Embed Size (px)
Citation preview
WLS1804-46 CENCO Bull’s Eye Apparatus Page 1
Operating Instructions: CENCO Bull’s Eye Apparatus
PrOduCt CONtENtS Quantity Description 2 upright support rods 1 1” steel ball 1 Curved Aluminum track 2 Magnetic Photogate holders 1 Platform base for photogate holders 1 Ball release 1 Hex Wrench
OtHEr SuggEStEd MAtErIALS
Photogate system with two Photogates: WLS1800-932 C-clamps: WLS19405-B Large digital display : WLS1801-06Plumb bobCarbon paperMeter stick
WLS1804-46 CENCO Bull’s Eye Apparatus Page 2
ASSEMBLy Of APPArAtuS
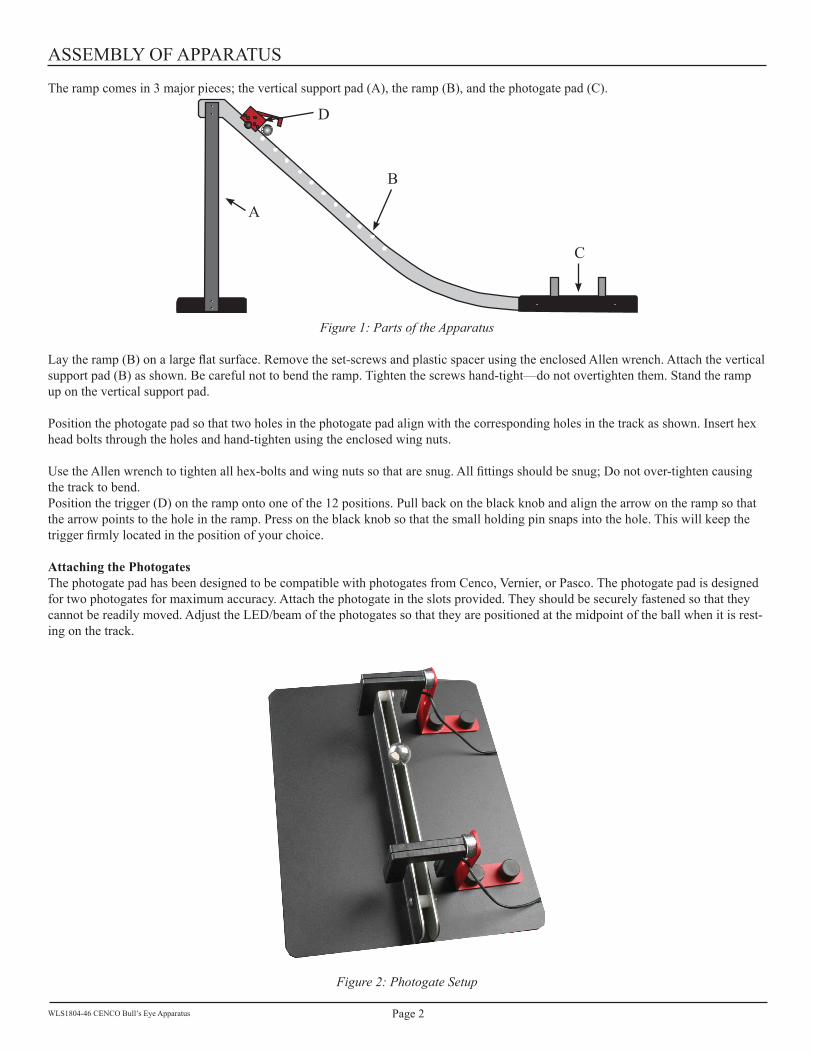
the ramp comes in 3 major pieces; the vertical support pad (A), the ramp (B), and the photogate pad (C).
A
B
C
d
Figure 1: Parts of the Apparatus
Lay the ramp (B) on a large flat surface. Remove the set-screws and plastic spacer using the enclosed Allen wrench. Attach the vertical support pad (B) as shown. Be careful not to bend the ramp. tighten the screws hand-tight—do not overtighten them. Stand the ramp up on the vertical support pad.
Position the photogate pad so that two holes in the photogate pad align with the corresponding holes in the track as shown. Insert hex head bolts through the holes and hand-tighten using the enclosed wing nuts.
Use the Allen wrench to tighten all hex-bolts and wing nuts so that are snug. All fittings should be snug; Do not over-tighten causing the track to bend.Position the trigger (d) on the ramp onto one of the 12 positions. Pull back on the black knob and align the arrow on the ramp so that the arrow points to the hole in the ramp. Press on the black knob so that the small holding pin snaps into the hole. this will keep the trigger firmly located in the position of your choice.
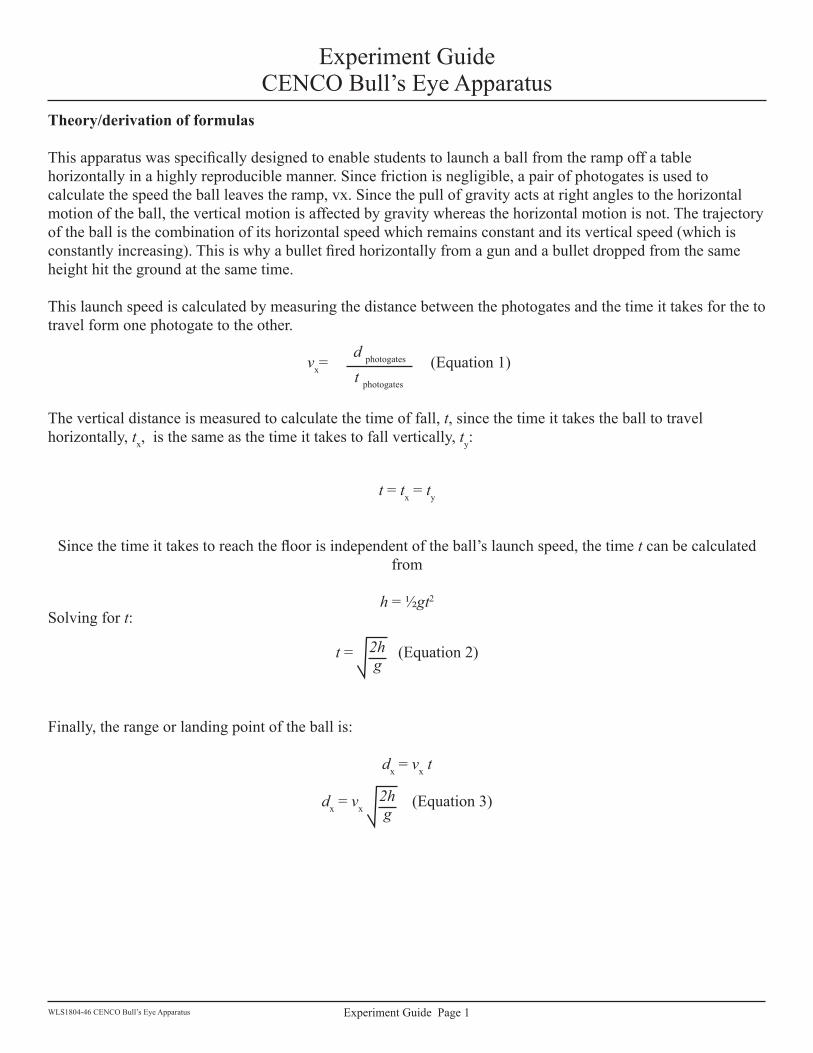
AttachingthePhotogatesthe photogate pad has been designed to be compatible with photogates from Cenco, Vernier, or Pasco. the photogate pad is designed for two photogates for maximum accuracy. Attach the photogate in the slots provided. they should be securely fastened so that they cannot be readily moved. Adjust the LEd/beam of the photogates so that they are positioned at the midpoint of the ball when it is rest-ing on the track.
Figure 2: Photogate Setup

WLS1804-46 CENCO Bull’s Eye Apparatus Page 3
SettingUptheRampSet up the ramp so that is on the edge of your lab table. Secure each pad with a 3-inch C-clamp (not supplied). Place the ball on the level part of the ramp to test that this portion of the ramp is level. If not, usually a piece of paper under on the down side is enough to level it. then clamp it down with C-clamp.
use a meterstick and/or a plumb-bob (not supplied) to locate the point directly below the launch point of the ball from the ramp. Care-fully mark this position on the floor. Now position the trigger on the top of the ramp. Have an assistant insert the steel ball on the ramp with the plunger while you mark the spot where it lands. repeat as necessary and mark the average landing point. the landing points should be a small cluster. use a meterstick to draw a line between these two points. the ball should land on the line when released from all the other positions on the ramp. Tape a meterstick to the floor so that accurate measurements of the landing point can be made.
the ramp can be used for a variety of experiments depending on the students level and background. Although the ramp was designed to give highly reproducible results for the speed of the ball at the the bottom of the ramp so that the ball lands on or near the same point from a given release point, it also can be used to compare the launch speed and the relative height to their corresponding pre-dicted values.
CArE/MAINtENANCE Of dEVICE
the Cenco Bull’s Eye apparatus requires nor specialized maintenance or care. When not in use please store in an upright position and do not place it on its side, the ramp may bend if items are placed or stacked on its side.
If you should experience any difficulty with the Bull’s Eye Apparatus please contact Cenco Physics, giving details of the peoblem. your business is important to us, to insure maximum service, do not return any apparatus until we have given you authorization.
ACCESSOrIES ANd rEPLACEMENt PArtS
Description Cat.No.Photogate system with two Photogates WLS1800-93
Large digital display : WLS1801-06C-Clamp (6” x 3-1/4”) WLS-19405-dPlain 1m Meter Stick WLS-44685
COPyrIgHt NOtICE
The Cenco Bull’s Eye Apparatus operating instructions are copyrighted and all rights reserved. Permission is granted to all non-profit educational institutions to make as many copies of these instructions as they like as long as it is for the sole purpose of teaching students. reproduction by anyone for any other reason is prohibited.
Experiment guide Page 1WLS1804-46 CENCO Bull’s Eye Apparatus
Experiment guide CENCO Bull’s Eye Apparatus
Theory/derivationofformulas
This apparatus was specifically designed to enable students to launch a ball from the ramp off a table horizontally in a highly reproducible manner. Since friction is negligible, a pair of photogates is used to calculate the speed the ball leaves the ramp, vx. Since the pull of gravity acts at right angles to the horizontal motion of the ball, the vertical motion is affected by gravity whereas the horizontal motion is not. the trajectory of the ball is the combination of its horizontal speed which remains constant and its vertical speed (which is constantly increasing). This is why a bullet fired horizontally from a gun and a bullet dropped from the same height hit the ground at the same time.
this launch speed is calculated by measuring the distance between the photogates and the time it takes for the to travel form one photogate to the other.
vx= d photogates
t photogates
(Equation 1)
the vertical distance is measured to calculate the time of fall, t, since the time it takes the ball to travel horizontally, tx, is the same as the time it takes to fall vertically, ty:
t = tx = ty
Since the time it takes to reach the floor is independent of the ball’s launch speed, the time t can be calculated from
h = ½gt2
Solving for t:
t = 2hg
(Equation 2)
finally, the range or landing point of the ball is:
dx = vx t
dx = vx 2hg
(Equation 3)

Experiment guide Page 2WLS1804-46 CENCO Bull’s Eye Apparatus
RotationalMotionoftheBall
It is important to note that all the potential energy of the ball on the ramp is not converted into translational energy of the ball, ½mv2 . Some of the energy—about 29%—is transformed into rotational energy ½Iω2 . this, of course, is why physics textbooks use blocks sliding down inclines instead of balls. Many misconceptions arise by simply equating PElost to translational KEgained. Making this erroneous assumption leads to discovering the balls reach the bottom slower than expected and do not go as far as expected.
Here are derivations for the energy and the speed of the ball as it rolls off the ramp
PE lost = KE translational + KE rotational
mgh = ½mv2 + ½Iω2 (Equation 4)
for a solid sphere the rotational inertia of the ball, I = 2/5mr2 and the tangential speed of a point on the ball’s surface, v = ωr. Inserting these values into Equation 4 and simplfying:
ω = vr
mgh = 12 mv2 + 1
2 ( 25 mr2)ω2
mgh = 12 mv2 + ½( 2
5 mr2)( vr )2
mgh = 12 mv2 + 1
5 mr2( v2
r2 )
mgh = 12 mv2 + 1
5 mv2
mgh = 510 mv2 + 2
10 mv2
mgh = 710 mv2 (Equation 5)
So (71%) of the total energy of the ball, mgh, is translational and (29%) is rotational.
Some may might attribute the discrepancy in the range of the ball to friction. Although rolling friction is present, it’s small compared to the effect due to rotation. to see how rotation affects the translational speed of the ball,
12 mvr
2 = 57 ( 1
2 mvNr2) (Equation 6)
where vr is the speed of the rotating ball and vNr is the translational speed of the non-rotating ball.
Experiment guide Page 3WLS1804-46 CENCO Bull’s Eye Apparatus
Solving for vr,
12 mvr
2 = 57 ( 1
2 mvNr2)
vr2 = 5
7 vNr2
vr = 5
7vNr (Equation 7)
vr ≈ 0.85 vNr
therefore the speed of the rotating ball as it leaves the ramp has a speed about 85% that of a pendulum released from the same height. thus, the range of the rotating ball will be about 85% that of what might expect to be—about 15% short—a discrepancy too large to attribute to friction alone.
Experiment1-PredictingtheRange
A.Setup/Procedure
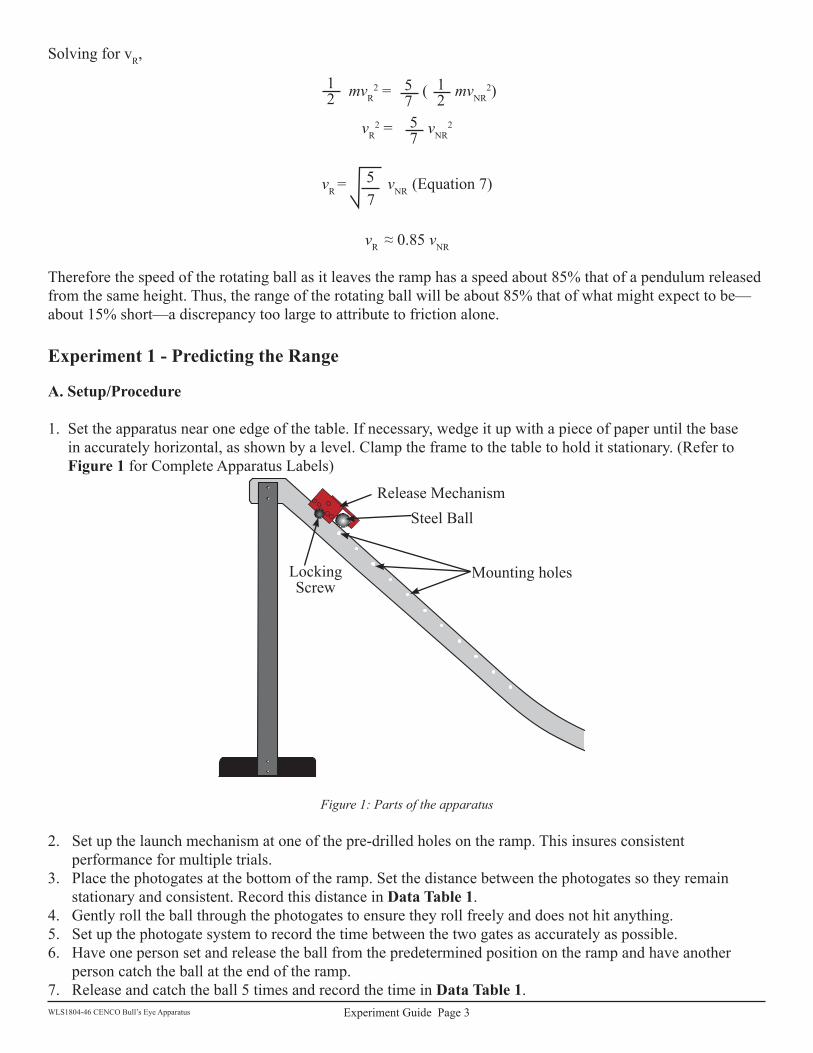
1. Set the apparatus near one edge of the table. If necessary, wedge it up with a piece of paper until the base in accurately horizontal, as shown by a level. Clamp the frame to the table to hold it stationary. (refer to Figure1 for Complete Apparatus Labels)
release MechanismSteel Ball
Locking Screw
Mounting holes
Figure 1: Parts of the apparatus
2. Set up the launch mechanism at one of the pre-drilled holes on the ramp. this insures consistent performance for multiple trials.
3. Place the photogates at the bottom of the ramp. Set the distance between the photogates so they remain stationary and consistent. record this distance in DataTable1.
4. gently roll the ball through the photogates to ensure they roll freely and does not hit anything.5. Set up the photogate system to record the time between the two gates as accurately as possible.6. Have one person set and release the ball from the predetermined position on the ramp and have another
person catch the ball at the end of the ramp.7. release and catch the ball 5 times and record the time in DataTable1.

Experiment guide Page 4WLS1804-46 CENCO Bull’s Eye Apparatus
8. Calculate the average time.9. using Equation 1 calculate the horizontal launch speed.10. Measure the vertical height the ball is being launched above the floor. Record this in DataTable2 as height,
h.11. Use Equation 2 to calculate the time of flight, t for the steel ball. use the appropriate value for g; either 9.81
m/s2 or 981 cm/s2.12. use Equation 3 to calculate the horizontal range, dx.
data table 1: determining Launch Speed
distance between photogates: ________cmtrial time (s)
12345
Average
data table 2: Predicting the horizontal range
Vertical height - h (cm)Calculated time of flight - t (s)
Horizontal range - dx (cm)
13. Using a plumb bob, find the position on the floor directly beneath the launch point. This is the measured from the edge of the ramp. from this position measure out a horizontal range that you calculated in step 12 See Figure2. Place a can or carbon paper at this distance. release the ball and measure the distance directly below the edge of the ramp to the landing point. this is the horizontal range.
dx
h
t = tx = ty
Figure 214. Compute the percent error between the calculated and measured values of the landing points, dx.

Experiment guide Page 5WLS1804-46 CENCO Bull’s Eye Apparatus
Experiment2-PredictingtheLaunchSpeed
A.Theory/derivationofformulas
In Experiment 1, students predict the landing point of the ball by measuring the launch speed and the vertical height. Experiment 2 is essentially the reverse of Experiment 1. Students measure the landing point of the ball and measure the height of fall to predict the speed of the ball at the bottom of the ramp (launch speed), vx. (See Figure2). the launch speed of the ball is the same as the horizontal speed of the ball as it lands.
where the time t it takes the ball to hit the floor is the same time as it takes to fall vertically the same height—just as in Experiment 1. Measuring the height of fall enables students to calculate the time of fall:
h = ½gt2
Solving for the time:
t = 2hg
the horizontal speed of the ball is simply by rearranging Equation 3:
vx= dx/t (Equation 8)
B.Setup/Procedure
1. Set up the apparatus and photogates as describe in Experiment 1.2. Use a plumb bob to locate and mark the position on the floor directly below the end of the ramp. Record this
vertical height as “h” in DataTable3. this will also be used to measure the horizontal range dx.3. Set up the launch mechanism at one of the pre-drilled holes on the ramp. this insures consistent perfor-
mance for multiple trials.4. Place the photogates at the bottom of the ramp. Set the distance between the photogates so they remain
stationary and consistent. record this distance in DataTable3 as the photogate distance. this will be used to calculate the launch speed.
5. gently roll the ball through the photogates to ensure it rolls freely and does not hit anything.6. Release the ball and record the distance that it lands on the floor as dx in DataTable3. Also record the
distance between the photogates and the photogate times.7. repeat this for 5 trials and calculate the average for each.8. use Equation 8, your measured value for the vertical height h and the average horizontal range, dx, to
calculate for the predicted horizontal launch speed. record this in DataTable4 as the predicted speed.9. use Equation 1 to calculate the launch speed. record this in DataTable3.10. Calculate the percent error between the average measured speed and the predicted speed of the ball.
Experiment guide Page 6WLS1804-46 CENCO Bull’s Eye Apparatus
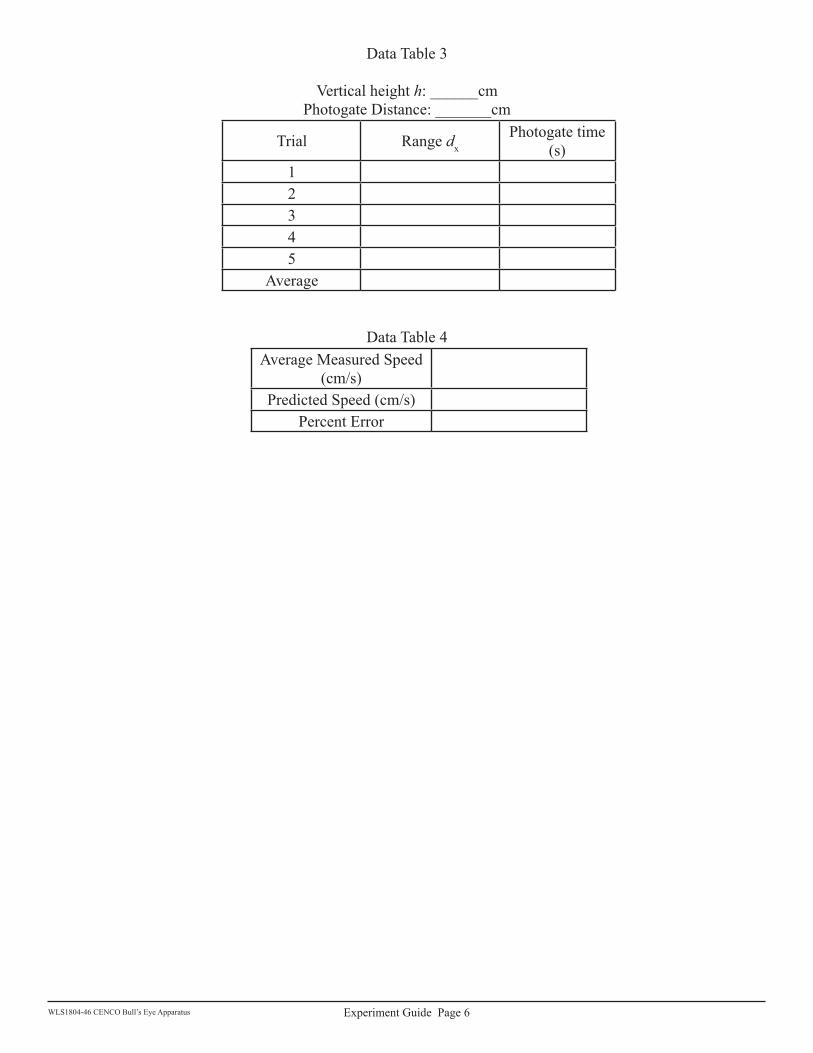
data table 3
Vertical height h: ______cmPhotogate distance: _______cm
trial range dxPhotogate time
(s)12345
Average
data table 4Average Measured Speed
(cm/s)Predicted Speed (cm/s)
Percent Error

Experiment guide Page 7WLS1804-46 CENCO Bull’s Eye Apparatus
Experiment3-PredictingtheReleaseHeightoftheBall
A.Theory/derivationofformulas
As an object rolls without slipping down a ramp its gravitational potential energy PE is changed into translational and rotational kinetic energy. the greater the release height greater the translational speed will be at the bottom. Equation 6 relates the vertical height of the steel ball to the speed at the bottom of the ramp. See Figure3. Since the speed of the ball at the bottom of the ramp can be measured, the initial release height of the ball can be predicted. In this experiment, students will predict the vertical height, h, the ball was released from on the ramp by measuring the speed of the ball at the bottom of the ramp.
mgh = 710 mv2 (Equation 5)
Simplifying and solving for the release height h:
h = 710g v2 (Equation 9)
h
v
Figure 3
B.Setup/Procedure
1. Set up the apparatus and photogates as describe in Experiment 1.2. Set up the launch mechanism at one of the pre-drilled holes on the ramp. this insures consistent
performance for multiple trials.3. Place the photogates at the bottom of the ramp. Set the distance between the photogates so they remain
stationary and consistent. record this distance in DataTable4 as the photogate distance. 4. gently roll the ball through the photogates to ensure the ball rolls freely and does not hit anything.5. release the steel ball and record the photogate time in DataTable4. 6. repeat the experiment for 5 trials, calculate the speed for each trial and calculate the average speed.7. use Equation 9 and the average value for the launch speed and to calculate the initial release height, h.
Show your calculations below.
Experiment guide Page 8WLS1804-46 CENCO Bull’s Eye Apparatus
data table 4
trial Photogate distance (cm) Photogate time (s) Speed (cm/s)
12345
Average
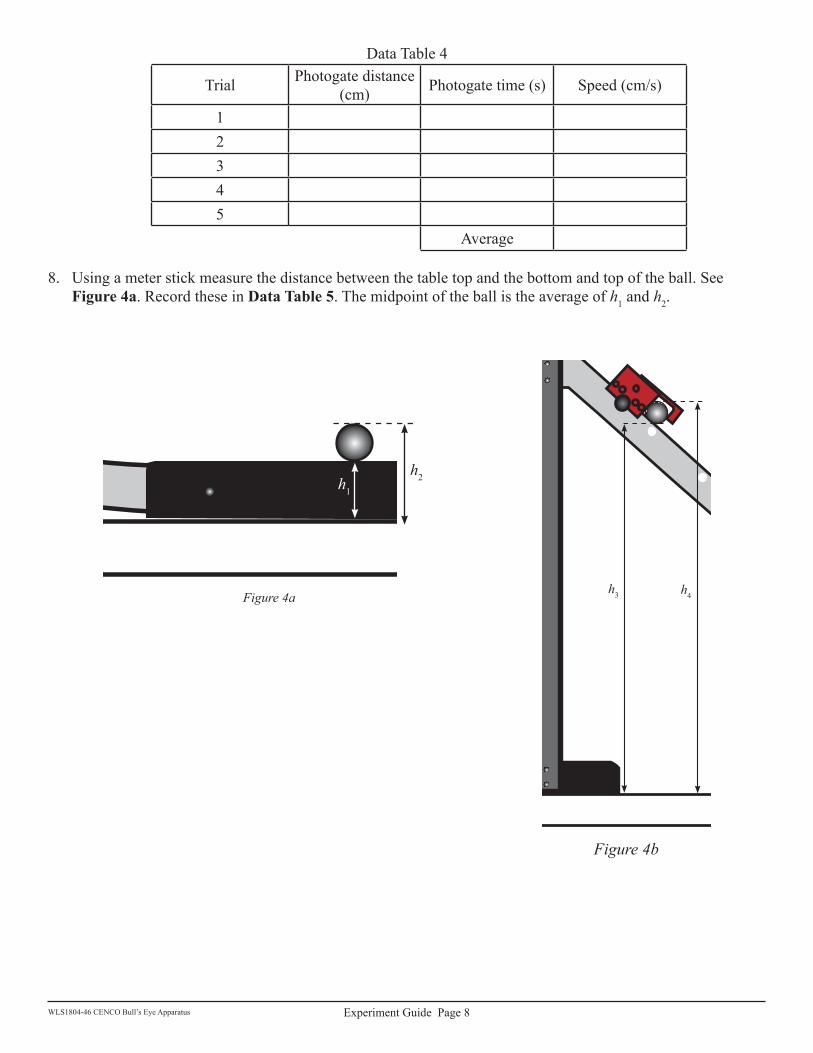
8. using a meter stick measure the distance between the table top and the bottom and top of the ball. See Figure4a. record these in DataTable5. the midpoint of the ball is the average of h1 and h2.
Figure 4a
h1
h2
h4h3
Figure 4b

Experiment guide Page 9WLS1804-46 CENCO Bull’s Eye Apparatus
9. repeat the measuring process at the release position. See Figure4b. record these values in DataTable5.10. Calculate the average position for the center of the ball.11. Calculate measured release height by subtracting the difference between the average position of the steel
ball at the top and bottom of the ramp.data table 5
Ball position (cm)
h1
h2
Average position bottom
h3
h4
Average position top
Measured release Height
12. Calculate the percent error between the release height calculated in Step 7 and the measured height measured in Step 11.