Embed Size (px)
Citation preview

Open Pension Meeting
December 5, 2013
Agenda Opening comments Sandra Aversa
Key Events, Capital Markets and Overall Performance Rob Stapleford – Mercer
Manager Presentations Background on Firm Performance as of June 30, 2013 and Sep. 30,2013 Investment Outlook
Questions and Discussion
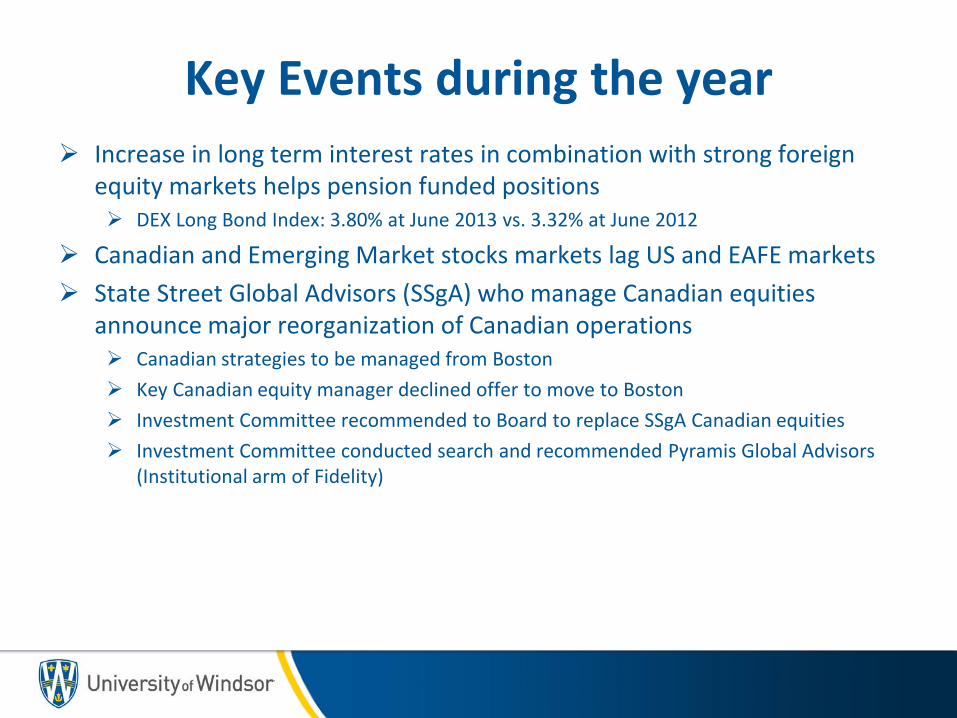
Key Events during the year Increase in long term interest rates in combination with strong foreign
equity markets helps pension funded positions DEX Long Bond Index: 3.80% at June 2013 vs. 3.32% at June 2012
Canadian and Emerging Market stocks markets lag US and EAFE markets State Street Global Advisors (SSgA) who manage Canadian equities
announce major reorganization of Canadian operations Canadian strategies to be managed from Boston Key Canadian equity manager declined offer to move to Boston Investment Committee recommended to Board to replace SSgA Canadian equities Investment Committee conducted search and recommended Pyramis Global Advisors
(Institutional arm of Fidelity)

Key Events during the year (cont’d)
Canadian Institute of Actuaries to release new mortality table in 2014 Indicates people are living longer. Will lead to higher pension liabilities
Province continues initiative to consolidate broader public sector pension plan assets
Increased public discussion about expanding CPP and QPP

Capital Market Performance

Capital Market Performance – June 2013
Year ending June 2013
91 Day CDN T-Bill 1.0%
DEX Universe Bond Index (0.2%)
DEX Long Bond Index (2.9%)
S&P/TSX Composite Index 7.9%
MSCI World Index ($Cdn) 23.4%
MSCI Emerging Markets Index ($Cdn) 6.8%
Median Manager in Mercer Balanced Universe 10.8%
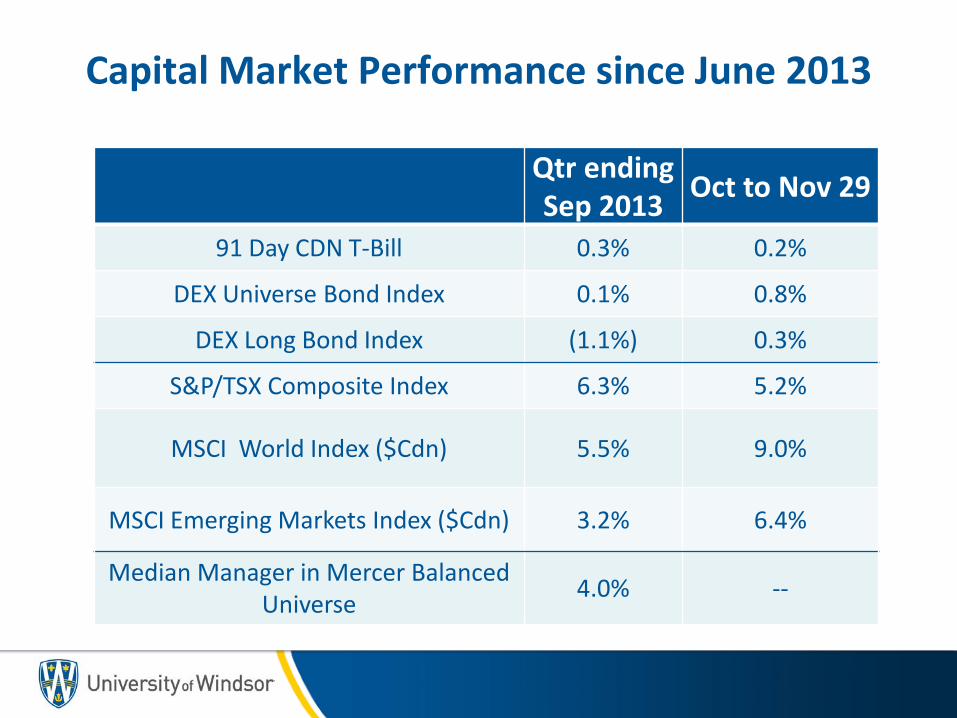
Capital Market Performance since June 2013
Qtr ending Sep 2013 Oct to Nov 29
91 Day CDN T-Bill 0.3% 0.2%
DEX Universe Bond Index 0.1% 0.8%
DEX Long Bond Index (1.1%) 0.3%
S&P/TSX Composite Index 6.3% 5.2%
MSCI World Index ($Cdn) 5.5% 9.0%
MSCI Emerging Markets Index ($Cdn) 3.2% 6.4%
Median Manager in Mercer Balanced Universe 4.0% --

University Performance Results
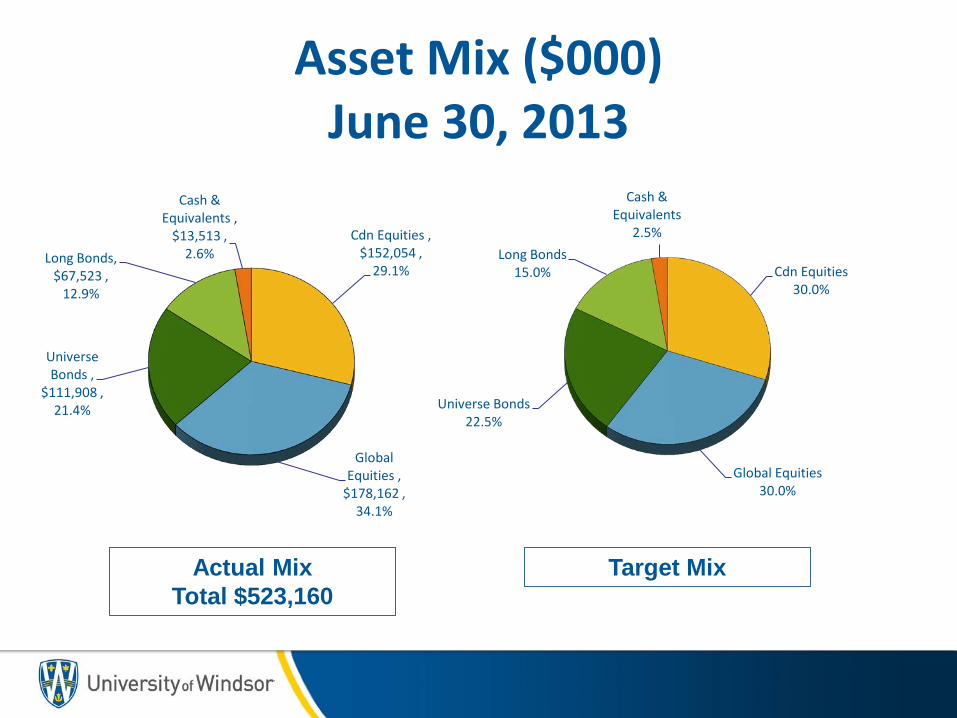
Asset Mix ($000) June 30, 2013
Actual Mix Total $523,160
Target Mix
Cdn Equities , $152,054 ,
29.1%
Global Equities ,
$178,162 , 34.1%
Universe Bonds ,
$111,908 , 21.4%
Long Bonds, $67,523 ,
12.9%
Cash & Equivalents ,
$13,513 , 2.6%
Cdn Equities 30.0%
Global Equities 30.0%
Universe Bonds 22.5%
Long Bonds 15.0%
Cash & Equivalents
2.5%

Asset Allocation by Manager ($000’s)
Foyston, $175,079 ,
33%
PHN, $93,655 ,
18%
SSgA, $73,733 ,
14%
Baillie Gifford,
$89,770 , 17%
Sprucegrove, $88,392 ,
17%
Cash, $2,531 , 1% Foyston,
$179,312 , 33%
PHN, $93,406 ,
17%
SSgA, $79,212 ,
15%
Baillie Gifford,
$96,764 , 18%
Sprucegrove, $92,415 ,
17%
Cash, $2,902 , 0%
Total Fund MV at June 30, 2013 $523,160
Total Fund MV at Sept 30, 2013 $544,011
June 30, 2013 Sept 30, 2013

Performance by Manager ($000)
MV % Annualized to June 30
June 30/13 MV Annual to Jun 30/13 2 years 3 years 4 years
Allocation by Manager: Foyston, Gordon & Payne $175,079 33.47% 8.96% 6.14% 8.68% 9.44% Phillips, Hager & North 93,655 17.90% -0.47% 5.46% 5.65% 7.00% SSgA 73,733 14.09% 7.81% n/a n/a n/a Baillie Gifford 89,770 17.16% 27.52% 12.33% 15.50% n/a Sprucegrove 88,392 16.90% 22.06% 10.89% 12.48% n/a Cash 2,531 0.48% 1.00% 0.98% 0.95% 0.01%
Total Fund $523,160 11.58% 5.96% 8.84% 8.61% U of Windsor Benchmark 8.32% 5.04% 7.94% 7.87%

Total Pension Fund Returns as of September 30, 2013
Mkt value Recent QTR
at Sept 30 2013
at Sept 30 2013 One Year
Annualized to Sept 30, 2013
(000's) (3 mths) at Sept 30
2013 2 Years 3 Years 4 Years
Total Fund $544,011 4.32% 12.32% 11.46% 7.64% 7.97%
U of Windsor Benchmark 3.33% 8.02% 9.14% 6.46% 6.97%

Impact of Investment Performance for Faculty Plan
Gross fund return 11.55% for the year ended June 30, 2013 Net return of 11.04%
• Money Purchase balances increased by 11.04% for active members
• Money Purchase pensions for all retirees increased by: 2.00% for those who retired before July 1, 2004 5.23% for those who retired on and after July 1, 2004
(Increase is the difference between the return and 6% plus the mortality adjustment)
• Minimum Guaranteed pensions for all retirees increased by 0.95%

Impact of Investment Performance for Employees’ Plan
Gross fund return 11.56% for the year ended June 30, 2013
Net return of 10.97%
Rate of credited interest on employee contributions for the year ending June 30, 2013 is 1.54%
4 year Average Fund Return for pension increases is 8.03% Pensions increased by 0.48% Actual increase is 50% of excess average return over 5.6%, limited to 50% of the CPI increase (0.95% at June 30, 2013)

Investment Manager Presentations
1. Foyston, Gordon & Payne - Steve Copeland & Jim Houston
2. Phillips, Hager & North - Kevin De Sousa & Bruce Geddes
3. State Street - Rob Stapleford (Mercer)
4. Sprucegrove - Marcel Leroux
5. Baillie Gifford - Nick Wood & Tim Gooding
6. Pyramis Global Investments - Edward Lui & Lawrence Lim

INVESTMENT PRESENTATION
Open Pension Committee Meeting
Steve Copeland, Senior Vice President
December 5, 2013

University of Windsor Pension Plan – Domestic Balanced
One Year Attribution
• Bonds and Canadian equities outperform their benchmarks
Investment returns are expressed in Canadian dollars unless otherwise noted, gross of investment management fees, net of fund expenses for FGP pooled funds, and include reinvestment of dividends and income. Returns are time weighted and annualized for periods greater than one year. Values change frequently and past investment performance may not be repeated. FGP claims compliance with the Global Investment Performance Standards (GIPS) on a firm-wide basis. Deloitte LLP has audited the compliance of FGP with the GIPS standards on a firm-wide basis. This audit covers the period from January 1, 2000 to December 31, 2012. A copy of the FGP Performance Summary is available upon request.
Annualized Time Weighted CDN$ Rates of Return Periods Ending June 30, 2013
YTD 1 Year 2 Years 3 Years 4 Years 5 Years Fiscal June 30th
Inception Date (March 31, 1998)
Total Fund 1.9% 8.9% 6.2% 8.7% 9.2% 6.9% 8.9% 8.2%
Benchmark -1.9 2.8 2.6 5.6 6.3 3.9 2.8 4.7*
Value Added +3.8 +6.1 +3.6 +3.1 +2.9 +3.0 +6.1 +3.5
*Benchmark inception date as of March 31, 2000
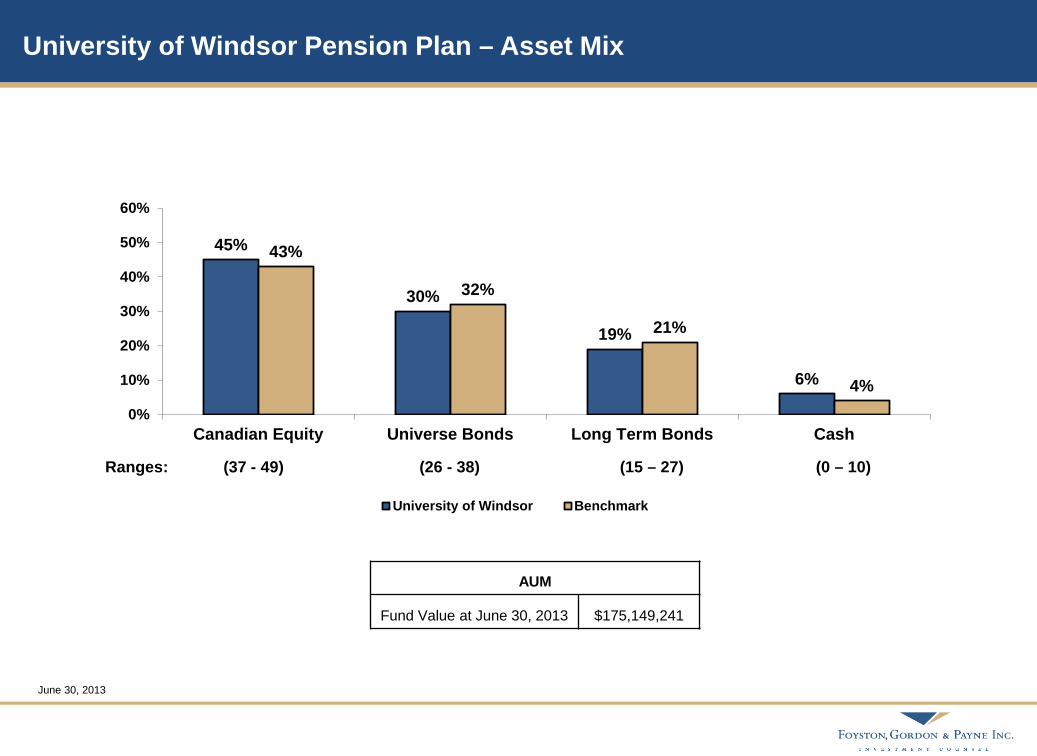
45%
30%
19%
6%
43%
32%
21%
4% 0%
10%
20%
30%
40%
50%
60%
Canadian Equity Universe Bonds Long Term Bonds Cash
University of Windsor Benchmark
June 30, 2013
Ranges: (37 - 49) (26 - 38) (15 – 27) (0 – 10)
AUM
Fund Value at June 30, 2013 $175,149,241
University of Windsor Pension Plan – Asset Mix

24% 27%
43%
6%
26% 23%
49%
2%
-5%
5%
15%
25%
35%
45%
55%
Canadas Corporates Provincials Municipals
Sector Weightings
*Source: PC Bond Analytics – June 30, 2013
56%
10%
27%
7%
44%
23% 25%
8%
0%
20%
40%
60%
80%
AAA AA A BBB
Credit Quality 51%
37%
12%
0%
40%
29% 29%
2% 0%
10%
20%
30%
40%
50%
60%
Canadas Corporates Provincials Municipals
Sector Weightings
FGP Bond Fund
Long Bond Fund
33% 33% 24%
10%
31% 26%
35%
8%
0%5%
10%15%20%25%30%35%40%45%50%
AAA AA A BBB
Credit Quality
FGP Term (Duration) DEX Term (Duration)
8.0 (5.9) 9.7 (6.9)
FGP Term (Duration) DEX Term (Duration)
19.3 (11.7) 22.4 (13.7)
Fixed Income - Quality

FGP Canadian Equities - Sector Allocation
Not Index-like
Bottom-up, earnings-driven
Independent valuation
*Source: National Bank Financial – June 30, 2013
Sector S&P/TSX* FGP
Consumer Discretionary 5.7% 14.5% 8.8%
Financials 34.4% 37.1% 2.7%
Information Technology 1.6% 3.5% 1.9%
Energy 24.9% 25.9% 1.0%
Consumer Staples 3.2% 3.7% 0.5%
Telecom Services 5.1% 3.8% -1.3%
Utilities 2.0% 0.0% -2.0%
Health Care 2.6% 0.0% -2.6%
Industrials 7.3% 4.0% -3.3%
Materials 13.1% 6.7% -6.4%
Cash 0.7%
8.8%
2.7%
1.9%
1.0%
0.5%
-1.3%
-2.0%
-2.6%
-3.3%
-6.4%
-10.0% -7.0% -4.0% -1.0% 2.0% 5.0% 8.0% 11.0%
Underweight Overweight

Outlook
Developed world equity markets surge on Central Bank stimulus
Bonds promise muted longer-term returns unless recession reappears
Geopolitical risks a continued threat
Valuations favour Canadian & developing market equities
Foyston, Gordon & Payne Inc.

University of Windsor
Presented by: Kevin De Sousa, Vice President
Presentation to
December 5th, 2013

2 University of Windsor – December 5, 2013
Bond Market Review Something’s Different
DEX Universe Bond Index -1.3
DEX Short Bond Index 1.3
DEX Long Bond Index -5.8
Sector (Mid-term) Canada -2.1 Provincial -0.6 Corporate 1.2
1 Yr September 30, 2013 %
Source: yc..\sc index… 9/30/13
Source: PC Bond Analytics
2.7%
DEX Universe Bond Index Yields

3 University of Windsor – December 5, 2013
University of Windsor Pension Plan Performance Summary as of September 30, 2013
U of W Pension Plan Consolidated -2.39 5.32 Benchmark -2.98 5.02 Value Added +0.59 +0.30
1 Yr 4 Yrs (%) (%)

4 University of Windsor – December 5, 2013
PH&N IM Fixed Income Investment Philosophy Multiple Sources of Risk/Opportunity
Aim to provide consistent value-added
Breadth of strategies is key
Focus on return/risk relationship
Multiple Strategies
Interest Rate Credit Liquidity
Goal is to build a diversified portfolio with attractive relative returns
Predictability of expected value-added Most Least
5 University of Windsor – December 5, 2013
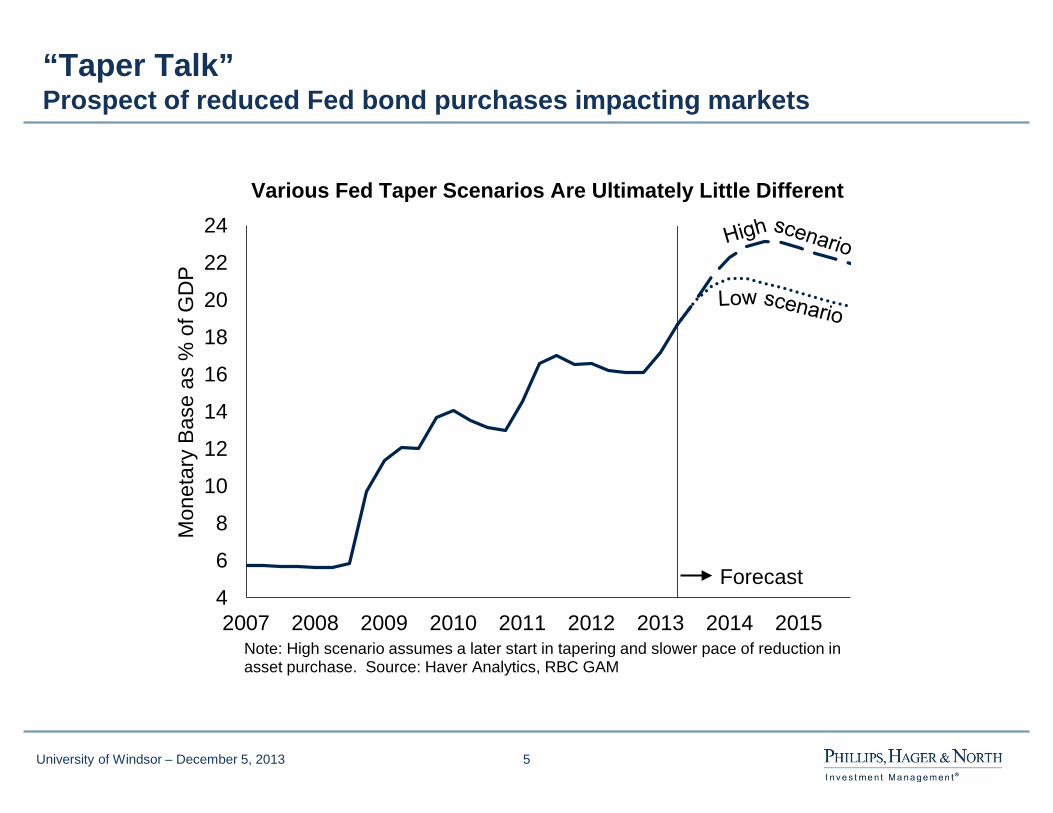
“Taper Talk” Prospect of reduced Fed bond purchases impacting markets
4
6
8
10
12
14
16
18
20
22
24
2007 2008 2009 2010 2011 2012 2013 2014 2015
Mon
etar
y Ba
se a
s %
of G
DP
Forecast
Note: High scenario assumes a later start in tapering and slower pace of reduction in asset purchase. Source: Haver Analytics, RBC GAM
Various Fed Taper Scenarios Are Ultimately Little Different

6 University of Windsor – December 5, 2013
Year 1 Year 2 Year 3 Year 4 Year 5 Average 2008 1974 1974 1994 1990 1969 2001 1979 2002 1999
What Does a Bad Bond Market Look Like? Worst 5 Years for Stocks and Bonds Over the Past 50 years
Stocks (13 negative years) Bonds (7 negative years)
Average return for stocks in “Worst 5” bond years = 22.5%
Note: Stock returns are based on the S&P/TSX Total Return Index. Bond returns are based on DEX Long Bond Index prior to Dec 1979 and based on DEX Universe Bond Index after Dec 1979 as the inception date of the DEX Universe Bond Index is Dec 1979. Source: PC Bond Analytics, Bloomberg

7 University of Windsor – December 5, 2013
Relative Importance of Corporate Spread
Source: credit\corporate yield breakdown 9/13

8 University of Windsor – December 5, 2013
University of Windsor Pension Plan Portfolio Summary as of September 30, 2013
Portfolio Distribution
Portfolio Yield: 2.85% Benchmark Yield: 2.58 % Incremental +0.27%
Sector Distribution

9 University of Windsor – December 5, 2013
Questions?
SSgA Firm Overview
CanMkt-2049

5 As of September 30, 2013
A Global Perspective with Local Expertise
New York
Munich
Paris
Zurich
Hong Kong
Singapore
Tokyo
London
Frankfurt
Atlanta
San Francisco
Brussels
Dubai
Chicago Toronto
Sydney
Wilton, CT Boston
Bangalore
Amsterdam
Milan Geneva
Dublin
Hangzhou
Seoul
Investment Center
Marketing/Relationship
Management Office
Global Alliance Company
• 27 local offices, bringing a global
perspective to managing client needs
• 24 hour global trading capability with trading
desks in Boston, London, and Hong Kong
• 9 investment centers, promoting
diversity of ideas
• Acquired Bank of Ireland Asset Management
in Q1 2011. Launched China joint venture in 2013.
Montreal
Taipei
GLSTND-1057
19
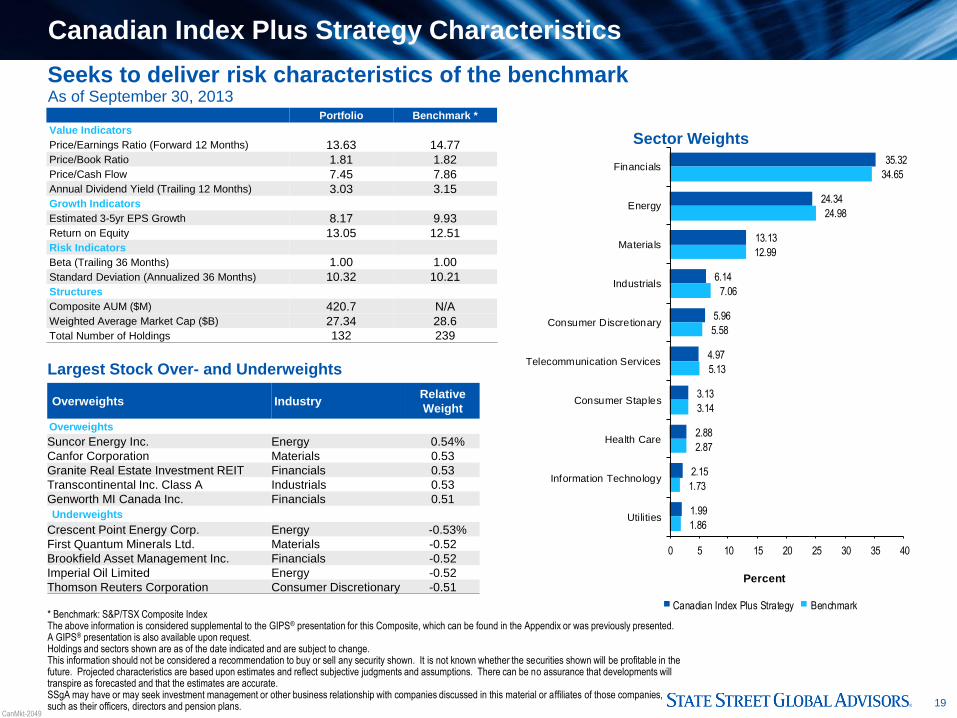
Sector Weights
Seeks to deliver risk characteristics of the benchmark
Largest Stock Over- and Underweights
Overweights Industry Relative
Weight
Overweights
Suncor Energy Inc. Energy 0.54%
Canfor Corporation Materials 0.53
Granite Real Estate Investment REIT Financials 0.53
Transcontinental Inc. Class A Industrials 0.53
Genworth MI Canada Inc. Financials 0.51
Underweights
Crescent Point Energy Corp. Energy -0.53%
First Quantum Minerals Ltd. Materials -0.52
Brookfield Asset Management Inc. Financials -0.52
Imperial Oil Limited Energy -0.52
Thomson Reuters Corporation Consumer Discretionary -0.51
Portfolio Benchmark *
Value Indicators
Price/Earnings Ratio (Forward 12 Months) 13.63 14.77
Price/Book Ratio 1.81 1.82
Price/Cash Flow 7.45 7.86
Annual Dividend Yield (Trailing 12 Months) 3.03 3.15
Growth Indicators
Estimated 3-5yr EPS Growth 8.17 9.93
Return on Equity 13.05 12.51
Risk Indicators
Beta (Trailing 36 Months) 1.00 1.00
Standard Deviation (Annualized 36 Months) 10.32 10.21
Structures
Composite AUM ($M) 420.7 N/A
Weighted Average Market Cap ($B) 27.34 28.6
Total Number of Holdings 132 239
35.32
24.34
13.13
6.14
5.96
4.97
3.13
2.88
2.15
1.99
34.65
24.98
12.99
7.06
5.58
5.13
3.14
2.87
1.73
1.86
0 5 10 15 20 25 30 35 40
Financials
Energy
Materials
Industrials
Consumer Discretionary
Telecommunication Services
Consumer Staples
Health Care
Information Technology
Utilities
Percent
Canadian Index Plus Strategy Benchmark * Benchmark: S&P/TSX Composite Index The above information is considered supplemental to the GIPS® presentation for this Composite, which can be found in the Appendix or was previously presented. A GIPS® presentation is also available upon request. Holdings and sectors shown are as of the date indicated and are subject to change. This information should not be considered a recommendation to buy or sell any security shown. It is not known whether the securities shown will be profitable in the future. Projected characteristics are based upon estimates and reflect subjective judgments and assumptions. There can be no assurance that developments will transpire as forecasted and that the estimates are accurate. SSgA may have or may seek investment management or other business relationship with companies discussed in this material or affiliates of those companies, such as their officers, directors and pension plans.
As of September 30, 2013
Canadian Index Plus Strategy Characteristics
CanMkt-2049

21
Performance Attribution Trailing One Year — Canadian Index Plus
Stock Selection Effect by Sector (%)
As of September 30, 2013 Source: FactSet, SSgA Past performance is not a guarantee of future results. Characteristics are as of the date indicated, are subject to change, and should not be relied upon as current thereafter.
-0.25 0.00 0.25 0.50 0.75 1.00 1.25
Information Technology
Consumer Staples
Telecommunication Services
Energy
Financials
Utilities
Health Care
Industrials
Consumer Discretionary
MaterialsTop 5
Avg.
Active
Weight
Total
Return
Selection
Effect
Eldorado Gold Corporation -0.42 -53.08 0.37
Magna International Inc. 0.49 104.03 0.34
Canfor Corporation 0.46 78.51 0.26
CCL Industries Inc. Class B 0.42 90.94 0.25
Transcontinental Inc. Class A 0.37 98.49 0.22
Bottom 5
Avg.
Active
Weight
Total
Return
Selection
Effect
Dundee Precious Metals Inc. 0.32 -38.04 -0.30
Kinross Gold Corporation 0.36 -47.89 -0.30
OceanaGold Corporation 0.31 -53.07 -0.25
Canadian Pacific Railway -0.41 57.59 -0.23
Manulife Financial Corp. -0.45 48.89 -0.19
CanMkt-2049

25
Canadian Index Plus Strategy Historical Performance
Source: SSgA † Inception: June 2005 *The calculation method for value added returns may show rounding differences.
The performance shown is of a composite consisting of all discretionary accounts using this investment strategy. There is no minimum account size required
for inclusion in the composite. New funds or accounts are added to the composite upon the first full month of operation and closed funds or accounts are
removed from the composite upon the last full month of operation. The above information is considered supplemental to the GIPS presentation for this
Composite, which can be found in the Appendix or was previously presented. A GIPS presentation is also available upon request.
Past performance is not a guarantee of future results. Performance returns for periods of less than one year are not annualized. Returns are expressed gross
of management fees. Some members of the composite may accrue administration fees. The performance includes the reinvestment of dividends and other
corporate earnings and is calculated in Canadian dollars.
Gross annualized returns for the period ending September 30, 2013 (CAD$)
20.53 17.38
11.97
-31.26
33.53
18.39
-8.10
8.69 6.15
18.65 17.26
9.83
-33.00
35.05
17.61
-8.71
7.19 5.31
-50
-40
-30
-20
-10
0
10
20
30
40
2005 (Partial) 2006 2007 2008 2009 2010 2011 2012 2013 YTD
Pe
rce
nt
Canadian Index Plus Composite S&P/TSX Composite Index
1 Year 3 Years 5 Years Since Inception†
Canadian Index Plus Composite 7.81% 5.40% 5.69% 7.49%
S&P/TSX Composite Index 7.12 4.09 4.81 6.39
Difference* 0.69 1.30 0.87 1.10
CanMkt-1976
Strategy Has Outperformed in 7 of 8 Years Since Inception
Marcel Leroux
Private & Confidential
University of Windsor December 5, 2013

Performance Notes
2 Continued on page 3
Sprucegrove Investment Returns Investment performance returns exclude any investment management fees paid by the investor. Investment advisory fees will reduce stated returns. Performance returns are calculated on a time weighted, total return basis which includes dividend net of withholding taxes and interest income, realized and unrealized gains or losses, transaction costs and other expenses, if any. For example, a 90 basis point investment advisory fee applied to an investment with an annual gross return of 10% will provide a compounded gross return of 10.0% after 1 year and a 61.1% return after 5 years while the compounded net return after investment advisory fees would result in a return of 9.04% after 1 year and a 54.16% after 5 years. MSCI EAFE & World Indices The Morgan Stanley Capital International (MSCI) EAFE and World Indices are presented as benchmarks for investment performance. The Indices are the arithmetical average, weighted by market value of the performance of companies representing the stock markets of Canada, the U.S., Europe, Australasia, and the Far East. Returns shown assume reinvestment of dividends. The MSCI EAFE Index includes a selection of stocks from 22 developed markets and is designed to measure the equity performance of developed markets, excluding Canada and the United States. MSCI World Index includes the 22 countries that make up the EAFE Index along with Canada and the U.S. Throughout this report MSCI data is provided as a comparative reference only and may not be used in any way without the express permission of MSCI. The MSCI information may only be used for your internal use, may not be reproduced or redisseminated in any form and may not be used as a basis for or a component of any financial instruments or products or indices. None of the MSCI information is intended to constitute investment advice or a recommendation to make (or refrain from making) any kind of investment decision and may not be relied on as such. Historical data and analysis should not be taken as an indication or guarantee of any future performance analysis, forecast or prediction. The MSCI information is provided on an “as is” basis and the user of this information assumes the entire risk of any use made of this information. MSCI, each of its affiliates and each other person involved in or related to compiling, computing or creating any MSCI information (collectively, the “MSCI Parties”) expressly disclaims all warranties (including, without limitation, any warranties of originality, accuracy, completeness, timeliness, non-infringement, merchantability and fitness for a particular purpose) with respect to this information. Without limiting any of the foregoing, in no event shall any MSCI Party have any liability for any direct, indirect, special, incidental, punitive, consequential (including, without limitation, lost profits) or any other damages. (www.msci.com) S&P 500 Index The S&P 500 Index is presented as a benchmark for investment performance. The Index is the arithmetic average, weighted by market value of the performance of companies representing the stock markets of the U.S. Returns shown assume reinvestment of dividends. The S&P Index includes 500 leading companies in leading industries of the U.S. economy. Specific Recommendations Examples of specific holdings are intended to demonstrate our investment process and should not be construed as representative of investment performance. It should not be assumed that investments made in the future will be profitable or will equal any results presented. A list of all securities purchased and sold within the past year (together with dates and prices) is available upon request. Possibility of Loss Investors should be aware that market conditions affect performance and that investment programs carry with them the possibility of loss. It should not be assumed that investments made in the future will be profitable or will equal any results shown in this document.

3
GIPS Compliance Notes Sprucegrove Investment Management Ltd. (Sprucegrove) claims compliance with the Global Investment Performance Standards (GIPS®). Sprucegrove has been independently verified for the periods May 1, 1985 to December 31, 2012. The composites have been examined for the periods May 1, 1985 to December 31, 2012.
Definition of the Firm Sprucegrove is registered in most provinces in Canada as Investment Fund Manager and Portfolio Manager and with the SEC as an Investment Advisor. It manages fully discretionary accounts for fee paying clients. All portfolios with a market value greater than $15 million are included in a composite.
Composite and Benchmark Definition Composites and their corresponding benchmarks are determined by equity mandate (EAFE, Global or U.S.) and by the country in which the respective account is domiciled (Canada or the United States). The following is a list of the composites and their benchmarks:
Composite Inception Date of Composite Benchmark EAFE - Canadian Clients Composite May 1985 MSCI EAFE Net Index - CAD Global - Canadian Clients Composite July 1992 MSCI World Net Index - CAD U.S. Equities - Canadian Clients Composite November 2001 S&P 500 Net Index - CAD EAFE - U.S. Clients Composite October 1985 MSCI EAFE Net Index – USD Global - U.S. Clients Composite October 2010 MSCI World Net Index – USD
Fee Schedules The following are the standard fee schedules based on the market value of assets managed.
Pooled Fund Accounts Separate Fund Accounts Assets Managed Rate Assets Managed Rate
First 5,000,000.00 0.90% First 25,000,000.00 0.70% Next 10,000,000.00 0.65% Next 25,000,000.00 0.60% Next 25,000,000.00 0.55% Next 25,000,000.00 0.50% Next 35,000,000.00 0.50% Next 225,000,000.00 0.25% Next 225,000,000.00 0.25% Balance 0.20% Balance 0.20%
Composite Dispersion Composite dispersion is calculated as the difference in percentage in performance between the highest and lowest performing portfolios in the composite.
Policies Sprucegrove’s policies for valuing portfolios, calculating performance and preparing compliant presentations are available upon request.
Withholding Taxes Composite and benchmark returns are stated net of withholding taxes on dividends.
Past Performance Prior to Sprucegrove commencing operations in 1993, the Sprucegrove team managed two EAFE portfolios at Confederation Life Insurance, from their inception in 1985, until the portfolios were acquired by Sprucegrove in 1994. Accordingly the performance of these portfolios are linked to their continuation at Sprucegrove as follows: The EAFE Canadian Clients composite includes the performance of the Confederation Life International Pooled Fund from 1985 to 1994; The EAFE U.S. Clients composite includes the performance of the Confederation Life American International Pooled Fund from 1985 to 1994. Prior to December 31, 2011, the name of each composite included the term “Pooled and Separate Accounts Combined.” This term was removed from the composite names as of December 31, 2011.
Further Information To obtain a presentation that complies with GIPS requirements, and/or a list of composite description, please contact your client service representative.
Performance Notes continued

Investment Philosophy
Ownership of Value Quality Companies at Attractive Valuations
Emphasis on Stock Selection Bottom-up Process
Long-Term Investors Low Portfolio Turnover Investment Strategy “Working List” of Quality Companies
4
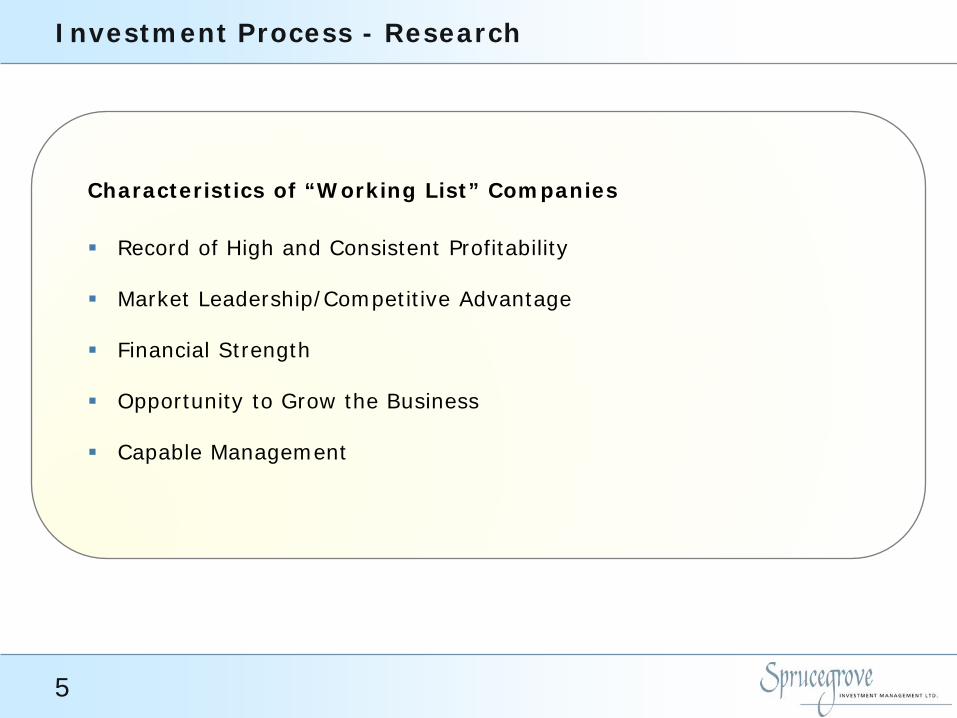
Investment Process - Research
Characteristics of “Working List” Companies
Record of High and Consistent Profitability
Market Leadership/Competitive Advantage
Financial Strength
Opportunity to Grow the Business
Capable Management
5

Transaction Summary – Q2 2013 Sprucegrove Global Pooled Fund (Pension)
6 It should not be assumed that investments made in the future will be profitable or will equal any results shown here. The information presented as an example of investment technique and should not be construed as representative of investment performance. A list of all securities purchased and sold within the past year together with dates and prices is available upon request. Refer to Performance Footnotes on page 2 for additional details.
Note: Valuation characteristics are at the time of the transaction.
Eliminations/Reductions New Holdings/Additions
Projected
ROE (%)
Normalized P/E (x)
Projected
ROE (%)
Normalized P/E (x)
Martin Marietta Materials 16.0 21.9 Nokian Tyres 18.0 15.0 Crane 17.0 20.3 Covidien 17.0 16.3
Westamerica 18.0 12.2
Shin-Etsu Chemical 9.0 18.7 Petrobras 14.0 5.3 Bemis 14.0 18.1 Fugro 18.0 10.5 Ryanair 16.0 20.4 Apache 16.0 5.9 SMC 9.0 24.2 Sasol 20.0 9.9 3M 28.0 14.9 Hindalco 10.0 5.6 Hubbell 16.0 21.7 CRH 13.0 8.8 Wolseley 17.0 20.5 POSCO 12.0 5.0 adidas 16.0 18.8 Holcim 12.0 11.4 Denso 9.0 14.8 Anglo American 15.0 5.4 Toyota Motor 9.0 17.3 Vopak 20.0 14.7 Signet Jewellers 13.0 18.3 Sembcorp Industries 16.0 12.0 Procter & Gamble 19.0 17.1 Jardine Matheson 18.0 7.7 Walgreen 16.0 15.5 General Dynamics 17.0 12.2 Becton Dickinson 22.0 19.5 Granite Construction 11.0 12.0 Merck 20.0 13.6 BMW 13.0 10.3 Pfizer 20.0 13.8 Tiger Brands 27.0 14.1 Takeda Pharmaceutical 9.0 17.6 Tesco 14.0 12.2 Keyence 11.0 24.3 United Overseas Bank 13.0 10.7 SingTel 15.0 16.5 Banco Santander 14.0 4.9
Infosys 24.0 13.7 Hoya 15.0 11.6 China Mobile 21.0 8.7
Altera 27.0 11.3 FLIR Systems 16.0 14.9 Intel 18.0 13.0
Average 15.3 18.5 16.7 10.6 MSCI World 12.0 15.9 12.0 15.9
7
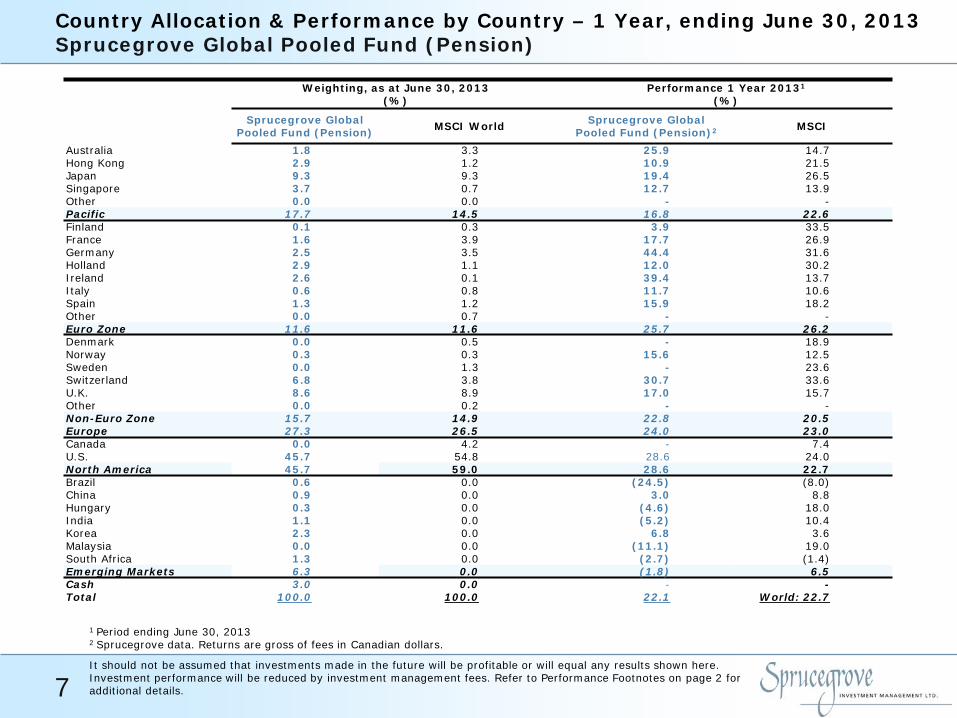
Country Allocation & Performance by Country – 1 Year, ending June 30, 2013 Sprucegrove Global Pooled Fund (Pension)
It should not be assumed that investments made in the future will be profitable or will equal any results shown here. Investment performance will be reduced by investment management fees. Refer to Performance Footnotes on page 2 for additional details.
1 Period ending June 30, 2013
2 Sprucegrove data. Returns are gross of fees in Canadian dollars.
Weighting, as at June 30, 2013 (%)
Performance 1 Year 20131 (%)
Sprucegrove Global Pooled Fund (Pension) MSCI World Sprucegrove Global
Pooled Fund (Pension)2 MSCI
Australia 1.8 3.3 25.9 14.7 Hong Kong 2.9 1.2 10.9 21.5 Japan 9.3 9.3 19.4 26.5 Singapore 3.7 0.7 12.7 13.9 Other 0.0 0.0 - - Pacific 17.7 14.5 16.8 22.6 Finland 0.1 0.3 3.9 33.5 France 1.6 3.9 17.7 26.9 Germany 2.5 3.5 44.4 31.6 Holland 2.9 1.1 12.0 30.2 Ireland 2.6 0.1 39.4 13.7 Italy 0.6 0.8 11.7 10.6 Spain 1.3 1.2 15.9 18.2 Other 0.0 0.7 - - Euro Zone 11.6 11.6 25.7 26.2 Denmark 0.0 0.5 - 18.9 Norway 0.3 0.3 15.6 12.5 Sweden 0.0 1.3 - 23.6 Switzerland 6.8 3.8 30.7 33.6 U.K. 8.6 8.9 17.0 15.7 Other 0.0 0.2 - - Non-Euro Zone 15.7 14.9 22.8 20.5 Europe 27.3 26.5 24.0 23.0 Canada 0.0 4.2 - 7.4 U.S. 45.7 54.8 28.6 24.0 North America 45.7 59.0 28.6 22.7 Brazil 0.6 0.0 (24.5) (8.0) China 0.9 0.0 3.0 8.8 Hungary 0.3 0.0 (4.6) 18.0 India 1.1 0.0 (5.2) 10.4 Korea 2.3 0.0 6.8 3.6 Malaysia 0.0 0.0 (11.1) 19.0 South Africa 1.3 0.0 (2.7) (1.4) Emerging Markets 6.3 0.0 (1.8) 6.5 Cash 3.0 0.0 - - Total 100.0 100.0 22.1 World: 22.7

Value in Emerging Market Companies, as at June 30, 2013 Sprucegrove Global Pooled Fund (Pension)
8
Company Country Market Cap. Price/Book
Financial Leverage
Projected ROE
Normalized P/E
Dividend Yield
(US$ Bn) (x) (x) (%) (x) (%)
Petrobras Brazil 98 0.5 2.0 14.0 3.7 4.9
China Mobile China 210 1.8 1.5 21.0 8.6 4.2
Gedeon Richter Hungary 3 1.2 1.1 11.0 11.2 1.9
GAIL India 7 1.5 1.9 20.0 7.3 2.9
Hindalco India 5 0.6 3.0 10.0 5.6 1.4
Infosys India 24 3.2 1.2 24.0 13.3 1.2
POSCO Korea 23 0.6 2.0 12.0 4.7 3.4
Samsung Electronics Korea 173 1.4 1.6 16.0 8.7 0.6
Impala Platinum South Africa 6 1.1 1.5 17.0 6.6 2.1
Sasol South Africa 28 2.0 1.7 20.0 9.9 4.0
Tiger Brands South Africa 6 4.1 1.6 27.0 15.1 2.8
Fund Emerging Market Average 53 1.6 1.7 17.7 8.4 2.7
Total Fund Average 50 2.2 2.1* 16.9 12.9 2.7 MSCI EM Index 4 1.5 2.7* 12.0 12.4 2.9
MSCI World Index 17 1.9 2.8* 12.0 15.9 2.7
* Excludes Financials

Top 10 Holdings, as at June 30, 2013 Sprucegrove Global Pooled Fund (Pension)
9 It should not be assumed that investments made in the future will be profitable or will equal any results shown here. The information presented as an example of investment technique and should not be construed as representative of investment performance. A list of all securities purchased and sold within the past year together with dates and prices is available upon request. Refer to Performance Footnotes on page 2 for additional details.
1 Financial Leverage weighted average excludes companies in the Financials sector.
Stock Country Sector % of
Fund
Normalized P/E
P/B Dividend
Yield Projected
ROE Financial Leverage1
(x) (x) (%) (%) (x)
Markel U.S. Financials 3.3 8.2 1.2 0.0 15.0 3.3
Wells Fargo U.S. Financials 2.8 10.5 1.5 2.4 14.0 9.7
Novartis Switzerland Health Care 2.5 16.1 2.6 3.4 16.0 1.8
3M U.S. Industrials 2.4 14.5 4.1 2.3 28.0 2.0
Merck U.S. Health Care 2.2 12.6 2.5 3.5 20.0 2.3
Procter & Gamble U.S. Consumer Staples 2.1 16.7 3.2 2.9 19.0 2.1
Berkshire Hathaway U.S. Financials 2.1 13.5 1.5 0.0 11.0 2.3
Johnson & Johnson U.S. Health Care 2.0 16.5 3.6 3.0 22.0 1.9
Pfizer U.S. Health Care 2.0 12.4 2.5 3.5 20.0 2.2
Microsoft U.S. Information Technology 1.9 10.7 3.7 2.7 35.0 1.8
23.3
Weighted Average 12.9 2.5 2.3 19.5 2.0
MSCI World 15.9 1.9 2.7 12.0 2.8
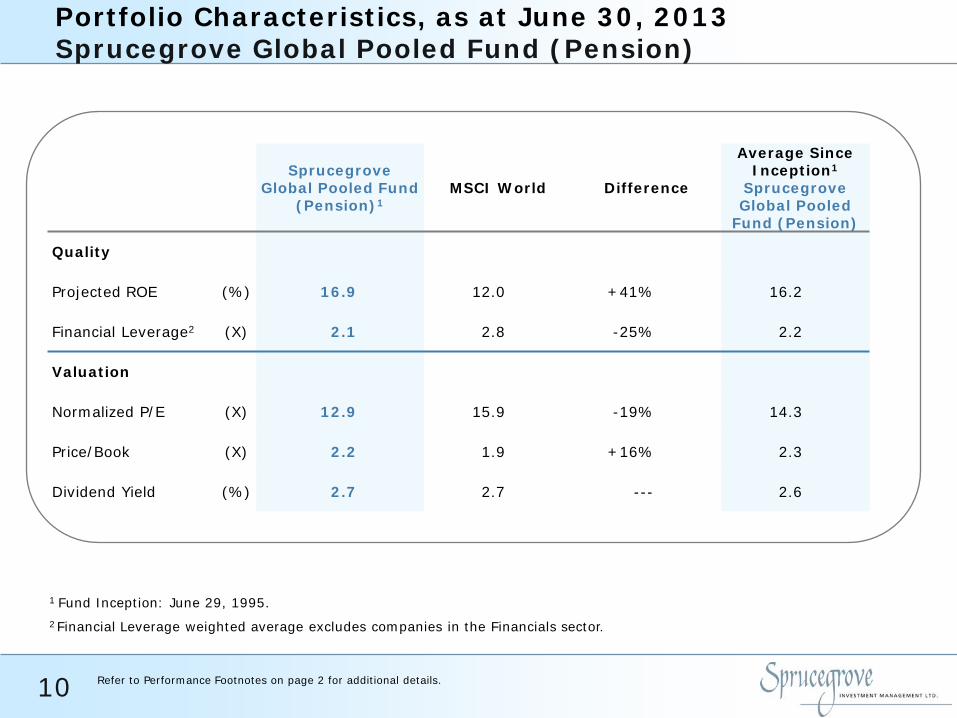
Portfolio Characteristics, as at June 30, 2013 Sprucegrove Global Pooled Fund (Pension)
10
1 Fund Inception: June 29, 1995. 2 Financial Leverage weighted average excludes companies in the Financials sector.
Refer to Performance Footnotes on page 2 for additional details.
Sprucegrove
Global Pooled Fund (Pension)1
MSCI World Difference
Average Since Inception1
Sprucegrove Global Pooled
Fund (Pension)
Quality
Projected ROE (%) 16.9 12.0 +41% 16.2
Financial Leverage2 (X) 2.1 2.8 -25% 2.2
Valuation
Normalized P/E (X) 12.9 15.9 -19% 14.3
Price/Book (X) 2.2 1.9 +16% 2.3
Dividend Yield (%) 2.7 2.7 --- 2.6

Annualized Performance Results, ending June 30, 2013 Sprucegrove Global Pooled Fund (Pension)
11 It should not be assumed that investments made in the future will be profitable or will equal any results shown here. Investment performance will be reduced by investment management fees. Refer to Performance Footnotes on page 2 for additional details.
Q2 2013
YTD 2013
1 Year
2 Years
3 Years
4 Years
5 Years
10 Years
15 Years
Since Inception
(%) (%) (%) (%) (%) (%) (%) (%) (%) (%)
Sprucegrove Global Pooled Fund (Pension)1
4.6 15.2 22.1 10.9 12.5 11.3 5.5 5.5 5.1 7.5
MSCI World (Gross) 4.7 15.3 23.4 11.7 14.1 10.8 4.1 5.1 1.9 4.6*
University of Windsor2 4.6 15.2 22.1 10.9 12.5 - - - - 12.3
MSCI World (Gross) 4.7 15.3 23.4 11.7 14.1 - - - - 13.1*
1Inception date of Fund: June 29, 1995.
2Inception date of University of Windsor Master Trust: June 14, 2010 Returns shorter than a 1-year period are arithmetic returns and have not been annualized. Returns greater than a 1-year period have been annualized. Returns are gross of fees in Canadian dollars. *MSCI World Net Index

Annualized Performance Results, ending September 30, 2013 Sprucegrove Global Pooled Fund (Pension)
12 It should not be assumed that investments made in the future will be profitable or will equal any results shown here. Investment performance will be reduced by investment management fees. Refer to Performance Footnotes on page 2 for additional details.
Q3 2013
YTD 2013
1 Year
2 Years
3 Years
4 Years
5 Years
10 Years
15 Years
Since Inception
(%) (%) (%) (%) (%) (%) (%) (%) (%) (%) Sprucegrove Global Pooled Fund (Pension)1
4.5 20.4 25.3 19.5 11.2 9.5 7.8 5.5 6.1 7.6
MSCI World (Gross) 5.5 21.6 26.2 20.8 12.5 10.0 7.7 5.3 2.9 4.9*
University of Windsor2 4.5 20.4 25.3 19.5 11.2 - - - - 12.8
MSCI World (Gross) 5.5 21.6 26.2 20.8 12.5 - - - - 13.9*
1Inception date of Fund: June 29, 1995.
2Inception date of University of Windsor Master Trust: June 14, 2010 Returns shorter than a 1-year period are arithmetic returns and have not been annualized. Returns greater than a 1-year period have been annualized. Returns are gross of fees in Canadian dollars. *MSCI World Net Index

BAILLIE GIFFORD
December 05, 2013
University of Windsor Pension Plans

Baillie Gifford University of Windsor Pension Plans December 2013
1
Our Relationship
Appointed:
June 2010
Portfolio Value as at September 30, 2013
C$96,764,495
Baillie Gifford:
An independent Edinburgh based asset management firm
Global Alpha:
A Global equity strategy
Growth
Best Ideas
Long Term

Baillie Gifford University of Windsor Pension Plans December 2013
2
Portfolio Performance
Performance Objective:
To exceed the return of the MSCI AC World Index over time
Investment Returns
Fund %
Benchmark %
Difference %
12 Months to June 30, 2013 27.7 21.3 +6.4
Since Inception* to September 30, 2013 (p.a.) 15.9 12.4 +3.5
Source: Baillie Gifford, gross of fees * June 30, 2010
Top and Bottom Ten Stock Contributors 12 Months to June 30, 2013
Fund %
Benchmark %
Contribution %
Apple 0.0 1.7 0.8
Tesla Motors 0.2 0.0 0.8
Ryanair 1.3 0.0 0.6
Richemont 2.1 0.1 0.6
Prudential 2.7 0.1 0.6
Moody's 1.4 0.0 0.5
CarMax 1.1 0.0 0.4
Mohawk Industries 1.1 0.0 0.4
TripAdvisor 0.5 0.0 0.4
Roche 2.0 0.5 0.4
Inpex 1.2 0.0 -0.5
Clicks 1.1 0.0 -0.3
America Movil 0.9 0.2 -0.3
Ultra Petroleum 0.9 0.0 -0.3
Baidu 0.6 0.0 -0.2
Aggreko 0.5 0.0 -0.2
Arcos Dorados 0.5 0.0 -0.2
Fairfax Financial 1.3 0.0 -0.2
Teradata 0.4 0.0 -0.2
Odontoprev 0.5 0.0 -0.2
Source: Baillie Gifford/StatPro

Baillie Gifford University of Windsor Pension Plans December 2013
3
Global Alpha – Recent Research Focus
Image Sources: © iStockphoto.com, © Getty Images, © Dreamstime.com
US INDUSTRIAL REVIVAL
Cheap energy and a more
competitive labour force have
led to growing optimism in a US
manufacturing revival
US INDUSTRIAL REVIVAL
Cheap energy and a more
competitive labour force have
led to growing optimism in a US
manufacturing revival
US INDUSTRIAL REVIVAL
Cheap energy and a more
competitive labour force have
led to growing optimism in a US
manufacturing revival
US INDUSTRIAL REVIVAL
Cheap energy and a more
competitive labour force have
led to growing optimism in a US
manufacturing revival
US INDUSTRIAL REVIVAL
Cheap energy and a more
competitive labour force have
led to growing optimism in a US
manufacturing revival
US INDUSTRIAL REVIVAL
Cheap energy and a more
competitive labour force have
led to growing optimism in a US
manufacturing revival
US INDUSTRIAL REVIVAL
Cheap energy and a more
competitive labour force have
led to growing optimism in a US
manufacturing revival
US INDUSTRIAL REVIVAL
Cheap energy and a more
competitive labour force have
led to growing optimism in a US
manufacturing revival
US INDUSTRIAL REVIVAL
Cheap energy and a more
competitive labour force have
led to growing optimism in a US
manufacturing revival
M&T Bank
TD Ameritrade
ICICI
China Resources Ent.
Lincoln Electric
Royal Caribbean Cruises
Investing in companies that should
benefit from a change in the current,
atypical business environment
NORMALISATION:
INTEREST RATES/MARGINS
Growth driven by
gradual shift from
investment to
consumption (middle
income consumers
predicted to double by
2020 in emerging
economies)
EMERGING MARKET
CONSUMER
REVIVAL IN US
MANUFACTURING
Cheap energy and a more
competitive labour force have
led to growing optimism in a US
manufacturing revival
Myriad Genetics Tesla Motors
INNOVATION
Investing in companies attacking
existing profit pools through
transforming capabilities and
creating products for new markets
Supply side consolidation and
capital withdrawal
EMERGING QUALITY GROWTH
Baillie Gifford University of Windsor Pension Plans December 2013
4
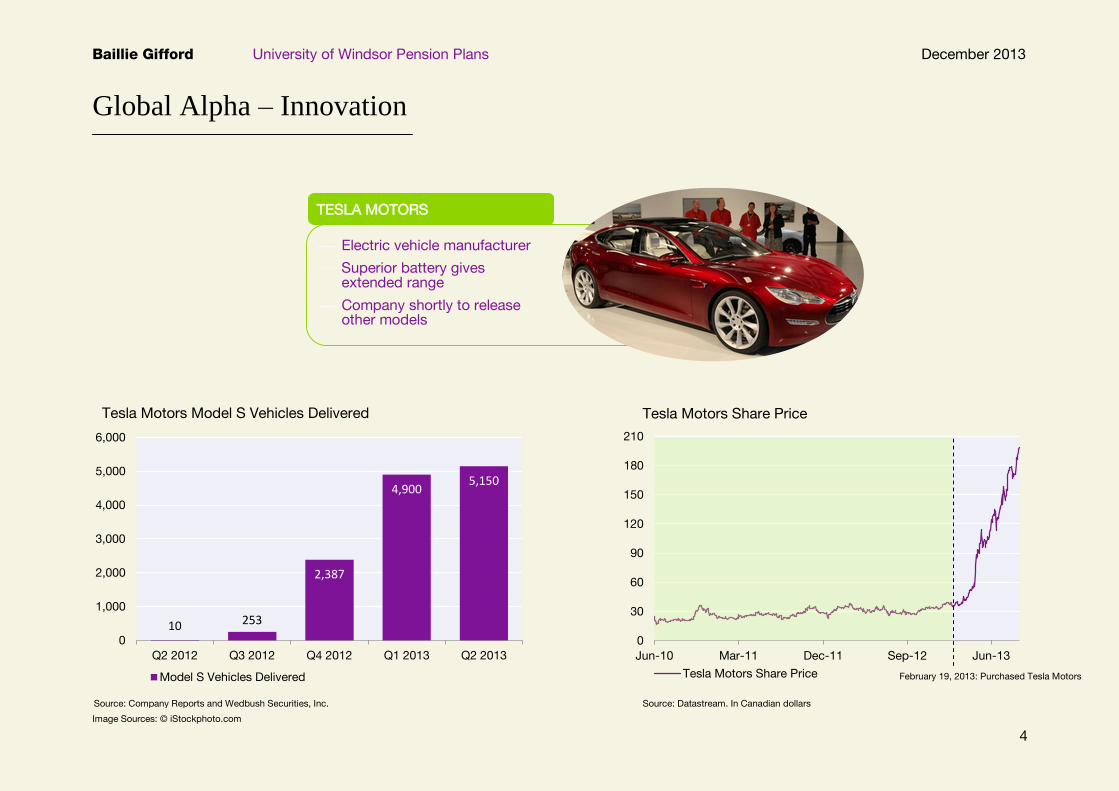
Global Alpha – Innovation
Image Sources: © iStockphoto.com
10 253
2,387
4,900 5,150
0
1,000
2,000
3,000
4,000
5,000
6,000
Q2 2012 Q3 2012 Q4 2012 Q1 2013 Q2 2013
Model S Vehicles Delivered
0
30
60
90
120
150
180
210
Jun-10 Mar-11 Dec-11 Sep-12 Jun-13
Tesla Motors Share Price
Electric vehicle manufacturer
Superior battery gives extended range
Company shortly to release other models
TESLA MOTORS
US INDUSTRIAL REVIVAL
Cheap energy and a more
competitive labour force have
led to growing optimism in a US
manufacturing revival
US INDUSTRIAL REVIVAL
Cheap energy and a more
competitive labour force have
led to growing optimism in a US
manufacturing revival
US INDUSTRIAL REVIVAL
Cheap energy and a more
competitive labour force have
led to growing optimism in a US
manufacturing revival
US INDUSTRIAL REVIVAL
Cheap energy and a more
competitive labour force have
led to growing optimism in a US
manufacturing revival
US INDUSTRIAL REVIVAL
Cheap energy and a more
competitive labour force have
led to growing optimism in a US
manufacturing revival
US INDUSTRIAL REVIVAL
Cheap energy and a more
competitive labour force have
led to growing optimism in a US
manufacturing revival
US INDUSTRIAL REVIVAL
Cheap energy and a more
competitive labour force have
led to growing optimism in a US
manufacturing revival
US INDUSTRIAL REVIVAL
Cheap energy and a more
competitive labour force have
led to growing optimism in a US
manufacturing revival
US INDUSTRIAL REVIVAL
Cheap energy and a more
competitive labour force have
led to growing optimism in a US
manufacturing revival
Source: Company Reports and Wedbush Securities, Inc. Source: Datastream. In Canadian dollars
February 19, 2013: Purchased Tesla Motors
Tesla Motors Model S Vehicles Delivered Tesla Motors Share Price

Baillie Gifford University of Windsor Pension Plans December 2013
5
Global Alpha – Normalisation
Image Sources: © iStockphoto.com
0.0
0.5
1.0
1.5
2.0
2.5
3.0
3.5
4.0
4.5
5.0
5.5
6.0
Sep-07 Sep-08 Sep-09 Sep-10 Sep-11 Sep-12 Sep-13
US Treasury Bonds Yield
10
15
20
25
30
Sep-08 Sep-09 Sep-10 Sep-11 Sep-12 Sep-13
TD Ameritrade Share Price
Online broker
Currently under-earning due to low interest rates
Growing client assets through industry consolidation
TD AMERITRADE
US INDUSTRIAL REVIVAL
Cheap energy and a more
competitive labour force have
led to growing optimism in a US
manufacturing revival
US INDUSTRIAL REVIVAL
Cheap energy and a more
competitive labour force have
led to growing optimism in a US
manufacturing revival
US INDUSTRIAL REVIVAL
Cheap energy and a more
competitive labour force have
led to growing optimism in a US
manufacturing revival
US INDUSTRIAL REVIVAL
Cheap energy and a more
competitive labour force have
led to growing optimism in a US
manufacturing revival
US INDUSTRIAL REVIVAL
Cheap energy and a more
competitive labour force have
led to growing optimism in a US
manufacturing revival
US INDUSTRIAL REVIVAL
Cheap energy and a more
competitive labour force have
led to growing optimism in a US
manufacturing revival
US INDUSTRIAL REVIVAL
Cheap energy and a more
competitive labour force have
led to growing optimism in a US
manufacturing revival
US INDUSTRIAL REVIVAL
Cheap energy and a more
competitive labour force have
led to growing optimism in a US
manufacturing revival
US INDUSTRIAL REVIVAL
Cheap energy and a more
competitive labour force have
led to growing optimism in a US
manufacturing revival
Source: Datastream Source: Datastream. In Canadian dollars
March 20, 2013: Purchased TD Ameritrade
US 10-Year Treasury Bonds Yield TD Ameritrade Share Price
Baillie Gifford University of Windsor Pension Plans December 2013
6
Outlook
Withdrawal of quantitative easing would be a sign of health returning to the global economy
A long term support to fundamentals
Companies in good shape
Opportunities for stock pickers with disciplined investment process
© iStockphoto.com


For Institutional Use Only
Pyramis Global Advisors® Pyramis Canadian Focused Equity
December 5, 2013
Edward Lui Institutional Portfolio Manager Lawrence Lim Director, Institutional Client Management
© 2013 FMR LLC. All rights reserved. (P) 672297.1.0 (F) 672299.1.0
PRESENTATION TO:
For Institutional Use Only 2
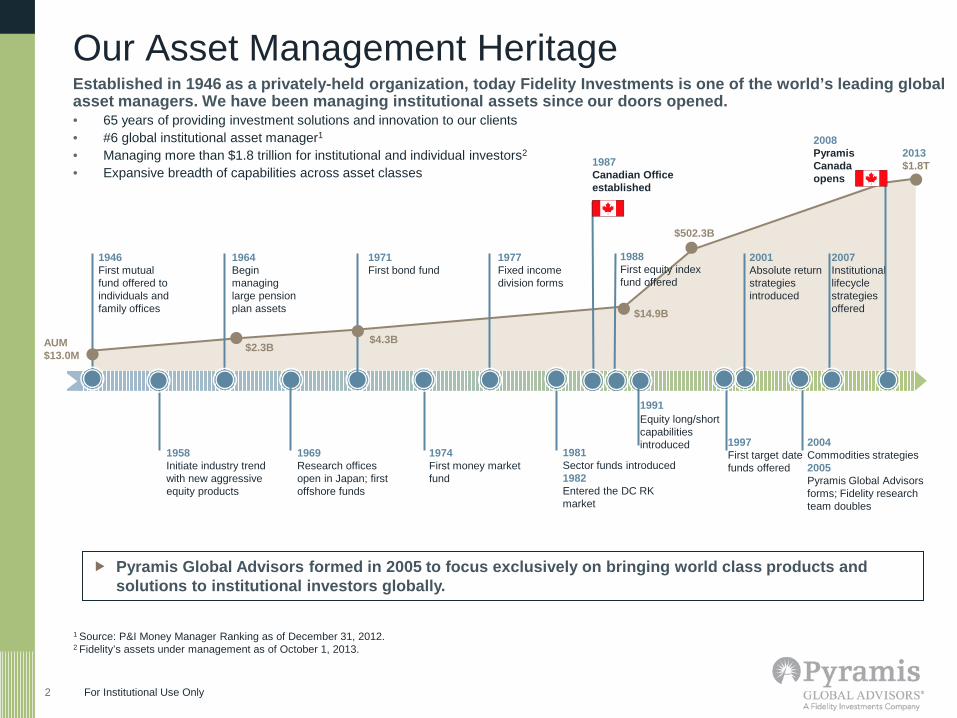
Our Asset Management Heritage Established in 1946 as a privately-held organization, today Fidelity Investments is one of the world’s leading global asset managers. We have been managing institutional assets since our doors opened. • 65 years of providing investment solutions and innovation to our clients • #6 global institutional asset manager1
• Managing more than $1.8 trillion for institutional and individual investors2
• Expansive breadth of capabilities across asset classes
1 Source: P&I Money Manager Ranking as of December 31, 2012. 2 Fidelity’s assets under management as of October 1, 2013.
1946 First mutual fund offered to individuals and family offices
1964 Begin managing large pension plan assets
1971 First bond fund
1969 Research offices open in Japan; first offshore funds
1988 First equity index fund offered
1977 Fixed income division forms
1974 First money market fund
2007 Institutional lifecycle strategies offered
2004 Commodities strategies 2005 Pyramis Global Advisors forms; Fidelity research team doubles
AUM $13.0M
1981 Sector funds introduced 1982 Entered the DC RK market
2001 Absolute return strategies introduced
1958 Initiate industry trend with new aggressive equity products
1997 First target date funds offered
$2.3B $4.3B
$14.9B
$502.3B
2013 $1.8T
Equity long/short capabilities introduced
1991
Pyramis Global Advisors formed in 2005 to focus exclusively on bringing world class products and solutions to institutional investors globally.
1987 Canadian Office established
2008 Pyramis Canada opens

For Institutional Use Only 3 3
Pyramis Assets
$198.8 BILLION 2,3
$94.7B International/ Global Equity
$69.5B Fixed Income4
$30.6B US Equity
$3.8B Alternatives5
As at 9/30/13. 1 Canadian assets are represented in CAD. Canadian assets under administration include: $15.37B in institutional assets within defined benefit pension plans, endowments, foundations, corporate and defined contribution plans (DCIO), $3.11B of which is invested in mutual funds within defined contribution plans. 2 Due to rounding, the total may not add up to 100% of total assets. 3 Pyramis assets under management include $61.9B of asset allocation assets, which may be invested in other Pyramis or affiliated products. Source for asset and client data: Pyramis Global Advisors as at September 30, 2013. All currency is in US dollars. 4 Fidelity Investments total fixed income bond assets are $374.1B as at September 30, 2013. 5 Includes real estate debt and REIT investment strategies, and U.S., international, global, and sector market neutral strategies. Fidelity Investments total REIT and real estate debt assets are over $24B as at September 30, 2013.
PYRAMIS focuses on serving corporate retirement plans, public plans, E&F, Taft-Hartley, sovereign entities, and central banks worldwide.
Canadian Institutional Assets
$7.6B Canadian Equity
$3.4B International Global Equity
$0.2B U.S. Equity
$1.5B Fixed Income
$2.6B Asset Allocation $15.4B1
98 clients
Our Clients and Assets

For Institutional Use Only 4
Fundamental Research Resources
America
Europe
Japan
Pacific ex-Japan
• Access to one of the world’s largest buy-side research teams
• Proprietary global research, independent from Bay Street and Wall Street
• Local market coverage
• Analysts manage industry funds
EQUITY RESEARCH PROFESSIONALS*
Europe 28
Japan 8
Asia/Pacific-Ex-Japan 27
Americas 165
Total Worldwide Equity 228
Worldwide Fixed Income 115
TEAM CANADA EQUITY RESEARCH PROFESSIONALS**
Fundamental Analysts 12
Portfolio Managers 9
Total 21
*Source: FMR LLC and Pyramis Global Advisors. Research professionals include research analysts and associates and reflect the combined resources of Pyramis and Fidelity Investments as of October 1, 2013. **Team Canada equity analysts as at October 1, 2013.

For Institutional Use Only 5
Pyramis Canadian Focused Equity Strategy overview
*Source: eVestment. Based on gross composite performance in Canadian dollars. Data indicating the percentage of peers beaten for Pyramis Canadian Focused Equity is from eVestment Alliance as of September 30, 2013 and is based on a total of 72 investment products within this category. Composite account information is shown. Supplemental information is complemented by the GIPS Composite Performance Data. While the fund is typically managed to this constraint, the portfolio manager retains the discretion to deviate from it, and it is not included as part of the fund’s investment strategy. Pool Benchmark: S&P/TSX Capped Composite Index. Composite Benchmark: MSCI Canada Index.
Portfolio Manager
Research Team
Risk Control Parameters
• Joe Overdevest • 11 years experience, 11 years with Fidelity • Co-Portfolio Manager: Andrew Marchese
• Benchmark: S&P/TSX Capped Composite Index • Sector weights: Index weights +/- 7.5% • Style and capitalization: Core, all-cap
• Excess Return: 3.1% (1st quartile*)
• Tracking Error: 3.5% • Information Ratio: 0.9 (1st quartile*) • Average No. of Holdings: 50 stocks
• Team Canada: 12 Fundamental analysts + Global research team
10-Year Results

For Institutional Use Only 6
CANADIAN FOCUSED EQUITY
FUNDAMENTAL COVERAGE OF CANADIAN STOCKS
IDENTIFY BEST IDEAS WITHIN EACH SECTOR
PORTFOLIO CONSTRUCTION AND RISK MANAGEMENT
For illustrative purposes only.
Pyramis Canadian Focused Equity Investment process
For Institutional Use Only 7
Pyramis Canadian Focused Equity Composite performance vs. S&P/TSX Capped Composite
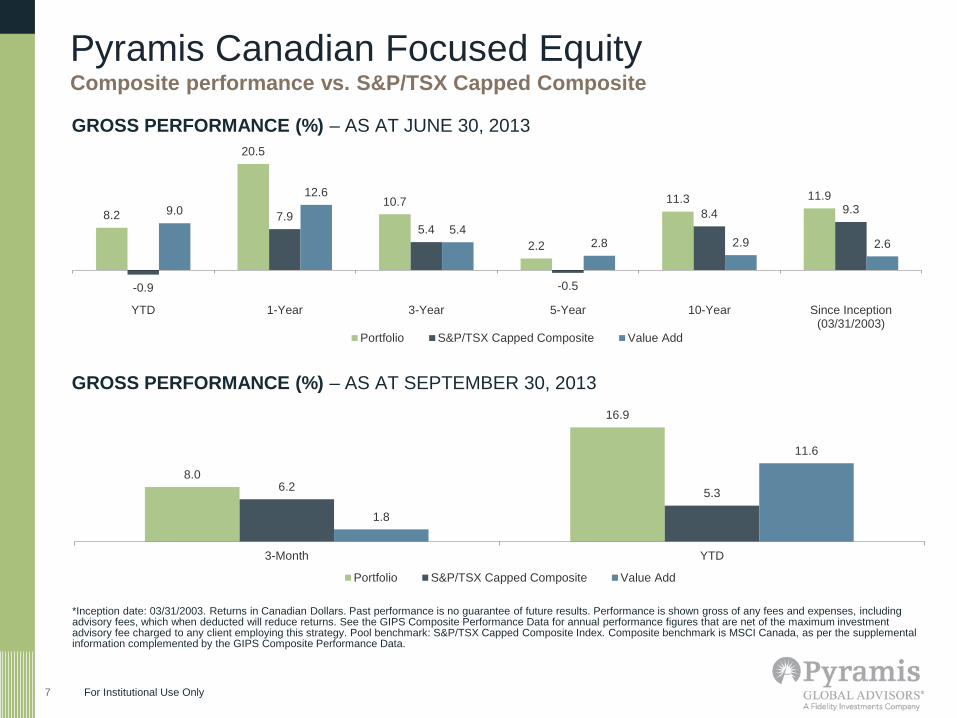
*Inception date: 03/31/2003. Returns in Canadian Dollars. Past performance is no guarantee of future results. Performance is shown gross of any fees and expenses, including advisory fees, which when deducted will reduce returns. See the GIPS Composite Performance Data for annual performance figures that are net of the maximum investment advisory fee charged to any client employing this strategy. Pool benchmark: S&P/TSX Capped Composite Index. Composite benchmark is MSCI Canada, as per the supplemental information complemented by the GIPS Composite Performance Data.
GROSS PERFORMANCE (%) – AS AT JUNE 30, 2013
GROSS PERFORMANCE (%) – AS AT SEPTEMBER 30, 2013
8.2
20.5
10.7
2.2
11.3 11.9
-0.9
7.9 5.4
-0.5
8.4 9.3 9.0 12.6
5.4 2.8 2.9 2.6
YTD 1-Year 3-Year 5-Year 10-Year Since Inception(03/31/2003)
Portfolio S&P/TSX Capped Composite Value Add
8.0
16.9
6.2 5.3
1.8
11.6
3-Month YTD
Portfolio S&P/TSX Capped Composite Value Add
For Institutional Use Only 8
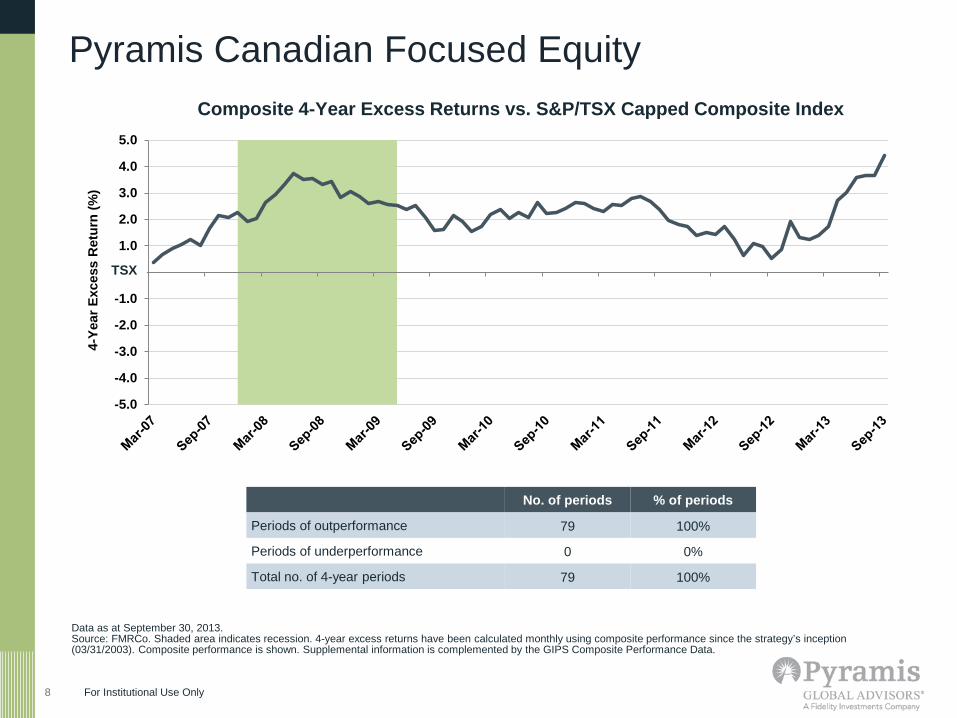
Data as at September 30, 2013. Source: FMRCo. Shaded area indicates recession. 4-year excess returns have been calculated monthly using composite performance since the strategy’s inception (03/31/2003). Composite performance is shown. Supplemental information is complemented by the GIPS Composite Performance Data.
0
2
4
6
8
10
12
14
-5.0
-4.0
-3.0
-2.0
-1.0
0.0
1.0
2.0
3.0
4.0
5.0
4-Ye
ar E
xces
s R
etur
n (%
) Composite 4-Year Excess Returns vs. S&P/TSX Capped Composite Index
No. of periods % of periods
Periods of outperformance 79 100%
Periods of underperformance 0 0%
Total no. of 4-year periods 79 100%
TSX
Pyramis Canadian Focused Equity

For Institutional Use Only 9 9
Pyramis Canadian Focused Equity
0%
20%
40%
60%
80%
100%
120%
Down Market Capture Up Market Capture
Ups
ide
/ Dow
nsid
e C
aptu
re
Capture rates are based on monthly annualized returns. Benchmark used is the S&P/TSX Capped Composite Index. Up markets include months for which the benchmark return is positive; down markets include months for which the benchmark return is negative. Past performance is no guarantee of future results. Returns in Canadian Dollars. Performance is shown gross of any fees and expenses, including advisory fees, which when deducted will reduce returns. See the GIPS Composite Performance Data for annual performance figures that are net of the maximum investment advisory fees charged to any client employing these strategies. Sources: FMR Co, eVestment Alliance. Pool benchmark: S&P/TSX Capped Composite Index. Composite benchmark: MSCI Canada. Totals may not equal due to rounding.
Composite Upside / Downside Capture Rates (Four Years Ending September 30, 2013)
Down Years Up Years
2008 2011 2010 2012
Canadian Focused Equity Composite -30.0% -6.2% 17.9% 9.4%
S&P/TSX Capped Composite -33.0% -8.7% 17.6% 7.2%
Excess Return 3.0% 2.6% 0.3% 2.2%
For Institutional Use Only 10 10
• Strength: size and quality of our investment professionals - Access to over 300 research professionals globally
• Concentrated portfolio of our best ideas: 40-60 stocks • Core investment approach with a focus on risk management.
- No style or market cap bias
• Seeks to provide value added returns in both and down markets conditions
Pyramis Canadian Focused Equity Key strategy highlights
Source: FMR LLC and Pyramis Global Advisors as at September 30, 2013. Research professionals include research analysts and associates and reflect the combined resources of Pyramis and Fidelity Investments as at September 30, 2013. In addition to the above resources, Pyramis also has access to an additional 300 investment professionals through Fidelity Worldwide.

For Institutional Use Only 11
Canadian Focused Equity Composite (CAD) Versus MSCI Canada Index (Net) As of September 30, 2013
GIPS Composite Performance Data
Period Composite Return (Gross%)
Composite Return (Net%)
Benchmark Return (%) Value Added (%)* Number of Portfolios
Total Composite Assets End of Period
($M)
Composite 3 Year Standard Deviation
(%)
Benchmark 3 Year Standard Deviation
(%)
Asset Weighted Standard Deviation
(%)
Percent of Firm's Assets
2013 YTD 16.87 16.18 5.18 11.69 19 1,558 9.67 10.40 N/A less than 1% 2012 Annual 9.44 8.58 6.55 2.89 15 900 11.52 11.63 0.46 less than 1% 2011 Annual (6.15) (6.91) (10.87) 4.72 14 649 14.50 14.72 0.15 less than 1% 2010 Annual 17.88 16.96 14.34 3.54 11 594 20.28 20.38 0.45 less than 1% 2009 Annual 34.51 33.47 34.87 (0.36) 11 610 19.64 19.81 0.81 less than 1% 2008 Annual (30.00) (30.59) (33.28) 3.28 7 318 17.84 17.75 0.20 less than 1% 2007 Annual 16.33 15.42 10.40 5.93 6 420 11.06 10.73 0.07 less than 1% 2006 Annual 14.55 13.65 18.15 (3.60) 7 379 11.32 10.41 0.09 less than 1% 2005 Annual 29.19 28.18 24.30 4.89 7 349 N/A N/A N/A less than 1% 2004 Annual 14.89 13.99 13.05 1.84 less than 5 161 N/A N/A N/A less than 1% 2003 Partial** 29.67 28.92 30.18 (0.51) less than 5 67 N/A N/A N/A less than 1% * Value Added is calculated by taking the gross composite return less the benchmark return. ** The inception of this composite is March 31, 2003; performance is presented for the period April 01, 2003 through December 31, 2003. Notes Definition of the "Firm" For GIPS purposes, the "Firm" includes: (1) all of the portfolios managed by the investment management units of the Pyramis Global Advisors group of companies ("Pyramis"); and (2) portfolios managed by Pyramis' affiliates, Fidelity Management & Research Company and its subsidiaries ("FMR Co.") and/or Fidelity Investments Money Management, Inc. ("FIMM"), that are also substantially similar to institutional mandates advised by Pyramis and managed by the same portfolio management team. Changes to Definition of the "Firm" Effective January 1, 2009, the definition of the Firm was revised to exclude Pyramis' management of funds that invest in real estate and exclude other affiliated advisers or divisions no longer held out to the public as a part of Pyramis. Effective January 1, 2011, the definition of the Firm was revised to include substantially similar investment strategies managed by FMR Co. and/or FIMM and the same portfolio management team. Effective January 1, 2013, the definition of the Firm was revised to include subsidiaries of FMR Co. Basis of Presentation The Firm claims compliance with the Global Investment Performance Standards (GIPS®) and has prepared and presented this report in compliance with the GIPS standards. The Firm has been independently verified for the periods January 1, 1990 through December 31, 2012. The verification reports are available upon request. Verification assesses whether (1) the firm has complied with all of the composite requirements of the GIPS standards on a firm-wide basis and (2) the firm's policies and procedures are designed to calculate and present performance in compliance with the GIPS standards. Verification does not ensure the accuracy of any specific composite presentation. The Firm's list of composite descriptions is available upon request. Policies for valuing portfolios, calculating performance, and preparing compliant presentations are available upon request. Returns Gross composite returns do not reflect the deduction of investment advisory ("IA"), administrative or custodial fees, but do include trading expenses. Net composite returns are calculated by deducting the maximum standard IA fee that could have been charged to any client employing this strategy during the time period shown, exclusive of performance fee or minimum fee arrangements. IA fees paid by a client vary depending upon a variety of factors, including portfolio size and the use of any performance fee or minimum fee arrangement. Actual returns will be reduced by the IA fee and any administrative, custodial, or other fees and expenses incurred. Returns could be higher or lower than those shown. A client's fees are generally calculated based on the average month-end assets at market value during the quarter as calculated by the Firm, and are billed quarterly in arrears. More information regarding fees is available upon request. These investment performance statistics were calculated without a provision for United States income taxes. Composite Creation Date This composite was created in 2003
Composite Description The investment objective of this composite is to seek long-term capital appreciation by investing in a diversified portfolio of Canadian equities while adding incremental return above the MSCI Canada (Net) Index. The composite is composed of all fee-paying discretionary accounts that are managed by the Firm in this style. Composite Name Change The composite name changed in 2012 from the Canada Growth Composite to the Canadian Focused Equity Composite to better reflect the underlying investments in the portfolios. Pool Portfolio The composite contains a pool portfolio that is presented net of custody and audit fees. Investment security transactions for the pool portfolio are accounted for on trade date-plus-one. Fee Schedule The maximum scheduled investment advisory fee for this strategy is 80 basis points, which may be subject to certain decreases as assets under management increase. The investment advisory fee applicable to a portfolio depends on a variety of factors, including but not limited to portfolio size, the level of committed assets, service levels, the use of a performance fee or minimum fee arrangement, and other factors. Effect of Investment Advisory Fee Returns will be reduced by the investment advisory fee and any other expenses incurred in the management of the portfolio. For example, an account with a compound annual return of 10% would have increased by 61% over five years. Assuming an annual advisory fee of 80 basis points, the net return would have been 55% over five years. Derivative Exposure Typically, portfolios may make limited use of derivative instruments to manage and invest cash inflows of underlying accounts within the composite. They are not used for hedging purposes. Derivative instruments are only used when and as client guidelines permit. Known Inconsistencies in Exchange Rates The composite base currency is U.S. Dollar (USD). One or more of the current or historic constituent portfolios have a base currency that differs from the composite and uses a valuation point that differs from other constituent portfolios. Currency Translation Please note that the base currency of this composite is U.S. Dollar (USD). Presented performance is shown in Canadian Dollar (CAD), translated using the New York Close valuation point. Past performance is no guarantee of future results. 577342.9.0
For Institutional Use Only 12
Important Information Read this important information carefully before making any investment. Speak with your relationship manager if you have any questions.
RISKS Past performance is no guarantee of future results. An investment may be risky and may not be suitable for an investor's goals, objectives and risk tolerance. Investors should be aware that an investment's value may be volatile and any investment involves the risk that you may lose money. Performance results for individual accounts will differ from performance results for composites and representative accounts due to factors such as portfolio size, account objectives and restrictions, and factors specific to a particular investment structure. The value of a strategy's investments will vary day to day in response to many factors, including in response to adverse issuer, political, regulatory, market or economic developments. The value of an individual security or a particular type of security can be more volatile than the market as a whole and can perform differently from the value of the market as a whole. The performance of fixed income strategies will change daily based on changes in interest rates and market conditions and in response to other economic, political or financial developments. Debt securities are sensitive to changes in interest rates depending on their maturity, and may involve the risk that their prices may decline if interest rates rise or, conversely, if interest rates decline, their prices may increase. Debt securities carry the risk of default, prepayment risk and inflation risk. Changes specific to an issuer, which may involve its financial condition or economic environment, can affect the credit quality or value of an issuer's securities. Lower-quality debt securities (those of less than investment grade quality, also referred to as high yield debt securities) and certain types of other securities are more volatile and are often considered to be speculative and involve greater risk due to increased sensitivity to adverse issuer, political, regulatory and market developments, especially in periods of general economic difficulty. The value of mortgage securities may change due to shifts in the market's perception of issuers and changes in interest rates, regulatory or tax changes. Derivatives may be volatile and involve significant risk, such as credit risk, currency risk, leverage risk, counterparty risk and liquidity risk. Using derivatives can disproportionately increase losses and reduce opportunities for gains in certain circumstances. Investments in derivatives may have limited liquidity and may be harder to value, especially in declining markets. Derivatives involve leverage because they can provide investment exposure in an amount exceeding the initial investment. Leverage can magnify investment risks and cause losses to be realized more quickly. A small change in the underlying asset, instrument, or index can lead to a significant loss. Assets segregated to cover these transactions may decline in value and are not available to meet redemptions. Government legislation or regulation could affect the use of these transactions and could limit the ability to pursue such investment strategies.

For Institutional Use Only 13
Important Information These materials contain statements that are “forward-looking statements,” which are based on certain assumptions of future events. Forward-looking statements are based on information available on the date hereof, and Pyramis does not assume any duty to update any forward-looking statement. Actual events may differ from those assumed. There can be no assurance that forward-looking statements, including any projected returns, will materialize or that actual market conditions and/or performance results will not be materially different or worse than those presented.
PERFORMANCE DATA
Performance data is generally presented gross of any fees and expenses, including advisory fees, which when deducted will reduce returns. See the GIPS® Composite Performance Data for performance figures that are net of the maximum investment advisory fee charged any client employing this strategy. Some clients may request a performance fee arrangement, which if imposed will also reduce returns when deducted. See Pyramis' Form ADV for more information about advisory fees if Pyramis Global Advisors, LLC is the investment manager to the account. For additional information about advisory fees related to other Pyramis advisory entities, speak with your relationship manager. All results reflect realized and unrealized appreciation and the reinvestment of dividends and investment income, if applicable. Taxes have not been deducted. In conducting its investment advisory activities, Pyramis utilizes certain assets, resources and investment personnel of FMR Co., which does not claim compliance with the Global Investment Performance Standards (GIPS®).
Representative account information is based on an account in the subject strategy’s composite that generally reflects that strategy’s management and is not based on performance of that account. An individual account’s performance will vary due to many factors, including inception dates, portfolio size, account guidelines and type of investment vehicle. Index or benchmark performance shown does not reflect the deduction of advisory fees, transaction charges and other expenses, which if charged would reduce performance. Investing directly in an index is not possible.
Unless otherwise indicated, references made to product assets under management (“AUM”) are to the GIPS firm AUM for the strategy which include all discretionary and, if applicable, non-discretionary portfolios.

For Institutional Use Only 14
Important Information The business unit of Pyramis Global Advisors (Pyramis) consists of: Pyramis Global Advisors Holdings Corp., a Delaware corporation; Pyramis Global Advisors Trust Company, a non-depository trust company (PGATC); Pyramis Global Advisors, LLC, a U.S. registered investment adviser (PGA LLC); Pyramis Global Advisors (Canada) ULC, an Ontario registered investment adviser; Pyramis Global Advisors (UK) Limited, a U.K. registered investment manager (Pyramis-UK); Pyramis Global Advisors (Hong Kong) Limited, a Hong Kong registered investment adviser (Pyramis-HK); Pyramis Global Advisors (Japan) KK, a Japan registered investment manager and investment advisory and agency services provider (Pyramis-Japan); Pyramis Distributors Corporation LLC, a U.S. registered broker-dealer; and Fidelity Investments Canada ULC, an Alberta corporation (FIC). Investment services are provided by PGATC, PGA LLC, Pyramis Global Advisors (Canada) ULC, Pyramis-UK, Pyramis-Japan and/or Pyramis-HK. Fidelity Investments" refers collectively to FMR LLC, a US company, and its subsidiaries, including but not limited to Fidelity Management & Research Company (FMR Co.) and Pyramis. “FIL Limited” refers collectively to FIL Limited, a non-US company, and its subsidiaries. “Fidelity” refers collectively to Pyramis and Fidelity Investments. Products and services presented here are managed by the Fidelity Investments companies of Pyramis Global Advisors, LLC, a registered investment adviser, or Pyramis Global Advisors Trust Company, a non-depository trust company. Pyramis products and services may be presented by Fidelity Investments Institutional Services Company, Inc., Fidelity Investments Canada ULC, FIL Limited, or Fidelity Brokerage Services, LLC, Member NYSE, SIPC, all non-exclusive financial intermediaries that are affiliated with Pyramis. Certain data and other information in this presentation have been supplied by outside sources and are believed to be reliable as of the date of this document. Data and information from third-party databases, such as those sponsored by eVestment Alliance and Callan, are self-reported by investment management firms that generally pay a subscription fee to use such databases, and the database sponsors do not guarantee or audit the accuracy, timeliness or completeness of the data and information provided including any rankings. Rankings or similar data reflect information at the time rankings were retrieved from a third-party database, and such rankings may vary significantly as additional data from managers are reported. Pyramis has not verified and cannot verify the accuracy of information from outside sources, and potential investors should be aware that such information is subject to change without notice. Information is current as of the date noted. Pyramis has prepared this presentation for, and only intends to provide it to, institutional, sophisticated and/or qualified investors in one-on-one or comparable presentations. Do not distribute or reproduce this report. Third party trademarks and service marks are the property of their respective owners. All other trademarks and service marks are the property of FMR LLC or its affiliated companies. Pyramis does not provide legal or tax advice and we encourage you to consult your own lawyer, accountant or other advisor before making an investment.

Questions and Discussion