Embed Size (px)
Citation preview

NASA-CR-2OS025
FINAL REPORT
Investigation of Fiber Optics BasedPhased Locked Diode Lasers
PHASE CORRECTION IN A SEMICONDUCTOR
AMPLIFIER ARRAY USING FIBER OPTICS
,'_ •///!/ /
/./,. ,.--y _
; % ,._
Period of Performance:
March 13, 1995 to March 12, 1996
Contract No: NAS58-38609 D.O. 138
Paul D. Burke
Oon Inv:l'. Completed under:
NASA/MSFC CDDF TASK 94-23
UAH DELIVERY ORDER 138
MARCH 1997
Submitted to:
NASA/MSFC
Submitted by:
University of Alabama in Huntsville
Department of Physics
Huntsville, AL 35899
https://ntrs.nasa.gov/search.jsp?R=19970023108 2018-05-25T01:59:24+00:00Z
FORWARD
This scope of work was completed under contract through the Physics Department
at the University of Alabama in Huntsville, and the NASA Marshall Space Flight Center
Center Director Discretionary Fund. The research completed from 3/95 to 3/96 at the
Optics and RF Division was under CDDF task 94-23 at Marshall Space Flight Center in
Huntsville, Alabama. The remainder of the work was completed from 3/96 to 9/96 at the
Optics Building at the University of Alabama in Huntsville Physics Department. The
equipment used in the experiments was property of NASA, the University of Alabama in
Huntsville Physics Department. and Phillips Laboratory at Kirtland Airforce Base.
Albuquerque. NM. The assistance of the NASA and University staff was vital to the
completion of this project.
TABLE OF CONTENTS
Page
List of Figures ........................................................ viii
List of Tables ......................................................... x
List of Symbols ........................................................ xi
Chapter
I. INTRODUCTION ............................................... 1
1.1 Background .............................................. 1
1.2 Power Beaming Projects .................................... 2
1.3 Geostationary Power Fountain ............................... 2
1.4 Power Beaming using an Array .............................. 3
1.5 Power Beaming and Coherence .............................. 4
1.6 Fiber Optic Phase Modulation ............................... 5
1.7 Coherence and Spot Size .................................. 5
1.8 Research Focus .......................................... 6
II. THEORY ..................................................... 7
2.1
2.2
2.2.1
2.2.2
2.2.3
General Interference Theory ................................ 7
Phased array and diffraction theory ........................... 13
System in Cartesian Coordinates ............................. 13
Radially symmetric system in polar coordinates ................. 16
Output power for an array with 7r/4 phase error .................. 21

Ill.
2.3
2.3.1
2.3.2
2.3.3
2.4
2.5
Spatialcoherencetheory : ..................................
Young's Double Slit Experiment ............................
Spatial coherence of an array of slits .......................... 29
Van Cittert - Zernike Theorem ............................... 31
Fiber Theory ............................................. 33
Fiber interferometers and sensors
Page
26
27
............................. 36
EXPERIMENT
3.1
3.2
3.3
3.4
3.5
3.5.1
3.5.2
3.5.3
3.6
3.6.1
3.6.2
3.6.3
3.6.4
3.6.5
...... .... ..... ° ........ .°. ....... .° ....... °°°oo 44
Experiment Introduction .................................... 44
Injection Locking Semiconductor Optical Amplifiers .............. 45
Fiber Based Math Zehnder interferometer system ................ 50
Piezo Electric fiber stretcher ................................. 51
Experimental Procedure .................................... 55
Fiber stretcher test procedure ................................ 57
Diode laser system ........................................ 58
Ti : Sapphire laser test system ............................... 60
Experimental Results ...................................... 63
Phase shift calculation ...................................... 63
Mach Zehnder interferometer phase shift ....................... 64
Experiment Calculations .................................... 65
Near IR system changes .................................... 65
Amplifier output power .................................... 73
vi

Page
IV. DISCUSSION .................................................. 79
4.1 System Considerations for Laser Power Beaming ................. 79
4.2 Fiber optic phase modulation ................................. 80
4.3 Recommendations ......................................... 82
4.4 Conclusion ............................................... 83
APPENDIX A: NASA Presentation ...................................... 85
REFERENCES ........................................................ 89
BIBLIOGRAPHY ..................................................... 92
vii
LIST OF FIGURES
Figure
2.1
2.2
2.3
2.4
2.5
2.6
2.7
2.8
2.9
2.10
2.11
2.12
2.13
2.14
2.15
3.1
3.2
3.3
Page
Phased Array Aperture System in Cartesian Coordinates ............. 15
Phased Array Aperture System in Polar Coordinates ................. 17
Mathematical model of Phased army aperture ...................... 23
Far-field intensity distribution of in phase array .................... 24
Far-field intensity distribution of random phase array ................ 25
Aperture and Observation Planes ................................ 28
Young's Double Slit System .................................... 29
Multiple Slits for Young's Experiment ............................ 30
Fiber Launch and TIR ......................................... 34
Polarization Maintaining Fiber Structures .......................... 37
Fiber Fabry - Perot Interferometer ................................ 40
Fiber Sagnac Interferometer ..................................... 40
Fiber Mach- Zehnder Interferometer ............................. 40
Sensing Fiber Interferometer and OPD ............................ 41
Phase shift and intensity in a fiber interferometer .................... 42
Injection Locking Semiconductor Optical Amplifier (ILA) ............. 46
CIR 915 fiber stretcher and clamshell cylinder (NASA model) ......... 56
CIR Fiber Stretcher Test System ................................. 59
viii
Figure
3.4
3.5
3.6
3.7
3.8
3.9
3.10
3.11
3.12
3.13
3.14
3.15
3.16
3.17
3.18
3.19
3.20
Page
Ti: Sapphirelaserandamplifiersystemfor powermeasurements........ 61
Piezowaferexpansionfor testfrequencies......................... 66
Fiber stretcherphaseshift for 0-5voltsDC signal ................... 67
Phaseshift for 5 volt amplitudewith variousfrequencies.............. 68
Oscilloscopetracefor stretcher- 1kHz at2 volt amplitude............ 69
Oscilloscopetracefor stretcher- 10kHz signalat 5 volt amplitude...... 69
Oscilloscopetracefor stretcher- 1.6kHz at 5volts amplitude.......... 70
Oscilloscopetracefor stretcher- 1kHz at 5 voltsamplitude............ 70
Oscilloscopetracefor stretcher- 4 kHz at 5volts amplitude............ 71
Oscilloscopetracefor stretcher- 10kHz at2 volts amplitude........... 71
FiberStretcherFringeShift VersusFrequency...................... 72
Fiber stretchertestinterferencepattern- 0 Hz ....................... 76
Fiber stretchertestinterferencepattern- 20Hz ...................... 76
Fiber stretchertestinterferencepatternwith extrashear............... 77
Fiber stretchertestinterferencepatternwith tilt ...................... 77
Fiber stretchertestinterferencepattern- 1kHz ...................... 78
Fiberstretchertestinterferencepattern- 200Hz ..................... 78
ix

LIST OF TABLES
Table
2.1
3.1
3.2
3.3
3.4
Page
Collectable Power Loss with Phase Shift .......................... 22
Injection Locking Amplifier Power Requirements ................... 48
Amplifier Power Characteristics ................................. 49
List of System Components ..................................... 52
Fiber Stretcher Specifications ................................... 54

LIST OF SYMBOLS
Symbol
GPF
He-Ne
ILA
MCF
MOPA
OPD
PM
PZT
Ti:Sapphire
a
ac_
A
A
hoij
C
d
Cj
Definition
Geostationary Power Fountain
Helium Neon.
Injection locking optical amplifier.
Mutual Coherence Function.
Master oscillator and power amplifier.
Optical path distance.
Polarization maintaining.
Lead Zirconate Titanate.
Titanium doped Sapphire.
Radius of synthetic aperture.
Radius of fiber core.
Amplitude of electric field vector for entire array at Z=0.
Source aperture at Z=0.
Amplitude of electric field of a single emitter in aperture A.
Amplitude of electric field of emitter (i,j) in array at Z=0.
Speed of light in a vacuum, c = 3.0 x 10g m/s 2
Distance between two slits in Young's experiment.
Distance between any two elements in synthetic aperture array.
Et(r,t), Ez(r,t) Electric field vector at a position r and time t.
xi

Symbol
E j(q)
E0_ , Eo2
E,o_
f,,f2
h
i
i.j
[i,j]
I
I,, I2
I0
I(p)
io ij
Ifin,,
Iiniti_
I,v4
Jo(b)
Jl(b)
Definition
Electric field vector at image plane radius q from emitters in [i,j].
Amplitude of electric field vector E_ and E2.
Total electric field from a sum of superimposed waves.
Phaseterm given as e_#'_-i#_".
Path distance from the center of A to observation points in plane P.
Dummy variable for calculating Bessel function, J_ (kpq/R).
Complex number, if--1.
Array component identification number for array of sources.
Array from (1,1) to (i,j).
Intensity of superimposed waves E_ + Ez.
Intensity of E_ and E2 respectively.
Intensity from a single emitter.
Total intensity at point p from multiple superimposed waves.
Initial intensity at aperture plane from emitter (i,j) in array.
Optical power out of a sensing fiber.
Optical power into a sensing fiber.
Maximum possible intensity from a system.
Intensity at image plane with half of the sources n/4 out of phase.
Intensity at image plane with half of the sources A_ out of phase.
Zero order Bessel function of (b).
First order Bessel function of (b).
xii

Symbol
k
kl, ks
L
AL
m
N
hi, n2
ncladding
r_
An
P
PI, P2
(q, _')
r
R
SD $2
t s,l
t
t _
T
U
Definition
Wave number, 2n/g.
Wave vectors for El and E:.
Length of optical fiber.
Change in length of optical fiber.
Order number of diffraction pattern maxima.
Number of sources in array [i j], equal to the product ij.
Index of refraction for media 1 and 2 respectively.
Index of refraction of fiber cladding.
Index of refraction of fiber core.
Photo-elastic change in refractive index in a stretched fiber.
Observation plane used to calculate spatial coherence for F_2(0).
Source points in aperture plane at Z=0.
Polar coordinates of observation plane at Z=R.
Radius of synthetic aperture at Z=0.
Distance along Z axis between the aperture and observation planes.
Vector coordinates for source position within the aperture A.
_/(xsl )2 + (y,,)2.
Time variable.
Time variable to include a delay in the (P2" Pt) path difference.
Time interval over which the time average of a function is taken.
Dummy variable used to show integration of a Bessel function.
o.°
XIII

F(P1, P2, x')
F(s,s,0)
F(f_l, _2, 0)
rl
Pl, P2
Pll
Oz2
(p,
0
01, 02
0_
T
Definition
Normalized degree of spatial coherence for rays from two aperture
points Pl and P2 superimposed with no time delay (x=0).
Spatial coherence of waves propagating along rl and r2 from
PI and P: in A. Same as F(rl, r2,0).
MCF for two source aperture points Pl and P2 with time delay x.
Optical intensity function at aperture A for a coordinate vector s.
Spatial coherence function for two propagation paths f2_ and f_2.
Also used for the self coherence function with _=0.
Variable used for measuring degree of spatial coherence across a
propagating beam from a synthetic aperture array of sources.
Wavelength of light.
Dummy variable used in a zero order Bessel function integral.
Beam propagation paths from source points PI and P2 to a point in
observation plane P.
Photo elastic tensor constant for fiber core, 0.121 for fused silica.
Photo elastic tensor constant for fiber core, 0.270 for fused silica.
Polar coordinates of aperture at Z=0.
Angle of propagation l_om the center of an array to central peak maxima.
Ray angles with respect to the normal in media of index nmand n2.
Critical angle for fiber and interface of media index of nl and n2.
Time delay between two waves, E1 and Ez at an observation plane.
XV

S_._vmbol
U(x,y)
Uij(x,y)
v'
v(a,13)
va (a,13)
(x,y)
(xs, yB)
(x,1,ysl)
z
Z
8
A,
_N
_b(AL)
AC_j
_jo
Definition
Electric field in aperture at coordinates (x,y) at Z=0.
Electric field at (x,y) from emitter numbered (i,j) in array at Z=0.
V-number, used to determine number of operable modes of a fiber.
Electric field of image at coordinates (a,13) at Z=tL
Electric field at (ct,13) at Z=R from a source numbered (i.j) in A.
Cartesian coordinates for aperture plane at Z=0.
Cartesian coordinates for point in observation plane P.
Cartesian coordinates for observation point at Z=IL
Coordinates of source point Pt in aperture A.
Separation distance from source to aperture plane.
Longitudinal axis of propagation.
Cartesian coordinates for image plane at Z=IL
Piston error between Et and Ez causing a phase difference.
Value used to calculate the V _ for a step index fiber.
Phase of the Nth wave at observation point in z=o plane.
Phase of an electromagnetic wave or fight beam
Phase change with a change in fiber length AL.
Phase difference.
Phase difference between two emitters in the array [i_].
Initial phase angle for a wave leaving an array source numbered (i,j).
xiv
Symbol
V
Vp
CO
Definition
Frequency of light, v = c/_.
Poisson's ratio for a fiber core, 0.17 for fused silica.
Optical frequency, co = 2rcc/_..
xvi

CHAPTER I
INTRODUCTION
1.1 Background
Continuing investigations of new methods of propulsion for space vehicles are
beginning to include technologies for beaming energy from the ground to space. In one
concept under consideration, an intense laser beam is convened into electrical power by a
photo-voltaic array, typical of those used on spacecraft today. While this is not currently
used in space missions, demonstrations of the technologies needed to complete such a
power beaming system are being accomplished. Earth based power beaming could be
used to power orbital transfer vehicles, geosynchronous orbit satellites, or Space Station
Freedom. Conversion efficiency from coherent laser light to electrical power is twice that
possible in converting sunlight. Also, there is less waste heat generated in the army with
laser light, making possible higher power incident beams. This could allow a ten-fold
increase in convened power. Convened power could be used on board space vehicles for
propulsion or payload operations. These advanced concepts have been under discussion
at Marshall Space Flight Center in Huntsville, Alabama, with a recent Beamed Energy
Transportation Workshop held in October 1996.

1.2 PowerBeamingProjects
NASA's explorationof powerbeaminginto spacehasledto the ideaof using
diodelasersfor their efficiency,power,sizeandcost,eventuallyleadingto
conceptualizationof ahigh powerarraysource.Experimentsbeganin the late1970s
(Backus,1972)thatproposedusinglasersto transmitpowerto photovoltaicarrays.
Subsequentinvestigationsin the late1980'sconsideredhighpoweredlasersfor beaming
to satellitesandotherspacevehicles(Montgomery,1995) Laserpowerbeaminghasalso
beenpursuedfor useby theDepartmentof Defenseandcommercialventuresaswell.
(Landiset al., 1992)(LandisandWesterlund,1992) In 1990,asaresultof successful
powerbeamingstudies,theSELENEprojectwascreatedfor spacelaserenergyheaded
by JohnRatherandtheOffice of Space Access and Technology. SELENE, named after
the Greek god of the moon, was proposed to use a pulsed free-electron laser and an
adaptive optic segmented mirror to launch power to an orbiting satellite or lunar base.
(Montgomery, 1992) (Landis et al., 1992)
the scope of this work.
SELENE research was used as background for
1.3 Geostationary Power Fountain
Phased-array power beaming is an offspring of the SELENE project. The
proposed system would use a synthetic aperture phased array of emitters secured to the
ground called the Geostationary Power Fountain (GPF). The adaptive optics approach is
investigated in this work with a fiber optic phase correcting system. The GPF system
was spawned when weaknesses in the SELENE project were more clearly defined. The
GPF's primary advantages over SELENE are cost and reliability. The GPF uses many

lowerpowersources,anddoesnotneeda supportingstructm'eto mountanddirect it.
Phasedarraysin generalhavetheadvantageof needinglesssupportandequipmentto
directahigh poweredbeam.
Singlelasersusedfor powerbeamingneeda phasingor directionalmirror to
correctphaseerrorsandminimize thespotsize. Thermalandmechanicalproblems
increasedramaticallyfor steeringasinglesource,aspowerbeamingto spacevehicles
requiresanoptical intensityon theorderof kilowatts.An arrayis morereliablesinceall
elementswill not fail atthe sametime, andit canoperatecontinuouswave,not pulsed,
like mosthigh powerlasers.Continuouswaveoperationis betterfor powerconversion
with photovoltaicarraysonboardmanysatellites(Landiset al, 1992). The SELENE
programproposesapulsedfree-electronlaserandadirectionalmirror andtelescopeto
focusit ontoa lunarbasefromChinaLake,California. Otherproposedusesfor
SELENE'spowerbeamingarepoweringspacemanufacturingfacilities, lunarmissions,
andMarsmissions.(Walker andHeinbockel,1989)
1.4 PowerBeamingusinganArmy
Thetechnologywhich couldbe thekeyto beamingsufficientopticalpowerto a
targetin spaceis a syntheticaperturephasedarrayof semiconductorsources.Phased
arraysareusedin radarandradiotelescopeswith a systemof phasedtransmittersand
receiversutilizing asyntheticaperturegeometry.Thesesystemsusemodulatedbeam
phasingandsourcegeometryto controlincidentspotsizeandlocation. A phased array of
optical power emitters can be used for near infrared (780-860 nm) laser power beaming
with the same results and control. A master oscillator and power amplifier (MOPA)

4
architecture would employ a laser source for the optical signal, and an array of injection-
locking semiconductor optical amplifiers as the emitters. The MOPA system can use
many emitters in an array to achieve a desired output power, but an adaptive optic system
must be incorporated to create the phase modulation. Such an adaptive optic technology
is investigated in this research using fiber optics and piezoelectric actuators.
1.5 Power Beaming and Coherence
A temporally coherent emitted beam is achieved by limiting the array operation to
a single optical frequency with a very. narrow linewidth. Multiple quantum well optical
power amplifiers take an injected light beam and amplify its output. These
semiconductor devices can be manufactured to operate at a specific wavelength in the
near infrared. They have a narrow linewidth, and amplify only a specific incident signal
wavelength. As sources in a MOPA system, they would serve as the emitting elements in
a phased array. Each propagating wave from sources in an array of emitters has a
different initial phase angle. Addressing the phase of each element in the array can
correct phase mismatches by modulating the beam's path length in order to launch a
coherent beam of light to a target vehicle in space. Modulating the phase of each beam is
possible by changing its optical path distance (OPD) with respect to other beams in the
array. OPD corrections can be made before final injection in _. _"optical amplifiers.
These corrections require an adaptive optic system, which is the topic of research here.
1.6 FiberOptic PhaseModulation
Phasecorrectionsto theemittedbeamcanbecontrolledusingfiber opticsanda
fiber stretcherthatchangestheOPDof the light in thefiber leadingto eachamplifier in
theaperture.Beaminformationfrom thetargetvehiclecanbeusedin a fiber-optic
feedbackandcorrectionsystemwhich incorporatesinformationaboutbeamsizeand
degreeof spatialcoherenceat thedetectorplane. Targetfeedbackandsensorinformation
atthearraycouldcorrectphasedifferencesbeforelaunchto optimizepowercollection
andcentralpeaksizeatthedetectorplane. A laserbeaconcouldtransmitatmospheric
distortioninformationto thearraysitein orderto makephasecorrectionsat thearray
beforelaunch.
1.7 CoherenceandSpotSize
Propagationthroughtheatmospheregenerallychangesthespatialcoherenceof
laserbeams.Geosynchronousorbit for satellitesis 40 - 60thousandkilometers,usually
indicatinga far field casefor powerbeaming.Beamdistortionscausedby propagating
throughtheatmospherecanbecorrectedby adaptiveopticsto shape,steer,andtargetthe
intensitypatternontoasatellite. This is accomplished by controlling the phase of the
emitters in the array. Beam information from the target vehicle could allow correction of
distortion at the aperture of sources. The total beam's spatial coherence will determine
the size of the smallest far field diffracted spot, as well as the concentration of optical
power within that spot. Power losses in the far-field pattern caused by a change of phase
were modeled by Williams. (Williams, 1992) The power collection efficiency of a
simulated phased array decreased very quickly with loss of phase stability beyond a
pistonerrorof k/5 across the elements of the array. If a traveling beam is spatially
incoherent, the central diffracted spot size can be large and the power inside diffusely
distributed. Conversely, a spatially coherent beam will have a concentrated, smaller
central diffraction peak with all in-phase array elements constructively interfering.
1.8 Research Focus
The scope of this work will begin with an overview of relevant theory for
interference and optical coherence for an array of sources. An explanation of
fundamental fiber optics and their applications will follow and provides added
background for the components used in the experiment system, including fiber optic
interferometers. The experiment will examine an adaptive optic system using a piezo
electric device to stretch optical fiber. The fiber stretcher will be characterized using a
fiber interferometer and various modulation frequencies. The laser beam exiting one arm
of the interferometer will be amplified using a semiconductor optical amplifier. The
performance of an optical amplifier will be demonstrated while the fiber stretcher
changes the incident beam's phase. This will introduce the basic MOPA system with
fiber optic phase modulators used as an adaptive optics system. The phased army system
discussed in the GPF proposal is a candidate for application of the experimental results.

CHAPTER II
THEORY
2.1 General Interference Theory
Interference of two beams can be seen as the superposition of waves intersecting
in a common plane. For the usual case, the sources of these waves are points and are
separated by a distance much greater than the wavelength of the propagating light. An
interference plane at a point P a distance R away, that is much greater than the separation
distance d between the sources, will sum relatively planar waves from these sources (due
to a long propagation distance). Interference of two plane waves at point P is described
mathematically using the principle of superposition of the electric fields of the waves. Let
the scalar fields be given by:
El(rl,t) = E01 cos(kl'rl " cot + dpl) (2.1)
Fa(r2,t) = E02 cos(k_.r2 - cot + _b2) (2.2)
E0t and E02 are the amplitudes of the electric field vectors, and to is the frequency of
oscillation, kl and ks are the wave vectors for each wave, and dh and _2 are initial phase
angles. A complex vectoral form of the fields may be written as:

(2.3)
(2.4)
Let the waves E! and E: propagate in the same direction along the Z axis with the same
wavelength so that kl = 2z_/X = k2, but let the path lengths be different:
k 1 . Zl_ = kz I (2.5)
k 2 •z2_. = kz 2 (2.6)
E01 and E02 both lie on the X axis for this example, meaning the waves are linearly
polarized. Now let
E = E ! + E2 (2.7)
So:
E = Eol ei(_z'-_+#' )x + E02 ei(a:_ -_ot+#, )_ (2.8)
and define:
I = < E.E" > (2.9)
= <(E_ + E_). (E,*+ E2*)> (2.10)
= < E1 • El* + E2 • E2* + El • E2* + E2" El* > (2.1 1)
Now if only the real part of E i and E 2 is considered then,
E01_ cos(kzl + co t- #l )
E02:_cos(kz 2 + c_ot -#2)
EI--
E 2 =
(2.12)
(2.13)
then E 1 • E2 ° = E 2 • E I" = E I • E 2 (2.14)

and fi'om Equation 2.11, the intensity can be written as"
I =<IE12+E22+2(E1 .E2) >
9
(2.15)
individual sources, I1 and I2.
I(P) = I1 + I2 + I12
Taking the time average gives a value for I(P) in terms of the intensity of each of the
Let Ix = <l E _12>and I2 = <1E 212>
(2.16)
and
I12 = 2 < El • E2 > (2.17)
This allows It: to be called the interference term evaluated for the specific instance that E1
is parallel to E2. Using this interference term, it is evident that
E1 • E2 = Eol Eo2 cos(kzl - cot + _bl) cos(kz2- cot + ¢_2) (2.18)
= Eol Eo2 {Cos(kz1 + el)COS(cot) + SiIl(kZl+ ¢l)sin(cot)}x
{ cos(kz2+ ¢2)cos(cot) + sin(kz2+ 02)sin(cot)} (2.19)
Note that the time average of a function f(t) taken over a time interval T with a dummy
variable t' is:
< f(t) > = 1/T _'+T f(t')dt' (2.20)
is the period of the harmonic function fit) and is equal to 2x/co. In Equation 2.20, T>>z,
so that over a large time interval, 1/T dominates the integral The time average of
Equation 2.19 is"
<El-E2 > = 1/T _ EolE02 [cos(kzl +Ot)cos(cot) + sin(kzl +01)sin(cot)] x
[cos(kz2 +¢:)cos(cot)+ sin(kz: +¢t)sin(cot)] dt' (2.21)

_2(ot) sin(kz,+)l) _(kz2+)s) +
cos(kzl+)O _(kzs+O2)] dt'
I/WfEolE02cos2(cot)cos(kZl+_l)cos(kz2+_s)+
sin(cot)cos(cot)[sin(kzl+_l)cos(kzs+_2)+
(2.22)
This expression can be simplified using the time average of two trigonometric identifies,
<cosS(cot)> = <sinS(cot)> = 1/2, and <sin(c0t)cos(cot)> = 0. When these are inserted into
Equation 2.22, it is simplified into Equation 2.23.
< E1-E2 > = Eo_ • Eos 1/2 cos[(kT.l+ d_l) - (kzs+ 62)] (2.23)
so, using Equation 2.17, Iz: is determined to be:
112 = Eol " Eo2 cos _ (2.24)
(Hecht, 1991)
In Equation 2.24, 8 depends on the path length difference and initial phases.
= [kZl-kz2 + qb_- _2] (2.25)
11= <fEll2> = Eol2 /2 ,12= <IE2[s> = E02s /2 (2.26)
The entireexpressionforthe interferencepatternI can thenbe writtenas:
I = 11+ 12+ 2 (IiIs)1:2cos6 (2.27)
For a system where the amplitudeof each sourceisthe same, Le. Eol = Eos,and
notingthatIwillhave a maximum value when cos8 = I,and Io= I_= Is,brightand dark
fringes(shown interms ofIo, the intensityof a singlesource)occour for:
{bright fringe}
{dark fringe }
at _ = 0, +_2_, __.4_, ... [ cos_ = 1] (2.28)
at _ = :!_, +_.37t,... [ cos8 = -1] (2.29)
(Nussbaum and Phillips, 1991)
10

11
The modulation is created by a difference in phase (caused by a difference in path
lengths if the initial phase angles are equal) between the interfering waves. Light and dark
fi'inges are created by the constructive and destructive interference of the in-phase (cos8 =
1) and out of phase (cos8 =-1) wavefronts.
When a large number of sources are superimposed, their wavefronts interfere as an
array. The intensity in the far field can be represented as a function of the emitted
intensity of a single source, Io. Letting the electric field from each emitting source be
E01 _ and the plane where superposition is observed be z=0, the total electric field from
all of the waves in an array of N sources (originating from a single plane) with optical
frequency co is:
E = Eol [e i('_t+_1)+ ei(_t+ _2) + ei(=t+ _) +... + ei(®t+ e}prj (2.30)
eN = phase of the Nth wave at an observation point in the z=0 plane, due to
a combination of the initial phase and the path difference.
E = e i'_t Eoli E e i_N (2.31)
I(P) = <IEI:> = Eol 2 < E e"i_NE e i_ > (2.32)
I(P) = E012 [ 1 + e -i(_2"_l) + e i(c2"_1) + 1 + e + e + 1+ ...] (2.33)
Io = Eox2 = h-radiance from one wave (2.34)
In the summation of the phases in Equation 2.33, there will be N terms that are equal to
unity. The other terms, where e_ _ e2, will be a cosine of their difference. Over the time
average, there will be as many positive contributions from the cosine terms as negative
ones if the phase angle s_ is random in time (due perhaps to the inital phase angle being
random in time). The sum of the time averages of the electric fields is <IE[2>.
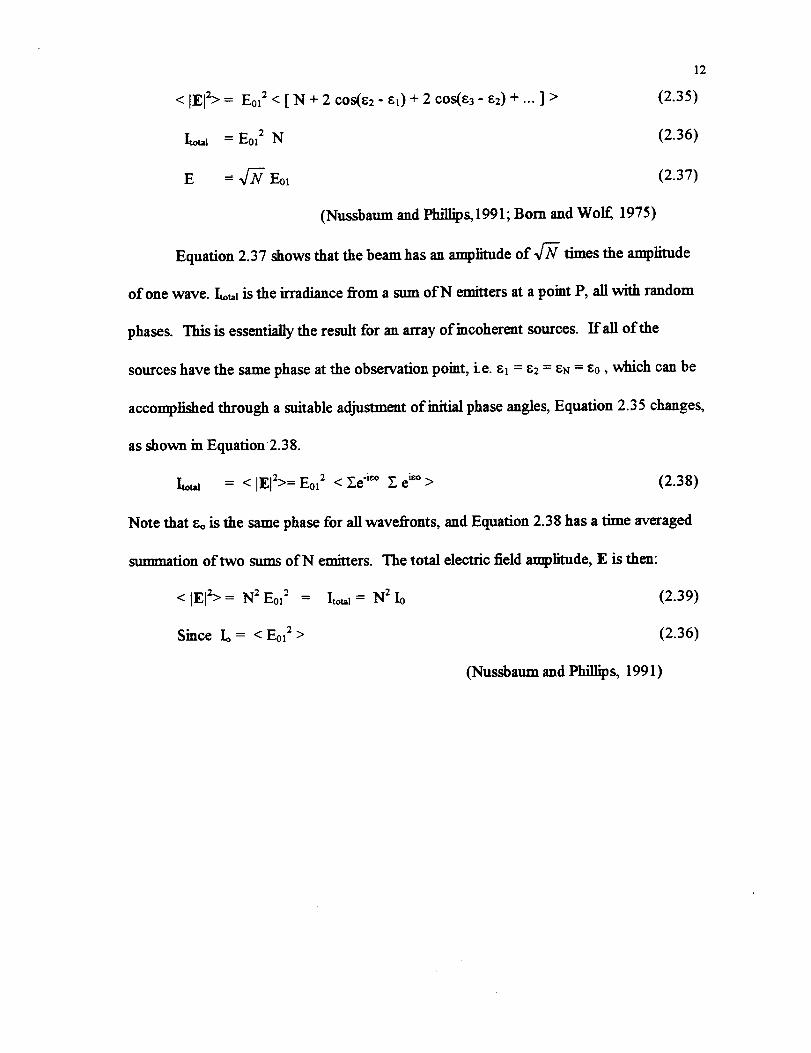
< [El2>= Eol2 < [ N + 2 cos(62 - 61)+ 2 COS(t:3-g2)+ --.]>
I_ul = EOl 2 N
E -" _:-N Eol
(Nussbaum and Phillips,1991; Born and Wol_ 1975)
12
(2.35)
(2.36)
(2.37)
Equation 2.37 shows that the beam has an amplitude ofx/N times the amplitude
of one wave. I_,_, is the irracliance l_om a sum of N emitters at a point P, all with random
phases. This is essentially the result for an array of incoherent sources, flail of the
sources have the same phase at the observation point, i.e. _1 = _2 = _N = _o, which can be
accomplished through a suitable adjustment of initial phase angles, Equation 2.35 changes,
as shown in Equation2.38.
Ito,-, = < [El 2>= Eol 2 < Y_e"i_° y- e i_° > (2.38)
Note that _o is the same phase for all wavefronts, and Equation 2.38 has a time averaged
summation of two sums of N emitters. The total electric field amplitude, E is then:
< IE[2>= N 2 Eol2 =
Since Io= < Eo_2>
Ito,-I = N 2 I0 (2.39)
(2.36)
(Nussbaum and Phillips, 1991)

13
Equation2.39showsthatthesummationof N in-phase,highly correlatedwave
frontsis a beamwith theelectricfield amplitudeof N2sources,andthusN2timesthe
intensityof asinglesource,I0. This can be combined with interference theory, for a
phased array of N emitters to demonstrate the importance of phase matched sources in an
army to obtain maximum intensity output.
2.2 Phased array and diffraction theory
An aperture of any dimension will create a diffraction pattern according to the
boundary conditions and the nature of the light that is incident upon it. A synthetic
aperture creates its boundary conditions by the geometry of the sources inside the
aperture. Diffraction from a synthetic aperture of radius a appears as a true illuminated
aperture if the propagation distance, z, from the aperture plane is significantly large
enough ( z >> 4aZ/_.) (Hecht, 1991) The far-field diffraction pattern from an array of
sources is then the pattern caused by an illuminated aperture of the same dimensions as
the array.
2.2.1 System in Cartesian coordinates
For a synthetic aperture consisting of an array of N sources numbered from (1,1)
to (i_j), with N = (i-j), the far field irradiance pattern is given by the Fraunhofer diffraction
pattern of the array's aperture, with a phase contribution from the piston error of each
emitter. The resulting beam's phase error is the combination of the piston errors from the
emitted beams in the entire array.
14
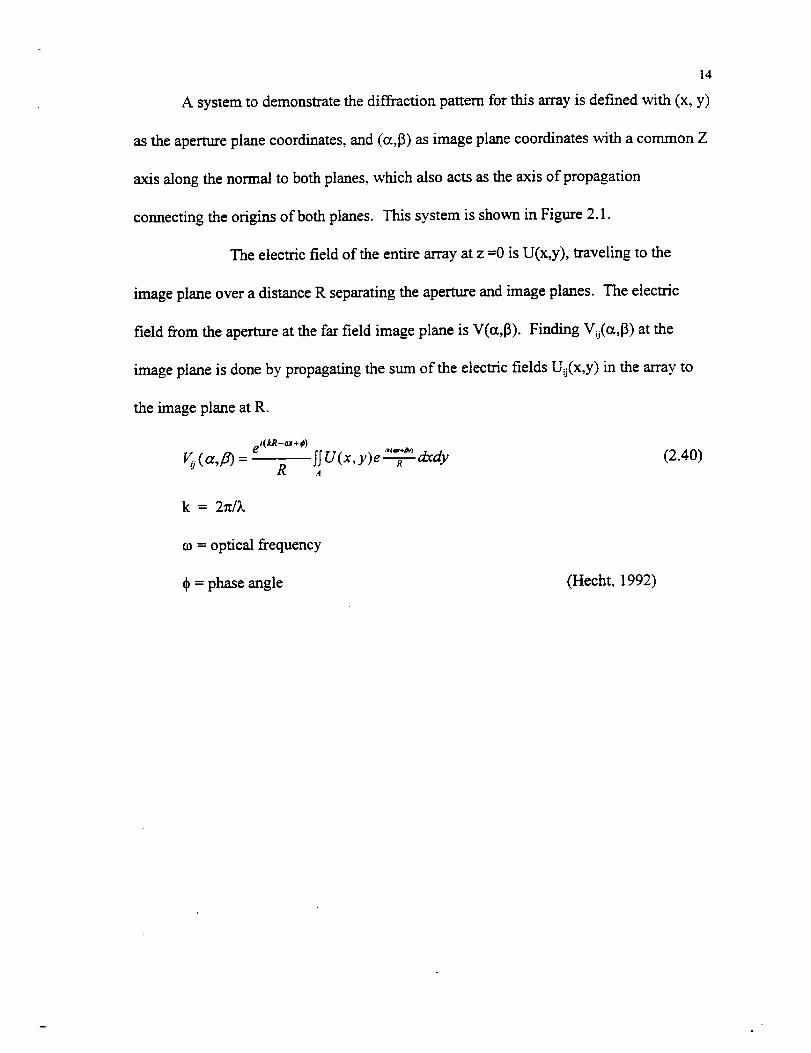
A system to demonstrate the diffraction pattern for this array is defined with (x, y)
as the aperture plane coordinates, and (a,[3) as image plane coordinates with a common Z
axis along the normal to both planes, which also acts as the axis of propagation
connecting the origins of both planes. This system is shown in Figure 2.1.
The electric field of the entire array at z =0 is U(x,y), traveling to the
image plane over a distance R separating the aperture and image planes. The electric
field from the aperture at the far field image plane is V(a,[B). Finding V_j(a,_) at the
image plane is done by propagating the sum of the electric fields U_j(x,y) in the array to
the image plane at R.
e i('_-_÷ _) ,k_ d_cf/_]_ U (x, y)e--.x-- _ _. (2.40)
k = 2r:/_.
co = optical frequency
d_= phase angle (Hecht, 1992)

15
Y
z--0
jX
R
v,j(a,_)..--
f "..
- -R
Figure 2.1 Phased Array Aperture System in Cartesian Coordinates
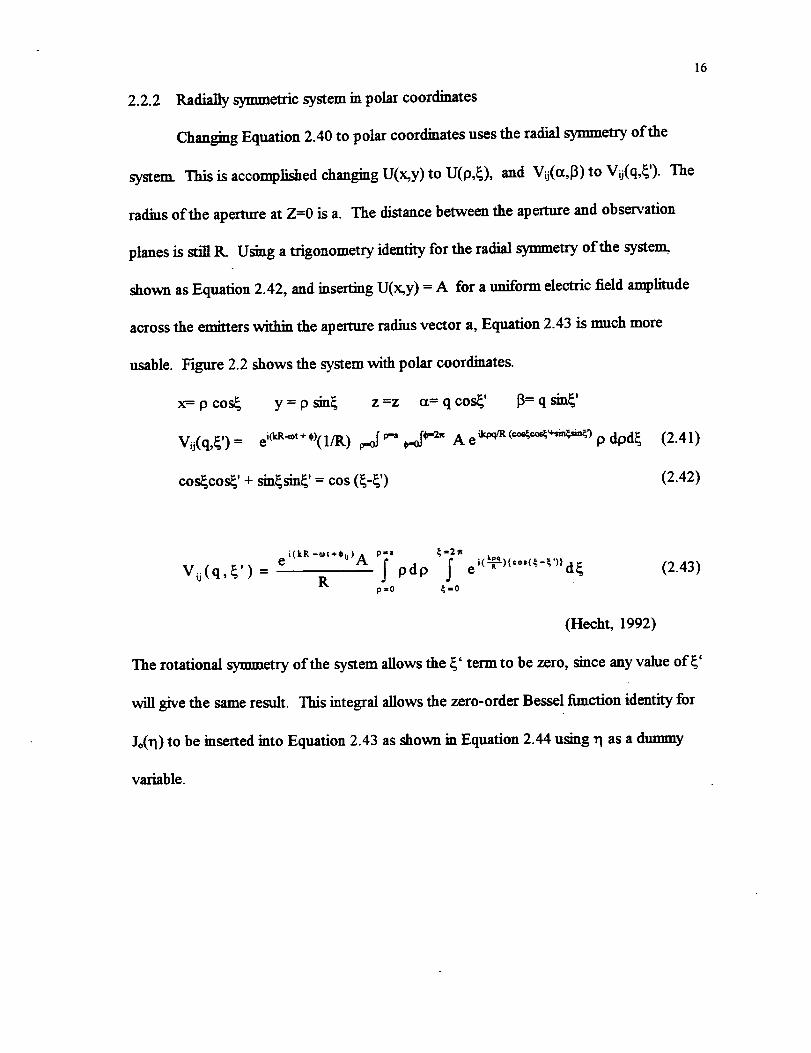
2.2.2 Radially symmetric system in polar coordinates
Changing Equation 2.40 to polar coordinates uses the radial symmetry of the
system This is accomplished changing U(x,y) to U(p,_), and Vij(a,13) to Vij(q,_'). The
radius of the aperture at Z=0 is a. The distance between the aperture and observation
planes is still R_ Using a trigonometry identity for the radial symmetry of the system,
shown as Equation 2.42, and inserting U(x,y) = A for a uniform electric field amplitude
across the emitters within the aperture radius vector a, Equation 2.43 is much more
usable. Figure 2.2 shows the system with polar coordinates.
x= p cos_ y = p sin_
Vij(q,_') = e i_'t+*)(1/R)
z =z a = q cos_' 13= q sin_'
_ _.o_*'2'_A e _ (_.,,_,¢,_.+m_i_,_p dpd_
cos cos ' + sin sin ' = cos
(2.41)
(2.42)
16
Vij(q,_')= e'_"R-"+'}"'A j" pdp f e (2.43)R
p =o _ =o
(Hecht, 1992)
The rotational symmetry of the system allows the _' term to be zero, since any value of_'
will give the same result. This integral allows the zero-order Bessel function identity for
Jo(rl) to be inserted into Equation 2.43 as shown in Equation 2.44 using r I as a dummy
variable.

17
V_j(q,_')
0
/
Figure 2.2 Phased Array Aperture System in Polar Coordinates

18
SubstitutingEquation2.44 intoequation2.43for theBesselfunctionintegral resultgives
V_j(a,13)asa functionof apertureandpropagationdimensionsin Equation2.45.
Jo(11)= (1/2n)d-" e_nC°'* d4_
Vij(ot,[_) = _. e[iOtg.._t+,ij)l jap [2n Jo(kpq/R)] do
(2.44)
(2.45)
(Born and Wolf, 1975)
(Hecht, 1992)
This expression can be changed to a first order Bessel function using the same integral
method in Equation 2.44 letting h = kpq/R.
p = h (R/kq)
dp = dh (R/kq) (2.46)
P u' Jo(u')du = h[Jt(h)] (2.47)
J" p [2rt Jo(kpq/R)] dp = 2_(R/kq) 2 h2 "_°'/g Jo(h) h dh (2.48)
= 2n _ J0 (kpq/R) p dp
= 2n (R/kq) 2 J,(kaq/R) (2.49)
V_. ( o_ ,/3)= V"eA i(kR-wt-_kq) (+) 2 2 x(-_) J I ("-_--) (2.50)
A i(kR -cot+#q)= 2 -ge (xa2)_,'-_--qlJ, k-'F "-) (2.51)
= 2 -_ei(_-a'eia'Area,m,,,, (___) (2.52)

19
The expression ev'* is the phase dependent term of the beams from the array. This
will become a determinate of the in-phase incident power as cos(A_) when the intensity is
taken from the electric field equation, as I = 1/2(E'E). Superposition of waves with a
phase error will cause them to interfere somewhat destructively, lowering the over_l
intensity, in the diffraction pattern incident on the image plane. A phase-matched array
will have no phase errors, and all sources in the aperture will contribute to the intensity as
shown in Equation 2.39 with the total output power proportional to N 2 times the power
from one emitter in the aperture. The net phase factor of the array can be expressed as
sum of piston errors in Equation 2.53.
_-j eia*ij = 1/2 [ 1 + cos ( k_jsin0 + @°ij) ] (2.53)
In Equation 2.53, _j is the separation of array element [ij] and the reference path used to
compare the phase. The @0j term is the initial phase angle; however, this can be
incorporated into the piston error for the [i,j] emitter by changing its value of d_j
accordingly.
A difference in phase from beams at (i, j) and (i, j+l) is a piston error between
the two. For N emitters in [i x j], the electric field at the image plane changes to E_j(q,_')
with a switch to polar coordinates. Letting the electric field amplitude from each source
in the aperture be A °, then
Eij (q) = Eli { E(aperture's diffraction pattern) • (beam phase)}
,(,R-o_,) J,(_'_-q) {1 +cos(kd o sin 0)} (2.54)Eij(q) = A_ Areaa,,_ e (-_--)
E

2O
Note that q/R = sin0 = 0, especially for long propagation distances R. This
assumption changes Equation 2.54 making all of the beam angles from the array very
small.
Y_E_j(0) = Area _e i_-°_t) Jl(katg) {1 + cos(kdoO)} (2.55)
I(O) = 1/2 {E'E}
o J, (ka O) {1+ cos(kdu O)}2 (2.56)= (1/2)(Area): Eij Aij _'_
For an on-axis, synthetic aperture phase-locked array, Equation 2.56 is a pattern
with a large peak central diffraction lobe. An array of phased sources along a line path
creates an Airy disk pattern, however an actual aperture has a much more complex
intensity distribution with side lobes and a central peak. The 1/211 + cos (kd0)] 2 phase
term in Equation 2.56 modulates the constructive interference in the central lobe of the
pattern, including the lobe diameter and percentage of incident power in the lobe. The
value of this term will change between 1 and 0 with changes in d and 0. If every other
source in an array is out of phase by r_ radians when comparing adjacent array sources,
complete destructive interference would cause the central lobe to have close to zero
power difference as compared to surrounding points in the image plane. This image
plane would look dimly illuminated with uniformly incoherent light, typical of an out of
phase array.
Phase differences cause power losses even if only a few of the sources are out of
phase. This can be shown with a simple model array demonstrating the power collection
at an image plane as a function of the phase errors in the beams from an array aperture of

21
sources. An array whose sources are either in phase, or rd4 out of phase can be modeled
for total incident power to futher demonstrate the importance of phase locked operation.
In doing so, the diffraction pattern at the image plane is left out of the calculation since
the power distribution is not needed for finding the destructive interference caused by
phase errors. The model is for an array numbered from [1,1] to [i,j].
2.2.3 Output power for an array with n/4 phase error
E = YZ A0ij [1 + coskd_ sin 0_] (2.57)i j
I= ½[Areaaperture]2Z [A_][1 + cos(A(_i))]
i,j
(2.58)
la$=O _$=_ }Area: / _ A_(1 + cosAd_)+ _ A_(1 + cosA_b) (2.59)2 t '.J _'J
Ia_=, _ I_[_(4)+ _(I +-_-_)1]
I,,,_ph_e I_ [/j'(4)]
(2.60)
Ia__,_ _ _(6.914213) (2.61)
I,,_pa,,.,e 0(4)
Equation 2.61 is a ratio for the out of phase to in-phase collected power. Table 2.1 shows
how the ratio can change for various phase differences, demonstrating how the total
output is affected by destructive interference.

PhaseError (A_) Imax
rc/2 0.625
_/4 0.864
rt/5 0.909
r_/10 0.976
22
Table 2.1 Collectable Power Loss with Phase Shift
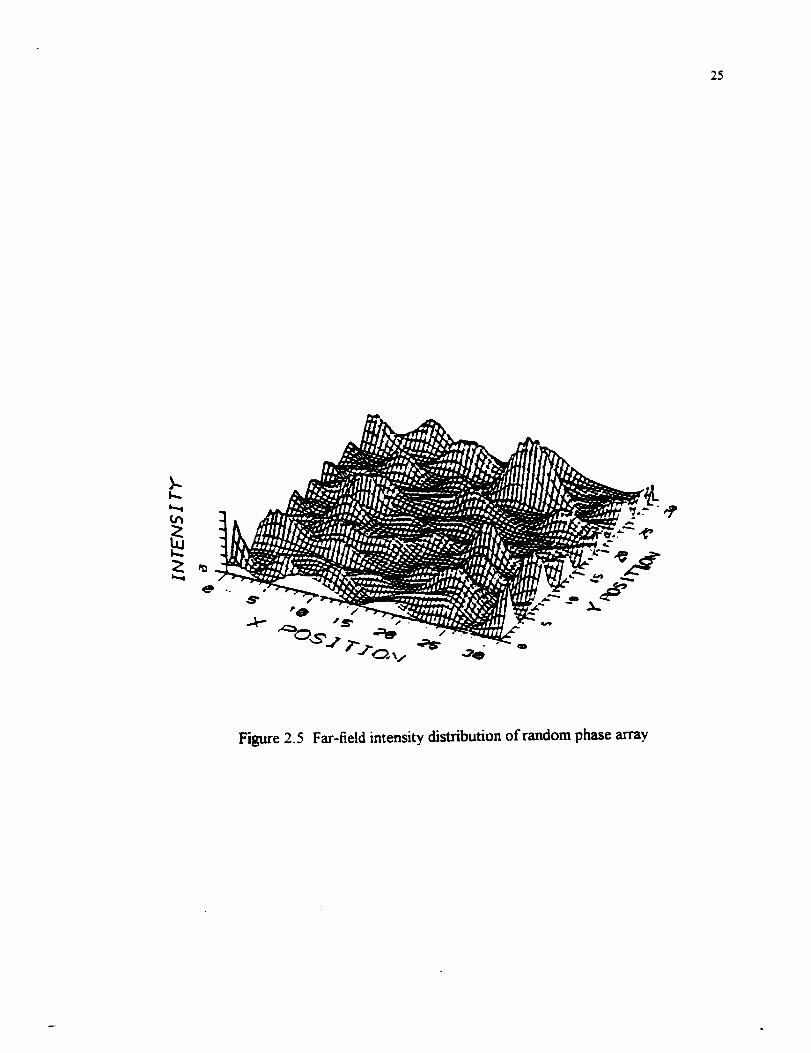
Williams' (Williams, 1992) computer simulation of a phased array shows the far-
field central lobe diffraction pattern for a synthetic aperture array propagating a distance
comparable to a satellite orbit distance (104 kin). The central lobe intensity patterns are
modeled for an in phase and a random phase array. The random phased army has a
central peak intensity and lobe diameter which are much worse for efficient power
transmission than for the in phase model. The intensity distributions from this model
clearly shows that an in phase array has a narrow central peak. Results are shown as
Figures 2.3, 2.4, and 2.5. The change of peak power and lobe size with the array's phase
change verifies the necessity of adaptive optics in a power beaming architechture.

23
Figure 2.3 Mathematical model of Phased array aperture

24
Figure 2.4 Far-field intensity distribution of in phase array
25
Figure 2,5 Far-field intensity distribution of random phase array
26
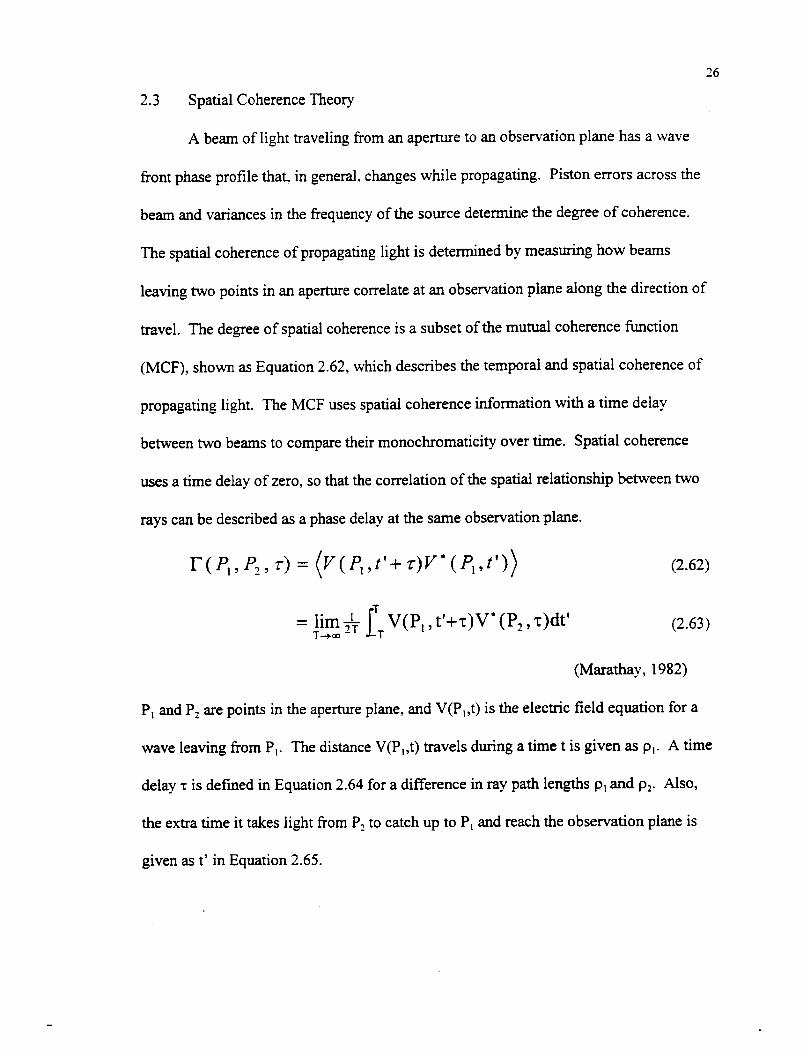
2.3 Spatial Coherence Theory
A beam of light traveling from an aperture to an observation plane has a wave
front phase profile that, in general, changes while propagating. Piston errors across the
beam and variances in the frequency of the source determine the degree of coherence.
The spatial coherence of propagating light is determined by measuring how beams
leaving two points in an aperture correlate at an observation plane along the direction of
travel. The degree of spatial coherence is a subset oft_he mutual coherence function
(MCF), shown as Equation 2.62, which describes the temporal and spatial coherence of
propagating light. The MCF uses spatial coherence information with a time delay
between two beams to compare their monochromaticity over time. Spatial coherence
uses a time delay of zero, so that the correlation of the spatial relationship between two
rays can be described as a phase delay at the same observation plane.
r(P,, P2, r) = (v(P,,t'+ r)v'(Pl,t') ) (2.62)
;= lim_ V(P,, t'+z)V" (P2, z)dt' (2.63)T--*_ - T
(Marathay, 1982)
Pt and P2 are points in the aperture plane, and V(P_,t) is the electric field equation for a
wave leaving from P_. The distance V(P_,t) travels during a time t is given as P_- A time
delay x is defined in Equation 2.64 for a difference in ray path lengths p_ and 92. Also,
the extra time it takes light from P, to catch up to P_ and reach the observation plane is
given as t' in Equation 2.65.

/92 --Plx = c (2.64)
/92m
t'=t- c (2.65)
27
The spatial coherence function, also called the mutual optical intensiw (MOI)
function describes the phase across a beam of light. A correlation function is created for
two rays, Pl and 9_, which travel to the same observation plane from different initial
points in a source aperture, A. The MOI function can be used with the Young's double
slit experiment to describe the spatial coherence of two beams leaving from the same
source aperture. If waves from the aperture are not in phase, they are spatially incoherent.
(Marathay, 1982)
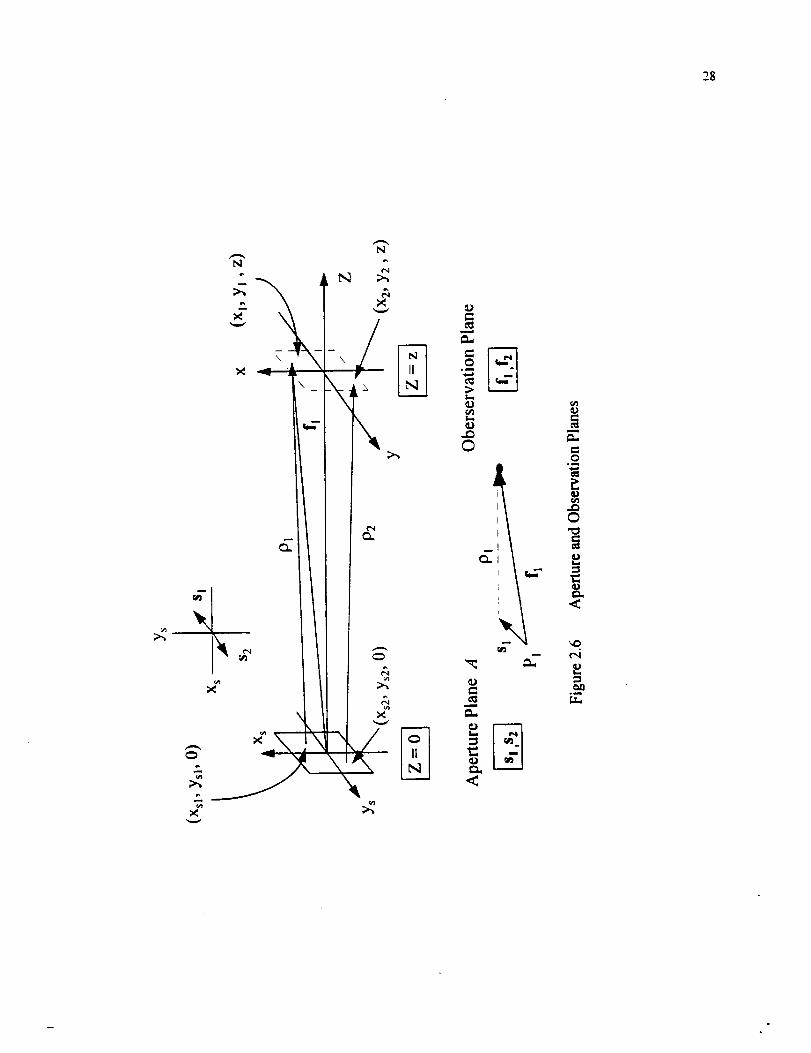
2.3.1 Young's Double Slit Experiment
In the coordinate planes for describing the spatial coherence of an illuminated
double slit system, f_ and f, have components (x_,yl) and (x,_,y:) in an observation plane at
Z = z,. s_, s2 are aperture variable coordinates for points Pt and P__in the source aperture
A. In this case, the two points lie in two slits separated by a distance d. The aperture is
located at Z=0. This system is shown in Figure 2.6. The planes are assumed to be
perpendicular and the direction of propagation from one plane to the other is along a
perpendicular to the aperture plane. Also, the light is assumed to be linearly polarized
and propagates as a plane wave. These assumptions can be used for a quasi-
monochromatic source, (for use in a temporally coherent field Av << v) which closely
resembles real laser sources.
_g
I
I
C2_
el)
©
°@Su
0
©
8,1
<
°_

29
Z
q- pFigure 2.7 Young's Double Slit System
Maxima and minima of the interference pattern from the two slits in Figure 2.7 will be
determined by Equation 2.66.
d sir_0 = m_. (2.66)
m = order of the maxima
X = wavelength of the illuminating source.
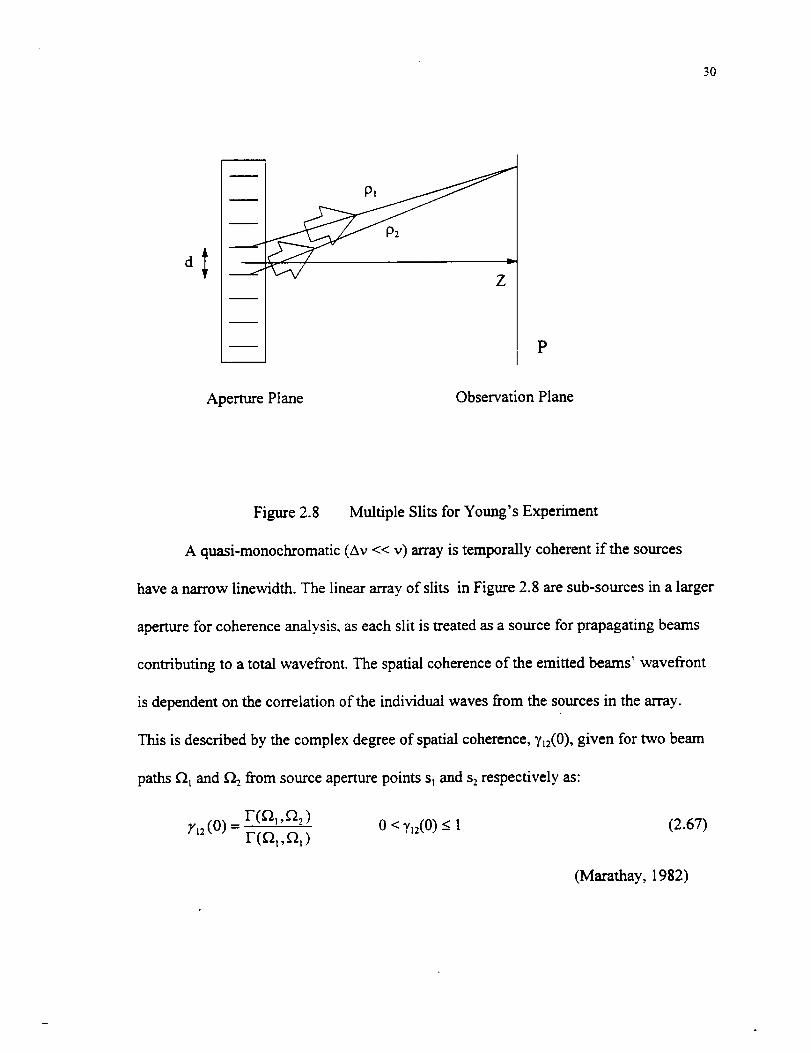
2.3.2 Spatial coherence of an array of slits
d2Using a far-field image plane where the propagation distance z >> -t", the
diffraction angle 0 determines the position of the localized maxima from the center of the
slits' separation d. The slits resemble two separate sources in an aperture plane, emitting
rays of equal intensity and wavelength. The difference between two waves propagating
from these slits is characterized by a difference in path length and phase depending on ray
direction and distance traveled. The Young's double slit system can be expanded to
incorporate multiple slits that are equally illuminated, resembling a linear array of
SOurCeS.
30
d
P,
Z
P
Aperture Plane Observation Plane
Figure 2.8 Multiple Slits for Young's Experiment
A quasi-monochromatic (Av << v) array is temporally coherent if the sources
have a narrow linewidth. The linear array of slits in Figure 2.8 are sub-sources in a larger
aperture for coherence analysis, as each slit is treated as a source for prapagating beams
contributing to a total wavefront. The spatial coherence of the emitted beams' wavefront
is dependent on the correlation of the individual waves from the sources in the array.
This is described by the complex degree of spatial coherence, 7_2(0), given for two beam
paths f2t and _2 from source aperture points s_ and s2 respectively as:
Yn (0) = F(_ ,_2 ) 0 < 7n(0) <- 1 (2.67)F(f_t,_l )
(Marathay, 1982)

31
£2_ and £22 are two propagation paths from the source apertures to the observation plane,
with zero time delay (-c = 0). F(f2_, f'21 ) is the self spatial coherence function for the ray
path _. The spatial coherence of these two waves is a comparison of their symmetry.
after traveling to the same plane P. The correlation of the waves at the observation plane
is normalized to create the complex measure of spatial coherence, yt2(0).
This describes how closely a wave leaving the aperture from sl resembles a wave
leaving s2 after propagating to the same plane. The normalization is done with the self
coherence function F(f21, f2_,0), which compares the wave to itself with zero time delay.
A spatially coherent beam from a synthetic aperture array of illuminated slits will have
Y_2(0) = 1 across the entire beam. With this set of conditions, any two initial aperture
points will be spatially coherent at the observation plane.
2.3.3 Van Cittert - Zemike Theorem
Measuring the coherence at an observation plane locates the positions where
phase differences from the source aperture are from piston errors, and to what extent the
phase differences make the beam incoherent. Using the Van Cittert - Zernike theorem
(Marathay, 1982), the spatial coherence can be described as the two-dimensional spatial
Fourier transform of the optical intensity, distribution from the source aperture A:
e ik(r,-r'- ) [.[ -i2n x'2xs+y'2ys1-'(01,02,0) = j jr(s, s,O)e dxsdys (2.68)
_Z-A
(Marathay, 1982)
F(s,s,0) describes the optical intensity function at the aperture, A, for the vector

32
coordinate s. The separation between planes is z, and the propagation distances t"1and f:
(see Figure 2.6) are from the center of the aperture to positions (x_,y0, and (x2,y:) in the
observation plane. The propagation paths are p_ and P2- Coordinates for s in A are (xs,Ys),
and L is the mean wavelength of the quasi-monochromatic source.
Spatial coherence for multiple sources in a synthetic aperture can be optimized if
the OPD of the traveling waves can be corrected for phase errors in propagation. To
demonstrate and example of how spatial coherence andphase can be measured, let an
aperture of N sources have a complex degree of spatial coherence given by _,s.s._(0) for
any two sources in the aperture. This would give the complex degree of spatial coherence
for source 1 and 2 y_.2(0), and )'3.4(0) for sources 3 and 4. This can represent all of the
spatial coherences of the sources through all the elements in an array in a summation :
_-_ 7 q._q.,, (0) "- _ 0<=--N (2.69)q=!
For this equation, - is the determinate of the spatial coherence of the synthetic
aperture. If =_ is equal to the number of sources in the aperture, then the beam is coherent.
If =- is less than the total number of sources, phase corrections must be made to some
contributing beams in the aperture. For each yq(0) ¢ 1, the qth beam can be corrected so
that yq(0) =1 for all sources in the array. A phase profile of the synthetic aperture's beam
can be calculated using this method, with =- values for each wave in the beam
characterizing its contribution to the degree of spatial coherence for each source.
N

33
2.4 Fiber Theory
Fiber optic wave guides axe commonly used to direct light from one location to
another, transporting a signal inside the fiber instead of propagating through air. Fibers
can eliminate the need for directional optics as it guides the light, and they can perform
some operations not possible with conventional free-space propagation. The path of light
through a fiber can be described with ray optics using a plane wave of the form Ae i(kr'°0 .
This assumes that r is along the direction of propagation, and k is the wave number for
light. A is the amplitude of the wavefront.
Knowing Snell's law of refraction for the boundary of two different media with
indices of refraction nl and n2, interaction at the fiber interface is given as:
n_sin01 = n2sin02 (2.70)
01 = incident angle in index n_
02 -- refracted angle in index n2
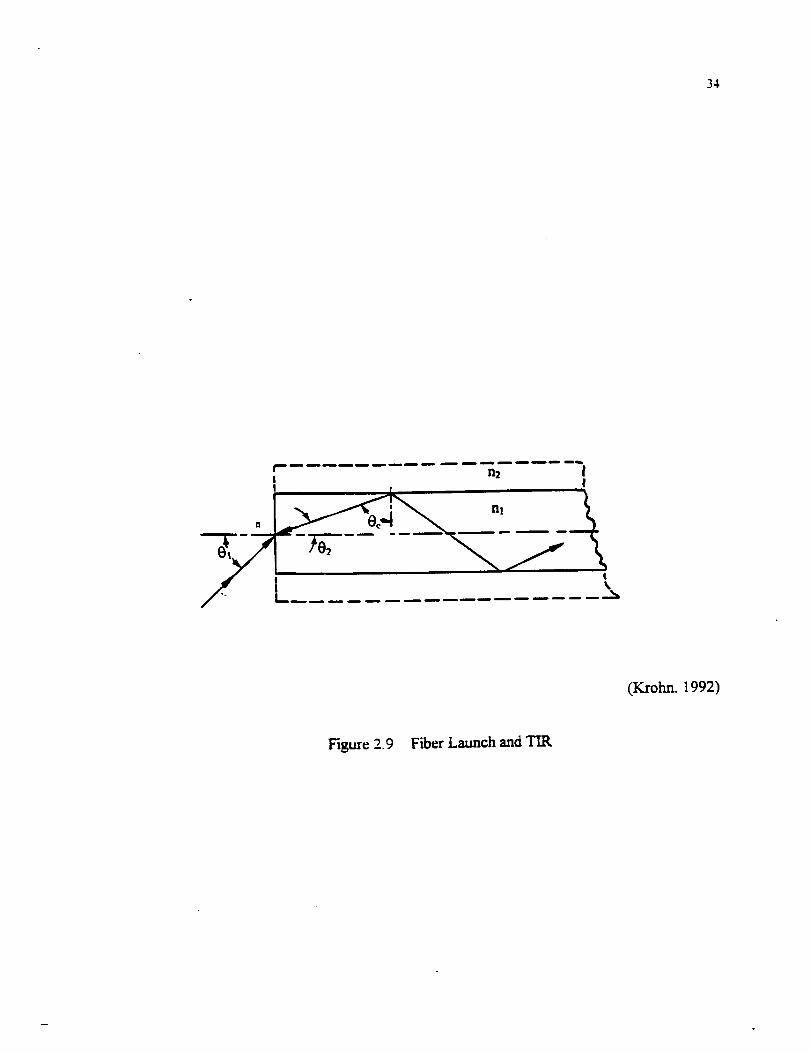
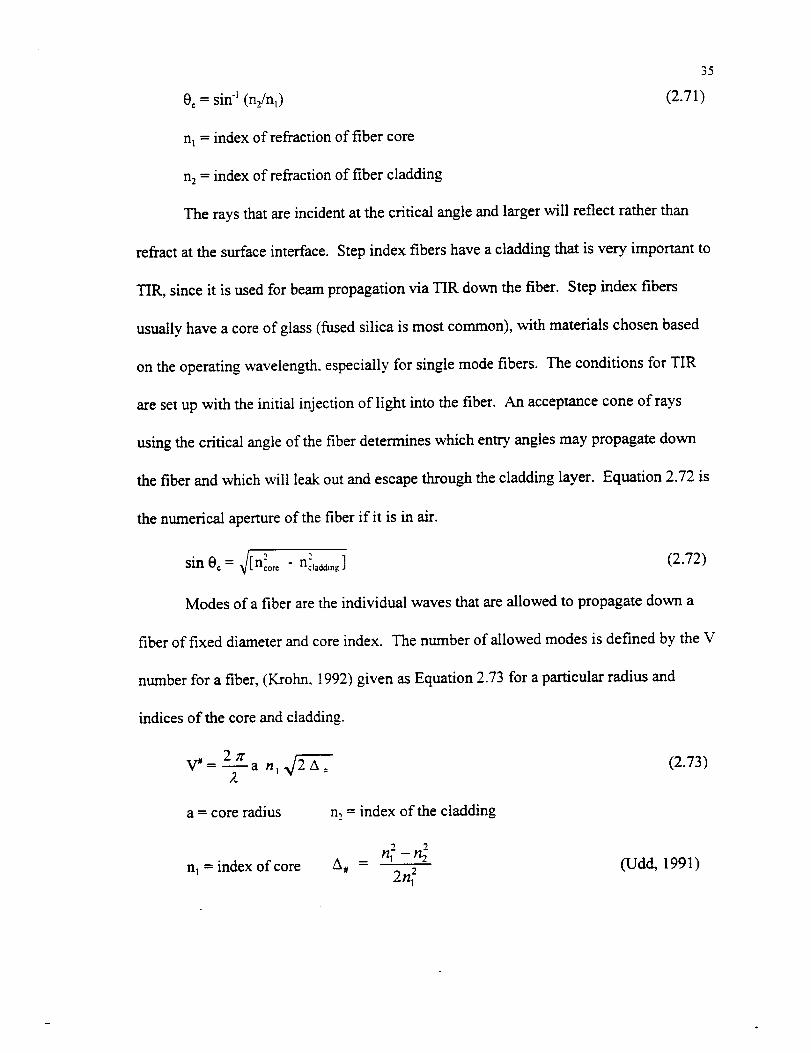
For a ray of light incident on an optical fiber with angle 01, it will continue into
the second index at a refracted angle determined by Snell's law. This is shown in figure
2.9 for a step index fiber. Once inside the fiber, the ray will obey Snell's law and a
condition called Total Internal Reflection (TIR) to continue moving along the length of
the fiber. The cladding surrounds the core of the fiber, consisting of a third media of
refractive index less than the fiber core, creating a condition where the light will reflect
off of the interface if the angle of incidence is beyond the critical angle. This critical
angle, 0c is given by:
34
(Krohn. 1992)
Figure 2.9 Fiber Launch and TIR
35
(2.71)
indicesof thecoreandcladding.
V_ 2= --a nl _f2zX2 "
a = core radius n_ = index of the cladding
2
nl = index of core A# - n_ - n 22n,
(Udd, 1991)
(2.73)
0c = sin "I (nJn,)
n I = index of refraction of fiber core
n2 = index of refraction of fiber cladding
The rays that are incident at the critical angle and larger will reflect rather than
refract at the surface interface. Step index fibers have a cladding that is very important to
TIR, since it is used for beam propagation via TIR down the fiber. Step index fibers
usually have a core of glass (fused silica is most common), with materials chosen based
on the operating wavelength, especially for single mode fibers. The conditions for TIR
are set up with the initial injection of light into the fiber. An acceptance cone of rays
using the critical angle of the fiber determines which entry angles may propagate down
the fiber and which will leak out and escape through the cladding layer. Equation 2.72 is
the numerical aperture of the fiber if it is in air.
sin 0c = _/[n_ore - n_,add,._] (2.72)
Modes of a fiber are the individual waves that are allowed to propagate down a
fiber of fixed diameter and core index. The number of allowed modes is defined by the V
number for a fiber, (Krohn. 1992) given as Equation 2.73 for a particular radius and

36
Singlemodestepindexfiberhasa smallercorediameterthanmulti-modefibers.
with singlemodefibersallowingonly onemodeor propagatingwave,to traveldownthe
lengthof the fiber. The incident angle on a single mode fiber is very, exact, with
alignment of such a fiber needing very accurate positioning for maximum throughput of
light. Multi-mode fiber will usually have a V_ number much greater than 2.5, with the
single mode cutoff below about 2.4. Other fiber types have a change in the index of the
fiber core with radius. Gradient index fiber has a tapering index with radius, allowing a
lower number of modes and less spreading of pulses in a propagating wave train.
For polarization sensitive systems, polarization maintaining (PM) fiber can be
used to maintain linearly polarized light during propagation down the fiber.
Manufacturing processes that alter standard circular core are used creme PM fiber.
Elliptical core fibers or stressors placed in the fiber creates birefringence to propagate
linearly polarized light. Various PM fiber structures are shown in Figure 2.10.
2.5 Fiber interferometers and sensors
Fiber optic interferometers are often used as sensing devices, as the optical phase
of the light passing through the fiber can be modulated by stresses and other physical
affects. The phase change is detected interferometrically by comparing the signal path to
a reference path. The output intensity is modulated by a change in phase (An) seen as a
piston error of the signal arm fiber path with respect to the reference arm fiber path.
Fiber sensors are very sensitive, with detectable displacement values as low as 10"_3
meters. (Krohn, 1992) There is also very low light loss in fibers, since the beam

37
•Figure 2.10 Polarization Maintaining Fiber Structures
(Fiber Optic Trends, 1988)

38
attenuation is low for carefully chosen optical sources. Stretching or squeezing the fiber
will change the length of the fiber or some other characteristic of the core that affects the
optical signal.
Fibers may also be stretched to maintain a specific OPD. The most common form
of fiber stretchers are piezo electric devices that expand or contract when an electric
current passes through them. They are often made of lead-zirconate-titanate (PZT).
(Udd, 1991; Kingsley, 1978) Piezo electric phase modulators stretch fiber to change their
length and OPD. PZT-5A can be made into rings or wafers and are the most common
forms of fiber optic phase modulators. Sending a signal voltage across the PZT material
changes its size, thus mechanically stretching fiber that is wrapped around it. These
phase modulators are usually operated at some modulation frequency. PZT devices have
acoustic resonances which are very important to frequency response. They are very
sensitive to input voltage when operated on resonance. PZT based modulators will have
more expansion on resonance, and can expand non-linearly. Resonant frequencies are
determined by device geometr?', piezo electric material type and mode of operation. (Udd.
1991; Kingsley, 1978) Bending and stretching the fiber induces a birefringence in the
stressed region, changing the polarization properties of the fiber. This is often why PM
fiber is used in systems that use a piezo electric phase modulator.
Stretching the fiber creates a change in OPD that is seen as a phase shift when
compared to a reference path. This is usually observed with interferometry. Stretching
optical fiber creates two types of phase delay, integral and differential. The integral phase
delay is caused by light traveling through added path length, AL, and is measured using

39
anexternalreferencepath. Integraldelayis muchgreaterthanthedifferentialphase
delay. Thedifferential phasedelayis causedby anindexchangein thecore, An, andthe
birefringencein thefiber. (Martini, 1987) Winding fiberarounda cylindrical phase
modulator,like a PZTring, causesstressinducedbirefringenteffectsfrom the bending
process.(Kingslake,1978;Yoshinoet al., 1982). Equation2.74showshow phase
changesfor a fiber of length L stretched by an amount AL.
_(AI,) = k [L 2m +nAL]
k = wave number
n = core index of refraction
L = length of stretched fiber
(2.74)
An = photo-elastic effect induced index change
AL = change in fiber length
(Yoshino et al., 1982; Bergh 1983; Krohn 1992)
Stretching the fiber will change the length, AL, and the refractive index, An, from
a photo-elastic effect. The difference in path length between the arms in a two path fiber
interferometer needs to be less than the coherence length of the laser source. If this is
violated, the interference fringes will not have good visibility, since wavefronts from
different wave trains will not interfere well. (Born and Wolf, 1975) Fiber
interferometers are set up as single beam (Fabry-Perot, Sagnac ring) or two beam
(Twyman Green, Mach-Zehnder) systems. Heterodyne systems use electronics and an
acousto-optic cell to change the operating frequency for sensing and detection, while
homodyne systems are very polarization sensitive and often require PM fiber, especially
to avoid birefringence caused by mechanically stretching the fiber. (Yoshino et al., 1982)
Sample fiber interferometers are shown in Figures 2.11 - 2.13.

40
-' - --/-IParbaJ transm_ttmcJm,rrors
DeUICtor
Figure 2. I I F_er Fabry - Perot Interferometer
(Krohn, 1992)
3 d8 coul)ler
Figure 2.12 Fiber Sagnac Imerferometer
(K.rohn. 1992)
Senm9 tsOer
3 d8 ¢oumef Oelm::or
i_ Tran_r _, Siqulpmmssor
3 da CouDler Re_l'_l_ |i[_=f
Figure 2.13 F_er Mach - Zehnder Interferomcter
(K.rohn, 1992)

41
Sensor detection can decrease the intensity output due to destructive interference.
If the phase difference Ad_ is an odd multiple of r_, then there will be an interference
minimum, resulting in a dark fringe or minimum output intensity.
Modulation from maximum to minimum intensity is defined again by Equation 2.75. The
change in output intensity of a fiber interferometer is shown in Figure 2.15, which
demonstrates the dependence of (1 + cos[Ad_]) (Krohn, 1992) as given in Equation 2.75.
I_,_l - I_i,_ (1 + cos A(h) (2.75)2
L9 Ib
ALReference fiber
Sensing fiber
Figure 2.14 Sensing Fiber Interferometer and OPD
Both fiber arms have the same core index n, and operating wavelength _..
From Figure 2.14 the reference and sensor phases are given by:
qk = -- nL Reference Phase2
_b + A_ - 2rCn(L+zkL)2
Sensor phase
(Krohn, 1992)
(2.76)
(2.77)

42
100%
Intensity
Note:
o I0 vrl2 _r 3rl2 2=r
Relativephaseshift (radians)
Sensitivityis a function o1the slopeof the intensityversusrelativephase shiftcurve
(Krohn, 1992)
Fisure 2.15 Phase shift and intensity in a fiber interferometer

43
The photo-elastic change of the index in the fiber, An L, is incorporated into the
AL term. It is used in Equation 2.79 for A_ using the photo-elastic tensor values,
Poisson's ratio, and the modulus of expansion for the core material. Tensor constants for
optical materials characterize how the refractive index will change as a function of fiber
stretch AL. (Yoshino, 1982; Martini, 1987; Udd, 1991) The change in refractive index
from photo-elastic effects, An is given by:
n 3 AL
T {(p,,+p,=)v, -P'=} T
P_, P_2 = Photo-elastic tensor constants for the fiber core material
vp = Poisson's Ratio
n = index of refraction of the fiber core (Yoshino, 1982)
Inserting Equation 2.78 for An into the basic phase shift expression in Equation 2.74
gives Equation 2.79 as the phase change for a fiber length change of AL.
n"knAL I+ {p,, +Pt2}VpA_
2
(2.78)
(2.79)
Stretching a fiber can be used to correct for phase differences as long as a reference path
is available to compare path length and piston error. OPD modulation using a piezo
electric fiber stretcher is one solution to phase mismatches in propagating beams since the
stretch correct this.
CHAPTER III
EXPERIMENT
3.1 Experiment Introduction
The initial experimental work presented here began by reviewing the previous
system used by NASA researchers. Analysis of its shortcomings pointed out a need for a
new fiber-stretching device. After locating an appropriate piezo electric fiber stretching
actuator, part one of the experiment began. This involved testing the piezo electric
actuator with a fiber optic interferometer. The fiber stretcher is the key device in the
system, and was characterized with a Mach-Zehnder interferometer and a He-Ne laser
operating at _.=632.8 nm. Part two of the experiment substituted the He-Ne laser with a
Ti:Sapphire laser tuned to lock in the optical power amplifier, supplied by Phillips Labs
at Kirtland Air Force Base. This interferometer system used different fiber and optics for
the near IR source wavelength.
The experiment is relatively simple in theory. The path length of one arm of the
fiber interferometer is changed by stretching it with a piezo electric actuator. The
interference pattern creates fringes that will move when the fiber is stretched. Stretching
the fiber creates a change in path length that is seen as a phase shift in the fringe pattern.
44

45
Phase modulation is calculated according to the fringes' movement and the drive signal to
the fiber stretcher. The semiconductor optical amplifier boosts output power of the light
coming through the stretched fiber arm while the phase is being changed.
3.2 Injection Locking Semiconductor Optical Amplifiers
The optical amplifier used in the experiment was an AIGaAs multiple quantum
well device on loan from PL/LIDA division at Phillips Labs at Kirtland Air Force Base.
It was the 10 emitter Techmo Demo design, two of which were sent to Marshall Space
Flight Center for this work. A single mode Panda PM fiber couples into the amplifier
that has ten channels operating at 860 nm when locked. One channel is used on the
amplifier in the experiment so that the locked-in power amplification can be seen easier.
The amplifier has a ridge waveguide y-branch to split the injected light into the ten
channels. The light is guided through a phase modulator region on the chip, which is
biased slightly to make it transparent. The light travels through the amplifier, which
emits spontaneously from the excited region unless locked by the injected signal. The
electrical ground for the device is the mounting heat sink, which had a lead running to the
current source common ground line.
The device's temperature was controlled with a water cooled mounting block
machined at NASA Marshall Space Flight Center Optics and RF division machine shop.
The temperatures of the amplifier and block were measured with a thermocouple system
and a Fluke multimeter. The sensitivity of the thermocouple monitored amplifier

46
Fiber Coupled Input
Figure 3.1 Injection Locking Semiconductor Optical Amplifier (KA)
(Burke, 1996 submitted to Optics and Photonics News)

47
temperatureswith + 0.1°C error. The temperature of the amplifier was kept at or below
60°F (15.5 °C) at full power as directed by the Phillips Laboratory's specifications.
Temperature measurements were made from the thermocouple control box. The
amplifier was also operated below 15.5°C in order to observe efficiency changes in the
semiconductor device, since they tend to operate better when cooled. Figure 3.1 is a
diagram of the amplifier with the injection fiber and power leads. (Burke et al., 1996) The
amplifier is very similar to semiconductor diode lasers, except anti-reflection coatings
replace a laser's mirrored end faces. Since it is a diode device, current limited sources
were used to control output power.
Semiconductor optical amplifiers have been used for coherent coupling (Yariv
and Usry, 1986), linear repeater systems (Yamamoto, 1980), receiver preamplifiers
(Simon et al, 1983), and optical detectors (Ikeda, 1985). They have a large power output,
and injection locking to a master oscillator generates a single mode operation. (Andrews,
1986) Injection locking an amplifier to another laser creates a pair of lasers which use the
same optical frequency and longitudinal mode, allowing coherent coupling through phase
modulation.
The output mode of an injection locked amplifier (ILA) is the same as the injected
signal, with all other modes suppressed inside the active region of the device. (Kobayashi
and Kimura, 1981) Data from Phillips Labs tests of the Techmo device in 1984
demonstrated amplification of the injected signal up to 30 dB in certain channels. These
amplifiers preserve both the phase and mode of the injected beam, allowing a master
oscillator and power amplifier (MOPA) system to be implemented for a high power

48
sourcewith anarrayof ILAs. (Kwonet al, 1992) Couplingtheoutputfrom two ILAs is a
matterof correctingthephasedifferenceof thetwo beams.This couldthenbeexpanded
to usemultiple sourcesin severalarrays.Thishasbeendemonstratedin interferometfic
systems,with couplingefficienciesupto 97%for a two amplifierexperiment.(Schuster
andAndrews,1992)
Table3.1 InjectionLockingOpticalAmplifier PowerRequirements
DeviceNumber446-78ATechmoDemodesign
Amplifier Component
Amplifier Current
Y Branch Current
Modulator Current
(transparency threshold)
Operating Current
1.5 amperes
500 milliamps
16-20 milliamps

Table3.2
ChannelData
InjectionLockedPower(mw)Un-locked
Power
(mw)Injected
Signal Power
(row)
49
Amplifier Power Characteristics
1 2 3 4 5 6 7 8 9 10
103.9 114.1 96.42 109.0 96.45 118.8 89.12 126.0 122.7 122.8
73.73 73.63 53.61 71.32 25.16 68.53 25.73 57.11 70.37 94.53
1.51 2.32 2.31 2.36 2.07 2.22 1.68 3.01 2.52 9.97
Operating wavelength: 860 nm
Amplifier Temperature: 10 °- 16 ° C
Courtesy of Phillips Labs PL/LIDA at Kirtland AFB, Albuquerque, New Mexico

50
3.3 FiberBasedMachZehnderinterferometersystem
Two lasersourceswereusedin theexperiment.A Spectra-Physics30mW 632.8
nm He-Nelaserwasusedto measurefiber stretchasafunction of drive sig_nal.The
visible sourcemeasurementsmadealignment,fiber launch,andtroubleshootingeasier.
After thesystemopticswerechangedto useanearinfraredsource,anSDL 5422diode
laserwasused,howeverits rangein wavelengthwastunableonly +5 nm from its mean
wavelength of 835 nm. This diode laser was replaced with a tunable Ti:Sapphire laser to
better match the operating wavelength of the injection-locking amplifier. A Coherent
Innova 300 Argon laser pumped 6 watts at 488 nm wavelength into a Coherent 899
Ti:Sapphire laser. This tunable system emits wavelengths from 790 nm to 920 nm, and
was set to 860 nm after calibration with a spectrometer. The Ti:Sapphire laser produced
200 mW at 860 nm, which was decreased with Melles Griot neutral density filters so that
the imaging CCD camera and the amplifier were not saturated.
The entire system was bolted onto a Modern Optics air-suspended optical table to
minimize environmental vibrations. Non-polarizing beamsplitters for visible and near
infrared wavelengths were from Newport Research Company and OptoSigma. All
mirrors were from Newport. as were the stages and 20x microscope objectives used for
launching and retrieving light from the fiber. Melles-Griot 20x beam expanders enlarged
the beam size after the light was retrieved from the fiber. A JVC CCD camera with a
Fujinon TV lens imaged the interference pattern on a Sony color monitor. Amplified
power was measured with a Newport silicon photo-diode, with the output displayed on a
Tektronix oscilloscope. The reference arm of the interferometer was three meters of 3M
singlemodefiber for 633nmfor theHe-Netestsystem,andthreemetersof 3M single
mode830 nmfiber for thefinal system.Otheroptics,shims,beamdumpsandmounts
werefrom theNASA MarshallSpaceFlight CenterOpticsandRF division Quantum
OpticsLab.
51
3.4 Piezo-Electricfiber stretcher
The fiber stretcher used in the experiments was a piezo electric actuator which
used two PZT wafers that expand when a voltage is sent across them. The manufacturer
and model used was the Canadian Instrumentation and Research Limited (CIR) 915 Fiber
Stretcher. This device came standard with 25 wraps of Panda PM fiber wrapped on it.
The experiment needed more sensitive expansion and OPD modulation, therefore
customized models were made for both the He-Ne visible and Ti:Sapphire near IR
sources. Each actuator had five wraps of Andrew Corp elliptical core single mode PM
fiber epoxied to the piezo wafers, with the rest of the 3 meters of fiber loosely coiled
around the stretcher. (Burke, Optics and Photonics News 1996 submission) A servo
board mounted directly on top of the plastic casing drove the piezo wafers. The actuator
operated with a +15 volt DC power supply and a +5 volt DC drive signal to control the
piezo wafer voltage.
The entire device was in a plastic mount, with the fiber wrapped around an oval
loop in the center. Fiber optic actuators are used as phase modulators for gyroscopes
(Udd, 1991; Kingsley, 1974; Krohn, 1992) telescope arrays (Weaver,1988), and passive
sensor systems like hydrophones (Lagakos, 1982; Kinsgley 1974; Stowe, 1982).

Table3.1
Component
30 mW He-Ne Laser
5422 150 mW diode laser
Collimating aspheric optic
Nonpolarizing beam splitters
List of System Components
Manufacturer
Spectra-Physics
SDL Inc.
G-eltech
Newport, OptoSigma
52
Fiber optic stages and objectives
Polarization maintaining fiber
Single mode fiber
Innova Argon laser
899 Ti:Sapphire ring laser
Fiber stretcher
CCD camera
"IV camera tens
Silicon detector
Double oscilloscope
Multimeter
Function generator
Closed-loop water chiller
IR viewer
25 volt triple power supply
Semiconductor optical amplifier
Newport
Andrew Corp.
3M
Coherent
Coherent
Canadian Insmmaentation and Research Ltd. - 915
JVC
Fujinon
Newport 818-BB-40
Tektronix TM504
Fluke model 46
Philips PM5133
Electrophysics Corp. IRV 7100
Power Designs TP 343B
McDonnell Douglas/Phillips Labs

53
Their ability to accuratelystretchfiber oververy smallrangesandalsoallow a large
dynamicrangemakesthemidealfor usein fiber interferometers.Theyareoftenusedto
keepafiber sensorat aspecificdetectionrange,wherethecontrastof light anddark
fringesis large. This is calledastateof quadrature,wheretheslopeof the input power
versustheoutputpoweris thegreatest.(Kingsley, 1974;Lagakos,1982;Udd,1991)
When asensoris in quadrature,it is themostsensitiveto environmentchanges.Phase
modulatorsareusedto keepthis quadraturepoint throughoutanythermaldrifting or
signalfading. Figure3.2 includesaphotoof theCIR 915fiber stretcherfrom the
manufacturer.(CIRLtd., 1995)
TheCIR 915 fiber stretcherusedaPowerDesignsTP 343B triple output DC
power supply for the servo board power and as an initial drive signal source. The drive
signal was changed to a Philips PM5133 function generator for applying modulation
frequencies to the fiber stretcher. A Tektronix TM 504 oscilloscope monitored the
frequency of the function generator signal, and the servo board power voltage.
Measurements of the fringe displacement as a function of drive frequency were taken for
a maximum +5 volts signal. Smaller drive signal amplitudes can be used for more
precise fiber stretch, however there is little response below 1 volt. The fiber was changed
for the Ti:Sapphire laser and the injection locking amplifier system. The actuator used
five wraps of single mode 830 nm PM fiber to replace the 632.8 nm fiber, and operated
with the same power and resonant frequencies of 1.45 kHz and 8 kHz.

Table 3.4 Fiber Stretcher Specifications
54
Piezo Electric Performance
Fiber Stretcher Components
Power Designs TP 343B Triple +15 volts DC servo board power
Output DC Power Source _+5volts DC drive signal
Tektronix TM 504 Monitor servo board power
Oscilloscope and drive signal
Philips PM 5133 Create modulated drive
Function Generator signals from 0-10 kHz

55
3.5 Experimental Procedure
Initial work started with investigation of previous attempts toward phase
modulation. Earlier research at NASA Marshall Space Flight Center's Optics and RF
division developed the optimum array geometry for the amplifiers in a synthetic aperture.
This was followed by a mathematical model of this aperture output for a phase-locked
system of 1 and 2 tings of emitters. A sample of the work presented at a NASA
presentation is included in Appendix A. The final results did not include the effects of
random phases in the emitters, as shown in the Williams rectangular array model.
(Williams, 1992)
The previous research did not finalize the choice of a fiber stretching actuator.
Equipment from the SELENE program was borrowed to make a fiber stretcher, and a
large actuator was built using three piezo electric columns to expand a pair of aluminum
half-cylinders shown in Figure 3.2. (Montgomery, 1996) The clam-shell fiber stretcher
had problems stretching the fiber since the fiber was not attached to the actuator, and
there was only one wrap of fiber around the actuator.(Montgomery, 1996) This most
likely led to the failure of the device. The earlier work concluded that it could not stretch
the fiber enough in previous architectures. The clamshell actuator had the potential to
stretch the fiber to create a change of 50 waves of OPD with only one turn of fiber and
maximum power to the piezo columns. The clamshell device's flaw was in not attaching
the fiber to the actuator to stretch it reliably and in controllable increments.

56
915 Piezo Modulatorand DriverCard
High Voltage
Power Supply Wrapped Fiber
"x
Light Out
Piezo Cylinders
Light in
Figure 3.2 CIR 915 fiber stretcher and clamshell cylinder (NASA model)

57
3.5.1 Fiber stretchertestprocedure
TheCIR model915canstretch5 wrapsof fiber to createatleast2-3wavesOPD
changeaccuratelyto afractionof awaveof pistonerrorusingthedriver card. This
devicewasinsertedintoa MachZehnderfiber interferometersystemto testtheOPD
changeusingaHe-Nelaser. In thefiber stretchertest system,non-polarizing
beamsplittersdividedthelaserbeaminto thetwo armsof the interferometerusingvertical
linearlypolarizedlight for maximumfringe contrastandvisibility of the interference
pattern. In eacharm,the light passedthroughthebeamsplitterandinto thefiber
launchingstage,wherea 20xmicroscopeobjectivefocusedthebeaminto thefiber. A
retrievalstageusedanother20xmicroscopeobjectiveto collimatetheemittedlight from
thefiber, anda beamexpanderallowedfor betterviewing andalignmentof the interfered
beams.A secondnon-polarizingbeamsplittercombinedthebeamsfrom thetwo pathsto
createaninterferencepattern.Thesensingarmhadthefiber stretcherandits lengthof
fiber, singlemodeelliptical corePM fiber from AndrewCorp. Thecontrol armhad3M
standardsinglemodefiber for 633nm. Eachfiber armwas3.0+ 0.01 meters long. The
interfered beams were viewed with the CCD camera and monitor for fringe pattern
location and alignment.
The actuator was tested for linear fiber stretch as a function of the drive signal,
stretch accuracy, and total fiber stretch. This series of signal tests preceded insertion of
the injection locking optical amplifier (ILA) and Ti:Sapphire laser. A sample data run of
the fiber stretcher began with realignment of the interfering beams at the combining
beamsplitter for maximum fringe contrast, aligning the fiber launchers for maximum light
58
throughput,andpositioningthedetectorin the interferencepattem.Next, thefunction
generatorwasconnectedandsetto thedesireddrive signal,andtheoscilloscope
displayedfrequencyandamplitude.Thedetectorchannelwasconnectedandthe
oscilloscopewassetto showbothsignalssimultaneously.The silicon photodiode was
used to measure the movement of the light and dark fringes across a stationary point. The
piezo test system is shown in Figure 3.3 with the CCD camera and monitor used for
alignment and initial pattern viewing. (Burke, 1996)
Several saw-tooth drive signals were used to test the fiber stretcher: a DC signal
of 0-5 volts, modulated signals at 200 Hz, 1 kHz, 1.6 kHz, 4kHz, 8 kHz, and 10 kHz.
Piezo wafer expansion per volt is the same for visible (_=633 nm) and near IR (_.=
835nm, 860 nm) sources, therefore no problems exist when switching sources and fibers.
The PZT wafers' expansion was not a function of the type of fiber used, but of the
amplitude and frequency of the drive signal. The OPD change was a function of the core
index, wavelength and fiber stretch.
3.5.2 Diode laser system
The actuator tests showed that it worked as expected, even exceeding NASA's
required 1 kHz bandwidth. (Montgomery, 1996) The resonant frequencies were located
and avoided so that the phase modulation would be linear with driver amplitude. The
He-Ne source was replaced by a Spectra Diode Labs 5422 diode laser, a 150 mW source
at 835 nm. The laser driver was an SDL 800 with a maximum output current of 1 Amp.
Since the laser beam had a large divergence angle, and the saggital and tangential rays
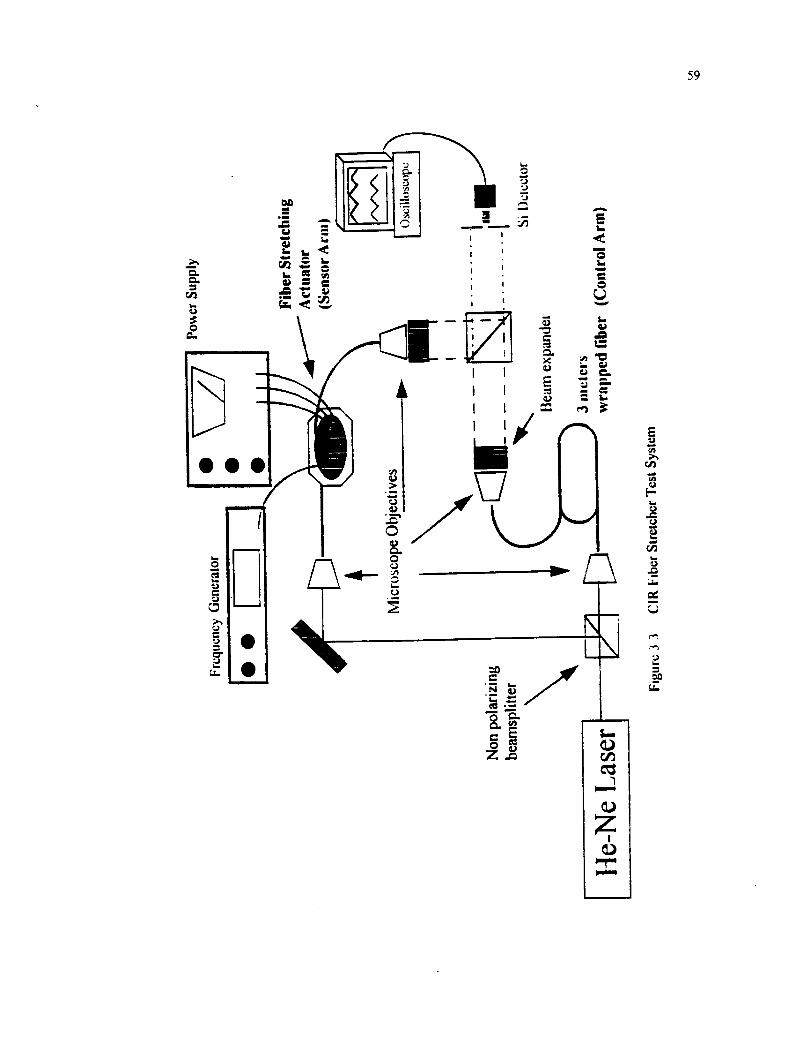
59
OO0
II
I I
I I
I I
I I
A
S-
OI..
I II i
I L
E
w
O
¢I_
=_ I-
E
,x_
P.
Ct_

60
had different divergence angles, an aspheric optic was used to collimate the laser beam. A
Thorlabs optic created a beam 2 mm in diameter at 100 mW output power with minimal
divergence. The control arm's fiber was changed to 840 nm wavelength compatible fiber,
and the fiber stretcher with 840 nm Andrew Corp fiber was inserted as the sensor arm.
Linear polarizers were placed in front of the launching stages, and the axis of polarization
was aligned to the sensor arm's PM fiber core to maximize the throughput. The system
optics were changed for near IR wavelengths, replacing the visual wavelength optics.
The beam from the sensor arm was focused into the fiber pigtail of the amplifier with a
20x microscope objective fiber launching stage, and the output from the biased
transparent channel of the ILA was collected by the silicon photodiode.
3.5.3 Ti : Sapphire laser test system
The 860 nm optimum wavelength of the amplifier was too far away in wavelength
from the 835 nm diode to observe gain from the injected signal using the diode laser as
the master oscillator. When this laser could not be tuned to lock the amplifier, it was
replaced by a tunable Coherent 899 Ti: Sapphire laser with an Argon ion pump laser.
This would serve as a test MOPA system with the amplifier. The final system with the
Ti: Sapphire laser is shown as Figure 3.4. (Burke, 1996)
The phase modulators on the amplifiers were biased with 16-20 mA to keep them
from absorbing the injected signal. The optimal operating temperature of the device was
15.5 °C as given by Phillips Laboratories. The operation conditions for the amplifier are
listed in Table 3.1. The amplifier's mounting block was used as a ground and heat sink,
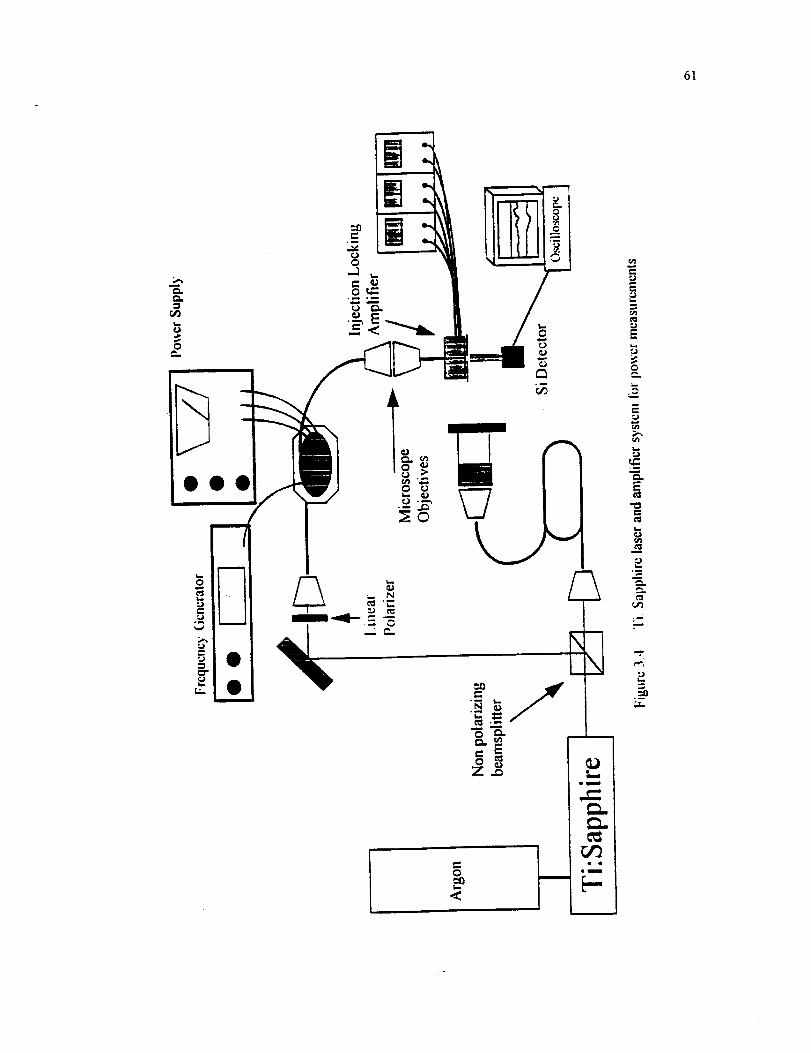
61
o
OO0
l°0 _
©
¢-O
u_
I
I
om !
m !
q
q
e,,,,
E
E
62
and was cooled by a closed loop variable temperature water chiller. The coolant water
was set to 10 °C to keep the amplifier and block at 15.5 °C when at full power, and was
monitored by a thermocouple mounted underneath the amplifier device. Temperature
tuning with this sort of device is primitive and coarse, so the coolant water was set at a
constant temperature, and tuning for the amplifier was accomplished by changing the
laser wavelength. The Ti: sapphire laser was the master oscillator in the MOPA.
The Ti: Sapphire laser was initially tuned to 860 nm. After 15-20 minutes the
amplifier's temperature stabilized to 15.5 °C, during which the dominant output from the
amplifier was spontaneous emission. The amplifier temperature was kept constant, so
that the operating wavelength would not shift with environmental fluctuations. The
laser's wavelength was adjusted with a micrometer on the Ti: Sapphire laser head to lock
in the amplifier. Once the laser was tuned to the lock in wavelength, the amplifier's
output power jumped from the spontaneous emission level on the oscilloscope. The
amplifier's output power was detected by a silicon photodiode placed in front of the
transparent amplifier channel. The output of the channels was blocked with a slit
aperture on the exit face aligned to pass only the transparent biased channel.
After the amplifier was locked, the fiber stretcher's power was set to +12 volts
DC, and the drive signal was connected to the actuator driver card from the function
generator. The piezo wafer's expansion stretched the fiber and changed the OPD of the
sensor arm in the interferometer, changing its phase with respect to the control arm. The
amplifier and laser operating wavelength varied slightly from trial to trial, but remained
near 860 nm +5 nm. Once the amplifier was locked and the laser wavelength recorded,
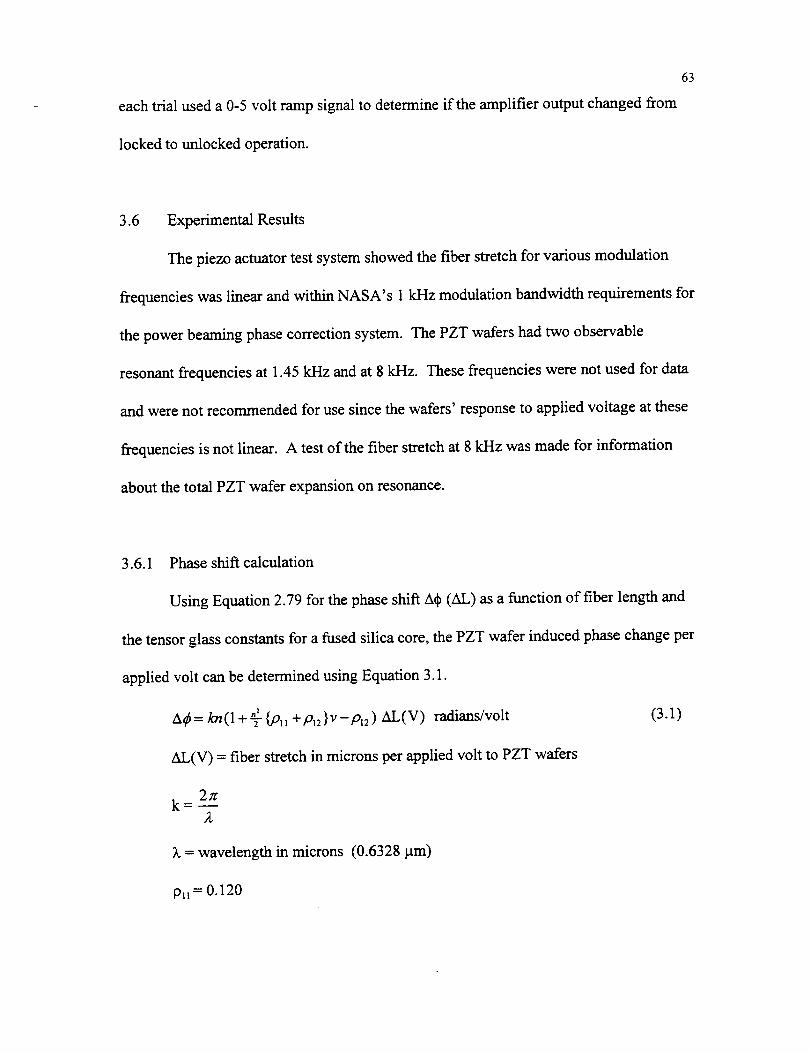
eachtrial useda0-5volt rampsignalto determineif theamplifieroutputchangedfrom
lockedto unlockedoperation.
63
3.6 ExperimentalResults
Thepiezoactuator test system showed the fiber stretch for various modulation
frequencies was linear and within NASA's 1 kHz modulation bandwidth requirements for
the power beaming phase correction system. The PZT wafers had two observable
resonant frequencies at 1.45 kHz and at 8 kHz. These frequencies were not used for data
and were not recommended for use since the wafers' response to applied voltage at these
frequencies is not linear. A test of the fiber stretch at 8 kHz was made for information
about the total PZT wafer expansion on resonance.
3.6.1 Phase shift calculation
Using Equation 2.79 for the phase shift Adp (AL) as a function of fiber length and
the tensor glass constants for a fused silica core, the PZT wafer induced phase change per
applied volt can be determined using Equation 3.1.
n 2
A_b = kn(1 + T {,°11 +P12 }v -Pl2 ) AL(V) radians/volt (3.1)
AL(V) = fiber stretch in microns per applied volt to PZT wafers
2rek-
2
_. = wavelength in microns (0.6328 _tm)
Plt= 0.120

P12= 0.270
v=0.17
n = 1.4616for ;L= 0.6328 p.m
64
Andrew Corp fiber
(Yoshino et al, 1982)
Equation 3.1 can be changed into an expression for fringe shift per micron of fiber stretch
if the wavelength of the He-Ne laser is inserted in microns and the phase shift is given in
number of fringes.
3.6.2 Mach- Zehnder interferometer phase shift
A Mach Zehnder interferometer is a single pass interferometer, as each fringe pair
is a full wave of piston error, or 2n radians. Equation 3.3 calculates fringe shift for any
fiber length change AL. The piston error created by changing the fiber length by AL
induces a phase shift given as Equation 3.4. The expansion of the PZT wafers and the
fiber stretch is a function of signal to the wafers. Equations 3.2 - 3.4 are for 5 wraps of
Andrew Corp PM fiber. A more universal equation for phase shift is given as Equation
3.5. This equation can be used to calculate phase shift for any actuator as a function of
the PZT wafer expansion per volt per wrap of fiber.
Fringe Shift- 1 1.4616{ 1+ 1'6_6------2-_(-0.20353)} AL(V) (3.2)0.6328/an
Fringe Shift = 1.8076 AL fringes/volt
A_ = 2rr(1.8076) AL radians/volt
= 11.357 AL radians/volt
(Yoshino et al., 1982)
(PZT response at 1 kHz) (3.3)
(3.4)

Ad_ = 2.272 AL radians/volt, fiber turn
65
(3.5)
3.6.3 Experiment Calculations
The experimental data was used to calculated the fiber stretch per volt for various
modulation frequencies using Equation 3.3. Since the PZT wafers' expansion was linear
to voltage, but frequency dependent, the modulation frequency was just as important as
the signal voltage for the system calculations. The calculated PZT wafer expansion from
the interferometer data is plotted against the modulation frequency of the drive signal in
Figure 3.5. The graph would be flat if the PZT wafers had perfect expansion independent
of drive frequency. The calculated phase shift with a 0-5 volt DC signal to the fiber
stretcher is plotted as Figure 3.6. The calculated phase shift with a 5 volt amplitude and
various modulation frequencies is graphed in Figure 3.7. These results are for the
stretcher test system using 5 wraps of PM fiber for He-Ne lasers. The PM fiber core
refractive index is 1.4616 for X= 632.8 nm, and 1.457 for X= 840 nm. Figures 3.8 - 3.13
are oscilloscope traces of the piezo test system's detector signal shown with the
modulated drive signal displayed. Some of the figures have been enhanced for easier
viewing. Figure 3.14 is the graphed data of the number of fringes that moved across the
detector for various modulation frequencies.
3.6.4 Near IR system changes
An actual power beaming system would use a source with a wavelength close to
830 nm for optimum atmospheric transmission and ease of semiconductor manufacturing.
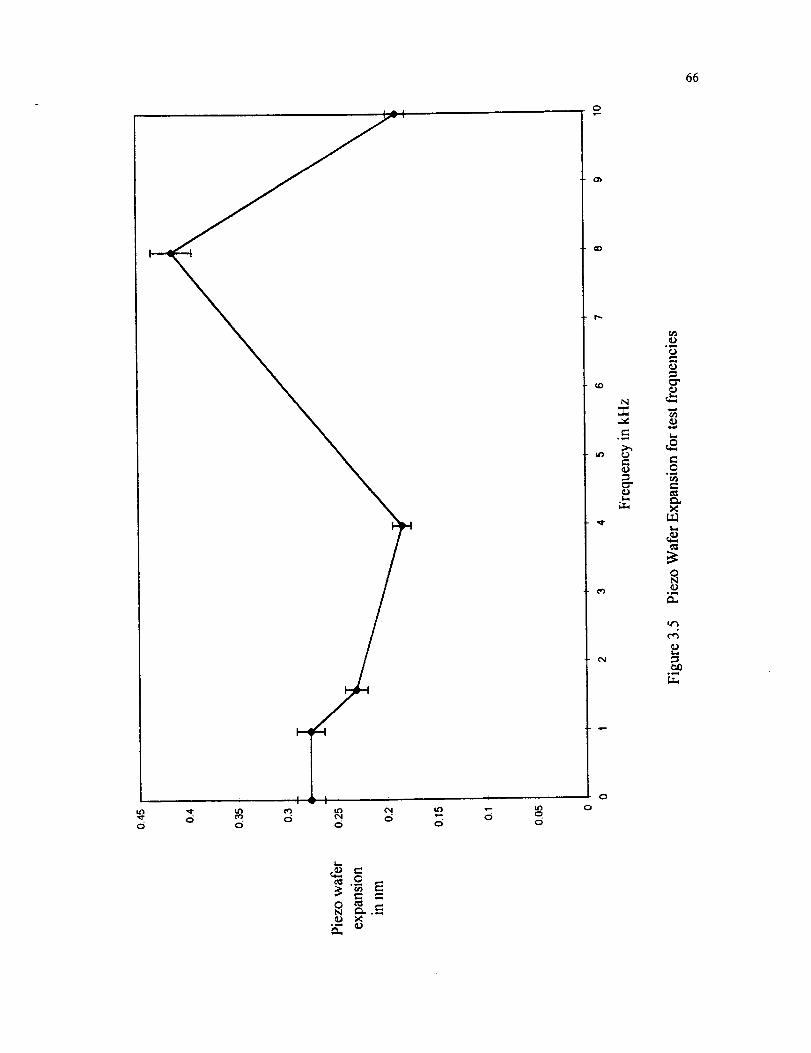
J
_ o Q.c_ o
o
_o
r_
Q
r_o
_r
L_
o
66
c_
Q
X
oN
o_i_
L.
N° _.._
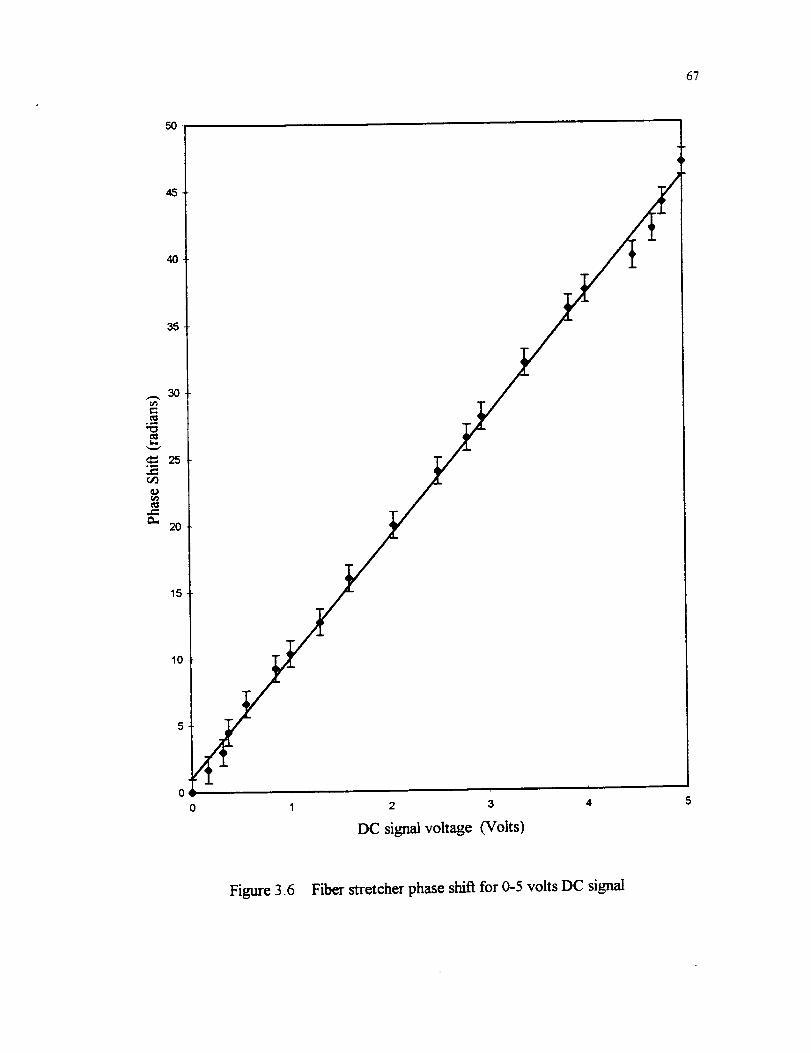
67
5O
4O
15
10
2 3
DC signal voltage (Volts)
Figure 3.6 Fiber stretcher phase shift for 0-5 volts DC signal

68
Io
0.3
_D
q)
O
¢o "_
._=
to _ Etm
[a.,
0 0• .., _.
°_
0
o
t_
. ,,...q

69
Fi_.tre 3.8 Oscilloscope trace for stretcher - tkI-Iz at 2 volts amplitude
Fi_are 3.9 Oscilloscope trace for stretcher - I0 kI-Iz at 5 volts amplitude
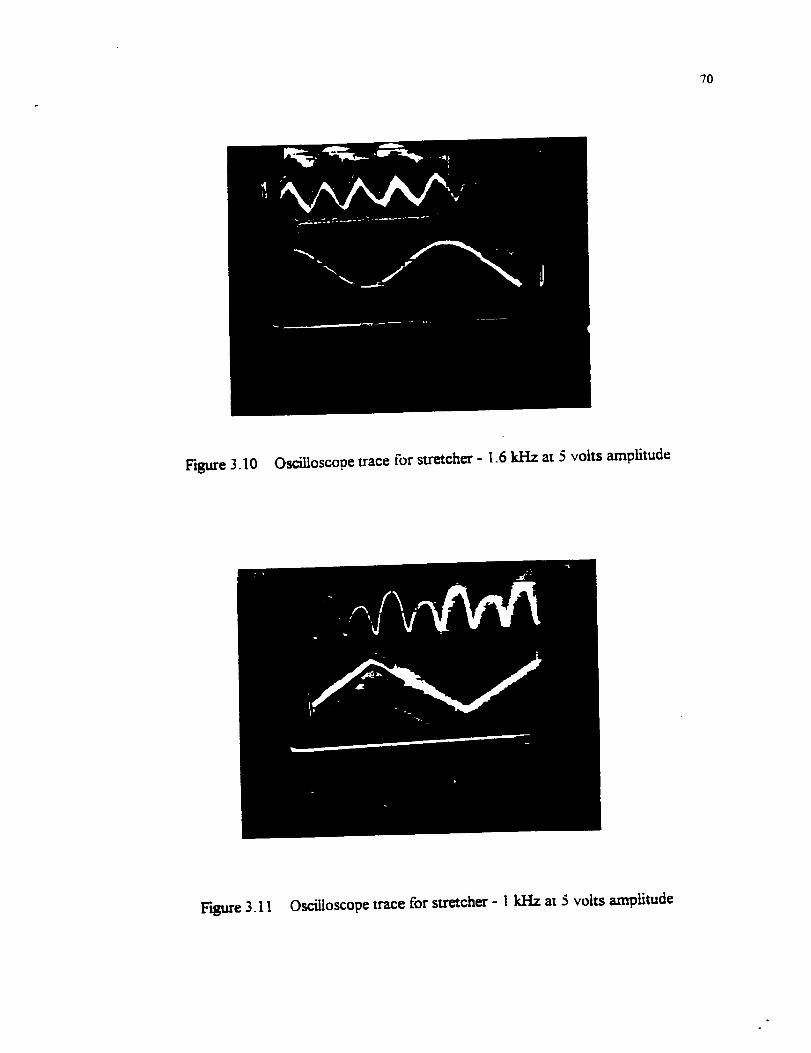
7O
H_a'e 3.10 Oscilloscope trace for stretcher - 1.6 kHz at 5 volts amplitude
Hgur¢ 3.11 Oscilloscope trace for stretcher - 1 kI-Iz at 5 volts amplitude
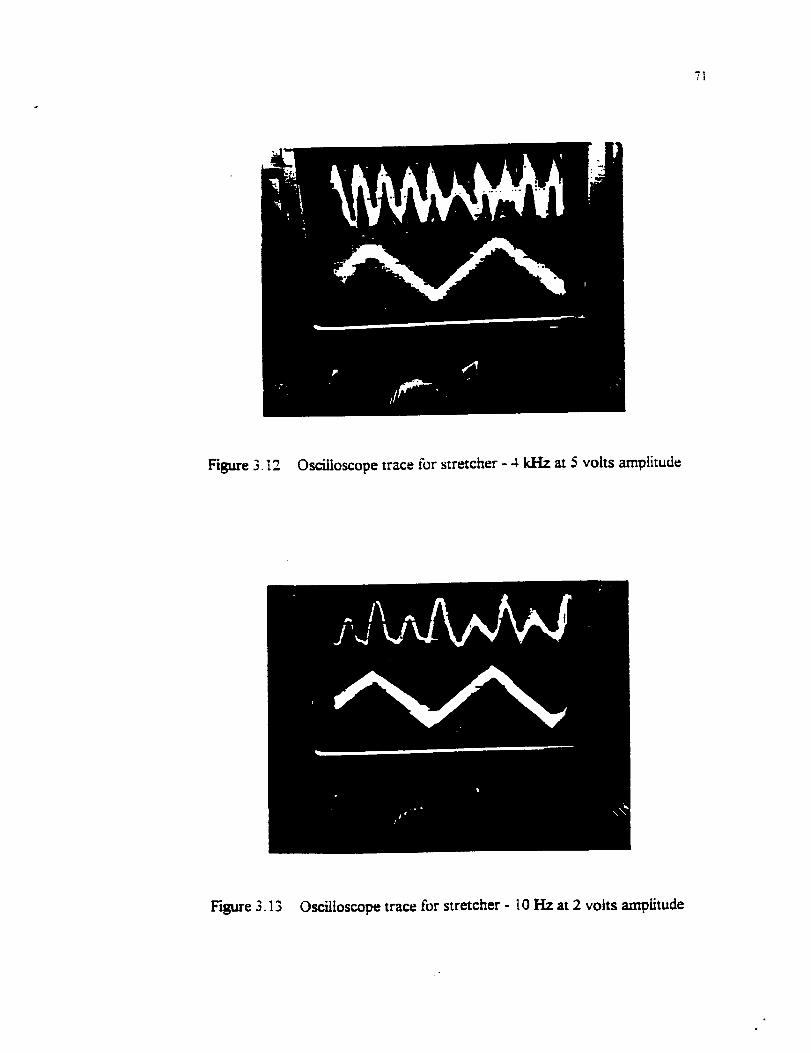
71
Figure 3.12 Oscilloscope trace for stretcher - 4 kI=Iz at 5 volts amplitude
Figure 3.1.3 Oscilloscope trace for stretcher - l 0 I=Iz at 2 volts amplitude

72
Io'J
i i
q.=.
Q
01
_D
L.
>
°_
_3
.=_. "_
L_ r_
o
o
_N
i-

73
The adaptive optic system for this wavelength would have a different response than the
He-Ne system using the same fiber stretcher since the fiber and laser would be changed.
Equations 3.6-3.9 use Equation 3.2 and the index for PM fiber for _,=840 nm and a
_,=0.83 lam source for phase shift.
different fibers or lasers.
Performance of the PZT wafers will not change for
Fringe Shift =
Fringe Shift- 1 1.457 {1+ -T-'4s72(-0.20353)} AL(V) (3.6)0.83/ml
1.376 AL fringes/volt
Ad_= 8.647 AL radians/volt
Ad_= 1.729 AL radians/volt, fiber turn
(3.7)
(3.8)
(3.9)
3.6.5 Amplifier output power
The output power increase for the optical amplifier was measured with the silicon
detector and oscilloscope. The spontaneous, unlocked output of the amplifier channel
was 53 mW at 1.5 A amplifier current and 200 mA y-branch current. This power came
from channel number 3 on the amplifier. This channel was used since it operated the best
of all the channels. Other channels were tested, but their output was more difficult to
observe since they emitted more unlocked power. Most channels emitted around 70 mw
when unlocked.
After tuning the laser wavelength to lock the amplifier, the output from the
amplifier channel increased on the oscilloscope. The amplitude was 20 mV per division
for the detector signal. Equation 3.10 converts the oscilloscope readings to incident

74
powerusingspecificationsfrom the50Ohmresistancesiliconphotodiode.Theincident
poweris givenas•
V=IR
I= V/R
Ohm's Law
Amps = Volts / Ohm
Responsivity = 0.6 Amps / Watt @ 860 nm = I / P_.°iden,
I Watts (V) = Pino en,0.6 Amp
Detector impedance = 50 Ohms = R
1 Watts / Volt} {Voscilloscope } (3.10)
The oscilloscope measured 53 mW of spontaneous emission from channel 3 with
1.59 volts. The reading increased 60 mV when locked in, increasing the optical power by
2 mW. This was significantly lower than expected. This value should have been higher
given the data in Table 3.2 for this amplifier. The power increase was tested with all
channels, and the amplified power was the same or worse. It was impossible to see a
power increase in the channels that had very high unlocked output power. The fiber
stretcher's modulation frequencies used to test the amplifier lock were 200 Hz and 1 kHz.
The locked in amplifier did not change output power while the fiber was
stretched. The performance of the amplifier was generally poor with or without a drive
signal. The fiber stretcher's ability to modulate the phase of a laser beam was observed
with the Mach- Zehnder system. The amplifier locked in the injection signal while the
phase was changing in the sensor arm of the interferometer, but was not affected. The
fiber stretcher changed the OPD at least 2 waves (4n radians) during injection lock as

75
well. Interferograms of the fiber stretcher test system are shown in Figures 3.15-3.20.
The figures are grabbed images of a moving fringe pattern, caused by changing the phase
with the fiber stretcher. The images move too fast to see anything but a blur; however,
when they are stopped, as they are in the figures, a good interference pattern remains
intact. They are still shots of moving fringes, and some were enhanced for easier fringe
viewing.

76
Figure3.15 Fiberstretchertestinterferencepattern - 0 Hz
Figure 3.16 Fiber stretcher test interference pattern - 20 Hz

77
Figure3.17 Fiberstretchertest interference pattern with extra shear
Figure 3.18 Fiber stretcher test interference pattern with tilt

78
Figure 3.19 Fiber stretcher test interference pattern - IkHz
Figure 3.20 Fiber stretcher test imerference pattern - 200 Hz

CHAPTER IV
DISCUSSION
4.1 System Considerations for Laser Power Beaming
Laser power beaming can provide an option for space propulsion and vehicle
onboard power, supplying laser power to future vehicles or current orbiting space
vehicles. As of now, no efficient, reliable, cost-effective system exists to provide this
laser power. Phased array power beaming may provide this power need with a synthetic
aperture source. Individual sources in the array provide laser power on the order of watts,
but a coherent sum of many sources can emit the on the order of kilowatts of laser power.
A system to couple arrays of sources in a synthetic aperture would make a reliable and
efficient laser source possible.
Coupling the power from arrays in a synthetic aperture onto a.target requires a
coherent beam of light. All sources must emit the same narrow linewidth for temporal
coherence. Spatial coherence of a laser beam is dependent on the source aperture and
phase of emitted beams from that aperture. Correcting phase differences in a beam with a
very narrow linewidth can produce coherent propagating light. The correction process for
a beam from an array must align the phase angles of all emitted rays in order to launch a
coherent light beam onto a far field target. A master oscillator and power amplifier
79

systemwith aphasecorrectionsystemcouldmeetthetemporalandspatialcoherence
requirementsfor spacepowerbeaming.
80
4.2 FiberOpticPhaseModulation
Using fiberopticsanda CanadianInstrumentationandResearchLtd. model915
fiber stretcher,thephaseof onebeamwaschangedover4reusingOPDmodulation.The
inducedpistonerror changedthephaseof onebeamtravelingthroughthefiber stretcher
with respectto abeamthatjust wentthroughfiber. Thepistonerrorwascreatedby
changingtheOPD in one arm of a Mach-Zelmder fiber interferometer with the 915 fiber
stretcher. The other fiber arm was kept at a constant OPD, and served as a reference path
length. The fiber stretcher could create OPD changes of over four waves with modulation
frequencies from 0-10 kHz.
Fringe movement in the interference pattern indicated a phase shift caused by
fiber OPD change when the actuator stretched the fiber. Phase correction can be
monitored using a feedback system, performing corrections to the OPD using the fiber
stretcher with up to a 10 kHz frequency.
In order to phase match beam paths across an array, the out of phase beams need a
maximum n phase correction. This is a half-wave of induced piston error, which is easily
attained with the CIR 915 fiber stretcher. Once the phase of a beam is sampled and
corrected to a reference path in a feedback system, it can be amplified by an injection
locking semiconductor amplifier which boosts the output intensity. An array of optical
amplifiers with fiber coupled injection placed in a synthetic aperture geometry could

81
providecorrectable,steerable,coherentpower. Injection lockedamplifiersthat are
locked-into their sourcesignalpreservethephaseandmodeof the injectedbeam,and
canamplify the lockingbeamwhile thephaseis changing.Thesetestsandexperiements
demonstratedamplificationof a laserbeamfrom aninjectionlocking opticalamplifier
loanedby Phillips LaboratoriesPL/LIDA group. Theamplifiedemissionfrom the
amplifier wasobservedwhile thephasewaschangingin thesensorarmof the
interferometer.
Investigationof afiber opticphasemodulatorfor anarrayof diodelasershas
demonstratedthatafiber stretchingactuatorcancorrectphasedifferencesin anarrayof
sources.An arrayusingaMOPA systemwith fiber stretchersin thefibers leadingto the
injection lockingopticalamplifierscancreateahighpowercoherentbeam.Thephaseof
eachemittedbeamis correctable,andthesemiconductordevicesarereliableandefficient
for supplyinghighpowerovera longlifetime. An arrayof sourcesis not likely to have
total powershutdown,andsmallanglebeamsteeringis possibleusingphasingacrossthe
arrayinsteadof usinga steeringmirror. Theseadvantagesmakethe MOPA systemwith
fiber opticphasemodulatorsapossiblesolutionfor a laserpowerbeamingsource.

82
4.3 Recommendations
Furtherresearchwork would be beneficial in advancing the principles found from
the investigation and results of this work. Customized, single channel, one-pass, multiple
quantum well injection locking amplifiers need to be obtained to replicate an actual array
emitter. Knowing the true dimension, power characteristics, and cooling requirements is
crucial to effectively model the output from these devices. The Phillips Laboratory
model amplifier was suitable for technology demonstration, but not for actual system
characterization because of difficulty in locking in the amplifier and lower than expected
amplification results. The new amplifier should be manufactured to amplify a 835 nm
injected signal, since this is a very good wavelength for transmission through the
atmosphere. It is a good choice for conversion efficiency with satellite photo-voltaic
detectors, and ease of obtaining the master laser since 835 nm is a common diode laser
wavelength.
Sensing electronics to fit a system for sensor fiber interferometers, such as a
sampling Fabry-Perot interferometer, could incorporate feedback and correction to test
the modulation frequency of the fiber stretcher with phase detection and correction at the
target. This would also require fiber couplers and beamsplitter to be added into the
amplifier fibers. Collimating optics such as lenslet arrays or small diffractive optics
would provide high throughput and a collimated beam for test bench power
measurements and far-field beam steering capabilities with a phased array of two or more
amplifiers.
Feedback systems from the target could provide spot size and power distribution
information usable by a feedback and correction loop at the source aperture itself.
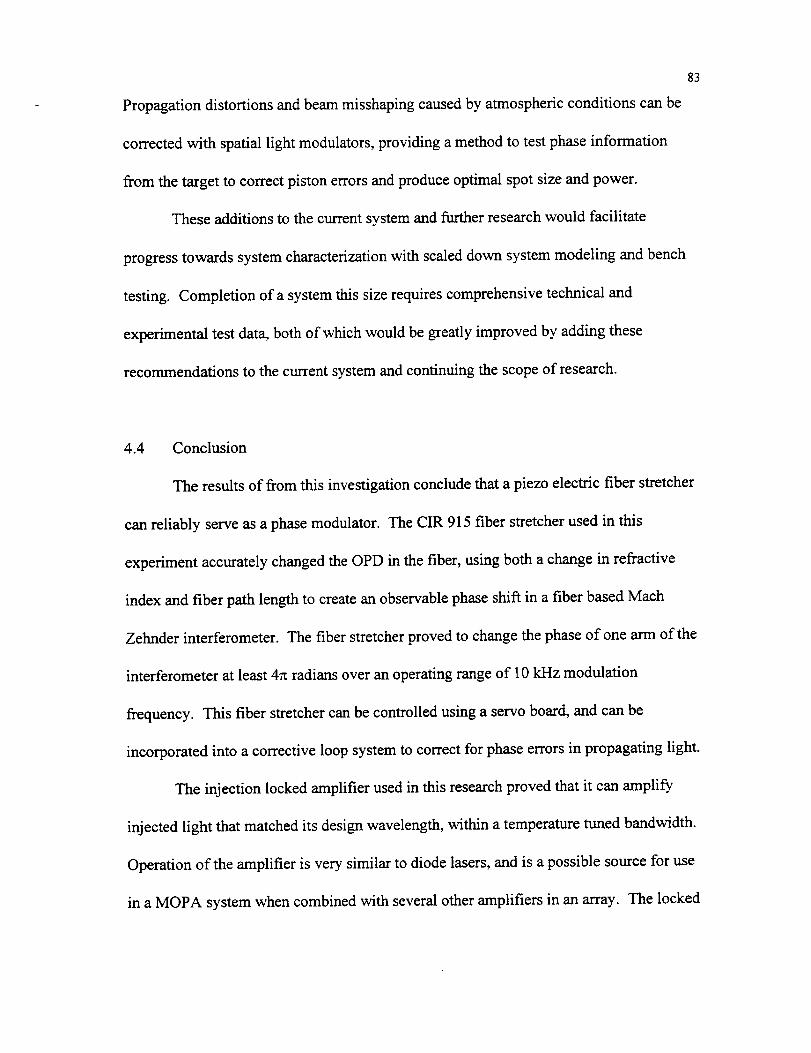
Propagationdistortionsandbeammisshapingcausedby atmosphericconditionscanbe
correctedwith spatiallight modulators,providingamethodto testphaseinformation
from thetarget to correctpistonerrorsandproduceoptimalspotsizeandpower.
Theseadditionsto thecurrentsystemandfurtherresearchwould facilitate
progresstowardssystemcharacterizationwith scaleddownsystemmodelingandbench
testing. Completionof asystemthis sizerequirescomprehensivetechnicaland
experimentaltestdata,bothof whichwouldbegreatlyimprovedby addingthese
recommendationsto thecurrentsystemandcontinuingthescopeof research.
83
4.4 Conclusion
Theresultsof from this investigationconcludethatapiezoelectricfiber stretcher
canreliably serveasa phasemodulator.TheCIR 915fiber stretcherusedin this
experimentaccuratelychangedtheOPD in thefiber, usingbotha changein refractive
indexandfiber pathlengthto createanobservablephaseshift in a fiberbasedMach
Zehnderinterferometer.Thefiber stretcherprovedto changethephaseof onearmof the
interferometerat least4ztradiansoveranoperatingrangeof 10kHz modulation
frequency.This fiber stretchercanbecontrolledusingaservoboard,andcanbe
incorporatedinto a correctiveloopsystemto correctfor phaseerrorsin propagatinglight.
The injectionlockedamplifierusedin thisresearchprovedthat it canamplify
injectedlight that matchedits designwavelength,within atemperaturetunedbandwidth.
Operation of the amplifier is very similar to diode lasers, and is a possible source for use
in a MOPA system when combined with several other amplifiers in an array. The locked

84
in operationof theamplifierwasnot affectedby thefiber stretcherchangingthephaseof
the injectedbeam,therefore,acombinationof thetwo couldbeusedto emit nearinfrared
light with a controllablephaseangle.
The fiber stretcherandinjectionlockingamplifierusedin seriesin this
experimenthasdemonstratedtheability to rapidlyandreliably changethe phaseof an
amplified outputbeam.Thecombinationof a largenumberof phasecontrolledbeams
couldbeconstructedasa phasedarrayof semiconductoramplifiersin orderto deliver
very intenselight to adetectortargetvery far away. Phaseerrorsin propagationcouldbe
correctedat thearraywith thefiber stretchersusingacorrectionandfeedbackloop.

APPENDIX A
NASA Presentation
K. Herren and K Bowman on the ring geometry for a phased array of sources.
"High Power Array of Phase Locked Laser Diodes"
George C. Marshall Space Flight Center
E.E. Montgomery (Principle Investigator)
K.A. Herren
C.W. Wilkerson
E. Vaughn
K. Bowman
85

86
J
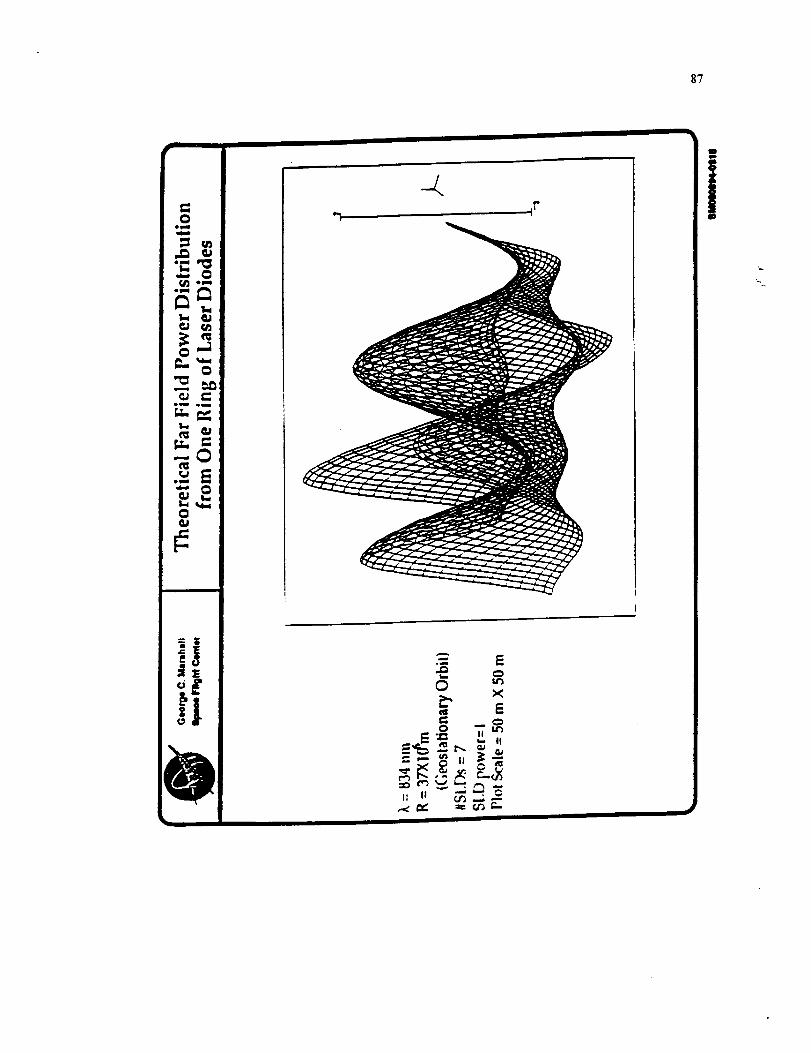
87
g
I
U_
II II ¢j_ ..; _v
,_'_ _r,_ _- _d
i4D
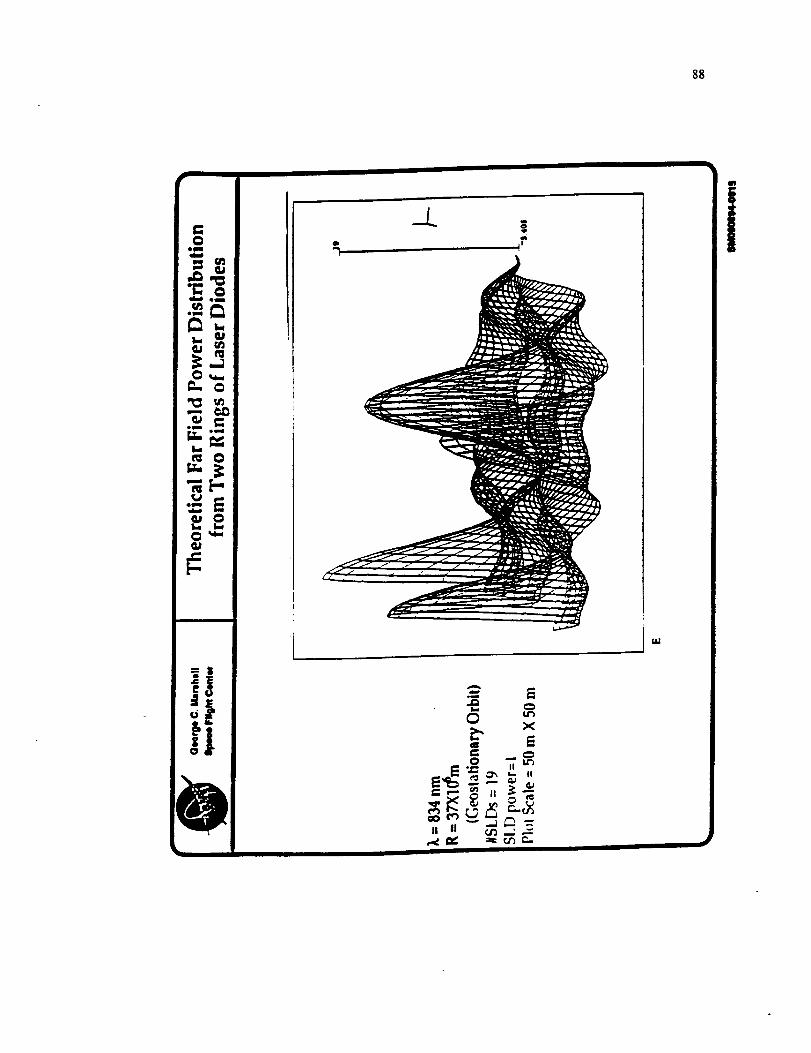
88
IN
em
I.I
_[-,
C:
l,r.t
o
04- __,..._ _u_I:: +p= _ +-- II
l_m:_l ,=,-_-,,, _..+ I

REFERENCES
Andrews, J.R., Traveling-wave amplifier made from a laser diode array. Applied Physics
Letters, 48(20)1986, 1311-1333.
Andrews, J.R., Interferometric power amplifiers. Optics Letters. Vol. 14 No. 1, 1989,
33-35.
Backus, C.E. "Laser Activation of Solar Cells," Proceedings of the 9th IEEE
Photovoltaic Specialists Conference, Silver Spring, MD., May 1972.
Born M., and Wolf, E., Principles of Optics, 5th edition, Pergamon Press, Elmsford, NY,
1975.
Botez, D. and Ackley, D.E., Phase-Locked Arrays of Semiconductor Lasers. IEEE
Circuits and Devices Magazine, January, 1986.8-17.
Burke, P.D., Gregory, D.A., Herren, K.A., Montgomery, E.E., "Phase correction in a
semiconductor amplifier array using fiber optics," 80th Anniversary OSA Annual
Meeting, Poster session display, Rochester, NY, October 1996.
Burke, P.D., "Phase correction using Fiber Optics," unpublished paper submitted on
request to Optics and Photonics News, December 1996.
Canadian Instrumentation and Research, Product Data Model 915 Piezo Assembly,
Burlington, Ontario, Canada, 1995.
Fiber Optic Trends, "Polarization preserving core structures." Photonics Spectra
Magazine, Laurin Publishing, 1988.
Kwon, J.H., Kim, D.H., Schuster, G. and Lee J.H., "Phase stability of injection-locked
beam of semiconductor lasers." NASA Technical Translation 10001, February 1992.
Kwon, J.H., Lee, J.H., and Williams, M.D., Far-field pattern of a coherently combined
beam from large scale laser diode arrays. Journal of Applied Physics, 69(3), 1991.
1177-1182.
Kingsley, S.A., Method of phase-modulating signals in optical fibers: Application to
optical-telemetry systems. Electronics Letters, Vol. 10, No. 2, 1974. 21-22.
89

Kingsley, S.A., Fibredyne systems for passive or semipassive fibre-optics sensors.
Electronics Letters, Vol. 14, No. 14, 1978. 419-422.
Hadley, G.R., Injection Locking of Diode Lasers. IEEE Journal of Quantum Electronics,
Vol. QE-22, No. 3, 1986. 419 - 426.
Hecht, E., Optics, 2nd Edition, Addison-Wesley Publishing Company Inc., Reading, PA,
1987.
Krohn, D.A., Fiber Optic Sensors: Fundamentals and Applications, Instrument Society
of America, Research Triangle Park, NC, 1992.
Kobayashi, S. and Kimura, T., Injection locking in AIGaAs semiconductor laser. IEEE
Journal of Quantum Electronics, Vol. QE-17, No. 5, 1981. 681-689.
Lagakos, N., Trott, W.J., Hickman, T.R., Cole, J.H. and Bucaro, J.A., Microbend fiber-
optic sensor as extended hydrophone. IEEE Journal of Quantum Electronics, Vol. QE-
18, No. 10, 1982. 1633-1638.
Landis, G.A., Stavnes, M., Oleson, S., and Bozek, J., "Space transfer with ground-based
laser/electric propulsion," NASA Technical Memorandum 106060, 28th Joint Propulsion
Conference and Exhibit, Nashville, TN, July, 1992.
Landis, G.A. and Westerlund, L.H., "Laser beamed power demonstration applications,"
NASA Contractor Report 190793, 43rd Congress of the International Astronautical
Federation, Washington, D.C., September, 1992.
Marathay, A.S., Elements of Optical Coherence Theory, John Wiley & Sons Inc., New
York, NY, 1982.
Martini, G., Analysis of a single-mode optical fibre piezoceramic phase modulator.
Optical and Quantum Electric Electronics, 19, 1987. 179-190.
Montgomery, E.E. and Herren, K.A., "Geostationary Power Fountain," NASA Marshall
Space Flight Center distribution, December 9, 1992.
Montgomery, E.E. (ed.), "National Advanced Optics Mission Initiative (NAOMI): Terms
of Reference," NASA Marshall Space Flight Center distribution, March 10, 1995.
Montgomery, E.E., Personal communication, 1996.
Nussbaum, A. and Phillips, R.A., Optics for Scientists and Engineers, Prentice-Hall
Inc., Englewood Cliffs, N J, 1976.
90

Schuster, G.L. and Andrews, J.R., Coherent summation of saturated A1GaAs amplifiers.
Optics Letters, Vol. 18, No. 8, 1993. 619-621.
Udd, E., Fiber Optic Sensors: An introduction for engineers and scientists, John Wiley
& Sons Inc., New York, NY, 1991.
Walker, G.H. and Heinbockel, J.H., Mathematical optimization of photovoltaic
converters for diode lasers. Proceedings of the 24th Intersociety Energy Conversion
Engineering Conference, Washington, D.C., August 1989.
Wang, W., Nakagawa, K., Sayama, S., Ohtsu, M., Coherent addition of injection-locked
high-power AlGa.As diode lasers. Optics Letters, Vol. 17, No. 22, 1992. 1593-1595.
Williams, M.D., Laser power beams obtained by the dynamic selection of emitting
elements in an array. Applied Optics, Vol.31, No. 15, 1992. 2738-2742.
Yoshino, T., Kurosawa, K., Itoh, K. and Ose, T., Fiber-optic Fabry-Perot interferometer
and its sensor applications. IEEE Journal of Quantum Electronics, Vol. QE- 18, No. 10,
1982. 1624-1633.
91

BIBLIOGRAPHY
Goodman, J.W., Introduction to Fourier Optics, McGraw-Hill Incorporated, New York,
New York, 1968.
Pedrotti, F.L. and Pedrotti, L.S., Introduction to Optics, Prentice-Hall, Inc., Englewood
Cliffs, New Jersey, 1987.
92

NASANaUonmlAcroa,utlcal Ind
$,mtce Agency1. Report No.
Report Document Page
2. Government Acceu(on No. 3. Reeiplentm Catalog No.
ii m,
4. Title and Subtitle
Investigation of Fiber Optics Based
Phased Locked Diode Lasers
7. Author(s)
Paul D. Burke
Don A. Gregory, Pricipal Investigator
ii i
9. Pcr_rming Organization Nameand Addr_s
University of Alabama in Huntsville
Department of Physics
Huntsville, AL 35899
12. Sponsoring Agency Nameand Addr_s
NASA
Marshall Space Flight Center
Huntsville, AI
5. Supplementary Notes
i
$,-Rcport Due
March 14, 1996
6. Performing Organitamon Code
UAH
S. Performing Organization Report No.
10. Work Unit. No,
11. Contract or Grant No.
NAS8-38609 D.0. 138
13. Type of report and Period covered
Final
• i
14. Sponsoring Agency Code
16. Abstract
Optical power beaming requires a high intensity source and a system to address
beam phase and location. A synthetic aperture array of phased locked sources can
provide the necessary power levels as well as a means to correct for phase errors. A
fiber optic phase modulator with a master oscillator and power amplifier (MOPA) using
an injection-locking semiconductor optical amplifier has proven to be effective in
correcting phase errors as large a 4_in an interferometer system. Phase corrections
with the piezo electric fiber stretcher were made from 0 - I0 kHz, with most
application oriented corrections requiring only I kHz. The amplifier did not lose
lose locked power output while the phase was changed, however its performance was
below expectation. Results of this investigation indicate fiber stretchers and
amplifiers can be incorporated into a MOPA system to achieve successful earth based
power beaming.
Fiber Optics
Phase Correction
Power Beaming
I_ l)+._trihul"-t +%(;,tc.,t.ttl
41. _t't',+ril'c ('hl_'x. (of (hl*_I"cI--'1) 2fl. -_t'c.,i_y (_I.+_._.{.f lhi+ l.q:t'+
t +.tl. s._il3cd l l.t'ht+._il+icd
N4_,a I.C)ltM 1+,26 ()('"1 _+,
2 I. No,. ,Jr I+.IL('_ 22. I'ricc


![[Oon seng tan]-problem-based_learning_innovation_(book_fi)](https://img.dokumen.tips/doc/110x75/58e4f2631a28ab87378b6623/oon-seng-tan-problem-basedlearninginnovationbookfi.jpg)


![[Array, Array, Array, Array, Array, Array, Array, Array, Array, Array, Array, Array]](https://img.dokumen.tips/doc/110x75/56816460550346895dd63b8b/array-array-array-array-array-array-array-array-array-array-array.jpg)