Embed Size (px)
Citation preview

One-Way Analysis of Variance:
Comparing Several Means
Diana Mindrila, Ph.D.
Phoebe Balentyne, M.Ed.
Based on Chapter 25 of The Basic Practice of Statistics (6th ed.)
Concepts:
Comparing Several Means
The Analysis of Variance F Test
The Idea of Analysis of Variance
Conditions for ANOVA
F Distributions and Degrees of Freedom
Objectives:
Describe the problem of multiple comparisons.
Describe the idea of analysis of variance.
Check the conditions for ANOVA.
Describe the F distributions.
Conduct and interpret an ANOVA F test.
References:
Moore, D. S., Notz, W. I, & Flinger, M. A. (2013). The basic practice of statistics (6th
ed.). New York, NY: W. H. Freeman and Company.
Introduction
The two sample t procedures compare the means of two populations.
However, many times more than two groups must be compared.
It is possible to conduct t procedures and compare two groups at a time, then
draw a conclusion about the differences between all of them. However, if this
were done, the Type I error from every comparison would accumulate to a
total called “familywise” error, which is much greater than for a single test.
The overall p-value increases with each comparison.
The solution to this problem is to use another method of comparison, called
analysis of variance, most often abbreviated ANOVA.
This method allows researchers to compare many groups simultaneously.
ANOVA analyzes the variance or how spread apart the individuals are within
each group as well as between the different groups.
Although there are many types of analysis of variance, these notes will focus
on the simplest type of ANOVA, which is called the one-way analysis of
variance.
ANOVA – Example (Hypotheses)
Research Question: Which method of instructional delivery is more effective?
– Face to face
– Hybrid (combination of face-to-face, and online)
– Online (100% online)
Design: Students with similar levels of background knowledge are randomly
assigned to one of the three cohorts (face-to-face, hybrid, and online). All students
are taught the same material by the same instructor. At the end of the course, all
students are assessed using the same test to measure achievement.
Null Hypothesis: In the population, the mean test scores are not significantly
different across the three cohorts of students.
μface-to-face=μhybrid=μonline
Alternative Hypothesis (multi-sided): In the population, the mean post-test score
is significantly different across the three cohorts of students.
Study Background
This example illustrates how to conduct a one-way analysis of variance to
compare the mean differences across three groups.
In this example, the researcher would like to determine which method of
instruction is the most effective: face-to-face, online, or hybrid (which
includes both face-to-face meetings and online sessions).
To investigate this, the researcher randomly assigns the participants in the
study to one of the three cohorts. The participants have similar levels of
background knowledge on the topic and they take exactly the same course
from the same instructor. The only way the courses differ is the type of
instructional delivery. At the end of the course, all students take the same
achievement test to measure the extent to which they mastered the course
objectives.
The null hypothesis is that there is no significant difference in the average
test scores across the three groups.
The alternative hypothesis for ANOVA is always multi-directional because
means vary in both directions, and these variations may occur for each one of
the groups included in the analysis.

ANOVA – Hypotheses (Summary)
When performing an ANOVA, researchers want to test the null hypothesis
that there are no differences among the means of the populations.
The basic conditions for inference are that the sample is random from each
population and that the population is Normally distributed.
The alternative hypothesis is that there is some difference. That is, not all
means are equal.
This hypothesis is not one-sided or two-sided; it is “many-sided.”
Multiple Comparisons
In a one-way analysis of variance, many comparisons are being performed at the
same time. Researchers need an overall measure of confidence in all the
conclusions.
When statistical analyses involving multiple comparisons are conducted, there are
two main steps that must be followed:
1) Conduct an overall test of significance to determine whether the differences
between means are statistically significant.
This involves computing a test statistic and finding a p-value.
This test is called the analysis of variance F test (ANOVA)
2) If the null hypothesis is rejected, conduct a detailed follow-up analysis to
decide which groups differ and how large the differences are.
Some means may be very similar, while others may be different.
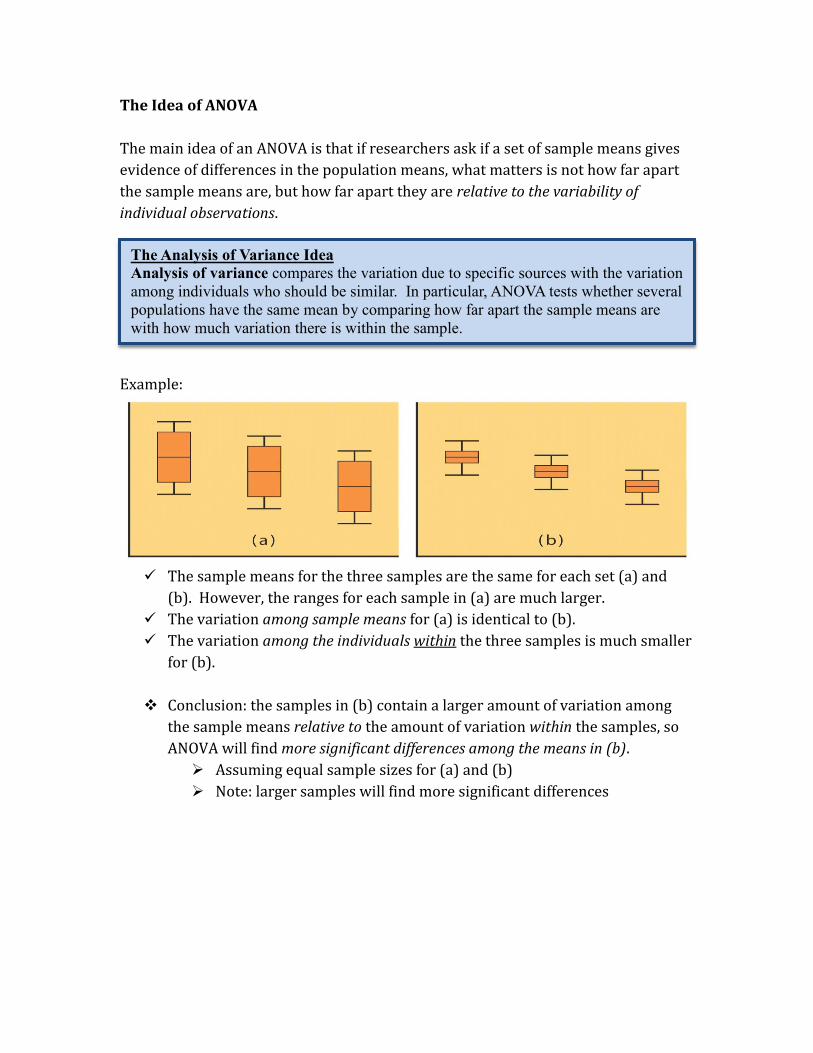
The Idea of ANOVA
The main idea of an ANOVA is that if researchers ask if a set of sample means gives
evidence of differences in the population means, what matters is not how far apart
the sample means are, but how far apart they are relative to the variability of
individual observations.
Example:
The sample means for the three samples are the same for each set (a) and
(b). However, the ranges for each sample in (a) are much larger.
The variation among sample means for (a) is identical to (b).
The variation among the individuals within the three samples is much smaller
for (b).
Conclusion: the samples in (b) contain a larger amount of variation among
the sample means relative to the amount of variation within the samples, so
ANOVA will find more significant differences among the means in (b).
Assuming equal sample sizes for (a) and (b)
Note: larger samples will find more significant differences
The Analysis of Variance Idea Analysis of variance compares the variation due to specific sources with the variation
among individuals who should be similar. In particular, ANOVA tests whether several
populations have the same mean by comparing how far apart the sample means are
with how much variation there is within the sample.

Example – Descriptive Analyses
In the example, software can run some descriptive analyses for the test
scores obtained from the students in the three groups.
When statistical software is used to run ANOVAs, a table of descriptions, like
the one shown below, is included in the output.
However, it is always a good idea to look at the descriptive statistics before
conducting the analysis.
In this case, it is clear that students in the hybrid cohort had the highest
average score, followed by the online cohort and the face-to-face cohort.
(Face-to-face instruction is labeled as traditional instruction in this data set).
The boxplots show that the hybrid group has the highest median, but also has
the largest spread (both the box and whiskers are longer), so there is more
variability in scores compared to the other two groups.
This information is taken into account when computing the ANOVA test
statistic.
The test statistic will tell researchers whether the differences between these
means are statistically significant.

The ANOVA F Statistic
To determine statistical significance, a test statistic is calculated:
The general formula for computing the test statistic is a ratio of the variation
between sample means and the variation within the groups.
The computation process for the F statistic is a little more tedious than for
the t or the z test statistics.
It can be computed by hand, but the computation involves many steps.
Statistical software is usually used to compute the F statistic.
The F statistic always takes positive values and, just like with other test
statistics, the larger the value of the F statistic, the more likely it is to have a
small p-value, and, therefore, enable researchers to reject the null hypothesis.
The ANOVA F Statistic
The analysis of variance F statistic for testing the equality of several means has this
form:
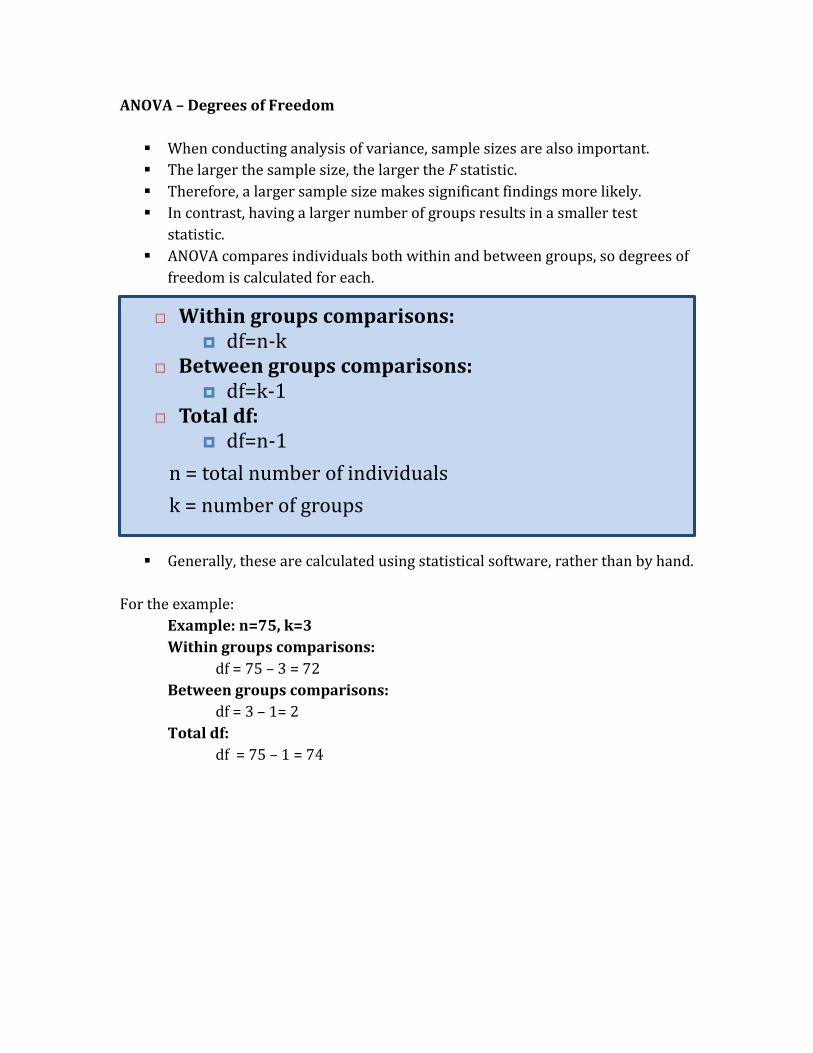
ANOVA – Degrees of Freedom
When conducting analysis of variance, sample sizes are also important.
The larger the sample size, the larger the F statistic.
Therefore, a larger sample size makes significant findings more likely.
In contrast, having a larger number of groups results in a smaller test
statistic.
ANOVA compares individuals both within and between groups, so degrees of
freedom is calculated for each.
Generally, these are calculated using statistical software, rather than by hand.
For the example:
Example: n=75, k=3
Within groups comparisons:
df = 75 – 3 = 72
Between groups comparisons:
df = 3 – 1= 2
Total df:
df = 75 – 1 = 74
Within groups comparisons:
df=n-k
Between groups comparisons:
df=k-1
Total df:
df=n-1
n = total number of individuals
k = number of groups

ANOVA – Output (Example)
The next step of an ANOVA is to run the statistical analysis and interpret the
results.
The first column of the table, labeled “Sum of Squares,” shows the sum of
score variances between and within groups, as well as the total sum for the
entire sample.
There is also a column for degrees of freedom, labeled “df,” for each type of
comparison and for the total sample.
The “Mean Square” column shows the average variation of scores between
groups and within each group.
These values are obtained by dividing the values in the “Sum of Squares”
column by the corresponding degrees of freedom.
The Within Groups variance is also called error because the groups need to
be as homogenous as possible, so variation within groups adds error to the
computation process.
The p-value is lower than the alpha level of .05, so the null hypothesis can be
rejected and the alternative hypothesis can be accepted.
Although it is now clear that there are significant differences in student
performance across the three groups, researchers still need to determine
where these differences occur, which requires post-hoc analysis.

ANOVA – Post-Hoc Analysis
If and only if the F statistic is significant, follow-up analyses can be conducted
to determine which groups have means that are significantly different and
which do not.
These follow-up analyses are called post-hoc analyses and there are a
variety of tests that can be used.
The simplest post-hoc test is called the Tukey Post-Hoc Test or the Tukey
Procedure.
The Tukey Post-Hoc Test indicates which group differences are statistically
significant.
For each group, a difference is computed between the average of that
group and the average of every other group.
Every one of these differences is tested for statistical significance.
Example:
The first column shows the first term of the subtraction, then the second
term of the subtraction. In the first row, it is online mean minus hybrid
mean.
The second column displays the differences between the means. The
differences that are statistically significant are marked with an asterisk.
In the above example, two mean differences are marked as significant,
however, they are the same difference in reverse order. This means there is
only one significant difference.
Conclusion: there is a significant difference between hybrid and traditional
instruction.
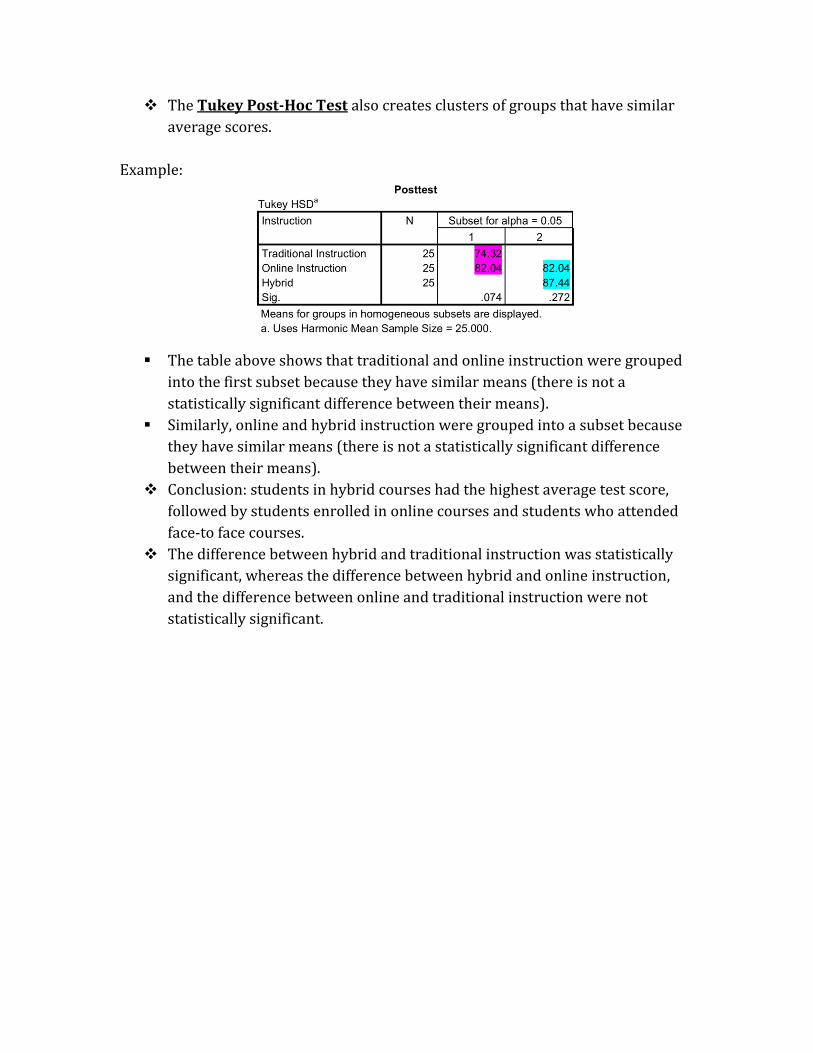
The Tukey Post-Hoc Test also creates clusters of groups that have similar
average scores.
Example:
The table above shows that traditional and online instruction were grouped
into the first subset because they have similar means (there is not a
statistically significant difference between their means).
Similarly, online and hybrid instruction were grouped into a subset because
they have similar means (there is not a statistically significant difference
between their means).
Conclusion: students in hybrid courses had the highest average test score,
followed by students enrolled in online courses and students who attended
face-to face courses.
The difference between hybrid and traditional instruction was statistically
significant, whereas the difference between hybrid and online instruction,
and the difference between online and traditional instruction were not
statistically significant.
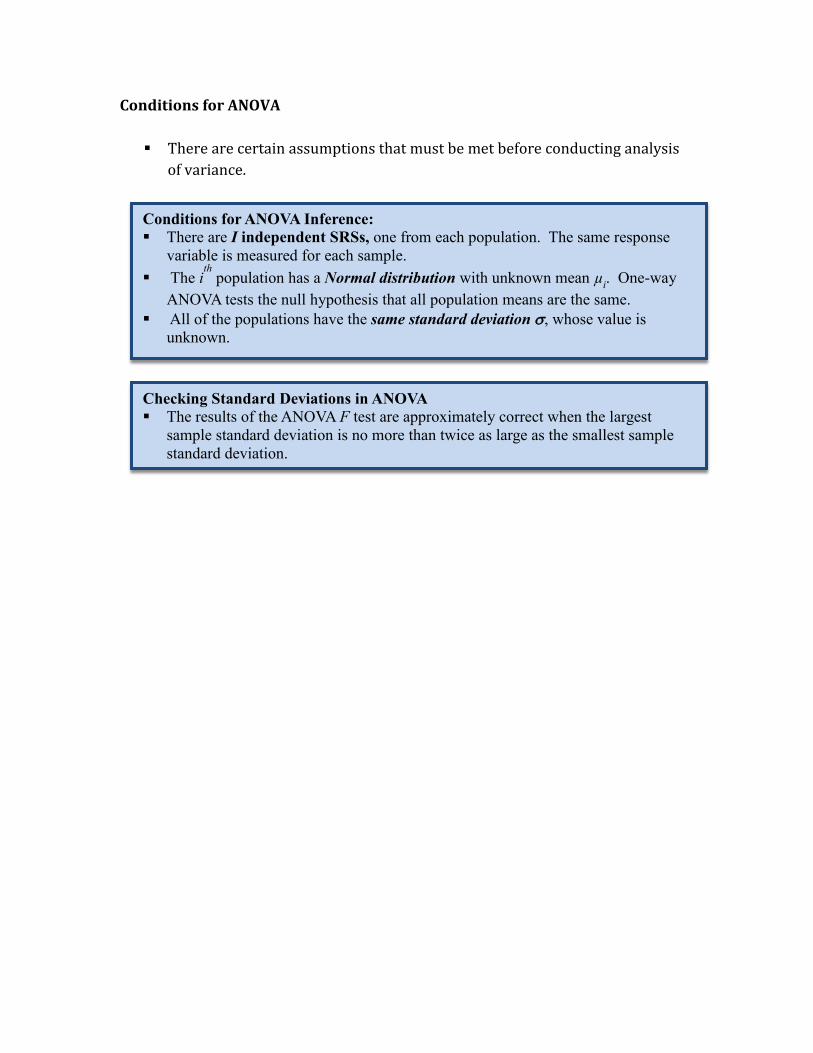
Conditions for ANOVA
There are certain assumptions that must be met before conducting analysis
of variance.
Conditions for ANOVA Inference: There are I independent SRSs, one from each population. The same response
variable is measured for each sample.
The ith
population has a Normal distribution with unknown mean µi. One-way
ANOVA tests the null hypothesis that all population means are the same.
All of the populations have the same standard deviation s, whose value is
unknown.
Checking Standard Deviations in ANOVA The results of the ANOVA F test are approximately correct when the largest
sample standard deviation is no more than twice as large as the smallest sample
standard deviation.