Embed Size (px)
Citation preview
BPS - 5th Ed. Chapter 24 1
Chapter 24
One-Way Analysis of Variance:Comparing Several Means
BPS - 5th Ed. Chapter 24 2
Chapter 18: compared the means of two populations or the mean responses to two treatments in an experiment– two-sample t tests
This chapter: compare any number of means– Analysis of Variance
Remember: we are comparing means even though the procedure is Analysis of Variance
Comparing Means

BPS - 5th Ed. Chapter 24 3
Case Study
Do SUVs and trucks have lower gas mileage than midsize cars?
Gas Mileage for Classes of Vehicles
Data from the Environmental Protection Agency’s Model Year 2003 Fuel Economy Guide, www.fueleconomy.gov.
BPS - 5th Ed. Chapter 24 4
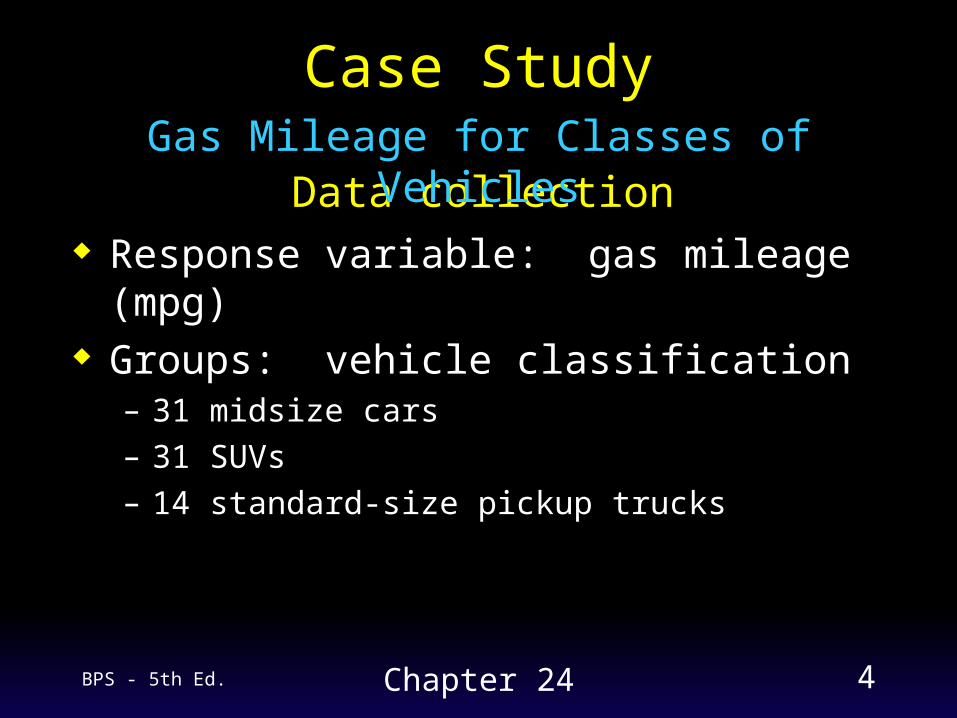
Case Study
Data collection Response variable: gas mileage (mpg) Groups: vehicle classification
– 31 midsize cars– 31 SUVs– 14 standard-size pickup trucks
Gas Mileage for Classes of Vehicles

BPS - 5th Ed. Chapter 24 5
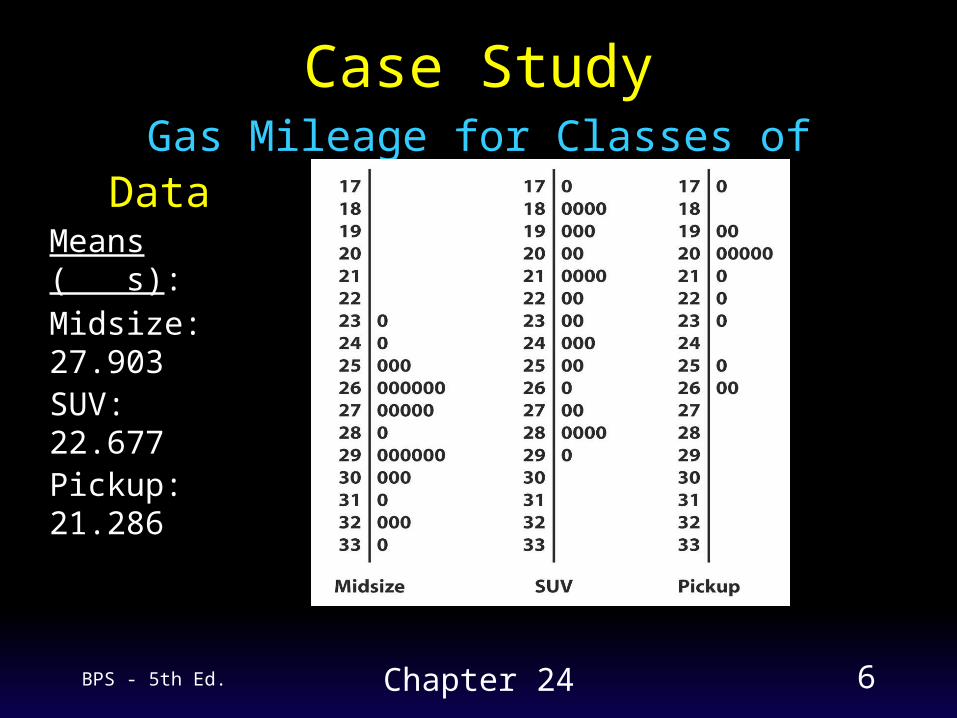
Gas Mileage for Classes of Vehicles
Case Study
Data
BPS - 5th Ed. Chapter 24 6
Gas Mileage for Classes of Vehicles
Means ( s):Midsize: 27.903SUV: 22.677Pickup: 21.286
Case Study
Data
BPS - 5th Ed. Chapter 24 7
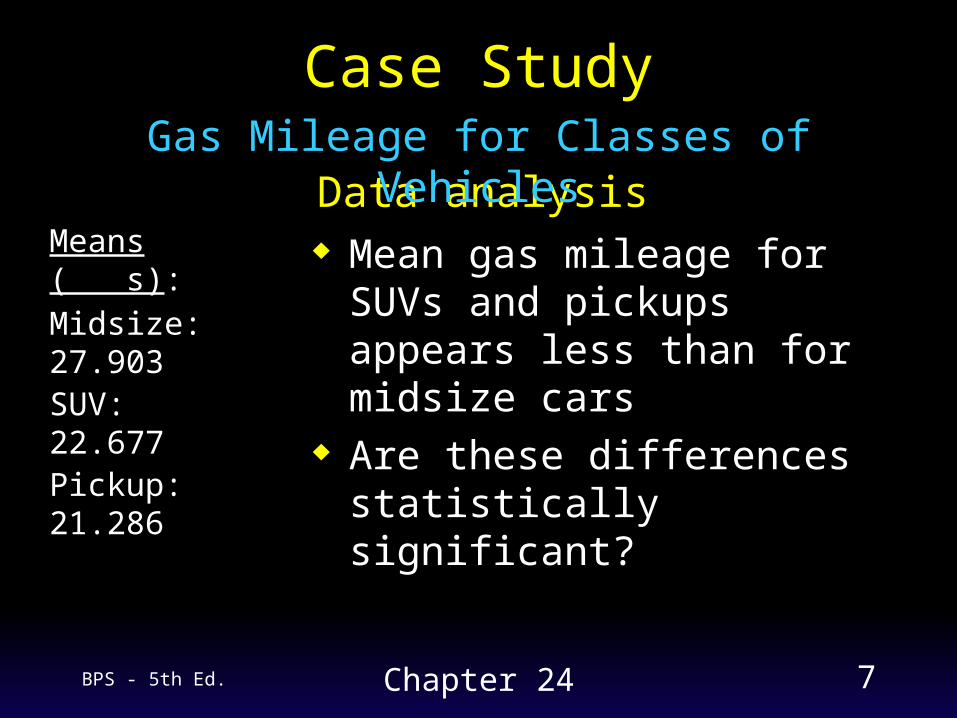
Data analysis Mean gas mileage for SUVs
and pickups appears less than for midsize cars
Are these differences statistically significant?
Gas Mileage for Classes of Vehicles
Case Study
Means ( s):Midsize: 27.903SUV: 22.677Pickup: 21.286
X
BPS - 5th Ed. Chapter 24 8
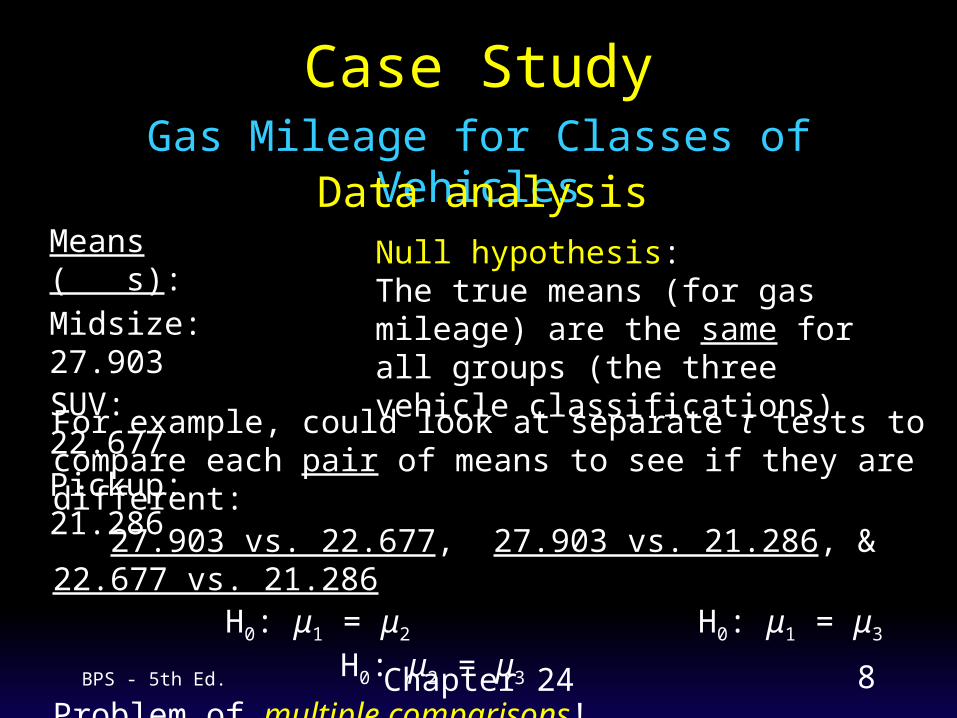
Null hypothesis: The true means (for gas mileage) are the same for all groups (the three vehicle classifications)
For example, could look at separate t tests to compare each pair of means to see if they are different: 27.903 vs. 22.677, 27.903 vs. 21.286, & 22.677 vs. 21.286 H0: μ1 = μ2 H0: μ1 = μ3 H0: μ2 = μ3
Problem of multiple comparisons!
Case StudyGas Mileage for Classes of Vehicles
Data analysisMeans ( s):Midsize: 27.903SUV: 22.677Pickup: 21.286
X
BPS - 5th Ed. Chapter 24 9
Problem of how to do many comparisons at the same time with some overall measure of confidence in all the conclusions
Two steps:– overall test to test for any differences– follow-up analysis to decide which groups differ
and how large the differences are Follow-up analyses can be quite complex;
we will look at only the overall test for a difference in several means, and examine the data to make follow-up conclusions
Multiple Comparisons
BPS - 5th Ed. Chapter 24 10
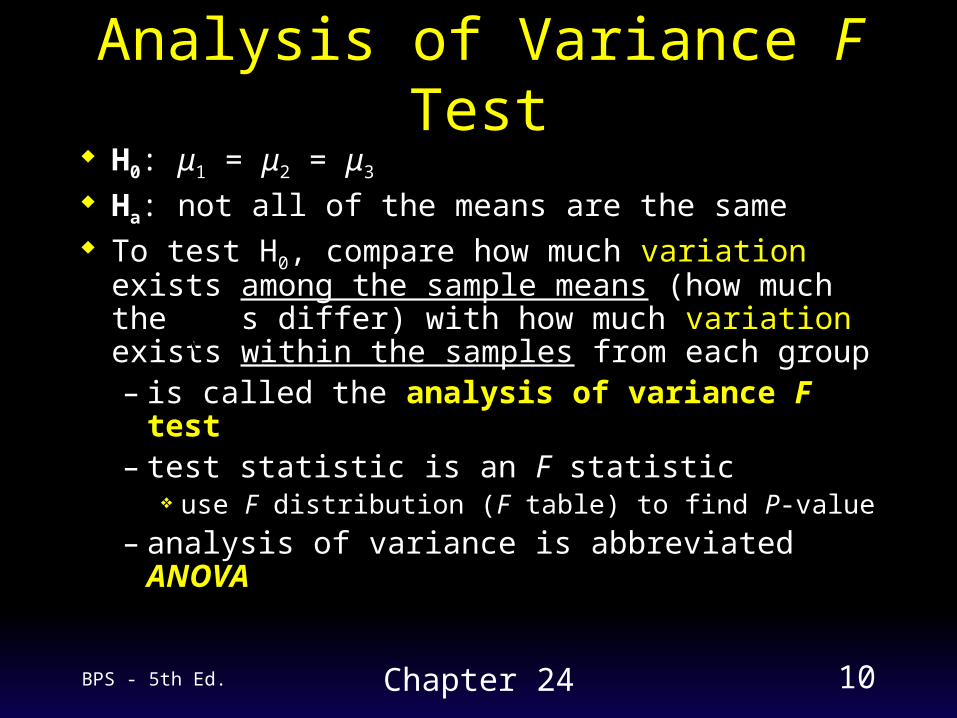
H0: μ1 = μ2 = μ3 Ha: not all of the means are the same To test H0, compare how much variation exists
among the sample means (how much the s differ) with how much variation exists within the samples from each group– is called the analysis of variance F test– test statistic is an F statistic
use F distribution (F table) to find P-value
– analysis of variance is abbreviated ANOVA
Analysis of Variance F Test
X
BPS - 5th Ed. Chapter 24 11
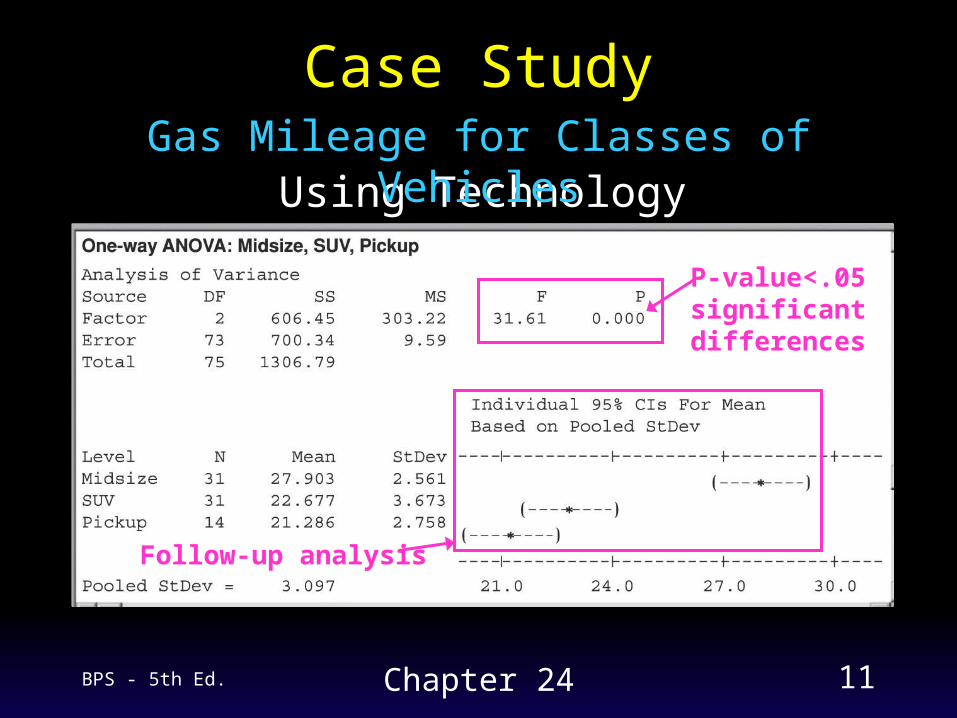
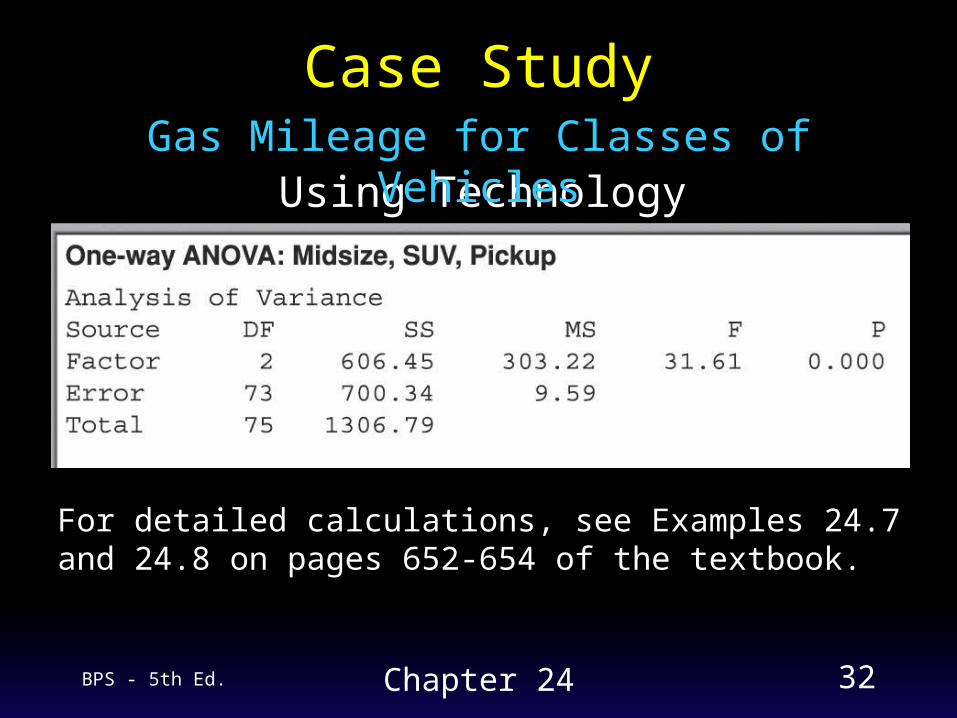
Using TechnologyGas Mileage for Classes of Vehicles
Case Study
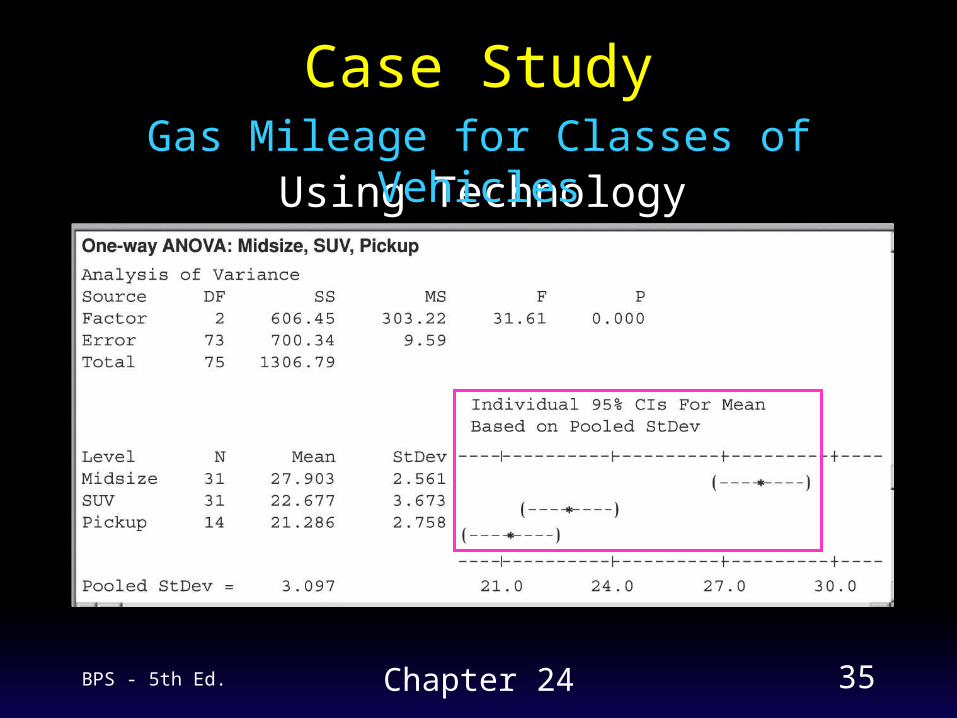
Follow-up analysis
P-value<.05significant differences
BPS - 5th Ed. Chapter 24 12
Case StudyGas Mileage for Classes of Vehicles
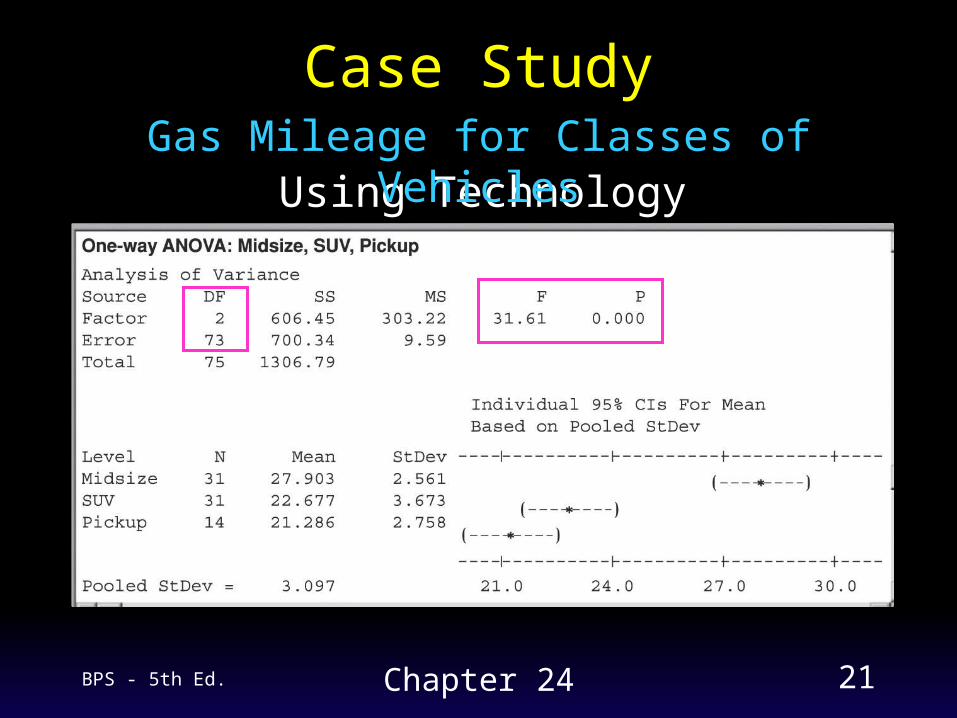
Data analysis F = 31.61 P-value = 0.000 (rounded) (is <0.001)
– there is significant evidence that the three types of vehicle do not all have the same gas mileage
– from the confidence intervals (and looking at the original data), we see that SUVs and pickups have similar fuel economy and both are distinctly poorer than midsize cars
BPS - 5th Ed. Chapter 24 13
ANOVA tests whether several populations have the same mean by comparing how much variation exists among the sample means (how much the s differ) with how much variation exists within the samples from each group– the decision is not based only on how far apart
the sample means are, but instead on how far apart they are relative to the variability of the individual observations within each group
ANOVA Idea
X
BPS - 5th Ed. Chapter 24 14
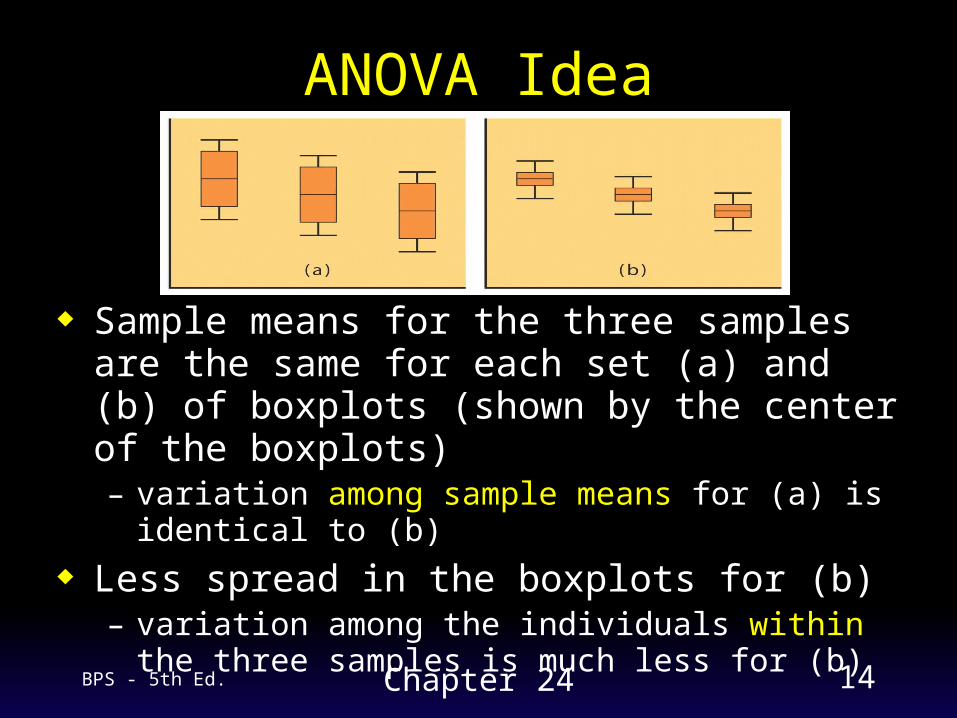
ANOVA Idea
Sample means for the three samples are the same for each set (a) and (b) of boxplots (shown by the center of the boxplots)– variation among sample means for (a) is identical to (b)
Less spread in the boxplots for (b)– variation among the individuals within the three
samples is much less for (b)
BPS - 5th Ed. Chapter 24 15
ANOVA Idea
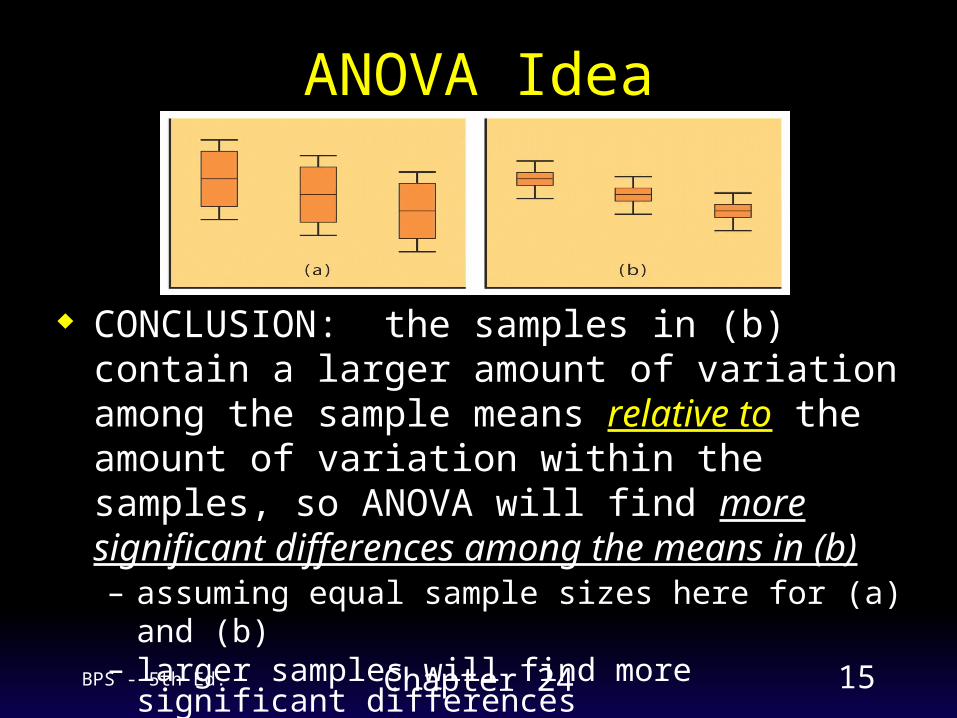
CONCLUSION: the samples in (b) contain a larger amount of variation among the sample means relative to the amount of variation within the samples, so ANOVA will find more significant differences among the means in (b)– assuming equal sample sizes here for (a) and (b)– larger samples will find more significant differences
BPS - 5th Ed. Chapter 24 16
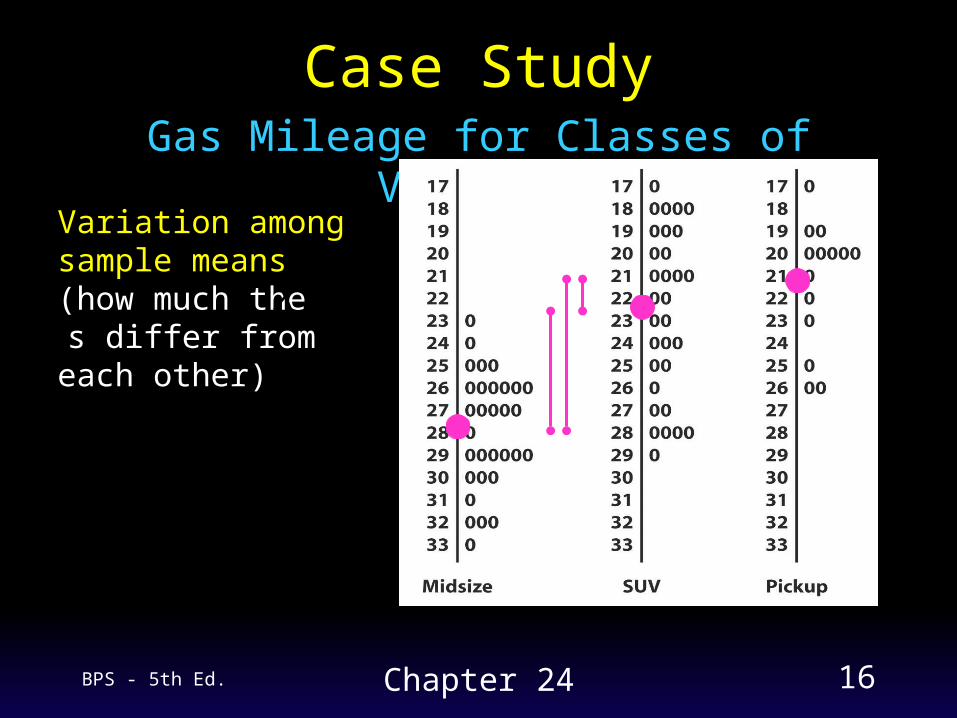
Gas Mileage for Classes of Vehicles
Case Study
Variation among sample means (how much the s differ from each other)
X
BPS - 5th Ed. Chapter 24 17
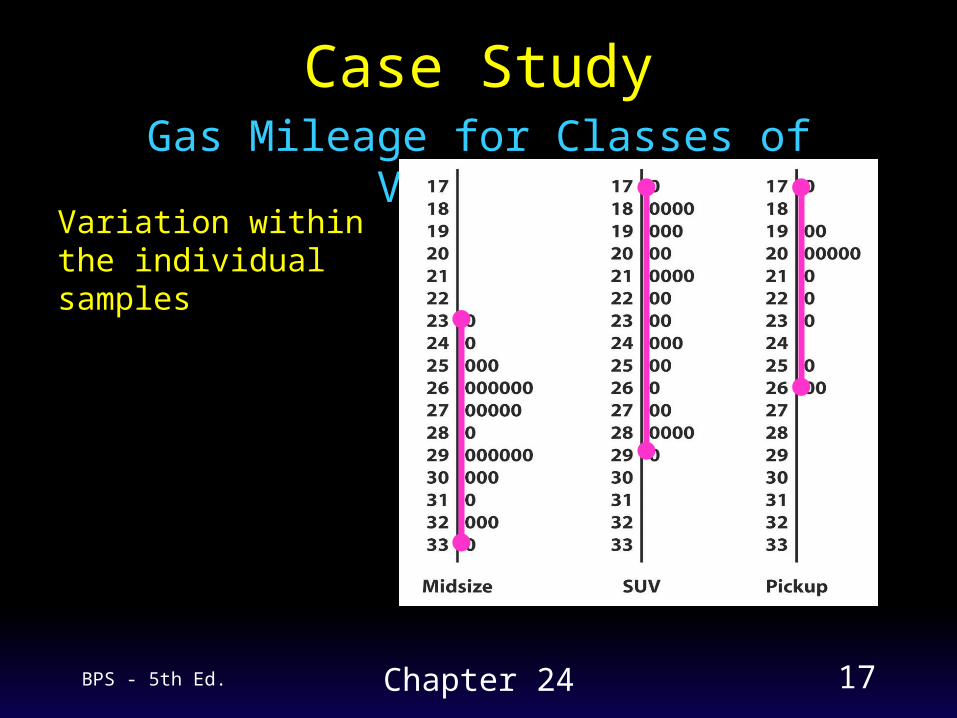
Gas Mileage for Classes of Vehicles
Case Study
Variation within the individual samples
BPS - 5th Ed. Chapter 24 18
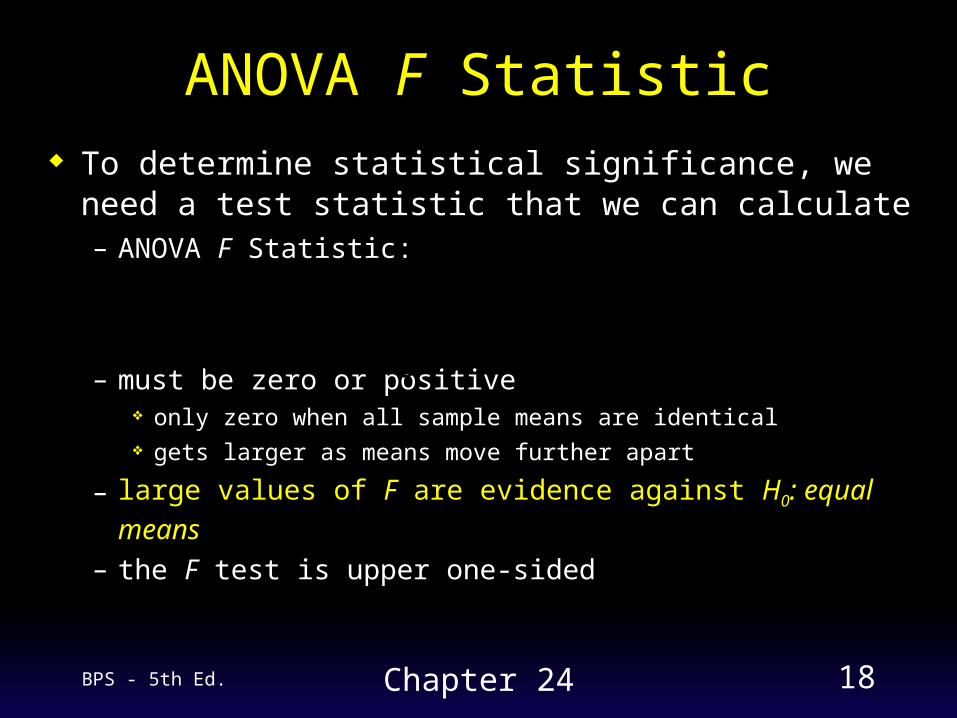
To determine statistical significance, we need a test statistic that we can calculate– ANOVA F Statistic:
– must be zero or positive only zero when all sample means are identical gets larger as means move further apart
– large values of F are evidence against H0: equal means
– the F test is upper one-sided
ANOVA F Statistic
variation among the sample meansF
variation among individuals in the same sample=
BPS - 5th Ed. Chapter 24 19
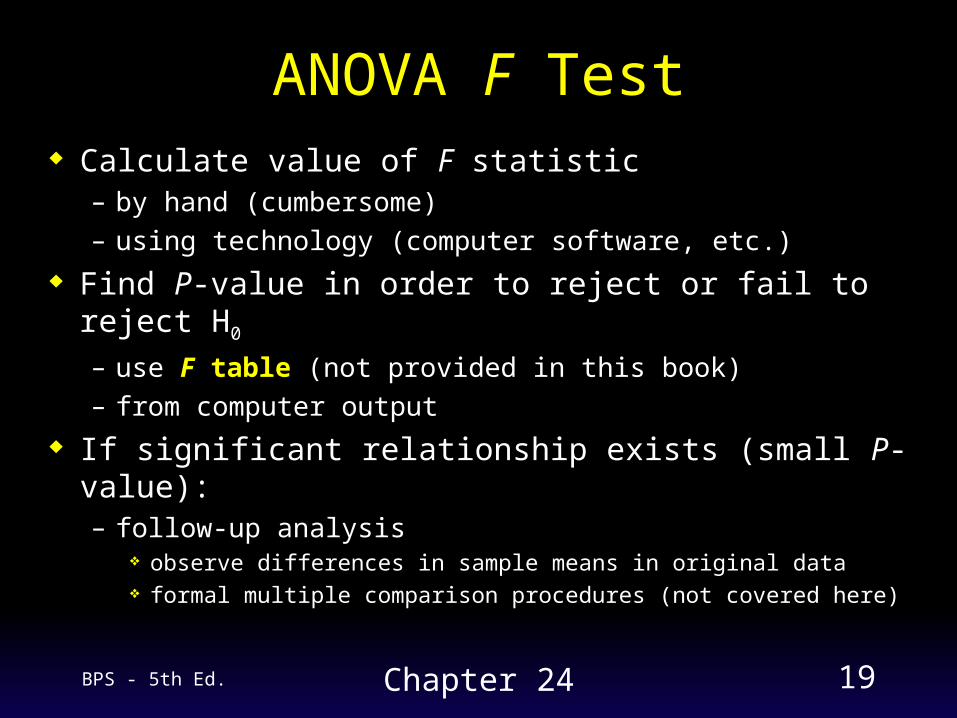
ANOVA F Test Calculate value of F statistic
– by hand (cumbersome)– using technology (computer software, etc.)
Find P-value in order to reject or fail to reject H0
– use F table (not provided in this book)– from computer output
If significant relationship exists (small P-value):– follow-up analysis
observe differences in sample means in original data formal multiple comparison procedures (not covered here)
BPS - 5th Ed. Chapter 24 20
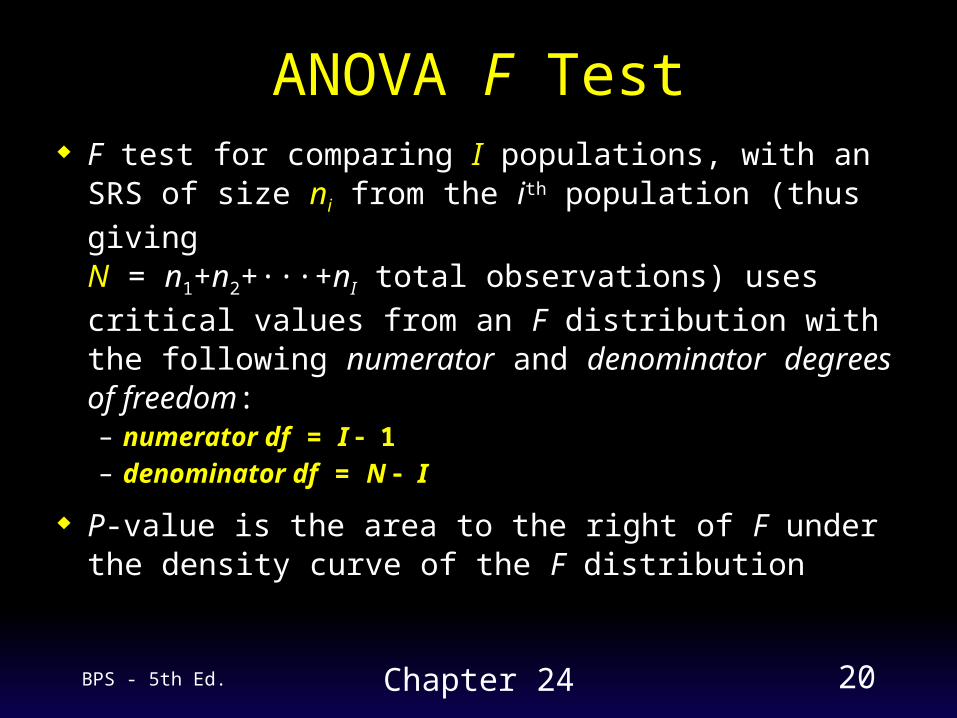
F test for comparing I populations, with an SRS of size ni from the ith population (thus giving
N = n1+n2+···+nI total observations) uses critical
values from an F distribution with the following numerator and denominator degrees of freedom:– numerator df = I 1– denominator df = N I
P-value is the area to the right of F under the density curve of the F distribution
ANOVA F Test
BPS - 5th Ed. Chapter 24 21
Using TechnologyGas Mileage for Classes of Vehicles
Case Study
BPS - 5th Ed. Chapter 24 22
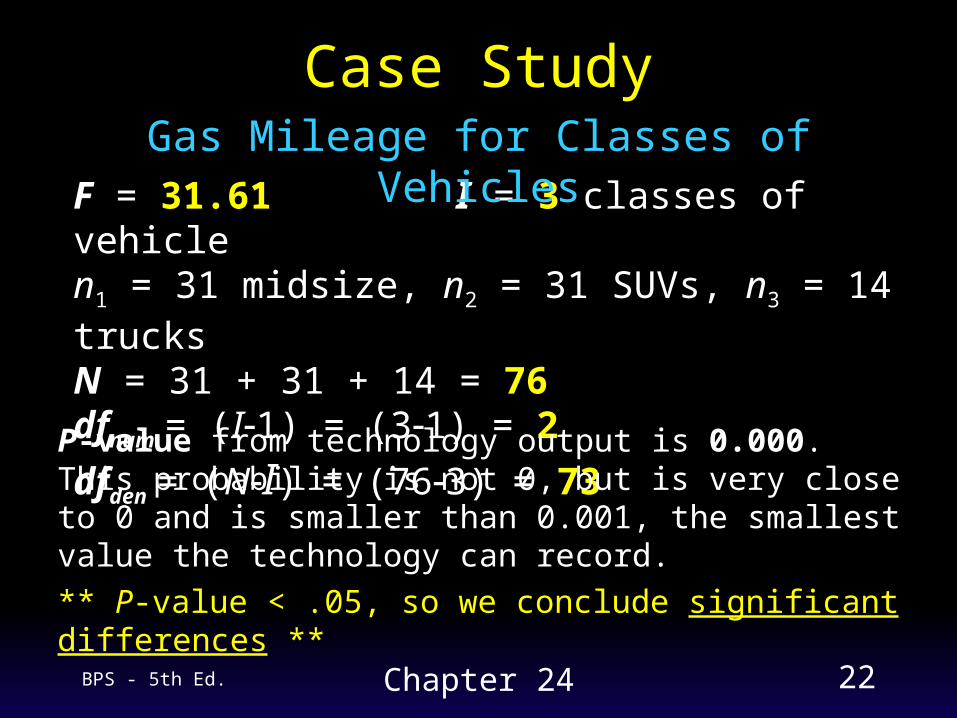
Case Study
F = 31.61 I = 3 classes of vehiclen1 = 31 midsize, n2 = 31 SUVs, n3 = 14 trucksN = 31 + 31 + 14 = 76dfnum = (I1) = (31) = 2
dfden = (NI) = (763) = 73P-value from technology output is 0.000. This probability is not 0, but is very close to 0 and is smaller than 0.001, the smallest value the technology can record.
** P-value < .05, so we conclude significant differences **
Gas Mileage for Classes of Vehicles
BPS - 5th Ed. Chapter 24 23
Conditions required for using ANOVA F test to compare population means– have I independent SRSs, one from each
population.– the ith population has a Normal distribution
with unknown mean µi (means may be different).
– all of the populations have the same standard deviation , whose value is unknown.
ANOVA Model, Assumptions
BPS - 5th Ed. Chapter 24 24
ANOVA F test is not very sensitive to lack of Normality (is robust)– what matters is Normality of the sample means– ANOVA becomes safer as the sample sizes
get larger, due to the Central Limit Theorem– if there are no outliers and the distributions are
roughly symmetric, can safely use ANOVA for sample sizes as small as 4 or 5
Robustness
BPS - 5th Ed. Chapter 24 25
ANOVA F test is not too sensitive to violations of the assumption of equal standard deviations– especially when all samples have the same or
similar sizes and no sample is very small– statistical tests for equal standard deviations
are very sensitive to lack of Normality (not practical)
– check that sample standard deviations are similar to each other (next slide)
Robustness
BPS - 5th Ed. Chapter 24 26
The results of ANOVA F tests are approximately correct when the largest sample standard deviation (s) is no more than twice as large as the smallest sample standard deviation
Checking Standard Deviations
BPS - 5th Ed. Chapter 24 27
Gas Mileage for Classes of Vehicles
Case Study
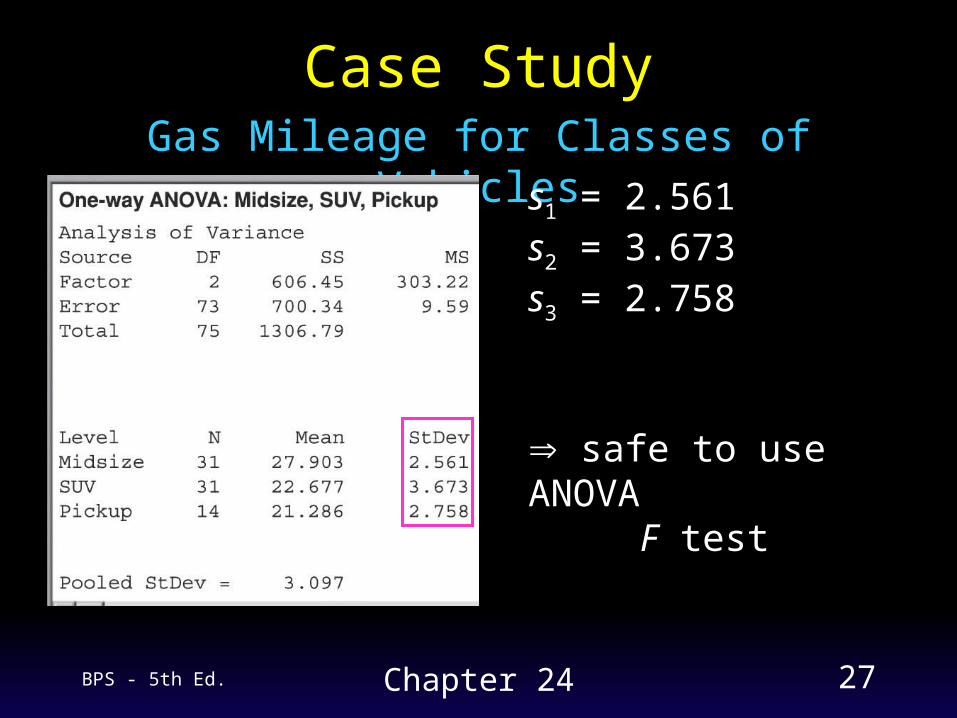
s1 = 2.561s2 = 3.673s3 = 2.758
s
s
largest 3.673= =1.434
smallest 2.561
safe to use ANOVA F test

BPS - 5th Ed. Chapter 24 28
ANOVA F statistic:
– the measures of variation in the numerator and denominator are mean squares general form of a sample variance ordinary s2 is “an average (or mean) of the squared
deviations of observations from their mean”
ANOVA Details
variation among the sample meansF
variation among individuals in the same sample=
BPS - 5th Ed. Chapter 24 29
Numerator: Mean Square for Groups (MSG)– an average of the I squared deviations of the
means of the samples from the overall mean
ni is the number of observations in the ith group
ANOVA Details
X
1
2222
211
I
II )xx(n)xx(n)xx(nMSG
N
xnxnxnx II
2211
BPS - 5th Ed. Chapter 24 30
Denominator: Mean Square for Error (MSE)– an average of the individual sample variances
(si2) within each of the I groups
MSE is also called the pooled sample variance, written as sp
2 (sp is the pooled standard deviation)
sp2 estimates the common variance 2
ANOVA Details
III
N
snsnsnMSE
2222
211 )1()1()1(

BPS - 5th Ed. Chapter 24 31
– the numerators of the mean squares are called the sums of squares (SSG and SSE)
– the denominators of the mean squares are the two degrees of freedom for the F test, (I1) and (NI)
– usually results of ANOVA are presented in an ANOVA table, which gives the source of variation, df, SS, MS, and F statistic
ANOVA F statistic:
ANOVA Details
SSE/dfE
SSG/dfG
MSE
MSGF
BPS - 5th Ed. Chapter 24 32
Using TechnologyGas Mileage for Classes of Vehicles
Case Study
For detailed calculations, see Examples 24.7 and 24.8 on pages 652-654 of the textbook.
BPS - 5th Ed. Chapter 24 33
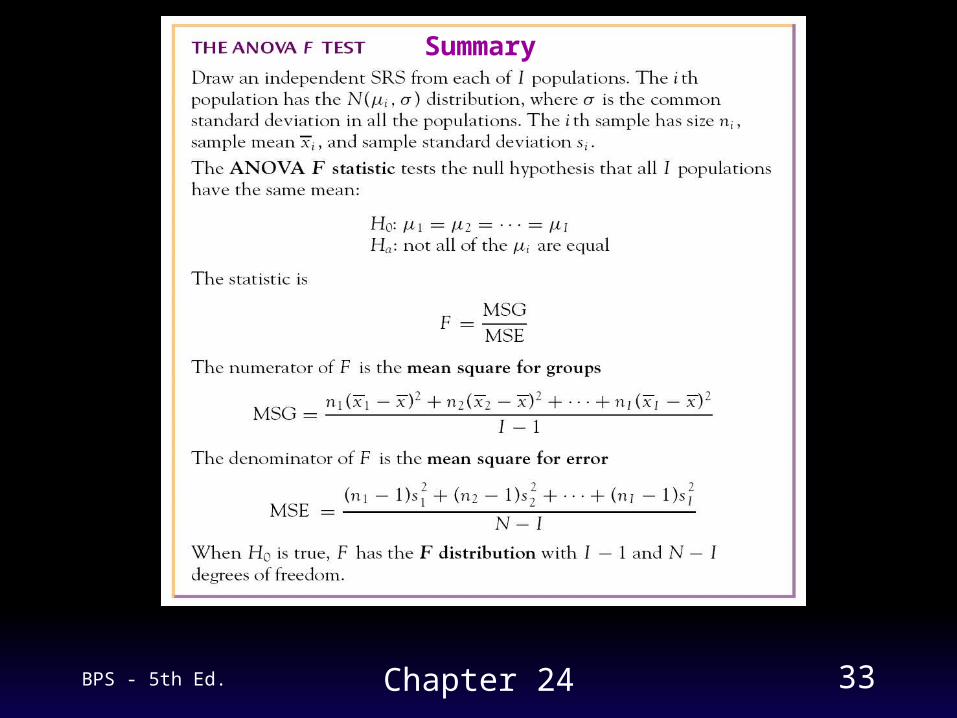
Summary

BPS - 5th Ed. Chapter 24 34
Confidence interval for the mean i of any
group:
– t* is the critical value from the t distribution with NI degrees of freedom (because sp has NI degrees of freedom)
– sp (pooled standard deviation) is used to estimate
because it is better than any individual si
ANOVA Confidence Intervals
i
pi
n
s*tx
BPS - 5th Ed. Chapter 24 35
Using TechnologyGas Mileage for Classes of Vehicles
Case Study