Embed Size (px)
Citation preview
Oncogenes, anti-oncogenes and the immune response to cancer: a mathematical model
JONATHAN A. SHERRATTl AND MARTIN A. NOWAK2
’ Centre for Mathematical Biology, Mathematical Institute, 2629 St. Giles’, Oxford OXI 3LB, U.K. 2 Department of Zoology, University of Oxford, South Parks Road, Oxford OX1 3PS, U.K.
SUMMARY
We develop a mathematical model for the initial growth of a tumour after a mutation in which either an oncogene is expressed or an anti-oncogene (i.e. tumour suppressor gene) is lost. Our model incorporates mitotic control by several biochemicals, with quite different regulatory characteristics, and we consider mutations affecting the cellular response to these control mechanisms. Our mathematical representation of these mutations reflects the current understanding of the roles of oncogenes and anti-oncogenes in controlling cell proliferation. Numerical solutions of our model, for biologically relevant parameter values, show that the different types of mutations have quite different effects. Mutations affecting the cell response to chemical regulators, or resulting in autonomy from such regulators, cause an advancing wave of tumour cells and a receding wave of normal cells. By contrast, mutations affecting the production of a mitotic regulator cause a slow localized increase in the numbers of both normal and mutant cells. We extend our model to investigate the possible effects of an immune response to cancer by including a first order removal of mutant cells. When this removal rate exceeds a critical value, the immune system can suppress tumour growth; we derive an expression for this critical value as a function of the parameters characterizing the mutation. Our results suggest that the effectiveness of the immune response after an oncogenic mutation depends crucially on the way in which the mutation affects the biochemical control of cell division.
1. INTRODUCTION
Cell division in vivo is carefully regulated. The physical proximity of neighbouring cells and changes in cell shape both have direct effects on the progression through the cell cycle (Stebbing & Heath 1984; Folkman & Moscona 1978), but the primary control mechanism is biochemical. The extracellular space in a normal tissue contains a wide range of growth- regulating chemicals, and each stage of the cell cycle occurs at a rate dependent on the concentrations of these chemicals (Baserga 1985, chapters 10 and 11). Such a complex control mechanism ensures a rapid response to changes in cell density, such as occurs in wound healing (Sprugel et al. 1987 ; Sherratt 8z Murray 1990, 1991, 1992).
Growth-regulating chemicals can be of several types. Firstly, they can be either activators or inhibitors of cell division. In addition, their action can be autocrine or paracrine, that is, they can be produced either by the cell type on which they act or only by other cell types. At a greater level of detail, different chemicals affect different portions of the cell cycle. Homeostasis therefore requires a wide range of mitotic regulators.
One of the characteristics of cancer cells is their escape from these biochemical control mechanisms. Such escape is probably not sufficient to generate cancer: in particular, the cells of benign tumours often express oncogenes (Balmain et al. 1984; Ananthaswamy ----- - - ---- - & Pierceall 1990; Nicolson 1991). Rather, cancer
results from a number of genetic mutations, one of which (in many cases, probably the* first) affects the control of cell division (Weinberg 1989a; Fearon & Vogelstein 1990; Volpe 1990). Over the last decade, an intensive programme of experimental research has led to a partial understanding of the genetic mechanisms by which cancer cells escape from biochemical growth control, namely mutations which cause the expression of oncogenes or the loss of anti-oncogenes. The former are genes causing excessive cell proliferation, whereas anti-oncogenes act to limit the division rate of normal cells. In either case, mutation results in a cell with a proliferative advantage compared with the normal cells around it. These rapidly dividing mutant cells are often the first step in a series of genetic transformations which result in cancer.
The role of biochemical regulators of mitosis in tumour growth has been investigated in several theoretical studies. Several authors have incorporated chemical inhibitors of cell division into models of tumour growth that is limited by the uptake of nutrients, showing that the growth rate and diffusion- limited size of a tumour (typically a few millimetres in diameter) both depend on the parameters of this mitotic inhibition (Greenspan 1972, 1974; Bhargava 1977 ; Tarumi & Schwegler 1983). Glass (1973) focused on the inhibition aspect and developed a simple model which suggested that proliferative inhibition alone could be sufficient to limit tumour growth, depending on the mitotic parameters. This work has recently been
Proc. R. SOL Lmd. B (1992) 248, 261-271 P&ted in Great Britain
261 6 1992 The Royal Society
262 J. A. Sherratt and M. A. Nowak Oncogenes and immune response to cancer
extended to include more general geometries and spatial non-uniformities (Shymko & Glass 1976; Adam 1986, 1987 a, 6). These models of diffusion-limited growth can also be applied to in vitro multicell spheroids (Durand 1990 ; Swan 1992). The role of mitotic control in carcinogenic mutations was considered by Wheldon (1975), who divided such mutations into two types, according to whether the detection or production of a mitotic inhibitor was affected. Also, Bell (1976) used a stochastic model to investigate the possible failure of mutant cells to secrete a mitotic inhibitor, and derived an expression for the probability of a single mutant cell giving rise to a macroscopic tumour of a given size. More recently, Michelson & Leith ( 199 1) have compared the effects of autocrine and paracrine growth factors by varying the parameters in a logistic model for tissue growth.
2. MODELLING THE ESCAPE FROM MITOTIC CONTROL
The division of normal cells is regulated both directly by the local cell density and by the combined effect of a number of synergistic growth factors. We model this by taking the division rate per cell to be given by &I r(n) $1 (Cl) . . . s,(c,), where n(x, t) is the cell density, and cf(x, t) (1 < i <j] are the concentrations of the j mitotic regulators, with x and t denoting space and time coordinates. Thus we approximate the real situation of an integer number of cells by a continuum variable for cell density. The decreasing function r(n) reflects the effect of crowding on cell density, which we include although it is not essential feature of the model, and sf(cr) represents the effect on the cell division rate of chemical i. Thus si. is an increasing function if chemical i is a mitotic activator, and a decreasing function for a mitotic inhibitor. In normal tissue, the cell density and chemical concentrations are in an equilibrium state, which we assume to be spatially homogeneous, with the growth rate R, balanced by an equal rate of cell death. We denote this equilibrium state by n = n’, Cf = ci (1 < i <j), and we assume that r(n’) = sf(cf) = 1 (1 d i <j).
Oncogenic mutations can modify this division rate in several ways.
1. Increased response to a mitotic activator. This can result from the expression of an oncogene such as erb B, whose oncoprotein is a truncated version of the receptor to the mitotic activator epidermal growth factor (Downward et aZ. 1984). Another possible cause is the loss of an anti-oncogene such as the neuro- fibromatosis tumour suppressor gene, which in normal cells produces a protein inhibiting ras-mediated mitotic activation (Xu et al. 1990). We model such a mutation by assuming that mutant cells detect the extracellular concentration of the activator to be 5 times its real value, with t > 1.
cell migration / * -,
2. Decreased response to a mitotic inhibitor. This can be caused by the loss of an anti-oncogene, for example, the RB (retinoblastoma) gene, whose ex- pression in normal cells reduces the responsiveness to the mitosis-inhibiting effects of type p transforming growth factor (Kimchi et al. 1987; Parkinson & Balmain 1990). A second example is the DCC (deleted in colon carcinoma) gene, whose product is the receptor for a mitotic inhibitor, although the inhibitor itself has not yet been identified (Fearon et al. 1990). We model a mutation of this kind by again assuming that the mutant cells detect the concentration of the inhibitor to be g times its real value, but with 5 < 1 in this case.
3. Increased production of a mitotic activator. Two types of mutation have this effect. The first is typified by the ras gene, whose cytoplasmic oncoprotein stimulates the production of several different growth activators (Jakowlew et al. 1988; Rayter et al. 1989). The second is the expression of an oncogene whose oncoprotein is very similar to a particular mitotic activator. Examples of this are sis, whose protein is very similar to platelet-derived growth factor (Doolittle et al. 1983), and int-2, whose protein is related to basic fibroblast growth factor (Dickson & Peters 1987). In our model, such mutations do not have a direct effect on the cell growth rate: rather, they affect the equation for chemical conservation.
4. Decreased production of a mitotic inhibitor. If a cell produces an auto-inhibitor of cell division then the gene corresponding to this inhibitor is clearly a potential anti-oncogene, and, in our model, the chemical conservation equation is again affected. The existence and properties of such mitotic auto-inhibitors are very well documented (see Iversen (1981) for review), but the corresponding genes remain to be characterized.
5. Escape from biochemical dependence. The ex- pression of oncogenes can stimulate intracellular signals that normally occur only in response to a mitotic activator. Such oncogenes are of two types. The first have oncoproteins that act within the cell cytoplasm: an example of this is the abl gene, which triggers signals normally generated by the growth-activating chemical GM-CSF (Kelly 1985 ; Cook et al. 1985). The second type act within the nucleus to remove cell division from its dependence on cytoplasmic signals : an example is the myc gene (Eisenman 1989). We model mutations of this kind by adding a constant term s0 to the product Jl (Cl> . . . s, (c,) in the division rate per mutant cell.
Detailed reviews of the mechanisms by which oncogenes promote cell division are given by Weinberg ( 1989 6) and Aaronson ( 199 1) ; anti-oncogenes have been reviewed by Sager ( 1989) and Weinberg ( 199 1).
We denote by m(x, t) the density of mutant cells. In a mixed population of normal and mutant cells, the crowding term in the mitotic rate depends on the sum of these cell densities, so that the conservation equations for normal and mutant cells have the following form:
biochemically regulated cell division cell death / \ I .
ih/CQ = DV% + R,nr(n+m) s1 (c,) . ..s. (c,) - Ron am/& = DV2m +R,mr(n+m)[s,+s,(~c1)s~(c2)...sj(c,)]- R,m. (1)
Proc. R. Sot. Lond. B (1992)

Oncogenes and immune
Here we assume that any mutation in the response to extracellular regulators occurs with respect to chemical 1. Following a number of previous studies (Murray 1989; Sherratt & Murray 1990), we use linear diffusion to model cell migration, and we take cell death to be a first order process. This representation of cell growth takes no account of possible limits on the supply of nutrients, and is thus only applicable to very early stages of tumour growth.
The remaining model equations are conservation equations for the concentrations of the j chemicals. The form of these depend on whether the chemical is an autocrine or paracrine regulator, and we consider the
n* = n/n’, m* = m/n’, ct* = CJCf, X* . .
response to cancer J. A. Sherratt and M. A. Nowak 263
ditions to correspond to the mutation of a single cell at the origin, so that
n(x,O) = i 0, I4 < L ne 1x1 > L
m(x,O) = {
ne, 1x1 < L 0 Ix1 > L Cf (4 0) = 6,
(1 d i < j), where L is half a typical cell length. As the size of the tissue is very large compared with the submacroscopic tumours we are considering, we take the spatial domain to be infinite. Moreover, there will be no disturbances far from the site of mutation, so that the appropriate boundary conditions are n = ne, m = 0, c = cf at x = + oo (1 d i < j). We non-dimensionalize this system by using the following resealings:
= x/L, t* = R,t, D” = D/(RO L2), 0; = Df/(RO L2), PF = e/R,, r*(n*) = r(n), sT(cT) = sf (cJ, p,*(n*+m*) = pf (n+m) n”/(cfR,,).
Henceforth we omit the asterisks for notational simplicity. The dimensionless governing equations can then be written in the following general form:
an/at = D(a2n/ax2) +nr(n+m) sl(c,) . ..s~(c.) -n, (34 am/at = D(a2m/ax2) +mr(n+m)[s,+s, (&,) s2(c2) . ..s.(c,)]-m, (34 ac,/at = D,(~2c,/~x2)+P,+(n+m)p,(n+m)+Hmp,(n+m)-[~~+p1(1)Jcr, (3~)
and
&,/at = D,(~2cf/~x2)+P,+(n+m)pf(n+m)-[~+pf(1)Jcf, (3d)
subject to general case in which chemical i is produced at a constant rate pt, independent of cell density, and also at a rate pi (ti + m) per cell. Intuitively, we expect Pr to be
n(x,O) = 1 0, I4 < 1
1 LIXI < 1
1, lx1 > 1 m(-% 0) = 0, Ix1 > 1 %(X9 0) = 1
either constant or increasing if chemical i is a mitotic (44 inhibitor, and constant or decreasing for a mitotic activator. If chemical i is normally produced in a
and
purely autocrine way, then pt = 0, whereas if it is a n=l, m=O, cl=l at x= &oo, (44 purely paracrine factor, pf z 0. Thus we have
chemical diffusion chemical production by cells constant chemical production chemical decay c ,
ac,/at = DfV2ct + G
Here we take the decay of active chemical to be a simple first order process, with rate constant df ; the fact that n = ne, m = 0, cf = cr (1 < i <j) is an equilibrium state in the absence of mutations implies that dt = (P,+pf(ne) ne)/c:. The positive constant D, is the chemical diffusion coefficient.
In either the autocrine or paracrine case, a mutation which affects the production of chemical i has the effect of adding the term Hmp, (n+m) to the right-hand side of the conservation equation. In the activator case, H > 0, and the mutation causes either increased pro- duction of an autocrine factor or the triggering of the auto-production of a paracrine chemical that is normally produced only by other cell types. In the inhibitor case, this mutation is only relevant for an autocrine factor and corresponds to a reduced pro- duction rate of this chemical, so that 0 > H > - 1.
The equations (1) and (2) constitute our model. We consider these equations in one space dimension, which renders the system amenable to mathematical analysis. Numerical solutions in two and three dimensions with radial symmetry are qualitatively very similar to these one-dimensional solutions; we have not investigated the effects of asymmetries. We take the initial con-
PYOC. R. Sot. Lond. B (1992)
P% + pr - df Cf l (2)
(2 < i < j). As previously, we assume that any mutation affecting the response to, or production of, chemicals by the cells occurs with respect to chemical 1. Usually, only one of (5 - 1 ), s,, and H will be non- zero, although an oncogene whose protein is a truncated growth factor receptor, such as erb B, might result in 6 > 1 and s0 > 0 (Downward et al. 1984).
3. PARAMETER VALUES AND MODEL SOLUTIONS
In addition to a number of parameters, the system (3) depends on the functions r(n), sf(cf) and p,(n) (1 d i < j), which remain undetermined except for the constraint that r( 1) = sf( 1) = 1, for all i. The function r(n) is strictly decreasing, and we take r(n) = (N--n)lW- I>, so that the dimensionless quantity N is an upper bound on the cell density, due to crowding effects. If chemical i is an activator of cell division, then sf(cf) is strictly increasing, whereas p,(n) is either constant or decreasing, because an increase in cell density will result in either no change or a decrease in

264 J. A. Sherratt and M. A. Nowak Oncogenes and immune response to cancer
the production rate per cell of a mitotic activator. In this case, following Sherratt & Murray (1990, 1991, 1992), we take s&c{) = a,+ (1 -a,) cr, and p,(n) = Ml +A>/(1 +An2L where a,E (0,l) and /z,,/?~E(O, a). In the inhibitor case, ~~(6,) is strictly decreasing, whereas p,(n) is either constant or increasing, and we take So = k,/[l + (k,- 1) ct], and/+(n) = h, (1 +/$n)/ (1 +pi), where kit (1,~) and, as above, hi,BrE (0, m).
A simple biological requirement of the model is that, when n = ct = 1 and m = 0, as in normal tissue, the system should be stable to small local perturbations in the cell density n. In Appendix 1, we discuss the constraints that this imposes on the kinetic parameter values. Several of the model parameters can be estimated biologically. Equation (3a) gives a cell cycle time of Ri’ log 2 in normal tissue, for which a typical order of magnitude is about 100 h. We therefore take R, = (l/100) log2 h-’ x 7 x 1 OS3 h-‘. Previous model- ling experience (Murray 1989; Sherratt & Murray 1990; Sherratt et al. 1992) suggests that a typical order of magnitude for a cell diffusion coefficient in uiuo is
1.0
10-l’ cm2 s-r or lo-l1 cm2 s-l. With a cell length of 10 pm and the above value for R,, this gives D GZ 0.01. Biochemicals of fairly large molecular mass, such as growth factors, will have a diffusion coefficient about 100 times larger than that of cells in z&o (Sherratt & Murray 1990 ; Sherratt et al. 1992), so that Di will for each i have an order of magnitude of about 1. A final restriction is that we anticipate the chemical kinetics to be fast compared with cell division, so that h, % 1 when chemical i is an au tocrine regulator, and 4 $ 1 in the paracrine case. However, beyond these intuitive considerations, which have been used previously (see, for example, Wheldon 1975), we are not aware of experimental data that would enable these production rates to be estimated quantitatively.
We have solved the model equations (3) subject to (4) numerically for a wide range of parameter values within these constraints. Our simulations show that the different mutations discussed above give quite different types of behaviour. Mutations affecting the response to a mitotic regulator (I[- 11 > 0), or giving an escape
Figure 1. The initial growth of a tumour cell population after a mutation which causes increased response to a mitotic activator, decreased response to a mitotic inhibitor, or partial escape from biochemical regulation of mitosis. We plot the density of (a) normal and (6) mutant cells (n and m, respectively) and (c) and (6) the concentrations of the corresponding regulatory biochemicals (cr and c,& as functions of distance x from the site of the mutation, at equally spaced times (dimensionless time interval = 3) ; the arrows indicate the way in which the solution changes as t increases. The solution has the form of an advancing wave of tumour cells and a receding wave of normal cells, with associated waves of regulatory chemicals. This is the qualitative form of the solution whenever s0 > 0 or It- 11 > 0. The dimensionless parameter values are so = 2, 6 = 2.5, D = 0.01, N = 10, j = 2. Chemical 1 is a mitotic activator, with 01~ = 0.1, h, = 18, /3, = 10, PI = 0 and D, = 1.2. Chemical 2 is a mitotic inhibitor, with k, = 15, h, = 22, 8, = 0.1, pz = 10 and D, = 2. Thus, chemical 1 is produced in a purely autocrine way, whereas the production of chemical 2 is part autocrine and part paracrine. The solution is obtained by solving (3) subject to (4) numerically, using a finite difference scheme.
Proc. R. Sot. Lmd. B (1992)
Oncogenes and immune response to cancer J. A. Sherratt and M. A. Nowak 265
0.8
(4
1.8
x x
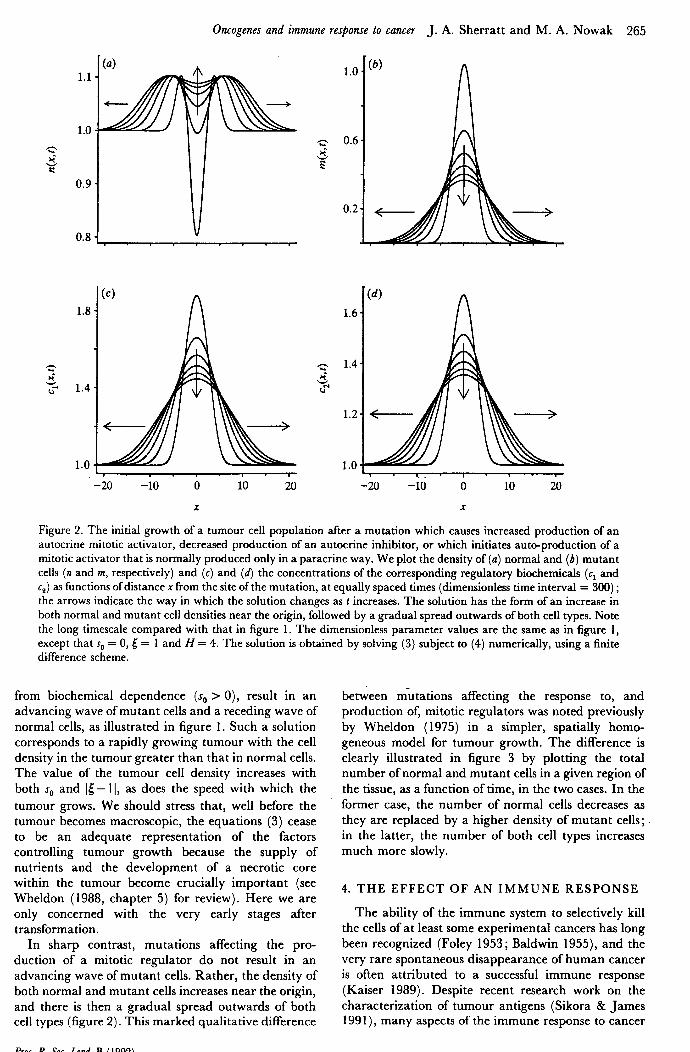
Figure 2. The initial growth of a tumour cell population after a mutation which causes increased production of an autocrine mitotic activator, decreased production of an autocrine inhibitor, or which initiates auto-production of a mitotic activator that is normally produced only in a paracrine way. We plot the density of ((I) normal and (b) mutant cells (n and m, respectively) and (c) and (d) the concentrations of the corresponding regulatory biochemicals (cl and cz) as functions of distance x from the site of the mutation, at equally spaced times (dimensionless time interval = 300) ; the arrows indicate the way in which the solution changes as t increases. The solution has the form of an increase in both normal and mutant cell densities near the origin, followed by a gradual spread outwards of both cell types. Note the long timescale compared with that in figure 1. The dimensionless parameter values are the same as in figure 1, except that s, = 0, 5 = 1 and H = 4. The solution is obtained by solving (3) subject to (4) numerically, using a finite difference scheme.
from biochemical dependence (s,, > 0), result in an advancing wave of mutant cells and a receding wave of normal cells, as illustrated in figure 1. Such a solution corresponds to a rapidly growing tumour with the cell density in the tumour greater than that in normal cells. The value of the tumour cell density increases with both s,, and It- 11, as does the speed with which the tumour grows. We should stress that, well before the tumour becomes macroscopic, the equations (3) cease to be an adequate representation of the factors controlling tumour growth because the supply of nutrients and the development of a necrotic core within the tumour become crucially important (see Wheldon (1988, chapter 5) for review). Here we are only concerned with the very early stages after transformation.
In sharp contrast, mutations affecting the pro- duction of a mitotic regulator do not result in an advancing wave of mutant cells. Rather, the density of both normal and mutant cells increases near the origin, and there is then a gradual spread outwards of both cell types (figure 2). This marked qualitative difference
Proc. R. Sot. Lond. B ( 1992)
between mutations affecting the response to, and production of, mitotic regulators was noted previously by Wheldon (1975) in a simpler, spatially homo- geneous model for tumour growth. The difference is clearly illustrated in figure 3 by plotting the total number of normal and mutant cells in a given region of the tissue, as a function of time, in the two cases. In the former case, the number of normal cells decreases as they are replaced by a higher density of mutant cells ; in the latter, the number of both cell types increases much more slowly.
4. THE EFFECT OF AN IMMUNE RESPONSE
The ability of the immune system to selectively kill the cells of at least some experimental cancers has long been recognized (Foley 1953 ; Baldwin 1955)) and the very rare spontaneous disappearance of human cancer is often attributed to a successful immune response (Kaiser 1989). Despite recent research work on the characterization of tumour antigens (Sikora 8z James 199 1 ), many aspects of the immune response to cancer

266 J. A. Sherratt and M. A. Nowak Oncogenes and immune response to cancer
time, t
w
40-c c-c--- ----s ---
30
20 I
j ..-. . , , , . , . , . . . . . . . . . . . . . . . . . . . . . . . . . . . . . . . . . . . . . . . . .
0 1000 2000
time, t
Figure 3. The variation with time of the number of normal cells (dashed line), mutant cells (dotted line) and total number of cells (solid line) in the region 20 cell lengths either side of the site of the mutation (that is, -40 < x < 40). (a) A mutation affecting the response to a mitotic regulator, or causing partial escape from biochemical control of mitosis (parameter values as in figure 1). (6) A mutation affecting the production of a mitotic regulator (parameter values as in figure 2). In the former case, there is a rapidly growing tumour, with normal cells being replaced by a higher density of mutant cells. In the latter case, there is a much slower increase in the number of both cell types. This figure clearly illustrates the totally different consequences of the different types of mutation. The solutions are obtained as in figures 1 and 2.
remain poorly understood (Naftzger & Houghton 199 1) . Nevertheless, immunotherapy, in which the natural immune response is enhanced, is one of the most rapidly developing cancer treatments (Rosenberg 1988 ; Topalian & Rosenberg 1990 ; Morton & Economou 1990). Experience with immune suppressed and AIDS patients suggests that a significant immune response may occur only for a minority of tumours (Beral et al. 1991), although the short life expectancy of these patients means that this does not exclude the importance of immunosurveillance more generally.
Several mathematical models have been proposed for this immune response. DeLisi & Rescigno (1977) and Rescigno & DeLisi (1977) developed a deter- ministic ordinary differential equation model for tumour cells and ‘immune cells’, based on an ecological predator-prey model. Grossman & Burke (1980) used a similar approach to show that both small and large tumours can escape immune surveillance, and Albert et al. (1980) determined the conditions for immune suppression of cancer in a predator-prey model with time-varying parameters. More recently, Hiernaux & Lefever ( 1988) proposed a model in which proliferating tumour cells compete with immuno- competent killer cells. The model predictions include the possibility of dormancy and of stimulation of tumour growth by the immune system.
Here, we use a very simple representation of the immune response to cancer, by assuming that mutant cells are subject to an additional first order death rate, with dimensionless rate constant 6. Thus, we add the term- 6m to the right-hand side of equation (3 6). Numerical solutions of this amended model suggest that for mutations affecting the response to, or causing autonomy from, biochemical regulators, there is a critical value of S above which the immune response prevents the growth of the tumour and causes the number of mutant cells to decay rapidly to zero, after a short initial burst of proliferation (figure 4). However,
Proc. R. Sot. ~2nd. B (1992)
for mutations affecting only the production of chemical regulators, any positive value of 6 causes the number of mutant cells to rapidly decrease to zero (figure 5). In Appendix 2, we present analysis which suggests that, for any model of the form (3), with biologically appropriate parameter values, the condition for the immune system to overcome the oncogenic mutation is
s ’ scrit =s~(5)+w-L (5)
and this is confirmed by our extensive numerical simulations. In terms of dimensional parameters, this condition is 6> [s~+~~(&)s~(c~)...~,(c~)]-[si(c:)... sI (ci)]. The biological interpretation of this is that, for immunosuppression of cancer, the immune system must remove mutant cells at a rate greater than the excess proliferation rate of the mutant cells over normal cells. In particular, when the mutation only affects the production of regulators, this excess pro- liferation rate is zero, so that Scrit = 0. This explains the result obtained in the previous section, that when 6 = 0, mutations affecting the response to, and production of, growth regulators have quite different effects. In the former case, the system is at the critical value of 6 when d = 0. Indeed, whenever 6 = aCcrit the solutions have a form that is qualitatively very similar to that shown in figure 2. Moreover, when 5 = 1 and s0 = 0 with ]H- 11 > 0, a negative value of 6 induces an advancing wave of tumour cells; this is a mathematical observation with no biological relevance.
One aspect of the condition (5) that is intuitively surprising is that Scrit is independent of the number of growth regulators and of whether they act in an autocrine or paracrine way. Moreover, in the autocrine case, hit is independent of the functional forms of/+(n), so that auto-regulation of growth control makes no contribution to the suppression of the advancing wave of mutant cells. These factors do, however, affect the cell density within the tumour, as illustrated in figure 6. The tumour cell density decreases as the number of

Oncogenes and immune response to cancer J. A. Sherratt and M. A. Nowak 267
-4 -2 0 2 4
X
-4 -2 0 2 4 X
Figure 4. The initial growth of a tumour cell population in the presence of an immune response, after a mutation affecting the response to a mitotic regulator, or causing partial escape from mitotic control. In (u), the immune response is not quite sufficient to suppress tumour growth, and there is an advancing wave of mutant cells and a corresponding receding wave of normal cells. In (6), the immune response is strong enough to suppress tumour growth, and the mutant cell density rapidly decreases; the ‘gap’ is rapidly filled by normal cells. We plot the density of normal and mutant cells (n and m, respectively) as functions of distance x from the site of the mutation, at equally spaced times (dimensionless time interval = 7.5) ; the arrows indicate the way in which the solution changes as t increases, The increase in tl above zero near the origin is a purely transient phenomenon. For brevity, we omit the concentrations of the corresponding regulatory biochemicals. The parameter values are s0 = 1.5, 5 = 2, H = 0, D = 0.01, N = 10,j = 3. The value of accrlt is then 2.3. In (a), 6 = 2.2, and in (b), 6 = 2.4. In both cases, chemical 1 is a purely paracrine mitotic activator, with a, = 0.2, h, = 0, 4 = 20 and D, = 1.5. Chemical 2 is also an activator, with &B=0.1,h,=5,fi,= l,P,=OandD,= 1.3. Chemical 3 is an inhibitor, with k, = 15, h, = 30, & = 0.5, P3 = 0 and 4 = 0.9. The solutions are obtained as in figures 1 and 2.
1.0
0.2
-4 -2 0 2 4 -4 -2 0 2 4
x x
Figure 5. The immunosuppression of a tumour cell population after a mutation affecting the production of a mitotic regulator. For this type of mutation, any positive immune response is sufficient to rapidly remove the mutant cells. We plot the density of (a) normal and (6) mutant cells (n and m, respectively) as functions of distance x from the site of the mutation, at equally spaced times (dimensionless time interval = 15) ; the arrows indicate the way in which the solution changes as t increases. For brevity, we omit the concentrations of the corresponding regulatory biochemicals. The parameter values are the same as in figure 2, but with S = 0.0 1. The solutions are obtained as in figures 1 and 2.
Proc. R. Sot. L..ond. B ( 1992)

268 J. A. Sherratt and M. A. Nowak Oncogenes and immune response to cancer
(4 1.0
-10 -5 0 5 10
2.5
i
-10 -5 0 5 10
X
Figure 6. The effect of mitotic regulation on tumour cell density. We show the initial growth of a tumour cell population after the same mutation in two cases. (a) Weak mitotic regulation: two regulatory chemicals with production rates independent of cell density. (b) Strong mitotic regulation: seven regulatory chemicals whose production rates depend steeply on cell density. The tumour cell density is much higher in (a) than (6) because of the weaker mitotic control. However, the growth rate of the tumour is approximately the same in both cases: this is a function of the mutation only. We plot the density of normal and mutant cells (n and m, respectively) as functions of distance x from the site of the mutation, at equally spaced times (dimensionless time interval = 3) ; the arrows indicate the way in which the solution changes as t increases. For brevity, we omit the concentrations of the corresponding regulatory biochemicals. The parameter values are as follows. In both (a) and (6), s,, = 3, 5 = 5, 6 = 1.‘5, D = 0.01, N= 10. In (a), chemical 1 is a mitotic activator, with ai = 0.1, h, = 20, /?r = 0, PI = 0 and D, = 1.2; Chemical 2 is an inhibitor, with k, = 15, h, = 20, p, = 0, Pz = 0 and D, = 2. In (6), chemical 1 is an activator, with a,=0.1,h,=25,#?,=60,P,=OandD1= 1.2 ; chemical 2 is an inhibitor, with k, = 15, h, = 60, be = 2, Pz = 0 and D, = 2; chemical 3 is an activator, with a3 = 0.3, h, = 20, r6, = 50, P3 = 15 and D, = 1; chemical 4 is an inhibitor, with k, = 20, h, = 40, /?, = 1, 4 = 10 and D, = 0.8 ; chemical 5 is an activator, with ag = 0, h, = 18, 8, = 100, P5= 10and D,= 1.1; chemical 6 is an inhibitor, with k, = 15, h, = 30, /3a = 2, P, = 0 and D, = 1.5; chemical 7 is an inhibitor, with k, = 18, h, = 25, & = 4, P, = 20 and D, = 1. The solutions are obtained as in figures 1 and 2.
growth regulators increases, and also as the control on their production (that is, Idp,/dnl) increases. The parameter values in figure 6a, b correspond to weak and strong biochemical control, respectively, but with identical mutations.
5. CONCLUSION
Recent experimental research has led to a partial understanding of the types of mutations by which cancer cells can acquire a proliferative advantage over normal cells. We have developed a mathematical model for the initial growth of a tumour after such a mutation. Our mathematical representation of the various types of mutation reflects the current under- standing of the roles of oncogenes and anti-oncogenes
PYOC. R. SOC. Lmd. B ( 1992)
(i.e. tumour suppressor genes) in controlling cell proliferation . Numerical solutions of our model, for biologically relevant parameter values, show that the different types of mutations have quite different effects. Mutations affecting the cell response to chemical regulators or resulting in autonomy from such regu- lators, cause an advancing wave of tumour cells and a receding wave of normal cells. By contrast, mutations affecting the production of a mitotic regulator cause a slow localized increase in the numbers of both normal and mutant cells. Building on this understanding of the different types of mutation, we have extended our model to investigate the possible effects of an immune response to cancer by including a first order removal of mutant cells. When this removal rate exceeds a critical value, the immune system can suppress tumour

Oncogenes and immune
growth; this critical value is equal to the difference in the mitotic rates of mutant and normal cells when the concentrations of regulatory biochemicals are at their values in normal tissue.
One of the roles of theoretical models in cell biology is to suggest ways in which experimentally charac- terized molecular and genetic mechanisms might conspire to cause macroscopic phenomena. In this regard, the biological implications of our results are twofold. Firstly, our investigation of the effects of different types of mutation suggests a possible mech- anism by which the expression of different oncogenes, or the loss of different anti-oncogenes, could give rise to different types of tumour growth. Secondly, our model suggests that the immune system may control tumour growth by directly counteracting the mitotic advantage of the cancer cells. Further investigation of this possibility, both experimentally and theoretically, could ultimately lead to an understanding of the factors responsible for the success or failure of immuno- therapy treatments.
J.A.S. was supported by a Junior Research Fellowship at Merton College, Oxford. M.A. N. is a Junior Research Fellow of Wolfson College, Oxford.
APPENDIX 1
A biological constraint on any model for cell growth in uivo is that the normal level of cell density in the tissue is stable to small local perturbations in either the cell density itself or the concentrations of regulatory biochemicals. In this Appendix, we investigate the conditions that this imposes on the model parameter values. Linearizing the model about the steady state n=c f = 1, with m=O and &= 1, s,,=O, H=O (as is the case in normal tissue) gives
aqat = D(a”G/ax’) +r’( 1) fi+si( 1) c;+ . . . +s;( 1) c;,
and (A 14
ac;/at = D,(a”c;/ax”) + [Pr( 1) +pl( l)] n’- [&+pt( 1)] c;, (A 14
response to cancer J. A. Sherratt and M. A. Nowak 269
Now for biologically relevant parameter values, pr (n) and 4 are both % 1 (except that one may be zero). Writing/+ (n) = dl (n)/e and pt = pt/e, with c + 1, gives
[DK’ - o---q I)] = s;(l)&(l) +/$(l)J/ i-1
For any given value of K, the roots of this equation all have positive real part for sufficiently small values of e if, and only if,
[DK~- ~;lw&wPi (1) +P; Wl/K+P* WI ’ 0. 1-l
We therefore require this inequality to hold for all K E (w, so that the steady state is stable if, and only if,
r’(1) +~~s;(l)[P,(l) +P,‘u)llre+P,(l)l < 0. (A 3) f-l
APPENDIX 2
Numerical solutions of the model equations suggest that there is a critical value of the parameter 6, which reflects the extent of the immune response to the oncogenic mutation, above which the tumour cells rapidly die off, but below which the model solutions have the form of an advancing wave of tumour cells and a corresponding receding wave of normal cells. Here we present analysis which suggests that this critical value depends on the parameters characterizing the mutation in the following way : accrit = s,, + s1 (5) - 1.
We look for travelling wave solutions of (3), that is, waves with constant shape and constant speed. This implies that n(x,t) = C(Z), m(x, t) = R(Z), ct (x,t) = q (z), where z = x+ at, with a the dimensionless wave speed. Substituting these solution forms into (3), with an immune response term - 6m added to (3 b), and omitting the overbars for notational simplicity, gives
a(dn/dz) = D(d%/dz2) +nr(n+m) sl (c,) . ..s. (c,) -n, (B 14
a(dm/dz) = D(dgm/dz2)+mr(n+m)[s,+s, (&,)s, (c,) . ..s.(c,)]-(1 +S) m P 14
a(dc,/dz) = D,(dzc,/dz2)+~+(n+m)p,(n+m)+Hmp,(n+m)-[P,+p,(1)]cl, (B lc)
and
a(dc,/dz) = D,(d2c,/dz2) + pi + (n + m) p,(n + m) - [pt +P,( I)] ct. (B 14
(l<i<j),wheren”=n-1 and&=c,-1 area1141 in absolute value. We look for plane wave solutions, 5 cc exp (l/cx--Wl), c;- cc exp (LKx---Ot) (L = -\/ - 1). Sub- stituting these expressions into (A 1) and simplifying shows that, for non-trivial solutions, we require
i-j
[DK~---+)] = c s;( l)j-jr (1) +p;( I)]/
‘-’ [D rK2-W+<+pi(l)]. (A 2)
This is the dispersion relation for O(K) ; the steady state
is stable if, and only if, g&‘(o) > 0 for all K E Iw.
Proc. R. Sot. Land. B (1992)
These equations are valid on - co < z < 00, with the initial conditions n = ct = 1, m = 0 at z = - 00. As discussed in the main body of the paper, we anticipate that D < 1, while P,+pr(n+ m) b 1. We can therefore assume that, to a first order approximation, D = 0 and either 4 = co or h, = 00. The equations (B 1) then reduce to a system of two coupled ordinary differential equations :
dn/dc = n{s, Gf(n, m)] * F(n + m) - 1)
and P 24
dm/dc = m{s, r(n + m) + s1 [$‘(n, m)] . F(n + m) - 1 - S),

270 J. A. Sherratt and M. A. Nowak Oncogenes and immune response to cancer
where [ = z/a and f(n, m) = [PI+ (n+m) PI (n+m) +Hmp, (n+41/[G+P1(1)l, with
The stability matrix of (B 2) at the equilibrium point n= 1, m=O, is
[
aflan(l,O)+F’(l) i?J/~m(l,O)+F’(1) 0 s,+s, (5) - l-6 1
as f(l,O) =F(l) = 1. NOW afl%(l,O)+F’(l) is simply the left-hand side of the inequality (A 3), and the stability condition for normal tissue implies that this is negative. Therefore the equilibrium point (1,O) in the n-m phase plane is a stable node if 6 > sO+sl(& - 1, and a saddle point if 6 < s,+s, (&- 1. Moreover, (B 2) has a solution corresponding to a travelling wave solution of (3) if, and only if, there is a trajectory emerging from the point ( 1,O) in n-m phase space. This suggests that such a travelling wave solution exists if, and only if, 6 < s,, + s1 (5) - 1; this solution will then correspond to the unique trajectory leaving ( 1,O). Moreover, as r(N) = F(N) = 0, the triangular region n > 0, m 3 0, n+ m < N is a confined set in the n-m phase plane, and thus this trajectory must terminate within this region. Further mathematical details of this travelling wave form in a simple special case will be discussed elsewhere (Sherratt 1992).
REFERENCES
Aaronson, S. A. 1991 Growth factors and cancer. Science, Wash. 254, 1146-l 153.
Adam, J. A. 1986 A simplified mathematical model of tumor growth. Math. Biosci. 81, 229-244.
Adam, J. A. 1987a A mathematical model of tumor growth. II. Effects of geometry and spatial nonuniformity on stability. Math. Biosci. 86, 183-211.
Adam, J. A. 1987 b A mathematical model of tumor growth. III. Comparison with experiment. Math. Biosci. 86, 213-227.
Albert, A., Freedman, M. & Perelson, A. S. 1980 Tumors and the immune system: the effects of a tumor growth modulator. Math. Biosci. 50, 25-58.
Ananthaswamy, H. N. & Pierceall, W. E. 1990 Molecular mechanisms of ultraviolet radiation carcinogenesis. Photo- them. Photobiol. 52, 1119-l 136.
Baldwin, R. W. 1955 Immunity to methylcholanthrene induced tumours in inbred rats following atrophy and regression of implanted tumours. BY. J. Cancer 9, 652-657.
Balmain, A., Ramsden, M., Bowden, G. T. & Smith, J. 1984 Activation of the mouse cellular Harvey-ras gene in
chemically induced benign skin papillomas. Nature, Lond. 307, 658-660.
Baserga, R. 1985 The biology of cell reproduction. Cambridge, Massachussetts : Harvard University Press.
Bell, G. I. 1976 Models of carcinogenesis as an escape from mitotic inhibitors. Science, Wash. 192, 569-572.
Beral, V., Jaffe, H. & Weiss, R. 1991 Cancer surveys: cancer, HIV and AIDS. Eur. J. Cancer 27, 1057-1058.
Bhargava, P. M. 1977 Regulation of cell division by malignant transformation : a new model for control by uptake of nutrients. J. theor. Biol. 68, 101-137.
Cook, W. D., Metcalf, D., Nicola, N. A., Burgess, A. W. & Walker, F. 1985 Malignant transformation of a growth
Proc. R. SOG. Lond. B (1992)
factor-dependent myeloid cell line by Abelson virus without evidence of an autocrine mechanism. Cell 41, 677-683.
DeLisi, C. & Rescigno, A. 1977 Immune surveillance and neoplasia. I. A minimal mathematical model. Bull. Math. Biol. 39, 20 l-22 1.
Dickson, C. & Peters, G. 1987 Potential oncogene product related to growth factors. Nature, Lond. 326, 833.
Doolittle, R. F., Hunkapiller, M. W., Hood, L. E., De Vare, S. G., Robbins, K. C., Aaronson, S. A. & Antoniades, H. N. 1983 Simian sarcoma virus one gene, v-sis, is derived from the gene (or genes) encoding a platelet-derived growth factor. Science, Wash. 221, 275-276.
Downward, J., Yarden, Y., Mayes, E., Scrace, G., Totty, N., Stockwell, P., Ullrich, A., Schlessinger, J. & Water-field, M. D. 1984 Close similarity of epidermal growth factor receptor and v-erb B oncogene protein sequences. Nature, Lond. 307, 521-527.
Durand, R. E. 1990 Multicell spheroids as a model for cell kinetic studies. Cell Tiss. Kinet. 23, 141-159.
Eisenman, R. N. 1989 Nuclear oncogenes. In Oncogenes and the molecular origins of cancer (ed. R. A. Weinberg), pp. 175-22 1. Cold Spring Harbor Laboratory Press.
Fearon, E. R., Cho, K. R., Nigro, J. M., Kern, S. E., Simons, J. W., Ruppert, J. M., Hamilton, J. R., Preisinger, A. C., Thomas, G., Kinzler, K. W. & Vogelstein, B. 1990 Identification of a chromosome 18q gene that is altered in colorectal cancers. Science, Wash. 247, 49-56.
Fearon, E. R. & Vogelstein, B. 1990 A genetic model for colorectal tumorigenesis. Cell 61, 759-767.
Foley, E. J. 1953 Antigenic properties of methyl- cholanthrene induced tumours in mice of the strain of origin. Cancer Res. 13, 835-837.
Folkman, J. & Moscona, A. 1978 Role of cell shape in growth control. Nature, Lond. 273, 345-349.
Glass, L. 1973 Instability and mitotic patterns in tissue growth. J. dyn. Syst. Meas. Control 95, 324-327. *
Greenspan, H. P. 1974 On the self-inhibited growth of cell ’ cultures. Growth 38, 81-95.
Greenspan, H. P. 1972 Models for the growth of a solid tumor by diffusion. Stud. a#. Math. 51, 317-340.
Grossman, 2. & Berke, G. 1980 Tumor escape from immune elimination. J. theor. Biof. 83, 267-296.
Hiernaux, J. R. & Lefever, R. 1988 Population dynamics of tumors attacked by immunocompetant killer cells. In Theoretical immunology, Part 2 (ed. A. S. Perelson), pp. 19-36. Redwood City, California : Addison- Wesley.
Iversen, 0. H. 1981 The chalones. In Tissue growth factors (ed. R. Baserga), pp. 491-550. Berlin: Springer-Verlag.
Jakowlew, S. B., Kondaiah, P., Flanders, K. C., Thompson, N. L., Dillard, P. J., Sporn, M. B. 8~ Roberts, A. B. 1988 Increased coordinate expression of growth factor mRNAs accompanies viral transformation of rodent cells. Oncogene Res. 2, 135-148.
Kaiser, H. E. 1989 Regression of neoplasms in man. In Injuence of the host on tumour development (ed. R. B. Herber- man), pp. 20-26. Dordrecht.
Kelly, K. 1985 Growth factors short-circuited. Nature, Lond. 317, 390.
Kimchi, A., Wang, X.-F., Weinberg, R. A., Cheifetz, S. & Massague, J. 1987 Absence of transforming growth factor- /3 receptors and growth inhibitory responses in retino- blastoma cells. Science, Wash. 240, 196-199.
Michelson, S. & Leith, J. 1991 Autocrine and paracrine growth factors in tumor growth: a mathematical model. Bull. Math. Biol. 53, 639-656.
Morton, D. L. & Economou, J. 1990 Cancer immunology and immunotherapy. In Cancer treatment (ed. C. M. Haskell), pp. 102-l 19. Philadelphia : W. B. Saunders.

Oncogenes and immune response to cancer J. A. Sherratt and M. A. Nowak 271
Murray, J. D. 1989 Mathematical biology. Berlin : Springer- Verlag.
Naftzger, C. & Houghton, A. N. 1991 Tumor immunology. Cur-r. Opin. Oncol. 3, 93-99.
Nicolson, G. L. 1991 Molecular mechanisms of cancer metastasis: tumor and host properties and the role of oncogenes and suppressor genes. Curr. Opin. Oncol. 3, 75-92.
Parkinson, K. & Balmain, A. 1990 Chalones revisited - a possible role for transforming growth factor B in tumour promotion. Carcinogenesis 11, 195- 198.
Rayter, S. I., Iwata, K. K., Michitsh, R. W., Sorvillo, J. M., Valenzuela, D. M. & Foulkes, J. G. 1989 In Oncogenes (ed. D. M. Glover & B. D. Hames), pp. 113-190. Oxford : IRL Press.
Rescigno, A. & DeLisi, C. 1977 Immune surveillance and neoplasia. II. A two-stage mathematical mode. Bull. Math. Biol. 39, 487-497.
Rosenberg, S. A. 1988 The development of new immuno- therapies for the treatment of cancer using interleukin-2. Ann. Surg. 208, 121-135.
Sager, R. 1989 Tumor suppressor genes : the puzzle and the promise. Science, Wash. 246, 1406-1412.
Sherratt, J. A. & Murray, J. D. 1990 Models of epidermal wound healing. Proc. R. SOG. Lond. B 241, 29-36.
Sherratt, J. A. & Murray, J. D. 1991 Mathematical analysis of a basic model for epidermal wound healing. J. math. Biol. 29, 389-404.
Sherratt, J. A. & Murray, J. D. 1992 Epidermal wound healing: a theoretical approach. Comments theor. Biol. (In the press.)
Sherratt, J. A. 1992 Cellular growth control and travelling waves of cancer. (Submitted.)
Sherratt, J. A., Sage, E. H. & Murray, J. D. 1992 Chemical control of eukaryotic cell movement: a new model. (Submitted.)
Shymko, R. M. & Glass, L. 1976 Cellular and geometric control of tissue growth and mitotic instability. J. theor. Biol. 63, 355-374.
Sikora, K. & James, N. 1991 Immune modulation and cancer. Br. med. Bull. 47, 209-226.
Sprugel, K. H., McPherson, J. M., Clowes, A. W. & Ross, R. 1987 Effects of growth factors in viva. I. Cell ingrowth into
porous subcutaneous chambers. Am. J. Path. 129,601-613. Stebbing, A. R. D. 8z Heath, G. W. 1984 Is growth
controlled by a hierarchical system? 2001. J. Linn. Sot. 80, 345-367.
Swan, G. W. 1992 The diffusion of an inhibitor in a spherical tumor. Math. Biosci. 108, 75-79.
Tarumi, K. & Schwegler, H. 1983 Oscillating spatial structures of a tissue. J. theor. Biol. 101, 373-386.
Topalian, S. L. & Rosenberg, S. A. 1990 Tumor-infiltrating lymphocytes : evidence for specific immune reactions against growing cancers in mice and humans. In Important advances in oncology (ed. V. T. DeVita, S. Hellman & S. A. Rosenberg), pp. 19-41. Philadelphia : J. B. Lippincott.
Volpe, J. 1990 Genetic stability and instability in tumours. In Molecular basis ofcancer genes (ed. M. Sluyser), pp. 9-23. Chichester : Ellis Harwood.
Weinberg, R. A. 1991 Tumour suppressor genes. Scimce, Wash. 254, 1138-I 146.
Weinberg, R. A. 1989a Oncogenes, anti-oncogenes, and the molecular bases of multistep carcinogenesis. Cancer Res. 49, 3713-3721.
Weinberg, R. A. 1989 b Growth factors and oncogenes. In Oncogenes and the molecular origins of cancer (ed. R. A. Weinberg), pp. 45-66. Cold Spring Harbor Laboratory Press.
Wheldon, T. E. 1975 Mitotic autoregulation of normal and abnormal cells: alternative mechanisms for the derange- ment of growth control. J. theor. Biol. 53, 421-433.
Wheldon, T. E. 1988 Mathematical models in cancer research. Bristol : Adam Hilger.
Xu, G., O’Connell, P., Viskochil, D., Cawthon, R., Robert- son, M., Culver, M., Dunn, D., Stevens, J., Gesteland, R., White, R. & Weiss, R. 1990 The neurofibromatosis type 1 gene encodes a protein related to GAP. Cell 62, 599-608.
Received 25 February 1992 ; accepted 12 March 1992
Proc. R. Sot. Lond. B (1992)
Vol. 24%. B . .‘y.