Embed Size (px)
Citation preview
On the Structure and Dielectric Study
of Iso- and Alio-Valent Modified BaTiO3
Ceramics
THESIS SUBMITTED TO THE NATIONAL INSTITUTE OF TECHNOLOGY,
ROURKELA, FOR THE AWARD OF THE DEGREE OF
DOCTOR OF PHILOSOPHY
IN
P H Y S I C S
By
Manas Ranjan Panigrahi
DEPARTMENT OF PHYSICS
NATIONAL INSTITUTE OF TECHNOLOGY
ROURKELA 769 008, INDIA
April 2010

C E R T I F I C A T E
This is to certify that the thesis entitled “On the structure and
dielectric study of iso- and alio-valent modified BaTiO3 ceramics”, which is
being submitted by Manas Ranjan Panigrahi for the award of the degree
of Doctor of Philosophy in Physics (Material Science) of National Institute
of Technology (NIT) Rourkela, is a record of his own research work carried
out by him. He has carried out this investigation for the last three years on
the subject matter of the thesis under my guidance at NIT Rourkela. He
has fulfilled all prescribed requirements for the thesis. The matter
embodied in the thesis has not been submitted for the award of any other
degree by him or by anybody else.
Prof. Simanchala Panigrahi
Supervisor
Department of Physics,
NIT, Rourkela-769008, India
D E C L A R A T I O N
I hereby declare that the thesis entitled “On the structure and
dielectric study of iso- and alio-valent modified BaTiO3 ceramics”, being
submitted by me to National Institute of Technology (NIT) Rourkela for the
award of the Doctoral Degree of Philosophy (Ph.D.) is an original and
authentic research work conducted by myself in the Department of
Physics, NIT, Rourkela under the supervision of Prof. (Dr) Simanchala
Panigrahi, of Department of Physics. To reiterate, no part of this thesis work
or in full form has been submitted elsewhere for a similar Degree. The
assistance and help received during the course of this investigation have
been fully acknowledged.
Manas Ranjan Panigrahi
Roll no. 50710001
Department of Physics,
National Institute of Technology, Rourkela, India
Date:

Bio-data
Name: MANAS RANJAN PANIGRAHI
Date of Birth: 22nd
June 1973
Permanent Address: AT- Bariha Garposh, P.O. - Garposh
Dist- Jharsuguda, PIN-768 224, Odisha, India
Educational Qualification: M.Sc. (Physics), Ph.D.
Research Experience: 3 years in the department of Physics, N.I.T., Rourkela.
Designation: Senior Lecturer
Organization: Department of Physics, Purushottam Institute of Engineering & Technology,
Rourkela, India.
Professional Experience: 12 years
Administrative post held: Prof. I/C Examination, Prof. I/C Academics, Prof. I/c Administration,
Warden of the Hall of residence.
Publication: (Referred journal: 10, International Conf.: 07, National Conf.: 24), 51 in total
Books: Author of two text books (in press)
Popular articles: 14 Nos.
Reviewer: Reviewer of international Journal (Materials Science and Engineering B)
Invited author: http://www.scitopics.com
Training: Data analysis fundamentals training in Spectroscopic Ellipsometry (J.A.Woollam Co.
Inc.)
Refresher Course: 5 Nos.
Summer/ winter school: 3 nos. (Sponsored by DST-SERC)
Chairing: A Session at National Seminar
(Signature)

Dedicated to the innocence
&
Simplicity of my parents
With lots of LOVE
v
Acknowledgements
As I now stand on the threshold of completing my Ph.D. dissertation, at the
outset I express my deep sense of gratitude from the core of my heart, to HIM, the
Almighty, the Omnipresent, His holiness, Lord Jagannath. Then, I would like to
acknowledge the support of my supervisor, Prof. Simanchala Panigrahi. I would like to
thank him for a project that not only interested me scientifically, but one that heavily
relied on interpersonal communications and collaborations, thus allowing me to meet so
many people here and there. I believe these interactions enhanced the development of my
scientific skills, and most importantly, enriched my personal life. He is who inspired me
to pursue the research with difficulties to learn more and more. I would like to thank him
once again to encourage me to find my own path in every situation. Finally, I’d like to
acknowledge my other committee members- Dr. B Ganguli, Dr. P Kumar and Dr. R
K Singh who have been exemplary in attendance, and support. I am especially thankful
to Dr. B C Roy for his timely response.
I am especially thankful to Dr T N Tiwari, Ex-Professor & Head, Department of
Physics, NIT Rourkela for his suggestion and critically going through the literature of the
thesis.
I would like to express my sincere gratitude to Dr. S K Sarangi Director, and Dr.
A Behera Dean (AA), National Institute of Technology (NIT) Rourkela, for their direct
and indirect help during my research work.

vi
I would like to express my sincere thanks and gratitude to Director, Purushottam
Institute of Engineering & technology, Rourkela in general and Er. R.N. Dash,
Secretary, PEWT in particular for giving me a chance to do research by sponsoring me
for higher education.
I would like to express my gratitude to Dr. S N Sahu and Dr. S N Sarangi of
Institute of Physics, Bhubaneswar for providing LCR meter facility.
I warmly thank Dr. D Behera, Dr. D K Bisoyi, Dr. S K jena, Dr. D Pradhan,
Dr. P N Biswakarma and Dr. Senthilnathan and other staffs of Department of Physics,
NIT Rourkela for their encouragement and suggestions during my research here.
I am deeply indebted to Dr. U K Mohanty, Dr. S C Mishra, and Dr. B B
Verma of Department of Metallurgical and Materials Engineering, NIT Rourkela for
providing experimental tools like XRD and SEM.
My heart felt thanks to all the research scholars of the Department for their co-
operation. I also like to thank Dr. B Mallick, who consistently encouraged me during my
research and came to meet me whenever he visited his parents. The help of Laboratory,
Library, Computer center, Administrative staffs are highly acknowledged. I am grateful
to, particularly the technical staff, namely Uday, and Rajesh, of Department of
Metallurgical and Materials Engineering, NIT Rourkela, for their regular co-operation in
experimental work.

vii
Most importantly, I acknowledge the unlimited love, encouragement, assistance,
support, affection and blessings I received from my mother, father, mother-in-law, father-
in-law, brothers, sisters, brother-in-laws, nephew, nice, family members and other
relatives. I am also highly indebted to the love, care and affection of my late grand father,
who is not here to see all this. I am really missing you BUDHA DADA. I like to record
my special thank to my wife, Madhusmita and my cute baby boy Ayush, who were a
constant source of inspiration and a good friend of mine with whom I shared all the
difficulties faced during my research periods. Thank you for your patience, love, and
support during this entire process. I look forward to the rest of my life with you who can
manage with any situation cheerfully ignoring the piercing pains. It seems such an arduous
task to thank you in this allotted space in an otherwise gigantic document, but the fact that I
produced such a document-a Ph.D. thesis!-I hope speaks volumes to my upbringing, character,
and spirit. In spite of the labels, lifetimes, and miles separating us, I hope that this thesis, a printed
document of effort and hardships, honors you all. Finally, you lift up my spirits, you shine on
my soul, whenever I’m empty, you make me feel whole. I can rely on you, to guide me
through any situation. You give me direction, You show me the way, You give me a
reason, to face every day.
So here I go...
M.R.Panigrahi
Dtd.--/--/----

viii
ABSTRACT
Keywords: Perovskite; Modified BaTiO3; Rare earth; Ball Milling; XRD; SEM; EDX;
Rietveld; Void species; Microstructure; ceramograph; Dielectric study;
Diffuse phase transition; Relaxor.
The perovskite family includes many titanates used in various electroceramic
applications, for example, electronic, electro-optical, and electromechanical applications
of ceramics. Barium titanate, having a perovskite structure, is a common ferroelectric
material with a high dielectric constant, which is widely utilized to manufacture
electronic components such as mutilayer capacitors (MLCs), PTC thermistors,
piezoelectric transducers, and a variety of electro-optical devices. Because of people’s
demands, dielectric (essentially nonconducting) characteristics of ceramic materials are
increasing rapidly. At the same time, people are attempting to reduce the size of all
communication devices as small and as light as possible. Due to this trend, high dielectric
constant materials such as barium titanate have nowadays become more and more
important in ceramic materials.
This thesis describes perovskite structure based on barium titanate composition. Oxide
perovskites (ABO3) are important electroceramics having a large area of functionalities
by virtue of their unique magnetic, dielectric, semiconducting or superconducting
properties. These properties are related to the crystal structure, microstructure, and nature
and distribution of point defects prevailing in the ceramics, which, in turn, depend on

ix
synthesis routes and processing parameters adopted. Extensive studies are reported in
literature on these aspects of ceramics. The properties are also sensitive to such factors as
atomic composition (non-stoichiometry), interfacial characteristics and chemical states as
well as distribution, spatial and depth-wise, of the constituents of the material. Non-
stoichiometry, oxygen non-stoichiometry in particular, is prevalent in perovskites.
Oxygen vacancies, apart from bringing about structural modifications, act as donors and
are responsible for the electrical conductivity of ceramics. The atomic composition in
interfacial regions of polycrystalline materials is often different from the nominal or bulk
composition. Therefore, a detailed study on these aspects of materials is desirable for a
comprehensive assessment of their properties.
This thesis presents investigations on the atomic composition and microstructural features
of barium titanate and other electronic ceramics, namely, barium calcium titanates,
barium praseodymium titanates and barium dysprosium titanates, by surface analytical
techniques. The structural investigations of the ceramics have been carried out by X-ray
diffraction, Energy Dispersive X-ray Spectroscopy (EDS) in association with scanning
electron microscopy to probe the ceramographic study along with the compositional
analysis.
Chapter I gives a brief introduction to the ceramics, their perovskite structure, their
relaxor behaviour and theoretical model to explain this concept.

x
Chapter II describes the solid-state syntheses of the ceramics and principles and methods
of different surface analytical techniques.
Chapter III deals with the structural investigation of the ceramics along 100% RI peak,
and the void species determination from the FSDP-related XRD.
Chapter IV presents studies on the Rietvelt treatment for its microstructural analysis,
generated structure, probables bond length, bond angles and generated positions of the
structure. Different atomic positions of the structure are also presented.
Chapter V describes the different ceramographs in terms of quantity and their variation
along with the compositional analysis of various elements in the ceramics and its
variation according to the different composition of the dopant elements.
Chapter VI describes the dielectric behaviour and its variation with different composition
of the Ca, Pr and Dy modified BaTiO3 ceramics. The relaxor behaviour of the ceramics is
well defined and explained in the light of existing theory.
Chapter VII dscribes the different findings in the field of structure, structure with
Rietveld refinement, ceramograph and its compositions and dielectric behaviour of
different studied ceramics. The scope for future work is also explained.

xi
Electroceramics form an important class of materials of great technical value in numerous
device applications, for instance, high-dielectric-constant capacitors, piezoelectric sonar
and ultrasonic transducers, power engineering, radio and communication, medicine and
health-care and pyroelectric security surveillance devices. The thin film technology has
further broadened the area of applications into random access memory (DRAM),
ferroelectric random access memory (FRAM), pyroelectric image arrays and other
devices. There is a growing interest in miniaturization, integrating electroceramic
functions onto conventional semiconductor chips and evolution of multifunction
components and systems. Further, nanosize effects and nanostructuring of
electroceramics hold much promise, and studies on these aspects are currently pursued
worldwide. Oxide ceramics, ABO3 perovskite type in particular, are the most extensively
used electroceramics having a variety of functionalities.

xii
LIST OF PUBLICATION
Referred journal
1. M.R. Panigrahi, S.Panigrahi, Phase formation and dielectric study of Ba1-
xCaxTiO3 ceramics, International Journal of Physics, Vol.3 No.1 pp. 11-23 (2010).
2. M.R. Panigrahi, S.Panigrahi, Void species determination of Ba1-xCaxTiO3
ceramics with FSDP- related XRD, DOI: 10.1016/j.physb.2010.04.011
3. M.R.Panigrahi, S.Panigrahi, Diffuse phase transition and dielectric study in
Ba0.95Ca 0.05TiO3 ceramic, Physica B: Condensed matter 405 2556-2559 (2010).
4. M.R.Panigrahi, S.Panigrahi, Phase transition and dielectric study in
Ba0.95Dy0.05TiO3 ceramic, accepted, (Bulletin of Material Science). 5. M.R.Panigrahi, S.Panigrahi, D. Behera, Rietveld analysis of Calcium modified
BaTiO3 ceramics, Orissa Journal of Physics Vol. 17 No.1 (2) 73-84 (2010).
6. M.R.Panigrahi, S.Panigrahi, Structural analysis of 100% relative intense peak of
Ba1-xCaxTiO3 ceramics by X-ray powder diffraction method, Physica B:
Condensed matter 405 1787-1791 (2010).
7. M.R.Panigrahi, S.Panigrahi, Microstructure study of calcium modified Barium
titanate ceramics by high energy ball milling, Physica B: Condensed Matter 404
4267-4272 (2009).
8. M.R.Panigrahi, S.Panigrahi, Ferroelectric Ceramics: Revisited, Vol. XLIV, No.
5, pp 299-304 (2010).
9. M.R. Panigrahi, T. Badapanda, S.Panigrahi, Theoretical description of ABO3
relaxor ferroelectric:A review, Indian J. Phys. 83(4) pp 467-471 (2009).
10. B.Mallick, M.R. Panigrahi, S.Panigrahi et al, Microstructural analysis of neutron
irradiation induced changes in polymer fibre studied using EPMA. Indian J. Phys.
83 (4) pp 476-479 (2009).
International Conference
1. M.R.Panigrahi, S.Panigrahi, Microstructure refinement and rietveld analysis of
Ba1-xDyxTiO3 ceramics, International Conference on Nanoscience and
Nanotechnology (ICONN 2010).
xiii
2. M.R.Panigrahi, S.Panigrahi, Structural investigation of 100% RI peak in
Dysprosium doped BaTiO3 ceramics International Conference on Nanoscience
and Nanotechnology (ICONN 2010).
3. M. R. Panigrahi, S Panigrahi, Measurement of void –species nanostructure of
modified BaTiO3 ceramics with FSDP related XRD, INDO-US workshop on
nanotechnology: Applications and implications, OP-09 November, 2009.
4. M. R. Panigrahi, S Panigrahi, Microstructure refinement and rietveld analysis of
Ba1-xPrxTiO3 ceramic, Rcent trends in Materials characterizations, EP14 – P, Feb’
2010.
5. M. R. Panigrahi, S Panigrahi, A study on the surface morphology of Dy-doped
BaTiO3 ceramics prepared by high-energy ball-milling, Rcent trends in Materials
characterizations EP1- O, Feb’ 2010.
National Conference
1. M.R.Panigrahi, S.Panigrahi, Void species determination of Ba1-xPrxTiO3
ceramics with FSDP related XRD, National seminar on Physics & Technology of
Novel Materials, 25th
-27th
Feb’2010.
2. M.R.Panigrahi, S.Panigrahi, Microstructure refinement and rietveld analysis of
Ba1-xCaxTiO3 ceramics, National Conference on High tech materials: synthesis,
characterization and applications, SL-pp-44, December 2009.
3. M.R.Panigrahi, S.Panigrahi, Structural investigation of 100% RI peak in
Praseodymium doped BaTiO3 ceramics, National Conference on High tech
materials: synthesis, characterization and applications, SL-pp-45, December 2009.
4. M. R. Panigrahi, S Panigrahi, D.Behera, R.F. Magnetron Sputtered BaTiO3 Thin
film and its optical properties, PP – S - 01, PSSI 2009.
5. M. R. Panigrahi, S Panigrahi, Synthesis and structural investigation of calcium
substituted BaTiO3 ceramics, pp-173, CMDAYS’ 09.
6. M.R.Panigrahi, S.Panigrahi, Microstructure study of praseodymium doped
barium titanate prepared by high energy ball milling, pp-202A, CMDAYS’ 09.
7. M.R.Panigrahi, S.Panigrahi, SEM analysis of Praseodymium doped Barium
titanate ceramics, pp 94-95, EMSINC-2009.

xiv
8. M.R.Panigrahi, S.Panigrahi, Atomic force microscopy and material
characterization at the atomic level- A reality, pp 65-66, EMSINC 2009.
9. M.R.Panigrahi, B.Mallick, S.Panigrahi, S. Sarangi, Structural refinement
calculations of BaTiO3 ceramics prepared by solid state reaction and wet
chemical method, P-151, pp 113, NSC-38 2009.
10. M.R.Panigrahi, T.Badapanda, S.Panigrahi, “Phase Formation and Phase
Transition Study of Ba1-xCax TiO3 Ceramics” CMDays’2007, P-23, August 2007.
Popular article
1. M.R.Panigrahi, “Green body compaction and sintering model”
http://www.scitopics.com, April 16th
2010.
2. M.R.Panigrahi, “Mathematical modeling of green-body formation, and strength”
http://www.scitopics.com, April 8th
2010.
3. M.R.Panigrahi, A Contactless Method for Dielectric Function Measurement,
Nano Digest, Vol- 1, issue-11 pp 24-27, April 2010.
4. M.R.Panigrahi, "X-ray Diffraction: The finger print of a material",
http://www.scitopics.com. March 22nd
2010.
5. M.R.Panigrahi, SAM: analyse acoustic properties of materials, Nano Digest,
Vol- 1, issue-10 pp 24-27, March 2010.
6. M.R.Panigrahi, NSOM: Optical Microscopy at the Near Field, Nano Digest,
Vol- 1, issue-9 pp 24-27, February 2010.
7. M.R.Panigrahi, AFM: A Versatile Mechanical Characterising Tool, Nano
Digest, Vol- 1, issue-8 pp 24-27, January 2010.
8. M.R.Panigrahi, STM: Impact on Surface Interface Science, Nano Digest, Vol- 1,
issue-7 pp 24-27, December 2009.
9. M.R.Panigrahi, TEM: For microstructural Characterisation, Nano Digest, Vol- 1,
issue-6 pp 24-25, November 2009.
10. M.R.Panigrahi, SEM: An aid to study topography, Nano Digest, Vol-1, issue-5,
pp 24-27, October 2009.
11. M.R.Panigrahi, XRD: Tool for structural Analysis, Nano Digest, Vol-1, issue-4,
pp 24-27, September 2009.

xv
12. M.R.Panigrahi, Scanning probe microscope: A revolution in Characterization
tehnique , Nano Digest, Vol-1, issue-3, pp 24-27, August 2009.
13. M.R.Panigrahi, Importance of nanoparticles thin film, Nano Digest, Vol-1,
issue-2, pp 24-27, July 2009.
14. M.R.Panigrahi, Getting started with Nanotech, Nano Digest, Vol-1, issue-1, pp
24-27, June 2009.
Communicated Papers
1. M.R. Panigrahi and S.Panigrahi, Dielectric study and diffuse phase transition in
Ba0.999Pr0.001TiO3 ceramic.
2. M.R. Panigrahi and S.Panigrahi, Rietveld analysis of single phase Ba0.9Ca0.1TiO3
ceramic.
3. M.R. Panigrahi and S.Panigrahi, Rietveld Analysis Of Single Phase
Ba0.998Pr0.002TiO3 Ceramics.
4. M.R. Panigrahi and S.Panigrahi, Void species determination of Ba1-xPrxTiO3
ceramics with FSDP- related XRD.
5. M.R. Panigrahi, Rietveld analysis of single phase Ba0.99Dy0.01TiO3 ceramic.
xvi
CONTENTS
Title Page No.
Acknowledgements v
Abstract viii
List of publications xii
Table of contents xvi
List of figures xxiii
List of tables’ xxxii
Nomenclature xxxiv
Acronyms xxxvii
Chapter-I 1
1. Introduction 2
1.1 Background, properties and applications of perovskites 2
1.1.1 Historical background 3
1.1.2 Properties of ordered perovskites 4
1.2 Introduction to the perovskite structure 4
1.2.1 General descriptions of perovskites structure 4
1.2.2 Crystal structure of perovskites 5
1.2.3 ABO3 perovskite ceramics 7
1.3 Ferroelectricity 8
1.3.1 Classification of ferroelectric crystals 11
1.3.2 Diffuse phase transitions (DPT) 12

xvii
1.3.3 Difference between NFEs and RFEs 15
1.3.4 Theoretical model and explanation to relaxor behavior 19
1.3.5 Theoretical description of ABO3 relaxor ferroelectric 20
1.4 Barium titanate (BaTiO3) 23
1.4.1 Structure of perovskite-barium titanate (BaTiO3) 24
1.4.2 Principles of dielectrics 25
1.4.3 Dielectric characteristics of barium titanate 27
1.4.4 Phase transitions in BaTiO3 29
1.4.5 Applications 30
1.4.5.1 Multi layer ceramic capacitors 30
1.4.5.2 Positive Temperature coefficient thermistor 32
1.4.5.3 Summary and conclusion 34
References 35
Chapter-II 39
2. Materials and methods 40
2.1Preparation methods 40
2.2 solid state reaction 40
2.2.1 Preparation of barium calcium titanate ceramics (Ba1-xCaxTiO3) 43
2.2.2 Preparation of barium praseodymium titanate ceramics (Ba1-xPrxTiO3) 43
2.2.3 Preparation of barium dysprosium titanate ceramics (Ba1-xDyxTiO3) 43
2.3 Preparation of ceramic discs 44
2.4 Sintering of the ceramics 44
2.5 Polishing 45

xviii
2.6 Ohmic contacts for electrical measurements 45
2.7 Physical methods for characterization 46
2.7.1 X-ray powder diffraction studies 46
2.7.2 Production of X-rays 46
2.7.3 Principle 48
2.7.4 Specimen preparation 49
2.7.5 Significance of diffraction peaks 50
2.7.6 Qualitative analysis 50
2.7.7 Quantitative analysis 51
2.7.8 Instrumentation 52
2.8 Scanning electron microscopy 53
2.8.1 Working principle 54
2.8.2 Secondary electrons 56
2.8.3 Backscattered electrons 57
2.8.4 Parameters of an SEM 57
2.8.5 Morphology 58
2.8.6 Compositional imaging 59
2.9 Dielectric measurement 61
References 63
Chapter-III 64
3. X-ray powder diffraction studies 65
3.1 Experimentation 65
3.1.1 Theory 65

xix
3.2 Results and discussion 68
3.2.1 Results and discussion of Ba1-xCaxTiO3 ceramics 68
3.2.1.1 Conclusion 76
3.2.2 Results and discussion of Ba1-xPrxTiO3 ceramics 77
3.2.2.1 Conclusion 83
3.2.3 Results and discussion of Ba1-x DyxTiO3 ceramics 85
3.2.3.1 Conclusion 93
3.3 FSDP related XRD studies 94
3.3.1 Void species determination of Ba1-xCaxTiO3 ceramics 94
3.3.2 Void species determination of Ba1-xPrxTiO3 ceramics 102
3.3.3 Void species determination of Ba1-xDyxTiO3 ceramics 107
3.3.3.4 Conclusion 112
References 113
Chapter-IV 114
4. Rietveld analysis 115
4.1 Introduction 115
4.1.1 Microstructure characterization by X-ray powder diffraction 116
4.1.2 Microstructure evolution by X-ray powder diffraction 116
4.1.3 Size–strain analysis 119
4.2 Results and discussion 119
4.2.1 Results and discussion of Ba1-xCaxTiO3 ceramics 119
4.2.1.1 Generated structure of Ba1-xCaxTiO3 ceramics 125
4.2.1.2 The unit cell 126

xx
4.2.1.3 The generated position of Ba1-xCaxTiO3 ceramics 127
4.2.1.4 Bond lengths of the generated structure of Ba1-xCaxTiO3 ceramics 127
4.2.1.5 Bond angles of the generated structure of Ba1-xCaxTiO3 ceramics 127
4.2.1.6 Conclusion 129
4.2.2 Results and discussion of Ba1-xPrxTiO3 ceramics 130
4.2.2.1 Generated structure of Ba1-xPrxTiO3 ceramics 134
4.2.2.2 The unit cell 135
4.2.2.3 The generated position of Ba1-xPrxTiO3 ceramics 136
4.2.2.4 Bond lengths of the generated structure of Ba1-xPrxTiO3 ceramics136
4.2.2.5 Bond angles of the generated structure of Ba1-xPrxTiO3 ceramics 136
4.2.2.6 Conclusion 138
4.2.3 Results and discussion of Ba1-xDyxTiO3 ceramics 139
4.2.3.1 Generated structure of Ba1-xDyxTiO3 ceramics 143
4.2.3.2 The unit cell 144
4.2.3.3 The generated position of Ba1-xDyxTiO3 ceramics 144
4.2.3.4 Bond lengths of the generated structure of Ba1-xDyxTiO3 ceramics 144
4.2.3.5 Bond angles of the generated Structure of Ba1-xDyxTiO3 ceramics145
4.2.3.6 Conclusion 146
References 147
Chapter-V 148
5. SEM and EDX analysis 149
5.1 Green body formation and its theory 149
5.2 SEM morphology and EDX elemental analysis 155
xxi
5.2.1 Results and discussion of Ba1-xCaxTiO3 ceramics 155
5.2.1.1 Conclusion 163
5.2.2 SEM and EDX analysis of Ba1-xPrxTiO3 ceramics 165
5.2.2.1 Results and discussion of Ba1-xPrxTiO3 ceramics 165
5.2.2.2 Conclusion 171
5.2.3 SEM and EDX analysis of Ba1-xDyxTiO3 ceramics 172
5.2.3.1 Results and discussion of Ba1-xCaxTiO3 ceramics 172
5.2.3.2 Conclusion 179
References 181
Chapter-VI 182
6. Dielectric studies of modified BaTiO3 ceramics 183
6.1 Dielectric property 183
6.2 Electric flux density 184
6.3 Dielectric measurement 185
6.4 Frequency dependence of polarization 185
6.4.1 Electronic polarization 186
6.4.2 Ionic polarization 186
6.4.3 Orientation (dipolar) polarization 187
6.4.4 Space charge polarization 187
6.5 Temperature and frequency dependence of polarization 188
6.5.1 Relaxation time 188
6.6 Dielectric studies of Ba1-xCaxTiO3 ceramics 190
xxii
6.6.1 Results and discussions 191
6.6.2 Conclusions 213
6.7 Dielectric studies of Ba1-xPrxTiO3 ceramics 214
6.7.1 Results and discussions 215
6.7.2 Conclusions 228
6.8 Dielectric studies of Ba1-xDyxTiO3 ceramics 230
6.8.1 Results and discussions (dielectric studies) 231
6.8.2 Permittivity variation in the high temperature side 236
6.8.3 Conclusions 245
References 246
Chapter-VII 249
7 Conclusion and Future Scope 250
7.1 Conclusion 250
7.2 Future Scope 255

xxiii
List of Figures
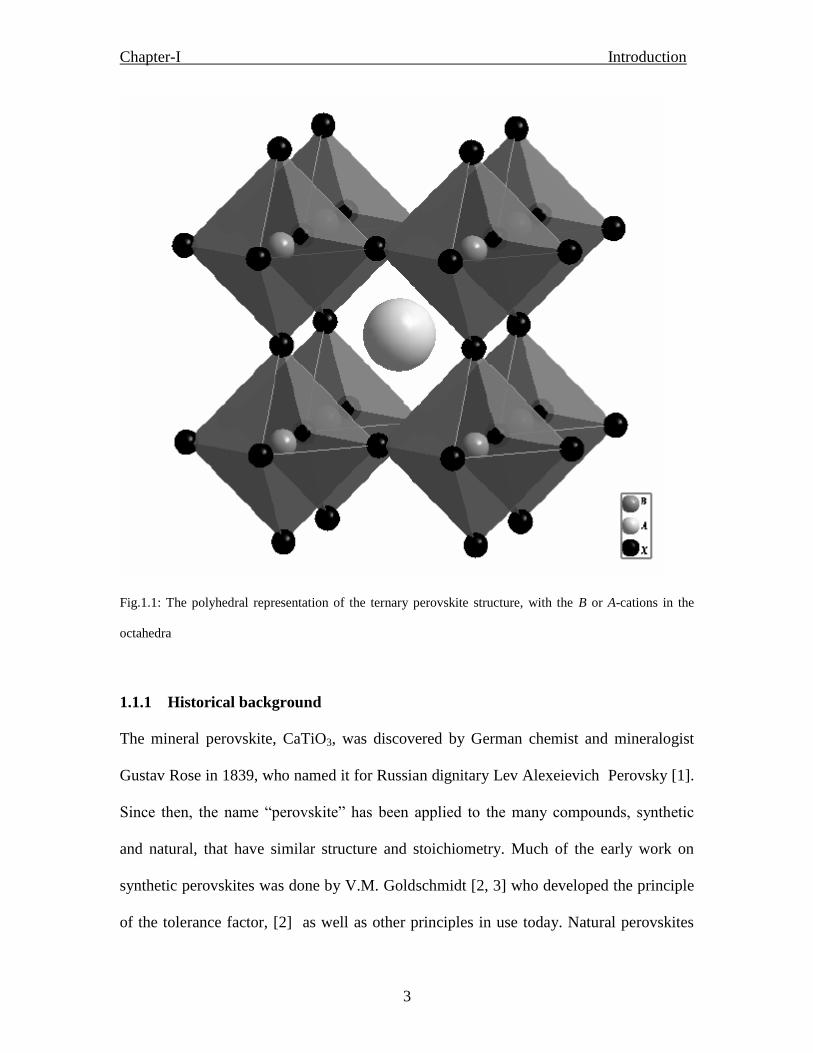
Fig. 1.1: The polyhedral representation of the ternary perovskite structure, with the B or
A-cations in the octahedra.
Fig. 1.2 The perovskite structure ABO3 : (a) B- type unit cell, (b) A-type unit cell and (c)
[BO6]8-
octahedral frame-work
Fig. 1.3 Perovskite structure (BaTiO3)
Fig. 1.4 Lattice parameters of BaTiO3 as a function of temperature
Fig. 1.5 Dielectric constants of BaTiO3 as a function of temperature
Fig. 1.6 Crystallographic changes of BaTiO3
Fig. 1.7 Schematic diagram of a multilayer ceramic capacitor construction
Fig. 1.8 Typical resistivity behaviour of BaTiO3 - type PTCR material
Fig. 1.9: Shift in Curie temperature, Tc, as a function of A-site dopant concentration
Fig.1.10 Difference between the properties of normal ferroelectrics and relaxor
ferroelectrics
Fig. 2.1 Flow chart of experimental process
Fig. 2.2 Typical arrangement of a diffractometer
Fig. 2.3 Diffraction of X-rays
Fig. 2.4 X’Pert-MPD PANalytical X-Ray Diffractometer
Fig. 2.5 A schematic representation of the scanning electron microscope
Fig. 2.6 Typical paths for high energy electrons in a solid
Fig. 2.7 Scanning Electron Microscope 6480 LV (a) SEM system and (b)EDX system
Fig. 2.8 (a) The Hewlett Packard (hp) LCR meter (b) Experimental set-up for dielectric
measurement with self fabricated oven (c)

xxiv
Fig. 3.1 X-ray diffractogram of Ba1-xCaxTiO3 ceramics
Fig. 3.2 X-ray normalized diffractogram of Ba1-xCaxTiO3 ceramics
Fig. 3.3 Composition vs. crystallite size of Ba1-xCaxTiO3 ceramics
Fig. 3.4 Composition vs. lattice strain of Ba1-xCaxTiO3 ceramics
Fig. 3.5 Composition vs. plastic strain of Ba1-xCaxTiO3 ceramics
Fig. 3.6 Composition vs. % crystallinity of Ba1-xCaxTiO3 ceramics
Fig. 3.7 Composition vs. line broadening of Ba1-xCaxTiO3 ceramics
Fig. 3.8 Composition vs. L-P factor of Ba1-xCaxTiO3 ceramics
Fig. 3.9 Composition vs. N-R function of Ba1-xCaxTiO3 ceramics
Fig. 3.10 X-ray diffractogram of Ba1-xPrxTiO3 ceramics
Fig.3.11 Normalised X-ray diffractogram of Ba1-xPrxTiO3 ceramics
Fig. 3.12 Crystallite size vs. Composition of Ba1-xPrxTiO3 ceramics
Fig. 3.13 Lattice strain vs. Composition of Ba1-xPrxTiO3 ceramics
Fig. 3.14 Plastic strain vs. Composition of Ba1-xPrxTiO3 ceramics
Fig. 3.15 %C vs. composition of Ba1-xPrxTiO3 Ceramics
Fig. 3.16 Line broadening vs. composition of Ba1-xPrxTiO3 ceramics
Fig. 3.17 L-P factor vs. composition of Ba1-xPrxTiO3 ceramics
Fig.3.18 N-R Function vs. Composition of Ba1-xPrxTiO3 Ceramics
Fig. 3.19 X-ray diffractogram of Ba1-xDyxTiO3 ceramics
Fig. 3.20 Normalised diffractogram of 100% RI Peak of Ba1-xDyxTiO3 ceramics
Fig. 3.21 Crystallite size vs. composition of Ba1-xDyxTiO3 ceramics
Fig. 3.22 Lattice strain vs. composition of Ba1-xDyxTiO3 ceramics
Fig. 3.23 Plastic strain vs. composition of Ba1-xDyxTiO3 ceramics

xxv
Fig. 3.24 % C vs. composition of Ba1-xDyxTiO3 ceramics
Fig.3.25 Line broadening vs. composition of Ba1-xDyxTiO3 ceramics
Fig. 3.26 L-P factor vs. composition of Ba1-xDyxTiO3 ceramics
Fig. 3.27 N-R function vs. composition of Ba1-xDyxTiO3 ceramics
Fig.3.28 Composition vs. correlation length of Ba1-xCaxTiO3 ceramics
Fig.3.29 Composition vs. effective periodicity of Ba1-xCaxTiO3 ceramics
Fig.3.30 Composition vs. nano void diameter of Ba1-xCaxTiO3 ceramics
Fig.3.31 Composition vs. nearest neighbour distance of Ba1-xCaxTiO3 ceramics
Fig.3.32 Composition vs. inter atomic distance of Ba1-xCaxTiO3 ceramics
Fig 3.33 Composition vs. correlation length of Ba1-xPrxTiO3 ceramics
Fig 3.34 Composition vs. effective periodicity of Ba1-xPrxTiO3 ceramics
Fig 3.35 Composition vs. nano void diameter of Ba1-xPrxTiO3 ceramics
Fig 3.36 Composition vs. inter atomic distance of Ba1-xPrxTiO3 ceramics
Fig 3.37 Composition vs. atomic diameter of Ba1-xPrxTiO3 ceramics
Fig 3.38 Composition vs. correlation length of Ba1-xDyxTiO3 ceramics
Fig 3.39 Composition vs. effective periodicity of Ba1-xDyxTiO3 ceramics
Fig 3.40 Composition vs. nano void diameter of Ba1-xDyxTiO3 ceramics
Fig 3.41 Composition vs. inter atomic distance of Ba1-xDyxTiO3 ceramics
Fig 3.42 Composition vs. atomic diameter of Ba1-xDyxTiO3 ceramics
Fig. 4.1 (a) Refined structure of Ba1-xCaxTiO3 ceramics for x=0.0
Fig. 4.1 (b) Refined structure of Ba1-xCaxTiO3 ceramics for x=0.05
Fig. 4.1 (c) Refined structure of Ba1-xCaxTiO3 ceramics for x=0.1
Fig. 4.1 (d) Refined structure of Ba1-xCaxTiO3 ceramics for x=0.2

xxvi
Fig. 4.1 (e) Refined structure of Ba1-xCaxTiO3 ceramics for x=0.25
Fig. 4.1 (f) Refined structure of Ba1-xCaxTiO3 ceramics for x=0.3
Fig. 4.1 (g) Refined structure of Ba1-xCaxTiO3 ceramics for x=0.4
Fig. 4.1 (h) Refined structure of Ba1-xCaxTiO3 ceramics for x=0.5
Fig. 4.2 Generated Structure of Ba1-xCaxTiO3 ceramics
Fig.4.3 Unit cell of the generated structure of Ba1-xCaxTiO3 ceramics
Fig. 4.4 (a) Refined structure of Ba1-xPrxTiO3 ceramics for x=0.001
Fig.4.4 (b) Refined structure of Ba1-xPrxTiO3 ceramics for x=0.002
Fig. 4.4 (c) Refined structure of Ba1-xPrxTiO3 ceramics for x=0.003
Fig. 4.4 (d) Refined structure of Ba1-xPrxTiO3 ceramics for x=0.004
Fig 4.5 r.m.s. strain vs. composition of Ba1-xPrxTiO3 ceramics
Fig 4.6 Crystallite vs. composition of Ba1-xPrxTiO3 ceramics
Fig 4.7 Composition vs. lattice parameters of Ba1-xPrxTiO3 ceramics
Fig 4.8 Generated structure of Ba1-xPrxTiO3 ceramics
Fig 4.9 Unit cell of Ba1-xPrxTiO3 ceramics
Fig. 4.10 (a) Refined structure of Ba1-xDyxTiO3 ceramics for x=0.01
Fig. 4.10 (b) Refined structure of Ba1-xDyxTiO3 ceramics for x=0.025
Fig. 4.10 (c) Refined structure of Ba1-xDyxTiO3 ceramics for x=0.05
Fig. 4.10 (d) Refined structure of Ba1-xDyxTiO3 ceramics for x=0.075
Fig. 4.11 Generated structure of Ba1-xDyxTiO3 ceramics
Fig.4.12 Unit cell of the generated structure of Ba1-xDyxTiO3 ceramics
Fig. 5.1 Microstructure of Ba1-xCaxTiO3 ceramics for (a) x=0, (b) x=0.05, (c) x= 0.1, (d)
x=0.2, (e) x=0.25, (f) x=0.3, (g) x=0.4 and (h) x=0.5.

xxvii
Fig. 5.2 EDX spectra of Ba1-xCaxTiO3 ceramics for (a) x=0, (b) x=0.05, (c) x= 0.1, (d)
x=0.2, (e) x=0.25, (f) x=0.3, (g) x=0.4 and (h) x=0.5
Fig. 5.3 Composition vs. grain size
Fig. 5.4 Composition vs. shape factor
Fig. 5.5 Composition vs. share %
Fig.5.6 Composition vs. weight %
Fig.5.7 Microstructure of Pr-doped BaTiO3 ceramics, (a)0%Pr, (b) 0.1% Pr, (c) 0.2% Pr,
(d) 0.3%Pr and (e)0.4%Pr.
Fig. 5.8 Compositional analysis of Pr-doped BaTiO3 ceramics, (a) 0% Pr, (b) 0.1% Pr, (c)
0.2% Pr, (d) 0.3%Pr and (e) 0.4%Pr
Fig 5.9 Composition vs. grain size of Ba1-xPrxTiO3 ceramics
Fig 5.10 Composition vs. shape factor of Ba1-xPrxTiO3 ceramics
Fig.5.11 Composition vs. Wt % of Ba1-xPrxTiO3 ceramics
Fig.5.12 Microstructure of Dy-doped BaTiO3 ceramics, (a)0 % Dy, (b) 0.01% Dy, (c)
0.025% Dy, (d) 0.05% Dy and (e)0.075% Dy
Fig.5.13 Compositional analysis of Dy-doped BaTiO3 ceramics, (a)0 % Dy, (b) 0.01%
Dy, (c) 0.025% Dy, (d) 0.05% Dy and (e)0.075% Dy
Fig. 5.14 Composition vs. grain size of Ba1-x DyxTiO3 ceramics
Fig. 5.15 Composition vs. shape factor of Ba1-x DyxTiO3 ceramics
Fig. 5.16 Composition vs. Wt % of various elements of Ba1-x DyxTiO3 ceramics
Fig. 6.1 Frequency dependence of the polarization processes
Fig. 6.2 (a) Temperature dependent dielectric constant of Ba1-xCaxTiO3 ceramics for x=0
Fig.6.2 (b) Temperature dependent dielectric constant of Ba1-xCaxTiO3 ceramics for
x=0.05
Fig. 6.2 (c) Temperature dependent dielectric constant of Ba1-xCaxTiO3 ceramics for x=0.1
Fig.6.2 (d) Temperature dependent dielectric constant of Ba1-xCaxTiO3 ceramics forx=0.2

xxviii
Fig.6.2 (e) Temperature dependent dielectric constant of Ba1-xCaxTiO3 ceramics for x=0.25
Fig.6.2 (f) Temperature dependent dielectric constant of Ba1-xCaxTiO3 ceramics for x=0.3
Fig.6.2(g) Temperature dependent dielectric constant of Ba1-xCaxTiO3 ceramics for x=0.4
Fig.6.2(h) Temperature dependent dielectric constant of Ba1-xCaxTiO3 ceramics for x=0.5
Fig.6.3 (a) Temperature dependent dielectric loss of Ba1-xCaxTiO3 ceramics for x=0.0
Fig.6.3 (b) Temperature dependent dielectric loss of Ba1-xCaxTiO3 ceramics for x=0.05
Fig.6.3 (c) Temperature dependent dielectric loss of Ba1-xCaxTiO3 ceramics for x=0.1
Fig.6.3 (d) Temperature dependent dielectric loss of Ba1-xCaxTiO3 ceramics for x=0.2
Fig.6.3 (e) Temperature dependent dielectric loss of Ba1-xCaxTiO3 ceramics for x=0.25
Fig.6.3 (f) Temperature dependent dielectric loss of Ba1-xCaxTiO3 ceramics for x=0.3
Fig.6.3 (g) Temperature dependent dielectric loss of Ba1-xCaxTiO3 ceramics for x=0.4
Fig.6.3 (h) Temperature dependent dielectric loss of Ba1-xCaxTiO3 ceramics for x=0.5
Fig.6.4 (a) Temperature dependency 1/ ε’ of Ba1-xCaxTiO3 ceramics for x=0
Fig.6.4 (b) Temperature dependency 1/ ε’ of Ba1-xCaxTiO3 ceramics for x=0.05
Fig. 6.4 (c) Temperature dependency 1/ ε’ of Ba1-xCaxTiO3 ceramics for x=0.1
Fig. 6.4 (d) Temperature dependency 1/ ε’ of Ba1-xCaxTiO3 ceramics for x=0.2
Fig. 6.4 (e) Temperature dependency 1/ ε’ of Ba1-xCaxTiO3 ceramics for x=0.25
Fig. 6.4 (f.) Temperature dependency 1/ ε’ of Ba1-xCaxTiO3 ceramics for x=0. 3
Fig.6.4 (g) Temperature dependency 1/ ε’ of Ba1-xCaxTiO3 ceramics for x=0.4
Fig. 6.4 (h) Temperature dependency 1/ ε’ of Ba1-xCaxTiO3 ceramics for x=0.5
Fig. 6.5 log (1/ε’ – 1/εm) vs. log (T-Tm) at 10 kHz
Fig. 6.6 (a) Reduced dielectric constant (m
'
) vs. Reduced Temperature ( ) at different
frequencies for x = 0
xxix
Fig. 6.6 (b) Reduced dielectric constant (m
'
) vs. Reduced Temperature ( ) at different
frequencies for x = 0.05
Fig. 6.6 (c) Reduced dielectric constant (m
'
) vs. Reduced Temperature ( ) at different
frequencies for x = 0.1
Fig. 6.6 (d) Reduced dielectric constant (m
'
) vs. Reduced Temperature ( ) at different
frequencies for x = 0.2
Fig. 6.6 (e) Reduced dielectric constant (m
'
) vs. Reduced Temperature ( ) at different
frequencies for x = 0.25
Fig. 6.6 (f) Reduced dielectric constant (m
'
) vs. Reduced Temperature ( ) at different
frequencies for x = 0.3
Fig. 6.6 (g) Reduced dielectric constant (m
'
) vs. Reduced Temperature ( ) at different
frequencies for x = 0.4
Fig. 6.6 (h) Reduced dielectric constant (m
'
) vs. Reduced Temperature ( ) at different
frequencies for x = 0.5
Fig. 6.7 1000/T vs. ln f of BCT ceramics for vogel fulcher’s relation
Fig. 6.8(a) Temperature dependent dielectric constant of Ba1-xPrxTiO3 ceramics for
x=0.001
Fig. 6.8(b) Temperature dependent dielectric constant of Ba1-xPrxTiO3 ceramics for
x=0.002
Fig. 6.8(c) Temperature dependent dielectric constant of Ba1-xPrxTiO3 ceramics for
x=0.003
Fig. 6.8(d) Temperature dependent dielectric constant of Ba1-xPrxTiO3 ceramics for
x=0.004
Fig. 6.9 (a) Temperature dependent dielectric loss of Ba1-xPrxTiO3 ceramics for x=0.001
Fig. 6.9(b) Temperature dependent dielectric loss of Ba1-xPrxTiO3 ceramics for x=0.002
Fig. 6.9(c) Temperature dependent dielectric loss of Ba1-xPrxTiO3 ceramics for x=0.003
Fig. 6.9(d) Temperature dependent dielectric loss of Ba1-xPrxTiO3 ceramics for x=0.004

xxx
Fig.6.10 (a) Temperature dependency 1/ ε’ of Ba1-xPrxTiO3 ceramics for x=0.001
Fig.6.10 (b) Temperature dependency 1/ ε’ of Ba1-xPrxTiO3 ceramics for x=0.002
Fig.6.10 (c) Temperature dependency 1/ ε’ of Ba1-xPrxTiO3 ceramics for x=0.003
Fig.6.10 (d) Temperature dependency 1/ ε’ of Ba1-xPrxTiO3 ceramics for x=0.004
Fig.6.11 Plot of ln(1/ε−1/εm) vs. ln(T−Tm) of Ba1-xPrxTiO3 ceramics
Fig. 6.12 (a) Reduced dielectric constant (
'
m
) vs. reduced temperature ( ) at different
frequencies for x = 0.001
Fig. 6.12 (b) Reduced dielectric constant ( m
'
) vs. reduced temperature ( ) at different
frequencies for x = 0.002
Fig. 6.12 (c) Reduced dielectric constant ( m
'
) vs. reduced temperature ( ) at different
frequencies for x = 0.003
Fig. 6.12 (d) Reduced dielectric constant ( m
'
) vs. reduced temperature ( ) at different
frequencies for x = 0.004
Fig. 6.13 1000/T vs. ln f for BPT ceramics for Vogel Fulcher’s relation.
Fig. 6.14 (a) Temperature dependent dielectric constant of Ba1-xDyxTiO3 ceramics for
x=0.01
Fig. 6.14 (b) Temperature dependent dielectric constant of Ba1-xDyxTiO3 ceramics for
x=0.025
Fig. 6.14 (c) Temperature dependent dielectric constant of Ba1-xDyxTiO3 ceramics for
x=0.05
Fig. 6.14 (d) Temperature dependent dielectric constant of Ba1-xDyxTiO3 ceramics for
x=0.075
Fig. 6.15 (a) Temperature dependent dielectric loss of Ba1-xDyxTiO3 ceramics for x=0.01
Fig. 6.15(b) Temperature dependent dielectric loss of Ba1-xDyxTiO3 ceramics for x=0.025
Fig. 6.15 (c) Temperature dependent dielectric loss of Ba1-xDyxTiO3 ceramics for x=0.05
Fig.6.15 (d) Temperature dependent dielectric loss of Ba1-xDyxTiO3 ceramics for x=0.075
xxxi
Fig.6.16 (a) Temperature dependency 1/ ε’ of Ba1-xDyxTiO3 ceramics for x=0.01
Fig.6.16 (b) Temperature dependency 1/ ε’ of Ba1-xDyxTiO3 ceramics for x=0.025
Fig.6.16 (c) Temperature dependency 1/ ε’ of Ba1-xDyxTiO3 ceramics for x=0.05
Fig.6.16 (d) Temperature dependency 1/ ε’ of Ba1-xDyxTiO3 ceramics for x=0.075
Fig.6.17 Plot of ln(1/ε−1/εm) vs. ln(T−Tm) of Ba1-xDyxTiO3 ceramics
Fig. 6.18 (a) Reduced dielectric constant ( m
'
) vs. reduced temperature ( ) at different
frequencies for x = 0.01
Fig. 6.18 (b) Reduced dielectric constant ( m
'
) vs. reduced temperature ( ) at different
frequencies for x = 0.025
Fig. 6.18(c) Reduced dielectric constant ( m
'
) vs. reduced temperature ( ) at different
frequencies for x = 0.05
Fig. 6.18 (d) Reduced dielectric constant ( m
'
) vs. reduced temperature ( ) at different
frequencies for x = 0.075
Fig. 6.19 Frequency dependence of Tm for Ba0.95Dy0.05TiO3 ceramic. The symbols and
solid line indicate data points and fit to Vogel–Fulcher’s relationship,
respectively
xxxii
List of Tables
Table-1.1 Classification of the PTCR applications
Table-1.2 Classification of crystal point group
Table-1.3 Difference between the properties of normal ferroelectrics and relaxor
ferroelectrics of perovskite type
Table- 3.1 X-ray powder diffraction data of Ba1-xCaxTiO3 ceramics
Table -3.2 X-ray powder diffraction data of Ba1-xPrxTiO3 ceramics
Table-3.3 X-ray powder diffraction data of Ba1-x DyxTiO3 ceramics
Table-3.4 Nano-void species of calcium-modified BaTiO3 ( Ba1-xCaxTiO3 ceramics)
Table-3.5 Nano-void species of praseodymium-modified BaTiO3 (Ba1-xPrxTiO3
ceramics)
Table-3.6 Nano-void species of dysprosium-modified BaTiO3 (Ba1-x DyxTiO3 ceramics)
Table-4.1 Figure of Merit for Ba1-xCaxTiO3 ceramics
Table-4.2 The generated position of Ba1-xCaxTiO3 ceramics
Table-4.3 Bond lengths of the generated structure of Ba1-xCaxTiO3 ceramics
Table-4.4 Bond angles of the generated structure of Ba1-xCaxTiO3 ceramics
Table- 4.5 Figure of merit for Ba1-xPrxTiO3 ceramics
Table- 4.6 Generated positions of Ba1-xPrxTiO3 ceramics
Table- 4.7 Bond lengths of the generated structure of Ba1-xPrxTiO3 ceramics
Table-4.8 Bond angles of the generated structure of Ba1-xPrxTiO3 ceramics
Table-4.9 Figure of merit for Ba1-xDyxTiO3 ceramics
Table-4.10 Generated positions of Ba1-xDyxTiO3 ceramics
Table-4.11 Bond lengths of Ba1-xDyxTiO3 ceramics

xxxiii
Table-4.12 Bond angles of Ba1-xDyxTiO3 ceramics
Table-5.1 Microstructure analysis data of Ba1-xCaxTiO3 ceramics
Table-5.2: Elemental analysis of Ba1-xCaxTiO3 ceramics
Table -5.3 Ceramographic analysis of Pr-doped BaTiO3 ceramics
Table -5.4 Elemental analysis of Pr-doped BaTiO3 ceramics
Table-5.5 Microstructure analysis of Ba1-x DyxTiO3 ceramics
Table -5.6 Elemental analysis of Ba1-xDyxTiO3 ceramics
Table-6.1: Parameters obtained from temperature dependency dielectric study on the
composition Ba1-xCaxTiO3 at 1 kHz
Table-6.2: Parameters obtained from temperature dependency dielectric study on the
composition Ba1-xPrxTiO3 at 1 kHz
Table-6.3: Parameters obtained from temperature dependency dielectric study on the
composition Ba1-xDyxTiO3 at 1 kHz

xxxiv
Nomenclature
Tc = Curie temperature
Tm = Temperature at maximum dielectric permittivity
' = Dielectric permittivity
'' = Dielectric loss
ε m = Dielectric permittivity maximum
ε 0 = Dielectric permittivity of free space
δ = Loss angle
γ = Order of dielectric measure
t = Tolerance factor
RA = Radius of A cation in ABO3 perovskite
RB = Radius of B cation in ABO3 perovskite
RO = Radius of O2-
cation in ABO3 perovskite
R = Effective periodicity
L = Correlation length
S = Magnitude of scattering vector
E = Ehrnfest number
D = Nano-void diameter
r = Interatomic distance
Dhkl = Crystallite size
hkl = Miller indices
a, b, c = Lattice parameters
xxxv
I = Intensity
F = The structure Factor
m = Multiplicity
A(θ) = The absorption factor
e-2M
= The temperature factor
β = FWHM
λ = Wavelength
θhkl = Bragg angle
RI = Relative intensity
= The resolution of diffractometer
WR = The receiving slit width
RG = The radius of goniometer
K = Shape factor
A cryst = Sum of the areas of the crystalline peaks
A total = The total area of the diffraction pattern
e = Plastic strain
β = Line broadening
AU = Arbitrary units
ε = Lattice strain
p = Dipole moment
P = Polarization vector
χ = Dielectric succeptibility
D = Displacement vector
xxxvi
C = Capacity of the capacitor
Pe = Electronic polarization
Pi = Ionic polarization
Po = Orientation or dipolar polarization
Ps = Space charge polarization

xxxvii
Acronyms
ASTM: American Society for Testing Materials
BSE: Back scattered electrons
BT: Barium titanate
CFEs: Classical ferroelectrics
CMR: Colossal magneto-resistence
CRT: Cathode ray tube
DPT: Diffuse phase transition
DRAM: Dielectric random access memory
EDX: Energy dispersive X-rays
FDPT: Ferroelectric diffuse phase transition
FRAM: Ferroelectric random access memory
FSDP: First sharp diffraction peak
FWHM: Full width at half maximum
JCPDS-ICDD: Joint committee for powder diffraction standards – International centre for
diffraction data
L-P: Lorentz-Polarization Factor
LSS: Low S structure
MLCs: Multilayer ceramic capacitors
N-R: Nelson – Riley function
NVD: Nano void diameter
PTCR: Positive temperature coefficient resistor

xxxviii
PVA: Polyvinyl alcohol
RFEs: Relaxor ferroelectrics
SE: Secondary electrons
SEM: Scanning electron microscope
SOFC: Solid-oxide fuel cell
XRD: X-ray diffraction

INTRODUCTION
Introduction
Chapter-I

Chapter-I Introduction
2
1.1 Background, properties and applications of perovskites
The perovskite structure has shown great flexibility of composition, incorporating nearly
every member of the periodic table. The basic perovskite framework (see Fig. 1.1), a 3-
dimensional array of corner-sharing octahedra, is also the basis for related structures,
known collectively as layered perovskites, which include two-dimensional layers of
corner-sharing octahedra separated by layers of cations. The perovskite and layered
perovskite structures can incorporate ions of a variety of sizes and charges, as this
framework is flexible, allowing for subtle distortions that ease the bond strains created by
size mismatch. However, the perovskite structure does compete with other structures of
similar stoichiometry, particularly the defect pyrochlore structure. Perovskites and
layered perovskites are of great interest for the wide variety of useful properties that they
exhibit. Each of these properties is influenced by the structure, as subtle changes alter
symmetry considerations, bond overlap, and band energy levels. Understanding and
predicting the structure of these compounds is essential for the intelligent design of new
and useful materials.
Chapter-I Introduction
3
Fig.1.1: The polyhedral representation of the ternary perovskite structure, with the B or A-cations in the
octahedra
1.1.1 Historical background
The mineral perovskite, CaTiO3, was discovered by German chemist and mineralogist
Gustav Rose in 1839, who named it for Russian dignitary Lev Alexeievich Perovsky [1].
Since then, the name “perovskite” has been applied to the many compounds, synthetic
and natural, that have similar structure and stoichiometry. Much of the early work on
synthetic perovskites was done by V.M. Goldschmidt [2, 3] who developed the principle
of the tolerance factor, [2] as well as other principles in use today. Natural perovskites

Chapter-I Introduction
4
make up much of the Earth‟s mantle (50-90%) in the form of MgSiO3. The dense packing
of the perovskite structure makes it ideal for high-pressure environments like this. It is
believed to be the most abundant mineral within the Earth. The perovskite structure is
also a part of many materials whose properties make them useful in industry, from
ferroelectric behavior to superconductivity and colossal magnetoresistance. The
properties of different types of perovskites and perovskite-like structures are discussed
below.
1.1.2 Properties of ordered perovskites
Ordered perovskites are of great interest due to the flexibility that they introduce into the
composition. Having multiple cations at a particular site allows for ions of greater or
lesser oxidation state to be incorporated. Ordering of these cations affects the symmetry
of the structure, and further, the bulk properties of the material. One of the most
interesting perovskites is BaTiO3, whose ferroelectric nature has gained it attention as a
high-κ dielectric. Substitutions at both the A- and B-sites have been made in an attempt to
make these materials more technologically useful. There is a peak in the dielectric
constant at a resonant frequency, and the dielectric constant also tends to be variable with
temperature. It has been found that ordering of the cations affects the dielectric loss of a
material, as well as the smoothness of the phase transition with temperature [4, 5]. For
these reasons, perovskites have been explored as possible dielectric relaxors [6, 7].
1.2 Introduction to the perovskite structure
1.2.1 General descriptions of perovskites structure
Chapter-I Introduction
5
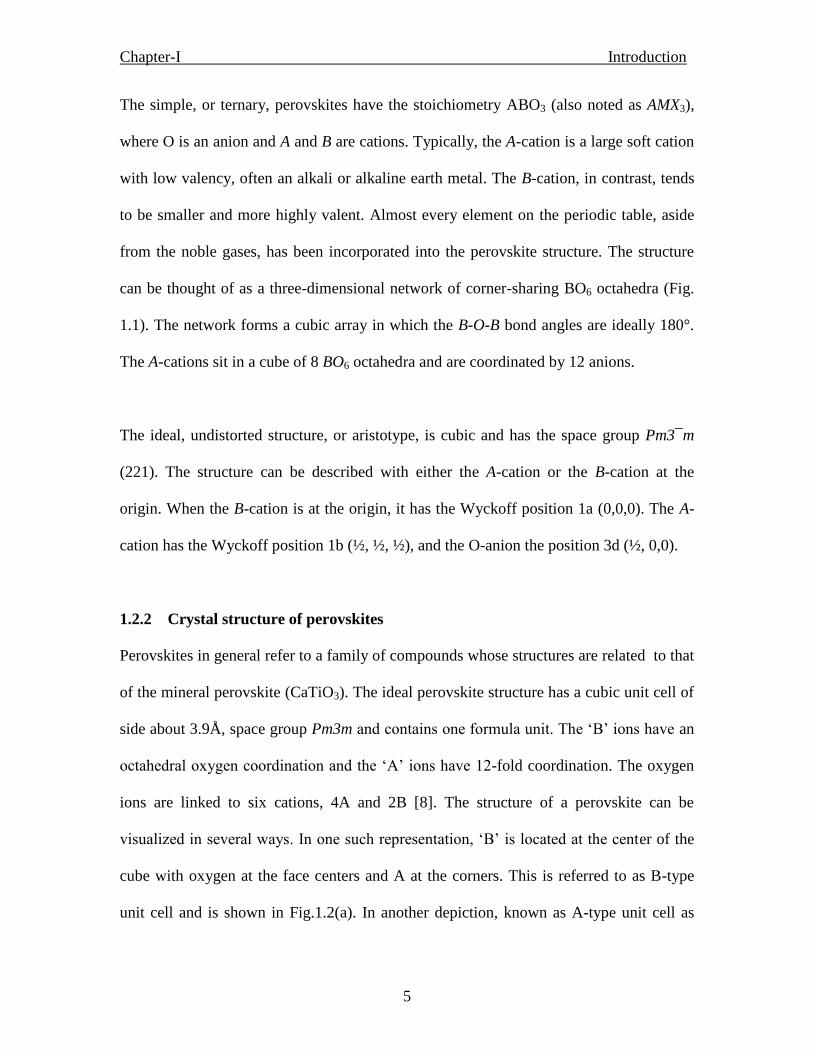
The simple, or ternary, perovskites have the stoichiometry ABO3 (also noted as AMX3),
where O is an anion and A and B are cations. Typically, the A-cation is a large soft cation
with low valency, often an alkali or alkaline earth metal. The B-cation, in contrast, tends
to be smaller and more highly valent. Almost every element on the periodic table, aside
from the noble gases, has been incorporated into the perovskite structure. The structure
can be thought of as a three-dimensional network of corner-sharing BO6 octahedra (Fig.
1.1). The network forms a cubic array in which the B-O-B bond angles are ideally 180°.
The A-cations sit in a cube of 8 BO6 octahedra and are coordinated by 12 anions.
The ideal, undistorted structure, or aristotype, is cubic and has the space group Pm3¯m
(221). The structure can be described with either the A-cation or the B-cation at the
origin. When the B-cation is at the origin, it has the Wyckoff position 1a (0,0,0). The A-
cation has the Wyckoff position 1b (½, ½, ½), and the O-anion the position 3d (½, 0,0).
1.2.2 Crystal structure of perovskites
Perovskites in general refer to a family of compounds whose structures are related to that
of the mineral perovskite (CaTiO3). The ideal perovskite structure has a cubic unit cell of
side about 3.9Å, space group Pm3m and contains one formula unit. The „B‟ ions have an
octahedral oxygen coordination and the „A‟ ions have 12-fold coordination. The oxygen
ions are linked to six cations, 4A and 2B [8]. The structure of a perovskite can be
visualized in several ways. In one such representation, „B‟ is located at the center of the
cube with oxygen at the face centers and A at the corners. This is referred to as B-type
unit cell and is shown in Fig.1.2(a). In another depiction, known as A-type unit cell as

Chapter-I Introduction
6
shown in Fig.1.2(b), „A‟ is located at the center of the cube, oxygen at the middle of cube
edges and B at the corners. The most useful approach is to consider it to be a framework
of corner-shared [BO6]8−
octahedra, forming dodecahedral void in which A cations are
situated [Fig.1.2(c)]. The dimensions of the framework are determined by the B−O
distance which requires cell edge, a0 = 2(RB + RO). This determines the size of the
dodecahedral void, which in turn controls the permissible size of the „A‟. If the relative
sizes of A, B and O are appropriate, an ideal perovskite, for example SrTiO3, results;
otherwise distortion occurs leading to the formation of such related structures as
tetragonal, rhombohedral, orthorhombic, monoclinic or triclinic.
Figure 1.2: The perovskite structure ABO3 : (a) B- type unit cell, (b) A-type unit cell and (c) [BO6]8-
octahedral frame work [13, 15]

Chapter-I Introduction
7
1.2.3 ABO3 perovskite ceramics
Electroceramics form an important class of materials of great technical value in numerous
device applications, for instance, high-dielectric constant capacitors, piezoelectric sonar
and ultrasonic transducers, power engineering, radio and communication, medicine and
health-care and pyroelectric security surveillance devices [9, 10]. The thin film
technology has further broadened the area of application into random access memory
(DRAM), ferroelectric random access memory (FRAM), pyroelectric image arrays and
other devices [11-13]. There is growing interest in miniaturization, integrating
electroceramic functions onto conventional semiconductor chips and evolution of
multifunction components and systems. Further, nanosize effects and nanostructuring of
electroceramics hold much promise and studies on these aspects are currently pursued
worldwide [9].
Oxide ceramics, ABO3 perovskite type in particular, are the most extensively used
electroceramics having a variety of functionalities. No other class of materials exhibits
such a wide range of properties (dielectrics, ferroelectricity, piezoelectricity, semi-and
superconductivity, ferro-and anti-ferromagnetism, colossal magnetoresistance (CMR),
etc.), which can be exploited for electronic applications [10]. ABO3-type oxides are
known to stabilize with a wide range of A (Ca, Ba, Sr, Mg) and B (Ti, Mn, Zr, Sn) ions
with „A‟ having larger ionic radius than that of „B‟. These oxides exist in structurally
different forms, which are broadly classified into perovskite and ilmenite on the basis of
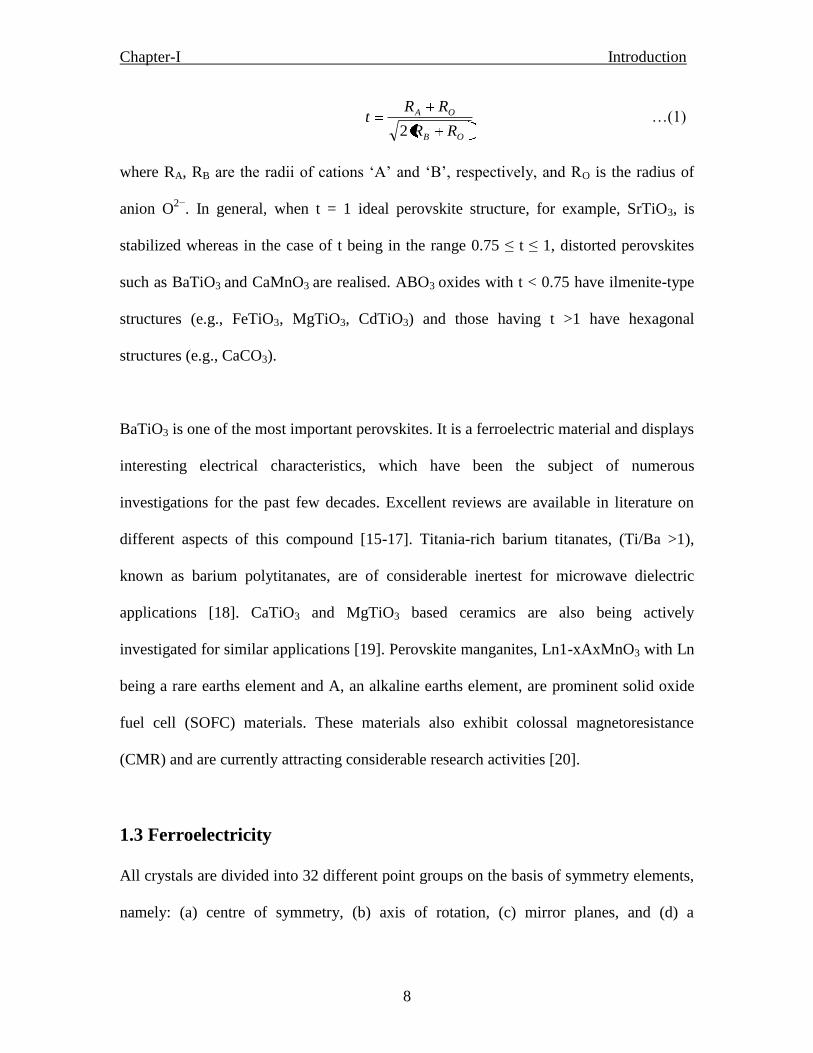
tolerance factor, t, defined by Goldschmidt [14] as
Chapter-I Introduction
8
OB
OA
RR
RRt
2 …(1)
where RA, RB are the radii of cations „A‟ and „B‟, respectively, and RO is the radius of
anion O2−
. In general, when t = 1 ideal perovskite structure, for example, SrTiO3, is
stabilized whereas in the case of t being in the range 0.75 ≤ t ≤ 1, distorted perovskites
such as BaTiO3 and CaMnO3 are realised. ABO3 oxides with t < 0.75 have ilmenite-type
structures (e.g., FeTiO3, MgTiO3, CdTiO3) and those having t >1 have hexagonal
structures (e.g., CaCO3).
BaTiO3 is one of the most important perovskites. It is a ferroelectric material and displays
interesting electrical characteristics, which have been the subject of numerous
investigations for the past few decades. Excellent reviews are available in literature on
different aspects of this compound [15-17]. Titania-rich barium titanates, (Ti/Ba >1),
known as barium polytitanates, are of considerable inertest for microwave dielectric
applications [18]. CaTiO3 and MgTiO3 based ceramics are also being actively
investigated for similar applications [19]. Perovskite manganites, Ln1-xAxMnO3 with Ln
being a rare earths element and A, an alkaline earths element, are prominent solid oxide
fuel cell (SOFC) materials. These materials also exhibit colossal magnetoresistance
(CMR) and are currently attracting considerable research activities [20].
1.3 Ferroelectricity
All crystals are divided into 32 different point groups on the basis of symmetry elements,
namely: (a) centre of symmetry, (b) axis of rotation, (c) mirror planes, and (d) a
Chapter-I Introduction
9
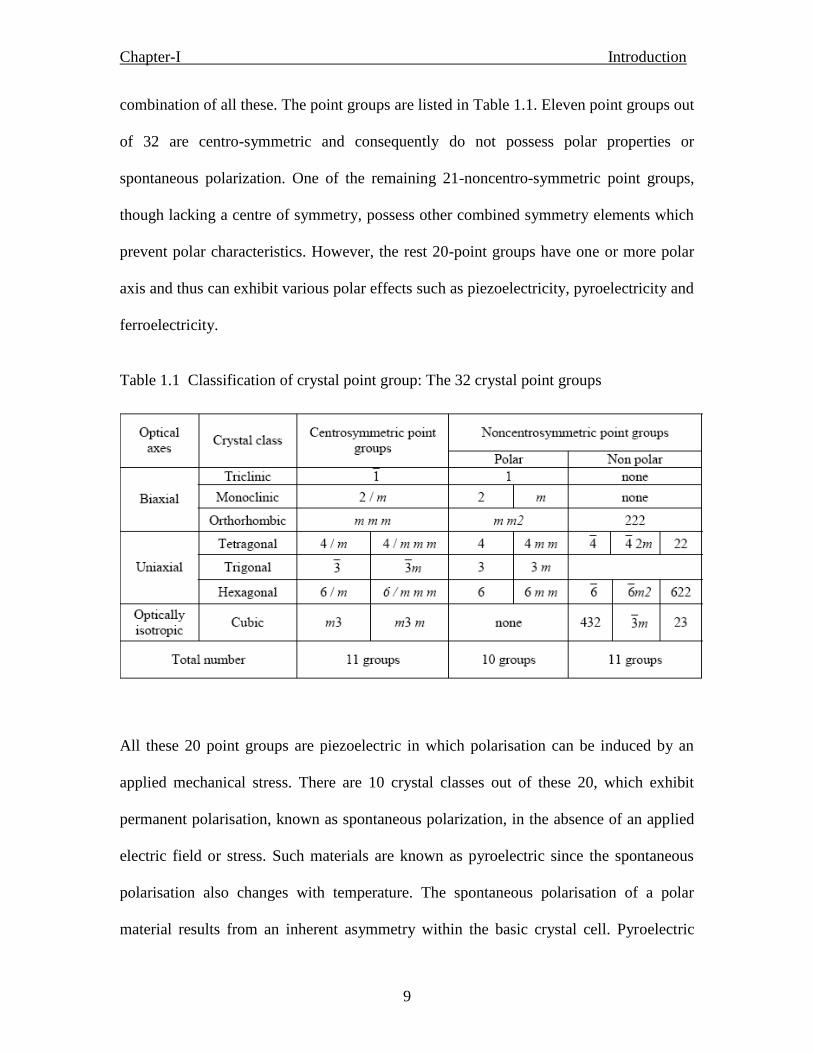
combination of all these. The point groups are listed in Table 1.1. Eleven point groups out
of 32 are centro-symmetric and consequently do not possess polar properties or
spontaneous polarization. One of the remaining 21-noncentro-symmetric point groups,
though lacking a centre of symmetry, possess other combined symmetry elements which
prevent polar characteristics. However, the rest 20-point groups have one or more polar
axis and thus can exhibit various polar effects such as piezoelectricity, pyroelectricity and
ferroelectricity.
Table 1.1 Classification of crystal point group: The 32 crystal point groups
All these 20 point groups are piezoelectric in which polarisation can be induced by an
applied mechanical stress. There are 10 crystal classes out of these 20, which exhibit
permanent polarisation, known as spontaneous polarization, in the absence of an applied
electric field or stress. Such materials are known as pyroelectric since the spontaneous
polarisation also changes with temperature. The spontaneous polarisation of a polar
material results from an inherent asymmetry within the basic crystal cell. Pyroelectric
Chapter-I Introduction
10
materials whose direction of spontaneous polarisation can be changed by an applied
electric field are known as ferroelectrics. Therefore two, conditions necessary in a
material to classify it as ferroelectrics are: (i) the existence of spontaneous polarization,
and (ii) a demonstrated reorientation of polarization.
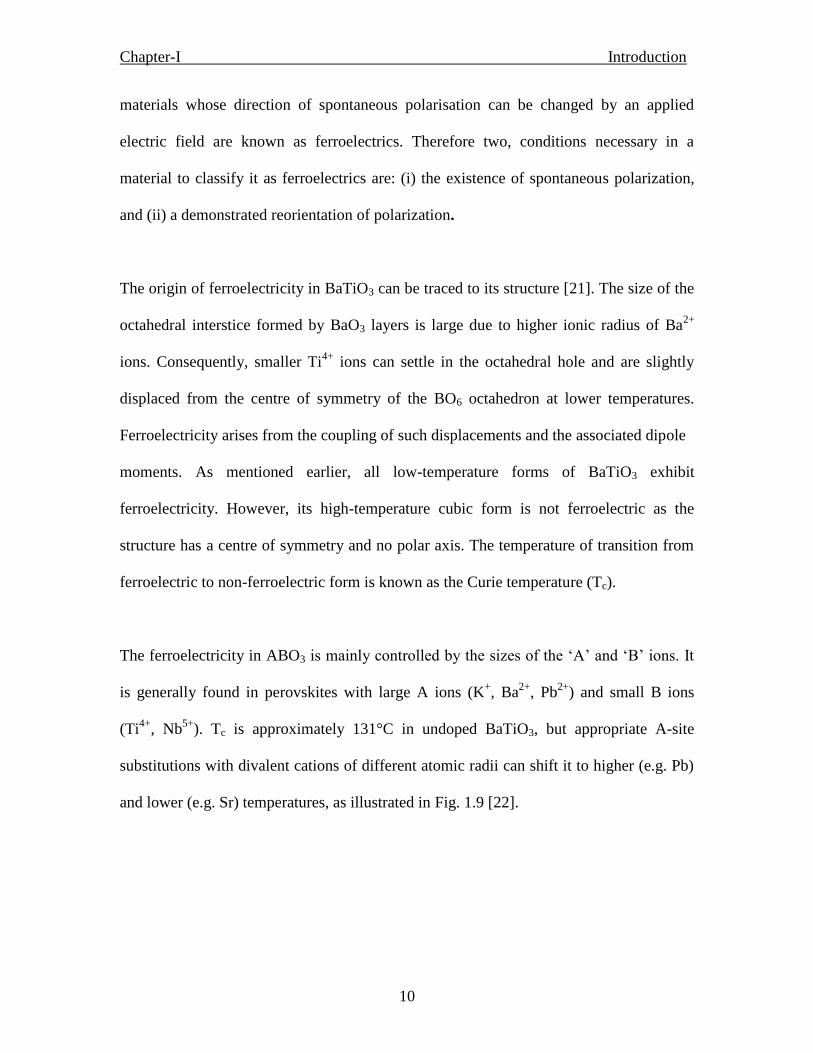
The origin of ferroelectricity in BaTiO3 can be traced to its structure [21]. The size of the
octahedral interstice formed by BaO3 layers is large due to higher ionic radius of Ba2+
ions. Consequently, smaller Ti4+
ions can settle in the octahedral hole and are slightly
displaced from the centre of symmetry of the BO6 octahedron at lower temperatures.
Ferroelectricity arises from the coupling of such displacements and the associated dipole
moments. As mentioned earlier, all low-temperature forms of BaTiO3 exhibit
ferroelectricity. However, its high-temperature cubic form is not ferroelectric as the
structure has a centre of symmetry and no polar axis. The temperature of transition from
ferroelectric to non-ferroelectric form is known as the Curie temperature (Tc).
The ferroelectricity in ABO3 is mainly controlled by the sizes of the „A‟ and „B‟ ions. It
is generally found in perovskites with large A ions (K+, Ba
2+, Pb
2+) and small B ions
(Ti4+
, Nb5+
). Tc is approximately 131°C in undoped BaTiO3, but appropriate A-site
substitutions with divalent cations of different atomic radii can shift it to higher (e.g. Pb)
and lower (e.g. Sr) temperatures, as illustrated in Fig. 1.9 [22].

Chapter-I Introduction
11
Fig. 1.3: Shift in Curie temperature, Tc, as a function of A-site dopant concentration [35]
1.3.1 Classification of ferroelectric crystals
Depending on the temperature variation of dielectric constant or Curie constant C,
ferroelectrics can be divided into two groups. In one group, the compounds undergoing
order-disorder-type transition have a Curie constant of the order 103 while for the other,
which undergoes displacive-type transition, it is of the order of 105. Initially, ferroelectric
materials were broadly classified into two categories: (a) soft (KH2PO4 - type), and (b)
hard (BaTiO3 -type).The phase transition in soft (H-bonded) ferroelectrics is of order-
disorder type where, as in hard ones it is displacive type. The phase transition in soft
ferroelectrics involves not only the ordering of the disordered hydrogen atom, but also the

Chapter-I Introduction
12
deformation of the atomic groups like SO4 -2
, Se4-2
and PO4 -3
. In case of displacive type
of transition a small atomic displacement of some of the atoms is mainly responsible for
phase transition, which has been found in some of the perovskites.
However, the difference between displacive and order-disorder type of transition
becomes uncertain when the separation of relevant disorder becomes comparable with the
mean thermal amplitude of those atoms. The character of ferroelectrics is represented in
terms of the dynamics of phase transition
1.3.2 Diffuse phase transitions (DPT)
The capacitance-temperature curves of some ferroelectrics show broad maxima and a
large deviation from the Curie-Weiss law. These characteristics are explained on the
basis of diffuse phase transitions. Ferroelectric to paraelectric phase transition which
extends over a temperature interval due to the coexistence of two or more phases within a
range of temperatures is known for isovalent as well as aliovalent-substituted BaTiO3
solid solutions. Ba(Ti, Sn)O3, Ba(Nb1.5Zr0.25)O5.25, Ba(Ti, Zr)O3, (Ba, Sr)TiO3 and
BaTiO3 + x at.% Nd are reported to show diffuse phase transition behaviour [23-25]. The
nature of DPT cannot be described by the classical theory of ferroelectric transition. Its
origin is not clear and is considered to be associated with either compositional or thermal
or inter-granular strains [26-28]. Point defects arising from the inherent non-
stoichiometry can also induce DPT behaviour [29].

Chapter-I Introduction
13
Generally, materials showing DPT behaviour are considered to contain polarized micro-
regions called Känzig regions, all having somewhat different phase transition
temperatures [30]. These small differences may be due to mechanical stress distribution
in the material or due to the variations in chemical composition caused during sintering.
Implied in this concept is the increased stress in microstructure during the cubic to
tetragonal transition, which is largely compensated by ferroelectric domains. For
ceramics of smaller grain size (less than a few microns), this compensation is incomplete
and is said to be the major reason for the observed distribution of Tc. The contribution
from chemical inhomogeneity (e.g. resulting from differences in the Ti/Sn ratio) to the
distribution of Tc can be small. The spread of Tc values arises from the decrease in the
heat of transformation with increase in chemical inhomogeneity. Since the enthalpy
change tends to zero, the free energy change around Tc should be very small.
The most remarkable examples of DPT are found in ferroelectric materials [31].
Ferroelectrics diffuse phase transitions (FDPT) are first mentioned in the literature in the
early 1950‟s [32]. Some characteristics of the DPT are: (a) broadened maxima in the
permittivity- temperature curve, (b) gradual decrease of spontaneous and remanent
polarisations with rising temperature, (c) transition temperatures obtained by different
techniques which do not coincide, (d) relaxation character of the dielectric properties in
transition region, and (e) no Curie-Weiss behavior in certain temperature intervals above
the transition temperature. The diffuseness of the phase transition is assumed to be due to
the occurrence of fluctuations in a relatively large temperature interval around the
transition. Usually two kinds of fluctuations are considered: (a) compositional

Chapter-I Introduction
14
fluctuation, and (b) polarization (structural) fluctuation. From the thermodynamic point
of view, it is clear that the compositional fluctuation is present in ferroelectric solids-
solutions and polarization fluctuation is due to the small energy difference between high
and low temperature phases around the transition. This small entropy difference between
ferroelectric and paraelectric phase will cause a large probability of fluctuation. Kanzing
[33] has observed from X-ray diffraction that in a narrow temperature range around the
transition BaTiO3 single crystal splits up into FE and PE micro-regions. According to
Fritsberg [34], substances of less stability are expected to have a more diffuse transition.
For relaxor as well as other FDPT, the width of the transition region is mainly important
for practical applications. Smolensky [35] and Rolov [36] have introduced a model
calculation, based on the concept of Gaussian distribution for both the compositional and
polarisation fluctuation, from which the diffuseness parameter can be calculated.
Complex perovskite-type ferroelectrics with distorted cation arrangements show DPT
which is characterised by a broad maximum for the temperature dependence of dielectric
constant (%‟) and dielectric dispersion in the transition region [35, 37]. For DPT, ε‟
follows modified temperature dependence
CTT m
m
/)(11
.… (2)
where Tm is the temperature at which reaches maximum, m is the value of at Tm, C
is the modified Curie Weiss like constant and is the critical exponent, explains the

Chapter-I Introduction
15
diffusivity of the materials, which lies in the range 1< <2 [38]. The smeared out vs.
T response has generally been attributed [39-40] to the presence of microregions with
local compositions varying from the average composition over length scale of 100 to
1000 Å. Different microregions in a macroscopic sample are assumed [41] to transfer at
different temperature, so-called Curie range, leading DPT which is due to compositional
fluctuations. The dielectric and mechanical properties of FE system below their TC are
functions of the state of polarisation and stress. So ferroelectrics have major application
today because of their characteristic electro-optic, dielectric and hysteresis properties.
For many practical applications, it is desired to use the very large property maxima in the
vicinity of the ferroelectric phase transition, to move the transition into the temperature
range of interest and to broaden and diffuse the very large sharp peak values. In DPT the
dielectric maxima is now much rounder and polarisation persists for a short range of
temperature above Tm.
1.3.3 Difference Between NFEs and RFEs
In order to appreciate and understand the properties of relaxors, it is useful to contrast
some of their properties with those of normal ferroelectrics. We do so with the help of
Fig. 1.4. The difference is as follows:
The P-E hysteresis loop (Fig. 1.4 a) is the signature of a ferroelectric in the low-
temperature FE phase. The large remanent polarization, PR, is a manifestation of the
cooperative nature of the FE phenomenon. A relaxor, on the other hand, exhibits a so-
Chapter-I Introduction
16
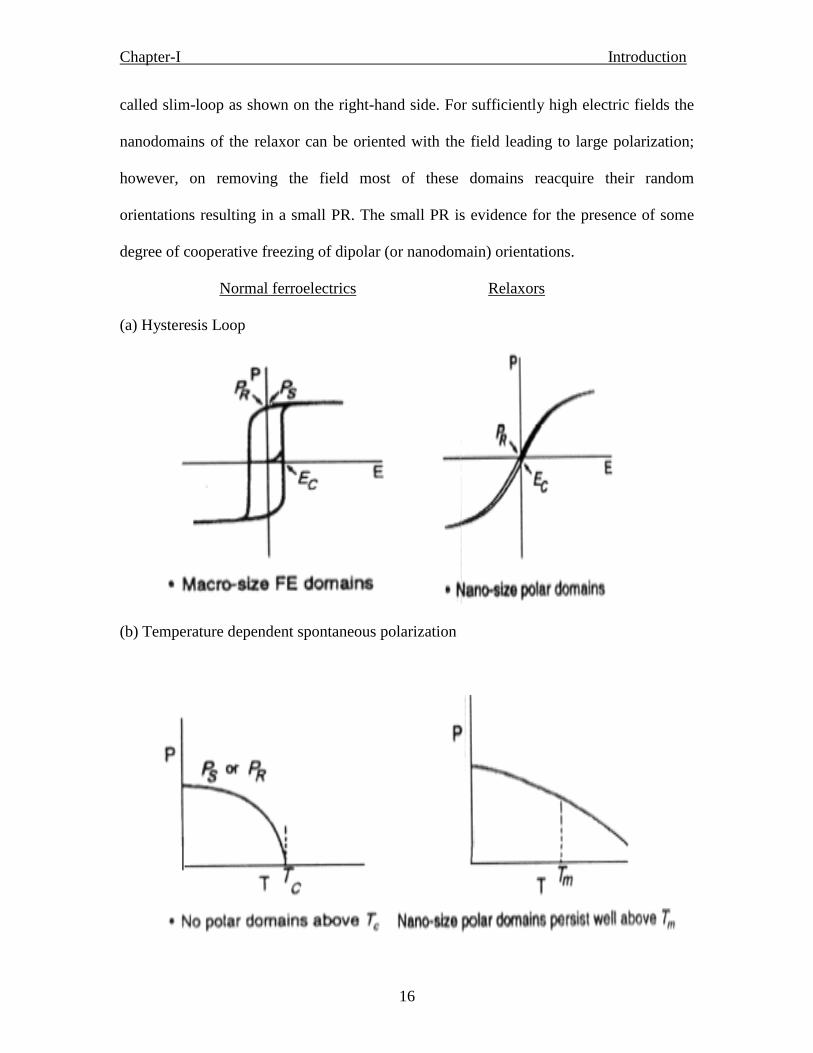
called slim-loop as shown on the right-hand side. For sufficiently high electric fields the
nanodomains of the relaxor can be oriented with the field leading to large polarization;
however, on removing the field most of these domains reacquire their random
orientations resulting in a small PR. The small PR is evidence for the presence of some
degree of cooperative freezing of dipolar (or nanodomain) orientations.
Normal ferroelectrics Relaxors
(a) Hysteresis Loop
(b) Temperature dependent spontaneous polarization

Chapter-I Introduction
17
(c ) Temperature dependence dielectric response
Fig.1.4: difference between the properties of normal ferroelectrics and relaxor ferroelectrics
• The saturation and remanent polarizations of a ferroelectric decrease with increasing
temperature and vanish at the FE transition temperature (TC). The vanishing of P at TC is
continuous for a second-order phase transition (Fig.1.4 b) and discontinuous for a first-
order transition. No polar domains exist above TC. By contrast, the field-induced
polarization of a relaxor decreases smoothly through the dynamic transition temperature
Tm and retains finite values to rather high temperatures due to the fact that nano-size
domains persist to well above Tm.
• The static dielectric susceptibility, or dielectric constant ( ε‟), of a ferroelectric exhibits
a sharp, narrow peak at TC (Fig. 1.4 c). For a single crystal, the peak is very sharp and the
width at half max is ~10~20 K. For a mixed oxide FE, e.g., a PZT, the peak is somewhat

Chapter-I Introduction
18
rounded due to compositional fluctuations, and the width at half max is typically ~20~40
K. The FE response is frequency independent in the audio-frequency range. By contrast,
a relaxor exhibits a very broad ε(T) peak and strong frequency dispersion in the peak
temperature (Tm) and in the magnitude of ε below Tm. The conventional wisdom has been
that the broad ε(T) peak, also referred to as a “diffuse phase transition,” is associated with
compositional fluctuations leading to many micro FE regions with different compositions
and TC‟s. The breadth of the peak is simply a manifestation of the dipolar glass-like
response of these materials.
• The temperature dependence of ε‟ of a ferroelectric obeys a Curie-Weiss law, ε =C/(T-
T0), above TC, which could be shown by the linear 1/ ε vs. T response. By contrast, ε(T)
of a relaxor exhibits strong deviation from this law for temperatures of many 10s to a few
100s degrees above Tm.
• The FE transition can be thermodynamically first- or second-order and involves a
macroscopic symmetry change at TC. Transparent FEs exhibit strong optical anisotropy
across Tm.
Table 1.2 shows the difference between the properties of normal ferroelectrics and
relaxor ferroelectrics of perovskite type material.
Chapter-I Introduction
19
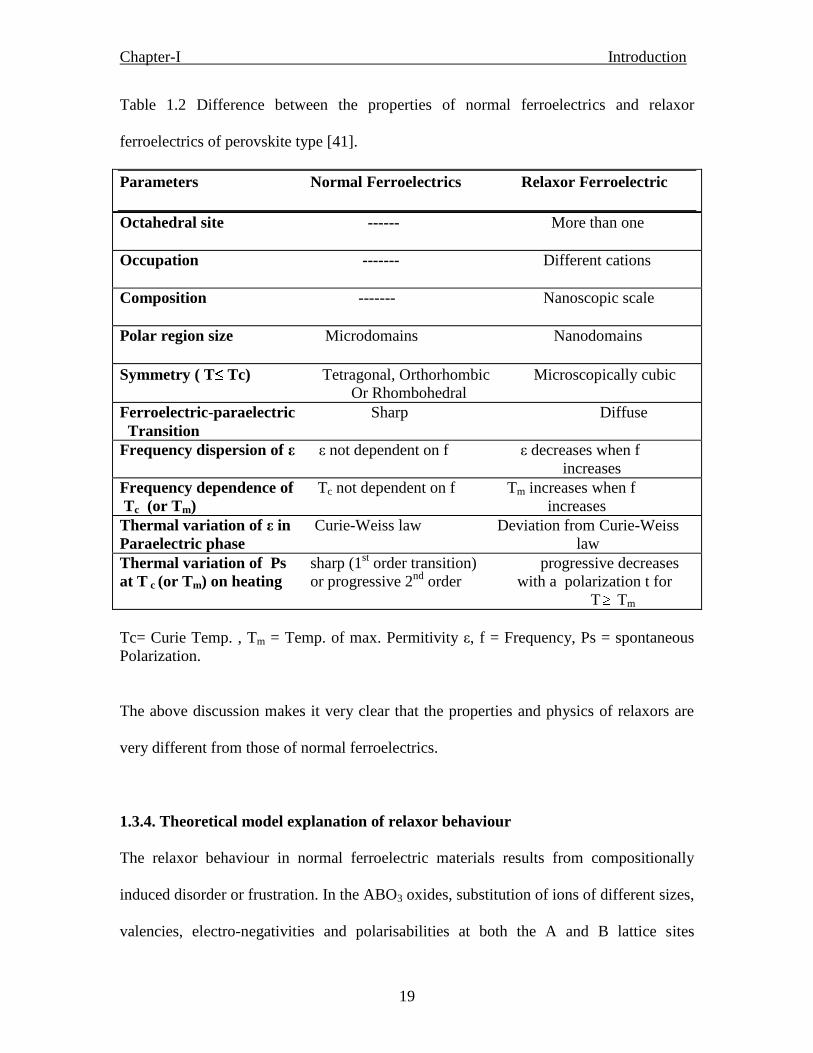
Table 1.2 Difference between the properties of normal ferroelectrics and relaxor
ferroelectrics of perovskite type [41].
Parameters Normal Ferroelectrics Relaxor Ferroelectric
Octahedral site ------ More than one
Occupation ------- Different cations
Composition ------- Nanoscopic scale
Polar region size Microdomains Nanodomains
Symmetry ( T Tc) Tetragonal, Orthorhombic Microscopically cubic
Or Rhombohedral
Ferroelectric-paraelectric Sharp Diffuse
Transition
Frequency dispersion of ε ε not dependent on f ε decreases when f
increases
Frequency dependence of Tc not dependent on f Tm increases when f
Tc (or Tm) increases
Thermal variation of ε in Curie-Weiss law Deviation from Curie-Weiss
Paraelectric phase law
Thermal variation of Ps sharp (1st order transition) progressive decreases
at T c (or Tm) on heating or progressive 2nd
order with a polarization t for
T Tm
Tc= Curie Temp. , Tm = Temp. of max. Permitivity ε, f = Frequency, Ps = spontaneous
Polarization.
The above discussion makes it very clear that the properties and physics of relaxors are
very different from those of normal ferroelectrics.
1.3.4. Theoretical model explanation of relaxor behaviour
The relaxor behaviour in normal ferroelectric materials results from compositionally
induced disorder or frustration. In the ABO3 oxides, substitution of ions of different sizes,
valencies, electro-negativities and polarisabilities at both the A and B lattice sites

Chapter-I Introduction
20
produces a dipolar defect and introduces a sufficiently high degree of disorder so as to
break translational symmetry and prevent the formation of long-range ordered state (Dial
et al. 1993; Dial et al. 1996). In reflecting on the occurrence of relaxor behavior of
perovskites, there appear to be three essentials ingredients: the existence of lattice
disorder (Priya and Viehland 2002; Lu 2004), evidence for the existence of polar nano
domains at temperature much higher than Tm and these domains existing as islands in a
highly polarizable (soft-mode) host lattice (Gupta and Viehland 1996). The existence of
nano-polar regions has also been evidenced by several other experimental techniques
such as transmission electron microscopy (Randall and Bhalla, 1989), diffuse X-ray
scattering and neutron diffraction studies ( de mathan, 1991; Conlone et al 2004; Gehring
et al 2004; Xu et al 2004). Various physical models such as superparaelectric model [40],
order-disorder transition model [42-43], microdomain and macrodomain switching model
[44], dipolar glass model [45-46] and random field model [47-48] have been proposed to
explain the behaviour of RFEs.
1.3.5. Theoretical description of ABO3 relaxor ferroelectric [49]
Relaxor ferroelectric or relaxor exhibit many properties similar to those of spin or dipolar
glasses. Relaxor behaviour in normal ferroelectric material results from compotionally
inheriety disorder or frustration [50]. This behaviour has been observed and studied most
extensively in ABO3 perovskite ferroelectric. Three essential ingradients of relaxor
ferroelectrics are the existence of lattice disorder, evidence of the existence of polar nano
domains at temperature much higher than Tm and the existence of domain as island in a
highly polarisable host lattice.

Chapter-I Introduction
21
To close similarity, spin glasses are magnetic systems in which the interactions among
the magnetic moments are both random and frustrated because of structural disorder. A
common feature of these systems, and the one that makes them such an interesting object
of study, is that they exhibit a freezing of magnetic moments in random directions at an
apparently sharp temperature Tsg.[51]. Under the most commonly studied Ising model of
spin glass consisting of N Ising spin Si = 1, i = 1, 2, …, N, in the presence of an
externally applied magnetic field H, the Hamiltonian for the model becomes [52]
i
iji
ji
ijH SHSSJH,2
1 ….(3)
Under the assumptions of one-dimensional nearest-neighbour interaction
n n
nnnH HJH 1 …. (4)
Because the relaxors are materials with random site lattice disorder, it is natural to resort
to models that investigate the role of random fields. In ABO3 relaxors, the dipolar
nanodomains formed by chemical substitutions create random electric fields in the host
lattices.
For an Ising spin model with infinite-ranged interactions with statistically-independent
site field, one considers a collection of spin s = 1 located at lattice sites i,j and
interacting in such a away that the total energy ,or Hamiltonian , is
iji i
njiH SSJH ….(5)
Chapter-I Introduction
22
Here the interaction J is a constant that incorporates all electronic properties in a
phenomenological way, and <,ij> designates nearest- neighbor pairs.
Although in Eq. (8) the quantities Sij are called “spins” the model is by no. means
restricted to magnetism. This model can describe any solid state system that has a
transition with a doubly degenerate order state , and contains frozen impurities or point
defects that break the symmetry and cannot move on the relevant time scale. The
important feature of relaxor is the presence of compositional and structural disorder,
which breaks translation symmetry and produces random dipolar nanodomains.
In spite of several attempts, the nature of diffused phase transition in relaxor
ferroelectrics has still remained in a controversial stage. Experimental evidence in them
showed incompatibility with the assumptions of fixed-length ordered parameter as
proposed in dipolar glasses or spin glasses. In the previous model, we have described
relaxor ferroelectrics by an ordering field of fixed length under Ising model. Because of
basic reorientable polar nanoclusters, i.e. the “pseudospins” vary in both their size and
orientation, the relaxor corresponds to new type of dipolar glasses, namely spherical
vector glasses, and the order parameter field is described as a continuous vector field of
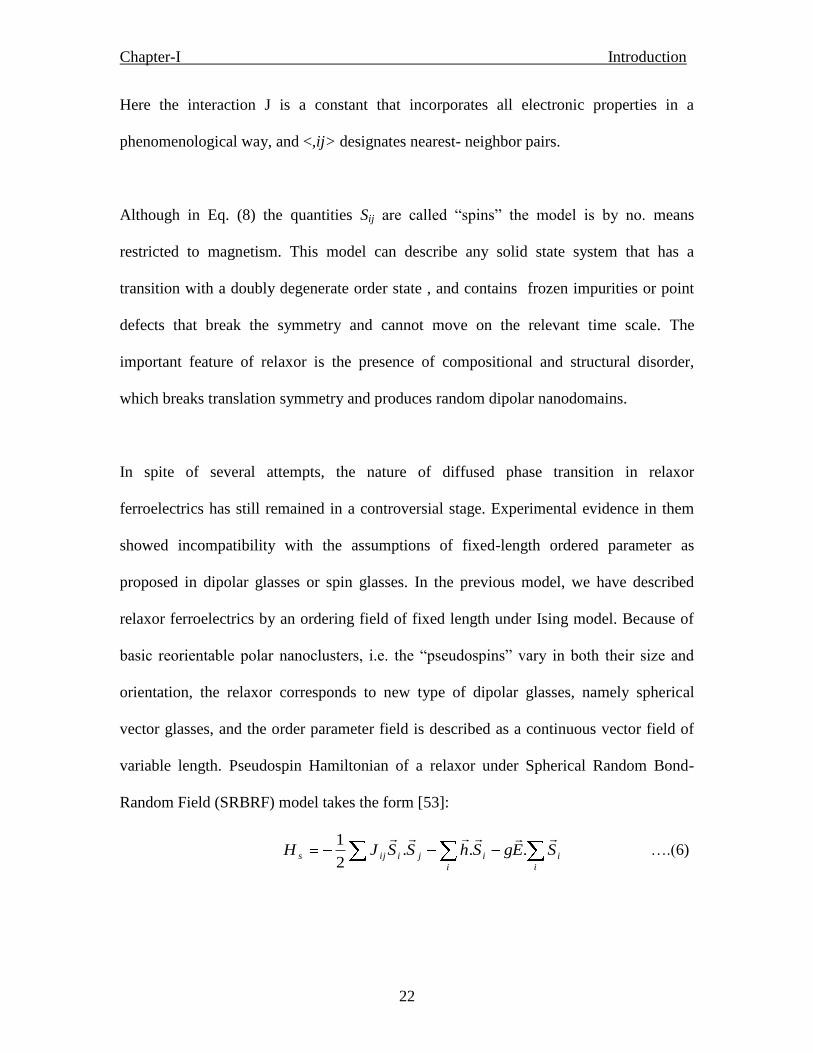
variable length. Pseudospin Hamiltonian of a relaxor under Spherical Random Bond-
Random Field (SRBRF) model takes the form [53]:
i i
iijiijs SEgShSSJH
...2
1 ….(6)

Chapter-I Introduction
23
where iS
dipole moment of the ith
polar cluster, Jij random intercluster interactions
(J0/N mean value, (J)2/N variance), E
external electric field, ih
random fields (0
mean value, Δδδhh μvij
c
aviviμ).
For isotropic system, spontaneous polarisation below Tc is given by [54],
2
0
2
0
2 11JJ
T
J
JP ….(7)
Including the pseudospin lattice coupling interaction, for the nano-domains are being
dispersed in a deformable lattice, the total Hamiltonian now becomes [54]
SLLS HHHH ….(8)
where HL and HSL are the lattice (phonon) contribution and pseudospin polar phonon,
respectively. The lattice coupling modifies the uncoupled interaction parameters J0 and J
to J0* and J
* [55] The phase transition to an inhomogeneous ferroelectric state occurs
below transition temperature Tc given by
2**
0
*
0)()(
1jj
JkTc ….(9)
In summary, the coupled SRBRF- phonon model of relaxors appears to be successful in
explaining the relaxor properties of ferroelectrics.
1.4 Barium titanate (BaTiO3)

Chapter-I Introduction
24
1.4.1 Structure of perovskite-barium titanate (BaTiO3)
The perovskite-like structure, named after the CaTiO3 perovskite mineral [56] , is a
ternary compound of formula ABO3 in which A and B cations differ in size. It is
considered an FCC- derivative structure in which the larger A cation and oxygen together
form an FCC lattice while the smaller B cation occupies the octahedral interstitial sites in
the FCC array. There is only the oxygen being B cation‟s nearest neighbor.
The structure is a network of corner-linked oxygen octahedra, with the smaller cation
filling the octahedral holes and the larger cation filling the dodecahedral holes [57]. The
unit cell of perovskite cubic structure is shown below in Fig. 1.5
Figure 1.5: Perovskite structure (BaTiO3)

Chapter-I Introduction
25
In Fig. 1.5, we can see that the coordination number of A (Ba+2
Barium) is 12, while the
coordination number of B (Ti+4
Titanium) is 6. In most cases, the above figure is
somewhat idealized [58]. In fact, any structure consisting of the corner-linked oxygen
octahedra with a small cation filling the octahedral hole and a large cation (if present)
filling the dodecahedral hole is usually regarded as a perovskite, even if the oxygen
octahedra are slightly distorted [59]. Also, it is unnecessary that the anion is oxygen. For
example, fluoride, chloride, carbide, nitride, hydride and sulfide perovskites are also
classified as the perovskite structures. As a result, we can say that perovskite structure
has a wide range of substitution of cations A and B, as well as the anions, but remember
that the principles of substitution must maintain charge balance and keep sizes within the
range for particular coordination number. Because the variation of ionic size and small
displacements of atoms that lead to the distortion of the structure and the reduction of
symmetry, have profound effects on physical properties, perovskite structure materials
play such an important role in dielectric ceramics.
1.4.2 Principles of dielectrics
Dielectrics and insulators can be defined as materials with high electrical resistivities [60]
. A good dielectric is, of course, necessarily a good insulator, but the converse is by no
means true. Dielectric properties, dielectric constant, dielectric loss factor, dielectric
resistivity, and dielectric strength will be interpreted as follows.
Capacitance. The principal characteristic of a capacitor is that an electrical charge Q can
be stored [61]. The charge on a capacitor is given in Eq.(10),
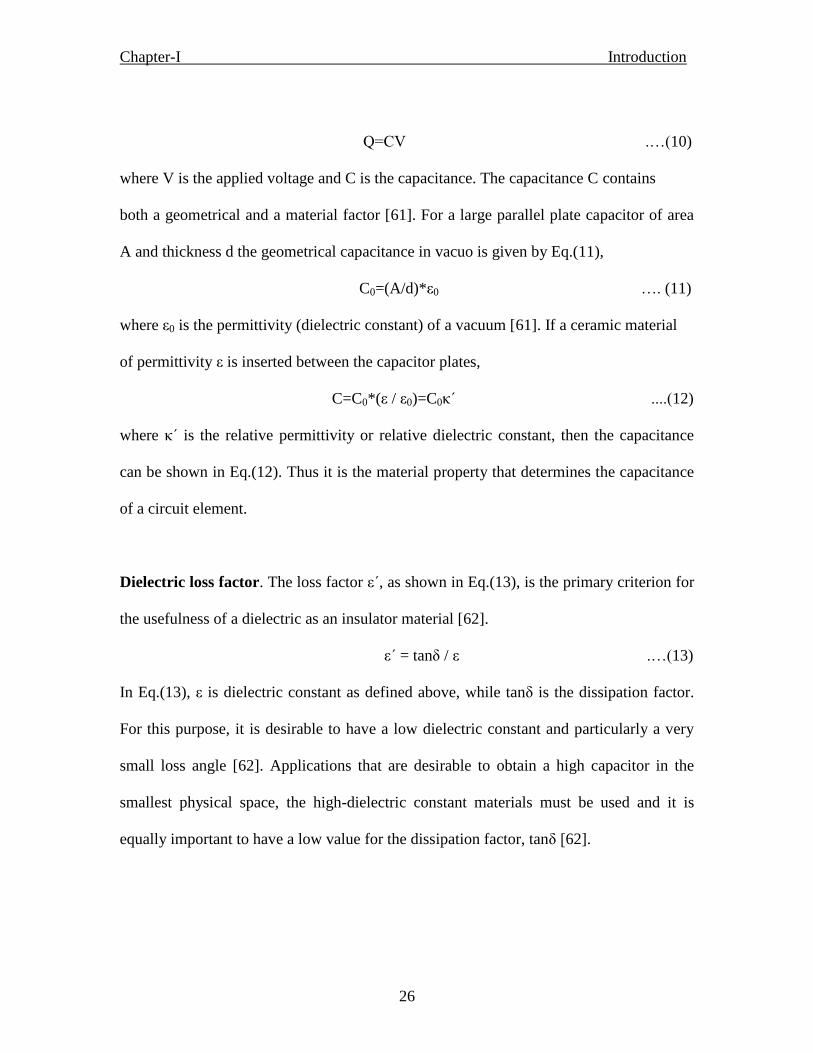
Chapter-I Introduction
26
Q=CV .…(10)
where V is the applied voltage and C is the capacitance. The capacitance C contains
both a geometrical and a material factor [61]. For a large parallel plate capacitor of area
A and thickness d the geometrical capacitance in vacuo is given by Eq.(11),
C0=(A/d)*ε0 …. (11)
where ε0 is the permittivity (dielectric constant) of a vacuum [61]. If a ceramic material
of permittivity ε is inserted between the capacitor plates,
C=C0*(ε / ε0)=C0κ΄ ....(12)
where κ΄ is the relative permittivity or relative dielectric constant, then the capacitance
can be shown in Eq.(12). Thus it is the material property that determines the capacitance
of a circuit element.
Dielectric loss factor. The loss factor ε΄, as shown in Eq.(13), is the primary criterion for
the usefulness of a dielectric as an insulator material [62].
ε΄ = tanδ / ε .…(13)
In Eq.(13), ε is dielectric constant as defined above, while tanδ is the dissipation factor.
For this purpose, it is desirable to have a low dielectric constant and particularly a very
small loss angle [62]. Applications that are desirable to obtain a high capacitor in the
smallest physical space, the high-dielectric constant materials must be used and it is
equally important to have a low value for the dissipation factor, tanδ [62].

Chapter-I Introduction
27
Dielectric strength. Dielectric strength is defined when the electric field is just sufficient
to initiate breakdown of the dielectric [60]. It depends markedly on material
homogeneity, specimen geometry, electrode shape and disposition, stress mode (DC, AC
or pulsed) and ambient conditions.
1.3.3 Dielectric characteristics of barium titanate
Barium titanate was the first developed piezoelectric ceramic and even now it is still
widely used. It is also a well-known material used for capacitors. The crystallographic
dimensions of the barium titanate lattice change with temperature, as shown in Fig.1.6,
due to distortion of the TiO6 octahedra as the temperature is lowered from the high
temperature cubic form [56].
Figure 1.6: Lattice parameters of BaTiO3 as a function of temperature
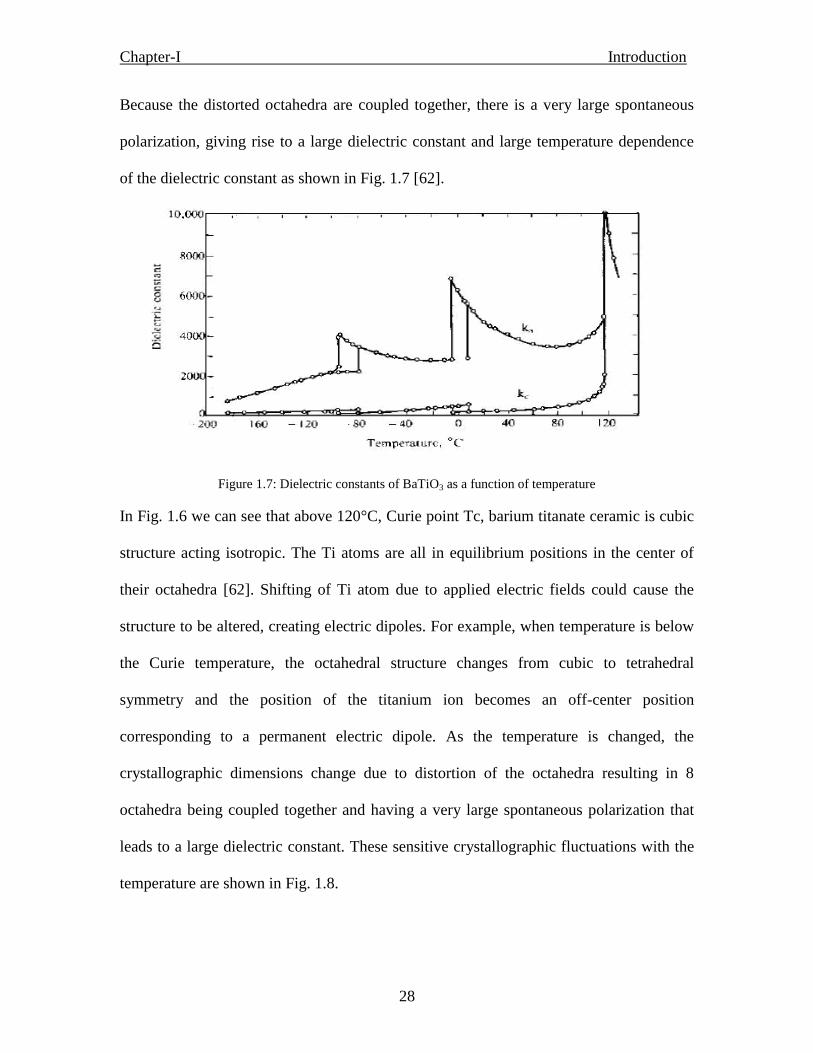
Chapter-I Introduction
28
Because the distorted octahedra are coupled together, there is a very large spontaneous
polarization, giving rise to a large dielectric constant and large temperature dependence
of the dielectric constant as shown in Fig. 1.7 [62].
Figure 1.7: Dielectric constants of BaTiO3 as a function of temperature
In Fig. 1.6 we can see that above 120°C, Curie point Tc, barium titanate ceramic is cubic
structure acting isotropic. The Ti atoms are all in equilibrium positions in the center of
their octahedra [62]. Shifting of Ti atom due to applied electric fields could cause the
structure to be altered, creating electric dipoles. For example, when temperature is below
the Curie temperature, the octahedral structure changes from cubic to tetrahedral
symmetry and the position of the titanium ion becomes an off-center position
corresponding to a permanent electric dipole. As the temperature is changed, the
crystallographic dimensions change due to distortion of the octahedra resulting in 8
octahedra being coupled together and having a very large spontaneous polarization that
leads to a large dielectric constant. These sensitive crystallographic fluctuations with the
temperature are shown in Fig. 1.8.

Chapter-I Introduction
29
Fig. 1.8: Crystallographic changes of BaTiO3
The dielectric characteristics of barium titanate ceramics with respect to temperature,
electric field strength, frequency and time (aging) are also very dependent on the
substitution of minor amounts of other ions, on microstructure, and in particular on fine
grain size. For example, the room-temperature relative dielectric constant increases as the
grain size of the fast-fired BaTiO3 ceramic is decreased [63]. When compared with
milling method, chemical mixing techniques show an advantage in enhancing the
microhomogeneity of additives, modifying the surface states and then have an effect on
the properties of coated ceramics.For instance, in coating process silica is a well-known
sintering aid that improves the sintering behavior of BaTiO3 particles and also can
produce a core-shell-like structure. By adjusting the core-shell structure, we can control
the dielectric properties. The coating process not only can increase the shrinkage rate that
improves the sintering behavior but also can inhibits the grain growth.
1.3.4 Phase transitions in BaTiO3
BaTiO3 has several polymorphs. It has the prototype perovskite structure above 131°C.
Below this temperature, it transforms successively into three different ferroelectric phases
as shown below [64]:
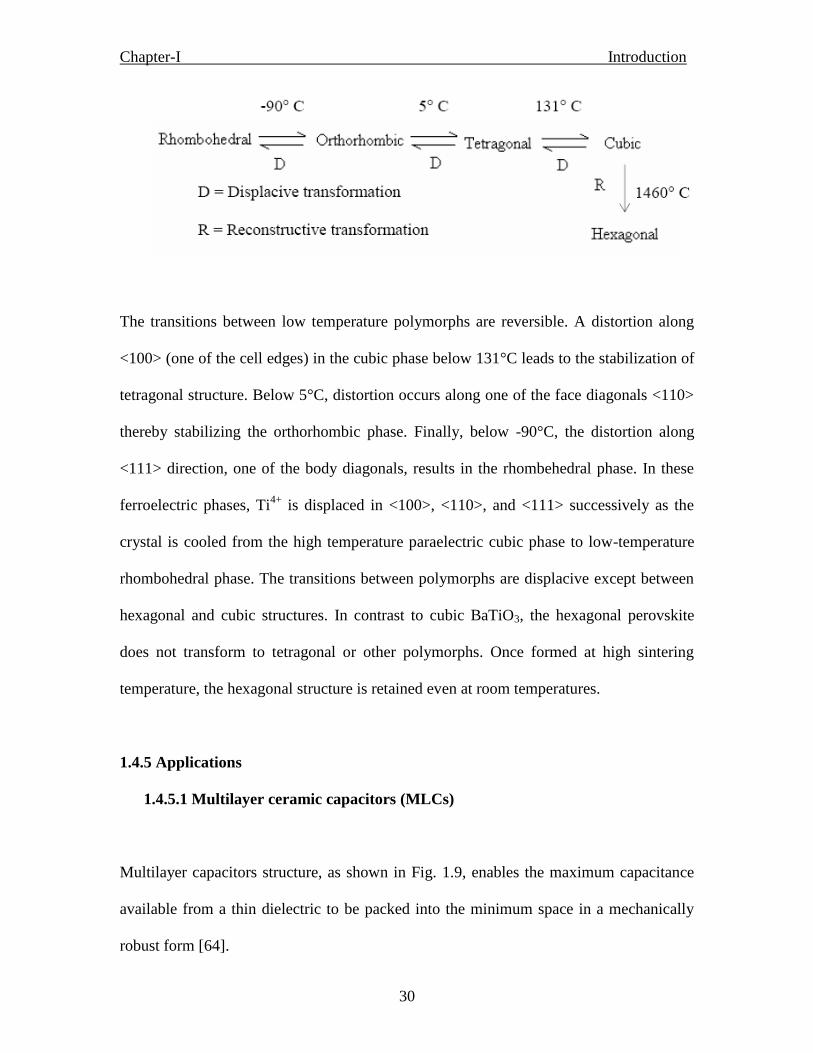
Chapter-I Introduction
30
The transitions between low temperature polymorphs are reversible. A distortion along
<100> (one of the cell edges) in the cubic phase below 131°C leads to the stabilization of
tetragonal structure. Below 5°C, distortion occurs along one of the face diagonals <110>
thereby stabilizing the orthorhombic phase. Finally, below -90°C, the distortion along
<111> direction, one of the body diagonals, results in the rhombehedral phase. In these
ferroelectric phases, Ti4+
is displaced in <100>, <110>, and <111> successively as the
crystal is cooled from the high temperature paraelectric cubic phase to low-temperature
rhombohedral phase. The transitions between polymorphs are displacive except between
hexagonal and cubic structures. In contrast to cubic BaTiO3, the hexagonal perovskite
does not transform to tetragonal or other polymorphs. Once formed at high sintering
temperature, the hexagonal structure is retained even at room temperatures.
1.4.5 Applications
1.4.5.1 Multilayer ceramic capacitors (MLCs)
Multilayer capacitors structure, as shown in Fig. 1.9, enables the maximum capacitance
available from a thin dielectric to be packed into the minimum space in a mechanically
robust form [64].

Chapter-I Introduction
31
Fig. 1.9: Schematic diagram of a multi layer ceramic capacitor construction
Recently, multilayer ceramic capacitors (MLCs) with Ni electrodes have been
increasingly produced to meet growing requirements for miniaturization, large
capacitance and cost reduction [65]. Firing the dielectric materials in a low-oxygen
partial pressure to prevent Ni from oxidizing is one method to miniaturize MLCs. Then
additions of MgO and Li2O-SiO2-CaO glass components are effective not only in
preventing the dielectric material from reducing but also in controlling the temperature
dependency of the dielectric constant. Because of appealing of heterogeneous
microstructure, so-called core-shell structure that showed a typical ferroelectric domain
pattern, microstructure controlling becomes extremely important to improve the
reliability of MLCs within very small dielectric layer thickness.
It was suggested that the microstructures and the electrical properties were influenced by
the change of substitution modes of Mg and rare-earth oxide in perovskite [65]. For
larger ion (La, Sm)-doped samples, larger amount of MgO is necessary to suppress the
grain growth and form the core-shell structure than smaller one (Dy, Ho, Er)-doped

Chapter-I Introduction
32
samples. Also, the solubility of rare-earth ions in BaTiO3 has a linear relationship with
the ionic radius. It is confirmed that the larger ion acting as donors mainly dissolves Ba
site, while the smaller ion acting as both donors and acceptors dissolves both Ba- and Ti-
sites. In recent years, MLCs with Ni internal electrodes composed of about 400 dielectric
layers of below 2µm thickness have been developed [66].
1.4.5.2 Positive temperature coefficient (PTC) thermistors
Positive temperature coefficient (PTC) materials prepared from doped semiconducting
barium titanate ceramics can be used in various kind of electronic circuitry as a switching
device or as a constant temperature heater [67]. In addition, PTC thermistors applications
such as the measurement/detection/control of temperature or parameters related to
temperature are also important. These PTC materials are known to have a high
temperature coefficient of resistance around the Curie point and the ability of self-
limiting, so they have as well turned out to be a very useful device for sensor
applications.
The positive temperature coefficient of resistance (PTCR) can be classified as critical
temperature resistors because of the positive coefficient being associated with the
ferroelectric Curie point. In fact, PTCR materials can be divided into four groups:
polymer composites, ceramic composites, V2O3 compounds and BaTiO3-based
compounds (BaSrTi3O, BaPbTiO3…) [68]. For BaTiO3-based compounds, BaTiO3 is an
insulator at room temperature. After doping with trivalent donors (e.g. La, Sb, Y) that
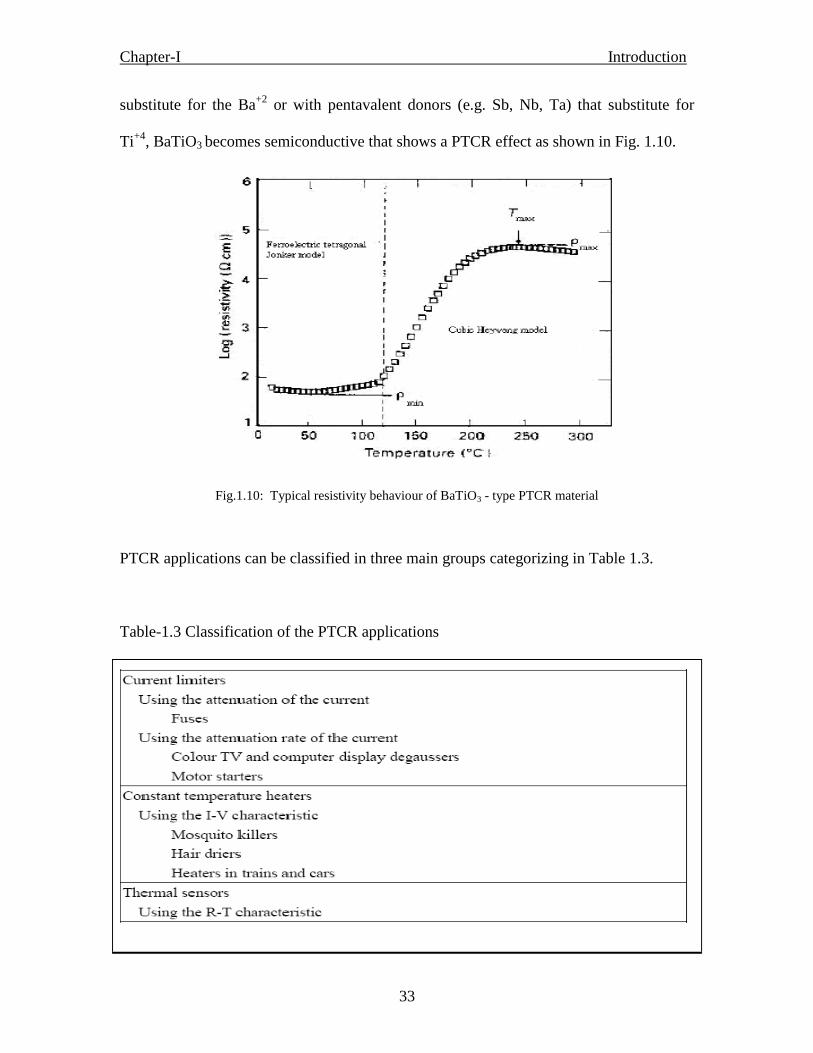
Chapter-I Introduction
33
substitute for the Ba+2
or with pentavalent donors (e.g. Sb, Nb, Ta) that substitute for
Ti+4
, BaTiO3 becomes semiconductive that shows a PTCR effect as shown in Fig. 1.10.
Fig.1.10: Typical resistivity behaviour of BaTiO3 - type PTCR material
PTCR applications can be classified in three main groups categorizing in Table 1.3.
Table-1.3 Classification of the PTCR applications

Chapter-I Introduction
34
1.4.5.3 Summary and conclusions
This section discusses the structure of barium titanate perovskite-based structure and
some principles of dielectric properties. BaTiO3 materials have been developed for
dielectric applications for a long time using various substitutional ions for Ba2+
and Ti4+
to miniaturize the capacitors with large capacitance. These dielectric properties of barium
titanate could be affected by many different parameters such as temperature, ambience,
synthesis process, grain size, etc. Because the crystallographic dimensions of BaTiO3 are
sensitive to temperature, we can see comprehensive applications of BaTiO3 playing a
significant role in dielectric materials.

Chapter-I Introduction
35
References
[1] A. Navrotsky, and D. J. Weidner, Eds. American Geophysical Union: Washington
D.C., 1989; Vol. 45, p xi.
[2] V.M. Goldschmidt, Naturwissenschafsen, 14, (1926) 477-485.
[3] A.S. Bhalla, R. Guo, and R. Roy, MRI 4 (1), (2000) 3-26.
[4] P.K. Davies, J. Tong, and T. Negas, J. Am. Ceram. Soc., 80 (7), (1997) 1727-1740.
[5] N. Setter, and L.E. Cross,. JAP, 51 (8) (1980) 4356-60.
[6] N. Scarisoreanu, M. Dinescu, F. Craciun, P. Verardi, A. Moldovan, A. Purice, and
C. Galassi, ASS 252 (13), (2006) 4553-4557.
[7] S. de Los, J. Guerra, M.H. Lente, and J.A. Eiras, APL, 88 (10), (2006).
[8] N. Ramdas, Mat. Sci. and Engg., 36 (1978) 231.
[9] N. Setter and R. Waser, Acta Materiallia, 48 (2000) 151.
[10] Gene H. Heartling, J. Am. Ceram. Soc., 82 (1999) 797.
[11] A. F. Tasch and L. H. Parker, Proc. I.E.E.E., 77 (1989) 374.
[12] P. Muralt, M. Kohli, T. Maeder and A. Kholkin, Sensors and Activators A, 48 (1995)
157.
[13] R. Bruchans, D. Pitzer, M. Schreiter and W. Wersing, J. Electroceramic, 3 (1999)
151.
[14] V. M. Goldschmidt, Skr. Nor. Vidensk. Akad., Oslo, 2 (1926).
[15] P. P. Phule and H. S. Risbud, J. Mater. Sci., 25 (1990) 1169.
[16] J. Daniels, K. H. Härdtl and R. Wernicke, Philips Technical Review, 38 (1978/9) 73.
[17] M. E. Lines and A. M. Glass, “Principles and Applications of Ferroelectrics and
related materials”, Clarendon Press, Oxford, 1979.
[18] R.J.Cava, J.Mater.Chem. , 1 (2001) 54.
[19] V. M. Ferreira, F. Azough, J. L. Baptista, and R. Freer, Ferroelectrics, 133 (1992)
127.
Chapter-I Introduction
36
[20] R. Von Helmholt, J. Wecker, B. Holzapfel, L. Schultz and K. Samwer, Phy.
Rev.Lett., 71 ( 1993 ) 2331.
[21] L. L. Hench and D. B. Dove, Physics of Electronic Ceramics, Marcel Dekker
Inc.,New York, 1971.
[22] B Jaffe, W. R. Cook, and H, Jaffe, Piezoelctric Ceramics, Academic Press, 1971.
[23] D. Hennings and A. Schnell, J. Am. Ceram. Soc., 65 (1982)539.
[24] P. Murugraj, T. R. N. Kutty and M. Subba Rao, J. Mat. Sci., 21 (1986) 3521.
[25] L. Benguigui, Phys. Stat. Solid (A), 46(1978) 337.
[26] G. A. Smolensky, J. Phy. Soc. Jpn., 28 (1970) 26.
[27] V. I. Fritsberg, Proc. Int. Meeting on Ferroelectricity, 1 (1966) 163.
[28] H. T. Martirena and J. C. Burfoot, J. Phys. C., 7 (1974) 3182.
[29] S. Shirasaki, K. Takahashi and K. Kakegan, J. Am. Ceram. Soc, 56 (1973) 450.
[30] W. Känzig, Helv Physics Acta 24 (1951) 175.
[31] C.G.F Stenger, and A.J.Burggraaf, J.Phys. Chem.Solids, 41, (1980) 25.
[32] W. Kanzig, Helv. Phys. Acta 24, (1951) 175.
[33] W. Kanzig, Ferroelectric and Antiferroelectrics, Academic Press, New york (1957).
[34] J. Fritesberg, Proc. 4th Int. Meeting on Ferroelectricity, Leningrad (1977).
[35] A.G.Smolensky, J. Phys.Soc.Japan 18, (1970) 26.
[36] B.N Rolov, Soviet Phys. Solid state, 6, (1965) 1676.
[37] A.G.Smolensky, J Ferroelectricity, 53, (1984) 129.
[38] V.S.Tiwari and D.Pandey, J.Am Ceram Soc.II, 77, (1994) 1819.
[39] V.V.Kirollov and V.A. Isupov, Ferroelectrics, 5, (1973) 3.
[40] L.E.Cross, Ferroelectrics 76, (1987) 241.
[41] L. E. Cross, Ferroelectrics 151, (1994) 305 – 320.

Chapter-I Introduction
37
[42] T. Egami, W. Dmowski, S. Teslic, P. K. Davies, I. W. Chen, and H. Chen,
Ferroelectrics 206-207,(1998) 231-244.
[43] T. Egami, Ferroelectrics 222, (1999) 163-170.
[44] I. W. Chen and Y. Wang, Ferroelectrics 206-207, (1998) 245-263.
[45] D. Viehland, M. Wuttig, and L. E. Cross, Ferroelectrics 120, (1991) 71-77.
[46] R. Pirc and R. Blinc, Phys. Rev. B 60(19), (1999) 13470-13478.
[47]V. Westphall, W. Kleeman, and M. D. Glinchuk, Phys. Rev. ¸Lett. 68, (1992) 847-
850.
[48] A. E. Glazounov, A. K. Tagantsev, and A. J. Bell, Ferrroelectrics 184,
[49] M.R.Panigrahi, T.Badapanda, and S.Panigrahi Indian J.Phys. 83(4) (2009) 567-571.
[50] G.A.Samara, Ferroelectrics, 117,(1991) 347and reference therein.
[51] K.Binder and A.P Young, Rev.Mod.Phys. 58, (1986) 801.
[52] J. Callaway, Quantum theory of solid state physics (Academic Press) 2nd
edition
(1991)
[53] R. Pric and R. Blinc, Phys, Rev B 60, 13,(1990) 470.
[54] J.J. Van der Klink and F. Borsa, Phys, Rev. B 3,(1984) 52.
[55] G. A. Samara Ferroelectric revisited (Advances in materials and physics),
Academic press, 56, (2001) 268.
[56] L. L. Hench and L. K. West, Principles of Electronic Ceramics, (John Wiley &
Sons, Inc., 1990), pp 244-247.
[57] Goldschmidt, V. M., Skrifter Norske Videnskaps-Akad, Oslo, I: Mat. - Naturv. Kl.,
2, 8 (1926).
[58] ibid, p 50.
[59] ibid, pp 182-184.
[60] ibid, pp 914-915.
[61] W. D. Kingery, H. K. Bowen, and D.R. Uhlmann, op cit, pp 926-927.
Chapter-I Introduction
38
[62] A. J. Moulson and J. M. Herbert, op cit, p 243.
[63] H. Mostaghaci and R. J. Brook, J. Mat. Sci, 21, (1986) 3575-3580.
[64] R. C. Buchanan, Materials Crystal Chemist”, Marcel Dekker Inc., New York, 1997.
[65] H Kishi, N Kohzu, J Sugino, H Ohsato, Y Iguchi and T Okuda, J. Europ Ceram.
Soc., 19, (1990)1043-1046.
[66] H Kishi, N Kohzu, J Sugino, H Ohsato, Y Iguchi and T Okuda, J. Europ Ceram.
Soc, 21, (2001) 1643-1647.
[67] S Chatterjee and H. S. Maiti, Materials Chemistry and Physics, 67, (2001) 294-297.
[68] B. Huybrechts, K. Ishizaki and M. Takata, J. Mat. Sci, 30, (1995) 2463-2474.
MATERIALS AND METHODS
Chapter-II
Chapter-II Materials and Methods
40
MATERIALS AND METHODS
Ceramic materials are one of the major groups in materials science because of their direct
and indirect applications in day-to-day life, hence is the importance of new ceramic
powder synthesis in the advancement of materials sciences. There are several methods of
preparation such as mechanical methods and chemical methods. Mechanical methods
include solid state reaction, and ball milling, etc., and chemical methods include sol-gel,
wet-chemical, semi-oxalate, organic precursor methods, etc. Each and every method has
its own advantages and disadvantages in terms of purity, homogeneity, reactivity and
particle size, etc. In this front, the solid state reaction method is found to be easier,
convenient and cost effective amongst other available methods.
2.1 Preparation methods
This chapter deals with the methods used for the synthesis of titanate ceramics and solid
solutions, as well as the instrumental techniques for characterization. Only the brief
outlines of the methods used for preparation are given here. More details will be
presented in the respective chapters. The purity, particle size, shape, reactivity and the
native defect concentration of the starting materials play a major role in the performance
of the final ceramics.
2.2 Solid state reaction
In this study the starting materials with high purity were used for the sample preparation.
The constituents of the required specimen were taken in a stoichiometric ratio and dry
Chapter-II Materials and Methods
41
mixed followed by ball milling in acetone as medium. The ball-milled powder was again
mixed with an agate mortar and pestle. The powders were then calcined at certain
temperature. The XRD of the calcined powders were taken for phase formation and/or
identification. After calcinations the powders were again ground and were mixed with
polyvinyl alcohol (PVA) as binder to reduce the brittleness and to have better
compactness amongst the granules of the materials. The green pellets of dimensions ~10
mm in diameter and ~1 mm in thickness were made using unixial isostatic cold press
with the help of stainless steel dye. The pellets were kept at 350 C for 5 hours to remove
the binder. Then the pellets are sintered to increase the density and the toughness of the
sample at a higher temperature with soak time as little as possible.
The various steps involved in the solid state reaction process are presented in the
following flow-chart (Fig. 2.1 )
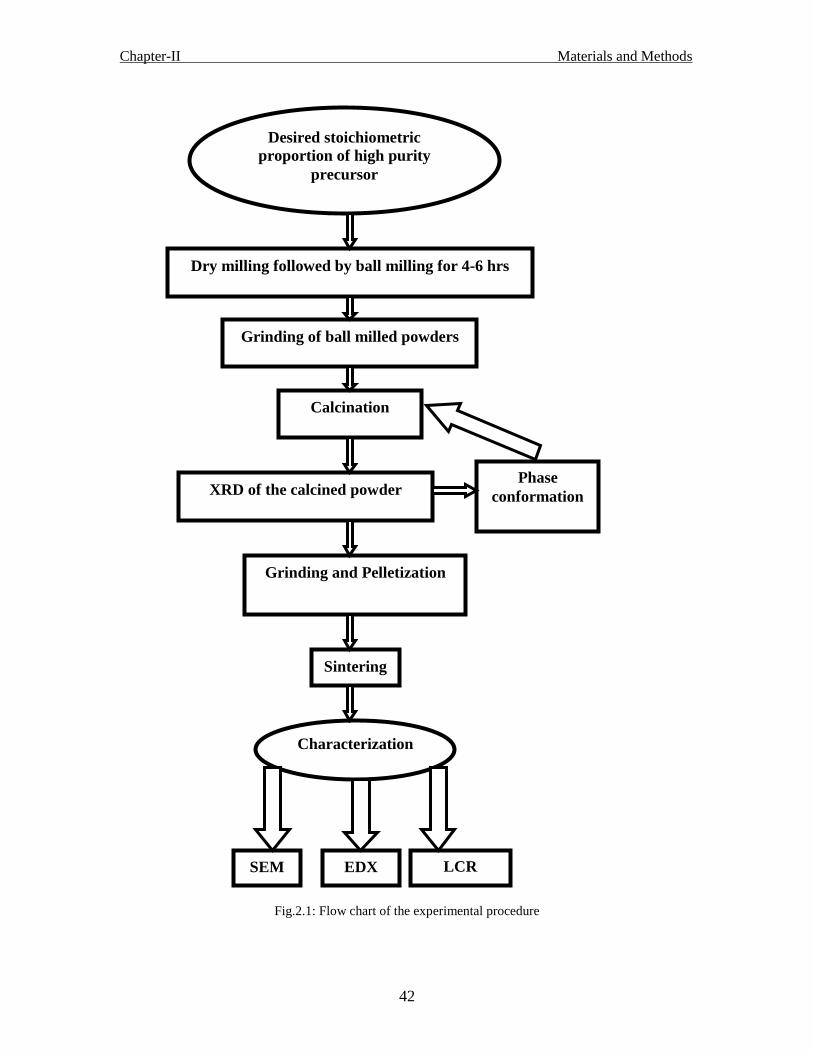
Chapter-II Materials and Methods
42
Fig.2.1: Flow chart of the experimental procedure
Desired stoichiometric
proportion of high purity
precursor
Dry milling followed by ball milling for 4-6 hrs
Calcination
XRD of the calcined powder
Grinding of ball milled powders
Grinding and Pelletization
Sintering
Characterization
SEM EDX LCR
meter
Phase
conformation
Chapter-II Materials and Methods
43
2.2.1 Preparation of barium calcium titanate ceramics (Ba1-xCaxTiO3 )
Ba1-xCaxTiO3 ceramics were prepared from BaCO3, CaCO3 and TiO2. High-purity
reagents (> 99% ) were used for the preparation of the ceramics. The equimolar wt% of
the compounds were homogeneously mixed by a planetary ball mill for 3 hours in
acetone medium in a zirconia vial containing zirconia balls (40 nos.) at a speed of 300
rpm. The grounded powder was grinded for 2 hours in an agate mortar and then calcined
initially at a temperature of 1280 °C for 5 h. The calcined powder was milled again to
prepare the ceramic discs.
2.2.2 Preparation of barium praseodymium titanate ceramics (Ba1-xPrx
TiO3)
Ba1-xPrxTiO3 ceramics were prepared from BaCO3, Pr6O11 and TiO2. High-purity
reagents (> 99% ) were used for the preparation of the ceramics. The equimolar wt% of
the compounds were homogeneously mixed by a planetary ball mill for 3 hours in
acetone medium in a zirconia vial containing zirconia balls (40 nos.) at a speed of 300
rpm. The grounded powder was grinded for 2 hours in an agate mortar and then calcined
initially at a temperature of 1400 °C for 4 h. The calcined powder was milled again to
prepare the ceramic discs.
2.2.3 Preparation of barium dysprosium titanate ceramics (Ba1-xDyxTiO3
)
Ba1-xDyxTiO3 ceramics were prepared from BaCO3, Dy2O3 and TiO2. High-purity
reagents (> 99% ) were used for the preparation of the ceramics. The equimolar wt% of
Chapter-II Materials and Methods
44
the compounds were homogeneously mixed by a planetary ball mill for 3 hours in
acetone medium in a zirconia vial containing zirconia balls (40 nos.) at a speed of 300
rpm. The grounded powder was grinded for 2 hours in an agate mortar and then calcined
initially at a temperature of 1400 °C for 4 h. The calcined powder was milled again to
prepare the ceramic discs.
2.3 Preparation of ceramic discs
The phase-pure titanate powder was mixed with 0.4 wt% polyvinyl alcohol (PVA) as the
binder and dried thoroughly. The granulated powders were cold pressed into disks of
around 0.7 mm thickness and 10 mm diameter using a hydraulic press at a pressure of
500 MPa. The green density of these pellets ranged from 87-97% of the theoretical
density.
2.4 Sintering of the ceramics
The pressed pellets were sintered in a high-temperature furnace on an alumina slab. The
heating rate, dwelling time, sintering temperature and the cooling rate were optimized
because of the strong influence of the sintering conditions on the electrical properties.
While the sintering temperature has strong influence on the microstructure of the
resulting ceramics, the cooling rate modifies the electrical properties of the titanate
ceramics. A constant heating rate of 5 C/min was maintained up to the prefiring stage
(650 oC) where the binder was burnt-off.
Chapter-II Materials and Methods
45
Subsequently, the heating rate was maintained at 300 oC/h until sintering temperatures.
Depending on the composition, the sintering temperature and duration were varied.
Typically, the sintering temperature ranged between 1280-1480 0C. The sintering
temperature was varied to yield variable microstructure and to achieve high sinter density
of the specimens. The density of the samples was determined using Archimedes method.
Sintered density of >93% was obtained in most cases.
2.5 Polishing
The ceramic surface was abraded on a series of metallographic abrasive papers by a
circular or figure „8‟ motion to obtain highly-polished surfaces which were used for
electrical measurements. The samples were subsequently cleaned ultrasonically in water
and acetone. The polished specimens were thermally etched at temperature of about 50 to
100 oC for 10-20 minutes. The specimens were coated with about 200 Å thin Pt layer by
DC sputtering (Jeol, JFC-1600 auto fine coater) to prevent charging during their
examination by scanning electron microscopy.
2.6 Ohmic contacts for electrical measurements
The bulk electrical properties of the ceramics are obtained only when a good Ohmic
contact having the least contact resistance is used. Commercially available silver paints
with polymer base are found to yield very high contact resistance. Good Ohmic contacts
were provided to the sintered disks by coating fired-on-silver paste. The fired-on-silver is
a glass-bonded composite which contains metal-rich (Ag) composition and the volume
Chapter-II Materials and Methods
46
fraction of the glass components are 20-30 %. It forms good adherence to the ceramic
surface. Direct soldering of the electrical contacts is possible on these electrodes.
2.7 Physical methods for characterization
The various experimental techniques used for the characterization of the ceramic samples
are as follows;
2.7.1 X-ray powder diffraction studies
XRD is a very convenient and nondestructive method for phase identification. From the
XRD pattern we can say whether the compound is crystalline or amorphous. The results
also give the information whether the compound is in single phase or multiphase. The
powder XRD method is used to calculate the lattice parameters for establishing or
confirming the formation of solid solution.
X-ray diffraction is a powerful analytical technique for investigating the structure of
materials. Crystalline materials diffract X-rays, and in doing so reveal their structure.
With the advancement of the technique, all branches of science and technology now
make use of the technique. The application ranges from fundamental research into the
structure of matter to quality control of commercial products.
2.7.2 Production of X-rays [1]
X-rays are produced when high-energy particles interact with matter. In this process,
electrons are ejected from the core shell around the nucleus and the resulting hole is filled
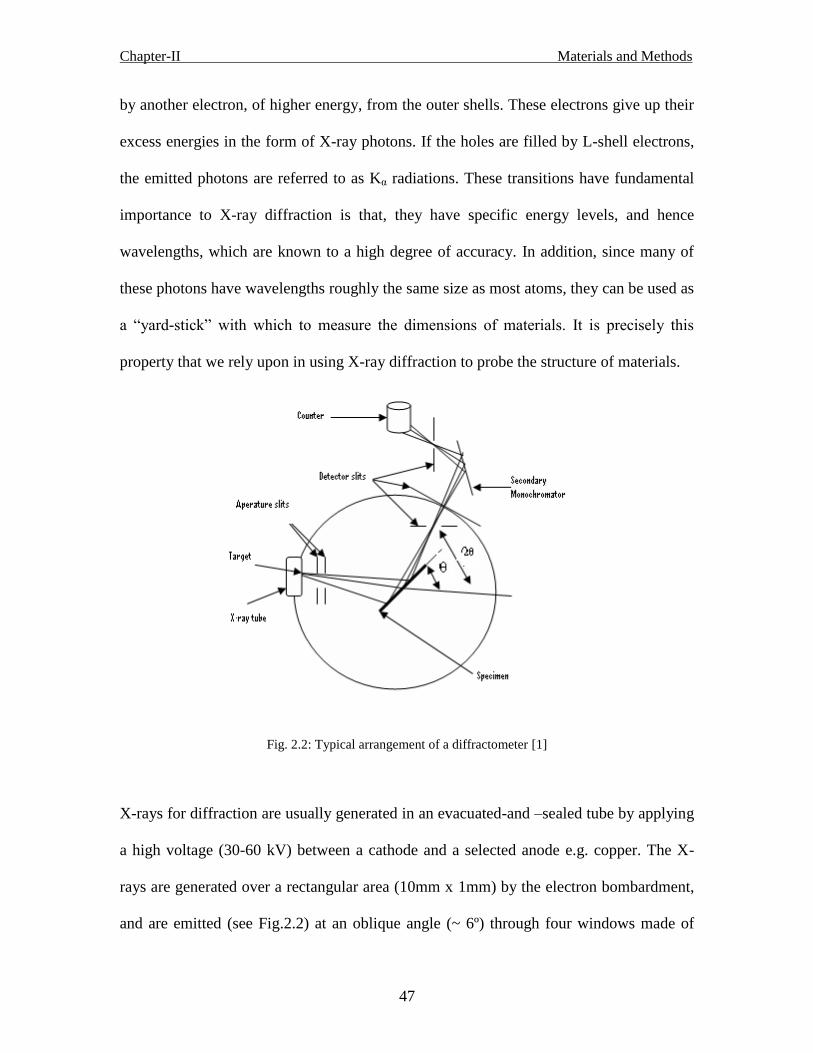
Chapter-II Materials and Methods
47
by another electron, of higher energy, from the outer shells. These electrons give up their
excess energies in the form of X-ray photons. If the holes are filled by L-shell electrons,
the emitted photons are referred to as Kα radiations. These transitions have fundamental
importance to X-ray diffraction is that, they have specific energy levels, and hence
wavelengths, which are known to a high degree of accuracy. In addition, since many of
these photons have wavelengths roughly the same size as most atoms, they can be used as
a “yard-stick” with which to measure the dimensions of materials. It is precisely this
property that we rely upon in using X-ray diffraction to probe the structure of materials.
Fig. 2.2: Typical arrangement of a diffractometer [1]
X-rays for diffraction are usually generated in an evacuated-and –sealed tube by applying
a high voltage (30-60 kV) between a cathode and a selected anode e.g. copper. The X-
rays are generated over a rectangular area (10mm x 1mm) by the electron bombardment,
and are emitted (see Fig.2.2) at an oblique angle (~ 6º) through four windows made of
Chapter-II Materials and Methods
48
beryllium. If viewed side-on, the beam can be considered as coming from a line focus,
and end-on as from a point focus. There must be adequate cooling of the tube to extract
the heat generated, and there must be adequate safety from both X-rays and high voltage
The X-ray spectrum obtained from such a tube must be pure. There is a background of
continuous radiation, on which the characteristic peaks from the Kα and Kβ radiations
superimposed. The Kα is usually 5-8 times more intense than that of Kβ radiation, and is,
in reality, made up of a doublet – α 1 and α 2. This doublet can be resolved in suitable
circumstances in a diffraction pattern.
2.7.3 Principle
In powder X-ray diffraction (XRD) technique, a beam of X-rays incident on a crystalline
material undergoes scattering by the electrons associated with the atoms. The scattered
X-rays, in turn, undergo interference due to the periodic arrangement of atoms in the
crystal and its symmetry. The interference is constructive in certain directions, giving rise
to a resultant diffracted beam in that direction (see Fig. 2.3) with enhanced X-ray
intensity. The interference is destructive in other directions. The Bragg‟s equation forms
the basis of X-ray diffraction, which determines the conditions of constructive
interference of X-ray, i.e.
nd sin2 ….(1)
where d = the inter-planner spacing, = the wavelength of incident X-rays, and = the
angle of diffraction. This equation is the basis of most X-ray diffraction analysis, and

Chapter-II Materials and Methods
49
usually involves fixing one of the parameters and measuring the variation in the second
parameter as a function of the third.
Fig. 2.3: Diffraction of X-rays
2.7.4 Specimen preparation
Specimen is representative of the material being investigated. The size of the crystallites
in the material should be less than ~ 45 µm. This is necessary to increase the probability
of diffraction taking place, and being collected. Too small size will cause peak
broadening. There should be no distortion of the lattice planes during preparation. This is
because deformation will reduce the quality of the diffraction pattern by broadening the
peaks. The top surface of the specimen must be flat so that it is always a tangent to the
circumference of the focusing circle. Deviation from the flatness and from the correct
specimen height can cause broadening of the diffraction profile, displacement of the peak
and incorrect intensity measurement.

Chapter-II Materials and Methods
50
2.7.5 Significance of diffraction peaks
The diffraction pattern consists of a number of sharp peaks with different intensities and
various widths. These variations are of fundamental importance in X-ray diffraction and
are a signature of the d-spacing of the planes giving rise to each reflection, and also the
intensity and width of each diffraction peak.
The d-spacing is determined by measuring the position of a peak in angular terms and can
be obtained from the above Eq. (1). The width of a peak can be defined, in angular terms,
either by the full width at half maximum intensity (FWHM), i.e. 2
maxI; or the integral
breadth, which is the width of a rectangle whose height is equal to Imax and whose area is
equal to the integrated intensity. Usually, the diffracted intensities are expressed relative
to the strongest peak in the diffraction pattern in %. The intensity I of a diffracted beam,
relative to that of the incident beam, can be expressed by the equation [2]
2
FI m L-P A(θ) e-2M
….(2)
where F is the structure factor, m is multiplicity, L-P is the Lorenz-polarization factor,
A( ) is the absorption factor and e-2M
is the temperature factor.
2.7.6 Qualitative analysis
The next stage after getting the X-ray diffraction data is to use this information to identify
the material(s). Since this identification is on the basis of structure and chemistry, the
identification of allotropes is possible. The usual method of doing this is to compare the
results with a reference database, either of one‟s own making, or, more usually, that

Chapter-II Materials and Methods
51
initiated by the American Society for Testing materials (ASTM) and now run by the Joint
Committee for Powder Diffraction Standards – International Centre for Diffraction data
(JCPDS – ICDD).
To use this database one may make use of the Hanawalt search index procedure. This is a
powerful procedure for identifying materials, particularly with the aid of computes which
now contain the whole of the JCPDS file on the hard disc and allow a search match
routine for phase analysis to be carried out very rapidly. Hence the search time is
drastically reduced. For better use of this approach, one should have some pre-defined
knowledge of the instruments and the material.
2.7.7 Quantitative analysis
Once the constituent phases in a mixture have been identified, it may be necessary to
measure the exact amount of a particular phase. There are three different methods to find
out the exact amount of a particular phase in a mixture of phases; they are external
standard method, internal standard method and direct comparison method. Out of these,
the internal standard method is suitable for studying powders because of its technical
merit, and, probably the direct comparison method is the most widely used method in the
metallurgical field.
The other parameters that can be calculated from the diffraction data (pattern) are lattice
parameters, lattice strain: plastic strain and elastic strain, residual stress, crystallite size,

Chapter-II Materials and Methods
52
L-P function, N-R function and their different relations. There is long list to find out the
different parameters, but as per the requirement, we do find the intended parameters only.
2.7.8 Instrumentation
An X‟Pert-MPD PANalytical X-ray diffractometer (X‟Pert-MPD, PANalytical, The
Netherlands) with PW 3020 vertical goniometer having Bragg-Brentano parafocusing
optics and PW3710MPD control unit, has been used for the X-ray diffraction study. The
geometry of Bragg-Brentano parafocusing optics was employed for the high-resolution
X-ray powder diffraction study. In the present system, there is a provision to get both
line- and point- focus X-ray beam. CuK -radiation from a high-power ceramic X-ray tube
(operated at 30 kV and 20 mA) is initially collimated through Soller slit of 0.04 rad,
fixed divergence slit (0.25 - 4 ) and mask (2 - 20 mm) before getting it diffracted from
the sample. Then, the diffracted beam from the sample is well collimated by passing it
through a programmable anti-scattering slit to reduce air scattering, programmable
receiving slit and Soller slit (parallel plate) of 0.04 rad before getting it reflected by the
Johann-type curved graphite crystal (002) of radius 225 mm as post monochromator. An
Xe-gas filled proportional counter (PW3011/10) of energy resolution 19% and maximum
count rate of 750 kcps (with 2 cps background) is mounted on the arm of the goniometer
circle at a radius of 200 mm to receive diffracted X-ray signal. Experimental control and
data acquisition are fully automated through computer.
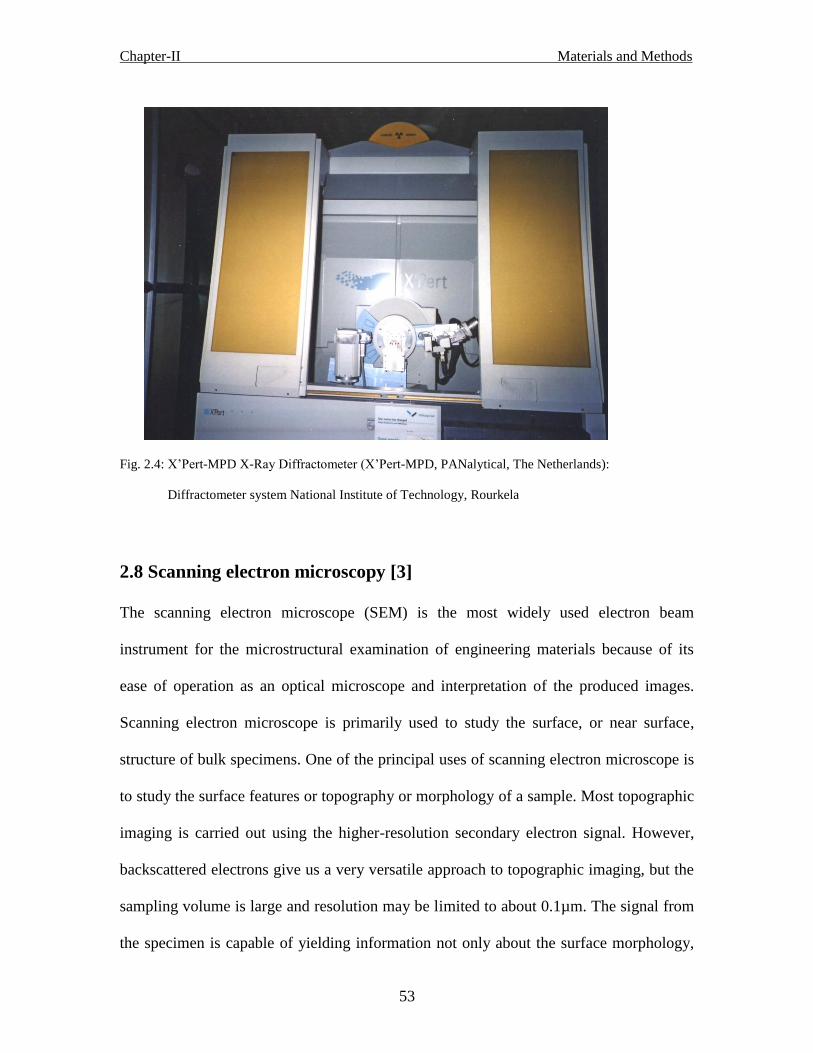
Chapter-II Materials and Methods
53
Fig. 2.4: X‟Pert-MPD X-Ray Diffractometer (X‟Pert-MPD, PANalytical, The Netherlands):
Diffractometer system National Institute of Technology, Rourkela
2.8 Scanning electron microscopy [3]
The scanning electron microscope (SEM) is the most widely used electron beam
instrument for the microstructural examination of engineering materials because of its
ease of operation as an optical microscope and interpretation of the produced images.
Scanning electron microscope is primarily used to study the surface, or near surface,
structure of bulk specimens. One of the principal uses of scanning electron microscope is
to study the surface features or topography or morphology of a sample. Most topographic
imaging is carried out using the higher-resolution secondary electron signal. However,
backscattered electrons give us a very versatile approach to topographic imaging, but the
sampling volume is large and resolution may be limited to about 0.1µm. The signal from
the specimen is capable of yielding information not only about the surface morphology,

Chapter-II Materials and Methods
54
but also the composition. For compositional imaging, the solid angle of the detector
should be as large as possible, and therefore, short working distance and large active
detector areas are desirable.
2.8.1 Working principle
The scanning electron microscope (SEM) employs a beam of high energy electrons
directed at the specimen. These electrons are produced from an electron gun (see Fig.
2.5) usually of the tungsten-filament, thermionic-emission type, accelerated in a potential
difference typically of the order of 10-20 kV. Two or three condenser lenses demagnify
the electron beam to form an electron spot of a size of the order of a few nm. When the
energetic electrons hit the surface under investigation, secondary electrons (SE) are
emitted, some incident electrons are being backscattered (BSE), X-rays are emitted (X)
and a current is measured to the sample (SC and EBIC). A deflection coil system scans
the focused electron beam in a raster across the surface. In synchronism with this is an
electron beam of a separate cathode-ray tube (CRT) scanned over the screen, while the
intensity of the CRT is modulated by one of the signals SE, BSE, X, or SC and EBIC to
form an image of the surface.

Chapter-II Materials and Methods
55
Fig.2.5: A schematic representation of the scanning electron microscope
When a high energy electron beam impinges on a thick specimen, then the electrons in
the beam interact with the material and lose energy and change direction. As Fig. 2.6
shows, electron X loses all its energy to the specimen, whereas electrons Y and Z escape
from the surface as backscattered electrons before they have lost all their energy. As
electron Y has traveled further through the material than electron Z, it will emerge as a
backscattered electron of lower energy. The energy lost by the incident electrons excites
various secondary emissions from the material. Any radiation from the specimen may be
used to provide the signal to modulate the CRT and thus provide contrast in the image.
Each signal is the result of some particular interaction between the incident electron and
the specimen, and may provide us with different information about the specimen.

Chapter-II Materials and Methods
56
Fig.2.6: Typical paths for high-energy electrons in a solid
2.8.2 Secondary Electrons
Secondary electrons are outer-shell atomic electrons, ejected after collision with incident
electrons, and they are generated throughout the passage of the incident electrons.
Secondary electrons are of low energy and easily absorbed by the material. The
secondary electrons strike a scintillator, e.g. a phosphor or a YAG crystal, which then
emits light. The light is transmitted through a light pipe, and into a photomultiplier which
converts the photons into pulses of electrons, which may then be amplified and used to
modulate the intensity of the CRT. Although secondary electrons are generated both by
the primary electrons entering the specimen and by the escaping backscattered electrons,
the former are more numerous, and, therefore, the detected secondary electron signal
originates mainly from a region which is a little larger than the diameter of the incident
beam.

Chapter-II Materials and Methods
57
2.8.3 Backscattered electrons
Backscattered electrons, which are traveling in the appropriate direction, will hit the
scintillator of the detector, and be counted. If the scintillator bias is switched off, or the
collector given a small negative voltage, then secondary electrons are excluded from the
detector, and the backscattered signal is obtained. However, only those electrons
traveling along the direct line of sight towards the detector will be collected, and thus the
geometric efficiency will be very low. Though this method of detection is now rarely
used, most microscopes are fitted with purpose-built backscattered electron detectors.
2.8.4 Parameters of an SEM
The process of image formation in the scanning electron microscope depends on the
picture element or pixel. The pixels are the fundamental units of the image, and can be
considered as squares of diameter with a uniform intensity and no internal structure. The
spot on the CRT mimics the movement of the electron beam on the specimen, and,
therefore, for each of the pixels on the CRT there is a corresponding pixel on the
specimen.
If the electron probe is larger than the specimen pixel, then the signal from adjacent
pixels is merged, and hence the resolution is degraded. If the electron probe is smaller
than the specimen pixel, then the signal will be noisy. Thus, it is clear that for optimum
performance of the instrument, the probe diameter should be equal to the specimen pixel
diameter.

Chapter-II Materials and Methods
58
The depth of field, convergence angle and the working distance play an important role in
focusing the image. Secondary electrons have the smallest sampling volume, with a
diameter a little larger than the probe diameter. As the probe diameter is reduced, the
beam current is decreased and, ultimately, the beam current will be insufficient to
generate a useable signal. So the ultimate resolution of the SEM can be defined as that
produced by the smallest probe which can provide an adequate signal from the specimen.
2.8.5 Morphology
Although topographic images may be obtained using most signals, we will only consider
the use of secondary and backscattered electrons. Images obtained with secondary
electrons look remarkably like the images of solid objects viewed with light. As we are
accustomed to this sort of images, we find these topographic images easy to interpret.
Topographic images may also be obtained using backscattered electrons. As only line of
sight backscattered electrons are detected, the number of electrons detected is a function
of both the specimen and detector geometries. These images have a close analogy with
viewing a specimen by eye. The images obtained in this case have more shadows and
highlights, i.e. they appear harsher compared to secondary electron image.
Although backscattered electrons give us a very versatile approach to topographic
imaging, we must remember that the sampling volume for the backscattered electrons is
large and resolution is small. Consequently, most topographic imaging s carried out using
the higher-resolution secondary electron signal.

Chapter-II Materials and Methods
59
2.8.6 Compositional imaging
The specimen signal is capable of yielding information about the composition along with
the topography. Specimen for compositional imaging should be flat, un-etched and
polished. For compositional imaging, the solid angle of the detector should be as large as
possible, and therefore short working distance and large active detector areas are
desirable. Although we may be able to detect two phases in a specimen, but it is not that
easy with very good spatial resolution, as the ultimate resolution of the instrument is
dependent on the contrast. For phases with similar atomic numbers the resolution may be
very poor.
With the advent of improved backscattered electron detectors over the past few years, use
of this imaging mode in the SEM has increased greatly, particularly in conjunction with
X-ray analysis. A standard polished metallographic specimen is prepared, and the areas
of compositional interest, are easily identified by backscattered imaging. The chemistry
of the phases is then determined by spot analysis of each of the phases using energy
dispersive X-ray analysis. It is also possible to obtain quantitative compositional
information by measuring the intensity of the backscattered signal from the phase of
interest.
This technique is potentially valuable on account of its high spatial resolution, compared
to X-ray analytical techniques, and for its ability to analyze phases of low atomic number
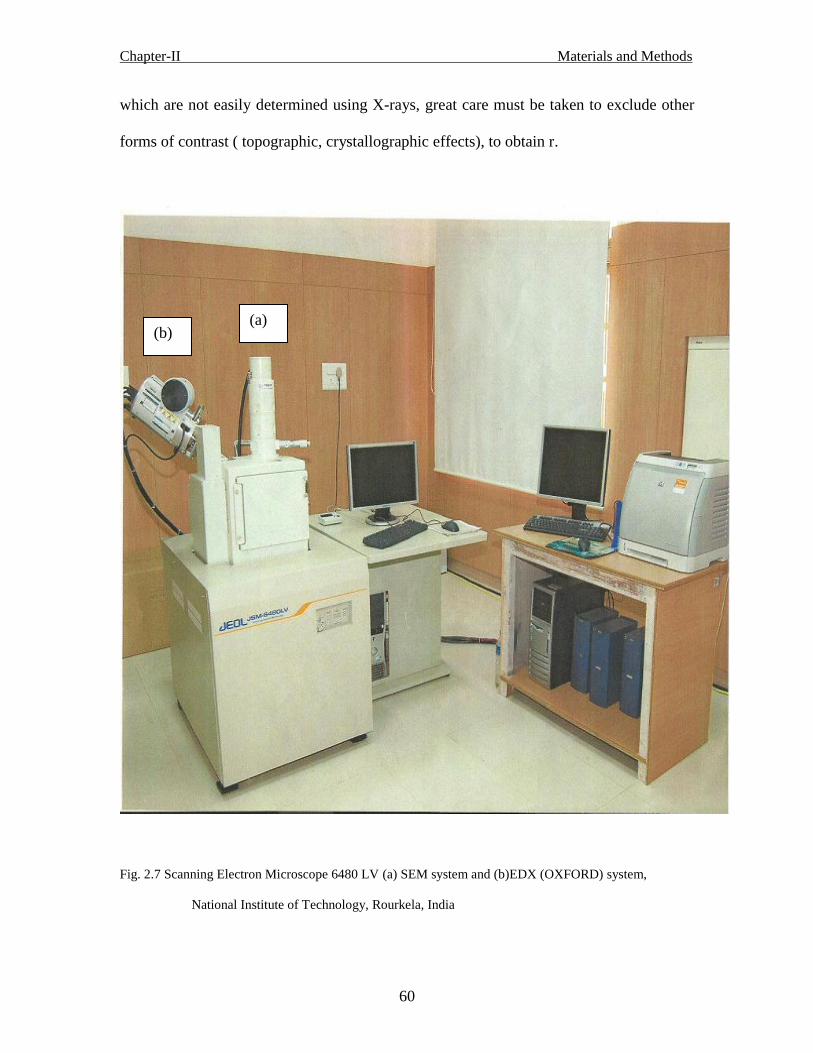
Chapter-II Materials and Methods
60
which are not easily determined using X-rays, great care must be taken to exclude other
forms of contrast ( topographic, crystallographic effects), to obtain r.
Fig. 2.7 Scanning Electron Microscope 6480 LV (a) SEM system and (b)EDX (OXFORD) system,
National Institute of Technology, Rourkela, India
(a) (b)

Chapter-II Materials and Methods
61
2.9 Dielectric measurement
When the dielectric is placed in alternating fields, different types of polarisations are set
up and give rise to the dielectric constant. A temporal phase shift is found to occur
between the driving field and the resulting polarisation and a loss current component
appears giving rise to the dielectric loss of the sample. The dielectric measurement
method involves placing the dielectric (usually taken in the form of a disc) between two
perfectly conducting plates. For dielectric measurement, thin silver paints were painted
on to opposite faces of the ceramic disc using a fine brush. For organic removal, the
electroded discs were kept on an alumina plate and fried at 4700 oC, 10-15 minutes.
Dielectric measurements were carried out over the range 1 KHz to 1 MHz using HP-
4284A Precision LCR meter. The temperature dependency of dielectric measurement was
carried out with a self-fabricated temperature controlled oven with a heating rate of 0.5°C
min -1
. The dielectric data was collected at an interval of 5 0C while heating at a rate of
0.5 oC per min. The detailed theory of dielectric is explained in Chapter-VI, along with
the explanation of the dielectric studies of different samples.

Chapter-II Materials and Methods
62
Fig.2.8(a) The Hewlett Packard (hp) 4284A-Precision LCR meter at IOPb, (b) Experimental set-up for
dielectric measurement with (c) self fabricated oven in-set
(c)
(b)
(a)
(c)

Chapter-II Materials and Methods
63
References:
[1] M.R.Panigrahi, Nano Digest, Vol-1, issue-4, pp 24-27, September 2009.
[2] B.D.Culity, Elements of x-ray diffraction, Addison-Wesley Publishing Company, Inc.,
London,1978.
[3] M.R.Panigrahi, Nano Digest, Vol-1, issue-5, pp 24-27, October 2009.
[4] P. Murugraj, T. R. N. Kutty and M. Subba Rao, J. Mat. Sci., 21, (1986) 3521.

X-Rays Powder Diffraction Studies
Chapter-III

Chapter-III X-ray Powder Diffraction Studies
65
X-RAYS POWDER DIFFRACTION STUDIES
3.1 Experimentation
The fine smooth ceramic powder samples were mounted on a holder and leveled properly
flat to get good result of the X-ray diffraction. The X-ray diffraction patterns were
recorded with a step size of 0.02 on a 10/20 -80/90 range with a scanning rate of 0.
6 /sec with a scan speed of 0.33. A line focus and collimated CuK -radiation from an X-
ray tube operated at 30 kV and 20 mA was passed through fixed divergence slit of 0.5
and mask (10 mm) before getting it diffracted from the fibre sample. Then the diffracted
beam from the sample was well collimated by passing it through a programmable anti-
scattering slit of 0.5 , receiving slit of 0.15 mm and Soller slit before getting it reflected
by the graphite monochromator. Experimental data such as d spacing, area of the
diffraction peak and intensity were calculated using X’Pert Graphics & Identify software
[1].
3.1.1 Theory
The diffracted intensity can be expressed as either the maximum counts, Imax, or, more
accurately, the integrated intensity. In either case, they are usually expressed relative to
the strongest peak in the diffraction pattern. The intensity I of a diffracted beam, relative
to that of incident beam, can be expressed by the equation [2]
MePAmLFI 22)( ….(1)
where F is the structure factor, m is multiplicity, L-P is the Lorenz-polarization factor,
A( ) is the absorption factor and e-2M
is the temperature factor.
Chapter-III X-ray Powder Diffraction Studies
66
Addition of impurity atoms to the parent materials causes the peak shifting due to
stacking fault and which can be verified by differentiating the Bragg law. The spacing
dhkl, of a set of planes in a crystal is related to the Bragg angle θhkl and the wavelength λ
by the equation,
hkl
hkldsin2
....(2)
The expression for change in dhkl due to stacking faults can be measured by noting the
change in hkl. It is found that the dhkl value of (110) plane decreases with increasing the
impurity concentration. Differentiating dhkl with respect to hkl, where diffraction angle is
measured in terms of 2 , then
hkl
hkl
hkld
dtan2)2( ….(3)
where d is the change in d-spacing with respect to virgin (parent) sample. The quantity
d / dhkl is the strain due to the substitution of the Ca ion in place of Ba ion. The
percentage stain (% ) calculated for the (110) plane is given in the Table 1.
Again, crystallite size (Dhkl) of the identified crystalline phase is calculated using
corrected form of Scherrer formula as [3]
cosβ
KDhkl ….(4)
where β (= B - b) is the FWHM (full width at half maximum); B is the line width; b is the
instrumental broadening; K is the shape factor (= 0.9); is the Bragg angle and is the
wavelength of Cu K 1(1.54056 Å). The factor 57.3 is used to convert the value of β
from degree to radians to obtain Dhkl in angstrom unit (Å). However, the instrumental
broadening [4] can be calculated as
Chapter-III X-ray Powder Diffraction Studies
67
G
R
R
Warcb tan
2
2tan
2 ….(5)
where is the resolution of diffractometer (2.5 10-3
), is the Bragg (or glancing)
angle, RW is the receiving slit width (1 mm) and GR is the radius of goniometer (200 mm).
The sample crystallinity can be defined as
100%total
cryst
A
AC ….(6)
where Acryst is the sum of the areas of the crystalline peaks and Atotal is the total area of the
diffraction pattern. The decrease in crystallinity may be due to the loss of densification
because of replacement of less heavier element like Ca in place of Ba.
Particle size and lattice strain have different dependences on Bragg angle, so it is
necessary it isolate their individual contributions. The contribution of plastic strain (e) to
line broadening varies as tan4e , while that of particle size (t) varies as cost
. The
total contribution to line broadening ( ) therefore becomes
cos
tan4t
e ….(7)
Lorenz-polarization (L-P) factor is made up of two parameters, Lorenz and polarization,
which are grouped together for convenience and is expressed by
cossin
2cos12
2
.… (8)
Both are purely geometric in nature, and dependent on the diffraction angle. Their overall
effect is to decrease the intensity of reflections at low and high Bragg angles.

Chapter-III X-ray Powder Diffraction Studies
68
Nelson-Riley (N-R) function as a function of given by
22 cos
sin
cos ….(9)
is used to find the lattice parameters by extrapolation method. This is the most accurate
compared to other methods.
3.2 Results and discussion
3.2.1 Results and discussion of Ba1-xCaxTiO3 ceramics [5]
The structures of Ba1-xCaxTiO3 ceramics were determined by X-ray diffraction technique.
The XRD patterns of Ba1-xCaxTiO3 ceramics of concentration (x) = 0, 0.05, 0.1, 0.15, 0.2,
0.25, 0.3, 0.4 and 0.5 are shown in Fig. 3.1. In this figure and figure 3.2 the intensities are
given in arbitrary units (AU). It is well known that Ba1-xCaxTiO3 ceramics are tetragonal.
The crystal structure of above ceramics is tetragonal symmetry in the space group p4mm
with a = b = 3.990Aº and c = 4.03Aº. The purpose of this work is to determine the effect
of Ca substitution in barium titanate. The X-ray powder diffraction data on the effect of
doping concentrations are given in the Table 1. It is observed in Fig.1 that the addition of
impurity atoms to the parent materials causes the peak shifting towards higher angle and
indicate development of strain in the materials, and peak broadening due to creation of
stacking fault. The shifting of the peak position can be clearly visualized from the
normalized diffractogram of the (110) direction, shown in Fig.3.2. In the XRD profile,
the 100% relative intensity (Imax) peaks play an important role in understanding the
structure of the materials. Fig. 1 shows the evolution of new peak i.e. phase at x=0.3 at
around 33 deg (2θ) which becomes stronger with increasing doping concentration. Also
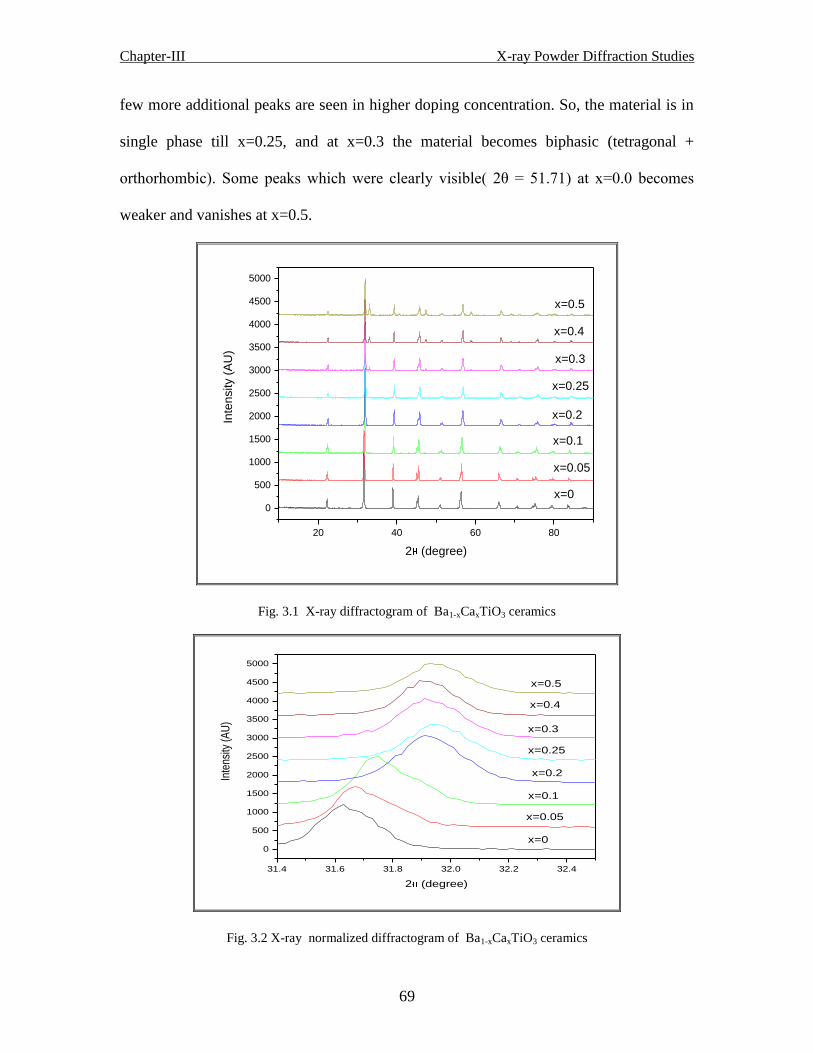
Chapter-III X-ray Powder Diffraction Studies
69
few more additional peaks are seen in higher doping concentration. So, the material is in
single phase till x=0.25, and at x=0.3 the material becomes biphasic (tetragonal +
orthorhombic). Some peaks which were clearly visible( 2θ = 51.71) at x=0.0 becomes
weaker and vanishes at x=0.5.
20 40 60 80
0
500
1000
1500
2000
2500
3000
3500
4000
4500
5000
Inte
nsity (
AU
)
2 (degree)
x=0.5
x=0.4
x=0.3
x=0.25
x=0.2
x=0.1
x=0.05
x=0
Fig. 3.1 X-ray diffractogram of Ba1-xCaxTiO3 ceramics
31.4 31.6 31.8 32.0 32.2 32.4
0
500
1000
1500
2000
2500
3000
3500
4000
4500
5000
x=0.5
x=0.4
x=0.3
x=0.25
x=0.2Inte
nsity
(A
U)
2 (degree)
x=0.1
x=0.05
x=0
Fig. 3.2 X-ray normalized diffractogram of Ba1-xCaxTiO3 ceramics
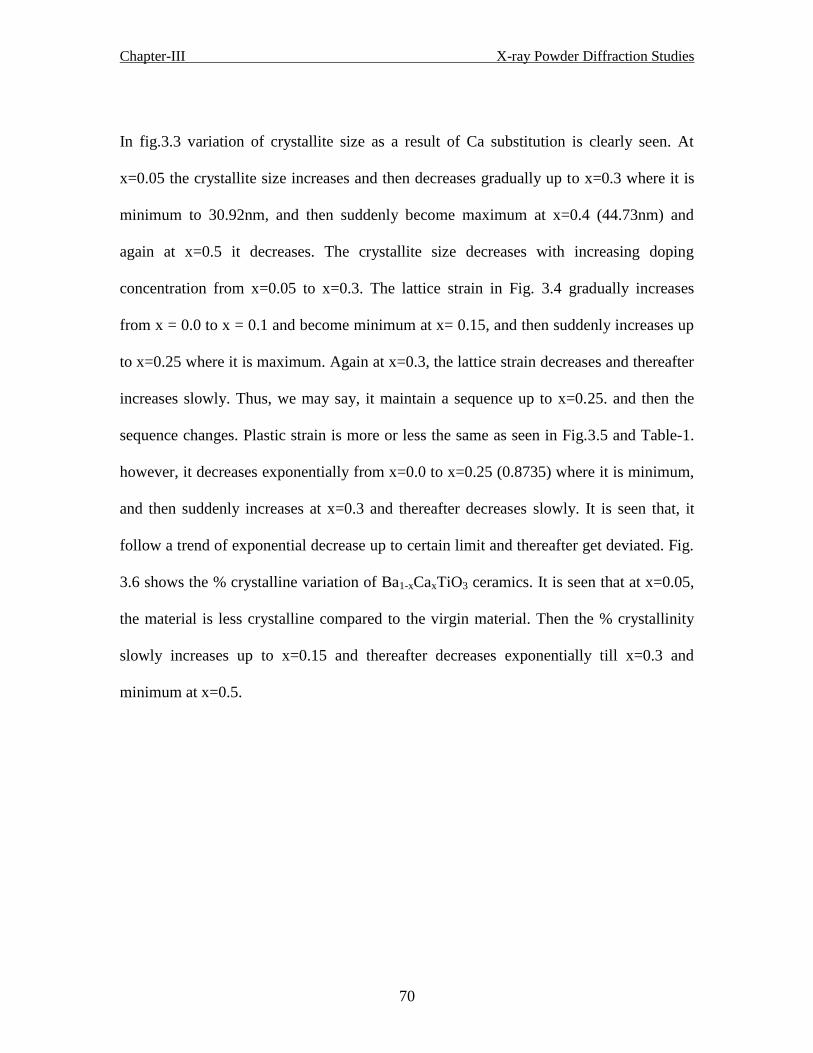
Chapter-III X-ray Powder Diffraction Studies
70
In fig.3.3 variation of crystallite size as a result of Ca substitution is clearly seen. At
x=0.05 the crystallite size increases and then decreases gradually up to x=0.3 where it is
minimum to 30.92nm, and then suddenly become maximum at x=0.4 (44.73nm) and
again at x=0.5 it decreases. The crystallite size decreases with increasing doping
concentration from x=0.05 to x=0.3. The lattice strain in Fig. 3.4 gradually increases
from x = 0.0 to x = 0.1 and become minimum at x= 0.15, and then suddenly increases up
to x=0.25 where it is maximum. Again at x=0.3, the lattice strain decreases and thereafter
increases slowly. Thus, we may say, it maintain a sequence up to x=0.25. and then the
sequence changes. Plastic strain is more or less the same as seen in Fig.3.5 and Table-1.
however, it decreases exponentially from x=0.0 to x=0.25 (0.8735) where it is minimum,
and then suddenly increases at x=0.3 and thereafter decreases slowly. It is seen that, it
follow a trend of exponential decrease up to certain limit and thereafter get deviated. Fig.
3.6 shows the % crystalline variation of Ba1-xCaxTiO3 ceramics. It is seen that at x=0.05,
the material is less crystalline compared to the virgin material. Then the % crystallinity
slowly increases up to x=0.15 and thereafter decreases exponentially till x=0.3 and
minimum at x=0.5.

Chapter-III X-ray Powder Diffraction Studies
71
0.0 0.1 0.2 0.3 0.4 0.5
30
32
34
36
38
40
42
44
46
Dhkl (
nm
)
Composition
Fig. 3.3 Composition vs. Crystallite Size of Ba1-xCaxTiO3 ceramics
0.0 0.1 0.2 0.3 0.4 0.5
0.000
0.002
0.004
0.006
0.008
0.010
La
ttic
e s
tra
in
Composition
Fig. 3.4 Composition vs. Lattice Strain of Ba1-xCaxTiO3 ceramics

Chapter-III X-ray Powder Diffraction Studies
72
0.0 0.1 0.2 0.3 0.4 0.5
0.872
0.874
0.876
0.878
0.880
0.882
0.884
Pla
stic s
tra
in
Composition
Fig. 3.5 Composition vs. Plastic Strain of Ba1-xCaxTiO3 ceramics
0.0 0.1 0.2 0.3 0.4 0.5
88
90
92
94
96
98
100
% C
C o m p o s i t i o n
Fig.3.6 Composition vs. % Crystallinity of Ba1-xCaxTiO3 ceramics

Chapter-III X-ray Powder Diffraction Studies
73
Fig. 3.7 shows the effect of line broadening as a result of Calcium doping and is almost
same from x=0.05 to x=0.25, but, at x=0.3 it becomes more and minimum again at x=0.4
(0.10035nm) and further at x=0.5 increases. Thus we may say the stable region is x=0.05
to x=0.25. Here also it is seen that, it maintain certain trend till x=0.25. Fig. 3.8 shows the
behavior of L-P geometric factor dependent on Bragg diffraction angle. It shows almost
linear behavior and exponential decrease till x=0.25, though there is a very slight
decrease from x=0.0 to x=0.5. Till x=0.25 the L-P factor decreases gradually (Table-1),
then again there is a slight increase in value at x=0.3 and then again decreases. Fig. 3.9
shows the variation of N-R factor due to the doping of Calcium on barium titanate. The
N-R factor decreases exponentially almost exponentially till x=0.25, then increases at
x=0.3 and further decreases slowly. Its nature is almost same as that of the plastic strain.
Here also the N-R factor follows a trend till x=0.25 and thereafter it deviates from that
particular sequence. This deviation may be due to some Ca2+
replacing Ti4+
instead of
Ba2+
in this ceramic [6]. Since the ion radius for Ca2+
is much larger than that of Ti4+
,
Ca2+
replacing Ti4+
in the octahedral sites of the perovskite structure will cause a
localized expansion of the unit cell, and result in a lattice distortion.
Porosity, which can be considered as a secondary phase, indicates the degree of
densification of a ceramic. Porosity decreases strength, because pores reduce the true
cross section area of a member and also pores act as stress-concentrating notches. In this
study, we found that the porosity of all the specimens is less than 8% (approx.), which
means that the pores are discrete and match with the porosity thumb rule [7].

Chapter-III X-ray Powder Diffraction Studies
74
0.0 0.1 0.2 0.3 0.4 0.5
0.10034
0.10036
0.10038
0.10040
0.10042
0.10044
0.10046
0.10048
0.10050
0.10052
Lin
e B
roa
de
nin
g (
)
Composition
Fig. 3.7 Composition vs. Line Broadening of Ba1-xCaxTiO3 ceramics
0.0 0.1 0.2 0.3 0.4 0.5
23.6
23.7
23.8
23.9
24.0
24.1
24.2
L-P
Fa
cto
r
Composition
Fig. 3.8 Composition vs. L-P Factor of Ba1-xCaxTiO3 ceramics

Chapter-III X-ray Powder Diffraction Studies
75
0.0 0.1 0.2 0.3 0.4 0.5
3.415
3.420
3.425
3.430
3.435
3.440
3.445
3.450
3.455
3.460
N-R
Fu
nctio
n
Composition
Fig. 3.9 Composition vs. N-R Function of Ba1-xCaxTiO3 ceramics
Table- 3.1: X-ray powder diffraction data of Ba1-xCaxTiO3 ceramics
Sample Conc.
x
2θ in
degree
dhkl (nm) I cts
(AU)
FWHM
(nm)
Dhkl
(nm)
%C
ε e (nm)
L-P
factor
N-R
FN
I x=0 31.6266 0.28267 998.36 0.02427 34.021 99.36 0 0.8828 0.10047 24.1430 3.4561
II x=0.05 31.6575 0.28241 981.84 0.02169 38.072 92.95 -0.0009 0.8818 0.10042 24.0854 3.4514
III x=0.1 31.7250 0.28182 1163.62 0.02191 37.698 95.08 -0.003 0.8797 0.10043 23.9884 3.4438
IV x=0.2 31.8902 0.28040 1193.57 0.02320 35.616 97.34 -0.0080 0.8750 0.10044 23.7186 3.4234
V x=0.25 31.9390 0.27998 910.75 0.02176 34.12 94.38 -0.010 0.8735 0.10042 23.6411 3.4177
VI x=0.3 31.8864 0.28043 1086.47 0.02672 30.924 92.62 -0.0079 0.8750 0.10051 23.7200 3.4234
VII x=0.4 31.9045 0.28028 913.72 0.01847 44.737 93.19 -0.0085 0.8747 0.10035 23.6986 3.4222
VIII x=0.5 31.9146 0.28019 771.64 0.02040 40.505 89.76 -0.0088 0.8744 0.10039 23.6786 3.4209

Chapter-III X-ray Powder Diffraction Studies
76
3.2.1.1 Conclusion
Single-phase BCT ferroelectric compounds were prepared by solid state reaction method.
The BCT ceramics exhibit a pure tetragonal phase for x from 0.00 up to 0.25, tetragonal
and orthorhombic phases coexisted for x = 0.3–0.5. A detailed study of X-ray diffraction
parameters shows, the material compounds follow a particular trend, either increasing or
decreasing up to x=0.25, and thereafter the trend is not followed, it breaks. Also the
material is in a single phase up to x=0.25, and after that it is in the dual phase confirmed
by the evolution of new peaks. This study shows a relation of various X-ray parameters
of Ba1-xCaxTiO3 ceramics. This gives a better understanding of the material. We may say,
the deviation of various parameter at x=0.3 may be due to the co-existence of different
phases. Whereas, x 0.25, it is in a single phase and follow a singular trend.
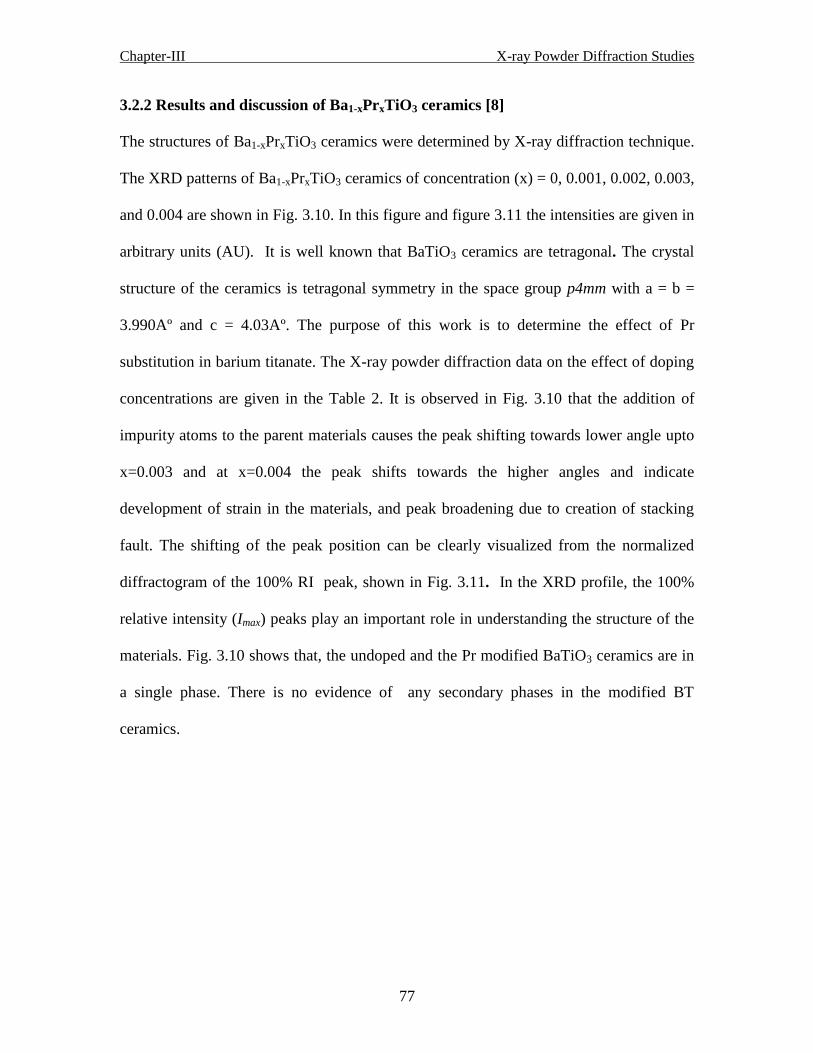
Chapter-III X-ray Powder Diffraction Studies
77
3.2.2 Results and discussion of Ba1-xPrxTiO3 ceramics [8]
The structures of Ba1-xPrxTiO3 ceramics were determined by X-ray diffraction technique.
The XRD patterns of Ba1-xPrxTiO3 ceramics of concentration (x) = 0, 0.001, 0.002, 0.003,
and 0.004 are shown in Fig. 3.10. In this figure and figure 3.11 the intensities are given in
arbitrary units (AU). It is well known that BaTiO3 ceramics are tetragonal. The crystal
structure of the ceramics is tetragonal symmetry in the space group p4mm with a = b =
3.990Aº and c = 4.03Aº. The purpose of this work is to determine the effect of Pr
substitution in barium titanate. The X-ray powder diffraction data on the effect of doping
concentrations are given in the Table 2. It is observed in Fig. 3.10 that the addition of
impurity atoms to the parent materials causes the peak shifting towards lower angle upto
x=0.003 and at x=0.004 the peak shifts towards the higher angles and indicate
development of strain in the materials, and peak broadening due to creation of stacking
fault. The shifting of the peak position can be clearly visualized from the normalized
diffractogram of the 100% RI peak, shown in Fig. 3.11. In the XRD profile, the 100%
relative intensity (Imax) peaks play an important role in understanding the structure of the
materials. Fig. 3.10 shows that, the undoped and the Pr modified BaTiO3 ceramics are in
a single phase. There is no evidence of any secondary phases in the modified BT
ceramics.

Chapter-III X-ray Powder Diffraction Studies
78
20 30 40 50 60 70 80
0
500
1000
1500
2000
2500
3000
3500
4000
x=0.004
x=0.003
x=0.002
x=0.001
x=0.0
I n
t e
n s
i t y
(A
U)
2 (degree)
Fig. 3.10 X-ray Diffractogram of Ba1-xPrxTiO3 Ceramics
31.0 31.2 31.4 31.6 31.8 32.0 32.2 32.4
0
500
1000
1500
2000
2500
3000
3500
4000
x=0.004
x=0.003
x=0.002
x=0.001
x=0.0
I n t
e n
s i
t y (
A U
)
2 (degree)
Fig.3.11 Normalised X-ray Diffractogram of Ba1-xPrxTiO3 Ceramics
In fig. 3.12 variation of crystallite size as a result of Pr substitution is clearly seen. The
crystallite size decreases abruptly with Pr addition and almost remains the same with a
slight variation of 1.43 nm on the higher side with x=0.003 and for all other cases it 21.50

Chapter-III X-ray Powder Diffraction Studies
79
nm. So we may say the crystallite size decreases with addition of Pr and almost remains
constant. The lattice strain in Fig. 3.13 gradually increases from x = 0.0 to x = 0.003 and
then suddenly falls to minimum at x =0.004, which coincides with the value of x=0.001.
Thus we may say, when the 100% RI peak starts shifting towards the higher angle the
lattice strain begins to fall. Plastic strain is more or less follow the same pattern as that of
lattice strain as seen in Fig. 3.14 and Table-2. It is seen that, the plastic strain (e)
increases almost linearly with Pr addition upto X=0.003 and reaches its maximum and
thereafter starts to fall to a minimum value of 0.8846 same as that of X=0.001. So, in
case of strain, both in lattice and plastic, increases gradually with addition of Pr and at
X=0.003 it get saturated and with further increase in addition of Pr begins to fall and
repeat the path with further addition of Pr. Fig. 3.15 shows the % crystalline variation of
Ba1-xPrxTiO3 ceramics. It is seen that with addition of Pr the modified BT materials
decrease its % crystallinity exponentially and minimum at x=0.004 with 93.63 %. It does
not mean that, it get amorphised, but its crystallinity decreases a little.
0.000 0.001 0.002 0.003 0.004
20
22
24
26
28
30
32
34
36
D h
k l (
nm
)
Composition
Fig. 3.12 crystallite size vs. Composition of Ba1-xPrxTiO3 Ceramics
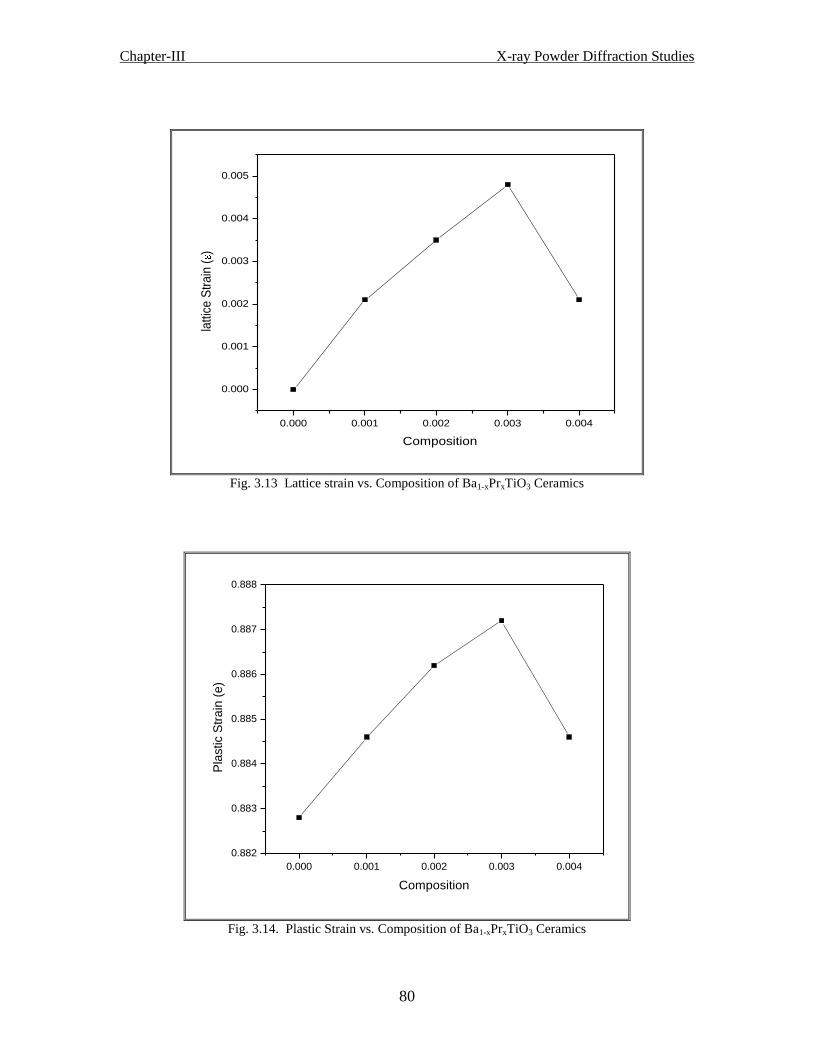
Chapter-III X-ray Powder Diffraction Studies
80
0.000 0.001 0.002 0.003 0.004
0.000
0.001
0.002
0.003
0.004
0.005
lattic
e S
tra
in (
)
Composition
Fig. 3.13 Lattice strain vs. Composition of Ba1-xPrxTiO3 Ceramics
0.000 0.001 0.002 0.003 0.004
0.882
0.883
0.884
0.885
0.886
0.887
0.888
Pla
stic S
tra
in (
e)
Composition
Fig. 3.14. Plastic Strain vs. Composition of Ba1-xPrxTiO3 Ceramics

Chapter-III X-ray Powder Diffraction Studies
81
0.000 0.001 0.002 0.003 0.004
93
94
95
96
97
98
99
100
% C
C o m p o s i t i o n
Fig. 3.15. %C vs. Composition of Ba1-xPrxTiO3 Ceramics
Fig. 3.16 shows the effect of line broadening as a result of Pr doping and is same up to
x=0.002 and then decreases slightly at X=0.003 from 0.1075 to 0.1070 and again
increases up to 0.1075 at x=0.004, where it is maximum. Thus we may say the line
broadening is almost stable with a variation of 0.0005 in Pr modified baTiO3 ceramics.
Here also it is seen that, it maintain certain trend till x=0.003 and the trend changes with
higher substitution. Fig. 3.17 shows the behavior of L-P geometric factor dependent on
Bragg diffraction angle. It shows almost linear increase till x=0.003, and attains its
maximum get saturated and then begins to fall (Table-2). The geometric parameters (L-P
Factor) maintain the same trend as that of strain, as shown in Fig. 3.14. Fig. 3.18 shows
the variation of N-R function due to the doping of Pr on barium titanate. The N-R factor
behaves in the same way as the lattice strain as seen from figure. The N-R function
increases gradually attains its maximum at x=0.003 and then begins to fall. In all the
above cases it is seen that, the Pr modified ceramic materials maintains some trend till
x=0.003 and then it deviates from its sequence and behave oppositely. This deviation
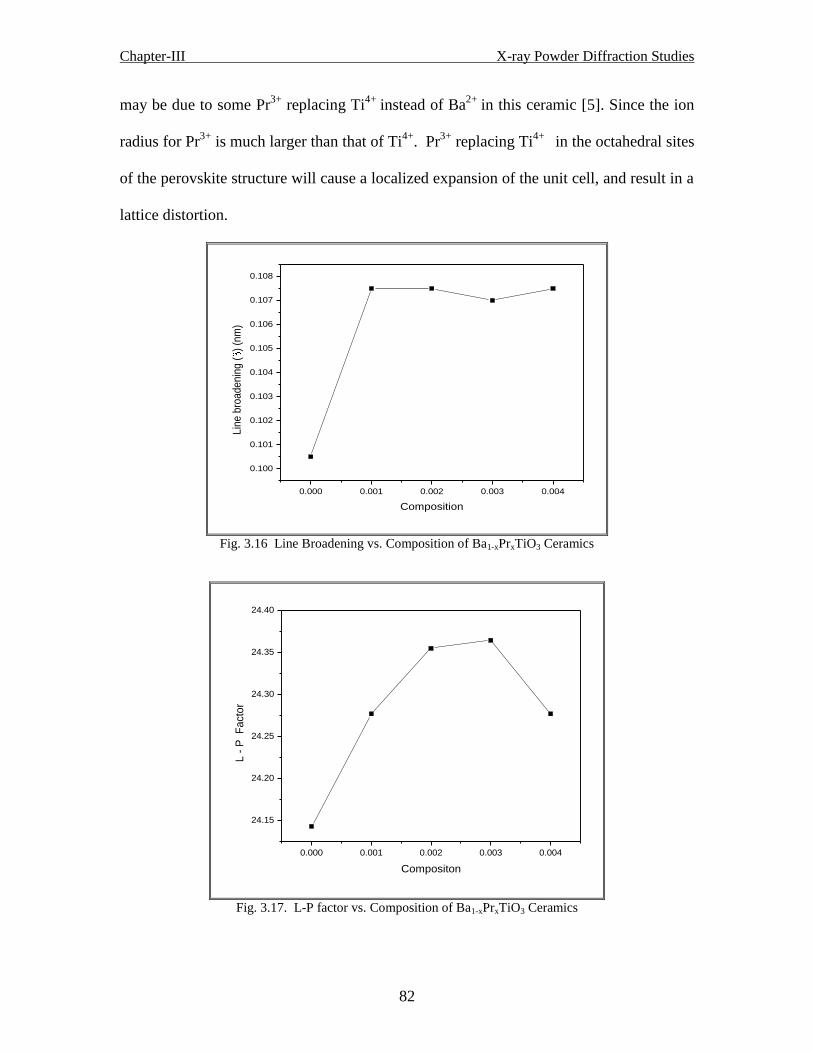
Chapter-III X-ray Powder Diffraction Studies
82
may be due to some Pr3+
replacing Ti4+
instead of Ba2+
in this ceramic [5]. Since the ion
radius for Pr3+
is much larger than that of Ti4+
. Pr3+
replacing Ti4+
in the octahedral sites
of the perovskite structure will cause a localized expansion of the unit cell, and result in a
lattice distortion.
0.000 0.001 0.002 0.003 0.004
0.100
0.101
0.102
0.103
0.104
0.105
0.106
0.107
0.108
Lin
e b
roa
de
nin
g (
) (n
m)
Composition
Fig. 3.16 Line Broadening vs. Composition of Ba1-xPrxTiO3 Ceramics
0.000 0.001 0.002 0.003 0.004
24.15
24.20
24.25
24.30
24.35
24.40
L -
P F
acto
r
Compositon
Fig. 3.17. L-P factor vs. Composition of Ba1-xPrxTiO3 Ceramics
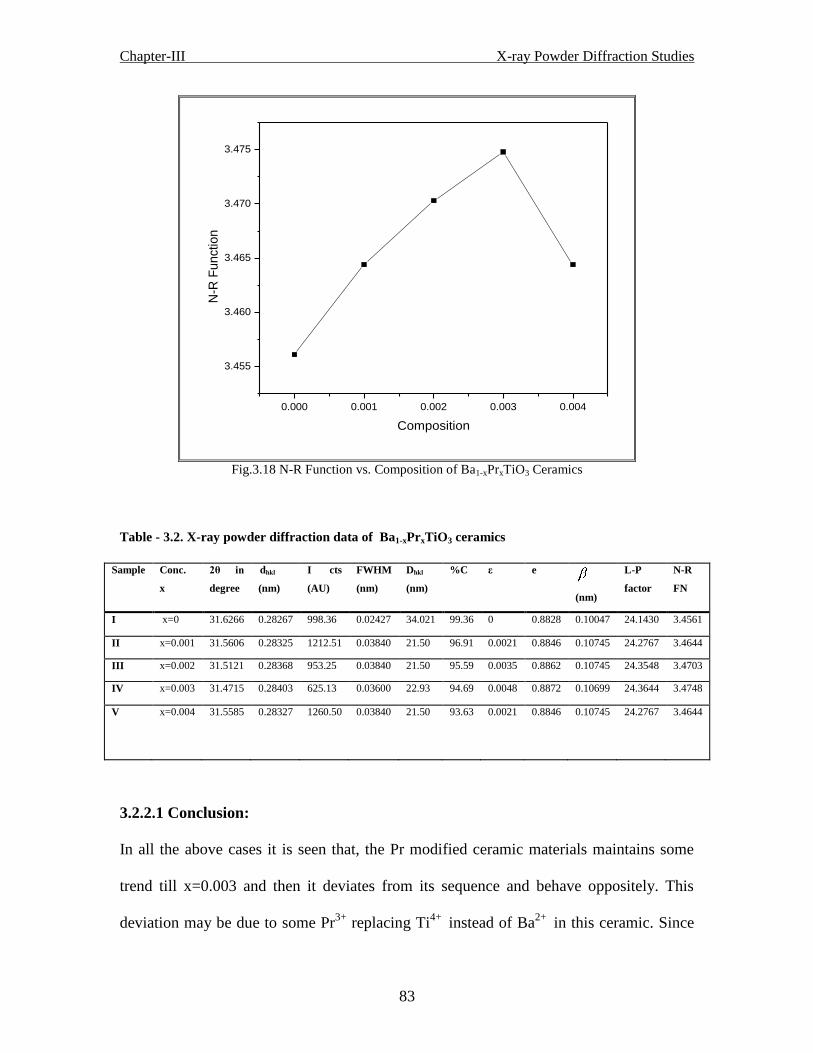
Chapter-III X-ray Powder Diffraction Studies
83
0.000 0.001 0.002 0.003 0.004
3.455
3.460
3.465
3.470
3.475
N-R
Fu
nctio
n
Composition
Fig.3.18 N-R Function vs. Composition of Ba1-xPrxTiO3 Ceramics
Table - 3.2. X-ray powder diffraction data of Ba1-xPrxTiO3 ceramics
Sample Conc.
x
2θ in
degree
dhkl
(nm)
I cts
(AU)
FWHM
(nm)
Dhkl
(nm)
%C
ε e
(nm)
L-P
factor
N-R
FN
I x=0 31.6266 0.28267 998.36 0.02427 34.021 99.36 0 0.8828 0.10047 24.1430 3.4561
II x=0.001 31.5606 0.28325 1212.51 0.03840 21.50 96.91 0.0021 0.8846 0.10745 24.2767 3.4644
III x=0.002 31.5121 0.28368 953.25 0.03840 21.50 95.59 0.0035 0.8862 0.10745 24.3548 3.4703
IV x=0.003 31.4715 0.28403 625.13 0.03600 22.93 94.69 0.0048 0.8872 0.10699 24.3644 3.4748
V x=0.004 31.5585 0.28327 1260.50 0.03840 21.50 93.63 0.0021 0.8846 0.10745 24.2767 3.4644
3.2.2.1 Conclusion:
In all the above cases it is seen that, the Pr modified ceramic materials maintains some
trend till x=0.003 and then it deviates from its sequence and behave oppositely. This
deviation may be due to some Pr3+
replacing Ti4+
instead of Ba2+
in this ceramic. Since

Chapter-III X-ray Powder Diffraction Studies
84
the ion radius for Pr3+
is much larger than that of Ti4+
. Pr3+
replacing Ti4+
in the
octahedral sites of the perovskite structure will cause a localized expansion of the unit
cell, and result in a lattice distortion. . It is seen that with addition of Pr the modified BT
materials decrease its % crystallinity exponentially and minimum at x=0.004 with 93.63
%. It does not mean that, it get amorphised. structural analysis of Praseodymium
modified BaTiO3 is analysed. The variation of different structural parameters w.r.t.
different composition is shown. The 100% RI peak has a key role in understanding the
structure of the material.
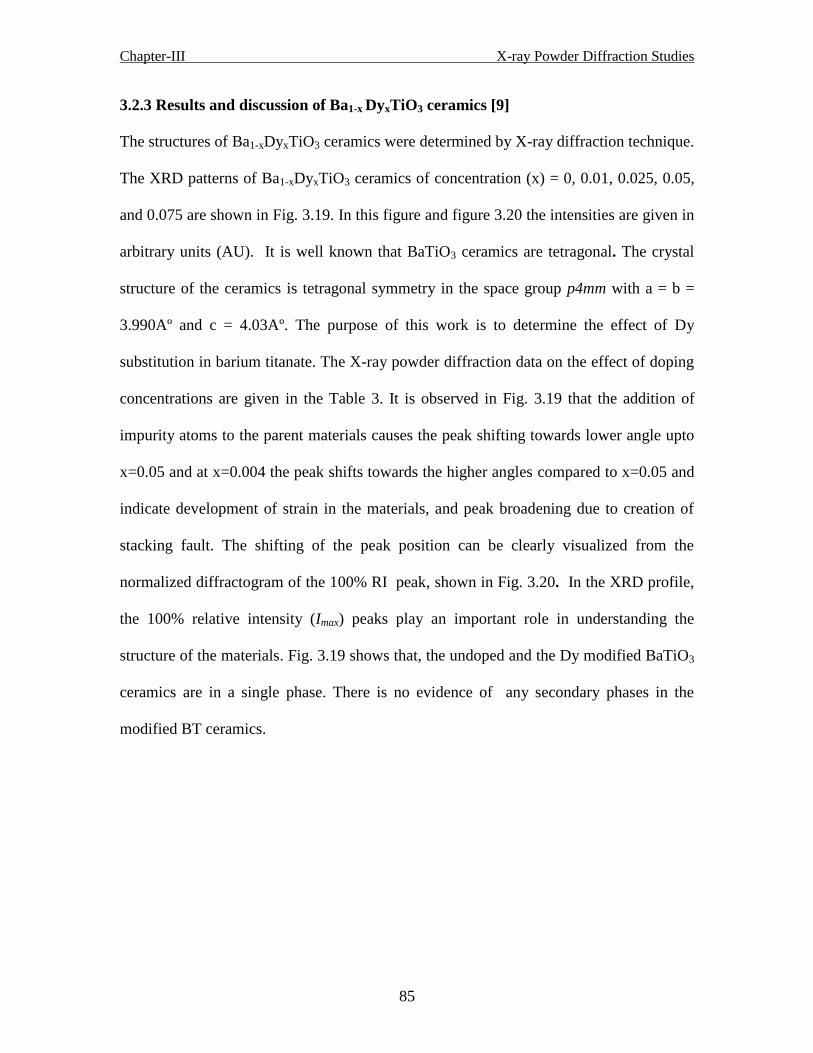
Chapter-III X-ray Powder Diffraction Studies
85
3.2.3 Results and discussion of Ba1-x DyxTiO3 ceramics [9]
The structures of Ba1-xDyxTiO3 ceramics were determined by X-ray diffraction technique.
The XRD patterns of Ba1-xDyxTiO3 ceramics of concentration (x) = 0, 0.01, 0.025, 0.05,
and 0.075 are shown in Fig. 3.19. In this figure and figure 3.20 the intensities are given in
arbitrary units (AU). It is well known that BaTiO3 ceramics are tetragonal. The crystal
structure of the ceramics is tetragonal symmetry in the space group p4mm with a = b =
3.990Aº and c = 4.03Aº. The purpose of this work is to determine the effect of Dy
substitution in barium titanate. The X-ray powder diffraction data on the effect of doping
concentrations are given in the Table 3. It is observed in Fig. 3.19 that the addition of
impurity atoms to the parent materials causes the peak shifting towards lower angle upto
x=0.05 and at x=0.004 the peak shifts towards the higher angles compared to x=0.05 and
indicate development of strain in the materials, and peak broadening due to creation of
stacking fault. The shifting of the peak position can be clearly visualized from the
normalized diffractogram of the 100% RI peak, shown in Fig. 3.20. In the XRD profile,
the 100% relative intensity (Imax) peaks play an important role in understanding the
structure of the materials. Fig. 3.19 shows that, the undoped and the Dy modified BaTiO3
ceramics are in a single phase. There is no evidence of any secondary phases in the
modified BT ceramics.

Chapter-III X-ray Powder Diffraction Studies
86
20 30 40 50 60 70 80
0
200
400
600
800
1000
1200
1400
1600
1800
2000
2200
2400
2600
2800
3000
3200
x=0.075
x=0.05
x=0.025
x=0.01
x=0.0
I n
t e
n s
i t y
(A
U)
2 (degree)
Fig. 3.19. X-ray Diffractogram of Ba1-xDyxTiO3 Ceramics
31.0 31.2 31.4 31.6 31.8 32.0 32.2 32.4
0
200
400
600
800
1000
1200
1400
1600
1800
2000
2200
2400
2600
2800
3000
3200
x=0.075
x=0.05
x=0.025
x=0.01
x=0.0
I n
t e
n s
i t y
(A
U)
2 (degree)
Fig. 3. 20 Normalised Diffractogram of 100% RI Peak of Ba1-xDyxTiO3 Ceramics
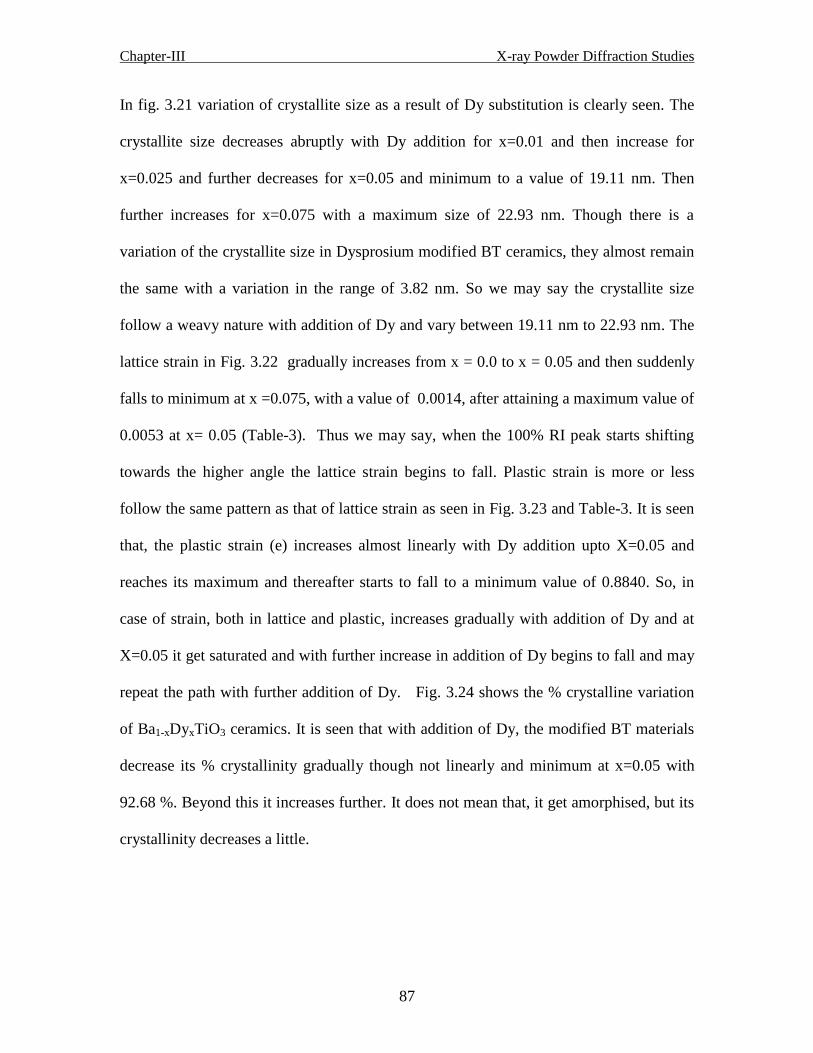
Chapter-III X-ray Powder Diffraction Studies
87
In fig. 3.21 variation of crystallite size as a result of Dy substitution is clearly seen. The
crystallite size decreases abruptly with Dy addition for x=0.01 and then increase for
x=0.025 and further decreases for x=0.05 and minimum to a value of 19.11 nm. Then
further increases for x=0.075 with a maximum size of 22.93 nm. Though there is a
variation of the crystallite size in Dysprosium modified BT ceramics, they almost remain
the same with a variation in the range of 3.82 nm. So we may say the crystallite size
follow a weavy nature with addition of Dy and vary between 19.11 nm to 22.93 nm. The
lattice strain in Fig. 3.22 gradually increases from x = 0.0 to x = 0.05 and then suddenly
falls to minimum at x =0.075, with a value of 0.0014, after attaining a maximum value of
0.0053 at x= 0.05 (Table-3). Thus we may say, when the 100% RI peak starts shifting
towards the higher angle the lattice strain begins to fall. Plastic strain is more or less
follow the same pattern as that of lattice strain as seen in Fig. 3.23 and Table-3. It is seen
that, the plastic strain (e) increases almost linearly with Dy addition upto X=0.05 and
reaches its maximum and thereafter starts to fall to a minimum value of 0.8840. So, in
case of strain, both in lattice and plastic, increases gradually with addition of Dy and at
X=0.05 it get saturated and with further increase in addition of Dy begins to fall and may
repeat the path with further addition of Dy. Fig. 3.24 shows the % crystalline variation
of Ba1-xDyxTiO3 ceramics. It is seen that with addition of Dy, the modified BT materials
decrease its % crystallinity gradually though not linearly and minimum at x=0.05 with
92.68 %. Beyond this it increases further. It does not mean that, it get amorphised, but its
crystallinity decreases a little.

Chapter-III X-ray Powder Diffraction Studies
88
-0.01 0.00 0.01 0.02 0.03 0.04 0.05 0.06 0.07 0.08
18
20
22
24
26
28
30
32
34
36
D h
k l (n
m)
Compositiion
Fig. 3. 21. Crystallite size vs. Composition of Ba1-xDyxTiO3 Ceramics
-0.01 0.00 0.01 0.02 0.03 0.04 0.05 0.06 0.07 0.08
0.000
0.001
0.002
0.003
0.004
0.005
0.006
La
ttic
e S
tra
in (
)
Composition
Fig. 3.22. Lattice strain vs. Composition of Ba1-xDyxTiO3 Ceramics

Chapter-III X-ray Powder Diffraction Studies
89
-0.01 0.00 0.01 0.02 0.03 0.04 0.05 0.06 0.07 0.08
0.882
0.883
0.884
0.885
0.886
0.887
0.888
Pla
stic s
tra
in (
e)
Composition
Fig. 3.23 Plastic Strain vs. Composition of Ba1-xDyxTiO3 Ceramics
-0.01 0.00 0.01 0.02 0.03 0.04 0.05 0.06 0.07 0.08
92
93
94
95
96
97
98
99
100
% C
Composition
Fig. 3.24. % C vs. Composition of Ba1-xDyxTiO3 Ceramics

Chapter-III X-ray Powder Diffraction Studies
90
Fig. 3.25 shows the effect of line broadening as a result of Dy doping. Line broadening
increases with addition of Dy though not linearly. Initially it increases, then decreases
and further increases and decreases again. i.e. here also the line broadening parameter
follow a weavy nature like crystallite size but in reverse manner. This is minimum at
X=0.025 and 0.075 with a value of 0.1070 and maximum at x=0.05 with a value of
0.1084. Thus we may say the line broadening is almost stable with a variation of 0.0014
in Dy modified BaTiO3 ceramics. Fig. 3.26 shows the behavior of L-P geometric factor
dependent on Bragg diffraction angle. It shows almost linear increase till x=0.025, and
attains its maximum get saturated at x=0.05 and then begins to fall (Table-3). The
geometric parameters (L-P Factor) maintain the same trend as that of strain, as shown in
Fig. 3.22. Fig. 3.27 shows the variation of N-R function due to the doping of Dy on
barium titanate. The N-R factor behaves in the same way as the lattice strain as seen from
figure. The N-R function increases gradually attains its maximum at x=0.05 and then
begins to fall. In all the above cases it is seen that, the Dy modified ceramic materials
maintains some trend till x=0.05 and then it deviates from its sequence and behave
oppositely. This deviation may be due to some Dy3+
replacing Ti4+
instead of Ba2+
in this
ceramic[5]. Since the ion radius for Dy3+
is much larger than that of Ti4+
. Dy3+
replacing
Ti4+
in the octahedral sites of the perovskite structure will cause a localized expansion of
the unit cell, and result in a lattice distortion.

Chapter-III X-ray Powder Diffraction Studies
91
-0.01 0.00 0.01 0.02 0.03 0.04 0.05 0.06 0.07 0.08
0.100
0.102
0.104
0.106
0.108
0.110
Lin
e b
roa
de
nin
g (
) (n
m)
Composition
Fig.3.25. Line Broadening vs. Composition of Ba1-xDyxTiO3 Ceramics
-0.01 0.00 0.01 0.02 0.03 0.04 0.05 0.06 0.07 0.08
24.10
24.15
24.20
24.25
24.30
24.35
24.40
24.45
L-P
Fa
cto
r
Composition
Fig. 3.26. L-P Factor vs. Composition of Ba1-xDyxTiO3 Ceramics

Chapter-III X-ray Powder Diffraction Studies
92
-0.01 0.00 0.01 0.02 0.03 0.04 0.05 0.06 0.07 0.08
3.455
3.460
3.465
3.470
3.475
3.480
N-R
Fu
nctio
n
Composition
Fig. 3.27 N-R Function vs. Composition of Ba1-xDyxTiO3 Ceramics
Table-3.3. X-ray powder diffraction data of Ba1-x DyxTiO3 ceramics
Sample Conc.
x
2θ in
degree
dhkl
(nm)
I cts
(AU)
FWHM
(nm)
Dhkl
(nm)
%C
ε e
(nm)
L-P
factor
N-R
FN
I x=0 31.6266 0.28267 998.36 0.02427 34.021 99.36 0 0.8828 0.10047 24.1430 3.4561
II x=0.01 31.5919 0.28298 500.92 0.03840 21.50 95.64 0.0011 0.8837 0.10744 24.2014 3.4599
III x=0.025 31.4895 0.28384 517.21 0.03600 22.92 95.09 0.0042 0.8868 0.10698 24.3596 3.4745
IV x=0.05 31.4546 0.28418 391.61 0.04320 19.11 92.68 0.0053 0.8878 0.10837 24.4382 3.4768
V x=0.075 31.5824 0.28306 1260.50 0.03600 22.93 94.12 0.0014 0.8840 0.10698 24.2038 3.4618

Chapter-III X-ray Powder Diffraction Studies
93
3.2.3.1 Conclusion
In all the above cases it is seen that, the Dy modified ceramic materials do not maintain
any sequence. But in most of the cases, the different parameters remain swinging within a
little range. Or, in other words, we may say the parameters are almost same within the
studied range. This deviation may be due to some Dy3+ replacing Ti4+
instead of Ba2+
in
this ceramic. Since the ion radius for Pr3+ is much larger than that of Ti4+
. Dy3+
replacing Ti4+
in the octahedral sites of the perovskite structure will cause a localized
expansion of the unit cell, and result in a lattice distortion.
It is seen that with addition of Dy the modified BT materials decrease its % crystallinity
exponentially and minimum at x=0.05 with 92.68 %, and again the crystallinity increases
for x=0.075. Structural analysis of Dysprosium modified BaTiO3 is analysed. The
variation of different structural parameters w.r.t. different composition is shown. The
100% RI peak has a key role in understanding the structure of the material.

Chapter-III X-ray Powder Diffraction Studies
94
3.3 FSDP related XRD studies
3.3.1 Void species determination of Ba1-xCaxTiO3 ceramics [10]
The FSDP parameter such as the interlayer separation, quasi periodic in nature with an
effective periodicity ( R ) and correlation length (L), over which such periodicity is
maintained, of atomic density fluctuations, regardless of the precise atomic origin of such
fluctuations were calculated using the general expressions [11 ],
S
R2
…. (10)
where S is the magnitude of the scattering vector and is given by
sin4
S ….(11)
Corresponds to the position of the FSDP, and
2
L …. (12)
Where is the full width at half maximum (FWHM) of the FSDP.
The refined XRD data and the calculated FSDP parameters are demonstrated in Table-4.
One can see that, the FSDP for various calcium modified BaTiO3 ceramics is around
03618.222 , 04053.222 ,
04532.222 , 05182.222 ,
05261.222 ,
05039.222 , 05288.222 and
05038.222 corresponding to the scattering
vector 3.1052, 3.1109, 3.1166, 3.1256, 3.1247, 3.1231, 3.1264 and 3.1231 respectively.

Chapter-III X-ray Powder Diffraction Studies
95
The magnitude of the FWHM of the FSDP of samples I, II, III, Iv, V, VI, VII, and VIII
are 0.2400, 0.1920, 0.1920, 0.2640, 0.3120, 0.2400, 0.2400 and 0.2400 respectively.
The interlayer separation with an effective periodicity (R), (the atom-void distance [12])
and the correlation length (L) are calculated using eqs. (1), (2) and (3) and found to be
2.2043 and 26.1908 A for the sample-I. For all other samples including sample-I, these
values are presented in Table-1. This means that, periodicity of R 2.2043 A in sample-
I, is necessary to give the FSDP at the observed value of scattering vector (S) 3.1052
A and the real space quasi periodicity takes place along the correlation length of (L)
26.1908 A .
In case of sample- II, the FSDP is found around 04053.222 with scattering vector
3.1109 A . the magnitude of FWHM of the FSDP is equal to 0.1920. the repetitive
distance (R) and the structural correlation length (L) obtained to be equal to 2.0206 and
32.7385.
Analytically the FSDP position S and nano-void diameter D can be represented as [13-
14]
D
S3.2
….(13)

Chapter-III X-ray Powder Diffraction Studies
96
Where D is the nano-void diameter and found to be equal to, 2.3279, 2.3237, 2.3194,
2.3127, 2.3134, 2. 3146, 2.3121 and 2.3146 respectively.
According Elliott’s Void model which describes the FSDP [12],
d
S2
3
Or, S
d2
3 ….(14)
where d is the nearest-neighbour cation–cation distance or cation–void distance.
The interatomic correlation, a characteristic distance of second or third neighbour inter
atomic distributions is given by the well known formula [15]
23.1sin2r
Or, sin2
23.1r …. (15)
Where r is the first co-ordination sphere radius, is the scattering angle, is the X-ray
diffraction wavelength and the co-efficient 1.23 is known as the Ehrenfest’s number.
The above Eq. (15) can be represented as
r
S46.2
…. (16)

Chapter-III X-ray Powder Diffraction Studies
97
Thus the Ehrenfest number is dependent on the value of S and r. So, a change in the value
of S and r result in a different Ehrenfest’s number [16]. Thus the most generalized
Ehrenfest’s formula is given by
2
SrE …. (17)
Where E is the modified Ehrenfest’s number after Rachek [16].
It is found that, the interatomic distance (r) is very close to nano-void diameter (D). this
implies that, the internal structural nanovoids [15] may be responsible for low S structure
(LSS) in XRD data. LSS could be the result of sharp peak in pair distribution function
G(r) at r
46.2 and a damped sinusoidal oscillations in G(r) with a
S
2 period. The
correlation observed between the above formulas connecting the FSDP position S, with
the structural details is explained. Its common feature could be originated from the atom-
atom and/or void-void distributions on the scale of extended range order within void
based approach for the FSDP.
Fig. 3.28 shows the variation of correlation length of Ba1-xCaxTiO3 ceramics with
different composition of Ca variation. It is seen that, the correlation length initially
increases and then decreases to a minimum value and then again increases and then if
more amount of Ca is added the correlation length decreases but less in magnitude. The
variation of correlation length is like a damped wave as if it is decaying with more and
more addition of Ca with the BaTiO3 ceramic. The minimum correlation length is for
x=0.25 and then with higher x values the pattern changes. That means it has a limiting

Chapter-III X-ray Powder Diffraction Studies
98
value at x=0.25 and as explained earlier it is the solid solubility limit. The effective
periodicity of Ba1-xCaxTiO3 ceramics is found to be maximum for BaTiO3 ceramic and it
decreases initially for x=0.05 slightly and then remains constant for the entire range of
compositions, as shown in fig. 3.29. The nano void diameter ( Fig.3.30) shows avery
peculiar nature, i.e with addition of Ca, in Ba1-xCaxTiO3 ceramics, NVD decreases
sharply , then increases a little. Afterwards within a range of 0.0007 nm they fluctuate
and almost remains in stable situation, with a maximum value of 0.2319 nm and a
minimum value of 0.2312 nm. This may be due to the almost same crystallite size of the
materials.
0.0 0.1 0.2 0.3 0.4 0.5
20
22
24
26
28
30
32
34
Co
rre
latio
n e
ng
th (
L)
Composition
Fig.3.28 Composition vs. Correlation length of Ba1-xCaxTiO3 ceramics
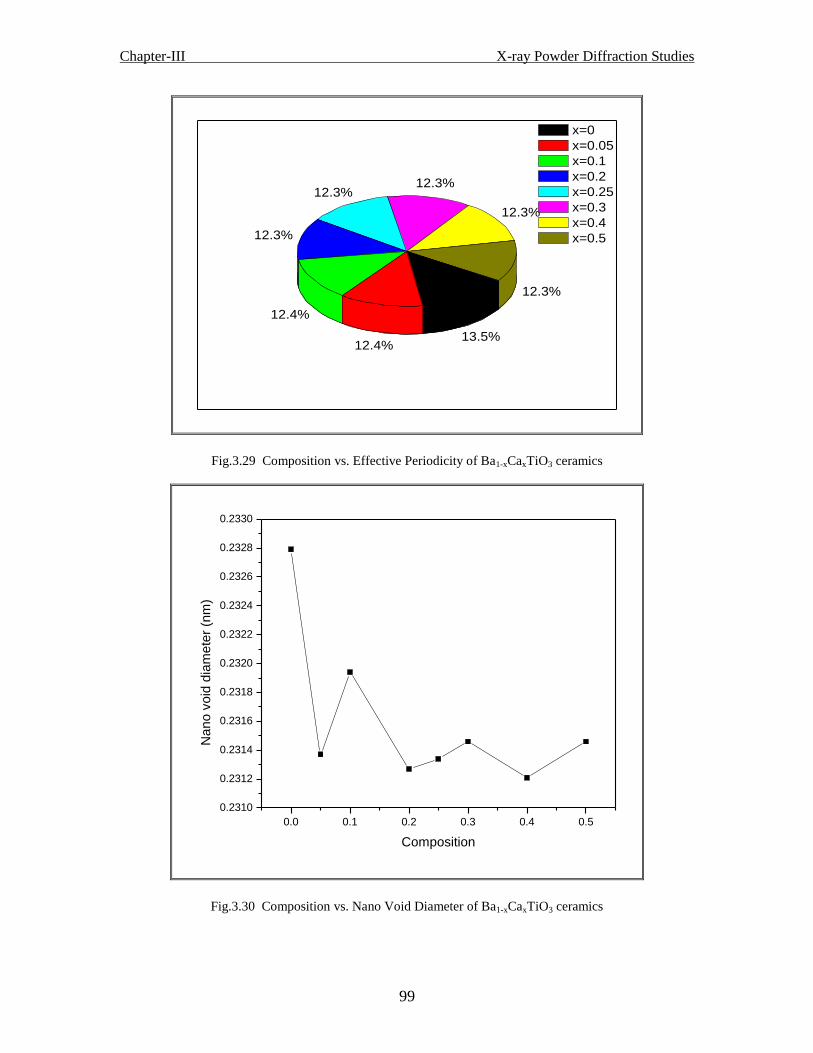
Chapter-III X-ray Powder Diffraction Studies
99
12.3%
12.3%
12.3%12.3%
12.3%
12.4%
12.4%13.5%
x=0
x=0.05
x=0.1
x=0.2
x=0.25
x=0.3
x=0.4
x=0.5
Fig.3.29 Composition vs. Effective Periodicity of Ba1-xCaxTiO3 ceramics
0.0 0.1 0.2 0.3 0.4 0.5
0.2310
0.2312
0.2314
0.2316
0.2318
0.2320
0.2322
0.2324
0.2326
0.2328
0.2330
Na
no
vo
id d
iam
ete
r (n
m)
Composition
Fig.3.30 Composition vs. Nano Void Diameter of Ba1-xCaxTiO3 ceramics

Chapter-III X-ray Powder Diffraction Studies
100
0.0 0.1 0.2 0.3 0.4 0.5
0.1508
0.1510
0.1512
0.1514
0.1516
0.1518
Ne
are
st n
eig
hb
ou
r d
ista
nce
(n
m)
Composition
Fig.3.31 Composition vs. Nearest neighbour distance of Ba1-xCaxTiO3 ceramics
The nearest neighbour distance (Fig.3.31) falls exponentially and then at x=0.25 increases
a little and x=0.4 it further decreases and again increases at x=0.5. However, the nearest
neighbour distance follow a butterfly nature and almost remains stable within x=0.2 to
x=0.5 with a variation in the range of 0.0002 nm with a maximum of 0.1510 nm and a
minimum of 0.1508 nm. The inter atomic distance of Ba1-xCaxTiO3 ceramics behaves in
the similar ways as the nearest neighbour distance behaves (Fig. 3.32). Thus we may say
stable region in Ba1-xCaxTiO3 ceramics is between x=0.2 to x=0.5, where it shows almost
the similar nature for the nano void species.
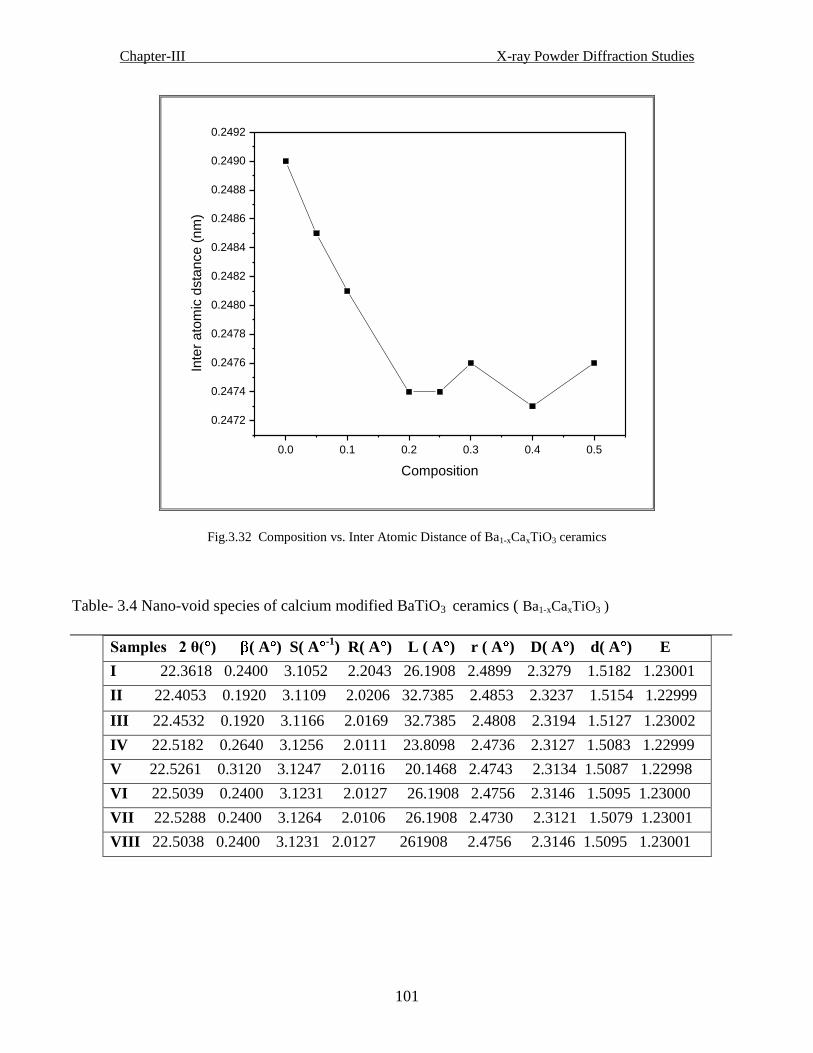
Chapter-III X-ray Powder Diffraction Studies
101
0.0 0.1 0.2 0.3 0.4 0.5
0.2472
0.2474
0.2476
0.2478
0.2480
0.2482
0.2484
0.2486
0.2488
0.2490
0.2492
Inte
r a
tom
ic d
sta
nce (
nm
)
Composition
Fig.3.32 Composition vs. Inter Atomic Distance of Ba1-xCaxTiO3 ceramics
Table- 3.4 Nano-void species of calcium modified BaTiO3 ceramics ( Ba1-xCaxTiO3 )
Samples 2 θ( ) ( A ) S( A-1
) R( A ) L ( A ) r ( A ) D( A ) d( A ) E
I 22.3618 0.2400 3.1052 2.2043 26.1908 2.4899 2.3279 1.5182 1.23001
II 22.4053 0.1920 3.1109 2.0206 32.7385 2.4853 2.3237 1.5154 1.22999
III 22.4532 0.1920 3.1166 2.0169 32.7385 2.4808 2.3194 1.5127 1.23002
IV 22.5182 0.2640 3.1256 2.0111 23.8098 2.4736 2.3127 1.5083 1.22999
V 22.5261 0.3120 3.1247 2.0116 20.1468 2.4743 2.3134 1.5087 1.22998
VI 22.5039 0.2400 3.1231 2.0127 26.1908 2.4756 2.3146 1.5095 1.23000
VII 22.5288 0.2400 3.1264 2.0106 26.1908 2.4730 2.3121 1.5079 1.23001
VIII 22.5038 0.2400 3.1231 2.0127 261908 2.4756 2.3146 1.5095 1.23001
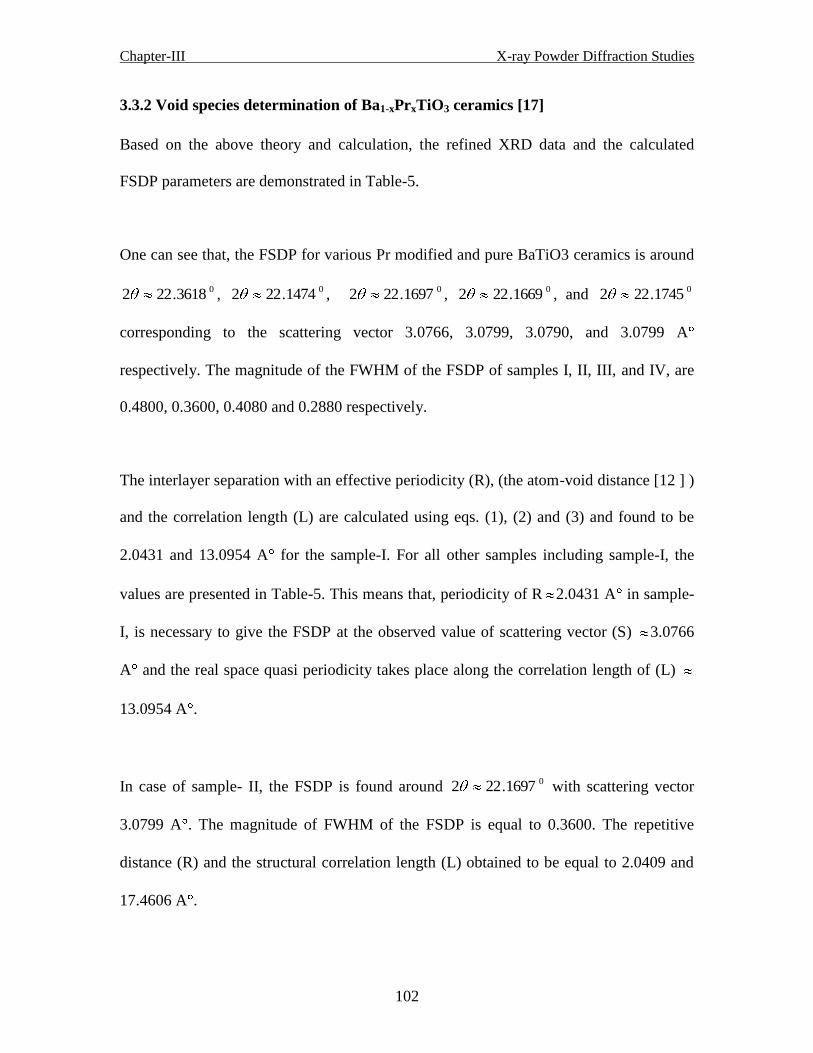
Chapter-III X-ray Powder Diffraction Studies
102
3.3.2 Void species determination of Ba1-xPrxTiO3 ceramics [17]
Based on the above theory and calculation, the refined XRD data and the calculated
FSDP parameters are demonstrated in Table-5.
One can see that, the FSDP for various Pr modified and pure BaTiO3 ceramics is around
03618.222 , 01474.222 , 01697.222 , 01669.222 , and 01745.222
corresponding to the scattering vector 3.0766, 3.0799, 3.0790, and 3.0799 A
respectively. The magnitude of the FWHM of the FSDP of samples I, II, III, and IV, are
0.4800, 0.3600, 0.4080 and 0.2880 respectively.
The interlayer separation with an effective periodicity (R), (the atom-void distance [12 ] )
and the correlation length (L) are calculated using eqs. (1), (2) and (3) and found to be
2.0431 and 13.0954 A for the sample-I. For all other samples including sample-I, the
values are presented in Table-5. This means that, periodicity of R 2.0431 A in sample-
I, is necessary to give the FSDP at the observed value of scattering vector (S) 3.0766
A and the real space quasi periodicity takes place along the correlation length of (L)
13.0954 A .
In case of sample- II, the FSDP is found around 01697.222 with scattering vector
3.0799 A . The magnitude of FWHM of the FSDP is equal to 0.3600. The repetitive
distance (R) and the structural correlation length (L) obtained to be equal to 2.0409 and
17.4606 A .
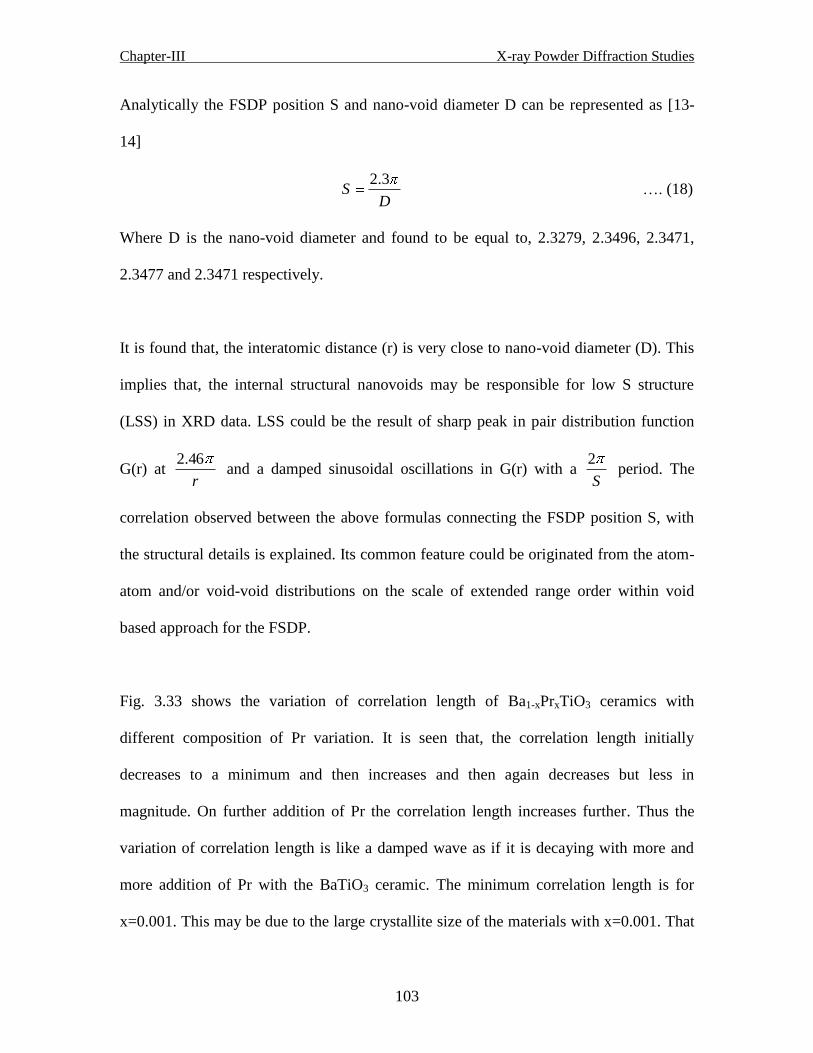
Chapter-III X-ray Powder Diffraction Studies
103
Analytically the FSDP position S and nano-void diameter D can be represented as [13-
14]
D
S3.2
…. (18)
Where D is the nano-void diameter and found to be equal to, 2.3279, 2.3496, 2.3471,
2.3477 and 2.3471 respectively.
It is found that, the interatomic distance (r) is very close to nano-void diameter (D). This
implies that, the internal structural nanovoids may be responsible for low S structure
(LSS) in XRD data. LSS could be the result of sharp peak in pair distribution function
G(r) at r
46.2 and a damped sinusoidal oscillations in G(r) with a
S
2 period. The
correlation observed between the above formulas connecting the FSDP position S, with
the structural details is explained. Its common feature could be originated from the atom-
atom and/or void-void distributions on the scale of extended range order within void
based approach for the FSDP.
Fig. 3.33 shows the variation of correlation length of Ba1-xPrxTiO3 ceramics with
different composition of Pr variation. It is seen that, the correlation length initially
decreases to a minimum and then increases and then again decreases but less in
magnitude. On further addition of Pr the correlation length increases further. Thus the
variation of correlation length is like a damped wave as if it is decaying with more and
more addition of Pr with the BaTiO3 ceramic. The minimum correlation length is for
x=0.001. This may be due to the large crystallite size of the materials with x=0.001. That

Chapter-III X-ray Powder Diffraction Studies
104
means the correlation length is crystallite size dependent. The effective periodicity of
Ba1-xPrxTiO3 ceramics is found to be maximum for BaTiO3 ceramic and it decreases
initially for x=0.001 slightly and then remains constant for the entire range of
compositions, as shown in fig. 3.34. The nano void diameter ( Fig.3.35) shows avery
peculiar nature, i.e with addition of Pr, in Ba1-xPrxTiO3 ceramics, NVD increases sharply
with x=0.001 , then decreases slightly for x=0.002, and remains almost constant with
other compositions at 0.2347 nm . that means the materials shows similar nature for
x=0.002, 0.003 and 0.004.. This may be due to the almost same crystallite size of the
materials. A close observation on the inter atomic distance (Fig. 3.36) and nearest
neighbour distance (Fig. 3.37) shows the same pattern as that of the Fig. 3.35. All these
three parameters are more or less same for the compositions, x=0.002, 0.003 and 0.004 in
Ba1-xPrxTiO3 ceramics.
0.000 0.001 0.002 0.003 0.004
1.2
1.4
1.6
1.8
2.0
2.2
2.4
2.6
2.8
Co
rre
latio
n le
ng
th (
L)
Composition
Fig 3.33 Composition vs. Correlation length of Ba1-xPrxTiO3 ceramics

Chapter-III X-ray Powder Diffraction Studies
105
19.7%
19.7%
19.7%
19.7%
21.3%
x=0.0
x=0.001
x=0.002
x=0.003
x=0.004
Fig 3.34 Composition vs. Effective periodicity of Ba1-xPrxTiO3 ceramics
0.000 0.001 0.002 0.003 0.004
0.2325
0.2330
0.2335
0.2340
0.2345
0.2350
Na
no
vo
id d
iam
ete
r (n
m)
Composition
Fig 3.35 Composition vs. Nano Void Diameter of Ba1-xPrxTiO3 ceramics

Chapter-III X-ray Powder Diffraction Studies
106
0.000 0.001 0.002 0.003 0.004
0.2490
0.2495
0.2500
0.2505
0.2510
0.2515
Inte
r a
tom
ic d
ista
nce
(n
m)
Composition
Fig 3.36 Composition vs. Inter Atomic Distance of Ba1-xPrxTiO3 ceramics
0.000 0.001 0.002 0.003 0.004
0.1516
0.1518
0.1520
0.1522
0.1524
0.1526
0.1528
0.1530
0.1532
0.1534
Ne
are
st n
eig
hb
ou
r d
ista
nce
(n
m)
Composition
Fig 3.37 Composition vs. Atomic Diameter of Ba1-xPrxTiO3 ceramics

Chapter-III X-ray Powder Diffraction Studies
107
Table- 3.5 Nano-void species of Praseodymium modified BaTiO3 (Ba1-xPrxTiO3 ceramics)
Samples 2 θ( ) ( A ) S( A-1
) R( A ) L ( A ) r ( A ) D( A ) d( A ) E
I 22.1474 0.4800 3.0766 2.0431 13.0954 2.5130 2.3496 1.5323 1.22999
II 22.1697 0.3600 3.0799 2.0409 17.4606 2.5103 2.3471 1.5307 1.22999
III 22.1669 0.4080 3.0790 2.0415 15.4064 2.5110 2.3477 1.5311 1.22997
IV 22.17448 0.2880 3.0799 2.0409 21.8257 2.5103 2.3471 1.5307 1.22999
3.3.3 Void species determination of Ba1-xDyxTiO3 ceramics
Again basing on the above theory and calculations the refined XRD data and the
calculated FSDP parameters are demonstrated in Table-6.
One can see that, the FSDP for various Dy modified BaTiO3 and Pure BaTiO3 ceramics
is around 03618.222 , 01533.222 , 02562.222 , 00750.222 , and,
01674.222 , corresponding to the scattering vector 3.1052, 3.0774, 3.0905, 3.0660,
and 3.0790 A respectively. The magnitude of the FWHM of the FSDP of samples I, II,
III, and IV, are 0.2400, 0.3120, 0.3600, 0.3600 and 0.2640 respectively.
The interlayer separation with an effective periodicity (R), (the atom-void distance [12])
and the correlation length (L) are calculated using eqs. (1), (2) and (3) and found to be
2.0426 and 20.1468 A for the sample-I. For all other samples including sample-I, the
values are presented in Table-6. This means that, periodicity of R 2.0426 A in sample-
I, is necessary to give the FSDP at the observed value of scattering vector (S) 3.0774
A and the real space quasi periodicity takes place along the correlation length of (L)
20.1468 A .

Chapter-III X-ray Powder Diffraction Studies
108
In case of sample- II, the FSDP is found around 02562.222 with scattering vector
3.0905 A . The magnitude of FWHM of the FSDP is equal to 0.3600. The repetitive
distance (R) and the structural correlation length (L) obtained to be equal to 2.0339 and
17.4606 A .
Analytically the FSDP position S and nano-void diameter D can be represented as [13-
14]
D
S3.2
…. (19)
Where D is the nano-void diameter and found to be equal to, 2.3279, 2.3490, 2.3390,
2.3577 and 2.3477 respectively.
It is found that, the interatomic distance (r) is very close to nano-void diameter (D). this
implies that, the internal structural nanovoids may be responsible for low S structure
(LSS) in XRD data. LSS could be the result of sharp peak in pair distribution function
G(r) at r
46.2 and a damped sinusoidal oscillation in G(r) with a
S
2 period. The
correlation observed between the above formulas connecting the FSDP position S, with
the structural details is explained. Its common feature could be originated from the atom-
atom and/or void-void distributions on the scale of extended range order within void
based approach for the FSDP.
Fig. 3.38 shows the variation of correlation length of Ba1-xDyxTiO3 ceramics with
different composition of Dy variation. It is seen that, the correlation length decreases
gradually up to x=0.025 and becomes minimum and then again increases gradually with
higher Dy doping. The figure looks like a big U. That means the correlation length is
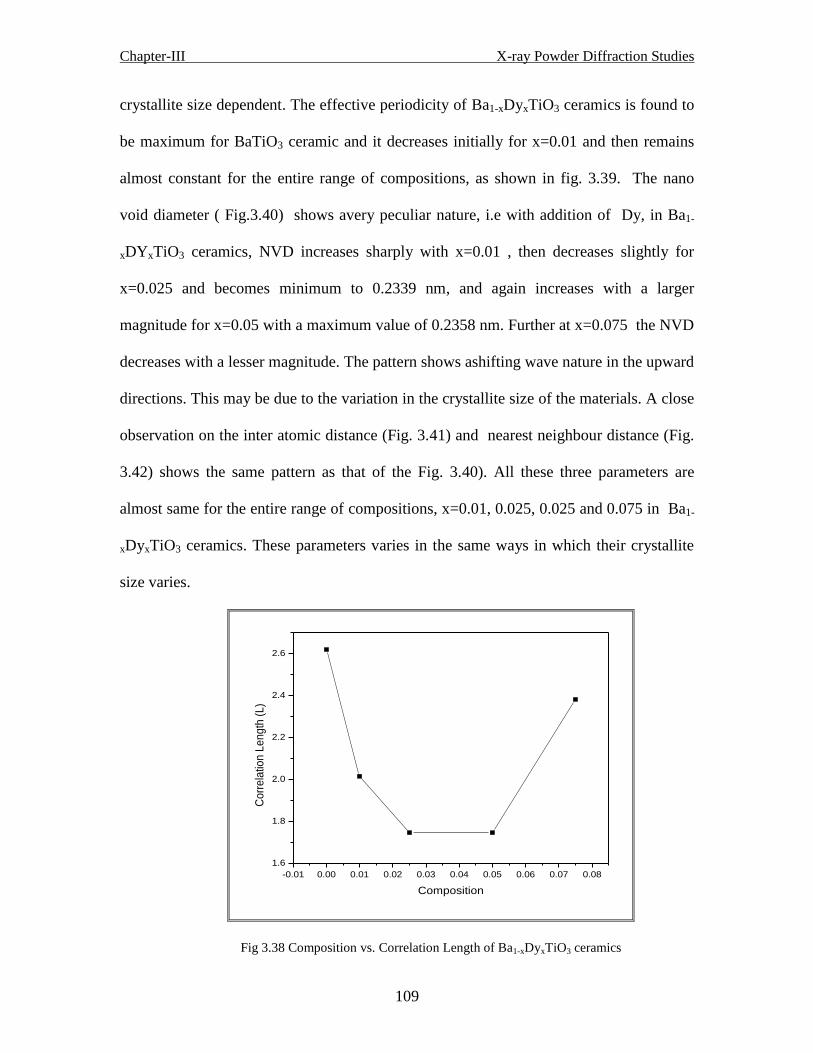
Chapter-III X-ray Powder Diffraction Studies
109
crystallite size dependent. The effective periodicity of Ba1-xDyxTiO3 ceramics is found to
be maximum for BaTiO3 ceramic and it decreases initially for x=0.01 and then remains
almost constant for the entire range of compositions, as shown in fig. 3.39. The nano
void diameter ( Fig.3.40) shows avery peculiar nature, i.e with addition of Dy, in Ba1-
xDYxTiO3 ceramics, NVD increases sharply with x=0.01 , then decreases slightly for
x=0.025 and becomes minimum to 0.2339 nm, and again increases with a larger
magnitude for x=0.05 with a maximum value of 0.2358 nm. Further at x=0.075 the NVD
decreases with a lesser magnitude. The pattern shows ashifting wave nature in the upward
directions. This may be due to the variation in the crystallite size of the materials. A close
observation on the inter atomic distance (Fig. 3.41) and nearest neighbour distance (Fig.
3.42) shows the same pattern as that of the Fig. 3.40). All these three parameters are
almost same for the entire range of compositions, x=0.01, 0.025, 0.025 and 0.075 in Ba1-
xDyxTiO3 ceramics. These parameters varies in the same ways in which their crystallite
size varies.
-0.01 0.00 0.01 0.02 0.03 0.04 0.05 0.06 0.07 0.08
1.6
1.8
2.0
2.2
2.4
2.6
Co
rre
latio
n L
en
gth
(L
)
Composition
Fig 3.38 Composition vs. Correlation Length of Ba1-xDyxTiO3 ceramics
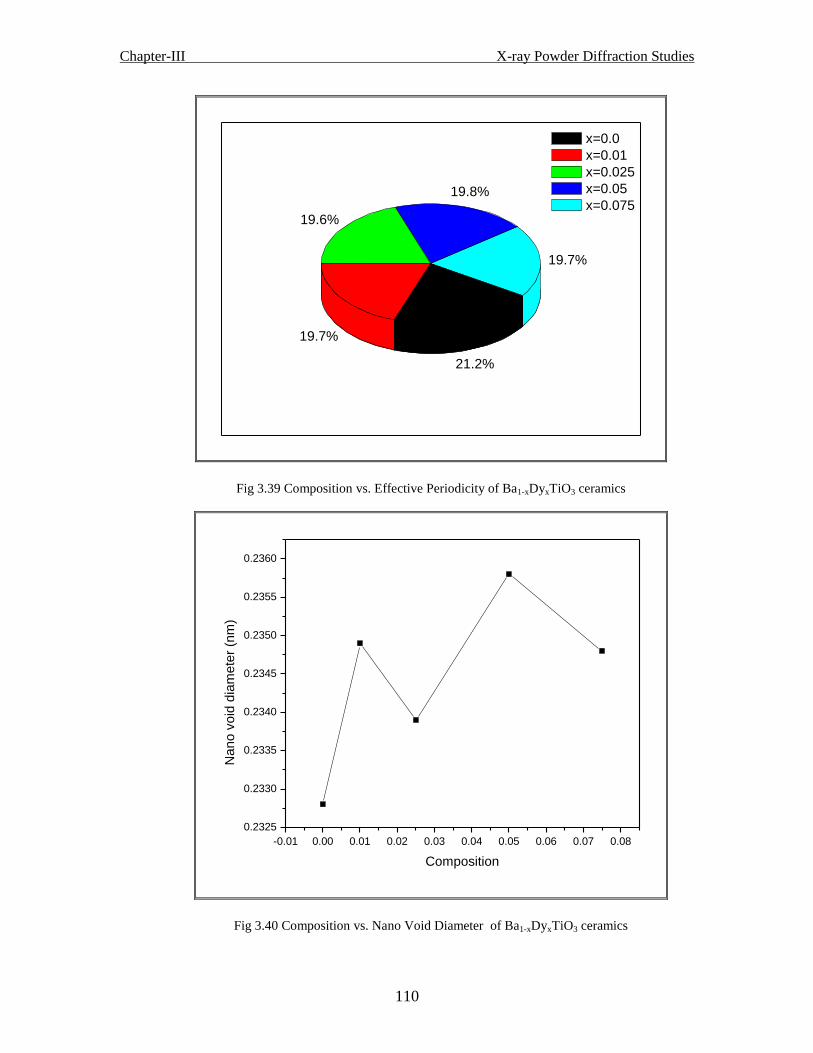
Chapter-III X-ray Powder Diffraction Studies
110
19.7%
19.8%
19.6%
19.7%
21.2%
x=0.0
x=0.01
x=0.025
x=0.05
x=0.075
Fig 3.39 Composition vs. Effective Periodicity of Ba1-xDyxTiO3 ceramics
-0.01 0.00 0.01 0.02 0.03 0.04 0.05 0.06 0.07 0.08
0.2325
0.2330
0.2335
0.2340
0.2345
0.2350
0.2355
0.2360
Na
no
vo
id d
iam
ete
r (n
m)
Composition
Fig 3.40 Composition vs. Nano Void Diameter of Ba1-xDyxTiO3 ceramics

Chapter-III X-ray Powder Diffraction Studies
111
-0.01 0.00 0.01 0.02 0.03 0.04 0.05 0.06 0.07 0.08
0.2485
0.2490
0.2495
0.2500
0.2505
0.2510
0.2515
0.2520
0.2525
Inte
r a
tom
ic d
ista
nce (
nm
)
Composition
Fig 3.41 Composition vs. Inter Atomic Distance of Ba1-xDyxTiO3 ceramics
-0.01 0.00 0.01 0.02 0.03 0.04 0.05 0.06 0.07 0.08
0.1515
0.1520
0.1525
0.1530
0.1535
0.1540
Ne
are
st n
eig
hb
ou
r d
ista
nce
(n
m)
Composition
Fig 3.42 Composition vs. Atomic Diameter of Ba1-xDyxTiO3 ceramics

Chapter-III X-ray Powder Diffraction Studies
112
Table-3.6 Nano-void species of Dysprosium modified BaTiO3 (Ba1-x DyxTiO3) ceramics
Samples 2 θ( ) ( A ) S( A-1
) R( A ) L ( A ) r ( A ) D( A ) d( A ) E
I 22.1533 0.3120 3.0774 2.0426 20.1468 2.5123 2.3490 1.5319 1.22997
II 22.2562 0.360 3.0905 2.0339 17.4606 2.5017 2.3390 1.5254 1.22999
III 22.0750 0.3600 3.0660 2.0502 17.4606 2.5217 2.3577 1.5376 1.22999
IV 22.1674 0.2640 3.0790 2.0415 23.8098 2.5110 2.3477 1.5311 1.22997
3.3.3.4 Conclusion:
In this section the void species nanostructure of modified BaTiO3 such as Ba1-xCaxTiO3
,Ba1-xPrxTiO3, Ba1-x DyxTiO3 ceramics using the FSDP XRD has been studied. It is seen
that the inter atomic distance, nano-void diameter and nearest neighbour distance varies
almost in the same way with different compositions for all the three different kind of
samples. As a result of correlation observed, the values of r parameter are found to be
very close to D parameter. We may say the internal structural nano-voids may be
responsible for the origin of LSS in X-ray scattering in the frame work of Elliott’s void
based model. Also here we have observed the variation in Ehrenfest’s number only in the
fifth significant figures but, almost it gives 1.23 (approx.).

Chapter-III X-ray Powder Diffraction Studies
113
References:
[1] Philips Analytical X-ray, The Netherlands, Graphics & Identify software, 1999
[2] B. D. Cullity, Elements of X-ray Diffraction, Addision-Wesley Publishing Company,
Inc., London, (1978).
[3] R. Jenkins and J. L. de Varies, Worked Examples in X-ray Analysis, The Macmillan
Press Ltd., (1978) pp132-133.
[4] T. Ida and K. Kimura, J. Appl. Cryst. 32 (1999) 634-640.
[5] M.R.Panigrahi, S.Panigrahi, Physica B: Physics of Condensed Matter 405 (2010)
1787-1791.
[6] X.W.Zhang, and Y.H.Han, J.Am. Ceram.Soc.70 (1987)100.
[7] M.R.Panigrahi, S.Panigrahi, Physica B: Physics of Condensed Matter 404 (2009)
4267- 4272.
[8] M.R.Panigrahi, S.Panigrahi, National Conference on High Tech Materials: Synthesis,
Characterization and Applications, pp.45 2009.
[9] M.R.Panigrahi, S.Panigrahi, International Conference on Nanoscience and
Nanotechnology (ICONN 2010)
[10] M. R. Panigrahi, S Panigrahi, INDO-US workshop on nanotechnology: Applications
and implications, OP-09 November, 2009.
[11] S.R. Elliott J. Non-Cryst. Solids 182 (1995 ) 40–48.
[12] S.R. Elliott Phys. Rev. Lett. 67 (1991) 711–714.
[13] T.S. Kavetskyy, and O.I. Shpotyuk, J. Optoelectron. Adv. Mater. 7 (2005) 2267–
2273.
[14] O. Shpotyuk, A. Kozdras, T. Kavetskyy, and J. Filipecki, J. Non-Cryst. Solids 352
(2006) 700–703.
[15] P.H. Gaskell, J. Non-Cryst. Solids 351 (2005) 1003–1013.
[16] O.P. Rachek, J. Non-Cryst. Solids 352 (2006) 3781–3786.
[17] M.R.Panigrahi, S.Panigrahi, National Conference on physics and Technology of
Novel materials, pp 09, OP-02 February 2010.

RIETVELD ANALYSIS
Chapter-IV
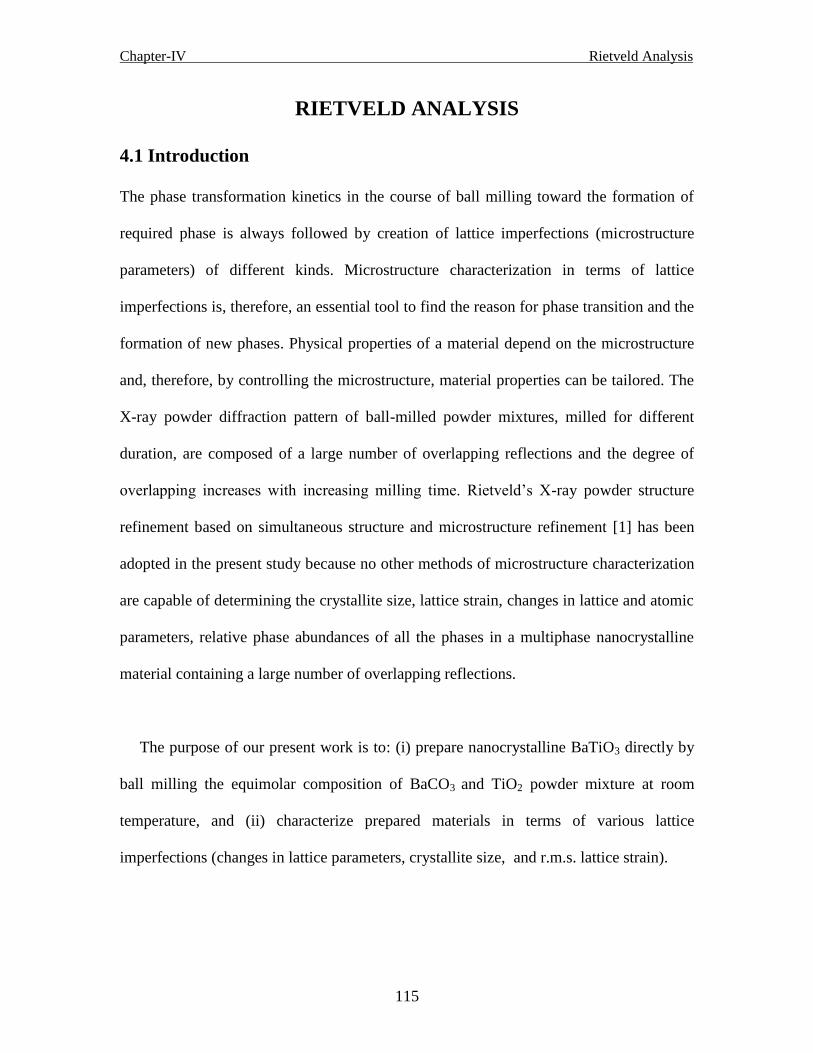
Chapter-IV Rietveld Analysis
115
RIETVELD ANALYSIS
4.1 Introduction
The phase transformation kinetics in the course of ball milling toward the formation of
required phase is always followed by creation of lattice imperfections (microstructure
parameters) of different kinds. Microstructure characterization in terms of lattice
imperfections is, therefore, an essential tool to find the reason for phase transition and the
formation of new phases. Physical properties of a material depend on the microstructure
and, therefore, by controlling the microstructure, material properties can be tailored. The
X-ray powder diffraction pattern of ball-milled powder mixtures, milled for different
duration, are composed of a large number of overlapping reflections and the degree of
overlapping increases with increasing milling time. Rietveld’s X-ray powder structure
refinement based on simultaneous structure and microstructure refinement [1] has been
adopted in the present study because no other methods of microstructure characterization
are capable of determining the crystallite size, lattice strain, changes in lattice and atomic
parameters, relative phase abundances of all the phases in a multiphase nanocrystalline
material containing a large number of overlapping reflections.
The purpose of our present work is to: (i) prepare nanocrystalline BaTiO3 directly by
ball milling the equimolar composition of BaCO3 and TiO2 powder mixture at room
temperature, and (ii) characterize prepared materials in terms of various lattice
imperfections (changes in lattice parameters, crystallite size, and r.m.s. lattice strain).

Chapter-IV Rietveld Analysis
116
The X-ray powder diffraction profiles of the ball-milled samples were recorded using Ni-
filtered Cu Kα radiation from a highly-stabilized and automated Philips X-ray generator
(PW 1830) operated at 30 kV and 20 mA. The generator is coupled with a Philips X-ray
powder diffractometer consisting of a PW 3040 mpd controller, PW 1050/51 goniometer
of radius 200 mm, and a proportional counter. For this experiment, 1 divergence slit, and
1mm receiving slit, were used. The step-scan data of step size 0.02 and step scan 0.6 s
were recorded for the entire angular range 10–90 .
4.1.1 Microstructure characterization by X-ray powder diffraction
In the present study, we have adopted the Rietveld’s powder-structure refinement
analysis [1-6] of X-ray powder diffraction step scan data of ball-milled and post-annealed
samples to obtain the refined structural and microstructural parameters (crystallite size
and r.m.s. lattice strain). The Rietveld software MAUD 2.14 [1] is specially designed to
refine simultaneously both the structural and microstructural parameters through a least-
square method. The peak shape was assumed to be a pseudo-Voigt function with
asymmetry. The background of each pattern was fitted by a polynomial function of
degree 5. In the present study, refinements were conducted without refining the isotropic
atomic thermal parameters.
4.1.2 Microstructure evolution by X-ray powder diffraction
Microstructure characterization of all the ball-milled powder samples has been made by
employing the Rietveld’s whole-profile fitting method based on structure and
microstructure refinement [7-10] The experimental profiles were fitted with the most

Chapter-IV Rietveld Analysis
117
suitable pseudo-Voigt analytical function [10] because it takes individual care for both
the particle size and strain broadening of the experimental profiles. For both the Kα1 and
Kα2 profiles, the line broadening function B (2θ) and the symmetric part of instrumental
function S (2θ) may be represented by the pseudo-Voigt function [10]
)]()1()([)( xGxCIxpV nt ….(1)
where the Cauchyian component, C(x) = (1 + x2)−1 and the Gaussian component, G(x) =
exp[−(ln 2)x2] with x = (2θ − 2θ0)/HWHM (HWHM: half-width at half-maxima of the X-
ray peaks) and HWHM = 1/2FWHM = 1/2(U tan2 θ + V tan θ + W)1/2, where U, V and
W are coefficients of the quadratic polynomial, η the Gaussianity of X-ray profile, θ0 the
Bragg angle of Kα1 peak and Int the scale factor.
The powder diffraction patterns were simulated providing all necessary structural
information and some starting values of microstructural parameters of the individual
phases with the help of the Rietveld software, the MAUD 2.07[1].
Initially, the positions of the peaks were corrected by successive refinements of zero-shift
error. Considering the integrated intensity of the peaks as a function of structural
parameters only, the Marquardt least-squares procedures were adopted for minimization
the difference between the observed and simulated powder diffraction patterns and the

Chapter-IV Rietveld Analysis
118
minimization was carried out by using the reliability index parameter, Rwp (weighted
residual error), Rexp (expected error) and RB (Bragg factor) defined as:
2/1
2
0
2
0 ])(
[Iw
IIwR
i
ci
wp ….(2)
0
0100
I
IIR
c
B ….(3)
and
2/1
2
0
expIw
PNR
i
….(4)
where I0 and Ic are the experimental and calculated intensities, respectively, wi (1/I0) and
N are the weight and number of experimental observations, and P is the number of fitting
parameters.
The goodness of fit (GoF) is established by comparing Rwp with the expected error, Rexp
This leads to the value of goodness of fit [8, 9, 11] :
expR
RGOF
wp ….(5)
Refinement continues till convergence is reached with the value of the quality factor,
which confirms the goodness of refinement.
Chapter-IV Rietveld Analysis
119
4.1.3 Size–strain analysis
The basic consideration of this method is the modeling of the diffraction profiles by an
analytical function, which is a combination of Cauchyian, Gaussian, and asymmetry
functions as well. It has been well established that the observed peak broadenings of the
sample profiles are mainly due to the presence of small particle size and rms strain inside
the particles. The particle size and strain broadening can be approximated better with
Cauchyian and Gaussian-type functions, respectively [12-13] . Being a linear
combination of a Cauchyian and Gaussian functions, the pV function is the most reliable
peak-shape function and is being widely used in the Rietveld structure-refinement
software.
The process of successive profile refinements modulated different structural and
microstructural parameters of the simulated pattern to fit the experimental diffraction
pattern. Profile refinement continues until convergence is reached in each case, with the
value of the quality factor (GoF) approaches very close to 1.
4.2 Results and discussion
4.2.1 Results and discussion of Ba1-xCaxTiO3 ceramics
Fig.4.1(a-h) represents the refined structure of the Ca substituted BaTiO3 ceramics. In the
figure the dots represent observed and solid lines represents the calculated intensities on
the same scale. The tick marks indicate the calculated positions of Bragg peaks.
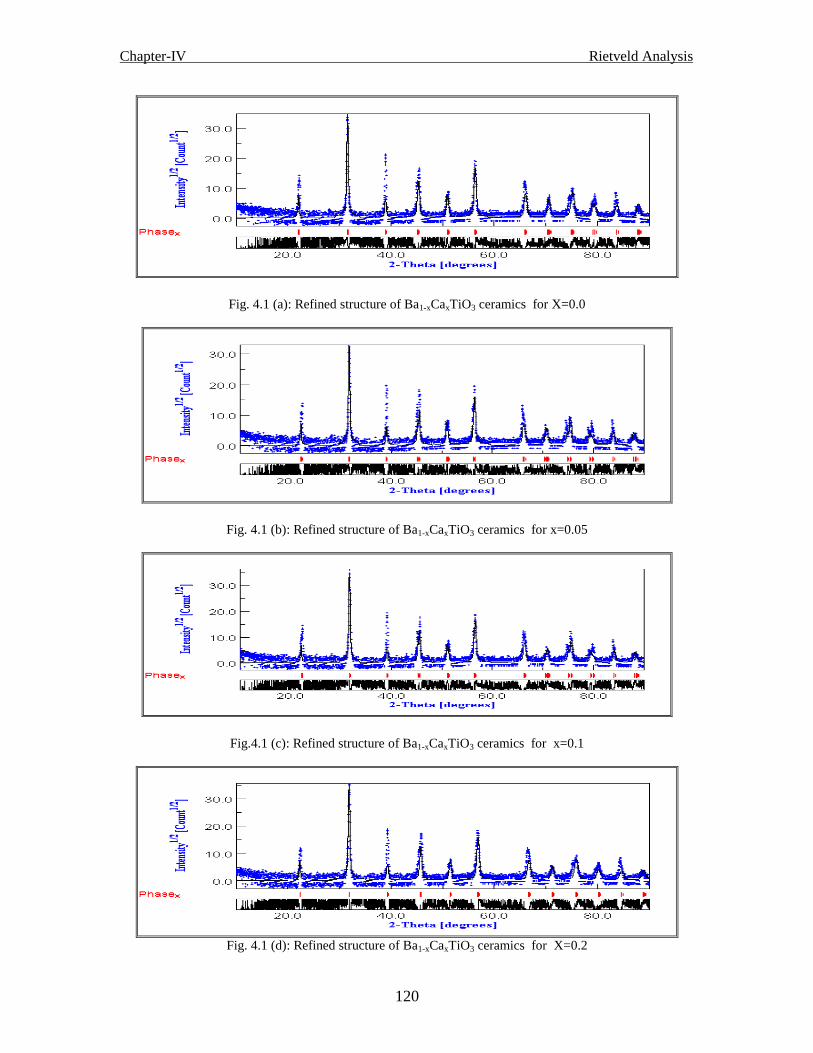
Chapter-IV Rietveld Analysis
120
Fig. 4.1 (a): Refined structure of Ba1-xCaxTiO3 ceramics for X=0.0
Fig. 4.1 (b): Refined structure of Ba1-xCaxTiO3 ceramics for x=0.05
Fig.4.1 (c): Refined structure of Ba1-xCaxTiO3 ceramics for x=0.1
Fig. 4.1 (d): Refined structure of Ba1-xCaxTiO3 ceramics for X=0.2
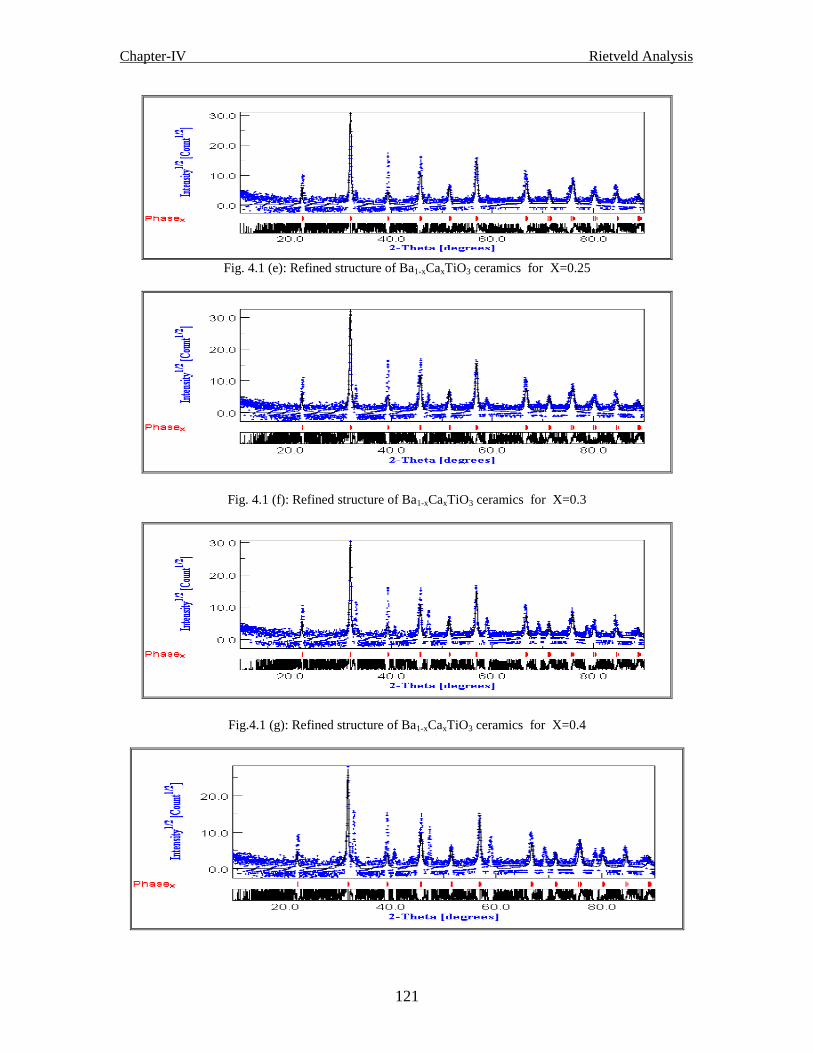
Chapter-IV Rietveld Analysis
121
Fig. 4.1 (e): Refined structure of Ba1-xCaxTiO3 ceramics for X=0.25
Fig. 4.1 (f): Refined structure of Ba1-xCaxTiO3 ceramics for X=0.3
Fig.4.1 (g): Refined structure of Ba1-xCaxTiO3 ceramics for X=0.4

Chapter-IV Rietveld Analysis
122
Fig. 4.1 (h): Refined structure of Ba1-xCaxTiO3 ceramics for X=0.5
Fig.4.2 represents the variation of r.m.s. strain of BaTiO3 ceramics due to the substitution
of Ca. The figure indicates that the change in r.m.s. strain due to the substitution of Ca is
non-linear. Due to the substitution of Ca the crystallite size of BaTiO3 ceramics get
changed. Fig. 4.3 represents the change in crystallite size (nm) due to the substitution of
Ca. The variation of crystallite size with different % of Ca substitution is isotropic in
nature. It decreases continuously with addition of calcium. Fig. 4.4 shows the variation of
lattice parameters due to the substitution of Ca with the BaTiO3 ceramics. The variation
of lattice parameter with different % of Ca substitution follow a peculiar trend and is
explained subsequently.
0.0 0.1 0.2 0.3 0.4 0.5
0.8
1.0
1.2
1.4
1.6
1.8
2.0
2.2
2.4
r.m
.s. str
ain
x 1
0 3
Composition
Figure 4.2: composition vs. r.m.s. strain

Chapter-IV Rietveld Analysis
123
0.0 0.1 0.2 0.3 0.4 0.5
150
200
250
300
350
400
Cry
sta
llite
siz
e (
nm
)
Composition
Figure 4.3: composition vs. crystallite size (nm)
The lattice parameter of the ball-milled and Ca-modified, ball-milled BaTiO3 is presented
in the Table 4.1. It is observed that the lattice parameter a decreases gradually upto
x=0.25 and then increases slowly and varies within a range of 2 x 10⁻⁴
nm, whereas the
lattice parameter c first decreases upto x=0.2. and then slightly increases for x=0.25.
Thereafter, the c parameter also varies within a range of 2 x 10⁻⁴
nm. But for all the
samples c parameter is more than a parameter. Or, in other words, c/a ratio is more than
1, i.e. the material is more dense. A pecualirity is observed for x=0.3, variation of the c
parameter does not follow the same trend, rather it increases. This may be due to the
sudden decrease in the crystallite size. The continuous decrease in lattice parameters
signifies the reduction in lattice strain. Our result is different from those reported earlier.
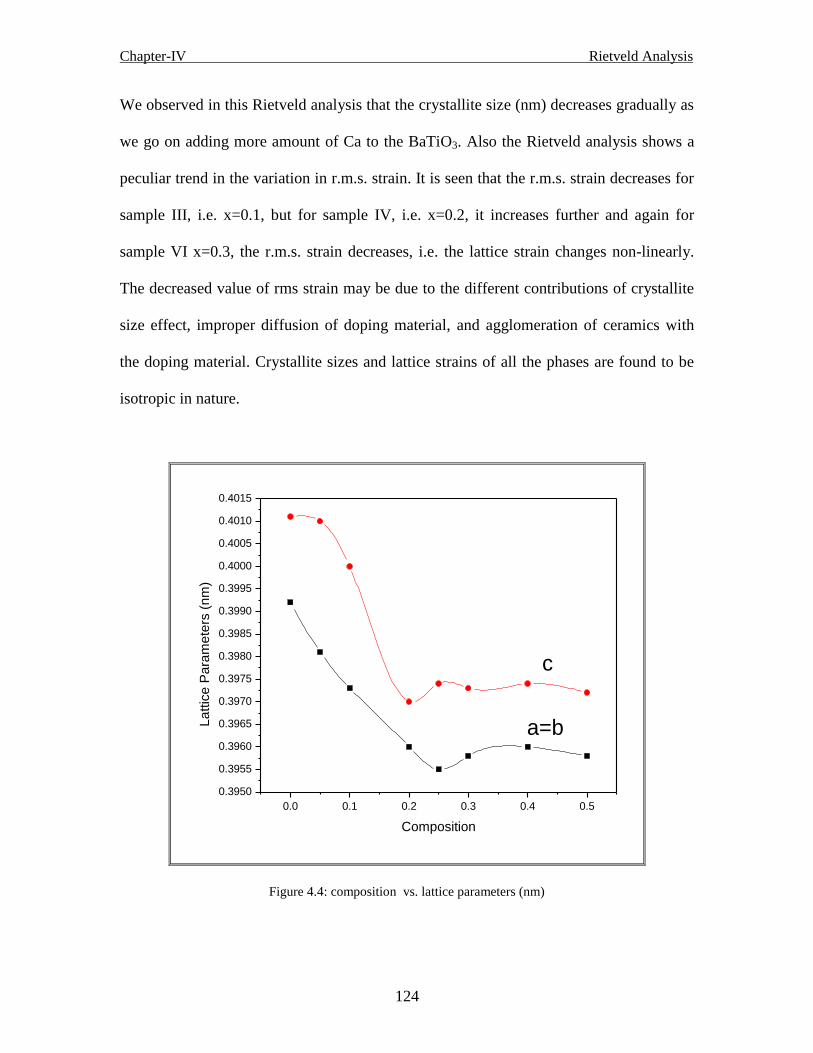
Chapter-IV Rietveld Analysis
124
We observed in this Rietveld analysis that the crystallite size (nm) decreases gradually as
we go on adding more amount of Ca to the BaTiO3. Also the Rietveld analysis shows a
peculiar trend in the variation in r.m.s. strain. It is seen that the r.m.s. strain decreases for
sample III, i.e. x=0.1, but for sample IV, i.e. x=0.2, it increases further and again for
sample VI x=0.3, the r.m.s. strain decreases, i.e. the lattice strain changes non-linearly.
The decreased value of rms strain may be due to the different contributions of crystallite
size effect, improper diffusion of doping material, and agglomeration of ceramics with
the doping material. Crystallite sizes and lattice strains of all the phases are found to be
isotropic in nature.
0.0 0.1 0.2 0.3 0.4 0.5
0.3950
0.3955
0.3960
0.3965
0.3970
0.3975
0.3980
0.3985
0.3990
0.3995
0.4000
0.4005
0.4010
0.4015
c
a=bLa
ttic
e P
ara
me
ters
(n
m)
Composition
Figure 4.4: composition vs. lattice parameters (nm)

Chapter-IV Rietveld Analysis
125
Table. 4.1 Figure of Merit for Ba1-xCaxTiO3 ceramics
Sample Refined parameters Lattice parameters(nm) Crystallite r.m.s. strain
Size (nm)
Rwp Rp Rwpb Rpb GOF a b c (Dv) ε x 10-3
I 0.5328 0.4324 0.8106 0.4516 0.24 0.3992 0.3992 0.4011 307.21 1.50
II 0.5359 0.4290 0.7911 0.4620 0.25 0.3981 0.3981 0.4010 361.33 1.05
III 0.5123 0.4074 0.7690 0.4641 0.24 0.3973 0.3973 0.4000 288.07 0.998
IV 0.5009 0.4035 0.6892 0.4401 0.23 0.3960 0.3960 0.3970 274.18 2.20
V 0.5137 0.4187 0.7792 0.4676 0.25 0.3955 0.3955 0.3974 225.97 1.44
VI 0.4896 0.3881 0.7781 0.4299 0.24 0.3959 0.3959 0.3973 222.91 1.78
VII 0.5456 0.4459 0.8301 0.5080 0.25 0.3960 0.3960 0.3974 211.63 0.968
VIII 0.5802 0.4821 0.9441 0.5611 0.25 0.3958 0.3958 0.3972 146.13 0.906
4.2.1.1 Generated structure of Ba1-xCaxTiO3 ceramics
The structure of Ba1-xCaxTiO3 ceramics generated using powder cell 2.3 [14] looks like
the below-mentioned figure (Fig. 4.5). The initial data for generation of this figure were
taken as SGN 123, lattice parameters a=b= 3.973 A , c= 4.0 A i.e. in tetragonal
symmetry for x = 0.1

Chapter-IV Rietveld Analysis
126
a
b
c
Ba3.46254.8868
4.8868
2.8327
2.83274.0300
2.0150
2.8157
3.9820
3.9820
Ti
1.9910
1.99102.0150
Ba
3.4624
2.8327
4.8868
4.8868
4.0300
2.0150
2.8327
3.9820
2.8157
ca
4.8868
2.8327
1.9910
2.8157
3.9820
4.88682.8157
2.8327
1.9910 2.8327
4.8868
2.8327
4.8868
Ba
2.8157
3.4624
4.8868
4.8868
3.98202.8327
3.9820
O1
2.8327
2.8327
2.8327
2.8157
2.8157
ca
4.8868
2.8327
1.9910
3.9820
2.8157
2.8327
1.9910
4.8868
4.8868
2.8327
Ba
3.46244.8868
2.83274.0300
2.01503.9820
Ti
1.9910
2.0150
O23.46251.9910
1.9910
3.4624
3.4624
3.4624
Ti1.9910
2.0150
Ba
3.9820
2.81572.8327
4.8868ca2.8327
1.9910
2.8327
2.81574.8868
2.8327
O1
2.8157
2.83272.8157
Ba
4.0300
2.0150
2.8327
ca
2.8327
1.9910 2.8327
Ba
3.9820
Ti
2.0150
Ba
PowderCell 2 .0
Fig. 4.5: Generated structure of Ba1-xCaxTiO3 ceramics
4.2.1.2 The unit cell
a
b
c
O2
3.46251.9910
ca
2.8327
1.9910
2.8327
O1
2.8157
Ti
2.0150
Ba
PowderCell 2 .0
Fig.4.6: Unit cell of the generated structure of Ba1-xCaxTiO3 ceramics

Chapter-IV Rietveld Analysis
127
4.2.1.3 The generated position of Ba1-xCaxTiO3 ceramics
Table- 4.2 The generated position of Ba1-xCaxTiO3 ceramics
No name crystal coordinates cartesian coordinates
x y z x y z
1 Ba 0.0000 0.0000 0.0000 -1.9910 -1.9910 -2.0150
2 Ti 0.0000 0.0000 0.5000 -1.9910 -1.9910 0.0000
3 O1 0.5000 0.5000 0.0000 0.0000 0.0000 -2.0150
4 O2 0.5000 0.5000 0.5000 0.0000 0.0000 0.0000
5 Ca 0.0000 0.5000 0.5000 -1.9910 0.0000 0.0000
6 Ca 0.5000 0.0000 0.5000 0.0000 -1.9910 0.0000
4.2.1.4 Bond lengths of the generated structure of Ba1-xCaxTiO3 ceramics
Table-4.3 Bond lengths of the generated Structure of Ba1-xCaxTiO3 ceramics
No atom1 atom2 distance quant
1 Ba Ti 2.0150 8
2 Ba O1 2.8157 8
3 Ba O2 3.4625 8
4 Ba Ca 2.8327 16
5 Ba Ba 3.9820 8
6 Ba Ca 4.8868 16
7 Ba Ba 4.0300 4
8 Ti Ca 1.9910 8
9 O1 Ca 2.8327 8
10 O2 Ca 1.9910 4
11 Ca Ca 2.8157 4
12 Ca Ca 3.9820 2
4.2.1.5 Bond angles of the generated structure of Ba1-xCaxTiO3 ceramics
Table-4.4 Bond angles of the generated structure of Ba1-xCaxTiO3 ceramics
No atom1 atom2 atom3 angle quant
1 Ti Ba O1 89.9993 2
2 Ti Ba O2 54.4110 6
3 Ti Ba Ca 44.6565 16
4 Ti Ba Ba 89.9995 16
5 Ti Ba Ca 65.6478 12
6 Ti Ba Ba 0.0005 8
7 Ba Ti Ca 90.0005 16
8 Ba Ti Ba 180.0000 4
9 O1 Ba O2 35.5883 2
10 O1 Ba Ca 60.1980 4
11 O1 Ba Ba 44.9998 16
12 O1 Ba Ca 30.1991 12
13 O1 Ba Ba 89.9993 2
14 Ba O1 Ca 60.1989 12
15 Ba O1 Ba 90.0000 8
16 Ba O1 Ca 19.8020 4
17 Ba O1 Ba 180.0000 4

Chapter-IV Rietveld Analysis
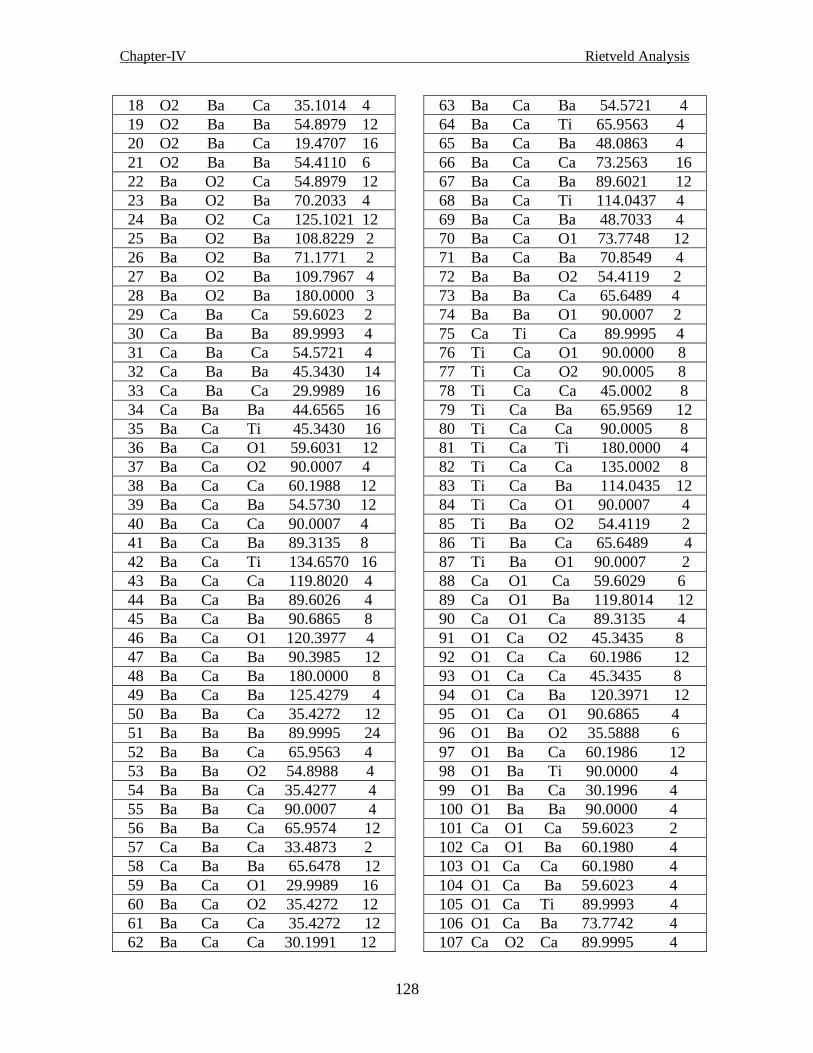
Chapter-IV Rietveld Analysis
128
18 O2 Ba Ca 35.1014 4
19 O2 Ba Ba 54.8979 12
20 O2 Ba Ca 19.4707 16
21 O2 Ba Ba 54.4110 6
22 Ba O2 Ca 54.8979 12
23 Ba O2 Ba 70.2033 4
24 Ba O2 Ca 125.1021 12
25 Ba O2 Ba 108.8229 2
26 Ba O2 Ba 71.1771 2
27 Ba O2 Ba 109.7967 4
28 Ba O2 Ba 180.0000 3
29 Ca Ba Ca 59.6023 2
30 Ca Ba Ba 89.9993 4
31 Ca Ba Ca 54.5721 4
32 Ca Ba Ba 45.3430 14
33 Ca Ba Ca 29.9989 16
34 Ca Ba Ba 44.6565 16
35 Ba Ca Ti 45.3430 16
36 Ba Ca O1 59.6031 12
37 Ba Ca O2 90.0007 4
38 Ba Ca Ca 60.1988 12
39 Ba Ca Ba 54.5730 12
40 Ba Ca Ca 90.0007 4
41 Ba Ca Ba 89.3135 8
42 Ba Ca Ti 134.6570 16
43 Ba Ca Ca 119.8020 4
44 Ba Ca Ba 89.6026 4
45 Ba Ca Ba 90.6865 8
46 Ba Ca O1 120.3977 4
47 Ba Ca Ba 90.3985 12
48 Ba Ca Ba 180.0000 8
49 Ba Ca Ba 125.4279 4
50 Ba Ba Ca 35.4272 12
51 Ba Ba Ba 89.9995 24
52 Ba Ba Ca 65.9563 4
53 Ba Ba O2 54.8988 4
54 Ba Ba Ca 35.4277 4
55 Ba Ba Ca 90.0007 4
56 Ba Ba Ca 65.9574 12
57 Ca Ba Ca 33.4873 2
58 Ca Ba Ba 65.6478 12
59 Ba Ca O1 29.9989 16
60 Ba Ca O2 35.4272 12
61 Ba Ca Ca 35.4272 12
62 Ba Ca Ca 30.1991 12
63 Ba Ca Ba 54.5721 4
64 Ba Ca Ti 65.9563 4
65 Ba Ca Ba 48.0863 4
66 Ba Ca Ca 73.2563 16
67 Ba Ca Ba 89.6021 12
68 Ba Ca Ti 114.0437 4
69 Ba Ca Ba 48.7033 4
70 Ba Ca O1 73.7748 12
71 Ba Ca Ba 70.8549 4
72 Ba Ba O2 54.4119 2
73 Ba Ba Ca 65.6489 4
74 Ba Ba O1 90.0007 2
75 Ca Ti Ca 89.9995 4
76 Ti Ca O1 90.0000 8
77 Ti Ca O2 90.0005 8
78 Ti Ca Ca 45.0002 8
79 Ti Ca Ba 65.9569 12
80 Ti Ca Ca 90.0005 8
81 Ti Ca Ti 180.0000 4
82 Ti Ca Ca 135.0002 8
83 Ti Ca Ba 114.0435 12
84 Ti Ca O1 90.0007 4
85 Ti Ba O2 54.4119 2
86 Ti Ba Ca 65.6489 4
87 Ti Ba O1 90.0007 2
88 Ca O1 Ca 59.6029 6
89 Ca O1 Ba 119.8014 12
90 Ca O1 Ca 89.3135 4
91 O1 Ca O2 45.3435 8
92 O1 Ca Ca 60.1986 12
93 O1 Ca Ca 45.3435 8
94 O1 Ca Ba 120.3971 12
95 O1 Ca O1 90.6865 4
96 O1 Ba O2 35.5888 6
97 O1 Ba Ca 60.1986 12
98 O1 Ba Ti 90.0000 4
99 O1 Ba Ca 30.1996 4
100 O1 Ba Ba 90.0000 4
101 Ca O1 Ca 59.6023 2
102 Ca O1 Ba 60.1980 4
103 O1 Ca Ca 60.1980 4
104 O1 Ca Ba 59.6023 4
105 O1 Ca Ti 89.9993 4
106 O1 Ca Ba 73.7742 4
107 Ca O2 Ca 89.9995 4

Chapter-IV Rietveld Analysis
129
108 Ca O2 Ba 125.1012 4
109 Ca O2 Ca 180.0000 2
110 Ca O2 Ba 54.8988 4
111 O2 Ca Ca 45.0002 8
112 O2 Ca Ba 35.4277 4
113 O2 Ca Ca 180.0000 2
114 O2 Ca Ba 90.0000 8
115 O2 Ca Ba 89.9993 4
116 O2 Ca Ca 0.0003 2
117 Ba O2 Ba 108.8224 2
118 Ba O2 Ba 70.2038 4
119 Ba O2 Ba 109.7962 4
120 Ba O2 Ba 71.1776 2
121 O2 Ba Ca 35.1019 12
122 Ba O2 Ba 179.9703 1
123 Ca Ca Ca 45.0002 8
124 Ca Ca Ba 119.8014 12
125 Ca Ca Ca 90.0000 4
126 Ca Ca Ba 30.1996 4
127 Ba Ca Ca 35.4277 4
128 Ba Ca Ba 48.0866 4
129 Ba Ca Ba 48.7036 4
130 Ba Ca Ba 125.4270 12
131 Ca Ba Ca 54.5730 12
132 Ca Ba Ca 33.4879 6
133 Ca Ca Ba 90.0000 8
134 Ca Ca Ba 89.9993 4
135 Ca Ba Ca 59.6031 6
136 Ca Ba Ba 90.0000 8
137 Ca Ca Ba 60.1980 4
138 Ba Ca Ba 70.8545 4
139 Ba Ca Ba 90.3974 4
140 Ca Ba Ba 45.3435 9
141 Ba Ba Ca 45.3435 3
4.2.1.6 Conclusions
Microstructure characterization of ball-milled BaCO3, CaCO3 and TiO2 powder mixture
clearly reveals that, tetragonal BaTiO3 in nanocrystalline form can be obtained by ball
milling the stoichiometric powder mixtures of BaCO3, CaCO3 and TiO2. The material is
found to be dense as c/a ratio is more than 1. The decrease in lattice parameters signifies
the reduction in lattice strain. The crystallite size decreases as Ca modify BaTiO3
ceramics. At last we get a clear picture of the crystal structure of Ba0.9Ca0.1TiO3 ceramics
in terms of different positions of the atoms, bond lengths and bond angles.

Chapter-IV Rietveld Analysis
130
4.2.2 Results and discussion of Ba1-xPrxTiO3 ceramics
Fig. 4.7 (a): Refined structure of Ba1-xPrxTiO3 ceramics for X=0.001
Fig. 4.7 (b): Refined structure of Ba1-xPrxTiO3 ceramics for X=0.002
Fig. 4.7 (c): Refined structure of Ba1-xPrxTiO3 ceramics for x=0.003
Fig. 4.7 (d): Refined structure of Ba1-xPrxTiO3 ceramics for x=0.004
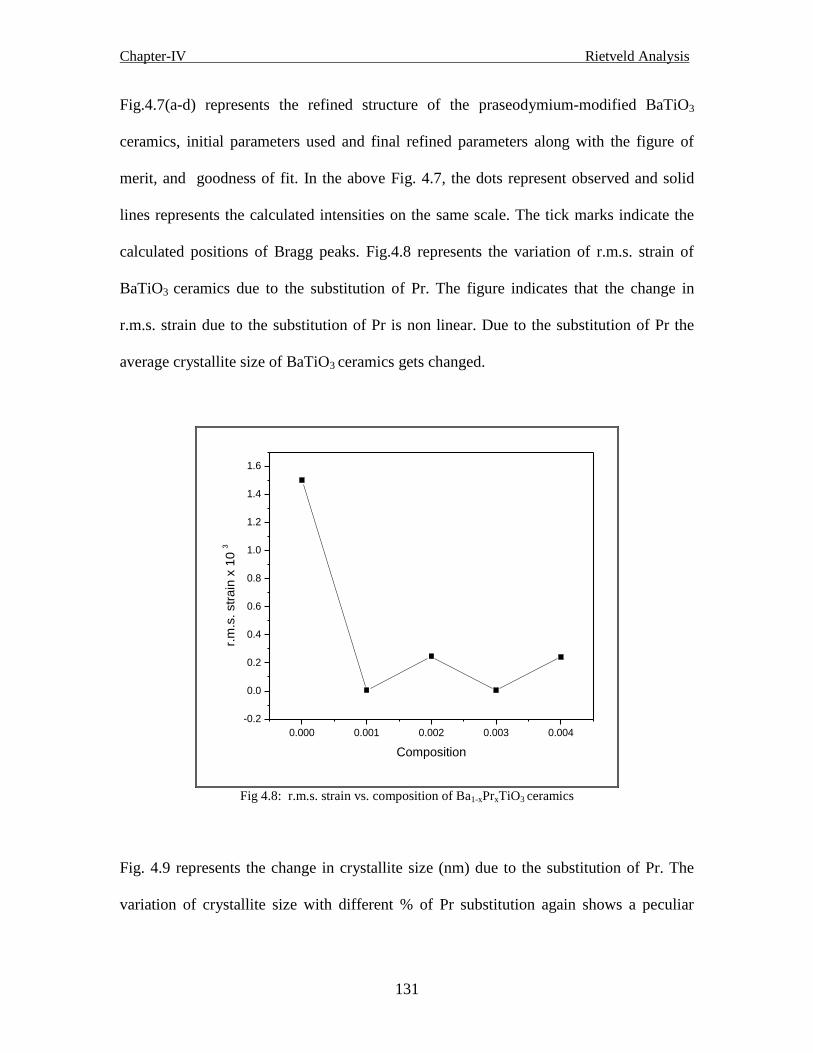
Chapter-IV Rietveld Analysis
131
Fig.4.7(a-d) represents the refined structure of the praseodymium-modified BaTiO3
ceramics, initial parameters used and final refined parameters along with the figure of
merit, and goodness of fit. In the above Fig. 4.7, the dots represent observed and solid
lines represents the calculated intensities on the same scale. The tick marks indicate the
calculated positions of Bragg peaks. Fig.4.8 represents the variation of r.m.s. strain of
BaTiO3 ceramics due to the substitution of Pr. The figure indicates that the change in
r.m.s. strain due to the substitution of Pr is non linear. Due to the substitution of Pr the
average crystallite size of BaTiO3 ceramics gets changed.
0.000 0.001 0.002 0.003 0.004
-0.2
0.0
0.2
0.4
0.6
0.8
1.0
1.2
1.4
1.6
r.m
.s. str
ain
x 1
0 3
Composition
Fig 4.8: r.m.s. strain vs. composition of Ba1-xPrxTiO3 ceramics
Fig. 4.9 represents the change in crystallite size (nm) due to the substitution of Pr. The
variation of crystallite size with different % of Pr substitution again shows a peculiar

Chapter-IV Rietveld Analysis
132
trend. First, it increases rapidly for x= 0.001, and almost remains the same for x=0.002,
then suddenly decreases for x=0.003 and further for x = 0.004, it increases up to 790 nm.
0.000 0.001 0.002 0.003 0.004
300
400
500
600
700
800C
rysta
llite
siz
e (
nm
)
Composition
Fig. 4.9: Crystallite size vs. composition of Ba1-xPrxTiO3 ceramics
Fig 4.10 shows the variation of lattice parameters due to the substitution of Pr with the
BaTiO3 ceramics. The variation of lattice parameter with different % of Pr substitution
follows a peculiar trend and is explained subsequently.
The lattice parameters a, b and c of all the samples first increase, then decrease and, with
higher doping %, increase again and as the doping % of praseodymium increases, all the
three lattice parameters decreases, as shown in Table 4.5. Or, in other words, c/a ratio is
>= 1, i.e. the material is more dense. The compactness ratio ( c/a) is maximum for
sample-III and V and minimum for II and IV.

Chapter-IV Rietveld Analysis
133
0.000 0.001 0.002 0.003 0.004
0.2
0.4
0.6
0.8
1.0
1.2
1.4
1.6
1.8
c
a=b
La
ttic
e P
ara
me
ters
(n
m)
Composition
Fig 4.10: Composition vs. lattice parameters of Ba1-xPrxTiO3 ceramics
The peculiarity is observed for x=0.003, variation of the c parameter does not follow the
same trend, rather it is almost same as a=b may be due to the sudden decrease in the
crystallite size and minimum strain. The decrease in lattice parameters signifies the
reduction in lattice strain.
The lattice strain changes non-linearly. The decreased value of r.m.s. strain may be due to
the different contributions of crystallite-size effect, improper diffusion of doping
material, and agglomeration of ceramics with the doping material. Crystallite sizes and
lattice strains of all the phases are found to be isotropic in nature. All the refined
parameters including RB, Rp and Rwp are also mentioned in Table 4.5 and it seems that
these values are always more than that of the virgin BaTiO3 for all the samples.

Chapter-IV Rietveld Analysis
134
Table 4.5 Figure of merit for Ba1-xPrxTiO3 ceramics
Sample Refined parameters Lattice parameters(nm) Grain size r.m.s.
(nm) strain
Rwp Rp Rwpb Rpb GOF a b c (Dv) ε x 10-3
I 0.888 0.843 1.049 0.926 0.18 0.5054 0.5054 0.5154 790.29 0.006
II 0.773 0.668 0.847 0.716 0.19 0.1467 0.1467 1.6489 790.05 0.247
III 0.763 0.678 1.354 0.862 0.22 0.5061 0.5061 0.5091 585.09 0.005
IV 0.802 0.707 0.879 0.765 0.18 0.1448 0.1448 1.6982 790.05 0.242
4.2.2.1 Generated structure of Ba1-xPrxTiO3 ceramics
Based on the above consideration, theoretically we can predict the structure of the
praseodymium-modified BaTiO3 to be as shown in Fig 4.11 with different bond lengths
(Table-4.7)and bond angles (Table-4.8) and generated positions (Table-4.6) with initial
data a = b = 1.4667A and c = 16.4897 A with SGN 123, P4MM, H-M Tetragonal
symmetry for x = 0.002.

Chapter-IV Rietveld Analysis
135
a
b
c
Ba
3.4707
2.8384
2.8384
4.03352.0168
2.8245
3.9945
3.9945
Ti
1.9972
1.9972
2.0168
Ba
3.4706
2.8384
4.0335
2.8383
2.0168
3.9945
2.8245
O1
2.8384
2.8384
2.8383
2.8383
2.8245
2.8245
Pr
3.9945
2.83841.9972
2.8245
2.83841.9972
2.8245
2.8383
Ba
2.8384
3.4706
4.03352.0168
2.8383
3.9945
Pr
2.8245
2.83841.9972
3.9945
2.83841.9973
2.8383
Ba
2.82453.4706
3.9945
3.9945
Ti
1.9973
2.0168
O2
3.4707
1.9972
1.9972
3.4706
3.4706
3.4706
Ti
1.9972
2.0168
Ba 4.0335
2.8383
2.0168
2.8383
Pr
2.8384
2.8245
1.9972
2.8383
2.8383
Ba
3.9945
2.8245
Pr
2.83841.9972
2.8383
2.8383
O1
2.8245
2.8245
Ba
3.9945
Ti2.0168Ba
PowderCell 2 .0
Fig. 4.11: Generated structure of Ba1-xPrxTiO3 ceramics
4.2.2.2 The unit cell
a
b
c
O2
3.4707
1.9972
Pr
2.83841.9972
2.8383
O1
2.8245
Ti 2.0168
Ba
PowderCell 2 .0
Fig. 4.12: Unit cell of Ba1-xPrxTiO3 ceramics

Chapter-IV Rietveld Analysis
136
4.2.2.3 Generated positions of Ba1-xPrxTiO3 ceramics
Table-4.6 Generated positions of Ba1-xPrxTiO3 ceramics
No name crystal coordinates cartesian coordinates
x y z x y z
1 Ba 0.0000 0.0000 0.0000 -1.9973 -1.9973 -2.0168
2 Pr 0.0000 0.5000 0.5000 -1.9972 0.0000 0.0000
3 Ti 0.0000 0.0000 0.5000 -1.9973 -1.9972 0.0000
4 O1 0.5000 0.5000 0.0000 0.0000 0.0000 -2.0168
5 O2 0.5000 0.5000 0.5000 0.0000 0.0000 0.0000
6 Pr 0.5000 0.0000 0.5000 0.0000 -1.9972 0.0000
4.2.2.4 Bond lengths of the generated structure of Ba1-xPrxTiO3 ceramics
Table - 4.7 Bond lengths of the generated structure of Ba1-xPrxTiO3 ceramics
No atom1 atom2 distance quant
1 Ba Pr 2.8384 16
2 Ba Ti 2.0168 8
3 Ba O1 2.8245 8
4 Ba O2 3.4707 8
5 Ba Ba 3.9945 4
6 Ba Ba 3.9945 4
7 Ba Ba 4.0335 4
8 Pr Ti 1.9972 8
9 Pr O1 2.8383 8
10 Pr O2 1.9972 4
11 Pr Pr 2.8245 4
12 Pr Pr 3.9945 2
4.2.2.5 Bond angles of the generated structure of Ba1-xPrxTiO3 ceramics
Table-4.8 Bond angles of the generated structure of Ba1-xPrxTiO3 ceramics
No atom1 atom2 atom3 angle quant
1 Pr Ba Ti 44.7214 8
2 Pr Ba O1 60.1604 4
3 Pr Ba O2 35.1323 4
4 Pr Ba Pr 59.6775 8
5 Pr Ba Ba 89.9993 4
6 Pr Ba Ba 45.2781 8
7 Pr Ba Ba 44.7214 8
8 Ba Pr Ti 45.2781 8
9 Ba Pr O1 59.6784 16
10 Ba Pr O2 90.0007 4
11 Ba Pr Pr 60.1612 12
12 Ba Pr Pr 90.0007 4

Chapter-IV Rietveld Analysis
137
13 Ba Pr Ba 89.4433 8
14 Ba Pr Ti 34.7219 8
15 Ba Pr Pr 119.8396 4
16 Ba Pr Ba 90.5567 8
17 Ba Pr O1 120.3225 16
18 Ba Pr Ba 179.9900 2
19 Ti Ba O1 89.9993 2
20 Ti Ba O2 54.4724 2
21 Ti Ba Ba 89.9995 16
22 Ti Ba Ba 0.0005 8
23 Ba Ti Pr 90.0005 16
24 Ba Ti Ba 180.0000 4
25 O1 Ba O2 35.5269 8
26 O1 Ba Ba 44.9998 16
27 O1 Ba Ba 89.9993 2
28 Ba O1 Pr 60.1612 12
29 Ba O1 Ba 90.0000 8
30 Ba O1 Pr 119.8396 4
31 Ba O1 Ba 179.9899 2
32 O2 Ba Ba 54.8670 12
33 O2 Ba Ba 54.4724 2
34 Ba O2 Pr 54.8670 12
35 Ba O2 Ba 70.2651 4
36 Ba O2 Pr 125.1330 12
37 Ba O2 Ba 108.9457 2
38 Ba O2 Ba 71.0543 2
39 Ba O2 Ba 109.7349 4
40 Ba O2 Ba 179.9774 1
41 Ba Pr Ba 180.0000 2
42 Ba Ba Ba 89.9995 24
43 Ba Ba O2 54.8679 4
44 Ba Ba Pr 45.2786 8
45 Ba Ba Pr 90.0007 4
46 Ba Ba Pr 44.7219 8
47 Ba Ba O2 54.4733 6
48 Ba Ba O1 90.0007 2
49 Ti Pr O1 90.0000 8
50 Ti Pr O2 90.0005 8
51 Ti Pr Pr 45.0002 8
52 Ti Pr Pr 90.0005 8
53 Ti Pr Ba 134.7214 8
54 Ti Pr Ti 180.0000 4
55 Ti Pr Pr 135.0002 8
56 Ti Pr Ba 45.2786 8
57 Ti Pr O1 90.0007 4
58 Pr Ti Pr 89.9995 4
59 O1 Pr O2 45.2786 4
60 O1 Pr Pr 60.1610 12
61 O1 Pr Pr 45.2786 4
62 O1 Pr O1 90.5567 4
63 Pr O1 Pr 59.6781 8
64 Pr O1 Ba 119.8390 12
65 Pr O1 Pr 89.4433 4
66 O2 Pr Pr 45.0002 8
67 O2 Pr Pr 180.0000 2
68 O2 Pr Ba 90.0000 8
69 O2 Pr O1 45.2781 4
70 O2 Pr Ba 89.9993 4
71 Pr O2 Pr 89.9995 4
72 Pr O2 Ba 125.1321 4
73 Pr O2 Pr 180.0000 2
74 Pr O2 Ba 54.8679 4
75 Pr Pr Pr 45.0002 8
76 Pr Pr Ba 119.8390 12
77 Pr Pr Pr 90.0000 4
78 Pr Pr Ba 90.0000 8
79 Pr Pr O1 45.2781 4
80 Pr Pr Ba 89.9993 4
81 Ba Pr Ba 179.9759 2
82 Pr Ba O1 60.1610 12
83 Pr Ba O2 35.1328 12
84 Pr Ba Ti 44.7219 8
85 Pr Ba Ba 90.0000 8
86 Ti Pr O1 89.9993 4
87 Pr Pr O1 60.1604 4
88 Pr Pr Ba 60.1604 4
89 Pr O1 Ba 60.1604 4
90 Ti Ba O2 54.4733 6
91 Ti Ba O1 90.0007 2
92 Ba O1 Ba 179.9796 2
93 O1 Ba Ti 90.0000 4
94 O1 Ba Ba 90.0000 4
95 O2 Pr Pr 0.0003 2
96 Ba O2 Ba 108.9453 2
97 Ba O2 Ba 70.2655 4
98 Ba O2 Ba 109.7345 4
99 Ba O2 Ba 71.0547 2
100 Ba O2 Ba 180.0000 3

Chapter-IV Rietveld Analysis
138
101 Ba Pr Ba 179.9862 2
4.2.2.6 Conclusion:
The Rietveld refinement of Ba1-xPrxTiO3 ceramics for x = 0, 0.001 shows that all the
figure of merit parameters, the average crystallite size, r.m.s. microstrain and the lattice
parameters follow a peculiar trend. All the above parameters changes non-linearly and
are closely related and follows a wavy nature with increasing doping concentration of
praseodymium to BaTiO3. At last we get a clear picture of the crystal structure of
Ba0.999Pr0.001TiO3 ceramics in terms of positions of the different atoms, bond lengths and
bond angles.

Chapter-IV Rietveld Analysis
139
4.2.3 Results and discussions of Ba1-xDyxTiO3 ceramics
Fig. 4.13 (a): Refined structure of Ba1-xDyxTiO3 ceramics for x=0.01
Fig. 4.13 (b): Refined structure of Ba1-xDyxTiO3 ceramics for x=0.025
Fig. 4.13 (c): Refined structure of Ba1-xDyxTiO3 ceramics for x=0.05
Fig. 4.13 (d): Refined structure of Ba1-xDyxTiO3 ceramics for x=0.075

Chapter-IV Rietveld Analysis
140
In the above Fig. 4.13(a-d), the dots represent observed and solid lines represents the
calculated intensities on the same scale. The tick marks indicates the calculated positions
of Bragg peaks.
-0.01 0.00 0.01 0.02 0.03 0.04 0.05 0.06 0.07 0.08
0.2
0.4
0.6
0.8
1.0
1.2
1.4
1.6
r.m
.s. str
ain
x 1
0 3
Composition
Fig. 4.14: Composition vs. r.m.s. strain of Ba1-xDyxTiO3 ceramics
Fig.4.14 represents the variation of r.m.s. strain of BaTiO3 ceramics due to the
substitution of Dy. The figure indicates that, the change in r.m.s. strain due to the
substitution of Dy decreases suddenly and from x = 0.025, it remains same. There is no
change in microstrain. But, due to the substitution of Dy the average crystallite size of
BaTiO3 ceramics gets changed. The crystallite size increases suddenly and remains
constant at 789.95 nm. Fig. 4.15 represents the change in crystallite size (nm) due to the
substitution of Dy. The variation of crystallite size with different % of Dy substitution
shows a peculiar trend. First, it increases rapidly for x= 0.01, and remains the same for all
other composition.
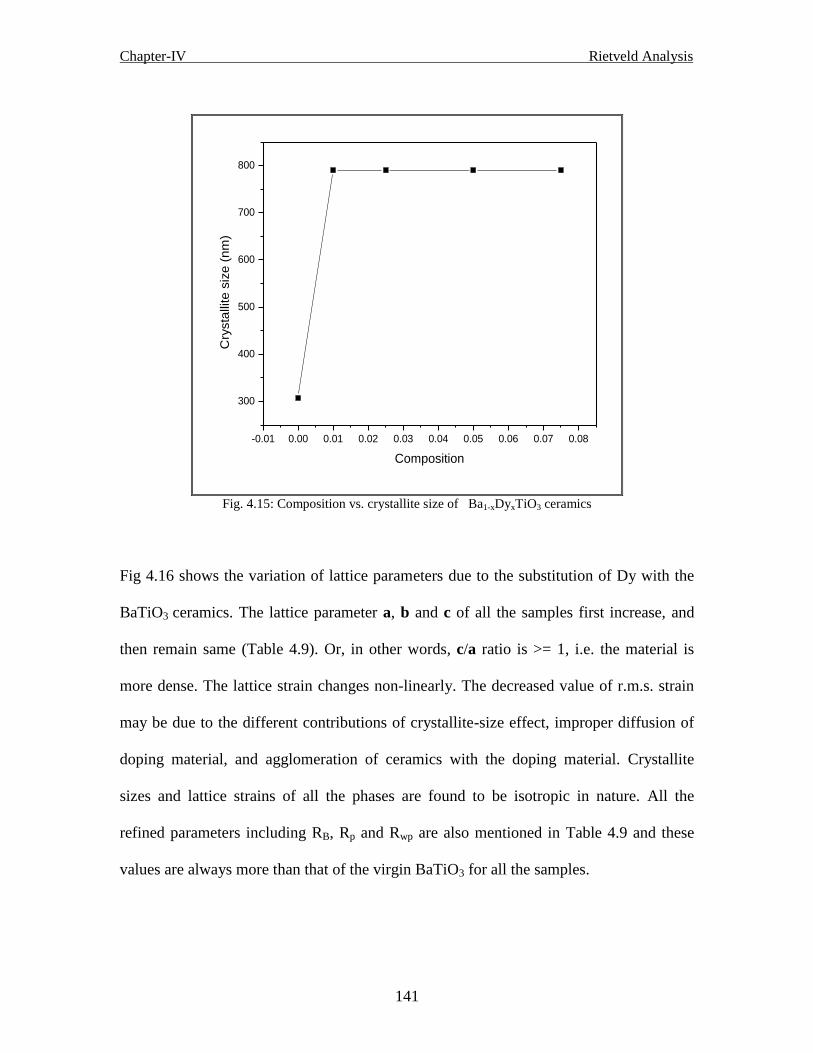
Chapter-IV Rietveld Analysis
141
-0.01 0.00 0.01 0.02 0.03 0.04 0.05 0.06 0.07 0.08
300
400
500
600
700
800
Cry
sta
llite
siz
e (
nm
)
Composition
Fig. 4.15: Composition vs. crystallite size of Ba1-xDyxTiO3 ceramics
Fig 4.16 shows the variation of lattice parameters due to the substitution of Dy with the
BaTiO3 ceramics. The lattice parameter a, b and c of all the samples first increase, and
then remain same (Table 4.9). Or, in other words, c/a ratio is >= 1, i.e. the material is
more dense. The lattice strain changes non-linearly. The decreased value of r.m.s. strain
may be due to the different contributions of crystallite-size effect, improper diffusion of
doping material, and agglomeration of ceramics with the doping material. Crystallite
sizes and lattice strains of all the phases are found to be isotropic in nature. All the
refined parameters including RB, Rp and Rwp are also mentioned in Table 4.9 and these
values are always more than that of the virgin BaTiO3 for all the samples.

Chapter-IV Rietveld Analysis
142
-0.01 0.00 0.01 0.02 0.03 0.04 0.05 0.06 0.07 0.08
0.0
0.5
1.0
1.5
2.0
2.5
3.0
3.5
a=b
c
La
ttic
e p
ara
me
ters
(n
m)
Composition
Fig. 4.16: Composition vs. lattice parameters of Ba1-xDyxTiO3 ceramics
Table 4.9 Figure of merit for Ba1-xDyxTiO3 ceramics
Sample Refined parameters Lattice parameters(nm) Crystallite r.m.s. strain
size (nm)
Rwp Rp Rwpb Rpb GOF a b c (Dv) ε x10-3
I 0.768 0.671 0.812 0.698 0.24 0.146 0.146 1.625 789.95 0.254
II 0.848 0.790 0.871 0.795 0.25 0.148 0.148 1.950 789.95 0.237
III 0.831 0.769 1.132 0.926 0.26 3.305 3.305 2.161 789.95 0.237
IV 0.862 0.807 1.148 0.934 0.23 3.305 3.305 2.161 789.95 0.237

Chapter-IV Rietveld Analysis
143
4.2.3.1 Generated structure of Ba1-xDyxTiO3 ceramics
Based on the above consideration, theoretically we can predict the structure of the
praseodymium-modified BaTiO3 as shown in Fig 4.17, with different bond lengths
(Table-4.14)and bond angles (Table-4.15) and generated positions (Table-4.13), with
initial data a = b = 1.4574A and c = 16.2498 A with SGN 123, P4MM, H-M
Tetragonal symmetry for x = 0.01.
a
b
c
Ba
2.8242
3.4716
3.9940
2.8398
3.9940
2.8398 2.0190
4.0380
Ba3.9940
2.8242
3.4716
2.8398 2.0190
2.8398
4.0380
Ti
1.9970
1.9970
2.0190
O1
2.8242
2.8398
2.8398
2.8398
2.8242
2.8398
Dy1.99703.9940
2.8242 1.9970
2.8242
2.8398
2.8398
2.8398
Ba
3.9940
3.47162.8398
2.0190 2.8398
4.0380
Ti1.9970
2.0190
Dy
1.99702.8242
3.9940
1.9970
2.8398
2.8398 2.8398Ba
3.4717
2.8242
3.9940
3.9940
O2
3.4717
1.9970
1.9970
3.4716 3.4716
3.4716
Ba
2.0190
2.8398
2.8398
4.0380 Dy1.9970
2.8242
2.8398
2.8398
2.8398
Ti
1.9970
2.0190
Ba3.9940
2.8242Dy
1.9970
2.8398
2.8398
2.8398
O1
2.8242
2.8242
Ti
2.0190
Ba
3.9940
Ba
PowderCell 2 .0
Fig. 4.17: Generated structure of the Ba1-xDyxTiO3 ceramics

Chapter-IV Rietveld Analysis
144
4.2.3.2 The unit cell
O1
2.8242
2.8398
O2
3.4717
1.9970
Ba
2.0190
2.8398
Dy
1.9970
Ti
PowderCell 2 .0
Fig. 4.18: Unit cell of the Ba1-xDyxTiO3 ceramics
4.2.3.3 Generated positions of Ba1-xDyxTiO3 ceramics
Table: 4.13 Generated positions of Ba1-xDyxTiO3 ceramics
No name crystal coordinates cartesian coordinates
x y z x y z
1 Ba 0.0000 0.0000 0.0000 -1.9970 -1.9970 -2.0190
2 Ti 0.0000 0.0000 0.5000 -1.9970 -1.9970 0.0000
3 O1 0.5000 0.5000 0.0000 0.0000 0.0000 -2.0190
4 O2 0.5000 0.5000 0.5000 0.0000 0.0000 0.0000
5 Dy 0.0000 0.5000 0.5000 -1.9970 0.0000 0.0000
6 Dy 0.5000 0.0000 0.5000 0.0000 -1.9970 0.0000
4.2.3.4 Bond lengths of Ba1-xDyxTiO3 ceramics
Table: 4.14 Bond lengths of Ba1-xDyxTiO3 ceramics
No atom1 atom2 distance quant
1 Ba Ti 2.0190 8
2 Ba O1 2.8242 8
3 Ba O2 3.4717 8
4 Ba Dy 2.8398 16
5 Ba Ba 3.9940 8
6 Ba Ba 4.0380 4
7 Ti Dy 1.9970 8
8 O1 Dy 2.8398 8
9 O2 Dy 1.9970 4
10 Dy Dy 2.8242 4
11 Dy Dy 3.9940 2
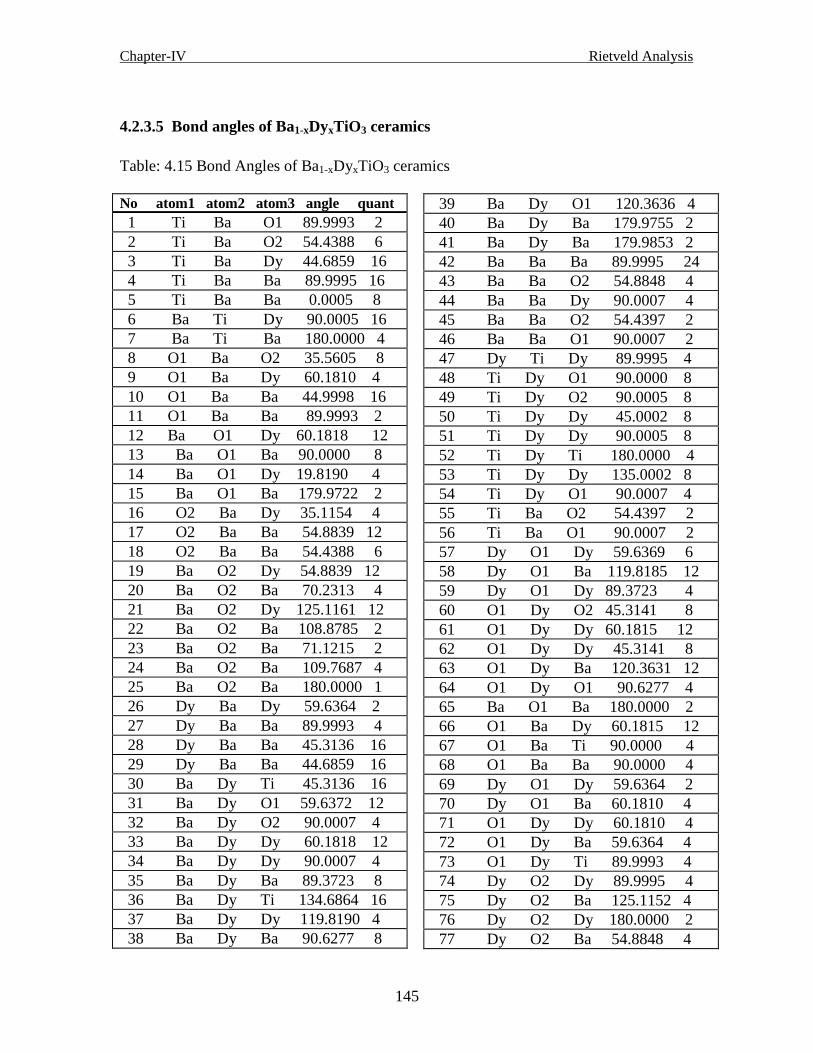
Chapter-IV Rietveld Analysis
145
4.2.3.5 Bond angles of Ba1-xDyxTiO3 ceramics
Table: 4.15 Bond Angles of Ba1-xDyxTiO3 ceramics
No atom1 atom2 atom3 angle quant
1 Ti Ba O1 89.9993 2
2 Ti Ba O2 54.4388 6
3 Ti Ba Dy 44.6859 16
4 Ti Ba Ba 89.9995 16
5 Ti Ba Ba 0.0005 8
6 Ba Ti Dy 90.0005 16
7 Ba Ti Ba 180.0000 4
8 O1 Ba O2 35.5605 8
9 O1 Ba Dy 60.1810 4
10 O1 Ba Ba 44.9998 16
11 O1 Ba Ba 89.9993 2
12 Ba O1 Dy 60.1818 12
13 Ba O1 Ba 90.0000 8
14 Ba O1 Dy 19.8190 4
15 Ba O1 Ba 179.9722 2
16 O2 Ba Dy 35.1154 4
17 O2 Ba Ba 54.8839 12
18 O2 Ba Ba 54.4388 6
19 Ba O2 Dy 54.8839 12
20 Ba O2 Ba 70.2313 4
21 Ba O2 Dy 125.1161 12
22 Ba O2 Ba 108.8785 2
23 Ba O2 Ba 71.1215 2
24 Ba O2 Ba 109.7687 4
25 Ba O2 Ba 180.0000 1
26 Dy Ba Dy 59.6364 2
27 Dy Ba Ba 89.9993 4
28 Dy Ba Ba 45.3136 16
29 Dy Ba Ba 44.6859 16
30 Ba Dy Ti 45.3136 16
31 Ba Dy O1 59.6372 12
32 Ba Dy O2 90.0007 4
33 Ba Dy Dy 60.1818 12
34 Ba Dy Dy 90.0007 4
35 Ba Dy Ba 89.3723 8
36 Ba Dy Ti 134.6864 16
37 Ba Dy Dy 119.8190 4
38 Ba Dy Ba 90.6277 8
39 Ba Dy O1 120.3636 4
40 Ba Dy Ba 179.9755 2
41 Ba Dy Ba 179.9853 2
42 Ba Ba Ba 89.9995 24
43 Ba Ba O2 54.8848 4
44 Ba Ba Dy 90.0007 4
45 Ba Ba O2 54.4397 2
46 Ba Ba O1 90.0007 2
47 Dy Ti Dy 89.9995 4
48 Ti Dy O1 90.0000 8
49 Ti Dy O2 90.0005 8
50 Ti Dy Dy 45.0002 8
51 Ti Dy Dy 90.0005 8
52 Ti Dy Ti 180.0000 4
53 Ti Dy Dy 135.0002 8
54 Ti Dy O1 90.0007 4
55 Ti Ba O2 54.4397 2
56 Ti Ba O1 90.0007 2
57 Dy O1 Dy 59.6369 6
58 Dy O1 Ba 119.8185 12
59 Dy O1 Dy 89.3723 4
60 O1 Dy O2 45.3141 8
61 O1 Dy Dy 60.1815 12
62 O1 Dy Dy 45.3141 8
63 O1 Dy Ba 120.3631 12
64 O1 Dy O1 90.6277 4
65 Ba O1 Ba 180.0000 2
66 O1 Ba Dy 60.1815 12
67 O1 Ba Ti 90.0000 4
68 O1 Ba Ba 90.0000 4
69 Dy O1 Dy 59.6364 2
70 Dy O1 Ba 60.1810 4
71 O1 Dy Dy 60.1810 4
72 O1 Dy Ba 59.6364 4
73 O1 Dy Ti 89.9993 4
74 Dy O2 Dy 89.9995 4
75 Dy O2 Ba 125.1152 4
76 Dy O2 Dy 180.0000 2
77 Dy O2 Ba 54.8848 4

Chapter-IV Rietveld Analysis
146
78 O2 Dy Dy 45.0002 8
79 O2 Dy Dy 180.0000 2
80 O2 Dy Ba 90.0000 8
81 O2 Dy Ba 89.9993 4
82 O2 Dy Dy 0.0003 2
83 Ba O2 Ba 108.8781 2
84 Ba O2 Ba 70.2317 4
85 Ba O2 Ba 109.7683 4
86 Ba O2 Ba 71.1219 2
87 Ba O2 Ba 179.9811 2
88 O2 Ba Dy 35.1159 12
89 Ba O2 Ba 179.9895 1
90 Dy Dy Dy 45.0002 8
91 Dy Dy Ba 119.8185 12
92 Dy Dy Dy 90.0000 4
93 Dy Dy Ba 90.0000 8
94 Dy Dy Ba 89.9993 4
95 Ba Dy Ba 179.9693 2
96 Dy Ba Dy 59.6372 6
97 Dy Ba Ba 90.0000 8
98 Dy Dy Ba 60.1810 4
99 Ba Dy Ba 179.9764 2
4.2.3.6 Conclusion:
The Rietveld refinement of Ba1-xDyxTiO3 ceramics for x = 0.01 shows that all the figure
of merit parameters, the average crystallite size, r.m.s. microstrain and the lattice
parameters follow a peculiar trend. Initially they decreases and thereafter remains
constant. It seems that after certain range the crystallite size and strain has no change and
remain same and are independent. At last we get a clear picture of the crystal structure of
Ba0.99Dy0.01TiO3 ceramics in terms of position of the different atoms, bond lengths and
bond angles.
Chapter-IV Rietveld Analysis
147
References
[1] L. Lutterotti, Maud version 2.14, (2008)
[2] H. M. Rietveld, Acta Crystallogr. 22 (1967) 151.
[3] H. M. Rietveld, J. Appl. Crystallogr. 2 (1969) 65.
[4] R. A. Young, and D. B. Wiles, J. Appl. Cryst. 15 (1982) 430.
[5] R. A. Young (Ed.), The Rietveld Method, Oxford University Press/IUCr, pp. 1–38
(1996).
[6] D. B. Wiles, and R. A. Young, J. Appl. Cryst. 14 (1981) 149.
[7] S. Bid, and S. K. Pradhan, J. Appl. Cryst. 35 (2002) 517.
[8] S. Bid, and S. K. Pradhan, Mater. Chem. Phys. 82 (2003) 27.
[9] S. Bid, and S. K. Pradhan, Jpn. J. Appl. Phys. 43 (2004) 5455.
[10] S. K. Pradhan, S. Bid, M. Gateshki, and V. Petkov, Mater. Chem. Phys. 93 (2005)
224.
[11] B. E. Warren, X-ray Diffraction, Addition-Wesley, Reading, MA, p. 264 (1969)
[12] L. Lutterotti, P. Scardi, and P. Maistrelli, J. Appl. Crystallogr. 25 (1992) 459.
[13] S. Enzo, G. Fagherazzi, A. Benedetti, and S. Polizzi, J. Appl. Crystallogr. 21
(1998) 536.
[14] www.ccp14.ac.uk/tutorial/powdercell 2.3

SEM AND EDX ANALYSIS
Chapter - V
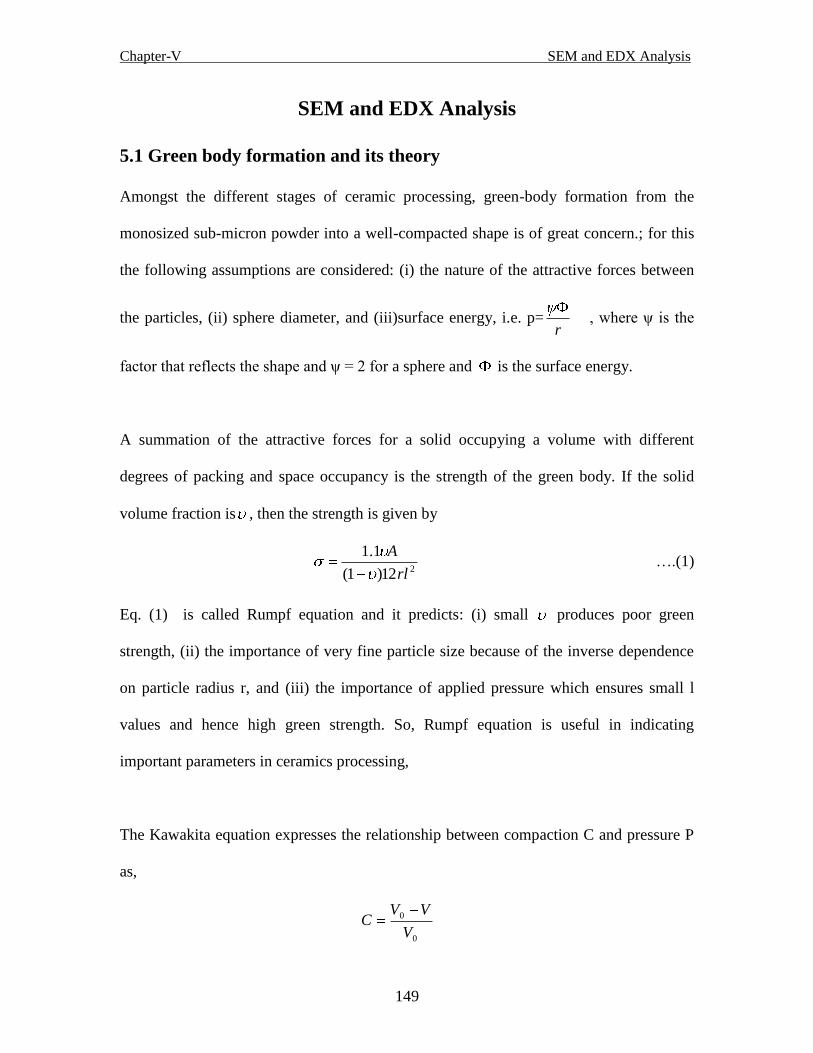
Chapter-V SEM and EDX Analysis
149
SEM and EDX Analysis
5.1 Green body formation and its theory
Amongst the different stages of ceramic processing, green-body formation from the
monosized sub-micron powder into a well-compacted shape is of great concern.; for this
the following assumptions are considered: (i) the nature of the attractive forces between
the particles, (ii) sphere diameter, and (iii)surface energy, i.e. p=r
, where ψ is the
factor that reflects the shape and ψ = 2 for a sphere and is the surface energy.
A summation of the attractive forces for a solid occupying a volume with different
degrees of packing and space occupancy is the strength of the green body. If the solid
volume fraction is , then the strength is given by
212)1(
1.1
rl
A ….(1)
Eq. (1) is called Rumpf equation and it predicts: (i) small produces poor green
strength, (ii) the importance of very fine particle size because of the inverse dependence
on particle radius r, and (iii) the importance of applied pressure which ensures small l
values and hence high green strength. So, Rumpf equation is useful in indicating
important parameters in ceramics processing,
The Kawakita equation expresses the relationship between compaction C and pressure P
as,
0
0
V
VVC
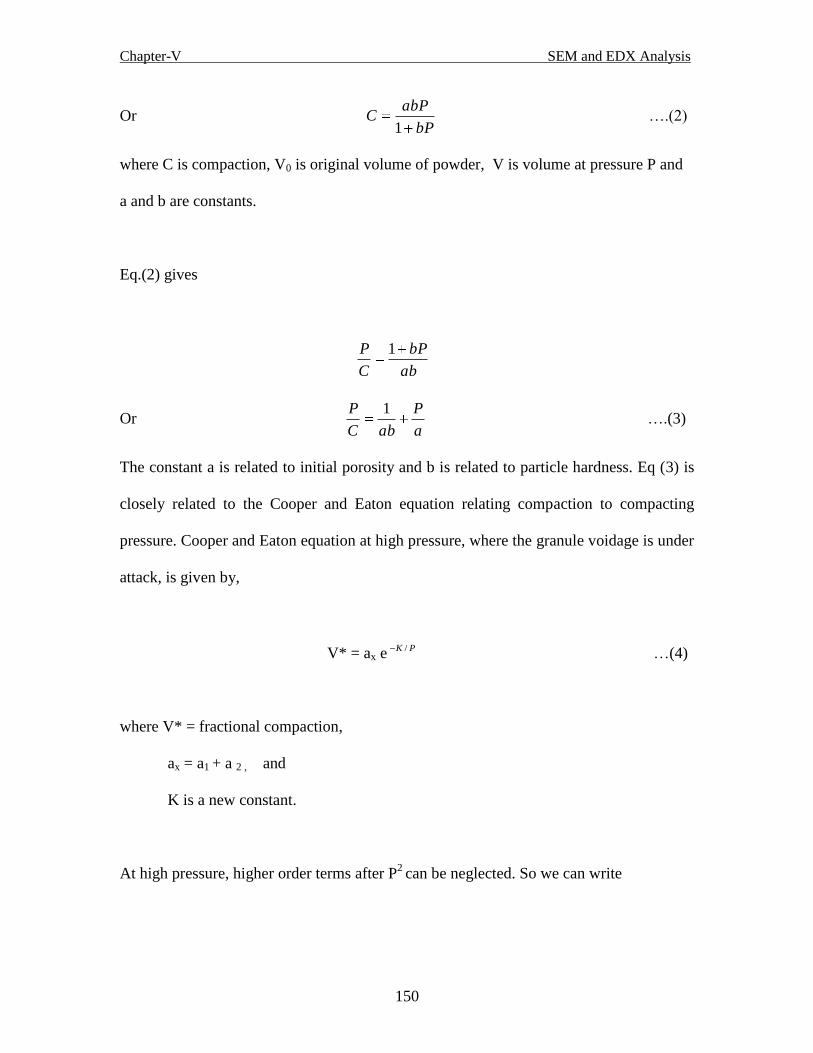
Chapter-V SEM and EDX Analysis
150
Or bP
abPC
1 ….(2)
where C is compaction, V0 is original volume of powder, V is volume at pressure P and
a and b are constants.
Eq.(2) gives
ab
bP
C
P 1
Or a
P
abC
P 1 ….(3)
The constant a is related to initial porosity and b is related to particle hardness. Eq (3) is
closely related to the Cooper and Eaton equation relating compaction to compacting
pressure. Cooper and Eaton equation at high pressure, where the granule voidage is under
attack, is given by,
V* = ax ePK / …(4)
where V* = fractional compaction,
ax = a1 + a 2 , and
K is a new constant.
At high pressure, higher order terms after P2
can be neglected. So we can write
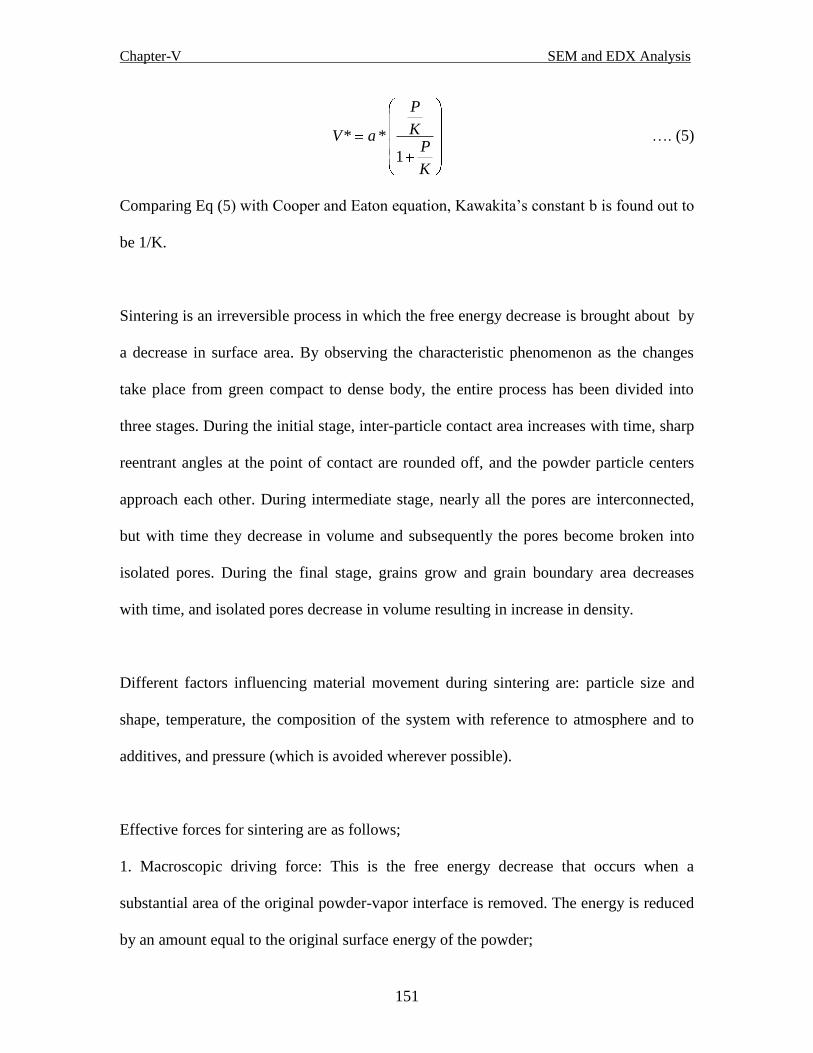
Chapter-V SEM and EDX Analysis
151
K
PK
P
aV
1
** …. (5)
Comparing Eq (5) with Cooper and Eaton equation, Kawakita’s constant b is found out to
be 1/K.
Sintering is an irreversible process in which the free energy decrease is brought about by
a decrease in surface area. By observing the characteristic phenomenon as the changes
take place from green compact to dense body, the entire process has been divided into
three stages. During the initial stage, inter-particle contact area increases with time, sharp
reentrant angles at the point of contact are rounded off, and the powder particle centers
approach each other. During intermediate stage, nearly all the pores are interconnected,
but with time they decrease in volume and subsequently the pores become broken into
isolated pores. During the final stage, grains grow and grain boundary area decreases
with time, and isolated pores decrease in volume resulting in increase in density.
Different factors influencing material movement during sintering are: particle size and
shape, temperature, the composition of the system with reference to atmosphere and to
additives, and pressure (which is avoided wherever possible).
Effective forces for sintering are as follows;
1. Macroscopic driving force: This is the free energy decrease that occurs when a
substantial area of the original powder-vapor interface is removed. The energy is reduced
by an amount equal to the original surface energy of the powder;

Chapter-V SEM and EDX Analysis
152
rmass
energyU
3, where is specific surface work and is density.
A little modification of this relation throws light that sintering cannot be improved by
increasing the driving force as particle size cannot be reduced to atomic dimension.
2. Microscopic driving force: Compact green body does increase its density on firing.
From the earliest stage of the heating process, curvatures are changed and pores decrease
their radii. The effect of curvature on the vacancy concentration defines a driving force
on the microscopic scale. This driving force is due to the pressure difference that exists at
equilibrium across a curved surface.
The general form of the microscopic driving force for sintering is r
P , where =1
for cylindrical shape and =2 for a sphere. The pulling pressure is calculated from the
above equation and is responsible for the movement of the atoms, molecules or ions in
the system leading to densification.
3. Surface diffusion: Surface diffusion consumes macroscopic driving force without
providing densification. Atoms or ions on the surface of each sphere move along the
surface into the small curvature region where the spheres meet and build up the neck
area. Thus, this process leads to consolidation as the neck area increases, but does not
move structural units from between the centers of the two spheres, so there is no
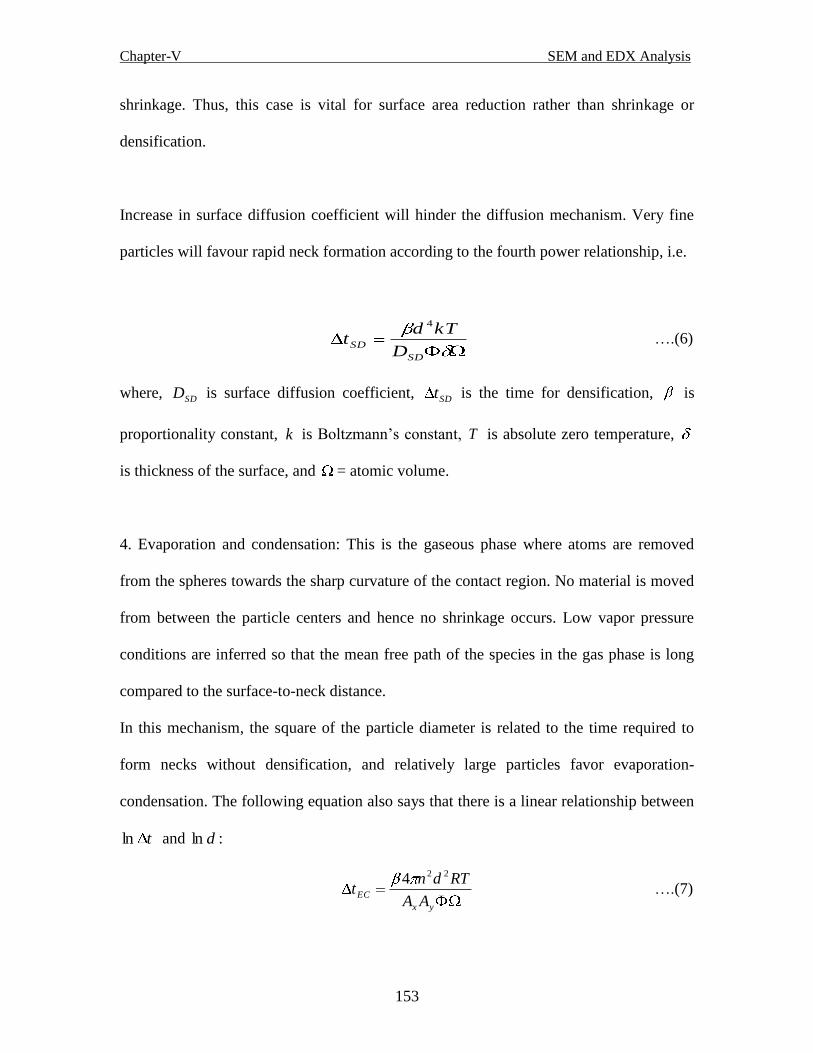
Chapter-V SEM and EDX Analysis
153
shrinkage. Thus, this case is vital for surface area reduction rather than shrinkage or
densification.
Increase in surface diffusion coefficient will hinder the diffusion mechanism. Very fine
particles will favour rapid neck formation according to the fourth power relationship, i.e.
SD
SDD
kTdt
4
….(6)
where, SDD is surface diffusion coefficient, SDt is the time for densification, is
proportionality constant, k is Boltzmann’s constant, T is absolute zero temperature,
is thickness of the surface, and = atomic volume.
4. Evaporation and condensation: This is the gaseous phase where atoms are removed
from the spheres towards the sharp curvature of the contact region. No material is moved
from between the particle centers and hence no shrinkage occurs. Low vapor pressure
conditions are inferred so that the mean free path of the species in the gas phase is long
compared to the surface-to-neck distance.
In this mechanism, the square of the particle diameter is related to the time required to
form necks without densification, and relatively large particles favor evaporation-
condensation. The following equation also says that there is a linear relationship between
tln and dln :
yx
ECAA
RTdnt
224 ….(7)

Chapter-V SEM and EDX Analysis
154
where, xA and yA are the elements of area on the sphere and near the neck respectively,
R is the rate of evaporation per unit area and n is the radius of action. Other symbols have
their usual meaning.
5. Material flux: Material flux during sintering depends upon the number of atoms
crossing the area, chemical potential gradient, drift velocity, atomic volume and the
surface area as,
JA
Vt ….(8)
where, t is the time required to achieve a given degree of densification, V is the drift
velocity, J is the flux and A is area.
After these processes, we get a green ceramic body
The shape of the grains can be statistically quantified by dimensionless ratios called
shape factors. The shape factor ratios include axial lengths, areas, perimeters and
moments of grain shapes. Aspect ratio is the ratio of the largest diameter of a grain to the
smallest diameter and is given by
RA =
S
L
d
d ….(9)
where RA is the aspect ratio,
Ld is the diameter of the largest grain and Sd is the
diameter of the smallest grain. This ratio is normalized and presented in Table-1.
Roundedness of the grain relates the area of a grain to its perimeter and is given by
2
4
P
AR ….(10)

Chapter-V SEM and EDX Analysis
155
where R is the roundedness, A is the area of the grain and P is the perimeter of the grain
5.2 SEM morphology and EDX elemental analysis
5.2.1 Results and discussion of Ba1-xCaxTiO3 ceramics
It is well known that Ba1-xCaxTiO3 ceramics are tetragonal. Here we adopt crystal
structure of tetragonal symmetry in space group p4mm with a= b=3.990Aº and c=
4.03Aº. The purpose of this work is to determine the effect of Ca on barium titanate. The
microstructure of Ba1-xCaxTiO3 ceramics was investigated by Scanning Electron
Microscope (SEM). Fig.5.1shows the micrographs of the Ba1-xCaxTiO3 ceramics, while
Fig. 5.2 shows the EDX spectra of Ba1-xCaxTiO3 ceramics
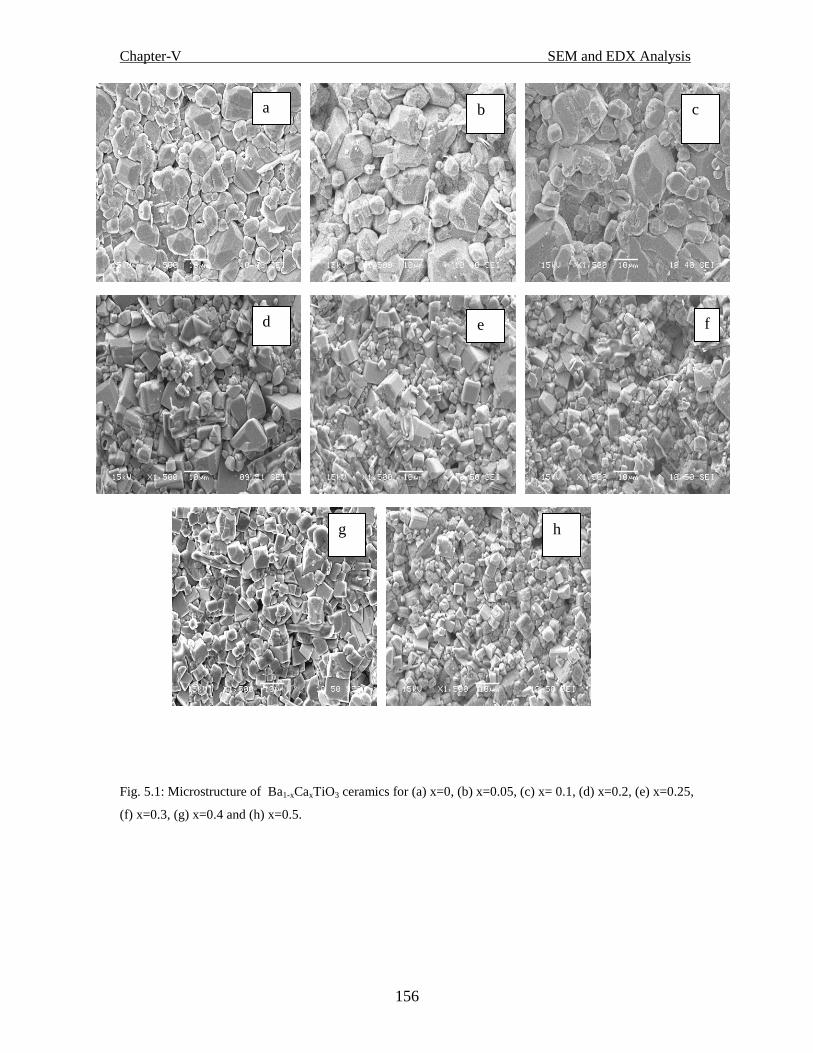
Chapter-V SEM and EDX Analysis
156
Fig. 5.1: Microstructure of Ba1-xCaxTiO3 ceramics for (a) x=0, (b) x=0.05, (c) x= 0.1, (d) x=0.2, (e) x=0.25,
(f) x=0.3, (g) x=0.4 and (h) x=0.5.
a b c
d e f
g h

Chapter-V SEM and EDX Analysis
157
Fig. 5.2 : EDX spectra of Ba1-xCaxTiO3 ceramics for (a) x=0, (b) x=0.05, (c) x= 0.1, (d) x=0.2, (e) x=0.25,
(f) x=0.3, (g) x=0.4 and (h) x=0.5
In this paper, ceramography is used to quantify the grain size and shape. The grain size
and other microstructural characteristics are all dependent on the processing conditions
and methods used to fabricate the ceramic. The mean diameter of the grains in a
microstructure can be defined as the diameter of a circle with the same area as the mean
grain area in a ceramographic cross section. Other techniques used for the measurements
are Martin, Feret and Nassenstein measurement method. Theory says that a specimen
measured by all the above methods is likely to have different grain size because the
methods do not measure the exact same thing. Fig. 5.3 shows that the grain size increases
as the doping concentration increases and again decreases beyond x=0.1 upto x=0.4, and
for x=0.5 again increases.
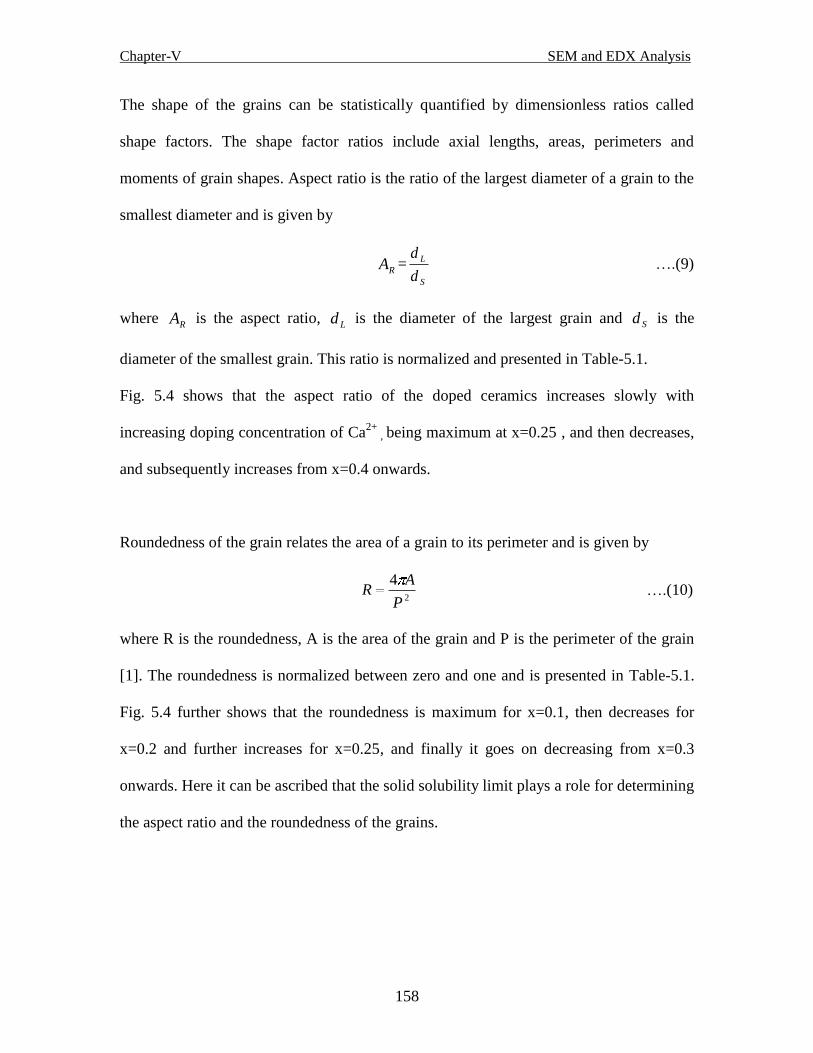
Chapter-V SEM and EDX Analysis
158
The shape of the grains can be statistically quantified by dimensionless ratios called
shape factors. The shape factor ratios include axial lengths, areas, perimeters and
moments of grain shapes. Aspect ratio is the ratio of the largest diameter of a grain to the
smallest diameter and is given by
RA =
S
L
d
d ….(9)
where RA is the aspect ratio,
Ld is the diameter of the largest grain and Sd is the
diameter of the smallest grain. This ratio is normalized and presented in Table-5.1.
Fig. 5.4 shows that the aspect ratio of the doped ceramics increases slowly with
increasing doping concentration of Ca2+
, being maximum at x=0.25 , and then decreases,
and subsequently increases from x=0.4 onwards.
Roundedness of the grain relates the area of a grain to its perimeter and is given by
2
4
P
AR ….(10)
where R is the roundedness, A is the area of the grain and P is the perimeter of the grain
[1]. The roundedness is normalized between zero and one and is presented in Table-5.1.
Fig. 5.4 further shows that the roundedness is maximum for x=0.1, then decreases for
x=0.2 and further increases for x=0.25, and finally it goes on decreasing from x=0.3
onwards. Here it can be ascribed that the solid solubility limit plays a role for determining
the aspect ratio and the roundedness of the grains.

Chapter-V SEM and EDX Analysis
159
0.0 0.1 0.2 0.3 0.4 0.5
2
4
6
8
10
Gra
in s
ize
(m
)
Composition
Fig. 5.3: Composition vs. grain size
0.0 0.1 0.2 0.3 0.4 0.5
0.65
0.70
0.75
0.80
0.85
0.90
0.95
1.00
Sha
pe
Fa
cto
r (A
R /R
)
Composition
AR
R
Fig. 5.4: Composition vs. Shape factor

Chapter-V SEM and EDX Analysis
160
0.0 0.1 0.2 0.3 0.4 0.5
80
82
84
86
88
90
92
94
96
98
100
Sh
are
%
Composition
Fig. 5.5: Composition vs. share %
0.0 0.1 0.2 0.3 0.4 0.5
0
5
10
15
20
25
30
35
40
45
50
55
60
65
Wt %
Composition
Ba
Ti
Ca
Fig.5.6: Composition vs. weight %
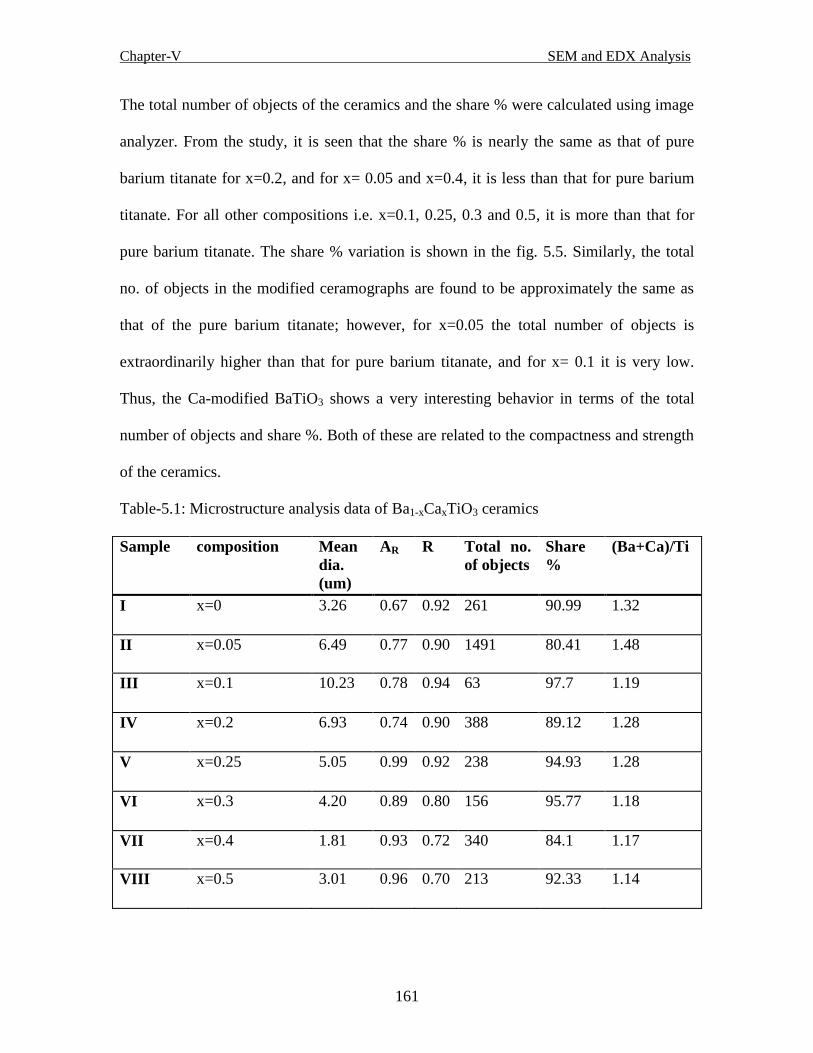
Chapter-V SEM and EDX Analysis
161
The total number of objects of the ceramics and the share % were calculated using image
analyzer. From the study, it is seen that the share % is nearly the same as that of pure
barium titanate for x=0.2, and for x= 0.05 and x=0.4, it is less than that for pure barium
titanate. For all other compositions i.e. x=0.1, 0.25, 0.3 and 0.5, it is more than that for
pure barium titanate. The share % variation is shown in the fig. 5.5. Similarly, the total
no. of objects in the modified ceramographs are found to be approximately the same as
that of the pure barium titanate; however, for x=0.05 the total number of objects is
extraordinarily higher than that for pure barium titanate, and for x= 0.1 it is very low.
Thus, the Ca-modified BaTiO3 shows a very interesting behavior in terms of the total
number of objects and share %. Both of these are related to the compactness and strength
of the ceramics.
Table-5.1: Microstructure analysis data of Ba1-xCaxTiO3 ceramics
Sample composition Mean
dia.
(um)
AR R Total no.
of objects
Share
%
(Ba+Ca)/Ti
I x=0 3.26 0.67 0.92 261 90.99 1.32
II x=0.05 6.49 0.77 0.90 1491 80.41 1.48
III x=0.1 10.23 0.78 0.94 63 97.7 1.19
IV x=0.2 6.93 0.74 0.90 388 89.12 1.28
V x=0.25 5.05 0.99 0.92 238 94.93 1.28
VI x=0.3 4.20 0.89 0.80 156 95.77 1.18
VII x=0.4 1.81 0.93 0.72 340 84.1 1.17
VIII x=0.5 3.01 0.96 0.70 213 92.33 1.14

Chapter-V SEM and EDX Analysis
162
Table-5.2 shows the relation between the theoretical wt% and EDX spectra wt% of
different elements of various compositions of Ba1-xCaxTiO3 ceramics. It is observed that
both the wt% are more or less the same with a little variation. Similarly Fig. 5.6 gives a
relation between the various compositions and wt% of the different element in the Ba1-
xCaxTiO3 ceramics.
Table-5.2: Elemental analysis of Ba1-xCaxTiO3 ceramics
.
Composition Element Theoretical Wt % EDX spectra Wt
%
X=0
Ba
58.89 65.03
Ti 20.52 17.17
O 20.58 17.80
Ca 0 0
X=0.05 Ba 57.14 61.79
Ti 20.96 15.36
O 21.02 21.92
Ca 0.87 0.93
X=0.1 Ba 55.30 56.84
Ti 21.42 18.26
O 21.48 23.37
Ca 1.79 1.53
X=0.2 Ba 51.40 53.19
Ti 22.39 16.92
O 22.46 27.34
Ca 3.75 2.54
X=0.25 Ba 49.31 55.40
Ti 22.92 19.50
O 22.98 20.44
Ca 4.80 4.66
X=0.3 Ba 47.12 46.57
Ti 23.46 19.76
O 23.53 27.75
Ca 5.89 5.91
X=0.4 Ba 42.41 45.24
Ti 24.64 22.46
O 24.71 23.48
Ca 8.25 8.82
X=0.5 Ba 37.20 37.75
Ti 25.93 21.56
O 26.00 31.13
Ca 10.86 9.56

Chapter-V SEM and EDX Analysis
163
Porosity, which can be considered as a secondary phase, indicates the degree of
densification of a ceramic. Porosity decreases strength, because pores reduce the true
cross section area of a member and also pores act as stress-concentrating notches. In this
study, we found that the porosity of all the specimens is less than 8% (approx.), which
means that the pores are discrete and match with the porosity thumb rule.
The euhedral microstructure of the ceramics is similar to the shape of the Bravais lattice
cell and is clearly observed in the Fig. 5.1. The dense and uniform micrographs are
clearly seen in all samples and the grain size is large. Fig. 5.1. shows the morphology of
the sintered BCT ceramics. The primary particles were round-shaped with uniform size
for BaTiO3 as shown in Fig.5.1 (a). Porosity is almost negligible. It was reported that the
driving forces for densification and grain growth are comparable in magnitude, both
being proportional to the reciprocal grain size. The compositional EDS analysis shows
that the consistence decreases in the atomic concentration ratios of (Ba+Ca)/Ti value as
the doping concentration of Ca increases from x=0 to x=0.3 except for x=0.15. This
deviation may be due to some Ca2+
replacing Ti4+
instead of Ba2+
in this ceramic[2].
Since the ion radius for Ca2+
is much larger than that of Ti4+
, Ca2+
replacing Ti4+
in the
octahedral sites of the perovskite structure will cause a localized expansion of the unit
cell, and result in a lattice distortion.[3].
5.2.1.1 Conclusion:
The euhedral microstructures are clearly seen in the micrograph. The analysis shows that
the grains are almost equaxed. The roundedness and the aspect ratios of almost all the

Chapter-V SEM and EDX Analysis
164
samples are found to be closer to one for the largest grain. The grain size shows very
interesting behavior e.g. it increases as the doping concentration increases and again
decreases beyond x=0.1, upto x=0.4, and for x=0.5 the grain size again increases. The
EDX analysis shows that, for all the doping concentration, the theoretical wt% of the
elements is more or less the same with the wt% calculated from the EDX spectra. This
shows a consistency of the elemental wt% present in the green ceramics.
Chapter-V SEM and EDX Analysis
165
5.2.2 SEM and EDX analysis of Ba1-xPrxTiO3 ceramics
Since the discovery of high dielectric properties of BaTiO3 ceramics, many investigators
have tried to modify this compound by different means in order to achive stable
capacitors with satisfactory operational capacity [4-9].
The main use of rare earths in electronic ceramics is for capacitor materials. Capacitors
are a large family. Here capacitor means multilayer ceramic capacitors (MLC). Rare earth
oxide is one of the most important additives to BaTiO3 based dielectrics in MLC
manufacturing with base metal electrode [10, 11]. However little research has been
focused on the BaTiO3 system doped with various rare earth elements. The most widely
used ceramic material is barium titanate whose Curie temperature is within the working
temperature range (-55 to + 125 C) [12, 13]. Consequently the dielectric constant, K, is
not steady in this temperature range. For the precision capacitor range with low K (30 -
60) light RE-compounds (lanthanum, cerium, praseodymium, neodymium) are added
with other ingredients such as TiO2 in order to obtain a very stable K. Another RE effect
is an increase in the capacitor life. In this paper, the influence of rare earth element
(praseodymium) in BaTiO3 and its microstructure was investigated.
5.2.2.1 Result and Discussion of Ba1-xPrxTiO3 ceramics
The SEM micrographs of Pr doped BaTiO3 for x= 0, 0.001.0.002, 0.003 and 0.004 were
shown in Fig.5.7. The images were obtained to collect the information about grain size,
shape and the degree of powder agglomeration. SEM figure shows the microstructure of
the surface of the pellets. The grains were in micrometer range, with an irregular, dense

Chapter-V SEM and EDX Analysis
166
morphology and the powder was not agglomerated. The EDX spectra of Pr doped
BaTiO3 for x= 0, 0.001.0.002, 0.003 and 0.004 were shown in Fig.5.8. Through EDX
analysis, we confirmed the presence of Ba, Pr, Ti and O atoms in BPrT ceramics in
almost the same proportion in the prepared materials. Hence from the above experimental
analysis, we confirmed that the material is formed with high purity.
Fig.5.7: Microstructure of Pr doped BaTiO3 ceramics, (a)0%Pr, (b) 0.1% Pr, (c) 0.2% Pr, (d) 0.3%Pr and
(e)0.4%Pr.
b
a c
d e
a

Chapter-V SEM and EDX Analysis
167
Fig. 5.8: Compositional analysis of Pr doped BaTiO3 ceramics, (a) 0% Pr, (b) 0.1% Pr, (c) 0.2% Pr, (d)
0.3%Pr and (e) 0.4%Pr
From the fig 5.9 it is seen that, the grain size of the raw barium titanate (BT) was less. As
the BT was modified with praseodymium the grain size first increases and then decreases
but the grain size again increases after certain limit. It is observed that barium titanate
substituted with 0.001 wt% of praseodymium has the largest grain size and when it is
substituted with 0.003 wt% of praseodymium (Pr) has the smallest grain size. Thus we
may say that, Pr act as grain growth inhibitor beyond certain limit.
b
d
c e
d
c
b a

Chapter-V SEM and EDX Analysis
168
0.000 0.001 0.002 0.003 0.004
0
2
4
6
8
10
12
14
16
18
Gra
in S
ize
(m
)
Composition
Fig 5.9:Composition vs. Grain size of Ba1-xPrxTiO3 ceramics
Fig 5.10 explains the shape factor of Ba1-xPrxTiO3 ceramics. Here it is seen that, for some
doping concentration the grains are found to be whisker and for some other it is equaxed.
For 0.001 wt% of Pr doping the aspect ratio is minimum but roundedness is maximum,
where as for 0.002 wt% of Pr doping the aspect ratio is maximum but roundedness is
minimum. Fig 5.10 gives a helix like structure with AR and R. Fig 5.11 explains the
elemental wt% present in the compound. Here it is observed that, the theoretical wt %
and spectra wt % obtained from analysis more or less matches with a very little variation.
A quantitative analysis of the Pr doped BaTiO3 ceramics is presented in the Table-5.3 and
a comparision of the wt% of Ba, Pr, Ti and O element in different doping concentration is
given in the Table- 5.4
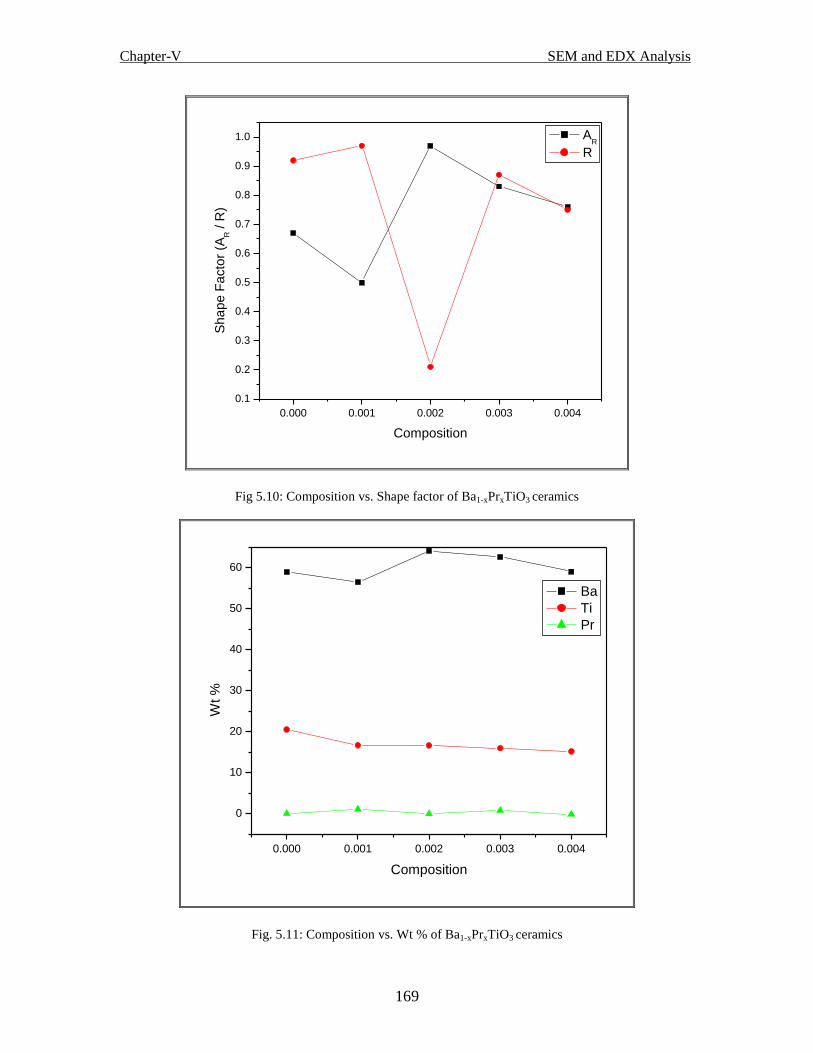
Chapter-V SEM and EDX Analysis
169
0.000 0.001 0.002 0.003 0.004
0.1
0.2
0.3
0.4
0.5
0.6
0.7
0.8
0.9
1.0
Sha
pe
Fa
cto
r (A
R / R
)
Composition
AR
R
Fig 5.10: Composition vs. Shape factor of Ba1-xPrxTiO3 ceramics
0.000 0.001 0.002 0.003 0.004
0
10
20
30
40
50
60
Wt %
Composition
Ba
Ti
Pr
Fig. 5.11: Composition vs. Wt % of Ba1-xPrxTiO3 ceramics

Chapter-V SEM and EDX Analysis
170
Table -5.3: Ceramographic analysis of Pr doped BaTiO3 ceramics
Sample composition Mean
diameter
in um
AR R (Ba+Pr)/Ti
I X=0 3.26 0.67 0.92 1.32
II X=0.001 17.45 0.50 0.97 1.20
III X=0.002 4.59 0.97 0.21 1.34
IV X=0.003 1.68 0.83 0.87 1.38
V X=0.004 2.13 0.76 0.75 1.35
Table – 5.4: Elemental analysis of Pr doped BaTiO3 ceramics.
Composition Element Theoretical
Wt %
EDX spectra
Wt %
X=0
Ba
58.89 65.03
Ti 20.52 17.17
O 20.58 17.80
Pr 0 0
X=0.001 Ba 58.83 56.42
Ti 20.53 16.69
O 20.58 25.76
Pr 0.06 1.14
X=0.002 Ba 58.77 64.07
Ti 20.53 16.68
O 20.58 19.30
Pr 0.12 -0.06
X=0.003 Ba 58.71 62.57
Ti 20.53 15.99
O 20.58 20.67
Pr 0.18 0.77
X=0.004 Ba 58.65 59.04
Ti 20.53 15.19
O 20.58 25.88
Pr 0.24 -0.11
Chapter-V SEM and EDX Analysis
171
5.2.2.2 Conclusion
The SEM images of BPT produced at this temperature were observed shriveled
irregular particles with a smooth surface. The chemical compositions of the samples
were checked by EDX analysis, which confirmed the high purity of the prepared
samples. Results indicated that below the critical concentration of Pr the substitution
took place in the barium sublattice with electronic compensation, and above the
critical concentration, gradually the rare earth ions begin to substitute for titanium.
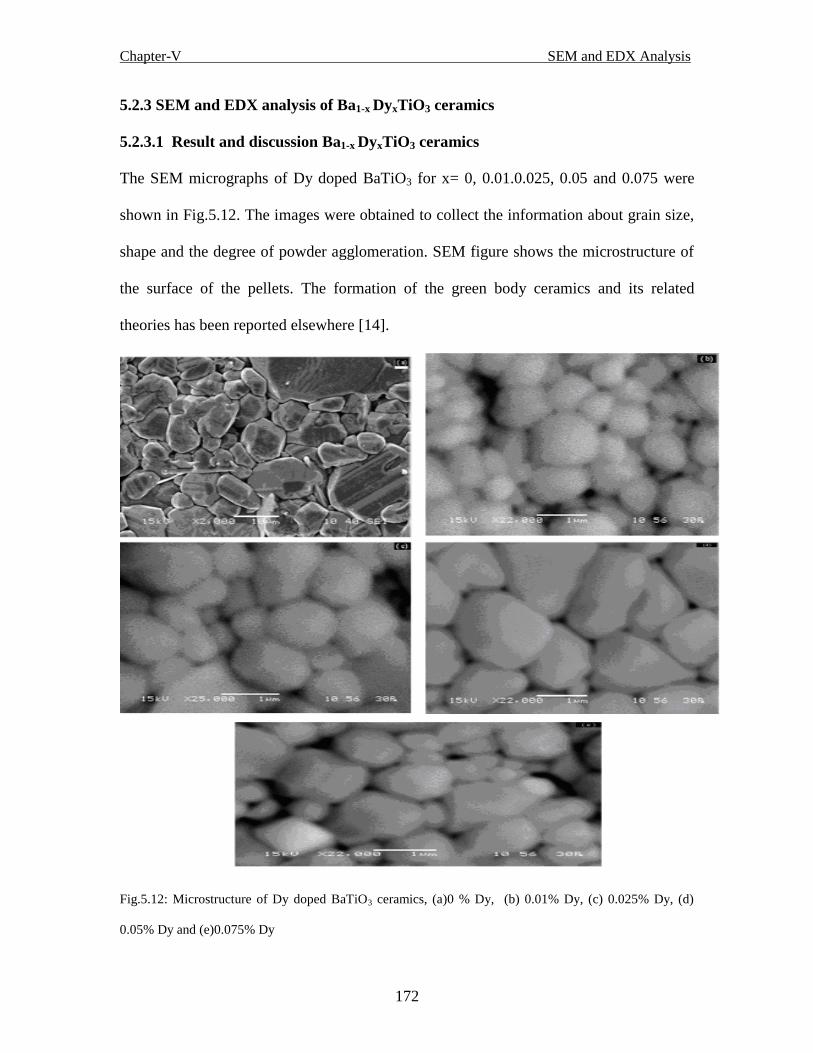
Chapter-V SEM and EDX Analysis
172
5.2.3 SEM and EDX analysis of Ba1-x DyxTiO3 ceramics
5.2.3.1 Result and discussion Ba1-x DyxTiO3 ceramics
The SEM micrographs of Dy doped BaTiO3 for x= 0, 0.01.0.025, 0.05 and 0.075 were
shown in Fig.5.12. The images were obtained to collect the information about grain size,
shape and the degree of powder agglomeration. SEM figure shows the microstructure of
the surface of the pellets. The formation of the green body ceramics and its related
theories has been reported elsewhere [14].
Fig.5.12: Microstructure of Dy doped BaTiO3 ceramics, (a)0 % Dy, (b) 0.01% Dy, (c) 0.025% Dy, (d)
0.05% Dy and (e)0.075% Dy

Chapter-V SEM and EDX Analysis
173
The euhedral microstructure of the ceramics is similar to the shape of the Bravais lattice
cell and is clearly observed in the Fig.5.12. The dense and uniform micrographs are
clearly seen in all samples and the grain size is quite small compared to pure BaTiO3 , in
the range of nano meter . The primary particles were round-shaped with uniform size for
BaTiO3 as shown in Fig.5.12(a). Porosity is almost negligible. It was reported that the
driving forces for densification and grain growth are comparable in magnitude, both
being proportional to the reciprocal grain size. The grains were in the range of few
hundreds of nano meter, with an almost round shape, dense morphology and the powder
was not agglomerated.
The EDX spectra of Dy doped BaTiO3 for x= 0, 0.01.0.025, 0.05 and 0.075 were shown
in Fig.5.13. The compositional EDS analysis shows that the atomic concentration ratios
of (Ba+Dy)/Ti decreases gradually upto x = 0.05 and suddenly it increases for x = 0.075,
as presented in Table-1. This shows the density for the x = 0.075 is more compared to the
other samples. This deviation may be due to some Dy3+
replacing Ti4+
instead of Ba2+
in
this ceramic[15]. Since the ion radius for Dy3+
is much larger than that of Ti4+
, Dy3+
replacing Ti4+
in the octahedral sites of the perovskite structure will cause a localized
expansion of the unit cell, and result in a lattice distortion[13]. Through EDX analysis,
we confirmed the presence of Ba, Dy, Ti and O atoms in dysprosium-substituted barium
titanate (BDT) ceramics in almost the same proportion in the prepared materials. Hence
from the above experimental analysis, we confirmed that the material is formed with high
purity.
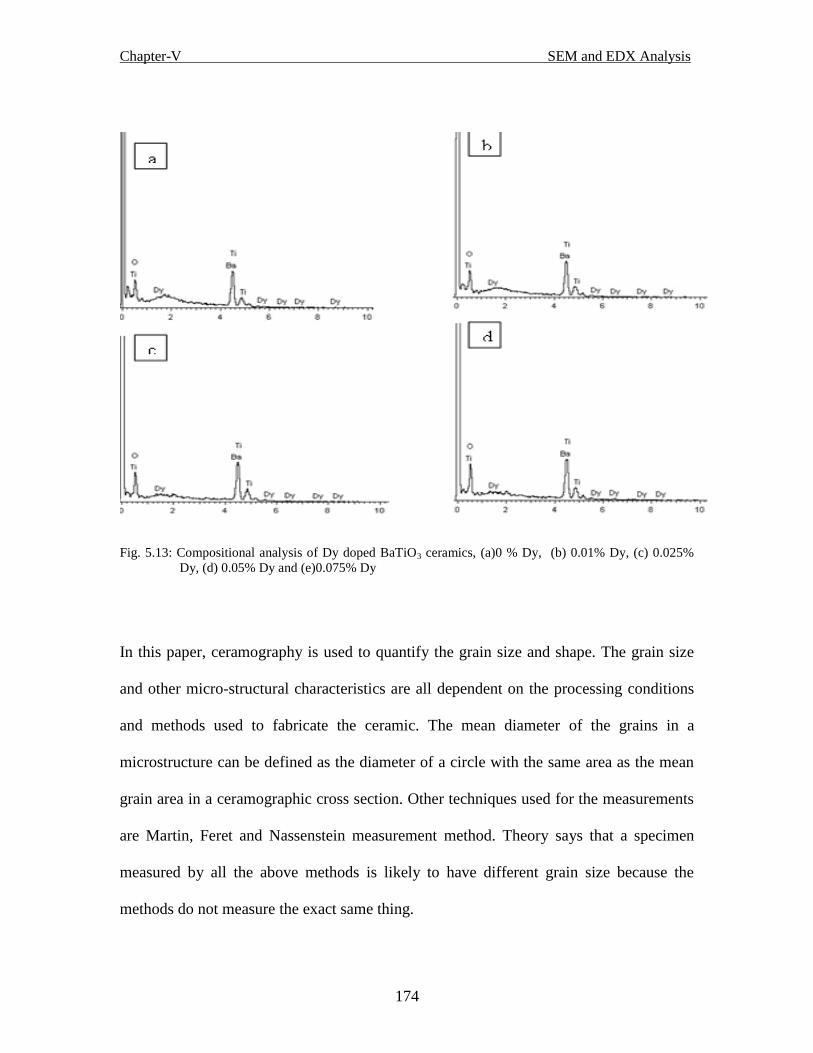
Chapter-V SEM and EDX Analysis
174
Fig. 5.13: Compositional analysis of Dy doped BaTiO3 ceramics, (a)0 % Dy, (b) 0.01% Dy, (c) 0.025%
Dy, (d) 0.05% Dy and (e)0.075% Dy
In this paper, ceramography is used to quantify the grain size and shape. The grain size
and other micro-structural characteristics are all dependent on the processing conditions
and methods used to fabricate the ceramic. The mean diameter of the grains in a
microstructure can be defined as the diameter of a circle with the same area as the mean
grain area in a ceramographic cross section. Other techniques used for the measurements
are Martin, Feret and Nassenstein measurement method. Theory says that a specimen
measured by all the above methods is likely to have different grain size because the
methods do not measure the exact same thing.
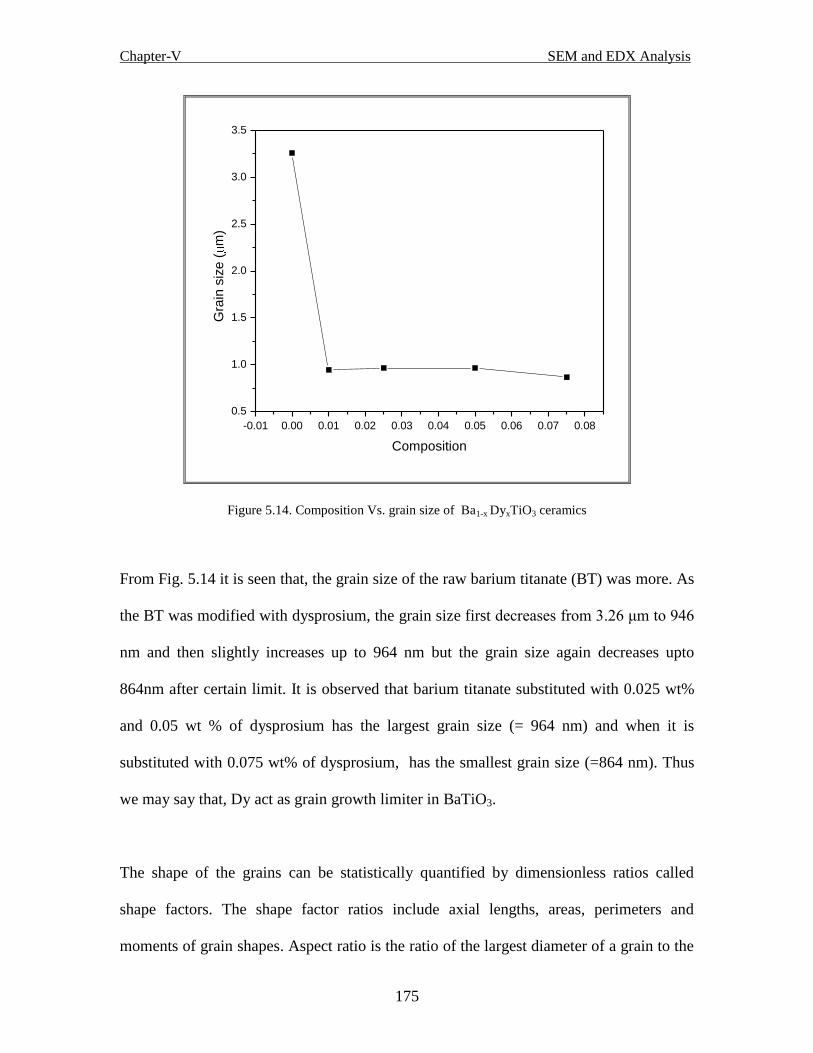
Chapter-V SEM and EDX Analysis
175
-0.01 0.00 0.01 0.02 0.03 0.04 0.05 0.06 0.07 0.08
0.5
1.0
1.5
2.0
2.5
3.0
3.5
Gra
in s
ize
(m
)
Composition
Figure 5.14. Composition Vs. grain size of Ba1-x DyxTiO3 ceramics
From Fig. 5.14 it is seen that, the grain size of the raw barium titanate (BT) was more. As
the BT was modified with dysprosium, the grain size first decreases from 3.26 μm to 946
nm and then slightly increases up to 964 nm but the grain size again decreases upto
864nm after certain limit. It is observed that barium titanate substituted with 0.025 wt%
and 0.05 wt % of dysprosium has the largest grain size (= 964 nm) and when it is
substituted with 0.075 wt% of dysprosium, has the smallest grain size (=864 nm). Thus
we may say that, Dy act as grain growth limiter in BaTiO3.
The shape of the grains can be statistically quantified by dimensionless ratios called
shape factors. The shape factor ratios include axial lengths, areas, perimeters and
moments of grain shapes. Aspect ratio is the ratio of the largest diameter of a grain to the

Chapter-V SEM and EDX Analysis
176
smallest diameter and is given by Eq. (9) and the normalized ratio is presented in Table-
5.5. Roundedness of the grain relates the area of a grain to its perimeter and is given by
Eq.(10). The roundedness is normalized between zero and one, and is presented in Table-
5.5.
Table-5-5 Microstructure analysis of Ba1-x DyxTiO3 ceramics
Sample Composition Mean dia(μm) AR R (Ba+Dy)/Ti
I x = 0 3.26 0.67 0.92 1.32
II x = 0.01 0.946 0.97 0.94 1.67
III x = 0.025 0.964 0.94 0.94 1.61
IV x = 0.05 0.964 0.95 0.94 1.59
V x = 0.075 0.864 0.91 0.91 1.74
Fig. 5.15 explains the shape factor of Ba1-xDyxTiO3 ceramics. Here it is seen that, for all
the doping concentration, the grains are found to be equaxed and spherical in shape. For
0.01 wt% of Dy doping, both the aspect ratio and roundedness is maximum, where as for
0.075 wt% of Dy doping both the aspect ratio and roundedness is minimum. So, here we
may say that, this difference may be due to the difference in grain size. Up to certain
range say 900 nm to 950 nm the shape factor is maximum and when the grain size is
below 900 nm again the aspect ratio and roundedness decreases. Though there is a
variation in the shape factor, for all the compositions they are highly equaxed. Fig. 5.15
gives wave like structure with AR and almost a straight line for R. Here it can be assumed
that the nano grains formation may plays a role in determining the aspect ratio and the
roundedness of the grains.

Chapter-V SEM and EDX Analysis
177
-0.01 0.00 0.01 0.02 0.03 0.04 0.05 0.06 0.07 0.08
0.65
0.70
0.75
0.80
0.85
0.90
0.95
1.00
Sh
ap
e F
acto
r (A
R / R
)
Composition
AR
R
Figure 5.15. : Composition vs. shape factor of Ba1-x DyxTiO3 ceramics
Porosity, which can be considered as a secondary phase, indicates the degree of
densification of a ceramic. Porosity decreases strength, because pores reduce the true
cross section area of a member and also pores act as stress-concentrating notches. In this
study, we found that the porosity of all the specimens is less than 6% (approx.), which
means that the pores are discrete and match with the porosity thumb rule.
Fig. 5.16 explains the elemental wt% present in the compound. Here it is observed that,
the theoretical wt % and EDX spectra wt % obtained from analysis more or less matches
with a very little variation. A quantitative analysis of the Dy doped BaTiO3 ceramics is
presented in theTable-5.5 and a comparison of the wt% of Ba, Dy, Ti and O element in

Chapter-V SEM and EDX Analysis
178
different doping concentration is given in the Table-5.6 from Table-5.6 it is seen that, the
theoretical wt % and the experimental wt % of various elements in different compositions
are in good agreement.
-0.01 0.00 0.01 0.02 0.03 0.04 0.05 0.06 0.07 0.08
0
10
20
30
40
50
60
70
wt %
C o m p o s i t i o n
Ba %
Dy %
Ti %
Figure 5.16 Composition vs. wt % of various elements of Ba1-x DyxTiO3 ceramics
Table -5.6. Elemental analysis of Ba1-xDyxTiO3 ceramics
Composition Element Theoretical
Wt %
EDX spectra
Wt %
X=0
Ba
58.89 65.03
Ti 20.52 17.17
O 20.58 17.80
Dy 0 0
X=0.01 Ba 58.24 65.19
Ti 20.50 13.76
O 20.56 20.24
Dy 0.70 0.81
X=0.025 Ba 57.27 65.96

Chapter-V SEM and EDX Analysis
179
5.2.3.2 Conclusion:
The SEM images of produced dysprosium-substituted barium titanate ceramics were
observed highly euaxed particles with a smooth surface. The roundedness and aspect
ratios of all the samples are found to be closer to one. The chemical compositions of the
samples were checked by EDX analysis, which shows a consistency of the elemental wt
% present in the green ceramics, also confirmed the high purity of the prepared samples.
The grain size shows very interesting behavior like for x = 0.01 it is less and for x=0.025,
0.05 it increases , but further as the doping concentration increases i.e. x=0.075 it
decreases and becomes minimum. Results indicate that below the critical concentration
of Dy the substitution took place in the barium sub-lattice with electronic compensation,
Ti 20.74 14.52
O 20.53 18.48
Dy 1.74 1.04
X=0.05 Ba 55.95 63.46
Ti 20.52 14.10
O 20.58 21.50
Dy 2.94 0.94
X=0.075 Ba 54.04 61.43
Ti 20.36 13.07
O 20.42 21.16
Dy 5.18 4.34

Chapter-V SEM and EDX Analysis
180
and above the critical concentration, gradually the rare earth ions begin to substitute for
titanium.
References
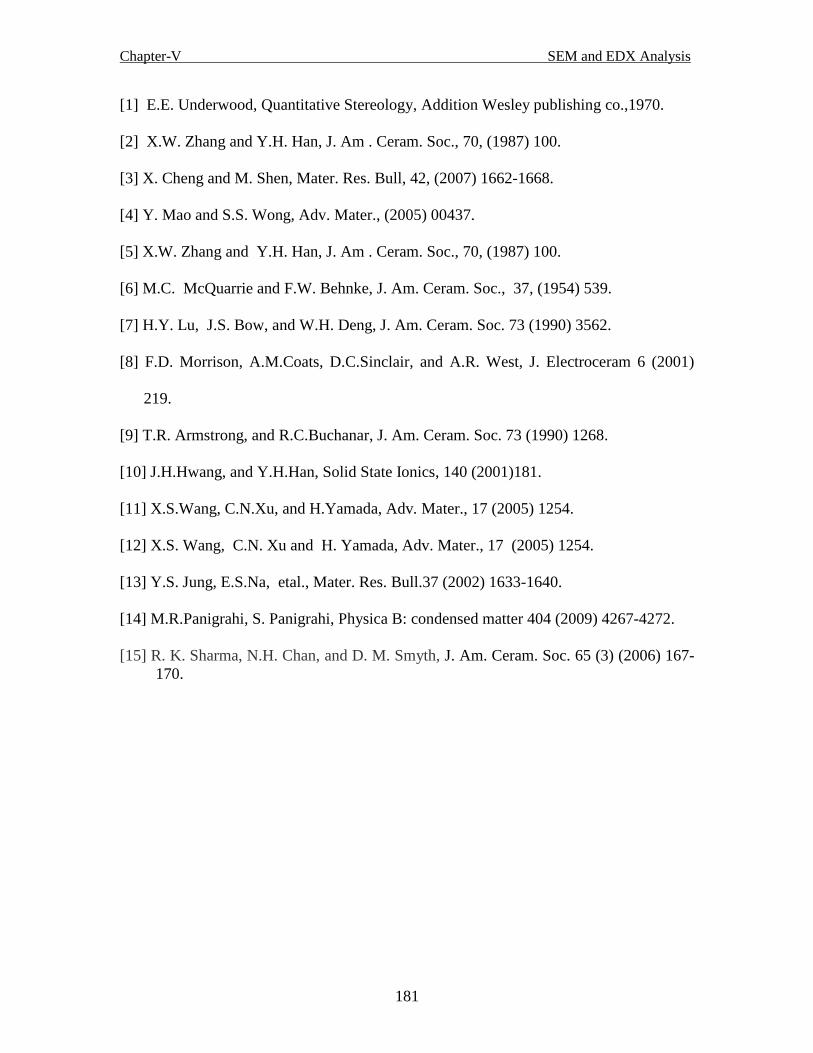
Chapter-V SEM and EDX Analysis
181
[1] E.E. Underwood, Quantitative Stereology, Addition Wesley publishing co.,1970.
[2] X.W. Zhang and Y.H. Han, J. Am . Ceram. Soc., 70, (1987) 100.
[3] X. Cheng and M. Shen, Mater. Res. Bull, 42, (2007) 1662-1668.
[4] Y. Mao and S.S. Wong, Adv. Mater., (2005) 00437.
[5] X.W. Zhang and Y.H. Han, J. Am . Ceram. Soc., 70, (1987) 100.
[6] M.C. McQuarrie and F.W. Behnke, J. Am. Ceram. Soc., 37, (1954) 539.
[7] H.Y. Lu, J.S. Bow, and W.H. Deng, J. Am. Ceram. Soc. 73 (1990) 3562.
[8] F.D. Morrison, A.M.Coats, D.C.Sinclair, and A.R. West, J. Electroceram 6 (2001)
219.
[9] T.R. Armstrong, and R.C.Buchanar, J. Am. Ceram. Soc. 73 (1990) 1268.
[10] J.H.Hwang, and Y.H.Han, Solid State Ionics, 140 (2001)181.
[11] X.S.Wang, C.N.Xu, and H.Yamada, Adv. Mater., 17 (2005) 1254.
[12] X.S. Wang, C.N. Xu and H. Yamada, Adv. Mater., 17 (2005) 1254.
[13] Y.S. Jung, E.S.Na, etal., Mater. Res. Bull.37 (2002) 1633-1640.
[14] M.R.Panigrahi, S. Panigrahi, Physica B: condensed matter 404 (2009) 4267-4272.
[15] R. K. Sharma, N.H. Chan, and D. M. Smyth, J. Am. Ceram. Soc. 65 (3) (2006) 167-
170.
DIELECTRIC STUDIES OF MODIFIED
BaTiO3 CERAMICS
Chapter - VI

Chapter-VI Dielectric Studies
183
DIELECTRIC STUDIES OF MODIFIED BaTiO3
CERAMICS
6.1 Dielectric property
Basically dielectrics are insulators as they do not have free electrons. They are used for
the purpose of insulation or capacitors. The properties of dielectric changes when placed
in an electric field. Electric field exerts a force pushing centre of +ve and –ve charges
apart, then the dielectric is polarized.
When a dielectric slab is placed in a static electric field, it acquires a surface charge. The
polarization so induced arises from the alignment of electric dipoles (if present) and the
displacement of positive and negative charges in the dielectric. For an isotropic, linear
dielectric, the polarization vector P is proportional and parallel to the applied field vector
E.
For isotropic dielectrics ε and are scalar quantities, which are dependent on the
molecular properties of the dielectric. The dielectric constant is determined by the
polarizability of the lattice.
If, p is the dipole moment and V is the volume, then dipole moment per unit volume V
p
= P called polarization. We know that, P α E,
Or, EP e 0 ….(1)
where εo is the permittivity of free space and χe is the dielectric succeptibility

Chapter-VI Dielectric Studies
184
The net effect is to reduce the resultant electric field. So, Ep is the field due to
polarization and εr is the dielectric constant or relative permittivity and is the ratio of
field in vacuum to the field in presence of dielectric. Or in otherwords we can write,
2
2
0
1
0
4
4
r
q
r
q
E
Er
….(2)
Or, 0
r
Or , 0 r ….(3)
As Eo > E implies ε > εo or, 0
> 1
So, er 1 …. (4)
6.2 Electric flux density D:
This vector depends on the magnitude of the charge and the distance of separation and is
defined as,
34
1
r
qrD
=
34 r
qr
Or, D=ε E ….(5)
Thus, from eq. (5) we get,
D = εo εr E = Ee )1(0
= εo E+ εo χe E = εo E + P

Chapter-VI Dielectric Studies
185
Or, D = εo E + P ….(6)
where D is the displacement vector, E is the electric field and P is polarization
PEEr 00
Or, EP r )1(0 ….(7)
6.3 Dielectric measurement
Dielectric constant or relative permittivity is defined as the ratio of the capacity of the
capacitor without dielectric to capacity of the capacitor with dielectric i.e.
C
Cdia
r
Or, A
Cdr
0 ….(8)
There will always be inertial and energy dissipation effects (losses) and these cause a lag
in phase between E and the response of the material.
Thus, if CosEE 0 ωt ….(9)
Then CosDD 0 (ωt - δ) ….(10)
where δ is the loss angle. It is independent of 0E but generally depends on frequency.
6.4 Frequency dependence of Polarisation
Polarization occurs due to several atomic mechanisms. For example, let us consider an
atom placed inside an electric field. The centre of positive charge is displaced along the

Chapter-VI Dielectric Studies
186
applied field direction, while the centre of negative charge is displaced in the opposite
direction. Thus, a dipole is produced. When a dielectric material is placed inside an
electric field, such dipoles are created in all the atoms inside. This process of producing
electric dipoles, which are oriented along the field direction is called polarization in
dielectrics.
There are four different types of polarization namely, electronic (Pe), ionic (Pi),
orientation or diolar (Po)and space charge polarization (Ps).
Thus the total polarizability, Pt = Pe + Pi + Po + Ps
6.4.1 Electronic polarization: This is due to the displacement of positively charged
nucleus and negatively charged electron cloud of an atom in opposite direction. On
application of electric field the negative electron cloud shifts to the no field direction.
This results in a dipole moment in an atom. The extent of the shift is proportional to the
strength of the field. The dipole moment is proportional to field strength, i.e. P α E or, P
= αe E, where αe is called the electronic polarizability. αe increases with the volume of
the atom and is independent of temperature.
6.4.2 Ionic polarization: It is due to the shift of ions relative to other oppositely charged
ions. This is also independent of temperature. The ionic contribution comes from the
displacement and deformation of a charged ion with respect to other ions, i.e. ionic
polarization is due to displacement of ions over a small distance due to the applied field.
Since ions are heavier than electron cloud, the time taken for displacement is larger. The
frequency with which ions are displaced is of the same order as the lattice vibration
Chapter-VI Dielectric Studies
187
frequency (~1013
Hz). This means that for optical frequency the ions do not respond, as
the time required for lattice vibrations is nearly 100 times larger than the period of
applied voltage at optical frequency. Hence, at optical frequencies, there is no ionic
polarization.
6.4.3 Orientation (dipolar) polarization: Sometimes the molecule carries dipole
moment in the absence of the electric field. But, the dipole moments are random. With
the application of electric field, the dipole moments are aligned in the field direction.
E.g., the centre of positive and negative charges do coincide in CH4. But in CH3Cl, they
do not coincide. Because the electro-negativity of chlorine is more than that of hydrogen
atom, so the chlorine atom pulls the bonding electrons more strongly than hydrogen
atom. Thus, the centre of positive and negative charges do not coincides and this gives
rise to orientation polarization. This polarization is dependent on temperature.
6.4.4 Space charge polarization: Space charge polarization is the slowest process, as it
involves the diffusion of ions over several interatomic distances. The relaxation time for
this process is related to the frequency of successful jumps of ions under the influence of
the applied field, a typical value being 102 Hz. Space charge polarization is due to the
accumulation of charges at the electrodes or at the interface between the multiphase
material. Space charge polarisation occurs at lower frequencies (50 – 60 Hz). Consider a
dielectric medium placed between two electrodes. When no field is applied to the
electrodes, the positive and negative charges are not separated and there are fixed number
of charges. On the other hand, when an electric field is applied, the charges are separated.
The positive charges are accumulated near the negative electrode. Therefore, a dipole
moment is induced due to displacement of ions. Then, the induced dipole moment per

Chapter-VI Dielectric Studies
188
unit volume gives the induced polarisation. This polarisation is also known as interfacial
polarisation.
In the calculation of total polarization, the space charge polarization is not taken
into account, since it occurs at interface and it is very small and hence neglected. In
addition to this, the fields are not well defined at interfaces. Therefore, the total
polarization vector is given by,
P= Pe+ Pi +Po ….(11)
where Pe is electronic polarisation, Pi is ionic oplarisation and P0 is orientational
polarisation
6.5 Temperature and frequency dependence of polarization
6.5.1 Relaxation time: It is the measure of time scale of polarization. It is the time taken
for the polarization to reach 0.63 of maximum value. Electronic polarization is an
extremely rapid process. It occurs at low to very high frequency, i.e. it occurs at all
frequency range, i.e. from microwave to visible frequency. Ionic polarization is slower
than electronic polarization, because it needs displacement of ions which are heavy. This
is slow at high frequency. Orientational polarization is even slower than ionic
polarization and the relaxation time is little high. But, space charge polarization is a
relatively slowest process.
In optical frequency range the dielectric constant is due to electronic polarization, where
as the ionic and orientational polarizations are small because of the inertia of the
molecules or sometimes they are also absent (see Fig. 6.1).
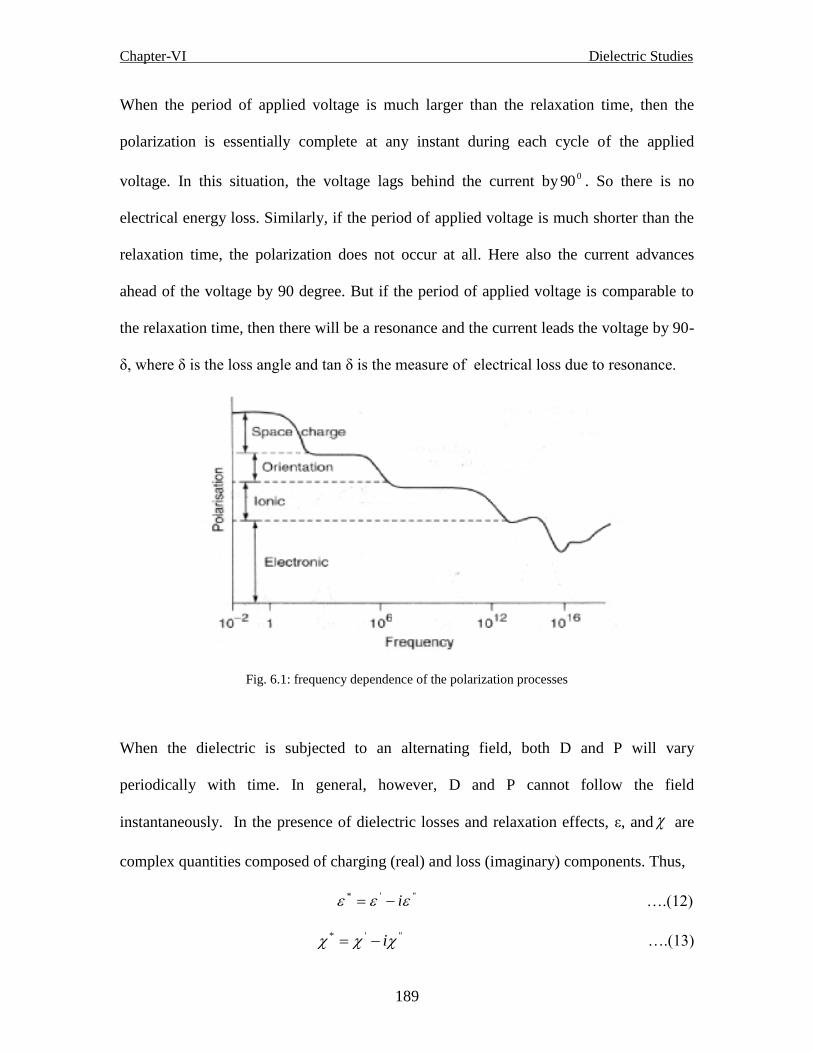
Chapter-VI Dielectric Studies
189
When the period of applied voltage is much larger than the relaxation time, then the
polarization is essentially complete at any instant during each cycle of the applied
voltage. In this situation, the voltage lags behind the current by 090 . So there is no
electrical energy loss. Similarly, if the period of applied voltage is much shorter than the
relaxation time, the polarization does not occur at all. Here also the current advances
ahead of the voltage by 90 degree. But if the period of applied voltage is comparable to
the relaxation time, then there will be a resonance and the current leads the voltage by 90-
δ, where δ is the loss angle and tan δ is the measure of electrical loss due to resonance.
Fig. 6.1: frequency dependence of the polarization processes
When the dielectric is subjected to an alternating field, both D and P will vary
periodically with time. In general, however, D and P cannot follow the field
instantaneously. In the presence of dielectric losses and relaxation effects, ε, and are
complex quantities composed of charging (real) and loss (imaginary) components. Thus,
'''* i ….(12)
'''* i ….(13)

Chapter-VI Dielectric Studies
190
The loss angle is given by '
''
tan
.
It is simply related to the Q-factor of the dielectric by Q = 1/tan δ, and is obtained rather
directly from experiment. ε‟ and ε‟‟ are related, at any given frequency, by the Kramers-
Kronig dispersion relations.
6.6 Dielectric studies of Ba1-xCaxTiO3 ceramics
Ferroelectric materials have been applied to many electronic and optical devices, utilizing
their excellent dielectric, piezoelectric and optical properties. Specially CaTiO3 is known
as the typical depressor in BaTiO3 ceramics, which leads to the significant suppressing of
the dielectric loss and the temperature coefficient of dielectric constant but only slight
change of Curie point [1]. Considering these good dielectric properties and the relaxor
nature, (Ba,Ca)TiO3 materials are expected as alternative candidates for tunable
microwave dielectric materials with low dielectric loss and small temperature
dependence.
Barium titanate BaTiO3 is an ABO3 perovskite-type structure where barium and titanium
occupy the A site and the B site, respectively, and titanium is slightly deviated from the
center. By virtue of this structure, the barium titanate expresses ferroelectricity and, in
turn, excellent electric properties such as dielectricity, piezoelectricity and pyroelectricity
and, therefore, is being widely used as various electronic materials [2-4]. Also, isovalent-
substituted BaTiO3 are the promising candidates and have been actively studied. Among
them, Ca-oped BaTiO3 (Ba1-xCaxTiO3, BCT) crystals are considered to be one of the
foremost potential candidates for the lead-free electro-optic modulators and memory

Chapter-VI Dielectric Studies
191
devices [5]. The barium calcium titanate ( Ba, Ca)TiO3 is widely used as a barium
titanate-based electronic material resulting from replacing a part of barium by calcium
and, in particular, the barium calcium titanate is attracting attention as a ceramic
capacitor material in which the temperature dependency and reliability of dielectric
property of the barium titanate are improved [6-9]. (Ba,Ca)TiO3 applications in various
capacitor materials (including multilayer ceramic capacitor), dielectric filter, dielectric
antenna, dielectric resonator, dielectric duplexer, capacitor and phase shifter, and also
include stacked piezoelectric actuator utilizing piezoelectricity. (Ba,Ca)TiO3 crystals
show promising applications in advanced laser systems, optical interconnects, and optical
storage devices, and the (Ba,Ca)TiO3 crystal is also an extremely promising materials for
photorefractive applications [10], such as phase conjugation or holographic intracavity
laser mode selection [11]. Barium calcium titanate Ba1-xCaxTiO3 is an important
ferroelectric material because of the significant variation in its physical and structural
properties with respect to Ca substitution.
In the present work, Ba1-xCaxTiO3 ceramics were prepared by solid state reaction, using
binary oxides or Ba and Ti carbonates as precursors [12-16]. Tiwari et al. [17,18] showed
that dielectric behavior is controlled by the processing procedure. The relationship
between dielectric properties and structures is discussed. The solid solubility limit is
different from that reported earlier.
6.6.1 Results and discussions:

Chapter-VI Dielectric Studies
192
Fig. 6.2(a-h) shows the temperature dependency of the dielectric constant of bulk Ba1−x
CaxTiO3 (x = 0.0, 0.05, 0.1, 0.2, 0.25, 0.3, 0.4 and 0.5) ceramics at different frequencies.
The figures shows, the value of εm increases gradually to a maximum value (εm) with
increase in temperature up to the transition temperature and then decreases smoothly
indicating a phase transition. The maximum of dielectric permittivity, εm, and the
corresponding maximum temperature Tm, depends upon the measurement frequency for
all the compositions. The magnitude of dielectric constant decreases with increase in
frequency and the maxima are shifting to higher temperature. In some cases, the
magnitude of dielectric constant almost matches with the higher frequency.
Fig. 6.2 (a) : Temperature dependent dielectric constant of Ba1-xCaxTiO3 ceramics for x=0
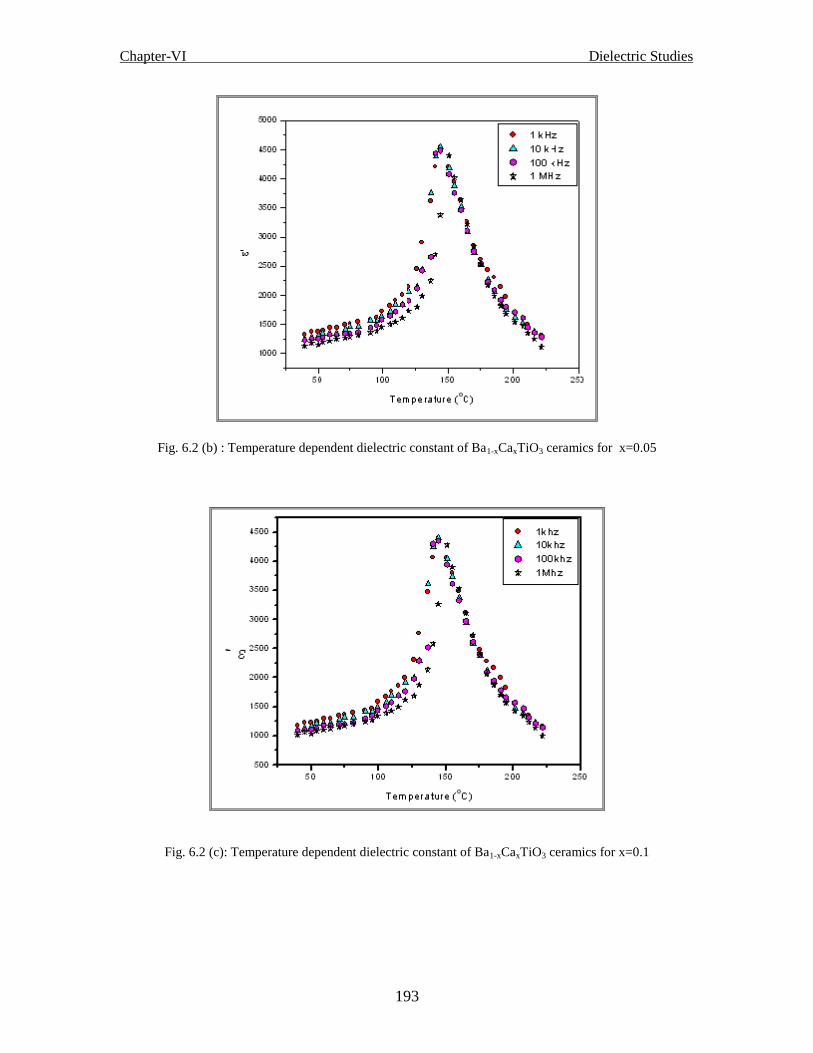
Chapter-VI Dielectric Studies
193
Fig. 6.2 (b) : Temperature dependent dielectric constant of Ba1-xCaxTiO3 ceramics for x=0.05
Fig. 6.2 (c): Temperature dependent dielectric constant of Ba1-xCaxTiO3 ceramics for x=0.1

Chapter-VI Dielectric Studies
194
Fig.6.2 (d) : Temperature dependent dielectric constant of Ba1-xCaxTiO3 ceramics for x=0.2
Fig.6.2 (e): Temperature dependent dielectric constant of Ba1-xCaxTiO3 ceramics for x=0.25
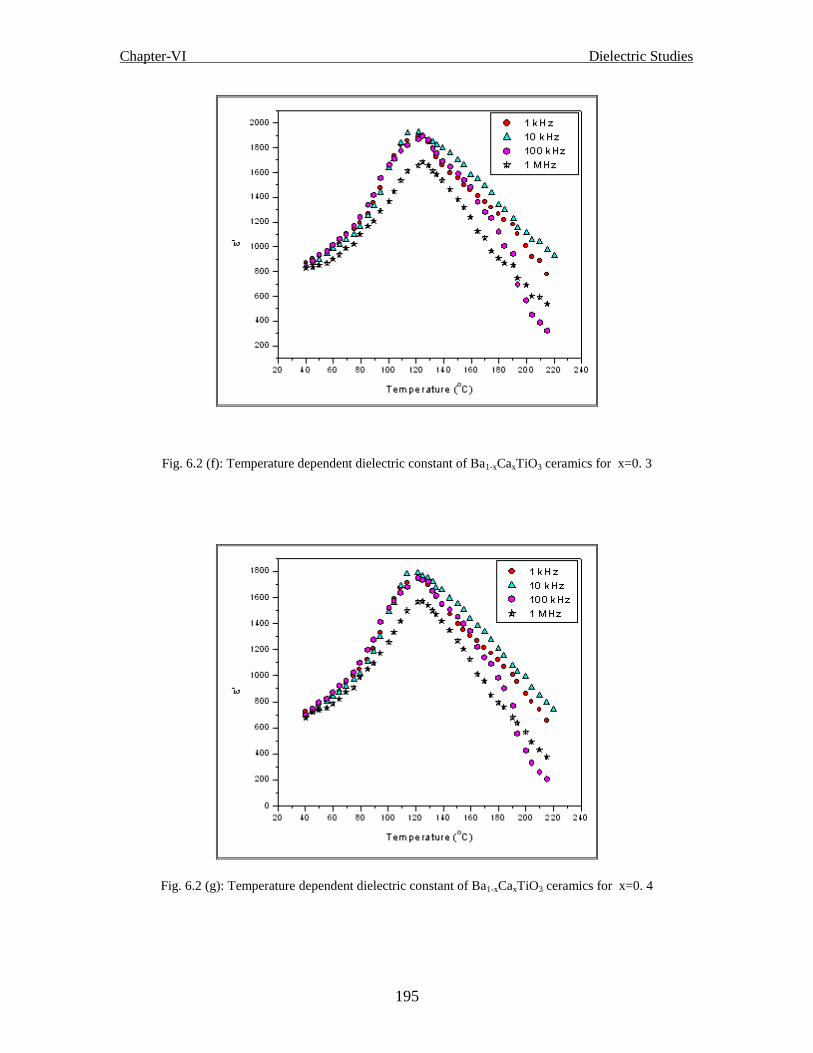
Chapter-VI Dielectric Studies
195
Fig. 6.2 (f): Temperature dependent dielectric constant of Ba1-xCaxTiO3 ceramics for x=0. 3
Fig. 6.2 (g): Temperature dependent dielectric constant of Ba1-xCaxTiO3 ceramics for x=0. 4

Chapter-VI Dielectric Studies
196
Fig. 6.2 (h) : Temperature dependent dielectric constant of Ba1-xCaxTiO3 ceramics for x=0.5
As seen in the Fig. 6.2, in some compositions of x, the dielectric permittivity increases
steadily and falls exponentially, e.g. Fig.6.2 (a), Fig. 6.2 (d), and Fig.6.2 (f), but in some
other compositions, e.g. Fig. 6.2 (b), Fig. 6.2 (c) and Fig.6.2 (e) are slightly diffuse and
the diffusivity is prominent in Fig. 6.2 (b). The broadness or diffusiveness occurs mainly
due to compositional fluctuation and structural disordering in the arrangement of cation
in one or more crystallographic sites of the structure. This suggests a microscopic
heterogeneity in the compound with different local Curie points. The nature of the
variation of dielectric constant and non-polar space group suggest that the material may
have ferroelectric phase transition. Fig. 6.3 shows the dielectric loss of the materials with
varying temperature at different frequencies.
It is known that the dielectric permittivity of a normal ferroelectric above the Curie
temperature follows the Curie–Weiss law described by

Chapter-VI Dielectric Studies
197
0
'TT
C
, (T>TC) ….(14)
where T0 is the Curie–Weiss temperature and C is the Curie–Weiss constant.
Fig. 6.3(a-h) shows the temperature dependency of the dielectric loss of bulk Ba1−x
CaxTiO3 (x = 0.0, 0.05, 0.1, 0.2, 0.25, 0.3, 0.4 and 0.5) ceramics at different frequencies.
The dielectric loss is found to decrease and the loss is larger at a higher measurement
frequency. With increasing x, the dielectric loss and temperature dependence were
significantly suppressed.
Fig. 6.3 (a) : Temperature dependent dielectric loss of Ba1-xCaxTiO3 ceramics for x=0.0

Chapter-VI Dielectric Studies
198
Fig. 6.3 (b) : Temperature dependent dielectric loss of Ba1-xCaxTiO3 ceramics for x=0.05
Fig. 6.3 (c) : Temperature dependent dielectric loss of Ba1-xCaxTiO3 ceramics for x=0.1

Chapter-VI Dielectric Studies
199
Fig. 6.3 (d) : Temperature dependent dielectric loss of Ba1-xCaxTiO3 ceramics for x=0.2
Fig. 6.3 (e) : Temperature dependent dielectric loss of Ba1-xCaxTiO3 ceramics for x=0.25

Chapter-VI Dielectric Studies
200
Fig. 6.3 (f) : Temperature dependent dielectric loss of Ba1-xCaxTiO3 ceramics for x=0.3
Fig. 6.3 (g) : Temperature dependent dielectric loss of Ba1-xCaxTiO3 ceramics for x=0.4

Chapter-VI Dielectric Studies
201
Fig. 6.3 (h) : Temperature dependent dielectric loss of Ba1-xCaxTiO3 ceramics for x=0.5
Fig. 6.4 (a-h) shows the plot of inverse dielectric constant versus temperature at different
frequencies. The parameters obtained at 10 kHz are listed in Table 6.1. The parameter
∆Tm, which describes the degree of the deviation from the Curie–Weiss law, is defined
as
∆Tm =TC W - Tm ….(15)
where Tcw denotes the temperature from which the permittivity starts to deviate from the
Curie–Weiss law and Tm represents the temperature of the dielectric maximum. The
Curie temperature determined from the graph by extrapolation of the reciprocal of
dielectric constant of the paraelectric region and the value obtained are given in Table
6.1.

Chapter-VI Dielectric Studies
202
20 40 60 80 100 120 140 160 180 200
0.0001
0.0002
0.0003
0.0004
0.0005
0.0006
0.0007
0.0008
0.0009
0.0010
0.0011
0.0012
0 2 4 6 8 10
0
2
4
6
8
10
1/
'
Temperature (OC)
1 kHz
10 kHz
100 kHz
1 MHz
Fig. 6.4 (a). Temperature dependency 1/ ε‟ of Ba1-xCaxTiO3 ceramics for x=0
Fig. 6.4 (b). Temperature dependency 1/ ε‟ of Ba1-xCaxTiO3 ceramics for x=0.05

Chapter-VI Dielectric Studies
203
Fig. 6.4 (c). Temperature dependency 1/ ε‟ of Ba1-xCaxTiO3 ceramics for x=0.1
Fig. 6.4 (d) . Temperature dependency 1/ ε‟ of Ba1-xCaxTiO3 ceramics for x=0.2

Chapter-VI Dielectric Studies
204
Fig. 6.4 (e). Temperature dependency 1/ ε‟ of Ba1-xCaxTiO3 ceramics for x=0.25
Fig. 6.4 (f). Temperature dependency 1/ ε‟ of Ba1-xCaxTiO3 ceramics for x=0. 3

Chapter-VI Dielectric Studies
205
Fig. 6.4 (g). Temperature dependency 1/ ε‟ of Ba1-xCaxTiO3 ceramics for x=0. 4
Fig. 6.4 (h). Temperature dependency 1/ ε‟ of Ba1-xCaxTiO3 ceramics for x=0.5

Chapter-VI Dielectric Studies
206
The diffuse characteristics of ferroelectric–paraelectric phase transition are known to
deviate from the typical Curie–Weiss behavior and can be described by a modified
Curie–Weiss relationship [19,20]:
CTT m
m
/)(11
….(16)
Fig. 6. 5 log (1/ε – 1/εm) vs. log (T-Tm) at 10 kHz
where and C are assumed to be constant. The parameter gives information on the
character of the phase transition: For = 1, a normal Curie–Weiss law is obtained, =
2, describes a complete diffuse phase transition [21]. Fig. 6.5 shows the plot of
log(1/ε−1/εm) versus log(T−Tm). The values of were found to be 1.18 for x=0.05, 1.26
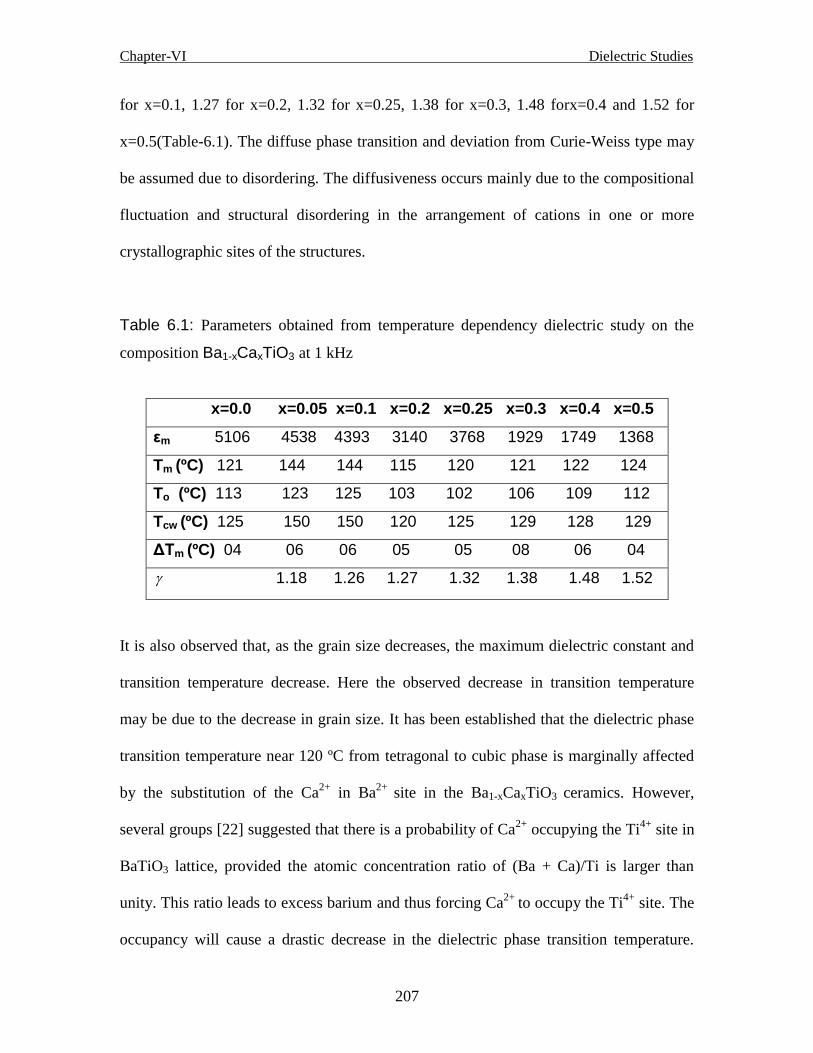
Chapter-VI Dielectric Studies
207
for x=0.1, 1.27 for x=0.2, 1.32 for x=0.25, 1.38 for x=0.3, 1.48 forx=0.4 and 1.52 for
x=0.5(Table-6.1). The diffuse phase transition and deviation from Curie-Weiss type may
be assumed due to disordering. The diffusiveness occurs mainly due to the compositional
fluctuation and structural disordering in the arrangement of cations in one or more
crystallographic sites of the structures.
Table 6.1: Parameters obtained from temperature dependency dielectric study on the
composition Ba1-xCaxTiO3 at 1 kHz
x=0.0 x=0.05 x=0.1 x=0.2 x=0.25 x=0.3 x=0.4 x=0.5
εm 5106 4538 4393 3140 3768 1929 1749 1368
Tm (ºC) 121 144 144 115 120 121 122 124
To (ºC) 113 123 125 103 102 106 109 112
Tcw (ºC) 125 150 150 120 125 129 128 129
ΔTm (ºC) 04 06 06 05 05 08 06 04
1.18 1.26 1.27 1.32 1.38 1.48 1.52
It is also observed that, as the grain size decreases, the maximum dielectric constant and
transition temperature decrease. Here the observed decrease in transition temperature
may be due to the decrease in grain size. It has been established that the dielectric phase
transition temperature near 120 ºC from tetragonal to cubic phase is marginally affected
by the substitution of the Ca2+
in Ba2+
site in the Ba1-xCaxTiO3 ceramics. However,
several groups [22] suggested that there is a probability of Ca2+
occupying the Ti4+
site in
BaTiO3 lattice, provided the atomic concentration ratio of (Ba + Ca)/Ti is larger than
unity. This ratio leads to excess barium and thus forcing Ca2+
to occupy the Ti4+
site. The
occupancy will cause a drastic decrease in the dielectric phase transition temperature.
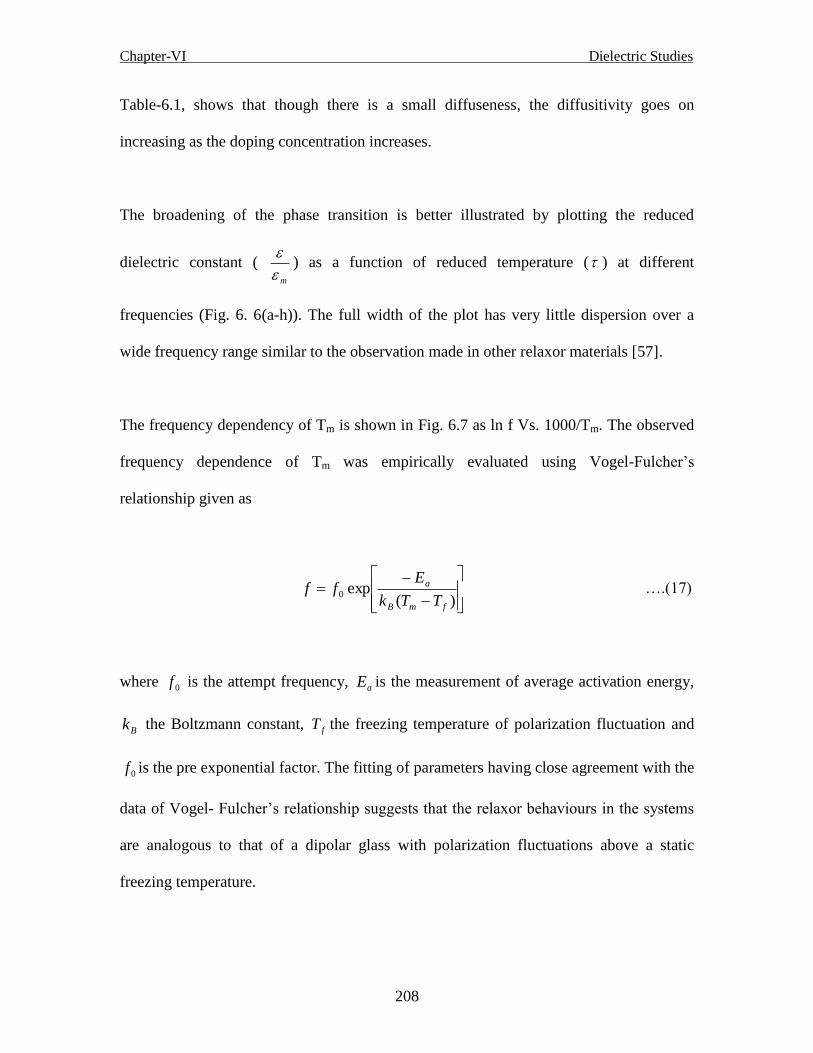
Chapter-VI Dielectric Studies
208
Table-6.1, shows that though there is a small diffuseness, the diffusitivity goes on
increasing as the doping concentration increases.
The broadening of the phase transition is better illustrated by plotting the reduced
dielectric constant ( m
) as a function of reduced temperature ( ) at different
frequencies (Fig. 6. 6(a-h)). The full width of the plot has very little dispersion over a
wide frequency range similar to the observation made in other relaxor materials [57].
The frequency dependency of Tm is shown in Fig. 6.7 as ln f Vs. 1000/Tm. The observed
frequency dependence of Tm was empirically evaluated using Vogel-Fulcher‟s
relationship given as
)(exp0
fmB
a
TTk
Eff ….(17)
where 0f is the attempt frequency, aE is the measurement of average activation energy,
Bk the Boltzmann constant, fT the freezing temperature of polarization fluctuation and
0f is the pre exponential factor. The fitting of parameters having close agreement with the
data of Vogel- Fulcher‟s relationship suggests that the relaxor behaviours in the systems
are analogous to that of a dipolar glass with polarization fluctuations above a static
freezing temperature.
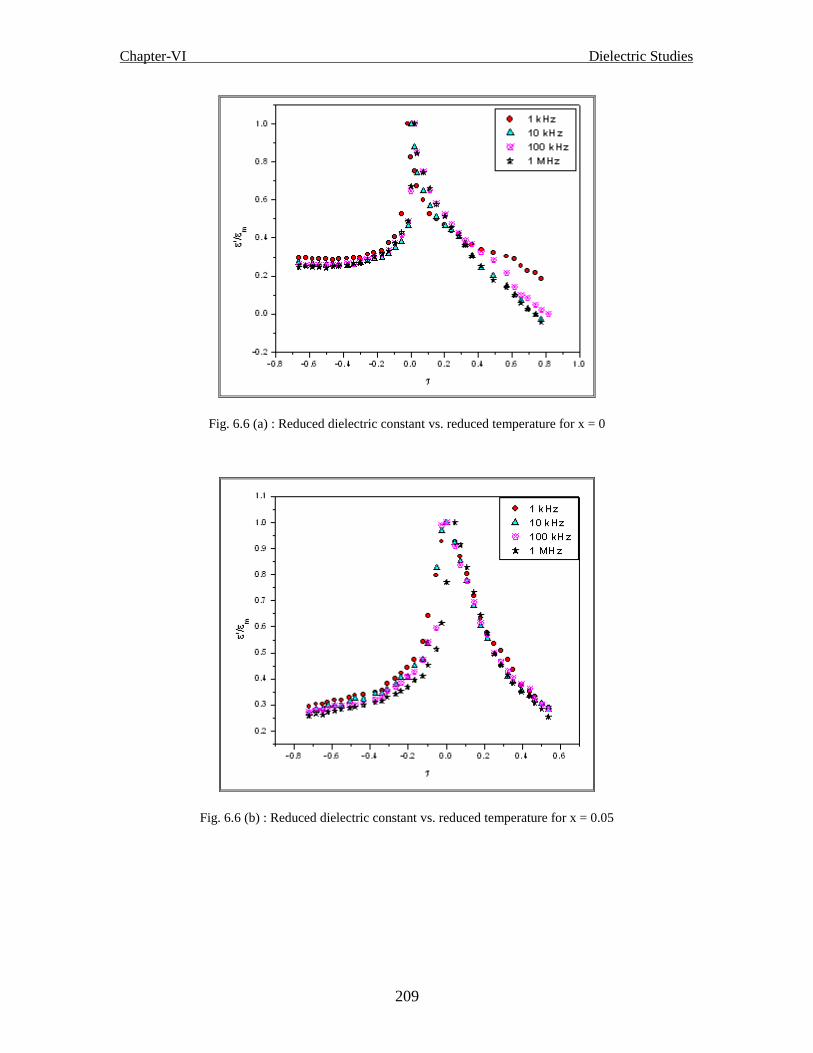
Chapter-VI Dielectric Studies
209
Fig. 6.6 (a) : Reduced dielectric constant vs. reduced temperature for x = 0
Fig. 6.6 (b) : Reduced dielectric constant vs. reduced temperature for x = 0.05
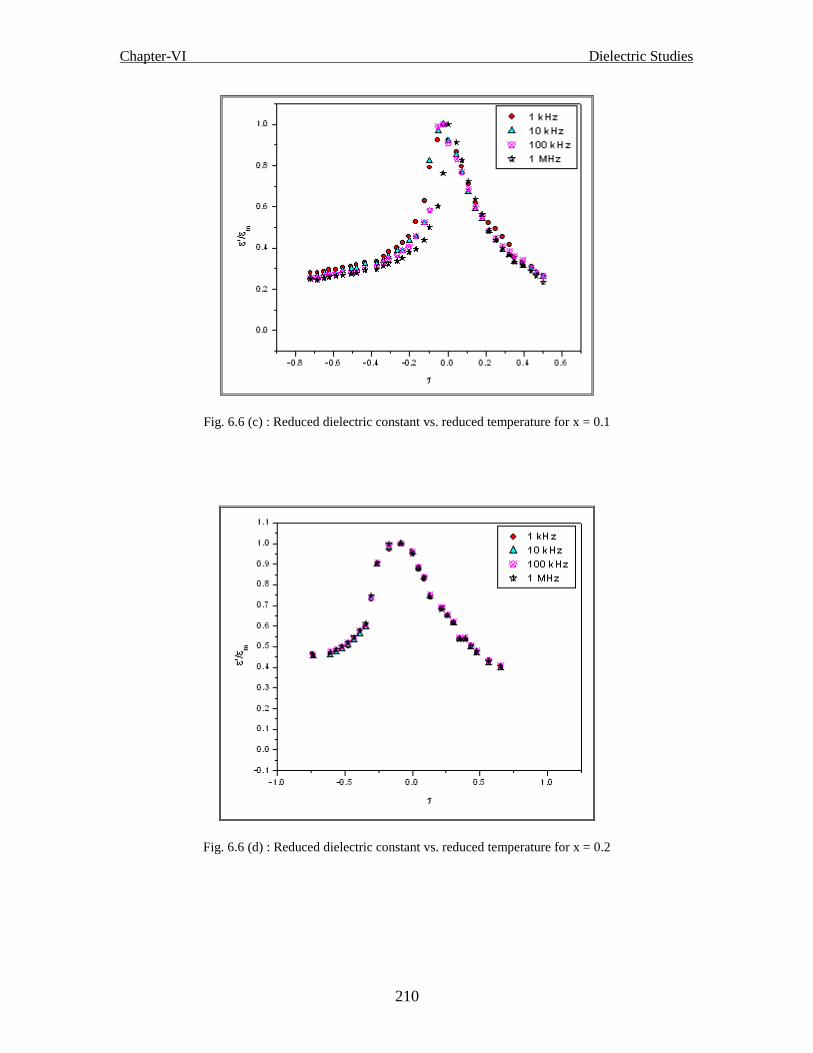
Chapter-VI Dielectric Studies
210
Fig. 6.6 (c) : Reduced dielectric constant vs. reduced temperature for x = 0.1
Fig. 6.6 (d) : Reduced dielectric constant vs. reduced temperature for x = 0.2

Chapter-VI Dielectric Studies
211
Fig. 6.6 (e) : Reduced dielectric constant vs. reduced temperature for x = 0.25
Fig. 6.6 (f ) : Reduced dielectric constant vs. reduced temperature for x = 0.3

Chapter-VI Dielectric Studies
212
Figure 6.6 (g ) : Reduced dielectric constant vs. reduced temperature for x = 0.4
Fig. 6.6 (h) : Reduced dielectric constant vs. reduced temperature for x = 0.5

Chapter-VI Dielectric Studies
213
18 19 20 21 22 23 24 25
6
8
10
12
14
16
18
20
ln f
1000/T
B
ExpDec1 fit of Data1_B
Fig. 6.7 1000/T vs. ln f of BCT ceramics for Vogel Fulcher relation
6.6.2 Conclusions:
Single-phase BCT ferroelectric compounds were prepared by solid state reaction method.
The BCT ceramics exhibit a pure tetragonal phase for x varying from 0.00 up to 0.2,
tetragonal and orthorhombic phases coexist for x = 0.25–0.5, along with a small change
of the Curie point with x up to 0.5. Temperature dependency of the dielectric properties
of BCT ceramics has been investigated at different frequencies.The result shows that εm
decreases from 5106 to 1368 for x=0.0 to x=0.5, and correspondingly the Tm has a
variation from 115 to 124. The Curie-Weiss temperature, T0, drastically decreases
initially, thereafter increases gradually. This may be due to excess barium in the
materials, which in turn, indicates the occupancy of Ca2+
into the Ti4+
site.

Chapter-VI Dielectric Studies
214
6.7 Dielectric studies of Ba1-xPrxTiO3 ceramics
Recent studies on doped barium titanate ceramics for their application as capacitor
dielectrics, resistors, thermal sensors, etc., have been performed on the structural and
phase transition behavior of the compounds and solid solutions, especially A-site
substitution. Most of them exhibit normal phase transition behavior or diffuse phase
transition behavior. The main A-site substitutions of ABO3-type perovskites are classified
into the following two categories:
(1) iso-valent substitution, such as Ba1−xSrxTiO3 and Ba1−xCaxTiO3, in which the phase
transition behavior varies with doping concentration [23, 24].
(2) off-valent substitution, such as (Ba,La)TiO3 ceramics [25] and (Pb,La)TiO3 with
phase transition diffuse behavior.
We know that ferroelectric materials can be divided into two types, namely normal
ferroelectrics and relaxor ferroelectrics.
Compared with normal ferroelectric material, many studies [26, 27] showed that the
relaxor ferroelectric is highly diffuse and its temperature Tm shifts with frequency due to
the dielectric dispersion. Because of the diffuseness of the dielectric anomaly and the
anomalies in the temperature dependences of some other properties, relaxors are often
called the “ferroelectrics with diffuse phase transition”, even though no transition into
ferroelectric phase really occurs. Recently, many researchers have shown the doping of
different ions to BaTiO3-based ceramics, such as Sn4+
, Zr4+
,Mg2+
, Co3+
,Nb5+
,Mn4+
and
rare-earth ions [28-31] to control grain size and to improve dielectric properties for
electronic devices application.
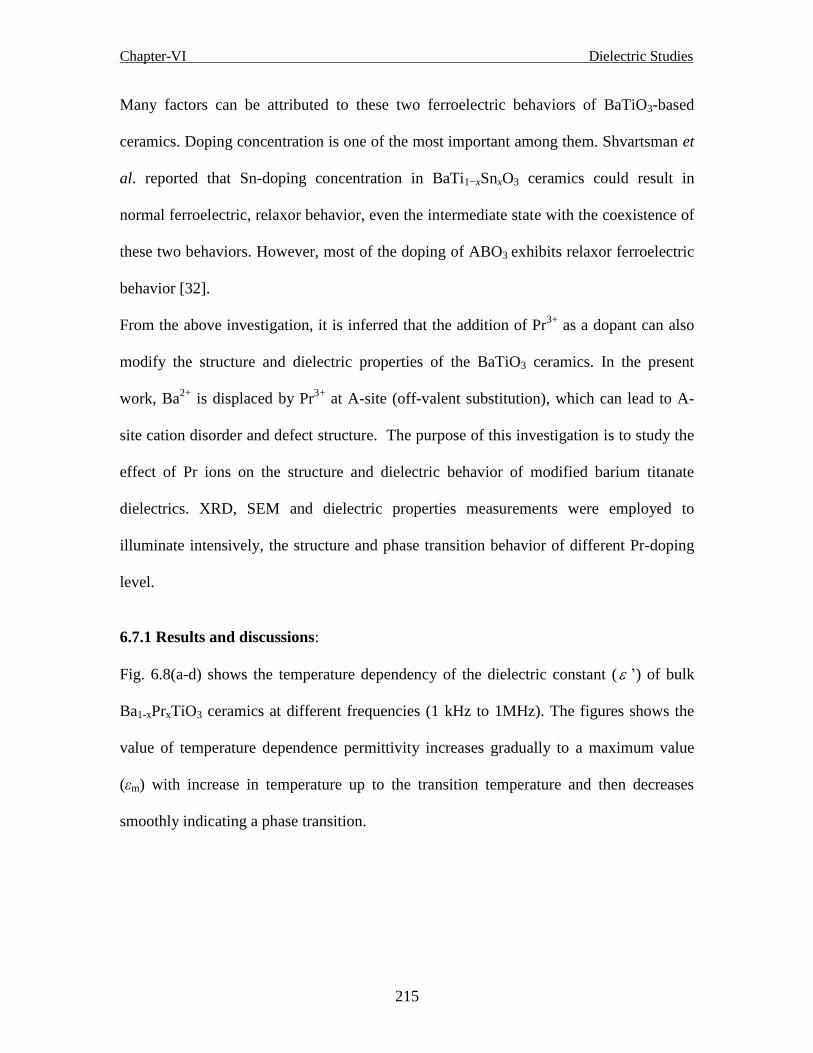
Chapter-VI Dielectric Studies
215
Many factors can be attributed to these two ferroelectric behaviors of BaTiO3-based
ceramics. Doping concentration is one of the most important among them. Shvartsman et
al. reported that Sn-doping concentration in BaTi1−xSnxO3 ceramics could result in
normal ferroelectric, relaxor behavior, even the intermediate state with the coexistence of
these two behaviors. However, most of the doping of ABO3 exhibits relaxor ferroelectric
behavior [32].
From the above investigation, it is inferred that the addition of Pr3+
as a dopant can also
modify the structure and dielectric properties of the BaTiO3 ceramics. In the present
work, Ba2+
is displaced by Pr3+
at A-site (off-valent substitution), which can lead to A-
site cation disorder and defect structure. The purpose of this investigation is to study the
effect of Pr ions on the structure and dielectric behavior of modified barium titanate
dielectrics. XRD, SEM and dielectric properties measurements were employed to
illuminate intensively, the structure and phase transition behavior of different Pr-doping
level.
6.7.1 Results and discussions:
Fig. 6.8(a-d) shows the temperature dependency of the dielectric constant ( ‟) of bulk
Ba1-xPrxTiO3 ceramics at different frequencies (1 kHz to 1MHz). The figures shows the
value of temperature dependence permittivity increases gradually to a maximum value
(εm) with increase in temperature up to the transition temperature and then decreases
smoothly indicating a phase transition.

Chapter-VI Dielectric Studies
216
Fig. 6.8 (a): Temperature dependent dielectric constant of Ba1-xPrxTiO3 ceramics for x=0.001
Fig. 6.8 (b): Temperature dependent dielectric constant of Ba1-xPrxTiO3 ceramics for x=0.002

Chapter-VI Dielectric Studies
217
Fig. 6.8 (c ): Temperature dependent dielectric constant of Ba1-xPrxTiO3 ceramics for x=0.003
Fig. 6.8 (d): Temperature dependent dielectric constant of Ba1-xPrxTiO3 ceramics for x=0.004

Chapter-VI Dielectric Studies
218
The maximum of dielectric permittivity, εm, and the corresponding maximum
temperature Tm, depend upon the measurement frequency. The magnitude of dielectric
constant decreases with increase in frequency and the maxima are shifting to higher
temperature. This indicates that the dielectric polarization is of relaxation type in nature.
At 1 KHz, the dielectric maximum (ε m) of Ba1-xPrxTiO3 ceramic and the observed high
value of Tm is due to the higher grain size. It is reported that as the grain size decreases,
the maximum dielectric constant and transition temperature decrease. The broadness or
diffusiveness occurs mainly due to compositional fluctuation and structural disordering in
the arrangement of cation in one or more crystallographic sites of the structure. This
suggests a microscopic heterogeneity in the compound with different local Curie points.
The nature of the variation of dielectric constant and non-polar space group suggest the
ferroelectric phase transition of the material. Fig. 6.9(a-d) shows the temperature
dependence dielectric loss of the material at different frequencies. The dielectric loss
values of the ferroelectric phase were reduced substantially at room temperature in the
paraelectric phase (above Tm). The observed lower temperature (below Tm) frequency
dispersion may also have some contribution from the space charge effect. The high value
of dielectric loss at 1 kHz is due to the presence of all types of polarization and may be
due to the contribution from the finite resistivity of the materials. The spectrums show
there is an increase in dielectric loss peak temperature with increase in frequency. This
indicates that the dielectric polarization is of relaxation type
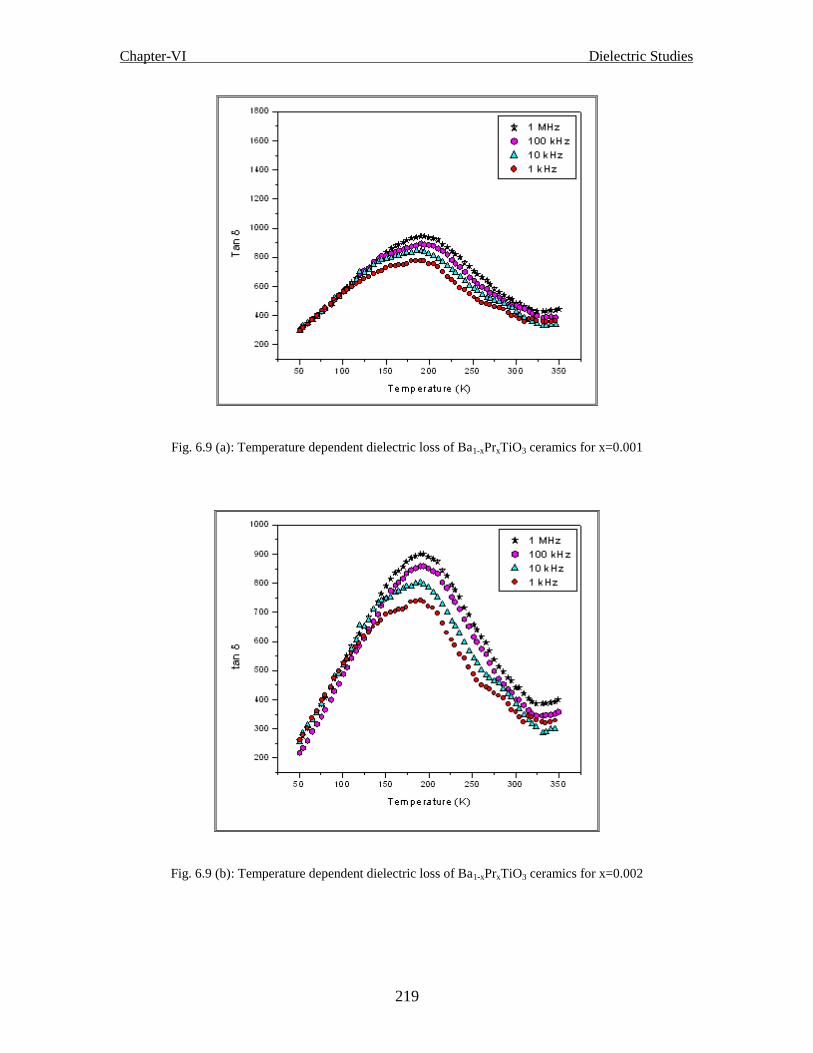
Chapter-VI Dielectric Studies
219
Fig. 6.9 (a): Temperature dependent dielectric loss of Ba1-xPrxTiO3 ceramics for x=0.001
Fig. 6.9 (b): Temperature dependent dielectric loss of Ba1-xPrxTiO3 ceramics for x=0.002

Chapter-VI Dielectric Studies
220
Fig. 6.9 (c): Temperature dependent dielectric loss of Ba1-xPrxTiO3 ceramics for x=0.003
Fig. 6.9 (d): Temperature dependent dielectric loss of Ba1-xPrxTiO3 ceramics for x=0.004

Chapter-VI Dielectric Studies
221
It is known that the dielectric permittivity of a normal ferroelectric above the Curie
temperature follows the Curie–Weiss law described by Eq. (14). Fig. 6.10 (a-d) shows the
plot of inverse dielectric constant versus temperature at different frequencies. The
different parameters obtained at 1 KHz are listed in Table 6.2. The parameter ∆Tm, which
describes the degree of the deviation from the Curie–Weiss law, is defined by Eq. (15).
The Curie temperature determined from the graph by extrapolation of the reciprocal of
dielectric constant of the paraelectric region and the value obtained are given in Table 6.2
Fig.6.10 (a): Temperature dependency 1/ ε‟ of Ba1-xPrxTiO3 ceramics for x=0.001
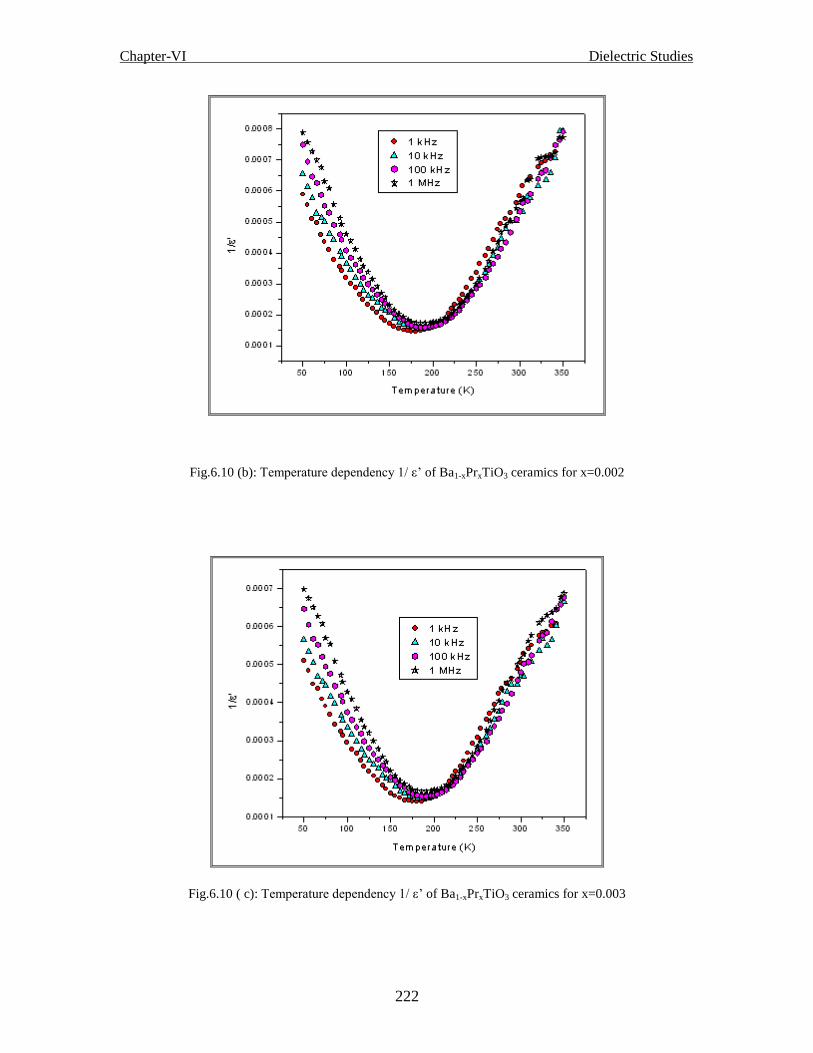
Chapter-VI Dielectric Studies
222
Fig.6.10 (b): Temperature dependency 1/ ε‟ of Ba1-xPrxTiO3 ceramics for x=0.002
Fig.6.10 ( c): Temperature dependency 1/ ε‟ of Ba1-xPrxTiO3 ceramics for x=0.003

Chapter-VI Dielectric Studies
223
Fig.6.10 (d): Temperature dependency 1/ ε‟ of Ba1-xPrxTiO3 ceramics for x=0.004
Table 6.2: Parameters obtained from temperature dependency dielectric study on the
composition Ba1-xPrxTiO3 at 1 kHz
x=0.0001 x=0.002 x=0.003 x=0.004
εm 6715 6880 7145 7610
Tm (ºC) 180 180 180 180
To (ºC) 185 185 191 191
Tcw (ºC) 191 186 189 190
ΔTm (ºC) 05 06 09 10
1.12 1.18 1.22 1.27
ΔTrelax (ºC) 11 05 05 05

Chapter-VI Dielectric Studies
224
The diffuse characteristics of ferroelectric–paraelectric phase transition are known to
deviate from the typical Curie–Weiss behavior and can be described by a modified
Curie–Weiss relationship [33, 34] given by Eq. (16). In this equation parameter gives
information on the character of the phase transition: For = 1, a normal Curie–Weiss
law is obtained, = 2, describe a complete diffuse phase transition [35]. Fig. 6.11 (a-d)
shows the plot of ln(1/ε−1/εm) versus ln(T−Tm). The values of were found to be 1.12,
1.18, 1.22 and 1.27 at frequencies 1 kHz (Table-6.2). Thus, it is clear that, there is a clear
diffuse phase transition which increases gradually with increase in frequency. The diffuse
phase transition and deviation from Curie-Weiss type behaviour may be assumed due to
disordering. The diffusiveness occurs mainly due to the compositional fluctuation and
structural disordering in the arrangement of cations in one or more crystallographic sites
of the structures.
Fig.6.11: Plot of ln(1/ε‟−1/εm) vs. ln(T−Tm) for Ba1-xPrxTiO3 ceramics

Chapter-VI Dielectric Studies
225
The broadening of the phase transition is better illustrated by plotting the reduced
dielectric constant ( m
) as a function of reduced temperature ( ) at different
frequencies (Fig. 6.12 (a-d)). The full width of the plot has very little dispersion over a
wide frequency range similar to the observation made in other relaxor materials [36].
Fig. 6.12 (a): Reduced dielectric constant (
'
m
) vs. reduced temperature ( ) at different frequencies for
x = 0.001
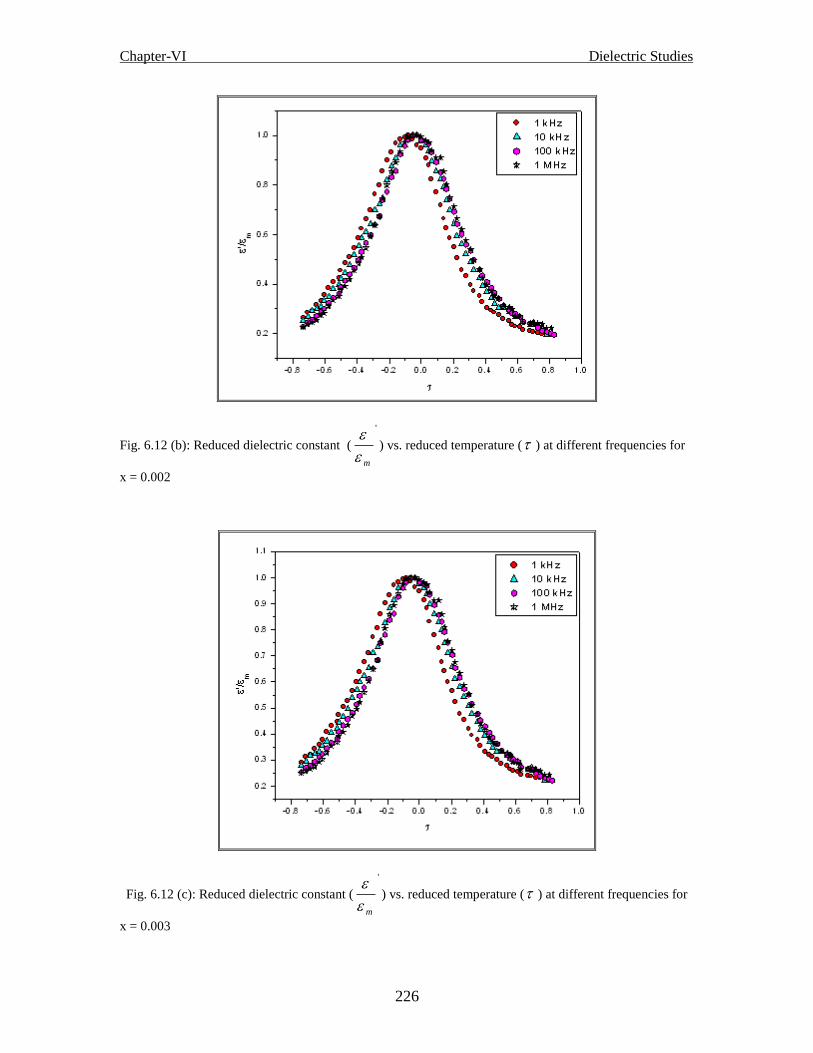
Chapter-VI Dielectric Studies
226
Fig. 6.12 (b): Reduced dielectric constant (
'
m
) vs. reduced temperature ( ) at different frequencies for
x = 0.002
Fig. 6.12 (c): Reduced dielectric constant (
'
m
) vs. reduced temperature ( ) at different frequencies for
x = 0.003

Chapter-VI Dielectric Studies
227
Fig. 6.12 (d): Reduced dielectric constant (
'
m
) vs. reduced temperature ( ) at different frequencies for
x = 0.004
5.0 5.1 5.2 5.3 5.4 5.5 5.6
6
8
10
12
14
16
18
20
ln f
1000/Tm
Fig. 6.13: 1000/T vs. ln f for BPT ceramics for Vogel Fulcher relation

Chapter-VI Dielectric Studies
228
Randomly distributed electrical field or strain field in a mixed system is the main reason
leading to the relaxor behaviour. In the present study of solid solution, Ba1-xPrxTiO3, Pr
ions occupy the A-site of ABO3 perovskite structure. In perovskite-type compounds the
relaxor behaviour appears when at least two cations occupy the same crystallographic
sites A or B. Both Ti and Pr are ferroelectrically active and these cations are off-centred
in the octahedral site giving rise to a local dipolar moment. Different effects of A-site
substitution on cation ordering and stability of the polar region are considered to be based
on the polarisibility of cations and the tolerance factor of perovskite structure. For
perovskite structure with formula ABO3, the tolerance factor is given by
OB
OA
RR
RRt
2 ….(18)
where RA is the radius of A, RB the radius of B and RO the radius of O. As t increases, the
normal ferroelectric phase becomes stabilized. Stresses were introduced into the lattice
during cooling after sintering process. Mechanical stress in the grain is one of the reasons
of relaxor behaviour in Ti-mixed composition [37, 38]. The observed high value of γ and
relaxation strength are due to the large difference in ionic radius of Ba 2+
(2.78 A˚) and
Pr 3+
(1.13 A) at the A-site of the perovskite structure.
6.7.2 Conclusions:
Single-phase perovskite Ba1-xPrxTiO3 ferroelectric compound has been prepared through
solid state reaction method. Temperature dependency of the dielectric properties of Ba1-

Chapter-VI Dielectric Studies
229
xPrxTiO3 ceramic has been investigated at different frequencies, which shows a typical
relaxor-like behaviour far below room temperature. The result shows that εm decreases
from 6715 to 7610, and correspondingly the Tm has a fixed value at 180 K. TheCurie-
Weiss temperature, T0, decreases gradually. That is the quantitative characterization of
the relaxor behaviour based on the empirical parameters and confirms the relaxor
behaviour of the composition Ba1-xPrxTiO3.

Chapter-VI Dielectric Studies
230
6.8 Dielectric studies of Ba1-xDyxTiO3 ceramics
Perovskite-based ferroelectrics materials attract considerable interest owing to rich
diversity of their physical properties and possible applications in various technologies
like memory storage devices [39], micro-electromechanical systems [40], multilayer
ceramic capacitors [41], and recently in the area of opto-electronic devices [42]. These
useful properties have most often been observed in lead-based perovskite compounds,
such as PMN, PST, PLZT [43 -45]. The enhanced properties of these compounds are
attributed to their relaxor behavior, observed in doped (mixed) perovskites. However,
these compositions have obvious disadvantages of volatility and toxicity of PbO.
Therefore, much effort has been carried out towards investigating environment-friendly
„Pb-free‟ ceramic materials. Specifically, BaTiO3 and its isovalent substituted materials
are the promising candidates for microwave and opto-electronic applications.
The effect of substitution on dielectric relaxation, ferroelectric phase transition and
electrical properties of BaTiO3 has been extensively studied [46, 47]. On partial
substitution of dopants like Ca, Sr, Zr [48-50], the variation of ε around Tc gets
broadened out in both ceramics and single crystal samples. Broadening increases with
increasing concentration of the dopant, as also does the deviation from Curie–Weiss
behavior at temperatures above the peak temperature (Tm) of the ε‟-T variation. The
observed broadening in ε - T variation has generally been attributed to the presence of
nano-regions resulting from local composition variation over length scale of 100–1000
A°. Different nano-regions in a macroscopic sample transform at different temperatures,
giving rise to a range of transformation temperatures, the so-called „Curie range‟. Thus
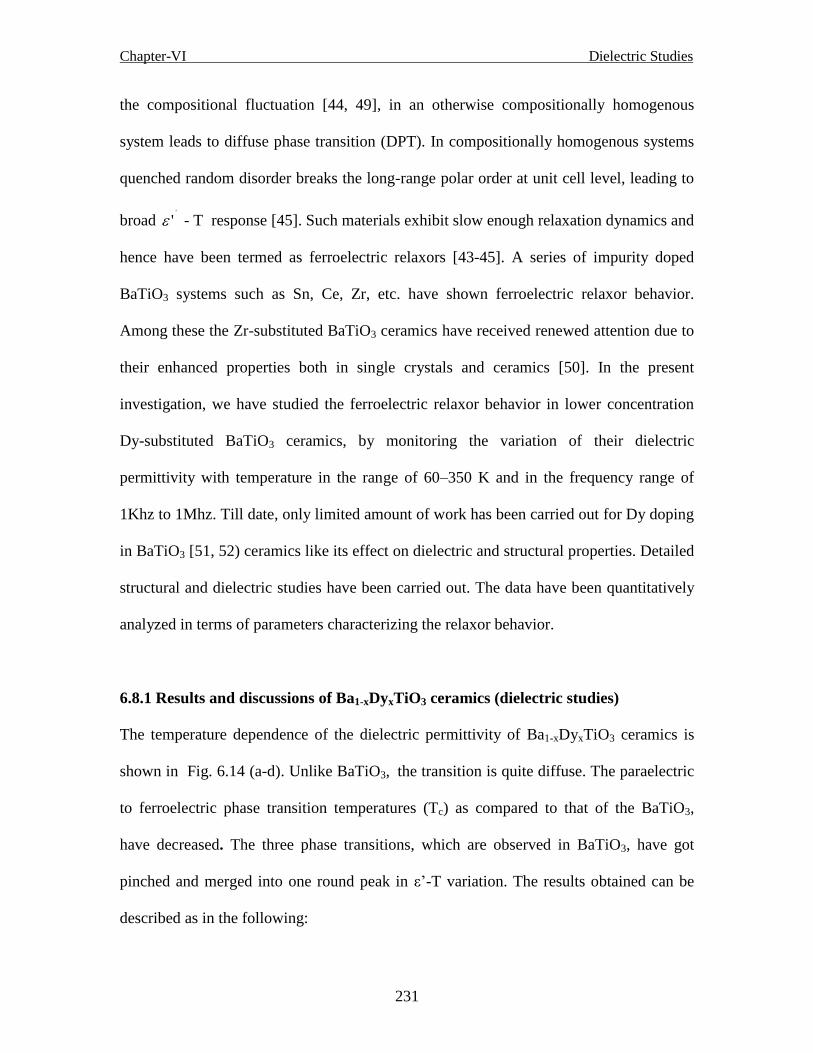
Chapter-VI Dielectric Studies
231
the compositional fluctuation [44, 49], in an otherwise compositionally homogenous
system leads to diffuse phase transition (DPT). In compositionally homogenous systems
quenched random disorder breaks the long-range polar order at unit cell level, leading to
broad '
' - T response [45]. Such materials exhibit slow enough relaxation dynamics and
hence have been termed as ferroelectric relaxors [43-45]. A series of impurity doped
BaTiO3 systems such as Sn, Ce, Zr, etc. have shown ferroelectric relaxor behavior.
Among these the Zr-substituted BaTiO3 ceramics have received renewed attention due to
their enhanced properties both in single crystals and ceramics [50]. In the present
investigation, we have studied the ferroelectric relaxor behavior in lower concentration
Dy-substituted BaTiO3 ceramics, by monitoring the variation of their dielectric
permittivity with temperature in the range of 60–350 K and in the frequency range of
1Khz to 1Mhz. Till date, only limited amount of work has been carried out for Dy doping
in BaTiO3 [51, 52) ceramics like its effect on dielectric and structural properties. Detailed
structural and dielectric studies have been carried out. The data have been quantitatively
analyzed in terms of parameters characterizing the relaxor behavior.
6.8.1 Results and discussions of Ba1-xDyxTiO3 ceramics (dielectric studies)
The temperature dependence of the dielectric permittivity of Ba1-xDyxTiO3 ceramics is
shown in Fig. 6.14 (a-d). Unlike BaTiO3, the transition is quite diffuse. The paraelectric
to ferroelectric phase transition temperatures (Tc) as compared to that of the BaTiO3,
have decreased. The three phase transitions, which are observed in BaTiO3, have got
pinched and merged into one round peak in ε‟-T variation. The results obtained can be
described as in the following:
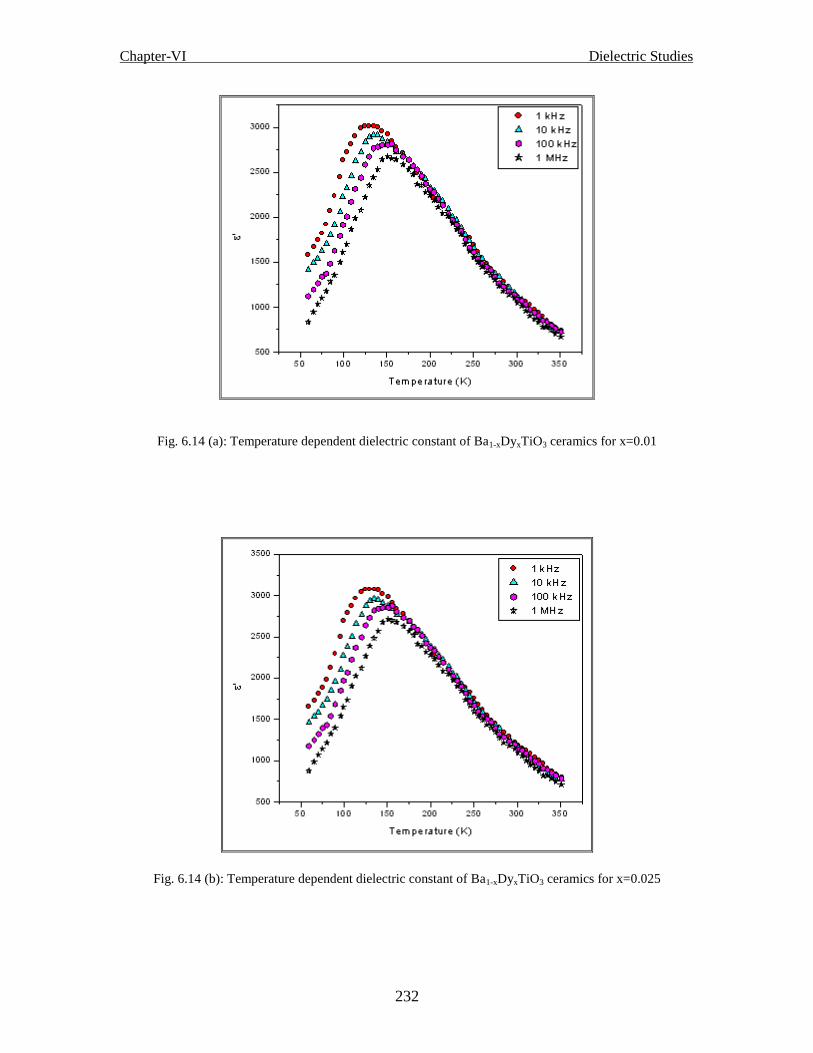
Chapter-VI Dielectric Studies
232
Fig. 6.14 (a): Temperature dependent dielectric constant of Ba1-xDyxTiO3 ceramics for x=0.01
Fig. 6.14 (b): Temperature dependent dielectric constant of Ba1-xDyxTiO3 ceramics for x=0.025
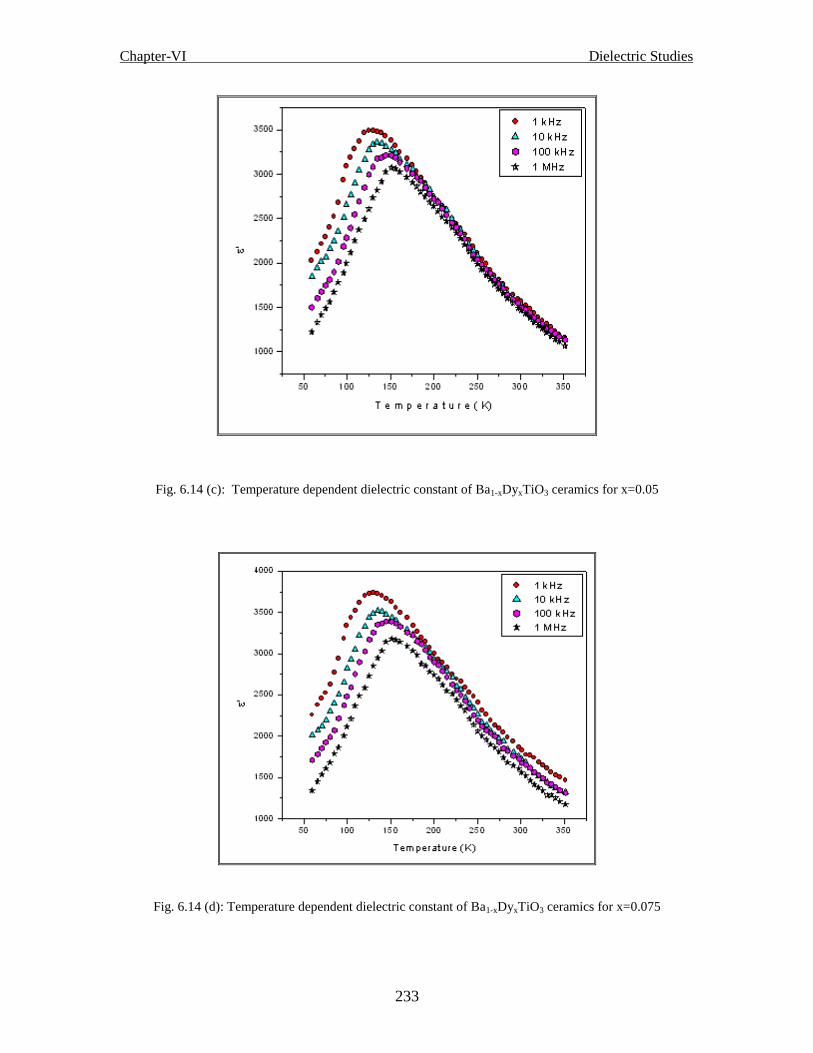
Chapter-VI Dielectric Studies
233
Fig. 6.14 (c): Temperature dependent dielectric constant of Ba1-xDyxTiO3 ceramics for x=0.05
Fig. 6.14 (d): Temperature dependent dielectric constant of Ba1-xDyxTiO3 ceramics for x=0.075

Chapter-VI Dielectric Studies
234
(1) There is a broad peak around Tm = 200 K in the ε‟ - T curve. With increasing
frequency, Tm increases, while the magnitude of the peak decreases.
(2) There is a strong dielectric dispersion in radio frequency region around and below Tm
in the ε‟–T curve.
The above described features of (ε‟ - T) variations shown in Fig. 6.14 are very much
similar to the observations by Cross, Lu, Cheng, Chen and other workers [43-44, 48, 50,
53] for various lead-based and lead-free ferroelectric relaxor materials. In order to further
confirm the relaxor behavior, the quantitative characterizations as described in the
following sections have been done. Fig. 6.15 (a-d) shows the dielectric loss of the studied
material at different frequencies with varying temperatures. The spectrums show there is
an increase in dielectric loss peak temperature with increase in frequency. This indicates
that the dielectric polarization is of relaxation type
Fig. 6.15 (a): Temperature dependent dielectric loss of Ba1-xDyxTiO3 ceramics for x=0.01

Chapter-VI Dielectric Studies
235
Fig. 6.15 (b): Temperature dependent dielectric loss of Ba1-xDyxTiO3 ceramics for x=0.025
Fig. 6.15 (c): Temperature dependent dielectric loss of Ba1-xDyxTiO3 ceramics for x=0.05

Chapter-VI Dielectric Studies
236
Fig. 6.15 (d): Temperature dependent dielectric loss of Ba1-xDyxTiO3 ceramics for x=0.075
The dielectric loss is found to decrease and the loss is larger at a higher measurement
frequency. With increasing x, the dielectric losses were significantly suppressed. The
high value of dielectric loss at 1 kHz is due to the presence of all types of polarization
and may be due to the contribution from the finite resistivity of the materials. This
indicates that the dielectric polarization is of relaxation type.
6.8.2 Permittivity variation in the high temperature side
It is known that dielectric permittivity of a normal ferroelectric above Curie temperature
follows the Curie–Weiss law described by Eq. (14). Fig. 6.16 (a-d) shows the inverse of
ε‟ as a function of temperature at 10 kHz and its fit to the experimental data by Curie–
Weiss law. A deviation from Curie–Weiss law starting at Tdev can be clearly seen. The
parameter ΔTm, which is often used to show the degree of deviation from the Curie-
Weiss law is defined by Eq. (15). The TCW as determined from the Curie–Weiss fit, is
TCW = 141-144 K, at 10 kHz.

Chapter-VI Dielectric Studies
237
Fig.6.16 (a): Temperature dependency 1/ ε of Ba1-xDyxTiO3 ceramics for x=0.01
Fig.6.16 (b): Temperature dependency 1/ ε of Ba1-xDyxTiO3 ceramics for x=0.025

Chapter-VI Dielectric Studies
238
Fig.6.16 (c): Temperature dependency 1/ ε of Ba1-xDyxTiO3 ceramics for x=0.05
Fig.6.16 (d): Temperature dependency 1/ ε‟ of Ba1-xDyxTiO3 ceramics for x=0.075

Chapter-VI Dielectric Studies
239
For such relaxor behavior, a modified Curie–Weiss law has been proposed by Uchino and
Nomura, [54-55] to describe the diffuseness of the phase transition. This is defined as in
the following
CTT m
m
/)(11
….(19)
where and C are assumed to be constant. The parameter gives information on the
character of the phase transition. Its limiting values are = 1 and = 2 in expression (3)
of the Curie–Weiss law, = 1 is for the case of a normal ferroelectric, and the quadratic
dependence is valid for an ideal ferroelectric relaxor, respectively [50, 56]. Thus, the
value of can also characterize the relaxor behavior. The plot of ln (1/ε−1/εm) as a
function of ln (T−Tm) is shown in the Fig. 6.17 (a-d) by fitting with Eq. (16), the exponent
γ, determining the degree of the diffuseness of the phase transition, is obtained from the
slope of ln(1/ε−1/εm) versus ln(T−Tm) plot. We obtained the value of the parameter γ to
be very close to 2, suggesting that the prepared ceramic is a relaxor ferroelectric [54, 56].
Yet another parameter, which is used to characterize the degree of relaxation behavior in
the frequency range of 100 Hz to 100 kHz, is described [56] as
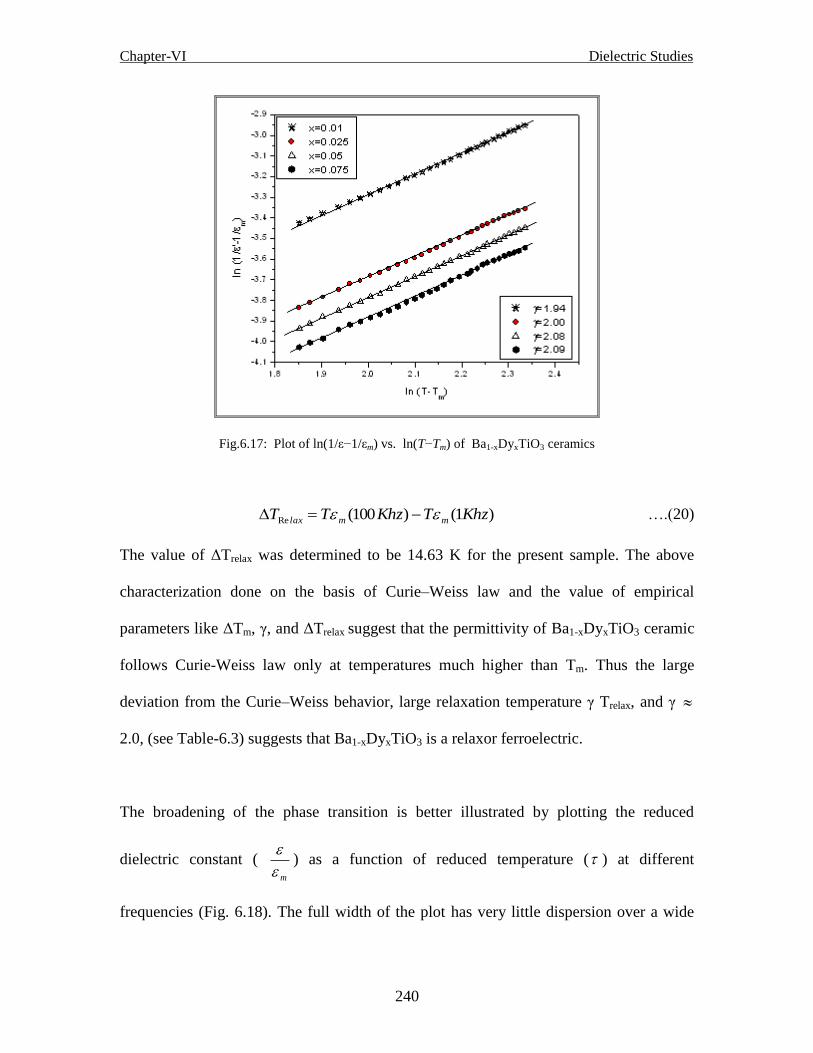
Chapter-VI Dielectric Studies
240
Fig.6.17: Plot of ln(1/ε−1/εm) vs. ln(T−Tm) of Ba1-xDyxTiO3 ceramics
)1()100(Re KhzTKhzTT mmlax ….(20)
The value of ΔTrelax was determined to be 14.63 K for the present sample. The above
characterization done on the basis of Curie–Weiss law and the value of empirical
parameters like ΔTm, γ, and ΔTrelax suggest that the permittivity of Ba1-xDyxTiO3 ceramic
follows Curie-Weiss law only at temperatures much higher than Tm. Thus the large
deviation from the Curie–Weiss behavior, large relaxation temperature γ Trelax, and γ
2.0, (see Table-6.3) suggests that Ba1-xDyxTiO3 is a relaxor ferroelectric.
The broadening of the phase transition is better illustrated by plotting the reduced
dielectric constant ( m
) as a function of reduced temperature ( ) at different
frequencies (Fig. 6.18). The full width of the plot has very little dispersion over a wide

Chapter-VI Dielectric Studies
241
frequency range similar to the observation made in other relaxor materials [57]. The
different parameters obtained at 1 KHz are listed in Table 6.3.
Fig. 6.18 (a): Reduced dielectric constant (
m
) vs. reduced temperature ( ) at different frequencies for
x = 0.01
Fig. 6.18 (b): Reduced dielectric constant (
m
) vs. reduced temperature ( ) at different frequencies for
x = 0.025
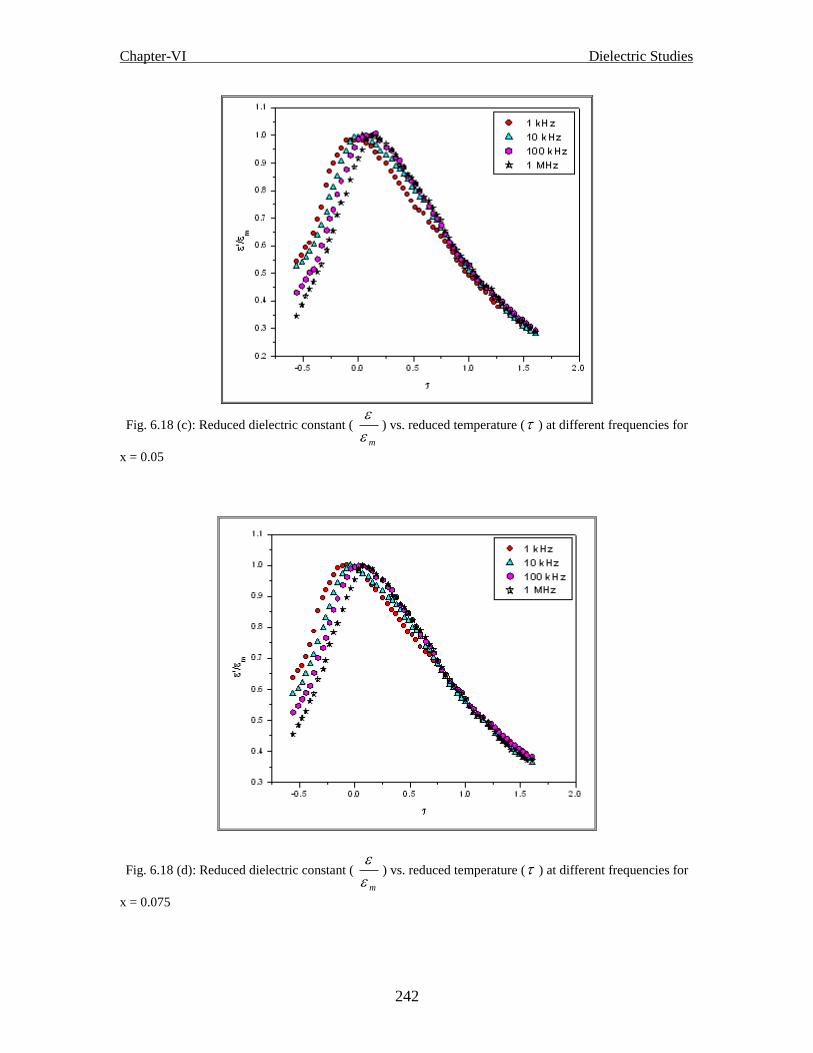
Chapter-VI Dielectric Studies
242
Fig. 6.18 (c): Reduced dielectric constant (
m
) vs. reduced temperature ( ) at different frequencies for
x = 0.05
Fig. 6.18 (d): Reduced dielectric constant (
m
) vs. reduced temperature ( ) at different frequencies for
x = 0.075

Chapter-VI Dielectric Studies
243
Table 6.3: Parameters obtained from temperature dependency dielectric study on the
composition Ba1-xDyxTiO3 at 1 kHz
x=0.01 x=0.025 x=0.05 x=0.075
εm 3011 3075 3139 3733
Tm (ºC) 129 129 129 129
To (ºC) 154 175 180 135
Tcw (ºC) 143 143 141 144
ΔTm (ºC) 14 14 12 15
1.94 2.00 2.08 2.09
ΔTrelax (ºC) 26 26 26 14
The frequency dependency of Tm is shown in Fig. 6.19 as ln f vs. 1000/Tm. The observed
frequency dependence of Tm was empirically evaluated using Vogel-Fulcher‟s
relationship given as
)(exp0
fmB
a
TTk
Eff ….(21)
where 0f is the attempt frequency, aE is the measurement of average activation energy,
Bk the Boltzmann constant, fT the freezing temperature of polarization fluctuation and
0f is the pre exponential factor. The fitting parameters for the composition (x=0.05) are
found to be, aE = 0.1109 eV, fT = 113 K, 0f = 11101.7 Hz. (with reference to Fig.
6.19). The fitting parameters having close agreement with the data of Vogel- Fulcher‟s
relationship suggests that the relaxor behaviours in the systems are analogous to that of a
dipolar glass with polarization fluctuations above a static freezing temperature.
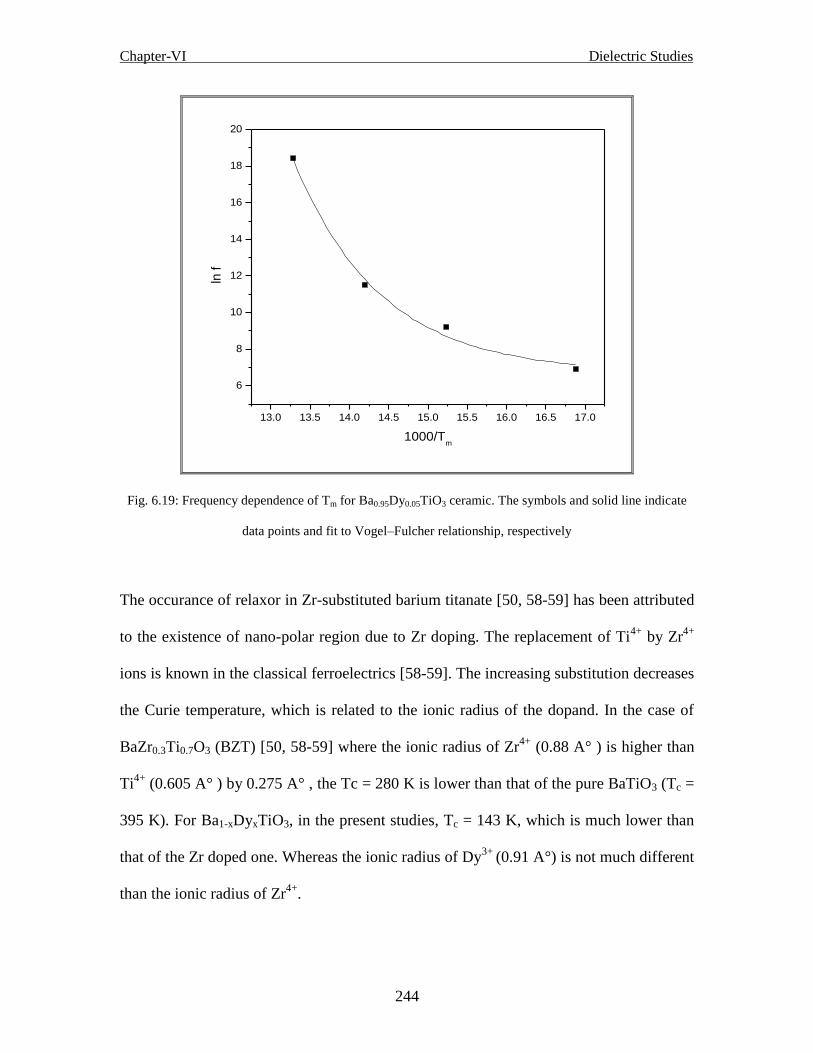
Chapter-VI Dielectric Studies
244
13.0 13.5 14.0 14.5 15.0 15.5 16.0 16.5 17.0
6
8
10
12
14
16
18
20
ln f
1000/Tm
Fig. 6.19: Frequency dependence of Tm for Ba0.95Dy0.05TiO3 ceramic. The symbols and solid line indicate
data points and fit to Vogel–Fulcher relationship, respectively
The occurance of relaxor in Zr-substituted barium titanate [50, 58-59] has been attributed
to the existence of nano-polar region due to Zr doping. The replacement of Ti4+
by Zr4+
ions is known in the classical ferroelectrics [58-59]. The increasing substitution decreases
the Curie temperature, which is related to the ionic radius of the dopand. In the case of
BaZr0.3Ti0.7O3 (BZT) [50, 58-59] where the ionic radius of Zr4+
(0.88 A° ) is higher than
Ti4+
(0.605 A° ) by 0.275 A° , the Tc = 280 K is lower than that of the pure BaTiO3 (Tc =
395 K). For Ba1-xDyxTiO3, in the present studies, Tc = 143 K, which is much lower than
that of the Zr doped one. Whereas the ionic radius of Dy3+
(0.91 A°) is not much different
than the ionic radius of Zr4+
.
Chapter-VI Dielectric Studies
245
It can be seen from the comparative structural study of Ba1-xDyxTiO3 and BaTiO3 using
XRD and SEM, that nano-scale defect features are present in Ba0.95Dy0.05TiO3. It appears
that substitution of Dy causing nano-scale compositional heterogeneity due to presence of
defects [57-60] creating nano-polar domains. It has been suggested that polar nano-
domains are responsible for the relaxational behavior in PMN and PLZT [48] systems.
The substitution of Dy ions tends to make the distance between off-center Ti dipoles
larger and thus weakening the correlation between these dipoles. The mismatch in the
size of Ti and Dy ions will cause substitutional distortion of the oxygen octahedra, giving
rise to the local electric-field and strain-field. Also the ferroelectric behavior of Ba1-
xDyxTiO3 depends on the competitions between long-range ordering owing to strong
correlation of the off-center Ti dipoles and the random fields induced by Dy doping, thus
the existence of these fields leads to the destruction of long-range ferroelectric ordering
and nanopolar coherent domains get formed giving rise to the relaxor behavior.
6.8.3 Conclusions
Based on the X-ray diffraction and dielectric studies of Ba1-xDyxTiO3 ceramic, it can be
concluded that Dy substitution in BaTiO3 forms a perovskite tetragonal phase structure at
room temperature. The occurrence of diffuse phase transition and strong frequency
dispersion of maxima in the permittivity versus temperature, strongly indicate the relaxor
behavior for this Ba1-xDyxTiO3 ceramic. The quantitative characterization and
comparison of the relaxor behavior based on empirical parameters (ΔTm, γ, γTdif and
ΔTrelax) confirm its relaxor behavior.

Chapter-VI Dielectric Studies
246
References:
[1] N. Baskaran and H. Chang, Mater. Chem. Phys., 77 [3] (2002) 889-894.
[2] M.E. Lines, and A.M. Glass, Principles and Applications of Ferroelectrics and
Related Materials; Clarendon Press, Oxford, (1977).
[3] Y. Sakabe, Y. Hamaji, and T. Nishiyama, Ferroelectrics, 13 [2] (1992) 133-138.
[4] A.J. Bell, J. Eur. Ceram. Soc., 28 [2] (2008) 1307-1317.
[5] H.Veenhuis, T. Borger, K. Peithmann, M. Flaspohler, K. Buse, R. Pankrath, H. Hesse,
and E. Kratzig, Appl. Phys. B: Laser Opt. 70 [2-6] (2000) 797-801.
[6] R. Varatharajan, S.B. Samanta, R. Jayavel, C. Subramanian, A.V. Narlikar, and P.
Ramasamy, Mater. Charact. 45 [2] (2000) 89-93.
[7] S. Jayanthi and T.R.N. Kutty, Mater. Sci. Eng. B, 110 (2004) 202-212.
[8] X. Cheng and M. Shen, Solid State Commun., 141 [11] (2007) 587-590.
[9] D.S. Kang, M.S. Han, S.G. Lee, and S.H. Song, J. Eur. Ceram. Soc., 23[3] (2003)
515-518.
[10] X.M. Chen, T. Wang, and J. Li, Mater. Sci. Eng. B, 113 [2] (2004) 117-120.
[11] P. Victor, R. Ranjith, S.B. Krupanidhi, J. Appl. Phys., 94 (2003) 7702.
[12]T.F. Lin, J.L. Lin, C.T. Hu, and I.N. Lin, J. Mater. Sci., 26 [2] (1991) 491-496.
[13] X.S. Wang, H. Yamada, and C.N. Xu, Appl. Phys. Lett., 86 (2005) 022905.
[14] N. Baskaran and H. Chang, Mater. Chem. Phys., 77 [3] (2003) 889-894.
[15] V.S. Tiwari, D. Pandey, and P. Groves, J. Phys. D: Appl. Phys., 22 [6] (1989) 837-
843.
[16] V.S. Tiwari, and D. Pandey, J. Am. Ceram. Soc., 77 [7] (1994) 1819-1824.
[17] X.S. Wang, H. Yamada, and C.N. Xu, Appl. Phys. Lett., 86 (2005) 022905.
[18] Y.H. Han, J.B. Appleby, and D.M. Smyth, J. Am. Ceram. Soc., 70 (1987) 96-100.
[19] W.J. Merz, Phys. Rev., 77 52-54 (1950).
[20] Z.Q. Zhuang, M.P. Harmer, D.M. Smyth, and R.E. Newnham, MRS Bull., 22 [10]
(1987) 1329-1335.

Chapter-VI Dielectric Studies
247
[21] K. Uchino, and S. Nomura, Ferroelectr. Lett. Sect., 44[1] (1982) 55-61.
[22] D. Viehland, M.Wuttig, and L.E. Cross, Ferroelectrics, 120 (1991) 71-77.
[23] A. Mazur, C. Verber, O. Kuper, and H. Hese, Radiat. Eff. Defects Solids 150 (1999)
281.
[24] H.Veenhuis, T. B¨orger, K. Peithmann, M. Flasp¨ohler, K. Buse, R. Pankrath,
H. Hesse, and E. Kr¨atzig, Appl. Phys. B: Lasers Opt. 70 (2000) 797.
[25] L.M. Hong, and L.H. Yang, Mater. Sci. Eng. A 323 (2002) 167.
[26] S.G. Lu, K. Xu, and H. Chen, Appl. Phys. Lett. 85 (2004) 5319–5321.
[27] M. Kuwabara, K. Goda, and K. Oshima, Phys. Rev. B 42 (1990) 10012.
[28] V.V. Shvartsman, W. Kleemann, J. Dec, Z.K. Xu, and S.G. Lu, J. Appl. Phys.
99 (2006) 124111.
[29] B. Cui, P.F. Yu, J. Tian, and Z.G. Chang, Mater. Sci. Eng. B 133 (2006) 205.
[30] Y. Tsur, T.D. Dunbar, and C.A. Bandall, J. Electroceram. 7 (2001) 25.
[31] N. Hirose, J.M.S. Skakle, and A.R. West, J. Electroceram. 3 (1999) 233.
[32] G.A. Samara, J. Phys.: Condens. Matter 15 (2003) R367.
[33] W.J. Merz, Phys. Rev. 77 (1950) 52.
[34] Z.Q. Zhuang, M.P. Harmer, D.M. Smyth, and R.E. Newnham, MRS Bull. 22 (987)
1329.
[35] K. Uchino, and S. Nomura, Ferroelectr. Lett. Sect. 44 (1982) 55.
[36] M. Tyunina, J. Levoska, A. Sternberg, and S. Leppavuori, Appl. Phys. 86 (1999)
5179.
[37] D.Hennings, H. Schell, and G. Simon, J. Am. Ceram. Soc. 65 (1982) 539.
[38] R. Pantou, C. Dubourdieu, F. Weiss, J.Kreisel, G, Kobernik, and W. Haessler,
Mater. Sci. Semicond. Process 5 (2003) 237.
[39] A.I. Kingon, S.K. Streiffier, C. Basceri and S.R. Summerfelt, MRS Bull. 21(1996)
46.

Chapter-VI Dielectric Studies
248
[40] D.L. Polla and L.F. Francis, MRS Bull. 21 (1996) 59.
[41] Y.Sakabe, T. Takagi, K. Wakino, and D.M. Smith, in: J.B. Blum, W.R. Cannon
(Eds.), Advances in Ceramics, Vol. 19, Am. Ceram. Soc. Inc.,, Ohio, 1986, p. 103.
[42] F.J. Walker and A. McKee, Nanostruct. Mater 7 (1996) 221.
[43] Z.G. Lu and G. Calvarin, Phys. Rev. B 51 (1995) 2694.
[44] L.E. Cross, Ferroelectric 76 (1987) 241.
[45] N. Setter and L.E. Cross, J. App. Phy. 51 (8).(1980).
[46] M. Maglione and M. Belkaoumi, Phys. Rev. B 45 (1992) 2029.
[47] J.N. Lin and B. Wu, J. Appl. Phy. 68 (1990) 985.
[48] P. Victor, R. Ranjith, and S.B. Krupanidhi, J. App. Phy. 12 (1994) 7702.
[49] V.S. Tiwari, N. Singh and D. Pande, J. Phys. Cond.Matter 7 (1995) 1441.
[50] Yu Zhi, C. Ang, R. Guo, and A.S. Bhalla, J. App. Phy. 92 (2002) 2655.
[51] W.H. Payne and V.J. Tennery, J. AM. Ceram. Soc. 48 (1965) 413.
[52] V. Tura, and L. Mitoseriu, Euro phys Letters 50 (6) (2000) 810.
[53] P.B. Hirsch, A. Howie, R.B. Nicholson, D.W. Pashley and J. Whelan J, Electron
microscopy of thin crystals, Butterworths, London, pp. 327–337 (1969).
[54] K. Uchino and S. Nomura, Integr. Ferroelectr. 44 (1982) 55.
[55] S.R. Elliott, Phys. Rev. Lett. 67 (1991) 711–714.
[56] C. Ang, Z. Jing, and Z.Yu, J. Phys. Cond. Matter 14 (2002) 8901.
[57] M. Tyunina, J. Levoska, A. Sternberg, and S. Leppavuori, Appl. Phys. 86 (1999)
5179.
[58] J. Ravez, M. Pouchard, and P. Hagenmuller, Eur. J. Solid State Inorg. Chem. 28
(1991) 1107.
[59] J. Ravez and A. Simon, Solid state Sci. 2 (2000) 525–529.
[60] J. Ravez and A. Simon A, Eur. J. Solid State Inorg. Chem. 37 (1997) 1199.
CONCLUSION AND FUTURE SCOPE
Chapter-VII

Chapter-VII Conclusion & Future scope
250
Conclusion and Future scope
7.1 Conclusion
From the X-ray diffraction studied of Ba1-xCaxTiO3 ceramics it is observed that
single-phase BCT compounds were prepared by solid-state reaction method. The BCT
ceramics exhibit a pure tetragonal phase for x from 0.00 up to 0.25, tetragonal and
orthorhombic phases coexisted for x = 0.3–0.5. Relations of various X-ray parameters of
Ba1-xCaxTiO3 ceramics have been studied. This gives a better understanding of the
material. We may say, the deviation of various parameters at x=0.3 may be due to the co-
existence of different phases. Whereas, x 0.25, it is in a single phase and follows a
singular trend. From Rietveld refinement, we have found that tetragonal BaTiO3 in
nanocrystalline form can be obtained by ball milling the stoichiometric powder mixture
of BaCO3, CaCO3 and TiO2. The material is found to be dense as c/a ratio is more than
1.The decrease in lattice parameters signifies the reduction in lattice strain. The crystallite
size decreases as Ca modifies BaTiO3 ceramics. At last we get a clear picture of the
crystal structure of Ba0.9Ca0.1TiO3 ceramics in terms of different positions of the atoms,
bond lengths and bond angles. Different void-species parameters have also been
calculated and explained quantitatively for all the studied compositions of the virgin and
modified BaTiO3 ceramics. It is seen that the inter-atomic distance, nano-void diameter
and nearest neighbour distance vary almost in the same way with different compositions
for all the three different kind of samples. As a result of correlation observed, the values
of r parameter are found to be very close to D parameter. We may say that the internal
structural nano-voids may be responsible for the origin of LSS in X-ray scattering in the

Chapter-VII Conclusion & Future scope
251
framework of Elliott’s void-based model. Also, here we have observed the variation in
Ehrenfest’s number only in the fifth significant figure but, almost it gives 1.23 (approx.).
The euhedral microstructures are clearly seen in the SEM micrographs. The analysis
shows that the grains are almost equaxed. The roundedness and the aspect ratios of
almost all the samples are found to be closer to one for the largest grain. The grain size
shows very interesting behavior, e.g. it increases as the doping concentration increases
and again decreases beyond x=0.1, upto x=0.4, and for x=0.5 the grain size again
increases. The EDX analysis shows that, for all the doping concentration, the theoretical
wt% of the elements is more or less the same with the wt% calculated from the EDX
spectra. This shows a consistency of the elemental wt% present in the green ceramics.
The BCT ceramics exhibit a pure tetragonal phase for x from 0.00 up to 0.2,
tetragonal and orthorhombic phases coexisted for x = 0.25–0.5, along with a small change
of the Curie point with x up to 0.5. Temperature dependency of the dielectric properties
of BCT ceramics has been investigated at different frequencies. The result shows that εm
decreases from 5106 to 1368 for x=0.0 to x=0.5, and correspondingly the Tm has a
variation from 115 to 124. The Curie-Weiss temperature, T0, drastically decreases
initially, thereafter it increases gradually. This may be due to excess of barium in the
materials, which in turn indicates the occupancy of Ca2+
in the Ti4+
site.
In the entire studied range, single-phase perovskite Ba1-xPrxTiO3 ferroelectric
compound has been prepared through solid-state reaction method. The Pr-modified
ceramic materials maintain a trend till x=0.003 and then they deviate from their sequence

Chapter-VII Conclusion & Future scope
252
and behave oppositely. This deviation may be due to some Pr3+
replacing Ti4+
instead of
Ba2+
in this ceramic. Since the ion radius for Pr3+
is much larger than that of Ti4+
. Pr3+
replacing Ti4+
in the octahedral sites of the perovskite structure will cause a localized
expansion of the unit cell, and result in a lattice distortion. It is seen that with addition of
Pr the modified BT materials decrease their % crystallinity exponentially and minimum
at x=0.004 with 93.63 %. It does not mean that, it gets amorphised. Structural analysis of
Praseodymium-modified BaTiO3 is conducted. The variation of different structural
parameters w.r.t. different composition is shown. The 100% RI peak has a key role in
understanding the structure of the material.
The Rietveld refinement of Ba1-xPrxTiO3 ceramics for X = 0, 0.001 shows that all
the figure of merit parameters, the average crystallite size, r.m.s. microstrain and the
lattice parameters, follow a peculiar trend. All the above parameters change non-linearly
and are closely related and follow a wavy nature with increasing doping concentration of
praseodymium to BaTiO3. At last, we get a clear picture of the crystal structure of
Ba0.999Pr0.001TiO3 ceramics in terms of positions of the different atoms, bond lengths and
bond angles.
The SEM images of BPrT produced at this temperature were observed shriveled
irregular particles with a smooth surface. The chemical compositions of the samples were
checked by EDX analysis, which confirmed the high purity of the prepared samples.
Results indicated that below the critical concentration of Pr the substitution took place in

Chapter-VII Conclusion & Future scope
253
the barium sub-lattice with electronic compensation, and above the critical concentration,
gradually the rare earth ions begin to substitute for titanium.
Temperature dependency of the dielectric properties of Ba1-xPrxTiO3 ceramic has
been investigated at different frequencies, which shows a typical relaxor-like behaviour
far below room temperature. The result shows that εm decreases from 6715 to 5719, and,
correspondingly, the Tm has a variation from 180.31 K to 193.23 K. The Curie-Weiss
temperature, T0, decreases gradually. That is, the quantitative characterization of the
relaxor behaviour based on the empirical parameters confirms the relaxor behaviour of
the composition Ba1-xPrxTiO3.
Based on the X-ray diffraction studies of Ba1-xDyxTiO3 ceramics it can be
concluded that Dy substitution in BaTiO3 forms a perovskite tetragonal phase structure at
room temperature. The Dy-modified ceramic materials do not maintain any sequence.
But in most of the cases, the different parameters remain swinging within a small range.
Or, in other words, we may say the parameters are almost same within the studied range.
This deviation may be due to some Dy3+
replacing Ti4+
instead of Ba2+
in this ceramic.
Since the ion radius for Dy3+
is much larger than that of Ti4+
, Dy3+
replacing Ti4+
in the
octahedral sites of the perovskite structure will cause a localized expansion of the unit
cell, and result in a lattice distortion. It is seen that, with addition of Dy, the modified
BT materials decrease their % crystallinity exponentially and have a minimum at x=0.05
with 92.68 %, and again the crystallinity increases for x=0.075. Structural analysis of
Chapter-VII Conclusion & Future scope
254
dysprosium-modified BaTiO3 is analysed. The variation of different structural parameters
w.r.t. different composition is shown.
The Rietveld refinement of Ba1-xDyxTiO3 ceramics for x = 0.01 shows that all the
figure of merit parameters, the average crystallite size, r.m.s. microstrain and the lattice
parameters, follow a peculiar trend. Initially they decrease and thereafter remain
constasnt. It seems that after certain range the crystallite size, and strain do not change
and remain same and are interdependent. At last, we get a clear picture of the crystal
structure of Ba0.99Dy0. 01TiO3 ceramics in terms of positions of the different atoms, bond
lengths and bond angles.
The SEM images of produced dysprosium-substituted barium titanate ceramics
were observed highly euaxed particles with a smooth surface. The roundedness and
aspect ratios of all the samples are found to be closer to one. The chemical compositions
of the samples were checked by EDX analysis, which shows a consistency of the
elemental wt % present in the green ceramics, it also confirmed the high purity of the
prepared samples. The grain size shows very interesting behavior, e.g. for x = 0.01 it is
less and for x=0.025, 0.05 it increases, but further as the doping concentration increases,
i.e. x=0.075, it decreases and becomes minimum. Results indicate that below the critical
concentration of Dy, the substitution took place in the barium sub-lattice with electronic
compensation, and above the critical concentration, gradually the rare-earth ions begin to
substitute for titanium.

Chapter-VII Conclusion & Future scope
255
The occurrence of diffuse phase-transition and strong frequency dispersion of
maxima in the permittivity versus temperature plots strongly indicate the relaxor behavior
for this Ba1-xDyxTiO3 ceramics. The quantitative characterization and comparison of the
relaxor behavior based on empirical parameters (ΔTm, γ, γTdif and ΔTrelax) confirms their
relaxor behavior.
7.2 Future scope
As explained earlier, BaTiO3 is an important material as it has a wide range of
applications in different fields. Thus, it has a wide prospect. Since microstructure
controlls the physical properties of a material, there are different ways to control the
microstructure and hence its properties. In future, the same material may be studied in the
form of thin films with different processes and materials parameters. Different thin film
preparation techniques can be used, sputtering is one of them. Other characterization
tools can be used in thin film mode like, AFM, Raman scattering, photoluminescence,
ellipsometry, etc. to study its structural, optical and electrical properties. The results so
obtained can be compared with the available results and suitability can be decided. The
thin film can also be irradiated with swift heavy ions, or with same cations to see the
change in the properties for comparisons. The same processes can be repeated time and
again with complex structure (combination of iso+ alio-valent) of modified BaTiO3 and
the phase formation, other structural parameters, optical properties, electrical properties,
etc. can be studied.