Embed Size (px)
Citation preview

materials
Article
On the Injection Molding Processing Parameters ofHDPE-TiO2 Nanocomposites
Abdel-Hamid I. Mourad 1, Mohammad Sayem Mozumder 2,*, Anusha Mairpady 2, Hifsa Pervez 2
and Uma Maheshwara Kannuri 2
1 Mechanical Engineering Department, College of Engineering, UAE University, Al Ain 15551, UAE;[email protected]
2 Chemical & Petroleum Engineering Department, College of Engineering, UAE University,Al Ain 15551, UAE; [email protected] (A.M.); [email protected] (H.P.);[email protected] (U.M.K.)
* Correspondence: [email protected]; Tel.: +971-3-713-5324; Fax: +971-3-713-4996
Academic Editor: Walter CaseriReceived: 24 September 2016; Accepted: 11 November 2016; Published: 20 January 2017
Abstract: In recent years, the development and use of polymeric nanocomposites in creatingadvanced materials has expanded exponentially. A substantial amount of research has been done inorder to design polymeric nanocomposites in a safe and efficient manner. In the present study,the impact of processing parameters, such as, barrel temperature, and residence time on themechanical and thermal properties of high density polyethylene (HDPE)-TiO2 nanocompositeswere investigated. Additionally, scanning electron microscopy and X-ray diffraction spectroscopywere used to analyze the dispersion, location, and phase morphology of TiO2 on the HDPE matrix.Mechanical tests revealed that tensile strength of the fabricated HDPE-TiO2 nanocomposites rangedbetween 22.53 and 26.30 MPa, while the Young’s modulus showed a consistent increase as the barreltemperature increased from 150 ◦C to 300 ◦C. Moreover, the thermal stability decreased as the barreltemperature increased.
Keywords: HDPE/TiO2 nanocomposites; injection molding parameters; structural changes;mechanical properties; thermal stability
1. Introduction
Polymers have been used as starting materials for several different applications, and polymericcomposites have formed a particularly interesting niche in biomedical engineering. Currently there area variety of metallic and ceramic materials that are being pursued as micro or nanofillers in a polymermatrix [1]. Incorporation of additives into the polymeric matrix are mostly used to enhance the existingproperties, however, it can also be considered a cost effective method for value added products [1,2].New hybrid polymeric materials are being continually developed by the addition of fillers that finetune the physical, chemical, and mechanical properties of the composites [1,3]. The effect of differentnanofillers can be observed from the improved properties of the polymeric nanocomposites, however,fine tuning the process parameters of injection molding itself is also another important factor that mustbe considered.
Polyethylene has been widely studied in combination with metallic nanoparticles for theircombined advantage in hard tissue replacement and tissue engineering [3,4]. Specifically, high densitypolyethylene (HDPE), a thermoplastic material, has shown great promise as a matrix component ofbone implants; its structure consists of long chains of carbon and hydrogen atoms bonded together withvariable branching throughout which determines its mechanical properties [5]. Given the versatilityof HDPE, many research groups have studied the effect of incorporation of fillers into the polymer
Materials 2017, 10, 85; doi:10.3390/ma10010085 www.mdpi.com/journal/materials
Materials 2017, 10, 85 2 of 25
matrix, including titanium dioxide, aluminum oxide, hydroxyapatite, and zirconia etc. that resultedin biocomposites with improved physical properties and enhanced cellular responses in bone-likecells [3,6–10].
Metallic fillers such as titanium, zinc, and copper are known to improve the thermal andelectrical conductivities of polymer matrices [1,11]. Among them, titanium has been used as implantmaterial since the 20th century, and its alloys have many uses in orthopedic and dental research [9].The popularity of titanium is attributed to its excellent biocompatibility, corrosion resistance, andhigh strength; nevertheless, its high modulus of elasticity limits its use as sole material for implantsand hence the incorporation of pure titanium or titanium dioxide in polymers has resulted in feasiblepolymeric composites [9]. A high modulus causes bone resorption, and therefore, minimizing thiseffect results in successful integration of implants in the body [3,9]. Other types of fillers such asquasi-crystalline (QC), hydroxyapatite, polyimidazole fibers, and aluminum oxide have also beenadded to HDPE matrix to fabricate specialized composites [1,3,12,13].
Nanocomposites based on polymeric matrix are fabricated by various techniques includinginjection molding [3,14], compression molding [15,16], in situ polymerization [17,18], sol-gel [19], andsintering [9]. Among them, in situ polymerization involves the dispersion of inorganic nanoparticlesin a monomer phase as a first step, followed by bulk phase polymerization [20]. The resultingsolution produced polymeric nanocomposites with well-dispersed nanoparticles and good flowingproperties [17]. However, a limitation of this technique shows that the mixture consists of unstablenanocomposites that may revert into a different morphology other than the expected [20]. Moreover,this process is not very common in industry and is mainly used for thermosetting polymers. In addition,compression molding is another technique used for fabricating nanocomposites; it involves a moldcavity in which the polymer blend is poured and results in composites of various dimensions.The processing conditions include very high pressure and the fabricated nanocomposites may notalways have a uniform consistency [16]. Furthermore, most compression molding techniques requirepre-treatment of the nanoparticles with curing.
Injection molding offers higher production cycles than compression molding thermoplastics [21].This technique has become one of the most significant industrialized techniques in the field of polymercomposites processing. The process provides high production rates, repeatable high tolerances, andlow labor cost, and is anticipated to hold greater potential in the fabrication of uniform, goodquality polymer micro- and sub-micrometer structures [22]. Injection molding can be used in avariety of applications in both commercial and research fields. A large number of polymer parts withcomplex geometry and good dimensional accuracy can be automatically manufactured by injectionmolding [23].
Liu et al. fabricated Ti-HDPE composites based on a sintering method that was carried outbetween a temperature of 1000–3000 ◦C and time ranging between 1 h and 12 h [9]. Sintering, powdercompaction and sol-gel are all alternative techniques to produce polymeric composites, however,the operating conditions (temperature, pressure etc.) and time needed are far in excess of thoseof injection molding [24]. As a polymer matrix, high density polyethylene (HDPE) is well-knownfor its semi-crystalline structure which is closely bound to the overall macroscopic properties of thepolymer such as mechanical and thermal characteristics [25]. In injection molding, HDPE undergoes anisothermal crystallization process which is a complex phenomenon occurring due to the varying shearand temperature gradients that occur while the polymer melts and fills the mold [23]. The variousgradients contribute to the formation of different layers with different levels of crystallinity that affectthe mechanical properties of the composites. In addition, the residence time (i.e., the time durationthat the polymer spends in the barrel) along with barrel temperature, and the crystallization processof the polymer, especially HDPE, become affected [23]. In a study by Bociaga and Palutkiewicz [24],it was found that mold temperature had the greatest impact on the mechanical properties and surfacestructure. They investigated the effect of different injection molding conditions and concluded thatlow injection temperature, or barrel temperature, resulted in polymeric molded parts that consisted

Materials 2017, 10, 85 3 of 25
of a solid skin layer and a fine cellular core. Also, low weight HDPE parts were obtained at lowinjection temperature due to the formation of numerous tiny pores and the resultant high viscosityof the melting plastic, since temperatures used were close to the melting point of HDPE [26]. In hisstudy, Mourad [27] concluded that the modulus of elasticity, yield strength, and tensile toughnessdecreased with increasing polyethylene (PE) content in the PE/PP blends of different concentrationsand different process parameters. In a similar study by Mourad et al. [28] on the thermal characteristicsof thermally treated and untreated VLDPE and isotactic PP blends (iPP), it was found through TGAand DSC analysis that addition of VLDPE resulted in a decrease in the melting temperature, heat offusion, and percent crystallinity of the iPP based blends.
Since injection molding is a commonly used technique for mass production in industrialapplications, it is imperative to study the different operating conditions so that the process isoptimized [29]. Therefore, the aim of the current study was to prepare HDPE-TiO2 nanocompositeswith a 5% constant nanofiller concentrations through injection molding. The two main parametersstudied were the barrel temperature and the residence time fixed at 250 ◦C and 50 min respectivelywhen either of the parameter was being studied. The effects of these process parameters wereinvestigated based on the measured mechanical properties (i.e., Young’s modulus, tensile strength,and percent elongation) and thermal properties (e.g., crystallization and degradation temperatures)of the produced composites. Moreover, structural analyses such as X-ray Diffraction (XRD) andFourier Transform Infrared (FTIR) spectroscopy were also used as tools to differentiate any structuralchanges of the polymer matrix. The surface morphology and titanium dioxide distribution was studiedby means of scanning electron microscopy (SEM) along with energy dispersive spectroscopy (EDS)mapping of different elements along the surface of the injection molded substrates.
2. Materials and Methods
Commercially available high-density polyethylene (HDPE) and titanium dioxide (TiO2) weresupplied by Sigma-Aldrich (Munich, Germany). The supplied HDPE has a transition temperature(softening point) of 123 ◦C and melt flow index of 2.2 g/10 min and the TiO2 nanoparticles(average particle size ~150 nm) of puriss grade have a melting temperature of >350 ◦C.
2.1. Synthesis of HDPE-TiO2 Nanocomposites
The HDPE nanocomposites having 5% TiO2 were subjected to high shear mixing to ensureeven dispersion of TiO2 in the polymer matrix. The homogenous HDPE/TiO2 mixture was thentransferred into the hopper of a gas assisted injection molding machine. After waiting for a specificamount of time, the sample was injected into the mold at constant air pressure and the moldtemperature was maintained at 100 ◦C. The extruded pellets were injected and molded into dumbbellshaped nanocomposites. In the present paper, the effects of two operating conditions were analyzed.When studying the effect of barrel temperature (150 ◦C, 175 ◦C, 200 ◦C, 250 ◦C, and 300 ◦C) on thenanocomposites properties, residence time was kept constant at 50 min. Similarly, while evaluatingthe influence of residence time (30, 40, 50, 60, and 70 min) on properties of nanocomposites, the barreltemperature was maintained at 250 ◦C.
2.2. Characterization
2.2.1. Mechanical Testing
Injection molded dumbbell shaped specimens were evaluated for their tensile properties using a5 kN load cell universal testing machine. A nominal gauge length of 20 mm was used, extended up tofracture with a cross head speed of 5 mm/min to obtain stress-strain curves. From the tensile curve,the tensile strength, elastic moduli, and elongation to break were determined.

Materials 2017, 10, 85 4 of 25
2.2.2. Thermal Analyses (TGA and DSC)
To illustrate the thermal stability of the fabricated nanocomposites, thermogravimetric analysis(TGA) and differential scanning calorimetry (DSC) were carried out on the fabricated HDPE-TiO2
nanocomposites. One composite sample of each operating condition (i.e., barrel temperature andresidence time) was considered for the thermal analyses, and its melting point, crystallization point,percentage of crystallization, and degradation temperature were determined.
TGA was carried out in a TA instrument (Model Q 50, TA Instruments, New Castle, DE, USA)to quantitatively evaluate the weight change observed for 10 mg of the sample as a function oftemperature and time. The temperature profile programmed in TGA consisted of heating range 25 ◦Cto 600 ◦C. The degradation temperature was varied from room temperature to 600 ◦C under theinfluence of nitrogen and the heating rate was maintained in the system at 10 ◦C·min−1.
The crystallization and melting behavior of HDPE-TiO2 nanocomposites were evaluated in aTA instrument (Model Q 200, TA Instruments, New Castle, DE, USA). Throughout the experiment,the system was maintained in a nitrogen environment to avert the oxidation of the sample; a heatingrate of 10 ◦C·min−1 was used. Approximately, 5 mg of the sample was placed in a DSC pan and anempty pan were used as a reference. The DSC instrument was programmed to execute the analysis inthree cycles. The first step involved a heating cycle in which the sample was exposed to a temperaturefrom 25 ◦C to 200 ◦C. This was followed by a cooling cycle, which involved scanning the DSC panswith decreasing temperature from 200 ◦C to 25 ◦C. Finally, the sample was heated up to 200 ◦C toretrieve the melting DSC curve. After completion of each step, the system was maintained isothermallyfor 5 min to disregard any thermal history. The rate of crystallization was calculated from the formulagiven below [30]:
Xc =∆Hm
(∆H◦m)× (ϕ)× 100%. (1)
where, ∆Hm is the heat of fusion and ∆H◦m is as per literature the extrapolated value of enthalpy
corresponding to 100% crystalline polyethylene; ∆H◦m = 293 J/g, ϕweight fraction of HDPE [31].
2.2.3. XRD Analysis
The crystal morphology of TiO2 loaded in HDPE was examined in an X-ray diffractometer (X’Pert3,PANalytical X-ray diffraction system, PANalytical, Denver, CO, USA). The X-ray diffraction patternwas obtained by using CuKα radiation (λ = 1.54 A◦), operating at a voltage of 45 kV and under acurrent of 40 mA. To measure the distances between the atomic planes (i.e., d spacing) using Braggslaw the following equation was used [32]:
nλ = 2dsinθ (2)
Crystallite size of the nanocomposites were measured by using the Scherrer equation [33].
Lhkl =Kλ
β cos θ(3)
where λ (A◦) is the wavelength of the X-ray, θ is the angle the between the incident X-ray and the planeperpendicular to the (hkl) plane, K is the crystallite shape factor which is 0.9 here, and β is the width ofthe diffraction beam at half height.
2.2.4. Scanning Electron Microscopy (SEM)
The surface morphology of the nanocomposites was examined by means of SEM (FEI Quanta50, Hillsboro, OR, USA) using a secondary electron detector (SE), at 30 kV and a working distance of9.6 mm. Samples were sputter coated with a nano film of Au/Pd using a 108 Auto Sputter Coater
Materials 2017, 10, 85 5 of 25
(Cressington Scientific Instruments, Watford, UK). EDS (energy dispersive spectroscopy) mapping ofthe surfaces was supported by Oxford systems, Abingdon, UK.
2.2.5. Fourier Transform Infrared (FTIR)
The presence of particular functional groups and bonding was analyzed by performing infraredspectroscopy using a Fourier transform spectrophotometer by SHIMADZU (Model: 8400S) in therange from 650 cm−1 to 4000 cm−1.
3. Results and Discussion
3.1. Surface Morphology and Nanoparticles Dispersion
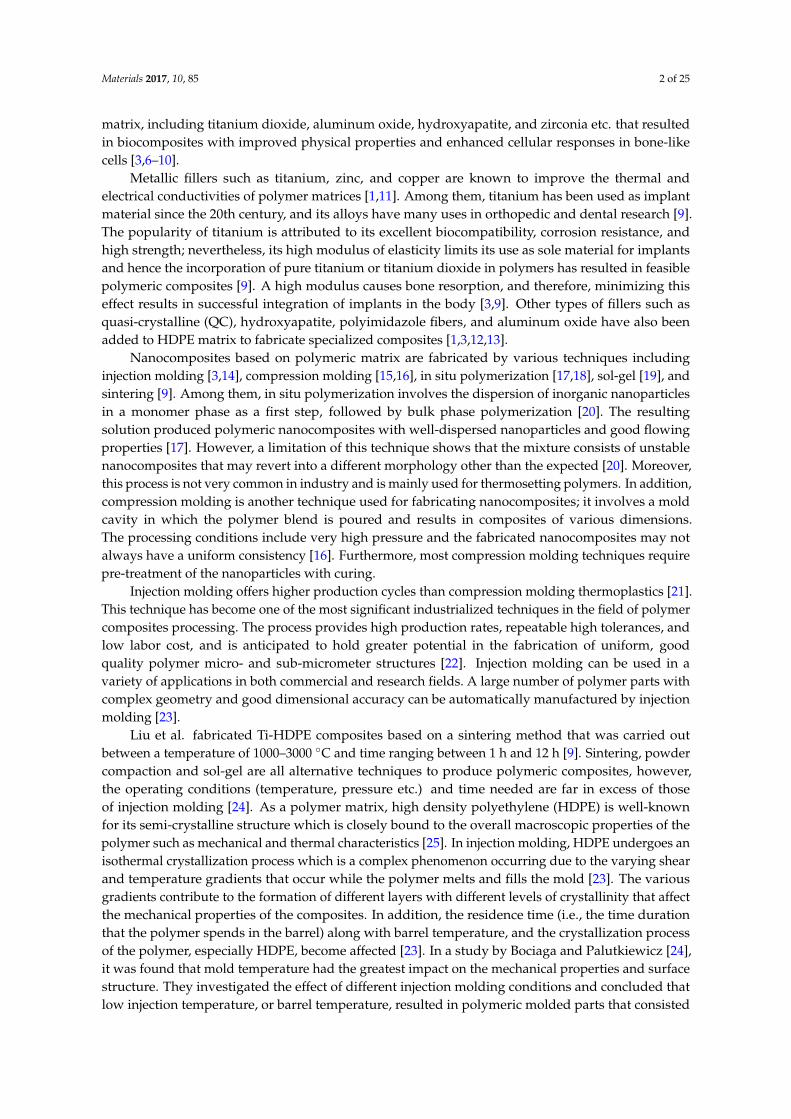
In this study, TiO2 nanoparticles enriched HDPE nanocomposites were fabricated usinginjection molding under varying operating conditions. In order to analyze the nanocomposites’surface topography and to verify the presence of titania particles, SEM images were taken for thedeveloped HDPE-TiO2 nanocomposites. Figure 1 is a representative micrograph showing the surfacemorphologies of the composites that were prepared with a consistent TiO2 content of 5 wt % , barreltemperature of 225 ◦C, and a residence time of 50 min. Micrographs for different barrel temperatures(150 ◦C, 225 ◦C, 250 ◦C, and 300 ◦C) were obtained. The SEM micrographs show some irregularities onthe surfaces of the injection molded nanocomposites samples and no evidence of agglomeration at theselected magnification were observed. According to Rideal et al. [34] temperatures for HDPE at orabove 300 ◦C resulted in degradation of the polymer due to the thermal effects on the bonding of thestructure. Moreover, practically at high barrel temperatures in the injection molding equipment withsamples containing metal fillers, the samples tend to overheat resulting in a less desirable surface [35].A similar result was also confirmed by Tripathi et al. [3] who reported a rougher surface when two ormore additives were added to the polymer matrix when samples were prepared at 180 ◦C [3].
Materials 2017, 10, 85 5 of 24
2.2.5. Fourier Transform Infrared (FTIR)
The presence of particular functional groups and bonding was analyzed by performing infrared spectroscopy using a Fourier transform spectrophotometer by SHIMADZU (Model: 8400S) in the range from 650 cm−1 to 4000 cm−1.
3. Results and Discussion
3.1. Surface Morphology and Nanoparticles Dispersion
In this study, TiO2 nanoparticles enriched HDPE nanocomposites were fabricated using injection molding under varying operating conditions. In order to analyze the nanocomposites’ surface topography and to verify the presence of titania particles, SEM images were taken for the developed HDPE-TiO2 nanocomposites. Figure 1 is a representative micrograph showing the surface morphologies of the composites that were prepared with a consistent TiO2 content of 5 wt % , barrel temperature of 225 °C, and a residence time of 50 min. Micrographs for different barrel temperatures (150 °C, 225 °C, 250 °C, and 300 °C) were obtained. The SEM micrographs show some irregularities on the surfaces of the injection molded nanocomposites samples and no evidence of agglomeration at the selected magnification were observed. According to Rideal et al. [34] temperatures for HDPE at or above 300 °C resulted in degradation of the polymer due to the thermal effects on the bonding of the structure. Moreover, practically at high barrel temperatures in the injection molding equipment with samples containing metal fillers, the samples tend to overheat resulting in a less desirable surface [35]. A similar result was also confirmed by Tripathi et al. [3] who reported a rougher surface when two or more additives were added to the polymer matrix when samples were prepared at 180 °C [3].
Figure 1. Representative secondary electron (SE) scanning electron microscopy (SEM) micrograph of high density polyethylene (HDPE)/TiO2 composites with 5 wt % nano-TiO2 prepared at a barrel temperature of 225 °C for 50 min of residence time. Image taken at 400× magnification and scaled to 300 micrometers.
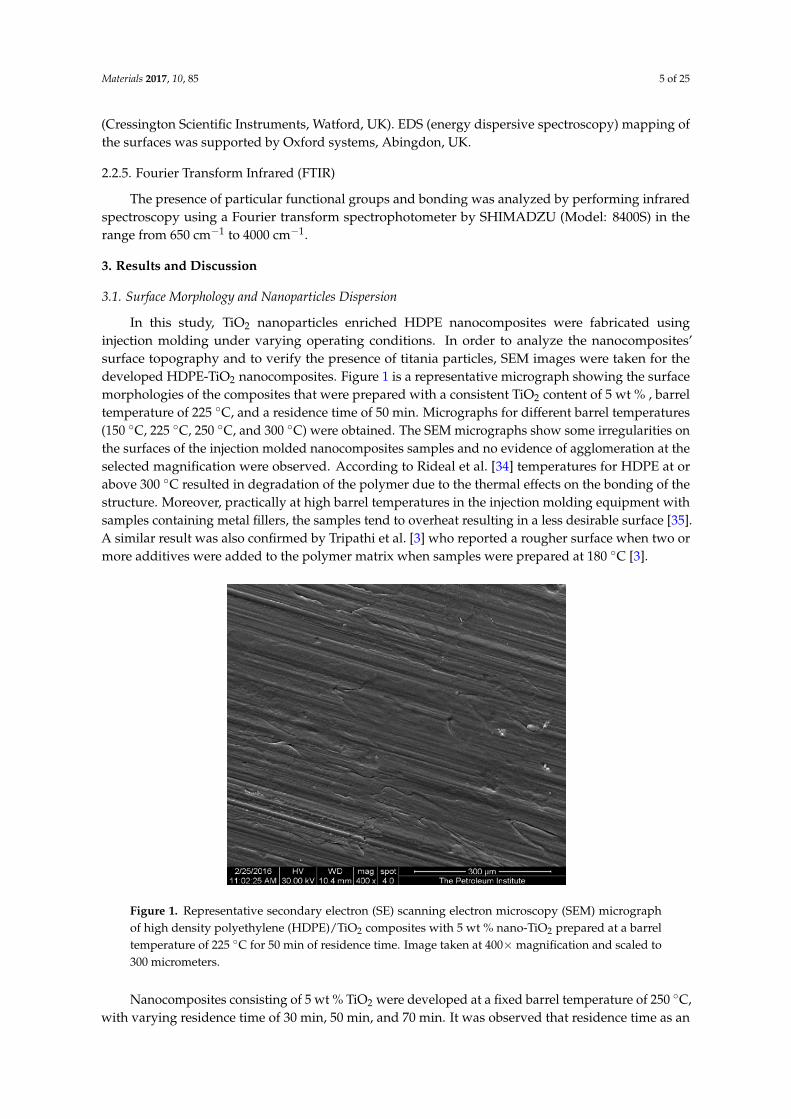
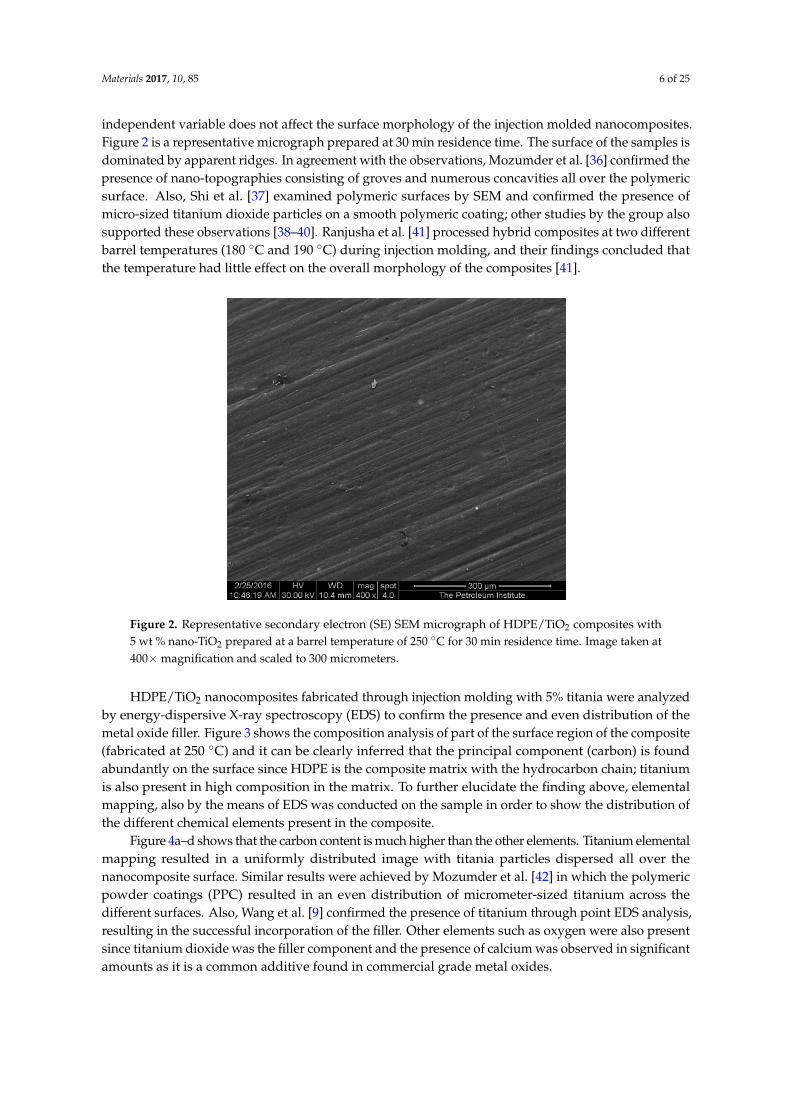
Nanocomposites consisting of 5 wt % TiO2 were developed at a fixed barrel temperature of 250 °C, with varying residence time of 30 min, 50 min, and 70 min. It was observed that residence time as an independent variable does not affect the surface morphology of the injection molded nanocomposites. Figure 2 is a representative micrograph prepared at 30 min residence time. The surface of the samples is dominated by apparent ridges. In agreement with the observations, Mozumder et al. [36] confirmed the presence of nano-topographies consisting of groves and
Figure 1. Representative secondary electron (SE) scanning electron microscopy (SEM) micrographof high density polyethylene (HDPE)/TiO2 composites with 5 wt % nano-TiO2 prepared at a barreltemperature of 225 ◦C for 50 min of residence time. Image taken at 400× magnification and scaled to300 micrometers.
Nanocomposites consisting of 5 wt % TiO2 were developed at a fixed barrel temperature of 250 ◦C,with varying residence time of 30 min, 50 min, and 70 min. It was observed that residence time as an
Materials 2017, 10, 85 6 of 25
independent variable does not affect the surface morphology of the injection molded nanocomposites.Figure 2 is a representative micrograph prepared at 30 min residence time. The surface of the samples isdominated by apparent ridges. In agreement with the observations, Mozumder et al. [36] confirmed thepresence of nano-topographies consisting of groves and numerous concavities all over the polymericsurface. Also, Shi et al. [37] examined polymeric surfaces by SEM and confirmed the presence ofmicro-sized titanium dioxide particles on a smooth polymeric coating; other studies by the group alsosupported these observations [38–40]. Ranjusha et al. [41] processed hybrid composites at two differentbarrel temperatures (180 ◦C and 190 ◦C) during injection molding, and their findings concluded thatthe temperature had little effect on the overall morphology of the composites [41].
Materials 2017, 10, 85 6 of 24
numerous concavities all over the polymeric surface. Also, Shi et al. [37] examined polymeric surfaces by SEM and confirmed the presence of micro-sized titanium dioxide particles on a smooth polymeric coating; other studies by the group also supported these observations [38–40]. Ranjusha et al. [41] processed hybrid composites at two different barrel temperatures (180 °C and 190 °C) during injection molding, and their findings concluded that the temperature had little effect on the overall morphology of the composites [41].
Figure 2. Representative secondary electron (SE) SEM micrograph of HDPE/TiO2 composites with 5 wt % nano-TiO2 prepared at a barrel temperature of 250 °C for 30 min residence time. Image taken at 400× magnification and scaled to 300 micrometers.
HDPE/TiO2 nanocomposites fabricated through injection molding with 5% titania were analyzed by energy-dispersive X-ray spectroscopy (EDS) to confirm the presence and even distribution of the metal oxide filler. Figure 3 shows the composition analysis of part of the surface region of the composite (fabricated at 250 °C) and it can be clearly inferred that the principal component (carbon) is found abundantly on the surface since HDPE is the composite matrix with the hydrocarbon chain; titanium is also present in high composition in the matrix. To further elucidate the finding above, elemental mapping, also by the means of EDS was conducted on the sample in order to show the distribution of the different chemical elements present in the composite.
Figure 4a–d shows that the carbon content is much higher than the other elements. Titanium elemental mapping resulted in a uniformly distributed image with titania particles dispersed all over the nanocomposite surface. Similar results were achieved by Mozumder et al. [42] in which the polymeric powder coatings (PPC) resulted in an even distribution of micrometer-sized titanium across the different surfaces. Also, Wang et al. [9] confirmed the presence of titanium through point EDS analysis, resulting in the successful incorporation of the filler. Other elements such as oxygen were also present since titanium dioxide was the filler component and the presence of calcium was observed in significant amounts as it is a common additive found in commercial grade metal oxides.
Figure 2. Representative secondary electron (SE) SEM micrograph of HDPE/TiO2 composites with5 wt % nano-TiO2 prepared at a barrel temperature of 250 ◦C for 30 min residence time. Image taken at400× magnification and scaled to 300 micrometers.
HDPE/TiO2 nanocomposites fabricated through injection molding with 5% titania were analyzedby energy-dispersive X-ray spectroscopy (EDS) to confirm the presence and even distribution of themetal oxide filler. Figure 3 shows the composition analysis of part of the surface region of the composite(fabricated at 250 ◦C) and it can be clearly inferred that the principal component (carbon) is foundabundantly on the surface since HDPE is the composite matrix with the hydrocarbon chain; titaniumis also present in high composition in the matrix. To further elucidate the finding above, elementalmapping, also by the means of EDS was conducted on the sample in order to show the distribution ofthe different chemical elements present in the composite.
Figure 4a–d shows that the carbon content is much higher than the other elements. Titanium elementalmapping resulted in a uniformly distributed image with titania particles dispersed all over thenanocomposite surface. Similar results were achieved by Mozumder et al. [42] in which the polymericpowder coatings (PPC) resulted in an even distribution of micrometer-sized titanium across thedifferent surfaces. Also, Wang et al. [9] confirmed the presence of titanium through point EDS analysis,resulting in the successful incorporation of the filler. Other elements such as oxygen were also presentsince titanium dioxide was the filler component and the presence of calcium was observed in significantamounts as it is a common additive found in commercial grade metal oxides.

Materials 2017, 10, 85 7 of 25
Materials 2017, 10, 85 7 of 24
Figure 3. Elemental composition analyzed by energy-dispersive X-ray spectroscopy (EDS) on HDPE/TiO2 nanocomposite at 5 wt % injection molded under a barrel temperature of 250 °C and residence time of 50 min.
Figure 4. A representative elemental mapping by EDS spectroscopy on injection molded HDPE/TiO2 nanocomposite fabricated under a barrel temperature of 250 °C and a residence time of 50 min. Images represent the distribution of the different chemical elements on the nanocomposite surfaces: (a) carbon; (b) titanium; (c) oxygen; and (d) calcium.
Therefore, elemental mapping confirms the presence of titania nanoparticles in the HDPE matrix with a good overall dispersion. Nanocomposite prepared at a barrel temperature of 150 °C exhibited
Figure 3. Elemental composition analyzed by energy-dispersive X-ray spectroscopy (EDS) onHDPE/TiO2 nanocomposite at 5 wt % injection molded under a barrel temperature of 250 ◦C andresidence time of 50 min.
Materials 2017, 10, 85 7 of 24
Figure 3. Elemental composition analyzed by energy-dispersive X-ray spectroscopy (EDS) on HDPE/TiO2 nanocomposite at 5 wt % injection molded under a barrel temperature of 250 °C and residence time of 50 min.
Figure 4. A representative elemental mapping by EDS spectroscopy on injection molded HDPE/TiO2 nanocomposite fabricated under a barrel temperature of 250 °C and a residence time of 50 min. Images represent the distribution of the different chemical elements on the nanocomposite surfaces: (a) carbon; (b) titanium; (c) oxygen; and (d) calcium.
Therefore, elemental mapping confirms the presence of titania nanoparticles in the HDPE matrix with a good overall dispersion. Nanocomposite prepared at a barrel temperature of 150 °C exhibited
Figure 4. A representative elemental mapping by EDS spectroscopy on injection molded HDPE/TiO2
nanocomposite fabricated under a barrel temperature of 250 ◦C and a residence time of 50 min.Images represent the distribution of the different chemical elements on the nanocomposite surfaces:(a) carbon; (b) titanium; (c) oxygen; and (d) calcium.
Therefore, elemental mapping confirms the presence of titania nanoparticles in the HDPE matrixwith a good overall dispersion. Nanocomposite prepared at a barrel temperature of 150 ◦C exhibited anon-uniform morphology, while composites at higher temperatures consisted of regular ridges and
Materials 2017, 10, 85 8 of 25
pores. The surface morphologies of the nanocomposites with varying residence time showed littlevariation but remained consistent with the general findings.
Infrared (IR) analysis is a very useful technique when analyzing different compounds since thespectra result in molecular fingerprints that enable identification of various organic and inorganicmolecules [28,43]. IR absorptions are useful in determining the presence of different bond stretchingpertaining to a particular chemical bond, the percent transmittance, as well as the intensity of aparticular peak [44].
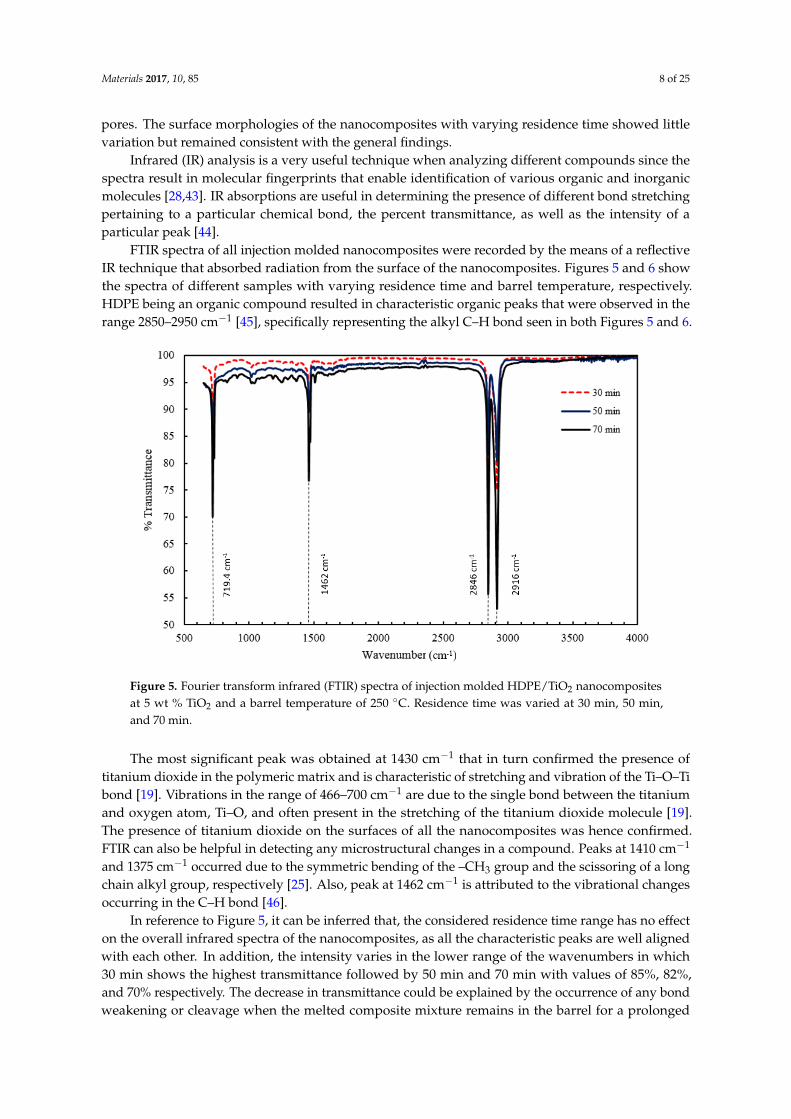
FTIR spectra of all injection molded nanocomposites were recorded by the means of a reflectiveIR technique that absorbed radiation from the surface of the nanocomposites. Figures 5 and 6 showthe spectra of different samples with varying residence time and barrel temperature, respectively.HDPE being an organic compound resulted in characteristic organic peaks that were observed in therange 2850–2950 cm−1 [45], specifically representing the alkyl C–H bond seen in both Figures 5 and 6.
Materials 2017, 10, 85 8 of 24
a non-uniform morphology, while composites at higher temperatures consisted of regular ridges and pores. The surface morphologies of the nanocomposites with varying residence time showed little variation but remained consistent with the general findings.
Infrared (IR) analysis is a very useful technique when analyzing different compounds since the spectra result in molecular fingerprints that enable identification of various organic and inorganic molecules [28,43]. IR absorptions are useful in determining the presence of different bond stretching pertaining to a particular chemical bond, the percent transmittance, as well as the intensity of a particular peak [44].
FTIR spectra of all injection molded nanocomposites were recorded by the means of a reflective IR technique that absorbed radiation from the surface of the nanocomposites. Figures 5 and 6 show the spectra of different samples with varying residence time and barrel temperature, respectively. HDPE being an organic compound resulted in characteristic organic peaks that were observed in the range 2850–2950 cm−1 [45], specifically representing the alkyl C–H bond seen in both Figures 5 and 6.
Figure 5. Fourier transform infrared (FTIR) spectra of injection molded HDPE/TiO2 nanocomposites at 5 wt % TiO2 and a barrel temperature of 250 °C. Residence time was varied at 30 min, 50 min, and 70 min.
The most significant peak was obtained at 1430 cm−1 that in turn confirmed the presence of titanium dioxide in the polymeric matrix and is characteristic of stretching and vibration of the Ti–O–Ti bond [19]. Vibrations in the range of 466–700 cm−1 are due to the single bond between the titanium and oxygen atom, Ti–O, and often present in the stretching of the titanium dioxide molecule [19]. The presence of titanium dioxide on the surfaces of all the nanocomposites was hence confirmed. FTIR can also be helpful in detecting any microstructural changes in a compound. Peaks at 1410 cm−1 and 1375 cm−1 occurred due to the symmetric bending of the –CH3 group and the scissoring of a long chain alkyl group, respectively [25]. Also, peak at 1462 cm−1 is attributed to the vibrational changes occurring in the C–H bond [46].
In reference to Figure 5, it can be inferred that, the considered residence time range has no effect on the overall infrared spectra of the nanocomposites, as all the characteristic peaks are well aligned with each other. In addition, the intensity varies in the lower range of the wavenumbers in which 30 min shows the highest transmittance followed by 50 min and 70 min with values of 85%, 82%, and 70% respectively. The decrease in transmittance could be explained by the occurrence of any bond weakening or cleavage when the melted composite mixture remains in the barrel for a prolonged period, nevertheless the spectrum converges along its length [47]. Figure 6 presents a stacked graph
Figure 5. Fourier transform infrared (FTIR) spectra of injection molded HDPE/TiO2 nanocompositesat 5 wt % TiO2 and a barrel temperature of 250 ◦C. Residence time was varied at 30 min, 50 min,and 70 min.
The most significant peak was obtained at 1430 cm−1 that in turn confirmed the presence oftitanium dioxide in the polymeric matrix and is characteristic of stretching and vibration of the Ti–O–Tibond [19]. Vibrations in the range of 466–700 cm−1 are due to the single bond between the titaniumand oxygen atom, Ti–O, and often present in the stretching of the titanium dioxide molecule [19].The presence of titanium dioxide on the surfaces of all the nanocomposites was hence confirmed.FTIR can also be helpful in detecting any microstructural changes in a compound. Peaks at 1410 cm−1
and 1375 cm−1 occurred due to the symmetric bending of the –CH3 group and the scissoring of a longchain alkyl group, respectively [25]. Also, peak at 1462 cm−1 is attributed to the vibrational changesoccurring in the C–H bond [46].
In reference to Figure 5, it can be inferred that, the considered residence time range has no effecton the overall infrared spectra of the nanocomposites, as all the characteristic peaks are well alignedwith each other. In addition, the intensity varies in the lower range of the wavenumbers in which30 min shows the highest transmittance followed by 50 min and 70 min with values of 85%, 82%,and 70% respectively. The decrease in transmittance could be explained by the occurrence of any bondweakening or cleavage when the melted composite mixture remains in the barrel for a prolonged
Materials 2017, 10, 85 9 of 25
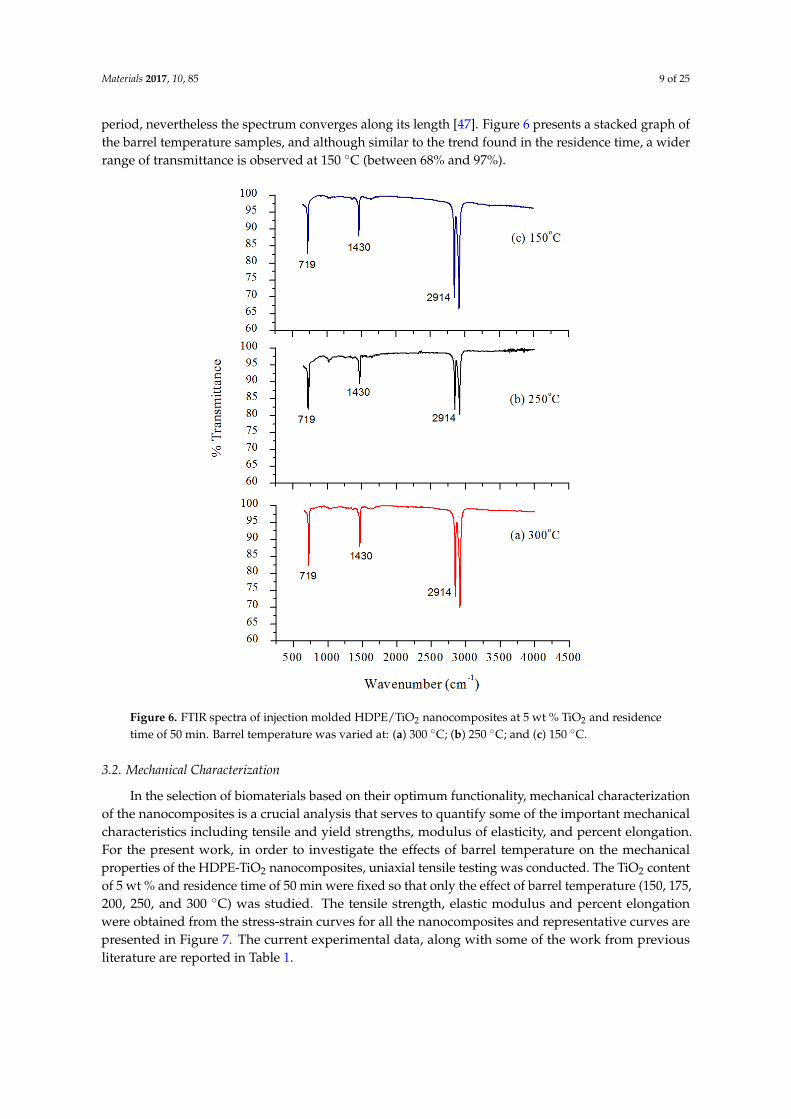
period, nevertheless the spectrum converges along its length [47]. Figure 6 presents a stacked graph ofthe barrel temperature samples, and although similar to the trend found in the residence time, a widerrange of transmittance is observed at 150 ◦C (between 68% and 97%).
Materials 2017, 10, 85 9 of 24
of the barrel temperature samples, and although similar to the trend found in the residence time, a wider range of transmittance is observed at 150 °C (between 68% and 97%).
Figure 6. FTIR spectra of injection molded HDPE/TiO2 nanocomposites at 5 wt % TiO2 and residence time of 50 min. Barrel temperature was varied at: (a) 300 °C; (b) 250 °C; and (c) 150 °C.
3.2. Mechanical Characterization
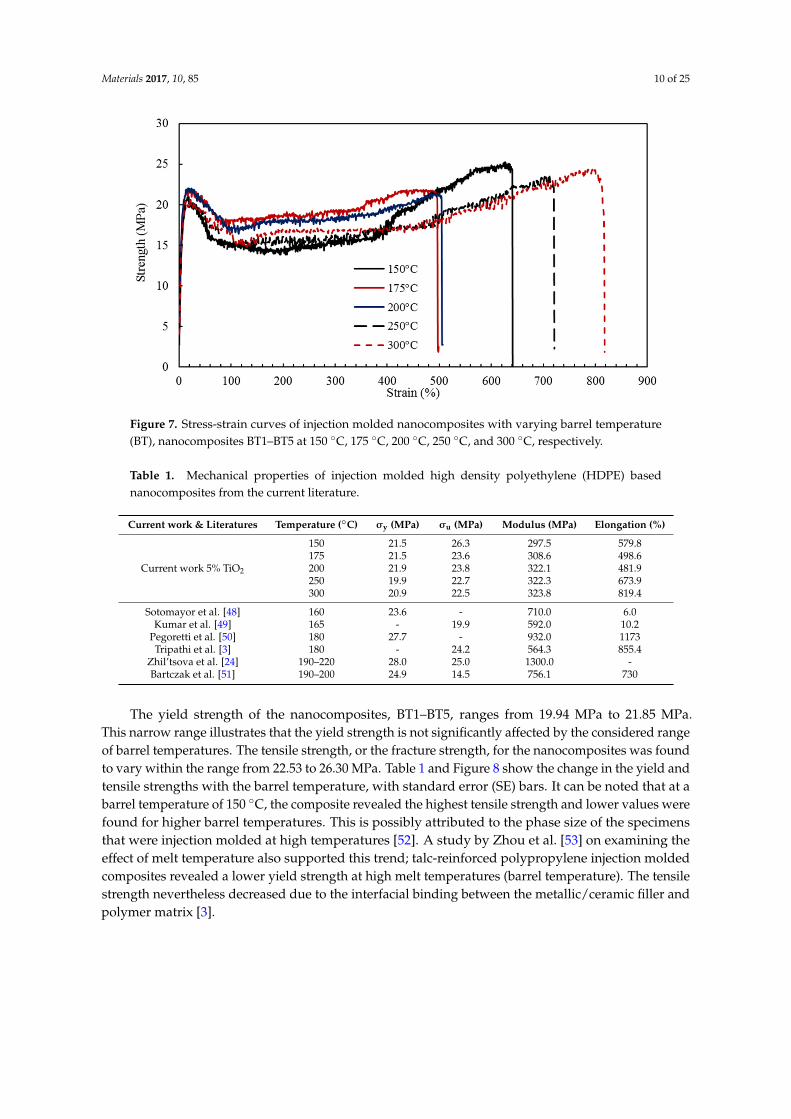
In the selection of biomaterials based on their optimum functionality, mechanical characterization of the nanocomposites is a crucial analysis that serves to quantify some of the important mechanical characteristics including tensile and yield strengths, modulus of elasticity, and percent elongation. For the present work, in order to investigate the effects of barrel temperature on the mechanical properties of the HDPE-TiO2 nanocomposites, uniaxial tensile testing was conducted. The TiO2 content of 5 wt % and residence time of 50 min were fixed so that only the effect of barrel temperature (150, 175, 200, 250, and 300 °C) was studied. The tensile strength, elastic modulus and percent elongation were obtained from the stress-strain curves for all the nanocomposites and representative curves are presented in Figure 7. The current experimental data, along with some of the work from previous literature are reported in Table 1.
Figure 6. FTIR spectra of injection molded HDPE/TiO2 nanocomposites at 5 wt % TiO2 and residencetime of 50 min. Barrel temperature was varied at: (a) 300 ◦C; (b) 250 ◦C; and (c) 150 ◦C.
3.2. Mechanical Characterization
In the selection of biomaterials based on their optimum functionality, mechanical characterizationof the nanocomposites is a crucial analysis that serves to quantify some of the important mechanicalcharacteristics including tensile and yield strengths, modulus of elasticity, and percent elongation.For the present work, in order to investigate the effects of barrel temperature on the mechanicalproperties of the HDPE-TiO2 nanocomposites, uniaxial tensile testing was conducted. The TiO2 contentof 5 wt % and residence time of 50 min were fixed so that only the effect of barrel temperature (150, 175,200, 250, and 300 ◦C) was studied. The tensile strength, elastic modulus and percent elongationwere obtained from the stress-strain curves for all the nanocomposites and representative curves arepresented in Figure 7. The current experimental data, along with some of the work from previousliterature are reported in Table 1.
Materials 2017, 10, 85 10 of 25Materials 2017, 10, 85 10 of 24
Figure 7. Stress-strain curves of injection molded nanocomposites with varying barrel temperature (BT), nanocomposites BT1–BT5 at 150 °C, 175 °C, 200 °C, 250 °C, and 300 °C, respectively.
Table 1. Mechanical properties of injection molded high density polyethylene (HDPE) based nanocomposites from the current literature.
Current work & Literatures
Temperature(°C)
σy
(MPa) σu
(MPa) Modulus
(MPa) Elongation
(%)
Current work 5% TiO2
150 21.5 26.3 297.5 579.8 175 21.5 23.6 308.6 498.6 200 21.9 23.8 322.1 481.9 250 19.9 22.7 322.3 673.9 300 20.9 22.5 323.8 819.4
Sotomayor et al. [48] 160 23.6 - 710.0 6.0 Kumar et al. [49] 165 - 19.9 592.0 10.2
Pegoretti et al. [50] 180 27.7 - 932.0 1173 Tripathi et al. [3] 180 - 24.2 564.3 855.4
Zhil’tsova et al. [24] 190–220 28.0 25.0 1300.0 - Bartczak et al. [51] 190–200 24.9 14.5 756.1 730
The yield strength of the nanocomposites, BT1–BT5, ranges from 19.94 MPa to 21.85 MPa. This narrow range illustrates that the yield strength is not significantly affected by the considered range of barrel temperatures. The tensile strength, or the fracture strength, for the nanocomposites was found to vary within the range from 22.53 to 26.30 MPa. Table 1 and Figure 8 show the change in the yield and tensile strengths with the barrel temperature, with standard error (SE) bars. It can be noted that at a barrel temperature of 150 °C, the composite revealed the highest tensile strength and lower values were found for higher barrel temperatures. This is possibly attributed to the phase size of the specimens that were injection molded at high temperatures [52]. A study by Zhou et al. [53] on examining the effect of melt temperature also supported this trend; talc-reinforced polypropylene injection molded composites revealed a lower yield strength at high melt temperatures (barrel temperature). The tensile strength nevertheless decreased due to the interfacial binding between the metallic/ceramic filler and polymer matrix [3].
Figure 7. Stress-strain curves of injection molded nanocomposites with varying barrel temperature(BT), nanocomposites BT1–BT5 at 150 ◦C, 175 ◦C, 200 ◦C, 250 ◦C, and 300 ◦C, respectively.
Table 1. Mechanical properties of injection molded high density polyethylene (HDPE) basednanocomposites from the current literature.
Current work & Literatures Temperature (◦C) σy (MPa) σu (MPa) Modulus (MPa) Elongation (%)
Current work 5% TiO2
150 21.5 26.3 297.5 579.8175 21.5 23.6 308.6 498.6200 21.9 23.8 322.1 481.9250 19.9 22.7 322.3 673.9300 20.9 22.5 323.8 819.4
Sotomayor et al. [48] 160 23.6 - 710.0 6.0Kumar et al. [49] 165 - 19.9 592.0 10.2
Pegoretti et al. [50] 180 27.7 - 932.0 1173Tripathi et al. [3] 180 - 24.2 564.3 855.4
Zhil’tsova et al. [24] 190–220 28.0 25.0 1300.0 -Bartczak et al. [51] 190–200 24.9 14.5 756.1 730
The yield strength of the nanocomposites, BT1–BT5, ranges from 19.94 MPa to 21.85 MPa.This narrow range illustrates that the yield strength is not significantly affected by the considered rangeof barrel temperatures. The tensile strength, or the fracture strength, for the nanocomposites was foundto vary within the range from 22.53 to 26.30 MPa. Table 1 and Figure 8 show the change in the yield andtensile strengths with the barrel temperature, with standard error (SE) bars. It can be noted that at abarrel temperature of 150 ◦C, the composite revealed the highest tensile strength and lower values werefound for higher barrel temperatures. This is possibly attributed to the phase size of the specimensthat were injection molded at high temperatures [52]. A study by Zhou et al. [53] on examining theeffect of melt temperature also supported this trend; talc-reinforced polypropylene injection moldedcomposites revealed a lower yield strength at high melt temperatures (barrel temperature). The tensilestrength nevertheless decreased due to the interfacial binding between the metallic/ceramic filler andpolymer matrix [3].

Materials 2017, 10, 85 11 of 25Materials 2017, 10, 85 11 of 24
Figure 8. Effect of barrel temperature on tensile and yield strengths of the developed HDPE-TiO2 nanocomposites (SE bars included).
Young’s modulus, which represents the stiffness of the material was calculated from the initial linear region of the stress-strain curves, the average values of three samples were considered and are shown in Table 1 and presented in Figure 9, with SE bars. The moduli of the nanocomposites were found to have little variation and were observed to increase with barrel temperature; a total increase of 8.81% was shown when the barrel temperature increased from 150 °C to 300 °C. Tripathi et al. [3] also studied HDPE composites incorporated with alumina and hydroxyapatite that were fabricated using injection molding at 180 °C (see Table 1). The mechanical tests revealed that the minimum modulus of elasticity occurred with neat HDPE and consistently increased at higher filler concentrations.
Figure 9. Effect of barrel temperature on Young’s modulus of the developed HDPE-TiO2 nanocomposites (SE bars included).
The percent elongations, representing the ductility of the material were obtained and are demonstrated in Figure 10. At 150 °C, the elongation of the composite was found to be ≈580%, while at 200 °C the elongation observed had a slightly lower value ≈482%. This could be explained by the presence of laminar orientation occurring at low temperatures that resulted in higher ductility, this result was also observed by Zhang et al. [52] in which PP/LLDPE composites revealed higher percent elongation at a low melt temperature (barrel temperature).
Figure 8. Effect of barrel temperature on tensile and yield strengths of the developed HDPE-TiO2
nanocomposites (SE bars included).
Young’s modulus, which represents the stiffness of the material was calculated from the initiallinear region of the stress-strain curves, the average values of three samples were considered and areshown in Table 1 and presented in Figure 9, with SE bars. The moduli of the nanocomposites werefound to have little variation and were observed to increase with barrel temperature; a total increase of8.81% was shown when the barrel temperature increased from 150 ◦C to 300 ◦C. Tripathi et al. [3] alsostudied HDPE composites incorporated with alumina and hydroxyapatite that were fabricated usinginjection molding at 180 ◦C (see Table 1). The mechanical tests revealed that the minimum modulus ofelasticity occurred with neat HDPE and consistently increased at higher filler concentrations.
Materials 2017, 10, 85 11 of 24
Figure 8. Effect of barrel temperature on tensile and yield strengths of the developed HDPE-TiO2 nanocomposites (SE bars included).
Young’s modulus, which represents the stiffness of the material was calculated from the initial linear region of the stress-strain curves, the average values of three samples were considered and are shown in Table 1 and presented in Figure 9, with SE bars. The moduli of the nanocomposites were found to have little variation and were observed to increase with barrel temperature; a total increase of 8.81% was shown when the barrel temperature increased from 150 °C to 300 °C. Tripathi et al. [3] also studied HDPE composites incorporated with alumina and hydroxyapatite that were fabricated using injection molding at 180 °C (see Table 1). The mechanical tests revealed that the minimum modulus of elasticity occurred with neat HDPE and consistently increased at higher filler concentrations.
Figure 9. Effect of barrel temperature on Young’s modulus of the developed HDPE-TiO2 nanocomposites (SE bars included).
The percent elongations, representing the ductility of the material were obtained and are demonstrated in Figure 10. At 150 °C, the elongation of the composite was found to be ≈580%, while at 200 °C the elongation observed had a slightly lower value ≈482%. This could be explained by the presence of laminar orientation occurring at low temperatures that resulted in higher ductility, this result was also observed by Zhang et al. [52] in which PP/LLDPE composites revealed higher percent elongation at a low melt temperature (barrel temperature).
Figure 9. Effect of barrel temperature on Young’s modulus of the developed HDPE-TiO2
nanocomposites (SE bars included).
The percent elongations, representing the ductility of the material were obtained and aredemonstrated in Figure 10. At 150 ◦C, the elongation of the composite was found to be ≈580%,while at 200 ◦C the elongation observed had a slightly lower value ≈482%. This could be explainedby the presence of laminar orientation occurring at low temperatures that resulted in higher ductility,this result was also observed by Zhang et al. [52] in which PP/LLDPE composites revealed higherpercent elongation at a low melt temperature (barrel temperature).
Materials 2017, 10, 85 12 of 25
Materials 2017, 10, 85 12 of 24
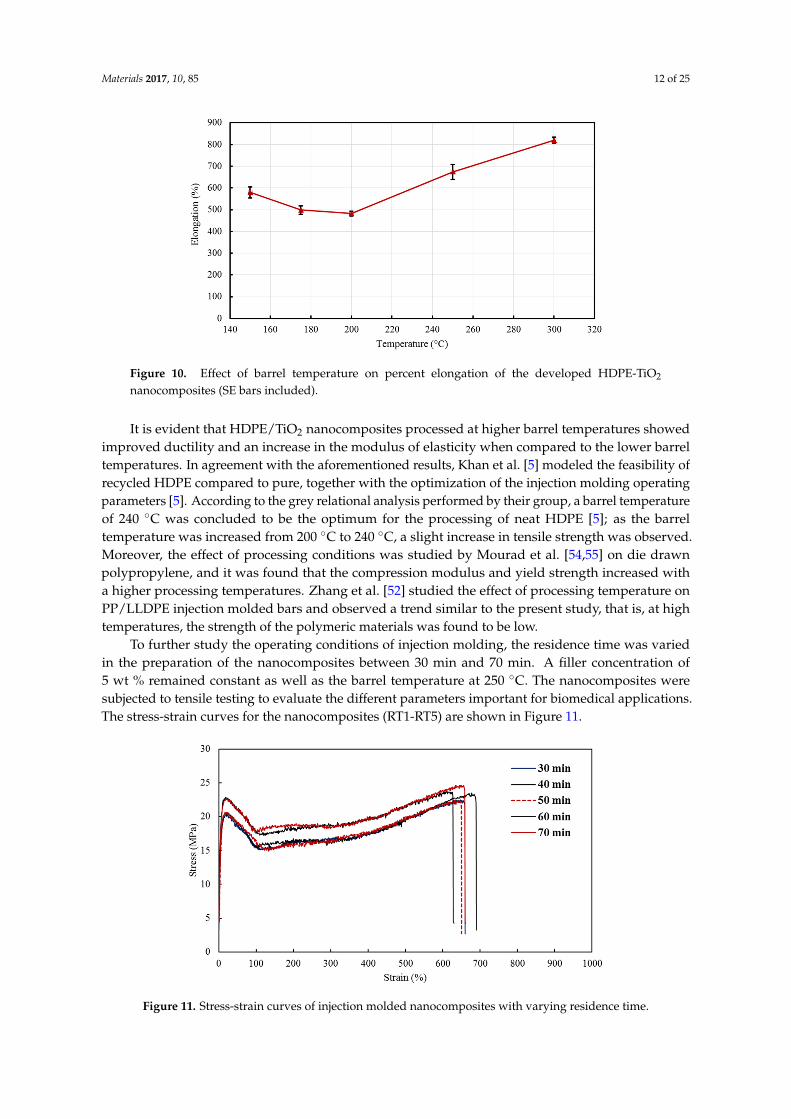
Figure 10. Effect of barrel temperature on percent elongation of the developed HDPE-TiO2 nanocomposites (SE bars included).
It is evident that HDPE/TiO2 nanocomposites processed at higher barrel temperatures showed improved ductility and an increase in the modulus of elasticity when compared to the lower barrel temperatures. In agreement with the aforementioned results, Khan et al. [5] modeled the feasibility of recycled HDPE compared to pure, together with the optimization of the injection molding operating parameters [5]. According to the grey relational analysis performed by their group, a barrel temperature of 240 °C was concluded to be the optimum for the processing of neat HDPE [5]; as the barrel temperature was increased from 200 °C to 240 °C, a slight increase in tensile strength was observed. Moreover, the effect of processing conditions was studied by Mourad et al. [54,55] on die drawn polypropylene, and it was found that the compression modulus and yield strength increased with a higher processing temperatures. Zhang et al. [52] studied the effect of processing temperature on PP/LLDPE injection molded bars and observed a trend similar to the present study, that is, at high temperatures, the strength of the polymeric materials was found to be low.
To further study the operating conditions of injection molding, the residence time was varied in the preparation of the nanocomposites between 30 min and 70 min. A filler concentration of 5 wt % remained constant as well as the barrel temperature at 250 °C. The nanocomposites were subjected to tensile testing to evaluate the different parameters important for biomedical applications. The stress-strain curves for the nanocomposites (RT1-RT5) are shown in Figure 11.
Figure 11. Stress-strain curves of injection molded nanocomposites with varying residence time.
Figure 10. Effect of barrel temperature on percent elongation of the developed HDPE-TiO2
nanocomposites (SE bars included).
It is evident that HDPE/TiO2 nanocomposites processed at higher barrel temperatures showedimproved ductility and an increase in the modulus of elasticity when compared to the lower barreltemperatures. In agreement with the aforementioned results, Khan et al. [5] modeled the feasibility ofrecycled HDPE compared to pure, together with the optimization of the injection molding operatingparameters [5]. According to the grey relational analysis performed by their group, a barrel temperatureof 240 ◦C was concluded to be the optimum for the processing of neat HDPE [5]; as the barreltemperature was increased from 200 ◦C to 240 ◦C, a slight increase in tensile strength was observed.Moreover, the effect of processing conditions was studied by Mourad et al. [54,55] on die drawnpolypropylene, and it was found that the compression modulus and yield strength increased witha higher processing temperatures. Zhang et al. [52] studied the effect of processing temperature onPP/LLDPE injection molded bars and observed a trend similar to the present study, that is, at hightemperatures, the strength of the polymeric materials was found to be low.
To further study the operating conditions of injection molding, the residence time was variedin the preparation of the nanocomposites between 30 min and 70 min. A filler concentration of5 wt % remained constant as well as the barrel temperature at 250 ◦C. The nanocomposites weresubjected to tensile testing to evaluate the different parameters important for biomedical applications.The stress-strain curves for the nanocomposites (RT1-RT5) are shown in Figure 11.
Materials 2017, 10, 85 12 of 24
Figure 10. Effect of barrel temperature on percent elongation of the developed HDPE-TiO2 nanocomposites (SE bars included).
It is evident that HDPE/TiO2 nanocomposites processed at higher barrel temperatures showed improved ductility and an increase in the modulus of elasticity when compared to the lower barrel temperatures. In agreement with the aforementioned results, Khan et al. [5] modeled the feasibility of recycled HDPE compared to pure, together with the optimization of the injection molding operating parameters [5]. According to the grey relational analysis performed by their group, a barrel temperature of 240 °C was concluded to be the optimum for the processing of neat HDPE [5]; as the barrel temperature was increased from 200 °C to 240 °C, a slight increase in tensile strength was observed. Moreover, the effect of processing conditions was studied by Mourad et al. [54,55] on die drawn polypropylene, and it was found that the compression modulus and yield strength increased with a higher processing temperatures. Zhang et al. [52] studied the effect of processing temperature on PP/LLDPE injection molded bars and observed a trend similar to the present study, that is, at high temperatures, the strength of the polymeric materials was found to be low.
To further study the operating conditions of injection molding, the residence time was varied in the preparation of the nanocomposites between 30 min and 70 min. A filler concentration of 5 wt % remained constant as well as the barrel temperature at 250 °C. The nanocomposites were subjected to tensile testing to evaluate the different parameters important for biomedical applications. The stress-strain curves for the nanocomposites (RT1-RT5) are shown in Figure 11.
Figure 11. Stress-strain curves of injection molded nanocomposites with varying residence time. Figure 11. Stress-strain curves of injection molded nanocomposites with varying residence time.
Materials 2017, 10, 85 13 of 25
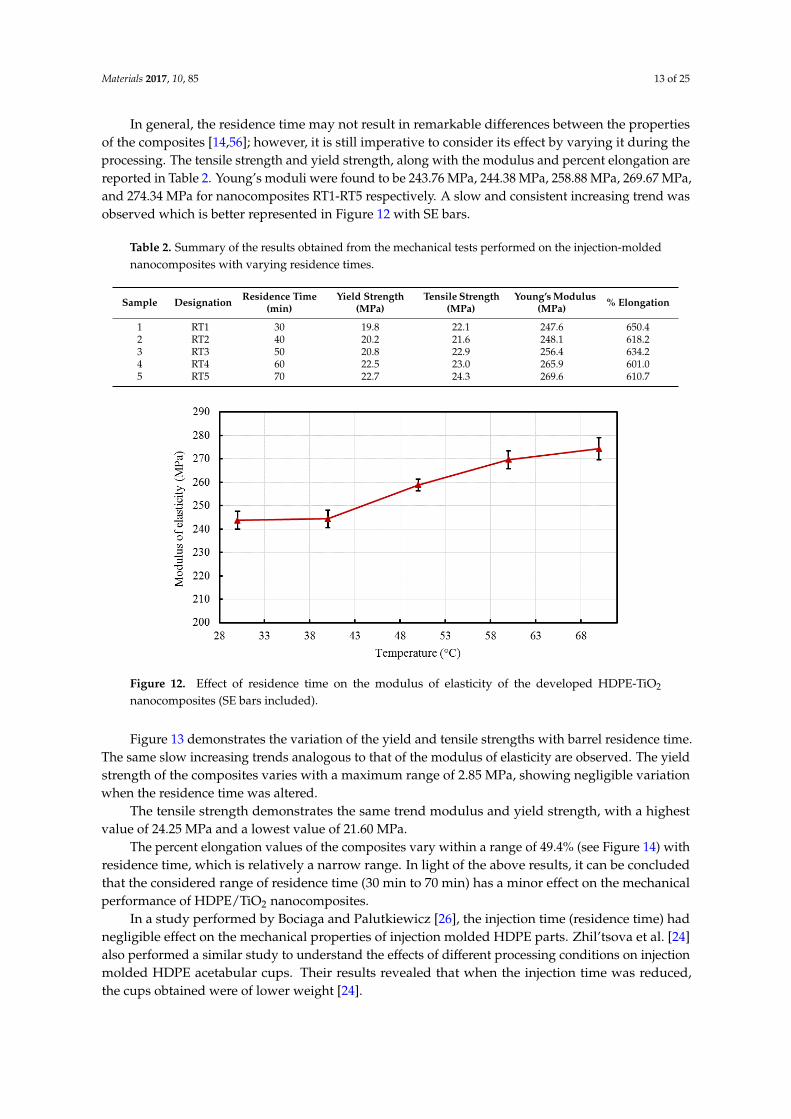
In general, the residence time may not result in remarkable differences between the propertiesof the composites [14,56]; however, it is still imperative to consider its effect by varying it during theprocessing. The tensile strength and yield strength, along with the modulus and percent elongation arereported in Table 2. Young’s moduli were found to be 243.76 MPa, 244.38 MPa, 258.88 MPa, 269.67 MPa,and 274.34 MPa for nanocomposites RT1-RT5 respectively. A slow and consistent increasing trend wasobserved which is better represented in Figure 12 with SE bars.
Table 2. Summary of the results obtained from the mechanical tests performed on the injection-moldednanocomposites with varying residence times.
Sample Designation Residence Time(min)
Yield Strength(MPa)
Tensile Strength(MPa)
Young’s Modulus(MPa) % Elongation
1 RT1 30 19.8 22.1 247.6 650.42 RT2 40 20.2 21.6 248.1 618.23 RT3 50 20.8 22.9 256.4 634.24 RT4 60 22.5 23.0 265.9 601.05 RT5 70 22.7 24.3 269.6 610.7
Materials 2017, 10, 85 13 of 24
In general, the residence time may not result in remarkable differences between the properties of the composites [14,56]; however, it is still imperative to consider its effect by varying it during the processing. The tensile strength and yield strength, along with the modulus and percent elongation are reported in Table 2. Young’s moduli were found to be 243.76 MPa, 244.38 MPa, 258.88 MPa, 269.67 MPa, and 274.34 MPa for nanocomposites RT1-RT5 respectively. A slow and consistent increasing trend was observed which is better represented in Figure 12 with SE bars.
Table 2. Summary of the results obtained from the mechanical tests performed on the injection-molded nanocomposites with varying residence times.
Sample Designation Residence Time (min)
YieldStrength
(MPa)
TensileStrength
(MPa)
Young’s Modulus
(MPa)
% Elongation
1 RT1 30 19.8 22.1 247.6 650.4 2 RT2 40 20.2 21.6 248.1 618.2 3 RT3 50 20.8 22.9 256.4 634.2 4 RT4 60 22.5 23.0 265.9 601.0 5 RT5 70 22.7 24.3 269.6 610.7
Figure 12. Effect of residence time on the modulus of elasticity of the developed HDPE-TiO2 nanocomposites (SE bars included).
Figure 13 demonstrates the variation of the yield and tensile strengths with barrel residence time. The same slow increasing trends analogous to that of the modulus of elasticity are observed. The yield strength of the composites varies with a maximum range of 2.85 MPa, showing negligible variation when the residence time was altered.
The tensile strength demonstrates the same trend modulus and yield strength, with a highest value of 24.25 MPa and a lowest value of 21.60 MPa.
The percent elongation values of the composites vary within a range of 49.4% (see Figure 14) with residence time, which is relatively a narrow range. In light of the above results, it can be concluded that the considered range of residence time (30 min to 70 min) has a minor effect on the mechanical performance of HDPE/TiO2 nanocomposites.
In a study performed by Bociaga and Palutkiewicz [26], the injection time (residence time) had negligible effect on the mechanical properties of injection molded HDPE parts. Zhil’tsova et al. [24] also performed a similar study to understand the effects of different processing conditions on injection molded HDPE acetabular cups. Their results revealed that when the injection time was reduced, the cups obtained were of lower weight [24].
Figure 12. Effect of residence time on the modulus of elasticity of the developed HDPE-TiO2
nanocomposites (SE bars included).
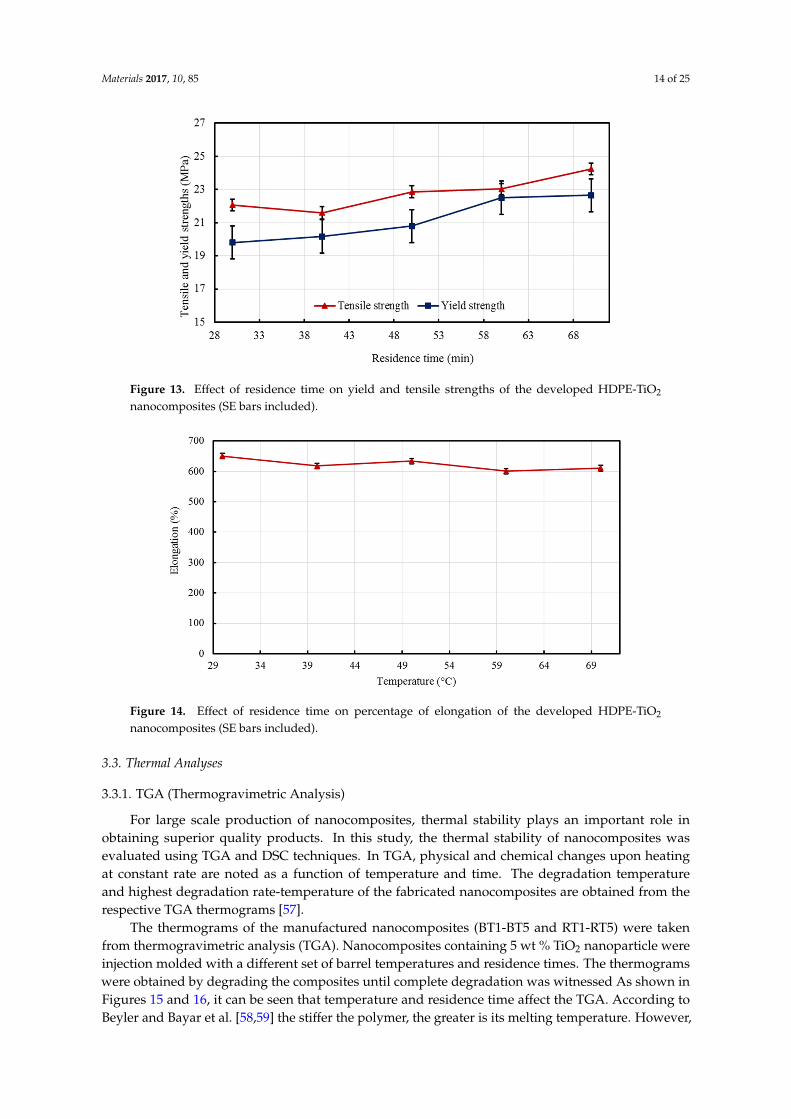
Figure 13 demonstrates the variation of the yield and tensile strengths with barrel residence time.The same slow increasing trends analogous to that of the modulus of elasticity are observed. The yieldstrength of the composites varies with a maximum range of 2.85 MPa, showing negligible variationwhen the residence time was altered.
The tensile strength demonstrates the same trend modulus and yield strength, with a highestvalue of 24.25 MPa and a lowest value of 21.60 MPa.
The percent elongation values of the composites vary within a range of 49.4% (see Figure 14) withresidence time, which is relatively a narrow range. In light of the above results, it can be concludedthat the considered range of residence time (30 min to 70 min) has a minor effect on the mechanicalperformance of HDPE/TiO2 nanocomposites.
In a study performed by Bociaga and Palutkiewicz [26], the injection time (residence time) hadnegligible effect on the mechanical properties of injection molded HDPE parts. Zhil’tsova et al. [24]also performed a similar study to understand the effects of different processing conditions on injectionmolded HDPE acetabular cups. Their results revealed that when the injection time was reduced,the cups obtained were of lower weight [24].
Materials 2017, 10, 85 14 of 25Materials 2017, 10, 85 14 of 24
Figure 13. Effect of residence time on yield and tensile strengths of the developed HDPE-TiO2 nanocomposites (SE bars included).
Figure 14. Effect of residence time on percentage of elongation of the developed HDPE-TiO2 nanocomposites (SE bars included).
3.3. Thermal Analyses
3.3.1. TGA (Thermogravimetric Analysis)
For large scale production of nanocomposites, thermal stability plays an important role in obtaining superior quality products. In this study, the thermal stability of nanocomposites was evaluated using TGA and DSC techniques. In TGA, physical and chemical changes upon heating at constant rate are noted as a function of temperature and time. The degradation temperature and highest degradation rate-temperature of the fabricated nanocomposites are obtained from the respective TGA thermograms [57].
The thermograms of the manufactured nanocomposites (BT1-BT5 and RT1-RT5) were taken from thermogravimetric analysis (TGA). Nanocomposites containing 5 wt % TiO2 nanoparticle were injection molded with a different set of barrel temperatures and residence times. The thermograms were obtained by degrading the composites until complete degradation was witnessed As shown in Figures 15 and 16, it can be seen that temperature and residence time affect the TGA. According to Beyler and Bayar et al. [58,59] the stiffer the polymer, the greater is its melting temperature. However,
Figure 13. Effect of residence time on yield and tensile strengths of the developed HDPE-TiO2
nanocomposites (SE bars included).
Materials 2017, 10, 85 14 of 24
Figure 13. Effect of residence time on yield and tensile strengths of the developed HDPE-TiO2 nanocomposites (SE bars included).
Figure 14. Effect of residence time on percentage of elongation of the developed HDPE-TiO2 nanocomposites (SE bars included).
3.3. Thermal Analyses
3.3.1. TGA (Thermogravimetric Analysis)
For large scale production of nanocomposites, thermal stability plays an important role in obtaining superior quality products. In this study, the thermal stability of nanocomposites was evaluated using TGA and DSC techniques. In TGA, physical and chemical changes upon heating at constant rate are noted as a function of temperature and time. The degradation temperature and highest degradation rate-temperature of the fabricated nanocomposites are obtained from the respective TGA thermograms [57].
The thermograms of the manufactured nanocomposites (BT1-BT5 and RT1-RT5) were taken from thermogravimetric analysis (TGA). Nanocomposites containing 5 wt % TiO2 nanoparticle were injection molded with a different set of barrel temperatures and residence times. The thermograms were obtained by degrading the composites until complete degradation was witnessed As shown in Figures 15 and 16, it can be seen that temperature and residence time affect the TGA. According to Beyler and Bayar et al. [58,59] the stiffer the polymer, the greater is its melting temperature. However,
Figure 14. Effect of residence time on percentage of elongation of the developed HDPE-TiO2
nanocomposites (SE bars included).
3.3. Thermal Analyses
3.3.1. TGA (Thermogravimetric Analysis)
For large scale production of nanocomposites, thermal stability plays an important role inobtaining superior quality products. In this study, the thermal stability of nanocomposites wasevaluated using TGA and DSC techniques. In TGA, physical and chemical changes upon heatingat constant rate are noted as a function of temperature and time. The degradation temperatureand highest degradation rate-temperature of the fabricated nanocomposites are obtained from therespective TGA thermograms [57].
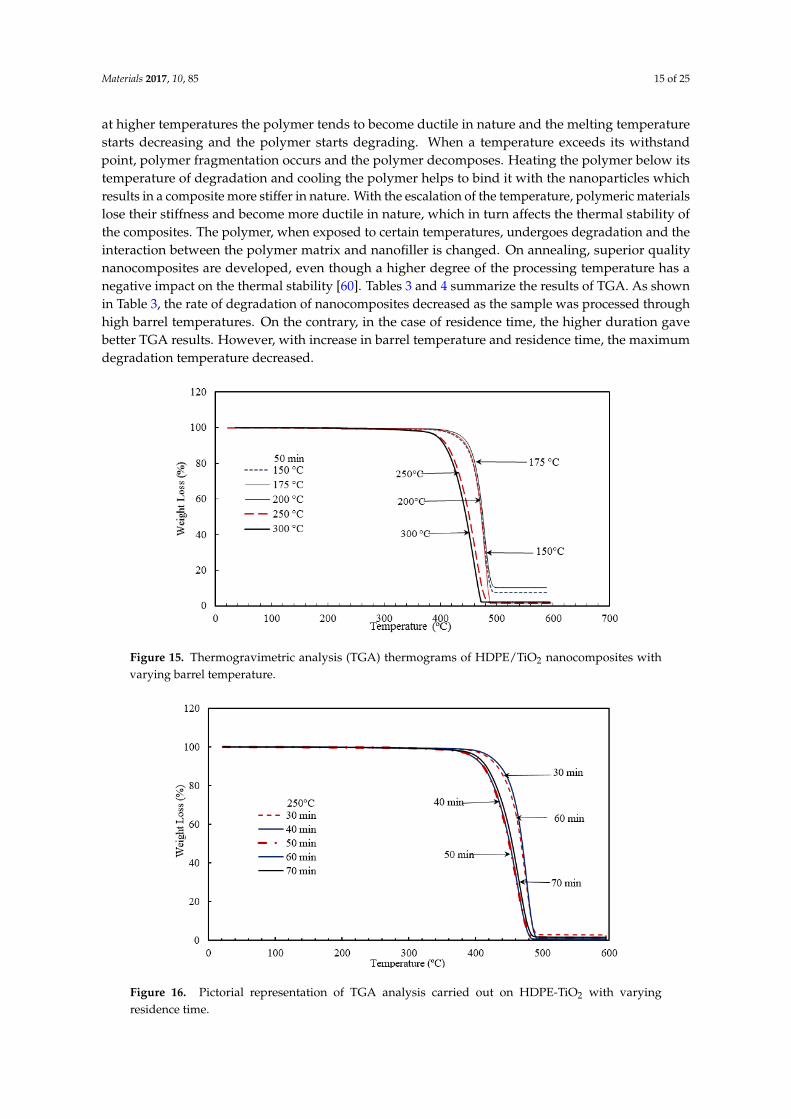
The thermograms of the manufactured nanocomposites (BT1-BT5 and RT1-RT5) were takenfrom thermogravimetric analysis (TGA). Nanocomposites containing 5 wt % TiO2 nanoparticle wereinjection molded with a different set of barrel temperatures and residence times. The thermogramswere obtained by degrading the composites until complete degradation was witnessed As shown inFigures 15 and 16, it can be seen that temperature and residence time affect the TGA. According toBeyler and Bayar et al. [58,59] the stiffer the polymer, the greater is its melting temperature. However,
Materials 2017, 10, 85 15 of 25
at higher temperatures the polymer tends to become ductile in nature and the melting temperaturestarts decreasing and the polymer starts degrading. When a temperature exceeds its withstandpoint, polymer fragmentation occurs and the polymer decomposes. Heating the polymer below itstemperature of degradation and cooling the polymer helps to bind it with the nanoparticles whichresults in a composite more stiffer in nature. With the escalation of the temperature, polymeric materialslose their stiffness and become more ductile in nature, which in turn affects the thermal stability ofthe composites. The polymer, when exposed to certain temperatures, undergoes degradation and theinteraction between the polymer matrix and nanofiller is changed. On annealing, superior qualitynanocomposites are developed, even though a higher degree of the processing temperature has anegative impact on the thermal stability [60]. Tables 3 and 4 summarize the results of TGA. As shownin Table 3, the rate of degradation of nanocomposites decreased as the sample was processed throughhigh barrel temperatures. On the contrary, in the case of residence time, the higher duration gavebetter TGA results. However, with increase in barrel temperature and residence time, the maximumdegradation temperature decreased.
Materials 2017, 10, 85 15 of 24
at higher temperatures the polymer tends to become ductile in nature and the melting temperature starts decreasing and the polymer starts degrading. When a temperature exceeds its withstand point, polymer fragmentation occurs and the polymer decomposes. Heating the polymer below its temperature of degradation and cooling the polymer helps to bind it with the nanoparticles which results in a composite more stiffer in nature. With the escalation of the temperature, polymeric materials lose their stiffness and become more ductile in nature, which in turn affects the thermal stability of the composites. The polymer, when exposed to certain temperatures, undergoes degradation and the interaction between the polymer matrix and nanofiller is changed. On annealing, superior quality nanocomposites are developed, even though a higher degree of the processing temperature has a negative impact on the thermal stability [60]. Tables 3 and 4 summarize the results of TGA. As shown in Table 3, the rate of degradation of nanocomposites decreased as the sample was processed through high barrel temperatures. On the contrary, in the case of residence time, the higher duration gave better TGA results. However, with increase in barrel temperature and residence time, the maximum degradation temperature decreased.
Figure 15. Thermogravimetric analysis (TGA) thermograms of HDPE/TiO2 nanocomposites with varying barrel temperature.
Figure 16. Pictorial representation of TGA analysis carried out on HDPE-TiO2 with varying residence time.
Figure 15. Thermogravimetric analysis (TGA) thermograms of HDPE/TiO2 nanocomposites withvarying barrel temperature.
Materials 2017, 10, 85 15 of 24
at higher temperatures the polymer tends to become ductile in nature and the melting temperature starts decreasing and the polymer starts degrading. When a temperature exceeds its withstand point, polymer fragmentation occurs and the polymer decomposes. Heating the polymer below its temperature of degradation and cooling the polymer helps to bind it with the nanoparticles which results in a composite more stiffer in nature. With the escalation of the temperature, polymeric materials lose their stiffness and become more ductile in nature, which in turn affects the thermal stability of the composites. The polymer, when exposed to certain temperatures, undergoes degradation and the interaction between the polymer matrix and nanofiller is changed. On annealing, superior quality nanocomposites are developed, even though a higher degree of the processing temperature has a negative impact on the thermal stability [60]. Tables 3 and 4 summarize the results of TGA. As shown in Table 3, the rate of degradation of nanocomposites decreased as the sample was processed through high barrel temperatures. On the contrary, in the case of residence time, the higher duration gave better TGA results. However, with increase in barrel temperature and residence time, the maximum degradation temperature decreased.
Figure 15. Thermogravimetric analysis (TGA) thermograms of HDPE/TiO2 nanocomposites with varying barrel temperature.
Figure 16. Pictorial representation of TGA analysis carried out on HDPE-TiO2 with varying residence time.
Figure 16. Pictorial representation of TGA analysis carried out on HDPE-TiO2 with varyingresidence time.

Materials 2017, 10, 85 16 of 25
Table 3. Summary of thermogravimetric analysis (TGA) results showing the effect of barrel temperatureon the degradation and the highest rate degradation temperatures of the fabricated nanocomposites.
Sample Designation Barrel Temperature (◦C) Degradation Temperature(Td) (◦C)
Highest DegradationTemperature (Tdh) (◦C)
1 BT1 150 458.0 488.32 BT2 175 459.5 488.73 BT3 200 433.1 481.24 BT4 250 424.6 478.45 BT5 300 423.5 478.4
Table 4. Summary of TGA results showing the effect of barrel temperature on the degradation and thehighest rate degradation temperatures of the fabricated nanocomposites.
Sample Designation Residence Time (min) Degradation Temperature(Td) (◦C)
Highest Rate DegradationTemperature (Tdh) (◦C)
1 RT1 30 450.4 485.82 RT2 40 426.8 480.73 RT3 50 424.5 478.44 RT4 60 454.9 486.95 RT5 70 431.1 479.5
Ranjusha et al. [41] investigated the influence of molding temperature on the injected moldedcomposites and reported that with increase in temperature from 180 to 200 ◦C, decrease in thermalstability was observed. In another research, Boey et al. [58] found that at lower temperature andshorter residence time, complete melting of polymer and blending of fillers may not be achieved.On the contrary, Davis et al. [61] established that melt blending of poly(ethylene terephthalate) claynanocomposites for longer duration and higher screw speed resulted in low quality products.
To conclude, the highest rate degradation temperature of nanocomposites was 459.5 ◦C, whichwas obtained at 175 ◦C temperature and 50 min residence time. As mentioned above, initially thepolymers, under the influence of temperature, melt and a certain amount of degradation takes place.On annealing, polymer will bind with nanoparticles which in turn results in better thermal stability.However, when processing conditions exceed the limit, polymer degradation becomes irreversible andsignificant changes occur in the structure of the material. The polymer loses its properties and leads tofragmentation [60,62]. In this study, it was noticed that the degradation temperature approximatelyreduced by 34.5 ◦C with the increase of barrel temperature from 150 to 300 ◦C. Similarly, in case ofresidence time, with escalation of time from 30 to 70 min, there was a decrease of 19 ◦C in degradationtemperature. This decrease in thermal stability can be attributed to the fact that as the durationincreases. the polymer has a longer time to melt and degrade. This irreversible degradation can be oneof the reasons for the decrease in thermal stability with increase in residence time [60,63].
3.3.2. DSC (Differential Scanning Calorimetry)
In designing the polymeric nanocomposites, tuning the operating conditions becomes extremelycrucial to ensure efficient dispersion of nanofillers in the polymeric matrix. For example, each polymerhas its own degradation temperature and while choosing the operating conditions, it is very importantto choose a temperature lower than its degradation temperature and follow a method that enhances thethermal stability of the nanocomposites [64]. Hence, differential scanning calorimetry was usedto obtain the melting and crystallization temperature of nanocomposites along with the degreeof crystallinity.
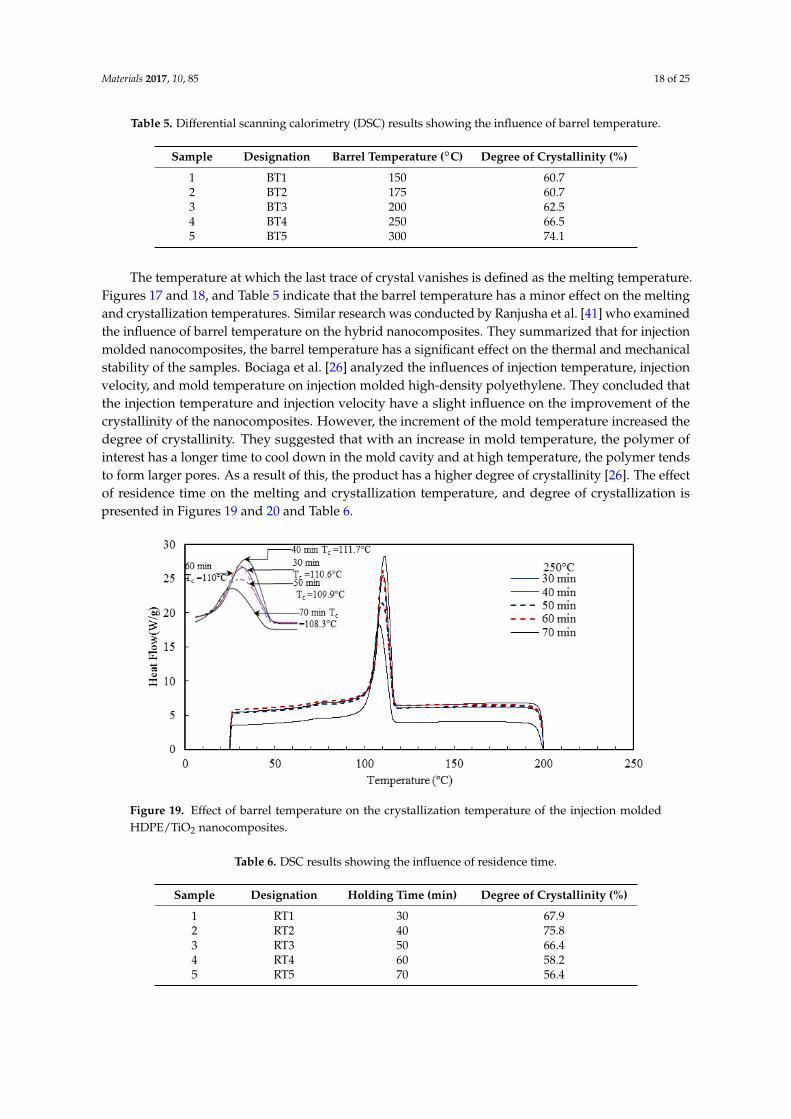
In the current work, the DSC curves for polymeric nanocomposites were generated fordifferent barrel temperatures (BT1–BT5) and residence time (RT1–RT5) under a nitrogen atmosphere.Figures 17 and 18 are the pictorial representation of the DSC melting and cooling curves generatedunder different barrel temperatures. Table 5 summarizes the values of some of the kinetic parameters

Materials 2017, 10, 85 17 of 25
(e.g., the melting and crystallization temperatures and degree of crystallinity). The results reveal that,the melting and cooling curves of the nanocomposites have not been affected significantly by the rangeof barrel temperatures studied. Increasing the barrel temperature from 150 ◦C to 300 ◦C leads to ageneral slow increasing trend in the rate of crystallization (from 60.7% to 74.1%). Similar results werereported by Hedesiu et al. [65], on studying the effect of temperature on high-density polyethylene.They postulated that, with an increase in temperature, the molecular movement of polymers began toshift from amorphous to lamellae surface. On annealing, there is a shift in the reorganization of theamorphous and the crystallization region, this in turn, boosts the arrangement of the crystallizationorder. Due to regular shifts in the amorphous region, the thickness of the amorphous area reduced,as a result of which more crystals were exposed [65].
Materials 2017, 10, 85 17 of 24
the melting and crystallization temperatures and degree of crystallinity). The results reveal that, the melting and cooling curves of the nanocomposites have not been affected significantly by the range of barrel temperatures studied. Increasing the barrel temperature from 150 °C to 300 °C leads to a general slow increasing trend in the rate of crystallization (from 60.7% to 74.1%). Similar results were reported by Hedesiu et al. [65], on studying the effect of temperature on high-density polyethylene. They postulated that, with an increase in temperature, the molecular movement of polymers began to shift from amorphous to lamellae surface. On annealing, there is a shift in the reorganization of the amorphous and the crystallization region, this in turn, boosts the arrangement of the crystallization order. Due to regular shifts in the amorphous region, the thickness of the amorphous area reduced, as a result of which more crystals were exposed [65].
Figure 17. Effect of barrel temperature on the crystallization temperature of the injection molded HDPE/TiO2 nanocomposites.
Figure 18. Effect of barrel temperature on the melting temperature of the injection molded HDPE/TiO2 nanocomposites.
Figure 17. Effect of barrel temperature on the crystallization temperature of the injection moldedHDPE/TiO2 nanocomposites.
Materials 2017, 10, 85 17 of 24
the melting and crystallization temperatures and degree of crystallinity). The results reveal that, the melting and cooling curves of the nanocomposites have not been affected significantly by the range of barrel temperatures studied. Increasing the barrel temperature from 150 °C to 300 °C leads to a general slow increasing trend in the rate of crystallization (from 60.7% to 74.1%). Similar results were reported by Hedesiu et al. [65], on studying the effect of temperature on high-density polyethylene. They postulated that, with an increase in temperature, the molecular movement of polymers began to shift from amorphous to lamellae surface. On annealing, there is a shift in the reorganization of the amorphous and the crystallization region, this in turn, boosts the arrangement of the crystallization order. Due to regular shifts in the amorphous region, the thickness of the amorphous area reduced, as a result of which more crystals were exposed [65].
Figure 17. Effect of barrel temperature on the crystallization temperature of the injection molded HDPE/TiO2 nanocomposites.
Figure 18. Effect of barrel temperature on the melting temperature of the injection molded HDPE/TiO2 nanocomposites.
Figure 18. Effect of barrel temperature on the melting temperature of the injection moldedHDPE/TiO2 nanocomposites.
Materials 2017, 10, 85 18 of 25
Table 5. Differential scanning calorimetry (DSC) results showing the influence of barrel temperature.
Sample Designation Barrel Temperature (◦C) Degree of Crystallinity (%)
1 BT1 150 60.72 BT2 175 60.73 BT3 200 62.54 BT4 250 66.55 BT5 300 74.1
The temperature at which the last trace of crystal vanishes is defined as the melting temperature.Figures 17 and 18, and Table 5 indicate that the barrel temperature has a minor effect on the meltingand crystallization temperatures. Similar research was conducted by Ranjusha et al. [41] who examinedthe influence of barrel temperature on the hybrid nanocomposites. They summarized that for injectionmolded nanocomposites, the barrel temperature has a significant effect on the thermal and mechanicalstability of the samples. Bociaga et al. [26] analyzed the influences of injection temperature, injectionvelocity, and mold temperature on injection molded high-density polyethylene. They concluded thatthe injection temperature and injection velocity have a slight influence on the improvement of thecrystallinity of the nanocomposites. However, the increment of the mold temperature increased thedegree of crystallinity. They suggested that with an increase in mold temperature, the polymer ofinterest has a longer time to cool down in the mold cavity and at high temperature, the polymer tendsto form larger pores. As a result of this, the product has a higher degree of crystallinity [26]. The effectof residence time on the melting and crystallization temperature, and degree of crystallization ispresented in Figures 19 and 20 and Table 6.
Materials 2017, 10, 85 18 of 24
Table 5. Differential scanning calorimetry (DSC) results showing the influence of barrel temperature.
Sample Designation Barrel Temperature (°C) Degree of Crystallinity (%) 1 BT1 150 60.7 2 BT2 175 60.7 3 BT3 200 62.5 4 BT4 250 66.5 5 BT5 300 74.1
The temperature at which the last trace of crystal vanishes is defined as the melting temperature. Figures 17 and 18, and Table 5 indicate that the barrel temperature has a minor effect on the melting and crystallization temperatures. Similar research was conducted by Ranjusha et al. [41] who examined the influence of barrel temperature on the hybrid nanocomposites. They summarized that for injection molded nanocomposites, the barrel temperature has a significant effect on the thermal and mechanical stability of the samples. Bociaga et al. [26] analyzed the influences of injection temperature, injection velocity, and mold temperature on injection molded high-density polyethylene. They concluded that the injection temperature and injection velocity have a slight influence on the improvement of the crystallinity of the nanocomposites. However, the increment of the mold temperature increased the degree of crystallinity. They suggested that with an increase in mold temperature, the polymer of interest has a longer time to cool down in the mold cavity and at high temperature, the polymer tends to form larger pores. As a result of this, the product has a higher degree of crystallinity [26]. The effect of residence time on the melting and crystallization temperature, and degree of crystallization is presented in Figures 19 and 20 and Table 6.
Figure 19. Effect of barrel temperature on the crystallization temperature of the injection molded HDPE/TiO2 nanocomposites.
Table 6. DSC results showing the influence of residence time.
Sample Designation Holding Time (min) Degree of Crystallinity (%) 1 RT1 30 67.9 2 RT2 40 75.8 3 RT3 50 66.4 4 RT4 60 58.2 5 RT5 70 56.4
Figure 19. Effect of barrel temperature on the crystallization temperature of the injection moldedHDPE/TiO2 nanocomposites.
Table 6. DSC results showing the influence of residence time.
Sample Designation Holding Time (min) Degree of Crystallinity (%)
1 RT1 30 67.92 RT2 40 75.83 RT3 50 66.44 RT4 60 58.25 RT5 70 56.4
Materials 2017, 10, 85 19 of 25Materials 2017, 10, 85 19 of 24
Figure 20. Effect of residence time on the melting temperature of the injection molded nanocomposites.
Influence of TiO2 on the crystal morphology of HDPE was also evaluated using X-ray powder diffraction (XRD). It is a powerful technique in determining the crystal’s interplanar distances, size and its structure [18,66].
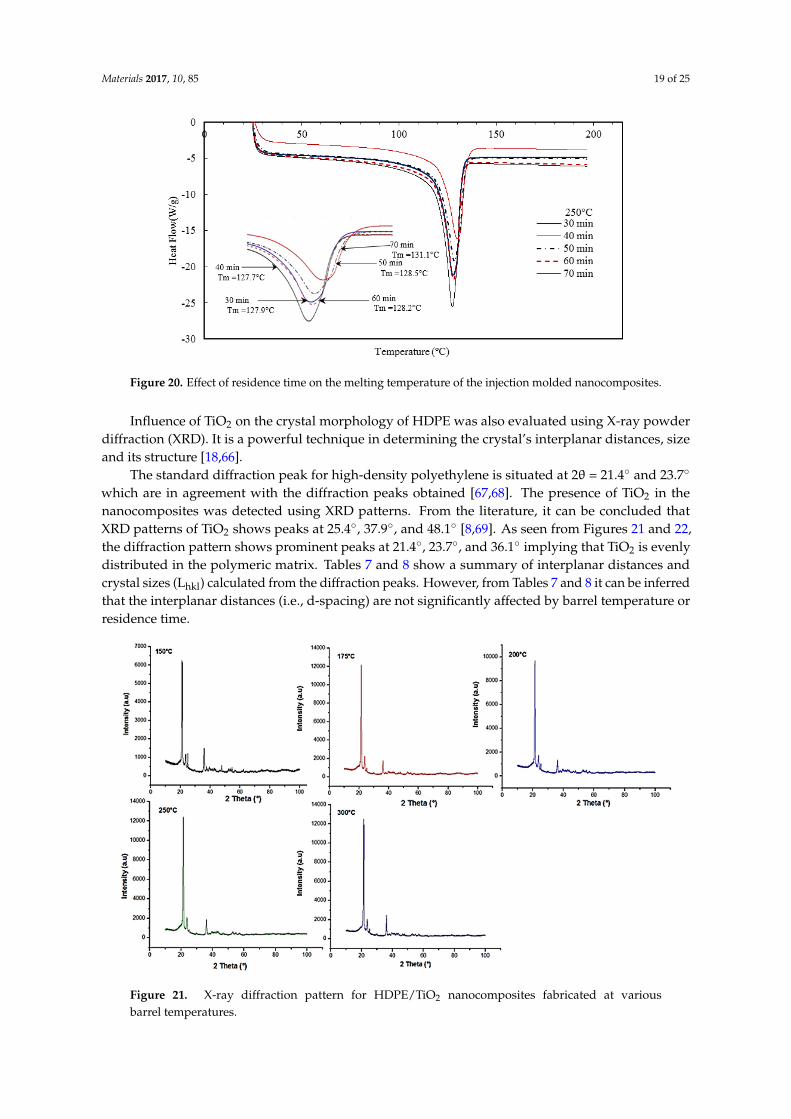
The standard diffraction peak for high-density polyethylene is situated at 2θ = 21.4° and 23.7° which are in agreement with the diffraction peaks obtained [67,68]. The presence of TiO2 in the nanocomposites was detected using XRD patterns. From the literature, it can be concluded that XRD patterns of TiO2 shows peaks at 25.4°, 37.9°, and 48.1° [8,69]. As seen from Figures 21 and 22, the diffraction pattern shows prominent peaks at 21.4°, 23.7°, and 36.1° implying that TiO2 is evenly distributed in the polymeric matrix. Tables 7 and 8 show a summary of interplanar distances and crystal sizes (Lhkl) calculated from the diffraction peaks. However, from Tables 7 and 8 it can be inferred that the interplanar distances (i.e., d-spacing) are not significantly affected by barrel temperature or residence time.
Figure 21. X-ray diffraction pattern for HDPE/TiO2 nanocomposites fabricated at various barrel temperatures.
Figure 20. Effect of residence time on the melting temperature of the injection molded nanocomposites.
Influence of TiO2 on the crystal morphology of HDPE was also evaluated using X-ray powderdiffraction (XRD). It is a powerful technique in determining the crystal’s interplanar distances, sizeand its structure [18,66].
The standard diffraction peak for high-density polyethylene is situated at 2θ = 21.4◦ and 23.7◦
which are in agreement with the diffraction peaks obtained [67,68]. The presence of TiO2 in thenanocomposites was detected using XRD patterns. From the literature, it can be concluded thatXRD patterns of TiO2 shows peaks at 25.4◦, 37.9◦, and 48.1◦ [8,69]. As seen from Figures 21 and 22,the diffraction pattern shows prominent peaks at 21.4◦, 23.7◦, and 36.1◦ implying that TiO2 is evenlydistributed in the polymeric matrix. Tables 7 and 8 show a summary of interplanar distances andcrystal sizes (Lhkl) calculated from the diffraction peaks. However, from Tables 7 and 8 it can be inferredthat the interplanar distances (i.e., d-spacing) are not significantly affected by barrel temperature orresidence time.
Materials 2017, 10, 85 19 of 24
Figure 20. Effect of residence time on the melting temperature of the injection molded nanocomposites.
Influence of TiO2 on the crystal morphology of HDPE was also evaluated using X-ray powder diffraction (XRD). It is a powerful technique in determining the crystal’s interplanar distances, size and its structure [18,66].
The standard diffraction peak for high-density polyethylene is situated at 2θ = 21.4° and 23.7° which are in agreement with the diffraction peaks obtained [67,68]. The presence of TiO2 in the nanocomposites was detected using XRD patterns. From the literature, it can be concluded that XRD patterns of TiO2 shows peaks at 25.4°, 37.9°, and 48.1° [8,69]. As seen from Figures 21 and 22, the diffraction pattern shows prominent peaks at 21.4°, 23.7°, and 36.1° implying that TiO2 is evenly distributed in the polymeric matrix. Tables 7 and 8 show a summary of interplanar distances and crystal sizes (Lhkl) calculated from the diffraction peaks. However, from Tables 7 and 8 it can be inferred that the interplanar distances (i.e., d-spacing) are not significantly affected by barrel temperature or residence time.
Figure 21. X-ray diffraction pattern for HDPE/TiO2 nanocomposites fabricated at various barrel temperatures.
Figure 21. X-ray diffraction pattern for HDPE/TiO2 nanocomposites fabricated at variousbarrel temperatures.
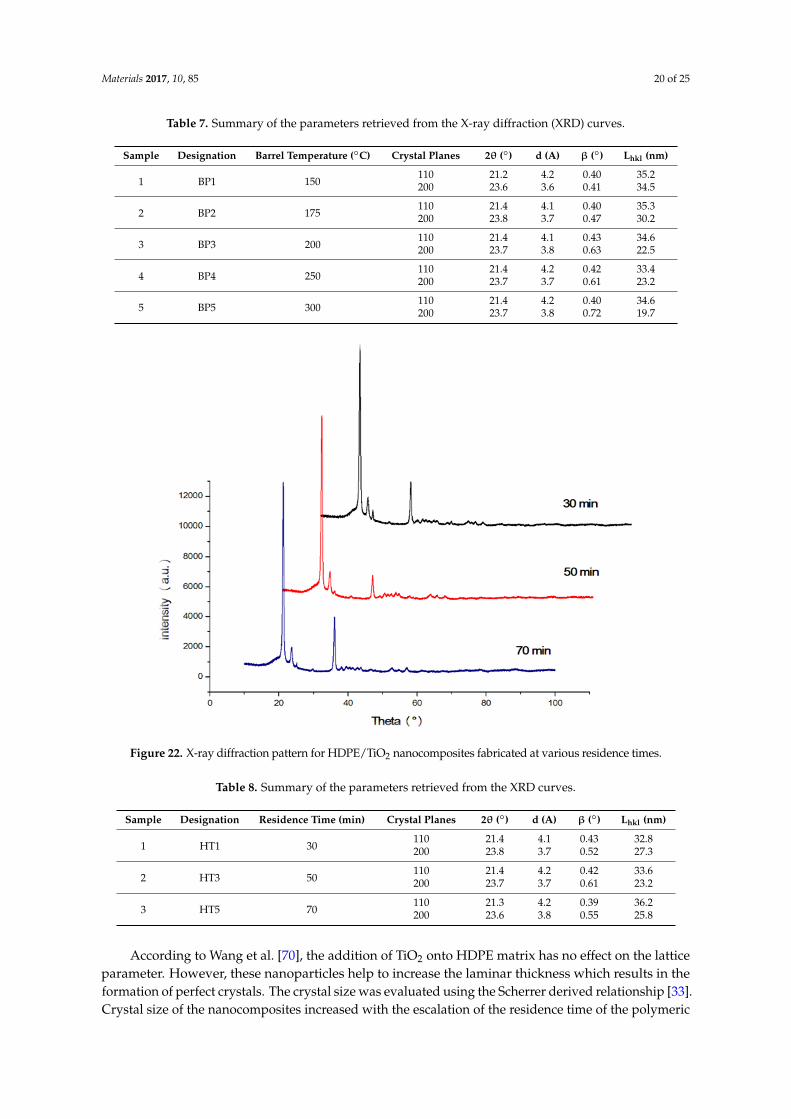
Materials 2017, 10, 85 20 of 25
Table 7. Summary of the parameters retrieved from the X-ray diffraction (XRD) curves.
Sample Designation Barrel Temperature (◦C) Crystal Planes 2θ (◦) d (A) β (◦) Lhkl (nm)
1 BP1 150110 21.2 4.2 0.40 35.2200 23.6 3.6 0.41 34.5
2 BP2 175110 21.4 4.1 0.40 35.3200 23.8 3.7 0.47 30.2
3 BP3 200110 21.4 4.1 0.43 34.6200 23.7 3.8 0.63 22.5
4 BP4 250110 21.4 4.2 0.42 33.4200 23.7 3.7 0.61 23.2
5 BP5 300110 21.4 4.2 0.40 34.6200 23.7 3.8 0.72 19.7
Materials 2017, 10, 85 20 of 24
Table 7. Summary of the parameters retrieved from the X-ray diffraction (XRD) curves.
Sample Designation Barrel Temperature (°C) Crystal Planes 2Ɵ (°) d (A) β (°) Lhkl (nm)
1 BP1 150 110 21.2 4.2 0.40 35.2 200 23.6 3.6 0.41 34.5
2 BP2 175 110 21.4 4.1 0.40 35.3 200 23.8 3.7 0.47 30.2
3 BP3 200 110 21.4 4.1 0.43 34.6 200 23.7 3.8 0.63 22.5
4 BP4 250 110 21.4 4.2 0.42 33.4 200 23.7 3.7 0.61 23.2
5 BP5 300 110 21.4 4.2 0.40 34.6 200 23.7 3.8 0.72 19.7
Figure 22. X-ray diffraction pattern for HDPE/TiO2 nanocomposites fabricated at various residence times.
Table 8. Summary of the parameters retrieved from the XRD curves.
Sample Designation Residence Time (min) Crystal Planes 2Ɵ (°) d (A) β (°) Lhkl (nm)
1 HT1 30 110 21.4 4.1 0.43 32.8 200 23.8 3.7 0.52 27.3
2 HT3 50 110 21.4 4.2 0.42 33.6 200 23.7 3.7 0.61 23.2
3 HT5 70 110 21.3 4.2 0.39 36.2 200 23.6 3.8 0.55 25.8
According to Wang et al. [70], the addition of TiO2 onto HDPE matrix has no effect on the lattice parameter. However, these nanoparticles help to increase the laminar thickness which results in the formation of perfect crystals. The crystal size was evaluated using the Scherrer derived relationship [33]. Crystal size of the nanocomposites increased with the escalation of the residence time of the polymeric mixture in the barrel (Table 7). However, the rise in barrel temperature had an adverse
Figure 22. X-ray diffraction pattern for HDPE/TiO2 nanocomposites fabricated at various residence times.
Table 8. Summary of the parameters retrieved from the XRD curves.
Sample Designation Residence Time (min) Crystal Planes 2θ (◦) d (A) β (◦) Lhkl (nm)
1 HT1 30110 21.4 4.1 0.43 32.8200 23.8 3.7 0.52 27.3
2 HT3 50110 21.4 4.2 0.42 33.6200 23.7 3.7 0.61 23.2
3 HT5 70110 21.3 4.2 0.39 36.2200 23.6 3.8 0.55 25.8
According to Wang et al. [70], the addition of TiO2 onto HDPE matrix has no effect on the latticeparameter. However, these nanoparticles help to increase the laminar thickness which results in theformation of perfect crystals. The crystal size was evaluated using the Scherrer derived relationship [33].Crystal size of the nanocomposites increased with the escalation of the residence time of the polymeric

Materials 2017, 10, 85 21 of 25
mixture in the barrel (Table 7). However, the rise in barrel temperature had an adverse effect on thecrystal size (Lhkl) (Table 8). Decrease in crystal size can be postulated in such way that with highertemperature and shorter residence time, the formation of cross-link bond, reorganization, and chainfolding between polymers during the crystallization process is hindered, resulting in a distorted latticeand incomplete crystals [70].
From XRD patterns, it can be concluded that the nanocomposites had an even dispersion ofnanoparticles in the polymeric matrix irrespective of barrel temperature and retention time. For crystalplane 110, with increase in barrel temperature from 150 ◦C to 300 ◦C the crystallite size decreased from35.2 to 34.6, in turn indicating the formation of perfect crystals.
4. Conclusions
Nano-sized titanium dioxide enriched HDPE nanocomposites were fabricated through injectionmolding using dumbbell shaped inserts. In the injection molding process, the two main controlvariables are the barrel temperature and the residence time. Hence this study aimed to comparethe nanocomposites’ mechanical, thermal, and structural properties obtained by changing theseoperating parameters. The SEM-EDS, FTIR, and XRD results confirmed the uniform distribution ofTiO2 nanoparticles on the surface of the matrix. The degradation temperature decreased with anincrease in the barrel temperature and residence time, however, the rate of crystallization showed aconsistent rise in both cases; rate of crystallization was increased up to 75%.
The results revealed that there is no specific barrel temperature or residence time as an optimumvalue; for such nanomaterials, a range of temperature (150 ◦C–300 ◦C) can be considered formanufacturing these nanocomposites. However, the authors recommend researchers to use anoperating barrel temperature lower than 300 ◦C since the polymer’s initial degradation temperature isabout 424–460 ◦C. When samples were processed at temperatures around 300 ◦C, black spots wereobserved on the injection molded nanocomposites. Lastly, it is also recommended to use a temperaturehigher than 150 ◦C for easy material flow while injection molding. To conclude, the effect of varyingthe injection molding process parameters was studied and a wide range of barrel temperature andresidence times can be used depending on the specific needs of the application.
Acknowledgments: Authors would like to acknowledge UPAR (UAEU-NRF) research grant for this research.Authors would also like to thank Eng. Abdul Sattar for his help in mechanical characterization work and PrashanthSankaranarayanan (Laboratory Technician, Petroleum Geoscience, The Petroleum Institute, Abu Dhabi) for hisassistance in the SEM-EDS analyses.
Author Contributions: M.S.M. and A.H.I.M. conceived and designed the experiments; A.M., H.P. and U.M.K.performed the experiments; M.S.M. and A.H.I.M. analyzed the data; U.M.K. contributed reagents/materials/analysistools, and A.H.I.M., M.S.M., A.M. and H.P. wrote the paper.
Conflicts of Interest: The authors declare no conflict of interest.
References
1. Kothalkar, A.; Sharma, A.S.; Biswas, K.; Basu, B. Novel HDPE–quasicrystal composite fabricated for wearresistance. Philos. Mag. 2011, 91, 2944–2953. [CrossRef]
2. Mourad, A.-H.I.; Fouad, H.; Elleithy, R. Impact of some environmental conditions on the tensile,creep-recovery, relaxation, melting and crystallinity behaviour of UHMWPE-GUR 410-medical grade.Mater. Des. 2009, 30, 4112–4119. [CrossRef]
3. Tripathi, G.; Basu, B. Injection-molded high-density polyethylene-hydroxyapatite-aluminum oxide hybridcomposites for hard-tissue replacement: Mechanical, biological, and protein adsorption behavior. J. Appl.Polym. Sci. 2012, 124, 2133–2143. [CrossRef]
4. Mohamed, F.H.; Mourad, A.-H.I.; Barton, D.C. UV irradiation and aging effects on nanoscale mechanicalproperties of ultra high molecular weight polyethylene for biomedical implants. Plast. Rubber Compos. 2013,37, 346–352. [CrossRef]
Materials 2017, 10, 85 22 of 25
5. Khan, Z.A.; Kamaruddin, S.; Siddiquee, A.N. Feasibility study of use of recycled High Density Polyethyleneand multi response optimization of injection moulding parameters using combined grey relational andprincipal component analyses. Mater. Des. 2010, 31, 2925–2931. [CrossRef]
6. Nath, S.; Bodhak, S.; Basu, B. HDPE-Al2O3-HAp composites for biomedical applications: Processing andcharacterizations. J. Biomed. Mater. Res. B Appl. Biomater. 2009, 88, 1–11. [CrossRef] [PubMed]
7. Tripathi, G.; Basu, B. In vitro osteogenic cell proliferation, mineralization, and in vivo osseointegrationof injection molded high-density polyethylene-based hybrid composites in rabbit animal model.J. Biomater. Appl. 2014, 29, 142–157. [CrossRef] [PubMed]
8. Li, J.-F.; Xu, Z.-L.; Yang, H.; Yu, L.-Y.; Liu, M. Effect of TiO2 nanoparticles on the surface morphology andperformance of microporous PES membrane. Appl. Surf. Sci. 2009, 255, 4725–4732. [CrossRef]
9. Wang, J.F.; Liu, X.Y.; Luan, B. Fabrication of Ti/polymer biocomposites for load-bearing implant applications.J. Mater. Process. Technol. 2008, 197, 428–433. [CrossRef]
10. Sadi, A.Y.; Shokrgozar, M.A.; Homaeigohar, S.S.; Khavandi, A. Biological evaluation of partially stabilizedzirconia added HA/HDPE composites with osteoblast and fibroblast cell lines. J. Mater. Sci. Mater. Med.2008, 19, 2359–2365. [CrossRef] [PubMed]
11. Fouad, H.; Mourad, A.-H.I.; Barton, D.C. Effect of pre-heat treatment on the static and dynamicthermo-mechanical properties of ultra-high molecular weight polyethylene. Polym. Test. 2005, 24, 549–556.[CrossRef]
12. Alothman, O.Y.; Almajhdi, F.N.; Fouad, H. Effect of gamma radiation and accelerated aging on the mechanicaland thermal behavior of HDPE/HA nano-composites for bone tissue regeneration. Biomed. Eng. Online 2013,12, 95. [CrossRef] [PubMed]
13. Faiz, S.; Anis, A.; Luqman, M.; al Zahrani, S.M. Studies on thermal, mechanical, morphological, andviscoelastic properties of polybenzimidazole fiber reinforced high density polyethylene composites.Polym. Compos. 2016, 37, 5–13. [CrossRef]
14. Mao, Q.; Wyatt, T.P.; Chen, J.; Wang, J. Insert injection molding of high-density polyethylene single-polymercomposites. Polym. Eng. Sci. 2015, 55, 2448–2456. [CrossRef]
15. Tripathi, G.; Gough, J.E.; Dinda, A.; Basu, B. In vitro cytotoxicity and in vivo osseointergration properties ofcompression-molded HDPE-HA-Al2O3 hybrid biocomposites. J. Biomed. Mater. Res. A 2013, 101, 1539–1549.[CrossRef] [PubMed]
16. Pinto, G.; López-gonzález, C.; Jiménez-martín, A. Polymer composites prepared by compression molding ofa mixture of carbon black and nylon 6 powder. Polym. Compos. 1999, 20, 804–808. [CrossRef]
17. Yang, F.; Ou, Y.; Yu, Z. Polyamide 6/silica nanocomposites prepared byin situ polymerization. J. Appl.Polym. Sci. 1998, 69, 355–361. [CrossRef]
18. Kaleel, S.H.A.; Bahuleyan, B.K.; Masihullah, J.; Al-Harthi, M. Thermal and Mechanical Properties ofPolyethylene/Doped-TiO2 Nanocomposites Synthesized Using In Situ Polymerization. J. Nanomater. 2011,2011, e964353.
19. Vetrivel, V.; Rajendran, K.; Kalaiselvi, V. Synthesis and characterization of pure titanium dioxide nanoparticlesby sol- gel method. Int. J. ChemTech Res. 2015, 7, 1090–1097.
20. Wilkie, C.A.; Morgan, A.B. Fire Retardancy of Polymeric Materials, 2nd ed.; CRC Press: Boca Raton, FL,USA, 2009.
21. Callister, W.D.; Rethwisch, D.G. Materials Science and Engineering: An Introduction; Wiley: New York, NY,USA, 2009; p. 992.
22. Liou, A.-C.; Chen, R.-H. Injection molding of polymer micro- and sub-micrometers structures withhigh-aspect ratios. Int. J. Adv. Manuf. Technol. 2005, 28, 1097–1103. [CrossRef]
23. Huang, L.; Wang, Z.; Zheng, G.; Guo, J.Z.; Dai, K.; Liu, C. Enhancing oriented crystals in injection-moldedHDPE through introduction of pre-shear. Mater. Des. 2015, 78, 12–18. [CrossRef]
24. Zhil’tsova, T.V.; Oliveira, M.S.A.; Ferreira, J.A.F. Relative influence of injection molding processing conditionson HDPE acetabular cups dimensional stability. J. Mater. Process. Technol. 2009, 209, 3894–3904. [CrossRef]
25. Pagès, P. Characterization of Polymer Materials Using FT-IR and DSC Techniques; Universidade da Coruña:Coruña, Spain, 2005.
26. Bociaga, E.; Palutkiewicz, P. The influence of injection molding parameters and blowing agent addition onselected properties, surface state, and structure of HDPE parts. Polym. Eng. Sci. 2013, 53, 780–791. [CrossRef]
Materials 2017, 10, 85 23 of 25
27. Mourad, A.-H.I. Thermo-mechanical characteristics of thermally aged polyethylene/polypropylene blends.Mater. Des. 2010, 31, 918–929. [CrossRef]
28. Mourad, A.-H.I.; Akkad, R.O.; Soliman, A.A.; Madkour, T.M. Characterisation of thermally treated anduntreated polyethylene–polypropylene blends using DSC, TGA and IR techniques. Plast. Rubber Compos.2009, 38, 265–278. [CrossRef]
29. Bilewicz, M.; Viana, J.; Dobrzanski, L. Polymer composite strengthening by developed injection mouldingtechnique. Arch. Mater. Sci. Eng. 2008, 30, 69–72.
30. Lizundia, E.; Vilas, J.L.; León, L.M. Crystallization, structural relaxation and thermal degradation inPoly(L-lactide)/cellulose nanocrystal renewable nanocomposites. Carbohydr. Polym. 2015, 123, 256–265.[CrossRef] [PubMed]
31. Fei, P.; Fei, B.; Yu, Y.; Xiong, H.; Tan, J. Thermal properties and crystallization behavior of bamboofiber/high-density polyethylene composites: Nano-TiO2 effects. J. Appl. Polym. Sci. 2014, 131. [CrossRef]
32. Olad, A. Polymer/Clay Nanocomposites. In Advances in Diverse Industrial Applications of Nanocomposites;Reddy, B., Ed.; InTech: Rijeka, Croatia, 2011.
33. Klug, H.P.; Alexander, L.E. X-ray Diffraction Procedures: For Polycrystalline and Amorphous Materials, 2nd ed.;Wiley: Hoboken, NJ, USA, 1974.
34. Rideal, G.R.; Padget, J.C. The thermal-mechanical degradation of high density polyethylene. J. Polym. Sci.Polym. Symp. 2007, 57, 1–15. [CrossRef]
35. Katmer, S.; Karatas, C. Effects of injection molding conditions on residual stress in HDPE and PP parts. J. Fac.Eng. Archit. GAZI Univ. 2015, 30, 319–327.
36. Mozumder, M.S.; Mourad, A.-H.I.; Perinpanayagam, H.; Zhu, J. Nano-SiO2 Enriched Biocompatible PowderCoatings. Mater. Today Proc. 2015, 2, 147–152. [CrossRef]
37. Shi, W.; Mozumder, M.S.; Zhang, H.; Zhu, J. MTA-enriched nanocomposite TiO(2)-polymeric powdercoatings support human mesenchymal cell attachment and growth. Biomed. Mater. 2012, 7, 055006. [CrossRef][PubMed]
38. Mozumder, M.S.; Zhu, J.; Perinpanayagam, H. Titania-polymeric powder coatings with nano-topographysupport enhanced human mesenchymal cell responses. J. Biomed. Mater. Res. A 2012, 100, 2695–2709.[CrossRef] [PubMed]
39. Mozumder, M.S.; Mourad, A.-H.I.; Perinpanayagam, H.; Zhu, J. NanoTiO2-Enriched BiocompatiblePolymeric Powder Coatings: Adhesion, Thermal and Biological Characterizations. Adv. Mater. Res. 2014,995, 113–124. [CrossRef]
40. Hou, N.; Perinpanayagam, H.; Mozumder, M.; Zhu, J. Novel Development of Biocompatible Coatings forBone Implants. Coatings 2015, 5, 737–757. [CrossRef]
41. Ranjusha, J.P.; Anjana, R.; George, K.E. Effect of Moulding Temperature on the Properties ofPolypropylene/High Density Polyethylene/Clay/Glass Fibre Composites. Int. J. Eng. Res. Appl. 2012, 2,1922–1926.
42. FTIR Instrumentation and Theory. Available online: http://chemistry.oregonstate.edu/courses/ch361-464/ch362/irinstrs.htm (accessed on 10 April 2016).
43. Pathak, L.C.; Venkateswarlu, K.; Bandopadhyay, A.; Ray, A.K. Advanced Materials: Proceedings of theIndo-Malaysian Joint Workshop (WAM-2002); Allied Publishers: New Delhi, India, 2003.
44. IR Absorption Table. Available online: http://www.chem.ucla.edu/~webspectra/irtable.html (accessed on6 March 2016).
45. Raza, M.; Bachinger, A.; Zahn, N.; Kickelbick, G. Interaction and UV-Stability of Various Organic CappingAgents on the Surface of Anatase Nanoparticles. Materials 2014, 7, 2890–2912. [CrossRef]
46. Fasano, M.; Bigdeli, M.B.; Sereshk, M.R.V.; Chiavazzo, E.; Asinari, P. Thermal transmittance of carbonnanotube networks: Guidelines for novel thermal storage systems and polymeric material of thermal interest.Renew. Sustain. Energy Rev. 2015, 41, 1028–1036. [CrossRef]
47. Sotomayor, M.E.; Krupa, I.; Várez, A.; Levenfeld, B. Thermal and mechanical characterization of injectionmoulded high density polyethylene/paraffin wax blends as phase change materials. Renew. Energy 2014, 68,140–145. [CrossRef]
48. Kumar, B.R.B.; Doddamani, M.; Zeltmann, S.E.; Gupta, N.; Ramesh, M.R.; Ramakrishna, S. Processing ofcenosphere/HDPE syntactic foams using an industrial scale polymer injection molding machine. Mater. Des.2016, 92, 414–423.
Materials 2017, 10, 85 24 of 25
49. Pegoretti, A.P.A.; Dorigato, A. Tensile mechanical response of polyethylene—Clay nanocomposites.eXPRESS Polym. Lett. 2007, 1, 123–131. [CrossRef]
50. Bartczak, Z.; Argon, A.; Cohen, R.; Weinberg, M. Toughness mechanism in semi-crystalline polymer blends:II. High-density polyethylene toughened with calcium carbonate filler particles. Polymer 1999, 40, 2347–2365.[CrossRef]
51. Su, R.; Wang, K.; Zhang, Q.; Chen, F.; Fu, Q. Effect of melt temperature on the phase morphology, thermalbehavior and mechanical properties of injection-molded PP/LLDPE blends. Chin. J. Polym. Sci. 2010, 28,249–255. [CrossRef]
52. Zhou, Y.; Mallick, P.K. Effects of melt temperature and hold pressure on the tensile and fatigue properties ofan injection molded talc-filled polypropylene. Polym. Eng. Sci. 2005, 45, 755–763. [CrossRef]
53. Mourad, A.-H.I.; Bekheet, N.; El-Butch, A.; Abdel-Latif, L.; Nafee, D.; Barton, D.C. The effects of processparameters on the mechanical properties of die drawn polypropylene. Polym. Test. 2005, 24, 169–180.[CrossRef]
54. Mourad, A.-H.I.; Bekheet, N.; El-Butch, A.; Abdel-Latif, L.; Nafee, D. Effect of Die Drawing Process on theMechanical Behaviour of Polypropylene. Key Eng. Mater. 2004, 261–263, 1677–1682. [CrossRef]
55. Sepe, M. The Importance of Melt & Mold Temperature: Plastics Technology. 2011. Available online: http://www.ptonline.com/columns/the-importance-of-melt-mold-temperature (accessed on 26 April 2016).
56. Ellingham, S.T.D.; Thompson, T.J.U.; Islam, M. Thermogravimetric analysis of property changes and weightloss in incinerated bone. Palaeogeogr. Palaeoclimatol. Palaeoecol. 2015, 438, 239–244. [CrossRef]
57. Boey, P.; Ho, W.; Bull, S.J. The effect of temperature on the abrasive wear of coatings and hybrid surfacetreatments for injection-moulding machines. Wear 2005, 258, 149–156. [CrossRef]
58. Bayar, S.; Delale, F.; Li, J. Effect of Temperature on Mechanical Properties of Nanoclay-Reinforced PolymericNanocomposites. II: Modeling and Theoretical Predictions. J. Aerosp. Eng. 2014, 27, 505–519. [CrossRef]
59. Leszczynska, A.; Njuguna, J.; Pielichowski, K.; Banerjee, J.R. Polymer/montmorillonite nanocompositeswith improved thermal properties: Part I. Factors influencing thermal stability and mechanisms of thermalstability improvement. Thermochim. Acta 2007, 453, 75–96. [CrossRef]
60. Davis, C.H.; Mathias, L.J.; Gilman, J.W.; Schiraldi, D.A.; Shields, J.R.; Trulove, P.; Sutto, T.E.; Delong, H.C.Effects of melt-processing conditions on the quality of poly(ethylene terephthalate) montmorillonite claynanocomposites. J. Polym. Sci. B Polym. Phys. 2002, 40, 2661–2666. [CrossRef]
61. Da Silva, G.R.; da Silva-Cunha, A.; Behar-Cohen, F., Jr.; Ayres, E.; Oréfice, R.L. Biodegradation ofpolyurethanes and nanocomposites to non-cytotoxic degradation products. Polym. Degrad. Stab. 2010,95, 491–499. [CrossRef]
62. Fang, L.; Leng, Y.; Gao, P. Processing and mechanical properties of HA/UHMWPE nanocomposites.Biomaterials 2006, 27, 3701–3707. [CrossRef] [PubMed]
63. Mittal, V. (Ed.) Surface Modification of Nanotube Fillers; Wiley-VCH Verlag GmbH & Co. KGaA: Weinheim,Germany, 2011; pp. I–XV.
64. Hedesiu, C.; Demco, D.E.; Kleppinger, R.; Buda, A.A.; Blümich, B.; Remerie, K.; Litvinov, V.M. The effect oftemperature and annealing on the phase composition, molecular mobility and the thickness of domains inhigh-density polyethylene. Polymer 2007, 48, 763–777. [CrossRef]
65. Sampath, S.; Isdebski, T.; Jenkins, J.E.; Ayon, J.V.; Henning, R.W.; Orgel, J.P.R.O.; Antipoa, O.; Yarger, J.L.X-ray diffraction study of nanocrystalline and amorphous structure within major and minor ampullatedragline spider silks. Soft Matter 2012, 8, 6713–6722. [CrossRef] [PubMed]
66. Han, G.; Lei, Y.; Wu, Q.; Kojima, Y.; Suzuki, S. Bamboo–Fiber Filled High Density Polyethylene Composites:Effect of Coupling Treatment and Nanoclay. J. Polym. Environ. 2008, 16, 123–130. [CrossRef]
67. Jafarzadeh, R.Y.Y. Effect of TiO2 nanoparticles on structure and properties of high density polyethylenemembranes prepared by thermally induced phase separation method. Polym. Adv. Technol. 2015, 26, 392–398.[CrossRef]
68. Vatanpour, V.; Madaeni, S.S.; Khataee, A.R.; Salehi, E.; Zinadini, S.; Monfared, H.A. TiO2 embedded mixedmatrix PES nanocomposite membranes: Influence of different sizes and types of nanoparticles on antifoulingand performance. Desalination 2012, 292, 19–29. [CrossRef]

Materials 2017, 10, 85 25 of 25
69. Wang, S.; Zhang, J. Non-isothermal crystallization kinetics of high density polyethylene/titanium dioxidecomposites via melt blending. J. Therm. Anal. Calorim. 2013, 115, 63–71. [CrossRef]
70. Gu, J.; Xu, H.; Wu, C. Thermal and Crystallization Properties of HDPE and HDPE/PP Blends Modified withDCP. Adv. Polym. Technol. 2014, 33. [CrossRef]
© 2017 by the authors; licensee MDPI, Basel, Switzerland. This article is an open accessarticle distributed under the terms and conditions of the Creative Commons Attribution(CC BY) license (http://creativecommons.org/licenses/by/4.0/).