Embed Size (px)
Citation preview
On fusion for multispectral iris recognition Conference or Workshop Item
Accepted Version
Wild, P., Radu, P. and Ferryman, J. (2015) On fusion for multispectral iris recognition. In: 8th IAPR International Conference on Biometrics (ICB2015), 1922 May, 2015, Phuket, Thailand, pp. 3173. Available at http://centaur.reading.ac.uk/48396/
It is advisable to refer to the publisher’s version if you intend to cite from the work. Published version at: http://ieeexplore.ieee.org/xpls/abs_all.jsp?arnumber=7139072
All outputs in CentAUR are protected by Intellectual Property Rights law, including copyright law. Copyright and IPR is retained by the creators or other copyright holders. Terms and conditions for use of this material are defined in the End User Agreement .
www.reading.ac.uk/centaur
CentAUR
Central Archive at the University of Reading
Reading’s research outputs online
On Fusion for Multispectral Iris Recognition
Peter Wild, Petru Radu, James FerrymanComputational Vision Group, School of Systems Engineering, University of Reading, UK
{p.wild, p.radu, j.m.ferryman}@reading.ac.uk
Abstract
Multispectral iris recognition uses information frommultiple bands of the electromagnetic spectrum to bet-ter represent certain physiological characteristics of theiris texture and enhance obtained recognition accuracy.This paper addresses the questions of single versus cross-spectral performance and compares score-level fusion ac-curacy for different feature types, combining different wave-lengths to overcome limitations in less constrained record-ing environments. Further it is investigated whether Dod-dington’s “goats” (users who are particularly difficult torecognize) in one spectrum also extend to other spectra.Focusing on the question of feature stability at differentwavelengths, this work uses manual ground truth segmen-tation, avoiding bias by segmentation impact. Experimentson the public UTIRIS multispectral iris dataset using 4 fea-ture extraction techniques reveal a significant enhancementwhen combining NIR + Red for 2-channel and NIR + Red+ Blue for 3-channel fusion, across different feature types.Selective feature-level fusion is investigated and shown toimprove overall and especially cross-spectral performancewithout increasing the overall length of the iris code.
1. Introduction
Traditional visual biometrics uses either monochrome or3-channel RGB colour images for sensing biometric traits.Emerging multispectral techniques exploit multiple bandsof the electro-magnetic spectrum in the recognition process,aiming for enhanced accuracy when information is com-bined [15], or predicting performance in unknown chan-nels [21] for easier or cheaper recording of biometric sig-nals. Especially in iris recognition due to the narrow depthof field in optical setups and illumination problem in vis-ible range (strong reflections) any means to enhance theentropy of biometric source signals is highly appreciated.Further, benefits of multispectral imaging comprise the effi-cient encoding of complementary information for counter-spoofing [4], combination of the iris biometric with con-junctival vasculature, and potential cross-spectral applica-tions with quantum photography in the future [12].
Most of the commercial implementations of iris recog-nition systems use iris images acquired in the near infrared(NIR) spectrum in the 700nm to 900nm range. With therecent challenge evaluations on noisy iris images (NICE),considerable focus of research groups has also been put onthe visible wavelength (VW) spectrum at 390nm to 700nm,especially for the purpose of robust iris segmentation. Thistask turns out to be particularly challenging for dark (highlypigmented) iris images, due to very low contrast betweenpupil and sclera, and certainly due to the presence of strongreflections which can hardly be controlled in this band. Theformer reason, more specifically the presence of Eume-lanin (brown-black melanin) and Pheomelanin (yellow-redmelanin) in dark eyes, make recognition in the visible spec-trum particularly difficult for this type of eyes. On the otherhand, for less pigmented iris images, visible range imagesshow incredibly rich texture, see Fig. 1 comparing a hazeland brown iris in both spectra.
While iris multispectral fusion has attracted researchersto look into far NIR (greater than 900nm) bands [19] andNIR+VW bands [15], it is especially the combination ofNIR images with images captured in VW (in particular thered channel being highly discriminative [1]) which is of par-ticular interest due to cheap available sensors and illumi-nators for this type of imagery. As a contribution to ex-isting multispectral evaluations, this paper presents an ef-ficient feature-level fusion using random selected bits [17]and thoroughly addresses the following questions: (1) Howis intra and inter-channel performance affected for differenttypes of features? (2) Are difficult subjects in one spectrumalso difficult in another? (3) Which features and combi-nations thereof are most discriminatory for different wave-lengths?
Section 2 gives a short survey on multispectral iris recog-nition, highlighting the most relevant related works. Em-ployed baseline algorithms, the multispectral database andtested fusion approaches are introduced in Section 3. Sec-tion 4 analyses experimental results with regards to ques-tions outlined above. Finally, the conclusion and wrap-upof main insights with regards to our multispectral fusion ex-periments is outlined in Section 5.
1
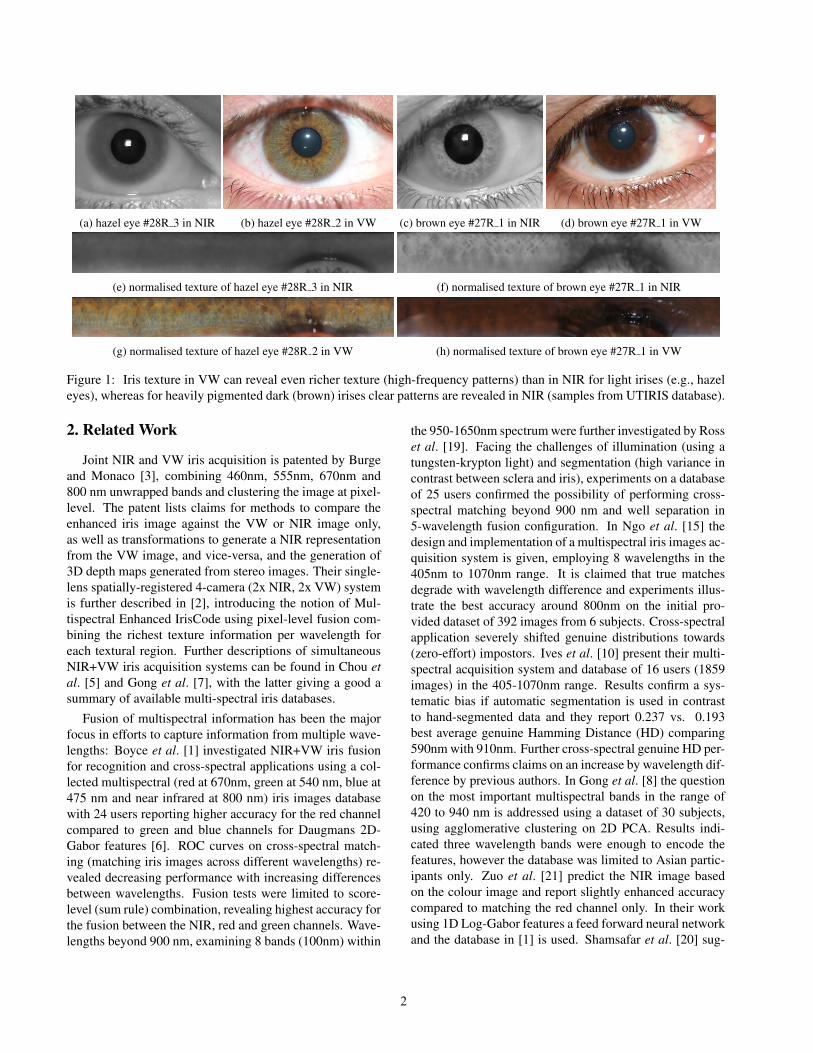
(a) hazel eye #28R 3 in NIR (b) hazel eye #28R 2 in VW (c) brown eye #27R 1 in NIR (d) brown eye #27R 1 in VW
(e) normalised texture of hazel eye #28R 3 in NIR (f) normalised texture of brown eye #27R 1 in NIR
(g) normalised texture of hazel eye #28R 2 in VW (h) normalised texture of brown eye #27R 1 in VW
Figure 1: Iris texture in VW can reveal even richer texture (high-frequency patterns) than in NIR for light irises (e.g., hazeleyes), whereas for heavily pigmented dark (brown) irises clear patterns are revealed in NIR (samples from UTIRIS database).
2. Related Work
Joint NIR and VW iris acquisition is patented by Burgeand Monaco [3], combining 460nm, 555nm, 670nm and800 nm unwrapped bands and clustering the image at pixel-level. The patent lists claims for methods to compare theenhanced iris image against the VW or NIR image only,as well as transformations to generate a NIR representationfrom the VW image, and vice-versa, and the generation of3D depth maps generated from stereo images. Their single-lens spatially-registered 4-camera (2x NIR, 2x VW) systemis further described in [2], introducing the notion of Mul-tispectral Enhanced IrisCode using pixel-level fusion com-bining the richest texture information per wavelength foreach textural region. Further descriptions of simultaneousNIR+VW iris acquisition systems can be found in Chou etal. [5] and Gong et al. [7], with the latter giving a good asummary of available multi-spectral iris databases.
Fusion of multispectral information has been the majorfocus in efforts to capture information from multiple wave-lengths: Boyce et al. [1] investigated NIR+VW iris fusionfor recognition and cross-spectral applications using a col-lected multispectral (red at 670nm, green at 540 nm, blue at475 nm and near infrared at 800 nm) iris images databasewith 24 users reporting higher accuracy for the red channelcompared to green and blue channels for Daugmans 2D-Gabor features [6]. ROC curves on cross-spectral match-ing (matching iris images across different wavelengths) re-vealed decreasing performance with increasing differencesbetween wavelengths. Fusion tests were limited to score-level (sum rule) combination, revealing highest accuracy forthe fusion between the NIR, red and green channels. Wave-lengths beyond 900 nm, examining 8 bands (100nm) within
the 950-1650nm spectrum were further investigated by Rosset al. [19]. Facing the challenges of illumination (using atungsten-krypton light) and segmentation (high variance incontrast between sclera and iris), experiments on a databaseof 25 users confirmed the possibility of performing cross-spectral matching beyond 900 nm and well separation in5-wavelength fusion configuration. In Ngo et al. [15] thedesign and implementation of a multispectral iris images ac-quisition system is given, employing 8 wavelengths in the405nm to 1070nm range. It is claimed that true matchesdegrade with wavelength difference and experiments illus-trate the best accuracy around 800nm on the initial pro-vided dataset of 392 images from 6 subjects. Cross-spectralapplication severely shifted genuine distributions towards(zero-effort) impostors. Ives et al. [10] present their multi-spectral acquisition system and database of 16 users (1859images) in the 405-1070nm range. Results confirm a sys-tematic bias if automatic segmentation is used in contrastto hand-segmented data and they report 0.237 vs. 0.193best average genuine Hamming Distance (HD) comparing590nm with 910nm. Further cross-spectral genuine HD per-formance confirms claims on an increase by wavelength dif-ference by previous authors. In Gong et al. [8] the questionon the most important multispectral bands in the range of420 to 940 nm is addressed using a dataset of 30 subjects,using agglomerative clustering on 2D PCA. Results indi-cated three wavelength bands were enough to encode thefeatures, however the database was limited to Asian partic-ipants only. Zuo et al. [21] predict the NIR image basedon the colour image and report slightly enhanced accuracycompared to matching the red channel only. In their workusing 1D Log-Gabor features a feed forward neural networkand the database in [1] is used. Shamsafar et al. [20] sug-
2
Segmentation
Normalisation
RGB image
NIR image
NIR Feature
Extraction
VW Feature
Extraction
Feature
Fusion
Compare
Compare
Compare
Score
Fusion
or
Yes/No
Database
Identity Claim
# 123
Ground Truth
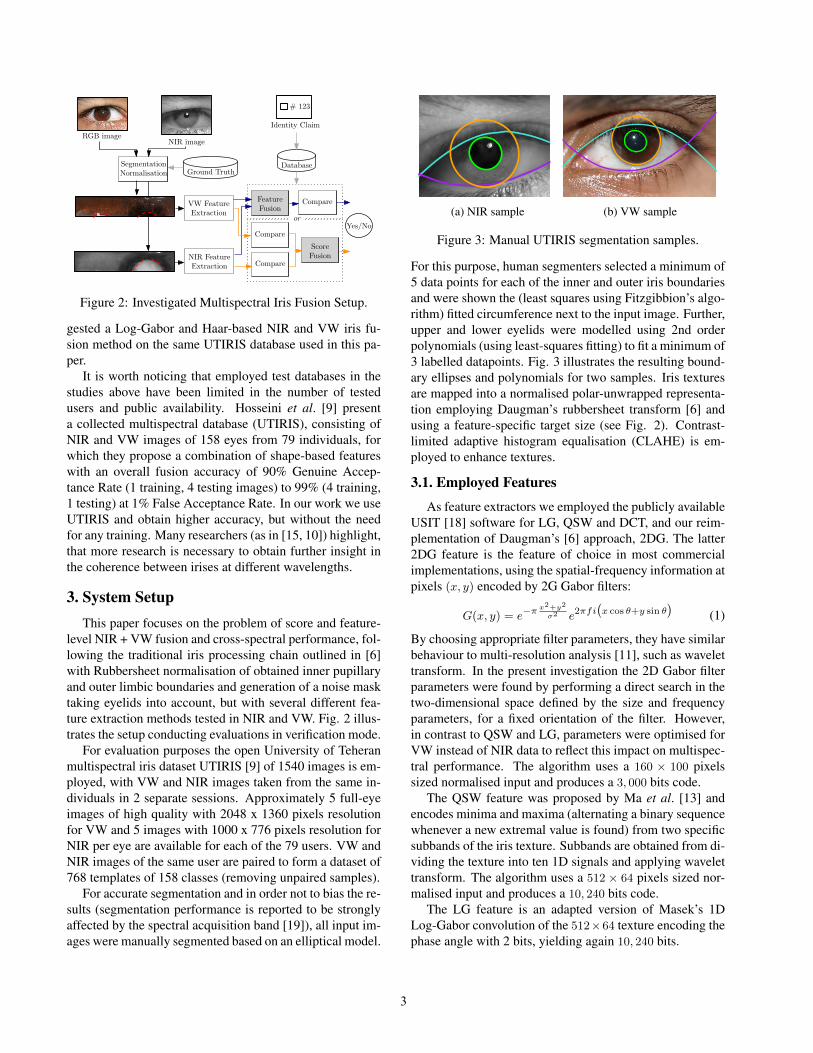
Figure 2: Investigated Multispectral Iris Fusion Setup.
gested a Log-Gabor and Haar-based NIR and VW iris fu-sion method on the same UTIRIS database used in this pa-per.
It is worth noticing that employed test databases in thestudies above have been limited in the number of testedusers and public availability. Hosseini et al. [9] presenta collected multispectral database (UTIRIS), consisting ofNIR and VW images of 158 eyes from 79 individuals, forwhich they propose a combination of shape-based featureswith an overall fusion accuracy of 90% Genuine Accep-tance Rate (1 training, 4 testing images) to 99% (4 training,1 testing) at 1% False Acceptance Rate. In our work we useUTIRIS and obtain higher accuracy, but without the needfor any training. Many researchers (as in [15, 10]) highlight,that more research is necessary to obtain further insight inthe coherence between irises at different wavelengths.
3. System SetupThis paper focuses on the problem of score and feature-
level NIR + VW fusion and cross-spectral performance, fol-lowing the traditional iris processing chain outlined in [6]with Rubbersheet normalisation of obtained inner pupillaryand outer limbic boundaries and generation of a noise masktaking eyelids into account, but with several different fea-ture extraction methods tested in NIR and VW. Fig. 2 illus-trates the setup conducting evaluations in verification mode.
For evaluation purposes the open University of Teheranmultispectral iris dataset UTIRIS [9] of 1540 images is em-ployed, with VW and NIR images taken from the same in-dividuals in 2 separate sessions. Approximately 5 full-eyeimages of high quality with 2048 x 1360 pixels resolutionfor VW and 5 images with 1000 x 776 pixels resolution forNIR per eye are available for each of the 79 users. VW andNIR images of the same user are paired to form a dataset of768 templates of 158 classes (removing unpaired samples).
For accurate segmentation and in order not to bias the re-sults (segmentation performance is reported to be stronglyaffected by the spectral acquisition band [19]), all input im-ages were manually segmented based on an elliptical model.
(a) NIR sample (b) VW sample
Figure 3: Manual UTIRIS segmentation samples.
For this purpose, human segmenters selected a minimum of5 data points for each of the inner and outer iris boundariesand were shown the (least squares using Fitzgibbion’s algo-rithm) fitted circumference next to the input image. Further,upper and lower eyelids were modelled using 2nd orderpolynomials (using least-squares fitting) to fit a minimum of3 labelled datapoints. Fig. 3 illustrates the resulting bound-ary ellipses and polynomials for two samples. Iris texturesare mapped into a normalised polar-unwrapped representa-tion employing Daugman’s rubbersheet transform [6] andusing a feature-specific target size (see Fig. 2). Contrast-limited adaptive histogram equalisation (CLAHE) is em-ployed to enhance textures.
3.1. Employed Features
As feature extractors we employed the publicly availableUSIT [18] software for LG, QSW and DCT, and our reim-plementation of Daugman’s [6] approach, 2DG. The latter2DG feature is the feature of choice in most commercialimplementations, using the spatial-frequency information atpixels (x, y) encoded by 2G Gabor filters:
G(x, y) = e
�⇡
x
2+y
2
�
2e
2⇡fi
�x cos ✓+y sin ✓
�(1)
By choosing appropriate filter parameters, they have similarbehaviour to multi-resolution analysis [11], such as wavelettransform. In the present investigation the 2D Gabor filterparameters were found by performing a direct search in thetwo-dimensional space defined by the size and frequencyparameters, for a fixed orientation of the filter. However,in contrast to QSW and LG, parameters were optimised forVW instead of NIR data to reflect this impact on multispec-tral performance. The algorithm uses a 160 ⇥ 100 pixelssized normalised input and produces a 3, 000 bits code.
The QSW feature was proposed by Ma et al. [13] andencodes minima and maxima (alternating a binary sequencewhenever a new extremal value is found) from two specificsubbands of the iris texture. Subbands are obtained from di-viding the texture into ten 1D signals and applying wavelettransform. The algorithm uses a 512 ⇥ 64 pixels sized nor-malised input and produces a 10, 240 bits code.
The LG feature is an adapted version of Masek’s 1DLog-Gabor convolution of the 512⇥64 texture encoding thephase angle with 2 bits, yielding again 10, 240 bits.
3
As an alternative, DCT (following Monro et al. [14])computes the 1D discrete cosine transform on overlappingdiamond-shaped image patches. The feature uses the 512⇥64 pixels sized normalised input and produces a 7 ⇥ 3, 072
bits code (for each of 7 pixel shifts).As comparators, for QSW, LG and 2DG we use the min-
imum fractional HD (using ±4 shifts in either direction) asa measure of (dis-)similarity between feature vectors codeAand codeB, and corresponding code masks (maskA, maskBidentifying out-of-iris bits using ground-truth) [6]:
HD =||(codeA � codeB) \ maskA \ maskB||
||maskA \ maskB|| . (2)
For the DCT feature, the comparator defined in [14] isemployed.
3.2. Investigated Fusion Methods
Comparison in multispectral systems may refer to ei-ther gallery or probe samples available in multiple chan-nels, or both. Let w, x, y, z 2 {NIR,R,G,B} denote chan-nels, when assessing cross-channel performance we inves-tigate scores s
x,y
for comparing a probe image channel y
with gallery image channel x, or short sx
:= s
x,x
for intra-channel. Note, that in general even for symmetric matcherss
x,y
6= s
y,x
as different images are involved (but distribu-tions in our experimental setup are similar). In score-levelfusion, any subset of the 42 scores could be combined, butusually, focus is on combining intra-channel scores: in ex-periments, we focus on 2-channel fusion combining scorevectors ~s
x,y
:= {sx
, s
y
}, 3-channel ~s
x,y,z
and 4-channel~s
w,x,y,z
vectors. As combination technique we employ
sum-rule fusion: Csum (~s) := 1
n
nPi=1
s[i], where s[i] denotes
the i-th element in the score vector of n elements.The paper aims to consider feature-level approaches,
however, simple concatenation of features in case of em-ploying the fractional HD as feature should (neglecting thepresence of bit-shifts to optimise the alignment) yield sim-ilar resuls as for score-level fusion. Further, concatena-tion generally increases the length of the feature vector ~
f ,whereas the approach studied in this work selects bits fromn channels ~
F = (~fx
,
~
f
y
, . . . ,
~
f
z
) keeping the length m of thefeature vector: Cbitsel (~F )[i] := ~
F [sel(1, n)][i] for all i with1 i m. This approach follows [17], but applied to mul-tiple spectra and instead of training uses a random selectionof bits (sel is the random function returning equally dis-tributed natural numbers between 1 and n), reported to per-form remarkably well in incremental iris recognition [18]without any training.
4. Experimental ResultsInvestigating a series of questions related to multispec-
tral fusion performance, we employ Receiver Operating
50 55 60 65 70 75 80 85 90 95
100
0.1 1 10 100
Gen
uin
e A
ccep
tan
ce R
ate
(%)
False Acceptance Rate (%)
NIR vs NIRR vs RG vs GB vs B
R vs GG vs BR vs B
NIR vs R
NIR vs GNIR vs B
(a) LG
50 55 60 65 70 75 80 85 90 95
100
0.1 1 10 100
Gen
uin
e A
ccep
tan
ce R
ate
(%)
False Acceptance Rate (%)
(b) QSW
50 55 60 65 70 75 80 85 90 95
100
0.1 1 10 100
Gen
uin
e A
ccep
tan
ce R
ate
(%)
False Acceptance Rate (%)
(c) DCT
50 55 60 65 70 75 80 85 90 95
100
0.1 1 10 100
Gen
uin
e A
ccep
tan
ce R
ate
(%)
False Acceptance Rate (%)
(d) 2DG
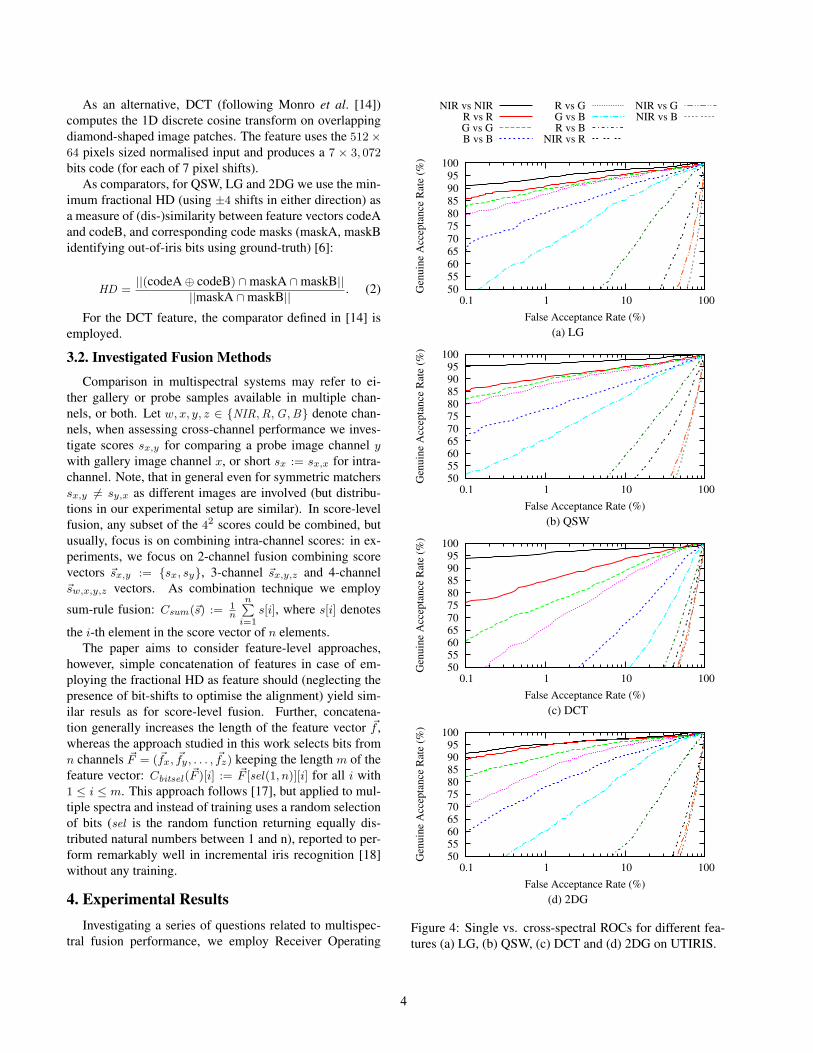
Figure 4: Single vs. cross-spectral ROCs for different fea-tures (a) LG, (b) QSW, (c) DCT and (d) 2DG on UTIRIS.
4
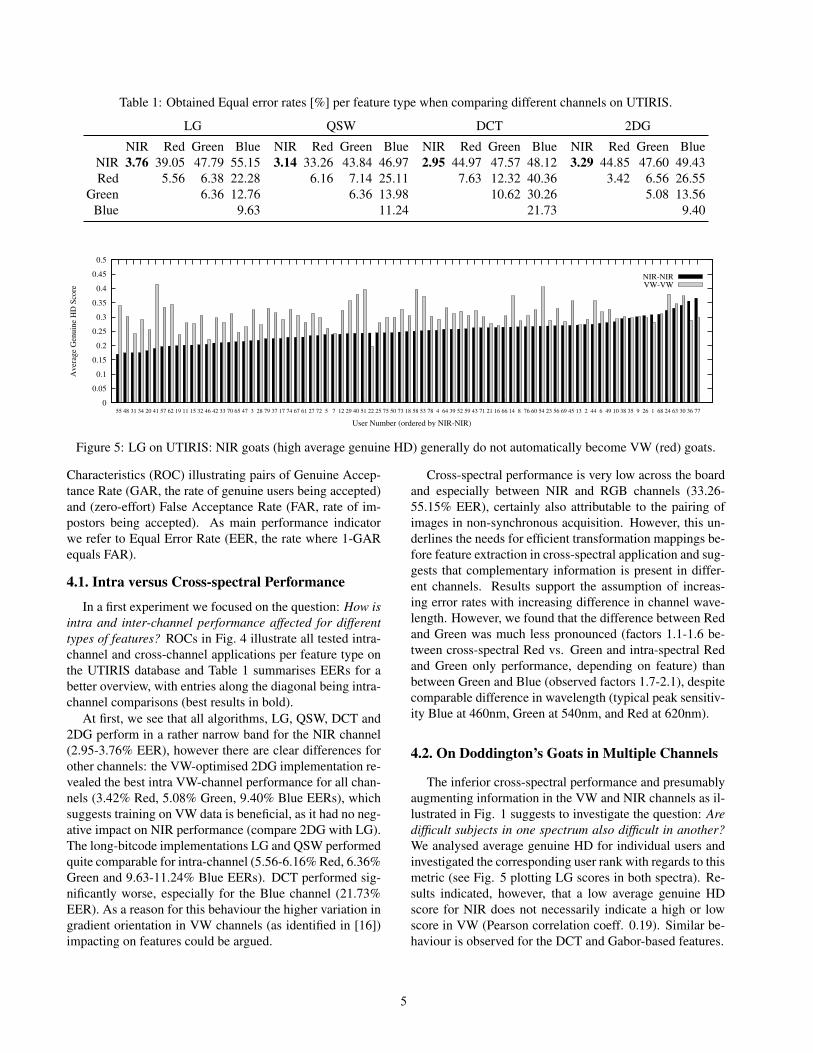
Table 1: Obtained Equal error rates [%] per feature type when comparing different channels on UTIRIS.
LG QSW DCT 2DGNIR Red Green Blue NIR Red Green Blue NIR Red Green Blue NIR Red Green Blue
NIR 3.76 39.05 47.79 55.15 3.14 33.26 43.84 46.97 2.95 44.97 47.57 48.12 3.29 44.85 47.60 49.43Red 5.56 6.38 22.28 6.16 7.14 25.11 7.63 12.32 40.36 3.42 6.56 26.55
Green 6.36 12.76 6.36 13.98 10.62 30.26 5.08 13.56Blue 9.63 11.24 21.73 9.40
0
0.05
0.1
0.15
0.2
0.25
0.3
0.35
0.4
0.45
0.5
55 48 31 34 20 41 57 62 19 11 15 32 46 42 33 70 65 47 3 28 79 37 17 74 67 61 27 72 5 7 12 29 40 51 22 25 75 50 73 18 58 53 78 4 64 39 52 59 43 71 21 16 66 14 8 76 60 54 23 56 69 45 13 2 44 6 49 10 38 35 9 26 1 68 24 63 30 36 77
Av
erag
e G
enu
ine
HD
Sco
re
User Number (ordered by NIR-NIR)
NIR-NIRVW-VW
Figure 5: LG on UTIRIS: NIR goats (high average genuine HD) generally do not automatically become VW (red) goats.
Characteristics (ROC) illustrating pairs of Genuine Accep-tance Rate (GAR, the rate of genuine users being accepted)and (zero-effort) False Acceptance Rate (FAR, rate of im-postors being accepted). As main performance indicatorwe refer to Equal Error Rate (EER, the rate where 1-GARequals FAR).
4.1. Intra versus Cross-spectral Performance
In a first experiment we focused on the question: How isintra and inter-channel performance affected for differenttypes of features? ROCs in Fig. 4 illustrate all tested intra-channel and cross-channel applications per feature type onthe UTIRIS database and Table 1 summarises EERs for abetter overview, with entries along the diagonal being intra-channel comparisons (best results in bold).
At first, we see that all algorithms, LG, QSW, DCT and2DG perform in a rather narrow band for the NIR channel(2.95-3.76% EER), however there are clear differences forother channels: the VW-optimised 2DG implementation re-vealed the best intra VW-channel performance for all chan-nels (3.42% Red, 5.08% Green, 9.40% Blue EERs), whichsuggests training on VW data is beneficial, as it had no neg-ative impact on NIR performance (compare 2DG with LG).The long-bitcode implementations LG and QSW performedquite comparable for intra-channel (5.56-6.16% Red, 6.36%Green and 9.63-11.24% Blue EERs). DCT performed sig-nificantly worse, especially for the Blue channel (21.73%EER). As a reason for this behaviour the higher variation ingradient orientation in VW channels (as identified in [16])impacting on features could be argued.
Cross-spectral performance is very low across the boardand especially between NIR and RGB channels (33.26-55.15% EER), certainly also attributable to the pairing ofimages in non-synchronous acquisition. However, this un-derlines the needs for efficient transformation mappings be-fore feature extraction in cross-spectral application and sug-gests that complementary information is present in differ-ent channels. Results support the assumption of increas-ing error rates with increasing difference in channel wave-length. However, we found that the difference between Redand Green was much less pronounced (factors 1.1-1.6 be-tween cross-spectral Red vs. Green and intra-spectral Redand Green only performance, depending on feature) thanbetween Green and Blue (observed factors 1.7-2.1), despitecomparable difference in wavelength (typical peak sensitiv-ity Blue at 460nm, Green at 540nm, and Red at 620nm).
4.2. On Doddington’s Goats in Multiple Channels
The inferior cross-spectral performance and presumablyaugmenting information in the VW and NIR channels as il-lustrated in Fig. 1 suggests to investigate the question: Aredifficult subjects in one spectrum also difficult in another?We analysed average genuine HD for individual users andinvestigated the corresponding user rank with regards to thismetric (see Fig. 5 plotting LG scores in both spectra). Re-sults indicated, however, that a low average genuine HDscore for NIR does not necessarily indicate a high or lowscore in VW (Pearson correlation coeff. 0.19). Similar be-haviour is observed for the DCT and Gabor-based features.
5
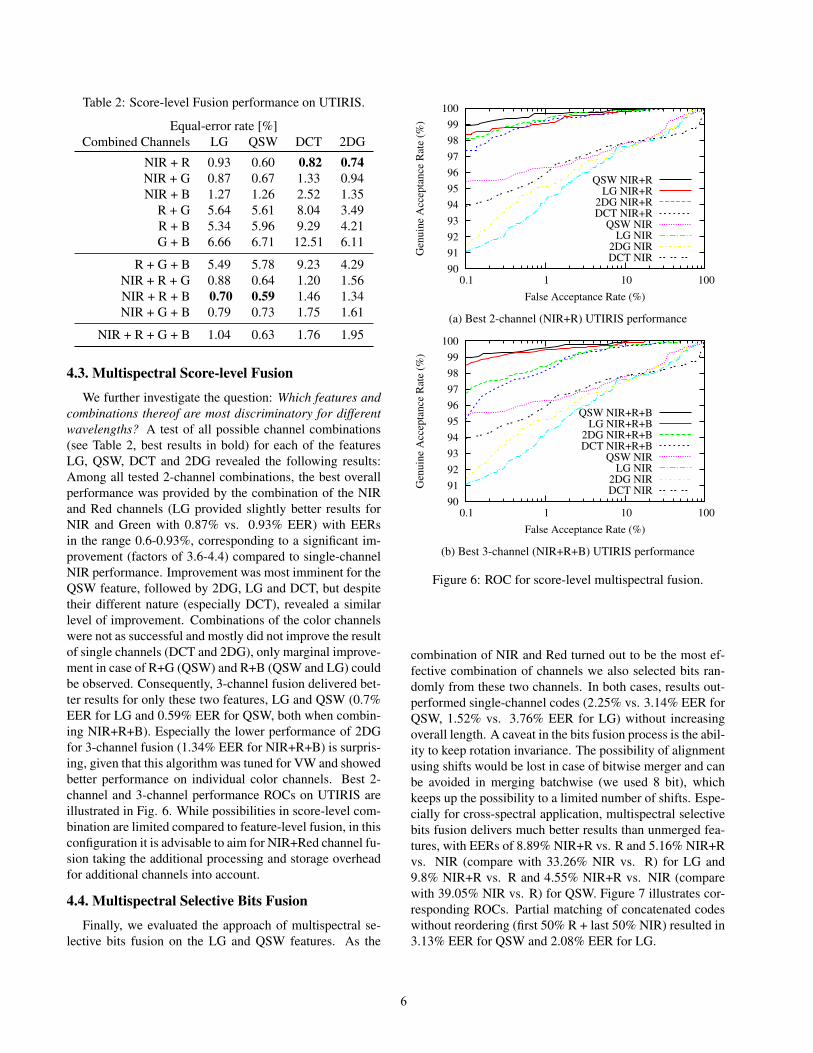
Table 2: Score-level Fusion performance on UTIRIS.
Equal-error rate [%]Combined Channels LG QSW DCT 2DG
NIR + R 0.93 0.60 0.82 0.74NIR + G 0.87 0.67 1.33 0.94NIR + B 1.27 1.26 2.52 1.35
R + G 5.64 5.61 8.04 3.49R + B 5.34 5.96 9.29 4.21G + B 6.66 6.71 12.51 6.11
R + G + B 5.49 5.78 9.23 4.29NIR + R + G 0.88 0.64 1.20 1.56NIR + R + B 0.70 0.59 1.46 1.34NIR + G + B 0.79 0.73 1.75 1.61
NIR + R + G + B 1.04 0.63 1.76 1.95
4.3. Multispectral Score-level Fusion
We further investigate the question: Which features andcombinations thereof are most discriminatory for differentwavelengths? A test of all possible channel combinations(see Table 2, best results in bold) for each of the featuresLG, QSW, DCT and 2DG revealed the following results:Among all tested 2-channel combinations, the best overallperformance was provided by the combination of the NIRand Red channels (LG provided slightly better results forNIR and Green with 0.87% vs. 0.93% EER) with EERsin the range 0.6-0.93%, corresponding to a significant im-provement (factors of 3.6-4.4) compared to single-channelNIR performance. Improvement was most imminent for theQSW feature, followed by 2DG, LG and DCT, but despitetheir different nature (especially DCT), revealed a similarlevel of improvement. Combinations of the color channelswere not as successful and mostly did not improve the resultof single channels (DCT and 2DG), only marginal improve-ment in case of R+G (QSW) and R+B (QSW and LG) couldbe observed. Consequently, 3-channel fusion delivered bet-ter results for only these two features, LG and QSW (0.7%EER for LG and 0.59% EER for QSW, both when combin-ing NIR+R+B). Especially the lower performance of 2DGfor 3-channel fusion (1.34% EER for NIR+R+B) is surpris-ing, given that this algorithm was tuned for VW and showedbetter performance on individual color channels. Best 2-channel and 3-channel performance ROCs on UTIRIS areillustrated in Fig. 6. While possibilities in score-level com-bination are limited compared to feature-level fusion, in thisconfiguration it is advisable to aim for NIR+Red channel fu-sion taking the additional processing and storage overheadfor additional channels into account.
4.4. Multispectral Selective Bits Fusion
Finally, we evaluated the approach of multispectral se-lective bits fusion on the LG and QSW features. As the
90
91
92
93
94
95
96
97
98
99
100
0.1 1 10 100
Gen
uin
e A
ccep
tan
ce R
ate
(%)
False Acceptance Rate (%)
QSW NIR+RLG NIR+R
2DG NIR+RDCT NIR+R
QSW NIRLG NIR
2DG NIRDCT NIR
(a) Best 2-channel (NIR+R) UTIRIS performance
90
91
92
93
94
95
96
97
98
99
100
0.1 1 10 100
Gen
uin
e A
ccep
tan
ce R
ate
(%)
False Acceptance Rate (%)
QSW NIR+R+BLG NIR+R+B
2DG NIR+R+BDCT NIR+R+B
QSW NIRLG NIR
2DG NIRDCT NIR
(b) Best 3-channel (NIR+R+B) UTIRIS performance
Figure 6: ROC for score-level multispectral fusion.
combination of NIR and Red turned out to be the most ef-fective combination of channels we also selected bits ran-domly from these two channels. In both cases, results out-performed single-channel codes (2.25% vs. 3.14% EER forQSW, 1.52% vs. 3.76% EER for LG) without increasingoverall length. A caveat in the bits fusion process is the abil-ity to keep rotation invariance. The possibility of alignmentusing shifts would be lost in case of bitwise merger and canbe avoided in merging batchwise (we used 8 bit), whichkeeps up the possibility to a limited number of shifts. Espe-cially for cross-spectral application, multispectral selectivebits fusion delivers much better results than unmerged fea-tures, with EERs of 8.89% NIR+R vs. R and 5.16% NIR+Rvs. NIR (compare with 33.26% NIR vs. R) for LG and9.8% NIR+R vs. R and 4.55% NIR+R vs. NIR (comparewith 39.05% NIR vs. R) for QSW. Figure 7 illustrates cor-responding ROCs. Partial matching of concatenated codeswithout reordering (first 50% R + last 50% NIR) resulted in3.13% EER for QSW and 2.08% EER for LG.
6
80
82
84
86
88
90
92
94
96
98
100
0.1 1 10 100
Gen
uin
e A
ccep
tan
ce R
ate
(%)
False Acceptance Rate (%)
NIR+R vs NIR+RNIR vs NIR
R vs RNIR+R vs NIR
NIR+R vs RNIR vs R
Figure 7: ROC for feature-level multispectral fusion on LG.
5. Conclusion and Future WorkIn this work we studied the impact of score-level fusion
and cross-spectral performance in multispectral iris recog-nition systems, investigating Log Gabor (LG), Wavelet-based (QSW), Discrete Cosine Transform (DCT) and 2DGabor (2DG) feature types. Results on the public UTIRISmultispectral database indicated, that features can be rathersusceptible to spectral channels (such as DCT deliveringbest NIR but worst RGB performance). Cross-spectral per-formance turned out to be highly challenging (EERs > 33%for comparing NIR against RGB channels across featuretypes), confirming increases in EERs as the difference inwavelength increases, but further also indicating a morepronounced degradation for Green versus Blue comparedwith Red versus Green intra-color cross-spectral applica-tion. Score-level fusion delivered best results for NIR+R+Bfor 3-channel (0.59% EER, 99% GAR at 0.1% FAR withQSW), closely followed by NIR+R in 2-channel config-uration with the latter providing most stable rates acrossall feature types (0.6 - 0.93% EER, 97-99% GAR at 0.1%FAR). Sensitivity to channel improvement was found to beseverely affected by the feature type. The suggested multi-spectral random selective bits fusion technique was able toimprove accuracy (1.52% vs. 3.76% EER, 97% vs. 91%GAR at 0.1% FAR for LG) with the benefit of unmodifiedfeature length. In the future, we plan to investigate learning-based methods to select bits from multiple channels.
AcknowledgementsThis work was supported by the EU FASTPASS project
under grant agreement 312583.
References[1] C. Boyce, A. Ross, M. Monaco, L. Hornak, and X. Li. Mul-
tispectral iris analysis: A preliminary study. In Proc. Conf.on Comp. Vision and Pattern Rec. WS, pages 51–51, 2006.
[2] M. Burge and M. Monaco. Multispectral iris fusion andcross-spectrum matching. In M. Burge and K. Bowyer, edi-tors, Handbook of Iris Recognition. Springer, 2013.
[3] M. J. Burge and M. K. Monaco. US Pat. 0279790. Multispec-tral Iris Fusion for Enhancement and Interoperability, 2009.
[4] R. Chen, X. Lin, and T. Ding. Liveness detection for irisrecognition using multispectral images. Pattern RecognitionLetters, 33(12):1513 – 1519, 2012.
[5] C.-T. Chou, S.-W. Shih, W.-S. Chen, V. Cheng, and D.-Y.Chen. Non-orthogonal view iris recognition system. IEEETrans. Circ. Syst. Video Techn., 20(3):417–430, March 2010.
[6] J. Daugman. How iris recognition works. IEEE Trans. onCirciuts and Systems for Video Technology, 14(1), 2004.
[7] Y. Gong, D. Zhang, P. Shi, and J. Yan. High-speed multi-spectral iris capture system design. IEEE Trans. on Instru-mentation and Measurement, 61(7):1966–1978, 2012.
[8] Y. Gong, D. Zhang, P. Shi, and J. Yan. Optimal wavelengthband clustering for multispectral iris recognition. Appl. Opt.,51(19):4275–4284, 2012.
[9] M. Hosseini, B. Araabi, and H. Soltanian-Zadeh. Pigmentmelanin: Pattern for iris recognition. IEEE Trans. on Instru-mentation and Measurement, 59(4):792 –804, 2010.
[10] R. Ives, H. Ngo, S. Winchell, and J. Matey. Preliminaryevaluation of multispectral iris imagery. In Proc. IET Conf.on Image Processing, pages 1–5, July 2012.
[11] V. Kyrki, J.-K. Kamarainen, and H. Kalviainen. Simple ga-bor feature space for invariant object recognition. PatternRecognition Letters, 25(3):311 – 318, 2004.
[12] G. B. Lemos, V. Borish, G. D. Cole, S. Ramelow, R. Lap-kiewicz, and A. Zeilinger. Quantum imaging with undetectedphotons. Nature, 512:409–412, 2014.
[13] L. Ma, T. Tan, Y. Wang, and D. Zhang. Efficient iris recog-nition by characterizing key local variations. IEEE Transac-tions on Image Processing, 13(6), 2004.
[14] D. M. Monro, S. Rakshit, and D. Zhang. Dct-based irisrecognition. IEEE Trans. Patt. Anal. Mach. Int., 29(4), 2007.
[15] H. Ngo, R. Ives, J. Matey, J. Dormo, M. Rhoads, andD. Choi. Design and implementation of a multispectral iriscapture system. In Proc. of CSSP, pages 380–384, Nov 2009.
[16] P. Radu, K. Sirlantzis, G. Howells, S. Hoque, and F. Deravi.Information fusion for unconstrained iris recognition. Int’l J.of Hybrid Inf. Techn., (4), 2011.
[17] C. Rathgeb, A. Uhl, and P. Wild. On combining selective bestbits of iris-codes. In Proc. Biometrics and ID ManagementWS, pages 227–237. 2011.
[18] C. Rathgeb, A. Uhl, and P. Wild. Iris Recognition: FromSegmentation to Template Security, volume 59 of Advancesin Information Security. Springer, 2012.
[19] A. Ross, R. Pasula, and L. Hornak. Exploring multispec-tral iris recognition beyond 900nm. In Proc. Int’l Conf onBiometrics: Th., App., and Syst., pages 1–8, Sept 2009.
[20] F. Shamsafar, H. Seyedarabi, and A. Aghagolzadeh. Fusingthe information in visible light and near-infrared images foriris recognition. Mach. Vis. App., 25(4):881–899, 2014.
[21] J. Zuo, F. Nicolo, and N. Schmid. Cross spectral iris match-ing based on predictive image mapping. In Proc. Int’l Conf.on Biometrics: Th., App., and Syst., pages 1–5, Sept 2010.
7


![An Iris Recognition System Using Score-level Fusion of 1-D DCT … · Proposed Iris Recognition System Using Score-level Fusion of DCT and RM [7] Segmentation , Normalization and](https://img.dokumen.tips/doc/110x75/5b5a50657f8b9a905c8bb124/an-iris-recognition-system-using-score-level-fusion-of-1-d-dct-proposed-iris.jpg)

![HYPERSPECTRAL AND MULTISPECTRAL IMAGE FUSION USING … Hyperspectral and... · band. Also, HS and MS image fusion is a type of HS super-resolution problem [5]. *Corresponding Author](https://img.dokumen.tips/doc/110x75/5fa998b7ac0b64005f09776a/hyperspectral-and-multispectral-image-fusion-using-hyperspectral-and-band.jpg)