Embed Size (px)
Citation preview

Project Information Project ID#: Aio7
Measure: Compressed Air System
Ex Ante Savings: 12,110 kWh, 25.00 kW
Facility Type: Manufacturing
End Use: Compressed Air
Measure Description This project consisted of installing a Sullair SFP-150 FlowLogic Pneumatic Flow Pressure
Controller. This controller maintains the system pressure at a lower pressure than what the
compressors are supplying, which results in less air being lost through leaks in the compressed
air piping.
Summary of the Ex Ante Calculations The Ex Ante savings listed in the project documentation match the claimed savings in the project
tracking system.
There are no calculations in the project documentation. Only the claimed savings values are
given.
The savings for this project are summarized in Table 1.
Table 1 Summary of Project Savings
Ex Ante Savings
Summer
Seasonal
Peak kW Annual kWh
Flow controller installation 25 12,110
Measurement & Verification Plan This project includes the calculation of savings due to the installation of a Sullair SFP-150
FlowLogic Pneumatic Flow Pressure Controller to lower the system pressure.
The base case for this project will be the current compressed air system with the supply lines in
the production area maintained at the pressure supplied by the compressors.
An inspection of the site and the installed controller will be conducted and the site representative
will be interviewed about the operation of the compressed air system and the installed controller.
Specifically the site representative will be asked to verify the installation of the flow controller,
the compressed air sequencing, and the system’s operating pressure, prior to the project
completion. The compressors will be inspected and their make and model numbers will be
recorded.
IPMVP Option A will be used to establish savings for this measure.
The energy use of the compressors will be metered for a period of no less than 2 weeks with a
metering interval no greater than 15 minutes. Split-core current transducers measure the three-
phase currents, and are hooked up to Dent ELITEpro Energy Loggers. In addition spot
measurements of the air compressor will be taken with a NIST calibrated Fluke 1735 of voltage,
amperage, power factor, and kW. The customer will be interviewed to determine if the plant
operation during the time that the loggers are installed is typical, and whether or not the plant
operations have changed significantly since the project was completed in 2008. The customer
will also be asked if the plant operation changes throughout the year, or if it is consistent.
Description of Verification An initial site visit to verify the completion of the project and install energy loggers was
conducted on January 19, 2012. The facility manager was interviewed and they provided
updated information about the compressed air system. The facility manager explained that all of
the work specified in the project documentation had been completed, and that the system
pressure is now maintained at 90psi via the Pneumatic Flow Pressure Regulator installed for this
project. The compressors cycle on and off to maintain 110psi pressure in the lines leading up to
the regulator. Prior to the project completion, the entire system was maintained at 110 psi. The
facility manager showed the visiting engineer both of the compressors that are used, the older of
the compressor being a 15HP compressor, and the newer compressor being a 20HP Sullair
compressor. These compressors are on/off and do not have VFDs. There is also a 5/8HP Great
Lakes Air refrigerated air dryer in use, and approximately 600 gallons of storage between the
compressors and the installed controller.
Two (2) Dent ELITEpro Energy Loggers were installed during the site visit (1 on each
compressor), and these loggers were removed on February 8, 2012.
Summary of Calculations The ex post energy savings for this measure are 9,204 kWh, compared to the ex ante savings of
12,110 kWh per year for a realization rate of 76%. The ex post summer and winter demand
savings are 2.81 kW and 1.10 kW, respectively, compared to the ex ante demand savings of 25
kW for both summer and winter, yielding realization rates of 11% and 4%, respectively. The Ex
Post summer and winter seasonal peak demand savings are 3.65 kW and 0.48 kW, respectively.
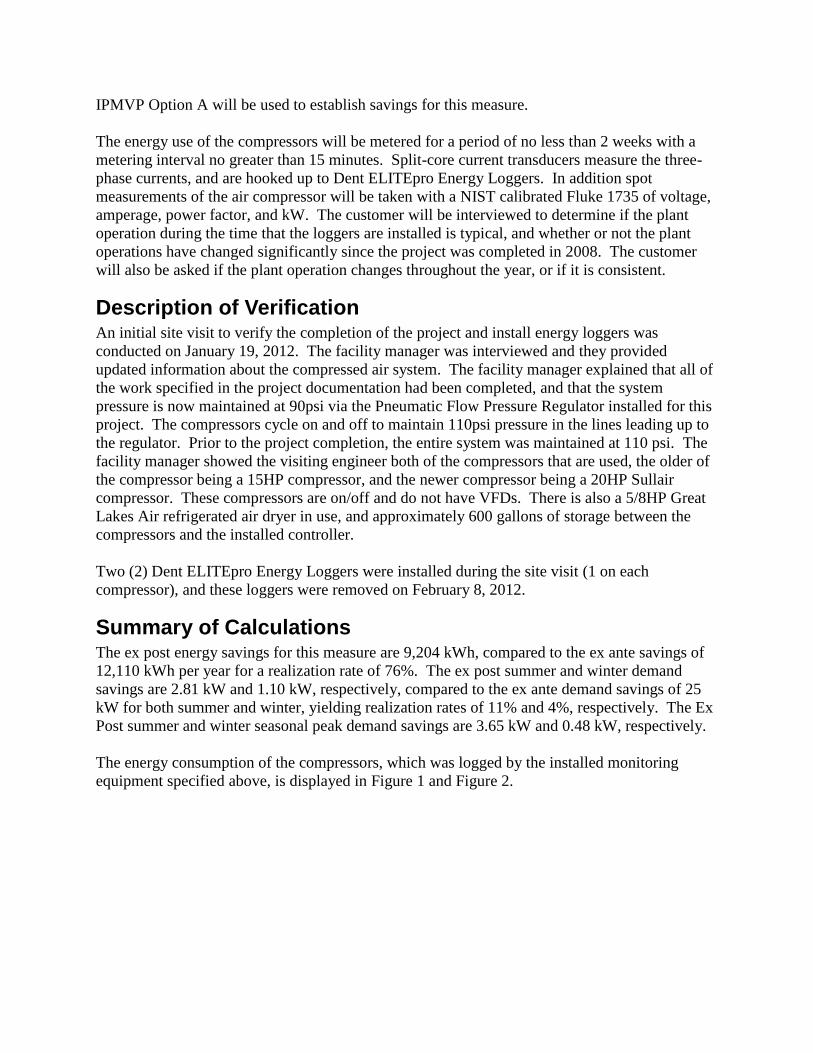
The energy consumption of the compressors, which was logged by the installed monitoring
equipment specified above, is displayed in Figure 1 and Figure 2.
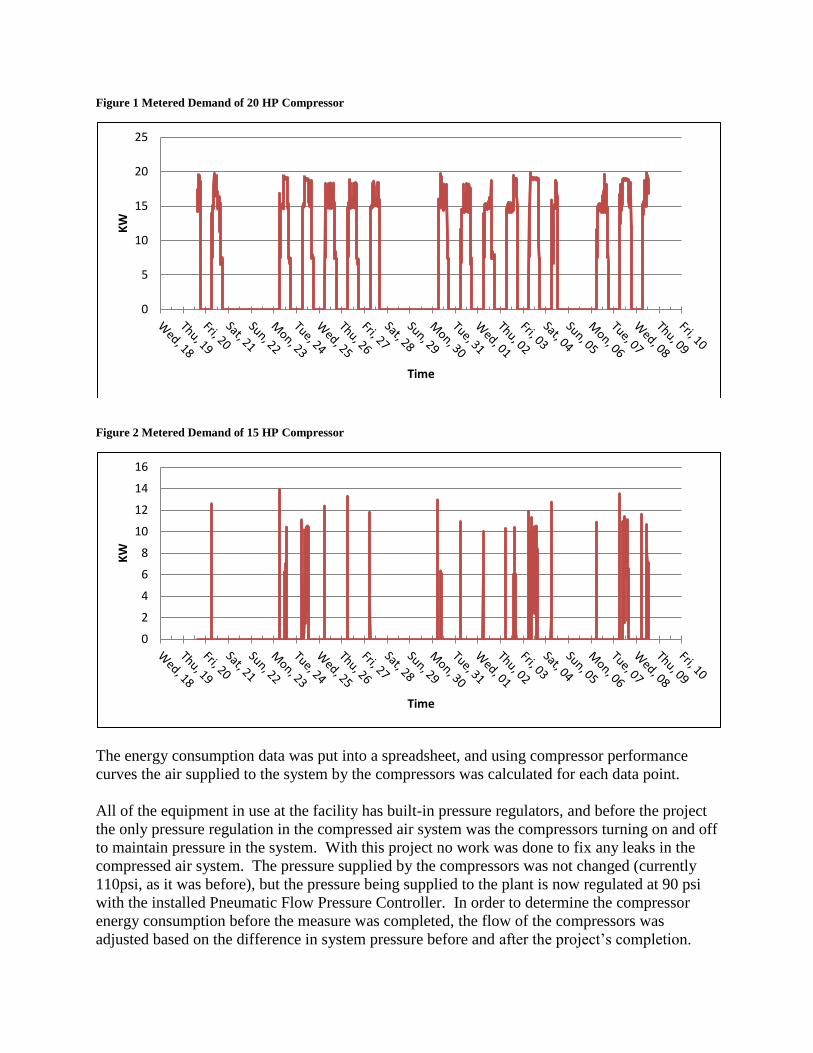
Figure 1 Metered Demand of 20 HP Compressor
Figure 2 Metered Demand of 15 HP Compressor
The energy consumption data was put into a spreadsheet, and using compressor performance
curves the air supplied to the system by the compressors was calculated for each data point.
All of the equipment in use at the facility has built-in pressure regulators, and before the project
the only pressure regulation in the compressed air system was the compressors turning on and off
to maintain pressure in the system. With this project no work was done to fix any leaks in the
compressed air system. The pressure supplied by the compressors was not changed (currently
110psi, as it was before), but the pressure being supplied to the plant is now regulated at 90 psi
with the installed Pneumatic Flow Pressure Controller. In order to determine the compressor
energy consumption before the measure was completed, the flow of the compressors was
adjusted based on the difference in system pressure before and after the project’s completion.
0
5
10
15
20
25 K
W
Time
0
2
4
6
8
10
12
14
16
KW
Time

The metered data from the energy loggers installed on the compressors and compressor curves
were used to determine the amount of air supplied to the system by the compressors for every set
of data points collected by the installed energy loggers. The estimated leaks in the system was
used to determine how much of the air supplied by the compressors is actually going to the
equipment in use at the facility. It was then determined how much air was leaking out of the
system prior to the completion of the project (when the system pressure was 110psi). The higher
system pressure in the base case causes an increased amount of air to escape from the system
through the leaks. The increased leaks CFM was added to the amount of air supplied to the
equipment in the facility to find the base case air flow for every set of data points. The
compressor curves used earlier were used to determine the compressor operation for every set of
data points given this higher amount of air needed by the system.
Using the calculated compressor demands for the base case and post case (described above),
hourly average demand profiles for an average week before and after the project’s completion
were created. These profiles were integrated into the 8760 calculator, in order to calculate the
annual energy consumption of the compressors and the seasonal demand and seasonal peak
demand savings. Observed Holidays and periods of maintenance were incorporated into the
profile, and the difference in annual power consumption was determined by calculating the
difference in total kWh between the system with and without the completion of the project.
The peak kW savings were determined using the same hourly power consumption profile
described above.
Because there were no calculations included in the project documentation, it is unknown why the
Ex Post savings differ from the Ex Ante Savings. Due to the lack of calculations in the project
documentation there are no technology or quantity adjustments. The savings for this project that
were calculated with the metered data and the information collected during the site visit is the
operations adjustment. Because the compressors are kept in an unconditioned area of the
building, there are no heating and cooling adjustments. As a result, the savings due to operations
adjustment are the Ex Post savings for this project.
Due to the lack of project documentation, it is not known what the factors are that contribute to
the decrease in savings from the ex ante to the ex post.
The Ex Ante and Ex Post savings and all of the savings adjustments made for this project and the
project realization rates are shown in

Table 2.
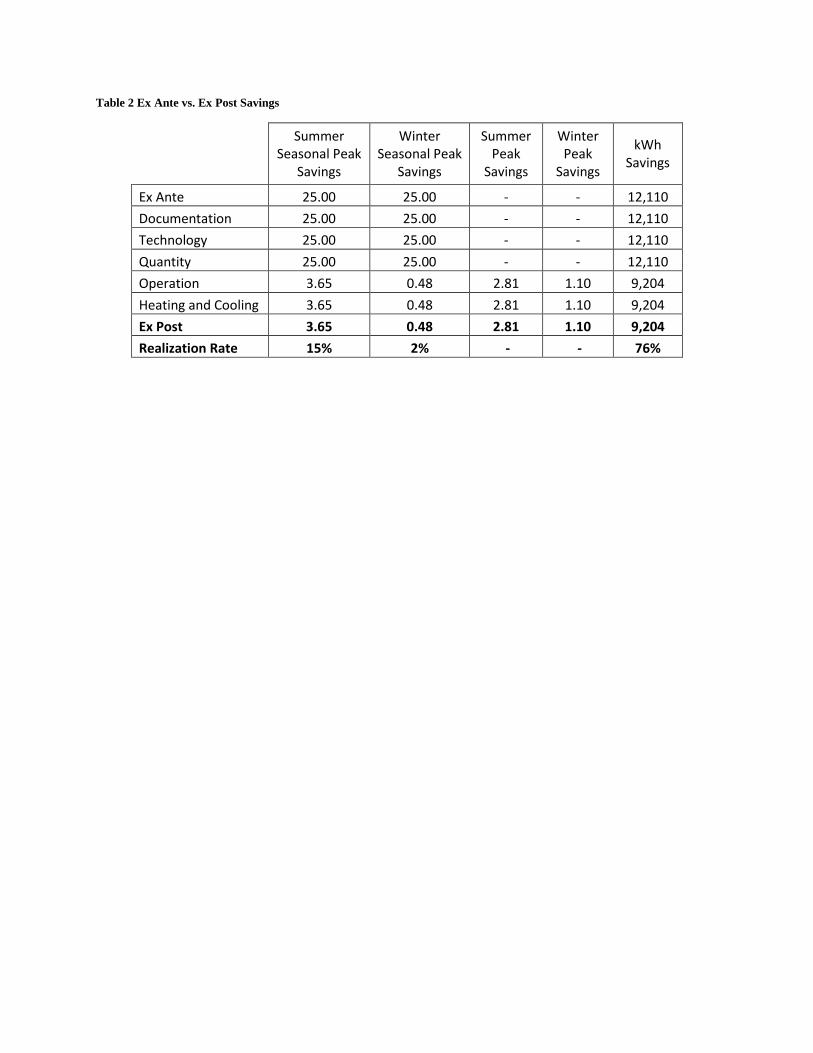
Table 2 Ex Ante vs. Ex Post Savings
Summer Seasonal Peak
Savings
Winter Seasonal Peak
Savings
Summer Peak
Savings
Winter Peak
Savings
kWh Savings
Ex Ante 25.00 25.00 - - 12,110
Documentation 25.00 25.00 - - 12,110
Technology 25.00 25.00 - - 12,110
Quantity 25.00 25.00 - - 12,110
Operation 3.65 0.48 2.81 1.10 9,204
Heating and Cooling 3.65 0.48 2.81 1.10 9,204
Ex Post 3.65 0.48 2.81 1.10 9,204
Realization Rate 15% 2% - - 76%
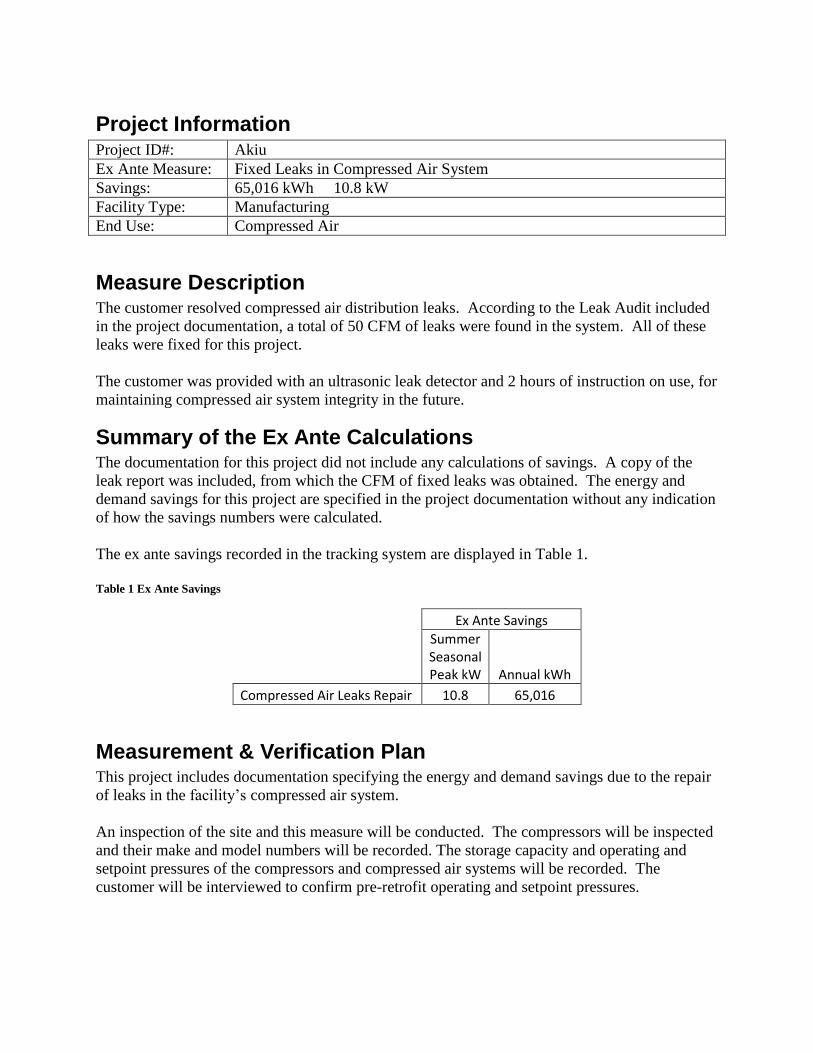
Project Information Project ID#: Akiu
Ex Ante Measure: Fixed Leaks in Compressed Air System
Savings: 65,016 kWh 10.8 kW
Facility Type: Manufacturing
End Use: Compressed Air
Measure Description The customer resolved compressed air distribution leaks. According to the Leak Audit included
in the project documentation, a total of 50 CFM of leaks were found in the system. All of these
leaks were fixed for this project.
The customer was provided with an ultrasonic leak detector and 2 hours of instruction on use, for
maintaining compressed air system integrity in the future.
Summary of the Ex Ante Calculations The documentation for this project did not include any calculations of savings. A copy of the
leak report was included, from which the CFM of fixed leaks was obtained. The energy and
demand savings for this project are specified in the project documentation without any indication
of how the savings numbers were calculated.
The ex ante savings recorded in the tracking system are displayed in Table 1.
Table 1 Ex Ante Savings
Ex Ante Savings
Summer Seasonal Peak kW Annual kWh
Compressed Air Leaks Repair 10.8 65,016
Measurement & Verification Plan This project includes documentation specifying the energy and demand savings due to the repair
of leaks in the facility’s compressed air system.
An inspection of the site and this measure will be conducted. The compressors will be inspected
and their make and model numbers will be recorded. The storage capacity and operating and
setpoint pressures of the compressors and compressed air systems will be recorded. The
customer will be interviewed to confirm pre-retrofit operating and setpoint pressures.
The customer will be interviewed about the operation and controls of the compressed air system
and the repaired leaks. Specifically, the site representative will be asked to verify that the leaks
specified in the air leak repair report were fixed.
The site representative will be interviewed regarding the benefits of the leak reduction program
and any effects on customer behavior regarding leaks; were additional leaks identified after the
initial project; were the leaks repaired internally; has the customer worked at lowering the system
pressure. The site representative will also be asked about the helpfulness and usefulness of the
input provided by the Connecticut Energy Efficiency Fund (CEEF) Energy Engineer as well as
overall satisfaction with the program.
The customer will also be asked about other possible changes at the facility that might have
affected the operation of the compressors, e.g. changes to the processes, production, or hours of
operation compared to the baseline operation.
IPMVP Option A will be used to establish savings for this measure.
Energy use metering of the air compressors will be performed at the panel level with DENT
ElitePro energy loggers for a period of no less than two weeks at a maximum interval of 15
minutes. The Power Factor, Amps, and Volts will also be logged with the DENT ElitePro. In
addition, spot measurement of Volts, Amps, Power Factor, and kW will be taken during the site
visit using a NIST calibrated Fluke 1735 power meter. If energy usage or power kW trend data is
available from the compressor controls, it will also be used to verify the post-retrofit operation of
the compressed air system.
The collected kW data and manufacturer performance curves for the new compressors will be
used to develop an air flow profile for the compressed air system. If curves are not available, the
AirMaster+ or other software program will be used to establish the air flow profiles of the post-
retrofit compressed air system. The demand kW and usage kWh of the compressors will be
considered to be the post-retrofit condition for the compressed air measures associated with this
project.
The baseline condition for these measures will be the current compressed air systems prior to the
leak repairs. The air usage CFM due to the leaks cannot be positively confirmed, but the values
will be checked for reasonableness. The post retrofit metered kW and calculated air profile will
be used to establish the specific kW per CFM across the range of operation. The CFM reduction
and these values will be used to calculate energy kWh savings for the metered period for each
facility.
Leak Repair Energy kWh Savings = (kW/cfm * cfm reduction, leak repair) for metered period
If it is confirmed that the metered period of operation is representative of typical operation, the
results will be extrapolated to establish annual energy kWh savings. If the metered period is not
representative of current annual operating conditions, the results will be normalized to account
for differences, e.g. hours of operation, air usage, etc.
Peak demand kW savings for each measure will be established using the average kW savings due
to CFM usage reduction for the appropriate peak periods.
Leak Repair Demand kW Savings = Average (kW/cfm * cfm reduction, leak repair) for metered
peak hours
The demand peak hours are calculated for 4 different time periods; average summer, winter and
seasonal summer and winter. The average summer demand savings are from 1:00 to 5:00 PM on
non-holiday weekdays from June through August. The average winter demand savings are from
5:00 to 7:00 PM during non-holiday weekdays in December and January. The season summer
and winter demand savings are determined when the ISO New England Real-Time System
Hourly Load is equal to or greater than 90% of the most recent “50/50” System Peak Load
forecast for the respective summer and winter periods laid out for the average demand periods.
Description of Verification An initial site visit to verify the installation of the measure and install energy loggers was
conducted on January 24, 2012. The facility manager was interviewed and they provided
updated information about the compressed air system. The facility manager explained that all of
the work specified in the project documentation had been completed and that the system pressure
is maintained at 96 psi, and has not changed with the completion of the project. (1) DENT
ElitePro Energy Logger was installed during the site visit to monitor the energy use of the
CompAi L75SR-13A/V1 compressor that has been in use at the facility since before the project’s
completion.
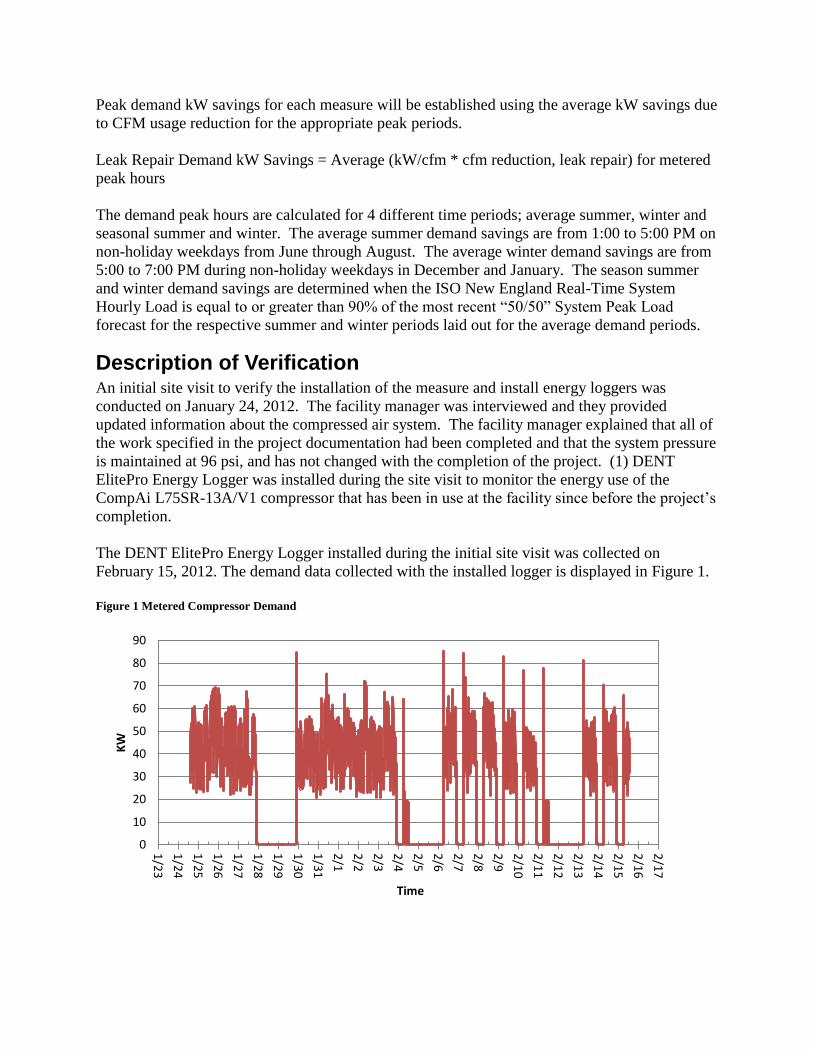
The DENT ElitePro Energy Logger installed during the initial site visit was collected on
February 15, 2012. The demand data collected with the installed logger is displayed in Figure 1.
Figure 1 Metered Compressor Demand
0
10
20
30
40
50
60
70
80
90 1
/23
1/2
4
1/2
5
1/2
6
1/2
7
1/2
8
1/2
9
1/3
0
1/3
1
2/1
2/2
2/3
2/4
2/5
2/6
2/7
2/8
2/9
2/1
0
2/1
1
2/1
2
2/1
3
2/1
4
2/1
5
2/1
6
2/1
7
KW
Time
Summary of Calculations The ex post energy savings for this measure are 52,962 kWh, compared to the ex ante savings of
65,016 kWh per year for a realization rate of 81%. The ex post summer and winter demand
savings are 7.92 kW and 7.68 kW, respectively, compared to the ex ante demand savings of
10.80 kW for both summer and winter, yielding realization rates of 73% and 71%, respectively.
The ex post summer and winter seasonal peak demand savings are both 9.91 kW.
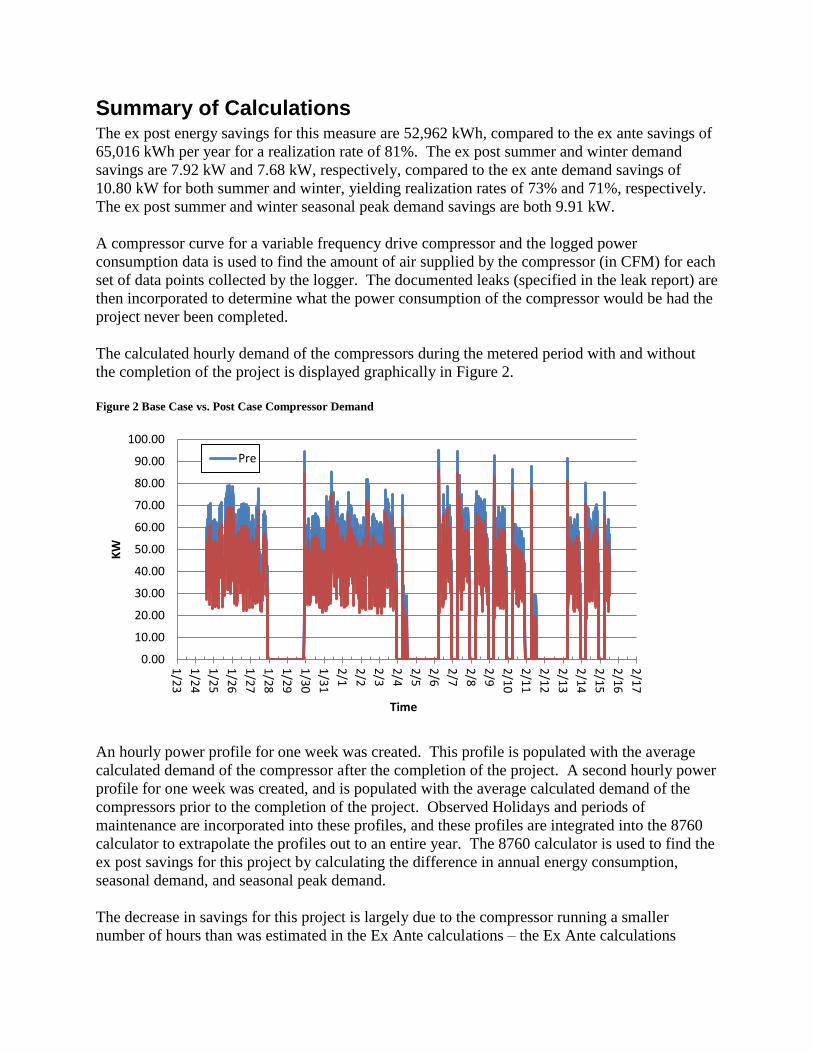
A compressor curve for a variable frequency drive compressor and the logged power
consumption data is used to find the amount of air supplied by the compressor (in CFM) for each
set of data points collected by the logger. The documented leaks (specified in the leak report) are
then incorporated to determine what the power consumption of the compressor would be had the
project never been completed.
The calculated hourly demand of the compressors during the metered period with and without
the completion of the project is displayed graphically in Figure 2.
Figure 2 Base Case vs. Post Case Compressor Demand
An hourly power profile for one week was created. This profile is populated with the average
calculated demand of the compressor after the completion of the project. A second hourly power
profile for one week was created, and is populated with the average calculated demand of the
compressors prior to the completion of the project. Observed Holidays and periods of
maintenance are incorporated into these profiles, and these profiles are integrated into the 8760
calculator to extrapolate the profiles out to an entire year. The 8760 calculator is used to find the
ex post savings for this project by calculating the difference in annual energy consumption,
seasonal demand, and seasonal peak demand.
The decrease in savings for this project is largely due to the compressor running a smaller
number of hours than was estimated in the Ex Ante calculations – the Ex Ante calculations
0.00
10.00
20.00
30.00
40.00
50.00
60.00
70.00
80.00
90.00
100.00
1/2
3
1/2
4
1/2
5
1/2
6
1/2
7
1/2
8
1/2
9
1/3
0
1/3
1
2/1
2/2
2/3
2/4
2/5
2/6
2/7
2/8
2/9
2/1
0
2/1
1
2/1
2
2/1
3
2/1
4
2/1
5
2/1
6
2/1
7
KW
Time
Pre

assume that the compressor runs 6020 hours/year, but the monitoring data shows that the
compressor only runs approximately 5535 hours/year.
The adjustment to the savings described above is categorized as an operational adjustment to the
savings. Not other adjustments to the savings were made. The savings after each adjustment
type, the ex post savings, and the realization rates for this project are displayed in
Table 2.
Table 2 Project Savings Comparison
Summer Seasonal
Peak Savings
Winter Seasonal
Peak Savings
Summer Peak
Savings
Winter Peak
Savings
kWh Savings
Ex Ante Savings 10.80 10.80 - - 65,016
Documentation Adjustment 10.80 10.80 - - 65,016
Technology Adjustment 10.80 10.80 - - 65,016
Quantity Adjustment 10.80 10.80 - - 65,016
Operation Adjustment 9.91 9.91 7.92 7.68 52,962
Heating and Cooling Adjustment 9.91 9.91 7.92 7.68 52,962
Ex Post Savings 9.91 9.91 7.92 7.68 52,962
Realization Rate 92% 92% - - 81%
Project Information Project ID#: AmGo
Measure: Condenser Coil Cleaning
Ex Ante Savings: 30,727 kWh
Facility Type: Manufacturing
End Use: HVAC
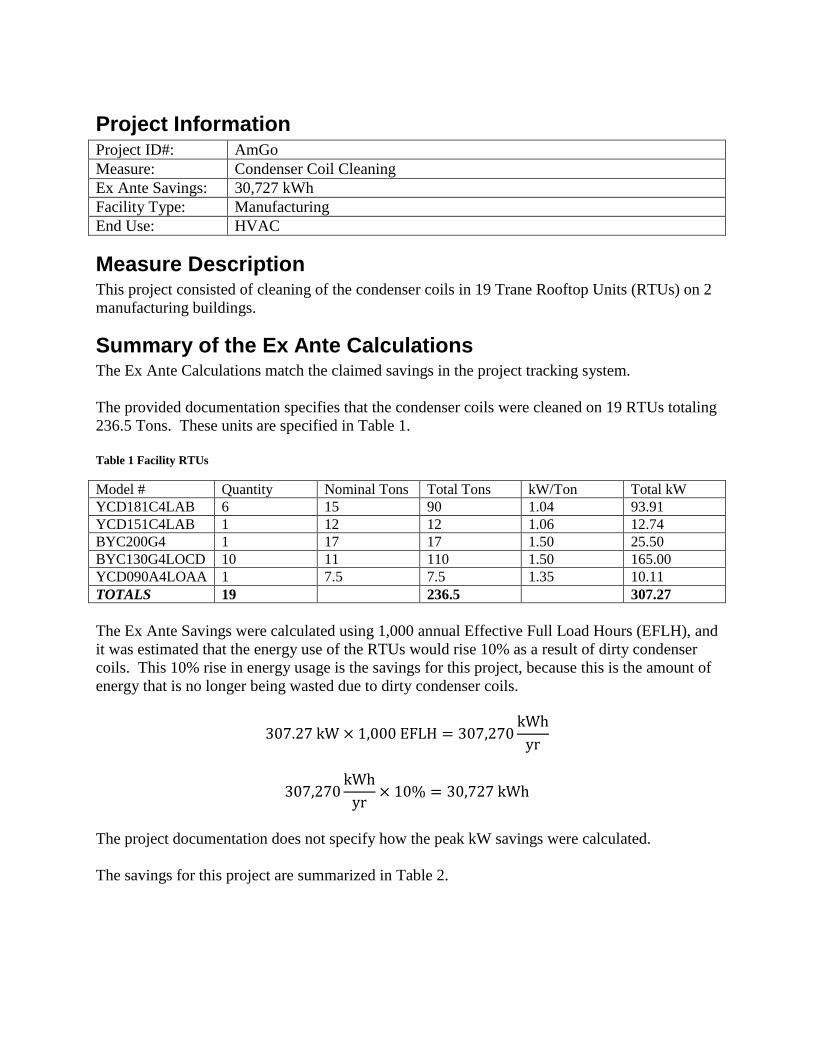
Measure Description This project consisted of cleaning of the condenser coils in 19 Trane Rooftop Units (RTUs) on 2
manufacturing buildings.
Summary of the Ex Ante Calculations The Ex Ante Calculations match the claimed savings in the project tracking system.
The provided documentation specifies that the condenser coils were cleaned on 19 RTUs totaling
236.5 Tons. These units are specified in Table 1.
Table 1 Facility RTUs
Model # Quantity Nominal Tons Total Tons kW/Ton Total kW
YCD181C4LAB 6 15 90 1.04 93.91
YCD151C4LAB 1 12 12 1.06 12.74
BYC200G4 1 17 17 1.50 25.50
BYC130G4LOCD 10 11 110 1.50 165.00
YCD090A4LOAA 1 7.5 7.5 1.35 10.11
TOTALS 19 236.5 307.27
The Ex Ante Savings were calculated using 1,000 annual Effective Full Load Hours (EFLH), and
it was estimated that the energy use of the RTUs would rise 10% as a result of dirty condenser
coils. This 10% rise in energy usage is the savings for this project, because this is the amount of
energy that is no longer being wasted due to dirty condenser coils.
The project documentation does not specify how the peak kW savings were calculated.
The savings for this project are summarized in Table 2.
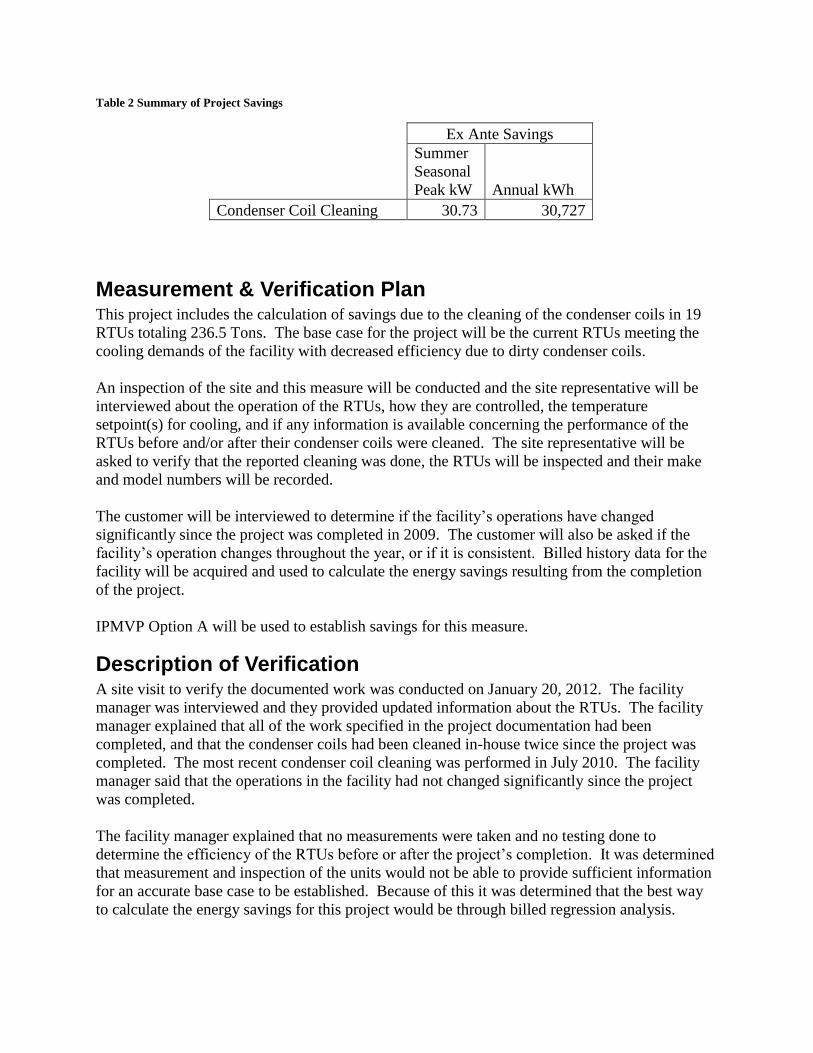
Table 2 Summary of Project Savings
Ex Ante Savings
Summer
Seasonal
Peak kW Annual kWh
Condenser Coil Cleaning 30.73 30,727
Measurement & Verification Plan This project includes the calculation of savings due to the cleaning of the condenser coils in 19
RTUs totaling 236.5 Tons. The base case for the project will be the current RTUs meeting the
cooling demands of the facility with decreased efficiency due to dirty condenser coils.
An inspection of the site and this measure will be conducted and the site representative will be
interviewed about the operation of the RTUs, how they are controlled, the temperature
setpoint(s) for cooling, and if any information is available concerning the performance of the
RTUs before and/or after their condenser coils were cleaned. The site representative will be
asked to verify that the reported cleaning was done, the RTUs will be inspected and their make
and model numbers will be recorded.
The customer will be interviewed to determine if the facility’s operations have changed
significantly since the project was completed in 2009. The customer will also be asked if the
facility’s operation changes throughout the year, or if it is consistent. Billed history data for the
facility will be acquired and used to calculate the energy savings resulting from the completion
of the project.
IPMVP Option A will be used to establish savings for this measure.
Description of Verification A site visit to verify the documented work was conducted on January 20, 2012. The facility
manager was interviewed and they provided updated information about the RTUs. The facility
manager explained that all of the work specified in the project documentation had been
completed, and that the condenser coils had been cleaned in-house twice since the project was
completed. The most recent condenser coil cleaning was performed in July 2010. The facility
manager said that the operations in the facility had not changed significantly since the project
was completed.
The facility manager explained that no measurements were taken and no testing done to
determine the efficiency of the RTUs before or after the project’s completion. It was determined
that measurement and inspection of the units would not be able to provide sufficient information
for an accurate base case to be established. Because of this it was determined that the best way
to calculate the energy savings for this project would be through billed regression analysis.
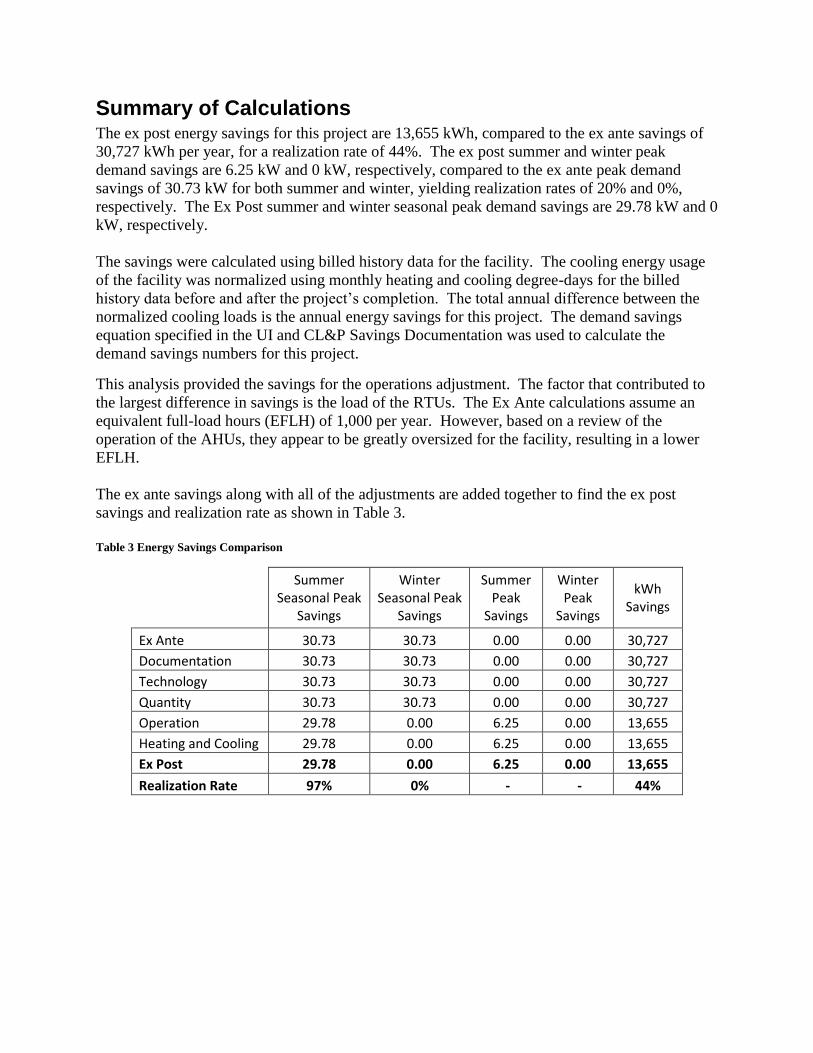
Summary of Calculations The ex post energy savings for this project are 13,655 kWh, compared to the ex ante savings of
30,727 kWh per year, for a realization rate of 44%. The ex post summer and winter peak
demand savings are 6.25 kW and 0 kW, respectively, compared to the ex ante peak demand
savings of 30.73 kW for both summer and winter, yielding realization rates of 20% and 0%,
respectively. The Ex Post summer and winter seasonal peak demand savings are 29.78 kW and 0
kW, respectively.
The savings were calculated using billed history data for the facility. The cooling energy usage
of the facility was normalized using monthly heating and cooling degree-days for the billed
history data before and after the project’s completion. The total annual difference between the
normalized cooling loads is the annual energy savings for this project. The demand savings
equation specified in the UI and CL&P Savings Documentation was used to calculate the
demand savings numbers for this project.
This analysis provided the savings for the operations adjustment. The factor that contributed to
the largest difference in savings is the load of the RTUs. The Ex Ante calculations assume an
equivalent full-load hours (EFLH) of 1,000 per year. However, based on a review of the
operation of the AHUs, they appear to be greatly oversized for the facility, resulting in a lower
EFLH.
The ex ante savings along with all of the adjustments are added together to find the ex post
savings and realization rate as shown in Table 3.
Table 3 Energy Savings Comparison
Summer Seasonal Peak
Savings
Winter Seasonal Peak
Savings
Summer Peak
Savings
Winter Peak
Savings
kWh Savings
Ex Ante 30.73 30.73 0.00 0.00 30,727
Documentation 30.73 30.73 0.00 0.00 30,727
Technology 30.73 30.73 0.00 0.00 30,727
Quantity 30.73 30.73 0.00 0.00 30,727
Operation 29.78 0.00 6.25 0.00 13,655
Heating and Cooling 29.78 0.00 6.25 0.00 13,655
Ex Post 29.78 0.00 6.25 0.00 13,655
Realization Rate 97% 0% - - 44%
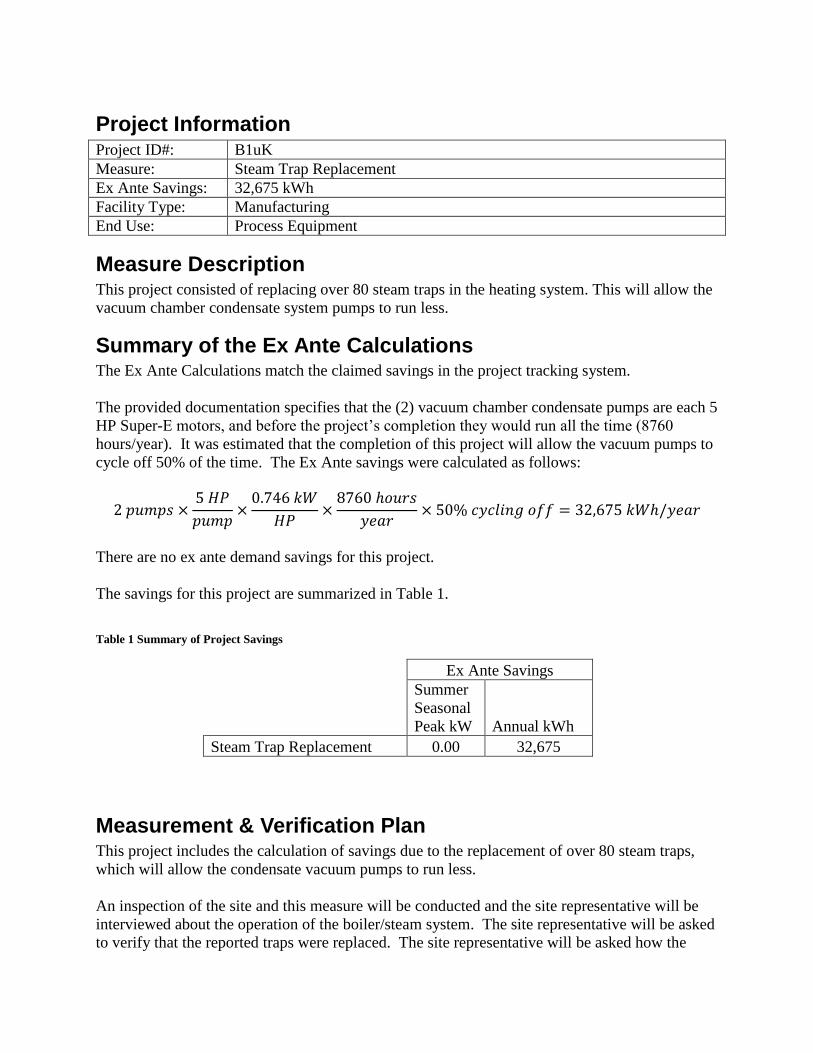
Project Information Project ID#: B1uK
Measure: Steam Trap Replacement
Ex Ante Savings: 32,675 kWh
Facility Type: Manufacturing
End Use: Process Equipment
Measure Description This project consisted of replacing over 80 steam traps in the heating system. This will allow the
vacuum chamber condensate system pumps to run less.
Summary of the Ex Ante Calculations The Ex Ante Calculations match the claimed savings in the project tracking system.
The provided documentation specifies that the (2) vacuum chamber condensate pumps are each 5
HP Super-E motors, and before the project’s completion they would run all the time (8760
hours/year). It was estimated that the completion of this project will allow the vacuum pumps to
cycle off 50% of the time. The Ex Ante savings were calculated as follows:
There are no ex ante demand savings for this project.
The savings for this project are summarized in Table 1.
Table 1 Summary of Project Savings
Ex Ante Savings
Summer
Seasonal
Peak kW Annual kWh
Steam Trap Replacement 0.00 32,675
Measurement & Verification Plan This project includes the calculation of savings due to the replacement of over 80 steam traps,
which will allow the condensate vacuum pumps to run less.
An inspection of the site and this measure will be conducted and the site representative will be
interviewed about the operation of the boiler/steam system. The site representative will be asked
to verify that the reported traps were replaced. The site representative will be asked how the
vacuum pumps are controlled, and if they can verify that the pumps were running all the time
throughout the entire year as specified in the project documentation.
The customer will be interviewed to determine if the facility’s operations have changed
significantly since the project was completed. The customer will also be asked if the facility’s
operation changes throughout the year, or if it is consistent.
IPMVP Option A will be used to establish savings for this measure.
The vacuum pumps will be inspected and their specifications will be recorded. Assuming that
the pump motors are fixed-speed, a spot measurement of their power consumption when on will
be taken, and a U12-012 external channel logger with 20A split-core current transducer will be
installed to monitor the operation of the pumps for a minimum of 2 weeks with a time interval no
greater than 15 minutes.
Description of Verification An initial site visit to verify the documented work was conducted on January 27, 2012. The site
representative was interviewed, but they were unable to verify most of the documented base case
information.
The vacuum pumps were located, and their specifications were recorded. A spot measurement of
power consumption was taken using a NIST-calibrated Fluke 1735 power analyzer.
Summary of Calculations The ex post energy savings for this project are 21,516 kWh, compared to the ex ante savings of
32,675 kWh per year, for a realization rate of 66%. The ex post summer and winter peak
demand savings are 2.96 kW and 2.93 kW, respectively, compared to the ex ante peak demand
savings of 0 kW for both summer and winter. The Ex Post summer and winter seasonal peak
demand savings are 2.83 kW and 2.52 kW, respectively.
The savings were calculated using the current data gathered from an installed U12-012 external
channel logger. Based on the customer interview, the operation of the vacuum pumps was
assumed to be consistent throughout the year, as the boilers are run year round for the process.
The vacuum pumps were assumed to run all the time in the base case. For the Post case, a
weekly on/off profile was created for the pumps, and this was multiplied by the demand of the
pumps when on to create a weekly demand profile. This weekly profile was put into the 8760
calculator to determine the annual energy and demand savings for the project. The metered data
is displayed in Figure 1.

Figure 1 Vacuum Pump Logger Data
In Figure 1 it can be seen that there are 2 stages to the vacuum pumps’ operation, the low stage
being when only one of the pumps is operating, and the high stage being when both pumps are
operating.
The largest contributor to the decrease in savings is due to the fact that the vacuum pumps are
running significantly more in the post condition that expected based on the ex ante calculations.
The metered data clearly shows that nearly all of the time at least one of the pumps is running,
and occasionally both pumps are running – this equates to the pumps running approximately
70% of the time, more than the 50% assumed in the Ex Ante calculations. Because the pumps
are running more than predicted, the savings for this project are less than predicted.
Because the vacuum pumps are in an unconditioned area of the building there are no heating and
cooling adjustments for this project.
The Ex Ante and Ex Post savings, along with all the adjustments made and the realization rates
for this project are displayed in Table 2.
Table 2 Energy Savings Comparison
Summer Seasonal Peak
Savings
Winter Seasonal Peak
Savings
Summer Peak
Savings
Winter Peak
Savings
kWh Savings
Ex Ante 0.00 0.00 - - 32,675
Documentation 0.00 0.00 - - 32,675
Technology 0.00 0.00 - - 32,675
Quantity 0.00 0.00 - - 32,675
Operation 2.83 2.52 2.96 2.93 21,516
Heating and Cooling 2.83 2.52 2.96 2.93 21,516
Ex Post 2.83 2.52 2.96 2.93 21,516
Realization Rate - - - - 66%
0.00
2.00
4.00
6.00
8.00
10.00 K
W
Time


![[2015] PwC-BEPS Final Reports.pdf](https://img.dokumen.tips/doc/110x75/577c783a1a28abe0548f2d80/2015-pwc-beps-final-reportspdf.jpg)