Embed Size (px)
Citation preview

www.olg.ca
SAULT STE. MARIE70 Foster Drive, Suite 800Sault Ste. Marie, ON P6A 6V2705-946-6464
TORONTO4120 Yonge Street, Suite 500Toronto, ON M2P 2B8416-224-1772
An Operational Enterprise Agency of the Province of Ontario
OLG Support Centre - Customer Inquiries1-800-387-0098The Ontario Problem Gambling Helpline1-888-230-3505
ISSN 1499 4887Ce rapport est également publié en français sous le nom de Rapport annuel 2016-2017 de la Société des loteries et des jeux de l’Ontario. Il est disponible en composant le 1-800-387-0098.
2016–17 Annual Report
ON
TAR
IO LO
TTER
Y AN
D G
AM
ING
CO
RP
OR
ATION
20
16
–17
AN
NU
AL R
EP
OR
T
52114 Form 1 AnnualReport2016-2017-Cover_English.indd 1-2 2017-10-31 3:08 PM

This Annual Report is printed in English and French on Canadian-made Rolland Enviro100 paper, which is manufactured from 100 per cent post-consumer waste �bre, is Processed Chlorine Free (PCF) and uses BioGas in its production (an alternative “green energy” source produced from decomposing waste collected from land�ll sites) to reduce greenhouse emissions and ozone-layer depletion.
Rolland Enviro100 saves the harvesting of mature trees, reduces solid waste that would have gone into land�ll sites, uses 80 per cent less water than conventional paper manufacturing and helps reduce air and water pollution.
Certified ProcessedChlorine Free
100% Post-ConsumerWaste Fibre
Recyclable WhereFacilities Exist
Green EnergySource
52114 Form 1 AnnualReport2016-2017-Cover_English.indd 3-4 2017-10-31 3:08 PM

Message from the Chair _______________________ 2
Message from the President and Chief Executive Of�cer ____________________ 3
Economic Impact ____________________________ 4
The Path Forward ____________________________ 6
Overview ___________________________________ 11
Financial Highlights _________________________ 12
Board of Directors ___________________________ 13
Executive Committee ________________________ 13
Governance ________________________________ 14
Management’s Discussion and Analysis ________ 15
Management’s Responsibility for Annual Reporting ________________________ 36
Independent Auditors’ Report _________________ 37
Consolidated Financial Statements ____________ 38
Notes to the Consolidated Financial Statements ________________________ 42
52114 Form 2 AnnualReport2016-2017-Text_English.indd 1 2017-11-02 5:41 PM

OLG ANNUAL REPORT 2016–172
MESSAGE FROM THE CHAIRThe Board of Directors of the Ontario Lottery and Gaming Corporation (OLG) is comprised of a talented group of individuals. It has been a pleasure serving with them since becoming OLG’s Chair in November 2016. Together, we are committed to ensuring a strong Net Pro�t to the Province while continuing OLG’s leadership in Responsible Gambling programming. We also understand the important role we play, as part of our mandate, in enhancing regional economic development.
We are supportive of the transformation underway at OLG and have con�dence in senior management’s business and modernization plans. We look forward to ful�lling our governance role as OLG continues to build a strong lottery and gaming industry that will bene�t the people of Ontario for many years to come.
On a personal note, I would like to acknowledge and thank my predecessor, Philip Olsson. Through his leadership as Chair and his dedication to OLG, Mr. Olsson has made many signi�cant and lasting contributions to the organization over his three-year term. I would also like to thank Wilson Teixeira for all he has done for OLG over his two terms as a member of the board.
George L. Cooke Chair
Stephen Rigby, President and CEO
George L. Cooke, Chair
52114 Form 2 AnnualReport2016-2017-Text_English.indd 2 2017-11-02 5:41 PM

3MESSAGE FROM THE CHAIR AND MESSAGE FROM THE PRESIDENT AND CHIEF EXECUTIVE OFFICER
MESSAGE FROM THE PRESIDENT AND CHIEF EXECUTIVE OFFICER I am pleased to present our 2016–17 Annual Report, which details a productive year at the Ontario Lottery and Gaming Corporation (OLG). It was a year marked by record �nancials; signi�cant progress on modernization; and the development of a new vision, mission and strategic priorities to articulate where we’re going as an organization.
OLG’s vision is to develop world-class gaming entertainment for Ontario. Our mission is to generate revenue for the province, stimulate and enhance economic development, and promote Responsible Gambling – all in the best interests of the Province of Ontario. In 2016–17, OLG delivered a record $2.36 billion in Net Pro�t to the Province to support key government priorities like health care, amateur athletics and problem gambling prevention, treatment and research. Hundreds of millions more went to host communities, First Nations, lottery retailers and local charities across the province, among other recipients.
These are remarkable results for an organization that is balancing the needs of our current day business, while meeting the challenges of transforming for the future.
OLG is making fundamental changes to the way lottery and gaming are delivered in Ontario, against the global backdrop of a rapidly changing gaming business and an increasingly digital industry.
One of our strategic priorities is to continue executing the land-based gaming modernization plan, which will enhance gaming entertainment for our customers while maximizing the �nancial and economic impact to the province. Since our last report, we made signi�cant progress on this plan including the transfer of the operation of sites within the North and Southwest Gaming Bundles to Gateway Casinos & Entertainment Limited and the release of Requests for Proposal for the Greater Toronto Area (GTA), West GTA, Central, Ottawa and Niagara Gaming Bundles. We expect to announce the successful service provider for each of these bundles in the 2017–18 and 2018–19 �scal years.
The year also saw the opening of the �rst new casino in Ontario in more than a decade. Ontario Gaming East Limited Partnership, the service provider in the East Gaming Bundle, built and now owns and operates Shorelines Casino Belleville, which opened in January 2017.
As we move forward with our land-based gaming modernization, we will continue to collaborate with key stakeholders and partners to ensure OLG is positioned for growth and innovation in a responsible manner. As new operators take over gaming sites, they will be required to adhere to the same rigorous Responsible Gambling (RG) standards and controls that are in place at OLG. For example, operators will be required to deliver the RG training that OLG developed in collaboration with the Centre for Addiction and Mental Health.
The 2016–17 �scal year also saw new developments in our Lottery business. Speci�cally, OLG discontinued the Request for Proposal for Lottery in favour of a revised approach to generate more value from Lottery as a retained business. We have taken a number of steps this year to ensure our technology and product solutions are responsive to changing customer needs.
In December 2016, we issued a Request for Information (RFI) on a new player platform. Information and advice received from the market in response to the RFI helped us �nd out how upgrades to our current technology infrastructure can improve the ways we connect with customers. In February 2017, we released a Request for Pre-Quali�cation to help bring us closer to selecting a vendor to replace and update our existing lottery terminals and network to reach more customers across Ontario.
As the way we do business changes, OLG must continually evolve. We have identi�ed key cultural characteristics and behaviours that are guiding our efforts in talent management and will provide a foundation as we build out a new organization – more nimble, agile and digitally-oriented – that is driven by the pursuit of innovation and guided by an enhanced understanding of our customers. New analytic capabilities and capacity are being developed that will help us to continually assess our impact on customers and their experiences, using a fact-based approach.
The greatest contributing factor to a company’s success is always its people. Certainly the successes we’ve had this year would not be possible without the dedication and commitment of our own employees across the organization and those that now work with an expanding portfolio of service providers. My thanks to them for their continued efforts in serving our customers and their contributions to a record-breaking �nancial performance.
Stephen RigbyPresident and Chief Executive Of�cer
52114 Form 2 AnnualReport2016-2017-Text_English.indd 3 2017-11-02 5:41 PM

OLG ANNUAL REPORT 2016–174
ECONOMIC IMPACTSince 1975, the Ontario Lottery and Gaming Corporation (OLG or the Corporation) has provided nearly $47 billion to the Province and the people of Ontario. OLG’s annual payments to the province have helped support the operation of hospitals and other provincial priorities; problem gambling prevention, treatment and research; amateur sport through the Quest for Gold program; and local and provincial charities through the Ontario Trillium Foundation. OLG is also helping to build a more sustainable horse racing industry in Ontario. In � scal 2016–17 alone, OLG contributed $2.36 billion in Net Pro� t to the Province to support these programs.
IN FISCAL 2016–17 ALONE, OLG GENERATED $4.1 BILLION IN TOTAL ECONOMIC ACTIVITY IN ONTARIO.
*Net Pro� t to the Province is the amount the Corporation returns to the Province of Ontario after stakeholder and other payments.**based on government policy that directs 2% of forecasted OLG slot machine gross revenue (excluding slot machine revenue from the Resort Casinos and the Great Blue Heron Casino) to problem gambling funding
$2.2 BILLIONdirected to the operation of hospitals and other provincial priorities
$115.0 MILLIONdirected to the Ontario Trillium Foundation for the bene� t of local and provincial charities
$38.0 MILLION directed by the Ministry of Health and Long-Term Care to problem gambling prevention, treatment and research**
$10.0 MILLION to support amateur athletes through the Quest for Gold program
NET PROFIT TO THE PROVINCE*
Actual2015–16
$2,231
Budget2016–17
$1,965
Actual2016–17
$2,361
Budget2017–18
$2,134
Projected2018–19
$2,220
In addition to OLG’s payments to the province, there are several direct bene� ciaries of gaming proceeds, including host municipalities and Ontario First Nations.
OLG operations also contribute to the economy in a number of other ways.
Net Pro� t to the Province (in millions of dollars) � scal 2015–16 (actual) to � scal 2018–19 (projected)
Budget2016–17
$1,965
Actual2016–17
$2,361
2.36 $ billion
52114 Form 2 AnnualReport2016-2017-Text_English.indd 4 2017-11-02 5:41 PM

5ECONOMIC IMPACT
$933.8 MILLIONin personnel costs for OLG’s 16,800 direct and indirect employees* across the province
1.68 $265.6 MILLIONin commissions paid to lottery retailers across Ontario
$199.4 MILLIONin goods and services purchased from Ontario businesses to support gaming facilities operated by OLG
$146.3 MILLIONin payments to municipalities and Ontario First Nations that host gaming facilities and Charitable Gaming Centres
$137.3 MILLIONin payments to Ontario First Nations through the Gaming Revenue Sharing and Financial Agreement
SUPPORT FOR LOCAL ECONOMIES
This includes:
HOST MUNICIPALITIES BENEFIT DIRECTLY FROM HOSTING FEES, PROPERTY TAX REVENUE, DEVELOPMENT FEES AND THE CREATION OF JOBS.
$20.0 MILLIONthat OLG directed to its Responsible Gambling program, including Resource Centres, education and
technology, program delivery, staff training and self-exclusion capital costs. Together, OLG and the
Ministry of Health and Long-Term Care spent $58.0 MILLION on responsible gambling and problem
gambling prevention, treatment and research.
$36.4 MILLIONin Charitable Gaming proceeds distributed to participating local charities
This includes:
*Direct employees are those employed directly by OLG. Indirect employees are those employed by the Resort Casinos and the Great Blue Heron Casino.
$ billion
58.9 CORPORATE
RESPONSIBILITY
$ million$2.5 MILLION
dedicated to the sponsorship of community festivals and events
52114 Form 2 AnnualReport2016-2017-Text_English.indd 5 2017-11-02 5:41 PM

OLG ANNUAL REPORT 2016–176
THE PATH FORWARD Across the province, Ontarians have more choices than ever to play their favourite lotteries, place a wager on the big game, enjoy a night out at a casino, slots facility or Charitable Gaming Centre or take in the thrills of horse racing. And PlayOLG’s online casino games mean players can partake when they want, where they want.
Responsibly providing players with more convenient options and better products began �ve years ago when OLG set out an ambitious plan to modernize lottery and gaming in the province. In �scal 2016–17, this important work continued. 100 per cent of OLG proceeds – $2.36 billion in 2016–17 – are invested in Ontario. Proceeds from OLG support initiatives across the province, including the operation of hospitals, amateur sports and cultural programs, local and provincial charities, as well as problem gambling research, prevention and treatment.
OLG is proud of the progress made in the past year and we are excited about the work ahead.
The gaming industry around the world is changing at a dramatic pace, and against this backdrop, OLG is making fundamental changes to the way lottery and gaming are delivered in Ontario. In December 2016, OLG introduced The Path Forward, an articulation of the core concepts that provide employees, both individually and collectively, with a clear sense of the direction we are taking as we drive change in our business and our organization.
This is not only good for the Corporation, but it is good for our customers and good for all Ontarians who bene�t from OLG’s proceeds.
STRATEGIC PRIORITIESServing as checkpoints along The Path Forward are �ve Strategic Priorities. Each must be realized in order for OLG to meet its modernization goals.
• Execute the land-based Gaming modernization plan which will enhance gaming entertainment for our customers while maximizing the �nancial and economic impact to the province
• Develop and implement a revised modernization approach to Lottery that ensures its technology and product solutions are responsive to changing customer needs
• Collaborate with key stakeholders and partners to ensure OLG is positioned for growth and innovation in a responsible manner
• Anticipate and advance developments in the gaming entertainment industry through an enhanced understanding of our customers
• Introduce cultural reform to actively manage the business for long-term success
ORGANIZATIONAL CHARACTERISTICSOLG has also identi�ed the Organizational Characteris-tics it needs not only for a successful modernization, but to remain a viable and vibrant force in this ever-changing gaming environment.
Resourcefulness: Identify and develop innovative opportunities using a fact-based approach
Execution Excellence: Commit to and deliver against strategic priorities
Agility: Focus on a bias to action and always be willing to take on new challenges
Ownership: Develop an environment where employees commit to and are
held accountable for results
Empowerment: Create a culture of opportunity,
transparency and trust that enables employees to deliver exceptional
results
Our VisionTo develop world-class gaming
entertainment for Ontario.
Our MissionTo generate revenue for the Province;
stimulate and enhance economic development; and promote high standards of
responsible gambling – all in the best interests of the Province of Ontario.
52114 Form 2 AnnualReport2016-2017-Text_English.indd 6 2017-11-02 5:41 PM

7THE PATH FORWARD
Key Initiative – A New Player Platform and Upgraded Retailer Terminals for the Lottery BusinessOLG’s revised approach to modernizing the lottery business is to focus on customers and implement new product and technology solutions that meet their current and anticipate their future needs.
Exploring a new player platformFocused on better understanding customers and enhancing the player experience, OLG began exploring how upgrades to its current technology infrastructure can improve the ways it connects with its online and retail customers. As a �rst step, OLG released a Request for Information (RFI) in December 2016 to seek advice from the market on a player platform. In May 2017, OLG released a Request for Proposal (RFP) for a player platform that is responsive to changing customer needs.
Updating Lottery terminals in retail storesAs part of its commitment to modernization, OLG will improve the lottery retail experience. In December 2016, OLG released a Request for Pre-Quali�cation (RFPQ) for service providers to replace and update the existing lottery retail terminals and network. This was followed by an RFP in May 2017. OLG also plans to add retailers to its network, allowing it to reach more customers across Ontario in a responsible way.
In October 2016, OLG introduced DAILY GRAND, a twice-weekly lottery that offers players the chance to win $1,000 every day for life. Three months later, Amin Liaghati Nasseri of Newmarket was Ontario’s �rst DAILY GRAND jackpot winner.
OUR KEY INITIATIVES AND ACHIEVEMENTS ALONG THE PATH FORWARDOn this road to modernization, it is important to measure progress on the Corporation’s key initiatives and re�ect on the achievements of �scal 2016–17. Complementing our Vision and Mission, OLG introduced principles that will guide the Corporation through its current modernization effort and beyond as it pursues its Vision to develop world-class gaming entertainment for Ontario.
With these six Guiding Principles in mind, OLG is proud to report on its achievements of the past year and its ongoing work on these initiatives that are helping to guide the Corporation on its path forward.
GUIDING PRINCIPLE – INNOVATION“Make innovation a key driver of how we grow”
Key Initiative – Continued Growth of Internet Gaming (iGaming)OLG’s investments to grow this new line of business are beginning to pay off. The number of registered customers has grown steadily since the January 2015 launch as awareness and trial of the website have increased, driving steady growth in weekly revenues.
PlayOLG’s product portfolio consists of slot and table games and select Lotto games (i.e., LOTTO MAX, LOTTO 6/49 and ENCORE). OLG expects growth to continue through the introduction of new products (e.g., progressive slot games and electronic INSTANT games) and a new mobile app, acquiring new game suppliers and expanding the player base.
iGaming is OLG’s only business where player registration is required. This provides OLG with great insight into player preferences, which among other things, allows for the delivery of appropriate and timely messages from the PlaySmart Responsible Gambling program.
“It gives me the freedom to follow my personal and professional passions and the wonderful ability to share with the people I love.”
- Amin Liaghati Nasseri
WHEN THE NATIONAL BASKETBALL ASSOCIATION (NBA) TIPPED OFF THE 2016–17 SEASON ON OCTOBER 25, 2016, CUSTOMERS SAW A NEW ADDITION ON THEIR PRO•LINE SHEETS. PROFESSIONAL BASKETBALL WAGERING RETURNED AFTER A 21-YEAR ABSENCE. WITH THE POPULARITY OF THE NBA AT AN ALL-TIME HIGH IN ONTARIO, OLG BROUGHT NBA GAMES BACK TO PRO•LINE GIVING CUSTOMERS EVEN MORE OPPORTUNITIES TO WAGER ON THEIR FAVOURITE SPORTS GAMES.
NBA RETURNS TO PRO•LINE
52114 Form 2 AnnualReport2016-2017-Text_English.indd 7 2017-11-02 5:41 PM

OLG ANNUAL REPORT 2016–178
GUIDING PRINCIPLE – CUSTOMER FOCUS“Assess our impact on the customer and their experience in everything we do”
Key Initiative – Strategic Procurement for Land-Based Gaming SitesWith the release of the RFP for the Niagara Gaming Bundle on April 10, 2017, all existing and proposed gaming sites in established gaming bundles were in the �nal stages of procurement to modernize gaming in Ontario. The Corporation follows a fair and competitive procurement process and has engaged the services of a Fairness Monitor for oversight and advice.
The Corporation made signi�cant progress on this initia-tive this past year. Highlights include:
• East Gaming Bundle: Fiscal 2016–17 marked the �rst full year of operation of the former OLG Casino Thousand Islands and OLG Slots at Kawartha Downs by a private sector service provider. Great Canadian Gaming Corporation (GCGC) rebranded the facilities as Shorelines properties and on January 11, 2017 the new Shorelines Casino Belleville opened to the public. The casino has created hundreds of jobs in the Belleville area and supports economic develop-ment across the region.
• North and Southwest Gaming Bundles: On December 13, 2016, OLG selected Gateway Casinos & Entertainment Limited (Gateway) as the service provider for the North and Southwest Gam-ing Bundles. Under the agreement for the South-west Gaming Bundle, on May 9, 2017, Gateway assumed the operations of OLG Slots at Western Fair, OLG Slots at Clinton Raceway, OLG Slots at Dresden Raceway, OLG Slots at Hanover Race-way, OLG Slots at Woodstock Raceway and OLG Casino Point Edward. On May 30, 2017, Gateway assumed operations of the sites within the North Gaming Bundle, which include OLG Casino Thunder Bay, OLG Casino Sault Ste. Marie and OLG Slots at Sudbury Downs. Gateway also has the opportunity to build two new gaming and entertainment facilities in the areas of Kenora and North Bay.
• Greater Toronto Area (GTA): The RFP for the GTA Gaming Bundle, which includes OLG Slots at Woodbine Racetrack and OLG Slots at Ajax Downs,
remains in market after its February 11, 2016 release to pre-quali�ed service providers. In August 2016, as part of the Ontario government’s commitment to work-ing with First Nations communities, it was announced that a number of historic revenue sharing agreements were reached between the Province of Ontario, OLG, the Mississaugas of Scugog Island First Nation and other parties. This allowed the Great Blue Heron Casino to be added to the GTA Gaming Bundle. OLG expects to announce the successful service provider for this gaming bundle in late summer 2017.
• Ottawa Area: On May 15, 2017, OLG selected Hard Rock Casino Ottawa Limited Partnership (Hard Rock) as the service provider for the Ottawa Gaming Bundle. Under the agreement for the Ottawa Gaming Bundle, Hard Rock will take over operations of OLG Slots at Rideau Carleton Raceway.
• Niagara: On April 10, 2017, OLG issued the RFP to pre-quali�ed vendors for the Niagara Gaming Bundle, which includes Niagara Fallsview Casino Resort and Casino Niagara. The candidate will also be responsible for operating the future Niagara Falls Entertainment Centre. OLG expects to announce the successful service provider in summer 2018.
OLG also issued RFPs for the West GTA and Central Gaming Bundles.
BIG WINNERS: IN FISCAL 2016–17, BIG LOTTERY WINS MADE DOZENS OF ONTARIANS INSTANT MILLIONAIRES.
Number of prizes won of
$1 million or more
Number of prizes of $50,000
to $999,999
Number of prizes of $10,000 to $49,999
781158
1,450
52114 Form 2 AnnualReport2016-2017-Text_English.indd 8 2017-11-02 5:41 PM

9THE PATH FORWARD
GUIDING PRINCIPLE – POLICY SHAPING“Play a strong role in shaping gaming policy in Ontario and Canada to create growth opportunities”
Key Initiative – Charitable Gaming Revitalization ProgramOLG continues to work with the industry to review its current business model and address a number of sector challenges in order to support long-term sustainability and responsible growth. The Corporation expects to be in a position to announce and implement the new business model in �scal 2017–18.
To date, the Charitable Gaming Revitalization Program has provided $151.7 million to nearly 1,800 local participating charities.
GUIDING PRINCIPLE – PARTNERSHIPS“Effectively partner with stakeholders, customers, employees and the private sector”
Key Initiative – Horse RacingBy building the foundation for industry-led success, OLG and the Government of Ontario are helping to create a more sustainable future for horse racing in the province.
In February 2016, the government extended support to the horse racing industry by two years. The extension will provide up to $100 million annually to the industry until March 2021. As the administrator of these transfer payments, in 2016–17, OLG distributed approximately $91 million of this funding to support close to 950 race dates.
OLG also contributes to building a positive brand for the industry through various initiatives. For example, OLG launched two advertising campaigns: one was geared towards current and new fans that positioned horse racing as a unique entertainment experience in Ontario, and the other was industry-facing, reinforcing OLG’s partnership with horse racing.
GUIDING PRINCIPLE – RESPONSIBILITY“Foster a healthy, sustainable player base through education, risk reduction and player assistance”
Key Initiative – Responsible Gambling (RG)OLG has a statutory, regulatory and policy mandate to make RG a core business priority. OLG’s RG program aims to prevent and mitigate harm to those who may have developed a problem, and to provide a gateway to support services and community resources. To this end, OLG works formally with government and independent agencies to help customers make informed gambling decisions. This enterprise-wide program encompasses customer education, customer assistance, Self-Exclusion, employee engagement and training, policy development, standards compliance and stakeholder relations.
Drawing from best practices across Canada and internationally, OLG embedded RG and safe play mechanisms into all aspects of PlayOLG, its Internet Gaming website. The platform provides links to register for Self-Exclusion and to obtain customer support services. Sophisticated third-party age and identity veri�cation is an integral part of the registration process to limit unauthorized access to the website.
In June 2015, a new RG pre-commitment tool was piloted at OLG Slots at Georgian Downs. MyPlaySmart is featured as part of the new Gaming Management System (GMS), allowing slot players to pre-commit to limits on their time and money spent gambling, helping them to monitor and assess their play and to adopt safe gambling habits. MyPlaySmart will be implemented at gaming sites in each gaming bundle as day-to-day operations are transferred to land-based gaming service providers. The timing of each implementation will be outlined in the contract between OLG and the respective service provider for each gaming bundle.
IN JANUARY 2017, RETAIL PARTNERS RANKED OLG AS THE NUMBER ONE SUPPLIER IN THE ADVANTAGE REPORT ™. RANKED AGAINST SOME OF CANADA’S LARGEST RETAIL BRANDS, THIS RECOGNITION SPEAKS TO OLG’S COMMITMENT TO BEING A GOOD PARTNER WITH LOTTERY RETAILERS ACROSS THE PROVINCE.
1 RETAILPARTNER
#
52114 Form 2 AnnualReport2016-2017-Text_English.indd 9 2017-11-02 5:41 PM

OLG ANNUAL REPORT 2016–1710
Self-Exclusion remains a core component of OLG’s RG program, designed to support individuals who make a personal commitment to control or stop their gambling. In �scal 2016–17, OLG implemented a new policy to ensure those registered in the Self-Exclusion program are not awarded prize payouts if they are in breach of their commitment. This policy enhancement aligns OLG with other leading gambling operators and is consistent with the recommendations made by the Responsible Gambling Council.
OLG extended the reach of this important program to all 31 Charitable Gaming Centres across Ontario.
OLG is also assisting the horse racing industry implement an RG strategy. It has consulted with the industry, documented existing practices across Ontario and identi�ed opportunities that might exist for future enhancements.
GUIDING PRINCIPLE – ECONOMIC STEWARDSHIP“Drive profitable growth, be cost conscious, invest efficiently and generate employment opportunities in Ontario”
Investing in OntarioSince the �rst WINTARIO lottery draw in 1975, 100 per cent of OLG proceeds have been invested in Ontario to support the operation of hospitals and other provincial priorities, amateur sport, horse racing and local and provincial charities. To date, this amount totals $46.9 billion. In �scal 2016–17, OLG’s Net Pro�t to the Province was $2.36 billion on record-breaking revenue of $7.47 billion.
OLG also made payments totalling more than $183.3 million to First Nations for hosting gaming facilities and in accordance with the Gaming Revenue Sharing and Financial Agreement, and lease, service and other commission agreements.
THE PATH FORWARD . . .
While OLG has made signi�cant progress this past year, the work continues to realize our Vision to develop world-class gaming entertainment for Ontario. This means that every day we will strive to ensure our customers experience the best in lottery products and casino games while ensuring that all Ontarians continue to bene�t from the solid �nancial returns of a provincial lottery and gaming sector that is operating in the most responsible way possible. OLG’s path forward leads to a strong and viable future that transforms the way people enjoy lottery and gaming in our province.
52114 Form 2 AnnualReport2016-2017-Text_English.indd 10 2017-11-02 5:41 PM

11OVERVIEW
OVERVIEWOntario Lottery and Gaming Corporation (OLG or the Corporation) and the operators of the Resort Casinos employ 16,800 people across Ontario. OLG conducts and manages gaming facilities, the sale of province wide lottery games, PlayOLG Internet Gaming and the delivery of bingo and other electronic gaming products at Charitable Gaming Centres, and is helping to build a more sustainable horse racing industry in Ontario.
The Corporation is intended to provide gaming entertainment in an ef�cient and socially responsible manner that maximizes economic bene�ts for the people of Ontario, related economic sectors and host communities.
The Ontario Lottery and Gaming Corporation Act, 1999 requires that net revenue from its operations be paid to the Government of Ontario Consolidated Revenue Fund. In �scal 2016–17, this revenue supported services such as the operation of hospitals, amateur sport and problem gambling prevention, treatment and research. Revenue from OLG operations is also made available to the Ontario Trillium Foundation by the government for distribution to charitable and not-for-pro�t organizations. OLG’s Charitable Gaming program also makes direct funding contributions to charitable gaming associations. Since the program’s inception, these direct funding payments have provided $151.7 million.
SOURCES OF REVENUEOLG’s operations and revenues are organized under �ve lines of business and a Corporate Services division.
LOTTERYOLG operates 21 terminal-based lottery and sports games and offers 79 INSTANT lottery products through approximately 9,800 independent retailers across the province.
CHARITABLE GAMINGOLG conducts and manages the operations of 31 Charitable Gaming Centres across Ontario. In addition to the classic paper-based play, these sites offer a variety of bingo and break open ticket games in electronic formats.
OLG RESORT CASINOSOLG is responsible for conducting and managing gaming at four Resort Casinos – Caesars Windsor, Casino Rama, Casino Niagara and Niagara Fallsview Casino Resort. These sites are operated, under contract, by private operating companies.
SLOTS AND CASINOSOLG operates 14 slot machine facilities at racetracks and owns and operates �ve casinos in Ontario. OLG also conducts and manages gaming at two casinos and one slot machine facility that are operated by a land-based gaming service provider.*
INTERNET GAMING OLG conducts and manages the operation of PlayOLG, its Internet Gaming website. The site offers slots and table games as well as sales of select Lotto games (i.e., LOTTO MAX, LOTTO 6/49 and ENCORE).
*OLG’s share of revenue from the service provider-operated sites (i.e., Shorelines Casino Belleville, Shorelines Casino Thousand Islands and Shorelines Slots at Kawartha Downs) is de�ned in the Casino Operating and Services Agreement with the service provider. In accordance with International Financial Reporting Standards, OLG recognizes revenue for these sites differently from those sites that it operates directly. Revenue is reported as total revenue less �xed, variable and permitted capital fees paid to the service provider. As a result of this reporting change, revenue reported from these sites in �scal 2016–17 will appear lower when compared to previous years. Net Pro�t to the Province is not affected by this reporting change.
In September 2016, OLG assumed ownership of the table games at Great Blue Heron Casino, and will conduct and manage the slots and table games at this facility until a land-based gaming service provider is selected.
52114 Form 2 AnnualReport2016-2017-Text_English.indd 11 2017-11-02 5:41 PM

OLG ANNUAL REPORT 2016–1712
FINANCIAL HIGHLIGHTS
$ Change
Lottery (104,843)
Charitable Gaming (12,909)
Resort Casinos 50,709
Slots and Casinos 87,440
Internet Gaming 9,195
Total OLG revenue change 29,592
(in thousands of dollars)
3,000
2,000
1,000
0
8,000
$ MILLIONS
7,000
6,000
4,000
5,000
7,44
5
(105)(13) 51 87
7,47
520
16–1
7
2015
–16
Lotte
ry
Char
itabl
e Ga
min
g
Reso
rt
Casi
nos
Slot
s an
d Ca
sino
s
9In
tern
et
Gam
ing
7.47 billion
$ LOTTERY $3,681 MILLION
In �scal 2016–17, OLG’s five lines of
business collectively generated revenue of
INTERNET GAMING $58 MILLION
SLOTS AND CASINOS $2,149 MILLION
OLG RESORT CASINOS $1,433 MILLION
CHARITABLE GAMING $153 MILLION
CHANGE IN REVENUE 2015–16 TO 2016–17
TOTAL REVENUE 2016–17
52114 Form 2 AnnualReport2016-2017-Text_English.indd 12 2017-11-02 5:41 PM

13GOVERNANCE
BOARD OF DIRECTORSGeorge L. Cooke (Chair)Appointed November 20, 2016
Philip Olsson (Chair)November 20, 2013 to November 19, 2016
Gail BeggsNovember 20, 2013 to November 19, 2015
Reappointed November 20, 2015
Sunir ChandariaMarch 5, 2014 to March 4, 2016
Reappointed March 5, 2016
John H. CraigAppointed December 2, 2015
Mary Beth CurrieNovember 20, 2013 to November 19, 2015
Reappointed November 20, 2015
Urban JosephDecember 11, 2013 to December 10, 2015
Reappointed December 11, 2015
Frances LankinNovember 20, 2013 to November 19, 2015
Reappointed November 20, 2015
Joanne LefebvreNovember 20, 2013 to November 19, 2015
Reappointed November 20, 2015
Lori O’NeillFebruary 12, 2014 to February 11, 2016
Reappointed February 12, 2016
Orlando M. RosaDecember 11, 2013 to December 10, 2015
Reappointed December 11, 2015
Wilson TeixeiraMarch 5, 2014 to March 4, 2016
March 5, 2016 to March 4, 2017
Steve WilliamsMay 27, 2015 to May 26, 2017
Reappointed May 27, 2017
The Chair is appointed for a period not exceeding three years.Directors are appointed for a period not exceeding two years.
EXECUTIVE COMMITTEEAs of March 31, 2017, senior executives responsible for day-to-day operations were:
Stephen RigbyPresident and Chief Executive Of�cer
Alexandra AguzziSenior Vice President, Corporate Affairs
Barbara AndersonSenior Vice President, Chief Financial Of�cer
Cal BrickerSenior Vice President, Horse Racing
Javier De la CubaSenior Vice President, Modernization
Brian GillSenior Vice President and Chief Technology Of�cer
Will HillSpecial Advisor to the President and Chief Executive Of�cer
Greg McKenzieExecutive Vice President and Chief Operating Of�cer
Vaike MurusaluVice President, Audit Services
David PridmoreSenior Vice President, Enterprise Strategy and Analytics
Larry RourkeSenior Vice President, Human Resources
Lori SullivanSenior Vice President, Governance, Legal and Compliance, General
Counsel and Corporate Secretary
LOTTERY $3,681 MILLION
52114 Form 2 AnnualReport2016-2017-Text_English.indd 13 2017-11-02 5:41 PM

OLG ANNUAL REPORT 2016–1714
GOVERNANCEThe legislative authority of the Corporation is set out in the Ontario Lottery and Gaming Corporation Act, 1999 (the Act). Classi�ed as an Operational Enterprise Agency, OLG has a single shareholder, the Government of Ontario, and for �scal 2016–17 reported through its Board of Directors to the Minister of Finance. Members of the Board of Directors and its Chair are appointed by the Lieutenant Governor in Council. Neither the Chair nor members of the board are full-time, nor are they members of Management.
BOARD MANDATEThe Board of Directors oversees the overall management of the affairs of the Corporation in accordance with its objectives as set out in the Act, the Corporation’s by-laws, the approved business plan and the Memorandum of Understanding between the Corporation and the Minister of Finance. The board’s mandate is to direct Management’s focus to optimizing the Corporation’s overall performance and increasing shareholder value by executing its various responsibilities, which include:
• to establish the goals, objectives and strategies for the Corporation consistent with the Corporation’s mandate and applicable government policies
• to approve the annual business plan as well as operating and capital budgets
• to de�ne and assess business risks• to review the adequacy and effectiveness of
internal controls in managing risks• to appraise the performance of the President and
Chief Executive Of�cer• to oversee a code of conduct to ensure the
highest standards in dealing with customers, suppliers and staff, with due regard to ethical values and the interests of the community at large in all corporate endeavours
• to track the overall performance of the Corporation• to remain informed and provide input, as
required, concerning communications with the Government of Ontario and stakeholders
• to ensure compliance with key policies, laws and regulations
The total remuneration paid to board members in �scal 2016–17 was $348,000.
BOARD COMMITTEESAs of March 31, 2017, the OLG Board of Directors operated through three working committees.
GOVERNANCE AND HUMAN RESOURCES COMMITTEEThe Governance and Human Resources Committee (the Committee) assists the board in developing and monitoring governance policies and practices. It helps identify policy areas for review and presents recommendations to the board for consideration so that the board can ensure the Corporation’s adherence to the highest standards in corporate governance. In addition, the Committee helps ensure that the Corporation has suf�cient organizational strength at the senior management level to achieve its short- and long-term goals. It also recommends, for board approval, the compensation and bene�t plans for senior management. Chair of this committee, as of March 31, 2017, is Urban Joseph.
AUDIT AND RISK MANAGEMENT COMMITTEEThe primary function of the Audit and Risk Management Committee (the Committee) is to assist the board in ful�lling its oversight responsibilities by reviewing and monitoring the Corporation’s �nancial statements, systems of internal controls, including those over �nancial reporting, capital expenditure program and Enterprise Risk Management program, as well as the compliance systems that have been established. In addition, the Committee assists the board by inquiring into and overseeing the �nancial matters of the Corporation. It reviews the budget framework, policies and procedures; oversees and contributes to the development of the annual budget and projections; and reviews �nancial performance. Chair of this committee, as of March 31, 2017, is Lori O’Neill.
SOCIAL RESPONSIBILITY COMMITTEEThe Social Responsibility Committee assists the board and the Corporation in ful�lling its social responsibility in the conduct of its business. It inquires into and oversees such areas as responsible gambling, game integrity and Smart Serve food and beverage service. It reviews, in particular, the design and implementation of Internet Gaming and other new game offerings, with a focus on preventing underage and problem gambling. Chair of this committee, as of March 31, 2017, is Frances Lankin.
52114 Form 2 AnnualReport2016-2017-Text_English.indd 14 2017-11-02 5:41 PM

15MANAGEMENT’S DISCUSSION AND ANALYSIS
MANAGEMENT’S DISCUSSION AND ANALYSISFor the �scal year ended March 31, 2017
1. INTRODUCTION AND DISCLOSURESThe following Management’s Discussion and Analysis (MD&A) comments on the consolidated �nancial position and �nancial performance of the Ontario Lottery and Gaming Corporation (OLG or the Corporation) and should be read together with the audited Consolidated Financial Statements of OLG for the �scal year ended March 31, 2017.
The Consolidated Financial Statements are presented in Canadian dollars and have been prepared in accordance with International Financial Reporting Standards (IFRS).
Certain comparative �gures in this MD&A and the accompanying audited Consolidated Financial Statements have been reclassi�ed, where necessary, to re�ect the current year’s presentation.
The Board of Directors, on the recommendation of its Audit and Risk Management Committee approved the contents of this MD&A on June 29, 2017.
FORWARD LOOKING STATEMENTSThis MD&A contains forward-looking statements about expected or potential future business and �nancial performance. For OLG, forward-looking statements include, but are not limited to: statements about possible transformation initiatives; future revenue and pro�t guidance; and other statements about future events or conditions. Forward-looking statements are not guarantees of future performance and involve risks and uncertainties that could cause actual results to differ materially from those projected. These risks and uncertainties include, but are not limited to: the uncertain economic environment; �uctuations in customer demand; foreign currency exchange rates; the outcome of litigations; and changes in government or regulation.
Although such statements are based on Management’s current estimates, expectations, and currently available competitive, �nancial and economic data, forward-looking statements are inherently uncertain. The reader is cautioned that a variety of factors could cause business conditions and results to differ materially from what is contained herein.
RECONCILIATION OF NON-IFRS MEASURESIn the following analysis, OLG has used several key performance indicators and non-IFRS measures which Management believes are useful in assessing the company’s performance. Readers are cautioned that these measures may not have standardized meanings under IFRS and therefore may not be comparable to similar terms used by other companies.
Direct expenses are costs that are directly associated with current �scal gaming or non-gaming revenue and vary as current year revenue changes.
Indirect expenses are costs that do not directly vary with current �scal revenue levels.
Contribution margin is total gaming and non-gaming revenue net of direct expenses.
Net Profit to the Province (NPP) is the amount the Corporation returns to the Province of Ontario after stakeholder and other payments. NPP is calculated on an accrual basis by adding back win contribution to net income.
Net win per patron is derived by dividing gaming revenue (net win) by the number of patrons.
Corporate Services expenses as a percentage of consolidated revenue is derived by dividing Corporate Services division expenses by consolidated revenue. The Corporate Services division provides support services to all of the revenue-generating lines of business.
Other Non-IFRS measures prevalent in this document may be speci�c to the Line of Business in which they occur and are de�ned when they are �rst used.
52114 Form 2 AnnualReport2016-2017-Text_English.indd 15 2017-11-02 5:41 PM

OLG ANNUAL REPORT 2016–1716
2. FISCAL 2016–17 FINANCIAL HIGHLIGHTS – EXECUTIVE SUMMARY
Fiscal 2016–17 was another record-breaking year for OLG in terms of both consolidated revenue and NPP, exceeding �scal 2015–16 actual results and budget projections. For the 12 months ended March 31, 2017, consolidated revenue was $7.47 billion, $640.7 million or 9.4 per cent above budget and $29.6 million or 0.4 per cent above prior year; NPP was $2.36 billion, $395.5 million or 20.1 per cent above budget and $130.0 million or 5.8 per cent above prior year.
These favourable results were driven by:
• continued strong Lottery revenue, led by national Lotto and INSTANT game sales • continued success of marketing strategies at gaming sites, especially those within the Greater Toronto Area (GTA)• the transition of table operations at the Great Blue Heron Casino to OLG in September 2016 • the opening of Shorelines Casino Belleville in January 2017 • an increase in the level of high-end play at Resort Casinos• signi�cant growth in iGaming revenue attributable to a growing number of active players, a higher hold and an
expanded game portfolio
These favourable results were offset by:
• unanticipated expenses related to the transfer of table operations at Great Blue Heron Casino to OLG• an increase in Gaming Revenue Sharing and Financial Agreement (GRSFA) payments as a result of higher
revenues experienced in �scal 2015–16 (basis for current year payments) than were projected. While GRSFA payments are budgeted, the actual payments for a given �scal year are based on the previous �scal year’s actual revenues
PRIOR YEAR HIGHLIGHTS – FISCAL 2015–16Total revenue for �scal 2015–16 was $7.45 billion, an increase of $801.1 million or 12.1 per cent from $6.64 billion in the �scal 2014–15. This increase was primarily led by Lottery revenue, which was up $517.0 million or 15.8 per cent compared to the previous year mainly due to higher value jackpots for LOTTO MAX and LOTTO 6/49 as well as an increase in INSTANT sales.
The Corporation’s NPP for �scal 2015–16 was $2.23 billion, $231.9 million or 11.6 per cent more than �scal 2014–15. The increase was attributable to higher revenue in each line of business. This was partially offset by higher expenses, the most notable of which were higher direct expenses and a one-time operator non-extension cost with respect to the Permanent Casino Operating Agreement for the Niagara Casinos.
FISCAL 2016–17 TOTAL REVENUE
(in billions of dollars)h0.4% vs �scal 2015–16 actualh9.4% vs �scal 2016–17 budget
FISCAL 2016–17NET PROFIT TO THE PROVINCE
(in billions of dollars)h5.8% vs �scal 2015–16 actualh20.1% vs �scal 2016–17 budget
*Fiscal 2016–17 budgeted revenue is calculated using gross gaming revenue generated at the land-based gaming service provider sites prior to the deduction of fees paid to the service provider. All other amounts are in accordance with IFRS
$7.17
$7.47
$6.83
$7.45
$6.64
2017–18Budget
2016–17Actual
2016–17Budget*
2015–16Actual
2014–15Actual
$2.13
$2.36
$1.97
$2.23
$2.00
2017–18Budget
2016–17Actual
2016–17Budget
2015–16Actual
2014–15Actual
52114 Form 2 AnnualReport2016-2017-Text_English.indd 16 2017-11-02 5:41 PM

17MANAGEMENT’S DISCUSSION AND ANALYSIS
THE PATH FORWARD – FISCAL 2017–18In �scal 2017–18, total revenue is projected at $7.17 billion and NPP at $2.13 billion. The following activities are anticipated to contribute to these projections:
• the introduction of new Lottery products and the positive impact of DAILY GRAND’s �rst full year of operations on the national Lotto category
• a full year of operation of the new Shorelines Casino Belleville within the East Gaming Bundle• the full year impact of table operations at the Great Blue Heron Casino• the transition of the North, Southwest, Ottawa, and GTA Gaming Bundles to private sector service providers
which is expected to decrease revenue but increase NPP. This is due to the recognition of revenue net of service provider fees and with a simultaneous decrease in expenses.
Overall, �scal 2017–18 will be a signi�cant transformational period as modernization initiatives progress, driving towards OLG’s goal of generating greater and more sustainable �nancial bene�ts for the province. NPP is expected to grow from $2.36 billion in �scal 2016–17 to $2.63 billion in �scal 2020–21.
*Payments to the Province of Ontario are calculated on a cash basis which includes win contribution. The Corporation remits a contribution to the Province of Ontario equal to 20 per cent of gaming revenue from the Resort Casinos and the Great Blue Heron Casino in accordance with the Ontario Lottery and Gaming Corporation Act, 1999.
OLG’s payments to the Province of Ontario of $2.43 billion in �scal 2016–17 were used by the government to invest in the operation of hospitals and other priority programs, to support amateur sport through the Quest for Gold program, local and provincial charities and problem gambling prevention, treatment and research. In the past 10 years, OLG’s payments to the Province of Ontario have increased by $747 million or 44.3 per cent.
3. RESULTS OF OPERATIONS – LINES OF BUSINESSThe Corporation has �ve lines of business and one Corporate Services division. The �ve lines of business are distinct revenue-generating business units that offer different products and services and are managed separately as they require different enabling technologies and supporting marketing strategies. The lines of business are Lottery, Charitable Gaming, Resort Casinos, Slots and Casinos, and Internet Gaming. Gaming facilities in the Slots and Casinos line of business can be operated directly by OLG or by land-based gaming service providers. The Corporate Services division provides support services to the revenue-generating lines of business that OLG directly operates.
Gaming revenue from land-based gaming service provider-operated sites (i.e., Shorelines Casino Belleville, Shorelines Casino Thousand Islands and Shorelines Slots at Kawartha Downs) within the Slots and Casinos line of business, represents OLG’s share of revenue, pursuant to the Casino Operating and Services Agreement. OLG’s share of revenue re�ects the �xed fee, a variable fee (calculated as a percentage of gaming revenue above a set revenue threshold) and an amount for permitted capital expenditures paid to the service provider.
PAYMENTS TO THE PROVINCE OF ONTARIO*Actuals (in millions of dollars)
2007-08 2008-09 2009-10 2010-11 2011-12 2012-13 2013-14 2014-15 2015-16 2016-17
$1,685$1,902 $1,875
$2,068 $1,924$1,903
$2,077 $2,043$2,391
$2,432
52114 Form 2 AnnualReport2016-2017-Text_English.indd 17 2017-11-02 5:41 PM

OLG ANNUAL REPORT 2016–1718
The following sections summarize the results of each line of business as well as the Corporate Services division in relation to OLG’s two main key performance indicators: revenue and NPP.
A. LOTTERY Summary data from Statement of Comprehensive Income
(in thousands of dollars)
For the �scal year 2016–17 2015–16 $ Variance % Variance
Revenue $ 3,680,753 $ 3,785,596 (104,843) (2.8)
Direct Expenses 2,336,705 2,382,744 46,039 1.9
Contribution MarginIndirect Expenses
1,344,048262,608
1,402,852232,144
(58,804)(30,464)
(4.2)(13.1)
Net Income $ 1,081,440 $ 1,170,708 (89,268) (7.6)
Add: Win Contribution - - - -
Net Profit to the Province $ 1,081,440 $ 1,170,708 (89,268) (7.6)
A1. Lottery revenueThe Lottery line of business launched two major initiatives in �scal 2016–17:
• On October 18, 2016, the �rst draw was held for DAILY GRAND, a new national Lotto game. For $3, lottery players have a chance to win the top prize of $1,000 a day for life or a lump sum of $7 million.
• Starting October 11, 2016, gift cards were available for purchase that may be redeemed for Lottery products. OLG was the �rst Canadian jurisdiction to make Lottery gift cards available in the marketplace.
Lottery revenue for �scal 2016–17 was $3.68 billion, a decrease of $104.8 million or 2.8 per cent from the previous �scal year. This was primarily due to lower value jackpots and lower sales per jackpot for national Lotto games. The decrease was offset by higher sales for regional (Ontario only) Lotto, INSTANT and Sports games, and the launch of DAILY GRAND. Lottery revenue was $369.5 million or 11.2 per cent higher than budget due to higher than expected sales across all product groupings.
The following table sets forth lottery sales and prize data by type of game:
Lottery sales and prize data by type of game
Product Groupings
Number of Games
Revenue(in millions of dollars)
Percentage of Revenue
Prizes(in millions of dollars)
For the �scal year 2016–17 2015–16 2016–17 2015–16 2016–17 2015–16 2016–17 2015–16
Lotto 15 14 $ 2,190.1 $ 2,372.6 59.5% 62.7% $ 1,067.5 $ 1,164.2
INSTANT 79 79 1,192.8 1,119.4 32.4% 29.6% 783.7 731.0
Sports 6 6 297.9 293.6 8.1% 7.7% 184.3 185.3
Totals 100 99 $ 3,680.8 $ 3,785.6 100.0% 100.0% $ 2,035.5 $ 2,080.5
OLG is a member of the Interprovincial Lottery Corporation (ILC), an entity established in 1976 to conduct and manage lotteries on behalf of Her Majesty the Queen in Right of all provinces. Other members are British Columbia Lottery Corporation (BCLC), Western Canada Lottery Corporation, Loto-Québec and Atlantic Lottery Corporation. The three main games ILC oversees are LOTTO MAX, LOTTO 6/49 and DAILY GRAND. ILC also oversees certain INSTANT games (e.g., $200 MILLION$ EXTRAORDINAIRE) that are sold by participating members in their respective jurisdictions across Canada.
52114 Form 2 AnnualReport2016-2017-Text_English.indd 18 2017-11-02 5:41 PM

19MANAGEMENT’S DISCUSSION AND ANALYSIS
Lotto games refer to national and regional lottery products where tickets are generated on a lottery terminal (excluding Sports games). These include games such as LOTTO MAX, LOTTO 6/49 and LOTTARIO. Sports games are also played through a lottery terminal; however, these games are played by predicting the outcomes of sporting events or events within a sporting event (e.g., in baseball, the number of base hits one player achieves versus another). INSTANT games are lotteries that are played by removing the scratch-off layer on the face of the ticket to reveal a series of symbols or numbers that determine if the ticket is a winner.
Lotto sales decreased by 7.7 per cent from last �scal as national Lotto sales (LOTTO MAX and LOTTO 6/49) decreased by $188.1 million or 11.5 per cent primarily due to the lower valued jackpots experienced this �scal versus last (�scal 2015–16 was a record breaking year for jackpots). In �scal 2016–17, LOTTO MAX experienced 22 jackpots at values greater than $50 million versus 30 in the previous �scal year. This resulted in a decrease in the average sales per jackpot draw to $15.5 million ($18.0 million in �scal 2015–16). LOTTO 6/49 experienced only 12 jackpots at values greater than $20 million versus 21 in the last year. However when compared to budget, national Lotto sales were $150.7 million or 11.6 per cent higher. The increase over budget was attributed to higher than budgeted LOTTO MAX sales of $153.4 million and the incremental revenue of $37.9 million from the new DAILY GRAND game offset by lower than budgeted LOTTO 6/49 sales of $40.6 million.
The decrease in national Lotto sales was offset by a marginal improvement in regional Lotto sales, primarily due to the strong performance of LOTTARIO. Enhancements to LOTTARIO that were introduced in November 2015 allowed the game to offer jackpots that grow more quickly. In addition, three new prize categories, larger prize payouts, and better overall odds of winning have continued to generate increased sales over the last �scal year. Higher sales from the Daily games (i.e., PICK 3, PICK 4, and DAILY KENO) and ONTARIO 49 also contributed to the favourable year over year results as sales growth was driven by increased play frequency of current players as well as a strong marketing campaign for these games.
INSTANT sales again exceeded $1 billion this �scal year, better than the previous �scal year and budget. Sales increased $73.4 million or 6.6 per cent, driven in large part by higher sales activity in the BINGO and CROSSWORD family of games, $5 and $10 Variety products, and the $10 and $30 ILC INSTANT games particularly $250 MILLION GOLDEN TREASURES. Premium ticket design, play mechanics, and concentrated marketing campaigns all drove increased sales of these games.
Sports product revenues were $4.3 million above prior year primarily attributed to increased PRO•LINE sales of $2.7 million. Compared to budget, revenue increased $17.9 million due to higher POINT SPREAD and PRO•LINE sales of $14.2 million and $7.2 million respectively. In the history of Canadian lotteries, only two jurisdictions have experienced periods where wagering on any league/team was not allowed; BCLC (while the Vancouver Grizzlies were located in British Columbia from 1995–2001) and OLG (with the Toronto Raptors located in Ontario from 1995-Present). In May 2016, following negotiations with the National Basketball Association, an agreement was reached whereby Sports patrons can now wager on professional basketball games. Wagering on these games resulted in sales of $27.8 million which contributed to the increase in Sports revenue this �scal more than offsetting the decreases experienced in some other sports games.
A2. Lottery net profit to the provinceNPP from the Lottery line of business for �scal 2016–17 was $1.08 billion, $89.3 million or 7.6 per cent lower than in the previous �scal year but $116.9 million or 12.1 per cent higher than budget. The decrease in NPP was due primarily to the �ow through of lower revenue that resulted from lower jackpot levels for LOTTO 6/49 and LOTTO MAX. This was partially offset by decreases in prizes and commissions expenses which are directly associated with a decrease in revenue. The higher than budget NPP was due to the �ow through of higher than anticipated sales in all categories, but primarily in national Lotto (LOTTO MAX and DAILY GRAND) and INSTANT games.
52114 Form 2 AnnualReport2016-2017-Text_English.indd 19 2017-11-02 5:41 PM

OLG ANNUAL REPORT 2016–1720
A3. Lottery – Other key performance indicatorsThe following are additional Lottery key performance indicators (KPIs) for �scal 2016–17 compared to �scal 2015–16:
For the �scal year 2016–17 2015–16Budget
2016–17
Average sales per LOTTO MAX jackpot draw* ($ millions) $ 15.5 $ 18.0 $ 12.6
Average sales per LOTTO 6/49 jackpot draw* ($ millions) $ 5.7 $ 6.7 $ 6.1
Total retailers 9,765 9,640 9,850
INSTANT ticket sales (millions of tickets) 273 274 258
Average price per INSTANT ticket sold $ 4.37 $ 4.09 $ 4.02 *Jackpot draws are the winning numbers drawn for the single main prize of LOTTO MAX (i.e., excludes draws for $1 million MAXMILLIONS prizes) and LOTTO 6/49.
Average sales per jackpot draw for LOTTO MAX decreased due to a marked reduction in the number of higher value jackpot draws in �scal 2016–17. This resulted in a decrease in the average sales per jackpot draw to $15.5 million compared to $18.0 million in �scal 2015–16. Customers tend to wager more when the value of the jackpot rolls or increases to its next level. The LOTTO MAX jackpot starts at $10 million and grows each time it is not won until it reaches a maximum of $60 million. At the $50 million jackpot level, individual $1 million prizes (MAXMILLIONS) are also offered. In �scal 2016–17, LOTTO MAX had 22 jackpots of $50 million or more plus MAXMILLIONS, compared to 30 such jackpots in the previous �scal year, while LOTTO 6/49 experienced 12 jackpots of $20 million or greater versus 21 in last �scal. The average sales per jackpot draw for LOTTO 6/49 decreased from $6.7 million in �scal 2015–16 to $5.7 million in �scal 2016–17 as this game experienced fewer jackpot rolls than in the previous �scal year. Additional terminal installations pushed up the total number of lottery retailers in �scal 2016–17 compared to the previous �scal year.
Overall, INSTANT ticket sales volume in �scal 2016–17 was consistent with the previous �scal year and greater than budget. The average price per INSTANT ticket sold increased over last �scal and budget as a result of a marketing strategy that focused on the sale of higher valued ticket games as well as the continued success of the $30 ILC INSTANT ticket.
A4. Lottery trends and risksOLG continues to act on the recommendations contained in its report, Modernizing Lottery and Gaming in Ontario: Strategic Business Review / Advice to Government. The report found that OLG’s current business model was not optimal over the long term and its modernization was necessary to improve the customer experience. To do this, OLG is becoming more customer-focused, renewing its role in the conduct and management of lottery and gaming, and seeking to enhance its capabilities in technology and innovation through partnership with the private sector.
The launch of PlayOLG in January 2015 offered customers the option to purchase LOTTO 6/49, LOTTO MAX and ENCORE tickets on the Internet; however, the vast majority of adult Ontarians still purchase paper lottery tickets from a retailer. OLG’s current lottery terminal technology limits where paper-based tickets can be sold and is not suited to current shopping patterns. Most adult Ontarians frequently visit supermarkets, big box stores, and large retail locations where OLG products are not conveniently located or are not offered for sale. OLG’s modernization addresses this challenge by recommending the expansion of lottery retail options to include these multi-lane retailers that can sell lottery products at multiple checkouts, while continuing to support the existing retailer network. As a result, on June 1, 2017 OLG announced the launch of its �rst multi-lane solution, QUICKTICKET, at select Metro and Food Basics stores in Ontario with full rollout expected by September 2017 to 261 locations and over 2,500 checkout lanes. QUICKTICKET will allow customers to purchase preprinted LOTTO MAX and LOTTO 6/49 tickets (with ENCORE) at checkout lanes while purchasing their groceries not just at the customer service desk. OLG also launched the new OLG Lottery App on May 30, 2017 that gives players a convenient option for checking their lottery tickets and �nding other lottery information from their smartphones. In the future, the app could also support lottery transactions such as ticket sales.
52114 Form 2 AnnualReport2016-2017-Text_English.indd 20 2017-11-02 5:41 PM

21MANAGEMENT’S DISCUSSION AND ANALYSIS
To unlock the full potential of the Lottery business, OLG is seeking to enhance its capabilities in technology and innovation through partnerships with the private sector. In �scal 2016–17, OLG cancelled a Request for Proposal (RFP) for a single lottery service provider in favour of a revised modernization approach. This approach will leverage the existing Lottery operations headquartered in Sault Ste. Marie, Ontario. OLG’s revised Lottery modernization plan is evolving and includes the selection of a service provider to provide a new enterprise wide digital foundation for OLG’s products. This platform will improve the ways OLG connects with customers within a framework of social responsibility. It will allow OLG to add new games, improve the online experience and enable mobile responsiveness. It will also add to existing digital capabilities in areas like player registration, responsible gambling controls and player accounts. OLG will also replace and update the existing Lottery terminals and network in retail stores. New Lottery terminals will enhance functionality for retailers and reduce maintenance costs. In addition to replacing and updating the terminals, the selected service provider will also be responsible for integrating and maintaining the new terminals and managing the corresponding telecommunications network. OLG will also add retailers to the network, allowing us to reach more customers across the province in a responsible way. Through OLG’s revised Lottery plan, OLG will seek ways to unlock opportunities to create greater value for Ontario. OLG plans for lottery modernization to be fully implemented in �scal 2021–22.
Lottery revenue is expected to grow at a compound annual growth rate (CAGR) of 3.0 per cent from �scal 2016–17 to �scal 2020–21. This is primarily due to the execution of a product and channel development strategy designed to maximize returns from Lottery’s four unique product categories and expand distribution by introducing new sales channels. It is expected that there will be an increase in the number of distribution channels culminating in net operating pro�t growth of 3.8 per cent CAGR.
B. CHARITABLE GAMINGSummary data from Statement of Comprehensive Income
(in thousands of dollars)
For the �scal year 2016–17 2015–16 $ Variance % Variance
Revenue $ 153,044 $ 165,953 (12,909) (7.8)
Direct Expenses 126,023 143,696 17,673 12.3
Contribution Margin $ 27,021 $ 22,257 4,764 21.4
Indirect Expenses 37,632 39,177 1,545 3.9
Net Loss (10,611) (16,920) 6,309 37.3
Add: Win Contribution - - - -
Net Loss to the Province $ (10,611) $ (16,920) 6,309 37.3
B1. Charitable Gaming revenueOLG conducts and manages the operations of 31 Charitable Gaming Centres across Ontario. These sites offer classic paper-based bingo and Break Open Ticket (BOT) products as well as related games that are played on electronic devices. Play on Demand (POD) games are personal electronic Bingo games with different price and prize levels. TapTix are electronic devices that can be used to play a BOT.
In �scal 2016–17, the Electronic Raf�e 50/50 program expanded to offer 50/50 raf�es at Toronto Blue Jays events in support of the Jays Care Foundation. The 50/50 raf�es were offered at Blue Jay home games until August 2016. In September 2016, the three Foundations previously partnered with OLG, migrated to the Alcohol and Gaming Commission of Ontario (AGCO) platform to operate their electronic 50/50 raf�es independent of OLG. Gross ticket sales were consistent year over year.
Charitable Gaming contribution margin in �scal 2016–17 was $27.0 million, an increase of $4.8 million or 21.4 per cent over the previous �scal year. This increase was primarily due to the strong performance of TapTix. The increase
52114 Form 2 AnnualReport2016-2017-Text_English.indd 21 2017-11-02 5:41 PM

OLG ANNUAL REPORT 2016–1722
in TapTix revenue was due to an additional 70 units in high volume centres, new game themes, and an integrated destination campaign designed to increase consumer awareness.
Charitable Gaming contribution margin for �scal 2016–17 was higher than budget by $8.2 million or 43.5 per cent mainly due to the continued success of TapTix as discussed above.
B2. Charitable Gaming net loss to the provinceCharitable Gaming net loss in �scal 2016–17 was $10.6 million, an improvement of $6.3 million or 37.3 per cent as compared to �scal 2015–16 and $8.9 million or 45.5 per cent favourable to budget. The decrease in net loss was attributable to the strong performance of TapTix and lower non-cash impairment charges due to delays in cGaming Linked Game and Windsor Retro�t projects. During the year, Management identi�ed indicators of impairment in the Charitable Gaming cash generating units (CGUs) (i.e., the individual Charitable Gaming Centres) as a result of the economic performance of the CGUs. The recoverable amount of the Charitable Gaming CGUs continues to be less than their respective carrying values and as a result non-cash impairment charges of $2.8 million ($6.5 million in �scal 2015–16) were included in other expenses.
B3. Charity paymentsThrough its share of the 31 Charitable Gaming Centres’ gaming proceeds, OLG makes direct-to-charity contributions to the respective locations’ charity associations to help support close to 1,800 local charity and non-pro�t groups. As of March 31, 2017, this program had made direct-to-charity payments in excess of $150 million since its launch in �scal 2005–06.
Payments to charitable associations that rely on funding from Charitable Gaming are included in direct expenses. Charities receive a commission based on a percentage of non-gaming revenue and a percentage of adjusted net win (net win after the payment of applicable marketing expenses). The payments to charitable associations totalled $36.4 million in �scal 2016–17 representing an increase of $6.1 million or 20.1 per cent when compared to �scal 2015–16.
B4. Charitable Gaming trends and risksIn 2010, OLG began a multi-year Charitable Gaming Revitalization Initiative, which is intended to preserve and enhance funding for local community charities across Ontario while creating economic bene�ts, including employment opportunities. This is to be achieved by introducing new electronic products, enhancing customer service and upgrading facilities.
Through the Charitable Gaming Revitalization Initiative, charities have made positive contributions to programs and services in their communities such as:
• the Hellenic Home for the Aged in Toronto for programs and transportation costs for seniors
• Art Starts that services �ve underserved Toronto neighbourhoods bringing together professional artists with residents of all ages
• Independent Living Sudbury Manitoulin that assists people with physical and intellectual disabilities by providing ongoing programs and purchasing basic food supplies
• the Huronia Transition Home in Penetanquishene that provides a safe haven for women and children, supports crisis calls, and provides counseling services to women in need
• Community Outreach Program Erie in Fort Erie that operates a food bank and offers clothing and small household items for those in need
• the Five Counties Children Centre in Peterborough that provides out-patient treatment for children and youth with physical, developmental and communication needs
• Victim Services of Peel that supports persons who have been victimized or are at risk of victimization by crime or tragic circumstance
52114 Form 2 AnnualReport2016-2017-Text_English.indd 22 2017-11-02 5:41 PM
23MANAGEMENT’S DISCUSSION AND ANALYSIS
Working with municipalities, the Ontario Charitable Gaming Association and the Commercial Gaming Association of Ontario, OLG has established 26 new Charitable Gaming Centres since August 2012, bringing the total number of centres across Ontario to 31.
To continue to support the industry and to grow revenue for participating charities, OLG plans to:• launch new games, based on bingo math, that engage customers by letting them select their own numbers
• introduce new entertainment features on existing games
• increase the number and variety of POD games
With this enhanced product offering, Charitable Gaming revenue is projected to grow at a CAGR of 1.6 per cent from �scal 2016–17 to �scal 2020–21. NPP is projected to increase annually until �scal 2017–18 and start to decrease in �scal 2018–19 as assets will be in need of refreshing. To ensure the ongoing success of this program, OLG is working with its stakeholders to enhance the Charitable Gaming operating model.
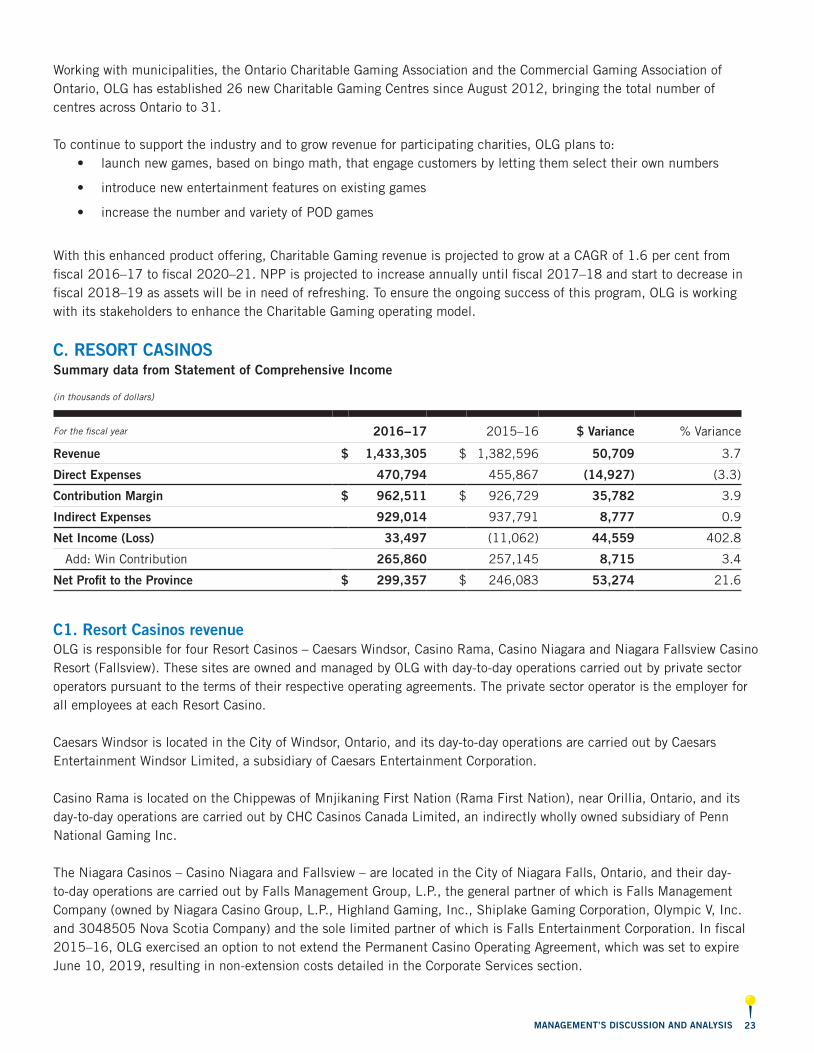
C. RESORT CASINOSSummary data from Statement of Comprehensive Income
(in thousands of dollars)
For the �scal year 2016−17 2015–16 $ Variance % Variance
Revenue $ 1,433,305 $ 1,382,596 50,709 3.7
Direct Expenses 470,794 455,867 (14,927) (3.3)
Contribution Margin $ 962,511 $ 926,729 35,782 3.9
Indirect Expenses 929,014 937,791 8,777 0.9
Net Income (Loss) 33,497 (11,062) 44,559 402.8
Add: Win Contribution 265,860 257,145 8,715 3.4
Net Profit to the Province $ 299,357 $ 246,083 53,274 21.6
C1. Resort Casinos revenueOLG is responsible for four Resort Casinos – Caesars Windsor, Casino Rama, Casino Niagara and Niagara Fallsview Casino Resort (Fallsview). These sites are owned and managed by OLG with day-to-day operations carried out by private sector operators pursuant to the terms of their respective operating agreements. The private sector operator is the employer for all employees at each Resort Casino.
Caesars Windsor is located in the City of Windsor, Ontario, and its day-to-day operations are carried out by Caesars Entertainment Windsor Limited, a subsidiary of Caesars Entertainment Corporation.
Casino Rama is located on the Chippewas of Mnjikaning First Nation (Rama First Nation), near Orillia, Ontario, and its day-to-day operations are carried out by CHC Casinos Canada Limited, an indirectly wholly owned subsidiary of Penn National Gaming Inc.
The Niagara Casinos – Casino Niagara and Fallsview – are located in the City of Niagara Falls, Ontario, and their day-to-day operations are carried out by Falls Management Group, L.P., the general partner of which is Falls Management Company (owned by Niagara Casino Group, L.P., Highland Gaming, Inc., Shiplake Gaming Corporation, Olympic V, Inc. and 3048505 Nova Scotia Company) and the sole limited partner of which is Falls Entertainment Corporation. In �scal 2015–16, OLG exercised an option to not extend the Permanent Casino Operating Agreement, which was set to expire June 10, 2019, resulting in non-extension costs detailed in the Corporate Services section.
52114 Form 2 AnnualReport2016-2017-Text_English.indd 23 2017-11-02 5:41 PM

OLG ANNUAL REPORT 2016–1724
Total Resort Casinos revenue for �scal 2016–17 was $1.43 billion, an increase of $50.7 million or 3.7 per cent over the previous �scal year. Higher gaming revenue was realized at all properties due to a consistently higher valued American dollar in addition to favourable weather conditions which kept Canadians playing domestically and attracted American patrons. In addition to these common factors, Casino Rama’s revenue increase can also be attributed to higher revenue from table games such as Baccarat and Midi-Baccarat. The Niagara properties and Caesars Windsor experienced a notable increase in the number of visits by higher-end players.
Resort Casinos revenue was $116.8 million or 8.9 per cent higher than budget primarily due to higher than anticipated slot play as well as high-end table play and strong hold for table games.
C2. Resort Casinos net profit to provinceIn �scal 2016–17, the Resort Casinos NPP was $299.4 million, an increase of $53.3 million or 21.6 per cent from �scal 2015–16 and $105.3 million or 54.3 per cent higher than budget. These positive variances are primarily due to the higher gaming revenue discussed previously in addition to lower indirect costs driven in part by lower than anticipated facilities costs at Niagara Casinos.
Compensation for the operators of Resort Casinos is based on a percentage of Gross Revenue and a percentage of Net Operating Margin, both de�ned terms in the respective operating agreement between OLG and each operator. Total fees paid to the operators in �scal 2016–17 were higher compared to the previous year and to budget due to higher than anticipated Gross Revenue and Net Operating Margin.
C3. Resort Casinos – Other key performance indicatorsThe following are additional Resort Casinos KPIs for �scal 2016–17 compared to �scal 2015–16:
For the �scal year 2016–17 2015–16Budget
2016–17
Total patrons (in millions) 16.4 16.6 16.3
Net Win per patron $ 81 $ 78 $ 75
Rated U.S. play*
Caesars Windsor 36.0% 34.2% n/a
*Rated U.S. play represents theoretical win contributed by U.S. carded patrons as a percentage of theoretical win contributed by all carded patrons. Theoretical win is based on probability theory, the intended win according to table games rule of play and slots payout schedule. One bene�t of using theoretical win is that it eliminates the impact of hold volatility. Rated U.S. play is not budgeted.
The total number of customer visits to the Resort Casinos in �scal 2016–17 was relatively consistent with �scal 2015–16 and budget. The net win per patron was $81 in �scal 2016–17, up from both prior year and budget at $78 and $75, respectively, attributable to increased high-end table play, slot spend per patron and strong hold for table games as discussed previously.
C4. Resort Casinos trends and risksOLG continues to act on the recommendations contained in its report, Modernizing Lottery and Gaming in Ontario: Strategic Business Review / Advice to Government. OLG will continue to leverage the regulated private sector involvement in the operations of the Resort Casinos. On March 31, 2017, OLG issued an RFP for the Central Gaming Bundle, which is comprised of Casino Rama, OLG Slots at Georgian Downs and a potential new gaming site in Wasaga Beach, Ontario or Collingwood, Ontario. On April 10, 2017, OLG issued an RFP for the Niagara Gaming Bundle, which is comprised of Casino Niagara and Fallsview while a modernization strategy for Caesars Windsor is currently under development.
52114 Form 2 AnnualReport2016-2017-Text_English.indd 24 2017-11-02 5:41 PM

25MANAGEMENT’S DISCUSSION AND ANALYSIS
Resort Casinos gaming revenue CAGR (before the deduction of service provider fees) is projected to decline marginally at 0.9 per cent from �scal 2016–17 to �scal 2020–21 due to increasing competition, particularly from the GTA region. Operational cost ef�ciencies are expected to lead a CAGR growth of 2.9 per cent in NPP for the same period.
Three of OLG’s Resort Casinos are located near the U.S. border, leaving them sensitive to variances in both inbound and outbound cross-border traf�c. During �scal 2016–17, the average USD exchange rate was $1.31 CAD (ranging from a low of $1.25 CAD in April 2016 to a high of $1.36 CAD in November 2016). The same average USD exchange rate of $1.31 CAD was experienced in �scal 2015–16 (with a low of $1.20 CAD and a high of $1.46 CAD). A higher American dollar drives additional U.S. visits to OLG gaming facilities and keeps Canadian players playing domestically.
The Canadian casino-style gaming market measured $10.6 billion in gaming revenue in �scal 2015–16 with the four top performing Canadian provinces – Ontario, Alberta, Quebec and British Columbia – accounting for more than 81.8 per cent of the total Canadian casino-style gaming market. Competition from the U.S. remains a signi�cant consideration. Scheduled maintenance closures of the Windsor-Detroit Tunnel and sections of U.S. Interstate 75 freeway south of Detroit, Michigan are planned in calendar 2017 and may discourage U.S. players from crossing into Canada. As well, there may be impacts from the rebranding of the Horseshoe Casinos in Ohio and Greektown Casino in Detroit and the $40 million expansion of the casino in Buffalo, New York.
Caesars Entertainment Operating Company, an operating unit of Caesars Entertainment Corporation and the parent company of Caesars Entertainment Windsor Limited, �led for Chapter 11 bankruptcy protection in a Chicago, Illinois court on January 15, 2015. The Caesars Windsor facility is owned by OLG while Caesars Entertainment Windsor Limited carries on the day-to-day operating activities of Caesars Windsor under an Operating Agreement with OLG dated December 14, 2006. OLG continues to monitor the situation with Caesars Entertainment Corporation; however, Caesars Windsor will not be impacted by the bankruptcy proceedings.
In an effort to increase customers’ interest, enhance their experience, and generate excitement, Resort Casinos continue to invest in a number of amenity improvement projects. In �scal 2016–17, Casino Rama commenced a multi-million dollar renovation of the Couchiching Buffet and Willow Chinese restaurant, both of which re-opened in April 2017. At the Niagara Casinos, renovations at Fallsview’s Noodle Bar food outlet and Salon Prive washrooms were completed in �scal 2016–17. In �scal 2017–18 Casino Niagara will update �xtures and �nishes while Fallsview will replace carpet and décor. During this time, OLG also expects to complete the RFP process for the Niagara Falls Entertainment Centre, a new large-scale, high-quality entertainment centre in the City of Niagara Falls. At Caesars Windsor, vacant space on the 27th �oor has been converted to a multi-use venue for hosting such events as dinners, cocktail receptions and weddings. Caesars Windsor also plans to renovate the hotel’s Forum tower and update its dining facilities in calendar 2017. The completion of these projects will enhance the gaming entertainment experience for customers. OLG is also investing in new slot machine products to stimulate growth and improve the competitive appeal of the Resort Casinos in their respective markets.
The Resort Casinos continue to leverage their strengths in product offerings, trip generating marketing programs (promotions associated with food and beverage, hotels and entertainment), continuous customer service improvements and operational ef�ciencies in order to sustain their competitive advantage.
52114 Form 2 AnnualReport2016-2017-Text_English.indd 25 2017-11-02 5:41 PM

OLG ANNUAL REPORT 2016–1726
D. SLOTS AND CASINOSSummary data from Statement of Comprehensive Income
(in thousands of dollars)
For the �scal year 2016–17 2015–16 $ Variance % Variance
Revenue $ 2,149,406 $ 2,061,966 87,440 4.2
Direct Expenses 130,502 109,488 (21,014) (19.2)
Contribution Margin $ 2,018,904 $ 1,952,478 66,426 3.4
Indirect Expenses 668,925 654,814 (14,111) (2.2)
Net Income 1,349,979 1,297,664 52,315 4.0
Add: Win Contribution 23,847 15,302 8,545 55.8
Net Profit to the Province $ 1,373,826 $ 1,312,966 60,860 4.6
D1. Slots and Casinos revenueOn September 8, 2016, OLG assumed the conduct and management responsibilities for the gaming table and non-gaming operations of the Great Blue Heron Casino. On January 11, 2017, Ontario Gaming East Limited Partnership (OGELP), as the land-based gaming service provider for the East Gaming Bundle, opened a new casino, Shorelines Casino Belleville, in Belleville, Ontario.
Revenue from Slots and Casinos for �scal 2016–17, including OLG’s share of revenue from sites operated by a land-based gaming service provider, was $2.15 billion, an increase of $87.4 million or 4.2 per cent from the previous �scal year and $143.6 million or 7.2 per cent higher than budget. Sixteen of 21 sites experienced a year-over-year increase (revenue before the deduction of service provider fees and Shorelines Casino Belleville opening January 11, 2017). Contributing factors were increased Gold member and non-carded play largely due to targeted carded member initiatives and player development activities designed to retain and grow high value members, as well as integrated provincial and local advertising that reinforced top-of-mind awareness and supported both carded and non-carded visits. OLG Slots at Woodbine Racetrack and OLG Slots at Ajax Downs posted revenue $49.1 million and $13.4 million above prior year respectively due in large part to these marketing initiatives. Revenue at OLG Casino Brantford was up $12.2 million compared to the previous year primarily due to the �rst full year of higher table game limits. The casino had also experienced a labour disruption in �scal 2015–16. The transition of Great Blue Heron Casino’s table game operations to OLG on September 8, 2016 also contributed an additional $40.6 million in revenue. Under OLG’s new operating model, OLG’s revenue includes its share of revenue pursuant to the Casino Operating and Services Agreement, of the gaming revenue generated at the Casino or Slot facility operated by the service provider. OLG’s share of revenue re�ects the fees paid to the service provider. This change in business model partially offsets the aforementioned areas of revenue growth.
D2. Slots and Casinos net profit to the provinceNPP from Slots and Casinos in �scal 2016–17 was $1.37 billion, an increase of $60.9 million or 4.6 per cent compared to the previous �scal year. This increase was primarily due to the �ow through impact of higher revenue, partially offset by increased direct and indirect costs primarily due to the incremental costs associated with the transition of Great Blue Heron’s table operations to OLG. Additionally, a $19.5 million one-time gain from the sale of East Gaming Bundle assets was reported in the previous �scal in other expenses. NPP for �scal 2016–17 was $164.3 million or 13.6 per cent higher than budget, the result of increased revenue partially offset by increased costs related to the transition of Great Blue Heron’s table operations to OLG.
52114 Form 2 AnnualReport2016-2017-Text_English.indd 26 2017-11-02 5:41 PM

27MANAGEMENT’S DISCUSSION AND ANALYSIS
D3. Slots and Casinos – Other key performance indicatorsThe following are additional Slots and Casinos KPIs for �scal 2016–17 compared to �scal 2015–16:
For the �scal year 2016–17 2015–16Budget
2016–17
Total patrons (in millions) 20.9 20.9 21.1
Win per patron $ 105 $ 98 $ 94
*Net win per patron is derived by dividing gaming revenue (net win) by the number of patrons.
The number of total site visits by patrons was consistent with the previous year and 0.2 million or 0.9 per cent lower than budget primarily due to a labour disruption at OLG Slots at Rideau that began in December 2015 and continued into May 2016 of �scal 2016–17.
Gaming revenue grew at a greater rate than the number of site visits resulting in an increase to net win per patron in �scal 2016–17. Actual net win per patron also exceeded budget expectations due in part to increased Gold member and non-carded play due to targeted carded member initiatives and Player Development activities designed to retain and grow high value members.
D4. Slots and Casinos trends and risksOLG continues to act on the recommendations contained in its report, Modernizing Lottery and Gaming in Ontario: Strategic Business Review / Advice to Government. Under direction from government, OLG is in the midst of an evolving multi-year transformation of its business. OLG’s strategic priorities are focused on modernization and executing an effective transformation of the organization. Modernizing Land-Based Gaming will help OLG meet market demand by allowing it to offer the right gaming product in the right markets across Ontario based on the existing model of gaming. This will enhance market management abilities and focus support functions on performance management of the site network. Once modernization is complete, OLG will be a leaner, more ef�cient organization, focused on its core responsibilities to conduct and manage, while the day-to-day delivery of land-based gaming will shift to service providers. Throughout this multi-year effort, the goal has remained consistent: to be a modern, ef�cient organization operating in the best interests of Ontarians. At the same time, OLG continues to operate its core businesses and generate revenue for the province. Signi�cant progress continues under land-based gaming modernization. Fiscal 2015–16 included the successful transfer of day-to-day operations and assets within the East Gaming Bundle to a new service provider, OGELP. This has resulted in the development of a new gaming facility in Belleville – the 25th gaming facility in Ontario. Fiscal 2016–17 included the release and execution of multiple RFPs – including the North, Southwest, GTA, Ottawa and West GTA Gaming Bundles. The completion of the RFP process for the North and Southwest Gaming Bundles occurred December 13, 2016 with the announcement that Gateway Casinos & Entertainment Limited (Gateway) had been selected as the service provider for the North and Southwest Gaming Bundles.
In �scal 2017–18, OLG completed the transition of all gaming sites in the North and Southwest Gaming Bundles to service providers. In May 2017 OLG completed the RFP process for the Ottawa Gaming Bundle which was awarded to Hard Rock Casino Ottawa Limited Partnership. OLG is expecting to complete the RFP process and transition of the GTA and West GTA Gaming Bundles to service providers. The completion of these transactions will represent a major step forward for the organization while enhancing gaming entertainment for customers.
The Slots and Casinos line of business will continue to focus on the transition of existing sites to service providers. Throughout this transition the business will strive to maintain and increase NPP within a framework of responsible gambling and in the public interest. Prior to the onboarding of service providers, the business will continue to use analytics, research and business case support in order to respond to gaming demand in existing markets – which may include an increase in the supply of electronic tables and slot machines, where appropriate – and to ensure effective
52114 Form 2 AnnualReport2016-2017-Text_English.indd 27 2017-11-02 5:41 PM

OLG ANNUAL REPORT 2016–1728
execution of marketing programs. As the day-to-day delivery of land-based gaming shifts to service providers, the line of business will be focused on its conduct and manage responsibility and the management of multiple service provider relationships in order to ensure the delivery of higher and more sustainable revenue to government. Gaming revenue (before deducting service provider fees) and NPP are projected to grow at a CAGR of 6.4 per cent and 2.7 per cent, respectively, from �scal 2016–17 to �scal 2020–21, through the transition of day-to-day operations of gaming sites to land-based gaming service providers and the subsequent expansion of existing gaming sites, relocation of sites where approved, or establishment of new sites in areas that are currently underserviced.
OLG’s ongoing commitment to Responsible Gambling is discussed on page nine of this Annual Report.
E. INTERNET GAMINGSummary data from Statement of Comprehensive Income
(in thousands of dollars)
For the �scal year 2016–17 2015–16 $ Variance % Variance
Revenue $ 58,365 $ 49,170 9,195 18.7
Direct Expenses 9,949 8,772 (1,177) (13.4)
Contribution MarginIndirect Expenses
48,41621,038
40,39825,549
8,0184,511
19.817.7
Net Income (loss) $ 27,378 $ 14,849 12,529 84.4
Add: Win Contribution – – – –
Net Profit to the Province $ 27,378 $ 14,849 12,529 84.4
E1. Internet Gaming revenuePlayOLG provides Ontarians with safe, secure, responsible Internet Gaming that leverages the trust and con�dence of the OLG brand. Internet Gaming revenue in �scal 2016–17, the second full year of operations, was $58.4 million, $9.2 million or 18.7 per cent more than in the previous year. The year-over-year increase is attributable to 16 per cent more active players in �scal 2016–17 than in the previous year as well as higher hold (changes in product mix) and an expanded game portfolio. In �scal 2016–17, PlayOLG focused on player acquisitions and promotions to encourage players to visit the site, while continuing to broaden the portfolio of casino games. Continued revenue growth is expected into the future as player loyalty and retention strengthens, awareness of the website increases and the portfolio of games expands. When compared to budget, Internet Gaming revenue was up $19.4 million or 49.7 per cent due to a higher than anticipated number of players and the expanded game portfolio.
E2. Internet Gaming net profit to provinceNPP from Internet Gaming for �scal 2016–17 was $27.4 million, $12.5 million or 84.4 per cent above �scal 2015–16. The year over year increase is due to higher revenue and lower indirect expenses, primarily marketing, AGCO fees, consulting and government payments. Compared to budget, Internet Gaming NPP was $20.9 million or 320.6 per cent above due to higher revenue and lower operating costs, mainly, AGCO fees, marketing and consulting.
E3. Internet Gaming trends and risksOLG continues to act on the recommendations contained in its report, Modernizing Lottery and Gaming in Ontario: Strategic Business Review / Advice to Government. OLG was asked to develop a complete Internet Gaming platform and as a result, PlayOLG was launched in January 2015.
52114 Form 2 AnnualReport2016-2017-Text_English.indd 28 2017-11-02 5:41 PM

29MANAGEMENT’S DISCUSSION AND ANALYSIS
Spending by Ontarians on grey market Internet Gaming websites (i.e., those not regulated by the Government of Ontario) provides no returns or value to the province. When PlayOLG was launched, research indicated that Ontario residents spent more than $500 million a year gambling on a wide variety of these websites that offered casino games, bingo, sports betting, poker and other related products.
PlayOLG’s competition is made up exclusively of grey market operators who offer a broader portfolio of products and promotional offers, are well known through extensive advertising and leverage their global operations to respond quickly to market dynamics.
In addition to the competitive environment, other Internet Gaming industry risks include changes to government legislation at either the federal or provincial level, changes in consumer opinions relating to Internet Gaming and changes to banking and �nancial regulations regarding the processing of Internet Gaming transactions.
OLG’s Internet Gaming revenue is projected to grow through the addition of new products, enhancing the PlayOLG website customer experience and in turn, helping to grow the player base. In May 2017, the PlayOLG Casino App was launched, which is an extension of the PlayOLG website and allows existing players to play their favourite casino games utilizing their smartphones.
PlayOLG is committed to ensuring that Responsible Gaming (RG) is the foundation of OLG’s Internet Gaming platform. The website uses innovative tools and safeguards to help better understand players’ risks and to track their game play. Time and money limits have been integrated into PlayOLG, including maximum weekly deposits, session (i.e., the amount of time one spends playing) limits, casino loss (i.e., the amount of money one is willing to lose) limits and lottery purchase amount limits. Players have the option to take a break for one to three months or be self-excluded for a period of six months up to an inde�nite period of time. After self-exclusion, if players decide to be reinstated, they must complete an online tutorial and manually opt in to receive marketing promotions again. In addition, the Bet Buddy program works in conjunction with player activity on PlayOLG to create a pro�le of the player (that the player can view) and notify OLG if the player is at risk.
F. CORPORATE SERVICES Summary data from Statement of Comprehensive Income
(in thousands of dollars)
For the �scal year 2016–17 2015–16 $ Variance % Variance
Consolidated Revenue 7,474,873 7,445,281 29,592 0.4
Corporate Services Expenses $ 410,480 $ 496,751 86,271 17.4
Corporate Services Expenses as a Percentage of Consolidated Revenue
5.5% 6.7% 1.2% –
F1. Corporate Services expensesCorporate services expenses for �scal 2016–17 were $410.5 million, a decrease of $86.3 million or 17.4 per cent compared to the previous �scal year. This was primarily due to the recognition of non-extension costs of $159.3 million including HST of $15.8 million (included in other expenses in �scal 2015–16) related to the Niagara Casinos, partially offset by increased Gaming Revenue Share Payment of $15.3 million, personnel expenses of $16.4 million and payments to the Government of Canada of $4.0 million.
F2. Corporate expenses as a percentage of consolidated revenueCorporate expenses as a percentage of consolidated revenue decreased to 5.5 per cent compared to the previous year for the reasons mentioned above.
52114 Form 2 AnnualReport2016-2017-Text_English.indd 29 2017-11-02 5:41 PM

OLG ANNUAL REPORT 2016–1730
4. FINANCIAL CONDITIONLiquidity and capital resourcesCash and cash equivalents were $307.2 million as at March 31, 2017, a decrease of $17.8 million from $325.0 million as at March 31, 2016. The majority of the Corporation’s cash and cash equivalents were denominated in Canadian dollars as at March 31, 2017.
The decrease in cash and cash equivalents was primarily due to increased cash used in �nancing and investing activities partially offset by increased cash generated by operating activities as set out in the following chart and explained below:
(in millions of dollars)
For the �scal year 2016–17 2015–16 $ Variance % Variance
Net cash flows provided by (used in):
Operating activities $ 2,278.7 $ 2,222.6 56.1 2.5
Investing activities (137.5) (86.6) (50.9) (58.8)
Financing activities (2,159.0) (2,127.3) (31.7) (1.5)
Net (decrease) increase in cash and cash equivalents $ (17.8) $ 8.7 (26.5) (304.6)
Cash provided by operating activities:Cash �ows provided by operating activities for �scal 2016–17 totalled $2.28 billion – $56.1 million higher than in the previous �scal year, primarily the result of an increase in net income, decrease in accounts receivable, decrease in prepaid expenses and increase in accounts payable.
Cash used in investing activities:Cash �ows used in investing activities, which include capital expenditures and proceeds from the sale of property, plant and equipment, totalled $137.5 million for �scal 2016–17, $50.9 million higher than in the previous �scal year primarily due to the reclassi�cation of property, plant and equipment to assets held for sale as well as decreased proceeds on disposal of property, plant and equipment due to the sale of the East Gaming Bundle assets in �scal 2015–16. This was partially offset by lower capital expenditures for �scal 2016–17.
Cash used in financing activities:During �scal 2016–17, cash �ows used in �nancing activities increased by $31.7 million to $2.16 billion compared with the previous �scal year. Included in �nancing activities are direct payments to the Province of Ontario, which totalled $2.14 billion in �scal 2016–17, up $24.0 million from the previous �scal year. Also included in �nancing activities are repayment of funds to the Ontario Financing Authority (OFA) related to the renovations at Slots at Woodbine Racetrack, and lease payments for the Casino Niagara building, Charitable Gaming assets and Great Blue Heron Casino facility.
During �scal 2016–17, long-term debt repayments totalled $18.3 million and included the following:
• Woodbine loan – $6.7 million• Internet Gaming loan – $1.9 million• Obligations under �nance leases – $9.7 million
The loan agreement for the purpose of �nancing the renovation and expansion of Slots at Woodbine Racetrack consisted of two �ve-year term loans with interest rates of 2.931 per cent and 2.32 per cent, respectively. The �rst term loan was repaid in May 2017 and the second expires in January 2018. The balance of the Woodbine loan at March 31, 2017 was $5.1 million.
52114 Form 2 AnnualReport2016-2017-Text_English.indd 30 2017-11-02 5:41 PM

31MANAGEMENT’S DISCUSSION AND ANALYSIS
During �scal 2014–15, the Corporation entered into a loan agreement with the OFA to borrow an amount up to $35.2 million to �nance the implementation of its Gaming Management System replacement program. During �scal 2016–17, the Corporation drew $8.3 million, plus accrued interest, bringing the total cumulative amount to $29.1 million. The loan is repayable over a �ve-year term commencing at the earlier of the project completion date or September 2017. The loan bears interest at the rate of OFA’s cost of funds as of each facility advance date plus 0.325 per cent per annum. No payments have been made on the loan to date.
During �scal 2014–15, the Corporation entered into a loan agreement with the OFA to borrow $1.8 million to �nance the capital costs of the PlayOLG website. The full loan balance was repaid in September 2016.
Capital risk managementThe capital structure of the Corporation consists of cash and cash equivalents, long-term debt and equity, comprising retained earnings, contributed surplus and reserves.
The Corporation is required to �nance certain capital expenditures with debt through the OFA. The approval of the Minister of Finance is required for the Corporation to borrow funds for major capital expenditures.
The Corporation believes its �nancial resources, together with future income, are suf�cient to meet funding requirements for current �nancial commitments and future operating and capital expenditures and to provide the necessary �nancial capacity to meet current and future growth expectations.
The Corporation’s objectives in managing capital are to ensure suf�cient resources are available for it to continue to fund future development and growth of its operations and to provide returns to the Province of Ontario.
The Board of Directors is responsible for the oversight of Management including policies related to �nancial and risk management. The Corporation manages its capital structure and makes adjustments to it in light of changes in economic conditions and the risk characteristics of the underlying assets. Operating agreements require the Resort Casinos to establish reserve funds. The Corporation is not subject to any externally imposed capital requirements.
The Corporation’s �nancial risk management and �nancial instruments are disclosed in Note 22 of the Notes to the Consolidated Financial Statements.
5. ENTERPRISE RISK MANAGEMENT OverviewOLG is exposed to diverse risks that could impact �nancial and non-�nancial business objectives related to its strategic priorities. OLG has a formal Enterprise Risk Management (ERM) program in place to support Management in identifying, assessing and managing risks – including strategic risks, legal/regulatory risks, operational risks, IT risks and workforce risks. ERM provides a framework and consistent approach aligned with ISO 31000 and in conformity with the Ontario Public Service risk management guidance and requirements.
Board Risk Governance and OversightThe Board of Directors, through its Audit and Risk Management Committee (ARMC), provides oversight for the ERM program. OLG Management sustains risk governance and oversight practices with risk oversight responsibilities outlined in the ARMC Terms of Reference. The ARMC receives regular reports on top risks and mitigation and/or response plans to address these risks.
52114 Form 2 AnnualReport2016-2017-Text_English.indd 31 2017-11-02 5:41 PM

OLG ANNUAL REPORT 2016–1732
Responsibilities for Risk Management The President and CEO has ultimate accountability for risk management supported by Management and the organization’s governance functions. OLG governance consists of risk management and compliance functions across the organization including Finance, Legal, ERM, Regulatory Compliance, Business Continuity Management, Fraud Risk Management and Information Security. Management and the governance functions work collaboratively to monitor the design and operation of the controls. OLG’s modernization has dedicated ERM resources to help Management ensure that all program components are risk assessed and mitigated on an ongoing basis. OLG Audit Services provides independent assurance regarding the effectiveness of risk management and controls across the organization. Risks that are outside of OLG’s ability to control, such as environmental risks (e.g., pandemics, extreme weather events), are mitigated by response plans which are regularly reviewed and updated by Management. OLG actively mitigates risk exposures through operational management and risk response plans. Impacts from some risks, such as losses from operations or failure of assets, are mitigated by insurance coverage when the insurance policies have been evaluated as economical, ef�cient and commercially viable.
Risk Management ProcessThe risk management process has been aligned to the current modernization governance structure that has been segmented in verticals (areas) based on deliverables. Detailed risk identi�cation and assessment are embedded in the project governance framework to ensure that projects and programs have risk management as a core component for decision-making. On a quarterly basis, detailed risk information is reviewed and top risks are reported to executive level management.
Top RisksRisks are de�ned as any event that could impact the achievement of objectives. The signi�cance of the risks in this section is such that they alone or in combination may have material �nancial, legal/regulatory, reputation and/or customer experience impacts.
Although OLG believes the measures taken to mitigate risks described in each risk section below are reasonable, there can be no expectation or assurance that they will effectively mitigate or fully address the risks described or that new developments and risks will not materially affect our operations or �nancial results. The following top risks have been identi�ed:
1. Ability to Maintain and Grow RevenueOLG’s ability to maintain and grow revenue is challenged by competitive pressures. Some land-based gaming sites are in sub-optimal locations, too far from population density and Internet Gaming is challenged by ongoing grey market play. A decreasing customer base and limited distribution channels challenge the lottery business. OLG’s modernization addresses these risks by introducing private sector investment and innovation while protecting value and increasing OLG’s contribution to the province.
Modernization is a multi-year transformative program which requires adjustments to both outcomes and processes as the transformation unfolds. The program is administered through project management, risk management and spending management disciplines to ensure that adjustments are fully considered, assessed and then incorporated into the program.
Risk Mitigations• land-based gaming modernization activities to offer the right gaming product in the right markets, including
selecting private sector partners to fund and build new gaming sites in optimal Ontario locations
• Internet Gaming activities to offer new products to improve customer experience and expanding the PlayOLG Casino App to offer casino games to existing players on their smartphones to compete with grey market operators
52114 Form 2 AnnualReport2016-2017-Text_English.indd 32 2017-11-02 5:41 PM

33MANAGEMENT’S DISCUSSION AND ANALYSIS
• lottery modernization activities increased distribution channels by launching multi-lane checkout for retailers and adding new retailers. Lottery launched the new OLG Lottery App and is selecting a vendor to provide a new enterprise wide digital foundation for OLG’s products that will support increasing the customer base by expanding digital capabilities
• there is regular consultation with the government to enable OLG to adjust to changing policy direction
• OLG works with its regulator, AGCO, and with the Ministry of Finance to ensure timelines are feasible for approvals
• there is close collaboration with external stakeholders, including the horse racing industry, charitable gaming industry and municipalities that have a gaming site within their jurisdictions.
• the private sector is continuously engaged to ensure that both their interests and those of OLG are understood and aligned
2. Regulatory ComplianceRegulatory Compliance Risk is the risk of not complying with the laws, regulations and standards that apply to our businesses and service providers. These regulatory obligations include those related to the regulation of gaming in Ontario, the prevention of money laundering and terrorist �nancing and the protection of privacy. OLG complies with many other laws and regulations that govern the businesses that it conducts and manages. Risk MitigationsOLG is managing this risk by implementing an Enterprise Compliance Framework structured to provide reasonable assurance that the processes and systems of OLG and its service providers are designed to prevent and detect regulatory breaches and maintain operations within an acceptable level of risk.
The key elements of the Enterprise Compliance Framework include the following:
• the Framework includes policy and controls development and oversight, training, monitoring and testing that is risk based, the management of issues and effective reporting to executive management and the Audit and Risk Management Committee of the board
• the Framework also provides for the appropriate management of relationships with various regulators that have oversight over the businesses that OLG conducts and manages. These core Framework elements are managed consistent with OLG’s methodology for managing service providers’ obligations
• the Framework is led by a Corporate Compliance Department staffed by professionals with the expertise to effectively challenge and monitor OLG and service provider operations
3. Information Technology (IT) and InfrastructureOLG must ensure that, while supporting modernization, its systems continue to sustain and develop core business and that access to systems and/or information is not compromised with expanded private sector delivery of Land-based Gaming, Internet Gaming and Charitable Gaming. Factors contributing to this risk include:
• maintaining an aging technology infrastructure and replacing when necessary
• introducing new organization technology solutions that impact multiple business lines
• managing the complexities and constraints of integrating the legacy technology solutions and new technology solutions
• dealing with an expanded supply chain of IT service providers, including cloud-based solutions, to provide new technology solutions
• a global increase in the type and severity of cyberattacks organizations have experienced
• maintaining existing staff technology skill sets and competing for new emerging technology skill sets
52114 Form 2 AnnualReport2016-2017-Text_English.indd 33 2017-11-02 5:41 PM

OLG ANNUAL REPORT 2016–1734
Risk Mitigations
• developing and maintaining internal technology skills, identifying future technology skills and using external parties to augment overall IT capability
• risk-based update of all critical technology components
• maintaining a technology roadmap and initiating projects to address legacy systems and meet the needs of modernization as well as the evolving landscape
• IT transition preparation and planning to ensure operation and integration of old and new technology as service providers are brought on board
• aligning IT to the new and evolving OLG operating model
• providing continuous enhancements to, and employee education on IT preventative and detective controls for OLG information assets and the introduction of new capabilities such as data leakage prevention
• conducting protection analysis over its IT systems to prevent cyber-attacks affecting Lottery retailers, land-based gaming service providers, and customers
• providing continuous improvement of employee Data Security Practices regarding hardware, data storage and email screening
• procurement measures which will source a single service provider to provide replacement lottery terminals and an integrated service for ongoing support and maintenance of both the lottery terminals and telecommunications network
4. Workforce ManagementThis is the risk that OLG could lose key skills and/or have dif�culties replacing key skills, the risk of employee disengagement and the risk of not having strategic and/or transformation capabilities in place when needed. OLG’s workforce has several existing challenges that create risk for the organization. They include:
• OLG modernization will result in many jobs moving to the private sector
• managing a number of different bargaining units, represented by a number of different bargaining agents
Risk Mitigations
• continual resource planning for the modernization effort to ensure that resource needs are addressed
• open and transparent communications, both bottom-up and top-down, through identi�ed channels
• dedicated change management resources to support the organization
• ensuring that all business continuity plans are up to date to ensure critical processes are not disrupted
• deliberate and targeted recruitment strategies for vacant positions to obtain talent
• targeted succession planning for executives
• employee skills training to help them retain and/or increase their marketability
• performing an ongoing review of the effectiveness of the risk mitigation
Other RisksOLG has identi�ed other high risks that are actively managed, either through direct management or through the use of response plans and/or insurance if no further mitigation is possible and the risk remains at a level that requires action. These risks include, in no speci�c order: fraud risk, project risk, business continuity risk and pandemic risk.
52114 Form 2 AnnualReport2016-2017-Text_English.indd 34 2017-11-02 5:41 PM

35MANAGEMENT’S DISCUSSION AND ANALYSIS
6. SIGNIFICANT ACCOUNTING POLICIES AND USE OF ESTIMATES AND JUDGMENTSThe preparation of the Consolidated Financial Statements in conformity with IFRS requires Management to make judgments, estimates and assumptions that affect the application of accounting policies and reported amounts of assets, liabilities, revenue and expenses. Actual results could differ from these estimates.
Estimates and underlying assumptions are reviewed on an ongoing basis. Revisions to accounting estimates are recognized in the period in which the estimates are revised and in any future years affected. Signi�cant estimates are used in determining, but are not limited to, the following: the useful lives and residual value of depreciable assets, recoverability of property, plant and equipment, provisions, valuation of �nancial instruments, employee bene�ts and contingencies.
Information about critical judgments in applying accounting policies that have the most signi�cant effect on the amounts recognized in the Consolidated Financial Statements are used in determining, but are not limited to, the following: leases and consolidation.
The Corporation’s signi�cant accounting policies, estimates and judgments have been reviewed and discussed with the ARMC of the Board of Directors. The Corporation’s signi�cant accounting policies are described in Note 4 of the Consolidated Financial Statements.
7. FEES PAID TO EXTERNAL AUDITORFor the �scal year ended March 31, 2017, the Corporation retained its independent auditor, KPMG LLP, to provide services in the categories and for the amounts shown in the table below:
(in thousands of dollars)
For the �scal year 2016–17 2015–16
Audit Services $ 1,367.1 $ 1,280.3
Audit Related Services 454.3 259.6
Tax Services 180.0 201.5
Other Services 728.2 108.4
Total of all Services $ 2,729.6 $ 1,849.8
52114 Form 2 AnnualReport2016-2017-Text_English.indd 35 2017-11-02 5:41 PM

OLG ANNUAL REPORT 2016–1736
MANAGEMENT’S RESPONSIBILITY FOR ANNUAL REPORTINGThe accompanying consolidated �nancial statements of the Ontario Lottery and Gaming Corporation and all information in this annual report are the responsibility of management and have been approved by the Board of Directors.
The consolidated �nancial statements have been prepared by management in accordance with International Financial Reporting Standards. Where required, management has made informed judgments and estimates in accordance with International Financial Reporting Standards.
The Board of Directors oversees management’s responsibilities for �nancial reporting through its Audit and Risk Management Committee, which is composed entirely of directors who are neither of�cers nor employees of the Corporation. The Audit and Risk Management Committee reviews the �nancial statements and recommends them to the Board for approval. This Committee meets periodically with management, internal audit and the external auditors.
To discharge its responsibility, management maintains an appropriate system of internal control to provide reasonable assurance that relevant and reliable consolidated �nancial statements are produced and that the Corporation’s assets are properly safeguarded. The Corporation maintains a staff of internal auditors whose functions include reviewing internal controls and their applications, on an ongoing basis. The reports prepared by the internal auditors are reviewed by the Committee. The Vice President, Audit Services, responsible for Internal Audit, reports directly to the President and Chief Executive Of�cer with unrestricted access to the Audit and Risk Management Committee.
KPMG LLP, the independent auditor appointed by the Board of Directors upon the recommendation of the Audit and Risk Management Committee, has examined the consolidated �nancial statements. Their report outlines the scope of their examination and their opinion on the consolidated �nancial statements. The independent auditor has full and unrestricted access to the Committee.
Barbara AndersonSenior Vice President and Chief Financial Of�cer
Stephen RigbyPresident and Chief Executive Of�cer
June 29, 2017
52114 Form 2 AnnualReport2016-2017-Text_English.indd 36 2017-11-02 5:41 PM

37MANAGEMENT’S RESPONSIBILITY FOR ANNUAL REPORTING AND INDEPENDENT AUDITORS’ REPORT
INDEPENDENT AUDITORS’ REPORTTo the Board of Directors of Ontario Lottery and Gaming Corporation and the Minister of Finance of Ontario:We have audited the accompanying consolidated �nancial statements of Ontario Lottery and Gaming Corporation, which comprise the consolidated statements of �nancial position as at March 31, 2017 and 2016, the consolidated statements of comprehensive income, changes in equity and cash �ows for the years then ended, and notes, comprising a summary of signi�cant accounting policies and other explanatory information.
Management’s Responsibility for the Consolidated Financial StatementsManagement is responsible for the preparation and fair presentation of these consolidated �nancial statements in accordance with International Financial Reporting Standards, and for such internal control as management determines is necessary to enable the preparation of consolidated �nancial statements that are free from material misstatement, whether due to fraud or error.
Auditors’ ResponsibilityOur responsibility is to express an opinion on these consolidated �nancial statements based on our audits. We conducted our audits in accordance with Canadian generally accepted auditing standards. Those standards require that we comply with ethical requirements and plan and perform the audit to obtain reasonable assurance about whether the consolidated �nancial statements are free from material misstatement.
An audit involves performing procedures to obtain audit evidence about the amounts and disclosures in the consolidated �nancial statements. The procedures selected depend on our judgment, including the assessment of the risks of material misstatement of the consolidated �nancial statements, whether due to fraud or error. In making those risk assessments, we consider internal control relevant to the Corporation’s preparation and fair presentation of the consolidated �nancial statements in order to design audit procedures that are appropriate in the circumstances, but not for the purpose of expressing an opinion on the effectiveness of the Corporation’s internal control. An audit also includes evaluating the appropriateness of accounting policies used and the reasonableness of accounting estimates made by management, as well as evaluating the overall presentation of the consolidated �nancial statements.
We believe that the audit evidence we have obtained in our audits is suf�cient and appropriate to provide a basis for our audit opinion.
OpinionIn our opinion, the consolidated �nancial statements present fairly, in all material respects, the consolidated �nancial position of Ontario Lottery and Gaming Corporation as at March 31, 2017 and 2016, and its consolidated �nancial performance and its consolidated cash �ows for the years then ended in accordance with International Financial Reporting Standards.
Chartered Professional Accountants, Licensed Public AccountantsJune 29, 2017 Toronto, Canada
52114 Form 2 AnnualReport2016-2017-Text_English.indd 37 2017-11-02 5:41 PM

OLG ANNUAL REPORT 2016–1738
CONSOLIDATED FINANCIAL STATEMENTSConsolidated Statements of Financial PositionAs at March 31, 2017 and 2016 (in thousands of dollars)
Notes March 31, 2017 March 31, 2016
Assets
Current assetsCash and cash equivalents $ 307,224 $ 325,034 Restricted cash 6 62,124 56,942 Trade and other receivables 7 150,931 159,140 Prepaid expenses 47,164 54,975 Inventories 8 31,258 28,048Assets held for sale 10, 27 112,606 -
Total current assets 711,307 624,139
Non-current assetsRestricted cash 6 121,301 118,957 Property, plant and equipment 9 1,105,676 1,224,027 Other asset 11 140,613 - Goodwill 1,776 1,776
Total non-current assets 1,369,366 1,344,760 Total assets $ 2,080,673 $ 1,968,899
Liabilities and Equity
Current liabilitiesTrade and other payables 12 $ 354,357 $ 316,186 Provisions 13 6,784 5,823 Due to operators and service provider 16 47,857 40,694 Due to Rama First Nation 17 2,500 2,118 Due to the Government of Canada 19 16,178 17,509 Deferred revenues 11,160 16,331 Current portion of long-term debt 21 21,397 18,810Liabilities held for sale 10, 27 1,007 -
Total current liabilities 461,240 417,471
Non-current liabilitiesDue to operators and service provider 16 145,834 143,476 Due to the Government of Canada 19 16,042 15,783 Long-term debt 21 200,227 66,096 Employee bene�ts 23 17,674 15,515
Total non-current liabilities 379,777 240,870 Total liabilities 841,017 658,341
EquityRetained earnings 1,056,010 1,129,256Contributed surplus 62,345 62,345Reserves 6 121,301 118,957
Total equity 1,239,656 1,310,558 Total liabilities and equity $ 2,080,673 $ 1,968,899
Related party transactions (Note 15)Commitments (Notes 16, 17 and 24)Contingencies (Note 25) Subsequent events (Note 27)
The accompanying notes are an integral part of these consolidated �nancial statements.
Approved on behalf of the Board
George L. CookeChair
Lori O’NeillDirector
52114 Form 2 AnnualReport2016-2017-Text_English.indd 38 2017-11-02 5:41 PM

39CONSOLIDATED FINANCIAL STATEMENTS
Lori O’NeillDirector
For the years ended March 31, 2017 and 2016 (in thousands of dollars)
Notes March 31, 2017 March 31, 2016
Revenues
Gaming $ 7,352,500 $ 7,332,490
Non-gaming 122,373 112,791
7,474,873 7,445,281
Direct Expenses
Prizes 2,035,482 2,118,488
Commissions and fees 603,873 568,934
Win contribution 18 289,707 272,447
Food, beverage and other purchases 104,252 103,584
Ticket printing 40,659 37,114
3,073,973 3,100,567
Contribution margin 4,400,900 4,344,714
Indirect Expenses
Personnel 933,843 903,811
Marketing and promotion 286,778 280,822
Other 20 144,826 254,518
Amortization 9, 11 155,957 157,481
Payments to the Government of Canada 315,725 305,608
Cost of premises and equipment 315,620 323,347
Regulatory fees 41,103 42,313
Gaming Revenue Sharing Payment 24.d 137,349 122,057
Finance income 14 (10,934) (9,019)
Finance costs 14 9,430 5,288
2,329,697 2,386,226
Net income and comprehensive income $ 2,071,203 $ 1,958,488
Consolidated Statements of Comprehensive Income
Other information (Note 26)
The accompanying notes are an integral part of these consolidated �nancial statements.
52114 Form 2 AnnualReport2016-2017-Text_English.indd 39 2017-11-02 5:41 PM

OLG ANNUAL REPORT 2016–1740
Consolidated Statements of Changes in Equity
The accompanying notes are an integral part of these consolidated �nancial statements.
For the years ended March 31, 2017 and 2016(in thousands of dollars)
Retained earnings
Contributed surplus
Capital renewals reserves
Operating reserves
Severance reserves Total
Balance at March 31, 2015 $ 1,282,147 $ 62,345 $ 25,979 $ 53,916 $ 45,794 $ 1,470,181
Net income and comprehensive income 1,958,488 – – – – 1,958,488
Contributions or distributions
Transfers to (from) reserves 6,732 – (7,476) 392 352 –
Payments to the Province of Ontario (2,118,111) – – – – (2,118,111)
Balance at March 31, 2016 $ 1,129,256 $ 62,345 $ 18,503 $ 54,308 $ 46,146 $ 1,310,558
Net income and comprehensive income 2,071,203 – – – – 2,071,203
Contributions or distributions
Transfers to reserves (2,344) – 764 1,208 372 –
Payments to the Province of Ontario (2,142,105) – – – – (2,142,105)
Balance at March 31, 2017 $ 1,056,010 $ 62,345 $ 19,267 $ 55,516 $ 46,518 $ 1,239,656
52114 Form 2 AnnualReport2016-2017-Text_English.indd 40 2017-11-02 5:41 PM

41CONSOLIDATED FINANCIAL STATEMENTS
Consolidated Statements of Cash FlowsFor the years ended March 31, 2017 and 2016 (in thousands of dollars)
Notes March 31, 2017 March 31, 2016
Cash flows from operating activitiesNet income and comprehensive income $ 2,071,203 $ 1,958,488
Adjustments to reconcile pro�t for the period to net cash from operating activities:
Amortization 9, 11 155,957 157,481 Loss on disposal of property, plant and equipment, net 20 2,593 1,360 Net �nance (income) costs (1,504) 3,085 Impairment loss on property, plant and equipment 9 2,831 6,496 Operator non-extension costs 20 – 159,259 Other long-term employee bene�ts 23.c 2,159 (3,367)
Operating cash �ows before change in non-cash working capital 2,233,239 2,282,802
Changes in non-cash working capital and current restricted cash:
(Increase) in current restricted cash (5,182) (1,868)
Decrease (increase) in trade and other receivables 8,209 (55,503)
Decrease (increase) in prepaid expenses 7,811 (8,029)
(Increase) in inventories (3,210) (2,574)
Increase (decrease) in trade and other payables 35,863 (2,886)
Increase in provisions 961 560
Increase in due to operators and service provider 7,163 5,965
Increase in due to Rama First Nation 382 113
(Decrease) increase in due to the Government of Canada (1,331) 1,755 (Decrease) increase in deferred revenues (5,171) 2,240
Net cash from operating activities 2,278,734 2,222,575
Cash flows used in investing activitiesInterest received 10,934 2,203 Capital expenditures (116,067) (133,975)(Increase) in net assets held for sale (30,161) –Proceeds on disposal of property, plant and equipment 103 38,444 (Increase) decrease in non-current restricted cash (2,344) 6,732
Net cash used in investing activities (137,535) (86,596)
Cash flows used in financing activitiesInterest paid (6,814) (5,288)Increase in long-term debt 8,250 14,750 Repayments of long-term debt (18,340) (18,636)
Payments to the Province of Ontario (2,142,105) (2,118,111)
Net cash used in financing activities
(2,159,009) (2,127,285)
(Decrease) increase in cash and cash equivalents (17,810) 8,694 Cash and cash equivalents, beginning of year 325,034 316,340
Cash and cash equivalents, end of year $ 307,224 $ 325,034
Supplemental disclosure relating to non-cash �nancing and investing activities:
Acquisition of property, plant and equipment through �nance leases $ 2,249 $ 2,645
Acquisition of property, plant and equipment not yet paid for $ 11,139 $ 8,344
The accompanying notes are an integral part of these consolidated �nancial statements.
52114 Form 2 AnnualReport2016-2017-Text_English.indd 41 2017-11-02 5:41 PM

OLG ANNUAL REPORT 2016–1742
(tabular amounts in thousands of Canadian dollars)
NOTES TO THE CONSOLIDATED FINANCIAL STATEMENTSYears ended March 31, 2017 and 2016
1. REPORTING ENTITY Ontario Lottery and Gaming Corporation (OLG or the Corporation) was established without share capital on April 1, 2000 pursuant to the Ontario Lottery and Gaming Corporation Act, 1999. The Corporation is classi�ed as an Operational Enterprise Agency of the Ontario government and is responsible for conducting and managing lottery games, Charitable Gaming (cGaming), Internet Gaming (iGaming), seven Casinos, 14 slot operations at racetracks and four Resort Casinos; Caesars Windsor, Casino Rama, Casino Niagara and Niagara Fallsview Casino Resort (Fallsview) in the Province of Ontario.
The Corporation has entered into operating agreements with Caesars Entertainment Windsor Limited (CEWL), CHC Casinos Canada Limited, Falls Management Group, L.P. and Great Blue Heron Gaming Company for the operation of Caesars Windsor, Casino Rama, Casino Niagara and Fallsview and the Great Blue Heron Casino, respectively. The Corporation consolidates the �nancial positions and results of the Resort Casinos and Great Blue Heron Casino but not those of their respective operators. In addition, the Corporation entered into a Casino Operating Services Agreement (COSA) with Ontario Gaming East Limited Partnership (OGELP) on January 11, 2016 to operate the East Gaming Bundle, which consists of Casino Thousand Islands, Slots at Kawartha Downs and Casino Belleville which opened January 11, 2017. The Corporation does not control OGELP and therefore does not consolidate its �nancial position and results.
The Corporation’s head of�ce and corporate of�ce, respectively, are located at:
• 70 Foster Drive, Suite 800, Sault Ste. Marie, Ontario, P6A 6V2• 4120 Yonge Street, Suite 402, Toronto, Ontario, M2P 2B8
These Consolidated Financial Statements were authorized for issue by the Board of Directors of the Corporation on June 29, 2017.
2. MODERNIZING LOTTERY AND GAMING IN ONTARIOOn March 12, 2012, the Minister of Finance accepted a report from OLG entitled Modernizing Lottery and Gaming in Ontario: Strategic Business Review / Advice to Government. This report was the culmination of an evidence-based strategic business review that examined the state of the Corporation’s current operations in the context of a changing market. The report included three recommendations for the Corporation to achieve greater sustainability and increase Net Pro�t to the Province (Note 26.a):
1. become more customer-focused2. expand regulated private sector delivery of lottery and gaming3. renew OLG’s role in oversight of lottery and gaming
On the approval of the Government of Ontario, the Corporation embarked on a series of initiatives to pursue these objectives and modernize its operations.
(i) Land-based Gaming Initiatives:As part of the modernization process, the Corporation has bundled all slots at racetracks and casino operations into eight gaming bundles and, following a successful procurement process, will transfer these bundles to private sector service providers (each, a Service Provider). Once the Request for Proposal (RFP) stage is completed, OLG selects the successful Service Provider and the Transition and Asset Purchase Agreement (TAPA) is signed which commits the Service Provider to acquire certain assets and assume certain liabilities related to the sites in the bundle and, upon signing the long-term Casino Operating and Services Agreement (COSA), to operate the site. OLG will continue to conduct and manage the land-based gaming sites for the duration of the agreement and the Service Provider will take on the day-to-day operations.
52114 Form 2 AnnualReport2016-2017-Text_English.indd 42 2017-11-02 5:41 PM

43NOTES TO THE CONSOLIDATED FINANCIAL STATEMENTS
All of OLG’s planned procurement opportunities for existing and proposed gaming facilities either have been completed or RFPs have been released, as outlined in the chart below:
OLG Gaming Bundle Sites Service Provider Status of Bundle COSA
Effective Date
EastCasino Thousand IslandsSlots at Kawartha DownsCasino Belleville
OGELP
• TAPA signed on September 8, 2015
• COSA signed on January 11, 2016
January 11, 2016
Southwest
Casino Point EdwardSlots at Western Fair DistrictSlots at Clinton RacewaySlots at Dresden RacewaySlots at Hanover RacewaySlots at Woodstock Raceway
Gateway Casinos & Entertainment Limited (Gateway)
• TAPA signed on December 13, 2016
• COSA signed on May 9, 2017 (Note 27)
May 9, 2017
North
Casino Sault Ste. MarieCasino Thunder BaySlots at Sudbury DownsNorth Bay (New Build)Kenora (New Build)
Gateway Casinos & Entertainment Limited (Gateway)
• TAPA signed on December 13, 2016
• COSA signed on May 30, 2017 (Note 27)
May 30, 2017
Ottawa Slots at Rideau Carleton Raceway
Hard Rock Casino Ottawa Limited Partnership (Hard Rock)
• TAPA signed on May 15, 2017 (Note 27)
To be determined
(TBD)
Greater Toronto Area
Slots at Woodbine RacetrackSlots at Ajax DownsGreat Blue Heron Casino
TBD• RFP issued
February 11, 2016TBD
West Greater Toronto Area
Casino BrantfordSlots at Flamboro DownsSlots at Mohawk RacetrackSlots at Grand River Raceway
TBD• RFP issued
October 20, 2016TBD
CentralSlots at Georgian DownsCasino Rama ResortSimcoe County (New Build)
TBD• RFP issued
March 31, 2017TBD
NiagaraCasino NiagaraFallsview Casino Resort
TBD• RFP issued
April 10, 2017TBD
On September 8, 2016, OLG assumed ownership of the Great Blue Heron table facility upon the signing of the Asset Purchase Agreement and various other long-term arrangements (Note 4.f(iv) and 16). With the transfer of table facility ownership, OLG will conduct and manage both slots and table games at Great Blue Heron Casino. Great Blue Heron Gaming Company will operate Great Blue Heron Casino until the Greater Toronto Area (GTA) Service Provider is selected to acquire certain assets and assume certain liabilities of Great Blue Heron Casino and to take over the day-to-day operations.
52114 Form 2 AnnualReport2016-2017-Text_English.indd 43 2017-11-02 5:41 PM

OLG ANNUAL REPORT 2016–1744
(tabular amounts in thousands of Canadian dollars)
(ii) Lottery Initiatives: On September 23, 2016, OLG cancelled the RFP for the lottery business. After a period of due diligence and consultation with proponents, OLG determined that the selection of a single service provider for the lottery business would not provide suf�cient value for the Province. Instead, OLG will leverage its existing lottery operations and seek to enhance capabilities in technology and innovation through partnerships with the private sector.
(iii) Horse Racing Initiatives: The Corporation is helping to build a more sustainable horse racing industry in Ontario by:• helping the industry build the capacity and structure needed for self-governance• increasing the public pro�le of horse racing via brand building and focused communications and sponsorships• sharing expertise and helping the industry adopt its own Responsible Gambling program• administering the Transfer Payment Agreements the provincial Government has in place with racetracks until
2021 by acting as a �ow-through intermediary for the provincial funding 3. BASIS OF PREPARATIONa. Statement of complianceThese Consolidated Financial Statements include the accounts of the Corporation and the wholly owned subsidiary, Ontario Gaming Assets Corporation, and have been prepared in accordance with International Financial Reporting Standards (IFRS), as issued by the International Accounting Standards Board (IASB).
b. Basis of measurementThese Consolidated Financial Statements have been prepared on the historical cost basis except for the revaluation of certain �nancial instruments classi�ed as �nancial assets through pro�t and loss that are measured at fair value (Note 4.k).
c. Functional and presentation currencyThese Consolidated Financial Statements are presented in Canadian dollars. The Canadian dollar is the Corporation’s functional currency and the currency of the primary economic environment in which the Corporation operates.
d. Use of estimates and judgmentsThe preparation of these Consolidated Financial Statements in conformity with IFRS requires Management to make judgments, estimates and assumptions that affect the application of accounting policies and reported amounts of assets, liabilities, revenues and expenses. Actual results may differ from these estimates.
Estimates and underlying assumptions are reviewed on an ongoing basis. Revisions to accounting estimates are recognized in the period in which the estimates are revised and in any future years affected.
Information about critical judgments in applying accounting policies that have the most signi�cant effect on the amounts recognized in the Consolidated Financial Statements are included in the following notes:
• Leases (Note 4.o)• Consolidation (Note 4.a)
Areas of signi�cant estimation and uncertainty that have a signi�cant effect on the amounts recognized in the Consolidated Financial Statements, and could result in a material adjustment within the next �scal year, are discussed in the following notes:
• Property, plant and equipment – useful lives and residual values (Note 4.l)• Recoverability of property, plant and equipment (Note 9)• Provisions (Note 13)• Valuation of �nancial instruments (Note 22)• Employee bene�ts (Note 23)• Contingencies (Note 25)
52114 Form 2 AnnualReport2016-2017-Text_English.indd 44 2017-11-02 5:41 PM

45NOTES TO THE CONSOLIDATED FINANCIAL STATEMENTS
4. SIGNIFICANT ACCOUNTING POLICIES The following accounting policies have been applied consistently by the Corporation and its wholly owned subsidiary to the Consolidated Financial Statements as at and for the years ended March 31, 2017 and March 31, 2016.
a. Basis of consolidationThe Consolidated Financial Statements include the accounts of the Corporation, and the wholly owned subsidiary which it controls, the Resort Casinos and Great Blue Heron Casino. The Corporation does not control OGELP and therefore does not consolidate its �nancial position and results. Control is achieved when the Corporation is exposed to, or has rights to, variable returns from its involvement with an entity and has the ability to affect those returns through its power over the entity. The �nancial statements of subsidiaries are included in the Consolidated Financial Statements from the date on which control commences until the date on which control ceases.
Intra-group balances and transactions, and any unrealized income and expenses arising from intra-group transactions, are eliminated on consolidation.
b. Foreign currencyMonetary assets and liabilities denominated in foreign currencies at the reporting date are converted to the Corporation’s functional currency at the exchange rates at that date. Non-monetary assets and liabilities in foreign currencies measured in terms of historical cost are converted at historical exchange rates at the date of the transaction. Transactions in foreign currencies are converted to the Corporation’s functional currency using the exchange rates at the date of the transactions. The Consolidated Statements of Comprehensive Income items are converted at the rate of exchange in effect at the transaction date. Foreign currency transaction gains and losses are recognized within �nance income in the Consolidated Statements of Comprehensive Income in the period in which they arise. The Corporation does not have any foreign operations.
c. Revenue recognitionRevenue is measured at the fair value of the consideration received or receivable. Revenue is recognized for the following major business activities:
(i) Lottery Lottery products are sold to the public by contracted lottery retailers, with LOTTOMAX, LOTTO 6/49 and ENCORE products also available for purchase over the Internet at PlayOLG. Revenue from tickets sold to customers for lottery games, for which results are determined based on a draw, is recognized when the related draw occurs. Revenue from INSTANT games is recognized when retailers make them available for sale to the public, as indicated by the retailers’ activation of tickets. Revenue from Sports wagering games is recognized when the ticket is sold to the customer. Tickets issued as a result of the redemption of free ticket prizes are not recorded as revenue.
(ii) cGamingcGaming products are sold to the public by cGaming Centre service providers and not-for-pro�t foundations. Revenue for all cGaming products is recognized in the same period the game is played, net of prizes paid.
(iii) Resort Casinos and Slots and Casinos Gaming revenue from OLG-operated sites and Resort Casinos: Gaming revenue includes revenue from slot and table game operations at Slots and Casinos facilities operated by OLG and Resort Casinos. This is recognized in the same period the game is played, net of prizes paid. Gaming revenue is recorded net of the change in accrued jackpot liabilities and liabilities under customer loyalty incentive programs.
52114 Form 2 AnnualReport2016-2017-Text_English.indd 45 2017-11-02 5:41 PM

OLG ANNUAL REPORT 2016–1746
(tabular amounts in thousands of Canadian dollars)
Gaming revenue from land-based gaming Service Provider operated sites:Gaming revenue includes OLG’s share, pursuant to the COSA, of the gaming revenue generated at the Casino or Slot facility operated by the Service Provider and is recognized in the same period the game is played. OLG’s share of revenue re�ects the �xed fee, a variable fee (calculated as a percentage of gaming revenue above a set revenue threshold) and an amount for permitted capital expenditures paid to the Service Provider.
Non-gaming revenue from OLG-operated sites and Resort Casinos:Non-gaming revenue includes revenue earned from accommodations, food and beverage, entertainment centres and other services excluding the retail value of accommodations, food and beverage and other goods and services provided to customers on a complimentary basis at Slots and Casinos operated by OLG and at Resort Casinos. Non-gaming revenue is recorded at the retail value and is recognized as goods are delivered and services performed.
(iv) iGaming iGaming revenue includes revenue earned from casino-style games available over the Internet at PlayOLG. This is recognized in the same period the game is played, net of prizes paid.
d. Customer loyalty incentive programsThe Corporation has customer loyalty incentive programs whereby customers have the choice to receive free or discounted goods and services and, in many cases, the right to receive cash. Some of these customer loyalty incentive programs allow customers to earn points based on the volume of play during gaming transactions. These points are recorded as a separate deliverable in the revenue transaction.
If the customer has the right to receive free or discounted goods and services and/or the option of receiving cash, a �nancial liability is recognized when the points are granted and a corresponding amount equal to the cash value is recorded as a reduction to revenue. The customer’s point balance will be forfeited if the customer does not earn additional points over the subsequent six- to 12-month period. If the points expire or are forfeited, the �nancial liability is derecognized.
For programs that provide customers the right to receive free or discounted goods and services, the revenue, as determined by the fair value of the undelivered goods and services related to the customer loyalty award, is deferred until the award is provided or expires.
e. Lottery prizesPrize expense for Lottery is recognized based on the predetermined prize structure for each game in the period revenue is recognized as described below:
• Prize expense for tickets sold to customers for lottery games, for which results are determined based on a draw, is recognized when the related draw occurs and is based on actual prize liability.
• Prize expense for INSTANT games is recognized when retailers make them available for sale to the public, as indicated by the retailers’ activation of tickets, and is based on the prize structure.
• Prize expense for Sports wagering games is recognized when the last wagered event occurs and is based on actual prize liability.
• Prize expense for annuity-based top prizes is based on the cost of the annuity purchased by the Corporation from a third party.
Unclaimed prizes on national Lotto games are returned to players through guaranteed jackpots and bonus draws. Unclaimed prizes on regional Lotto games are returned to the Province of Ontario through distributions to the province. Unclaimed regional Lotto game prizes are recorded as a reduction to the prize liability included in trade and other payables as well as a reduction to the prize expense. National Lotto games are administered by the Interprovincial Lottery Corporation and sold throughout Canada, while regional Lotto games are administered by the Corporation and sold only in Ontario.
52114 Form 2 AnnualReport2016-2017-Text_English.indd 46 2017-11-02 5:41 PM

47NOTES TO THE CONSOLIDATED FINANCIAL STATEMENTS
f. Commissions and bonusesCommissions and bonuses are recognized in the Consolidated Statements of Comprehensive Income in the period in which they are incurred.
(i) LotteryCommissions paid to lottery retailers are based on revenue earned by OLG, ticket redemptions or sales of major prize-winning tickets. OLG recognizes the commission expenses as revenue is earned.
(ii) cGamingcGaming service providers receive a commission based on percentages of net win (gaming revenue net of prizes paid) or adjusted net win (net win after the payment of applicable marketing expenses).
Charities and not-for-pro�t agencies receive a commission based on percentages of net win, adjusted net win or non-gaming revenue.
(iii) MunicipalitiesMunicipalities that host a Casino or Slots at Racetracks facility, including the City of Niagara Falls and the City of Windsor, receive a percentage of Electronic Games Revenue and Live Table Game Revenue as de�ned in the Municipal Contribution Agreements.
Municipalities that host cGaming Centres receive a commission based on either a percentage of non-gaming revenue and net win or a percentage of adjusted net win, as de�ned in the cGaming Centre Municipality Agreements.
(iv) Mississaugas of Scugog Island First NationAs the host community of the Great Blue Heron Casino, the Mississaugas of Scugog Island First Nation (MSIFN) received a percentage of Gross Revenues, as de�ned, from the slot machines up until September 7, 2016. On and after September 8, 2016 (Note 2), the MSIFN receive a Revenue Sharing Payment and Contribution Agreement Payment from slots and table games as de�ned in their respective agreements.
g. Cash and cash equivalentsCash and cash equivalents include cash and liquid investments that have a term to maturity at the time of purchase of less than 90 days.
h. Restricted cashRestricted cash consists of cash and liquid investments that have a term to maturity at the time of purchase of less than 90 days. Cash is restricted for the purposes of funding reserves and also includes prize funds on deposit, horse racing program funds, unused proceeds received from term loans and funds held on behalf of Internet Gaming patrons.
i. Trade and other receivablesTrade and other receivables are recognized initially at fair value and subsequently measured at amortized cost, less an allowance for impairment. Trade and other receivables are due for settlement no more than 30 days from the date of recognition.
j. InventoriesInventories are valued at the lower of cost and net realizable value. Cost is determined using the weighted average cost method. Net realizable value is the estimated selling price in the ordinary course of business less the estimated costs necessary to complete the sale.
52114 Form 2 AnnualReport2016-2017-Text_English.indd 47 2017-11-02 5:41 PM

OLG ANNUAL REPORT 2016–1748
(tabular amounts in thousands of Canadian dollars)
k. Financial instruments(i) Non-derivative financial assets recognitionThe Corporation has the following non-derivative �nancial assets: �nancial assets at fair value through pro�t or loss and loans and receivables. The Corporation does not have available-for-sale or held-to-maturity �nancial assets.
The Corporation initially recognizes loans and receivables on the date that they originated. All other �nancial assets (including assets designated at fair value through pro�t or loss) are recognized initially on the trade date on which the Corporation becomes a party to the contractual provisions of the instrument.
The Corporation derecognizes a �nancial asset when the contractual rights to the cash �ows from the asset expire or when it transfers the rights to receive the contractual cash �ows on the �nancial asset in a transaction in which substantially all the risks and rewards of ownership of the �nancial asset are transferred. Any interest in transferred �nancial assets that is created or retained by the Corporation is recognized as a separate asset or liability.
(ii) Non-derivative financial assets measurement
Financial assets at fair value through profit or loss
Comprised of all cash and cash equivalents and restricted cash
A �nancial asset is classi�ed at fair value through pro�t or loss if it is classi�ed as held for trading or designated as such upon initial recognition. Financial assets are designated at fair value through pro�t or loss if the Corporation manages such investments and makes purchase and sale decisions based on their fair value in accordance with the Corporation’s documented risk management or investment strategy.
Upon initial recognition, attributable transaction costs are recognized as incurred in the Consolidated Statements of Comprehensive Income. Financial assets at fair value through pro�t or loss are measured at fair value, and changes therein are recognized in the Consolidated Statements of Comprehensive Income.
Loans and receivables
Comprised of trade and other receivables
Loans and receivables are �nancial assets with �xed or determinable payments that are not quoted in an active market.
Loans and receivables are recognized initially at fair value plus any directly attributable transaction costs. Subsequent to initial recognition, loans and receivables are measured at amortized cost using the effective interest method, less any impairment losses.
(iii) Non-derivative financial liabilities recognitionThe Corporation has the following non-derivative �nancial liabilities: �nancial liabilities measured at amortized cost. The Corporation has no non-derivative liabilities classi�ed at fair value through pro�t or loss.
52114 Form 2 AnnualReport2016-2017-Text_English.indd 48 2017-11-02 5:41 PM

49NOTES TO THE CONSOLIDATED FINANCIAL STATEMENTS
The Corporation initially recognizes �nancial liabilities on the date that they originated.
All other �nancial liabilities (designated at fair value through pro�t or loss) are recognized initially on the trade date at which the Corporation becomes a party to the contractual provisions of the instrument. Any transaction costs that are directly attributable to these �nancial liabilities are expensed as incurred.
The Corporation derecognizes a �nancial liability when its contractual obligations are discharged, cancelled or have expired.
(iv) Non-derivative financial liabilities measurement
Financial liabilities at amortized cost
Comprised of trade and other payables, provisions, due to operators, due to Rama First Nation, due to the Government of Canada and long-term debt
Non-derivative �nancial liabilities are recognized initially at fair value plus any directly attributable transaction costs. Subsequent to initial recognition, these �nancial liabilities are measured at amortized cost using the effective interest method.
(v) Non-derivative financial assets and liabilities offsettingFinancial assets and liabilities are offset and the net amount presented in the Consolidated Statements of Financial Position when, and only when, the Corporation has a legal right to offset the amounts and intends either to settle on a net basis or to realize the asset and settle the liability simultaneously.
l. Property, plant and equipment(i) Recognition and measurementThe Corporation capitalizes any major capital purchase that has a useful life beyond the current year.
Property, plant and equipment are measured at cost less accumulated amortization and accumulated impairment losses.
Cost includes an expenditure that is directly attributable to the acquisition of the asset. The cost of self-constructed assets includes the cost of materials and direct labour and other costs directly attributable to bring the assets to a working condition for their intended use, the cost of dismantling and removing the items and restoring the site on which they are located and capitalized borrowing costs on qualifying assets. When parts of an item of property, plant and equipment have different useful lives, they are accounted for as separate items (major components) of property, plant and equipment.
Gains and losses on disposal of an item of property, plant and equipment are determined by comparing the proceeds from disposal with the carrying amount of property, plant and equipment and are recognized net within Other in the Consolidated Statements of Comprehensive Income.
(ii) Subsequent costs The cost of replacing a part of an item of property, plant and equipment is recognized in the carrying amount of the item if it is probable that the future economic bene�ts embodied within the part will �ow to the Corporation and its cost can be measured reliably. The carrying amount of the replaced part is derecognized. The cost of the day-to-day servicing of property, plant and equipment is recognized as incurred in the Consolidated Statements of Comprehensive Income.
(iii) AmortizationAmortization is calculated over the depreciable amount, which is the cost of an asset, or other amount substituted for cost, less its residual value.
52114 Form 2 AnnualReport2016-2017-Text_English.indd 49 2017-11-02 5:41 PM

OLG ANNUAL REPORT 2016–1750
(tabular amounts in thousands of Canadian dollars)
Amortization is recognized in the Consolidated Statements of Comprehensive Income on a straight-line basis over the estimated useful life of each component of an item of property, plant and equipment, since this most closely re�ects the expected pattern of consumption of the future economic bene�ts embodied in the asset. Leased assets are amortized over the shorter of the lease term and their estimated useful lives unless it is reasonably certain that the Corporation will obtain ownership by the end of the term of the lease. The estimated useful lives for the current and comparative periods are as follows:
Asset Rate
Buildings 10 to 50 years
Furniture, �xtures and equipment 2 to 10 years
Leasehold improvements Lesser of useful life or term of lease
Lottery gaming assets 5 to 7 years
Slots and Casinos and Resort Casinos gaming assets 2 to 10 years
Property, plant and equipment are amortized when ready for their intended use. Construction in progress and assets not in use are stated at cost, less any recognized impairment loss. Amortization of these assets, determined on the same basis as other property assets, commences when the assets are ready for their intended use.
Amortization methods, useful lives and residual values are reviewed at each �scal year end and adjusted if appropriate.
Borrowing costs incurred during the construction and development of qualifying property, plant and equipment are capitalized and amortized over the estimated useful life of the associated property, plant and equipment.
m. Disposal group held for saleNon-current assets, or disposal groups comprising assets and liabilities, are classi�ed as held for sale if it is highly probable that they will be recovered primarily through a sale rather than continuing use. Such assets, or disposal groups, are measured at the lower of the carrying amount or fair value less costs to sell. Any impairment loss on a disposal group is allocated among the related assets and liabilities on a pro rata basis, except that no loss is allocated to inventories and �nancial assets that continue to be measured in accordance with the Corporation’s other accounting policies. Impairment losses on initial classi�cation as held for sale and subsequent gains and losses on remeasurement are recognized in the Consolidated Statements of Comprehensive Income. Once classi�ed as held for sale, property, plant and equipment are no longer amortized or depreciated.
n. Impairment(i) Financial assets A �nancial asset not carried at fair value through pro�t or loss is assessed at each reporting date to determine whether there is objective evidence that it is impaired. A �nancial asset is impaired if objective evidence indicates that a loss event has occurred after the initial recognition of the asset and that the loss event had a negative effect on the estimated future cash �ows of that asset that can be estimated reliably.
The Corporation considers evidence of impairment for receivables at both a speci�c asset and collective level. All individually signi�cant receivables are assessed for speci�c impairment. All individually signi�cant receivables found not to be speci�cally impaired are then collectively assessed for any impairment that has been incurred but not yet identi�ed. Receivables that are not individually signi�cant are collectively assessed for impairment by grouping together receivables with similar risk characteristics.
52114 Form 2 AnnualReport2016-2017-Text_English.indd 50 2017-11-02 5:41 PM

51NOTES TO THE CONSOLIDATED FINANCIAL STATEMENTS
An impairment loss in respect of a �nancial asset measured at amortized cost is calculated as the difference between its carrying amount and the present value of the estimated future cash �ows discounted at the asset’s original effective interest rate. Losses are recognized in the Consolidated Statements of Comprehensive Income and re�ected in an allowance account against receivables. Interest on the impaired asset continues to be recognized through the unwinding of the discount. When a subsequent event causes the amount of impairment loss to decrease, the decrease in impairment loss is reversed in the Consolidated Statements of Comprehensive Income.
(ii) Non-financial assetsThe carrying amounts of the Corporation’s non-�nancial assets are reviewed at each reporting date to determine whether there is any indication of impairment. If any such indication exists, then the asset’s recoverable amount is estimated. For goodwill, the recoverable amount is estimated each year at the same time.
The recoverable amount of an asset or Cash Generating Unit (CGU) is the greater of its value in use and its fair value less costs of disposal. In assessing value in use, the estimated future cash �ows are discounted to their present value using a pre-tax discount rate that re�ects current market assessments of the time value of money and the risks speci�c to the asset or CGU. For the purpose of impairment testing, assets that cannot be tested individually are grouped together into the smallest group of assets that generates cash in�ows from continuing use that are largely independent of the cash in�ows of other assets or group of assets. For the purposes of goodwill impairment testing, CGUs to which goodwill has been allocated are aggregated so that the level at which impairment is tested re�ects the lowest level at which goodwill is monitored for internal reporting purposes.
The Corporation’s corporate assets do not generate separate cash in�ows. If there is an indication that a corporate asset may be impaired, then the recoverable amount is determined for the CGU to which the corporate asset is allocated.
An impairment loss is recognized if the carrying amount of an asset or its CGU exceeds its estimated recoverable amount. Impairment losses are recognized in Other in the Consolidated Statements of Comprehensive Income. Impairment losses recognized in respect of CGUs are �rst allocated to reduce the carrying amount of any goodwill allocated to the units and then to reduce, on a pro rata basis, the carrying amounts of the other assets in the unit or group of units.
An impairment loss in respect of goodwill is not reversed. In respect of other assets, impairment losses recognized in prior periods are assessed at each reporting date for any indications that the loss has decreased or no longer exists. An impairment loss is reversed if there has been a change in the estimates used to determine the recoverable amount. An impairment loss is reversed only to the extent that the asset’s carrying amount does not exceed the carrying amount that would have been determined, net of amortization, if no impairment loss had been recognized.
o. LeasesAt the inception of an arrangement, the Corporation determines whether such an arrangement is or contains a lease. A speci�c asset is the subject of a lease if ful�llment of the arrangement is dependent on the use of that speci�ed asset. An arrangement conveys the right to use the asset if the Corporation has the right to control the use of the underlying asset.
At the inception or upon the reassessment of the arrangement, the Corporation separates payments and other consideration required by such an arrangement into those for the lease and those for other elements on the basis of their relative fair values. If the Corporation concludes that it is impracticable to separate the payments reliably under a �nance lease, an asset and a liability are recognized at an amount equal to the fair value of the underlying asset. Subsequently, the liability is reduced as payments are made and an imputed �nance charge on the liability is recognized using the Corporation’s incremental borrowing rate.
52114 Form 2 AnnualReport2016-2017-Text_English.indd 51 2017-11-02 5:41 PM

OLG ANNUAL REPORT 2016–1752
(tabular amounts in thousands of Canadian dollars)
Leases where the Corporation assumes substantially all the risks and rewards of ownership are classi�ed as �nance leases. On a lease-by-lease basis, the Corporation estimates whether substantially all of the risks and rewards of ownership are assumed, taking into account the length of the lease, the present value of the minimum lease payments compared to the fair value of the leased asset and other terms contained within the lease. Upon initial recognition, the leased asset is measured at an amount equal to the lower of its fair value and the present value of the minimum lease payments.
Subsequent to initial recognition, the asset is accounted for in accordance with the accounting policy applicable to that asset. Minimum lease payments made under �nance leases are apportioned between the �nance expense and the reduction of the outstanding liability. The �nance expense is allocated to each period during the term of the lease so as to produce a constant periodic rate of interest on the remaining balance of the liability.
Leases other than �nance leases are classi�ed as operating leases and are not recognized in the Corporation’s Consolidated Statements of Financial Position. Operating lease payments are recognized as an expense on a straight-line basis over the term of the lease, except when another systematic basis is more representative of the time pattern in which economic bene�ts from the leased assets are consumed. Contingent rentals arising under operating leases are recognized as an expense in the period in which they are incurred.
p. Deferred revenueFunds collected from retailers for lottery games for which results are determined based on a draw, and for which tickets are sold in advance of the game draw, are recorded as deferred revenue and recognized as revenue once the related draw occurs.
q. Trade and other payablesThese amounts represent liabilities for unpaid goods and services provided to the Corporation prior to the end of the �nancial year. Such liabilities are recognized initially at fair value plus any directly attributable transaction costs. Subsequent to initial recognition, these liabilities are measured at their amortized cost using the effective interest method. The amounts are short term in nature.
r. ProvisionsProvisions are liabilities of uncertain timing and amount. A provision is recognized if, as a result of a past event, the Corporation has a present legal or constructive obligation that can be estimated reliably and it is probable that an out�ow of economic bene�ts will be required to settle the obligation.
Provisions are determined by discounting the expected future cash �ows at a pre-tax rate that re�ects current market assessments of the time value of money and the risks speci�c to the liability. The unwinding of the discount is recognized as a �nance cost.
Provisions are reviewed at each reporting date and adjusted to re�ect current best estimates.
(i) Legal claimsThe Corporation recognizes obligations for the settlement of current legal claims against the Corporation. The provision is measured based on the best estimate of the expenditure required to settle the matter. Each claim is individually reviewed for the likelihood of settlement and the expected settlement amount.
(ii) Other provisionsThe Corporation recognizes decommissioning obligations for the retirement of certain tangible property, plant and equipment, which result from the acquisition, construction, development and/or normal use of the assets. The provision is measured based on the net present value of Management’s best estimate of the expenditures that will be made. The associated asset retirement costs are capitalized as part of the carrying amount of the long-lived asset and amortized over the estimated useful life. The increase to the provision resulting from unwinding the discount is recognized as a �nance cost.
The decommissioning provision is measured each period and subsequent changes in the provision are capitalized as part of the cost of the long-lived asset and amortized prospectively over the remaining life of the item to which the costs relate. A gain or loss may be incurred upon settlement of the liability.
52114 Form 2 AnnualReport2016-2017-Text_English.indd 52 2017-11-02 5:41 PM

53NOTES TO THE CONSOLIDATED FINANCIAL STATEMENTS
The Corporation recognizes a provision for insurance claims that the Corporation’s insurance provider has indicated are more than likely to be settled. The provision is measured based on the amounts for each claim where settlement is probable or the amount of the deductible related to the claim.
s. Employee benefits(i) Defined contribution plansA de�ned contribution plan is a post-employment bene�t plan under which an entity pays �xed contributions into a separate entity and will have no legal or constructive obligation to pay further amounts. Obligations for contributions to de�ned contribution pension plans are recognized as an employee bene�t expense in the Consolidated Statements of Comprehensive Income in the periods during which services are rendered by the employees. Prepaid contributions are recognized as an asset to the extent that a cash refund or a reduction in future payments is available. Contributions to a de�ned contribution plan, which are due more than 12 months after the end of the period in which the employees render the service, are discounted to their present value.
(ii) Defined benefit plansA de�ned bene�t plan is a post-employment bene�t plan that requires entities to record their net obligation in respect of the plan and is not a de�ned contribution plan. The Corporation provides de�ned bene�t pension plans through the Public Service Pension Fund (PSPF) and the Ontario Public Service Employees Union Pension Fund (OPSEU Pension Fund). The Corporation does not have a net obligation in respect of de�ned bene�t pension plans as the plans are sole-sponsored de�ned bene�t plans established by the Province of Ontario. The Province of Ontario controls all entities included in the pension plans. The Corporation has classi�ed these plans as state plans whereby there is no contractual agreement or stated policy for charging the net de�ned bene�t cost of the plans to the Corporation. As such, the Corporation records these post-employment bene�ts as de�ned contribution plan.
(iii) Other long-term employee benefitsThe Corporation’s net obligation with respect to long-term employee bene�ts other than pension plans is the amount of future bene�t that employees have earned in return for their service in the current and prior periods. That bene�t is discounted to determine its present value and the fair value of any related assets is deducted. The discount rate is the yield at the reporting date on AA credit-rated bonds that have maturity dates approximating the terms of the Corporation’s obligations. The calculation is performed using the projected unit credit method. Any actuarial gains and losses are recognized in the Consolidated Statements of Comprehensive Income in the period in which they arise.
(iv) Termination benefitsTermination bene�ts are recognized as an expense at the earlier of when the Corporation can no longer withdraw the offer of those bene�ts and when the Corporation recognizes costs for a restructuring. If bene�ts are not expected to be settled wholly within 12 months of the end of the reporting period, they are discounted to their present value.
(v) Short-term employee benefits Short-term employee bene�t obligations are measured on an undiscounted basis and are expensed as the related service is provided.
A liability is recognized for the amount expected to be settled wholly within 12 months of the end of the reporting period if the Corporation has a present legal or constructive obligation to pay this amount as a result of past service provided by the employee and the obligation can be estimated reliably.
t. Finance income and finance costsFinance income consists of interest income on funds invested and changes in the fair value of �nancial assets at fair value through pro�t or loss, loans and receivables and foreign currency transaction gains or losses. Interest income is recognized as it accrues in the Consolidated Statements of Comprehensive Income using the effective interest method.
52114 Form 2 AnnualReport2016-2017-Text_English.indd 53 2017-11-02 5:41 PM

OLG ANNUAL REPORT 2016–1754
(tabular amounts in thousands of Canadian dollars)
Finance costs consist of interest expense on borrowings, unwinding of the discount on provisions and changes in the fair value of �nancial assets at fair value through pro�t or loss. Borrowing costs that are not directly attributable to the acquisition, construction or production of a qualifying asset are recognized in the Consolidated Statements of Comprehensive Income using the effective interest method.
u. Income taxesAs the Corporation is an agent of the Crown, it is not subject to federal or provincial corporate income taxes or corporate capital taxes.
v. Consolidated statements of comprehensive income presentation In �scal 2016–17, the Corporation changed the presentation of the Consolidated Statements of Comprehensive Income for the current and comparative periods to better align external and internal reporting. The new presentation classi�es expenses by nature, is based on the Corporation’s de�nitions of direct and indirect expenses versus function in the past. Finance costs remain unchanged, while Finance income and Foreign exchange gain have been combined to form Finance income. Other income and Other charges have been combined to form Other.
Direct expenses are costs that are directly associated with current �scal gaming or non-gaming revenue and vary as revenue changes. Indirect expenses are costs that do not directly vary with current �scal revenue levels. Contribution margin is total gaming and non-gaming revenue net of direct expenses.
w. Initial application of standards, interpretation and amendmentsThe Corporation did not adopt any new or amended accounting pronouncements that had a material impact on the Consolidated Financial Statements.
x. Accounting standards issued but not yet effectiveA number of new accounting standards and amendments to standards are not yet effective as at March 31, 2017 and have not been applied in preparing these Consolidated Financial Statements.
(i) IFRS 15, Revenue from Contracts with Customers (IFRS 15)In May 2014, the IASB issued IFRS 15, replacing IAS 11, Construction Contracts, IAS 18, Revenue and IFRIC 13, Customer Loyalty Programmes. The standard contains a single model that applies to contracts with customers and two approaches to recognizing revenue: at a point in time or over time. New estimates and judgmental thresholds have been introduced which may affect the amount and/or timing of revenue recognized. In April 2016, clari�cations to IFRS 15 were issued to provide additional guidance with respect to the �ve-step analysis, transition and the application of the standard to licences of intellectual property. IFRS 15 and the clari�cations are mandatorily effective for annual periods beginning on or after January 1, 2018. The Corporation is assessing the impact of this standard on the Consolidated Financial Statements.
(ii) IFRS 9, Financial Instruments (IFRS 9)In July 2014, the IASB issued the complete IFRS 9 which replaces IAS 39, Financial Instruments: Recognition and Measurement. The new standard provides guidance on the classi�cation and measurement of �nancial assets and introduces a new expected credit loss model for calculating impairment. It also incorporates general hedge accounting requirements. IFRS 9 is mandatorily effective for annual periods beginning on or after January 1, 2018. The Corporation is assessing the impact of this standard on its Consolidated Financial Statements.
(iii) IFRS 16, Leases (IFRS 16)In January 2016, the IASB issued IFRS 16, replacing IAS 17, Leases and IFRIC 4, Determining whether an arrangement contains a lease. The standard introduces a single lessee accounting model and requires a lessee to recognize assets and liabilities for all leases with a term of more than 12 months, unless the underlying asset is of
52114 Form 2 AnnualReport2016-2017-Text_English.indd 54 2017-11-02 5:41 PM

55NOTES TO THE CONSOLIDATED FINANCIAL STATEMENTS
low value. A lessee is required to recognize a right-of-use asset representing its right to use the underlying asset and a lease liability representing its obligation to make lease payments. The accounting treatment for lessors will remain largely the same as under IAS 17. IFRS 16 is mandatorily effective for annual periods beginning on or after January 1, 2019. The Corporation is assessing the impact of this new standard on its Consolidated Financial Statements.
5. CAPITAL RISK MANAGEMENTThe capital structure of the Corporation consists of cash and cash equivalents, long-term debt and equity, comprising retained earnings, contributed surplus and reserves.
The Corporation is required to �nance certain capital expenditures with debt obtained from the Ontario Financing Authority (OFA). The approval of the Minister of Finance is required for the Corporation to borrow funds for major capital expenditures.
The Corporation’s objectives in managing capital are to ensure suf�cient resources are available for it to continue to fund future development and growth of its operations and to provide returns to the Province of Ontario.
The Board of Directors is responsible for the oversight of Management, including policies related to �nancial and risk management. The Corporation manages its capital structure and makes adjustments to it in light of changes in economic conditions and the risk characteristics of the underlying assets. Operating agreements require the Resort Casinos to establish reserve funds. The Corporation is not subject to any externally imposed capital requirements. Refer to Note 22 for further details on the Corporation’s �nancial risk management and �nancial instruments.
6. RESTRICTED CASHRestricted cash, consisting of the following items and respective amounts, is held in separate bank accounts.
March 31, 2017 March 31, 2016
Current
Prize funds on deposit (a) $ 50,135 $ 45,264
Horse racing funds (b) 4,034 3,734
Other (c) 7,955 7,944
$ 62,124 $ 56,942
Non-current
Reserves (d)
Capital renewals $ 19,267 $ 18,503
Operating 55,516 54,308
Severance 46,518 46,146
$ 121,301 $ 118,957
Restricted cash $ 183,425 $ 175,899
a. Prize funds on deposit of $50,135,000 (March 31, 2016 – $45,264,000) are funds set aside representing the estimate of gross prizes outstanding of $86,221,000
(March 31, 2016 – $82,333,000) less an estimate for prizes not expected to be claimed by customers of $36,086,000 (March 31, 2016 – $37,069,000).
b. Standardbred Horsepeople’s Purse Funds of $4,034,000 (March 31, 2016 – $3,734,000) were received from the Ontario Racing Commission to fund activities that will
provide bene�ts to horsepeople.
c. Other restricted cash represents loan proceeds for the Gaming Management System project, funds held on behalf of Internet Gaming patrons and interest earned and received.
d. The Corporation has established reserves at the Resort Casinos in accordance with their respective operating agreements, or on other terms as otherwise agreed to, for the
following purposes:
(i) Capital renewals reserves – for property, plant and equipment additions, other than normal repairs, and to satisfy speci�ed obligations in the event that cash �ows
are insuf�cient to meet such obligations
(ii) Operating reserves – to satisfy speci�ed operating obligations in the event that cash �ows are insuf�cient to meet such obligations
(iii) Severance reserves – to satisfy certain obligations of the Corporation arising from the termination or layoff of employees of an operator in connection with the termination of an operator
52114 Form 2 AnnualReport2016-2017-Text_English.indd 55 2017-11-02 5:41 PM

OLG ANNUAL REPORT 2016–1756
(tabular amounts in thousands of Canadian dollars)
7. TRADE AND OTHER RECEIVABLES
March 31, 2017 March 31, 2016
Trade receivables $ 144,412 $ 152,282
Less: allowance for impairment (5,019) (5,159)
Trade receivables, net 139,393 147,123
Other receivables 11,538 12,017
Trade and other receivables $ 150,931 $ 159,140
The Corporation’s exposure to credit risks and impairment losses related to trade and other receivables is disclosed in Note 22.
8. INVENTORIES
March 31, 2017 March 31, 2016
Slot machine and table game parts $ 2,285 $ 3,086
Lottery and charitable gaming tickets and paper 21,408 17,620
Security and surveillance parts 1,047 1,435
Food and beverage 2,690 2,693
Retail 941 815
Other 2,887 2,399
Inventories $ 31,258 $ 28,048
Inventory costs, included in expenses, for the year ended March 31, 2017 were $117,480,000 (March 31, 2016 – $110,963,000). During �scal 2016–17, the Corporation recorded nil inventory write-downs (�scal 2015–16 – $285,000 of inventory write-downs in expenses).
52114 Form 2 AnnualReport2016-2017-Text_English.indd 56 2017-11-02 5:41 PM

57NOTES TO THE CONSOLIDATED FINANCIAL STATEMENTS
9. PROPERTY, PLANT AND EQUIPMENT
Cost
Land Buildings
Furniture, fixtures and equipment
Leasehold improvements
Lottery gaming assets
Slots and Casinos and
Resort Casinos gaming assets
Assets under
finance lease
Construction in progress and assets
not yet in use Total
Balance at April 1, 2015
$ 137,824 $ 1,905,317 $ 603,044 $ 646,696 $ 85,699 $ 613,091 $ 68,608 $ 56,561 $ 4,116,840
Additions and assets put into use
– 11,143 52,142 12,761 8,237 60,365 2,645 (13,868) 133,425
Disposals and retirements
(763) (34,012) (29,760) (10,875) (10,107) (73,823) – (20,624) (179,964)
Balance at March 31, 2016
$ 137,061 $ 1,882,448 $ 625,426 $ 648,582 $ 83,829 $ 599,633 $ 71,253 $ 22,069 $ 4,070,301
Balance at April 1, 2016
$ 137,061 $ 1,882,448 $ 625,426 $ 648,582 $ 83,829 $ 599,633 $ 71,253 $ 22,069 $ 4,070,301
Additions and assets put into use
– 7,576 20,911 7,317 11,690 60,857 2,252 10,508 121,111
Disposals and retirements – (1,090) (24,960) (10,820) – (41,383) (417) (529) (79,199)
Transfers to held for sale (Note 10)
(7,410) (118,382) (46,162) (32,517) – (64,469) – – (268,940)
Balance at March 31, 2017
$ 129,651 $ 1,770,552 $ 575,215 $ 612,562 $ 95,519 $ 554,638 $ 73,088 $ 32,048 $ 3,843,273
Accumulated amortization and accumulated impairment losses
Land Buildings
Furniture, fixtures and equipment
Leasehold improvements
Lottery gaming assets
Slots and Casinos and
Resort Casinos gaming assets
Assets under
finance lease
Construction in progress and assets
not yet in use Total
Balance at April 1, 2015
$ 41,091 $ 1,116,512 $ 520,917 $ 542,885 $ 83,615 $ 474,197 $43,240 $ – $ 2,822,457
Amortization for the period – 39,351 34,608 21,134 1,623 57,928 2,837 – 157,481
Impairment loss – – 3,852 – – – 2,644 – 6,496
Disposal and retirements – (20,725) (28,502) (10,552) (10,074) (70,307) – – (140,160)
Balance at March 31, 2016
$ 41,091 $ 1,135,138 $ 530,875 $ 553,467 $ 75,164 $ 461,818 $48,721 $ – $ 2,846,274
Balance at April 1, 2016
$ 41,091 $ 1,135,138 $ 530,875 $ 553,467 $ 75,164 $ 461,818 $ 48,721 $ – $ 2,846,274
Amortization for the period – 36,638 35,416 20,522 3,118 54,098 2,705 – 152,497
Impairment loss – – 579 – – – 2,252 – 2,831
Disposal and retirements – (752) (24,845) (9,804) – (40,686) (416) – (76,503)
Transfers to held for sale (Note 10) – (71,097) (39,801) (29,746) – (46,858) – – (187,502)
Balance at March 31, 2017
$ 41,091 $ 1,099,927 $ 502,224 $ 534,439 $ 78,282 $ 428,372 $ 53,262 $ – $ 2,737,597
52114 Form 2 AnnualReport2016-2017-Text_English.indd 57 2017-11-02 5:41 PM

OLG ANNUAL REPORT 2016–1758
(tabular amounts in thousands of Canadian dollars)
Carrying amounts
Land Buildings
Furniture,fixtures andequipment
Leaseholdimprovements
Lotterygamingassets
Slots andCasinos and
Resort Casinosgaming assets
Assets underfinance lease
Constructionin progressand assets
not yet in use Total
Balance atMarch 31, 2016
$ 95,970 $ 747,310 $ 94,551 $ 95,115 $ 8,665 $ 137,815 $ 22,532 $ 22,069 $ 1,224,027
Balance atMarch 31, 2017
$ 88,560 $ 670,625 $ 72,991 $ 78,123 $ 17,237 $ 126,266 $ 19,826 $ 32,048 $ 1,105,676
The Corporation leases certain items of property, plant and equipment under �nance lease agreements. At March 31, 2017, the net carrying amount of leased property, plant and equipment was $19,826,000 (March 31, 2016 – $22,532,000).
ImpairmentAs a result of the economic performance of the cGaming CGUs, made up of the individual cGaming Centres, Management performed an impairment analysis.
The recoverable amounts of the CGUs were based on fair value less costs of disposal, which was greater than the value in use. Management performed the fair value analysis utilizing discounted cash �ows based on its best estimates and using the market information currently available. The valuation technique used Level 3 inputs which are unobservable inputs supported by little or no market activity for the assets (Note 22.f). Cash �ow projections were based on annual approved budgets and Management’s projections thereafter. The cash �ows are Management’s best estimate of future events taking into account past experience and future economic assumptions. A discount rate of 7.0 per cent that was applied to the cash �ow projections was derived from Management’s consideration of current market assessments and the risks speci�c to the CGUs.
Management determined that the recoverable amount of the CGUs of $nil was less than their carrying value and, as a result, an impairment loss of $2,831,000 (�scal 2015–16 – $6,496,000) was recognized in Other in the Consolidated Statements of Comprehensive Income. The impairment loss relates to the cGaming line of business in Note 26.
Management did not identify any further impairment indicators at any of the Corporation’s other CGUs and, therefore, has not recognized any additional impairment losses at March 31, 2017.
10. DISPOSAL GROUP HELD FOR SALEOn December 13, 2016, OLG announced the selection of Gateway as the Service Provider for the North and Southwest Gaming Bundles. Under the terms of the TAPAs, OLG committed to sell certain assets and Gateway agreed to assume certain liabilities related to the sites in the bundles (Note 27). Accordingly, at March 31, 2017, these assets and liabilities met the criteria to be classi�ed as a disposal group held for sale and stated at their carrying values comprised the following:
March 31, 2017
Cash $ 29,458
Property, plant and equipment 81,438
Other 1,710
Assets held for sale $ 112,606
Trade payables and other $ 1,007
Liabilities held for sale $ 1,007
52114 Form 2 AnnualReport2016-2017-Text_English.indd 58 2017-11-02 5:41 PM

59NOTES TO THE CONSOLIDATED FINANCIAL STATEMENTS
11. OTHER ASSETOn September 8, 2016, the Corporation entered into a lease agreement for 22 years plus a stump period, as de�ned, with the Mississaugas of Scugog Island First Nation to lease the premises that situate the Great Blue Heron Casino (Note 2). This agreement is considered to be a �nance lease for accounting purposes. The total remaining obligation under the �nance lease is $142,871,000 at March 31, 2017 (Note 21). The related asset as at March 31, 2017 was $140,613,000, which is amortized over the life of the lease agreement. The amortization expense recognized during �scal 2016–17 was $3,460,000. 12. TRADE AND OTHER PAYABLES
March 31, 2017 March 31, 2016
Trade payables and accruals $ 103,263 $ 82,387
Prizes payable 50,135 45,264
Short-term employee bene�ts 51,434 56,225
Gaming liability 72,851 68,258
Commissions payable 27,031 25,105
Horse racing liability 3,261 3,734
Other payables and accruals 46,382 35,213
Trade and other payables $ 354,357 $ 316,186
Prizes payable comprise unclaimed and estimated Lottery prizes.
Short-term employee bene�ts include salaries payable, incentive accruals, long-term service awards, vacation pay accrual and other short-term employee-related liabilities.
Gaming liability consists of progressive jackpots, unredeemed chips, customer loyalty incentive points and other gaming-related payables. Progressive jackpots are measured based on the anticipated payout of the progressive jackpots. Unredeemed chips are funds deposited by customers for chips before gaming play occurs where the chips remain in the customers’ possession. Customer loyalty incentive points that are earned based on the volume of play and redeemable for complimentary goods and services and/or cash are recognized as a liability and measured at the amount payable on demand.
Commissions payable include amounts payable to lottery retailers and cGaming Centre service providers, municipalities and First Nations that host a Casino, a cGaming Centre or a Slots at Racetracks facility, including the City of Niagara Falls and the City of Windsor.
Horse racing liability represents the Standardbred Horsepeople’s Purse Funds received from the Ontario Racing Commission to fund activities that will provide bene�ts to horsepeople.
Other payables and accruals include accrued win contribution, casino customer deposits, security deposits, corporate marketing and other miscellaneous amounts.
The Corporation’s exposure to currency and liquidity risks related to trade and other payables is disclosed in Note 22.
52114 Form 2 AnnualReport2016-2017-Text_English.indd 59 2017-11-02 5:41 PM

OLG ANNUAL REPORT 2016–1760
(tabular amounts in thousands of Canadian dollars)
13. PROVISIONSAll provisions are included in current liabilities. The carrying amount was as follows:
Legal claims
Otherprovisions Total
Balance at April 1, 2016 $ 1,966 $ 3,857 $ 5,823
Increases and additional provisions 2,549 1,266 3,815
Amounts paid (814) (639) (1,453)
Amounts reversed (928) (473) (1,401)
Balance at March 31, 2017 $ 2,773 $ 4,011 $ 6,784
Legal claimsDuring �scal 2016–17, an additional $2,549,000 of potential legal claims was accrued, with an offsetting reduction of $814,000 in payments to claimants. The $928,000 of legal claims reversed in �scal 2016–17 was due to the likelihood of the obligations becoming remote. The ultimate outcome or actual cost of settlement may vary signi�cantly from the original estimates. Material obligations that have not been recognized as provisions, as the outcome is not probable or the amount cannot be reliably estimated, are disclosed as contingent liabilities, unless the likelihood of the outcome is remote (Note 25).
Other provisionsOther provisions include provisions for decommissioning obligations and insurance claims.
The decommissioning provision is associated with the retirement of tangible long-lived assets that results from the acquisition, construction, development and/or normal use of the assets. During �scal 2016–17, an additional $99,000 of decommissioning obligations was accrued.
During �scal 2016–17, an additional $1,167,000 of insurance claims was accrued, $639,000 of insurance claims was settled and $473,000 of accrued claims were reversed as the likelihood was remote that the claims would be incurred.
14. FINANCE INCOME (COSTS)
March 31, 2017 March 31, 2016
Interest income on �nancial assets at fair value through pro�t and loss and loans and receivables
$ 2,163 $ 2,203
Foreign exchange gain 8,771 6,816
Finance income $ 10,934 $ 9,019
Interest on bank overdraft and loans $ (381) $ (505)
Interest on obligations under �nance leases (6,392) (4,693)
Other interest expense (2,657) (90)
Total interest expense for �nancial liabilities not classi�ed at fair value through pro�t and loss
$ (9,430) $ (5,288)
Finance costs $ (9,430) $ (5,288)
52114 Form 2 AnnualReport2016-2017-Text_English.indd 60 2017-11-02 5:41 PM

61NOTES TO THE CONSOLIDATED FINANCIAL STATEMENTS
15. RELATED PARTIESThe Corporation is related to various other government agencies, ministries and Crown corporations. Related party transactions include loan agreements with the OFA (Note 21), post-employment bene�t plans with the Ontario Pension Board (Note 23.b), other long-term employee bene�ts with the Workplace Safety and Insurance Board (Note 23.c) and restricted intermediary funding arrangements with the Province of Ontario related to horse racing (Note 6).
All transactions with these related parties are in the normal course of operations and are measured at the exchange amounts, which are the amounts of consideration established and agreed to by the related parties.
Transactions with key management personnelKey management personnel compensationThe Corporation’s key management personnel, consisting of the Corporation’s Board of Directors and the Executive Committee, have authority and responsibility for overseeing, planning, directing and controlling the activities of the Corporation.
Key management personnel compensation was comprised of the following:
March 31, 2017 March 31, 2016
Short-term employee bene�ts $ 3,944 $ 4,201
Post-employment bene�ts 239 227
$ 4,183 $ 4,428
Short-term employee bene�ts include salaries and bene�ts and other short-term compensation.
Post-employment bene�ts include the employer’s portion of pension and other post-retirement bene�ts.
16. DUE TO OPERATORS AND SERVICE PROVIDER
March 31, 2017 March 31, 2016
Due to operators (a) $ 186,511 $ 184,170
Due to service provider (b) 7,180 –
193,691 184,170
Less: current portion 47,857 40,694
Due to operators and service provider non-current $ 145,834 $ 143,476
52114 Form 2 AnnualReport2016-2017-Text_English.indd 61 2017-11-02 5:41 PM

OLG ANNUAL REPORT 2016–1762
(tabular amounts in thousands of Canadian dollars)
a) Under the terms of the operating agreements for each of the Resort Casinos and the Great Blue Heron Casino, each operator is entitled to receive an operator’s fee calculated as a percentage of Gross Revenue and as a percentage of Net Operating Margin, both as de�ned in each of the related operating agreements. The total amount accrued with respect to the operator’s fees at March 31, 2017 was $38,668,000 (March 31, 2016 – $38,000,000). The Resort Casinos, including Great Blue Heron Casino, and their respective operators are as follows:
Site Operator Operating Agreement Term Expiration
Casino Niagara and Fallsview Falls Management Group, L.P. June 10, 2019
Casino Rama CHC Casinos Canada Limited Month-to-month until September 30, 2018
Caesars WindsorCaesars Entertainment Windsor Limited (CEWL)
July 31, 2020
Great Blue Heron Casino Great Blue Heron Gaming CompanyEarlier of (a) June 30, 2020, (b) date successor operator takes over, or (c) OLG providing 90 days’ prior notice
Also included in amounts due to operators are:
i. Casino Niagara and FallsviewDuring �scal 2015–16, the Corporation exercised an option to not extend the Permanent Casino Operating Agreement, which is set to expire June 10, 2019, resulting in non-extension costs and HST being incurred as disclosed in Note 20. As at March 31, 2017, the non-current amount due to the operator was $145,834,000 (March 31, 2016 – $143,476,000) with payment due on or before June 10, 2019. Under the terms of the Permanent Casino Operating Agreement, in a Competitive Environment, as de�ned in the operating agreement, the operator is entitled to receive additional operator services fees and an attractor fee. As a result, at March 31, 2017, the Corporation has included $1,705,000 (March 31, 2016 – $2,411,000) in due to operators and has a remaining commitment as at March 31, 2017 is $5,317,000.
ii. Caesars WindsorUnder the terms of a trademark licence agreement for the rebranding of Caesars Windsor, the Corporation pays a licence fee calculated as a percentage of the revenue and operating results, as de�ned, of Caesars Windsor. The trademark licence agreement is with a parent company of CEWL and will terminate on July 31, 2020. As at March 31, 2017, the amount included in due to operators in respect of the trademark licence agreement was $304,000 (March 31, 2016 – $283,000).
As at March 31, 2017, the current and non-current amount due to operators was $186,511,000 (March 31, 2016 – $184,170,000).
At each of the Resort Casinos and the Great Blue Heron Casino, the operator is the employer, either directly or indirectly, of the employees working at that facility. All payroll and payroll-related costs are charged to the Corporation on a monthly basis and expensed in the Corporation’s Consolidated Statements of Comprehensive Income.
52114 Form 2 AnnualReport2016-2017-Text_English.indd 62 2017-11-02 5:41 PM

63NOTES TO THE CONSOLIDATED FINANCIAL STATEMENTS
b) Under the terms of the COSA of the East Gaming Bundle, OGELP is entitled to receive a share of the gaming revenue, as de�ned, generated at the Casinos and Slot facility it operates. The amount due to Service Provider represents the accrued Service Provider’s share of revenue which re�ects the �xed fee, a variable fee (calculated as a percentage of gaming revenue above a set revenue threshold) and an amount for permitted capital expenditures. The Service Provider operated gaming bundle and sites is as follows:
OLG Gaming Bundle
Sites Service Provider Operating Agreement Term Expiration
East• Casino Thousand Islands• Slots at Kawartha Downs• Casino Belleville
OGELP March 31, 2036
17. DUE TO RAMA FIRST NATIONCasino Rama is located on reserve lands of Rama First Nation (RFN). The Corporation has entered into various contractual agreements with RFN regarding the Corporation’s occupation and operation of the Casino Rama Complex and the provision of community services.
The RFN Agreements expire July 31, 2031 with options to extend for periods of ten and �ve years respectively in the Corporation’s sole discretion.
The key agreements include:
a. Complex Sublease – A sublease to OLG from RFN covering the land on which the Casino Rama Complex is located. The Complex Sublease includes Casino Rama, parking, a warehouse and of�ce space.
b. Amended and Restated Post-2011 Contract relating to Casino Rama – Under this agreement, RFN is entitled to receive an annual fee for each successive 12-month period commencing August 1, 2011 in an amount equal to the greater of 1.9 percent of the Gross Revenues of the Casino Rama Complex, as de�ned, and $5,500,000. Under this agreement, OLG has also agreed to retain the services of RFN for �re protection, police protection and other community services.
At March 31, 2017, $2,500,000 (March 31, 2016 – $2,118,000) was due to RFN. In �scal 2016–17, $26,168,000 was expensed (�scal 2015–16 – $26,163,000) and is included in Cost of premises and equipment and Other in Note 26.
18. WIN CONTRIBUTIONThe Corporation remits a contribution to the Province of Ontario equal to 20 per cent of gaming revenue from the Resort Casinos and the Great Blue Heron Casino in accordance with the Ontario Lottery and Gaming Corporation Act, 1999, which amounted to $289,707,000 for �scal 2016–17 (�scal 2015–16 – $272,447,000) and was recorded as a direct expense.
19. DUE TO THE GOVERNMENT OF CANADAAs at March 31, 2017, the amount due to the Government of Canada was $32,220,000 (March 31, 2016 – $33,292,000), of which $16,042,000 (March 31, 2016 – $15,783,000) is included in the non-current amount due to the Government of Canada related to the Falls Management Group, L.P. non-extension (Note 16). The recognition of this obligation requires Management to make certain estimates regarding the nature, timing and amounts associated with the Due to the Government of Canada.
52114 Form 2 AnnualReport2016-2017-Text_English.indd 63 2017-11-02 5:41 PM

OLG ANNUAL REPORT 2016–1764
(tabular amounts in thousands of Canadian dollars)
a. Payments on behalf of the Province of OntarioThe provincial lottery corporations make payments to the Government of Canada under an agreement dated August 1979 between the provincial governments and the Government of Canada. The agreement stipulates that the Government of Canada will not participate in the sale of lottery tickets.
b. Goods and Services Tax / Harmonized Sales Tax (GST/HST)As a prescribed registrant, the Corporation makes GST/HST remittances to the Government of Canada pursuant to the Games of Chance (GST/HST) Regulations of the Excise Tax Act. The Corporation's net tax for a reporting period is calculated using net tax attributable to both gaming and non-gaming activities.
The net tax attributable to non-gaming activities is calculated in the same way as it is for any other GST/HST registrant in Canada. The non-recoverable GST/HST payable to suppliers and the additional imputed tax payable to the Government of Canada on gaming-related expenses were recognized as payments to the Government of Canada.
The net tax attributable to gaming activities results in a 26 per cent tax burden on most taxable gaming expenditures incurred by the Corporation.
20. OTHER
March 31, 2017 March 31, 2016
Operator non-extension (a) $ – $ 159,259
General and administration (b) 190,270 138,359
ATM fees (40,201) (41,003)
Impairment charge (c) 2,831 6,496
Losses on disposal of property, plant and equipment, net (d) 2,593 1,360
Miscellaneous income (10,667) (9,953)
Other $ 144,826 $ 254,518
a. Operator non-extensionIn �scal 2015–16, the Corporation incurred one-time operator non-extension costs of $159,259,000, including HST of $15,783,000, in relation to exercising its option to not extend the Permanent Casino Operating Agreement with Falls Management Group, L.P. The costs represent the present value of the future payments to be made on or before June 10, 2019. The future undiscounted payments comprise $151,143,000 to the operator and $16,626,000 to the Government of Canada. The amount payable to the operator is included in Due to operators and service provider in Note 16 and the amount Due to the Government of Canada is included in Note 19.
b. General and administrationGeneral and administration expenses are primarily comprised of of�ce supplies and consumables, legal and consulting, research and development, travel, telecommunication, information technology and other miscellaneous expenses.
c. Impairment chargeThe Corporation recognized an impairment loss for the year ended March 31, 2017 of $2,831,000 (March 31, 2016 – $6,496,000), as disclosed in Note 9.
d. Losses on disposal of property, plant and equipment, netDuring �scal 2016–17, the Corporation realized net losses on disposal of property, plant and equipment of $2,593,000 (�scal 2015–16 – $1,360,000). The prior year net losses amount included a gain of $19,548,000 related to the sale of East Gaming Bundle assets (Note 2) offset by losses associated with the discontinuation of capital projects of $20,908,000.
52114 Form 2 AnnualReport2016-2017-Text_English.indd 64 2017-11-02 5:41 PM

65NOTES TO THE CONSOLIDATED FINANCIAL STATEMENTS
21. LONG-TERM DEBT
March 31, 2017 March 31, 2016
Woodbine loan (a) $ 5,069 $ 11,819
Gaming Management System loan (b) 29,097 20,593
Internet Gaming loan (c) – 1,880
Obligations under �nance leases (d) 187,458 50,614
221,624 84,906
Less: current portion (21,397) (18,810)
Long-term debt $ 200,227 $ 66,096
On June 1, 2012, the Province of Ontario amended the Ontario Lottery and Gaming Corporation Act, 1999 to require the Corporation to �nance certain capital expenditures with debt obtained from the OFA. The approval of the Minister of Finance is required for the Corporation to borrow funds for major capital expenditures.
a. Woodbine loanIn October 2010, the Corporation entered into a loan agreement with the OFA for purposes of �nancing the renovation and expansion of the slots facility at Woodbine Racetrack.
The loan balance of $33,802,000, plus interest, was repayable over �ve years in equal monthly payments of $597,222 until �scal 2014–15 when the equal monthly payment changed to $514,690 due to a lump sum payment made in �scal 2013–14. The loan bears interest at a rate of 2.320 per cent per annum and is unsecured. The loan expires in January 2018. b. Gaming Management System loanIn July 2014, the Corporation entered into a loan agreement with the OFA, involving two facilities, to borrow an amount up to $35,200,000 to �nance the implementation of its Gaming Management System. This system will replace infrastructure that tracks and records gaming activity and accounting, as well as data and security events, at all of the slot machines. During �scal 2016–17, the Corporation drew $8,250,000 (prior cumulative advances to March 31, 2016 – $20,450,000), plus accrued interest, on facility one bringing the total cumulative loan balance to $29,097,000 (March 31, 2016 – $20,593,000) which is repayable, inclusive of interest accrued, at the earlier of the project completion date or September 2017, at which time the advance from facility two will be utilized to repay facility one. Facility one bears interest at the rate of OFA’s cost of funds as of the facility advance date plus 0.325 per cent per annum, compounded quarterly. Facility two is a non-revolving �ve-year term and bears interest at the rate of OFA’s �ve-year benchmark interest rate plus 0.325 per cent per annum, compounded semi-annually, and is repayable in semi-annual instalments of interest and principal commencing six months after the facility two advance date. The loan is unsecured.
c. Internet Gaming loanIn August 2014, the Corporation entered into a loan agreement with the OFA to borrow an amount up to $1,833,000 to �nance the capital costs of the PlayOLG website. The full loan balance of $1,833,000 was advanced on September 9, 2014. The loan bore interest at the rate of 1.643 per cent per annum, compounded quarterly. The loan was unsecured. The loan was repaid on September 9, 2016.
d. Obligations under finance leasesEffective March 2010, the Corporation entered into an amending agreement for an additional 15-year term with Maple Leaf Entertainment Inc., Canadian Niagara Hotels Inc., 1032514 Ontario Limited and Greenberg International Inc. to lease the facility that houses Casino Niagara and to license the adjacent parking facilities. The amending
52114 Form 2 AnnualReport2016-2017-Text_English.indd 65 2017-11-02 5:41 PM

OLG ANNUAL REPORT 2016–1766
(tabular amounts in thousands of Canadian dollars)
agreement extends the term of the original lease and licence agreements by 15 years from March 10, 2010 to March 9, 2025. This agreement is considered to be a �nance lease for accounting purposes and has an implicit interest rate of 8.2 per cent. The total remaining obligation under the �nance lease is $33,412,000 at March 31, 2017 (March 31, 2016 – $36,129,000).
The Corporation entered into a master services agreement on August 22, 2012 to lease TapTix, formerly known as BOT dispensers. This agreement is considered to be a �nance lease for accounting purposes and has an implicit interest rate of 9.0 per cent. The total remaining obligation under the �nance lease is $11,175,000 at March 31, 2017 (March 31, 2016 – $14,485,000).
Effective September 8, 2016, the Corporation entered into a lease agreement for 22 years plus a stump period, as de�ned, with the Mississaugas of Scugog Island First Nation to lease the premises that situate the Great Blue Heron Casino (Note 2). This agreement is considered to be a �nance lease for accounting purposes and a discount rate of 2.75 per cent was used to calculate the present value of future lease payments. The total remaining obligation under the �nance lease as at March 31, 2017 is $142,871,000. e. Payments over the next five years and thereafterPayments related to long-term debt and obligations under �nance leases that are expected to be made over the next �ve years and thereafter are approximately as follows:
March 31 Long-term debt Obligations under finance leases Total
Repayments Principal Interest
2018 $ 10,607 $ 10,790 $ 7,411 $ 28,808
2019 5,663 9,987 6,684 22,334
2020 5,816 9,213 6,046 21,075
2021 5,964 8,501 5,463 19,928
2022 6,116 8,620 4,959 19,695
Thereafter – 140,347 36,292 176,639
$ 34,166 $ 187,458 $ 66,855 $ 288,479
22. FINANCIAL RISK MANAGEMENT AND FINANCIAL INSTRUMENTSa. Overview The Corporation has exposure to credit risk, liquidity risk and market risk from its use of �nancial instruments. This note presents information about the Corporation’s exposure to each of these risks and the Corporation’s objectives, policies and processes for measuring and managing them.
b. Risk management frameworkThe Board of Directors, through its Audit and Risk Management Committee (ARMC), provides oversight with respect to the identi�cation and management of risk along with adherence to internal risk management policies and procedures.
The Corporation’s �nancial risk management policies are established to identify and analyze the risks faced by the Corporation, to set appropriate risk limits and controls and to monitor risks and adherence to limits. Risk management policies and systems are reviewed regularly to re�ect changes in market conditions and the Corporation’s activities. The Corporation, through its training and management standards and procedures, aims to develop a disciplined and constructive control environment in which all employees understand their roles and obligations.
52114 Form 2 AnnualReport2016-2017-Text_English.indd 66 2017-11-02 5:41 PM

67NOTES TO THE CONSOLIDATED FINANCIAL STATEMENTS
During �scal 2016–17, the ARMC oversaw how Management monitored compliance with the Corporation’s risk management policies and procedures and reviewed the adequacy of the risk management framework in relation to the risks faced by the Corporation. The ARMC was assisted in its oversight role by Internal Audit. Internal Audit undertakes both regular and ad hoc reviews of risk management controls and procedures, the results of which are reported to the ARMC.
The Corporation has a formal Enterprise Risk Management Program (Program), which is aligned with ISO 31000 and in conformity with the Ontario Public Service risk management guidance and requirements. This Program supports the Corporation in the identi�cation, assessment and management of risks.
c. Credit riskCredit risk is the risk that the Corporation will suffer a �nancial loss due to a third party failing to meet its �nancial or contractual obligations to the Corporation. The Corporation has �nancial instruments that potentially expose it to a concentration of credit risk. The instruments consist of trade and other receivables and liquid investments.
Trade and other receivablesTrade and other receivables include credit provided to retailers of lottery products, cGaming service providers and customers of Resort Casinos which meet the standards set by the AGCO. The Corporation performs initial credit or similar evaluations of retailers, cGaming service providers and customers and maintains reserves for potential credit losses on accounts receivable balances. The carrying amount of these �nancial assets represents the maximum credit exposure.
The amounts disclosed in the Consolidated Statements of Financial Position are net of allowances for impairment, which consist of a speci�c provision that relates to individually signi�cant exposures, estimated by Management based on prior experience and its assessment of the current economic environment. The Corporation establishes an allowance for impairment that represents its estimate of potential credit losses. Historically, the Corporation has not experienced any signi�cant losses. As at March 31, 2017, the Corporation had an allowance for impairment of $5,019,000 (March 31, 2016 – $5,159,000), which represented approximately 3.2 per cent (March 31, 2016 – 3.1 per cent) of the Corporation’s consolidated accounts receivable. The Corporation believes that its allowance for impairment is suf�cient to re�ect the related credit risk.
Liquid investmentsThe Corporation limits its exposure to credit risk by investing only in short-term debt securities with high credit ratings and minimal market risk. The Corporation has a formal policy for short-term investments that provides direction for Management to minimize risk. All investments held by the Corporation are low risk and have a term to maturity of less than 90 days. As a result, this risk is considered minimal.
d. Liquidity riskLiquidity risk is the risk that the Corporation will not be able to meet its �nancial obligations as they fall due. The Corporation’s approach to managing liquidity is to ensure, as much as possible, that it will always have suf�cient liquidity to meet its liabilities when due, under both normal and stressed conditions.
The Corporation currently settles its �nancial obligations using cash provided by operations. The Corporation has established reserves at the Resort Casinos in accordance with their respective operating agreements or on other terms as otherwise agreed to. In addition, all investments held by the Corporation are low risk and have a term to maturity of less than 90 days, further reducing liquidity risk.
The Corporation manages its liquidity risk by performing regular reviews of net income and cash �ows from operations and continuously monitoring the forecast against future liquidity needs. Given the Corporation’s line of business, which historically has generated positive cash �ows, liquidity risk is considered minimal.
52114 Form 2 AnnualReport2016-2017-Text_English.indd 67 2017-11-02 5:41 PM

OLG ANNUAL REPORT 2016–1768
(tabular amounts in thousands of Canadian dollars)
The undiscounted contractual maturities of the �nancial liabilities are as follows:
March 31, 2017 Carrying amountContractual cash flows < 1 year 1–2 years 3–5 years > 5 years
Trade and other payables $ 354,357 $ 354,357 $ 354,357 $ – $ – $ –
Provisions 6,784 6,784 6,784 – – –
Due to operators and service provider 193,691 199,000 47,857 – 151,143 –
Due to Rama First Nation 2,500 2,500 2,500 – – –
Due to the Government of Canada 32,220 32,804 16,178 – 16,626 –
Long-term debt, including obligations under �nance leases
221,624 290,605 29,564 22,903 61,499 176,639
$ 811,176 $ 886,050 $ 457,240 $ 22,903 $ 229,268 $ 176,639
March 31, 2016 Carrying amountContractual cash flows < 1 year 1–2 years 3–5 years > 5 years
Trade and other payables $ 316,186 $ 316,186 $ 316,186 $ – $ – $ –
Provisions 5,823 5,823 5,823 – – –
Due to operators and service provider 184,170 191,837 40,694 – 151,143 –
Due to Rama First Nation 2,118 2,118 2,118 – – –
Due to the Government of Canada 33,292 34,135 17,509 – 16,626 –
Long-term debt, including obligations under �nance leases
84,906 104,335 23,322 20,707 34,850 25,456
$ 626,495 $ 654,434 $ 405,652 $ 20,707 $ 202,619 $ 25,456
e. Market riskMarket risk is the risk that the fair value of future cash �ows of a �nancial instrument will �uctuate because of changes in market prices. Market risk includes interest rate risk, foreign currency risk and other market price risk.
(i) Interest rate riskInterest rate risk is the risk that the fair value of future cash �ows of a �nancial instrument will �uctuate due to changes in market interest rates. The Corporation has �nancial assets and liabilities that potentially expose it to interest rate risk.
The Corporation is subject to interest rate risk on its cash and cash equivalents, including short-term investments with maturity dates of less than 90 days and long-term debt.
Long-term debt currently consists of two loan agreements with the OFA and obligations under �nance leases. The obligations under �nance leases (Note 21.d) and one of the loan agreements have �xed interest rates for their entire terms, while the other loan agreement is subject to variable interest rates. Each of the long-term debt instruments is currently subject to limited interest rate risk.
At March 31, 2017, the Corporation had cash and cash equivalents of $307,224,000 (March 31, 2016 – $325,034,000). The impact of �uctuations in interest rates is not signi�cant and, accordingly, a sensitivity analysis of the impact of �uctuations in interest rates on net income has not been provided.
(ii) Foreign currency riskForeign currency risk is the risk that the value of a �nancial instrument will �uctuate due to changes in foreign exchange rates. The Corporation is exposed to foreign currency risk by settling certain obligations in foreign currencies, primarily in U.S. dollars (USD), and by holding bank accounts and investments in USD.
52114 Form 2 AnnualReport2016-2017-Text_English.indd 68 2017-11-02 5:41 PM

69NOTES TO THE CONSOLIDATED FINANCIAL STATEMENTS
The majority of the Corporation’s suppliers and customers are based in Canada and, therefore, transact in Canadian dollars (CAD). Some suppliers and customers are based outside of Canada. The suppliers located outside of Canada typically transact in USD. The Corporation’s border properties attract U.S. players who are required to exchange their USD for CAD prior to play. The Corporation exchanges USD using the daily market exchange rate and utilizes both a ‘buy’ and ‘sell’ rate. The Corporation holds USD cash and bank accounts for the purposes of transacting in USD with customers, as well as paying its U.S. suppliers. The balances held in USD are closely monitored to ensure future USD requirements are met. The Corporation’s foreign exchange gain for the year ended March 31, 2017 was $8,771,000 (March 31, 2016 – $6,816,000).
The Corporation does not enter into �nancial instruments for trading or speculative purposes. The Corporation’s exposure to currency risk, based on the carrying amounts, is as follows:
USD March 31, 2017 March 31, 2016
Cash and cash equivalents $ 29,251 $ 21,036
Trade and other payables (4,667) (3,435)
Obligations under �nance leases (11,175) (14,485)
Net exposure $ 13,409 $ 3,116
All USD balances are shown in CAD equivalents.
Sensitivity analysisA 10 per cent increase in the value of the USD at March 31, 2017 would have increased net income by $1,341,000. A 10 per cent decrease in the value of the USD at March 31, 2017 would have decreased net income by $1,341,000. This analysis assumes that all other variables, including interest rates, remain constant.
(iii) Other market price riskThe Corporation offers sports-based lottery products in the marketplace. The Corporation manages risks associated with these products by setting odds for each event within a short time frame before the actual event, by establishing sales liability thresholds by sport, by providing credit management controls, by posting conditions and prize structure statements on OLG.ca and by limiting the aggregate amount of prizes that may be won on any given day for all sports-based products. The Corporation also has the authority to suppress sales of any game at any time when liability risk is a concern.
f. Fair values measurement Financial instruments are measured subsequent to initial recognition at fair value and grouped into Levels 1 to 3 based on the degree to which the fair value is observable. The Corporation has determined the fair value of its �nancial instruments as follows:
Level 1 fair value measurements are those derived from quoted prices (unadjusted) in active markets for identical assets or liabilities.
The Corporation’s �nancial instruments carried at fair value in the Consolidated Statements of Financial Position, which consist of cash and cash equivalents and restricted cash, are valued using quoted market prices that are included in Level 1.
Level 2 fair value measurements are those derived from inputs other than quoted prices included within Level 1 that are observable for the asset or liability, either directly (i.e., prices) or indirectly (i.e., derived from prices).
52114 Form 2 AnnualReport2016-2017-Text_English.indd 69 2017-11-02 5:41 PM

OLG ANNUAL REPORT 2016–1770
(tabular amounts in thousands of Canadian dollars)
In the Consolidated Statements of Financial Position, the carrying amounts of trade and other payables, current due to operators and service provider, due to Rama First Nation and due to the Government of Canada approximate fair values because of the short-term nature of these �nancial instruments or because they are payable on demand.
Trade and other receivables are carried at amortized cost using the effective interest method.
The fair value of the Corporation’s long-term debt, excluding obligations under �nance leases, is not determinable given its related party nature, and there is no observable market for the Corporation’s long-term debt. Obligations under �nance leases and non-current due to operators and service provider and due to the Government of Canada are carried at amortized cost using the effective interest method which approximates fair value.
Level 3 fair value measurements are those derived from valuation techniques that include inputs for the asset or liability that are not based on observable market data (i.e., unobservable inputs).
There were no �nancial statement categories in Level 3 (valuation techniques using non-observable data) for the years ended March 31, 2017 or March 31, 2016.
Fair value estimates are made at a speci�c point in time, based on relevant market information and information about the �nancial instruments. These estimates are subjective in nature and involve uncertainties and matters of signi�cant judgment and, therefore, cannot be determined with precision. Changes in assumptions could signi�cantly affect the estimates.
23. EMPLOYEE BENEFITSa. Defined contribution plansThe operators of the Resort Casinos and the Great Blue Heron Casino have created de�ned contribution pension plans for their employees. The pension expense for �scal 2016–17 amounted to $21,598,000 (�scal 2015–16 – $20,286,000).
b. Other post-employment benefit plansThe Corporation provides pension bene�ts for all its permanent employees and for non-permanent employees who elect to participate through the PSPF and the OPSEU Pension Fund, which are sole-sponsored de�ned bene�t pension plans established by the Province of Ontario. The Province of Ontario controls all entities included in the PSPF and OPSEU Pension Fund. Contribution rates are set by the Public Service Pension Act, whereby the Corporation matches all regular contributions made by the member. The Corporation classi�ed these plans as state plans whereby there is no contractual agreement or stated policy for charging the net de�ned bene�t cost of the plans to the Corporation. As such, the Corporation accounts for these post-employment bene�ts as de�ned contribution plans and has recorded no additional liability for the plan de�cit. The annual contributions made by the Corporation are recorded as an expense in the Consolidated Statements of Comprehensive Income. The Corporation’s contribution and pension expense for �scal 2016–17 was $19,602,000 (�scal 2015–16 – $20,269,000).
c. Other long-term employee benefits As a Schedule 2 employer under the Workplace Safety and Insurance Act, 1997, (the Act), the Corporation is individually responsible for the full cost of accident claims �led by its workers. The Workplace Safety and Insurance Board (WSIB) maintains full authority over the claims entitlement process and administers and processes claims payments on the Corporation’s behalf. WSIB liabilities for self-insured employers are reported in the Consolidated Statements of Financial Position.
52114 Form 2 AnnualReport2016-2017-Text_English.indd 70 2017-11-02 5:41 PM

71NOTES TO THE CONSOLIDATED FINANCIAL STATEMENTS
The WSIB accrual at March 31, 2017 was $19,004,000 (March 31, 2016 – $16,683,000), of which $17,674,000 (March 31, 2016 – $15,515,000) is included in non-current employee bene�ts liability and $1,330,000 (March 31, 2016 – $1,168,000) is included in trade and other payables in Note 12. The accrued bene�t costs are based on actuarial assumptions.
The operators of the Resort Casinos and the Great Blue Heron Casino are Schedule 1 employers under the Act and are not subject to the �nancial reporting requirements of self-insured employers.
24. COMMITMENTSa. Obligations under operating leases The Corporation has entered into several operating leases for facilities, property and equipment with a typical range of �ve to seven years. The future minimum lease payments are, approximately, as follows:
2018 $ 87,256
2019 42,501
2020 38,428
2021 24,502
2022 14,102
$ 206,789
Thereafter 22,006
$ 228,795
b. HST on lease commitmentsThe Corporation and the Resort Casinos have entered into several agreements to lease property, plant and equipment from the Corporation’s subsidiary and other external parties. The non-recoverable HST and the additional imputed tax on the gaming-related assets payable to the Government of Canada, as described in Note 19.b, on the future lease payments are, approximately, as follows:
2018 $ 31,874
2019 27,095
2020 22,051
2021 17,716
2022 13,157
111,893
Thereafter 196,550
$ 308,443
c. Suppliers The Corporation has computer hardware maintenance agreements with future payments as at March 31, 2017 of approximately:
2018 $ 21,051
2019 426
$ 21,477
52114 Form 2 AnnualReport2016-2017-Text_English.indd 71 2017-11-02 5:41 PM

OLG ANNUAL REPORT 2016–1772
(tabular amounts in thousands of Canadian dollars)
d. Ontario First Nations (2008) Limited Partnership On February 19, 2008, Her Majesty the Queen in Right of Ontario, the Corporation, the Ontario First Nations Limited Partnership and Ontario First Nations (2008) Limited Partnership entered into the Gaming Revenue Sharing and Financial Agreement (GRSFA). Pursuant to the terms of the GRSFA and an Order-in-Council, the Corporation was directed to pay the Ontario First Nations (2008) Limited Partnership, commencing in �scal 2011–12 and in each �scal year for the remainder thereafter of the 20-year term, an amount equal to 1.7 per cent of the prior year’s Gross Revenues of the Corporation, as de�ned (Gaming Revenue Sharing Payment). Pursuant to the GRSFA, during �scal 2016–17, $137,349,000 was expensed (�scal 2015–16 – $122,057,000) as Gaming Revenue Sharing Payment.
25. CONTINGENCIESThe Corporation is, from time to time, involved in various legal proceedings of a character normally incidental to its business. The Corporation believes that the outcome of these outstanding claims will not have a material impact on its Consolidated Statements of Financial Position or the possibility of an out�ow of resources is remote. Estimates, where appropriate, have been included in the Consolidated Statements of Financial Position (Note 13); however, additional settlements, if any, concerning these contingencies will be accounted for as a charge in the Consolidated Statements of Comprehensive Income in the period in which the settlement occurs. 26. OTHER INFORMATIONThe Corporation has �ve lines of business and a Corporate Services division. The �ve lines of business are distinct revenue-generating business units that offer different products and services and are managed separately because they require different technologies and marketing strategies. The Corporate Services division provides support services to all of the revenue-generating lines of business. The following summary describes the operations in each line of business: • Lottery derives its revenue from the sale of lottery products, which include Lotto, INSTANT and Sports products.
Lotto products are also available for purchase over the Internet at PlayOLG.
• Charitable Gaming (cGaming) derives its revenue from the sale of Charitable Gaming products.
• Resort Casinos are full-service casinos that offer customers a variety of amenities, including accommodations, entertainment and food and beverage services, in addition to slot and table games.
• Slots and Casinos are gaming facilities including sites operated by OLG or a Service Provider.
• OLG Casinos, including Great Blue Heron Casino, offer slot and table games, as well as food and beverage services. OLG Slots are located at racetrack sites and include only slot games. Food and beverage services are also offered at the racetrack sites; however, at most of the locations, OLG is not the entity providing these services. At the Service Provider operated sites, OLG receives a share of the gaming revenue generated. The non-gaming revenue is earned and retained by the Service Provider.
• Internet Gaming (iGaming) derives its revenue from casino-style games available over the Internet at PlayOLG.
52114 Form 2 AnnualReport2016-2017-Text_English.indd 72 2017-11-02 5:41 PM

73NOTES TO THE CONSOLIDATED FINANCIAL STATEMENTS
March 31, 2017 Lottery cGaming Resort CasinosSlots and
Casinos iGamingCorporate Services Total
Revenues
Gaming $ 3,680,753 $ 153,044 $ 1,329,523 $ 2,130,815 $ 58,365 $ – $ 7,352,500
Non-gaming – – 103,782 18,591 – – 122,373
3,680,753 153,044 1,433,305 2,149,406 58,365 – 7,474,873
Direct expenses –
Prizes 2,035,482 – – – – – 2,035,482
Commissions and fees 266,161 120,426 112,600 94,737 9,949 – 603,873
Win contribution (Note 18) – –- 265,860 23,847 – – 289,707
Food, beverage, and other purchases
– – 92,334 11,918 – – 104,252
Ticket printing 35,062 5,597 – – – – 40,659
2,336,705 126,023 470,794 130,502 9,949 – 3,073,973
Contribution margin 1,344,048 27,021 962,511 2,018,904 48,416 – 4,400,900
Indirect expenses
Personnel 33,534 4,129 469,253 294,586 4,242 128,099 933,843
Marketing and promotion 63,064 235 123,983 71,612 3,613 24,271 286,778
Other 23,119 6,922 53,303 (6,793) 3,768 64,507 144,826
Amortization 4,918 – 97,978 45,177 201 7,683 155,957
Payments to the Government of Canada
101,251 17,567 86,854 79,121 4,718 26,214 315,725
Cost of premises and equipment
24,710 4,780 96,601 169,004 398 20,127 315,620
Regulatory fees 11,974 2,597 8,003 14,430 4,099 – 41,103
Gaming Revenue Sharing Payment
– – – – – 137,349 137,349
Net �nance (income) costs 38 1,402 (6,961) 1,788 (1) 2,230 (1,504)
262,608 37,632 929,014 668,925 21,038 410,480 2,329,697
Net income (loss) $ 1,081,440 $ (10,611) $ 33,497 $ 1,349,979 $ 27,378 $ (410,480) $ 2,071,203
Add: Win contribution (Note 18) – – 265,860 23,847 – – 289,707
Net Profit (loss) to the Province (a) $ 1,081,440 $ (10,611) $ 299,357 $ 1,373,826 $ 27,378 $ (410,480) $ 2,360,910
(a) Net Pro�t to the Province (NPP) is the amount the Corporation returns to the Province of Ontario after stakeholder and other payments. NPP is calculated by adding back win contribution to net income (loss).
52114 Form 2 AnnualReport2016-2017-Text_English.indd 73 2017-11-02 5:41 PM

OLG ANNUAL REPORT 2016–1774
(tabular amounts in thousands of Canadian dollars)
March 31, 2016 Lottery cGaming Resort CasinosSlots and
Casinos iGamingCorporate Services Total
Revenues
Gaming $ 3,785,596 $ 165,953 $ 1,285,964 $ 2,045,807 $ 49,170 $ – $ 7,332,490
Non-gaming – – 96,632 16,159 – – 112,791
3,785,596 165,953 1,382,596 2,061,966 49,170 – 7,445,281
Direct expenses
Prizes 2,080,496 37,992 – – – – 2,118,488
Commissions and fees 269,841 100,997 106,474 82,850 8,772 – 568,934
Win contribution (Note 18) – – 257,145 15,302 – – 272,447
Food, beverage, and other purchases
– – 92,248 11,336 – – 103,584
Ticket printing 32,407 4,707 – – – – 37,114
2,382,744 143,696 455,867 109,488 8,772 – 3,100,567
Contribution margin 1,402,852 22,257 926,729 1,952,478 40,398 – 4,344,714
Indirect expenses
Personnel 31,393 3,402 460,537 292,443 4,300 111,736 903,811
Marketing and promotion 56,301 33 121,458 78,967 5,399 18,664 280,822
Other 9,519 10,619 63,446 (27,790) 4,653 194,071 254,518
Amortization 3,807 – 99,118 45,991 201 8,364 157,481
Payments to the Government of Canada
96,649 16,354 89,282 75,773 5,299 22,251 305,608
Cost of premises and equipment
22,409 4,286 101,737 174,675 405 19,835 323,347
Regulatory fees 11,974 2,556 8,075 14,420 5,288 – 42,313
Gaming Revenue Sharing Payment
– – – – – 122,057 122,057
Net �nance (income) costs 92 1,927 (5,862) 335 4 (227) (3,731)
232,144 39,177 937,791 654,814 25,549 496,751 2,386,226
Net income (loss) $ 1,170,708 $ (16,920) $ (11,062) $ 1,297,664 $ 14,849 $ (496,751) $ 1,958,488
Add: Win contribution (Note 18) – – 257,145 15,302 – – 272,447
Net Profit (loss) to the Province (a) $ 1,170,708 $ (16,920) $ 246,083 $ 1,312,966 $ 14,849 $ (496,751) $ 2,230,935
(a) Net Pro�t to the Province (NPP) is the amount the Corporation returns to the Province of Ontario after stakeholder and other payments. NPP is calculated by adding back win contribution to net income (loss).
27. SUBSEQUENT EVENTSOn May 9, 2017 and May 30, 2017, OLG and Gateway entered into 20-year COSAs for the Southwest and North Gaming Bundles, respectively. Gateway purchased the net assets of both gaming bundles for $174,069,000, which included an estimate for working capital of $29,717,000, resulting in a gain on sale of net assets of $63,202,000 and took over day-to-day operations of the sites from OLG. Gateway is entitled to receive a share of the gaming revenue, as de�ned, generated at the Casinos and Slot facilities it operates. The share of revenue owed to Gateway re�ects the �xed fee, a variable fee (calculated as a percentage of gaming revenue above a set revenue threshold) and an amount for permitted capital expenditures. On the respective sale dates, OLG will derecognize all held for sale assets and liabilities – including property, plant and equipment – related to the sites in the North and Southwest Gaming Bundles.
On May 15, 2017, OLG announced the selection of Hard Rock as the Service Provider for the Ottawa Gaming Bundle. On the selection date, OLG and Hard Rock signed a TAPA committing Hard Rock to acquire certain assets and liabilities.
52114 Form 2 AnnualReport2016-2017-Text_English.indd 74 2017-11-02 5:41 PM

This Annual Report is printed in English and French on Canadian-made Rolland Enviro100 paper, which is manufactured from 100 per cent post-consumer waste �bre, is Processed Chlorine Free (PCF) and uses BioGas in its production (an alternative “green energy” source produced from decomposing waste collected from land�ll sites) to reduce greenhouse emissions and ozone-layer depletion.
Rolland Enviro100 saves the harvesting of mature trees, reduces solid waste that would have gone into land�ll sites, uses 80 per cent less water than conventional paper manufacturing and helps reduce air and water pollution.
Certified ProcessedChlorine Free
100% Post-ConsumerWaste Fibre
Recyclable WhereFacilities Exist
Green EnergySource
52114 Form 1 AnnualReport2016-2017-Cover_English.indd 3-4 2017-10-31 3:08 PM

www.olg.ca
SAULT STE. MARIE70 Foster Drive, Suite 800Sault Ste. Marie, ON P6A 6V2705-946-6464
TORONTO4120 Yonge Street, Suite 500Toronto, ON M2P 2B8416-224-1772
An Operational Enterprise Agency of the Province of Ontario
OLG Support Centre - Customer Inquiries1-800-387-0098The Ontario Problem Gambling Helpline1-888-230-3505
ISSN 1499 4887Ce rapport est également publié en français sous le nom de Rapport annuel 2016-2017 de la Société des loteries et des jeux de l’Ontario. Il est disponible en composant le 1-800-387-0098.
2016–17 Annual Report
ON
TAR
IO LO
TTER
Y AN
D G
AM
ING
CO
RP
OR
ATION
20
16
–17
AN
NU
AL R
EP
OR
T
52114 Form 1 AnnualReport2016-2017-Cover_English.indd 1-2 2017-10-31 3:08 PM