Embed Size (px)
Citation preview
OIL PRICES AND THE WORLD ECONOMY
Ray Barrell and Olga PomerantzNIESR
November 2004
Introduction
• Oil price increases and inflation were associated in the 1970’s and 1980’s– What factors affect oil prices– What makes oil prices ‘cause’ inflation– How do higher oil prices affect the level
of output
• Why is the world different
What affects output and inflation
• The oil intensity of production • Nominal inertia in wages and prices• The monetary policy response• The speed of recycling oil revenues into
demand• Patterns of trade have an important
influence

What should modellers and forecasters look at
• Temporary and permanent shocks differ– Expectations influence the impact of shocks– The effects on long term interest rates differ
• The use of oil revenues influences outcomes– Oil shocks redistribute income flows– The effects on trade in goods and services
determine the pattern of effects – So include oil producers and trade in services
The Role of OPEC
• OPEC is a lead producer, but it only sets a floor to prices– A positive output gap in the OECD puts
upward pressure on prices • Real oil prices display dollar inertia
because OPEC sets dollar prices– The real oil price is influenced by movements
in the dollar real exchange rate– Recent price increases have been much less
marked in euros
Oil Intensity
• The amount of oil per unit of GDP has been falling since 1975– In Europe oil intensity has fallen by one third since
1982– In the US oil intensity has fallen by as much
• Oil intensity is now 60 per cent higher in the US than in the major Euro Area countries
• The first round effect on output and prices must be higher in the US

Oil Intensity of Output(barrels of oil per unit of real output at 1994 PPPs)
0.400
0.500
0.600
0.700
0.800
0.900
1.000
1.100
1.200
1.300
1982
1983
1984
1985
1986
1987
1988
1989
1990
1991
1992
1993
1994
1995
1996
1997
1998
1999
2000
2001
France Germany UK US

Oil as per cent of total energy supply
10
15
20
25
30
35
40
45
50
55
60
1982 1984 1986 1988 1990 1992 1994 1996 1998 2000
OECD North America Europe Pacific
non-OECD China Other Asia Latin America

Oil Prices and Trade
• Oil prices affect the terms of trade– Higher dependence on oil imports raises the
impact on GDP• The impact on saving and investment is greater• Tax revenues and solvency are affected
• Patterns of OPEC (Russian, Norwegian) imports affect the pattern of trade impacts– The US has 22% of world GDP but only 11
percent of major oil exporters imports

World Tade in Oilimport share less export share
-0.4
-0.3
-0.2
-0.1
0
0.1
0.2
0.3
Euro A
rea
Other E
U countries
US
Other N
. Am
erica
JP Other A
sia
LA OP
EC
DE
Russia
Norw
ay
Transition countries
All other

US22%
Japan7%
Euro Area17%UK
3%
Asia excl. Japan24%
Other27%
US11%
Japan7%
Euro Area26%
UK6%
Asia excl. Japan18%
Other32%
Share of World GDP
(at PPPs), 2000
Share of Oil Producers’Imports, 2000

The role of the labour market
• An increase in the oil price reduces equilibrium income for each level of output
• Real wages need to fall – Bargaining institutions may resist and induce a recession– The central bank may allow inflation to reduce output costs – There may be asymmetries between upward and downward
shocks • Labour market institutions are now more flexible than
in the 1970s because of reforms• Bargainers realise that real wages must change• Hunt and Laxton NIER 2002 discuss these issues

Oil Prices and NiGEM
• The model is an estimated new Keynesian description of the world economy– Almost all OECD countries are covered– OPEC, and other regions are included– Trade and financial markets cover the world– Each country has a demand and supply
structure with a government sector– Financial, exchange rate and labour markets
have forward looking expectations
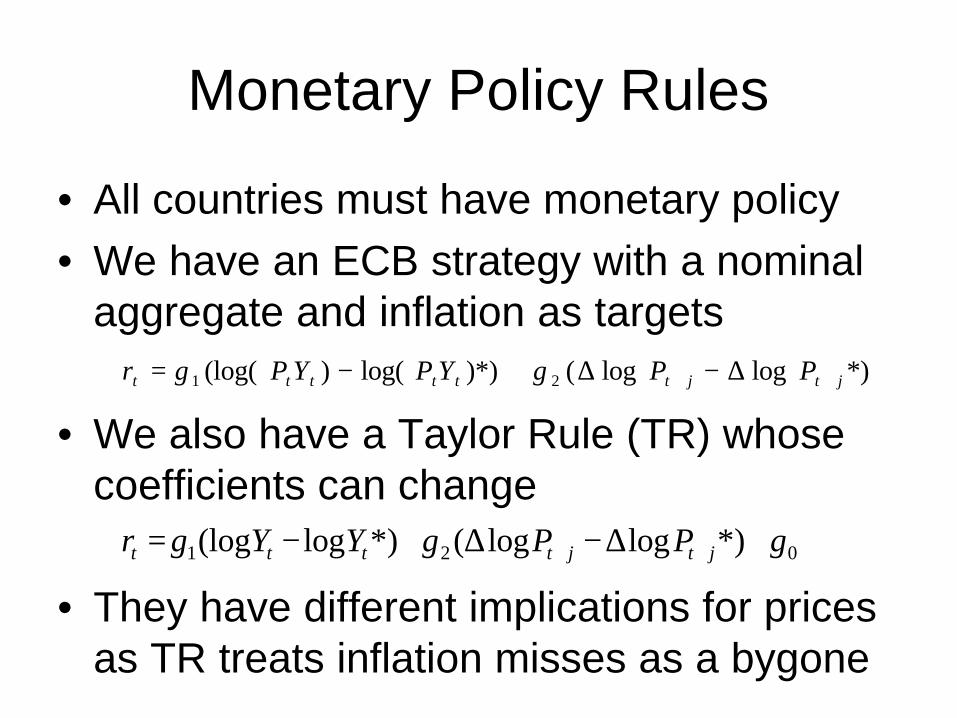
Monetary Policy Rules
• All countries must have monetary policy • We have an ECB strategy with a nominal
aggregate and inflation as targets
• We also have a Taylor Rule (TR) whose coefficients can change
• They have different implications for prices as TR treats inflation misses as a bygone
*)loglog()*)log()(log( 21 jtjtttttt PPYPYPr ++ ∆−∆+−= γγ
021 *)loglog(*)log(log γγγ +∆−∆+−= ++ jtjtttt PPYYr
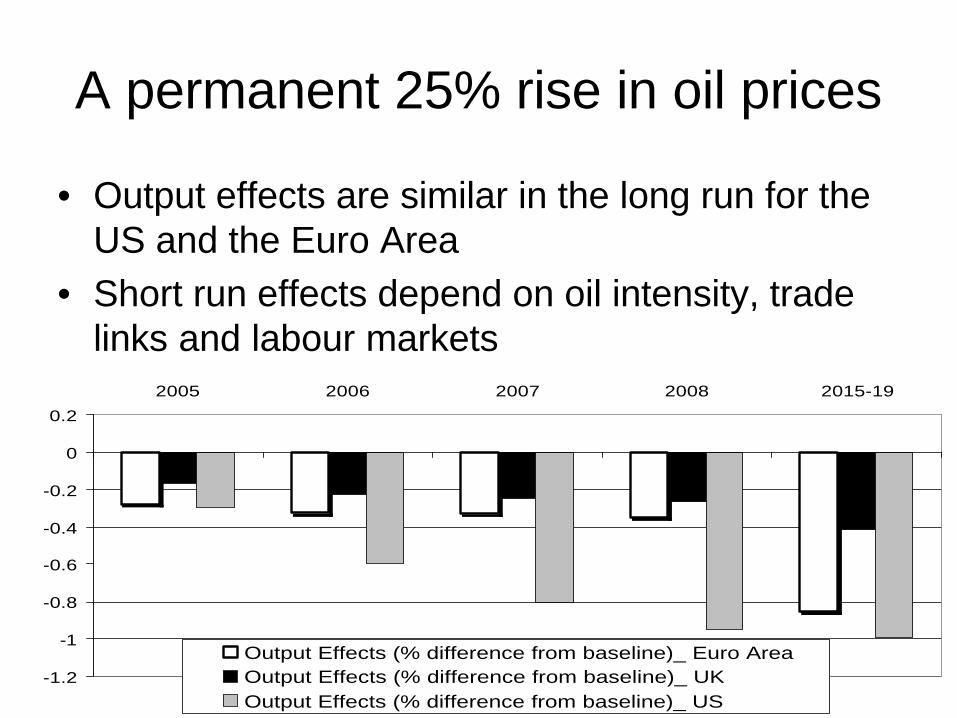
A permanent 25% rise in oil prices
• Output effects are similar in the long run for the US and the Euro Area
• Short run effects depend on oil intensity, trade links and labour markets
-1.2
-1
-0.8
-0.6
-0.4
-0.2
0
0.2
2005 2006 2007 2008 2015-19
Output Effects (% difference from baseline)_ Euro AreaOutput Effects (% difference from baseline)_ UK Output Effects (% difference from baseline)_ US

Impacts on Output of a 25% permanent rise in oil prices
-1
-0.9
-0.8
-0.7
-0.6
-0.5
-0.4
-0.3
-0.2
-0.1
0
France Germany Japan UK US
2005 2006 2007 2008
% difference from baseline
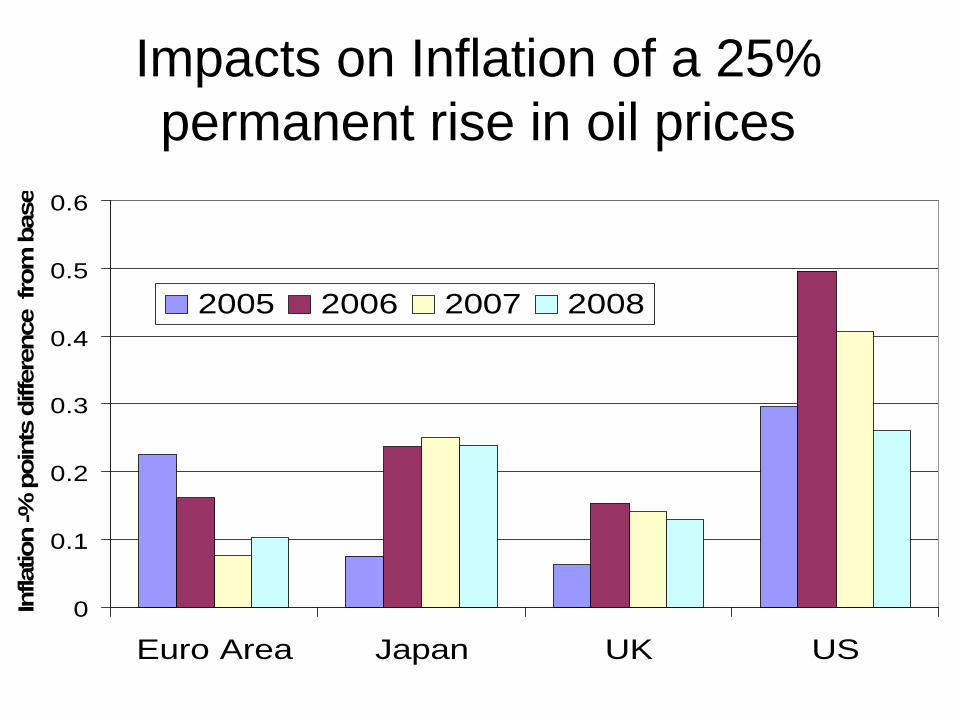
Impacts on Inflation of a 25% permanent rise in oil prices
0
0.1
0.2
0.3
0.4
0.5
0.6
Euro Area Japan UK US
Infla
tion -%
poin
ts d
iffer
ence
fro
m b
ase
2005 2006 2007 2008
Long term effects of a 25% permanent rise in real oil prices
• Higher oil prices change the terms of trade for the OECD as a whole
• The saving investment balance has to change
• Real interest rates have to rise, and output will be lower in the long run
• The rise in long term real interest rates will affect output now

The impact of a 25% permanent real oil price increase on long rates
0
0.05
0.1
0.15
0.2
0.25
0.3
Euro Area longrate
Euro Area longreal rate
US Long Rate US long real ratePer
cent
age
poin
ts d
iffe
renc
e fr
om b
ase
2005 2006 2007
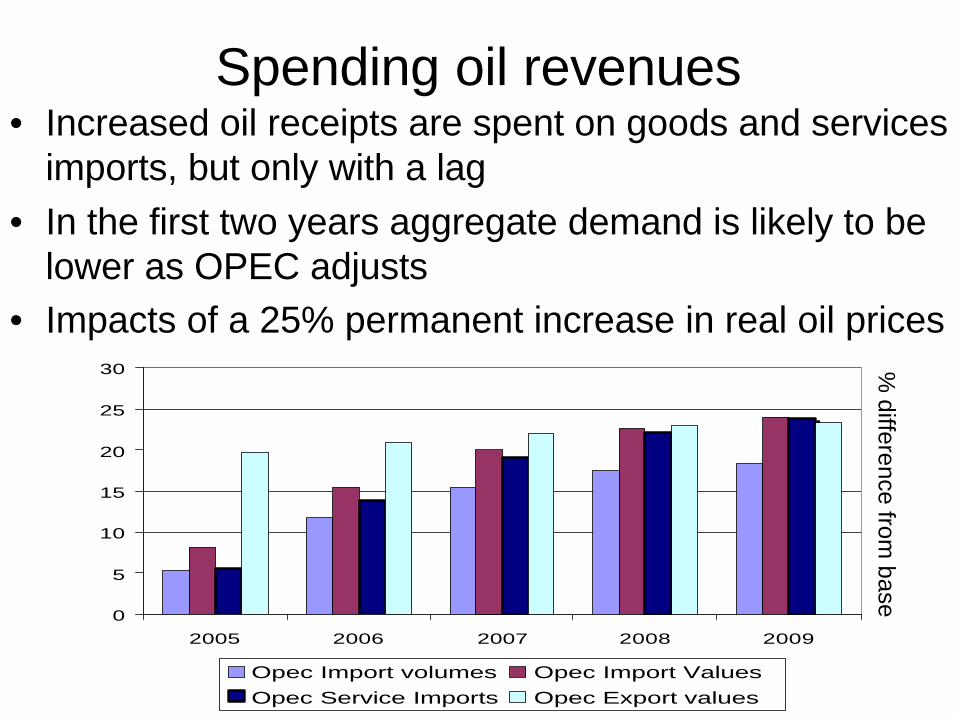
Spending oil revenues• Increased oil receipts are spent on goods and services
imports, but only with a lag• In the first two years aggregate demand is likely to be
lower as OPEC adjusts• Impacts of a 25% permanent increase in real oil prices
0
5
10
15
20
25
30
2005 2006 2007 2008 2009
Opec Import volumes Opec Import ValuesOpec Service Imports Opec Export values
% difference from
base

Slower spending of oil receipts
• Until 1985 OPEC recycled money into goods at half the speed they now spend at so we cut the speed of reaction to half its level
• Output effects of an oil price shock increase, especially in inertial Europe
-1.2
-1
-0.8
-0.6
-0.4
-0.2
0
2005 2006 2007 2008 2009
Euro Area Base Euro Area Slow US Base US Slow
Output %difference from base

Impact of slower spending of oil revenues of trade
0
5
10
15
20
25
2005
2006
2007
2008
2009
2010
2011
2012
2013
2014
2015
2016
2017
2018
2019
2020
% d
iffer
ence
from
bas
elin
e
Opec imports - fast Opec imports - slow
-2.5
-2
-1.5
-1
-0.5
0 2005
2007
2009
2011
2013
2015
2017
2019
% d
iffe
ence
fro
m b
asel
ine
World trade - fast world trade - slow

The role of monetary policy
• Short run effects on output also depend on policy – a looser monetary stance can half the impact on output
• Inflation effects depend on wage price flexibility and the policy rule– A looser monetary stance must mean a
greater price impact– More real wage inflexibility raises the costs of
keeping price effects small

Changing Policy in the US• We compare our default with a looser response and
output effects are smaller in the short run • Inflation effects are larger after the first year and the
price level is noticeably higher in the long run than in the default Looser Monetary Policy in the US
Ratio of loose to tight
0.00
0.50
1.00
1.50
2.00
2.50
2004 2005 2006
Effects of Loosening policy (loose/tight) Inflation Effects of Loosening policy (loose/tight) Output
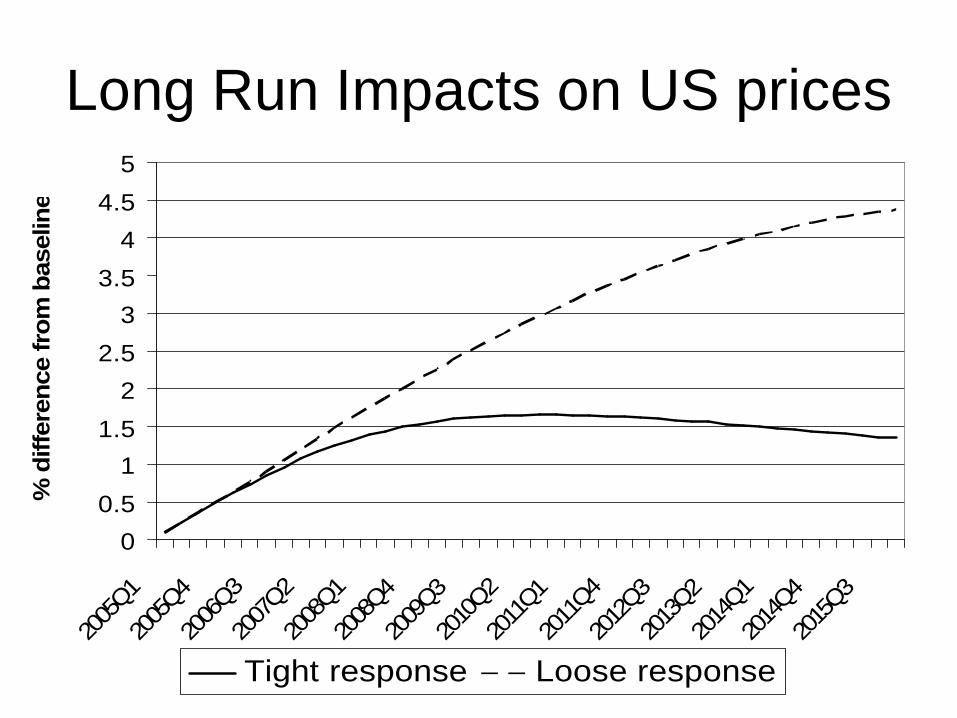
Long Run Impacts on US prices
0
0.5
1
1.5
2
2.5
3
3.5
4
4.5
5
2005
Q1
2005
Q4
2006
Q3
2007
Q2
2008
Q1
2008
Q4
2009
Q3
2010
Q2
2011
Q1
2011
Q4
2012
Q3
2013
Q2
2014
Q1
2014
Q4
2015
Q3
% d
iffer
ence
fro
m b
asel
ine
Tight response Loose response

Are temporary shocks different• We compare a permanent shock to a 2 year
shock under the same rules• Temporary shocks have less output effects
because real interest rates do not rise• Inflation effects can be larger as a result
-1.2
-1.0
-0.8
-0.6
-0.4
-0.2
0.0
0.2
0.4Inflation Output Inflation Output Inflation Output
Euro Area UK US
2004 2005
% difference temporaryand permanent shocks
Conclusions
• Higher oil prices lead to higher prices– Output should fall in the short and long run– Real interest rates should rise
• Wage price spirals worsen problems • Oil intensity is important for output effects• Inflation depends on the central bank
– Output effects can be reduced in the short run
• The speed of re-spending revenues on goods and services affects the impacts on output

SourcesMuch of the argument is contained in
Barrell and Pomerantz ‘Oil Prices and the World Economy’ NIESR Discussion Paper July 2004.
available at www.niesr.ac.ukAl Eyd et al ‘The world economy’ in National Institute Economic Review July and October
Information available at www.niesr.ac.uk
Contact Ray Barrell (rbarrell), Ian Hurst (aihurst) or Olga Pomerantz (opomerantz) @niesr.ac.ukfor details