Embed Size (px)
Citation preview
Telling Canada’s story in numbers
Talking StatsConnecting. Collaborating. Learning.
Anil Arora
Chief Statistician of Canada
March 17, 2017October 19, 2017
Oil Prices and the Canadian Economy—Events and Impacts
www.statcan.gc.ca

Outline
Statistics Canada • Statistique Canada
IntroductionWho we are and what we do. 1
Events: Prices
Movements, measures and margins 2
Impacts: Selected
Government, business and consumers 3
4
SummaryMoving forward and next steps
2
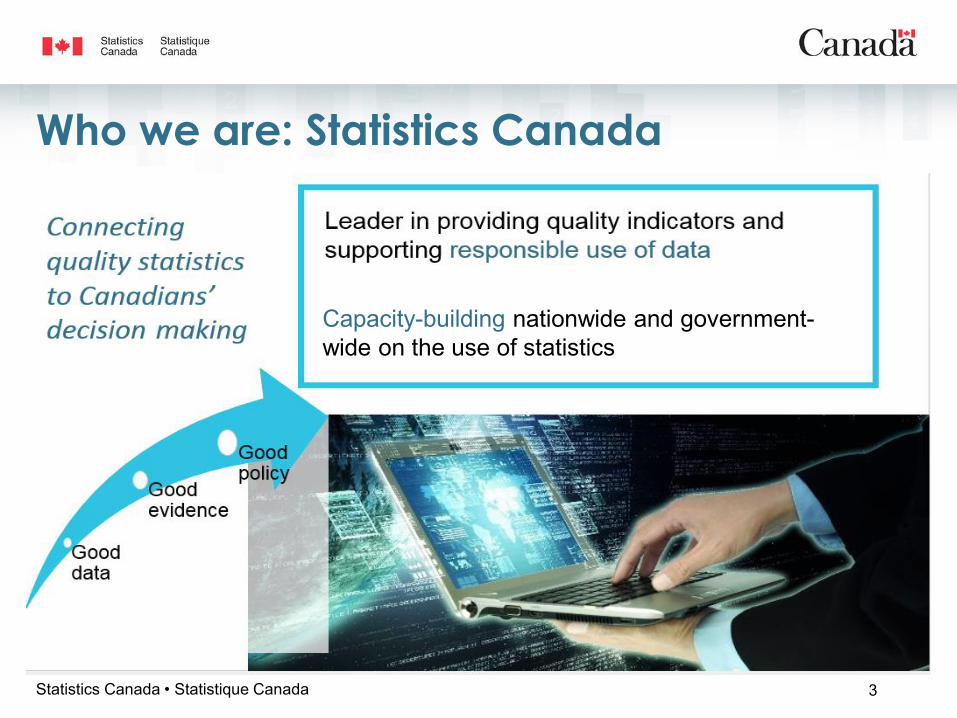
Who we are: Statistics Canada
3Statistics Canada • Statistique Canada
Capacity-building nationwide and government-wide on the use of statistics
EVENTS: PRICES
4Statistics Canada • Statistique Canada
o Movements
o Measures
o Margins
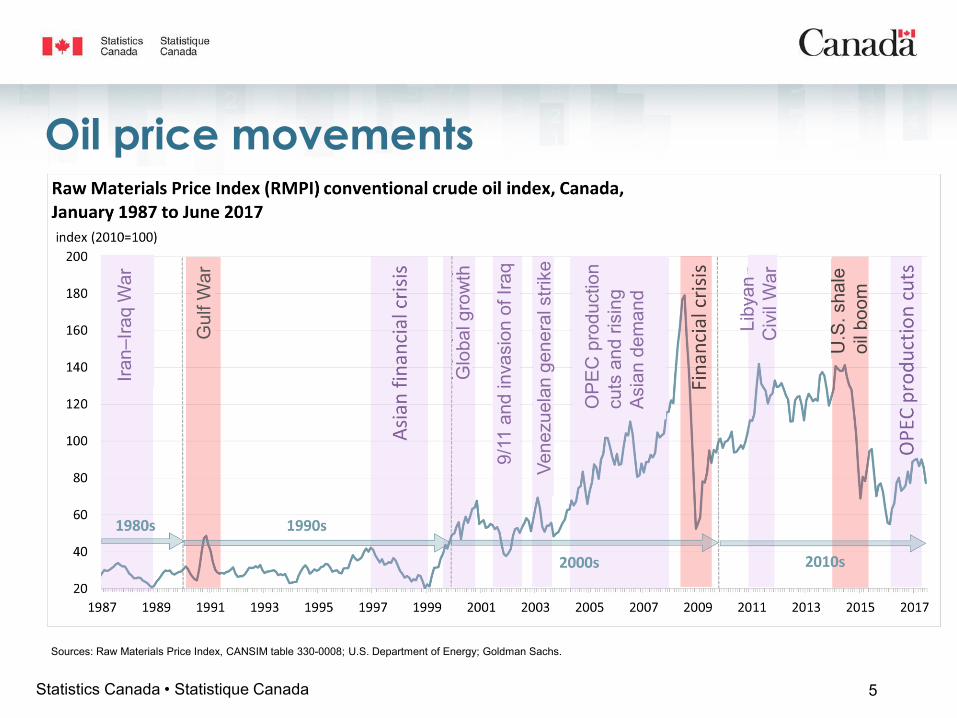
Oil price movements
5Statistics Canada • Statistique Canada
Sources: Raw Materials Price Index, CANSIM table 330-0008; U.S. Department of Energy; Goldman Sachs.
Iran–
Iraq
War
Gul
f War
Glo
bal g
row
th
9/11
and
inva
sion
of I
raq
Liby
an
Civ
il W
ar
U.S
. sha
le
oil b
oom
Vene
zuel
an g
ener
al s
trike
OP
EC
pro
duct
ion
cuts
and
risi
ng
Asi
an d
eman
d
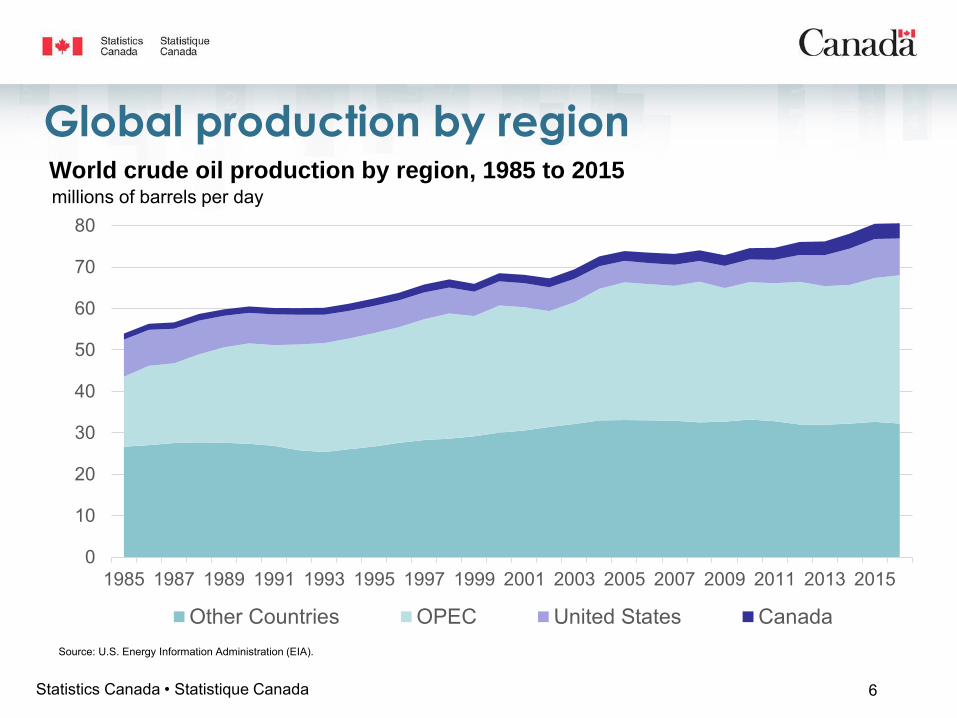
Global production by region
0
10
20
30
40
50
60
70
80
1985 1987 1989 1991 1993 1995 1997 1999 2001 2003 2005 2007 2009 2011 2013 2015
Other Countries OPEC United States Canada
millions of barrels per dayWorld crude oil production by region, 1985 to 2015
6Statistics Canada • Statistique Canada
Source: U.S. Energy Information Administration (EIA).
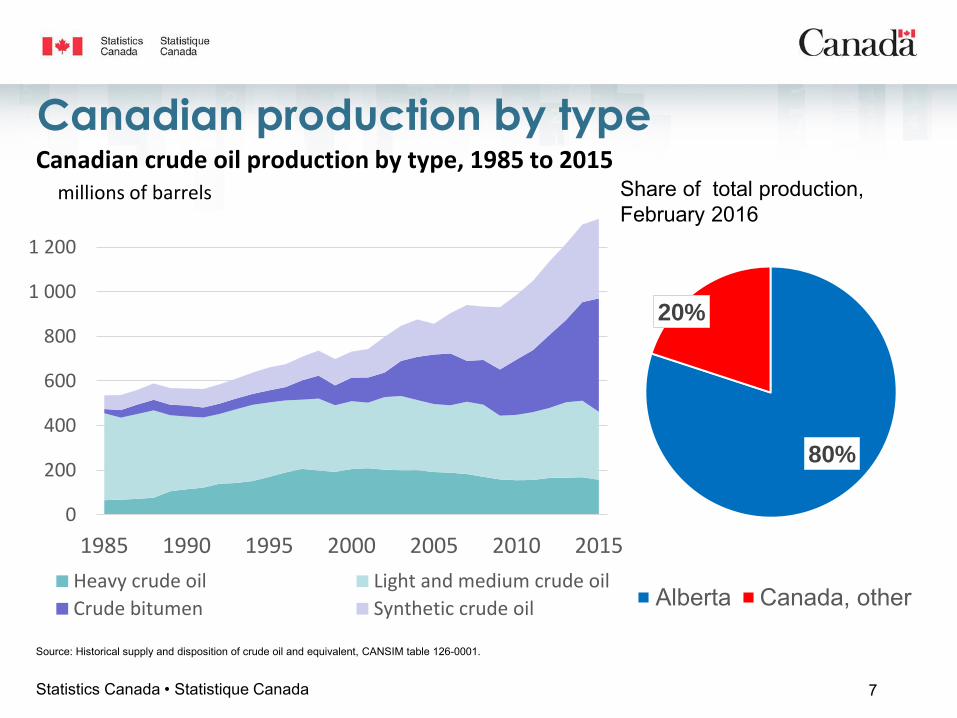
Canadian production by type
7Statistics Canada • Statistique Canada
Source: Historical supply and disposition of crude oil and equivalent, CANSIM table 126-0001.
0
200
400
600
800
1 000
1 200
1985 1990 1995 2000 2005 2010 2015
Heavy crude oil Light and medium crude oil
Crude bitumen Synthetic crude oil
Canadian crude oil production by type, 1985 to 2015millions of barrels
80%
20%
Alberta Canada, other
Share of total production, February 2016
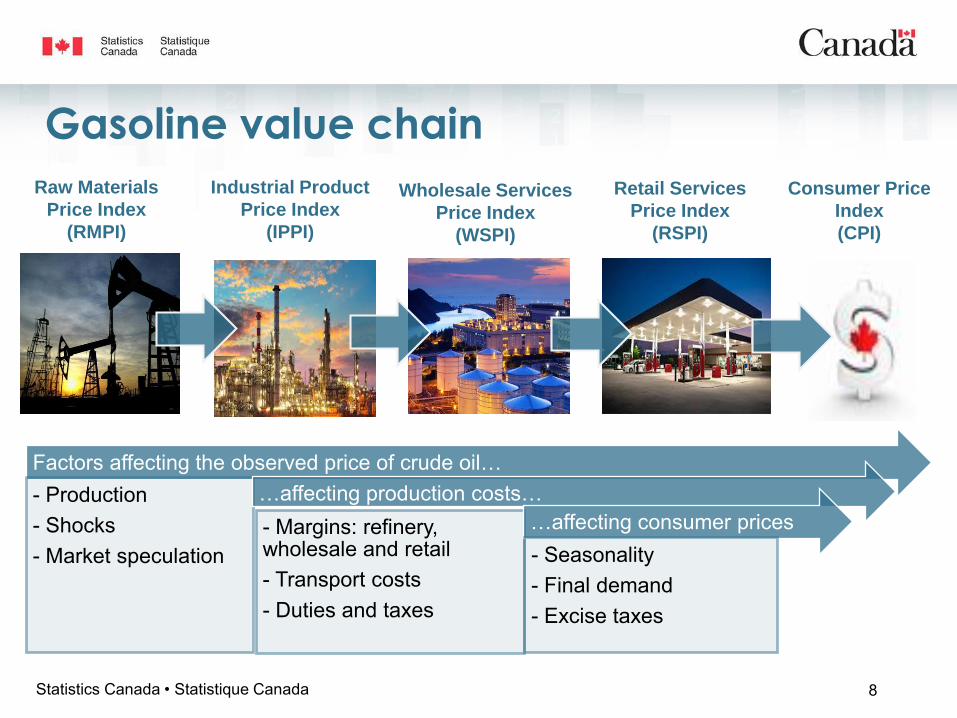
Gasoline value chain
Industrial Product
Price Index
(IPPI)
Wholesale Services
Price Index
(WSPI)
Retail Services
Price Index
(RSPI)
Consumer Price
Index
(CPI)
Raw Materials
Price Index
(RMPI)
Factors affecting the observed price of crude oil…- Production- Shocks- Market speculation
…affecting production costs…- Margins: refinery, wholesale and retail- Transport costs- Duties and taxes
…affecting consumer prices- Seasonality- Final demand- Excise taxes
8Statistics Canada • Statistique Canada
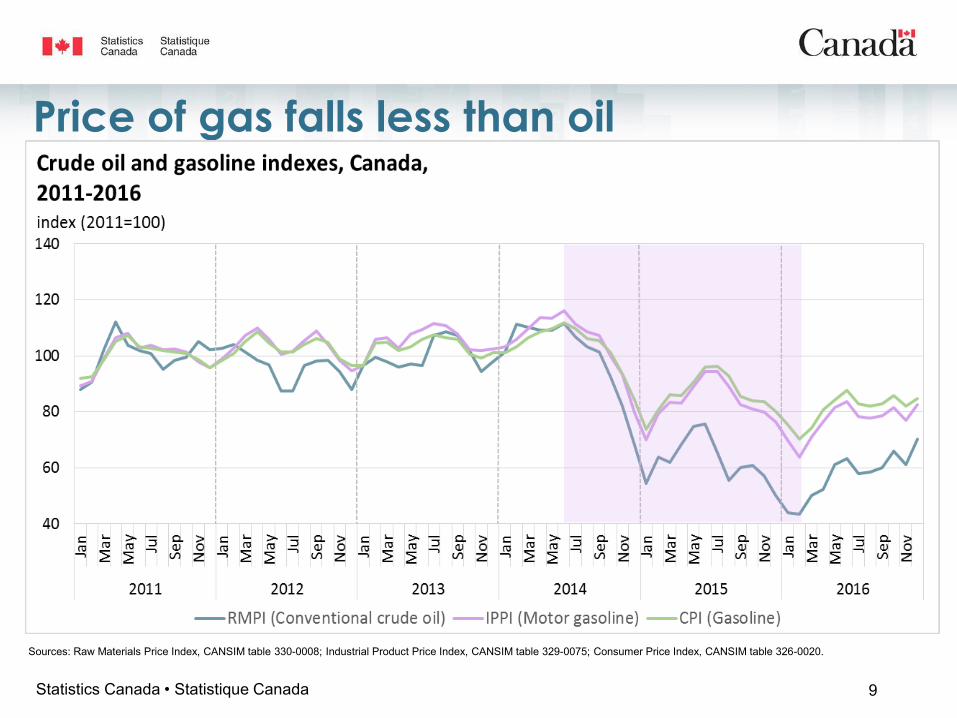
Price of gas falls less than oil
9Statistics Canada • Statistique Canada
Sources: Raw Materials Price Index, CANSIM table 330-0008; Industrial Product Price Index, CANSIM table 329-0075; Consumer Price Index, CANSIM table 326-0020.
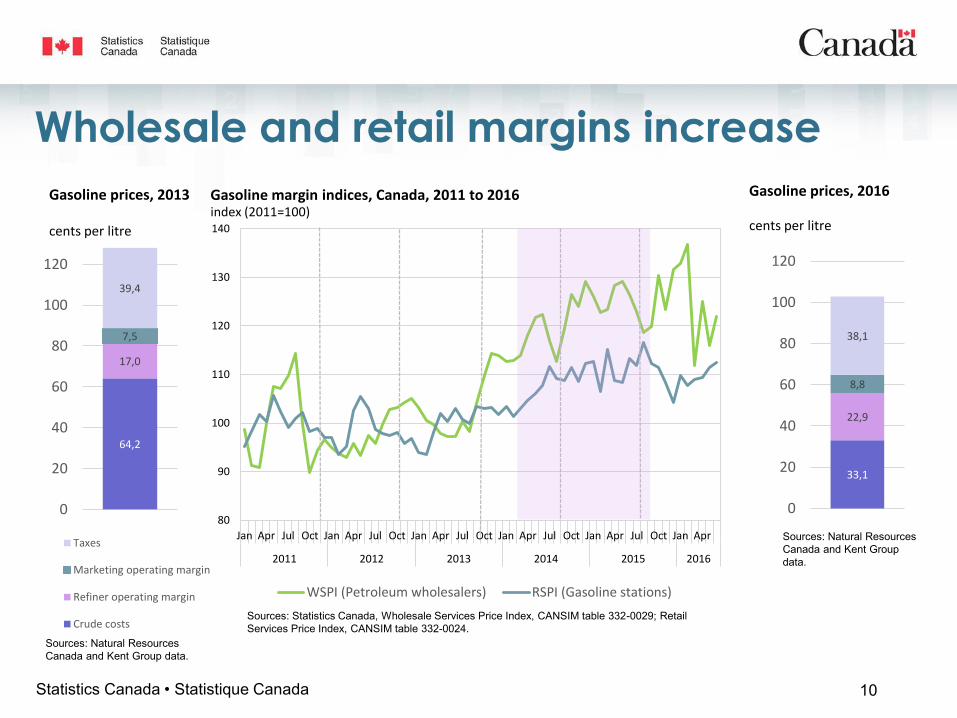
Wholesale and retail margins increase
10Statistics Canada • Statistique Canada
Sources: Statistics Canada, Wholesale Services Price Index, CANSIM table 332-0029; Retail Services Price Index, CANSIM table 332-0024.
Sources: Natural Resources Canada and Kent Group data.
Sources: Natural Resources Canada and Kent Group data.
80
90
100
110
120
130
140
Jan Apr Jul Oct Jan Apr Jul Oct Jan Apr Jul Oct Jan Apr Jul Oct Jan Apr Jul Oct Jan Apr
2011 2012 2013 2014 2015 2016
WSPI (Petroleum wholesalers) RSPI (Gasoline stations)
index (2011=100)Gasoline margin indices, Canada, 2011 to 2016
64,2
17,0
7,5
39,4
0
20
40
60
80
100
120
Taxes
Marketing operating margin
Refiner operating margin
Crude costs
Gasoline prices, 2013
cents per litre
33,1
22,9
8,8
38,1
0
20
40
60
80
100
120
Gasoline prices, 2016
cents per litre
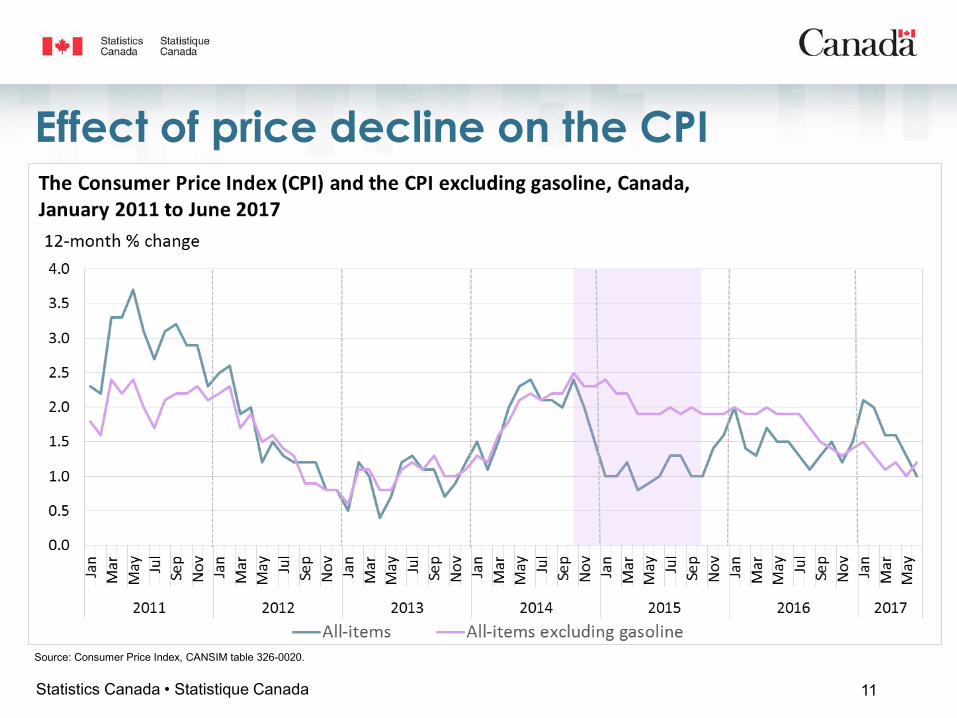
Effect of price decline on the CPI
11Statistics Canada • Statistique Canada
Source: Consumer Price Index, CANSIM table 326-0020.
IMPACTS: SELECTED
12Statistics Canada • Statistique Canada
o Government
o Business
o Consumers
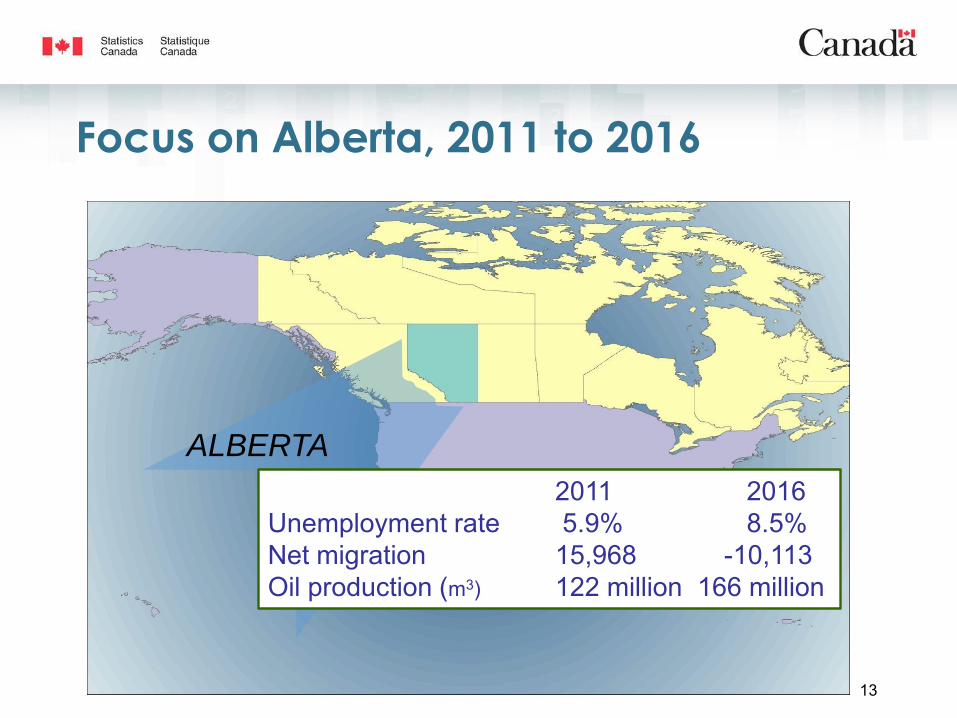
ALBERTA
2011 2016Unemployment rate 5.9% 8.5%Net migration 15,968 -10,113Oil production (m3) 122 million 166 million
Focus on Alberta, 2011 to 2016
13
GOVERNMENT SECTOR
14Statistics Canada • Statistique Canada
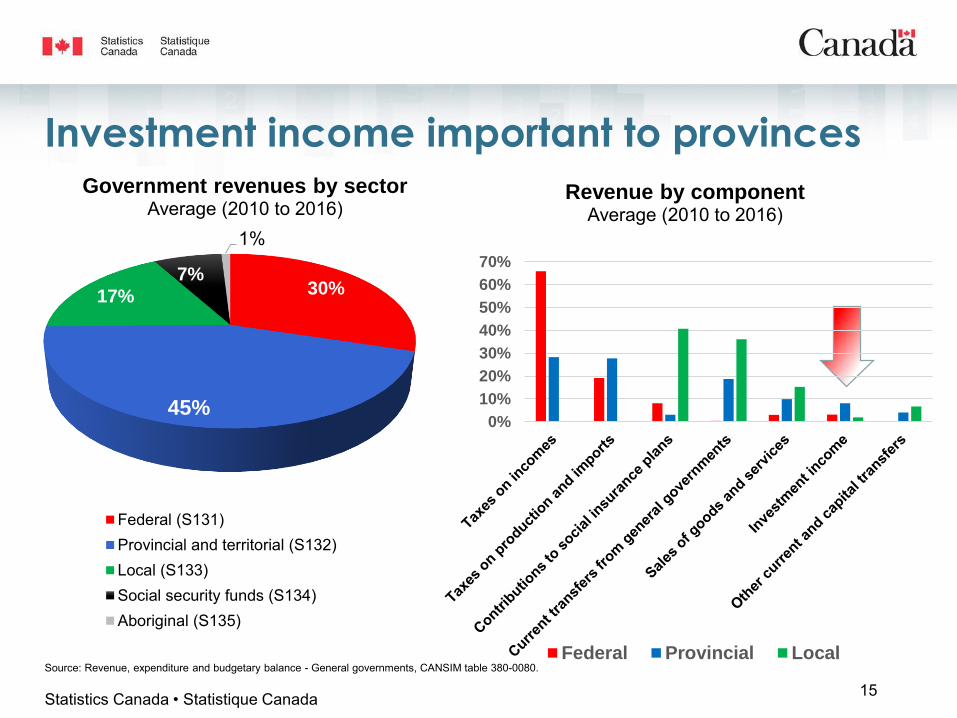
Investment income important to provinces
Source: Revenue, expenditure and budgetary balance - General governments, CANSIM table 380-0080.
30%
45%
17%
7%
1%
Government revenues by sectorAverage (2010 to 2016)
Federal (S131)Provincial and territorial (S132)Local (S133)Social security funds (S134)Aboriginal (S135)
0%
10%
20%
30%
40%
50%
60%
70%
Revenue by component Average (2010 to 2016)
Federal Provincial Local
15Statistics Canada • Statistique Canada
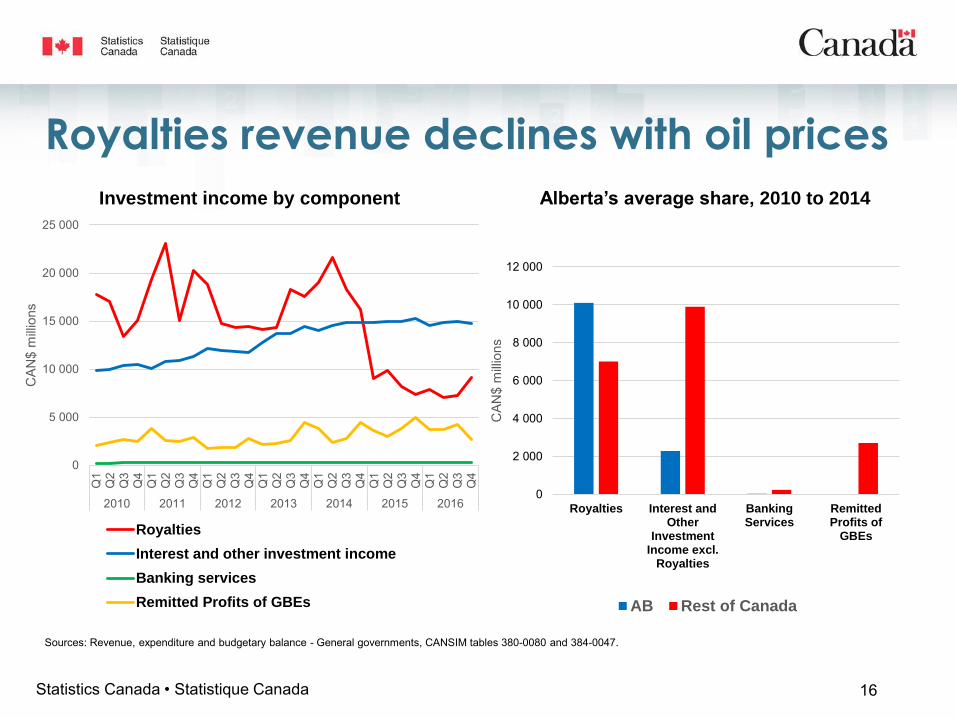
Royalties revenue declines with oil prices
Sources: Revenue, expenditure and budgetary balance - General governments, CANSIM tables 380-0080 and 384-0047.
0
2 000
4 000
6 000
8 000
10 000
12 000
Royalties Interest andOther
InvestmentIncome excl.
Royalties
BankingServices
RemittedProfits of
GBEs
CAN
$ m
illion
s
Alberta’s average share, 2010 to 2014
AB Rest of Canada
0
5 000
10 000
15 000
20 000
25 000
Q1
Q2
Q3
Q4
Q1
Q2
Q3
Q4
Q1
Q2
Q3
Q4
Q1
Q2
Q3
Q4
Q1
Q2
Q3
Q4
Q1
Q2
Q3
Q4
Q1
Q2
Q3
Q4
2010 2011 2012 2013 2014 2015 2016
CAN
$ m
illion
s
Investment income by component
Royalties
Interest and other investment income
Banking services
Remitted Profits of GBEs
16Statistics Canada • Statistique Canada
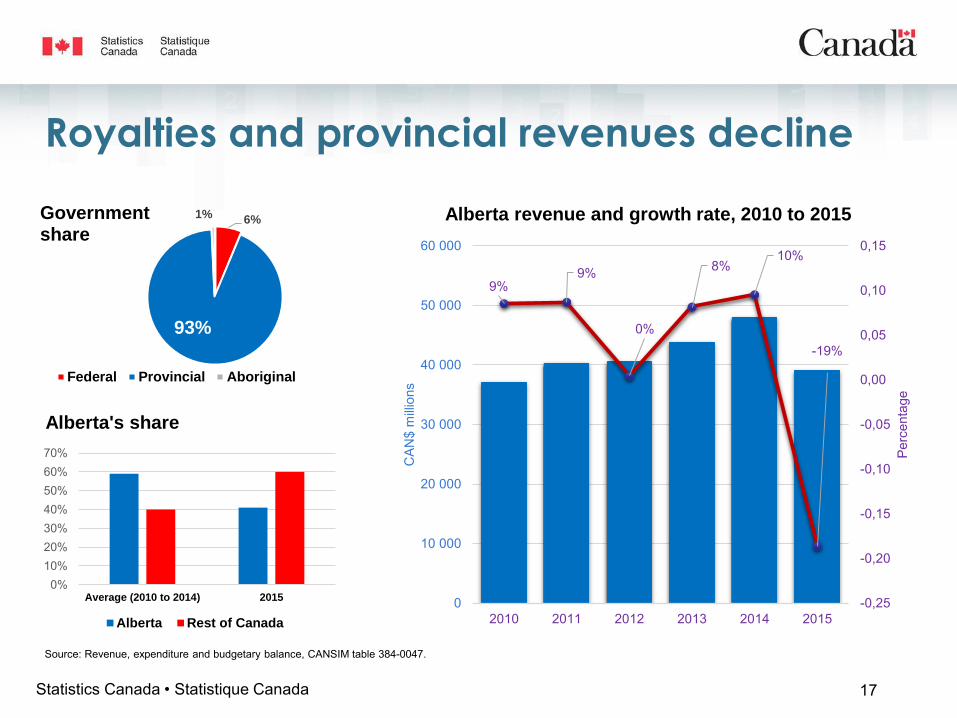
Royalties and provincial revenues decline
Source: Revenue, expenditure and budgetary balance, CANSIM table 384-0047.
6%
93%
1%Governmentshare
Federal Provincial Aboriginal
9%9%
0%
8%10%
-19%
-0,25
-0,20
-0,15
-0,10
-0,05
0,00
0,05
0,10
0,15
2010 2011 2012 2013 2014 20150
10 000
20 000
30 000
40 000
50 000
60 000
Perc
enta
ge
CAN
$ m
illion
s
Alberta revenue and growth rate, 2010 to 2015
17Statistics Canada • Statistique Canada
0%10%20%30%40%50%60%70%
Average (2010 to 2014) 2015
Alberta's share
Alberta Rest of Canada
BUSINESS SECTOR
• Construction industry• Producer prices• Building permits and housing starts• Lending by small institutions
18Statistics Canada • Statistique Canada
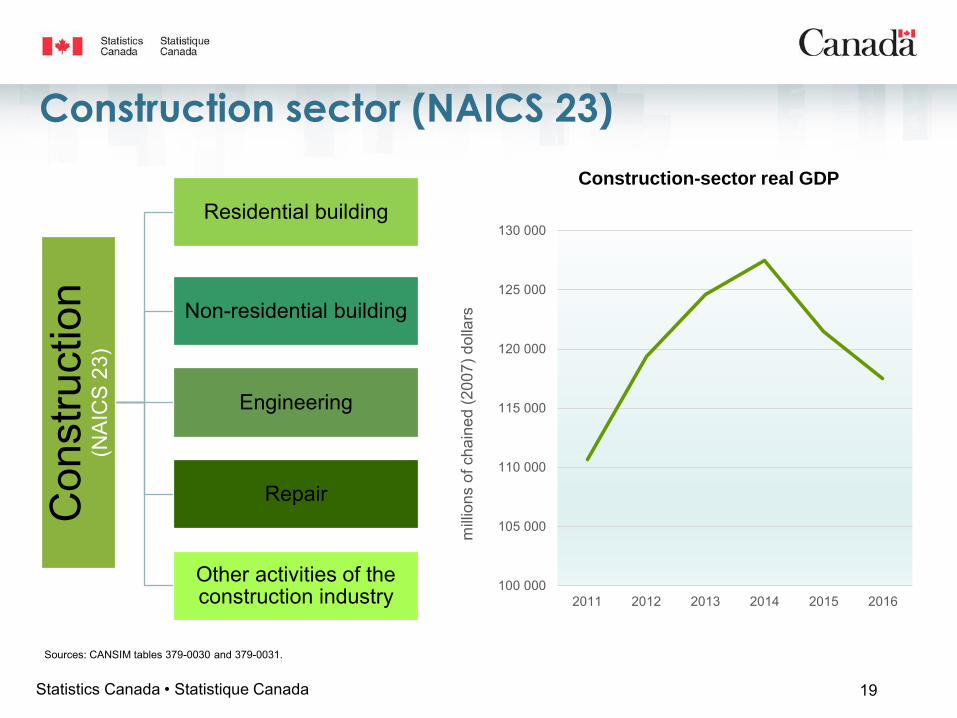
Construction sector (NAICS 23) C
onst
ruct
ion
(NA
ICS
23)
Residential building
Non-residential building
Engineering
Repair
Other activities of the construction industry
Sources: CANSIM tables 379-0030 and 379-0031.
100 000
105 000
110 000
115 000
120 000
125 000
130 000
2011 2012 2013 2014 2015 2016
milli
ons
of c
hain
ed (2
007)
dol
lars
Construction-sector real GDP
19Statistics Canada • Statistique Canada
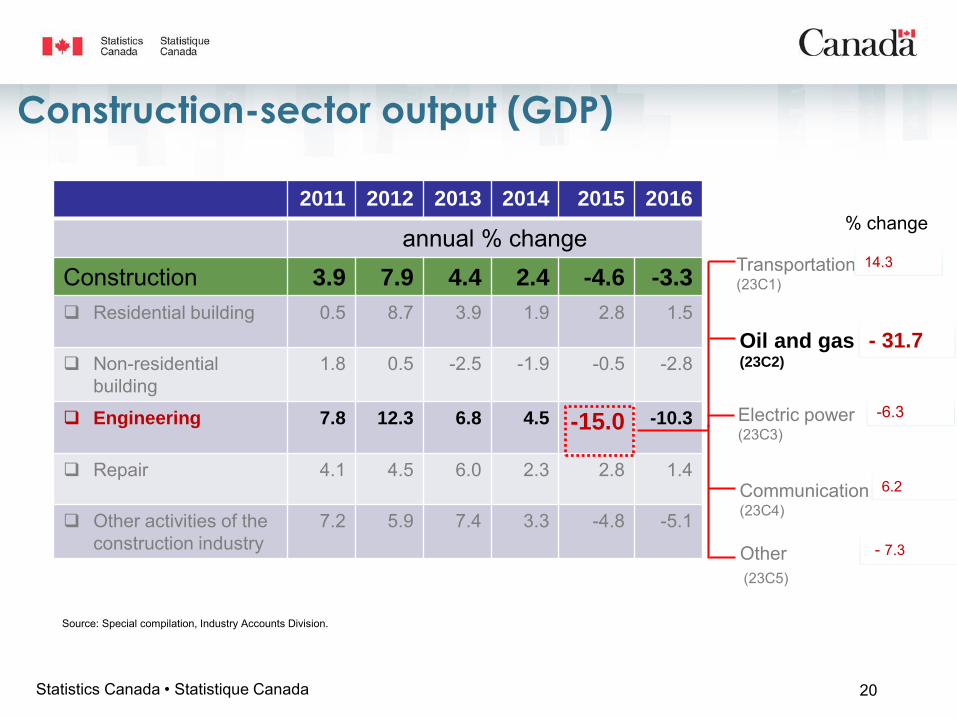
Construction-sector output (GDP)
Source: Special compilation, Industry Accounts Division.
2011 2012 2013 2014 2015 2016
annual % changeConstruction 3.9 7.9 4.4 2.4 -4.6 -3.3
Residential building 0.5 8.7 3.9 1.9 2.8 1.5
Non-residentialbuilding
1.8 0.5 -2.5 -1.9 -0.5 -2.8
Engineering 7.8 12.3 6.8 4.5 -15.0 -10.3
Repair 4.1 4.5 6.0 2.3 2.8 1.4
Other activities of the construction industry
7.2 5.9 7.4 3.3 -4.8 -5.1
Transportation(23C1)
Oil and gas (23C2)
Electric power(23C3)
Communication(23C4)
Other(23C5)
14.3
- 31.7
-6.3
6.2
- 7.3
% change
20Statistics Canada • Statistique Canada

How big is the oil and gas engineering industry?
70%
60% 40%
Engineering construction except oil and gasOil and gas engineering - AlbertaOil and gas engineering - Canada, other
Excluding
oil and gas
Oil and gas
75%
Alberta
Canada,
other
25%
Source: CANSIM table 379-0030.
21Statistics Canada • Statistique Canada
Engineering construction
Average GDP, 2007 to 2013 (current dollars)
Oil and gas engineering construction
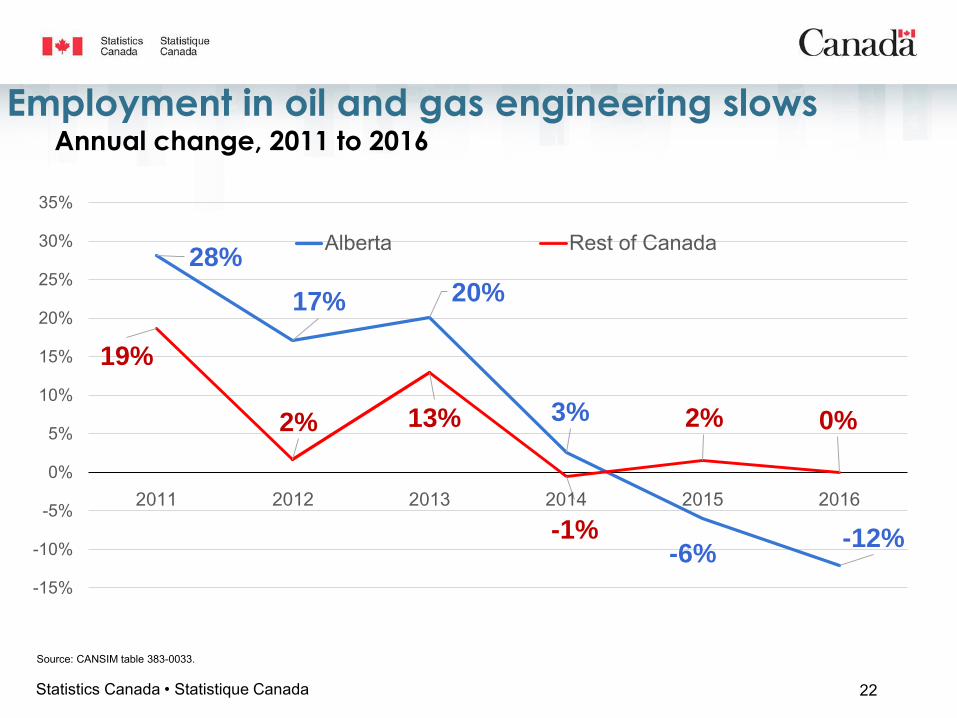
Source: CANSIM table 383-0033.
Employment in oil and gas engineering slowsAnnual change, 2011 to 2016
28%
17% 20%
3%
-6%-12%
19%
2% 13%
-1%
2% 0%
-15%
-10%
-5%
0%
5%
10%
15%
20%
25%
30%
35%
2011 2012 2013 2014 2015 2016
Alberta Rest of Canada
22Statistics Canada • Statistique Canada
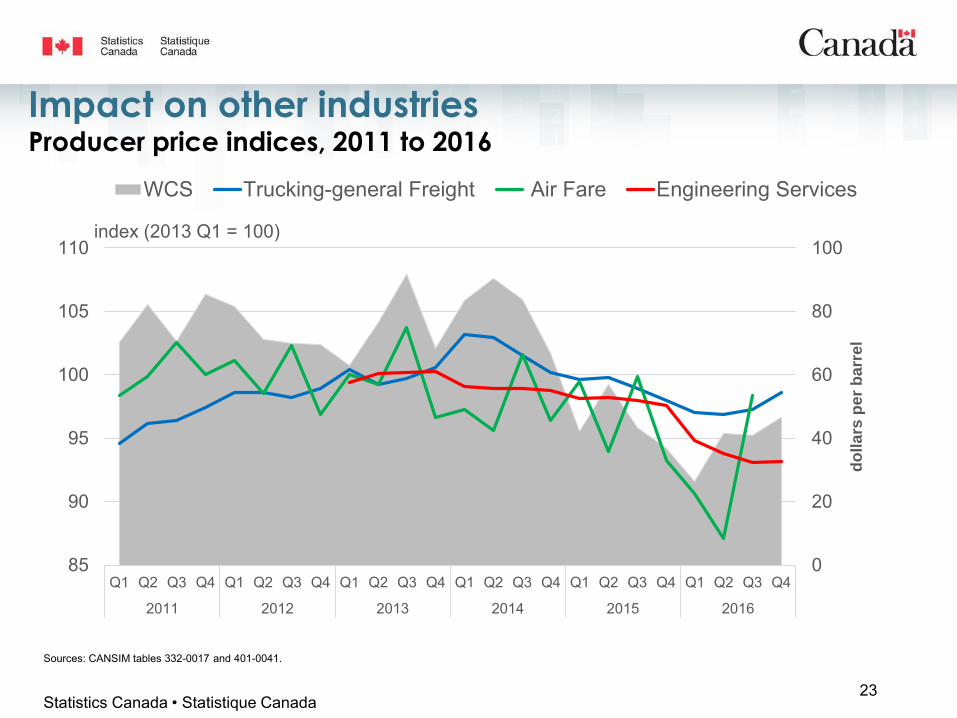
Impact on other industries Producer price indices, 2011 to 2016
Sources: CANSIM tables 332-0017 and 401-0041.
23Statistics Canada • Statistique Canada
0
20
40
60
80
100
85
90
95
100
105
110
Q1 Q2 Q3 Q4 Q1 Q2 Q3 Q4 Q1 Q2 Q3 Q4 Q1 Q2 Q3 Q4 Q1 Q2 Q3 Q4 Q1 Q2 Q3 Q4
2011 2012 2013 2014 2015 2016
do
lla
rs p
er
ba
rre
l
index (2013 Q1 = 100)
WCS Trucking-general Freight Air Fare Engineering Services
ALBERTA HOUSING INDUSTRY
• Building permits
• Housing starts
24Statistics Canada • Statistique Canada
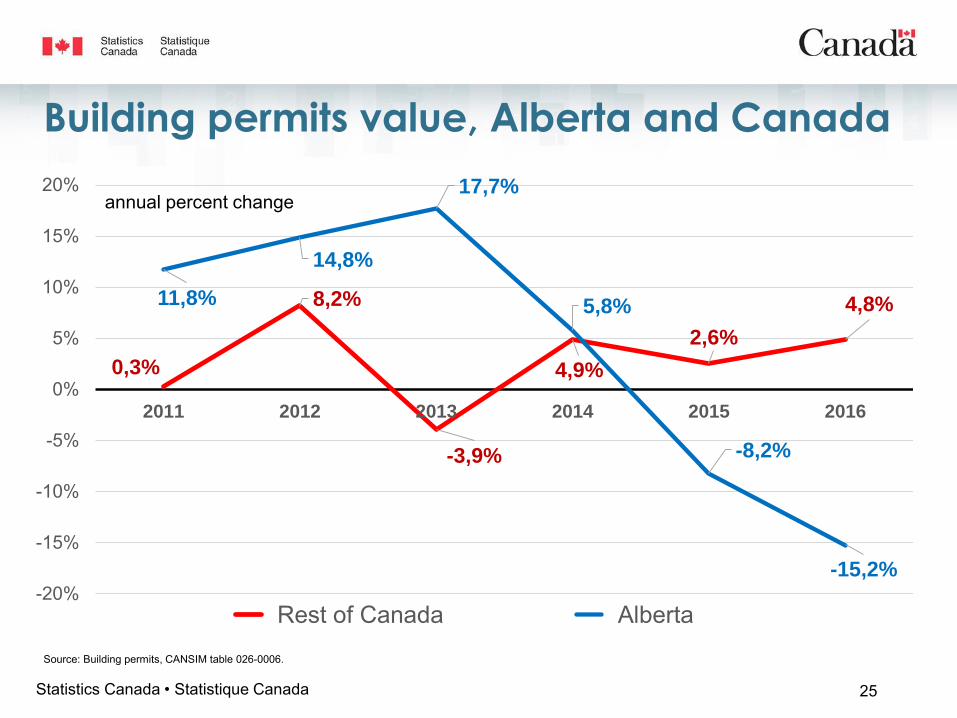
Building permits value, Alberta and Canada
0,3%
8,2%
-3,9%
4,9%
2,6%
4,8%11,8%
14,8%
17,7%
5,8%
-8,2%
-15,2%-20%
-15%
-10%
-5%
0%
5%
10%
15%
20%
2011 2012 2013 2014 2015 2016
Rest of Canada Alberta
Source: Building permits, CANSIM table 026-0006.
annual percent change
25Statistics Canada • Statistique Canada
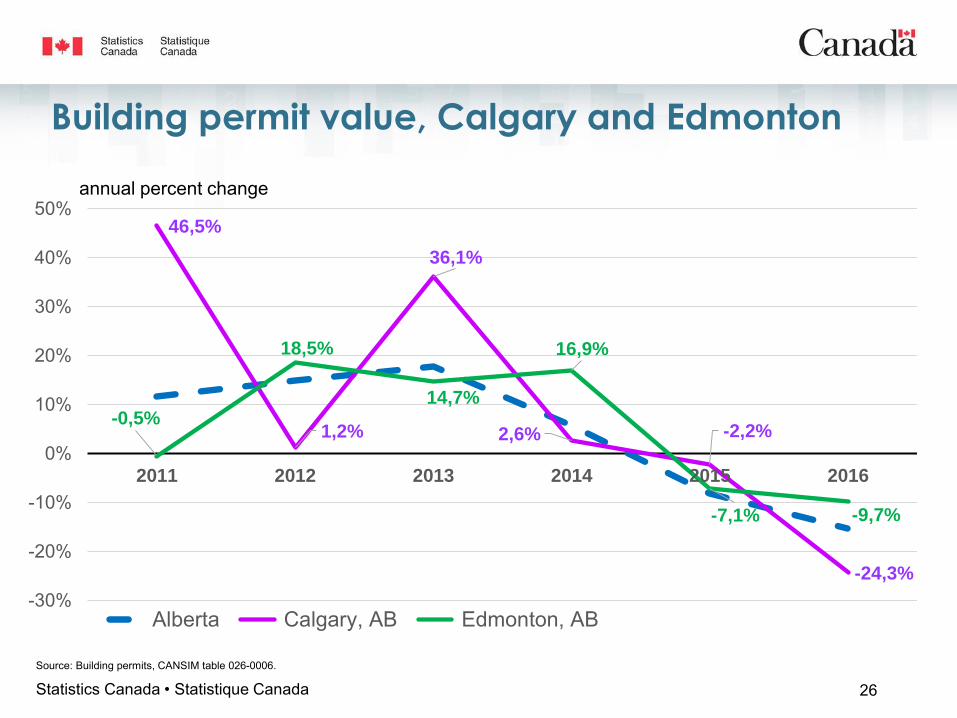
Building permit value, Calgary and Edmonton
46,5%
1,2%
36,1%
2,6% -2,2%
-24,3%
-0,5%
18,5%
14,7%
16,9%
-7,1% -9,7%
-30%
-20%
-10%
0%
10%
20%
30%
40%
50%
2011 2012 2013 2014 2015 2016
Alberta Calgary, AB Edmonton, AB
annual percent change
Source: Building permits, CANSIM table 026-0006.
26Statistics Canada • Statistique Canada
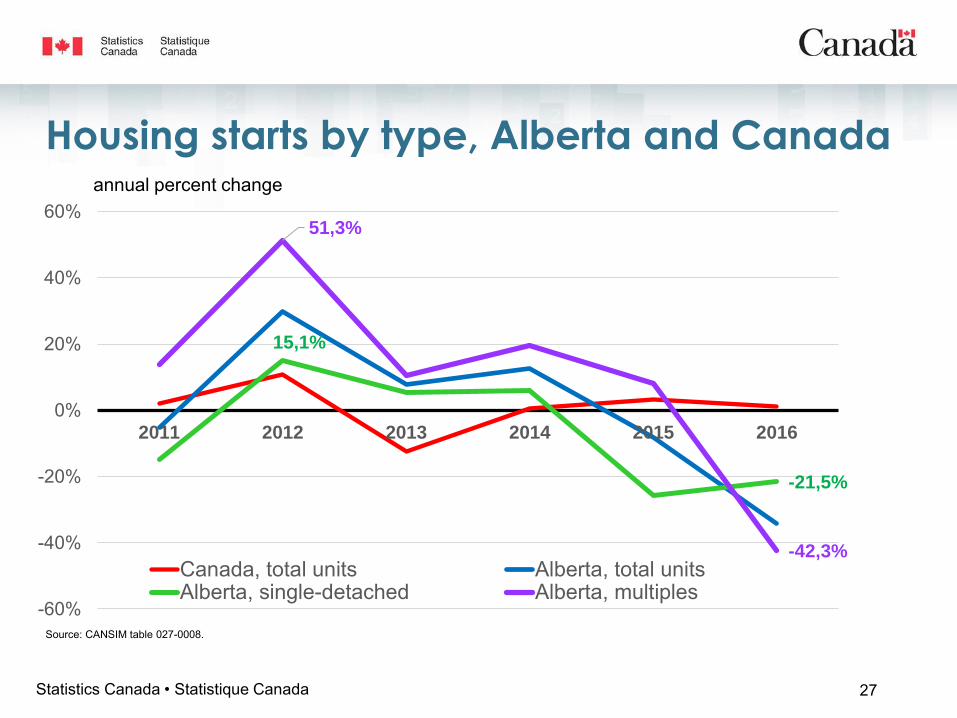
Housing starts by type, Alberta and Canada
15,1%
-21,5%
51,3%
-42,3%
-60%
-40%
-20%
0%
20%
40%
60%
2011 2012 2013 2014 2015 2016
Canada, total units Alberta, total unitsAlberta, single-detached Alberta, multiples
Source: CANSIM table 027-0008.
annual percent change
27Statistics Canada • Statistique Canada
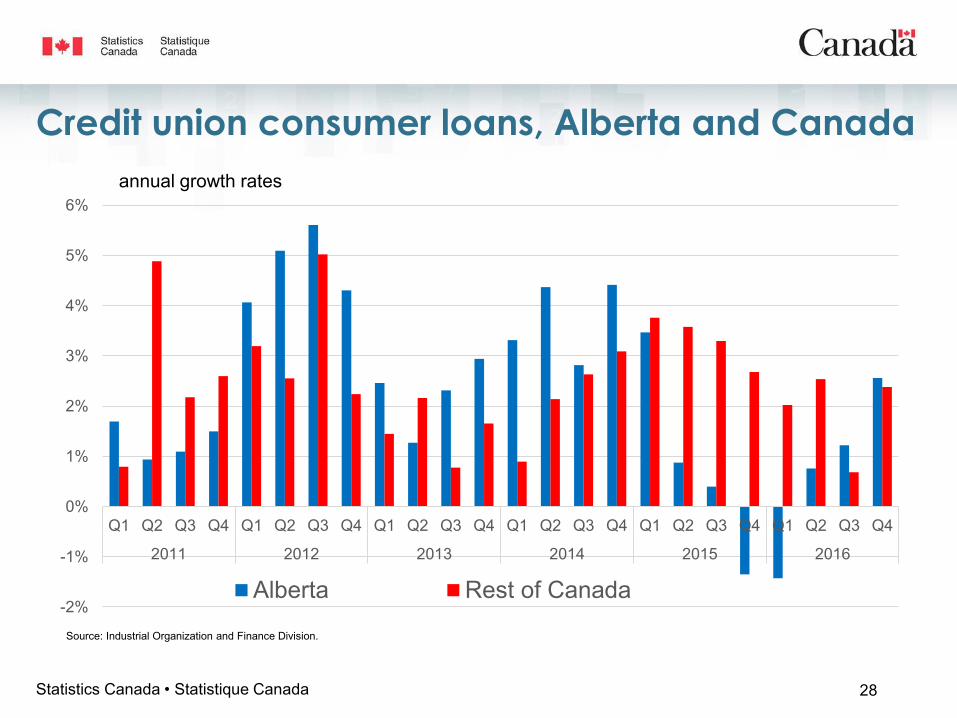
Credit union consumer loans, Alberta and Canada
-2%
-1%
0%
1%
2%
3%
4%
5%
6%
Q1 Q2 Q3 Q4 Q1 Q2 Q3 Q4 Q1 Q2 Q3 Q4 Q1 Q2 Q3 Q4 Q1 Q2 Q3 Q4 Q1 Q2 Q3 Q4
2011 2012 2013 2014 2015 2016
Alberta Rest of Canada
Source: Industrial Organization and Finance Division.
annual growth rates
28Statistics Canada • Statistique Canada
HOUSEHOLD SECTORSelected consumer spending
29Statistics Canada • Statistique Canada
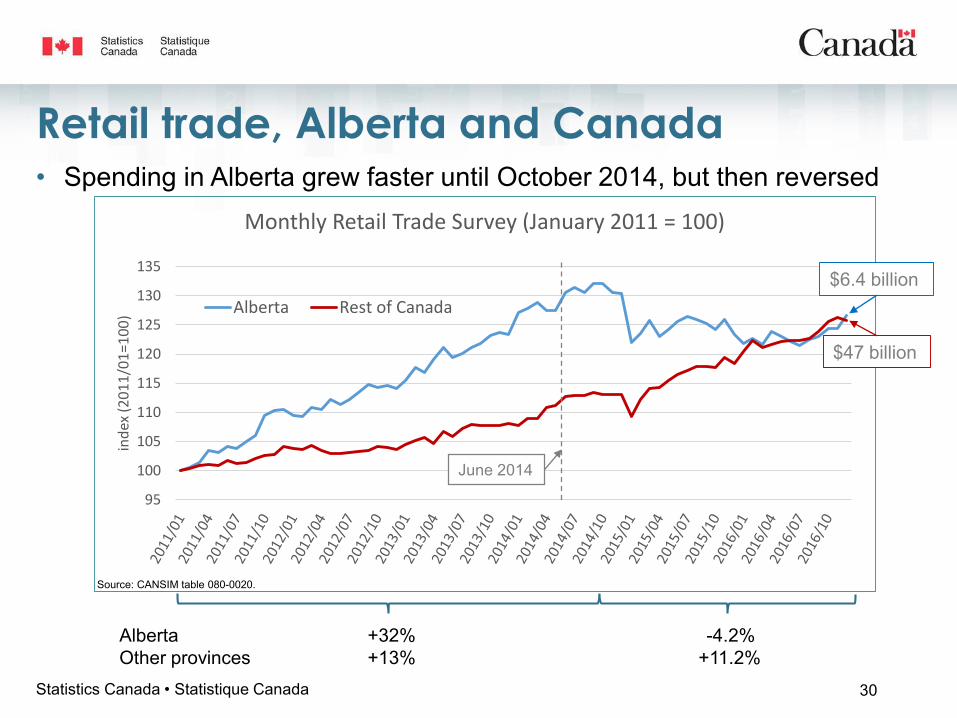
Retail trade, Alberta and Canada
Alberta +32% -4.2%Other provinces +13% +11.2%
• Spending in Alberta grew faster until October 2014, but then reversed
95
100
105
110
115
120
125
130
135
ind
ex (
20
11
/01
=10
0)
Monthly Retail Trade Survey (January 2011 = 100)
Alberta Rest of Canada
Source: CANSIM table 080-0020.
$6.4 billion
$47 billion
June 2014
30Statistics Canada • Statistique Canada
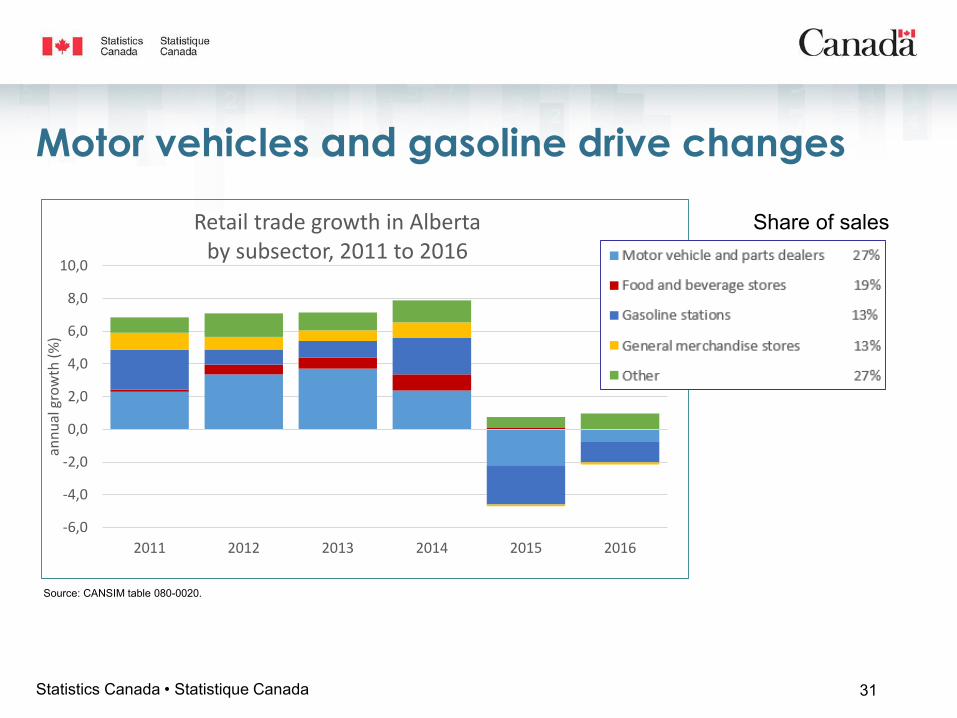
-6,0
-4,0
-2,0
0,0
2,0
4,0
6,0
8,0
10,0
2011 2012 2013 2014 2015 2016
ann
ual
gro
wth
(%
)
Retail trade growth in Albertaby subsector, 2011 to 2016
Motor vehicles and gasoline drive changes
Share of sales
Source: CANSIM table 080-0020.
31Statistics Canada • Statistique Canada
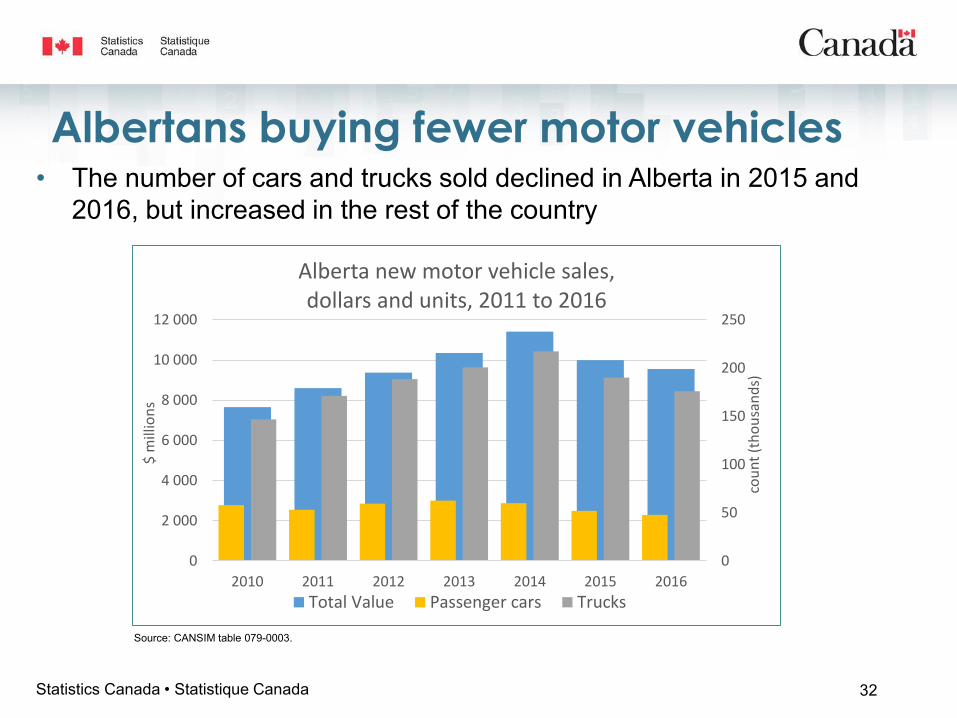
Albertans buying fewer motor vehicles• The number of cars and trucks sold declined in Alberta in 2015 and
2016, but increased in the rest of the country
Source: CANSIM table 079-0003.
0
50
100
150
200
250
0
2 000
4 000
6 000
8 000
10 000
12 000
2010 2011 2012 2013 2014 2015 2016
cou
nt
(th
ou
san
ds)
$ m
illio
ns
Alberta new motor vehicle sales,dollars and units, 2011 to 2016
Total Value Passenger cars Trucks
32Statistics Canada • Statistique Canada
95
100
105
110
115
120
125
130
135
140
ind
ex (
20
11
/01
=10
0)
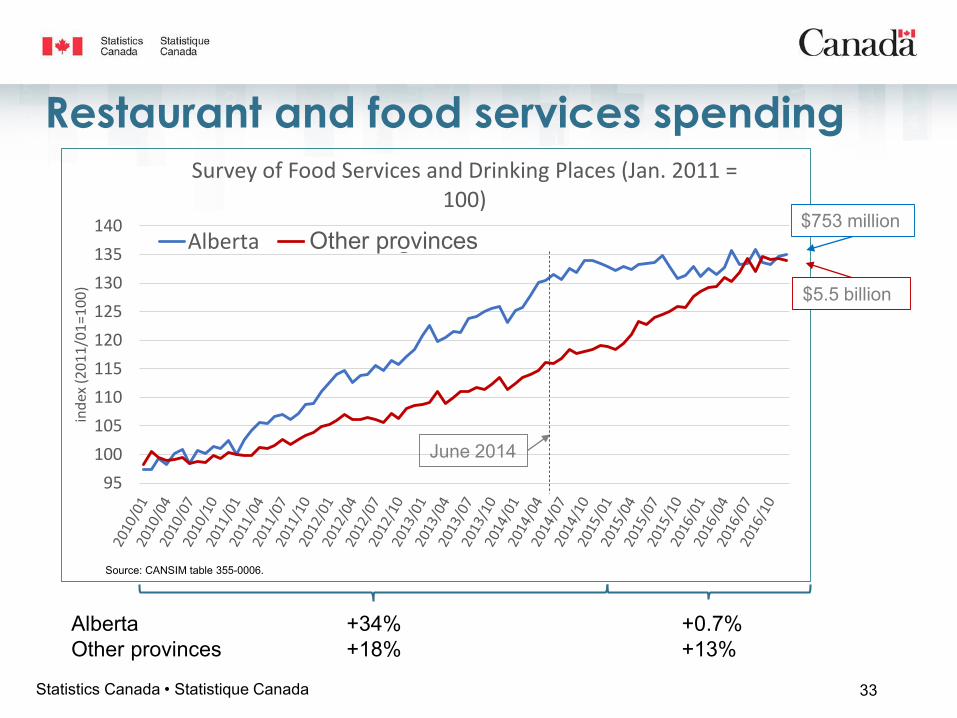
Survey of Food Services and Drinking Places (Jan. 2011 = 100)
Alberta Remaining Provinces
Restaurant and food services spending
Alberta +34% +0.7%Other provinces +18% +13%
June 2014
Source: CANSIM table 355-0006.
$753 million
$5.5 billion
33Statistics Canada • Statistique Canada
Other provinces
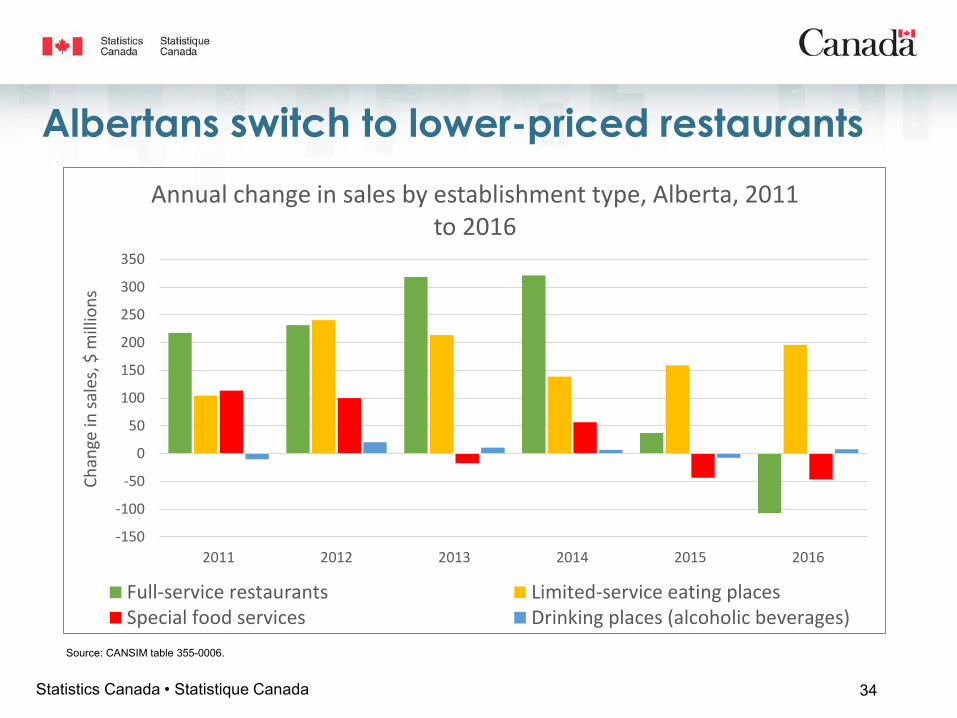
Albertans switch to lower-priced restaurants
Source: CANSIM table 355-0006.
-150
-100
-50
0
50
100
150
200
250
300
350
2011 2012 2013 2014 2015 2016
Ch
ange
in s
ales
, $ m
illio
ns
Annual change in sales by establishment type, Alberta, 2011 to 2016
Full-service restaurants Limited-service eating placesSpecial food services Drinking places (alcoholic beverages)
34Statistics Canada • Statistique Canada

SUMMARY
35Statistics Canada • Statistique Canada
o Moving forward
o Recap
o What’s next
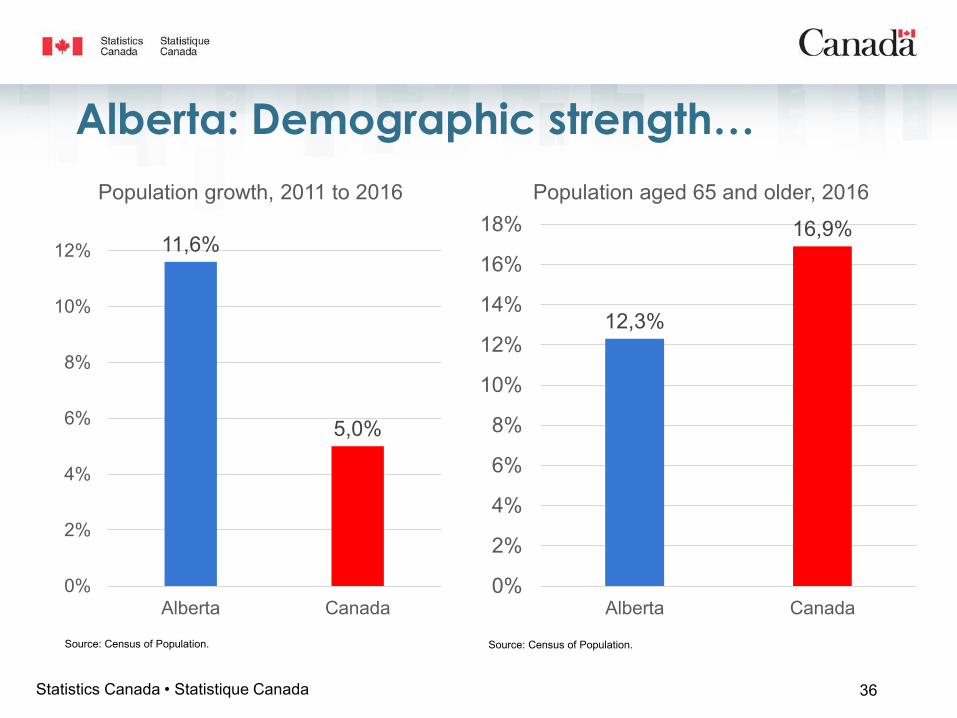
Alberta: Demographic strength…
Source: Census of Population.Source: Census of Population.
36Statistics Canada • Statistique Canada
11,6%
5,0%
0%
2%
4%
6%
8%
10%
12%
Alberta Canada
Population growth, 2011 to 2016
12,3%
16,9%
0%
2%
4%
6%
8%
10%
12%
14%
16%
18%
Alberta Canada
Population aged 65 and older, 2016
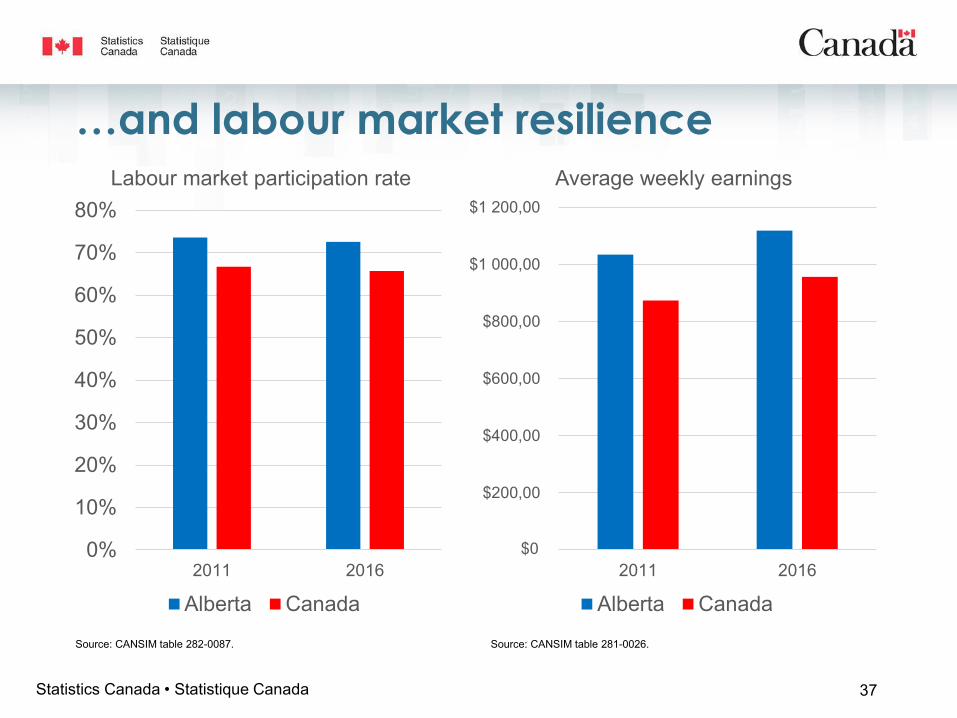
…and labour market resilience
Source: CANSIM table 281-0026.
$-
$200,00
$400,00
$600,00
$800,00
$1 000,00
$1 200,00
2011 2016
Average weekly earnings
Alberta Canada
0%
10%
20%
30%
40%
50%
60%
70%
80%
2011 2016
Labour market participation rate
Alberta Canada
Source: CANSIM table 282-0087.
37Statistics Canada • Statistique Canada
$0
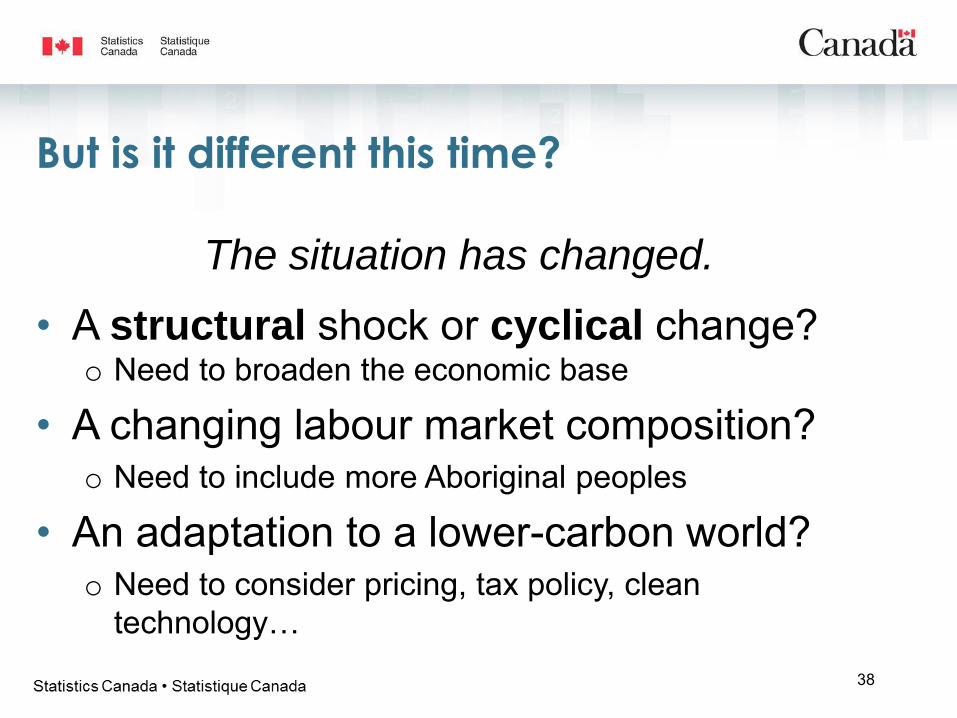
But is it different this time?
The situation has changed.
• A structural shock or cyclical change?o Need to broaden the economic base
• A changing labour market composition?o Need to include more Aboriginal peoples
• An adaptation to a lower-carbon world?o Need to consider pricing, tax policy, clean
technology…38
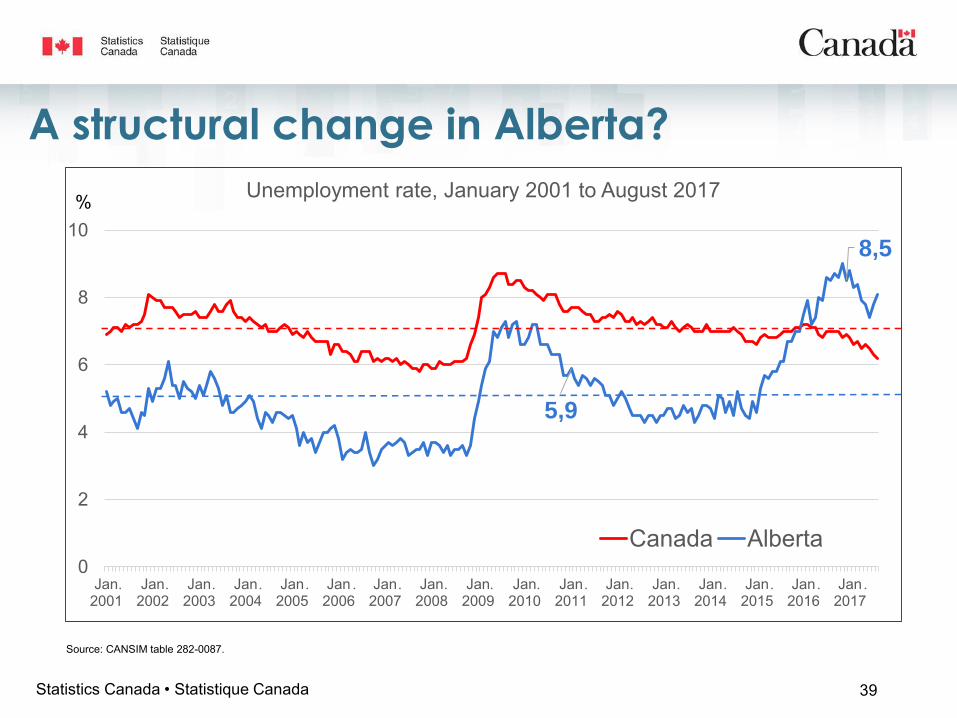
A structural change in Alberta?
Source: CANSIM table 282-0087.
39Statistics Canada • Statistique Canada
5,9
8,5
0
2
4
6
8
10
Jan2001
Jan2002
Jan2003
Jan2004
Jan2005
Jan2006
Jan2007
Jan2008
Jan2009
Jan2010
Jan2011
Jan2012
Jan2013
Jan2014
Jan2015
Jan2016
Jan2017
Unemployment rate, January 2001 to August 2017
Canada Alberta
%
.. . . . . . . . . . . . . . . .
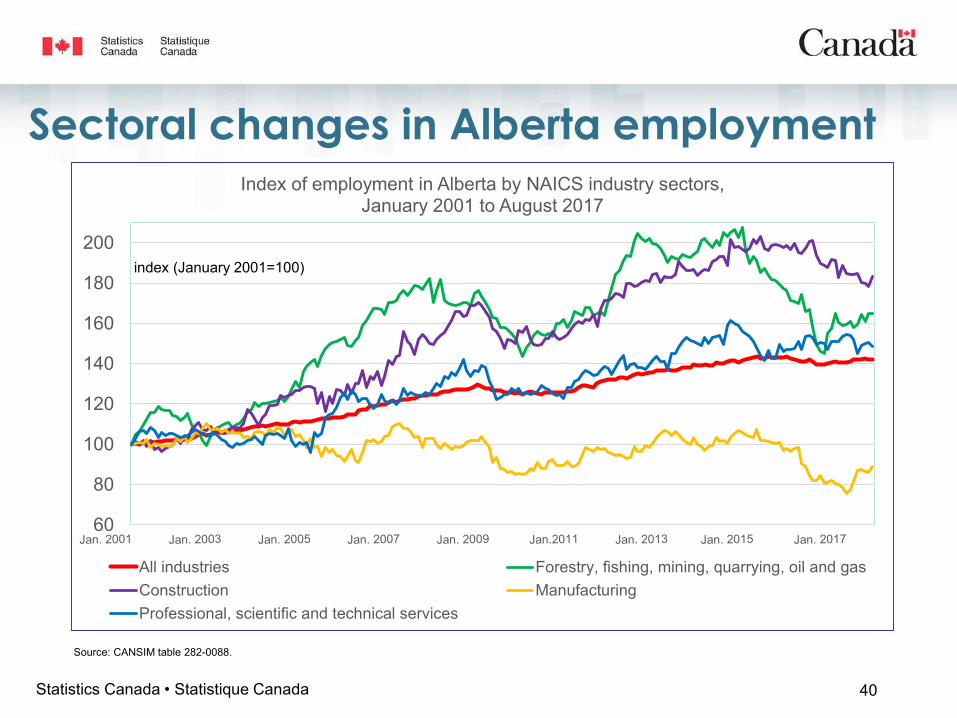
Sectoral changes in Alberta employment
Source: CANSIM table 282-0088.
40Statistics Canada • Statistique Canada
60
80
100
120
140
160
180
200
Index of employment in Alberta by NAICS industry sectors, January 2001 to August 2017
All industries Forestry, fishing, mining, quarrying, oil and gasConstruction ManufacturingProfessional, scientific and technical services
index (January 2001=100)
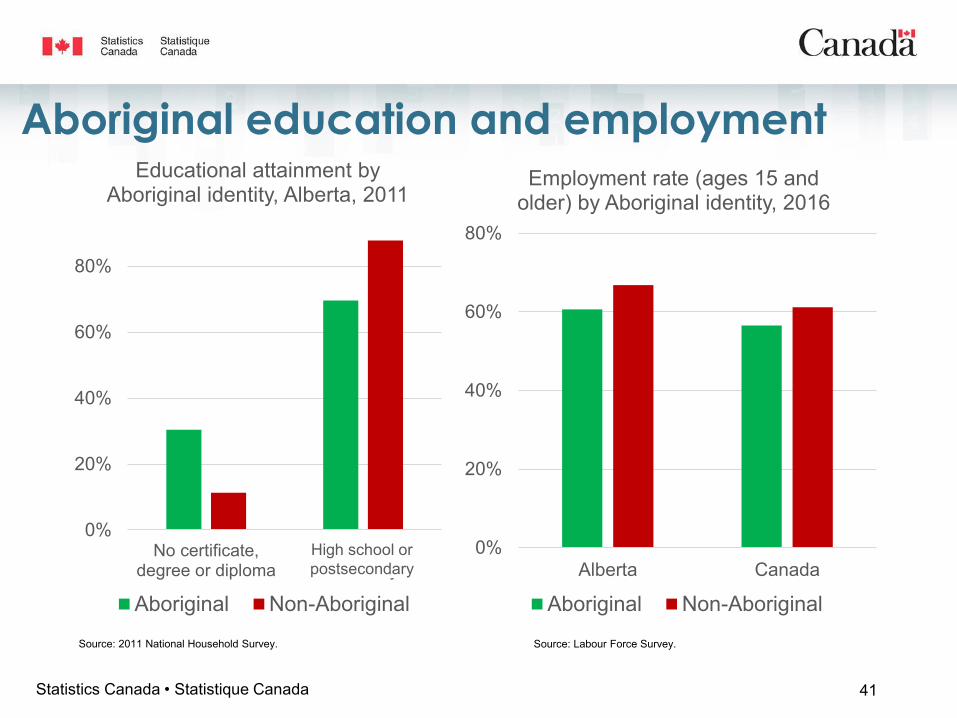
Aboriginal education and employment
Source: Labour Force Survey.
0%
20%
40%
60%
80%
Alberta Canada
Employment rate (ages 15 and older) by Aboriginal identity, 2016
Aboriginal Non-Aboriginal
0%
20%
40%
60%
80%
No certificate,degree or diploma
High school or post-secodary
Educational attainment by Aboriginal identity, Alberta, 2011
Aboriginal Non-Aboriginal
Source: 2011 National Household Survey.
41Statistics Canada • Statistique Canada
High school or postsecondary

Lower carbon = Economic diversification?
42
Recap
• Canadians are “price takers” in the global oil market, and, since 2014, gasoline prices have not fallen as far as crude oil prices
• Alberta’s reliance on oil production made it vulnerable to the price decline, with impacts felt in public finance, business and consumer behaviour
• Alberta is poised to recover with its strong demographics and labour market resilience, but there may be some challenges ahead
43
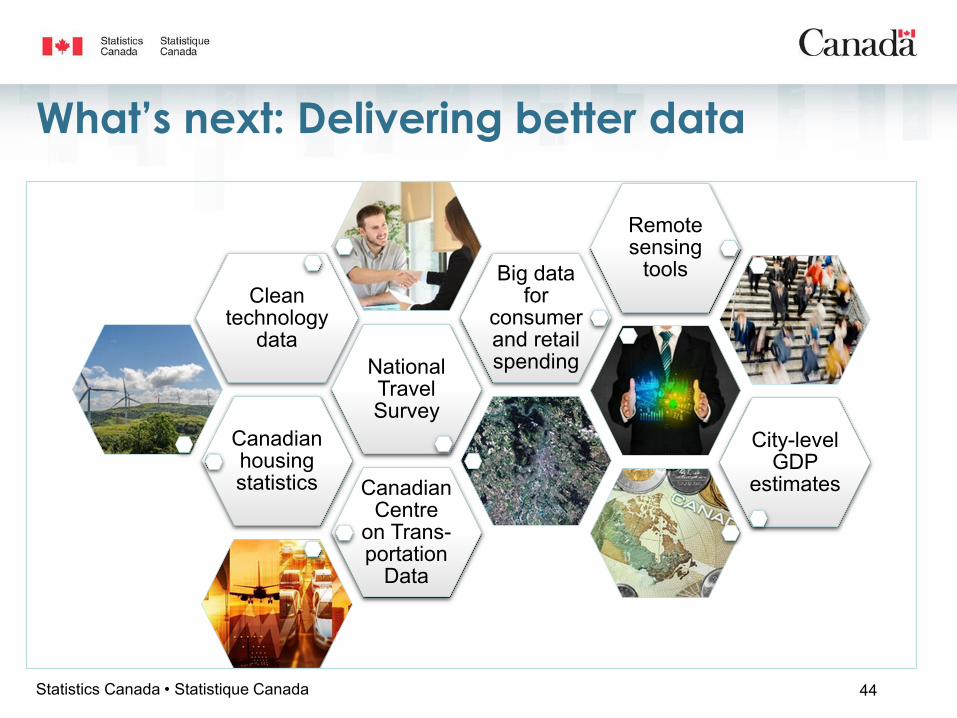
What’s next: Delivering better data
Canadian housing statistics
National Travel Survey
Clean technology
data
Big data for
consumer and retail spending
Remote sensing
tools
City-level GDP
estimatesCanadian Centre
on Trans-portation
Data
44Statistics Canada • Statistique Canada
A modern, responsive statistical agency
• Moving beyond a survey-first approach with new methods and integrating data from a variety of existing sources
• Making our data easier to access and use by adopting new tools to analyze and visualize data
• Helping more Canadians use data to make evidence-based decisions
45Statistics Canada • Statistique Canada