Embed Size (px)
Citation preview

Oil Markets and the Global Economy
Christof Rühl, Global Head of Research
Abu Dhabi
February 2016
1

Outline
The economy: an age of stagnation and low returns?
Oil price recap
Why are lower oil prices not boosting economic growth?
Where next for oil markets?
2

“Secular Stagnation“ ?
3
Source: The Economist

0%
1%
1%
2%
2%
3%
US Germany Japan
1985-1994 1995-2004 2005-2014
Real interest rates and total factor productivity (TFP)
Yield
Real return on 10-year
Government bonds Average annual growth
TFP in Advanced Economies
4
Source: OECD Source: Haver
-3%
0%
3%
6%
9%
1983 '87 '91 '95 '99 '03 '07 '11 2015
US Germany Japan

Where is…
Oil price decline
5
20
30
40
50
60
70
80
90
100
110
120
Jan-14 Jul-14 Jan-15 Jul-15 Jan-16
Dated Brent
US dollars per barrel
Source: Bloomberg
July 2014

20
30
40
50
60
70
80
90
100
110
120
Jan-14 Jul-14 Jan-15 Jul-15 Jan-16
Dated Brent
Where is the “shot in the arm”?
Revisions to GDP growth projections 2015
GDP growth
Source: IMF
6
Oil price decline
US dollars per barrel
Source: Bloomberg
July 2014
0%
1%
2%
3%
4%
5%
6%
World US Advancedeconomies
Emergingeconomies
Jul-14 Jan-15 Jul-15 Oct-15

3
4
5
6
7
8
9
China Emerging World
Apr-13 Oct-15
Long term growth projections in emerging markets
Revisions to 5-year GDP growth forecast
Percent
Source: IMF WEO
-1.0pp
-2.2pp
-0.5pp
20
25
30
35
40
45
50
55
1990 1993 1996 1999 2002 2005 2008 2011 2014
China
Emerging excl. China
Source: BP Statistical Review
Share of global oil demand
Percent
7

Outline
The economy: an age of stagnation and low returns?
Oil price recap
Why are lower oil prices not boosting economic growth?
Where next for oil markets?
8

20
30
40
50
60
70
80
90
100
110
120
Jan-14 Jul-14 Jan-15 Jul-15 Jan-16
Dated Brent
Oil price vs. other commodities
US dollars per barrel
Daily oil price
Source: Bloomberg
High price band of
2011-2014 period
Low price band
post 2015
0
100
200
300
400
500
600
700
0
20
40
60
80
100
120
140
Jan-00 Jan-03 Jan-06 Jan-09 Jan-12 Jan-15
Dated Brent (lhs)
Industrial metals (rhs)
Oil and industrial metals prices
US Dollars per barrel
9
Source: Bloomberg
Index

Oil supply disruptions and US production growth
Cumulative change since 4Q10, Mb/d
-4
-3
-2
-1
0
1
2
3
4
5
1Q11 3Q11 1Q12 3Q12 1Q13 3Q13 1Q14 3Q14 1Q15 3Q15
Libya Iran Other US Net
3Q15
Source: Includes data from BP Statistical Review of World
Energy and BP Energy Outlook 10

Oil supply disruptions and US production growth
Cumulative change since 4Q10, Mb/d
-4
-3
-2
-1
0
1
2
3
4
5
1Q11 3Q11 1Q12 3Q12 1Q13 3Q13 1Q14 3Q14 1Q15
Libya Iran Other US Net
3Q15
Source: Includes data from BP Statistical Review of World
Energy and BP Energy Outlook 11

Oil supply disruptions and US production growth
Source: Includes data from BP Statistical Review of World
Energy and BP Energy Outlook
Cumulative change since 4Q10, Mb/d
12
-4
-3
-2
-1
0
1
2
3
4
5
1Q11 3Q11 1Q12 3Q12 1Q13 3Q13 1Q14 3Q14 1Q15
Libya Iran Other US Net
3Q15

TO CUT PRODUCTION?
YES
OIL PRICE HIGHER
U.S. SHALE PRODUCTION
HIGHER
OPEC LOSES MARKET SHARE
OPEC REVENUES
DECLINE
NO
OIL PRICE LOWER
U.S. SHALE PRODUCTION
LOWER
OPEC GAINS MARKET SHARE
OPEC REVENUES
DECLINE
OPEC’s dilemma
13

Outline
The economy: an age of stagnation and low returns?
Oil price recap
Why are lower oil prices not boosting economic growth?
Where next for oil markets?
14

(1) US Dollar is appreciating
Source: Bloomberg
Real trade weighted US Dollar index…
• Relatively strong US growth and
productivity gains
• The end of QE in the US
… rises for good reasons
19% real appreciation since July
2014 (26% since July 2011):
Index, Jan 1990 = 100
85
90
95
100
105
110
115
120
125
Jan-90 Jan-95 Jan-00 Jan-05 Jan-10 Jan-15
15

(2) Households are deleveraging...
Household debt as a share of GDP
Change in household
debt since peak:
- 4 percentage points
- 19 percentage points
40
50
60
70
80
90
100
1Q 99 1Q 01 1Q 03 1Q 05 1Q 07 1Q 09 1Q 11 1Q 13 1Q 15
US
Euro area
1Q 2008 = 97.9%
4Q 2009 = 64.6%
16

… while government debt hampers demand management
% of GDP
19
20
21
22
23
24
25
26
1990 1995 2000 2005 2010 2015
Investment in Advanced
Economies
% of GDP
60
70
80
90
100
110
2001 2003 2005 2007 2009 2011 2013 2015
Government debt in Advanced
Economies
17
Source: Haver Source: Haver

(3) Major importers are becoming producers
30%
40%
50%
60%
70%
80%
90%
1994 1996 1998 2000 2002 2004 2006 2008 2010 2012 2014
US Brazil
Share of local consumption produced ‘at home’
Decline in imports
since 1994:
- 150 Kb/d
- 1,940 Kb/d
18
Source: BP Statistical Review of World Energy
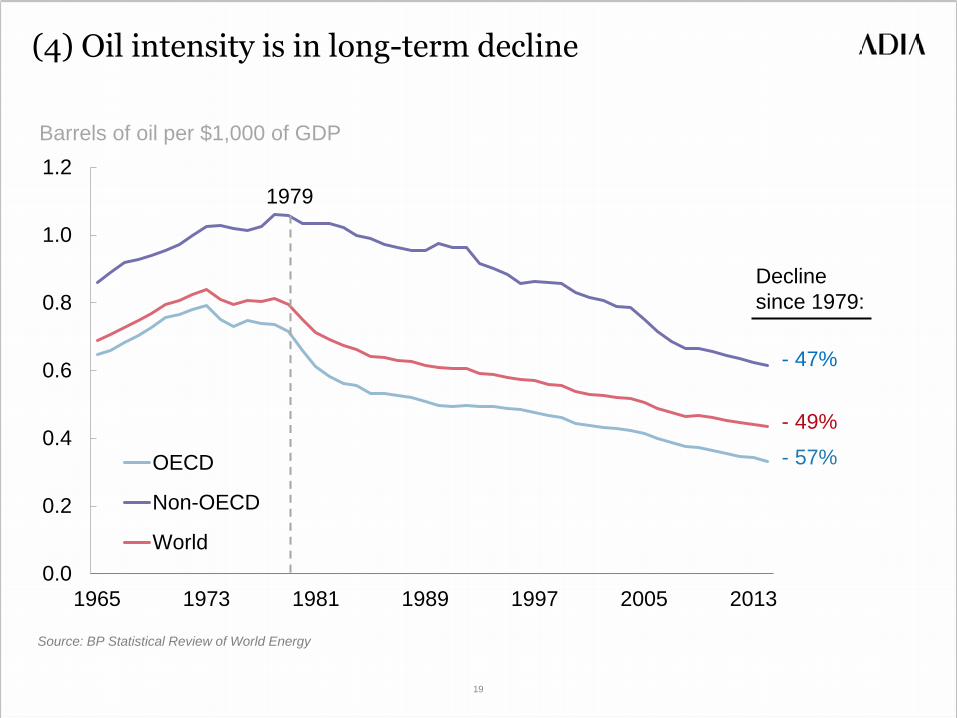
(4) Oil intensity is in long-term decline
0.0
0.2
0.4
0.6
0.8
1.0
1.2
1965 1973 1981 1989 1997 2005 2013
OECD
Non-OECD
World
Barrels of oil per $1,000 of GDP
- 47%
- 49%
- 57%
Decline
since 1979:
1979
Source: BP Statistical Review of World Energy
19

Outline
The economy: an age of stagnation and low returns?
Oil market recap
Why are lower oil prices not boosting economic growth?
Where next for oil markets?
20

-8
-6
-4
-2
0
2
4
6
8
10
12
14
20
30
40
50
60
70
80
90
100
110
120
130
Jan-14 Jun-14 Nov-14 Apr-15 Sep-15
12M – Dated Brent (rhs)
Dated Brent
0
20
40
60
80
100
120
140
Jan-00 Jan-03 Jan-06 Jan-09 Jan-12 Jan-15
Dated Brent
Weekly oil price
$/bbl $/bbl $/bbl
Contango
Backwardation
Daily oil price and term structure
Crude prices and term structure
21
Source: Bloomberg Source: Bloomberg

(1) OECD inventories are at historic highs…
22
2,500
2,600
2,700
2,800
2,900
3,000
3,100
Jan Feb Mar Apr May Jun Jul Aug Sep Oct Nov Dec
2010-14 Inventory range 2015 2014
Million barrels of crude oil and oil products
Source: EIA

… and so is the US strategic petroleum reserve
23
0
2
4
6
8
10
12
14
16
0
20
40
60
80
100
120
140
160
Jan-00 Jan-02 Jan-04 Jan-06 Jan-08 Jan-10 Jan-12 Jan-14
Strategic reserve
Net imports of crude and products (rhs)
Million barrels of oil per day Forward imports cover in days

(2) US shale oil production finally declining…
-5%
0%
5%
10%
15%
20%
25%
30%
Jan-11 Sep-11 May-12 Jan-13 Sep-13 May-14 Jan-15 Sep-15
US on-shore oil production (excl. Alaska)
YoY growth
US on-shore production
declined by more than 0.6
Mb/d since peaking at 7.7
Mb/d in March 2015
22% was the average
US onshore production
growth in the 2012 to
end-2014 period
24

… driving overall production lower
6.0
6.4
6.8
7.2
7.6
8.0
8.4
8.8
9.2
9.6
10.0
Jan-14 Apr-14 Jul-14 Oct-14 Jan-15 Apr-15 Jul-15 Oct-15
Total US crude production
Lower-48 production
Million barrels per day (Mb/d)
25
Source: EIA

-0.4
-0.3
-0.2
-0.1
0.0
0.1
0.2
0.3
0.4
Average 2011-14 2015
Europe US
(3) Above-average demand growth driven by the OECD
European and US demand growth
Million barrels per day (Mb/d)
Source: EIA
OECD and Non-OECD demand growth
-0.5
0.0
0.5
1.0
1.5
2.0
Average 2011-14 2015
OECD Non-OECD World
Million barrels per day (Mb/d)
Source: EIA
1.27 Mb/d 1.36 Mb/d
26
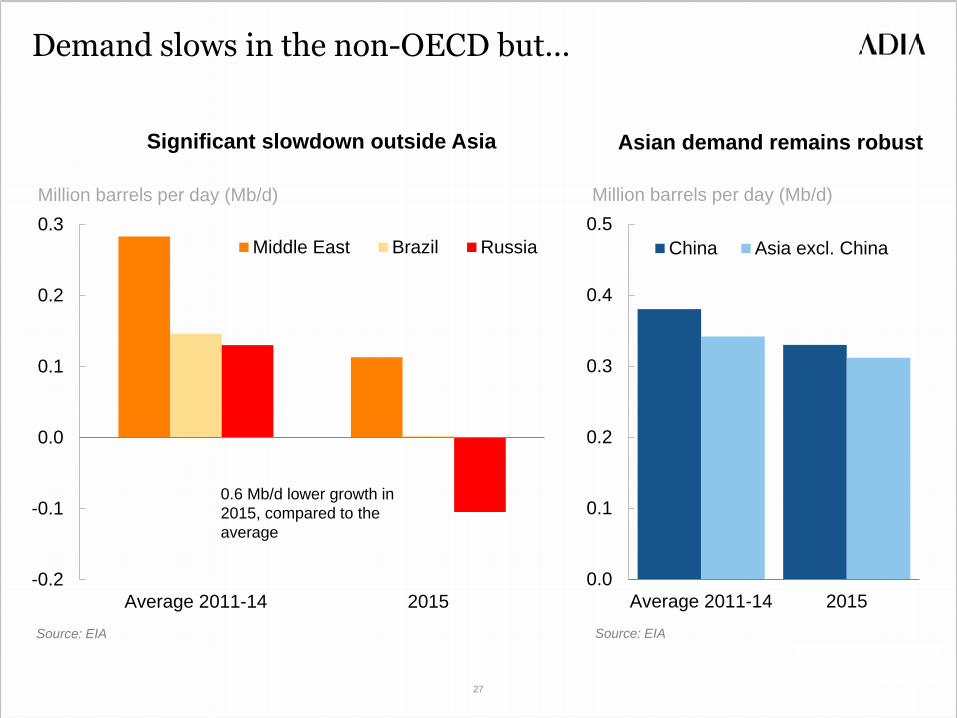
0.0
0.1
0.2
0.3
0.4
0.5
Average 2011-14 2015
China Asia excl. China
Demand slows in the non-OECD but…
Asian demand remains robust
Million barrels per day (Mb/d)
Source: EIA
Significant slowdown outside Asia
-0.2
-0.1
0.0
0.1
0.2
0.3
Average 2011-14 2015
Middle East Brazil Russia
Million barrels per day (Mb/d)
Source: EIA
0.6 Mb/d lower growth in
2015, compared to the
average
27

… China worries overblown
-30%
-20%
-10%
0%
10%
20%
30%
40%
Jan-11 Jul-11 Jan-12 Jul-12 Jan-13 Jul-13 Jan-14 Jul-14 Jan-15 Jul-15
Gasoline Diesel
YoY growth
2015
28
Source: JODI

500
550
600
650
700
750
Jan-12 Dec-12 Nov-13 Oct-14 Sep-15
Source: Bloomberg
0
200
400
600
800
1,000
1,200
Jan-14 Jul-14 Jan-15 Jul-15 Jan-16
(4) Saudi Arabia: FOREX reserves and forward rate
Saudi Arabian FOREX reserves
Million US dollars
Saudi Riyal 12-month forward premium
Basis points (above spot rate)
Source: Bloomberg
$129bn
decline
since
August
2014
29

Selected oil market shares
6%
7%
8%
9%
10%
11%
12%
Jan-12 Oct-12 Jul-13 Apr-14 Jan-15 Oct-15
Russia
Saudi Arabia
US crude oil
Market share
30%
31%
32%
33%
34%
35%
36%
Jan-12 Oct-12 Jul-13 Apr-14 Jan-15 Oct-15
OPEC
Market share
Country market shares OPEC market share
OPEC meeting OPEC meeting
30
Source: EIA Source: EIA

US and Saudi Arabia: oil market shares
6%
7%
8%
9%
10%
11%
12%
Jan-11 Aug-11 Mar-12 Oct-12 May-13 Dec-13 Jul-14 Feb-15 Sep-15
Saudi Arabia market share (crude only) US market share (crude only)
Market share
Saudi Arabian share
essentially flat
US market share
increased from
6.1% to 10.2%
at the peak
31
Source: EIA

2.8%
3.2%
3.6%
4.0%
4.4%
4.8%
Jan-11 Dec-11 Nov-12 Oct-13 Sep-14 Aug-15
Iran Iraq
Oil market shares of key OPEC producers
Market share
9.5%
9.9%
10.3%
10.7%
11.1%
11.5%
Jan-11 Dec-11 Nov-12 Oct-13 Sep-14 Aug-15
Saudi Arabia
Market share
Iran & Iraq Saudi Arabia
32
Source: EIA Source: EIA

Conclusion
The economy: Multiple and volatile adjustments, but still locally driven
Relationship between oil and global growth has weakened
Oil markets are searching for a new equilibrium, accommodating OPEC
as well as unconventional growth
Expect volatility with an upward drift in prices for 2016-17
33