Embed Size (px)
Citation preview

Trading Global Marketsusing Technical Analysis
Andy Bowerwww.alchemetrics.org

Format
Technical Analysis• Data• Chart Patterns• Computers/Backtesting• Neural Nets/Genetic Algorithms
Essentials of Trading• Markets• Money• Brokers
Risks, Reward and Practicality• Risk/Reward• “Practical” system building

Lecture OneTechnical Analysis
Andy Bowerwww.alchemetrics.org

Technical Analysis
“The examination of historical marketprice movements in order to predictfuture price movements”
Tenets:• Current prices reflect all available information• Prices “trend”; they are not entirely random• (Some) historical patterns tend to reoccur

Fundamental Analysis

Fundamentals vs Technicals
Apple Computer AAPL 2003/4Apple Computer AAPL 2003/4
XX

Technical Analysis Methods
Chart PatternsIndicatorsComputer analysis
• Backtesting – pattern isolation• Automated pattern matching

Data: Bars
Bars• Open-High-Low-Close-Volume• Weekly, Daily, Minute
PetsmartPetsmart PETMPETM–– Daily OHLC BarsDaily OHLC Bars
PetsmartPetsmart PETMPETM–– Volume SpikesVolume Spikes

Data: Candlesticks
GapsGaps

Data: Timescales
WeeklyWeekly
15 minute15 minute
DailyDaily

Patterns: Support/Resistance
SupportSupport
ResistanceResistanceSupport ASupport A
Resistance BResistance B
SupportSupport
NasdaqNasdaq 100 ETF Daily100 ETF DailyResistanceResistance

Patterns: Trends and Channels
NasdaqNasdaq 100 ETF Daily100 ETF Daily

Patterns: Reversal
Double/Treble Tops• 1st Peak on high volume• Trough• 2nd Peak usually on
lower volume• Break support on
high volume• Completion (often)
height of peaksbelow support
Ford DailyFord Daily

Patterns: Reversal
Head and Shoulders• Prior uptrend• Left shoulder• Pullback to neck• Head Peak• Pullback to neckline• Right shoulder• Break of neckline
on high volume signalstrend reversal
Citrix DailyCitrix Daily

Markov Game

Computer Pattern Matching
Strategy• Isolate tradable patterns.. Then test
Backtesting• Evaluation of a trading strategy using historical price
data to measure performance.
Metrics• Equity Curve• Profit Factor, Sharpe Ratio• Drawdown• Avg Trade %

BacktestingEquity Curve

BacktestingPeriod Returns

BacktestingPerformance Report
BacktestingOptimization
Strategies may have parameters• Optimize to maximize profitability• Need to be wary of “curve fitting”
Split data into segments• Backtest & Optimize on some segments• Then forward test on remaining segments
Minimize number of variables

Neural Networks
Used to isolate “unknown” patterns
BackpropagationBackpropagationNeural NetNeural Net
Real NeuronsReal Neurons

Neural Networks
Used to isolate “unknown” patternsInputs
• Indicators/Other Networks
Outputs• Profit/Sharpe Ratio/etc
Network configuration• Optimize using Genetic Algorithms
Backtesting• Curve Fitting issues are very important

Genetic Algorithms
Parameter Optimization• Searching a large multi-dimensional space• Typically better at avoid local optima
Use for Optimizing• Indicator based systems• Neural Network topology
Backtesting• Curve fitting issues are very important

Reading
Technical Analysis of the Financial MarketsMurphy: New York Institute of Finance
StockCharts.comhttp://stockcharts.com/education/ChartAnalysis/
Further ReadingDow Theory
in Murphy

Lecture TwoEssentials of Trading
Andy Bowerwww.alchemetrics.org

Essentials of Trading
Why People Trade• Money
What People Trade• Market
Where People Trade• Exchanges
How People Trade• Brokers• Orders• Margin• Shorting• Strategies

Money: Why People Trade
Investments• Pension Funds• Insurance Funds• Trusts• Individuals
Borrowers• House Buyers• Companies• Students
Hedgers• Producers
Exchange wealth now forExchange wealth now for(more) wealth in the future(more) wealth in the future
Exchange wealth in the futureExchange wealth in the futurefor wealth (facilities) nowfor wealth (facilities) now
Unknown future risk reductionUnknown future risk reduction

Market: What People TradeSecurities
Stocks• Shares issued to raise capital now• Regular dividend (interest) payment• Redeemable by selling to other investors at
“market” price.
Exchange Traded Funds (ETFs)• Funds hold portfolios matching common indices• QQQQ, DIA, SPY (US funds)
Bonds• Bonds, Notes issued to raise capital now• Bought (usually) for face value• Regular coupon (interest) payment• At term redeemed (usually) at face value

Market: What People TradeDerivatives
Options• Call Option – A right to purchase an asset at a strike
price on or before the expiration date. Cost of optionis the premium.
• Put Option – A right to sell an asset at a strike priceon or before the expiration date. Cost of option is thepremium.
Futures• Futures Contract - agreement to purchase a
commodity (item) for delivery in the future.
Leverage• Derivatives yield an amplification of gain or loss.

Market: What People TradeCurrencies
Exchange Rates• Profit from single exchange rate changes
Arbitrage• Exploit discrepancies in 3 way markets• E.g. yen-euro, euro-dollar, dollar-yen

Market: Where People Trade
Exchanges• UK: LIFFE, LSE• US: Amex, NYSE, CME
OTC• Over-the-Counter• Brokers and dealers negotiate trades• NASDAQ is a price quotation system for OTC trades• L1:Market Makers/L2:Brokers/L3:Investors
ECNs• Electronic Communication Networks• US ECNs – Island, Instinet, Archipelago etc.

Brokers: How People Trade Traders
• Investors• Borrowers• Hedgers
Trading Services• Market Makers/Specialists
Cross outstanding tradesOtherwise “deal” from own inventory (25%)Set bid & ask prices and profit from spread
• Brokers Interface between traders and market makersProfit from commission charges for orders filled
Traders effectively buy “liquidity” from Trading Services

Brokers: How People Trade
Direct Access BrokerDirect Access Broker$0.005$0.005 –– $0.01 per share$0.01 per share
Route direct to dealerRoute direct to dealer
WebWeb--based Discount Brokerbased Discount Broker$10$10--$20 per trade$20 per trade
““AutomaticallyAutomatically”” routed to dealerrouted to dealerFull Service BrokerFull Service Broker$100$100--$200 per trade$200 per trade
Additional research servicesAdditional research services

Brokers: How People TradeSpread Betting
WebWeb--based Spread Bettingbased Spread BettingLarger Bid/Ask SpreadLarger Bid/Ask Spread
Not actually trading securitiesNot actually trading securitiesTAX FREETAX FREE

Bid/Ask Prices
• Bid PricePrice offered to buy your asseti.e. Price at which you can sell
• Ask PricePrice offered to sell you an asseti.e. Price at which you can buy
• Bid <= Ask

Orders Market Orders
• Buy (initially) at inside ask• Sell (initially) at inside bid• Usually immediate fill during market hours
Limit Orders• Buy or Sell at specified limit price
Stop Orders• Sell triggered when price falls below stop price• Converted to market order when triggered• Used to manage risk.
Stop Limit Orders• Sell at a limit price when price falls below stop price• May not fill in fast moving market
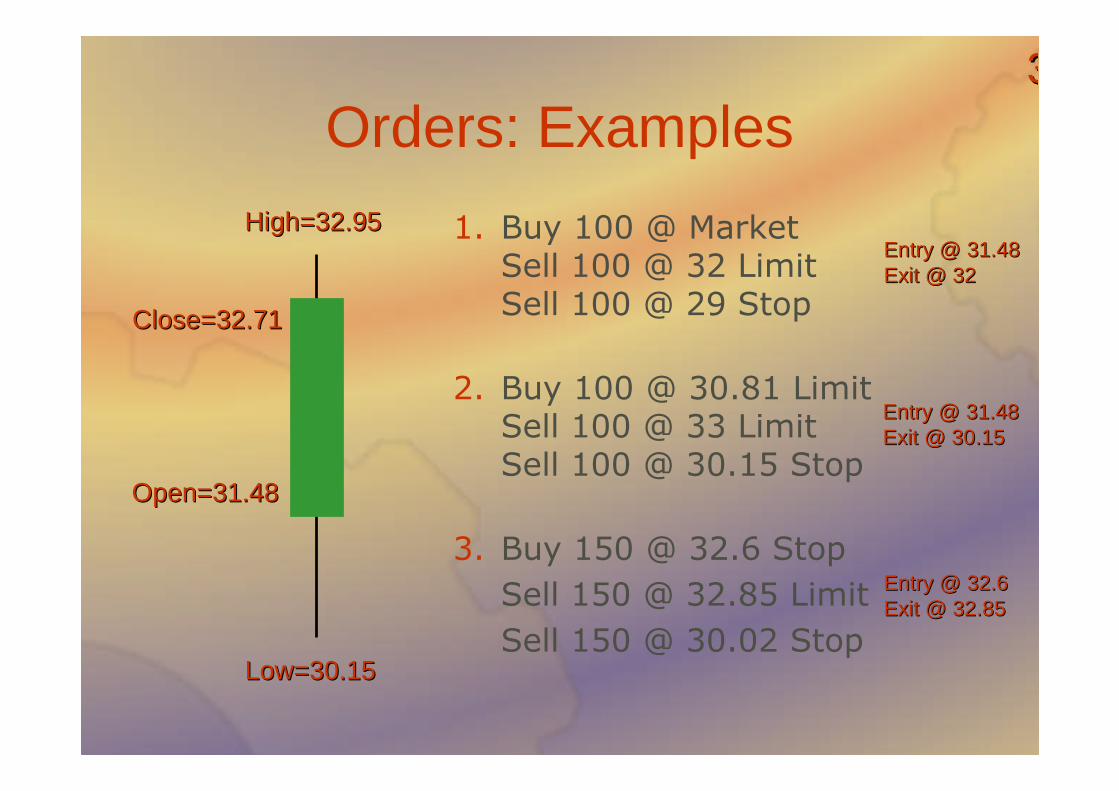
Orders: Examples
1. Buy 100 @ MarketSell 100 @ 32 LimitSell 100 @ 29 Stop
2. Buy 100 @ 30.81 LimitSell 100 @ 33 LimitSell 100 @ 30.15 Stop
3. Buy 150 @ 32.6 StopSell 150 @ 32.85 LimitSell 150 @ 30.02 Stop
Open=31.48Open=31.48
High=32.95High=32.95
Close=32.71Close=32.71
Low=30.15Low=30.15
Entry @ 31.48Entry @ 31.48Exit @ 32Exit @ 32
Entry @ 31.48Entry @ 31.48Exit @ 30.15Exit @ 30.15
Entry @ 32.6Entry @ 32.6Exit @ 32.85Exit @ 32.85
33

Margin
Standard Margin (US equity)• Margin accounts can borrow 100% of the account size (2:1)• Use of margin provides leverage: extra risk – extra gain
Day Trader Margin (US equity)• Accounts marked as pattern day trading must have a
minimum $25,000 balance• Day Trader Margin accounts can borrow 400% of the
account size (4:1)
Margin Calls• Accounts that exceed margin receive a margin call• Some brokers liquidate positions directly

Short Selling
Margin accounts can sell short• Borrow security from dealer with the aim to
buy it back at a lower price.
Shorting Advantages• An “obvious” way to profit in a falling market• Shorting an ETF index fund profits when
general market is bearish
Shorting Disadvantages• Unlimited potential for loss• Dividends must be paid out• Up-tick rule

Shorting Orders
Market Orders• Sell Short (initially) at inside bid• Cover (initially) at inside ask
Limit Orders• Sell or Cover at specified limit price
Stop Orders• Cover triggered when price rise above stop price• Converted to market order when triggered
Stop Limit Orders• Cover at a limit price when price rise above stop price• May not fill in fast moving market

Trading Styles
Buy & Hold or Position Trading• Buy and hold for long periods (years)• Portfolios accrue profits from general market direction
(on avg. 11%APR since 1920)• Often used by investment managers
Swing Trading• Buy or sell short and hold for up to several weeks• Attempt to capture profits from the price swings• Main vehicle of Hedge Funds
Day Trading• Buy or sell short and close positions by end of day• Scalpers attempt to “scalp” profits from small price
movements using large position sizes.

Trading Styles: HedgingBuy or Sell a correlated instrument to manage downside risk.
Industrial/Agricultural Hedging• Sell future contract against commodity.• Insure against price falls after upfront investment.• Limits upside and downside.
Stock hedging with futures contracts• Sell futures contract against correlated index• Insure again overall market fall/crash• Limits upside and downside.
Stock hedging with options• Buy put option to sell at a minimum future price• Limits downside, preserves upside (for premium).

Options Leverage/HedgingExamples
Feb 2005: Invest $10,400 in Apple ComputerCurrent price $44.86 per share
1. Purchase entirely as shares in AAPL
2. Purchase 2000 July 16th (QAAGW) call optionsStrike price $47.50, premium $3.70
3. Purchase entirely as AAPL shares and write July 16thQAAGW call options to cover (COVERED CALLS)
4. Purchase 1000 call options and invest the remainder inhalf yearly Treasury Bonds paying 2% per six months
Plot returns for August share price of $35, 40, 45, 50, 60 70in each strategy

Reading
Essentials of InvestmentsPART ONE: Investments Background and IssuesMcGraw Hill: Bodie, Kane, Marcus

Lecture ThreeReturns, Risk and
PracticalityAndy Bower
www.alchemetrics.org

Essentials of Investments
Measuring Return• Arithmetic/Geometric/APR
Measuring Risk• Risk premium/Gambling/Speculating• Drawdown
Diversification• Efficient Frontier
The Efficient Market Hypothesis• Buy & Hold/Medium/Short terms

Measuring Return
Holding Period Return (HPR)• (Priceend – Pricestart + Dividend) / Pricestart• No account for Deposits/Withdrawals
Arithmetic Average Return• (Sum HPR over n periods)/n• Ignores compounding• Good estimate for future HPR returns
Geometric Average• (Sum HPR over n periods) root n• Equivalent single period return with same compounded
performance

Measuring ReturnIRR
Takes into account net cash flows
CF0 + CF1/(1+IRR)1 +CF2/(1+IRR)2+CFn/(1+IRR)n=0
Solve for IRR

Measuring ReturnAPR / EAR
Annual Percentage Rate (APR)• Used for regular nperiod cash flows• Ignores compounding• APR = HPRperiod x nperiod
Effective Annual Rate (EAR)• Includes compounding• Discrete Compounding:
1+EAR=(1+HPR)n
• Continuous Compounding:EAR=eAPR - 1

Measuring Risk
Expected Rate of Return E(r)• Consider probability of various scenarios and
the HPRs for each.
• E(r) = s p(s) HPR(s)
Risk can be measured as:• “expected” variance of HPR from E(r)
• Var(r) = s p(s) (HPR(s)-E(r))2

Measuring Risk
Risk Premium• A measure of the benefit of investing in a
“risky” asset compared to a “risk free” asset.• Typically E(r)-rf
Speculators• Require a risk premium• Trade off risk against expected return
Gamblers• Don’t require a risk premium

Effects of Risk
Drawdown• The % amount by which an investment fund
falls below its previous high.• Confidence factor
Example Trading SystemHypothetical ReturnsAPR=466%
BUT…. >40% drawdown>40% drawdownthree times in 2 yearsthree times in 2 years
Drawdown periodsDrawdown periodseach > 3monthseach > 3months

Diversification
nn
Risk standard deviationRisk standard deviationvsvs
Portfolio sizePortfolio size
Market riskMarket risk

2 Asset Portfolios
Portfolio rate of return• rp = wa ra + wb rb
Portfolio Expected Rate of Return• E(rp) = wa E(ra) + wb E(rb)
Portfolio Variance (Risk)• σp = (waσa)2 + (wbσb)2 + 2(waσa)(wbσb)ρab
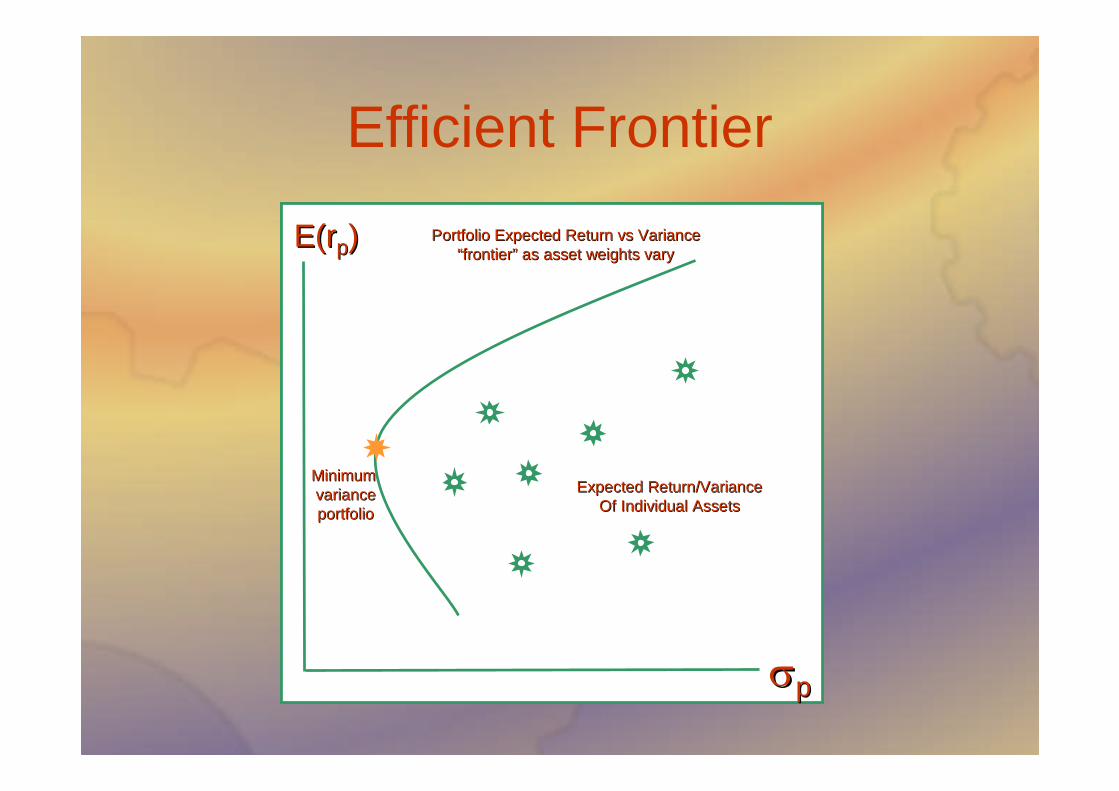
Efficient Frontier
E(rE(r22))
22
Two Asset Expected ReturnTwo Asset Expected Return vsvs VarianceVariancePlot as asset weights varyPlot as asset weights vary
MinimumMinimumvariancevariance
combinationcombination
E(rE(rpp))
pp
Expected Return/VarianceExpected Return/VarianceOfOf Individual AssetsIndividual Assets
Portfolio Expected ReturnPortfolio Expected Return vsvs VarianceVariance““frontierfrontier”” as asset weights varyas asset weights vary
MinimumMinimumvariancevarianceportfolioportfolio

Efficient Market Hypothesis
If prices include all available information• Markets must be “efficient”• Price action must be unpredictable (random walk)• Called the Efficient Market Hypothesis (EMH)
Three forms• Weak Form EMH• Semi-Strong Form EMH• Strong Form EMH• All predict that Technical Analysis is without merit
In which case the following shouldn’t work…
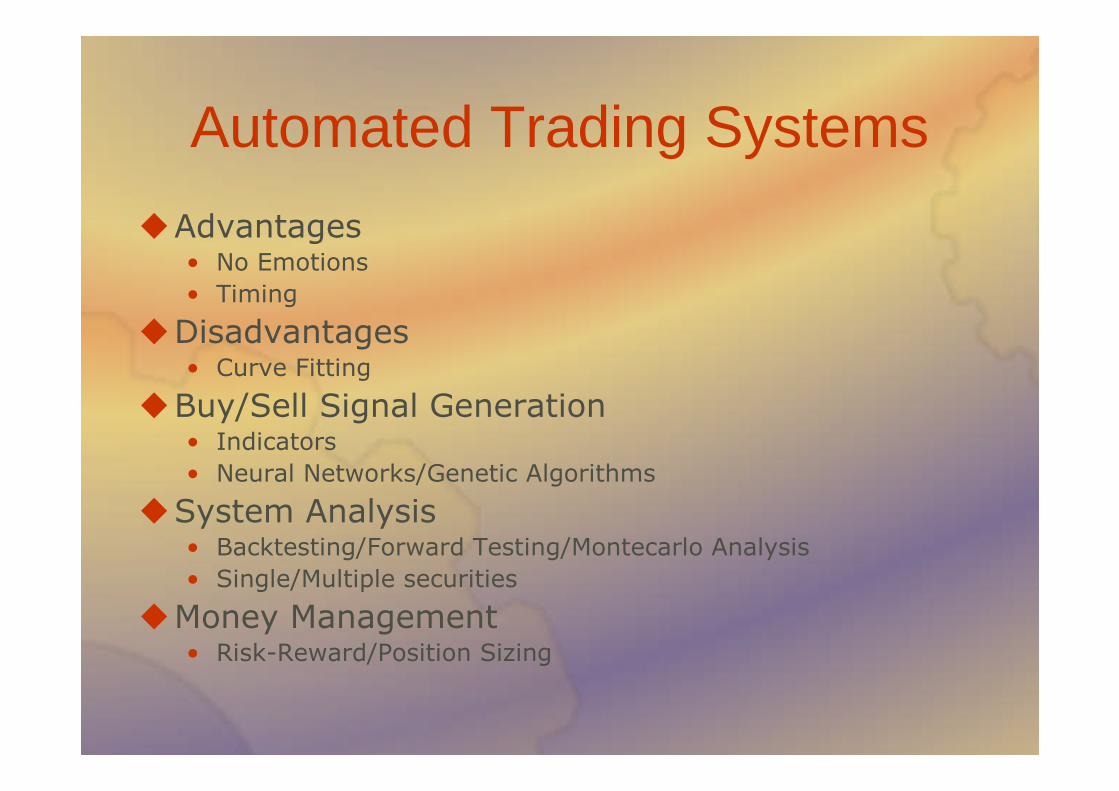
Automated Trading Systems
Advantages• No Emotions• Timing
Disadvantages• Curve Fitting
Buy/Sell Signal Generation• Indicators• Neural Networks/Genetic Algorithms
System Analysis• Backtesting/Forward Testing/Montecarlo Analysis• Single/Multiple securities
Money Management• Risk-Reward/Position Sizing

Practical System AnalysisExamples
Simple System• Moving average crossover
Effect of Diversification• Multiple stocks
Effect of Money Management• Returns vs. Drawdown
Slippage• Market orders/Effective market orders

Personal Experience
7th year of trading on US markets
4th year of automated trading• Proprietary software for strategy building• Analysis tools• Automated order submission
You can read about this at www.alchemetrics.org

Automated Trading

My “Rules of Engagement”Don't trade "manually"; always use computer-based
automated systems.
Go Long wherever possible.
Look for systems that exploit distortions in themarket.
Trade portfolios rather than individual issues.
Keep systems simple.
Don't believe your analysis tools.

Reading
Essentials of InvestmentsBodie, Kane, Marcus: McGraw-Hill
• Risk and Return• Efficient Diversification
Further Reading
Trade Your Way to Financial FreedomTharp: McGraw-Hill