Embed Size (px)
Citation preview

OIL AND GAS OPERATIONS
• Paramount exited 2017 with fourth quarter sales volumes averaging 95,412 Boe/d compared tosales volumes of 11,901 Boe/d in the fourth quarter of 2016. Full year sales volumes averaged 44,970Boe/d in 2017.
• Paramount’s sales volumes, excluding sales volumes from properties acquired or sold in the year,more than doubled to approximately 22,500 Boe/d in 2017 compared to about 10,000 Boe/d in 2016.Fourth quarter sales volumes for these properties increased to approximately 34,100 Boe/d in 2017compared to about 10,000 Boe/d in the fourth quarter of 2016.
• Adjusted funds flow was $218.7 million ($13.33 per Boe) in 2017 compared to $35.7 million ($3.06per Boe) in 2016. Liquids revenue was $353.9 million, 72 percent of total revenue.
• Fourth quarter adjusted funds flow was $110.1 million in 2017 compared to $14.3 million in 2016.
• Operating costs in the fourth quarter of 2017 were $9.81 per Boe, with transportation costs of $2.77per Boe and royalties of $1.92 per Boe.
• In the Grande Prairie region, 26 new wells from the 2016/2017 Karr capital program averaged 1,970Boe/d (59 percent liquids) over their initial 30-day peak production periods. Grande Prairie salesvolumes averaged 31,791 Boe/d in the fourth quarter of 2017.
• In the Kaybob region, six (3.1 net) new Duvernay wells completed with higher intensity fracs averaged1,346 Boe/d (47 percent liquids) per-well over their initial 90-day production periods. Kaybob salesvolumes averaged 41,531 Boe/d in the fourth quarter.
• In the Central Alberta and Other region, 9 (4.5 net) wells were drilled at Birch in 2017, four of whichwere producing by year-end. Sales volumes averaged 22,090 Boe/d in the fourth quarter in theCentral Alberta and Other region.
• The Company is restarting legacy wells and maximizing oil production at the Zama property innorthwest Alberta. These successful well reactivations underpin Paramount’s strategic objective ofdriving to a positive netback at Zama.

Paramount Resources Ltd. 2017 Annual Results
2018 GUIDANCE
• Paramount’s 2018 capital budget remains at $600 million. Approximately $200 million of the 2018capital program is related to projects that will bring new production on-stream in 2019 whenincremental third-party natural gas processing capacity is commissioned.
• Sales volumes in 2018 are expected to average 100,000 Boe/d with a 40 percent liquids weighting.The Company’s sales volumes are expected to remain at this level until production at Wapiti beginsto ramp up in the the spring of 2019 when a new third-party natural gas processing facility isscheduled for completion.
• Operating costs in 2018 are expected to average approximately $10.00 per Boe, with transportationcosts expected to average approximately $3.10 per Boe.
RESERVES
• The Company’s proved reserves at December 31, 2017 totalled 375.8 MMBoe compared to 59.6MMBoe in 2016. Proved plus probable reserves (ʺP+Pʺ) at December 31, 2017 totalled 593.5 MMBoecompared to 115.2 MMBoe in 2016.
• Proved reserves, excluding reserves acquired through the Apache Canada Acquisition and theTrilogy Merger and after production, increased 56 percent to 92.7 MMBoe in 2017 compared to 59.6MMBoe in 2016.
• P+P reserves, before acquisitions and after production, increased 34 percent to 153.9 MMBoe in2017 compared to 115.2 MMBoe in 2016.
• The Company’s reserve replacement ratio, before acquisitions, was 5.3 times for proved reservesand 6.1 times for P+P reserves.
• P+P reserves for the Karr property, after production, increased 55 percent to 130.4 MMBoe in 2017compared to 84.3 MMBoe in 2016.
• P+P finding and development ("F&D") costs for Karr were $11.72 per Boe in 2017.
• Estimated future net revenue for proved reserves increased to $2.5 billion and future net revenue forP+P reserves increased to $4.4 billion (discounted at 10 percent, before tax).
2

Paramount Resources Ltd. 2017 Annual Results
CORPORATE
• Paramount’s revolving bank credit facility (the “Facility”) was increased by $500 million to $1.2 billionin March 2018. At Paramount’s request, the size of the Facility can be further increased by up to $300million (to $1.5 billion) pursuant to an accordion feature in the Facility.
• The Company has delivered a redemption notice to redeem all $300 million outstanding principalamount of its 7.25% senior unsecured notes due 2019. The redemption will be funded using theupsized Facility and completed in early April 2018.
• To protect the Company’s cash flows and in support of its 2018 capital program, Paramount hasentered into commodity hedges for 16,000 Bbl/d of liquids for fiscal 2018 at an average price ofC$71.06/Bbl and 6,000 Bbl/d of liquids for fiscal 2019 at an average price of C$71.23/Bbl.
• Paramount has arrangements in place to transport and sell approximately 60,000 GJ/d of natural gasat the Dawn natural gas hub in Ontario at $US NYMEX reference prices and 21,000 GJ/d of naturalgas in California at $US Malin reference prices.
• In December 2017, Paramount implemented a normal course issuer bid. To date, the Company haspurchased and cancelled 1,454,100 common shares at a total cost of $27.4 million.
Forward-Looking Statements and Information This document includes forward-looking statements and information that is based on Paramount’s current expectations, estimates, projections and assumptions. Actual results may differ materially from those expressed or implied by the forward-looking statements and information. Readers are referred to the forward-looking statements and other advisories contained at the end of Paramount’s Management’s Discussion and Analysis for the year ended December 31, 2017 contained herein which also includes supplemental advisories related to additional information included in this document.
3

Paramount Resources Ltd. 2017 Annual Results
RESERVES (1)(2)(3)
Proved Proved plus Probable
2017 2016 % Change 2017 2016 % Change
Natural gas (Bcf) 1,398.7 238.0 488 2,171.3 463.3 369
NGLs (MBbl) 119,134 19,100 524 196,883 36,736 436
Light and Medium crude oil (MBbl) 23,570 882 NM 34,714 1,219 NM
Total (MBoe) 375,824 59,645 530 593,473 115,173 415
Future Net Revenue NPV10 ($ millions) 2,464 424 481 4,353 810 437
(1) Readers are referred to the advisories concerning Non-GAAP Measures and Oil and Gas Measures and Definitions in the Advisories section of this document.(2) Reserves evaluated and reviewed, as applicable, by the Company’s independent reserves evaluator, McDaniel & Associates Consultants Ltd. ("McDaniel") as of
December 31, 2017 in accordance with National Instrument 51-101 definitions, standards and procedures. Amounts are working interest reserves before royalty deductions. Net present values of future net revenue were determined using forecast prices and costs and do not represent fair market value.
(3) The estimates of reserves and future net revenue for individual properties may not reflect the same confidence level as estimates of reserves and future net revenue for all properties, due to the effects of aggregation.
NM Not meaningful
FINANCIAL AND OPERATING HIGHLIGHTS (1)
($ millions, except as noted)
Three months ended December 31
Twelve months ended December 31
2017 2016 % Change 2017 2016 % Change
Sales volumes
Natural gas (MMcf/d) 359.9 47.5 658 161.3 104.8 54
Condensate and oil (Bbl/d) 26,285 2,943 793 13,956 7,733 80
Other NGLs (Bbl/d) (2) 9,149 1,046 775 4,138 6,668 (38)
Total (Boe/d) 95,412 11,901 702 44,970 31,860 41
Petroleum and natural gas sales 258.9 32.3 702 491.4 248.8 98
Netback 131.7 17.0 675 249.9 93.1 168 ($/Boe) 14.99 15.53 (3) 15.22 7.99 90
Adjusted funds flow 110.1 14.3 670 218.7 35.7 513 per share – diluted ($/share) 0.82 0.13 531 1.89 0.34 456
Net income (loss) (106.2) 212.4 (150) 183.4 1,165.3 (84) per share – diluted ($/share) (0.79) 1.99 (140) 1.58 10.95 (86)
Exploration and Development Capital (3) 150.4 78.1 93 527.6 187.5 181
Investments in other entities – market value (4)(5) 53.3 208.7 (74)
Total assets 5,090.7 2,059.0 147
Net debt (cash) 636.2 (565.9) NM
Common shares outstanding (thousands) 135,059 105,787 28
(1) Readers are referred to the advisories concerning Non-GAAP Measures and Oil and Gas Measures and Definitions in the Advisories section of this document. This table contains the following non-GAAP measures: Netback, Adjusted funds flow, Exploration and Development Capital, Investments in other entities – market value and Net debt (cash).
(2) Other NGLs includes ethane, propane and butane. (3) Excludes land and property acquisitions and spending related to corporate assets. (4) Based on the period-end closing prices of publicly-traded investments and the book value of the remaining investments. (5) Excludes 3.8 million class A common shares of Seven Generations Energy Ltd. classified as "Investments in Securities for Distribution" having a carrying value and
market value of $119.0 million as at December 31, 2016. These shares were distributed to Paramount’s shareholders by way of dividend in January 2017. NM Not meaningful
4

Paramount Resources Ltd. 2017 Annual Results
REVIEW OF OPERATIONS
Paramount continued its transformation in 2017, expanding its footprint in the Montney and Duvernay Deep Basin resource plays and adding land positions across the Western Canadian Sedimentary basin. During the year, Paramount successfully completed the following major transactions:
• May 2017 – sold the Valhalla area development for $150 million;• August 2017 – acquired Apache Canada Ltd. for $486.9 million (the ʺACL Acquisitionʺ); and• September 2017 – merged with Trilogy Energy Corp., issuing one Paramount Common Share for
every 3.75 Trilogy common shares (the ʺTrilogy Mergerʺ).
Entering 2018, Paramount is well positioned with an excellent portfolio of top-tier resource plays, a solid balance sheet and an expanded five-year growth plan focused on exploiting the new development opportunities captured in 2017.
The ACL Acquisition added approximately 39,000 Boe/d of production, 282.9 MMBoe of proved plus probable reserves, effective December 31, 2017 as independently evaluated by McDaniel and Associates Ltd. (ʺMcDanielʺ), and approximately 1.6 million net acres of land.
The Trilogy Merger added approximately 22,000 Boe/d of production, 156.8 MMBoe of proved plus probable reserves, effective December 31, 2017 as independently evaluated by McDaniel, and approximately 0.6 million net acres of land.
During the year, the Company produced 44,970 Boe/d (16.4 million total Boe) and generated adjusted funds flow of $218.7 million ($13.33 per Boe), after interest and general and administrative expenses. Liquids revenue was $353.9 million, representing 72 percent of total 2017 revenue.
Capital expenditures for the Company’s regions were $150.4 million in the fourth quarter, bringing total 2017 annual capital expenditures to $527.6 million (before merger and acquisition activities and spending on corporate assets). Paramount realized $158.4 million of proceeds from the sale of non-core assets in 2017. Capital expenditures in the fourth quarter of 2017 were higher than planned, primarily as a result of incurring some 2018 expenditures in late-2017 to accelerate well completions and facilities expansion work at Karr, initiate drilling operations at Smoky River, Kaybob South and Karr and accelerate work on water management facilities for 2018 well completions.
OIL AND GAS OPERATIONS
Paramount’s land base encompasses 2.9 million net acres across western Canada. The Company is focused on developing its suite of liquids-rich Montney and Duvernay resource plays, with approximately 378,000 net acres and 230,000 net acres of land, respectively. An additional 206,500 net acres of oil sands lands in the Western Athabasca region are held through Cavalier Energy.
Paramount’s sale volumes averaged 95,412 Boe/d in the fourth quarter of 2017, despite unplanned third-party pipeline outages and freeze-offs that shut-in approximately 7,000 Boe/d of production during December. These pipelines were restarted in January 2018.
The Company’s integration efforts are nearing completion, focused on safety, operational excellence and cost reduction. Paramount has organized its expanded operations into three regions and created discipline-based leadership roles to facilitate the sharing of information, align operational management systems, develop project execution standards and best practices and integrate subsurface, operating, and midstream planning.
5

Paramount Resources Ltd. 2017 Annual Results
Paramount’s three new operating regions are:
• the Grande Prairie Region, located in the Peace River Arch area of Alberta, which is focused onMontney developments at Karr, Wapiti and Resthaven / Jayar;
• the Kaybob Region, located in west-central Alberta, which is focused on Montney and Duvernaydevelopments at Kaybob, Smoky River, Pine Creek and Ante Creek; and
• the Central Alberta and Other Region, which includes Duvernay development plays in southernAlberta at Willesden Green and the East Shale Basin, and lands and production in northern Albertaand British Columbia.
The Company’s sales volumes and capital expenditures by region for the fourth quarter of 2017 were as follows:
Three months ended December 31
2017 % Liquids 2016 % Liquids
Sales volumes (Boe/d)
Grande Prairie 31,791 51 8,357 36
Kaybob 41,531 29 271 48
Central Alberta and other 22,090 32 1,312 39
Total 95,412 37 9,940 37
Sold Assets (1) ─ ─ 1,961 15
Total 95,412 37 11,901 34
Capital Expenditures ($ millions)
Grande Prairie 97.0 66.6
Kaybob 39.3 ─
Central Alberta and other 14.1 11.5
Total 150.4 78.1 (1) Sold Assets includes the Valhalla area oil and gas properties divested in 2017 and other non-core property dispositions.
2018 OPERATIONAL AND CAPITAL PLAN
The Company is executing on a multi-year development plan to double production in a five-year period. Paramount’s 2018 capital plan is focused on the development of the Company’s liquids-rich projects while initiating a divestiture program to high-grade its asset base. Paramount expects sales volumes to average 100,000 Boe/d in 2018 with a 40-percent liquids weighting. The Company’s sales volumes are anticipated to remain at this level until production at Wapiti begins to ramp up in the spring of 2019 when 150 MMcf/d of new third-party gas processing capacity is scheduled to come on-stream. Operating costs through the 2018 period are estimated to be approximately $10.00 per Boe, with transportation costs expected to average approximately $3.10 per Boe.
Capital expenditures for 2018 are expected to be approximately $600 million including exploration, optimization and maintenance programs, excluding acquisitions, divestitures and abandonment and reclamation activities. Approximately $200 million of the 2018 capital program is related to projects that will bring new production on-stream in 2019, including $142 million to drill and complete wells in the Wapiti area in preparation for the startup of the third-party Wapiti natural gas processing plant in 2019 (the ʺWapiti Plantʺ).
6

Paramount Resources Ltd. 2017 Annual Results
2018 CAPITAL PROGRAM (1)
Region Wells
Drilled (2) Wells
Completed (2) Capital (3)
(Wells & Infrastructure)
(Gross / Net) (Gross / Net) ($ millions) Karr Grande Prairie 10 / 10 10 / 10 $ 156 Wapiti Grande Prairie 23 / 23 6 / 6 142 Montney Oil Kaybob 21 / 21 20 / 20 71 Smoky River Duvernay Kaybob 4 / 4 4 / 4 62 Duvernay South Kaybob 11 / 5.6 5 / 2.5 55 Willesden Green Central Alberta and Other 2 / 2 1 / 1 25 Other wells & facilities Various 6 / 4.3 5 / 3.3 66 Optimization projects Various 23
TOTAL 77 / 69.9 51 / 46.8 $ 600 (1) Excludes potential acquisitions, divestitures and abandonment and reclamation activities.(2) Includes wells planned to be drilled and completed in 2018. The actual number of wells drilled and completed will vary depending on the
effects of weather, the availability of third-party personnel, equipment and materials and other factors. (3) Budgeted capital costs for planned drilling, completion and infrastructure projects in 2018. The actual cost incurred in 2018 will vary depending on
the projects actually completed, the effects of weather, the cost and availability of third-party personnel, equipment and materials and other factors.
The 2018 drilling program includes 77 gross wells, requiring an estimated 2,500 drilling days. Paramount’s wholly-owned Fox Drilling fleet can accommodate approximately 1,900 of those drilling days.
To achieve efficient and timely well completions, the Company has contracted a dedicated frac unit for all of 2018. Additional frac units will be contracted as required throughout the year.
The Company is continuing the construction of water processing and management facilities initiated in 2017, consisting of four two-million barrel water pits, water disposal wells and related pipeline infrastructure. These water management facilities are expected to significantly increase operational efficiencies and reduce completion and operating costs going forward.
Optimization Projects
Paramount has allocated approximately $23 million to maintenance and optimization projects in 2018 to improve base production and reduce operating costs. Many of the optimization opportunities are possible due to the overlap of the Trilogy and Apache Canada land and infrastructure positions in Kaybob, which provide significant opportunities for cost saving synergies. The 2018 program includes plans to re-route certain Kaybob area production from third party facilities to owned and operated facilities.
Abandonment Activities
The Company plans to spend approximately $28 million in 2018 on abandonment and reclamation activities, primarily at Zama in northwest Alberta.
7

Paramount Resources Ltd. 2017 Annual Results
GRANDE PRAIRIE REGION
The focus in the Grande Prairie Region, depicted below, is the Karr and Wapiti properties, located south of Grande Prairie, Alberta, in the over-pressured liquids-rich Deep Basin Montney trend. Paramount added approximately 45,000 net acres of high quality Montney rights in the region through the ACL Acquisition, increasing its total Montney position to approximately 155,000 net acres as of December 31, 2017. The Company also has a material position of approximately 165,000 net acres of Deep Basin Cretaceous rights partially overlying the Montney rights in the region.
GRANDE PRAIRIE REGION
8

Paramount Resources Ltd. 2017 Annual Results
In the fourth quarter, nine (9.0 net) wells from the 2016/2017 27-well Karr drilling program were completed and brought on production and drilling commenced on a new five (5.0 net) well Montney pad. Sales volumes for the Grande Prairie Region averaged 31,791 Boe/d (51 percent liquids) in the fourth quarter of 2017, despite a two-day planned outage at the Karr 6-18 compression and dehydration facility (the ʺ6-18 Facilityʺ) to install additional power generation. This additional power generation capacity has increased water disposal capability at the 6-18 Facility, reducing hauling and third-party water disposal costs.
Karr
The 2016 / 2017 Karr capital program wrapped up in late 2017 with successful completions on the final five wells in the 27-well program. The table below summarizes the average peak 30-day initial wellhead production rates for the 26 wells that have produced for at least 30 days:
Well Peak 30-Day
Total (1) Peak 30-Day
Condensate (1) Peak 30-Day Condensate
Days on Production
Cumulative Production (2)
(Boe/d) (Bbl/d) (%) (Boe)
00/04-07-065-05W6/0 2,551 1,815 71% 380 521,267 02/04-07-065-05W6/0 2,844 2,176 77% 350 593,888 02/01-12-065-06W6/0 2,633 1,795 68% 339 450,105 00/01-12-065-06W6/0 2,218 1,533 69% 275 325,987 00/03-22-066-05W6/0 1,949 946 49% 268 306,564 00/09-32-065-04W6/0 2,159 1,401 65% 268 433,740 00/15-14-065-06W6/0 2,620 1,341 51% 248 476,581 00/16-32-065-04W6/0 2,122 1,263 60% 248 429,205 00/04-34-065-05W6/0 2,137 994 47% 228 346,811 00/01-33-065-05W6/0 1,912 805 42% 226 326,760 02/16-24-066-05W6/0 1,341 694 52% 208 208,391 00/04-06-066-04W6/0 1,815 851 47% 207 303,601 02/04-06-066-04W6/0 2,050 1,395 68% 205 311,528 00/03-06-066-04W6/0 1,839 874 48% 204 331,235 00/16-24-066-05W6/0 1,352 647 48% 197 233,255 02/09-32-065-04W6/0 1,767 1,042 59% 189 220,124 00/08-32-065-04W6/0 1,856 1,176 63% 165 261,683 02/16-14-065-06W6/0 2,133 1,288 60% 141 264,148 00/13-14-065-06W6/0 1,712 1,060 62% 125 179,459 02/14-14-065-06W6/0 1,781 1,044 59% 76 120,818 02/15-14-065-06W6/0 1,834 1,235 67% 76 134,784 02/02-25-065-05W6/2 1,909 1,146 60% 75 117,475 00/02-25-065-05W6/0 1,894 983 52% 72 116,012 02/03-25-065-05W6/0 1,792 991 55% 59 98,111 03/01-25-065-05W6/0 1,503 890 59% 56 105,372 00/03-25-065-05W6/0 1,494 953 64% 31 45,416
Average 1,970 1,167 59% 189
(1) Peak 30 Day is the highest daily average production rate over a 30-day consecutive period for an individual well, measured at the wellhead. Natural gas sales volumes are approximately 10 percent lower and stabilized condensate sales volumes are approximately 15 percent lower due to shrinkage. The production rates and volumes shown are 30 day peak rates over a short period of time and, therefore, are not necessarily indicative of average daily production, long-term performance or of ultimate recovery from the wells.
(2) Cumulative production for an individual well measured at the wellhead to February 24, 2018. Natural gas sales volumes are approximately 10 percent lower andstabilized condensate sales volumes are approximately 15 percent lower due to shrinkage.
Paramount increased average frac stages completed per day from approximately five on earlier pads to over 10 on the most recent pad, with a high of 17 frac stages completed in one 24-hour period.
The Company is expanding the existing 6-18 Facility, which delivers production volumes to a downstream third-party plant for processing, from its current 80 MMcf/d of compression and dehydration capacity to approximately 100 MMcf/d in the latter half of 2018. Paramount plans to increase natural gas production at
9

Paramount Resources Ltd. 2017 Annual Results
Karr to 150 MMcf/d by 2020. Firm service third-party natural gas transportation capacity is in place for the planned production ramp.
Wapiti
At Wapiti, two wells were rig released and two wells were completed and tested in 2017. To date, nine (9.0 net) delineation wells have been drilled and completed in three zones within the Upper, Middle and Lower Montney zones.
The new third-party Wapiti Plant is scheduled to be commissioned in the spring of 2019. Paramount has secured priority access to the entire 150 MMcf/d of natural gas processing capacity in the facility. The Wapiti Plant has been designed with sufficient liquids processing capacity to process production from liquids-rich Montney wells and includes water management facilities, which will reduce Paramount’s ongoing water disposal costs.
In 2018, the Company plans to drill 23 (23.0 net) Montney wells on two large multi-well pads and construct water management facilities for its completion programs. The majority of the well completions are scheduled in the early part of 2019 to align with the commissioning and startup of the Wapiti Plant.
Paramount has secured firm-service third-party natural gas transportation capacity for Wapiti production volumes, which will ramp-up from 50 MMcf/d of capacity in 2019 to 130 MMcf/d in early 2021.
Resthaven/Jayar
At Resthaven/Jayar, the 2016/2017 program included five (4.5 net) Cretaceous wells and one (1.0 net) Montney well.
A Montney well at Resthaven was drilled, completed and brought on production in the third quarter, with encouraging results. This well was completed with a similar design to recent Karr Montney wells and had a completed lateral length of approximately 2,700 meters, with 70 to 100 tonne frac stages, resulting in proppant loading intensities of 2.6 tonne/meter. The well continues to flow on cleanup and achieved an IP30 wellhead production rate of 1,314 Boe/d with 33 percent liquids. The Company is monitoring the longer-term performance of this well and may accelerate the development of the Montney in this area.
10

Paramount Resources Ltd. 2017 Annual Results
KAYBOB REGION
Paramount has a large portfolio of resource plays in the Kaybob Region, as depicted below. Through the ACL Acquisition and the Trilogy Merger, Paramount added approximately 900,000 net acres of land at Kaybob including 88,000 net acres of Montney oil, 122,000 net acres of liquids-rich Montney gas, and 136,000 net acres of Duvernay, more than half of which are in the liquids-rich Duvernay trend. Additionally, Paramount acquired rights in the multiple stacked Cretaceous formations and strategic owned and operated facilities, (including six natural gas processing plants and three oil batteries). Company-owned natural gas processing capacity at Kaybob exceeds 200 MMcf/d, and the oil batteries can process more than 40,000 Bbl/d of liquids.
KAYBOB REGION
11

Paramount Resources Ltd. 2017 Annual Results
Kaybob Montney Oil
At the Kaybob Montney Oil property, in keeping with Paramount’s strategy of innovation, the Company implemented a new completion design which includes 30 percent more stages and 100 percent greater proppant loading. The table below summarizes the average peak 30-day initial wellhead rates for wells with the new completion design:
Well Peak 30-Day
Total (1) Peak 30-Day
Oil (1) Peak 30-Day
Oil Days on
Production Cumulative
Production (2)
(Boe/d) (Bbl/d) (%) (Boe)
02/05-06-064-18W5/0 2,301 1,928 84% 419 232,756 03/04-06-064-18W5/0 1,059 759 72% 412 197,164 02/04-06-064-18W5/0 1,202 1,082 90% 376 144,224 00/13-31-064-18W5/0 1,174 990 84% 325 136,558 02/13-31-064-18W5/0 811 605 75% 332 170,525 00/14-31-064-18W5/0 756 578 76% 333 82,944 00/14-12-064-19W5/2 539 475 88% 324 76,073 02/15-12-064-19W5/0 683 587 86% 320 101,432 03/15-12-064-19W5/0 754 620 82% 285 83,110 02/08-05-064-18W5/0 1,007 929 92% 251 108,606 03/09-05-064-18W5/0 815 758 93% 239 83,403 02/08-29-064-18W5/0 1,573 599 38% 202 226,508
Average 1,056 826 78% 318
(1) Peak 30 Day is the highest daily average production rate over a 30-day consecutive period for an individual well, measured at the wellhead. Natural gas sales volumes are approximately 10 percent lower and oil sales volumes are approximately 15 percent lower due to shrinkage. The production rates and volumes shown are 30 day peak rates over a short period of time and, therefore, are not necessarily indicative of average daily production, long-term performance or of ultimate recovery from the wells.
(2) Cumulative production for an individual well measured at the wellhead to February 28, 2018. Natural gas sales volumes are approximately 10 percent lower andoil sales volumes are approximately 15 percent lower due to shrinkage.
Solution gas from Kaybob Montney Oil production is processed in Paramount’s owned and operated Kaybob 8-9-64-19W5 natural gas processing plant (the ̋ 8-9 Plantʺ), and delivered to market via firm-service transportation on the TCPL system. The 8-9 Plant is dually connected to both TCPL and Alliance, providing for future optionality. Oil sales volumes from the Kaybob Montney Oil property are processed at the Company’s 100 percent owned 12-10 oil battery and sold in Alberta at Edmonton Light Sour reference prices, which are not subject to the Western Canadian Select price discount.
Paramount’s development strategy at the Kaybob Montney Oil property is to grow production to approximately 14,000 Bbl/d, including 8,000 Bbl/d of oil production, maintain production at those levels and use the free cash flow from this property to help fund other developments. In 2018, the Company plans to drill up to 21 (21.0 net) wells.
Kaybob South Duvernay
The six (3.1 net) Duvernay well pad drilled and completed in 2017 continues to meet expectations, with average IP90 rates of 1,346 Boe/d (47 percent condensate). Drilling costs averaged $4.6 million per well ($842 per meter of total depth or $2,030 per meter of lateral length). Completion costs averaged $6.0 million for these wells ($147,000 per stage or $711 per tonne of proppant placed). This six-well pad tested two proppant loading intensities at approximately 55 meter stage spacing. Paramount’s development team is currently evaluating well performance to determine the optimal proppant loading intensity.
The Kaybob South Duvernay wells are processed through third-party facilities under firm agreements, coupled with firm-service transportation capacity for natural gas and downstream contracts for condensate and NGLs. Current capacity at the 15-28 compression and dehydration facility capacity is 40 MMcf/d, and
12

Paramount Resources Ltd. 2017 Annual Results
is expandable to 80 MMcf/d. Capacity up to 100 MMcf/d is secured at a downstream third-party plant to accommodate the incremental production should Paramount proceed with the expansion.
In 2018, the Company plans to drill up to 11 (5.6 net) South Duvernay wells on two multi-well pads and complete five (gross) of those wells in 2018, with the remaining wells to be completed in early 2019.
Kaybob Smoky River Duvernay
The 2018 program at the Kaybob Smoky River Duvernay property will see a new four (4.0 net) well pad drilled and brought on production in mid-2018. The wells are expected to have lateral lengths of approximately 2,700 meters and proppant loading intensities of 3.0 tonnes/meter.
This new four-well pad will produce to Paramount’s owned and operated Smoky River 6-16-64-21W5 natural gas processing plant (the ʺ6-16 Plantʺ), which will have approximately 12 MMcf/d of throughput capacity following some minor capital expenditures. The 6-16 Plant is pipeline connected to the TCPL system, where the Company has firm-service transportation capacity. Condensate will be trucked to the Company’s 12-10 Oil Battery, which is located about 15 miles east. NGLs will be trucked to Pembina’s Fox Creek terminal.
The 2018 Kaybob Smoky River Duvernay capital program is the first phase in a multi-phase development of the play. Phase Two will consist of further modifications to the 6-16 Plant to increase throughput capacity to over 20 MMcf/d, scheduled for the spring of 2019. Phase three of the development will include a condensate pipeline connection to the 8-9 Plant and some modifications and enhancements to the plant for handling Duvernay liquids.
The growth plan at Kaybob Smoky River Duvernay is supported by firm-service transportation capacity on the TCPL system and downstream contracts for condensate and NGLs.
13

Paramount Resources Ltd. 2017 Annual Results
CENTRAL ALBERTA AND OTHER REGION
The Central Alberta and Other Region includes multiple land and resource positions including Willesden Green and East Shale Basin Duvernay, Cardium, Glauconite and Ellerslie rights as well as approximately 176,000 net acres of fee simple lands.
The Company plans to drill a total of up to five (3.3 net) wells at Willesden Green and Leafland in 2018. The new wells will primarily produce through owned and operated infrastructure.
At the Zama property in northwest Alberta, the Company is restarting legacy wells and reconfiguring gathering systems to improve operational efficiencies. Sales volumes increased to approximately 1,300 Boe/d in the fourth quarter of 2017, including a year-over-year increase in oil production of 270 percent
CENTRAL ALBERTA AND OTHER REGION
14

Paramount Resources Ltd. 2017 Annual Results
from approximately 320 Bbl/d in the fourth quarter of 2016 to approximately 875 Bbl/d in the fourth quarter of 2017. These successful well reactivations underpin Paramount’s strategic objective of driving to a positive netback at Zama. Extending the productive life of the Zama field provides the Company with increased flexibility in managing long-term abandonment obligations associated with the property.
RESERVES AND FINDING & DEVELOPMENT COSTS
Paramount’s proved reserves, excluding reserves acquired through the Apache Canada Acquisition and the Trilogy Merger and after production, increased 56 percent to 92.7 MMBoe in 2017 compared to 59.6 MBoe in 2016. Proved plus probable reserves (ʺP+Pʺ), excluding the acquired reserves and after production, increased 34 percent to 153.9 MMBoe in 2017 compared to 115.2 MMBoe in 2016. The Company’s reserve replacement ratio, before acquisitions, was 5.3 times for proved reserves and 6.1 times for P+P reserves.
Reserves by Product
Total Company reserves at December 31, 2017 are as follows:
Proved (1)(2) Proved plus Probable (1)(2)
2017 2016 (3) % Change 2017 2016 (3) % Change
Natural gas (Bcf) 1,398.7 238.0 488 2,171.3 463.3 369
NGLs (MBbl) (4) 119,134 19,100 524 196,883 36,736 436
Light and medium crude oil (MBbl) 23,570 882 NM 34,714 1,219 NM
Total (MBoe) 375,824 59,645 530 593,473 115,173 415
(1) Readers are referred to the advisories concerning Oil and Gas Measures and Definitions in the Advisories section of this document.(2) Reserves evaluated, as applicable, by McDaniel and Associates Ltd. (ʺMcDanielʺ) as of December 31, 2017 and December 31, 2016 in accordance with
National Instrument 51-101 definitions, standards and procedures. Working interest reserves before royalty deductions. (3) The estimates of reserves and future net revenue for individual properties may not reflect the same confidence level as estimates of reserves and future net
revenue for all properties, due to the effects of aggregation.(4) Includes ethane, propane, butane and condensate.NM Not meaningful
Reserves by Category
The following table summarizes Paramount’s reserves by category as at December 31, 2017:
Gross Reserves (1)(2)
Future Net Revenue Net Present Value (1)(3)
Before Tax
Natural Gas NGLs (4)
Light & Medium
Crude Oil Total
($ millions)
Discount Rate
(Bcf) (MBbl) (MBbl) (MBoe) 0% 10% Proved
Developed Producing 635.2 30,924 12,234 149,032 1,475 1,129
Developed Non-producing 15.0 731 667 3,903 42 32
Undeveloped 748.5 87,479 10,669 222,890 3,161 1,303
Total Proved 1,398.7 119,134 23,570 375,824 4,678 2,464
Total Probable 772.5 77,749 11,144 217,648 4,373 1,889
Total Proved plus Probable 2,171.3 196,883 34,714 593,473 9,051 4,353
Columns may not add due to rounding. Working interest reserves before royalty deductions. The estimated net present values of future net revenue disclosed in this document do not represent fair market value. Revenues and expenditures were calculated based on McDaniel’s forecast prices and costs as of January 1, 2018.
Includes ethane, propane, butane and condensate.
15

Paramount Resources Ltd. 2017 Annual Results
Reserves Reconciliation
The following table provides a reconciliation of Paramount’s reserves for its existing properties for the year ended December 31, 2017 and the properties acquired through the Apache Canada Acquisition and the Trilogy Merger. Estimated reserves volumes for the Apache Canada and Trilogy properties at December 31, 2017 are comprised of estimated reserves acquired, plus extensions and discoveries ascribed to such properties as at December 31, 2017, less sales volumes from the closing date of each transaction to the end of the year.
Proved (1) Proved plus Probable (1)
Natural Gas
Oil & NGLs (2) Total
Natural Gas
Oil & NGLs (2) Total
(Bcf) (MBbl) (MBoe) (Bcf) (MBbl) (MBoe)
December 31, 2016 238.0 19,982 59,645 463.3 37,955 115,173
Extensions & discoveries 86.5 9,873 24,287 193.8 22,608 54,908
Technical revisions 59.0 12,005 21,837 (43.8) 5,697 (1,597)
Economic factors (4.2) (303) (1,003) (5.5) (374) (1,294)
Dispositions (18.2) (399) (3,433) (24.9) (561) (4,711)
Production excluding acquired properties (25.7) (4,324) (8,593) (25.7) (4,324) (8,592)
Total reserves before acquisitions 335.4 36,834 92,740 557.2 61,001 153,887
Acquisitions (3) 1,086.5 105,007 286,082 1,630.5 167,934 439,677
Extensions & discoveries – acquired properties 10.1 3,144 4,825 16.7 4,941 7,730
Production from acquired properties (33.2) (2,280) (7,822) (33.2) (2,280) (7,822)
December 31, 2017 1,398.7 142,704 375,824 2,171.3 231,597 593,473
(1) Columns and rows may not add due to rounding.(2) Condensate, light and medium crude oil and Other NGLs (3) Acquisition reserves volumes for the properties acquired through the Apache Canada Acquisition and the Trilogy Merger derived in accordance with National Instrument 51-101.
Includes estimated reserves volumes as at December 31, 2017 plus sales volumes from such properties from the closing date of each transaction to December 31, 2017.
Total P+P acquired volumes of 439.7 MMBoe are 13.7 MMBoe lower than total P+P volumes for Apache Canada and Trilogy as of the June 1, 2017 reserve evaluations prepared by McDaniel due to production between the date of the June report and the date Paramount acquired the entities. Reserves volumes for the Apache Canada Horn River dry gas property in northeast British Columbia were also reduced by approximately 3.7 MMBoe as a result of lower forecast natural gas prices.
Finding and Development Costs - Karr
The following table provides a calculation of finding and development costs (ʺF&Dʺ) for Paramount’s Karr property.
2017 Three- Year
Average (5) Karr Property Capital (2) Change in
FDC (3) Total F&D
Capital Reserves
Additions (4) F&D
($ millions) ($ millions) ($ millions) (MMBoe) ($/Boe) ($/Boe)
Proved (1) 329.5 195.4 524.9 38.9 13.48 13.38
Proved plus Probable (1) 329.5 281.8 611.3 52.2 11.72 10.09
(1) Readers are referred to the advisories concerning Non-GAAP Measures and Oil and Gas Measures and Definitions in the Advisories section of this document.(2) Aggregate exploration and development costs incurred for the year ended December 31, 2017. (3) Change in estimated future development costs from December 31, 2016 to December 31, 2017. (4) Reserves additions were calculated as the aggregate of extensions & discoveries, technical revisions and economic factors for the year ended December 31,
2017. Excludes acquisitions and dispositions. (5) Three-year average F&D costs are calculated using the aggregate capital costs, changes in future development capital and reserves additions over the three-
year period January 1, 2015 to December 31, 2017. Amounts for 2015 and 2016 were calculated on the same basis as for the year ended December 31, 2017.
16

Paramount Resources Ltd. 2017 Annual Results
Finding and development costs for Paramount’s expanded reserves base, including reserves acquired through the Apache Canada Acquisition and the Trilogy Merger, have not been presented because technical revisions and economic factors are not evaluated for acquired properties in the initial year of acquisition.
Future Development Costs
The following table summarizes the undiscounted future development costs incorporated in Paramount’s 2017 reserves evaluation:
(Undiscounted, $ millions) 2018 2019 2020 2021 2022 Remainder Total
Total Proved 406 755 742 695 460 90 3,148
Total Proved plus Probable 412 768 770 731 615 926 4,222
LAND
The following table sets forth Paramount’s land position:
December 31, 2017 December 31, 2016
(thousands of acres) Gross (1) Net (2) Gross (1) Net (2)
Acreage not assigned reserves 3,625 2,123 1,757 848
Acreage assigned reserves 1,251 775 288 152
Total 4,876 2,898 2,045 1,000
(1) "Gross" acres means the total acreage in which Paramount has an interest. Gross acreage is calculated only once per lease or license of petroleum and natural gas rights ("Lease") regardless of whether or not Paramount holds a working and/or royalty interest, or whether or not the Lease includes multiple prospective formations. If Paramount holds interests in different formations beneath the same surface location pursuant to separate leases, the acreage set out in each leaseis counted. Excludes oil sands lands associated with Cavalier Energy.
(2) "Net" acres means gross acres multiplied by Paramount’s working interest therein. Excludes oil sands lands associated with Cavalier Energy.
CORPORATE
To protect the Company’s cash flows and in support of its 2018 capital program, Paramount has entered into commodity hedges for 16,000 Bbl/d of liquids for fiscal 2018 at an average price of C$71.06/Bbl and 6,000 Bbl/d of liquids for fiscal 2019 at an average price of C$71.23/Bbl.
Paramount has arrangements in place to transport and sell approximately 60,000 GJ/d of natural gas at the Dawn natural gas hub in Ontario at $US NYMEX reference prices and 21,000 GJ/d of natural gas in California at $US Malin reference prices. The Company’s non-export natural gas sales volumes are sold in Alberta at Canadian dollar AECO reference prices.
Paramount’s revolving bank credit facility (the “Facility”) was increased by $500 million to $1.2 billion in March 2018. At Paramount’s request, the size of the Facility can be further increased by up to $300 million (to $1.5 billion) pursuant to an accordion feature in the Facility.
The Company has delivered a redemption notice to redeem all $300 million outstanding principal amount of its 7.25% senior unsecured notes due 2019. The redemption will be funded using the upsized Facility and completed in early April 2018.
17

Paramount Resources Ltd. 2017 Annual Results
For the year ended December 31, 2017, the Company recorded a non-cash write-down of $184.6 millionrelated to Paramount’s Liard Basin shale gas properties as a result of reduced activity and delays and cancellations of proposed third-party natural gas liquids terminals. There were no reserves assigned to thisearly-stage resource exploration project. Paramount also recorded a $130.2 million write-down of petroleumand natural gas properties in northeast British Columbia, primarily due to decreases in forecast natural gasprices.
In December 2017, Paramount implemented a normal course issuer bid under which the Company can purchase up to 7,497,530 Common Shares for cancellation. To date, the Company has purchased and cancelled 1,454,100 Common Shares at a total cost of $27.4 million.
18

Management’s Discussion and Analysis
For the year ended December 31, 2017

Paramount Resources Ltd. 2017 Annual Results
This Management’s Discussion and Analysis ("MD&A"), dated March 7, 2018, should be read in conjunction with the audited consolidated financial statements of Paramount Resources Ltd. ("Paramount" or the "Company") as at and for the year ended December 31, 2017 (the "Consolidated Financial Statements"). Financial data included in this MD&A has been prepared in accordance with International Financial Reporting Standards ("IFRS" or "GAAP") and is stated in millions of Canadian dollars, unless otherwise noted. The Company’s accounting policies have been applied consistently to all periods presented.
The disclosures in this document include forward-looking information, Non-GAAP measures and certain oil and gas measures. Readers are referred to the Advisories section of this document concerning such matters. Certain comparative figures have been reclassified to conform to the current years’ presentation. Additional information concerning Paramount, including its Annual Information Form, can be found on the SEDAR website at www.sedar.com.
ABOUT PARAMOUNT
Paramount is an independent, publicly traded, liquids-focused Canadian energy company that explores for and develops conventional and unconventional petroleum and natural gas resources. The Company also pursues long-term strategic exploration and pre-development plays and holds a portfolio of investments in other entities. Paramount’s principal properties are located in Alberta and British Columbia. The Company’s Class A Common Shares ("Common Shares") are listed on the Toronto Stock Exchange under the symbol "POU".
Paramount completed two major transactions in 2017, expanding its footprint in the Montney and Duvernay Deep Basin resource plays and materially increasing its inventory of undeveloped acreage in Western Canada. The Company has organized its expanded operations into three regions:
• the Grande Prairie Region, located in the Peace River Arch area of Alberta, which is focused onMontney developments at Karr, Wapiti and Resthaven / Jayar;
• the Kaybob Region, located in west-central Alberta, which is focused on Montney and Duvernaydevelopments at Kaybob, Smoky River, Pine Creek and Ante Creek; and
• the Central Alberta and Other Region, which includes Duvernay development plays in southernAlberta at Willesden Green and the East Shale Basin, and lands and production in northern Albertaand British Columbia.
Paramount also holds a portfolio of: (i) investments in other entities; (ii) investments in exploration and development stage assets, including oil sands and carbonate bitumen interests held by Paramount’s wholly-owned subsidiary Cavalier Energy ("Cavalier"), prospective shale gas acreage in the Liard and Horn River Basins (the "Shale Gas Project"); and (iii) drilling rigs owned by Paramount’s wholly-owned subsidiary, Fox Drilling Limited Partnership ("Fox Drilling").
20

Paramount Resources Ltd. 2017 Annual Results
2017 FINANCIAL AND OPERATING HIGHLIGHTS (1)(2)
2017 2016 2015
FINANCIAL
Petroleum and natural gas sales 491.4 248.8 376.8
Net income (loss) 183.4 1,165.3 (901.3)
per share – basic ($/share) 1.60 10.98 (8.52)
per share – diluted ($/share) 1.58 10.95 (8.52)
Adjusted funds flow 218.7 35.7 93.2
per share – basic ($/share) 1.90 0.34 0.88
per share – diluted ($/share) 1.89 0.34 0.88
Exploration and Development Capital (3) 527.6 187.5 457.3
Investments in other entities – market value (4) 53.3 208.7 130.8
Total assets 5,090.7 2,059.0 2,781.0
Long-term debt 701.8 – 1,750.2
Net debt (cash) 636.2 (565.9) 1,904.6
OPERATIONAL
Sales volumes
Natural gas (MMcf/d) 161.3 104.8 160.7
Condensate and oil (Bbl/d) 13,956 7,733 8,610
Other NGLs (Bbl/d) (5) 4,138 6,668 8,735
Total (Boe/d) 44,970 31,860 44,130
Net wells drilled (6) 36 12 11
ADJUSTED FUNDS FLOW ($/Boe)
Petroleum and natural gas sales 29.94 21.34 23.39
Royalties (1.50) (0.19) (0.64)
Operating expense (10.11) (8.32) (5.59)
Transportation and NGLs processing (7) (3.11) (4.84) (4.08)
Netback 15.22 7.99 13.08
Commodity contract settlements 0.88 3.91 0.78
Netback including commodity contract settlements 16.10 11.90 13.86
General and administrative (2.50) (2.22) (1.48)
Interest and financing expense (0.66) (6.74) (6.73)
Other 0.39 0.12 0.14
Adjusted funds flow 13.33 3.06 5.79
(1) Readers are referred to the advisories concerning Non-GAAP measures and Oil and Gas Measures and Definitions in the Advisories section of this document and to the reconciliations of such Non-GAAP measures to their most directly comparable measure under GAAP in the applicable sections of this document. This table contains the following Non-GAAP measures: Adjusted funds flow, Exploration and Development Capital, Investments in other entities – market value, Net debt (cash) and Netback.
(2) The results of operations and net assets of Apache Canada Ltd. are included in Paramount’s results following the Apache Canada Acquisition on August 16, 2017. The results of operations and net assets of Trilogy Energy Corp. are included in Paramount’s results following the clos ing of the Trilogy Merger on September 12, 2017.
(3) Exploration and Development Capital consists of property, plant and equipment and exploration expenditures excluding spending related to land and property acquisitions and corporate assets.
(4) Based on the period-end closing prices of publicly-traded investments and the book value of remaining investments. (5) Other NGLs include ethane, propane and butane.(6) Excludes wells drilled on lands associated with the disposed Musreau/Kakwa properties.(7) Includes downstream natural gas, NGLs and oil transportation costs and NGLs fractionation costs incurred by the Company.
21

Paramount Resources Ltd. 2017 Annual Results
CONSOLIDATED RESULTS
Net Income
Paramount recorded net income of $183.4 million for the year ended December 31, 2017 compared to net income of $1,165.3 million in the same period in 2016. Significant factors contributing to the change are shown below:
Year ended December 31, 2017
Net income – 2016 1,165.3
• Gain on Apache Canada Acquisition 548.9
• Income tax recovery in 2017 compared to income tax expense in 2016 295.0
• Higher Netback 156.8
• Lower interest and financing expense due to lower average debt during 2017 69.5
• Revaluation gain on Trilogy Shares owned by Paramount immediately prior to the Trilogy Merger 61.8
• Debt extinguishment expense in 2016 27.6
• Lower gain on sale of oil and gas assets in 2017 primarily due to the Musreau area asset sales in 2016 (1,256.0)
• Higher depletion and depreciation mainly due to higher sales volumes and net impairment charges of$89.9 million in 2017 compared to impairment reversals totaling $133.2 million in 2016
(357.7)
• Exploration and evaluation expense in 2017, including write-downs of $184.6 million related to the ShaleGas Project compared to income in 2016, which included a $99.2 million gain in respect of the CavalierRoyalty
(286.8)
• ARO Discount Rate Adjustment related to the Apache Canada Acquisition (158.2)
• Foreign exchange loss in 2017; the 2016 gain mainly related to US$450 million senior notes (44.0)
• Transaction and reorganization costs in 2017 related to the Apache Canada Acquisition and Trilogy Merger (30.5)
• Other (8.3)
Net income – 2017 183.4
On August 16, 2017, Paramount acquired all of the outstanding shares of Apache Canada Ltd. (ʺApache Canadaʺ) for total cash consideration of $486.9 million (the "Apache Canada Acquisitionʺ). Apache Canada was a wholly-owned subsidiary of a publicly traded U.S. based international oil and gas company. Apache Canada’s primary oil and gas assets were located at Wapiti, Kaybob and in Central Alberta.
On September 12, 2017, Paramount and Trilogy Energy Corp. (ʺTrilogyʺ) completed a merger transaction (the ʺTrilogy Mergerʺ) under which Paramount acquired all of the outstanding shares of Trilogy (ʺTrilogy Sharesʺ) not already owned by it in exchange for Common Shares, on the basis of one Common Share for every 3.75 Trilogy shares. Trilogy was, prior to the completion of the Trilogy Merger, a publicly traded petroleum and natural gas-focused Canadian energy corporation. Trilogy’s primary oil and gas assets were located in the Kaybob and Grande Prairie areas of Alberta.
Following the completion of the Apache Canada Acquisition, Apache Canada became a direct wholly-owned subsidiary of Paramount and upon completion of the Trilogy Merger, Trilogy became a direct wholly-owned subsidiary of Paramount. Paramount continued its operations on a combined basis with the operations of Apache Canada (renamed Paramount Resources (ACL) Ltd.) and Trilogy (renamed Paramount Resources (TEC) Ltd.), for the remainder of 2017. In January 2018, Paramount Resources Ltd. amalgamated with Paramount Resources (ACL) Ltd. and Paramount Resources (TEC) Ltd., with the amalgamated corporation continuing as Paramount Resources Ltd.
In April 2016, the Company sold its processing facilities at Musreau/Kakwa (the "Musreau Complex") and in August 2016, the Company sold the majority of its Musreau/Kakwa oil and gas properties (the "Musreau Assets"). In May 2017, Paramount closed the sale of its oil and gas properties in the Valhalla area (the
22

Paramount Resources Ltd. 2017 Annual Results
"Valhalla Assets"). When used herein, "Sold Assets" refers to the Musreau Complex, the Musreau Assets, the Valhalla Assets and other non-core property dispositions.
Paramount’s 2017 results include the results of operations of Paramount Resources (ACL) Ltd. (formerly Apache Canada) from August 16 (138 days) and Paramount Resources (TEC) Ltd.’s (formerly Trilogy) results of operations from September 12, 2017 (111 days).
Paramount recorded net income of $1,165.3 million for the year ended December 31, 2016 compared to a net loss of $901.3 million in the same period in 2015. Significant factors contributing to the change are shown below:
Year ended December 31, 2016
Net Loss – 2015 (901.3)
• Gain on the sale of oil and gas assets primarily due to the Musreau area asset sales in 2016 1,389.0
• Lower depletion and depreciation due to impairment reversals totaling $133.2 million and asset dispositionsin 2016 and because 2015 included impairment charges of $263.7 million 547.5
• Exploration and evaluation income in 2016 because of a $99.2 million gain recognized on the sale of theCavalier Royalty compared to an expense in 2015 which included $184.1 million of impairment charges 281.1
• Foreign exchange gain in 2016 compared to a loss in 2015, primarily related to the US$450 million seniornotes 104.8
• Lower write-downs of investments in securities 70.6
• Lower interest and financing expense due to lower average debt balances in 2016 30.3
• Income tax expense in 2016 compared to a recovery in 2015 (168.6)
• Lower Netback in 2016 mainly due to lower sales volumes and lower commodity prices (117.6)
• Lower gain on commodity contracts (52.5)
• Other (18.0)
Net Income – 2016 1,165.3
Adjusted Funds Flow (1)
The following is a reconciliation of Adjusted funds flow to the nearest GAAP measure:
2017 2016 2015
Cash from operating activities 126.3 45.7 84.3
Change in non-cash working capital 31.1 (15.9) (3.8)
Transaction and reorganization costs 30.5 – –
Geological and geophysical expenses 9.3 4.1 6.1
Asset retirement obligations settled 21.5 1.8 6.6
Adjusted funds flow 218.7 35.7 93.2
Adjusted funds flow ($/Boe) 13.33 3.06 5.79
(1) Refer to the advisories concerning non-GAAP measures in the Advisories section of this document.
23

Paramount Resources Ltd. 2017 Annual Results
Adjusted funds flow for the year ended December 31, 2017 was $218.7 million compared to $35.7 million for the same period in 2016. Significant factors contributing to the change are shown below:
Year ended December 31, 2017
Adjusted funds flow – 2016 35.7
• Higher Netback in 2017 mainly due to higher sales volumes and higher commodity prices 156.8
• Lower interest and financing expense due to lower average debt during 2017 67.8
• Lower receipts from commodity contract settlements in 2017 (31.2)
• Higher general and administrative expense mainly due to the Apache Canada Acquisition and TrilogyMerger
(15.2)
• Other 4.8
Adjusted funds flow – 2017 218.7
Adjusted funds flow for the year ended December 31, 2016 was $35.7 million compared to $93.2 million in 2015. Significant factors contributing to the change are shown below:
Year ended December 31, 2016
Adjusted funds flow – 2015 93.2
• Lower Netback in 2016 mainly due to lower sales volumes and lower commodity prices (117.6)
• Higher receipts from commodity contract settlements in 2016 33.0
• Lower interest and financing expense due to lower average debt balances in 2016 29.9
• Other (2.8)
Adjusted funds flow – 2016 35.7
OPERATING RESULTS
Netback
2017 2016
($/Boe) (1) ($/Boe) (1)
Natural gas revenue 132.8 2.26 82.1 2.14
Condensate and oil revenue 313.4 61.52 138.1 48.78
Other NGLs revenue (2) 40.5 26.80 27.4 11.24
Royalty and sulphur revenue 4.7 – 1.2 –
Petroleum and natural gas sales 491.4 29.94 248.8 21.34
Royalties (24.6) (1.50) (2.2) (0.19)
Operating expense (165.9) (10.11) (97.0) (8.32)
Transportation and NGLs processing (3) (51.0) (3.11) (56.5) (4.84)
Netback 249.9 15.22 93.1 7.99
Commodity contract settlements 14.4 0.88 45.6 3.91
Netback including commodity contract settlements 264.3 16.10 138.7 11.90
(1) Natural gas revenue shown per Mcf. (2) Other NGLs include ethane, propane and butane.(3) Includes downstream natural gas, NGLs and oil transportation costs and NGLs fractionation costs incurred by the Company.
Petroleum and natural gas sales were $491.4 million in 2017, an increase of $242.6 million from the prior year due to higher sales volumes and higher commodity prices. Petroleum and natural gas sales from Paramount Resources (ACL) Ltd. (formerly Apache Canada) and Paramount Resources (TEC) Ltd. (formerly Trilogy) since the closing date of each transaction to December 31, 2017 were $123.0 million and $66.4 million, respectively.
24

Paramount Resources Ltd. 2017 Annual Results
The impact of changes in sales volumes and prices on petroleum and natural gas sales are as follows:
Natural gas
Condensate and oil
Other NGLs
Royalty and Sulphur Total
Year ended December 31, 2016 82.1 138.1 27.4 1.2 248.8
Effect of changes in sales volumes 43.9 110.4 (10.5) – 143.8
Effect of changes in prices 6.8 64.9 23.6 – 95.3
Change in royalty and sulphur revenue – – – 3.5 3.5
Year ended December 31, 2017 132.8 313.4 40.5 4.7 491.4
Sales Volumes
Sales volumes for the year ended December 31, 2017 increased 41 percent to 44,970 Boe/d compared to 31,860 Boe/d in 2016. The increase was primarily due to incremental sales volumes resulting from the Apache Canada Acquisition and the Trilogy Merger and new production at Karr in the Grande Prairie Region, partially offset by lower sales volumes as a result of the dispositions of the Sold Assets. The increase in sales volumes in the Grande Prairie Region is primarily due to production from new Montney wells brought on production since late-2016. Sales volumes from the properties acquired through the Apache Canada Acquisition and Trilogy Merger totalled 7.8 MMBoe (approximately 21,430 Boe/d on an annual basis) since the closing of these transactions.
Paramount expects sales volumes to average approximately 100,000 Boe/d in 2018 with a 40-percent liquids weighting. The Company’s sales volumes are anticipated to remain at this level until production at Wapiti begins to increase in the spring of 2019 when 150 MMcf/d of new third-party gas processing capacity is scheduled to come on-stream. Operating costs through the 2018 period are estimated to be approximately $10.00 per Boe, with transportation costs expected to average $3.10 per Boe.
Year ended December 31
Natural gas (MMcf/d)
Condensate and Oil (Bbl/d)
Other NGLs (Bbl/d)
Total (Boe/d)
2017 2016 % Change 2017 2016 % Change 2017 2016 % Change 2017 2016 % Change
Grande Prairie 59.5 33.4 78 9,062 1,860 387 1,746 604 189 20,717 8,023 158
Kaybob 60.2 1.0 NM 3,160 146 NM 885 11 NM 14,073 323 NM
Central Alberta & Other
36.7 5.8 533 1,610 412 291 1,424 166 758 9,129 1,537 494
156.4 40.2 289 13,832 2,418 472 4,055 781 419 43,919 9,883 344
Sold Assets 4.9 64.6 (92) 124 5,315 (98) 83 5,887 (99) 1,051 21,977 (95)
Total 161.3 104.8 54 13,956 7,733 80 4,138 6,668 (38) 44,970 31,860 41
NM Not meaningful
25

Paramount Resources Ltd. 2017 Annual Results
Commodity Prices
2017 2016 % Change
Natural Gas
Paramount realized price ($/Mcf) 2.26 2.14 6
AECO daily spot ($/GJ) 2.04 2.05 -
AECO monthly index ($/GJ) 2.31 1.97 17
NYMEX (US$/MMbtu) 3.02 2.55 18
Malin (US$/MMbtu) 2.79 2.38 17
Crude Oil
Paramount average realized condensate & oil price ($/Bbl) 61.52 48.78 26
Edmonton Light Sweet ($/Bbl) 61.84 52.80 17
West Texas Intermediate (US$/Bbl) 50.95 43.32 18
Foreign Exchange $CDN / 1 $US
1.30 1.33 (2)
Paramount’s average realized natural gas price increased six percent in 2017 compared to the same period in 2016. Paramount’s natural gas portfolio primarily consists of sales priced at the Alberta, California and Eastern Canada markets and is sold in a combination of daily and monthly contracts. The Company has arrangements in place to transport and sell approximately 21,000 GJ/d of natural gas in California at prices based on the $US Malin reference prices. In the fourth quarter of 2017, the Company secured firm service transportation capacity for approximately 60,000 GJ/d of natural gas for delivery to the Dawn natural gas hub in Ontario, which is sold at $US NYMEX reference prices.
Paramount sells its condensate volumes in both stabilized and unstabilized condition, depending upon the location of production and the availability of stabilization capacity. Stabilized condensate volumes delivered through pipelines typically receive prices for condensate quoted at Edmonton, which are generally higher than prices for unstabilized condensate volumes, and are adjusted for applicable transportation, quality and density differentials. Prices for unstabilized condensate volumes trucked to terminals are based on crude oil or condensate prices quoted at Edmonton, depending on the terminal to which volumes are delivered, and are adjusted for transportation, quality and density differentials.
The Company’s average realized condensate and oil price increased 26 percent in 2017 compared to the same period in 2016. The increase in Paramount’s realized price was greater than increases in benchmark prices mainly as a result of the addition of condensate and oil production from Apache Canada and Trilogy since the closing of these transactions in the third quarter of 2017, which coincided with an increase to benchmark prices in the fourth quarter of 2017 compared to the first three quarters of 2017.
26

Paramount Resources Ltd. 2017 Annual Results
Commodity Price Management
From time-to-time Paramount uses financial commodity price contracts to manage exposure to commodity price volatility. Changes in the fair value of the Company’s risk management assets and liabilities are as follows:
Year ended December 31 2017 2016
Fair value, beginning of period (5.2) 40.2
Changes in fair value, net (4.1) 0.2
Settlements received (14.4) (45.6)
Assumed on Trilogy Merger 4.6 –
Fair value, end of period (19.1) (5.2)
At December 31, 2017 the Company had the following financial commodity contracts outstanding:
Subsequent to December 31, 2017, the Company entered into the following financial commodity contracts:
Instruments Aggregate notional Average fixed price Term
Oil – NYMEX WTI Swaps (Sale) 6,000 Bbl/d CDN$71.23/Bbl January 2019 – December 2019
Royalties
Year ended December 31 2017 Rate 2016 Rate
Royalties 24.6 5.0% 2.2 0.9%
$/Boe 1.50 0.19
Royalties increased $22.4 million to $24.6 million in 2017 compared to $2.2 million in 2016, primarily due to the Apache Canada Acquisition and the Trilogy Merger and increased production at Karr. Applicable royalty rates for Apache Canada and Trilogy sales volumes are higher than Paramount’s average royalty rates prior to the transactions, resulting in an increase to overall royalty rates for the Company in 2017. Following the Apache Canada Acquisition and Trilogy Merger, a lower proportion of the Company’s sales volumes benefit from royalty incentive programs.
Operating Expense
Year ended December 31 2017 2016 % Change
Operating expense 165.9 97.0 71
$/Boe 10.11 8.32 22
Operating expense increased by $68.9 million in 2017 to $165.9 million compared to $97.0 million in 2016. This increase was primarily due to incremental operating expenses in 2017 as a result of the Apache Canada Acquisition and Trilogy Merger and higher production at Karr, partially offset by lower operating costs due to the dispositions of the Sold Assets in 2016.
Instruments Aggregate notional Average fixed price Fair Value Term
Oil – NYMEX WTI Swaps (Sale) 16,000 Bbl/d CDN$71.06/Bbl (19.1) January 2018 – December 2018
27

Paramount Resources Ltd. 2017 Annual Results
Transportation and NGLs Processing
Year ended December 31 2017 2016 % Change
Transportation and NGLs processing 51.0 56.5 (10)
$/Boe 3.11 4.84 (36)
Transportation and NGLs processing includes the costs of downstream natural gas, NGLs and oil transportation and NGLs fractionation costs incurred by the Company.
Transportation and NGLs processing was $51.0 million in 2017, a decrease of $5.5 million compared to 2016. The decrease was primarily as a result of the sale of the Musreau Assets in 2016, partially offset by higher current year pipeline and trucking costs at Karr due to increased production and the impact of the Apache Canada Acquisition and the Trilogy Merger. Paramount expects the majority of liquids production at Karr to be trucked until mid-2018, when the expansion of condensate stabilization capacity at a third-party facility is completed. The Company has contracted a dedicated fleet of trucks and 24-hour logistical services over this period to provide egress for liquids production.
Other Operating Items
Year ended December 31 2017 2016
Depletion and depreciation (excluding impairment / de-impairment) (344.3) (209.7)
(Impairment) de-impairment of property plant and equipment (89.9) 133.2
Gain on sale of oil and gas assets 124.0 1,380.0
Exploration and evaluation expense (excluding write-downs) (18.2) (24.1)
Exploration and evaluation income – Cavalier Royalty – 99.2
Exploration and evaluation – write-down (196.6) (3.0)
Depletion and depreciation expense increased to $344.3 million ($20.98 per Boe) in 2017 compared to $209.7 million ($17.98 Boe) in 2016, primarily due to higher sales volumes and higher depletion rates in 2017.
At December 31, 2017, the Company recorded an impairment write-down of $122.1 million related to petroleum and natural gas assets for the northern properties within the Central Alberta and Other region (the "Northern CGU"). The impairment write-down was recorded because the carrying value of the Northern CGU exceeded its recoverable amount, which was estimated based on expected net discounted future cash flows from the production of proved and probable reserves. The impairments resulted from a combination of decreases in estimated future net revenues due to lower forecasted natural gas prices and higher well costs than reserves values assigned.
The Company also recorded a $42.1 million reversal of previously recorded impairment charges in the first quarter of 2017 related to the Valhalla area prior to the sale of the property in May 2017. The reversal represented the amount required to increase the carrying value of the Valhalla Assets to the amount that would have been determined, net of depletion and amortization, had no impairment charges been recognized in prior periods.
For the year ended December 31, 2016, the Company recorded a $133.2 million reversal of previously recorded impairment charges related to petroleum and natural gas assets in Grande Prairie. The impairment reversal was primarily due to increased development activities at Karr, including enhanced well performance and improved economic conditions and other factors.
28

Paramount Resources Ltd. 2017 Annual Results
Paramount closed the sale of the Valhalla Assets in May 2017 for gross cash proceeds of $151.3 million, resulting in the recognition of a gain on sale of $81.4 million. The Valhalla Assets encompassed approximately 94 (74 net) sections of land and had average sales volumes of approximately 1,400 Boe/d in 2017 prior to being sold. In September 2017, Paramount closed the sale of its oil and gas properties in the Saddle Hills/Mirage area of Alberta for cash and other proceeds of $8.2 million and recorded a gain on sale of $27.4 million.
In April 2016, Paramount sold the Musreau Complex and recorded a gain of $125.7 million. In August 2016, Paramount sold the Musreau Assets and recorded a gain on sale of $1.2 billion.
In December 2016, Cavalier granted a royalty (the "Cavalier Royalty") on its oil sands lands to an unrelated third-party for cash consideration of $100 million. A gain on sale of $99.2 million was recorded in respect of the sale, which is included in the exploration and evaluation expense (income) for the year ended December 31, 2016.
Exploration and evaluation ("E&E") write-downs for the year ended December 31, 2017 included $184.6 million of write-downs resulting from the de-recognition of the carrying value of the E&E assets related to the Shale Gas Project. The write-down of the Shale Gas Project was due to, among other factors, the suspension of development activities by the Company and other operators in the region and delays and cancellations of proposed downstream third-party liquid natural gas terminals to transport shale gas production to international markets.
INVESTMENTS IN SECURITIES
Paramount’s investments in other entities are summarized as follows:
Carrying Value Market Value (1)
As at December 31 2017 (2) 2016 2017 (2) 2016
Trilogy (2) – 44.1 – 144.5
MEG 19.0 34.2 19.0 34.2
Other (3) 34.3 30.0 34.3 30.0
Total 53.3 108.3 53.3 208.7
(1) Based on the period-end closing price of publicly traded investments and the book value of remaining investments.(2) On September 12, 2017, Paramount acquired all of the outstanding Trilogy Shares not already owned by it pursuant to the Trilogy Merger. As a result, no carrying
value or market value is shown as at December 31, 2017, as Trilogy’s results of operations and net assets have been reflected in Paramount’s consolidated financial statements.
(3) Includes investments in Blackbird Energy Inc., Marquee Energy Ltd., Storm Resources Ltd., Strategic Oil & Gas Ltd. and other public and private corporations.
OTHER ASSETS
Fox Drilling
Fox Drilling owns seven triple-sized rigs, including four walking rigs. The walking rigs have the capability of moving across a lease with the derrick and drill pipe remaining vertical, significantly increasing efficiencies on multi-well pads. The Fox Drilling rigs are being deployed on the Company’s lands in 2018.
Shale Gas Project
With the completion of the Company’s drilling program at the Shale Gas Project in 2016, Paramount secured its mineral rights in the region for up to another 10 years. The Company has drilled a total of 4 (4.0 net) exploration wells in the Liard Basin for delineation and land retention purposes. Future development
29

Paramount Resources Ltd. 2017 Annual Results
activities at the Shale Gas Project will depend upon the advancement of proposed downstream third-party liquid natural gas terminals, project economics and other factors.
Cavalier Energy
Cavalier was created in 2011 to be a self-funding entity that would develop the Company’s oil sands resources. Cavalier held approximately 206,000 net acres of Crown leases in the Western Athabasca region of Alberta as at December 31, 2017.
No significant additional expenditures are planned for Cavalier in the near term. Cavalier’s oil sands resources are at the early stages of their evaluation and development, currently have no production, and there are no assurances that Cavalier will commence production, generate earnings, operate profitably or provide a return on investment at any time in the future.
The agreement governing the Cavalier Royalty does not impose any development commitments on Cavalier, nor does it impose any terms or conditions on the use of the consideration paid for the Cavalier Royalty.
CORPORATE
Year ended December 31 2017 2016
General and administrative (41.1) (25.9)
Share-based compensation (17.8) (27.8)
Interest and financing (10.8) (80.3)
Debt extinguishment – (27.6)
Foreign exchange 0.3 (43.7)
Revaluation of Trilogy Shares 61.8 –
Income (loss) from equity-accounted investments 1.9 (14.3)
Write-down of investments in securities (12.6) (11.2)
Decrease in market value of securities distributed (10.5) –
Transaction and reorganization costs (30.5) – Gain on Apache Canada Acquisition 548.9 –
ARO Discount Rate Adjustment (158.2) –
General and administrative expenses were higher in 2017 primarily as a result of the impact of the Apache Canada Acquisition and the Trilogy Merger. Share-based compensation expense in 2016 included $13.8 million related to options cancelled in the second quarter of 2016.
Interest and financing expense was $10.8 million in 2017, a decrease of $69.5 million from 2016, primarily as a result of lower average debt balances. Debt extinguishment expense of $27.6 million was recorded in 2016 due to the redemption of the Company’s $450 million 7⅝ percent senior notes due 2019 and the assumption of the Company’s US$450 million 6⅞ percent senior notes due 2023 (the "2023 Notes") by the acquirer of the Musreau Assets.
The foreign exchange gain in 2016 mainly related to the 2023 Notes, which were outstanding until August 2016.
The carrying value of the 19.1 million Trilogy shares held by Paramount immediately prior to the Trilogy Merger was increased to fair value, resulting in the recognition of a gain of $61.8 million in 2017. The Company recorded equity earnings of $1.9 million prior to the closing of the Trilogy Merger.
30

Paramount Resources Ltd. 2017 Annual Results
The aggregate write-downs of investments in securities of $12.6 million in 2017 and $11.2 million in 2016resulted from decreases in the market value of certain of the Company’s publicly traded investments.
In December 2016, the Company’s Board of Directors declared a dividend of the Company’s remaining 3.8 million class A common shares of Seven Generations Energy Ltd. ("7Gen Shares") to holders of record of Paramount’s Common Shares on January 9, 2017. The decrease in the fair value of the 7Gen Shares of $10.5 million between the acquisition date and the date of the dividend, January 16, 2017, was reclassified to net income from accumulated other comprehensive income.
Transaction and reorganization costs in 2017 relate to costs incurred in respect of the Apache Canada Acquisition and the Trilogy Merger and the recognition of a provision for unutilized office space due to the relocation of Paramount’s corporate office following these transactions.
The $548.9 million gain recognized in respect of the Apache Canada Acquisition is substantially attributable to the undiscounted nature of the deferred tax asset recognized in the purchase allocation. Asset retirement obligations in respect of Apache Canada and Trilogy were initially recognized based on a credit adjusted discount rate and subsequently re-measured in accordance with Paramount’s accounting policy to reflect the discounting of such amounts using a risk-free discount rate (the ʺARO Discount Rate Adjustmentʺ). The ARO Discount Rate Adjustment resulted in an increase to the carrying value of property, plant and equipment, except for properties with a nil carrying value, where the corresponding amount related to the ARO Discount Rate Adjustment was recorded as a charge to net income. As a result of the ARO Discount Rate Adjustment, a charge of $158.2 million was recorded in net income for the year ended December 31, 2017.
Tax Pools
As of December 31, 2017, Paramount had tax pools of approximately $3.5 billion in respect of non-capital losses and scientific research and experimental development, $1.3 billion in respect of Canadian resource pools and undepreciated capital cost and $0.1 billion in respect of financing costs and other.
PROPERTY, PLANT AND EQUIPMENT AND EXPLORATION EXPENDITURES
2017 2016
Drilling, completion and tie-ins 451.7 167.9
Facilities and gathering 75.9 19.6
Exploration and Development Capital (1) 527.6 187.5
Land and property acquisitions 13.3 11.0
Exploration and Development Capital including land & property acquisitions 540.9 198.5
Corporate 4.2 2.5
545.1 201.0
(1) Exploration and Development Capital consists of property, plant and equipment and exploration expenditures excluding spending related to land and property acquisitions and corporate assets.
Exploration and Development Capital was $527.6 million in 2017 compared to $187.5 in in 2016. Current year expenditures include $37.0 million related to Apache Canada and $41.7 million related to Trilogy following the closing of each of the transactions.
Expenditures in 2017 were mainly related to drilling and completion programs at Karr, Resthaven and Birch, and the 6-18 compression and dehydration facility (the ʺ6-18 Facilityʺ) expansion at Karr. Expenditures in 2017 related to properties acquired with Apache Canada and Trilogy primarily related to drilling and completion programs at the Montney oil field in the Kaybob Region and at Wapiti in the Grande Prairie Region.
31

Paramount Resources Ltd. 2017 Annual Results
Development activities in 2017 were primarily focused on the 27 (27.0) well horizontal Montney drilling and completion program at Karr in the Grande Prairie Region, which commenced in mid-2016 (the Karr Programʺ) and the expansion of the 6-18 Facility. All 27(27.0 net) wells from the Karr Program were drilled and completed by the end of 2017. In April 2017, Paramount completed the expansion of the 6-18 Facility,doubling its capacity to 80 MMcf/d. The total cost of the expansion was approximately $40 million.
At Resthaven / Jayar, the 2016/17 program included five (4.5 net) Cretaceous wells and one (1.0 net) Montney well. Because of the exploratory nature of this program, drilling operations took longer than planned, resulting in approximately $10 million of additional drilling costs. The Company completed the Montney well, which was drilled in the northern portion of the Resthaven property, and brought it on production. The Company is monitoring the longer-term performance of this well and may accelerate the development of the Montney in this area.
At the Kaybob South Duvernay property, the Company completed a new six (3.1 net) well pad that had been drilled by Apache Canada prior to the closing of the Apache Canada Acquisition and brought it on production.
At the non-operated Birch property in northeast British Columbia, drilling operations concluded with nine (4.5 net) Montney wells being rig released. The expansion of the Birch compression and dehydration facility to 40 MMcf/d (20 MMcf/d net) was completed in the third quarter of 2017.
Capital expenditures for 2018 are expected to be approximately $600 million including exploration, optimization and maintenance programs, excluding acquisitions, divestitures and abandonment and reclamation activities. Approximately $200 million of the 2018 capital program is related to projects that will bring new production on-stream in 2019, including $142 million to drill and complete wells in the Wapiti area in preparation for the startup of the third-party Wapiti natural gas processing plant in 2019. In addition, the Company intends to spend approximately $28 million on abandonment and reclamation activities in 2018.
Wells drilled were as follows:
2017 2016
Gross (1) Net (2) Gross (1) Net (2)
Natural gas 35 28 12 12
Oil 8 8 – –
Total 43 36 12 12
(1) Gross is the number of wells in which Paramount has a working interest. Excludes wells drilled on lands associated with the disposed Musreau Assets. (2) Net is the aggregate number of wells obtained by multiplying each gross well by Paramount’s percentage of working interest. Excludes wells drilled on lands
associated with the disposed Musreau Assets.
32
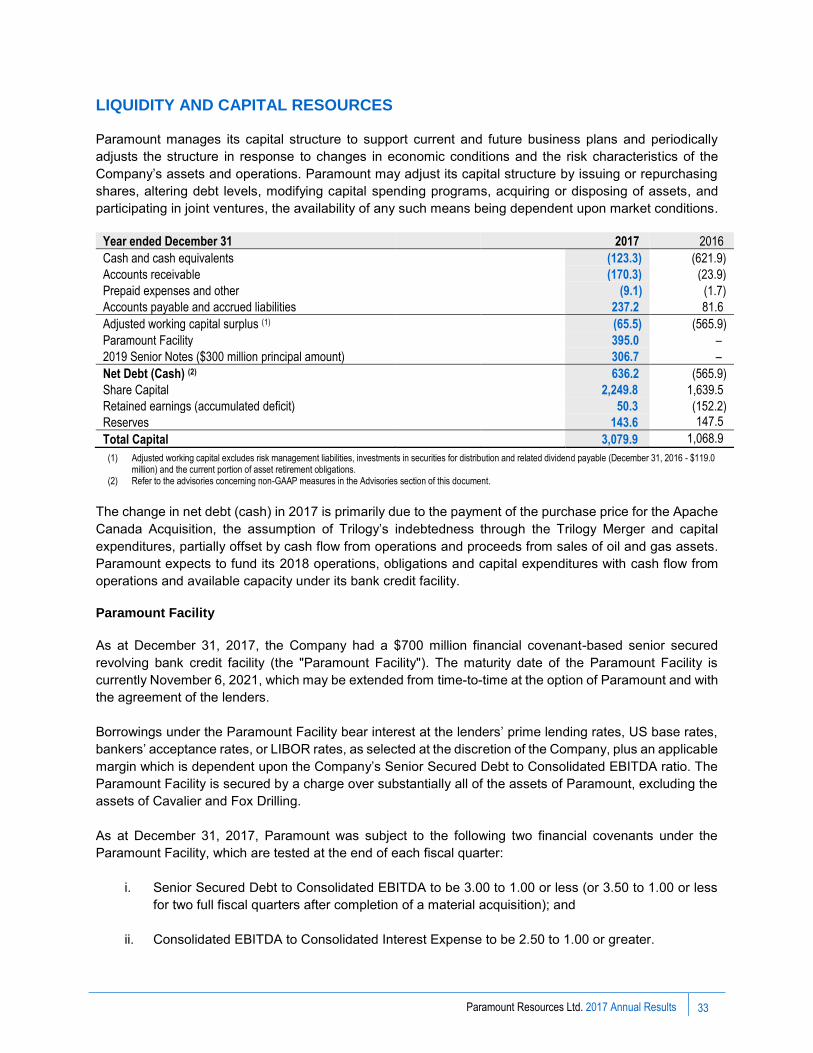
Paramount Resources Ltd. 2017 Annual Results
LIQUIDITY AND CAPITAL RESOURCES
Paramount manages its capital structure to support current and future business plans and periodically adjusts the structure in response to changes in economic conditions and the risk characteristics of the Company’s assets and operations. Paramount may adjust its capital structure by issuing or repurchasing shares, altering debt levels, modifying capital spending programs, acquiring or disposing of assets, and participating in joint ventures, the availability of any such means being dependent upon market conditions.
Year ended December 31 2017 2016
Cash and cash equivalents (123.3) (621.9)
Accounts receivable (170.3) (23.9)
Prepaid expenses and other (9.1) (1.7)
Accounts payable and accrued liabilities 237.2 81.6
Adjusted working capital surplus (1) (65.5) (565.9)
Paramount Facility 395.0 –
2019 Senior Notes ($300 million principal amount) 306.7 –
Net Debt (Cash) (2) 636.2 (565.9)
Share Capital 2,249.8 1,639.5
Retained earnings (accumulated deficit) 50.3 (152.2)
Reserves 143.6 147.5
Total Capital 3,079.9 1,068.9
(1) Adjusted working capital excludes risk management liabilities, investments in securities for distribution and related dividend payable (December 31, 2016 - $119.0 million) and the current portion of asset retirement obligations.
(2) Refer to the advisories concerning non-GAAP measures in the Advisories section of this document.
The change in net debt (cash) in 2017 is primarily due to the payment of the purchase price for the Apache Canada Acquisition, the assumption of Trilogy’s indebtedness through the Trilogy Merger and capital expenditures, partially offset by cash flow from operations and proceeds from sales of oil and gas assets. Paramount expects to fund its 2018 operations, obligations and capital expenditures with cash flow from operations and available capacity under its bank credit facility.
Paramount Facility
As at December 31, 2017, the Company had a $700 million financial covenant-based senior secured revolving bank credit facility (the ʺParamount Facilityʺ). The maturity date of the Paramount Facility is currently November 6, 2021, which may be extended from time-to-time at the option of Paramount and with the agreement of the lenders.
Borrowings under the Paramount Facility bear interest at the lenders’ prime lending rates, US base rates, bankers’ acceptance rates, or LIBOR rates, as selected at the discretion of the Company, plus an applicable margin which is dependent upon the Company’s Senior Secured Debt to Consolidated EBITDA ratio. The Paramount Facility is secured by a charge over substantially all of the assets of Paramount, excluding the assets of Cavalier and Fox Drilling.
As at December 31, 2017, Paramount was subject to the following two financial covenants under the Paramount Facility, which are tested at the end of each fiscal quarter:
i. Senior Secured Debt to Consolidated EBITDA to be 3.00 to 1.00 or less (or 3.50 to 1.00 or lessfor two full fiscal quarters after completion of a material acquisition); and
ii. Consolidated EBITDA to Consolidated Interest Expense to be 2.50 to 1.00 or greater.
33

Paramount Resources Ltd. 2017 Annual Results
Senior Secured Debt currently consists of amounts drawn under the Paramount Facility and the undrawn face amount of outstanding letters of credit.
Consolidated EBITDA is determined on a trailing twelve month basis, is adjusted for material acquisitions and dispositions, and is generally calculated as net income before Consolidated Interest Expense, taxes, depletion, depreciation, amortization, impairment and exploration and evaluation expense and is also adjusted to exclude non-recurring items and other non-cash items including unrealized mark-to-market amounts on derivatives, unrealized foreign exchange, share-based compensation expense and accretion.
Consolidated Interest Expense is reduced by any interest income and other customary exclusions and is calculated on a trailing twelve-month basis.
Paramount is in compliance with all covenants under the Paramount Facility.
At December 31, 2017, $395.0 million was drawn on the Paramount Facility. Paramount had undrawn letters of credit outstanding totaling $36.6 million at December 31, 2017 that reduce the amount available to be drawn on the Paramount Facility.
In March 2018, the Paramount Facility was increased by $500 million to $1.2 billion and the Senior Secured Debt to Consolidated EBITDA financial covenant in such facility was amended as follows:
• Senior Secured Debt to Consolidated EBITDA to be 3.50 to 1.00 or less (or 4.00 to 1.00 or lessfor two full fiscal quarters after completion of a material acquisition).
At Paramount’s request, the size of the Paramount Facility can be further increased by up to $300 million (to $1.5 billion) pursuant to an accordion feature in such facility, subject to securing incremental lender commitments.
In March 2018, the Company delivered a redemption notice to redeem all $300 million outstanding principal amount of its 7¼% senior unsecured notes due December 2019 (the ʺ2019 Senior Notesʺ). The redemption will be funded using the upsized Paramount Facility and completed in early April 2018.
Senior Unsecured Notes
Paramount has $300 million outstanding principal amount of senior unsecured notes due 2019. The 2019 Senior Notes were issued by Trilogy in late 2012 and became Paramount’s notes through its acquisition of, and subsequent amalgamation with, Trilogy.
The 2019 Senior Notes bear interest at 7¼% per annum, payable semi-annually in arrears on June 13 and December 13 of each year, and mature on December 13, 2019.
As of January 1, 2018, the 2019 Senior Notes were direct senior unsecured obligations of Paramount. The 2019 Senior Notes are redeemable in whole or in part at par, plus accrued and unpaid interest to the date of redemption, plus a redemption premium, if applicable, which varies based on the date of redemption.
Trilogy Facility
At closing of the Trilogy Merger on September 12, 2017, Trilogy had a $285 million senior secured revolving credit facility with a syndicate of Canadian banks (the ʺTrilogy Facilityʺ). In November 2017, the Trilogy Facility was repaid in full and cancelled.
34

Paramount Resources Ltd. 2017 Annual Results
Share Capital
In September 2017, Paramount issued 28,537,134 Common Shares pursuant to the Trilogy Merger.
On December 19, 2017, Paramount implemented a normal course issuer bid (the ̋ 2018 NCIBʺ) under which the Company can purchase up to 7,497,530 Common Shares for cancellation. Any shareholder may obtain, for no charge, a copy of the notice in respect of the 2018 NCIB filed with the TSX by contacting the Company at 403-290-3600. Between January 1, 2018 and March 7, 2018, the Company purchased and cancelled 1,454,100 Common Shares at a total cost of $27.4 million under the 2018 NCIB. The 2018 NCIB terminates on the earlier of: (i) December 21, 2018; and (ii) the date on which the maximum number of Common Shares that can be acquired are purchased.
Paramount previously implemented a normal course issuer bid on October 12, 2016 (the ʺ2016 NCIB”). The Company purchased and cancelled 622,900 Common Shares in 2016 at a total cost of $9.7 million under the 2016 NCIB. The 2016 NCIB expired on October 12, 2017.
At December 31, 2017, Paramount had 134,712,907 Common Shares outstanding (net of 345,904 Common Shares held in trust under the Company’s restricted share unit plan) and 10,028,920 options to acquire Common Shares outstanding, of which 1,986,388 options are exercisable.
FOURTH QUARTER 2017 RESULTS
Netback
Three months ended December 31 2017 2016
($/Boe) (1) ($/Boe) (1)
Natural gas revenue 69.9 2.11 13.5 3.10
Condensate and oil revenue 161.2 66.65 16.4 60.49
Other NGLs revenue (2) 25.4 30.15 2.1 22.16
Royalty and sulphur revenue 2.4 – 0.3 –
Petroleum and natural gas sales 258.9 29.49 32.3 29.52
Royalties (16.8) (1.92) (0.1) (0.08)
Operating expense (86.1) (9.81) (10.9) (10.00)
Transportation and NGLs processing (3) (24.3) (2.77) (4.3) (3.91)
Netback 131.7 14.99 17.0 15.53
Commodity contract settlements 3.7 0.42 8.2 7.54
Netback including commodity contract settlements 135.4 15.41 25.2 23.07
(1) Natural gas revenue shown per Mcf. (2) Other NGLs includes ethane, propane and butane.(3) Includes downstream natural gas, NGLs and oil transportation costs and NGLs fractionation costs incurred by the Company.
Fourth quarter 2017 petroleum and natural gas sales were $258.9 million, an increase of $226.6 million from the fourth quarter of 2016, primarily due to higher sales volumes and higher liquids prices, partially offset by lower natural gas prices.
The increases in sales volumes, royalties, operating expense and transportation and NGLs processing in the fourth quarter of 2017 compared to the same period in 2016 were primarily due to incremental production resulting from the Apache Canada Acquisition and the Trilogy Merger and new production at Karr in the Grande Prairie region.
35

Paramount Resources Ltd. 2017 Annual Results
The impact of changes in sales volumes and prices on petroleum and natural gas sales are as follows:
Natural gas
Condensate and oil
Other NGLs
Royalty and Sulphur Total
Three months ended December 31, 2016 13.5 16.4 2.1 0.3 32.3
Effect of changes in sales volumes 89.0 129.9 16.5 – 235.4
Effect of changes in prices (32.6) 14.9 6.8 – (10.9)
Change in royalty and sulphur revenue – – – 2.1 2.1
Three months ended December 31, 2017 69.9 161.2 25.4 2.4 258.9
Sales Volumes
Sales volumes increased 702 percent to 95,412 Boe/d in the fourth quarter of 2017 compared to 11,901 Boe/d in the same period in 2016. The increase was primarily due to incremental sales volumes resulting from the Apache Canada Acquisition and the Trilogy Merger and new production at Karr in the Grande Prairie Region.
Commodity Prices
Key monthly average commodity price benchmarks and foreign exchange rates are as follows:
Three months ended December 31 2017 2016 % Change
Natural Gas
Paramount realized price ($/Mcf) 2.11 3.10 (32)
AECO daily spot ($/GJ) 1.60 2.93 (45)
AECO monthly index ($/GJ) 1.85 2.62 (29)
NYMEX (US$/MMbtu) 2.92 3.18 (8)
Malin (US$/MMbtu) 2.70 3.02 (11)
Crude Oil
Paramount average realized condensate & oil price ($/Bbl) 66.65 60.49 10
Edmonton Light Sweet ($/Bbl) 65.68 60.76 8
West Texas Intermediate (US$/Bbl) 55.40 49.29 12
Foreign Exchange
$CDN / 1 $US 1.27 1.33 (5)
Three months ended December 31
Natural gas (MMcf/d)
Condensate and Oil (Bbl/d)
Other NGLs (Bbl/d)
Total (Boe/d)
2017 2016 % Change 2017 2016 % Change 2017 2016 % Change 2017 2016 % Change
Grande Prairie 93.7 31.9 194 13,146 2,263 481 3,026 784 286 31,791 8,357 280
Kaybob 176.3 0.8 NM 9,531 121 NM 2,625 10 NM 41,531 271 NM
Central Alberta & Other
89.9 4.8 NM 3,608 373 NM 3,498 145 NM 22,090 1,312 NM
359.9 37.5 860 26,285 2,757 853 9,149 939 874 95,412 9,940 860
Sold Assets – 10.0 (100) – 186 (100) – 107 (100) – 1,961 (100)
Total 359.9 47.5 658 26,285 2,943 793 9,149 1,046 775 95,412 11,901 702
NM Not meaningful
36

Paramount Resources Ltd. 2017 Annual Results
Net Income (Loss)
Three months ended December 31 2017 2016
Petroleum and natural gas sales 258.9 32.4
Royalties (16.8) (0.1)
Revenue 242.1 32.3
Loss on financial commodity contracts (21.5) (6.3)
220.6 26.0
(Expenses) Income
Operating expense (86.1) (10.9)
Transportation and NGLs processing (24.3) (4.3)
General and administrative (18.7) (6.5)
Share-based compensation (9.3) (3.6)
Depletion and depreciation (309.5) 112.0
Exploration and evaluation (208.0) 93.6
Gain on sale of oil and gas assets 10.0 9.6
Interest and financing (8.5) (5.5)
Accretion of asset retirement obligations (9.3) (1.0)
Foreign exchange 0.4 (0.2)
Debt extinguishment – (9.3)
Transaction and reorganization costs (16.1) –
Gain on Apache Canada Acquisition 182.9 –
ARO Discount Rate Adjustment 65.2 –
Loss from equity-accounted investments – (2.7)
Gain on sale of investment in securities – 3.4
Income tax recovery 102.0 11.1
Other 2.5 0.7
(326.8) 186.4
Net income (loss) (106.2) 212.4
37

Paramount Resources Ltd. 2017 Annual Results
Paramount recorded a net loss of $106.2 million for the three months ended December 31, 2017, which included $184.6 million of write-downs related to the Shale Gas Project and $132.0 million of impairment charges related to petroleum and natural gas assets in the Northern CGU. Net income of $212.4 millionwas recorded in the same period of 2016. Significant factors contributing to the change are shown below:
Three months ended December 31, 2017
Net income – 2016 212.4
• Gain on Apache Canada Acquisition 182.9
• Higher Netback primarily due to higher sales volumes 114.7
• Higher income tax recovery in 2017 90.9
• ARO Discount Rate Adjustment related to the Apache Canada Acquisition 65.2
• Higher depletion and depreciation mainly due to higher sales volumes and impairment charges totaling$132.0 million in 2017 compared to impairment reversals totaling $133.2 million in 2016
(421.6)
• Exploration and evaluation expense in 2017 including the $184.6 million write-down related to the ShaleGas Project compared to income in 2016 which included a $99.2 million gain in respect of the CavalierRoyalty
(301.7)
• Transaction and reorganization costs in 2017 related to the Apache Canada Acquisition and Trilogy Merger (16.1)
• Higher loss on commodity contracts in 2017 (15.2)
• Higher general and administrative costs mainly due to the Apache Canada Acquisition and Trilogy Merger (12.2)
• Other (5.5)
Net loss – 2017 (106.2)
Adjusted Funds Flow (1)
The following is a reconciliation of Adjusted funds flow to the nearest GAAP measure:
Three months ended December 31 2017 2016
Cash from (used in) operating activities 43.4 (6.4)
Change in non-cash working capital 36.8 19.6
Transaction and reorganization costs 16.1 –
Geological and geophysical expenses 4.8 0.2
Asset retirement obligations settled 9.0 0.9
Adjusted funds flow 110.1 14.3
Adjusted funds flow ($/Boe) 12.55 13.10
Adjusted funds flow ($/share - diluted) 0.82 0.13
(1) Refer to the advisories concerning non-GAAP measures in the Advisories section of this document.
Adjusted funds flow in the fourth quarter of 2017 was $110.1 million compared to $14.3 million in the same period in 2016. Significant factors contributing to the change are shown below:
Three months ended December 31, 2017
Adjusted funds flow – 2016 14.3
• Higher Netback in 2017 primarily due to higher sales volumes 114.7
• Higher general and administrative expense mainly due to the Apache Canada Acquisition and TrilogyMerger (12.2)
• Lower receipts from commodity contracts settlements in 2017 (4.5)
• Higher interest and financing expense due to higher average debt in 2017 (3.0)
• Other 0.8
Adjusted funds flow – 2017 110.1
38

Paramount Resources Ltd. 2017 Annual Results
Exploration and Development Capital
Exploration and Development Capital in the fourth quarter of 2017 totalled $150.4 million, with the majority of spending directed towards the Karr development in the Grande Prairie region, advancing the 6-18 Facility expansion at Karr and drilling and completion programs at the Montney oil field in the Kaybob region and at Wapiti in the Grande Prairie region.
Exploration and Development Capital in the fourth quarter of 2017 was higher than planned, primarily as a result of incurring some 2018 expenditures in late-2017 to accelerate well completions and facilities expansion work at Karr, initiate drilling operations at Smoky River, Kaybob South and Karr and accelerate work on water management facilities for 2018 well completions.
QUARTERLY INFORMATION
2017 2016
Q4 Q3 Q2 Q1 Q4 Q3 Q2 Q1
Petroleum and natural gas sales 258.9 116.5 61.3 54.7 32.3 51.7 73.6 91.2
Net income (loss) (106.2) 223.5 45.3 20.7 212.4 1,029.4 (30.6) (46.0) Per share – basic ($/share) (0.79) 1.99 0.43 0.20 2.01 9.69 (0.29) (0.43)
Per share – diluted ($/share) (0.79) 1.97 0.42 0.19 1.99 9.64 (0.29) (0.43)
Adjusted funds flow 110.1 45.3 35.2 28.0 14.3 3.8 (4.9) 22.4 Per share – basic ($/share) 0.82 0.40 0.33 0.26 0.14 0.04 (0.05) 0.21
Per share – diluted ($/share) 0.82 0.40 0.33 0.26 0.13 0.04 (0.05) 0.21
Sales volumes
Natural gas (MMcf/d) 359.9 177.2 53.0 51.4 47.5 88.6 129.8 153.9
Condensate and oil (Bbl/d) 26,285 14,845 8,118 6,348 2,943 5,335 9,490 13,245
Other NGLs (Bbl/d) 9,149 4,641 1,414 1,255 1,046 4,687 9,764 11,259
Total (Boe/d) 95,412 49,023 18,367 16,163 11,901 24,786 40,890 50,161
Average realized price
Natural gas ($/Mcf) 2.11 1.89 3.24 3.55 3.10 2.65 1.49 2.09
Condensate and oil ($/Bbl) 66.65 54.30 57.95 61.75 60.49 51.15 52.83 42.28
Other NGLs ($/Bbl) 30.15 23.05 20.09 23.69 22.16 11.11 11.19 10.31
Total ($/Boe) 29.49 25.84 36.69 37.61 29.52 22.66 19.79 19.98
Significant Items Impacting Quarterly Results
Quarterly earnings variances include the impacts of changing production volumes and market prices.
• Fourth quarter 2017 earnings include $184.6 million of write-downs related to the Shale Gas Project, a$182.9 million gain related to the Apache Canada Acquisition and $132.0 million of aggregateimpairment write-downs of property, plant and equipment in the Northern CGU.
• Third quarter 2017 earnings include a $366.1 million gain related to the Apache Canada Acquisition, a$223.4 million charge related to the ARO Discount Rate Adjustment and a $61.8 million gain related toa fair value adjustment in respect of the Trilogy Shares held prior to the Trilogy Merger.
• Second quarter 2017 earnings include a $80.9 million gain on the sale of oil and gas assets primarilyrelated to the sale of the Valhalla Assets.
39

Paramount Resources Ltd. 2017 Annual Results
• First quarter 2017 earnings include a $42.1 million reversal of impairments of oil and gas assetsrecorded in prior years related to the Valhalla Assets and a $10.5 million loss due to changes in the fairvalue of 3.8 million 7Gen Shares distributed to Paramount shareholders by way of dividend.
• Fourth quarter 2016 earnings include a $133.2 million reversal of impairments of oil and gas assetsrecorded in prior years, a $99.2 million gain recorded in respect of the Cavalier Royalty and therecognition of $61.0 million of previously unrecognized deferred tax assets.
• Third quarter 2016 earnings include the impact of the sale of the Musreau Assets, including a $1.2billion gain on sale, lower depletion and depreciation expense, higher income tax expense and lowernetback.
• Second quarter 2016 earnings include a $131.8 million gain on the sale of oil and gas assets primarilyin respect of the sale of the Musreau Complex, partially offset by $17.7 million of share-basedcompensation expense.
• First quarter 2016 earnings include a foreign exchange gain of $40.3 million related to the 2023 Notesand a $13.7 million gain on commodity contracts.
OTHER INFORMATION
Contractual Obligations
Paramount had the following long-term contractual obligations at December 31, 2017:
Within 1 year
After one year but
not more than three
years
After three years but not more than five
years More than five years Total
Paramount Facility (1) – – 395.0 – 395.0
2019 Senior Notes (2) 21.8 320.6 – – 342.4
Transportation and processing commitments (3) 121.3 371.3 279.3 537.7 1,309.6
Asset retirement obligations (4) 28.0 81.6 80.7 1,561.7 1,752.0
Operating leases and other (5) 9.5 9.1 3.4 0.2 22.2
180.6 782.6 758.4 2,099.6 3,821.2
(1) Excluding interest.(2) Including interest. (3) Certain of the transportation and processing commitments are secured by outstanding letters of credit totaling $20 million at December 31, 2017 (December 31, 2016 - $5.1
million). (4) Asset retirement obligations estimated as at December 31, 2017. Estimated costs and timing of settlement are revised from time-to-time based on new information. (5) Future lease commitments for corporate office space have been reduced for sublease revenue and the impact of provisions recorded in respect of a market rate adjustment
and unoccupied office space.
Transportation and processing commitments mainly relate to long-term firm service arrangements for the processing of natural gas and the transportation of natural gas and liquids.
Contingencies
In the normal course of Paramount’s operations, the Company may become involved in, named as a party to, or be the subject of, various legal proceedings, including regulatory proceedings, tax proceedings and legal actions. The outcome of outstanding, pending or future proceedings cannot be predicted with certainty. Paramount does not anticipate that these claims will have a material impact on its financial position.
In 2016, a release occurred from a non-operated pipeline in which the Company owns a 50 percent interest. The operator, and owner of the remaining 50 percent, has initiated response, containment and
40

Paramount Resources Ltd. 2017 Annual Results
remediation activities ("Response Activities"). Total costs to complete the Response Activities are estimatedat approximately $60 million. It is Paramount’s assessment that it is not responsible for the costs of the Response Activities and as a result, no provision has been recorded in the Company’s financial statements.
Tax and royalty legislation and regulations, and government interpretation and administration thereof, continually changes. As a result, there are often tax and royalty matters under review by relevant government authorities. All tax and royalty filings are subject to subsequent government audit and potential reassessments. Accordingly, the final amounts may differ materially from amounts estimated and recorded.
Risk Factors
A description of the most significant risk factors related to Paramount and its business is contained in Paramount’s current Annual Information Form under the heading "Risk Factors".
The Company cannot fully protect against all of these potential risks. Some of them cannot be insured against, and the coverage that can be obtained with respect to those that are insurable will be subject to exclusions and monetary limits. Accordingly, Paramount may be exposed to liabilities that are outside the scope of its insurance, are only partially covered by it, or that Paramount could not insure against (either at all or because of high premium costs or for other reasons). The occurrence of a significant event against which Paramount is not fully insured could have a material adverse effect on the Company.
CHANGE IN ACCOUNTING POLICIES
There were no new or amended accounting standards adopted by the Company for the year ended December 31, 2017.
Future Changes in Accounting Standards
In May 2014, the International Accounting Standards Board ("IASB") issued IFRS 15 – Revenue From
Contracts With Customers, which establishes a single revenue recognition framework that applies to contracts with customers. The standard requires an entity to recognize revenue to reflect the transfer of goods and services for the amount it expects to receive when control of goods is transferred to the purchaser or services are provided. IFRS 15 is effective for years beginning on or after January 1, 2018. The Company has evaluated the expected impact of the new standard and has concluded that it is not expected to have a material impact on the Company’s Consolidated Financial Statements.
In July 2014, the IASB issued IFRS 9 – Financial Instruments, which sets out the recognition and measurement requirements for financial instruments and certain contracts to buy or sell non-financial items. IFRS 9 proposes a single model of classifying and measuring financial assets and liabilities and provides for only two classification categories: amortized cost and fair value. IFRS 9 is effective for years beginning on or after January 1, 2018. The Company has evaluated the impact of the new standard and determined that it is not expected to have a material impact on the Company’s Consolidated Financial Statements, except for the measurement and presentation of investments in securities. The new standard provides that changes in the fair value of investments in securities can be recognized in earnings or be accumulated in other comprehensive income ("OCI"). The adoption of IFRS 9 is applied retroactively. Depending on whether the Company elects to record changes in the fair value of investments in securities in earnings or in OCI, the impact may result in material adjustments to the Company’s Consolidated Financial Statements.
In January 2016, the IASB issued IFRS 16 – Leases, which replaces IAS 17 – Leases and related interpretations. IFRS 16 eliminates the classification of leases as either finance or operating and introduces a single lessee accounting model for recognition and measurement, which will require the recognition of
41

Paramount Resources Ltd. 2017 Annual Results
assets and liabilities for most leases. IFRS 16 is effective for years beginning on or after January 1, 2019. The Company has initiated a project to identify and review lease contracts to determine the extent of the potential impact. Paramount expects that the adoption of the standard will have a material impact on the Consolidated Financial Statements.
DISCLOSURE CONTROLS AND PROCEDURES
As of the year ended December 31, 2017, an evaluation of the effectiveness of Paramount’s disclosure controls and procedures, as defined by the rules of the Canadian Securities Administrators, was performed by the Company’s management with the oversight of the chief executive officer and chief financial officer. Based upon that evaluation, the Company’s chief executive officer and chief financial officer have concluded that as of the end of that fiscal year, the Company’s disclosure controls and procedures are effective in ensuring that information required to be disclosed by the Company is (i) recorded, processed, summarized and reported within the time periods specified in Canadian securities law; and (ii) accumulated and communicated to the Company’s management, including its chief executive officer and chief financial officer as appropriate, to allow timely decisions regarding required disclosure.
It should be noted that while the Company’s chief executive officer and chief financial officer believe that the Company’s disclosure controls and procedures provide a reasonable level of assurance that they are effective, they do not expect that the Company’s disclosure controls and procedures or internal control over financial reporting will prevent all errors and fraud. A control system, no matter how well conceived or operated, can provide only reasonable, not absolute, assurance that the objectives of the control system are met.
INTERNAL CONTROLS OVER FINANCIAL REPORTING
Management has assessed the effectiveness of the Company’s internal controls over financial reporting ("ICFR") as defined under National Instrument 52-109 "Certification of Disclosure in Issuers’ Annual and
Interim Filings" as at December 31, 2017. In making its assessment, Management used the Committee of Sponsoring Organizations of the Treadway Commission Framework in Internal Control – Integrated Framework (2013) to evaluate the effectiveness of the Company’s ICFR. Based on this assessment, Management has concluded that the Company’s ICFR was effective as of December 31, 2017.
Internal control systems, no matter how well designed, have inherent limitations. Therefore, even those systems determined to be effective can provide only reasonable assurance with respect to financial statement preparation and presentation. Also, projections of any evaluation of effectiveness to future periods are subject to the risk that controls may become inadequate because of changes in conditions, or that the degree of compliance with policies or procedures may deteriorate.
Changes in Internal Control Over Financial Reporting
During the year ended December 31, 2017, there was no change in the Company’s ICFR that materially affected, or is reasonably likely to materially affect, the Company’s ICFR.
Paramount closed the Apache Canada Acquisition on August 16, 2017 and the Trilogy Merger on September 12, 2017. Management has limited the scope of their design of disclosure controls and procedures and ICFR to exclude the controls, policies and procedures of Apache Canada and Trilogy, pursuant to Section 3.3(1)(b) of National Instrument 52-109. Amounts in respect of Apache Canada and Trilogy included in Paramount’s Consolidated Financial Statements as at and for the year ended December 31, 3017 are as follows:
42

Paramount Resources Ltd. 2017 Annual Results
Apache Canada Trilogy
Sales Volumes (Boe/d) 14,882 6,548 Petroleum and natural gas sales 123.0 66.4 Current Assets 96.0 32.2 Current Liabilities 65.0 56.7
Non-current assets and non-current liabilities related to Apache Canada and Trilogy were impracticable to determine separately from Paramount’s consolidated non-current assets and non-current liabilities as at December 31, 2017. For additional financial information regarding the Apache Canada Acquisition and the Trilogy Merger, refer to notes 4 and 5 of the Company’s Consolidated Financial Statements.
CRITICAL ACCOUNTING ESTIMATES
The timely preparation of financial statements requires Management to make judgments, estimates and assumptions that affect the reported amounts of assets, liabilities, revenues and expenses and disclosures regarding contingent assets and liabilities. Estimates and assumptions are regularly evaluated and are based on Management’s experience and other factors, including expectations of future events that are believed to be reasonable under the circumstances. Changes in judgments, estimates and assumptions based on new information could result in a material change to the carrying amount of assets or liabilities and have a material impact on assets, liabilities, revenues and expenses recognized in future periods. The following is a description of the accounting judgments, estimates and assumptions that are considered significant.
Exploration or Development
The Company is required to apply judgment when designating a project as exploration and evaluation or development, including assessments of geological and technical characteristics and other factors related to each project.
Exploration and Evaluation Projects
The accounting for E&E projects requires Management to make judgments as to whether exploratory projects have discovered economically recoverable quantities of petroleum and natural gas, which requires the quantity and realizable value of such petroleum and natural gas to be estimated. Previous estimates are sometimes revised as new information becomes available. Where it is determined that an exploratory project did not discover economically recoverable petroleum and natural gas, the costs are written-off as E&E expense.
If hydrocarbons are encountered, but further appraisal activity is required, the exploratory costs remain capitalized as long as sufficient progress is being made in assessing whether the recovery of the petroleum and natural gas is economically viable. The concept of "sufficient progress" is a judgmental area, and it is possible to have exploratory costs remain capitalized for several years while additional exploratory activities are carried out or the Company seeks government, regulatory or partner approval for development plans. E&E assets are subject to ongoing technical, commercial and Management review to confirm the continued intent to establish the technical feasibility and commercial viability of the discovery. When Management is making this assessment, changes to project economics, expected quantities of petroleum and natural gas, expected production techniques, drilling results, estimated capital expenditures and production costs, results of other operators in the region and access to infrastructure and potential infrastructure expansions are important factors. Where it is determined that an exploratory project is not economically viable, the costs are written-off as E&E expense.
43

Paramount Resources Ltd. 2017 Annual Results
Reserves Estimates
Reserves engineering is an inherently complex and subjective process of estimating underground accumulations of petroleum and natural gas. The process relies on judgments based on the interpretation of available geological, geophysical, engineering and production data. The accuracy of a reserves estimate is a function of the quality and quantity of available data, the interpretation of such data, the accuracy of various economic assumptions and the judgment of those preparing the estimate. Because these estimates depend on many assumptions, all of which may differ from actual results, reserves estimates, and estimates of future net revenue will be different from the sales volumes ultimately recovered and net revenues actually realized. Changes in market conditions, regulatory matters, the results of subsequent drilling, testing and production and other factors may require revisions to the original estimates.
Estimates of reserves impact: (i) the assessment of whether a new well has found economically recoverable reserves; (ii) depletion rates; (iii) the estimated fair value of petroleum and natural gas acquired in a business combination, and (iv) the estimated recoverable amount of petroleum and natural gas properties used from time-to-time in impairment and impairment reversal assessments, all of which could have a material impact on earnings.
Business Combinations
Management is required to exercise judgment in determining whether assets acquired and liabilities assumed constitute a business. A business consists of an integrated set of assets and activities, comprised of inputs and processes, that is capable of being conducted and managed as a business by a market participant.
Business combinations are accounted for using the acquisition method of accounting, where-by the net identifiable assets acquired are recorded at fair value. The fair value of individual assets is often required to be estimated, which may involve estimating the fair values of reserves and resources, tangible assets, undeveloped land, intangible assets and other assets. These estimates incorporate assumptions using indicators of fair value, as determined by Management. Changes in any of the estimates or assumptions used in determining the fair value of the net identifiable assets acquired may impact the carrying values assigned to assets and liabilities acquired and could have a material impact on earnings.
Estimates of Recoverable Amounts
Estimates of recoverable amounts used in impairment and impairment reversal tests often incorporate level three hierarchy inputs, including estimated volumes and future net revenues from petroleum and natural gas reserves, contingent resource estimates, future net cash flow estimates related to other long-lived assets and internal and external market metrics used to estimate value based on comparable assets and transactions. By their nature, such estimates are subject to measurement uncertainty. Changes in such estimates, and differences between actual and estimated amounts, could have a material impact on earnings.
Determination of CGUs
The recoverability of the carrying value of petroleum and natural gas assets is generally assessed at the CGU level. The determination of the properties and other assets grouped within a particular CGU is based on Management’s judgment with respect to the integration between assets, shared infrastructure and cash flows, the overall significance of individual properties and the manner in which management monitors its operations and allocates capital. Changes in the assets comprising CGUs could have an impact on
44

Paramount Resources Ltd. 2017 Annual Results
estimated recoverable amounts used in impairment assessments and could have a material impact on earnings.
Equity Accounted Investments
Prior to the merger with Trilogy in September 2017, the Company accounted for its investment in Trilogy under the equity method of investment accounting, although it held less than 20 percent of the voting power, because in Management’s judgment, it had significant influence as a result of common directors and members of senior management.
Investments in Securities
The Company’s investments in securities are accounted for as available-for-sale financial instruments and are assessed at the end of each reporting period to determine whether there is any objective evidence of impairment. Management is required to exercise judgment in determining whether a decrease in the fair value of an investment below its carrying value is significant or prolonged, which would require an impairment charge to be recognized. Management is also required to exercise judgment in estimating the fair value of investments in the securities of private corporations that are not publicly traded.
Provisions
A provision is recognized where the Company has determined that it has a present obligation arising from past events and the settlement of the obligation is expected to result in an outflow of economic benefits. The determination of whether the Company has a present obligation arising from past events requires Management to exercise judgement as to the facts and circumstances of the event and the extent of any expected obligations of Paramount. Changes in facts and circumstances as a result of new information and other developments may impact Management’s assessment of the Company’s obligations, if any, in respect of such events. Changes in such estimates could have a material impact on Paramount’s assets, liabilities, revenues, expenses and earnings.
Asset Retirement Obligations
Estimates of asset retirement costs are based on assumptions regarding the methods, timing, economic environment and regulatory standards that are expected to exist at the time assets are retired. Management adjusts estimated amounts periodically as assumptions are updated to incorporate new information. Actual payments to settle the obligations may differ materially from amounts estimated.
Share-Based Payments
The Company estimates the grant date value of stock options awarded using the Black-Scholes-Merton model. The inputs used to determine the estimated value of the options are based on assumptions regarding share price volatility, the expected life of the options, expected forfeiture rates and future interest rates. By their nature, these inputs are subject to measurement uncertainty and require Management to exercise judgment in determining which assumptions are the most appropriate.
Income Taxes
Accounting for income taxes is a complex process requiring Management to interpret frequently changing laws and regulations and make judgments and estimates related to the application of tax law, the timing of temporary difference reversals and the likelihood of realizing deferred income tax assets. All tax filings are subject to subsequent government audits and potential reassessment. These interpretations and
45

Paramount Resources Ltd. 2017 Annual Results
judgments, and changes related to them, impact current and deferred tax provisions, the carrying value of deferred income tax assets and liabilities and could have a material impact on earnings.
ADVISORIES
Forward-looking Information
Certain statements in this document constitute forward-looking information under applicable securities legislation. Forward-looking information typically contains statements with words such as "anticipate", "believe", "estimate", "will", "expect", "plan", "schedule", "intend", "propose", or similar words suggesting future outcomes or an outlook. Forward-looking information in this document includes, but is not limited to:
• projected production and sales volumes (including the liquids component) and the timing thereof;• forecast capital expenditures, operating costs per Boe, abandonment and reclamation costs and
transportation costs per Boe;• exploration, development, and associated operational plans and strategies (including planned
drilling and completion programs, potential divestitures of non-core assets, facility expansionsliquids transportation initiatives and potential increases in third-party processing and relatedcapacities);
• estimated reserves and the undiscounted and discounted present value of future net revenuestherefrom;
• the timing and source of funds for the redemption of Paramount’s 2019 senior notes; and• general business strategies and objectives.
Such forward-looking information is based on a number of assumptions which may prove to be incorrect. Assumptions have been made with respect to the following matters, in addition to any other assumptions identified in this document:
• future natural gas and liquids prices;• royalty rates, taxes and capital, operating, general & administrative and other costs;• foreign currency exchange rates and interest rates;• general business, economic and market conditions;• the ability of Paramount to obtain the required capital to finance its exploration, development and
other operations and meet its commitments and financial obligations;• the ability of Paramount to obtain equipment, services, supplies and personnel in a timely manner
and at an acceptable cost to carry out its activities;• the ability of Paramount to secure adequate product processing, transportation, de-ethanization,
fractionation, and storage capacity on acceptable terms;• the ability of Paramount to market its natural gas and liquids successfully to current and new
customers;• the ability of Paramount and its industry partners to obtain drilling success (including in respect of
anticipated production volumes, reserves additions, liquids yields and resource recoveries) andoperational improvements, efficiencies and results consistent with expectations;
• the timely receipt of required governmental and regulatory approvals; and• anticipated timelines and budgets being met in respect of drilling programs and other operations
(including well completions and tie-ins and the construction, commissioning and start-up of new andexpanded facilities).
Although Paramount believes that the expectations reflected in such forward-looking information is reasonable, undue reliance should not be placed on them as Paramount can give no assurance that such expectations will prove to be correct. Forward-looking information is based on expectations, estimates and projections that involve a number of risks and uncertainties which could cause actual results to differ
46

Paramount Resources Ltd. 2017 Annual Results
materially from those anticipated by Paramount and described in the forward-looking information. The material risks and uncertainties include, but are not limited to
• fluctuations in natural gas and liquids prices;• changes in foreign currency exchange rates and interest rates;• the uncertainty of estimates and projections relating to future revenue, future production, reserve
additions, liquids yields (including condensate to natural gas ratios), resource recoveries, royaltyrates, taxes and costs and expenses;
• the ability to secure adequate product processing, transportation, de-ethanization, fractionation, andstorage capacity on acceptable terms;
• operational risks in exploring for, developing and producing, natural gas and liquids;• the ability to obtain equipment, services, supplies and personnel in a timely manner and at an
acceptable cost;• potential disruptions, delays or unexpected technical or other difficulties in designing, developing,
expanding or operating new, expanded or existing facilities (including third-party facilities);• processing, pipeline, de-ethanization, and fractionation infrastructure outages, disruptions and
constraints;• risks and uncertainties involving the geology of oil and gas deposits;• the uncertainty of reserves and resources estimates;• general business, economic and market conditions;• the ability to generate sufficient cash flow from operations and obtain financing to fund planned
exploration, development and operational activities and meet current and future commitments andobligations (including product processing, transportation, de-ethanization, fractionation and similarcommitments and obligations);
• changes in, or in the interpretation of, laws, regulations or policies (including environmental laws);• the ability to obtain required governmental or regulatory approvals in a timely manner, and to enter
into and maintain leases and licenses;• the effects of weather and other factors including wildlife and environmental restrictions which affect
field operations and access;• the timing and cost of future abandonment and reclamation obligations and potential liabilities for
environmental damage and contamination;• uncertainties regarding aboriginal claims and in maintaining relationships with local populations and
other stakeholders;• the outcome of existing and potential lawsuits, regulatory actions, audits and assessments; and• other risks and uncertainties described elsewhere in this document and in Paramount’s other filings
with Canadian securities authorities.
The foregoing list of risks is not exhaustive. For more information relating to risks, see the section titled "RISK FACTORS" in Paramount's current annual information form. The forward-looking information contained in this document is made as of the date hereof and, except as required by applicable securities law, Paramount undertakes no obligation to update publicly or revise any forward-looking statements or information, whether as a result of new information, future events or otherwise.
Non-GAAP Measures
In this document "Adjusted funds flow", "Netback", "Net Debt (Cash)", "Adjusted working capital", "Exploration and Development Capital", "Investments in other entities – market value" and "Finding and development costs", collectively the "Non-GAAP Measures", are used and do not have any standardized meanings as prescribed by IFRS.
47

Paramount Resources Ltd. 2017 Annual Results
Adjusted funds flow refers to cash from operating activities before net changes in operating non-cash working capital, geological and geophysical expenses, asset retirement obligation settlements and transaction and reorganization costs. Adjusted funds flow is commonly used in the oil and gas industry to assist management and investors in measuring the Company’s ability to fund capital programs and meetfinancial obligations. Refer to the Consolidated Results section of the Company’s Management’s Discussion and Analysis for the calculation thereof. Netback equals petroleum and natural gas sales less royalties, operating costs and transportation and NGLs processing costs. Netback is commonly used by management and investors to compare the results of the Company’s oil and gas operations between periods. Refer to the Operating Results section of the Company’s Management’s Discussion and Analysisfor the calculation thereof. Net Debt (Cash) is a measure of the Company’s overall debt position after adjusting for certain working capital and other amounts and is used by management to assess the Company’s overall leverage position. Refer to the Liquidity and Capital Resources section of the Company’s Management’s Discussion and Analysis for the calculation of Net Debt (Cash) and Adjusted working
capital. Exploration and Development Capital consists of the Company’s spending on wells, infrastructure projects, and other property, plant and equipment and excludes spending related to land and property acquisitions and corporate assets. The Exploration and Development Capital measure providesmanagement and investors with information regarding the Company’s capital spending on wells and infrastructure projects separate from land and property acquisition activity and corporate expenditures. Refer to the Property, Plant and Equipment and Exploration Expenditures section of the Company’s Management’s Discussion and Analysis for the calculation thereof for the year ended December 31, 2017 and 2016. The following is the calculation of Exploration and Development Capital from the nearest GAAP measure for the three months ended December 31, 2017 and December 31, 2016:
Three months ended December 31 2017 2016
Property, plant and equipment and exploration 158.8 78.8
Land and property acquisitions (6.0) (0.2)
Corporate (2.4) (0.5)
Exploration and Development Capital 150.4 78.1
Investments in other entities – market value reflects the Company’s investments in enterprises whose securities trade on a public stock exchange at their period end closing price (e.g. MEG Energy Corp, Blackbird Energy Inc., Marquee Energy Ltd., Storm Resources Ltd., Strategic Oil & Gas Ltd., Trilogy (2016) and others), and investments in all other entities at book value. Refer to the Investments in Securities section of the Company’s Management’s Discussion and Analysis and Consolidated Financial Statements as at and for the year ended December 31, 2017 for information on carrying and market values. Finding and development costs ("F&D") measure is commonly used by management and investors to assess the relationship between capital invested in oil and gas exploration and development projects and reserve additions associated with such projects. Refer to the Reserves and Finding & Development Costs section of this document for the calculation of the F&D costs per Boe for the Karr Property.
The Non-GAAP Measures should not be considered in isolation or construed as alternatives to their most directly comparable measure calculated in accordance with GAAP, or other measures of financial performance calculated in accordance with GAAP. The Non-GAAP Measures are unlikely to be comparable to similar measures presented by other issuers.
48
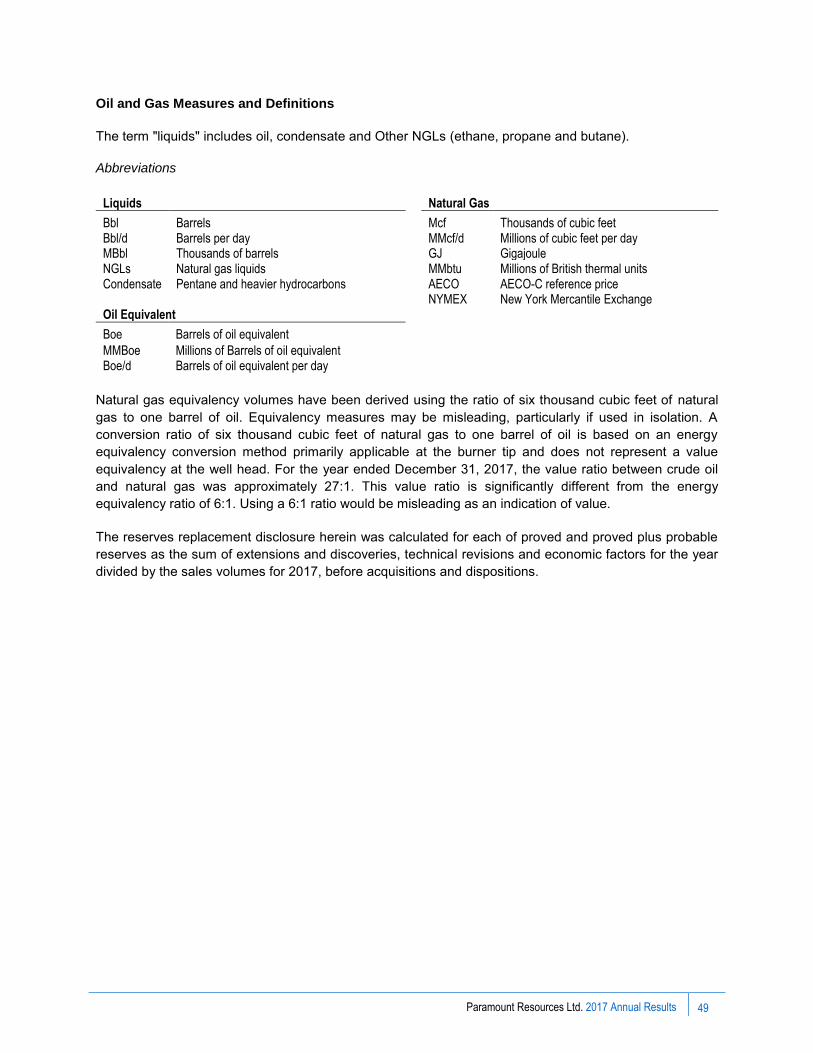
Paramount Resources Ltd. 2017 Annual Results
Oil and Gas Measures and Definitions
The term "liquids" includes oil, condensate and Other NGLs (ethane, propane and butane).
Abbreviations
Liquids Natural Gas
Bbl Barrels Mcf Thousands of cubic feet Bbl/d Barrels per day MMcf/d Millions of cubic feet per day MBbl Thousands of barrels GJ Gigajoule NGLs Natural gas liquids MMbtu Millions of British thermal units Condensate Pentane and heavier hydrocarbons AECO AECO-C reference price
NYMEX New York Mercantile Exchange Oil Equivalent
Boe Barrels of oil equivalent
MMBoe Millions of Barrels of oil equivalent Boe/d Barrels of oil equivalent per day
Natural gas equivalency volumes have been derived using the ratio of six thousand cubic feet of natural gas to one barrel of oil. Equivalency measures may be misleading, particularly if used in isolation. A conversion ratio of six thousand cubic feet of natural gas to one barrel of oil is based on an energy equivalency conversion method primarily applicable at the burner tip and does not represent a value equivalency at the well head. For the year ended December 31, 2017, the value ratio between crude oil and natural gas was approximately 27:1. This value ratio is significantly different from the energy equivalency ratio of 6:1. Using a 6:1 ratio would be misleading as an indication of value.
The reserves replacement disclosure herein was calculated for each of proved and proved plus probable reserves as the sum of extensions and discoveries, technical revisions and economic factors for the year divided by the sales volumes for 2017, before acquisitions and dispositions.
49

Consolidated Financial Statements
As at December 31, 2017 and 2016 and for the years then ended

Paramount Resources Ltd. 2017 Annual Results
MANAGEMENT’S REPORT
The accompanying Consolidated Financial Statements of Paramount Resources Ltd. (the "Company") are the responsibility of Management and have been approved by the Company’s Board of Directors. The Consolidated Financial Statements have been prepared in accordance with International Financial Reporting Standards as issued by the International Accounting Standards Board and include certain estimates that reflect Management’s best judgments. If alternate accounting methods exist, Management has chosen those policies it considers the most appropriate in the circumstances. Financial information included in the Company’s annual report, including Management’s Discussion and Analysis, is consistent with these Consolidated Financial Statements.
Management is also responsible for establishing and maintaining adequate internal control over the Company’s financial reporting. The Company’s internal control system was designed to provide reasonable assurance that all transactions are recorded that are necessary for the preparation and presentation of financial statements in accordance with International Financial Reporting Standards, that such transactions are recorded accurately and that the Company’s assets are safeguarded.
The Board of Directors is responsible for ensuring that Management fulfills its responsibilities for financial reporting and internal control. The Board of Directors exercises this responsibility through the Audit Committee, which is comprised entirely of non-Management directors. The Audit Committee meets regularly with Management and the independent auditors to ensure that Management’s responsibilities are properly discharged and to review the Consolidated Financial Statements. The Audit Committee reports its findings to the Board of Directors for consideration when approving the annual Consolidated Financial Statements for issuance. The Audit Committee also considers, for review by the Board of Directors and approval by the shareholders, the engagement or re-appointment of the independent auditors.
Ernst & Young LLP, independent auditors appointed by the shareholders of the Company, conducts an examination of the Consolidated Financial Statements in accordance with Canadian Generally Accepted Auditing Standards. Ernst & Young LLP has full and free access to the Board of Directors, the Audit Committee and Management.
/s/ J.H.T. Riddell /s/ B.K. Lee J.H.T. Riddell B.K. Lee President and Chief Executive Officer Executive Vice President, Finance and
Chief Financial Officer
March 7, 2018
51

Paramount Resources Ltd. 2017 Annual Results
INDEPENDENT AUDITORS’ REPORT
To the shareholders of Paramount Resources Ltd.
We have audited the accompanying consolidated financial statements of Paramount Resources Ltd. which comprise the consolidated balance sheets as at 31 December, 2017 and 2016, and the consolidated statements of comprehensive income, shareholders’ equity and cash flows for the years then ended, and a summary of significant accounting policies and other explanatory information.
Management's responsibility for the financial statements
Management is responsible for the preparation and fair presentation of these consolidated financial statements in accordance with International Financial Reporting Standards, and for such internal control as Management determines is necessary to enable the preparation of consolidated financial statements that are free from material misstatement, whether due to fraud or error.
Auditors’ responsibility
Our responsibility is to express an opinion on these consolidated financial statements based on our audits. We conducted our audits in accordance with Canadian Generally Accepted Auditing Standards. Those standards require that we comply with ethical requirements and plan and perform the audit to obtain reasonable assurance about whether the consolidated financial statements are free from material misstatement.
An audit involves performing procedures to obtain audit evidence about the amounts and disclosures in the consolidated financial statements. The procedures selected depend on the auditor’s judgment, including the assessment of the risks of material misstatement of the consolidated financial statements, whether due to fraud or error. In making those risk assessments, the auditor considers internal control relevant to the entity’s preparation and fair presentation of the consolidated financial statements in order to design audit procedures that are appropriate in the circumstances, but not for the purpose of expressing an opinion on the effectiveness of the entity’s internal control. An audit also includes evaluating the appropriateness of accounting policies used and the reasonableness of accounting estimates made by Management, as well as evaluating the overall presentation of the consolidated financial statements.
We believe that the audit evidence we have obtained in our audits is sufficient and appropriate to provide a basis for our audit opinion.
Opinion
In our opinion, the consolidated financial statements present fairly, in all material respects, the financial position of Paramount Resources Ltd. as at December 31, 2017 and 2016, and their financial performance and cash flows for the years then ended in accordance with International Financial Reporting Standards.
Calgary, Canada
March 7, 2018 Chartered Professional Accountants
52

Paramount Resources Ltd. 2017 Annual Results
CONSOLIDATED BALANCE SHEET ($ thousands)
On behalf of the Board of Directors
/s/ C.H. Riddell /s/ J.C. Gorman C.H. Riddell, Director J.C. Gorman, Director
March 7, 2018
As at December 31 Note 2017 2016
ASSETS
Current assets
Cash and cash equivalents 17 123,329 621,872
Investments in securities for distribution 11, 16 – 118,978
Accounts receivable 15 170,313 23,895
Prepaid expenses and other 9,047 1,715
302,689 766,460
Exploration and evaluation 6 785,764 301,530
Property, plant and equipment, net 7 3,282,542 882,724
Equity-accounted investment 5 – 44,053
Investments in securities 8 53,315 64,193
Deferred income tax 14 666,404 –
5,090,714 2,058,960
LIABILITIES AND SHAREHOLDERS’ EQUITY
Current liabilities
Dividend payable 11 – 118,978
Accounts payable and accrued liabilities 15 237,181 81,585
Risk management 15 19,060 5,180
Current portion of asset retirement obligations 10 28,000 7,896
284,241 213,639
Long-term debt 9 701,750 –
Asset retirement obligations and other 10 1,661,073 204,413
Deferred income tax 14 – 6,125
2,647,064 424,177
Commitments and contingencies 20
Shareholders’ equity
Share capital 11 2,249,746 1,639,466
Retained earnings (accumulated deficit) 50,325 (152,182)
Reserves 12 143,579 147,499
2,443,650 1,634,783
5,090,714 2,058,960
See the accompanying notes to these Consolidated Financial Statements.
53

Paramount Resources Ltd. 2017 Annual Results
CONSOLIDATED STATEMENT OF COMPREHENSIVE INCOME($ thousands, except as noted)
Year ended December 31 Note 2017 2016
Petroleum and natural gas sales 491,421 248,828
Royalties (24,649) (2,211)
Revenue 466,772 246,617
Gain (loss) on commodity contracts 15 (4,059) 253
462,713 246,870
Expenses
Operating expense 165,893 97,040
Transportation and NGLs processing 50,985 56,465
General and administrative 41,102 25,877
Share-based compensation 13 17,840 27,771
Depletion and depreciation 7 434,118 76,415
Exploration and evaluation 6 214,776 (72,071)
Gain on sale of oil and gas assets 7 (123,966) (1,379,965)
Interest and financing 10,783 80,324
Accretion of asset retirement obligations 10 15,970 4,622
Transaction and reorganization costs 4,5,10 30,529 –
Debt extinguishment 9 – 27,575
Foreign exchange 292 (43,727)
858,322 (1,099,674)
Income (loss) from equity-accounted investment 5 63,729 (14,316)
Gain on Apache Canada Acquisition 4 548,931 –
ARO Discount Rate Adjustment 10 (158,223) –
Other 16 (14,324) (10,859)
Income before tax 44,504 1,321,369
Income tax expense (recovery) 14
Deferred (138,857) 156,094
(138,857) 156,094
Net income 183,361 1,165,275
Other comprehensive income (loss), net of tax Items that may be reclassified to net income (loss):
Change in market value of securities (40,078) 13,128
Reclassification of accumulated losses on securities to net income (loss) 23,011 11,235
Deferred tax on other comprehensive income (loss) related to securities 947 (1,276)
Comprehensive income 167,241 1,188,362
Net income per common share ($/share) 11
Basic 1.60 10.98
Diluted 1.58 10.95
See the accompanying notes to these Consolidated Financial Statements.
54

Paramount Resources Ltd. 2017 Annual Results
CONSOLIDATED STATEMENT OF CASH FLOWS ($ thousands)
Year ended December 31 Note 2017 2016
Operating activities
Net income 183,361 1,165,275
Add (deduct):
Items not involving cash 17 (4,479) (1,161,287)
Asset retirement obligations settled 10 (21,450) (1,753)
Debt extinguishment – 27,575
Change in non-cash working capital (31,137) 15,942
Cash from operating activities 126,295 45,752
Financing activities
Net repayment of limited-recourse demand facilities – (100,911)
Net draw (repayment) of revolving long-term debt 9 392,535 (693,045)
Repayment of Trilogy Facility 9 (155,901) –
Redemption of senior notes 9 – (463,521)
Common shares issued, net of issue costs 6,623 1,462
Common shares purchased under restricted share unit plan 13 (11,370) –
Common shares repurchased under NCIB 11 – (9,704)
Other – (3,194)
Cash from (used in) financing activities 231,887 (1,268,913)
Investing activities
Property, plant and equipment and exploration (545,109) (200,992)
Proceeds on sale of oil and gas assets 158,370 1,177,437
Proceeds on sale of investments, net of costs – 862,931
Corporate acquisition 4 (486,852) –
Cash acquired on corporate acquisition 4 25,468 –
Change in non-cash working capital (7,121) (5,978)
Cash from (used in) investing activities (855,244) 1,833,398
Net increase (decrease) (497,062) 610,237
Foreign exchange on cash and cash equivalents (1,481) (306)
Cash and cash equivalents, beginning of year 621,872 11,941
Cash and cash equivalents, end of year 123,329 621,872
Supplemental cash flow information 17
See the accompanying notes to these Consolidated Financial Statements.
55

Paramount Resources Ltd. 2017 Annual Results
CONSOLIDATED STATEMENT OF SHAREHOLDERS’ EQUITY ($ thousands, except as noted)
Year ended December 31 Note 2017 2016
Shares (000’s)
Shares (000’s)
Share Capital
Balance, beginning of year 105,784 1,639,466 106,212 1,646,984
Issued 11 735 9,552 176 2,060
Issued on Trilogy Merger, net of issuance costs 5 28,537 603,085 – –
Common shares purchased under NCIB – – (623) (9,704)
Change in vested and unvested common shares for restricted share unit plan
13 (343) (2,357)19 126
Balance, end of year 134,713 2,249,746 105,784 1,639,466
Retained Earnings (Accumulated Deficit)
Balance, beginning of year (152,182) (1,197,627)
Net income 183,361 1,165,275
Dividend – (119,830)
Decrease in value of securities prior to distribution 16 19,146 –
Balance, end of year 50,325 (152,182)
Reserves 12
Balance, beginning of year 147,499 99,337
Other comprehensive income (loss) (16,120) 23,087
Contributed surplus 12,200 25,075
Balance, end of year 143,579 147,499
Total Shareholders’ Equity 2,443,650 1,634,783
See the accompanying notes to these Consolidated Financial Statements.
56

(Tabular amounts stated in $ thousands, except as noted)
Paramount Resources Ltd. 2017 Annual Results
1. Significant Accounting Policies
Paramount Resources Ltd. ("Paramount" or the "Company") is an independent, publicly traded, liquids-focused Canadian energy company that explores for and develops both conventional and unconventional petroleum and natural gas resources. The Company also pursues long-term strategic exploration and pre-development plays and holds a portfolio of investments in other entities. Paramount’s principal properties are located in Alberta and British Columbia.
Paramount is the ultimate parent company of a consolidated group of companies and is incorporated and domiciled in Canada. The address of its registered office is 2800, 421 – 7th Avenue S.W., Calgary, Alberta, Canada, T2P 4K9. The consolidated group includes wholly-owned subsidiaries Fox Drilling Limited Partnership ("Fox Drilling"), Cavalier Energy ("Cavalier") and MGM Energy.
These consolidated financial statements of the Company, as at December 31, 2017 and December 31, 2016 and for the years then ended (the "Consolidated Financial Statements"), were authorized for issuance by Paramount’s Board of Directors on March 7, 2018.
Basis of Preparation
These Consolidated Financial Statements have been prepared in accordance with International Financial Reporting Standards ("IFRS") and have been prepared on a historical cost basis, except for certain financial instruments. The Company’s accounting policies have been applied consistently to all years presented. Amounts included in these Consolidated Financial Statements are stated in thousands of Canadian dollars, unless otherwise noted. Certain comparative figures have been reclassified to conform with the current year’s presentation.
The financial statements of Paramount’s subsidiaries and partnerships are prepared for the same reporting periods as the parent in accordance with the Company’s accounting policies. All intercompany balances and transactions have been eliminated.
The preparation of these Consolidated Financial Statements requires the use of certain accounting estimates and also requires Management to exercise judgment in applying the Company’s accounting policies. Areas involving a higher degree of judgment or complexity, and areas where assumptions and estimates are significant to the Consolidated Financial Statements, are described in Note 2.
a) Revenue Recognition
Petroleum and natural gas sales revenues are recognized when title passes to third parties and the significant risks and rewards of ownership have been transferred.
Drilling services are billed to customers on a per-day basis and revenues are recognized as services are rendered and collectability is reasonably assured. When the Company’s drilling rigs (the "Rigs") drill on a property owned by Paramount, the Company capitalizes its working interest share of the drilling expenses and eliminates the associated drilling revenue.
b) Cash and Cash Equivalents
Cash and cash equivalents are recorded at cost and are comprised of cash in operating bank accounts, term deposits, certificates of deposit and other highly liquid investments.
57

(Tabular amounts stated in $ thousands, except as noted)
Paramount Resources Ltd. 2017 Annual Results
c) Trade and Other Receivables
Accounts receivable are recorded as corresponding amounts of revenue are recognized or costs are incurred on behalf of partners in connection with joint operations. An allowance for doubtful accounts is recognized based on Management’s best estimate of accounts that may not be collectible, which is reviewed and adjusted on a quarterly basis.
d) Exploration and Evaluation
Costs related to the exploration for and evaluation of hydrocarbon resources, including costs of acquiring unproved property, drilling and completing exploratory wells and estimated asset retirement costs, are initially capitalized, pending determination of technical feasibility and commercial viability. If hydrocarbons are found, but further appraisal activity is required to determine commercial viability, the exploration and evaluation ("E&E") costs continue to be recognized as an asset. All such costs are subject to technical, commercial, and Management review at least annually to confirm the continued intent to establish the technical feasibility and commercial viability of the discovery.
The Company’s E&E assets include shale gas properties in the Liard and Horn River basins and oil sands and carbonate bitumen properties. Net cash flows from the sale of production from Shale Gas Project wells are applied against the capitalized costs of the properties until the overall project is deemed commercially viable. All direct costs related to pre-development activities in connection with oil sands properties are considered pre-operating and are capitalized, including the costs to acquire mineral rights, conduct delineation and pre-production drilling, and design and construct plant and equipment.
When the technical feasibility and commercial viability of a project has been established, the E&E costs are transferred to petroleum and natural gas assets, subject to an impairment assessment. When the Company determines that an E&E project is no longer viable or its carrying value exceeds its recoverable amount, an impairment charge is recognized.
Exploratory geological and geophysical costs, pre-license costs, and annual lease rentals are expensed as incurred.
e) Property, Plant and Equipment
Petroleum and natural gas assets are carried at cost, net of accumulated depletion, depreciation and impairments, and include costs related to drilling and completing development wells, infrastructure construction, successful E&E projects and estimated asset retirement costs.
Paramount’s Rigs are carried at cost, net of accumulated depreciation. Costs incurred to improve the capabilities of the Rigs, extend their useful lives or replace significant components are capitalized. When a significant component is replaced, the carrying value of the replaced component is written-off. Costs incurred to maintain and repair the Rigs are expensed as incurred.
Other property, plant and equipment ("PP&E"), including leasehold improvements, are carried at cost net of accumulated depreciation.
Depletion and Depreciation
The capitalized costs of proved oil and gas properties are depleted over estimated volumes of proved developed reserves using the unit-of-production method. For purposes of these calculations, volumes of
58

(Tabular amounts stated in $ thousands, except as noted)
Paramount Resources Ltd. 2017 Annual Results
natural gas production and reserves are converted to barrels on an energy equivalent basis. Depletion rates are revised annually, or more frequently when events dictate. E&E costs are not depleted.
The capitalized costs of the majority of Paramount’s gathering systems and production equipment are depleted on a unit-of-production basis over the estimated proved developed reserves of the field to which they relate. Capitalized costs of processing plants and other major infrastructure assets are depreciated on a straight-line basis over their expected useful lives, which extend up to 40 years.
The Rigs are depreciated on a straight line basis by component over their expected useful lives, which range between 5 and 20 years.
Leasehold improvements are depreciated over the term of the related lease. Other assets are depreciated using the declining balance method at rates ranging between 35 and 50 percent.
f) Impairment of Non-Financial Assets
The carrying values of the Company’s non-financial assets are reviewed at each reporting date to determine whether any indicators of impairment are present, or whether there is any indication that an impairment loss recognized in prior periods may no longer exist or may have decreased. For the purpose of impairment testing, non-financial assets are tested individually or, in certain circumstances, grouped together into a cash-generating unit ("CGU"), which consists of the smallest group of assets that generate cash inflows that are largely independent of the cash inflows of other assets or groups of assets. Following two significant acquisitions in 2017, the Company’s conventional operations have been re-grouped into four new CGUs: the Grande Prairie CGU, the Kaybob CGU, the Central Alberta CGU and the Northern CGU. The Company’s non-conventional E&E assets associated with the Shale Gas Project form a fifth CGU for the purposes of impairment testing.
If an indicator of impairment or impairment reversal is identified for a particular asset or CGU, its recoverable amount is estimated. If the carrying value of such asset or CGU exceeds its estimated recoverable amount, an impairment charge is recognized. If the estimated recoverable amount of an asset or CGU that was previously impaired exceeds its carrying value, impairment charges recognized in prior periods are reversed to a maximum of the carrying value that would have been determined, net of depletion and amortization, had no impairment charges been recognized for the CGU in prior periods.
The recoverable amount of an asset or CGU is the greater of its fair value less costs to sell and its value in use. In assessing fair value less costs to sell, the Company estimates the value a potential purchaser would ascribe to an asset or CGU. For oil and gas properties, fair value less costs to sell is generally estimated based on expected after-tax future net cash flows from the production of proved and probable reserves volumes using forecast commodity prices and costs, discounted using market-based rates. Value in use is determined by estimating the present value of the future net cash flows expected to be derived from the continued use of the asset or CGU.
g) Joint Arrangements
Paramount conducts its exploration and development activities independently, as well as jointly with others through jointly controlled assets and operations. All of the Company’s current interests in joint arrangements are classified as joint operations. To account for these arrangements, Paramount recognizes its proportionate share of the related revenues, expenses, assets and liabilities of such joint operations.
59

(Tabular amounts stated in $ thousands, except as noted)
Paramount Resources Ltd. 2017 Annual Results
Interests in joint ventures are accounted for using the equity method of accounting. The Company does not currently have any interests in joint arrangements that are classified as joint ventures.
h) Equity-Accounted Investments
Investments in entities in which Paramount has significant influence are accounted for using the equity method of investment accounting. An investor is presumed to have significant influence where it holds 20 percent or more of the voting power over an investee, or where significant influence can be clearly demonstrated. Significant influence is the power to participate in the financial and operating policy decisions of the investee, but is not control or joint control of the entity. Factors that may demonstrate significant influence include representation on the board of directors of the investee, interchange of management personnel and participation in determining the significant policies of the investee.
Under the equity method, an investment is recognized at cost on acquisition, with the carrying amount being subsequently increased or decreased to reflect the investor’s proportionate share of the profit or loss of the investee after the date of acquisition. Distributions received from an investee reduce the carrying amount of the investment.
i) Business Combinations and Goodwill
Business combinations are accounted for using the acquisition method of accounting. Under this method, the net identifiable assets acquired are measured at fair value on acquisition date, except for deferred income tax amounts. Any excess of the consideration paid over the value of the net identifiable assets acquired is recognized as goodwill. Any deficiency in the consideration transferred versus the value of the net identifiable assets acquired is recognized in earnings. Costs incurred to complete the business combination are expensed.
Goodwill is tested for impairment at least annually, or when a potential impairment indicator is identified. To test goodwill for impairment, the carrying value of a CGU (or group of CGUs), including allocated goodwill, is compared to that CGU’s (or group of CGUs) estimated recoverable amount. An impairment charge is recognized to the extent that the carrying amount of the CGU (or group of CGUs), including goodwill, exceeds its estimated recoverable amount. Impairment charges related to goodwill are not reversed in future periods.
j) Capitalized Borrowing Costs
Borrowing costs directly associated with the acquisition, construction or production of a qualifying asset are capitalized while the asset is being constructed or otherwise prepared for its intended productive use. All other borrowing costs are expensed in the period incurred.
k) Provisions
Provisions are recognized when Paramount has a present legal and/or constructive obligation as a result of past events, it is probable that an outflow of economic resources will be required to settle the obligation and a reliable estimate can be made of the amount of the obligation.
A provision for onerous contracts is recognized when the expected economic benefits to be derived by the Company from a contract are lower than the unavoidable cost of meeting the obligations under the contract. The provision is measured at the lower of the expected cost of terminating the contract and the present value of the expected net cost of the remaining term of the contract.
60

(Tabular amounts stated in $ thousands, except as noted)
Paramount Resources Ltd. 2017 Annual Results
l) Asset Retirement Obligations
Asset retirement obligations arise from legal and/or constructive obligations to retire assets, including oil and gas wells, gathering systems, processing plants and access roads at the end of their productive lives. The present value of an asset retirement obligation is recognized in the Consolidated Balance Sheet when incurred and a reasonable estimate of the cost of retirement can be made. The present value of the obligation is determined using the applicable period-end risk free discount rate, after applying an estimated cost inflation factor, and is adjusted for the passage of time, which is recognized as accretion expense. The present values of estimated future asset retirement costs are capitalized as part of the carrying value of the related long-lived asset and depreciated on the same basis as the underlying asset. Revisions to the timing, anticipated cost, discount rate and inflation rate relating to the estimated liability are accounted for prospectively by recording an adjustment to the asset retirement obligation liability, with a corresponding adjustment to the carrying value of the related asset.
Actual costs incurred to retire assets are applied against the asset retirement obligation liability. Differences between the actual costs incurred and the liability accrued are recognized in earnings when the reclamation of a property is fully completed.
m) Foreign Currency Translation
The functional and presentation currency of Paramount and its subsidiaries is the Canadian dollar.
n) Estimates of Fair Value
Inputs used to estimate fair values incorporated in the preparation of the Consolidated Financial Statements are categorized into one of three levels in a fair value hierarchy. The fair value hierarchy gives the highest priority to quoted prices in active markets for identical assets or liabilities and the lowest priority to unobservable inputs. The three levels are defined as follows:
Level One – Inputs are quoted prices (unadjusted) in active markets for identical assets or liabilities that can be accessed at the measurement date.
Level Two – Inputs are based on information other than quoted prices included within Level One that are observable for the asset or liability, either directly or indirectly, including:
a) quoted prices for similar assets or liabilities in active markets;
b) quoted prices for identical or similar assets or liabilities in markets that are not active;
c) inputs other than quoted prices that are observable for the asset or liability, for example:
i. interest rates and yield curves observable at commonly quoted intervals; ii. implied volatilities; and iii. credit spreads; and
d) market-corroborated inputs.
Level Three – Inputs are unobservable. Unobservable inputs are developed using the best information available in the circumstances, which may incorporate Paramount’s own internally generated data.
61

(Tabular amounts stated in $ thousands, except as noted)
Paramount Resources Ltd. 2017 Annual Results
o) Financial Instruments and Other Comprehensive Income
Financial Instruments
Financial instruments are measured at fair value on initial recognition. The measurement of a financial instrument in subsequent periods is dependent upon whether it has been classified as "fair value through profit or loss", "available-for-sale", "loans and receivables", "held-to-maturity investments", or "financial liabilities measured at amortized cost", as defined by the relevant standard. Paramount does not presently employ hedge accounting for any of its financial instruments.
The fair values of cash and cash equivalents, accounts receivable and accounts payable and accrued liabilities approximate their carrying amounts due to the short-term maturities of these instruments.
Paramount’s risk management assets and liabilities are classified as fair value through profit or loss (held for trading). Fair value through profit or loss financial instruments are measured at fair value, with changes in their fair values over time being recognized in net earnings. The fair values of the Company’s risk management assets and liabilities are estimated using a market approach incorporating level two fair value hierarchy inputs, including forward market curves and price quotes for similar instruments provided by financial institutions.
Investments in securities are classified as available-for-sale. Available-for-sale financial assets are measured at fair value, with changes in such fair values being accumulated in other comprehensive income ("OCI") until the asset is realized or impaired, at which time a gain or loss is recognized in earnings. Investments in publicly-traded securities are carried at their period-end trading price (level one fair value hierarchy estimate). Investments in the securities of private entities are carried at fair value, which is estimated using values based on equity issuances and other indications of value from time-to-time (level two and level three fair value hierarchy estimates).
Long-term debt balances outstanding from time-to-time are classified as financial liabilities. Financial liabilities, including related transaction costs, are measured at amortized cost using the effective interest method.
Other Comprehensive Income
For Paramount, OCI is comprised of changes in the market value of investments in securities. Amounts recorded in OCI each period are presented in the Consolidated Statement of Comprehensive Income (Loss). Cumulative changes in OCI are included in Reserves, which is presented within Shareholders’ Equity in the Consolidated Balance Sheet.
An impairment charge is recognized in respect of an investment where its fair value decreases below its carrying value, and the decline is considered to be significant or prolonged. A subsequent increase in the fair value of an investment is recognized in OCI.
p) Income Taxes
Paramount follows the liability method of accounting for income taxes. Under this method, a deferred income tax asset or liability is recognized in respect of any temporary difference between the carrying amount of an asset or liability reported in the Consolidated Financial Statements and its respective tax basis, using substantively enacted income tax rates. Deferred income tax balances are adjusted to reflect changes in substantively enacted income tax rates expected to apply when the underlying assets are
62

(Tabular amounts stated in $ thousands, except as noted)
Paramount Resources Ltd. 2017 Annual Results
realized or liabilities are settled, with adjustments being recognized in deferred tax expense in the period in which the change occurs.
Deferred income tax assets are recognized to the extent future realization is considered probable. The carrying value of deferred income tax assets is reviewed at each reporting date taking into consideration historical and expected future taxable income, expected reversals of temporary differences, anticipated timing of realization, tax basis carry-forward periods and other factors. Deferred income tax assets are de-recognized to the extent that estimated future taxable earnings are not sufficient to result in the asset being recovered.
q) Share-Based Compensation
Paramount Stock Option Plan
Paramount has a stock option plan that enables its Board of Directors or Compensation Committee to grant options to acquire Common Shares of the Company ("Paramount Options") to key employees and directors. Paramount Options generally vest over five years and expire within six years after the grant date. The provisions of the plan permit the Company to settle the options in class A common shares ("Common Shares") of the Company or in cash.
The Company accounts for Paramount Options as equity-settled share-based compensation transactions. The aggregate grant date fair value of stock options awarded is recognized as share-based compensation expense over the applicable vesting period on a straight line basis, with a corresponding increase in Contributed Surplus. The grant date fair value of Paramount Options is estimated using the Black-Scholes-Merton model, and such value is not adjusted in future periods. The amount of share-based compensation expense recognized each period reflects the portion of the vesting term that has elapsed and the estimated number of options that are expected to vest. That estimate is adjusted each period such that the cumulative amount recognized on the vesting date reflects the actual number of Paramount Options that ultimately vest. Upon the exercise of a Paramount Option, the Company transfers the cumulative amount recognized in Contributed Surplus in respect of that option to Share Capital.
Cavalier Stock Option Plan
Cavalier has a stock option plan that enables its Board of Directors to grant options to acquire common shares of Cavalier ("Cavalier Options") to key employees and directors. Cavalier Options generally vest over five years and expire within seven years after the grant date. The provisions of the stock option plan permit Cavalier to settle Cavalier Options in common shares of Cavalier or in cash, at the discretion of Cavalier. Cavalier Options are accounted for as equity-settled share-based compensation transactions.
Restricted Share Unit Plan
Paramount’s restricted share unit plan ("RSU") provides that rights to Common Shares may be awarded to employees annually. Common Shares are purchased in the open market and held by an independent trustee until the completion of the vesting period. Generally, the awards vest over two years. The unvested portion of an award is initially recorded as a reduction of Paramount’s Share Capital. The cost of such awards is then recognized over the vesting period as share-based compensation expense, with a corresponding increase to Share Capital.
63

(Tabular amounts stated in $ thousands, except as noted)
Paramount Resources Ltd. 2017 Annual Results
r) Net Income Per Share
Basic net income per share is calculated by dividing net income by the weighted average number of Common Shares outstanding during the year. Diluted net income per share is calculated by adjusting the weighted average number of Common Shares outstanding for potentially dilutive Common Shares related to Paramount Options. The number of dilutive Common Shares is determined using the treasury stock method. As Paramount Options can be exchanged for Common Shares, they are considered potentially dilutive and are included in the Company’s diluted per share amounts when they are dilutive to net income per share.
2. Significant Accounting Estimates, Assumptions & Judgments
The timely preparation of financial statements requires Management to make judgments, estimates and assumptions that affect the reported amounts of assets, liabilities, revenues and expenses and disclosures regarding contingent assets and liabilities. Estimates and assumptions are regularly evaluated and are based on Management’s experience and other factors, including expectations of future events that are believed to be reasonable under the circumstances. Changes in judgments, estimates and assumptions based on new information could result in a material change to the carrying amount of assets or liabilities and have a material impact on assets, liabilities, revenues and expenses recognized in future periods. The following is a description of the accounting judgments, estimates and assumptions that are considered significant.
Exploration or Development
The Company is required to apply judgment when designating a project as exploration and evaluation or development, including assessments of geological and technical characteristics and other factors related to each project.
Exploration and Evaluation Projects
The accounting for E&E projects requires Management to make judgments as to whether exploratory projects have discovered economically recoverable quantities of petroleum and natural gas, which requires the quantity and realizable value of such petroleum and natural gas to be estimated. Previous estimates are sometimes revised as new information becomes available. Where it is determined that an exploratory project did not discover economically recoverable petroleum and natural gas, the costs are written-off as E&E expense.
If hydrocarbons are encountered, but further appraisal activity is required, the exploratory costs remain capitalized as long as sufficient progress is being made in assessing whether the recovery of the petroleum and natural gas is economically viable. The concept of "sufficient progress" is a judgmental area, and it is possible to have exploratory costs remain capitalized for several years while additional exploratory activities are carried out or the Company seeks government, regulatory or partner approval for development plans. E&E assets are subject to ongoing technical, commercial and Management review to confirm the continued intent to establish the technical feasibility and commercial viability of the discovery. When Management is making this assessment, changes to project economics, expected quantities of petroleum and natural gas, expected production techniques, drilling results, estimated capital expenditures and production costs, results of other operators in the region and access to infrastructure and potential infrastructure expansions are important factors. Where it is determined that an exploratory project is not economically viable, the costs are written-off as E&E expense.
64

(Tabular amounts stated in $ thousands, except as noted)
Paramount Resources Ltd. 2017 Annual Results
Reserves Estimates
Reserves engineering is an inherently complex and subjective process of estimating underground accumulations of petroleum and natural gas. The process relies on judgments based on the interpretation of available geological, geophysical, engineering and production data. The accuracy of a reserves estimate is a function of the quality and quantity of available data, the interpretation of such data, the accuracy of various economic assumptions and the judgment of those preparing the estimate. Because these estimates depend on many assumptions, all of which may differ from actual results, reserves estimates, and estimates of future net revenue will be different from the sales volumes ultimately recovered and net revenues actually realized. Changes in market conditions, regulatory matters, the results of subsequent drilling, testing and production and other factors may require revisions to the original estimates.
Estimates of reserves impact: (i) the assessment of whether a new well has found economically recoverable reserves; (ii) depletion rates; (iii) the estimated fair value of petroleum and natural gas acquired in a business combination, and (iv) the estimated recoverable amount of petroleum and natural gas properties used from time-to-time in impairment and impairment reversal assessments, all of which could have a material impact on earnings.
Business Combinations
Management is required to exercise judgment in determining whether assets acquired and liabilities assumed constitute a business. A business consists of an integrated set of assets and activities, comprised of inputs and processes, that is capable of being conducted and managed as a business by a market participant.
Business combinations are accounted for using the acquisition method of accounting, whereby the net identifiable assets acquired are recorded at fair value. The fair value of individual assets is often required to be estimated, which may involve estimating the fair values of reserves and resources, tangible assets, undeveloped land, intangible assets and other assets. These estimates incorporate assumptions using indicators of fair value, as determined by Management. Changes in any of the estimates or assumptions used in determining the fair value of the net identifiable assets acquired may impact the carrying values assigned to assets and liabilities acquired and could have a material impact on earnings.
Estimates of Recoverable Amounts
Estimates of recoverable amounts used in impairment and impairment reversal tests often incorporate level three hierarchy inputs, including estimated volumes and future net revenues from petroleum and natural gas reserves, contingent resource estimates, future net cash flow estimates related to other long-lived assets and internal and external market metrics used to estimate value based on comparable assets and transactions. By their nature, such estimates are subject to measurement uncertainty. Changes in such estimates, and differences between actual and estimated amounts, could have a material impact on earnings.
Determination of CGUs
The recoverability of the carrying value of petroleum and natural gas assets is generally assessed at the CGU level. The determination of the properties and other assets grouped within a particular CGU is based on Management’s judgment with respect to the integration between assets, shared infrastructure and cash flows, the overall significance of individual properties and the manner in which management monitors its operations and allocates capital. Changes in the assets comprising CGUs could have an impact on
65

(Tabular amounts stated in $ thousands, except as noted)
Paramount Resources Ltd. 2017 Annual Results
estimated recoverable amounts used in impairment assessments and could have a material impact on earnings.
Equity Accounted Investments
Prior to the merger with Trilogy Energy Corp. (ʺTrilogyʺ) in September 2017, the Company accounted for its investment in Trilogy under the equity method of investment accounting, although it held less than 20 percent of the voting power, because in Management’s judgment, it had significant influence as a result of common directors and members of senior management.
Investments in Securities
The Company’s investments in securities are accounted for as available-for-sale financial instruments and are assessed at the end of each reporting period to determine whether there is any objective evidence of impairment. Management is required to exercise judgment in determining whether a decrease in the fair value of an investment below its carrying value is significant or prolonged, which would require an impairment charge to be recognized. Management is also required to exercise judgment in estimating the fair value of investments in the securities of private corporations that are not publicly traded.
Provisions A provision is recognized where the Company has determined that it has a present obligation arising from past events and the settlement of the obligation is expected to result in an outflow of economic benefits. The determination of whether the Company has a present obligation arising from past events requires Management to exercise judgement as to the facts and circumstances of the event and the extent of any expected obligations of Paramount. Changes in facts and circumstances as a result of new information and other developments may impact Management’s assessment of the Company’s obligations, if any, in respect of such events. Changes in such estimates could have a material impact on Paramount’s assets, liabilities, revenues, expenses and earnings.
Asset Retirement Obligations
Estimates of asset retirement costs are based on assumptions regarding the methods, timing, economic environment and regulatory standards that are expected to exist at the time assets are retired. Management adjusts estimated amounts periodically as assumptions are updated to incorporate new information. Actual payments to settle the obligations may differ materially from amounts estimated.
Share-Based Payments
The Company estimates the grant date value of stock options awarded using the Black-Scholes-Merton model. The inputs used to determine the estimated value of the options are based on assumptions regarding share price volatility, the expected life of the options, expected forfeiture rates and future interest rates. By their nature, these inputs are subject to measurement uncertainty and require Management to exercise judgment in determining which assumptions are the most appropriate.
Income Taxes
Accounting for income taxes is a complex process requiring Management to interpret frequently changing laws and regulations and make judgments and estimates related to the application of tax law, the timing of temporary difference reversals and the likelihood of realizing deferred income tax assets. All tax filings are
66

(Tabular amounts stated in $ thousands, except as noted)
Paramount Resources Ltd. 2017 Annual Results
subject to subsequent government audits and potential reassessment. These interpretations and judgments, and changes related to them, impact current and deferred tax provisions, the carrying value of deferred income tax assets and liabilities and could have a material impact on earnings.
3. Changes in Accounting Standards
There were no new or amended accounting standards adopted by the Company for the year ended December 31, 2017.
Future Changes in Accounting Standards
In May 2014, the International Accounting Standards Board ("IASB") issued IFRS 15 – Revenue From
Contracts With Customers, which establishes a single revenue recognition framework that applies to contracts with customers. The standard requires an entity to recognize revenue to reflect the transfer of goods and services for the amount it expects to receive when control of goods is transferred to the purchaser or services are provided. IFRS 15 is effective for years beginning on or after January 1, 2018. The Company has evaluated the expected impact of the new standard and has concluded that it is not expected to have a material impact on the Company’s Consolidated Financial Statements.
In July 2014, the IASB issued IFRS 9 – Financial Instruments, which sets out the recognition and measurement requirements for financial instruments and certain contracts to buy or sell non-financial items. IFRS 9 proposes a single model of classifying and measuring financial assets and liabilities and provides for only two classification categories: amortized cost and fair value. IFRS 9 is effective for years beginning on or after January 1, 2018. The Company has evaluated the impact of the new standard and determined that it is not expected to have a material impact on the Company’s Consolidated Financial Statements, except for the measurement and presentation of investments in securities. The new standard provides that changes in the fair value of investments in securities can be recognized in earnings or be accumulated in OCI. The adoption of IFRS 9 is applied retroactively. Depending on whether the Company elects to record changes in the fair value of investments in securities in earnings or in OCI, the election may result in material adjustments to the Company’s Consolidated Financial Statements.
In January 2016, the IASB issued IFRS 16 – Leases, which replaces IAS 17 – Leases and related interpretations. IFRS 16 eliminates the classification of leases as either finance or operating and introduces a single lessee accounting model for recognition and measurement, which will require the recognition of assets and liabilities for most leases. IFRS 16 is effective for years beginning on or after January 1, 2019. The Company has initiated a project to identify and review lease contracts to determine the extent of the potential impact. Paramount expects that the adoption of this standard may have a material impact on the Consolidated Financial Statements.
4. Apache Canada Ltd. Acquisition
On August 16, 2017, Paramount acquired all of the outstanding shares of Apache Canada Ltd. (ʺApache Canadaʺ) for cash consideration of $486.9 million (the ʺApache Canada Acquisitionʺ).
Apache Canada was a wholly-owned subsidiary of a publicly traded U.S. based international oil and gas company. Apache Canada’s primary oil and gas assets were located at Wapiti, Kaybob and in Central Alberta. These Consolidated Financial Statements include the results of operations of Apache Canada for the period following the closing of the transaction on August 16, 2017.
67

(Tabular amounts stated in $ thousands, except as noted)
Paramount Resources Ltd. 2017 Annual Results
The Apache Canada Acquisition was accounted for as a business combination in accordance with IFRS 3,
Business Combinations (ʺIFRS 3ʺ), using the acquisition method of accounting whereby all of the assets acquired and liabilities assumed were recorded at fair value. The allocation of the total consideration is preliminary and was based on estimates of fair value, except for deferred income tax amounts.
The purchase allocation is based on Management’s best estimate of fair value and has been retrospectively adjusted to reflect new information obtained about conditions that existed at the acquisition date. As a result of these adjustments, the purchase price allocation includes an increase of $45.0 million to property, plant and equipment, an increase of $45.0 million to asset retirement obligations, an increase of $182.9 million to deferred income tax asset and an increase of $182.9 million to the gain recorded on acquisition.
The following table summarizes the net assets acquired:
Cash consideration $ 486,852
Cash
$ 25,468 Accounts receivable 36,113
Prepaids 5,015
Exploration and evaluation 295,095
Property, plant and equipment 870,329
Deferred income tax asset 633,503 Accounts payable (59,632)
Asset retirement obligations (see also - note 10) (757,196) Provision (12,912) Net assets acquired 1,035,783
Gain on Apache Canada Acquisition (548,931) $ 486,852
The estimated asset retirement obligations were discounted using a credit-adjusted discount rate of approximately six percent. These obligations will be settled over the useful lives of the assets, which exceed 40 years. A $12.9 million provision was recorded in relation to Apache Canada’s head office lease, which expires in 2023, as a result of the difference between current market rates and the contractual rates under the lease. The gain on acquisition of $548.9 million is substantially attributable to the undiscounted nature of the deferred tax asset recognized in the purchase allocation.
Paramount incurred $7.3 million of transaction costs related to the Apache Canada Acquisition, which were recognized in transaction and reorganization costs in the statement of comprehensive income.
Since August 16, 2017, the Company recorded $123.0 million of petroleum and natural gas sales in respect of properties added through the Apache Canada Acquisition. The profit or loss for the same period is impracticable to determine.
5. Trilogy Energy Corp. Merger
On September 12, 2017, Paramount and Trilogy completed a merger transaction (the ʺTrilogy Mergerʺ) under which Paramount acquired all of the outstanding shares of Trilogy (ʺTrilogy Sharesʺ) not already owned by it in exchange for Common Shares, on the basis of one Common Share for every 3.75 Trilogy shares. Trilogy was, prior to the completion of the merger, a publicly traded petroleum and natural gas-focused Canadian energy corporation. Trilogy’s primary oil and gas assets were located in the Kaybob and Grande Prairie areas of Alberta. These Consolidated Financial Statements include the results of operations of Trilogy for the period following the closing of the transaction on September 12, 2017.
68

(Tabular amounts stated in $ thousands, except as noted)
Paramount Resources Ltd. 2017 Annual Results
The Trilogy Merger was accounted for as a business combination in accordance with IFRS 3, using the acquisition method of accounting whereby all of the assets acquired and liabilities assumed were recorded at fair value. The allocation of the total consideration is preliminary and was based on estimates of fair value, except for deferred income tax amounts.
The purchase allocation is based on Management’s best estimate of fair value and has been retrospectively adjusted to reflect new information obtained about conditions that existed at the acquisition date. As a result of these adjustments, the purchase price allocation includes a decrease of $23.7 million to exploration and evaluation assets, an increase of $35.1 million to property, plant and equipment and an increase of $11.5 million to asset retirement obligations.
The following table summarizes the net assets acquired:
Share consideration – Common Shares $ 603,275
Fair value of Trilogy Shares held immediately before the Trilogy Merger 107,783
Share-based compensation – Trilogy Options 3,196
Total consideration $ 714,254
Accounts receivable $ 18,513 Risk management assets 4,605
Prepaids 2,321
Exploration and evaluation 405,992
Property, plant and equipment 1,011,509
Accounts payable (51,033)
Bank credit facility (158,716)
7¼ percent senior unsecured notes due 2019 (306,750)
Asset retirement obligations (see also - note 10) (110,395)
Deferred income tax liability (101,792)
Net assets acquired $ 714,254
Pursuant to the Trilogy Merger, Paramount issued 28.5 million Common Shares which were ascribed a value of $21.14 per share based on the closing market price of the shares on the day immediately preceding the closing of the Trilogy Merger. The carrying value of the 19.1 million Trilogy Shares held by Paramount immediately prior to the Trilogy Merger was increased to fair value, resulting in the recognition of a gain of $61.8 million. Equity income of $1.9 million was recorded to September 12, 2017 in respect of Paramount’s investment in Trilogy (twelve months ended December 31, 2016 - $14.3 million equity loss).
Following the closing of the Trilogy Merger, holders of options to acquire Trilogy Shares (ʺTrilogy Optionsʺ) are entitled to purchase Common Shares rather than Trilogy Shares at an adjusted exercise price, based on the exchange ratio for the Trilogy Shares. As a result, the fair value of the vested Trilogy Options was recognized by Paramount as additional consideration, based on a Black-Scholes option value of $3.2 million.
The estimated asset retirement obligations were discounted using a credit-adjusted discount rate of approximately six percent. These obligations will be settled over the useful lives of the assets, which exceed 40 years.
Paramount incurred $3.1 million of transaction costs related to the Trilogy Merger, which were recognized in transaction and reorganization costs in the statement of comprehensive income.
69

(Tabular amounts stated in $ thousands, except as noted)
Paramount Resources Ltd. 2017 Annual Results
Since September 12, 2017, the Company recorded $66.4 million of petroleum and natural gas sales in respect of properties added through the Trilogy Merger. The profit or loss for the same period is impracticable to determine.
If the Apache Canada Acquisition and the Trilogy Merger had been completed on January 1, 2017, Paramount’s revenue for the twelve months ended December 31, 2017 would have been approximately $845 million (unaudited). Paramount’s revenue less transportation, NGLs processing and operating expenses would have been approximately $420 million (unaudited) for the twelve months ended December 31, 2017. The impact of the Apache Canada Acquisition and the Trilogy Merger on net income for the period is impracticable to determine.
This pro forma information is not necessarily indicative of results that would have been obtained if the Apache Canada Acquisition and the Trilogy Merger had actually occurred on January 1, 2017.
6. Exploration and Evaluation
Year ended December 31 2017 2016
Balance, beginning of year 301,530 363,724
Additions 14,276 48,141
Apache Canada Acquisition and Trilogy Merger 701,087 –
Change in asset retirement provision 4,304 2,942
Transfers to property, plant and equipment (6,283) (23,700)
Dry hole – (13,811)
Expired lease costs (8,869) (6,194)
Write-downs (196,610) (2,969)
Dispositions (23,671) (66,603)
Balance, end of year 785,764 301,530
Exploration and Evaluation Expense (Income)
Year ended December 31 2017 2016
Geological and geophysical 9,297 4,115
Dry hole – 13,811
Expired lease costs 8,869 6,194
Write-down of exploration and evaluation assets 196,610 2,969
Gain on sale of Cavalier Royalty – (99,160)
214,776 (72,071)
Write-downs of exploration and evaluation assets for the year ended December 31, 2017 include $184.6 million related to the de-recognition of the carrying value of shale gas properties in the Liard and Horn River basins (the "Shale Gas Project"). The write-down of the Shale Gas Project was due to, among other factors, the suspension of development activities by the Company and other operators in the region and delays and cancellations of proposed downstream liquid natural gas terminals to transport shale gas production to international markets.
In 2016, Cavalier granted a royalty (the "Cavalier Royalty") on its oil sands properties (the "Oil Sands Lands") to an unrelated third party for cash consideration of $100 million. A gain of $99.2 million was recorded in respect of the sale of the Cavalier Royalty in 2016, which was included in exploration and evaluation expense (income). The Cavalier Royalty is secured by a lien over the Oil Sands Lands.
70

(Tabular amounts stated in $ thousands, except as noted)
Paramount Resources Ltd. 2017 Annual Results
7. Property, Plant and Equipment
Year ended December 31, 2017
Petroleum and natural gas assets
Drilling rigs Other Total
Cost
Balance, December 31, 2016 1,982,438 156,437 30,435 2,169,310
Additions 532,511 716 3,526 536,753
Apache Canada Acquisition and Trilogy Merger 1,881,838 – – 1,881,838
ARO Discount Rate Adjustment (see note 10) 507,775 – – 507,775
Transfers from exploration and evaluation 6,283 – – 6,283
Dispositions (324,299) – (253) (324,552)
Change in asset retirement provision (16,418) – – (16,418)
Cost, December 31, 2017 4,570,128 157,153 33,708 4,760,989
Accumulated depletion, depreciation and write-downs
Balance, December 31, 2016 (1,208,652) (55,442) (22,492) (1,286,586)
Depletion and depreciation (335,516) (12,398) (1,854) (349,768)
Write-downs (89,860) – – (89,860)
Dispositions 247,562 – 205 247,767
Accumulated depletion, depreciation and write-downs, December 31, 2017 (1,386,466) (67,840) (24,141) (1,478,447)
Net book value, December 31, 2016 773,786 100,995 7,943 882,724
Net book value, December 31, 2017 3,183,662 89,313 9,567 3,282,542
Year ended December 31, 2016
Petroleum and natural gas assets
Drilling rigs Other Total
Cost
Balance, December 31, 2015 3,655,956 155,107 29,166 3,840,229
Additions 166,930 1,330 2,761 171,021
Transfers from exploration and evaluation 23,700 – – 23,700
Dispositions (1,873,123) – (1,492) (1,874,615)
Change in asset retirement provision 8,975 – – 8,975
Cost, December 31, 2016 1,982,438 156,437 30,435 2,169,310
Accumulated depletion, depreciation and write-downs
Balance, December 31, 2015 (1,741,988) (42,677) (21,211) (1,805,876)
Depletion and depreciation (203,706) (12,765) (1,520) (217,991)
Reversal of prior-years’ write-downs 133,246 – – 133,246
Dispositions 603,796 – 239 604,035
Accumulated depletion, depreciation and write-downs, December 31, 2016 (1,208,652) (55,442) (22,492) (1,286,586)
Net book value, December 31, 2015 1,913,968 112,430 7,955 2,034,353
Net book value, December 31, 2016 773,786 100,995 7,943 882,724
At December 31, 2017, $119.0 million (December 31, 2016 – $99.2 million) of capitalized costs related to incomplete development wells and infrastructure projects were not subject to depletion or depreciation.
In September 2017, Paramount closed the sale of its oil and gas properties in the Saddle Hills/Mirage area of Alberta for cash and other proceeds of $8.2 million and recorded a gain on sale of $27.4 million.
71

(Tabular amounts stated in $ thousands, except as noted)
Paramount Resources Ltd. 2017 Annual Results
In May 2017, Paramount closed the sale of its oil and gas properties in the Valhalla area of Alberta (the "Valhalla Assets") for gross cash proceeds of $151.3 million. A gain of $81.4 million was recorded in respect of the sale of the Valhalla Assets.
In April 2016, Paramount closed the sale of its natural gas processing facility and related midstream assets at Musreau/Kakwa for net cash proceeds of $560.3 million, resulting in the recognition of a gain on sale of $125.7 million. In August 2016, Paramount sold the majority of its oil and gas properties in the Musreau/Kakwa area for total consideration of approximately $2.1 billion (the "Musreau Disposition"). A gain on sale of approximately $1.2 billion was recorded in respect of the Musreau Disposition.
Depletion and Depreciation
Year ended December 31 2017 2016
Depletion and depreciation 344,258 209,661
Write-downs of property, plant and equipment (reversal of prior-years’ write-downs) 89,860 (133,246)
434,118 76,415
A reversal of previously recorded impairment charges of $42.1 million related to the Valhalla Assets was recorded in 2017 prior to accounting for the sale, representing the amount required to increase the carrying value of the assets to the amount that would have been determined, net of depletion and amortization, had no impairment charges been recognized in prior periods.
At December 31, 2017, the Company recorded an impairment write-down of $132.0 million related to petroleum and natural gas assets in the Northern CGU. The impairment write-down was recorded because the carrying value of the CGU exceeded its recoverable amount, which was estimated on a value in use basis based on expected net discounted future cash flows from the production of proved and probable reserves. The impairments resulted from a combination of decreases in estimated future net revenues due to lower forecasted natural gas prices and higher well costs than reserves values assigned.
Recoverable amounts were estimated using a discounted cash flow method (level three fair value hierarchy estimate). Cash flows were projected over the expected remaining productive life of the Northern CGU’s reserves, at an after-tax discount rate of 10.5 percent, resulting in an estimated recoverable amount of $22.1 million. Reserve estimates were prepared by Paramount’s independent qualified reserves evaluator. The forecast prices used to determine the recoverable amount reflect the following benchmark prices, adjusted for basis differentials to determine local reference prices, transportation costs and quality:
(Average for the period) 2018 2019 2020 2021 2022 2023-2032 Thereafter
Natural Gas
AECO ($/MMBtu) 2.25 2.65 3.05 3.40 3.60 3.65 – 4.35 +2%/yr
Henry Hub (US$/MMBtu) 3.00 3.05 3.25 3.55 3.80 3.85 – 4.60 +2%/yr
Crude Oil
Edmonton Light ($/Bbl) 70.10 71.30 74.90 80.50 82.80 84.40 – 100.90 +2%/yr
WTI (US$/Bbl) 58.50 58.70 62.40 69.00 73.10 74.50 – 89.10 +2%/yr
Foreign Exchange
$US / 1 $CDN 0.79 0.79 0.80 0.83 0.85 0.85 0.85
For the twelve months ended December 31, 2016, the Company recorded a $133.2 million reversal of previously recorded impairment charges related to petroleum and natural gas assets in the Grande Prairie CGU (as constituted in 2016 prior to the Apache Canada Acquisition and the Trilogy Merger). The impairment reversal resulted from an increase in the estimated recoverable amount of the Grande Prairie
72

(Tabular amounts stated in $ thousands, except as noted)
Paramount Resources Ltd. 2017 Annual Results
CGU at December 31, 2016 compared to December 31, 2015 as a result of an increase in development activities at Karr, improved well performance and improved economics.
8. Investments in Securities
As at December 31 2017 2016
Shares (000’s)
Market Value
Shares (000’s)
Market Value
MEG Energy Corp. 3,700 19,018 3,700 34,151
Other (1) 34,297 30,042
53,315 64,193 (1) Includes investments in Blackbird Energy Inc., Marquee Energy Ltd., Storm Resources Ltd., Strategic Oil & Gas Ltd., and other public and private corporations.
Investments in publicly traded securities are carried at their period-end trading prices, which are level one fair value hierarchy inputs. The estimated fair value of the Company’s investments in the shares of private oil and gas companies are based on equity issuances and other indications of value from time-to-time (level three fair value hierarchy inputs).
For the twelve months ended December 31, 2017 aggregate unrealized losses of $12.6 million related to the Company’s investments in MEG Energy Corp., Blackbird Energy Inc., Marquee Energy Ltd., Storm Resources Ltd., and other securities previously recorded in OCI were charged to net income as a result of significant decreases in the market prices of the securities. For the twelve months ended December 31, 2016, aggregate unrealized losses of $11.2 million related to the Company’s investments in MEG Energy Corp., Marquee Energy Ltd., and other securities previously recorded in OCI were charged to earnings.
9. Long-Term Debt
As at December 31 2017 2016
Paramount Facility 395,000 – 2019 Senior Notes ($300 million principal amount) 306,750 –
701,750 –
Paramount Facility
As at December 31, 2017, the Company had a $700 million financial covenant-based senior secured revolving bank credit facility (the ʺParamount Facilityʺ). The maturity date of the Paramount Facility is currently November 6, 2021, which may be extended from time-to-time at the option of Paramount and with the agreement of the lenders.
Borrowings under the Paramount Facility bear interest at the lenders’ prime lending rates, US base rates, bankers’ acceptance rates, or LIBOR rates, as selected at the discretion of the Company, plus an applicable margin which is dependent upon the Company’s Senior Secured Debt to Consolidated EBITDA ratio. The Paramount Facility is secured by a charge over substantially all of the assets of Paramount, excluding the assets of Cavalier and Fox Drilling.
As at December 31, 2017, Paramount was subject to the following two financial covenants under the Paramount Facility, which are tested at the end of each fiscal quarter:
i. Senior Secured Debt to Consolidated EBITDA to be 3.00 to 1.00 or less (or 3.50 to 1.00 or less for two full fiscal quarters after completion of a material acquisition); and
73

(Tabular amounts stated in $ thousands, except as noted)
Paramount Resources Ltd. 2017 Annual Results
ii. Consolidated EBITDA to Consolidated Interest Expense to be 2.50 to 1.00 or greater.
Senior Secured Debt currently consists of amounts drawn under the Paramount Facility and the undrawn face amount of outstanding letters of credit. Consolidated EBITDA is determined on a trailing twelve month basis, is adjusted for material acquisitions and dispositions, and is generally calculated as net income before Consolidated Interest Expense, taxes, depletion, depreciation, amortization, impairment and exploration and evaluation expense and is also adjusted to exclude non-recurring items and other non-cash items including unrealized mark-to-market amounts on derivatives, unrealized foreign exchange, share-based compensation expense and accretion. Consolidated Interest Expense is reduced by any interest income and other customary exclusions and is calculated on a trailing twelve-month basis. Paramount is in compliance with all covenants under the Paramount Facility.
Paramount had undrawn letters of credit outstanding totaling $36.6 million at December 31, 2017 that reduce the amount available to be drawn on the Paramount Facility.
Senior Unsecured Notes
Paramount has $300 million outstanding principal amount of senior unsecured notes due 2019 (the "2019 Senior Notes"). The 2019 Senior Notes were issued by Trilogy in late 2012 and became Paramount’s notes through its acquisition of, and subsequent amalgamation with, Trilogy.
The 2019 Senior Notes bear interest at 7¼% per annum, payable semi-annually in arrears on June 13 and December 13 of each year, and mature on December 13, 2019.
As of January 1, 2018, the 2019 Senior Notes were direct senior unsecured obligations of Paramount. The 2019 Senior Notes are redeemable in whole or in part at par, plus accrued and unpaid interest to the date of redemption, plus a redemption premium, if applicable, which varies based on the date of redemption.
At December 31, 2017, the 2019 Senior Notes had a market value of 102.0% of their principal amount. The market value of the 2019 Senior Notes was estimated using a market approach based on prices quoted by financial institutions, which are level two fair value hierarchy inputs.
In 2016, the Company redeemed all $450 million aggregate principal amount of its 7⅝% senior unsecured notes due 2019 and was discharged and released from all obligations and covenants relating to such notes. In connection with the Musreau Disposition in 2016, the acquiror assumed all US$450 million aggregate principal amount of Paramount’s 6⅞% senior unsecured notes due 2023 (the "2023 Notes") and the Company was discharged and released from all obligations and covenants relating to such notes. Debt extinguishment expense for the year ended December 31, 2016 includes aggregate redemption premiums totaling $13.5 million and $13.9 million of unamortized financing fees related to such notes.
Trilogy Facility
At closing of the Trilogy Merger on September 12, 2017, Trilogy had a $285 million senior secured revolving credit facility with a syndicate of Canadian banks (the "Trilogy Facility"). In November 2017, the Trilogy Facility was repaid in full and cancelled.
74

(Tabular amounts stated in $ thousands, except as noted)
Paramount Resources Ltd. 2017 Annual Results
10. Asset Retirement Obligations and Other
Year ended December 31 2017 2016
Asset retirement obligations – long-term 1,642,194 204,413
Other liabilities 18,879 –
1,661,073 204,413
Asset Retirement Obligations
Year ended December 31 2017 2016
Asset retirement obligations, beginning of year 212,309 273,580
Retirement obligations incurred 6,003 6,616
Apache Canada Acquisition and Trilogy Merger 867,591 –
ARO Discount Rate Adjustment 665,998 –
Revisions to estimated retirement costs (20,421) 5,301
Obligations settled (21,450) (1,753)
Dispositions (55,806) (76,057)
Accretion expense 15,970 4,622
Asset retirement obligations, end of year 1,670,194 212,309
Asset retirement obligations – current 28,000 7,896
Asset retirement obligations – long-term 1,642,194 204,413
1,670,194 212,309
At December 31, 2017, estimated undiscounted asset retirement obligations were $1,752.0 million (December 31, 2016 – $212.3 million), which have been discounted using a weighted average risk-free rate of 2.25 percent (December 31, 2016 – 2.0 percent) and an inflation rate of 2.0 percent (December 31, 2016 – 2.0 percent). These obligations will be settled over the useful lives of the assets, which extend up to 53 years.
Asset retirement obligations of $757.2 million and $110.4 million recognized in the purchase allocations in respect of Apache Canada and Trilogy, respectively, were subsequently remeasured in accordance with Paramount’s accounting policy to reflect the discounting of such amounts using a weighted average risk-free discount rate of 2.25 percent (the ʺARO Discount Rate Adjustmentʺ). As a result of the ARO Discount Rate Adjustment, the carrying value of the estimated asset retirement obligations recorded in the purchase price allocations was subsequently increased by an aggregate of $666.0 million.
The ARO Discount Rate Adjustment resulted in a corresponding increase to the carrying value of property, plant and equipment, except for properties with a nil carrying value, where the corresponding amount related to the ARO Discount Rate Adjustment was recorded as a charge to net income. As a result of the ARO Discount Rate Adjustment, the carrying value of property, plant and equipment was increased by $507.8 million and a charge of $158.2 million was recorded to net income.
Other Liabilities
Other liabilities include the long-term portion of the provision recorded in respect of the Apache Canada office lease (see note 4), and the long-term portion of a provision recognized in respect of unoccupied office space. Paramount relocated its corporate offices following the closing of the Apache Canada Acquisition and the Trilogy Merger, which resulted in the Company being subject to leases for unoccupied office space. As a result, a $11.2 million provision was recorded at December 31, 2017 in respect of the remaining
75

(Tabular amounts stated in $ thousands, except as noted)
Paramount Resources Ltd. 2017 Annual Results
obligations under the leases, which expire in 2022. A corresponding $11.2 million charge was recorded in Transaction and Reorganization costs in respect of the unutilized office space provision.
11. Share Capital
Paramount’s authorized share capital consists of an unlimited number of Common Shares without par value and an unlimited number of preferred shares issuable in series. At December 31, 2017, 134,712,907 (December 31, 2016 – 105,784,070) Common Shares of the Company were outstanding, net of 345,904 (December 31, 2016 – 2,865) Common Shares held in trust under the restricted share unit plan, and no preferred shares were outstanding.
In September 2017, Paramount issued 28,537,134 Common Shares pursuant to the Trilogy Merger (see note 5).
In December 2017, Paramount implemented a normal course issuer bid (the ʺ2018 NCIBʺ) under which the Company may purchase up to 7,497,530 Common Shares for cancellation. Between January 1, 2018 and March 7, 2018, the Company has purchased and cancelled 1,454,100 Common Shares at a total cost of $27.4 million under the 2018 NCIB. The 2018 NCIB will terminate on the earlier of: (i) December 21, 2018; and (ii) the date on which the maximum number of Common Shares that can be acquired pursuant to the 2018 NCIB are purchased.
Paramount previously implemented a normal course issuer bid in October 2016 (the ʺ2016 NCIB”). The Company purchased and cancelled 622,900 Common Shares in 2016 at a total cost of $9.7 million under the 2016 NCIB. The 2016 NCIB expired in October 2017.
In December 2016, the Company’s Board of Directors declared a dividend of 3.8 million common shares of Seven Generations Energy Ltd. (ʺ7Gen Sharesʺ) to holders of record of Paramount’s Common Shares on January 9, 2017 (the ̋ January 2017 Dividendʺ), resulting in an entitlement of approximately 0.036 of a 7Gen Share for each Common Share, subject to rounding for fractions. The dividend was paid on January 16, 2017.
Weighted Average Common Shares
Year ended December 31 2017 2016
Wtd. Avg Shares (000’s) Net income
Wtd. Avg Shares (000’s) Net income
Net income – basic 114,852 183,361 106,157 1,165,275
Dilutive effect of Paramount Options 922 – 235 –
Net income – diluted 115,774 183,361 106,392 1,165,275
Outstanding stock options that can be exchanged for the Company’s Common Shares are potentially dilutive and are included in Paramount’s diluted per share calculations when they are dilutive to net income per share. There were 10.0 million options to acquire Paramount Common Shares outstanding at December 31, 2017 (December 31, 2016 – 4.3 million), of which 8.1 million (December 31, 2016 – 2.3 million) were anti-dilutive.
76

(Tabular amounts stated in $ thousands, except as noted)
Paramount Resources Ltd. 2017 Annual Results
12. Reserves
Reserves at December 31, 2017 include unrealized gains and losses related to changes in the market value of investments in securities and contributed surplus amounts in respect of Paramount Options and Cavalier Options. The changes in reserves are as follows:
Year ended December 31, 2017
Unrealized gains
on securities Contributed
surplus Total
reserves
Balance, beginning of year 31,724 115,775 147,499 Other comprehensive loss (16,120) – (16,120)
Share-based compensation – 11,743 11,743
Share-based compensation assumed on Trilogy Merger (see Note 5) – 3,196 3,196
Options exercised – (2,739) (2,739)
Balance, end of year 15,604 127,975 143,579
Year ended December 31, 2016
Unrealized gains
on securities Contributed
surplus Total
reserves
Balance, beginning of year 8,637 90,700 99,337
Other comprehensive income 23,087 – 23,087
Share-based compensation – 25,674 25,674
Options exercised – (599) (599)
Balance, end of year 31,724 115,775 147,499
13. Share-Based Compensation
Options to Acquire Common Shares of Paramount (ʺParamount Optionsʺ)
2017 2016
Weighted average exercise
price
Weighted average exercise
price
Number ($/share) Number ($/share)
Balance, beginning of period 4,322,120 13.00 7,238,650 34.66
Granted 5,475,000 20.48 4,565,100 12.74
Trilogy Merger (1) 1,362,375 26.75 – –
Exercised (2) (734,742) 9.27 (175,840) 8.34
Cancelled (395,833) 15.61 (6,227,300) 35.41
Forfeited – – (148,040) 21.05
Expired – – (930,450) 29.83
Balance, end of year 10,028,920 19.12 4,322,120 13.00
Options exercisable, end of year 1,986,388 18.72 811,740 8.26
(1) In connection with the Trilogy Merger, Trilogy Options were amended to provide the holders thereof the right to acquire the number of whole Paramount Common Shares determined by dividing the number of Trilogy common shares subject to such Trilogy Options by 3.75 at an adjusted exercise price approximately equal to the exercise price of such Trilogy Options multiplied by 3.75. As at September 12, 2017, 5.1 million Trilogy Options were outstanding at a weighted average exercise price of $7.13 per Trilogy Option.
(2) For Paramount Options exercised during the twelve months ended December 31, 2017, the weighted average market price of Paramount’s Common Shares on the dates exercised was $19.97 (2016 – $16.41).
77

(Tabular amounts stated in $ thousands, except as noted)
Paramount Resources Ltd. 2017 Annual Results
Share-based compensation expense for the year ended December 31, 2016 includes $13.8 million related to Paramount Options cancelled in the year.
The weighted average remaining contractual life and exercise prices of Paramount Options outstanding as of December 31, 2017 are as follows:
Awards Outstanding
Exercise Prices Number
Remaining contractual
life (years)
Weighted average exercise
price
$8.17 - $18.23 3,914,350 3.4 14.29 $18.24 - $19.94 3,145,000 5.3 19.94 $19.95 - $39.00 2,969,570 4.1 24.63
10,028,920 4.2 19.12
The grant date fair value of Paramount Options was estimated using the Black-Scholes-Merton model incorporating the following weighted average inputs:
Options awarded in
2017
Options awarded in
2016
Weighted average exercise price ($ / share) 20.48 12.74 Volatility (%) 40.1 53.9 Expected life of share options (years) 3.6 3.7 Pre-vest annual forfeiture rate (%) 10.7 6.1 Risk-free interest rate (%) 1.6 0.7 Expected dividend yield (%) nil nil Weighted average fair value of awards per option ($ / option) 6.31 4.79
The estimated expected life of Paramount Options is based on historical exercise patterns. Volatility is generally estimated based on the historical volatility of the trading price of the Company’s Common Shares over the most recent period that is commensurate with the expected term of the option, and may be normalized for significant transactions and other factors.
Cavalier Options
During the first quarter of 2017, Cavalier granted 5.0 million Cavalier Options, which vest over five years and expire 7.7 years from the grant date.
The grant date fair value of Cavalier Options awarded was estimated using the Black-Scholes-Merton model, incorporating the following inputs: expected volatility 57%, expected life 7.7 years, risk-free interest rate of 1.4%, pre-vest forfeiture rate of nil, and expected dividend yield of nil.
As Cavalier is a private company, expected volatility is estimated based on the average historical volatility of the trading price of a group of publicly traded oil sands companies over the most recent period that is generally commensurate with the expected term of the option.
78

(Tabular amounts stated in $ thousands, except as noted)
Paramount Resources Ltd. 2017 Annual Results
Restricted Share Unit Plan – Shares Held in Trust
2017 2016
Year ended December 31 Shares (000’s)
Shares (000’s)
Balance, beginning of year 3 9 22 135
Shares purchased 496 11,370 – –
Change in vested and unvested shares (153) (9,013) (19) (126)
Balance, end of year 346 2,366 3 9
Employee Benefit Costs
Year ended December 31 2017 2016
Stock option plans 11,743 25,674
Restricted share unit plan 6,098 2,097
Share-based compensation expense 17,841 27,771
Salaries and benefits, net of recoveries 32,104 18,015
49,945 45,786
14. Income Tax
The following table reconciles income taxes calculated at the Canadian statutory rate to Paramount’s recorded income tax expense:
Year ended December 31 2017 2016
Income before tax 44,504 1,321,369
Effective Canadian statutory income tax rate 27.0% 27.0%
Expected income tax expense 12,016 356,770
Effect on income taxes of:
Gain on sale of oil and gas assets – (11,610)
(Income) loss from equity-accounted investment (17,207) 3,865
Gain on Apache Canada Acquisition (148,211) –
Write-down of investments in securities 3,392 3,034
Change in unrecognized deferred income tax asset 844 (186,657)
Share-based compensation 3,170 6,932
Unrealized foreign exchange on 2023 Notes – (13,995)
Non-deductible items and other 7,139 (2,245)
Income tax expense (recovery) (138,857) 156,094
The following table summarizes the temporary differences that give rise to the deferred income tax asset (liability):
As at December 31 2017 2016
Property, plant and equipment (773,979) (241,779)
Asset retirement obligations 456,050 56,837
Non-capital losses and scientific research & experimental development 973,064 177,474
Other 11,269 1,343
Deferred income tax asset (liability) 666,404 (6,125)
79

(Tabular amounts stated in $ thousands, except as noted)
Paramount Resources Ltd. 2017 Annual Results
The following table summarizes movements of the deferred income tax asset (liability) during the year:
Year ended December 31 2017 2016
Deferred income tax asset (liability), beginning of year (6,125) 154,823
Deferred income tax recovery (expense) 138,857 (156,094)
Deferred income tax recovery (expense) included in OCI 947 (1,276)
Flow-through share renunciations – (4,065)
Apache Canada Acquisition and Trilogy Merger 531,711 –
Other 1,014 487
Deferred income tax asset (liability), end of year 666,404 (6,125)
As of December 31, 2017, Paramount has approximately $3.3 billion (2016 – $0.7 billion) of unused non-capital losses that expire between 2032 and 2037. The Company has $167.3 million (2016 – $311.0 million) of deductible temporary differences in respect of investments for which no deferred income tax asset has been recorded.
15. Financial Instruments and Risk Management
Financial Instruments
Financial instruments at December 31, 2017 consisted of cash and cash equivalents, accounts receivable, investments in securities, accounts payable and accrued liabilities, risk management liabilities and long-term debt.
Risk Management
The Company had the following financial commodity contracts in place as at December 31, 2017:
The fair values of risk management financial instruments are estimated using a market approach incorporating level two fair value hierarchy inputs, including forward market curves and price quotes for similar instruments, provided by financial institutions.
Changes in the fair value of risk management assets and liabilities are as follows:
Year ended December 31 2017 2016
Fair value, beginning of year (5,180) 40,207
Changes in fair value (4,059) 253
Settlements received (14,426) (45,640)
Assumed on Trilogy Merger (see Note 5) 4,605 –
Fair value, end of year (19,060) (5,180)
Instruments Aggregate notional Average fixed price Fair value Term
Oil – NYMEX WTI Swaps (Sale) 16,000 Bbl/d CDN$71.06/Bbl (19,060) January 2018 – December 2018
80

(Tabular amounts stated in $ thousands, except as noted)
Paramount Resources Ltd. 2017 Annual Results
Subsequent to December 31, 2017, the Company entered into the following financial commodity contracts:
Instruments Aggregate notional Average fixed price Term
Oil – NYMEX WTI Swaps (Sale) 6,000 Bbl/d CDN$71.23/Bbl January 2019 – December 2019
Paramount is exposed to market risks where the fair values or future cash flows of financial instruments are impacted by changes in underlying market prices.
Commodity Price Risk
Paramount uses financial commodity contracts from time-to-time to manage exposure to commodity price volatility. The Company is exposed to commodity price risk on these instruments, as changes in underlying commodity prices will impact the market values of the contracts and ultimately the amounts received or paid upon settlement.
A $5.00 per barrel increase or decrease in oil prices, assuming all other variables are held constant, would have impacted Paramount’s net earnings for the year ended December 31, 2017 by $29.2 million.
Foreign Currency Risk
Paramount is exposed to foreign currency risk on financial instruments denominated in US dollars including cash and cash equivalents, accounts receivable, and accounts payable and accrued liabilities.
Sales prices for natural gas, crude oil and natural gas liquids and the value of financial commodity contracts denominated in Canadian dollars are determined with reference to US benchmark prices, therefore a weakening of the Canadian dollar relative to the US dollar will increase the revenue received in Canadian dollars for the sale of Company’s production and the value of such financial commodity contracts. Paramount’s expenditures are primarily in Canadian dollars, but include equipment and other items sourced from the United States and settled in US dollars.
Credit Risk
Paramount is exposed to credit risk on its financial instruments where a financial loss would be experienced if a counterparty to a financial asset failed to meet its obligations. The Company manages credit risk by endeavoring to enter into contracts with counterparties that possess high credit ratings, employing net settlement agreements, employing letters of credit and limiting available credit when necessary. The maximum credit risk exposure at December 31, 2017 is limited to the carrying value of cash and cash equivalents and accounts receivable.
Paramount’s primary objectives with respect to cash and cash equivalents are to minimize financial risk and maintain high liquidity. The Company’s cash and cash equivalents are deposited with financial institutions with investment grade credit ratings and are highly liquid. Accounts receivable include balances due from customers and partners in the oil and gas industry and are subject to normal industry credit risk.
For the year ended December 31, 2017, the Company had sales to four customers which exceeded ten percent of total revenue. Such sales totaled $83.0 million, $64.6 million, $62.0 million and $48.2 million respectively.
81

(Tabular amounts stated in $ thousands, except as noted)
Paramount Resources Ltd. 2017 Annual Results
Interest Rate Risk
Paramount is exposed to interest rate risk from time-to-time on outstanding balances on its floating rate bank credit facilities and on interest bearing cash and cash equivalents. A one percent increase or decrease in interest rates would have impacted Paramount’s net earnings for the year ended December 31, 2017 by approximately $0.8 million (2016 – $2.9 million) based on the average floating rate credit facility balances outstanding during the year. Paramount’s senior notes bear interest at fixed rates and are subject to fair value changes as market interest rates change.
Liquidity Risk
Liquidity risk is the risk that Paramount will be unable to meet its financial obligations. The Company manages liquidity risk by ensuring that it has sufficient cash and cash equivalents, credit facilities and other financial resources available to meet its obligations.
The Company forecasts cash flows for a period of at least 12 months to identify financial requirements. These requirements are met through a combination of cash flows from operations, cash and cash equivalents, and if required, credit facilities, the sale of assets and capital market transactions.
The Company’s contractual obligations related to financial liabilities are as follows:
2018 2019 2020 2021 Total
Accounts payable & accrued liabilities 237,181 – – – 237,181
Risk management liabilities 19,060 – – – 19,060
Credit Facility (1) – – – 395,000 395,000
2019 Senior Notes (2) 21,750 320,618 – – 342,368
277,991 320,618 – 395,000 993,609
(1) Excluding interest. (2) Including interest.
Accounts Payable and Accrued Liabilities
As at December 31 2017 2016
Trade and accrued payables 221,888 80,869
Joint operation and other payables 13,926 481
Interest payable and financing costs 1,367 235
237,181 81,585
Trade and accrued payables and joint operation and other payables are non-interest bearing and are normally settled within 30 to 60 days.
Accounts Receivable
As at December 31 2017 2016
Revenue receivable 105,897 11,586
Joint operation receivable and other 64,416 12,309
170,313 23,895
Revenue receivable and joint operation receivables are non-interest bearing and are generally settled on 30 day terms.
82

(Tabular amounts stated in $ thousands, except as noted)
Paramount Resources Ltd. 2017 Annual Results
In estimating the recoverability of joint operation receivables, the Company performs a risk analysis considering the type and age of the outstanding receivables and the credit worthiness of the counterparties. The Company has determined that there was no impairment of joint operation receivables as at December 31, 2017.
16. Other Income (Loss)
Year ended December 31 2017 2016
Interest income 4,700 955
Decrease in market value of securities distributed (10,450) –
Write-down of investments in securities (12,561) (11,235)
Other 3,987 (579)
(14,324) (10,859)
The decrease in the fair value of Paramount’s investment in 3.8 million 7Gen Shares of $10.5 million between the acquisition date and the January 2017 Dividend was reclassified from accumulated other comprehensive income to earnings in January 2017. An associated income tax recovery of $1.4 million was also reclassified to earnings. The value ascribed to the dividend as at December 31, 2016 of $119.0 million was reduced by $19.1 million in January 2017 due to a decrease in the market price of 7Gen Shares prior to distribution, which was recorded as an increase in Retained Earnings.
17. Consolidated Statement of Cash Flows - Selected Information
Items Not Involving Cash
Year ended December 31 2017 2016
Commodity contracts 18,485 45,387
Share-based compensation 17,840 27,771
Depletion and depreciation 434,118 76,415
Exploration and evaluation 205,479 (76,186)
Gain on sale of oil and gas assets (123,966) (1,379,965)
Accretion of asset retirement obligations 15,970 4,622
Foreign exchange 259 (43,154)
(Income) loss from equity-accounted investments (63,729) 14,316
Gain on Apache Canada Acquisition (548,931) –
ARO Discount Rate Adjustment 158,223 –
Write-down of investments in securities 12,561 11,235
Decrease in market value of securities distributed 10,450 –
Deferred income tax (138,857) 156,094
Other (2,381) 2,178
(4,479) (1,161,287)
83

(Tabular amounts stated in $ thousands, except as noted)
Paramount Resources Ltd. 2017 Annual Results
Supplemental Cash Flow Information
Year ended December 31 2017 2016
Interest paid 14,629 71,070
Components of cash and cash equivalents
As at December 31 2017 2016
Cash 114,895 76,575
Cash equivalents 8,434 545,297
123,329 621,872
18. Capital Structure
Paramount’s primary objectives in managing its capital structure are to:
i. maintain a flexible capital structure which optimizes the cost of capital at an acceptable level of risk; ii. maintain sufficient liquidity to support ongoing operations, capital expenditure programs, strategic
initiatives and the repayment of debt obligations when due; and iii. maximize shareholder returns.
Paramount manages its capital structure to support current and future business plans and periodically adjusts the structure in response to changes in economic conditions and the risk characteristics of the Company’s underlying assets and operations. Paramount monitors metrics such as the Company’s Senior Secured Debt to Consolidated EBITDA, Consolidated EBITDA to Consolidated Interest Expense, debt-to-equity and debt-to-cash flow ratios, among others, to measure the status of its capital structure. The Company has not established fixed quantitative thresholds for such metrics. The capital structure may be adjusted by issuing or repurchasing shares, altering debt levels, modifying capital spending programs, acquiring or disposing of assets and participating in joint ventures, the availability of any such means being dependent upon market conditions.
Paramount’s capital structure consists of the following:
As at December 31 2017 2016
Adjusted working capital surplus (1) (65,508) (565,897)
Paramount Facility 395,000 –
2019 Senior Notes 306,750 –
Net debt (cash) 636,242 (565,897)
Share capital 2,249,746 1,639,466
Retained earnings (accumulated deficit) 50,325 (152,182)
Reserves 143,579 147,499
Total Capital 3,079,892 1,068,886
(1) Adjusted working capital excludes risk management liabilities and the current portion of asset retirement obligations.
19. Related Party Transactions
Compensation of Key Management Personnel
Year ended December 31 2017 2016
Salaries and benefits 2,554 3,038
Share-based compensation 6,439 9,018
8,993 12,056
84

(Tabular amounts stated in $ thousands, except as noted)
Paramount Resources Ltd. 2017 Annual Results
20. Commitments and Contingencies
Paramount had the following commitments as at December 31, 2017:
Within one
year
After one
year but not
more than
five years
More than
five years
Petroleum and natural gas transportation and processing commitments (1) 121,345 650,585 537,671 Operating leases and other (2) 9,515 12,537 189
130,860 663,122 537,860
(1) Certain of the transportation and processing commitments are secured by outstanding letters of credit totaling $19.8 million at December 31, 2017 (December 31, 2016 – $5.1 million).
(2) Future lease commitments for corporate office space have been reduced for sublease revenue and the impact of provisions recorded in respect of a market rate adjustment and unoccupied office space.
Operating Lease Commitment
Paramount’s corporate office space leases expire in 2022 and 2023. The Company incurred office lease costs of $7.3 million in 2017 (2016 – $3.7 million).
Contingencies
In the normal course of Paramount’s operations, the Company may become involved in, named as a party to, or be the subject of, various legal proceedings, including regulatory proceedings, tax proceedings and legal actions. The outcome of outstanding, pending or future proceedings cannot be predicted with certainty. Paramount does not anticipate that these claims will have a material impact on its financial position.
In 2016, a release occurred from a non-operated pipeline in which the Company owns a 50 percent interest. The operator, and owner of the remaining 50 percent, has initiated response, containment and remediation activities ("Response Activities"). Total costs to complete the Response Activities are estimated at approximately $60 million. It is Paramount’s assessment that it is not responsible for the costs of the Response Activities and as a result, no provision has been recorded in the Company’s financial statements.
Tax and royalty legislation and regulations, and government interpretation and administration thereof, continually changes. As a result, there are often tax and royalty matters under review by relevant government authorities. All tax and royalty filings are subject to subsequent government audit and potential reassessments. Accordingly, the final amounts may differ materially from amounts estimated and recorded.
21. Subsequent Event
In March 2018, the Paramount Facility was increased by $500 million to $1.2 billion and the Senior Secured Debt to Consolidated EBITDA financial covenant in such facility was amended as follows:
• Senior Secured Debt to Consolidated EBITDA to be 3.50 to 1.00 or less (or 4.00 to 1.00 or less for two full fiscal quarters after completion of a material acquisition).
At Paramount’s request, the size of the Paramount Facility can be further increased by up to $300 million (to $1.5 billion) pursuant to an accordion feature in such facility, subject to securing incremental lender commitments.
85

(Tabular amounts stated in $ thousands, except as noted)
Paramount Resources Ltd. 2017 Annual Results
In March 2018, the Company delivered a redemption notice to redeem all $300 million outstanding principal amount of its 2019 Senior Notes. The redemption will be funded using the upsized Paramount Facility and completed in early April 2018.
86