Embed Size (px)
Citation preview

978–0–19–956578–8 00-ADB-2-Main-drv African Development Bank2 (Typeset by SPi, Chennai) 13 of 233 July 29, 2009 15:25
2
Oil and Gas in Africa
Africa has historically been referred to as a continentwith rich natural resources but with high levels ofpoverty. Indeed, Africa is considered to be well-endowedwith minerals, including fossil fuels, although the exacteconomic potential of these resources is not known.New discoveries of oil and gas in Africa—in locationsnever before thought to hold such resources in signifi-cant amounts—prove that the continent is still “virgin”in many aspects regarding exploration and exploitationof oil and gas resources.
2.1 The International Perspective
This chapter briefly reviews major developments inthe oil and gas sector in the context of developmentsin global energy markets over the last 40 years. The
13
978–0–19–956578–8 00-ADB-2-Main-drv African Development Bank2 (Typeset by SPi, Chennai) 14 of 233 July 29, 2009 15:25
Oil and Gas in Africa
discussion focuses on the dynamics of oil and gas mar-kets over the last ten years, during which Africa has beenplaying an increasingly important role.
2.1.1 Evolution of World Energy Markets
The evolution of world energy markets in the post-1970period has been dramatic and its impact on the worldeconomy and on politics profound. This is illustratedby the worldwide economic ripple effects caused bythe volatility and occasional spectacular spikes in theprices of dominant global energy resources such as oiland gas. Another major trend with significant impacthas been the fundamental changes in the structure,conduct, and performance of the oil and gas sector—including considerable improvements in oil and gastechnology, unprecedented consolidation among multi-national oil companies, increasing global price trans-parency implicit in oil trade, new market fundamentals,and environmental considerations. The transition froma seller’s market environment (in the early 1970s), firstcontrolled and managed by multinational oil compa-nies and subsequently by major net oil-exporting coun-tries (OPEC), to a buyer’s market illustrates the pro-found changes that occurred in the oil industry duringthe period spanning the 1970s to the late 1990s. Theseissues are further explored in the following section,which focuses on oil prices and on post-1990 events inparticular.
14

978–0–19–956578–8 00-ADB-2-Main-drv African Development Bank2 (Typeset by SPi, Chennai) 15 of 233 July 29, 2009 15:25
Oil and Gas in Africa
0
20
40
60
80
100
120
140
160
1989
M1
1989
M8
1990
M3
1990
M10
1991
M5
1991
M12
1992
M7
1993
M2
1993
M9
1994
M4
1994
M11
1995
M6
1996
M1
1996
M8
1997
M3
1997
M10
1998
M5
1998
M12
1999
M7
2000
M2
2000
M9
2001
M4
2001
M11
2002
M6
2003
M1
2003
M8
2004
M3
2004
M10
2005
M5
2005
M12
2006
M7
2007
M2
2007
M9
2008
M4
2008
M11
Months/Years
US
$
Figure 2.1: Crude Oil Spot Price between 1989 and 2008
Source: Authors, from IMF Commodity Prices Database, January 2009.
2.1.2 Trends in Prices of Crude Oil and Petroleum Products
Crude oil prices exhibit wide swings in times ofshortage or excess supply. The crude oil price cycle(Figure 2.1) may extend over several years, even decades,responding to changes in overall geopolitical develop-ments and to demand and supply trends. Understandingand distinguishing among the factors affecting short-and long-term behavior has been the subject of muchdiscussion since the 1970s. The stylized facts aboutglobal energy have been widely documented; however,the scope of this publication does not allow furtherelaboration on the debate. This report briefly exam-ines the recent dynamics in the industry, as highlightedby price changes and industry structure, conduct, and
15

978–0–19–956578–8 00-ADB-2-Main-drv African Development Bank2 (Typeset by SPi, Chennai) 16 of 233 July 29, 2009 15:25
Oil and Gas in Africa
performance. It also draws some emerging lessons fromthese developments.
The dramatic rise in crude oil prices in 1973–74marked a new era in the industry. The rise in oil priceswas triggered in part by the supply shortage associ-ated with the oil embargo imposed on some major oil-consuming countries—as a result of the Middle Eastcrisis—and the transfer of oil property rights from multi-national oil companies to oil-producing countries. It isworth noting that oil price increases in 1973–74 and1979–80 signaled the end of the era of inexpensiveenergy in general. The nominal price of oil, which wasbelow $2 per barrel in 1970, rose to over $40 in 1981, tojust over $147 in July 2008 and to about $42 per barrelin February 2009. Indeed, since the beginning of thisdecade, and over the past two years in particular, worldoil and gas prices have risen to new historic heights. Pre-dictably, the prices of petroleum products have also sky-rocketed, triggered partly by the development in crudeoil prices.
The prices of natural gas imports, which averaged lessthan $2 per thousand cubic feet in the 1990s, jumpedto $4 in 2001, and doubled to an annual average of $8in 2005. Overall, large increases in gas prices in the pastdecade ushered in a new era with considerably higherenergy prices. However, because natural gas does nothave the same political profile as crude oil, its mar-ket development has been less contentious. Natural gasprices, like oil prices, have also experienced volatilitysince 1990. For example, the price of U.S. natural gas
16
978–0–19–956578–8 00-ADB-2-Main-drv African Development Bank2 (Typeset by SPi, Chennai) 17 of 233 July 29, 2009 15:25
Oil and Gas in Africa
imports fell by about 37 percent in September 2008, froma peak of $11.99 in October 2005.
2.1.3 Market Dynamics: Emerging Trends
The behavior of crude oil prices can be viewed fromtwo broad perspectives: prior to 1973 and post 1973.During the first period, prices exhibited long-term sta-bility. The multinational oil companies in control of theindustry at that time managed market supply of crudeto avoid substantial excess supply that could destabilizethe market. The playing field has changed significantlysince the 1970s. A series of events were fundamental tothe radical changes in market structure. First, oil propertyrights were transferred from multinational oil compa-nies to OPEC oil-producing countries. Second, the oilprice increases of the 1970s, coupled with extremelyhigh taxes on oil in the major OECD consuming coun-tries, helped trigger demand and supply responses thateventually produced the first major market slump in the1980s. However, increasingly in recent years, the supplyresponse to increased demand has been weak, inducinghigher price volatility.
In recent years, several factors have led to the currentstate of the oil market, which is characterized by volatileand high prices for crude oil and petroleum products.These factors include:
� Rise in demand in emerging economies, especially inChina and India;
17

978–0–19–956578–8 00-ADB-2-Main-drv African Development Bank2 (Typeset by SPi, Chennai) 18 of 233 July 29, 2009 15:25
Oil and Gas in Africa
� Decline in the spare capacity of major producingcountries and the peaking of production in severalimportant oil-producing areas (such as the North Seaand North America);
� Decline in global investment in the industry;� Lack of expansion in refinery capacity;� Supply bottlenecks and uncertainties associated with
domestic problems (for example, in Nigeria), andinternational politics (Iran, Iraq, Venezuela, andRussia) that impact supply;
� Supply uncertainties associated with extremeweather events (such as hurricanes);
� Lack of a dominant actor in the market to manageexcess supply and demand; and
� Commoditization of world oil (for example, throughNYMEX).
In the longer term, there will primarily be three marketdrivers: demand from emerging countries (China andIndia in particular); production from OPEC countries;and inventory movement in major consuming countries(especially the United States). Increasingly, environmen-tal policy considerations may also shape the future of themarket. Policies aimed at reducing carbon emissions inthe quest to mitigate global warming are likely to impactthe future use of oil.
Meanwhile, price movements—reflecting marketconditions—as well as pure speculation will continueto have a significant impact on the global economy.
18
978–0–19–956578–8 00-ADB-2-Main-drv African Development Bank2 (Typeset by SPi, Chennai) 19 of 233 July 29, 2009 15:25
Oil and Gas in Africa
Sustained energy price shocks, as witnessed in recentyears, constitute a major constraint on economicgrowth. Since oil and gas are likely to remain thedominant energy fuels, recent developments in thesemarkets have far-reaching implications for achievinguniversal, affordable, commercial energy access in netoil-importing developing countries. Undoubtedly, forthe more than two billion poor people living in Africa,Asia and Latin America, the current oil and gas marketdynamics are likely to make universal and affordableaccess to commercial energy more difficult to achieve.The impact of rising oil prices for Africa is furtheranalyzed in Chapter 4.
2.1.4 Supply and Demand Outlook
Any analysis of the outlook of oil and gas supply anddemand is fraught with difficulties. Assumptions have tobe made about growth in demand, commodity prices,reserve base, potential new discoveries, technology evo-lution, and world politics. The problem is that data onproduction and demand from the recent past, as wellas predictions in the short to medium term, are ofteninaccurate. These inaccuracies stem from the way thedata is compiled using OPEC production estimates aswell as commercial figures from other countries aroundthe world. These figures are sometimes slanted for polit-ical or economic reasons. The uncertainty increases forpredictions of future production demand. In the nearterm, companies are constantly revising their production
19

978–0–19–956578–8 00-ADB-2-Main-drv African Development Bank2 (Typeset by SPi, Chennai) 20 of 233 July 29, 2009 15:25
Oil and Gas in Africa
targets downwards, and in the longer term, publishedsupply and demand estimates show a large margin oferror. Recent analysis by ExxonMobil, for instance, indi-cates that, over the next 10 years, oil and gas demand willincrease by about 2 percent a year, while current fieldsin production will deplete at an average of 3 percentto 5 percent per year. A similar situation exists for gasproduction, demand, and supply, although the availablereserves figures are even less certain than those for oil.A significant amount of gas is still in the “possible”category.
2.1.5 Global Energy Resource Profile: Oil andGas in Perspective
World proven crude oil reserves1 at the end of 2006were estimated at 1,208.2 billion barrels.2 Global oilreserves are unequally distributed as the data on regional
1 Conventional crude oil reserves include all crude oil that it is tech-nically possible to produce from reservoirs through a well bore, usingprimary, secondary, improved, enhanced, or tertiary methods. This doesnot include liquids extracted from mined solids or gases. Oil reserves areclassified as proven, probable, and possible. Proven reserves are generallyintended to have at least 90% or 95% certainty of containing the amountspecified. Probable reserves have an intended probability of 50%, and pos-sible reserves an intended probability of 5% or 10%. Current technologyis capable of extracting about 40% of the oil from most wells. In severalmajor producing countries, the majority of reserves claims have not beensubject to outside audit or examination. Unconventional sources, such asheavy crude oil, tar sands, and oil shale, are not counted as part of oilreserves. For further elaboration on reserve categories and terminology,also see Whateley and Harvey (1994).
2 The analysis in this chapter is based mainly on data from BP StatisticalReview of World Energy (2006 and 2007 volumes).
20
978–0–19–956578–8 00-ADB-2-Main-drv African Development Bank2 (Typeset by SPi, Chennai) 21 of 233 July 29, 2009 15:25
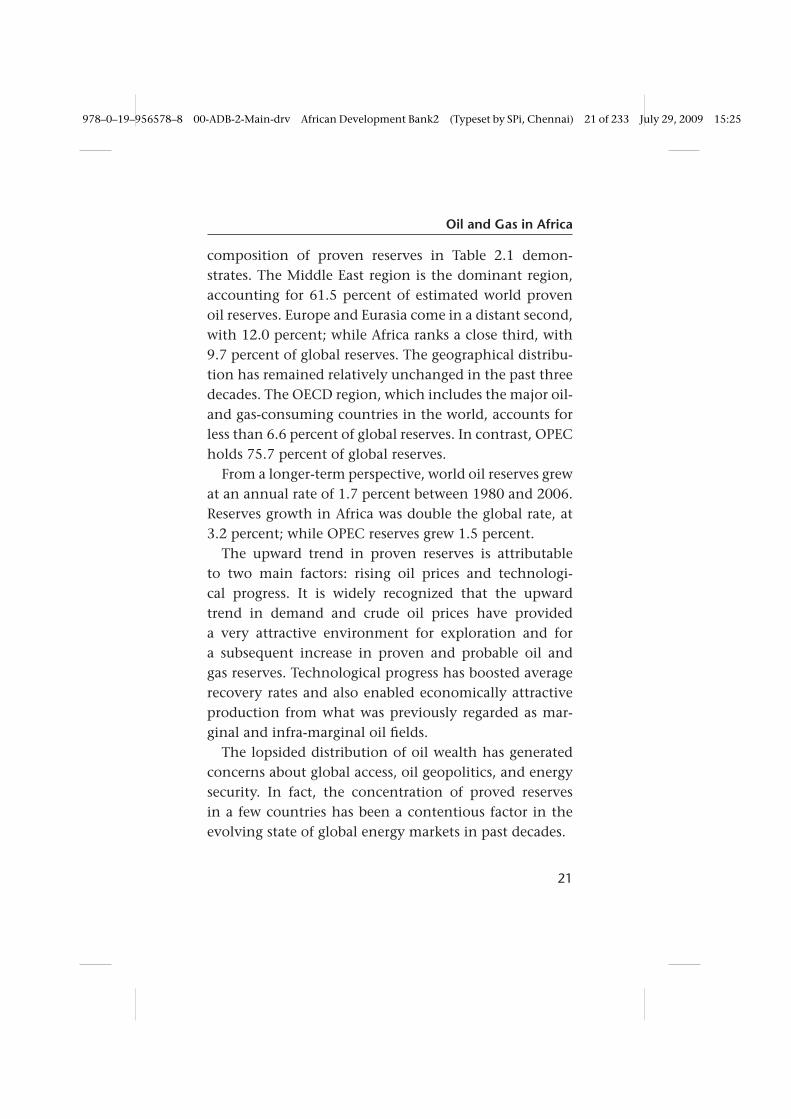
Oil and Gas in Africa
composition of proven reserves in Table 2.1 demon-strates. The Middle East region is the dominant region,accounting for 61.5 percent of estimated world provenoil reserves. Europe and Eurasia come in a distant second,with 12.0 percent; while Africa ranks a close third, with9.7 percent of global reserves. The geographical distribu-tion has remained relatively unchanged in the past threedecades. The OECD region, which includes the major oil-and gas-consuming countries in the world, accounts forless than 6.6 percent of global reserves. In contrast, OPECholds 75.7 percent of global reserves.
From a longer-term perspective, world oil reserves grewat an annual rate of 1.7 percent between 1980 and 2006.Reserves growth in Africa was double the global rate, at3.2 percent; while OPEC reserves grew 1.5 percent.
The upward trend in proven reserves is attributableto two main factors: rising oil prices and technologi-cal progress. It is widely recognized that the upwardtrend in demand and crude oil prices have provideda very attractive environment for exploration and fora subsequent increase in proven and probable oil andgas reserves. Technological progress has boosted averagerecovery rates and also enabled economically attractiveproduction from what was previously regarded as mar-ginal and infra-marginal oil fields.
The lopsided distribution of oil wealth has generatedconcerns about global access, oil geopolitics, and energysecurity. In fact, the concentration of proved reservesin a few countries has been a contentious factor in theevolving state of global energy markets in past decades.
21

978–0–19–956578–8 00-ADB-2-Main-drv African Development Bank2 (Typeset by SPi, Chennai) 22 of 233 July 29, 2009 15:25
Oil and Gas in Africa
Tab
le2.
1:Pr
oved
Cru
deO
ilRe
serv
esby
Regi
on,1
980
to20
06(B
illio
nBa
rrel
s)
Reg
ion
1980
1985
1990
2000
2005
2006
%o
fto
tal
in20
06
Afr
ica
53.3
57.0
58.7
93.4
114.
311
7.2
9.7
Nor
thA
mer
ica
92.5
101.
596
.375
.660
.759
.95.
0So
uth
and
Cen
tral
Am
eric
a26
.762
.971
.697
.910
3.2
103.
58.
6Eu
rop
e&
Eura
sia
98.4
78.6
80.3
114.
114
5.2
144.
412
.0M
iddl
eEa
st36
2.4
431.
365
7.7
691.
074
2.7
742.
761
.5A
sia
Paci
fic33
.839
.136
.342
.640
.540
.53.
4W
orl
d66
7.1
770.
41,
000.
91 ,
114.
71,
209.
51,
208.
210
0of
whi
chO
ECD
109.
211
8.6
115.
110
0.0
81.9
79.8
6.6
OPE
C43
4.6
535.
876
5.9
840.
591
4.5
914.
675
.7N
on-O
PEC
150.
517
2.0
171.
718
0.8
176.
417
4.5
14.4
Dat
aSo
urce
:BP
Stat
istic
alRe
view
ofW
orld
Ener
gy20
07(B
P,20
07).
22

978–0–19–956578–8 00-ADB-2-Main-drv African Development Bank2 (Typeset by SPi, Chennai) 23 of 233 July 29, 2009 15:25
Oil and Gas in Africa
World proven gas reserves in January 2007 were esti-mated to be 181.46 trillion cubic meters. However,although the distribution of global gas resources isunequal, similar to that of crude oil, its regional imbal-ance is less pronounced. Of the world’s proved reserves,the Middle East region ranks first with a 40.5 percentshare (Table 2.2); Europe, including gas reserves in Russiaand the former Soviet Republics, follows closely with35.3 percent; while Africa ranks fourth, with 7.8 percent.
2.1.6 Trends and Patterns of Global Energy Productionand Consumption
To understand recent energy market developments, it isnecessary to examine the long-term trends and patternsof world primary energy supply and demand. The analy-sis is based only on commercial and conventional energysources due to lack of data.
Table 2.3 shows that world primary energy supply rosefrom 288 quadrillion BTU (British Thermal Units) in1980 to 443 quadrillion BTU in 2004. Primary energysupply almost doubled in Africa. Table 2.4 presents thegeographical distribution of primary energy production.It is evident that oil and gas remain the dominant sourceof energy worldwide.
The regional composition of global energy consump-tion reveals a wide disparity in global access to reliableand adequate commercial energy. Although Africa (Sub-Saharan Africa and North Africa) accounts for about15 percent of the world’s population, it consumes only
23

978–0–19–956578–8 00-ADB-2-Main-drv African Development Bank2 (Typeset by SPi, Chennai) 24 of 233 July 29, 2009 15:25
Oil and Gas in Africa
Tab
le2.
2:Re
gion
alD
istr
ibut
ion
ofN
atur
alG
asRe
serv
es,1
980
to20
06(T
rillio
nm
3)
Reg
ion
1980
1990
1995
2000
2005
2006
%sh
are
of
tota
lin
2006
Afr
ica
5.99
8.55
9.93
12.4
714
.08
14.1
87.
8N
orth
Am
eric
a9.
899.
498.
477.
497.
837.
984.
4So
uth
and
Cen
tral
Am
eric
a2.
785.
255.
966.
986.
856.
883.
8Eu
rop
e&
Eura
sia
36.0
059
.84
63.1
661
.74
64.3
064
.13
35.3
Mid
dle
East
24.6
937
.99
45.3
759
.81
72.4
973
.47
40.5
Asi
aPa
cific
4.47
9.88
10.5
412
.28
14.6
614
.82
8.2
Wo
rld
83.3
013
1.00
143.
4216
0.76
180 .
2018
1.46
100.
0
Dat
aSo
urce
:BP
Stat
istic
alRe
view
ofW
orld
Ener
gy20
07(B
P,20
07).
24

978–0–19–956578–8 00-ADB-2-Main-drv African Development Bank2 (Typeset by SPi, Chennai) 25 of 233 July 29, 2009 15:25
Oil and Gas in Africa
Tab
le2.
3:W
orld
Prim
ary
Ener
gyPr
oduc
tion
inQ
uadr
illio
nBT
U,1
980–
2004
Year
Afr
ica
No
rth
Am
eric
aS.
&C
.A
mer
ica
Euro
pe
Eura
sia
Mid
dle
East
Asi
a&
Oce
ania
Wo
rld
Tota
l
1980
17.3
9583
.276
12.0
8340
.216
56.4
6342
.265
35.8
6128
7.55
919
9021
.610
91.9
0316
.749
46.9
0772
.111
40.9
9559
.389
349.
663
2000
27.8
4498
.754
26.0
4250
.821
55.6
8957
.480
80.4
9939
7.12
920
0128
.098
99.4
6825
.990
51.4
1257
.705
56.1
5585
.467
404.
295
2002
28.0
0410
0.01
925
.318
51.2
0059
.463
54.2
5187
.867
406.
121
2003
30.1
0598
.523
25.7
3850
.672
63.2
0957
.612
95.8
5542
1.71
420
0432
.043
99.3
1027
.169
50.6
1066
.714
62.0
7810
5.17
744
3.10
0
Dat
aSo
urce
:U.S
.Dep
artm
ent
ofEn
ergy
(200
6a).
25
978–0–19–956578–8 00-ADB-2-Main-drv African Development Bank2 (Typeset by SPi, Chennai) 26 of 233 July 29, 2009 15:25
Oil and Gas in Africa
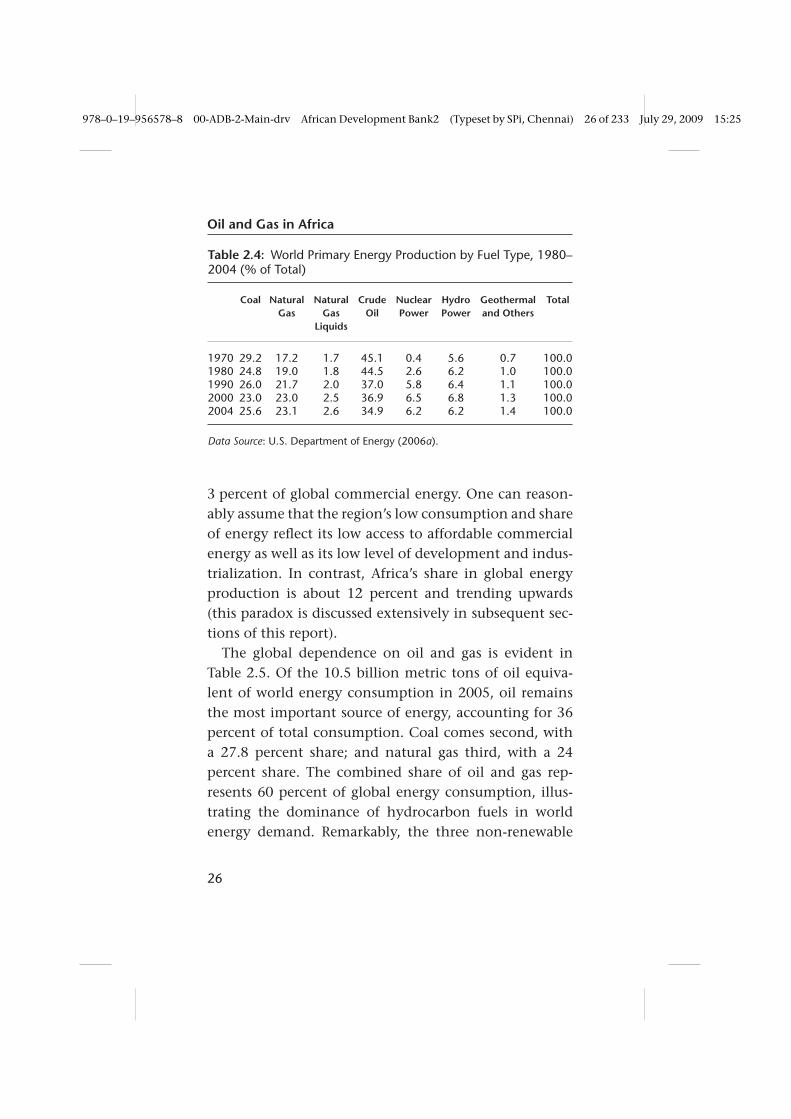
Table 2.4: World Primary Energy Production by Fuel Type, 1980–2004 (% of Total)
Coal NaturalGas
NaturalGas
Liquids
CrudeOil
NuclearPower
HydroPower
Geothermaland Others
Total
1970 29.2 17.2 1.7 45.1 0.4 5.6 0.7 100.01980 24.8 19.0 1.8 44.5 2.6 6.2 1.0 100.01990 26.0 21.7 2.0 37.0 5.8 6.4 1.1 100.02000 23.0 23.0 2.5 36.9 6.5 6.8 1.3 100.02004 25.6 23.1 2.6 34.9 6.2 6.2 1.4 100.0
Data Source: U.S. Department of Energy (2006a).
3 percent of global commercial energy. One can reason-ably assume that the region’s low consumption and shareof energy reflect its low access to affordable commercialenergy as well as its low level of development and indus-trialization. In contrast, Africa’s share in global energyproduction is about 12 percent and trending upwards(this paradox is discussed extensively in subsequent sec-tions of this report).
The global dependence on oil and gas is evident inTable 2.5. Of the 10.5 billion metric tons of oil equiva-lent of world energy consumption in 2005, oil remainsthe most important source of energy, accounting for 36percent of total consumption. Coal comes second, witha 27.8 percent share; and natural gas third, with a 24percent share. The combined share of oil and gas rep-resents 60 percent of global energy consumption, illus-trating the dominance of hydrocarbon fuels in worldenergy demand. Remarkably, the three non-renewable
26

978–0–19–956578–8 00-ADB-2-Main-drv African Development Bank2 (Typeset by SPi, Chennai) 27 of 233 July 29, 2009 15:25
Oil and Gas in Africa
Table 2.5: Global Dependence on Oil and Gas, 2005 (%)
Oil NaturalGas
Coal NuclearEnergy
HydroElectric
Total
Africa 40.9 20.3 31.7 0.9 6.3 100.0North America 40.4 24.9 21.9 7.5 5.3 100.0South and Central
America44.5 22.3 4.2 0.7 28.3 100.0
Europe and Eurasia 32.3 33.8 18.0 9.6 6.3 100.0Middle East 53.2 44.3 1.8 − 0.8 100.0Africa 40.9 20.3 31.7 0.9 6.3 100.0Asia 32.6 10.7 48.1 3.7 4.9 100.0World 36.4 23.5 27.8 6.0 6.3 100.0United States 40.4 24.4 24.6 8.0 2.6 100.0EU 25 40.8 24.7 17.4 12.9 4.1 100.0OECD 41.0 23.0 21.1 9.6 5.4 100.0
Data Source: BP Statistical Review of World Energy (BP, 2006).
fossil fuels—oil, natural gas, and coal—constitute almost90 percent of commercial energy consumed worldwide.
2.2 Oil and Gas and the Global Economy
The interrelationship between oil and gas and the eco-nomic status and development of countries remains adominant and persistent theme. A key factor is the factthat the world economy runs largely on hydrocarbons.The issue of unequal global access to commercial energyand the gains of global economic prosperity have alsofrequently been highlighted in international discourse.
Energy has traditionally played an important role inthe economy of any nation because it is an indispensable
27

978–0–19–956578–8 00-ADB-2-Main-drv African Development Bank2 (Typeset by SPi, Chennai) 28 of 233 July 29, 2009 15:25
Oil and Gas in Africa
input for economic growth and development. Two-thirds of global energy requirements are met from oiland gas supplies. Conventional wisdom holds that thereis a strong correlation between energy consumption percapita and the level of economic and social progress. Thisstill holds true despite globalization, increasing growth—in Asia, for example—and energy market developmentsin recent decades.
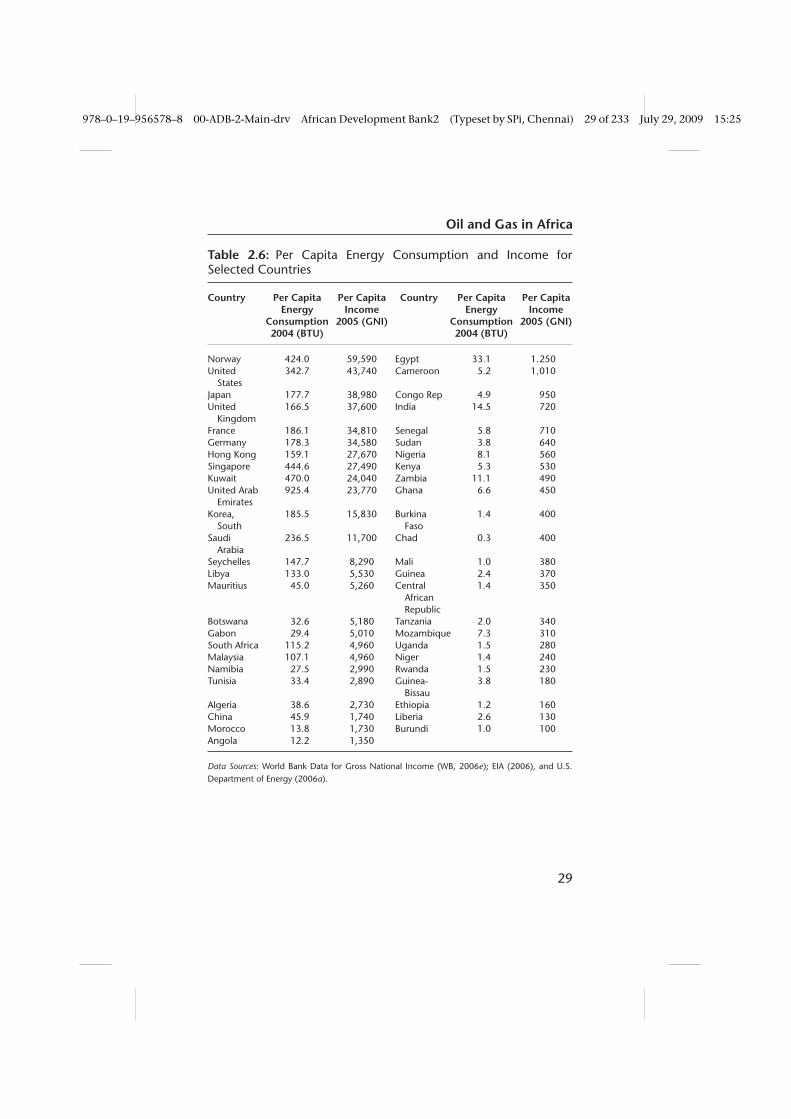
Since economic and social development depend, inlarge part, on an adequate supply of energy at affordableprices, changes in energy prices are bound to affect eco-nomic growth and development. However, the resilienceof developed and developing countries to the shocksproduced by these changes varies as a function of thedifferent economic strengths of these countries. Afford-able access to adequate and reliable energy supply wasa central factor in the achievement of the large produc-tivity gains that guaranteed sustained economic growthand led to a significant leap in material prosperity andwidespread improvement in human well-being in thelast century. The data in Table 2.6 supports the hypothe-sis that there is a strong correlation between energy (andoil) consumption per capita and the level of economicand social progress. The data clearly shows that countrieswith higher per capita income also consume more energyper head.
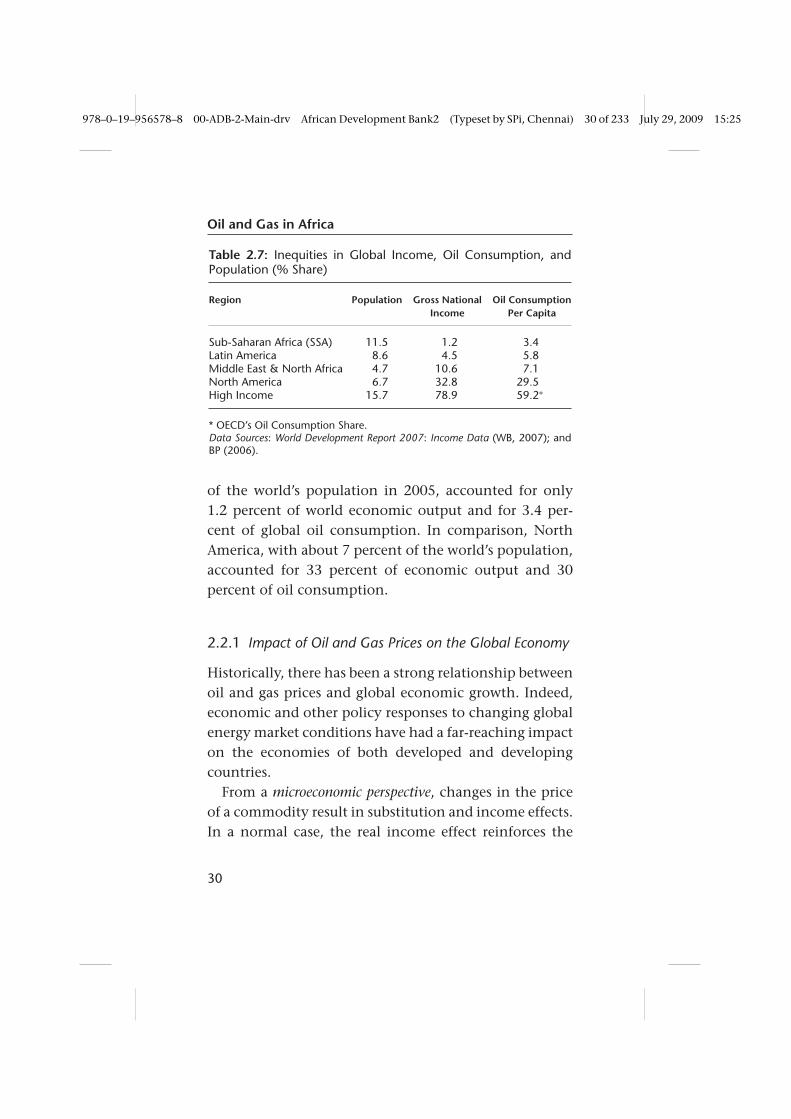
Table 2.7 further reveals the wide disparities in globalaccess to reliable and adequate commercial energy as wellas in the sharing of the fruits of global economic pros-perity. Sub-Saharan Africa (SSA), with almost 12 percent
28
978–0–19–956578–8 00-ADB-2-Main-drv African Development Bank2 (Typeset by SPi, Chennai) 29 of 233 July 29, 2009 15:25
Oil and Gas in Africa
Table 2.6: Per Capita Energy Consumption and Income forSelected Countries
Country Per Capita Per Capita Country Per Capita Per CapitaEnergy Income Energy Income
Consumption 2005 (GNI) Consumption 2005 (GNI)2004 (BTU) 2004 (BTU)
Norway 424.0 59,590 Egypt 33.1 1,250United
States342.7 43,740 Cameroon 5.2 1,010
Japan 177.7 38,980 Congo Rep 4.9 950United
Kingdom166.5 37,600 India 14.5 720
France 186.1 34,810 Senegal 5.8 710Germany 178.3 34,580 Sudan 3.8 640Hong Kong 159.1 27,670 Nigeria 8.1 560Singapore 444.6 27,490 Kenya 5.3 530Kuwait 470.0 24,040 Zambia 11.1 490United Arab
Emirates925.4 23,770 Ghana 6.6 450
Korea,South
185.5 15,830 BurkinaFaso
1.4 400
SaudiArabia
236.5 11,700 Chad 0.3 400
Seychelles 147.7 8,290 Mali 1.0 380Libya 133.0 5,530 Guinea 2.4 370Mauritius 45.0 5,260 Central
AfricanRepublic
1.4 350
Botswana 32.6 5,180 Tanzania 2.0 340Gabon 29.4 5,010 Mozambique 7.3 310South Africa 115.2 4,960 Uganda 1.5 280Malaysia 107.1 4,960 Niger 1.4 240Namibia 27.5 2,990 Rwanda 1.5 230Tunisia 33.4 2,890 Guinea-
Bissau3.8 180
Algeria 38.6 2,730 Ethiopia 1.2 160China 45.9 1,740 Liberia 2.6 130Morocco 13.8 1,730 Burundi 1.0 100Angola 12.2 1,350
Data Sources: World Bank Data for Gross National Income (WB, 2006e); EIA (2006), and U.S.Department of Energy (2006a).
29
978–0–19–956578–8 00-ADB-2-Main-drv African Development Bank2 (Typeset by SPi, Chennai) 30 of 233 July 29, 2009 15:25
Oil and Gas in Africa
Table 2.7: Inequities in Global Income, Oil Consumption, andPopulation (% Share)
Region Population Gross NationalIncome
Oil ConsumptionPer Capita
Sub-Saharan Africa (SSA) 11.5 1.2 3.4Latin America 8.6 4.5 5.8Middle East & North Africa 4.7 10.6 7.1North America 6.7 32.8 29.5High Income 15.7 78.9 59.2∗
* OECD’s Oil Consumption Share.Data Sources: World Development Report 2007: Income Data (WB, 2007); andBP (2006).
of the world’s population in 2005, accounted for only1.2 percent of world economic output and for 3.4 per-cent of global oil consumption. In comparison, NorthAmerica, with about 7 percent of the world’s population,accounted for 33 percent of economic output and 30percent of oil consumption.
2.2.1 Impact of Oil and Gas Prices on the Global Economy
Historically, there has been a strong relationship betweenoil and gas prices and global economic growth. Indeed,economic and other policy responses to changing globalenergy market conditions have had a far-reaching impacton the economies of both developed and developingcountries.
From a microeconomic perspective, changes in the priceof a commodity result in substitution and income effects.In a normal case, the real income effect reinforces the
30
978–0–19–956578–8 00-ADB-2-Main-drv African Development Bank2 (Typeset by SPi, Chennai) 31 of 233 July 29, 2009 15:25
Oil and Gas in Africa
pure substitution effect and yields a negative relation-ship between the amount purchased and the price of theproduct. Higher prices lead to reduced consumption, allother things being equal.
Analysis of the macroeconomic effects of higher oilprices has been a recurrent theme since the first majoroil price shock of the 1970s. Historical evidence showsthat oil price increases and volatility have had a sig-nificant impact on global, regional, and national eco-nomic performance and outlook. Conventional wisdom,backed by empirical analysis, suggests that increases inoil prices tend to exert strong inflationary pressures,reduce output, slow down economic growth, and exac-erbate unemployment in net oil-importing countries.Thus, the rising costs of oil imports caused by both theexchange rate depreciation and the rising dollar price ofoil are bound to have profound ripple effects throughoutnational economies.
Broadly speaking, higher oil prices can impact aggre-gate economic activity directly or indirectly. The mainchannels through which oil prices impact macroeco-nomic aggregates are well understood (IMF, 2000, 2005).These channels include the following:
1. Terms of trade effects: These result in the trans-fer of income from oil-importing countries to oil-producing countries at the global level and from oilconsumers to oil producers at the domestic level. Atthe global level, the net gain to oil-exporting coun-tries is offset by the net loss to net oil-importing
31

978–0–19–956578–8 00-ADB-2-Main-drv African Development Bank2 (Typeset by SPi, Chennai) 32 of 233 July 29, 2009 15:25
Oil and Gas in Africa
countries. The bigger the oil price increase, thelarger the potential macroeconomic effects are likelyto be at the national, regional, and global levels.
2. Input price: This channel works through productionand investment via increasing cost of productionin the economy. The size of this impact of higheroil prices on the economy depends on oil intensityof aggregate output. Adding price volatility to theprice shock, the consequences are high cost of pro-duction, deterrence of irreversible investment, andultimate reduction in aggregate economic activity,or, at best, slowdown in rate of economic growth.
3. Exchange rate pass-through: The invoicing currencyfor the oil trade has traditionally been the U.S. dol-lar. Oil-importing countries are adversely affected bychanges in the value of the U.S. dollar vis-à-vis othercurrencies. The exchange rate pass-through effectexacerbates the input shock effect of oil prices in netoil-importing developing countries. The magnitudeof the pass-through depends on government policyand the state of energy market liberalization. Thesize of the pass-through also depends on the struc-ture of the domestic oil market. A more competitivemarket structure would minimize the pass-throughrelative to monopolistic or oligopolistic cartel-likecontrol of the market.
4. Oil price pass-through to inflation: Oil priceincreases work as a shock to the aggregateprice level, exacerbating inflationary pressure that
32

978–0–19–956578–8 00-ADB-2-Main-drv African Development Bank2 (Typeset by SPi, Chennai) 33 of 233 July 29, 2009 15:25
Oil and Gas in Africa
decreases money balances with its macroeconomicconsequences. There could be partial or total pass-through from higher oil prices to core inflationdepending on the monetary policy stance.
5. Balance of payments impact through higher oilimport costs: This will be more severe if there are nocountervailing and compensating changes in exportrevenues through higher volume of exports andthrough terms of trade gains.
The magnitude of the macroeconomic impact of higheroil prices has been the subject of considerable debate inthe literature (Mork, 1989; Hamilton, 1996; and Lee, Niand Ratti, 1995). Two basic methodological approacheshave been adopted in quantifying the macroeconomicimpact of higher oil prices. The macro-econometricapproach is the most widely used methodology. Fromthis approach, substantial empirical evidence shows thatboth developed and developing countries have been ableto cope increasingly better with the challenges associatedwith oil price increases with each successive decade sincethe first major price increase in the 1970s (IMF, 2000).Nevertheless, economic performance would have beenmore robust if oil prices had not risen so sharply.3
3 Two major defects of the conventional macro-econometric approachare worth noting. The first is its inability to capture the non-linearand asymmetric relationship between oil price changes and output andemployment. Oil price volatility, as evident in the time series behavior ofoil prices, further complicates the problem of estimating the magnitudeof the macroeconomic impact of higher oil prices. The second defect ofthe macro-econometric approach is its inability to capture properly thedistributional effects of higher oil prices. Although this may not be an
33
978–0–19–956578–8 00-ADB-2-Main-drv African Development Bank2 (Typeset by SPi, Chennai) 34 of 233 July 29, 2009 15:25
Oil and Gas in Africa
Finally, an important issue is the role of economicpolicy—at both the micro and macro levels—in miti-gating the potential adverse economic impact of higheroil prices. Two questions come to mind: What can andshould be done to mitigate or even neutralize the impactof higher oil prices? In other words, what is the optimalpolicy mix that would help economies cope with thehigh economic and social costs of the external shocksthat accompany oil and gas market price changes? Itis in this context that an African Petroleum Fund wasproposed to assist African countries to deal with oil priceshocks.
2.2.2 Importance of Petroleum Products
The analysis in this section focuses on the magnitudeand importance of petroleum products for society andfor fueling the world economy. There are strong linksbetween the oil industry and other sectors of the domes-tic economy.
2.2.2.1 PETROLEUM PRODUCTS SUPPLY CHAIN
The energy supply cycle can be divided into upstreamand downstream elements: the upstream comprisesexploration and production activities; while the down-stream includes refining and retail activities. In basicterms, the cycle consists of acquisition of crude oil,
important issue in developed countries, the same cannot be said of low-income countries, where a majority of the people lives on less than $1 aday.
34
978–0–19–956578–8 00-ADB-2-Main-drv African Development Bank2 (Typeset by SPi, Chennai) 35 of 233 July 29, 2009 15:25
Oil and Gas in Africa
transportation to the refinery, refining, transportation tostorage, management of inventories, and selling of finalproducts. Specifically, the complex downstream industryconsists of
� Refining: Crude oil ships and refinery terminals
– Refinery storage and local terminal rack– Refinery products
� Wholesale: Shipping activities
– Marine terminals– Local and international markets
� Retail: Bulk terminal, retail/wholesale, and industrialand home usage.
2.2.2.2 IMPORTANT REFINED PRODUCTS
Refineries turn crude oil into liquefied products, aliphaticchemicals, asphalt paving mixtures, aviation fuels, ben-zene, butylenes, resid/fuel oil/bunker, cumene, cyclicaromatic hydrocarbons, diesel fuels, ethylene, gasoline,heating oils, hydraulic fluids, jet fuels, kerosene, lubri-cating oils and greases, naphtha, naphthenic acids,paraffin waxes, petrochemicals, petroleum coke, petro-leum jelly, petroleum lubricating oils, propane gases,propylene, solvents, styrene, tar, toluene, and xylene(EIA, 2008).
Petroleum products, especially motor gasoline, diesel,and jet fuel, provide virtually all the energy consumed inthe transportation sector. Transportation is the greatestsingle use of petroleum, accounting for over 67 percentof all U.S. petroleum consumed in 2005. The industrial
35

978–0–19–956578–8 00-ADB-2-Main-drv African Development Bank2 (Typeset by SPi, Chennai) 36 of 233 July 29, 2009 15:25
Oil and Gas in Africa
sector is the second largest petroleum-consuming sectorand accounts for about 24 percent of all petroleum con-sumption in the U.S. The residential/commercial andelectric utility sectors account for the remaining 9 per-cent of petroleum consumption (EIA, 2008).
Distillate fuel oil includes diesel oil, heating oils, andindustrial oils. It is used to power diesel engines in buses,trucks, trains, automobiles, and other machinery. It isalso used to heat residential and commercial buildingsand to fire industrial and electric utility boilers.
Liquefied petroleum gases (LPGs) rank third in usageamong petroleum products, behind motor gasoline anddistillate fuel oil. LPGs are used as inputs (feedstock) forpetrochemical production processes. This is their majornon-fuel use. LPGs are also used as fuel for domesticheating and cooking, farming operations, and as analternative to gasoline for use in internal combustionengines. Most jet fuel is a kerosene-based fuel used pri-marily in commercial airlines. Naphtha jet fuel meetsthe specifications required for certain military aircraft.Kerosene-type jet fuel is sometimes blended into heat-ing oil and diesel fuel during periods of extreme coldweather. Although this sector uses relatively little petro-leum, compared with the transportation and industrialsectors, the electric utility sector depends on petroleumfor about 3 percent of its total energy requirements.Residual fuel oil is also used as bunker fuel (fuel forships), industrial boiler fuel, and heating fuel in somecommercial buildings. Kerosene is used for residentialand commercial space heating. It is also used in water
36
978–0–19–956578–8 00-ADB-2-Main-drv African Development Bank2 (Typeset by SPi, Chennai) 37 of 233 July 29, 2009 15:25
Oil and Gas in Africa
heaters, as a cooking fuel, and in lamps. Petroleum cokecan be used as a relatively low-ash solid fuel for powerplants and industrial use (marketable coke) if its sulfurcontent is low enough, or used in non-fuel applications(catalyst coke), such as in refinery operations (Nage-ria, 2005).
Non-fuel use of petroleum is small, compared with fueluse, but it is nevertheless very important from a com-mercial and economic point of view. Non-fuel uses forpetroleum include various specialized products for use inthe textile, metallurgical, electrical, and other industries.A partial list of non-fuel uses for petroleum includes(Nageria, 2005):
� Solvents such as those used in paints, lacquers, andprinting inks;
� Lubricating oils and greases for automobile enginesand other machinery;
� Petroleum (or paraffin) wax used in candy, packag-ing, candles, matches, and polishes;
� Petrolatum (petroleum jelly) in medical products andtoiletries;
� Asphalt used to pave roads and airfields, to surfacecanals and reservoirs, and to make roofing materialsand floor coverings;
� Petroleum coke used as a raw material for manycarbon and graphite products, including furnaceelectrodes and liners, and the anodes used in theproduction of aluminum; and
37

978–0–19–956578–8 00-ADB-2-Main-drv African Development Bank2 (Typeset by SPi, Chennai) 38 of 233 July 29, 2009 15:25
Oil and Gas in Africa
� Petroleum feedstock used as chemical feedstockderived from petroleum, mainly for the manufac-ture of chemicals, synthetic rubber, and a variety ofplastics.
Petroleum has been used as feedstock in the produc-tion of petrochemicals since the 1920s. Petrochemicalfeedstocks also include products recovered from naturalgas and refinery gases (ethane, propane, and butane).Petrochemical feedstocks are converted to basic chemi-cal building blocks and intermediates, such as ethylene,propylene, normal and iso-butylenes, butadiene, andaromatics such as benzene, toluene, and xylene, whichare in turn used to produce plastics, synthetic rubber,synthetic fibers, drugs, and detergents.
2.2.2.3 INDIRECT IMPORTANCE OFPETROLEUM PRODUCTS
Petroleum products are very important for governments,essentially because they are a source of revenue throughtax contributions. Furthermore, both downstream andupstream industries and associated services employ a sig-nificant number of people. The oil industry has socialresponsibilities with local communities where it helps inbuilding access, schools, and hospitals. These aspects arefurther analyzed in Chapters 3 and 4.
2.2.3 Natural Gas and Biofuels
The use of petroleum products has been the subject ofpublic outcry because of their environmental impact.
38

978–0–19–956578–8 00-ADB-2-Main-drv African Development Bank2 (Typeset by SPi, Chennai) 39 of 233 July 29, 2009 15:25
Oil and Gas in Africa
There is also growing concern about the viability of oil-based fuels and products—leading to initiatives to findand develop alternative energy sources.
At present, alternative energy sources—to the oil-basedfuels and products—are quite limited and have untilrecently consisted of gasoline blends, ethanol, methanol,and liquefied gas. Most of these products still rely onexpensive technology, which makes them less compet-itive when compared to oil products. The alternativeenergies are still held back by the extremely large capitalinstallation costs, which reduces its popularity in today’sworld economy. However, both natural gas and biofuelsin various forms have gained considerable attention andmomentum in recent years.
2.2.3.1 NATURAL GAS
Natural gas can be used in a number of ways: in house-holds, in industry, and for power generation. It can alsobe used in the transport sector, in the form of compressednatural gas (CNG), as a substitute for gasoline and diesel.There has been a steady shift towards natural gas as aclean (that is, cleaner than oil and coal) and relativelycheap source of power in recent years. However, byvirtue of being a gas, natural gas is more costly to trans-port and store than liquid or solid fuels. Consequently,natural gas transportation is more complex and costlybecause it requires special vehicles or special pipelines.To address this problem, economies of scale must be pur-sued, especially in laying down extensive pipelines and
39

978–0–19–956578–8 00-ADB-2-Main-drv African Development Bank2 (Typeset by SPi, Chennai) 40 of 233 July 29, 2009 15:25
Oil and Gas in Africa
distribution systems. A pipeline network is economicallyviable especially if there are large consumers (such aspower plants and large industrial operations). The factorsneeded for sustainable conversion to CNG include theexistence of a gas distribution pipeline for other naturalgas users, close proximity to the supply, and inter-fueltaxation policy.
Biofuels are derived from biological (for example, agri-cultural) sources (Chow, 2007):
i. Cereals, grains, sugar crops and other starches canbe fermented to produce ethanol, which can beused pure or as a blending component (as ethanolor after being converted to Ethyl Tertiary ButylEther, ETBE;4
ii. Cellulosic materials, including grasses, trees andvarious waste products from crops, wood process-ing facilities, and municipal solid waste, can alsobe converted to alcohols or diesel type fuels;
iii. Oil-seed crops (such as rapeseed, soybean, and sun-flower) can be converted into methyl esters, whichcan be blended with conventional diesel or burntas pure biodiesel;
4 ETBE is an oxygenated fuel that can be blended with gasoline to makeit burn more cleanly and thus improve overall air quality. ETBE is producedby mixing ethanol and isobutylene and reacting them with heat over acatalyst. The promise of ETBE is that it eliminates many of the historicalimpediments to the greater use of ethanol, such as increased volatility ofgasoline and incompatibility with gasoline pipelines. This would allowETBE to be used at the refinery level and be economically transportedto areas that previously had not been able to utilize ethanol (Governors’Ethanol Coalition, 2007).
40

978–0–19–956578–8 00-ADB-2-Main-drv African Development Bank2 (Typeset by SPi, Chennai) 41 of 233 July 29, 2009 15:25
Oil and Gas in Africa
iv. Organic waste material can be converted intoenergy forms, which can be used as automotivefuel: waste oil (such as cooking oil) into biodiesel;animal manure and organic household wastes intobiogas (such as methane); and agricultural andforestry waste products into ethanol.
Countries such as Argentina, Brazil, Canada, Colombia,India, Malaysia, Mozambique, the Philippines, Thailand,and the United States of America have been promotingand boosting the production and use of biofuels (bio-diesel from soy bean palm and jatropha; ethanol fromsugar cane and others) and LNG as a coping mechanismfor high oil prices. Most of these countries have adoptedtargets for increasing the contribution of biofuels to theirtransport fuel supplies. In terms of production costs,ethanol from sugar cane has historically been the lowest-cost biofuel. However, recent surges in world sugar priceshave altered the relative economics of biofuels, with bio-diesel from palm oil emerging as potentially more viableunder certain market conditions (Chow, 2007).
2.3 Africa’s Oil Reserves and Production
2.3.1 Reserves
Reserves are defined as the known and estimated quan-tity in units of oil or gas that can be produced. Thecertainty to which we know the quantities defines thecategory of reserves. As outlined in Section 2.1, there
41

978–0–19–956578–8 00-ADB-2-Main-drv African Development Bank2 (Typeset by SPi, Chennai) 42 of 233 July 29, 2009 15:25
Oil and Gas in Africa
are proven, probable, and possible reserves. It shouldthus be noted that a reserve estimate is dynamic andcan change depending on the current technology level,economic conditions (for instance, the price of selling oilversus the costs of extracting it), location, and associatedenvironmental issues.
The most common notion of “proved reserves”—declared quantities known to a high level of confidencein terms of primarily geological data—is used in thisreport. However, it is worth noting that even with thispresumably physical and measurable estimation, dataon oil and gas resources from geological resources maybe inaccurate for a number of reasons, including: weakgovernment capacity to monitor oil companies (whichmay not wish to have an accurate data disclosure); geo-political interests of governments (who may not wanta full disclosure either); or lack of geological surveydata.
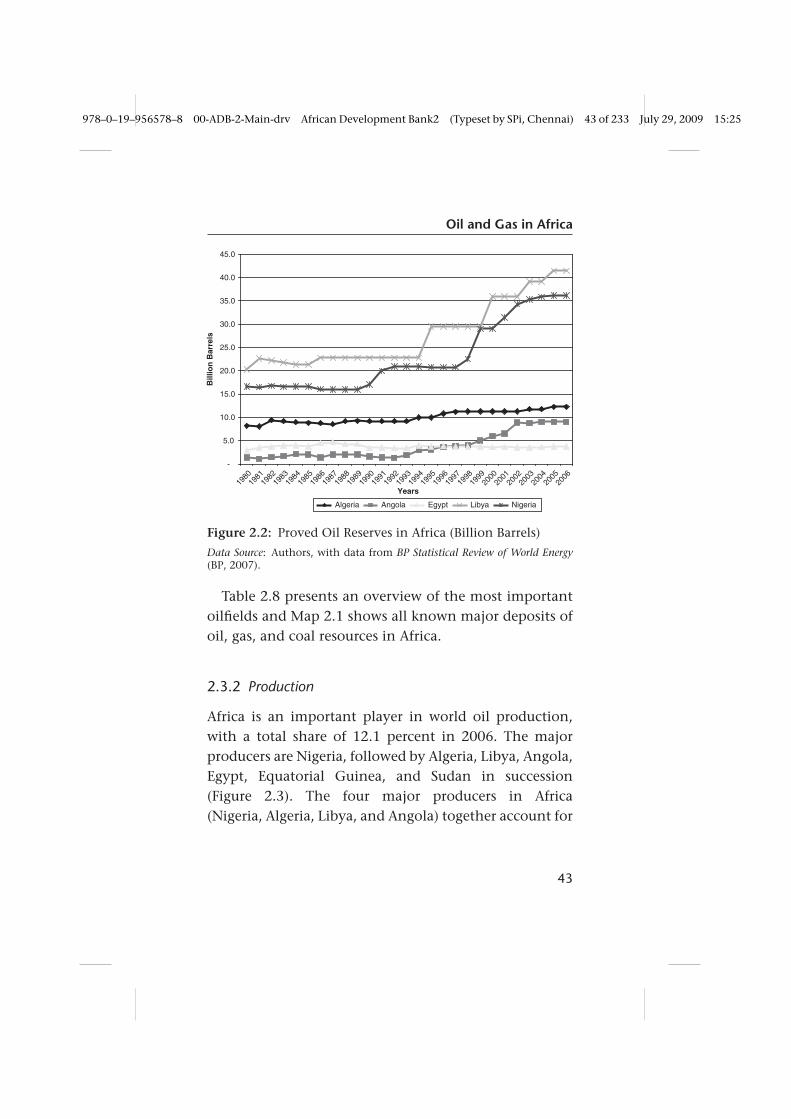
Figure 2.2 presents an overview of proved oil reservesin Africa. The majority of African oil reserves (and pro-duction) is located in Libya, Nigeria, Algeria, Angola,and Sudan, which together account for more than 90percent of the continent’s reserves. There is growingknowledge about Africa’s proved oil reserves, which rosefrom 53.3 billion barrels in 1980 to 117.2 billion barrelsin 2006, a share of 9.7 percent of total world reserves. Thelargest reserves are in Libya and Nigeria, which accountfor 3.4 and 3.0 percent, respectively, of world reserves(BP, 2007).
42
978–0–19–956578–8 00-ADB-2-Main-drv African Development Bank2 (Typeset by SPi, Chennai) 43 of 233 July 29, 2009 15:25
Oil and Gas in Africa
-
5.0
10.0
15.0
20.0
25.0
30.0
35.0
40.0
45.0
1980
1981
1982
1983
1984
1985
1986
1987
1988
1989
1990
1991
1992
1993
1994
1995
1996
1997
1998
1999
2000
2001
2002
2003
2004
2005
2006
Years
Bill
ion
Bar
rels
Algeria Angola Egypt Libya Nigeria
Figure 2.2: Proved Oil Reserves in Africa (Billion Barrels)
Data Source: Authors, with data from BP Statistical Review of World Energy(BP, 2007).
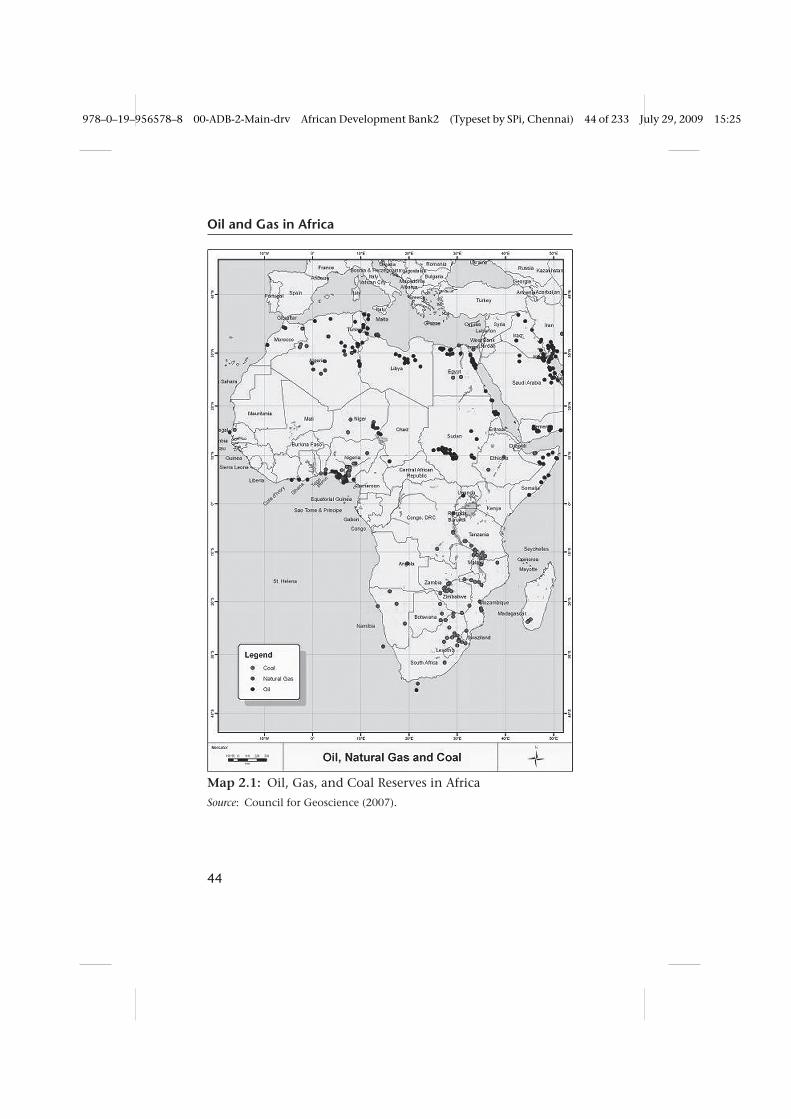
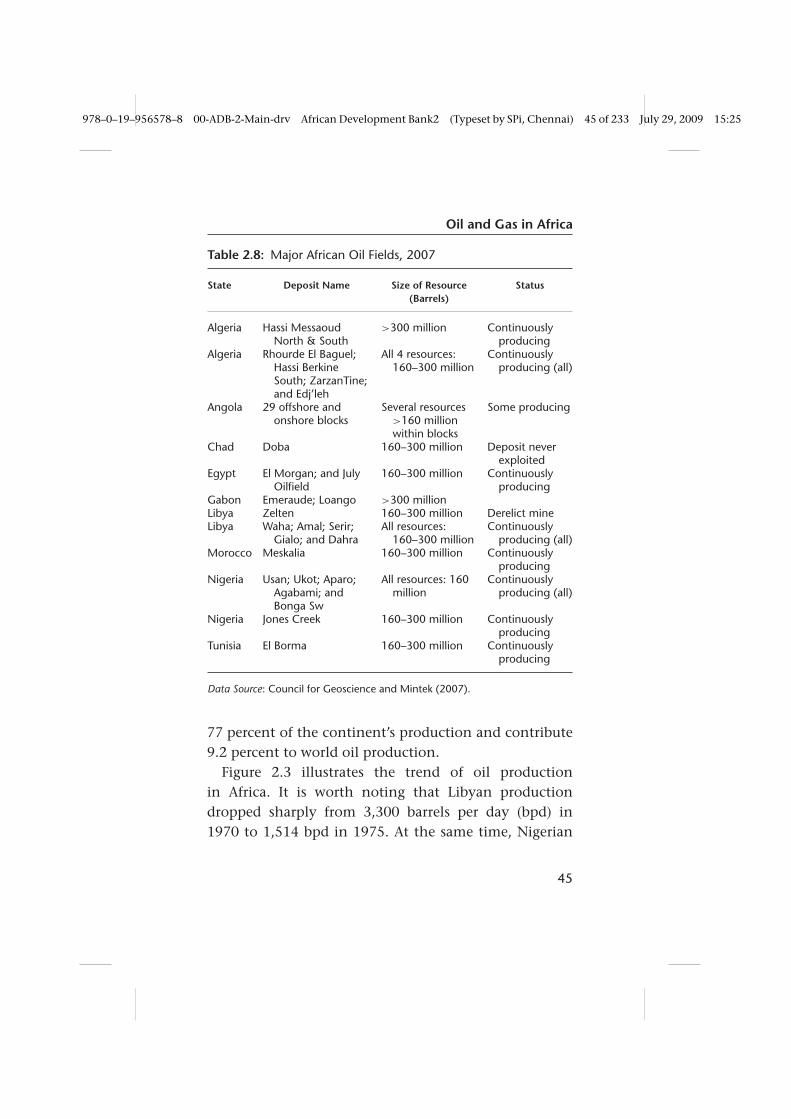
Table 2.8 presents an overview of the most importantoilfields and Map 2.1 shows all known major deposits ofoil, gas, and coal resources in Africa.
2.3.2 Production
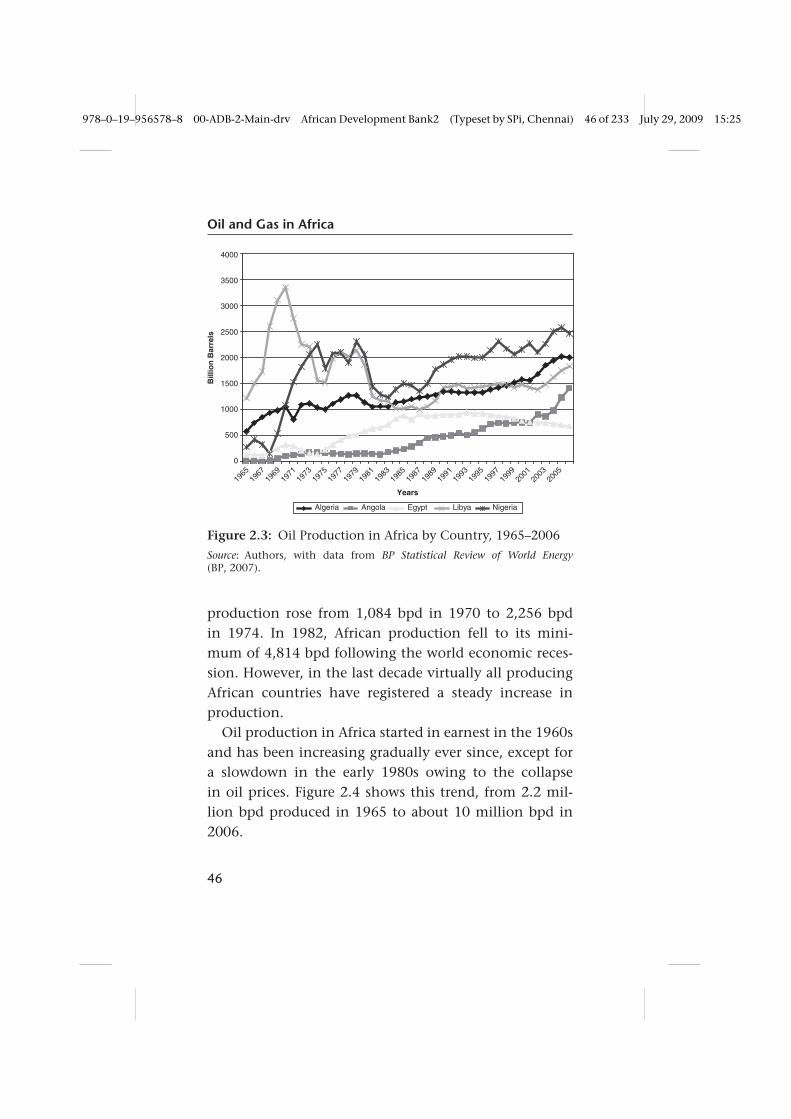
Africa is an important player in world oil production,with a total share of 12.1 percent in 2006. The majorproducers are Nigeria, followed by Algeria, Libya, Angola,Egypt, Equatorial Guinea, and Sudan in succession(Figure 2.3). The four major producers in Africa(Nigeria, Algeria, Libya, and Angola) together account for
43
978–0–19–956578–8 00-ADB-2-Main-drv African Development Bank2 (Typeset by SPi, Chennai) 44 of 233 July 29, 2009 15:25
Oil and Gas in Africa
Map 2.1: Oil, Gas, and Coal Reserves in Africa
Source: Council for Geoscience (2007).
44
978–0–19–956578–8 00-ADB-2-Main-drv African Development Bank2 (Typeset by SPi, Chennai) 45 of 233 July 29, 2009 15:25
Oil and Gas in Africa
Table 2.8: Major African Oil Fields, 2007
State Deposit Name Size of Resource(Barrels)
Status
Algeria Hassi MessaoudNorth & South
>300 million Continuouslyproducing
Algeria Rhourde El Baguel;Hassi BerkineSouth; ZarzanTine;and Edj’leh
All 4 resources:160–300 million
Continuouslyproducing (all)
Angola 29 offshore andonshore blocks
Several resources>160 millionwithin blocks
Some producing
Chad Doba 160–300 million Deposit neverexploited
Egypt El Morgan; and JulyOilfield
160–300 million Continuouslyproducing
Gabon Emeraude; Loango >300 millionLibya Zelten 160–300 million Derelict mineLibya Waha; Amal; Serir;
Gialo; and DahraAll resources:
160–300 millionContinuously
producing (all)Morocco Meskalia 160–300 million Continuously
producingNigeria Usan; Ukot; Aparo;
Agabami; andBonga Sw
All resources: 160million
Continuouslyproducing (all)
Nigeria Jones Creek 160–300 million Continuouslyproducing
Tunisia El Borma 160–300 million Continuouslyproducing
Data Source: Council for Geoscience and Mintek (2007).
77 percent of the continent’s production and contribute9.2 percent to world oil production.
Figure 2.3 illustrates the trend of oil productionin Africa. It is worth noting that Libyan productiondropped sharply from 3,300 barrels per day (bpd) in1970 to 1,514 bpd in 1975. At the same time, Nigerian
45
978–0–19–956578–8 00-ADB-2-Main-drv African Development Bank2 (Typeset by SPi, Chennai) 46 of 233 July 29, 2009 15:25
Oil and Gas in Africa
0
500
1000
1500
2000
2500
3000
3500
4000
1965
1967
1969
1971
1973
1975
1977
1979
1981
1983
1985
1987
1989
1991
1993
1995
1997
1999
2001
2003
2005
Years
Bill
ion
Bar
rels
Algeria Angola Egypt Libya Nigeria
Figure 2.3: Oil Production in Africa by Country, 1965–2006
Source: Authors, with data from BP Statistical Review of World Energy(BP, 2007).
production rose from 1,084 bpd in 1970 to 2,256 bpdin 1974. In 1982, African production fell to its mini-mum of 4,814 bpd following the world economic reces-sion. However, in the last decade virtually all producingAfrican countries have registered a steady increase inproduction.
Oil production in Africa started in earnest in the 1960sand has been increasing gradually ever since, except fora slowdown in the early 1980s owing to the collapsein oil prices. Figure 2.4 shows this trend, from 2.2 mil-lion bpd produced in 1965 to about 10 million bpd in2006.
46

978–0–19–956578–8 00-ADB-2-Main-drv African Development Bank2 (Typeset by SPi, Chennai) 47 of 233 July 29, 2009 15:25
Oil and Gas in Africa
0
1000
2000
3000
4000
5000
6000
7000
8000
9000
10000
1100019
65
1967
1969
1971
1973
1975
1977
1979
1981
1983
1985
1987
1989
1991
1993
1995
1997
1999
2001
2003
2005
Th
ou
san
d b
arre
ls d
aily
Figure 2.4: Africa’s Average Oil Production per Year (DailyProduction, bpd)
Data Source: BP Statistical Review of World Energy (BP, 2007).
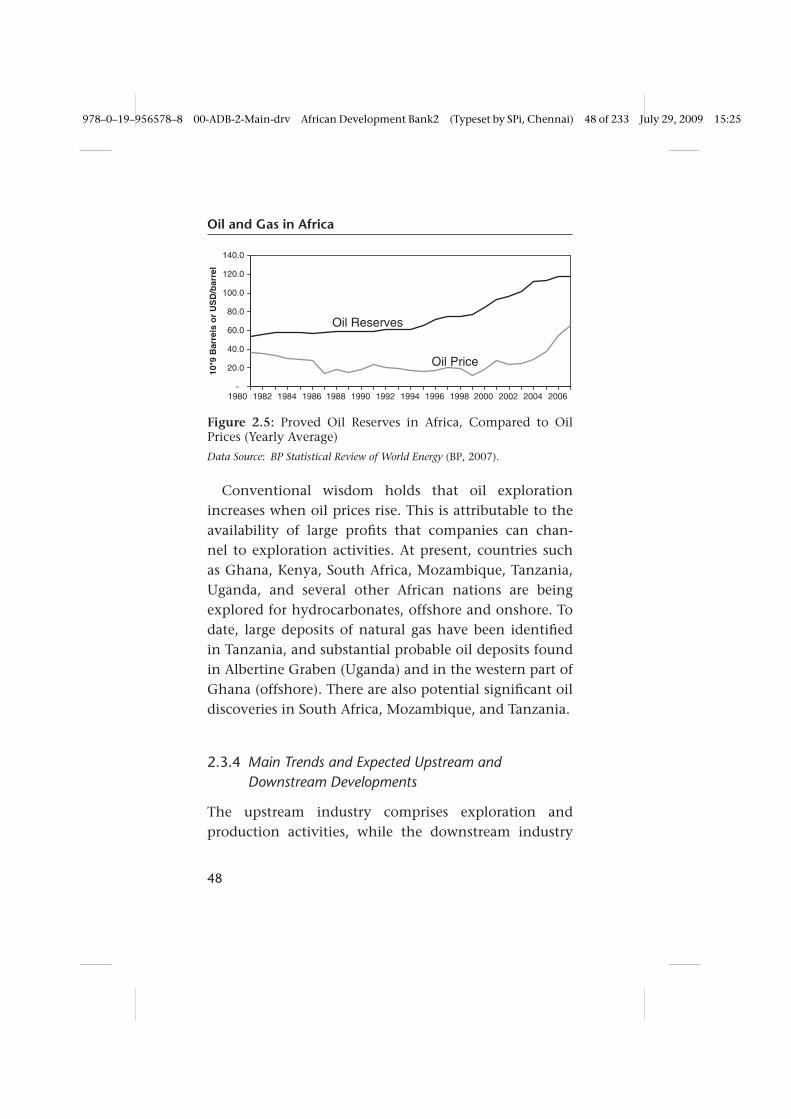
2.3.3 Exploration and Planned Production
Oil exploration activities are generally led by oil com-panies. It is rare for governments to directly lead theseactivities, although nationalized or state-run oil compa-nies are often involved. Oil exploration efforts in Africahave been boosted significantly in recent years, as illus-trated by the rate at which proved reserves are growingover time. Figure 2.5 presents an overview of cumulativeknown reserves in Africa and illustrates the close corre-lation with the gradual rise in oil prices over the last 10years. It is worth noting, however, that exploration, aswell as estimates of reserves, increased gradually even inthe 1980s, when oil prices were declining—most likelyillustrating that exploration in Africa was underpinnedby geopolitical and oil supply security motives (mostlyfrom Western nations, in the early phase, but, increas-ingly, with emerging countries such as China).
47
978–0–19–956578–8 00-ADB-2-Main-drv African Development Bank2 (Typeset by SPi, Chennai) 48 of 233 July 29, 2009 15:25
Oil and Gas in Africa
-
20.0
40.0
60.0
80.0
100.0
120.0
140.0
1980 1982 1984 1986 1988 1990 1992 1994 1996 1998 2000 2002 2004 2006
10*9
Bar
rels
or
US
D/b
arre
l
Oil Price
Oil Reserves
Figure 2.5: Proved Oil Reserves in Africa, Compared to OilPrices (Yearly Average)
Data Source: BP Statistical Review of World Energy (BP, 2007).
Conventional wisdom holds that oil explorationincreases when oil prices rise. This is attributable to theavailability of large profits that companies can chan-nel to exploration activities. At present, countries suchas Ghana, Kenya, South Africa, Mozambique, Tanzania,Uganda, and several other African nations are beingexplored for hydrocarbonates, offshore and onshore. Todate, large deposits of natural gas have been identifiedin Tanzania, and substantial probable oil deposits foundin Albertine Graben (Uganda) and in the western part ofGhana (offshore). There are also potential significant oildiscoveries in South Africa, Mozambique, and Tanzania.
2.3.4 Main Trends and Expected Upstream andDownstream Developments
The upstream industry comprises exploration andproduction activities, while the downstream industry
48

978–0–19–956578–8 00-ADB-2-Main-drv African Development Bank2 (Typeset by SPi, Chennai) 49 of 233 July 29, 2009 15:25
Oil and Gas in Africa
0
500
1000
1500
2000
2500
3000
3500
1965
1967
1969
1971
1973
1975
1977
1979
1981
1983
1985
1987
1989
1991
1993
1995
1997
1999
2001
2003
2005
10*3
Bar
rels
dai
ly
Total Refinery Capacity
Total Consumption
Figure 2.6: Total Oil Consumption and Refinery Capacity inAfrica
Data Source: BP Statistical Review of World Energy (BP, 2006).
includes refining and retail activities. Oil refineries con-vert crude oil into fuel products, lubricating oils, bitu-men, chemical feedstocks and other oil products (seeSection 2.2).
The first African refineries were built in Algiers(CFP/Total) and Durban (Socony/Mobil) in 1954. In the50 years up to 2004, a total of 48 refineries were built inAfrica. However, the majority of them were establishedin the 1970s and 1980s. The only new refineries builtin the last 10 years were Khartoum (Sudan) in 2001 andMIDOR (Egypt) in 2002. Africa’s historic refinery capacityis presented in Figure 3.5. The continent’s total activedistillation capacity is about 3 million bpd (15 millionmt/yr), an average of 79,000 bpd per refinery (Figure 2.6).
The major refining centers in Africa are located inSouth Africa (4 refineries and 3 synthetic fuel plants),Nigeria (3 refineries), Egypt (9 refineries), and Algeria(4 refineries) (Figure 2.7). The largest single refinery is
49

978–0–19–956578–8 00-ADB-2-Main-drv African Development Bank2 (Typeset by SPi, Chennai) 50 of 233 July 29, 2009 15:25
Oil and Gas in Africa
Figure 2.7: Refining Centers in Sub-Saharan Africa
Source: African Energy (2008).
the Skikda refinery in Algeria (300 million bpd), whereasthe smallest operating refinery is the Solimar refinery inMadagascar, with a capacity of 14 million bpd (AfricanEnergy, 2008).
Many African refineries have been forced to closebecause of low worldwide refining margins, small localmarkets, high operating costs (due to small size), andpoor yields. Following the World Bank/IMF insistenceon market liberalization in the early 1980s, many ofthe remaining refineries have faced significant chal-lenges. Although installed capacity in Africa is higherthan present consumption (Figure 2.6), the continent
50

978–0–19–956578–8 00-ADB-2-Main-drv African Development Bank2 (Typeset by SPi, Chennai) 51 of 233 July 29, 2009 15:25
Oil and Gas in Africa
still faces high shortages in refined products that arebalanced by imports. As a consequence of such short-ages and of the need to maximize economic profit byplacing the refinery close to the source, several initiativesand plans are underway to install new refineries in suchcountries as Nigeria, Sudan, Uganda, and Mozambique,as outlined in Boxes 2.1 to 2.4.
Box 2.1: THE EXAMPLE OF NIGERIA’S REFINERY INDUSTRY
There are considerable investment opportunities in Nigeria’s down-stream oil and gas sector. The government’s focus is on deregulatingthe sector by licensing private refineries, eliminating government subsi-dies to the downstream sector, and privatizing existing ones. Throughsuch strategic action, domestic capacity is expected to at least meetdemand. The four existing refineries have significantly and consistentlyproduced below capacity, owing to a host of factors, including poormanagement and maintenance.
The deregulation of the downstream oil and gas sector (PetroleumRefining & Marketing) has been in focus for a number of years. Indeed,scarcity of petroleum products and gradual deregulation of petroleumproduct prices have generated heated controversies in Nigeria. Thegovernment is determined to nurture private-sector participation andengage local companies in the oil and gas sector—hence the licensingof private refineries and deregulation of petroleum product prices—toimprove local capacity. In the coming years, consolidation is expectedin the oil refining and marketing sector, with new entrants. There aresignificant investment opportunities and a need for both local andinternational funding.
Sahara Petroleum Exploration, a subsidiary of Global EnvironmentalEnergy, has been contracted to build a 70,000 bpd oil refinery at Eket,Akwa Ibom state, Nigeria.
This is an approximately $4 billion project that represents cash flowat today’s market rate of approximately $1.5 billion per annum. Suchplans to increase Nigeria’s refining capacity will also provide consider-able cost savings to operators (such as Sahara Petroleum) by refiningoil products close to source. At present, the country has four mainrefineries with a nameplate capacity of 438,750 bpd.
Data Sources: Market Research (2008) and Onlinenigeria.com (2005).
51

978–0–19–956578–8 00-ADB-2-Main-drv African Development Bank2 (Typeset by SPi, Chennai) 52 of 233 July 29, 2009 15:25
Oil and Gas in Africa
Box 2.2: TULLOW OIL REFINERY PLAN IN UGANDA
Tullow Oil is currently working to find out the quantity and qualityof oil that has been discovered in the Albertine Graben in Ugandabefore a decision is made to build a multi-billion dollar refinery or not.The Uganda government and Tullow Oil have agreed to build a minirefinery in an early production scheme that will enable installation ofa 100 MW heavy fuel oil thermal power plant. The mini refinery (witha capacity of about 5,000 barrels of oil per day) will cost Tullow someUS$200 million.
Data Source: Kisambira (2007).
Box 2.3: SUDAN TO DOUBLE ITS OIL-REFINING CAPACITY
Sudan is planning to double its oil refining capacity, with a short,three-year investment plan, to handle increased production, havingreached an agreement to end its 21-year civil war. A new 100,000bpd refinery will be built in Port Sudan, on the Red Sea coast, andthe capacity of two existing refineries will be increased. Talks havebeen held with India’s Oil & Natural Gas, China’s Sinopec, Malaysia’sPetronas, and an unidentified Turkish company to build the newrefinery. Boosting refinery capacity is especially timely since Sudanexpects crude oil production to increase significantly in the comingyears.
Data Source: Chmaytelli (2005).
Box 2.4: NEW MOZAMBIQUE OIL REFINERY APPROVED
The Mozambican Council of Ministers has approved the constructionof an oil refinery, valued at more than $1.3 billion, in the northernprovince of Nampula. Dubbed the ‘Ayr Logistics Limited—Nacala’,the project is spearheaded by a privately owned American company,Ayr Logistics, in partnership with one Mozambican and three SouthAfrican investors. The project is expected to create about 450 jobs andgenerate extra tax revenue for the Mozambican government. With aninstalled capacity of about 100,000 bbl/d, most of the product will beexported to Malawi, Zimbabwe, and Zambia. The project also includesthe construction of several infrastructures that will support the main
52

978–0–19–956578–8 00-ADB-2-Main-drv African Development Bank2 (Typeset by SPi, Chennai) 53 of 233 July 29, 2009 15:25
Oil and Gas in Africa
activity of the project, which will be implemented over an area of838 ha and will be situated in the district of the Nacala port, whichis also home to Mozambique’s deepest and busiest port.
Data Source: Engineering News (2007).
Despite the plans and visions illustrated in the boxes, thefact remains that very little new global refining capacityhas been added in the last three years, including in 2007.Nevertheless, significant refinery capacity additions arestill planned, although a major concern is that construc-tion costs are rising with inflationary prices. Other non-economic reasons—important in Africa, as elsewhere—for the slow growth in refining capacity (worldwide) areenvironmental and local concerns, more stringent envi-ronmental laws, and effective community organizing,which have made it very difficult to build new refineries.Some analysts consider refinery capacity a significantfactor of high oil prices. It thus makes sense to increaserefinery capacity in Africa as a way to reduce the costs ofrefined oil products. However, this needs to be done inan environment-friendly manner.
2.4 Oil Trade in Africa
The oil market can be divided into two parts: withinAfrica and between Africa and the rest of the world.The major trends are clear: There is significant oil tradewithin West Africa and North Africa, whereas there isvery little oil trade between African producers and the
53
978–0–19–956578–8 00-ADB-2-Main-drv African Development Bank2 (Typeset by SPi, Chennai) 54 of 233 July 29, 2009 15:25
Oil and Gas in Africa
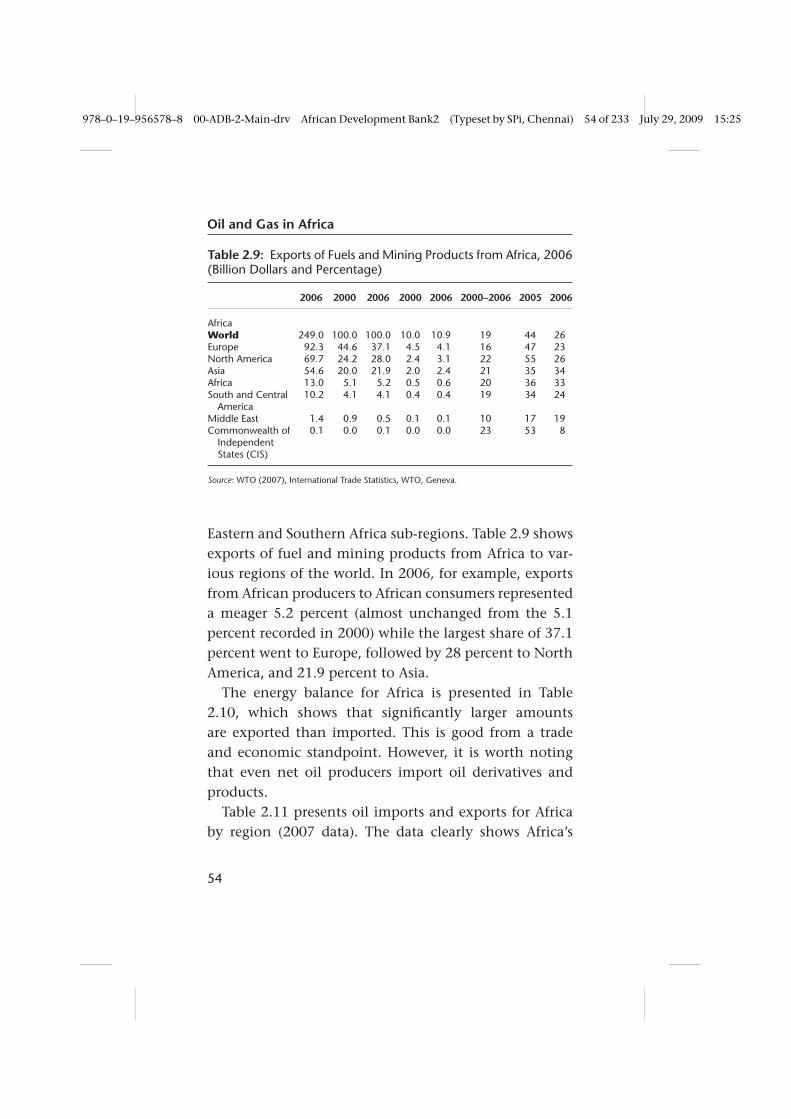
Table 2.9: Exports of Fuels and Mining Products from Africa, 2006(Billion Dollars and Percentage)
2006 2000 2006 2000 2006 2000–2006 2005 2006
AfricaWorld 249.0 100.0 100.0 10.0 10.9 19 44 26Europe 92.3 44.6 37.1 4.5 4.1 16 47 23North America 69.7 24.2 28.0 2.4 3.1 22 55 26Asia 54.6 20.0 21.9 2.0 2.4 21 35 34Africa 13.0 5.1 5.2 0.5 0.6 20 36 33South and Central
America10.2 4.1 4.1 0.4 0.4 19 34 24
Middle East 1.4 0.9 0.5 0.1 0.1 10 17 19Commonwealth of
IndependentStates (CIS)
0.1 0.0 0.1 0.0 0.0 23 53 8
Source: WTO (2007), International Trade Statistics, WTO, Geneva.
Eastern and Southern Africa sub-regions. Table 2.9 showsexports of fuel and mining products from Africa to var-ious regions of the world. In 2006, for example, exportsfrom African producers to African consumers representeda meager 5.2 percent (almost unchanged from the 5.1percent recorded in 2000) while the largest share of 37.1percent went to Europe, followed by 28 percent to NorthAmerica, and 21.9 percent to Asia.
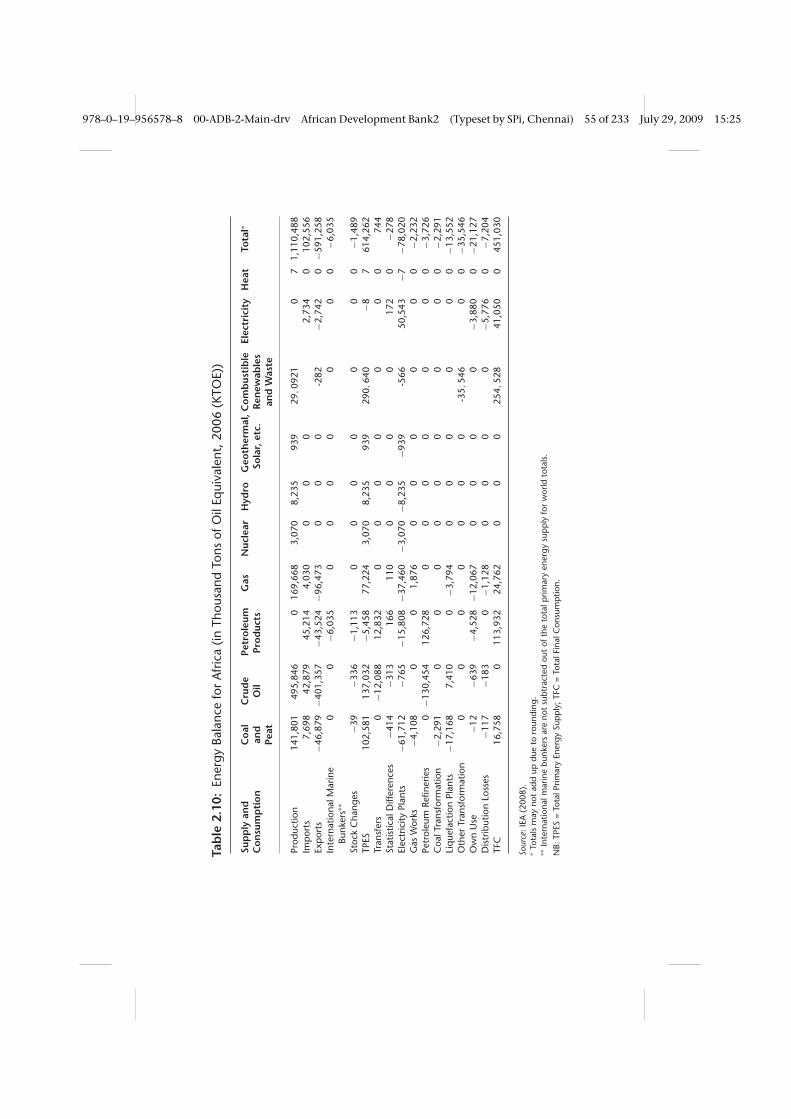
The energy balance for Africa is presented in Table2.10, which shows that significantly larger amountsare exported than imported. This is good from a tradeand economic standpoint. However, it is worth notingthat even net oil producers import oil derivatives andproducts.
Table 2.11 presents oil imports and exports for Africaby region (2007 data). The data clearly shows Africa’s
54
978–0–19–956578–8 00-ADB-2-Main-drv African Development Bank2 (Typeset by SPi, Chennai) 55 of 233 July 29, 2009 15:25
Tab
le2.
10:
Ener
gyBa
lanc
efo
rA
fric
a(in
Thou
sand
Tons
ofO
ilEq
uiva
lent
,200
6(K
TOE)
)
Sup
ply
and
Co
nsu
mp
tio
nC
oal
and
Peat
Cru
de
Oil
Petr
ole
umPr
od
ucts
Gas
Nuc
lear
Hyd
roG
eoth
erm
al,
Sola
r,et
c.C
om
bus
tib
leR
enew
able
san
dW
aste
Elec
tric
ity
Hea
tTo
tal∗
Prod
uctio
n14
1,80
149
5,84
60
169,
668
3,07
08,
235
939
29,09
210
71,
110,
488
Imp
orts
7,69
842
,879
45,2
144,
030
00
02,
734
010
2,55
6Ex
por
ts−4
6,87
9−4
01,3
57−4
3,52
4−9
6,47
30
00
-282
−2,7
420
−591
,258
Inte
rnat
iona
lMar
ine
Bunk
ers∗
∗0
0−6
,035
00
00
00
0−6
,035
Stoc
kC
hang
es−3
9−3
36−1
,113
00
00
00
0−1
,489
TPES
102,
581
137,
032
−5,4
5877
,224
3,07
08,
235
939
290,
640
−87
614,
262
Tran
sfer
s0
−12,
088
12,8
320
00
00
00
744
Stat
istic
alD
iffer
ence
s−4
14−3
1316
611
00
00
017
20
−278
Elec
tric
ityPl
ants
−61,
712
−765
−15,
808
−37,
460
−3,0
70−8
,235
−939
-566
50,5
43−7
−78,
020
Gas
Wor
ks−4
,108
00
1,87
60
00
00
0−2
,232
Petr
oleu
mRe
finer
ies
0−1
30,4
5412
6,72
80
00
00
00
−3,7
26C
oalT
rans
form
atio
n−2
,291
00
00
00
00
0−2
,291
Liq
uefa
ctio
nPl
ants
−17,
168
7,41
00
−3,7
940
00
00
0−1
3,55
2O
ther
Tran
sfor
mat
ion
00
00
00
0-3
5,54
60
0−3
5,54
6O
wn
Use
−12
−639
−4,5
28−1
2,06
70
00
0−3
,880
0−2
1,12
7D
istr
ibut
ion
Loss
es−1
17−1
830
−1,1
280
00
0−5
,776
0−7
,204
TFC
16,7
580
113,
932
24,7
620
00
254,
528
41,0
500
451,
030
Sour
ce:I
EA(2
008)
.∗
Tota
lsm
ayno
tad
dup
due
toro
undi
ng.
∗∗In
tern
atio
nalm
arin
ebu
nker
sar
eno
tsu
btra
cted
out
ofth
eto
talp
rimar
yen
ergy
sup
ply
for
wor
ldto
tals
.N
B:TP
ES=
Tota
lPrim
ary
Ener
gySu
pp
ly;T
FC=
Tota
lFin
alC
onsu
mp
tion.
978–0–19–956578–8 00-ADB-2-Main-drv African Development Bank2 (Typeset by SPi, Chennai) 56 of 233 July 29, 2009 15:25
Oil and Gas in Africa
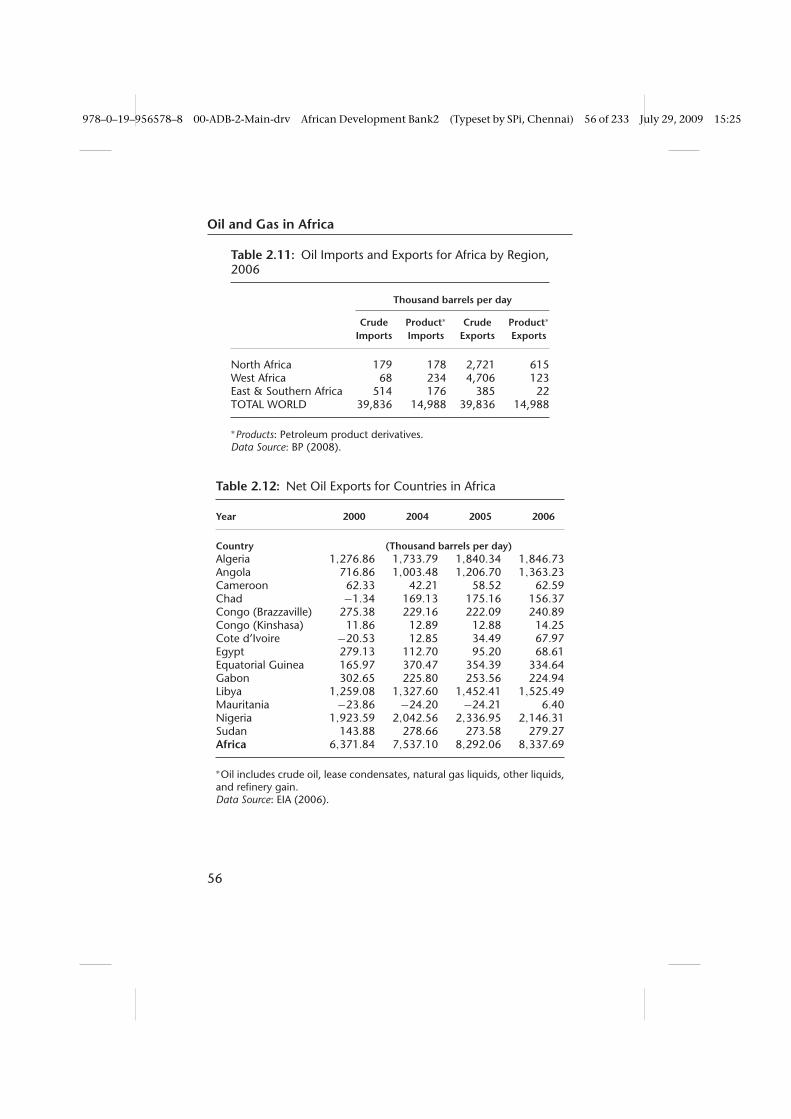
Table 2.11: Oil Imports and Exports for Africa by Region,2006
Thousand barrels per day
Crude Product∗ Crude Product∗
Imports Imports Exports Exports
North Africa 179 178 2,721 615West Africa 68 234 4,706 123East & Southern Africa 514 176 385 22TOTAL WORLD 39,836 14,988 39,836 14,988
∗Products: Petroleum product derivatives.Data Source: BP (2008).
Table 2.12: Net Oil Exports for Countries in Africa
Year 2000 2004 2005 2006
Country (Thousand barrels per day)Algeria 1,276.86 1,733.79 1,840.34 1,846.73Angola 716.86 1,003.48 1,206.70 1,363.23Cameroon 62.33 42.21 58.52 62.59Chad −1.34 169.13 175.16 156.37Congo (Brazzaville) 275.38 229.16 222.09 240.89Congo (Kinshasa) 11.86 12.89 12.88 14.25Cote d’Ivoire −20.53 12.85 34.49 67.97Egypt 279.13 112.70 95.20 68.61Equatorial Guinea 165.97 370.47 354.39 334.64Gabon 302.65 225.80 253.56 224.94Libya 1,259.08 1,327.60 1,452.41 1,525.49Mauritania −23.86 −24.20 −24.21 6.40Nigeria 1,923.59 2,042.56 2,336.95 2,146.31Sudan 143.88 278.66 273.58 279.27Africa 6,371.84 7,537.10 8,292.06 8,337.69
∗Oil includes crude oil, lease condensates, natural gas liquids, other liquids,and refinery gain.Data Source: EIA (2006).
56

978–0–19–956578–8 00-ADB-2-Main-drv African Development Bank2 (Typeset by SPi, Chennai) 57 of 233 July 29, 2009 15:25
Oil and Gas in Africa
limited significance with respect to imports as well asto derived products, but its very significant contributionto basic world crude oil exports. Table 2.12 presentsexport data from 2000 to 2006 for the 14 African netoil-producing countries.
It should be noted that only two of the 14 net oil-exporting African countries are landlocked (Chad andMauritania). Marketing (exporting) crude oil from alandlocked country is an added challenge for an investor.The case of Chad (Box 2.5) illustrates an effort to solvethis problem.
Box 2.5: CHAD–CAMEROON PIPELINE
Chad has a long history of civil war and exhibits many conditionsassociated with post-conflict zones. To overcome its geographic dis-advantage of being landlocked, Chad needed a pipeline to exploitits over one billion barrels in proven oil reserves. In 1999, conditionsinside Chad were so bad that no one in the private oil sector waswilling to invest in a pipeline unless the World Bank was involved.In the first project of its kind, the World Bank agreed to provideinvestment coupled with institutional oversight and transparency (U.S.Department of Energy, 2007b). The World Bank and a consortium ofoil companies, led by ExxonMobil, ChevronTexaco, and Petronas, setup a pipeline project in Chad.
Construction of the $3.5 billion Chad–Cameroon Petroleum Devel-opment and Pipeline Project began in 2000 and was completed in2004. To increase transparency, Chad was required to adopt thePetroleum Revenues Management Law, which stipulated that Chad’s12.5 percent of the oil revenues would be deposited into a Citibankescrow account monitored by an independent “college” before theChadian government received it. Another 10 percent was deposited ina “future generations” fund to provide Chad with revenues after theexhaustion of the oil reserves (Zissis, 2007). However, in December2005, Chad’s National Assembly abolished the future generations fundand diverted money away from poverty-mitigation efforts to armspurchase. The World Bank responded by suspending $124 million inloans.
(cont.)
57

978–0–19–956578–8 00-ADB-2-Main-drv African Development Bank2 (Typeset by SPi, Chennai) 58 of 233 July 29, 2009 15:25
Oil and Gas in Africa
Box 2.5: (Continued)
In July 2006, the two sides reached a compromise, which specified thatthe Chadian government would commit 70 percent of revenues todevelopment programs and 30 percent to government expenditures(Thibodeaux, 2007). Some have called the Chad experiment a primafacie failure; others maintain that after only a few years it is still tooearly to judge.
2.5 Africa’s Consumption of Oil
Figure 2.8 shows the growing pattern of oil product typeconsumption in Africa. Consumption of oil derivates inAfrica has grown steadily, with total consumption in2006 close to 3 million barrels per day. However, thisonly represents about 3 percent of world consumption.
0
500
1000
1500
2000
2500
3000
1965 1968 1971 1974 1977 1980 1983 1986 1989 1992 1995 1998 2001 2004
10*3
Bar
rels
dai
ly
Light distillates Fuel oilMiddle distillatesOthers Total Africa
Figure 2.8: Africa’s Oil Consumption by Product Type (barrelsper day)
Data Source: BP (2008).
58
978–0–19–956578–8 00-ADB-2-Main-drv African Development Bank2 (Typeset by SPi, Chennai) 59 of 233 July 29, 2009 15:25
Oil and Gas in Africa
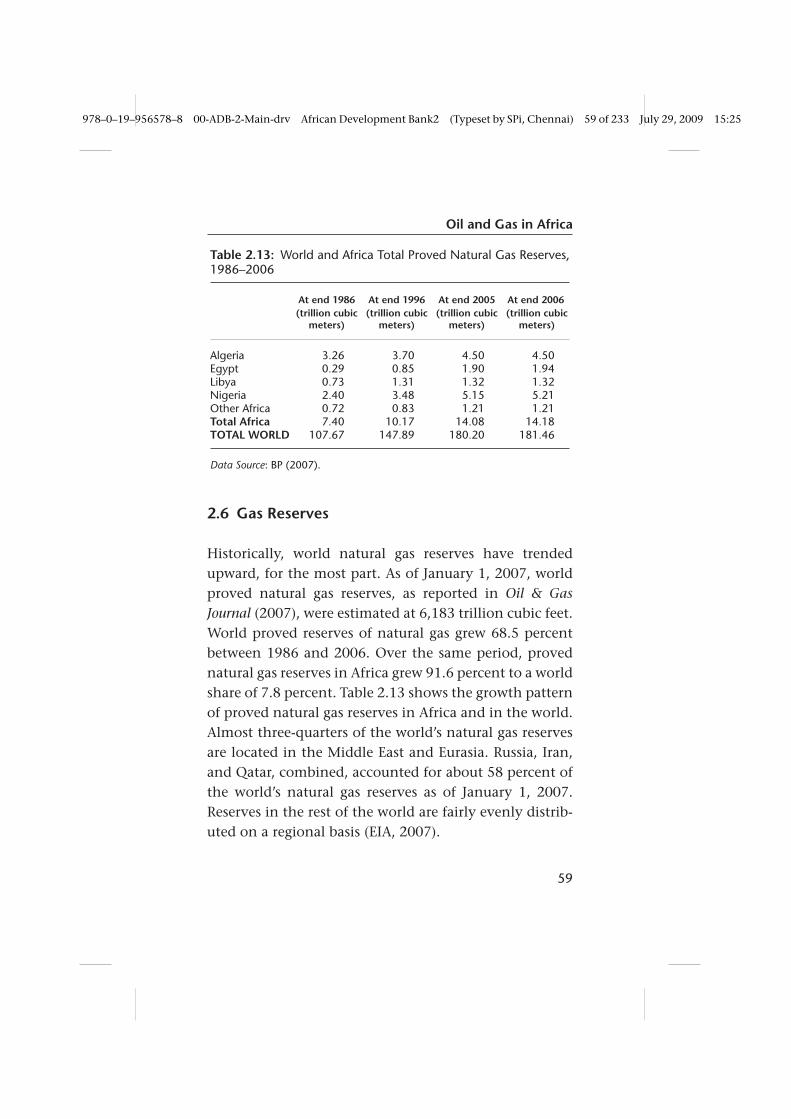
Table 2.13: World and Africa Total Proved Natural Gas Reserves,1986–2006
At end 1986 At end 1996 At end 2005 At end 2006(trillion cubic
meters)(trillion cubic
meters)(trillion cubic
meters)(trillion cubic
meters)
Algeria 3.26 3.70 4.50 4.50Egypt 0.29 0.85 1.90 1.94Libya 0.73 1.31 1.32 1.32Nigeria 2.40 3.48 5.15 5.21Other Africa 0.72 0.83 1.21 1.21Total Africa 7.40 10.17 14.08 14.18TOTAL WORLD 107.67 147.89 180.20 181.46
Data Source: BP (2007).
2.6 Gas Reserves
Historically, world natural gas reserves have trendedupward, for the most part. As of January 1, 2007, worldproved natural gas reserves, as reported in Oil & GasJournal (2007), were estimated at 6,183 trillion cubic feet.World proved reserves of natural gas grew 68.5 percentbetween 1986 and 2006. Over the same period, provednatural gas reserves in Africa grew 91.6 percent to a worldshare of 7.8 percent. Table 2.13 shows the growth patternof proved natural gas reserves in Africa and in the world.Almost three-quarters of the world’s natural gas reservesare located in the Middle East and Eurasia. Russia, Iran,and Qatar, combined, accounted for about 58 percent ofthe world’s natural gas reserves as of January 1, 2007.Reserves in the rest of the world are fairly evenly distrib-uted on a regional basis (EIA, 2007).
59

978–0–19–956578–8 00-ADB-2-Main-drv African Development Bank2 (Typeset by SPi, Chennai) 60 of 233 July 29, 2009 15:25
Oil and Gas in Africa
0.00
2.00
4.00
6.00
8.00
10.00
12.00
14.00
16.00
Years
Tri
llio
n C
ub
ic M
eter
s
Algeria Egypt Libya Nigeria Total Africa
1980
1981
1982
1983
1984
1985
1986
1987
1988
1989
1990
1991
1992
1993
1994
1995
1996
1997
1998
1999
2000
2001
2002
2003
2004
2005
2007
2006
Figure 2.9: Africa’s Proved Natural Gas Reserves, 1980 and2007
Data Source: BP (2008).
Despite the high rates of increase in natural gasconsumption, particularly over the past decade, mostregional reserves-to-production ratios are substantial.Worldwide, the reserves-to-production ratio is estimatedat 65 years. Central and South America have a reserves-to-production ratio of about 52 years; Russia, 80 years;and Africa, 88 years. The reserves-to-production ratio ofthe Middle East exceeds 100 years (EIA, 2007).
Proved natural gas reserves in Africa are concen-trated mainly in four countries—Algeria, Egypt, Libya,and Nigeria—which possess 91.5 percent of provedreserves. Figure 2.9 presents the distribution pattern of
60

978–0–19–956578–8 00-ADB-2-Main-drv African Development Bank2 (Typeset by SPi, Chennai) 61 of 233 July 29, 2009 15:25
Oil and Gas in Africa
proved natural gas reserves per country in Africa. Theundeveloped natural gas reserves in Nigeria, in particu-lar, are a target of the international giants in the sector(Box 2.6).
Box 2.6: NIGERIA NATURAL GAS AT STAKE
Nigeria exports about 18 million tons of liquefied natural gas eachyear through Nigeria Liquefied Natural Gas, jointly owned by the stateenergy company, Shell, Total, and Agip. Nigeria has the seventh-largestproven gas reserves in the world, but it has not developed its gasindustry to anywhere near full potential.
According to investors, most investment ideas in the sector are notprofitable because of the lack of a stable fiscal framework and ofmarket pricing for gas. Nevertheless, the Russian gas export monopoly,Gazprom, is in talks with Nigeria to spend up to $2.5 billion to exploit,gather and process Nigeria’s vast natural gas reserves. The Russiancompany is reported to be on a global hunt for new reserves andhas emerged as one of the leading players in the Nigerian naturalgas sector. UK-based companies BG Group and Centrica have alsoproposed multi-billion dollar investments.
About 2.5 billion cubic feet of Nigerian gas associated with theextraction of crude oil is burnt off every day because there is noinfrastructure to use the gas. The government is planning to finecompanies that flare gas. It hopes to see an explosion in domesticdemand for gas for use in power generation, petrochemicals, andfertilizers. But the price the state power monopoly now pays for gasmakes investment in stand-alone gas projects unprofitable.
Source: Adapted from Fin24 (2008) (Fin24.com article).
2.7 Gas Production
Natural gas production in Africa rose from 2.8 billioncubic meters (BCM) in 1970 to 50.2 BCM in 1986 and190.4 BCM in 2007, representing about 6 percent shareof world production. Production capacity in Africa grew
61
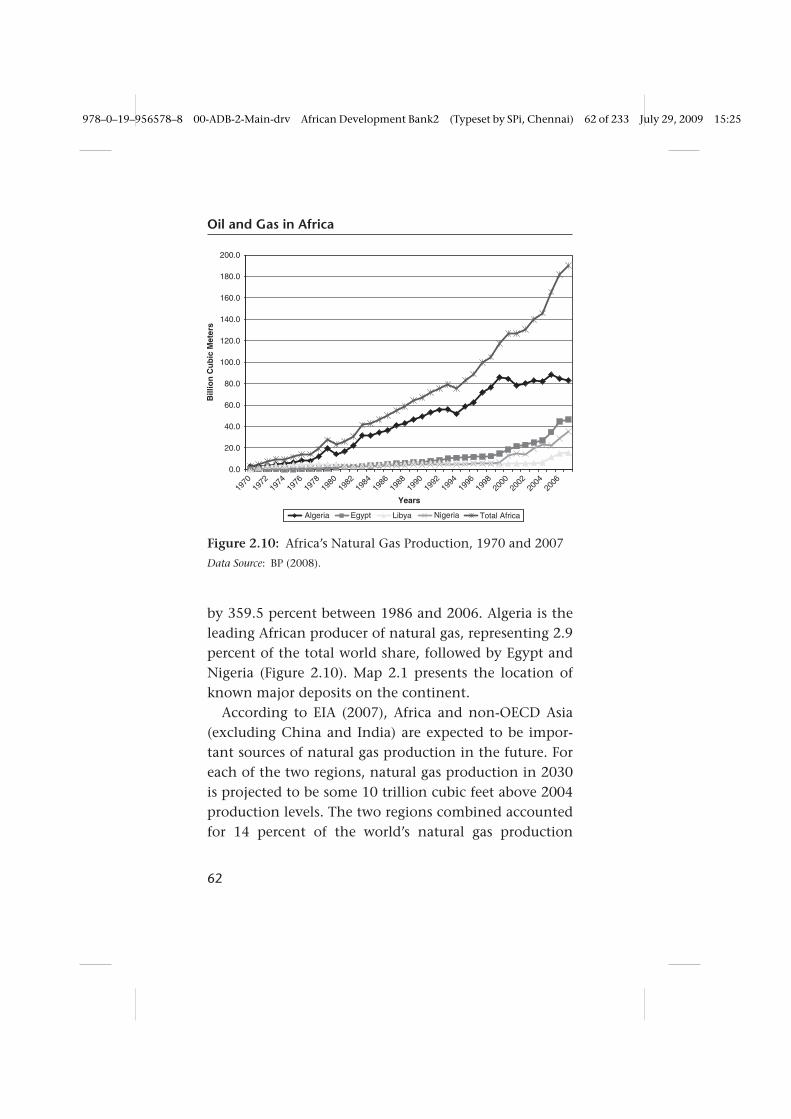
978–0–19–956578–8 00-ADB-2-Main-drv African Development Bank2 (Typeset by SPi, Chennai) 62 of 233 July 29, 2009 15:25
Oil and Gas in Africa
0.0
20.0
40.0
60.0
80.0
100.0
120.0
140.0
160.0
180.0
200.0
1970
1972
1974
1976
1978
1980
1982
1984
1986
1988
1990
1992
1994
1996
1998
2000
2002
2004
2006
Years
Bill
ion
Cu
bic
Met
ers
Algeria Egypt Libya Nigeria Total Africa
Figure 2.10: Africa’s Natural Gas Production, 1970 and 2007
Data Source: BP (2008).
by 359.5 percent between 1986 and 2006. Algeria is theleading African producer of natural gas, representing 2.9percent of the total world share, followed by Egypt andNigeria (Figure 2.10). Map 2.1 presents the location ofknown major deposits on the continent.
According to EIA (2007), Africa and non-OECD Asia(excluding China and India) are expected to be impor-tant sources of natural gas production in the future. Foreach of the two regions, natural gas production in 2030is projected to be some 10 trillion cubic feet above 2004production levels. The two regions combined accountedfor 14 percent of the world’s natural gas production
62

978–0–19–956578–8 00-ADB-2-Main-drv African Development Bank2 (Typeset by SPi, Chennai) 63 of 233 July 29, 2009 15:25
Oil and Gas in Africa
in 2004; in 2030, their combined share is projected tobe 21 percent. A substantial portion of the productionfrom both regions is exported. In 2004, 26 percent ofnatural gas production from non-OECD Asian countries(primarily Brunei, Indonesia, Malaysia, and Myanmar)and 50 percent of the production from African countrieswas exported. In 2030, the export share of productionfrom non-OECD Asia is projected to fall to 10 percentas domestic consumption rises, while the export share ofAfrica’s production is projected to increase even faster.Several pipelines from North Africa to Europe are underconsideration, and LNG export capacity in West Africacontinues to expand.
2.8 Consumption of Gas
Worldwide consumption of natural gas will increasefrom 100 trillion cubic feet in 2004 to 163 trillion cubicfeet in 2030 in the EIA 2007 reference case. By energysource, the projected increase in natural gas consump-tion is second only to coal. Natural gas remains a keyfuel in the electric power and industrial sectors. In thepower sector, natural gas is an attractive choice for newgenerating plants because of its relative fuel efficiency.Natural gas also burns more cleanly than coal or petro-leum products. As more governments begin implement-ing national or regional plans to reduce carbon dioxideemissions, they may encourage the use of natural gas todisplace liquids and coal.
63
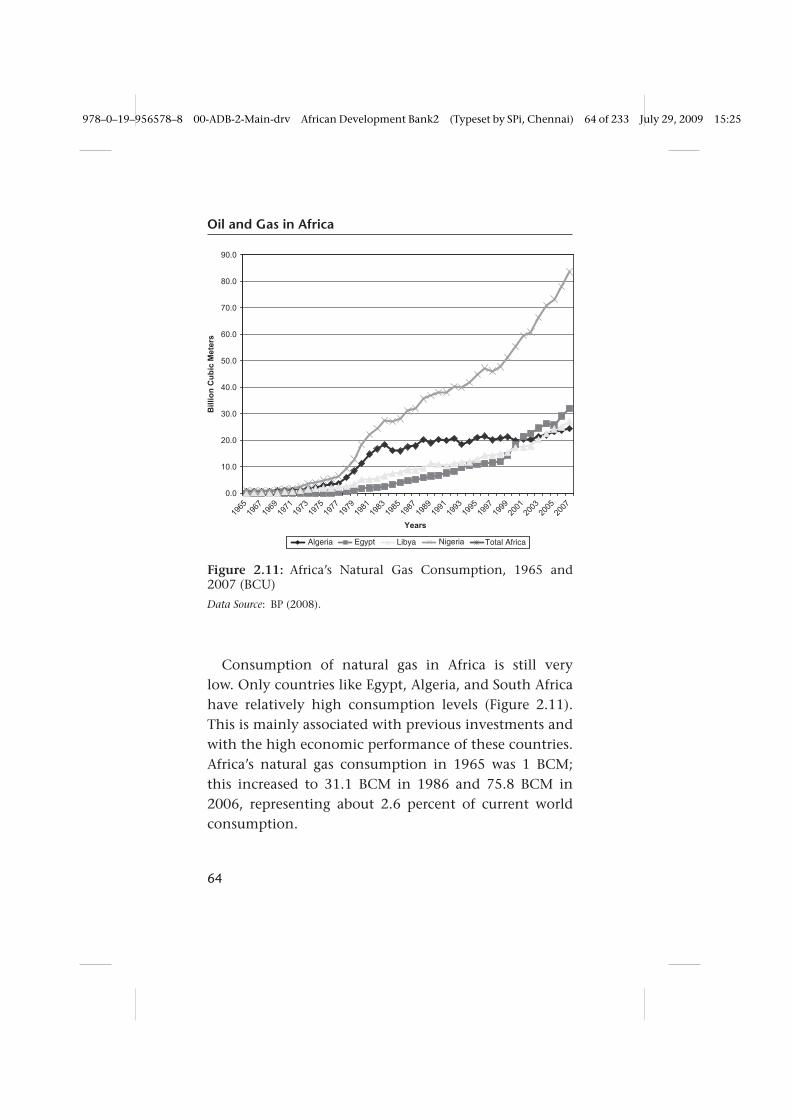
978–0–19–956578–8 00-ADB-2-Main-drv African Development Bank2 (Typeset by SPi, Chennai) 64 of 233 July 29, 2009 15:25
Oil and Gas in Africa
0.0
10.0
20.0
30.0
40.0
50.0
60.0
70.0
80.0
90.0
1965
1967
1969
1971
1973
1975
1977
1979
1981
1983
1985
1987
1989
1991
1993
1995
1997
1999
2001
2003
2005
2007
Years
Bill
ion
Cub
ic M
eter
s
Algeria Egypt Libya Nigeria Total Africa
Figure 2.11: Africa’s Natural Gas Consumption, 1965 and2007 (BCU)
Data Source: BP (2008).
Consumption of natural gas in Africa is still verylow. Only countries like Egypt, Algeria, and South Africahave relatively high consumption levels (Figure 2.11).This is mainly associated with previous investments andwith the high economic performance of these countries.Africa’s natural gas consumption in 1965 was 1 BCM;this increased to 31.1 BCM in 1986 and 75.8 BCM in2006, representing about 2.6 percent of current worldconsumption.
64

978–0–19–956578–8 00-ADB-2-Main-drv African Development Bank2 (Typeset by SPi, Chennai) 65 of 233 July 29, 2009 15:25
Oil and Gas in Africa
2.9 Natural Gas Market Dynamics
Natural gas prices were steady and low until 2000, whenthey began to follow world oil prices, rising sharply from2 to 9 USD per million BTU for CIF Europe (Figure 2.12).
The dynamics of natural gas markets are fundamen-tally different from those of crude oil, which is extremelysensitive to geopolitical events. Natural gas is boughtand sold through a large, integrated, continental scalemarket with multiple pricing hubs. Natural gas transferson the TransCanada Alberta System represent the mainCanadian pricing hub (AECO “C”), while the Henry Hubin Louisiana is the pricing point for natural gas traded onthe New York Mercantile Exchange (NYMEX). The priceof natural gas traded at these hubs is publicly postedand sets a commodity cost for natural gas. Natural gas
Natural Gas Prices
0.00
2.00
4.00
6.00
8.00
10.00
12.00
1985
1987
1989
1991
1993
1995
1997
1999
2001
2003
2005
USD
per
mill
ion
BTU
European Union cifOECD countries cif
Figure 2.12: Natural Gas Prices (CIF Europe and OECDCountries)
Data Source: BP (2007).
65

978–0–19–956578–8 00-ADB-2-Main-drv African Development Bank2 (Typeset by SPi, Chennai) 66 of 233 July 29, 2009 15:25
Oil and Gas in Africa
Box 2.7: NIGERIA ALONE COULD MEET THE POWER NEEDS OF ALLOF WEST AFRICA
Nigeria is gradually trying to develop a regional market for its gas.The government is working on a plan to build about 600 km of newgas pipeline to Benin, Togo, and Ghana. The governments of thesefour West African nations agreed in 1995 to build the pipeline, which,with the existing pipeline, would stretch about 960 km. This pipelineproject, according to World Bank studies, could save West Africancountries importing the gas about $500 billion in primary energy costsover 20 years.
The pipeline will provide markets for Nigeria’s natural gas, thusearning hard currency for the country’s economic and social devel-opment. It will also enable a reduction in gas flaring, leading to a saferenvironment in Nigeria, and contribute to the long-desired economicintegration of the region.
Nigeria is potentially capable of fueling the power needs of thewhole of West Africa.
Adapted from: Obadina (2000).
prices are highly influenced by contracts between naturalgas buyers and sellers trading in the natural gas futuresmarket. Futures contracts quote prices for delivery of aspecified quantity of natural gas at a particular time andplace in the future. Delivery ranges from one or twomonths from the date of inception to several years inthe future. The futures contracts are traded exclusivelyon regulated exchanges and are settled daily based ontheir current value in the marketplace (CNGMO, 2007).
The price consumers pay is the sum of threeparts: the commodity cost of the natural gas, thepipeline transportation cost, and the distribution cost(CNGMO, 2007). The trade movement of liquefied nat-ural gas in Africa is geared to the international markets,the largest importers being Turkey, Italy, Greece, and
66

978–0–19–956578–8 00-ADB-2-Main-drv African Development Bank2 (Typeset by SPi, Chennai) 67 of 233 July 29, 2009 15:25
Oil and Gas in Africa
Table 2.14: Natural Gas: Trade Movements, 2006—Liquefied Natural Gas (LNG)
From (in BCM) (BCM)Total
ImportsTo Algeria Egypt Libya Nigeria
North AmericaUnited States 0.49 3.60 1.62 16.56Mexico 0.16 0.54 0.94EuropeBelgium 3.35 0.25 0.16 4.28France 7.35 2.30 4.23 13.88Greece 0.45 0.04 0.49Italy 3.00 0.10 3.10Portugal 1.97 1.97Spain 2.80 4.80 0.72 7.10 24.42Turkey 4.60 1.12 5.72UK 2.00 0.96 3.56Asia PacificChina 1.00India 0.08 0.55 0.08 7.99Japan 0.24 0.80 0.22 81.86South Korea 0.32 1.25 0.16 34.14Taiwan 0.16 0.38 10.20TOTAL 24.68 14.97 0.72 17.58 210.11
Data Source: BP Statistical Review of World Energy (BP, 2006).
France, which import nearly 100 percent of their needsfrom Africa. The largest exporter in Africa is Algeria,which exports 24.68 BCM per year (Table 2.14).
2.10 Africa’s Position on the Global Energy Scene
Most African oil producers are members of OPEC (Orga-nization of the Petroleum Exporting Countries), whosestated goal is to promote sovereign control over resources
67

978–0–19–956578–8 00-ADB-2-Main-drv African Development Bank2 (Typeset by SPi, Chennai) 68 of 233 July 29, 2009 15:25
Oil and Gas in Africa
and attempt to stabilize world oil markets with fair pricesfor producers and guaranteed security of supply to con-sumers.
Considering the current energy uncertainties, the keydrivers of future demand, consumer countries’ policies(especially on nuclear and other alternatives to oil andgas), and expected future global economic growth andtechnology development, there is need to clearly estab-lish Africa’s position and develop strategies for futuresupply adequacy.
The evidence indicates that gas is gaining a significantshare in the global energy mix. Indeed, the World Bankestimates that the global demand for gas will outstripthat for oil as early as 2025. This projected dominanceof gas is driven by an assortment of factors that includeaccelerated growth in world economic activity, chang-ing energy markets, and advances in technology (forexample, gas-to-liquids and compressed natural gas)—allof which have combined to transform gas into a cost-competitive and flexible global energy option at a pacefew thought possible. In addition, gas offers significantenvironmental advantages over oil and coal and, as such,has become a preferred fuel in the power sector. At thesame time, indigenous gas production in Europe andAmerica is on the decline, with nearly half of total sup-plies to the United States and Europe projected to beimported by 2015.
Africa’s rich oil fields and the prospects for morediscoveries have transformed the continent into an
68

978–0–19–956578–8 00-ADB-2-Main-drv African Development Bank2 (Typeset by SPi, Chennai) 69 of 233 July 29, 2009 15:25
Oil and Gas in Africa
important player in global oil production. The conti-nent holds approximately 9.7 percent (Table 2.1) of theworld’s oil reserves and accounts for 12.1 percent ofworld oil production (2006). Africa’s oil production isexpected to continue to rise at an average rate of 6percent per year for the foreseeable future. There is evi-dence from several sources of Africa’s growing impor-tance within global energy markets: This includes recentlarge deepwater oil discoveries in Angola, Nigeria, andEquatorial Guinea. The waters around São Tomé andPrincipe are believed to hold about two billion barrels ofoil reserves and the strong interest from international oilcompanies suggests that this tiny archipelago will joina growing group of African oil producers. Thanks to theopening of the Chad–Cameroon pipeline in July 2003,Chad’s oil reserves can find their way to global markets(see Box 2.5). Oil has also recently been discovered inNiger, Ghana, and Uganda. Unsurprisingly, Africa is nowlooked upon as a key source for major oil importersseeking to diversify imports in order to achieve greaterenergy security (Malaquias, 2005).
Despite the major political and economic challengesconfronting Africa, international oil companies havecontinued to invest massive amounts of capital in furtherexploration and development of the region’s oil fields fora variety of reasons. First, foreign investors are attractedby very competitive terms and conditions offered byAfrican governments. Second, much of the oil is exploredoffshore (but not in deep waters) and therefore has the
69

978–0–19–956578–8 00-ADB-2-Main-drv African Development Bank2 (Typeset by SPi, Chennai) 70 of 233 July 29, 2009 15:25
Oil and Gas in Africa
advantage of being easily loaded and moved anywhereby ship. Also, being offshore, African oil is located faraway from onshore sites of disorder. Third, the relativeproximity to the American and European markets andthe fact that African oil tends to be particularly suited forAmerican refineries because of its high quality and lowsulfur provides an added incentive, especially for U.S.investors (Box 2.8).
Box 2.8: AFRICA’S OIL EXPORT TO THE UNITED STATES
African oil production has risen constantly over the last few years.Indeed, African countries currently supply about 15 percent of U.S. oilimports. Nigeria produces about 2.12 million b/d and exports 1.85million b/d, of which 621,000 b/d to the United States, making itthe United States’ fifth largest supplier. Much of Nigeria’s crude oilproduction—about 65 percent—is light and sweet. This makes it par-ticularly suited for American refineries because it yields high volumes ofgasoline. Nigeria has a bright energy outlook and is expected to signif-icantly increase its crude oil production in the next few years as recentdeep-water discoveries come on stream. Angola produces 900,000 b/dand exports 866,000 b/d (332,000 b/d to the United States, makingit the United States’ ninth largest supplier, and third largest non-OPECsupplier outside of the western hemisphere). Angola also has a verypromising future energy outlook, especially as oil begins to flow fromlarge fields in the Kwanza basin south of Cabinda. Cameroon, Chad,Equatorial Guinea, and Gabon export approximately 500,000 b/d inaggregate (221,000 b/d to the United States).
Data Source: Malaquias (2005).
For China, Africa has become an important area on theglobal energy scene. China currently derives a quarter ofits oil imports from Africa; it holds significant oil inter-ests in Algeria, Angola, Chad, and Sudan (Boxes 2.9 and2.10) and increasing stakes in Equatorial Guinea, Gabon,
70

978–0–19–956578–8 00-ADB-2-Main-drv African Development Bank2 (Typeset by SPi, Chennai) 71 of 233 July 29, 2009 15:25
Oil and Gas in Africa
Nigeria, and even Chad—a country that has diplomaticrelations with Taiwan. Chinese firms are becomingincreasingly involved in the Nigerian oil sector.
Box 2.9: CHINA—ENGAGING IN OIL EXTRACTION IN SUDAN
China first successfully established an oil outpost in Sudan in 1995when its National Petroleum Corporation gained oil explorationrights there. This presence grew when, in 1997, the United Statesimposed comprehensive economic, trade, and financial sanctionsagainst Sudan. China quickly filled the vacuum.
Chinese investment and technical expertise played an important rolein establishing Sudan’s oil industry, which began producing oil in 1999.Sudan currently produces about 500,000 b/d.
China’s National Petroleum Corporation is the largest shareholderin the consortium of international oil companies controlling much ofSudan’s energy sector. More than half of Sudan’s oil exports go toChina, accounting for 5 percent of China’s total oil imports. China hasalso become the biggest investor in Sudan’s $15 billion, 932-mile oilpipeline to Port Sudan on the Red Sea, where China has built a tankerterminal.
Data Source: Malaquias (2005).
Box 2.10: CHINA—ENGAGING IN ANGOLA’S OIL SECTOR
China’s growing influence in Angola’s oil sector has been facilitated bya series of soft loans, including a recent agreement whereby 10,000bpd of crude oil was tied to a US$2 billion loan to be repaid over17 years at 1.5 percent interest. These are much better terms thanAngola could ever hope to secure from other sources. This loan, partof a larger aid package, represents a significant departure from thetraditional way Angola has engaged external players—mostly throughdeals involving production-sharing agreements, market contracts, orinternational finance agreements.
Data Source: Malaquias (2005).
Africa is endowed with vast quantities of both fossiland renewable energy resources. It is the only continentin the world with frequent and substantial new finds
71
978–0–19–956578–8 00-ADB-2-Main-drv African Development Bank2 (Typeset by SPi, Chennai) 72 of 233 July 29, 2009 15:25
Oil and Gas in Africa
of oil and gas. Thus, in the last 20 years, oil reserveshave grown by over 25 percent, while gas reserves havegrown even faster, by over 100 percent. Exploiting theseresources in a sustainable manner for the benefit of thepopulations is crucial for Africa’s future development.
Oil and gas have until now been concentrated in pock-ets in North, West, and Eastern Africa. Coal reserves aredominant in the southern region, with over 95 percentin South Africa alone. As a result of this skewed distribu-tion, more than 70 percent of countries in the continentimport oil and gas to satisfy their needs (Davidson andSokona, 2002).
Geothermal deposits are available in the continent,but are mainly limited to Eastern Africa, along the RiftValley, and concentrated in Kenya and Ethiopia. In addi-tion, Africa has over 10 percent of world hydro resourcesand significant other renewable energy resources. Mostcountries in the continent enjoy long hours of sunshinewith significant radiation that can be exploited. Windresources are available in selected sites, mostly along thecoastlines in Northern, Western, and Southern Africa.
In principle, therefore, Africa is not short of energyresources, which can give the continent the energysecurity it requires. The challenge is to develop strate-gies and invest adequately—for example, access well-known technologies and overcome the major barriersthat exist. Energy insecurity undermines human develop-ment and institutional capacities and lowers economicgrowth. Energy security is correspondingly closely linkedwith social, economic, political, and environmental
72

978–0–19–956578–8 00-ADB-2-Main-drv African Development Bank2 (Typeset by SPi, Chennai) 73 of 233 July 29, 2009 15:25
Oil and Gas in Africa
development, thus making it a cross-cutting issue ratherthan one of simply finding geological energy resources.
2.10.1 Africa’s Imminent Energy Crisis
Africa currently faces an energy crisis. As late as January2008, South Africa, for instance, faced its worst energycrisis, believed to be the result of inadequate forward-planning for energy supply relative to economic growth(and corresponding energy demand) in the country andin the region.
According to Schultz (2007), taxi fares in Dakar,Senegal’s capital city, have almost doubled since 2005and blackouts occurred frequently in 2006 because state-owned utilities could not afford to pay for fuel. Thecountry relies on oil imports to power its diesel-fired gen-erators. Although conditions have improved somewhat,power cuts are on the rise again. As of May 2007, thecapital was facing 10-hour power cuts several times aweek and the government was warning of impending,unprecedented shortages. Senegal is paying nearly twicewhat it was a few years ago to import the same amount ofoil. The increased cost alone is more than seven times asmuch as the country is gaining through multilateral debtrelief programs. The government has responded to theenergy crisis by providing direct subsidies to consumers.Since the rise in world oil prices began in 2002, thesesubsidies have increased five-fold, creating yet anotherburden on the national budget.
73

978–0–19–956578–8 00-ADB-2-Main-drv African Development Bank2 (Typeset by SPi, Chennai) 74 of 233 July 29, 2009 15:25
Oil and Gas in Africa
Uganda has been plagued by increasingly frequent andsevere power outages from its hydroelectric stations onthe upper tributaries of the Nile River (Lake Victoria).Due in part to global warming, the water levels of LakeVictoria, the largest of Africa’s great lakes, have beendecreasing steadily over the last decade. As a result ofregional droughts, water levels dropped an astonishinghalf an inch per day in most of 2006 (Schultz, 2007) andUganda experienced one of the worst power shortagesin its history. As a result, the government resorted to anextreme load-shedding regimen, providing power onlyevery other day. Responding to the emergency with thesupport of the World Bank, it installed two diesel-firedgenerators to relieve the shortage—a less-than-perfectsolution.
Similar trends are occurring elsewhere in Africa, wherescarce budgetary resources, desperately needed in thehealth and education sectors, are being spent to cushionoil and electricity costs. It is estimated that poverty hasincreased as much as 6 percent in some parts of the worlddue to the hike in oil prices in recent years. Especiallyvulnerable are highly indebted countries, which rely onoil imports to fuel their economy. The poorest countriesin the world consume an almost negligible share of themillions of barrels of oil consumed every day globally,yet they are hit the most by rising world oil prices—andthen hit again by the effects of climate change associatedwith burning hydrocarbons. The solution to this crisisrequires that countries develop the tools to diversifytheir energy sources away from conventional fossil fuels
74
978–0–19–956578–8 00-ADB-2-Main-drv African Development Bank2 (Typeset by SPi, Chennai) 75 of 233 July 29, 2009 15:25
Oil and Gas in Africa
(see Schultz, 2007). These issues are further analyzed inChapters 4, 5, and 6.
2.11 Summary and Conclusion
Energy has traditionally played an important role in allnations because it is an indispensable input for economicgrowth and development. Two-thirds of global energyrequirements are met from oil and gas supplies. Evidencehas shown that there is a strong correlation betweenenergy consumption per capita and the level of eco-nomic and social progress.
The regional composition of global energy consump-tion reveals a wide disparity in global access to reli-able and adequate commercial energy. Africa, with about15 percent of the world’s population, consumes 3 per-cent of global commercial energy. One can reasonablyassume that Africa’s low energy consumption level andshare reflect both its low access to affordable commercialenergy and low level of development and industrializa-tion. Africa’s share in global energy production is about12 percent, and trending upwards. Its oil productionis expected to continue to rise at an average rate of 6percent per year for the foreseeable future. Evidence ofthe continent’s growing importance within the globalenergy markets comes from several sources, includingrecent large deepwater oil discoveries in Angola, Nigeria,and Equatorial Guinea, as well as new discoveries in suchcountries as Uganda and Ghana.
75

978–0–19–956578–8 00-ADB-2-Main-drv African Development Bank2 (Typeset by SPi, Chennai) 76 of 233 July 29, 2009 15:25
Oil and Gas in Africa
Africa holds approximately 9.7 percent of world oilreserves (2006). Its rich oil fields and the prospects formore discoveries have transformed it into an importantplayer in global oil production. However, its role is lesssignificant in terms of import or consumption of oil andoil products (3–4 percent level), although consumption ison the rise with recent improved economic performance.
The proved natural gas reserves in Africa are concen-trated mainly in four countries—Algeria, Egypt, Libya,and Nigeria—which possess 91.5 percent of the provedreserves and accounted for 7.8 percent of world provedreserves in 2006. Natural gas production and consump-tion in Africa are very low, representing 6.3 percentand 2.6 percent of world production and consumption,respectively.
World oil prices have been trending higher since 2000,and natural gas prices have tracked along. In recent years,several factors have been responsible for the current stateof the oil market, highlighted by very volatile and risingprices of crude oil and petroleum products. Some of thereasons attributed to the rise in oil prices include risingdemand in emerging economies, especially in China andin India; declining spare capacity in major producingcountries; peaking of production in several importantoil-producing areas; and lack of expansion in refinerycapacity.
The issue of the macroeconomic effects of higher oilprices has been a recurrent theme since the first major oilprice shock in the 1970s. Historical evidence shows thatoil price increases and volatility have had a significant
76

978–0–19–956578–8 00-ADB-2-Main-drv African Development Bank2 (Typeset by SPi, Chennai) 77 of 233 July 29, 2009 15:25
Oil and Gas in Africa
impact on global, regional, and national economic per-formance and outlook. Conventional wisdom, backedby empirical analysis, suggests that sustained and sharpincreases in oil prices tend to exert strong inflationarypressures, reduce output, slow down economic growth,and exacerbate unemployment in net oil-importingcountries—to which no fewer than 38 countries in Africabelong (analyzed further in Chapter 4).
The refinery industry in Africa lacks competitivenessand economies of scale. Most refineries are economi-cally inefficient, operating below 50 percent capacity.There are different regional and country visions aimedat increasing capacity and improving performance, but,by the end of 2007, very little had happened.
In light of current energy uncertainties, key drivers offuture demand, consumer countries’ policies (especiallyon nuclear and other alternatives to oil and gas), andexpected future global economic growth and technologydevelopment, there is need to clearly establish Africa’sposition and develop strategies for future supply ade-quacy. The energy crisis, which is exacerbated by thepublic outcry on the use of petroleum products—dueto its high prices, environmental impacts, and grow-ing concern about the viability of oil-based fuels andproducts—is leading to initiatives to find and developalternative energy sources (Chapter 4 discusses in detailcoping mechanisms for high oil prices).
77


![Africa Oil and Gas Nov 17%255B1%255D[1]](https://img.dokumen.tips/doc/110x75/5467bbe2b4af9f493f8b5863/africa-oil-and-gas-nov-17255b1255d1.jpg)