Embed Size (px)
Citation preview

University ofWestern SydneyBringing knowledge to life
OFFICE OF WESTERN SYDNEY
'STOCKTAKE' OF NSW AS A POTENTIAL
'KNOWLEDGE HUB'
AEGIS is a Research Centre of the University of Western Sydney
Level 8, 263 Clarence StSydney NSW 2000
PO Box Q1287QVB PostNSW 1230
Phone: (02) 8255 6200 Email: [email protected]: (02) 8255 6222Web: Web: http://aegis.uws.edu.au

AEGIS/UWS
1

Acknowledgements
This report has been prepared by the Australian Expert Group in Industry Studies (AEGIS) for the Office of Western Sydney (OWS). AEGIS is a research centre of the University of Western Sydney.
The research team working on the project was lead by Professor Jane Marceau and Dr. Cristina Martinez-Fernandez, and included Dr Bronwyn Hanna, Dr Marc Rerceretnam, Miss Kate Davison, and Mr Brian Wixted.
The cover artwork is credited to Monty Chanthapanya.
For further information please contact:
Dr Cristina Martinez-Fernandez
AEGIS University of Western Sydney PO Box Q1287 QVB Post Office NSW 1230\ Telphone: + 61 28225 6200 Fax: + 61 28225 6222 [email protected] or visit the project website: http://aegis.uws.edu.au/nswknowledgehub/main.html Disclaimer: The views expressed in this report are exclusive responsibility of the authors and do not necessarily represent those of the Office of Western Sydney. © Australian Expert Group in Industry Studies, 2005 ISBN 174108 099 1 print edition ISBN 174108 100 1 web edition Published by the University of Western Sydney, May 2005 http://www.uws.edu.au
AEGIS/UWS 2

Preface The report below describes the results of a small study carried out by AEGIS for the Office of Western Sydney in late 2002. The aim of the study was to ‘map’ or do a ‘stocktake’ of some of the knowledge assets available to New South Wales as the basis on which the State could potentially build policies for its future as a knowledge economy. The idea was to use the main conclusions of international work on the knowledge economy as the foundation for a series of studies describing and analysing what New South Wales might do in the future to maximise the value of the knowledge assets already available and the potential value of proposed new ones. The framework for the study was that of national and regional innovation systems, a framework used for more than a decade now by OECD countries seeking to improve their innovation performance.
The task of mapping the knowledge institutions in any area is vast. For this reason it was decided that this first study should focus on the public sector only and within that essentially on the universities. This limited focus already highlights a number of areas of interest and which require further study for a proper analysis. Thus, for example, the study shows the research strengths of the two biggest universities in New South Wales but for study timeframe reasons does not indicate research inputs and outputs by staff numbers, a further step required for detailed understanding and evaluation. Some other cautions are also appropriate here. The study was often handicapped by the inconsistency of some data sources and by the absence of data in several important areas. Thus, for example there are serious difficulties in interpreting business unit data after the introduction of the GST because of the linking of the ABS and Tax Office data. Detailed data of the kind needed were not yet available at the time of the study and the pre-and post-GST data are incompatible. We therefore were left with using 1998 data. We would also have liked to include employment data but the data from the 2001 census were not available when the study was undertaken and existing data were too old for sensible use. These are problems which face many studies which need to match different data sources. The study thus indicates the issues raised by and problems associated with a knowledge assets ‘stocktake’ which may have looked fairly simple at first sight.
Despite these difficulties, the study pioneers in shedding very interesting and relevant light on the issues facing a State which seeks to upgrade and maximise the value of its knowledge assets and is faced with decisions about those to which to give priority. The study both presents data on some of the most important knowledge assets in NSW and finishes with some international examples of areas (regions, States) which have developed policies to bring their knowledge assets together as a way of maximising their local economic and social value. The present study is intended as a contribution to NSW thinking about these important matters.
Jane Marceau
AEGIS
AEGIS/UWS 3

Table of Contents Acknowledgements.......................................................................................................2 Preface.......................................................................................................3 Chapter 1 : Background and Introduction ............................................................8
Knowledge hubs.........................................................................................................9
Chapter 2 : The Geographical Location of New South Wales Knowledge Institutions....................................................................................................................13 Chapter 3 : Knowledge Transmission................................................................18
Honours and Postgraduate Students.........................................................................23
Postgraduate Research and Coursework..................................................................25
Chapter 4 : Knowledge Generation by Universities in NSW.......................33 Global research expenditure ....................................................................................33
Research expenditure by fields ................................................................................35
Research expenditure by focus in university institutions in NSW..............40
Sources of research funding.....................................................................................43
Chapter 5 : Knowledge Transfer..................................................................45 The Business Population of NSW............................................................................45
Innovation propensities: Expenditure on R&D........................................................47
Sources of R&D Funding.........................................................................................50
R&D Funding and Business Size.............................................................................51
Types of R&D activity.............................................................................................53
Using public sector research and expertise..............................................................58
University commercial arms ....................................................................................65
Cooperative Research Centres .................................................................................65
Technology Parks.....................................................................................................66
Spotlight on Greater Western Sydney......................................................................66
Chapter 6 : Conclusions..................................................................................71 Canada and the US: Knowledge Generation and Transfer ......................................72
Europe: Collaboration for the Transmission of Knowledge ....................................74
POLICY PROPOSALS ...........................................................................................75
References....................................................................................................................77 Appendices...................................................................................................................79
Appendix 1A: Field of Education Classification by DEST.....................................79
Appendix 1B: ABS Research Fields, Courses and Disciplines Classification by AEGIS......................................................................................................................82
Appendix 2: GWS Postcodes...................................................................................83
AEGIS/UWS 4

Table of Maps Map 2.1: Location of knowledge centres in NSW.......................................................15
Map 2.2: Location of Knowledge Institutions between Newcastle and Wollongong .16
Map 2.3: Location of Knowledge Institutions in the Greater Sydney Area ................17
Map 2.4: Location of Australian Technology Showcase Companies in NSW............70
Table of Figures Figure 3.1: All Students (1) Enrolled in Universities by State in Australia, 2001 ......18
Figure 3.2: All Students Enrolled in Universities by Institution in NSW, 2001 .........19
Figure 3.3: Bachelor's Pass Domestic Undergraduate Students by University in NSW, 2001......................................................................................................................19
Figure 3.4: All Students in NSW by AEGIS grouping of Broad Field of Education 2001......................................................................................................................20
Figure 3.5: All Students by State in Australia and Broad Field of Education, 2001 ...21
Figure 3.6: All Students by Institution in NSW and Broad Field of Education 2001 .22
Figure 3.7: Bachelor's Pass Domestic Undergraduate Students by AEGIS grouping of RFCD and by University 2001 ............................................................................23
Figure 3.8: Bachelor's Honours Domestic Undergraduate Students by AEGIS grouping of RFCD 2001 ......................................................................................24
Figure 3.9: Bachelor's Honours Domestic Undergraduate Students by AEGIS grouping of RFCD and by University, 2001........................................................24
Figure 3.10: All Students Enrolled in Postgraduate Studies by Research and Coursework by State in Australia, 2000 ..............................................................25
Figure 3.11: All Students Enrolled in Postgraduate Studies by Research and Coursework by Institution in NSW, 2001............................................................26
Figure 3.12: Masters by Research Domestic Students by Institution in NSW 2001 ...27
Figure 3.13: Masters by Research Domestic Students in NSW by AEGIS grouping of RFCD, 2001 .........................................................................................................28
Figure 3.14: Masters by Research Domestic Students by Institution in NSW and AEGIS grouping of RFCD, 2001.........................................................................29
Figure 3.15: Masters by Research Domestic Students by AEGIS grouping of RFCD, by Institution in NSW 2001 .................................................................................29
Figure 3.16: Doctorate by Research Domestic Students in NSW by AEGIS grouping of RFCD, 2001.....................................................................................................30
Figure 3.17: Doctorate by Research Domestic Students by Institution in NSW 2001 31
Figure 3.18: Doctorate by Research Domestic Students by AEGIS grouping of RFCD, in NSW 2001 ...........................................................................................31
AEGIS/UWS 5

Figure 3.19: Doctorate by Research Domestic Students by Institution in NSW and AEGIS grouping of RFCD, 2001.........................................................................32
Figure 4.1: Research Expenditure on Research and Development by Universities by State, Australia, 2000...........................................................................................34
Figure 4.2: Research Expenditure in Australia and NSW by Type of Research Institution in 2000................................................................................................34
Figure 4.3: Expenditure on Research and Development by the Higher Education Sector by Socio-Economic Objective (SEO), by Location 2000-01 ...................35
Figure 4.4: Total Expenditure by Higher Education Sector on Research and Development by Research Fields, Courses and Disciplines (RFCD) Australia 2000-01 ................................................................................................................36
Figure 4.5: Total Expenditure by the Higher Education Sector on Research and Development by AEGIS grouping of RFCD, Australia, 2000-01. Regrouped categories. ............................................................................................................37
Figure 4.6: Expenditure on Research and Development by Universities by State in Australia and AEGIS grouping of RFCD 2000 ...................................................38
Figure 4.7: Research Expenditure by Universities in NSW in 2000 ...........................39
Figure 4.8: Expenditure by the Higher Education Sector on Research and Development by AEGIS grouping of RFCD and by the Type of Activity, Australia, 2000-01................................................................................................40
Figure 4.9: Expenditure on Research and Development by AEGIS grouping of RFCD and Institution in NSW 2000 ...............................................................................41
Figure 4.10: Research and Development Expenditure of the University of New South Wales by AEGIS groupings of RFCD in 2000....................................................42
Figure 4.11: Research and Development Expenditure of the University of Western Sydney by Broad Field of Research in 2000 .......................................................42
Figure 4.12: Expenditure on Research and Development by the Higher Education Sector, by AEGIS grouping of RFCD by Source of Funds 2000-01...................43
Figure 4.13: Expenditure on Research and Development by the Higher Education Sector, AEGIS grouping of RFCD by Source of Funds, Australia 2000-01, excluding General University Funds ...................................................................44
Figure 5.1: Number of Businesses in Industry Groups in NSW, 1998........................46
Figure 5.2: Proportion of businesses in Industry Groups in NSW as at September 1998......................................................................................................................46
Figure 5.3: Number of Businesses Undertaking Research and Development (R&D) in Australia by ANZSIC Code 2000-2001...............................................................47
Figure 5.4: Expenditure on Research and Development by Industry ANZSIC Code 2000-01 in Australia ............................................................................................48
Figure 5.5: Expenditure by Industry by Location 2000-01..........................................49
Figure 5.6: Expenditure by Location by Industry 2000-01..........................................49
Figure 5.7: Expenditure by Industry by Source of Funds 2000-01 in Australia..........50
AEGIS/UWS 6

Figure 5.8: Expenditure by Industry, by Source of Funds 2000-01 in Australia excluding Own Funds ..........................................................................................51
Figure 5.9: Expenditure by Industry on Research and Development by Business Employment Size 2000-2001 in Australia...........................................................52
Figure 5.10: Expenditure by Industry on Research and Development, by Business Employment Size 2000-2001 in NSW.................................................................52
Figure 5.11: Expenditure on Research and Development by the Type of Activity by Industry in Australia 2000-01 ..............................................................................53
Figure 5.12: Expenditure by Higher Education Sector and Industry on Research and Development by Type of Activity, 2000-01 ........................................................54
Figure 5.13: Expenditure on Research and Development by the Higher Education Sector and Industry by location 2000-01 .............................................................55
Figure 5.14: Expenditure by Higher Education Sector on Research and Development by AEGIS grouping of RFCD and by the Type of Activity, Australia, 2000-01 56
Figure 5.15: Expenditure by Higher Education Sector on Research and Development by Socio-Economic Objective by the Type of Activity, Australia 2000-01........57
Figure 5.16: Expenditure by Higher Education Sector on Research and Development in NSW by AEGIS grouping of RFCD and by the Type of Activity, 2000-01...57
Figure 5.17: Number of Patents Issued to Institutions in Australia in 2000................59
Figure 5.18: Number of Patents issued to Universities in NSW in 2000 ....................60
Figure 5.19: Total Licences, Options and Assignments Executed in Australia...........60
Figure 5.20: Number of Licences, Options and Assignments (LOAs) Executed by Universities in NSW in 2000 ...............................................................................61
Figure 5.21: Proportion of total Licences, Options and Assignments (LOAs) executed by Universities in NSW .......................................................................................62
Figure 5.22: LOAs by Discipline Group for Institutions in Australia in 2000 ............63
Figure 5.23: Licences, Options and Assignments Executed in NSW and Australia to Start-ups, and Small, Medium and Large Companies in 2000 (1).......................64
Figure 5.24: Licences, Options and Assignments Executed by Universities in NSW to Start-ups, and Small, Medium and Large Companies in 2000 ............................64
Figure 5.25: Number of Businesses in Industry Groups in Greater Western Sydney as at September 1998................................................................................................67
Figure 5.26: Proportion of Businesses in Principal Industry Groups in Greater Western Sydney as at September 1998................................................................67
AEGIS/UWS 7
Chapter 1 : Background and Introduction Modern western economies are increasingly realising that the key to their future competitiveness lies in their success in generating and using new knowledge. International experience suggests that it is important for regions and nations to maximise the value of their public sector knowledge-generating institutions (OECD 1999; Maskell 2001). The key to this maximisation is creating and improving links between knowledge producers and knowledge users, be the latter firms, other organisations or individuals needing leading edge training.
It is now widely recognised that global competitiveness is dependent on the capacity of economies to acquire knowledge capital and to apply new knowledge through a highly trained and specialised workforce. The term ‘knowledge-based’ or ‘learning economy’ emerged to describe those economies in which the production, distribution and use of knowledge are the main drivers of growth, wealth creation and employment across all industrial sectors (OECD 2001a). The concept of a knowledge-based economy has sometimes been used to make a contrast between so called ‘new’ economies based on new technologies, and ‘old’ economies based on long established products and processes.
In reality, both ‘old’ and ‘new’ sectors of an economy require new knowledge if they are to function competitively. A knowledge-based economy is not simply one that emphasises new technologies or even new knowledge. A knowledge-based economy is one in which all sectors are knowledge-intensive, are responsive to new ideas and technological change, are innovative and employ highly skilled personnel engaged in on-going learning. In short, knowledge and skills have to be usable and used in the production of all manner of goods and services (OECD 1999: 11; Smith 2000).
As knowledge economies have developed, two widely differing trends have emerged. On the one hand, as these economies have become more global they have become more independent of national institutions and processes. This is because knowledge is produced, transferred and diffused through organisational networks that are only partly dependent on proximity. Some analysts have used the term ‘organisational proximity’ to refer to the capacity to share knowledge and interactive learning among firms and other knowledge-intensive institutions, whether or not they are geographically close.
On the other hand, it has become clear that in many areas of both old and new economies, spatial proximity still seems to matter (Audretsch 1995). Much knowledge is ‘sticky’ and does not travel far. In Australia, it is therefore often important for firms and organisations located close to universities, research institutes, Co-operative Research Centres (CRCs) or the Commonwealth Scientific and Industrial Research Organisation (CSIRO) to maximise their information about what local knowledge-intensive institutions are producing or that knowledge may remain un- or under-used.
Spatial proximity to the sources of new knowledge does not automatically encourage firms to take advantage of what is on offer. This means that special measures may be needed to diffuse information, skills and technologies more effectively in the local region rather than rely on ‘simple’ commercialisation plans which do not take account
AEGIS/UWS 8

of the location of potential users. Spatial proximity between knowledge generating and using organizations will not be enough to ensure that maximum use is made of available information.
Since few areas are likely to be self-sufficient in knowledge generation and use, it is also important to see how both firms and knowledge organisations firms gather and use information drawn from multiple sources. This will also reveal gaps where firms, for instance, would prefer to work more closely with local organisations but find that the relevant knowledge and skills are not available.
Knowledge hubs A knowledge hub may be defined as an ensemble of knowledge-intensive organisations located in a specific geographical space. They can be operating in either public or private sectors or in the increasingly common ‘hybrid’ public-private arena. Some of these organisations are research-intensive, with a primary function as knowledge producers, such as research institutes or universities, while others transmit knowledge and develop new or higher level skills in their students or clients as well as undertaking research or knowledge transfer. Yet others may be knowledge-intensive and demanding user companies or organizations, such as hospitals, which rely on high level knowledge and skills and through their product development or practice also create important new knowledge which they in turn may transmit to other players in the hub.
Central to potential knowledge hubs are public sector or non-profit players, notably universities and other teaching and research organisations, in Australia including CSIRO, medical research institutes, CRCs and the more industrially-oriented areas of Technical And Further Education (TAFE). Both knowledge producers and knowledge users provide a focus for knowledge generation, transmission and diffusion, where producers and users are closely connected. Players in knowledge hubs are not necessarily physically co-located with all their clients, although they are usually thought of as having some local or regional focus. The experiences of knowledge hubs such as Silicon Valley and the North Carolina Research Triangle suggest the importance of the effective integration through the hub of human resources, public agencies and firms in generating and applying both local knowledge and knowledge produced elsewhere.
As implied above, the central organisations of knowledge hubs have three major functions:
• to generate knowledge;
• to transfer and apply knowledge; and
• to transmit knowledge to others in the community through education and training.
Knowledge hubs are thus foci for generating new knowledge, whether basic or more applied, of relevance to many industries, both old and new. The impact of this knowledge is not necessarily direct, nor immediate, but it is influential in the economic success of players in the hub and beyond through the sustained innovation that the hub facilitates. In addition, knowledge hub organisations also generate applied knowledge that is directly and immediately relevant to local industries.
AEGIS/UWS 9
The expertise (skilled personnel and high level equipment) present in an effective knowledge hub serves both to ‘capture’ knowledge generated elsewhere, nationally or internationally, and to enable the region to participate in creating and developing this further to meet specific local needs. Thus, local, national or international knowledge is translated by knowledge hub players and transferred into locally useful knowledge for supporting existing industries, generating new industries, informing public policies and meeting other kinds of community needs such as health, urban planning, environmental control, education, and aged care.
The transmission function of a knowledge hub takes place through educational institutions such as universities and schools but also through life-long learning processes that involve firms, community-based institutions and a variety of government agencies and services, including hospitals, clinics and professional associations.
Universities have an important role to play in all three major functions of a knowledge hub but they are not alone and a strong interdependent relationship between universities and the other knowledge-producing and using sectors that contribute to the hub is also vital (Tornatzky et al. 2001: 3).
Relations between the expertise available and local ‘receivers’ of knowledge are not simple. Recent work on clusters of business activity and the relationship between such clusters and ‘knowledge hubs’ centred on public sector research organisations has indicated that these relationships are a good deal more complex than was suggested by initial observers. Early studies often assumed a straightforward relationship such that more research and closer links between local industry and researchers were always ‘better’ but recent studies have shown that universities and similar public sector research institutions differ in their relationships with user organizations, both in relation to the type of new knowledge concerned in the transfer and to the mechanisms of such transfer.
There are several aspects of the situation which need to be understood by policymakers concerned with the development of knowledge economies and improving levels of innovation. Thus, for example, both relationships between and knowledge transfer from public sector organizations are critically affected by the level of sophistication of the receiving companies.
Moreover, different kinds of universities may serve different functions for different kinds of firms. Thus, it now seems that universities generating leading edge research have a very broad geographical ‘footprint’ in terms of the organizations interested in receiving the knowledge generated and sophisticated companies may well be the most interested in ‘breakthrough’ research in basic sciences rather than applied or experimental development. This is because, for example, breakthrough research information can be readily absorbed by the high level R&D personnel working in innovation and science-intensive firms and/or by the product development teams in that segment of industry but may be too difficult to use by many local enterprises.
AEGIS/UWS 10

Research-intensive firms seek information from many sources, which may be located in different places, and the personnel in the firms may be ‘symbolically close’ to knowledge generators far away as well as local. It is for these reasons that the ‘translation’ aspect of a knowledge hub can be vital for local economic development and that knowledge hub development must include measures to increase the ‘receptive capacity’ of local firms.
In some cases, a close research-intensive relationship may encourage receiving firms to relocate their operations to be nearer to particular universities generating the new knowledge but in most cases the knowledge received needs to be matched with and incorporated into high level information generated in other research organizations located elsewhere again. Provided that the firms’ ‘receptors’ are well tuned to research activities in a given set of organizations, often multinational organisations, there is no necessary reason for such firms to co-locate in any given area. This means that high-level internationally leading edge areas of research in given universities may be of great value to leading firms in certain industries wherever they may be located. However, within a well functioning knowledge hub, while high level research work may seldom directly encourage firms to co-locate with research leaders, such work, albeit via a more circuitous route, also contributes to the upgrading of firms in the researchers’ area. One mechanism for this is the improved capacity of local companies to become and remain suppliers to knowledge-demanding firms while others must upgrade their capacity to incorporate the new knowledge in order to maintain or improve their market position.
As part of this upgrading process, companies may engage with other, often more local, knowledge-generating institutions whose research is more applied and can be used to test new products or equipment. In these circumstances, enterprises may be linked to knowledge-generating institutions in ways which involve short term or formal spot contracting arrangements. These arrangements may be with individual companies or the research may be jointly commissioned and received by ‘clubs’ of enterprises with a more or less collective interest in the outcomes of research experimentation or testing.
‘Organisational proximity’ within a knowledge hub and between knowledge hubs is therefore also important. The growing sophistication of information and communication technologies has opened the way for the growth of knowledge networks ‘based upon spatially dispersed’ interaction (OECD 2001b: 21). It is the combination of proximity and spatially dispersed interaction that characterises the differing patterns of development of ‘knowledge hubs’ in various parts of the world.
Spatial distance or proximity is one aspect of the creation and diffusion of knowledge. However, the creation of a ‘knowledge hub’ has many dimensions and for the reasons mentioned above spatial proximity to the sources of new knowledge does not automatically encourage firms to take advantage of what is on offer; rather special measures to encourage ‘take up’ of new knowledge may be required. As the institutions in a knowledge hub develop and mature the challenge is to maximise local benefit for local stakeholders. Universities, through collaborative partnerships, are becoming more international and are involved in activities quite different from those typical of their role of twenty or thirty years ago.
AEGIS/UWS 11

There is thus a challenge to ensure that universities remain local knowledge diffusers and transmitters as well as knowledge producers for both their local area and other regions of national importance. Different universities in a region may perform these roles in different combinations and in different ways. Each can be very valuable. In order to maximise that value, however, we need to know what the different patterns are and how any gaps may be filled.
This requires much more detailed knowledge of the working of existing knowledge institutions in an area than is currently available. Very little work has been done in Australia in terms of the analysis of the relationships between a university and other organisations in its immediate geographical area. There have been some studies of relationships between firms and the commercial arms of universities, as for example, by the ARC (such as Crossing the Innovation Boundary) over a decade or so, but these have not been systematic and have not studied the degree to which the full potential of technologies developed locally has been realised. There have been no studies of the complete range of technologies developed by public sector research organizations in a State and the relations developed over time between the differing technologies and the recipient organisations. We thus know almost nothing about the diverse ways in which different kinds of locally-developed technologies are transferred, about whether and how local organisations bring in partners from other zones, such as venture capitalists from the Sydney CBD in the case of firms in western Sydney, or about the degree to which knowledge developed elsewhere is critical to innovation in a specified region or State.
The task of mapping these highly differentiated relationships and hence the spread of technologies throughout a region is critically important if knowledge organisations in a locality are to fulfil their potential and highly complex. There is no model for doing it properly even in the international literature, although attempts have been made by the OECD to come to grips with the issue, attempts published in such works as Cities and Regions in the New Learning Economy (OECD 2001b).
The task of mapping these interactions is vast. For this reason the principal focus of the study reported on here is on universities. This study can then form the basis for future work on other public sector research organizations, notably CSIRO, hospitals and CRCs, and on firms.
The question that lies behind the present study is how the universities located within Sydney and beyond in New South Wales and its regions can best contribute to the creation of a more innovative economic environment and turn Sydney and NSW into a more conscious promoter of knowledge of local as well as national and international value. The study reported on here indicates the outlines of what may be available to NSW in its search to become a knowledge economy of the twenty first century. It in no way claims to provide either complete information or a full analysis. It is a beginning which we hope will encourage more detailed examination.
AEGIS/UWS 12

Chapter 2 : The Geographical Location of New South Wales Knowledge Institutions
The maps in this chapter indicate the geographical location of the major public sector knowledge-intensive organisations located in New South Wales. These include university campuses, CSIRO units, hospital and medical research units and CRCs headquartered in NSW.
The map of NSW as a whole shows the concentration of the institutions along the coastal area north-south from Newcastle to Wollongong and inland to Penrith. This may be seen as the ‘Greater Sydney Knowledge Region’ (GSKR). This region contains most of the university campuses, with only those of the universities of New England (UNE), Southern Cross and Charles Stuart lying outside the area. With the exception of the agriculture-related CRCs, the NSW CRCs are also headquartered along the coastal strip around Sydney. Similarly, with the principal exception the Australian Telescope National Facility and the Agriculture, Entomology, Forestry and Forest Products, Plant Industry and Land and Water research field, the great majority of NSW CSIRO units are located in Sydney.
Within the medical knowledge system, the teaching hospitals and their associated research centres are also concentrated on the coast and, with the exception of Newcastle, in Sydney. In the medical field, the GSKR is principally within Sydney city.
Most NSW public sector research organizations are thus located in the triangle Newcastle-Penrith-Wollongong (see Maps 2.1 and 2.2).
Even within the Sydney area itself, moreover, there are also clear concentrations. The map of greater Sydney (Map 2.3) shows some concentration in the centre and eastern suburbs of the city, with some on the north shore (North Ryde). Once north of Ryde and west of Homebush there is remarkably little. The University of Western Sydney (UWS) has its central campuses west of Homebush, the University of Sydney has a campus at Camden and there is a concentration of research and teaching at and around Westmead Children’s Hospital but west of the Ryde-Homebush line there are no CSIRO units. Wollongong is planning a small campus at Bowral while Newcastle has one on the Central Coast but these constitute the only ones south of Sydney city within NSW and between Newcastle and North Ryde.
UWS is the only large tertiary level teaching university operating in the western part of the Greater Sydney Knowledge Region. UWS serves a very large urban population as well as the rural fringes of the city such as the Blue Mountains, Wollondilly Shire and the Southern Highlands. While the area also provides many students to the other Sydney universities, UWS remains the closest for many and the tertiary institution of their choice.
Some TAFE Institutes are located in the west, mostly in the northwest and southeast of the western region. These offer some specialities not offered in most TAFE, thus serving both the immediate region and beyond. One TAFE campus is co-located with
AEGIS/UWS 13

a UWS campus and a high school (at Quaker Hill) and another with the UWS campus at Campbelltown.
In most cases, therefore, families and businesses both in the west of the State and in the west of Sydney do not have the same access to knowledge-intensive institutions as do those located further east. The far northern suburbs of Sydney are also somewhat disadvantaged in terms of access, in contrast to the south where there is almost equal access to Sydney and to Wollongong institutions.
The geographical spread and concentration of the knowledge institutions of NSW need to borne in mind when considering the data in the following chapters.
AEGIS/UWS 14

Map 2.1: Location of knowledge centres in NSW
AEGIS/UWS
15
1 University Campus
18 University Campuses
1 CSIRO Lab2 CSIRO Labs3 CSIRO Labs
13 CSIRO Labs
1 Hospital
11 Hospitals
1 CRC
3 CRC’s
8 CRC’s
1 University Campus
18 University Campuses
1 CSIRO Lab2 CSIRO Labs3 CSIRO Labs
13 CSIRO Labs
1 Hospital
11 Hospitals
1 CRC
3 CRC’s
8 CRC’s

Map 2.2: Location of Knowledge Institutions between Newcastle and Wollongong
Newcastle
WyongHawkesbury
Gosford
Blue Mountains
Wollondilly
Camden
Campbelltown
Wingecarribee Wollongong
Sutherland
Botany Bay
Sydney
Warringah
University campus
CSIRO Units
Hospital and Medical Research UnitsCRC Head Office
Newcastle
WyongHawkesbury
Gosford
Blue Mountains
Wollondilly
Camden
Campbelltown
Wingecarribee Wollongong
Sutherland
Botany Bay
Sydney
Warringah
Newcastle
WyongHawkesbury
Gosford
Blue Mountains
Wollondilly
Camden
Campbelltown
Wingecarribee Wollongong
Sutherland
Botany Bay
Sydney
Warringah
University campus
CSIRO Units
Hospital and Medical Research UnitsCRC Head Office
AEGIS/UWS 16

Map 2.3: Location of Knowledge Institutions in the Greater Sydney Area
University Campus
CSIRO Lab
Hospital
CRC
University Campus
CSIRO Lab
Hospital
University Campus
CSIRO Lab
Hospital
CRC
AEGIS/UWS 17

Chapter 3 : Knowledge Transmission
In 2001, 231,561 domestic and international students were enrolled in NSW universities. The majority of the students (145,463 – 62.8%) were in Sydney at the city’s five public universities with some in the Australian Catholic University. The city universities are ‘ringed’ by Newcastle to the north, Wollongong to the south and Charles Sturt, UNE and Southern Cross in the country areas further out. The total numbers and their distribution by state and university are shown in Figures 3.1 and 3.2.
Figure 3.1: All Students (1) Enrolled in Universities by State in Australia, 2001
0
50,000
100,000
150,000
200,000
250,000
Tasmania SouthAustralia
WesternAustralia
Queensland Victoria New SouthWales
State
Num
ber o
f Stu
dent
s
(1) ‘All students’ in this report encompasses the total number of actual students at all levels and includes both overseas and domestic students. Students are otherwise designated by level and/or as domestic or international. Source: Commonwealth Department of Education, Science and Training, 2002, Table 29
AEGIS/UWS 18

Figure 3.2: All Students Enrolled in Universities by Institution in NSW, 2001
05,000
10,00015,00020,00025,00030,00035,00040,000
Sou
ther
n C
ross
Uni
vers
ity
Uni
vers
ity o
f Wol
long
ong
The
Uni
vers
ity o
f New
Eng
land
The
Uni
vers
ity o
fN
ewca
stle
Mac
quar
ie U
nive
rsity
Uni
vers
ity o
f Tec
hnol
ogy,
Syd
ney
Uni
vers
ity o
f Wes
tern
Syd
ney
Cha
rles
Stu
rt U
nive
rsity
The
Uni
vers
ity o
f New
Sou
th W
ales
The
Uni
vers
ity o
f Syd
ney
University
Num
ber o
f Stu
dent
s
Source: Commonwealth Department of Education, Science and Training, 2002, Table 29
Figure 3.2 shows Sydney as the biggest university in terms of student numbers, followed by UNSW, Charles Sturt and UWS. Looking only at pass degree, domestic students changes the ranks somewhat as shown in Figure 3.3.
Figure 3.3: Bachelor's Pass Domestic Undergraduate Students by University in NSW, 2001
0
5000
10000
15000
20000
25000
30000
The
Uni
vers
ity o
f Syd
ney
The
Uni
vers
ity o
f Wes
tern
Syd
ney
The
Uni
vers
ity o
f New
Sou
th W
ales
The
Uni
vers
ity o
fTe
chno
logy
, Syd
ney
Mac
quar
ie U
nive
rsity
Cha
rles
Stu
rt U
nive
rsity
The
Uni
vers
ity o
fN
ewca
stle
The
Uni
vers
ity o
f New
Eng
land
The
Uni
vers
ity o
fW
ollo
ngon
g
Sou
ther
n C
ross
Uni
vers
ity
University
Num
ber o
f Stu
dent
s
Source: Commonwealth Department of Education, Science and Training, 2002
AEGIS/UWS 19

Figure 3.4: All Students in NSW by AEGIS grouping of Broad Field of Education 2001
0100002000030000400005000060000700008000090000
100000
Hum
aniti
es, S
ocia
l Sci
ence
san
d O
ther
(1)
Man
agem
ent a
nd C
omm
erce
Hea
lth
Eng
inee
ring,
Rel
ated
Tech
nolo
gies
and
Arc
hite
ctur
ean
d B
uild
ing
Nat
ural
and
Phy
sica
l Sci
ence
s
Info
rmat
ion
Tech
nolo
gy
Agr
icul
ture
, Env
ironm
enta
l and
Rel
ated
Stu
dies
AEGIS grouping of Broad Field of Education (2)
Num
ber o
f Stu
dent
s
(1) Includes the DEST categories Society and Culture, Creative Arts, Education, and Food, Hospitality and Personal Services. (The DEST category ‘Society and Culture’ includes the RFCD categories Political Science and Policy Studies, Studies in Human Society, Human Welfare Studies and Services, Behavioural Science, Law, Justice and Law Enforcement, Librarianship, Information Management and Curatorial Studies, Language and Literature, Philosophy and Religious Studies, Economics and Econometrics, Sport and Recreation and Other Society and Culture). Unless otherwise stated, these categories are used in Figures 3.5 and 3.6. (2) This is a DEST designation and is different to the Research and Development classifications. Source: Commonwealth Department of Education, Science and Training, 2002, Table 32
For some analyses in this report we have relied upon DEST aggregate data (Broad Field of Education). However, where possible we have accessed more detailed data and presented the data with a classification scheme that we believe both reflects the needs of the analysis and is generally more illuminating as to the structure of student enrolments. In NSW, around 93,637 people (39%) (all levels, domestic and overseas) are studying in the Humanities, Social Sciences and Other disciplines as defined by DEST. Next come student numbers in Management and Commerce (about 57,532) and then Health (26,290). In other words, DEST figures suggest that Humanities, Social Science and Other faculties enrol between three and four times as many students as do Health fields and 40% more than do Management and Commerce. Starting from the other end of the scale, there are, as could be expected, fewest students in Agriculture, Veterinary Science and Environmental Sciences. The low numbers in the Environment field may be a cause for alarm, especially given the importance just allocated to that field in the Federal government’s choice of research priorities. Then, going upwards along the scale again, come the numbers enrolled in IT. These numbers are smaller than one might expect given the Federal research priority seen in the creation of the National IT Centre of Excellence (allocated in 2002 to a
AEGIS/UWS 20

consortium led by NSW). After IT come Engineering, Related Technologies and Architecture and Building, and the Natural and Physical Sciences, again a worryingly small proportion given the input of such sciences to the development of the more specialised technology fields and industrial innovation as well as engineering and technology development itself. Given that the biggest and fastest growing segment of the New South Wales economy is property and business services, both in terms of value-added and employment growth, the implication from the figures given above is that the Humanities, Social Science and Other faculties are the principal training grounds for these fields as well as for government and many other business activities. The contrast here is with Science students, of whom there are few. Many manufacturing businesses depend on science students’ expertise as graduates if they are to grow and innovate but they seem to provide few career opportunities for such graduates, as we show in a later chapter of this report.
The spread of students as between fields of study in NSW is largely paralleled in Victoria (see Figure 3.5) but in Victoria there seem to be somewhat fewer people enrolled in Humanities and Social Science (69,954) and somewhat more in IT, while the number in Management and Commence in Victoria is almost the same (54,900 against 57,532) as in NSW. Students thus seem to be more oriented towards more specialized degrees in Victoria than they are in NSW, although not in Health or Engineering.
Figure 3.5: All Students by State in Australia and Broad Field of Education, 2001
0
10,000
20,000
30,000
40,000
50,000
60,000
70,000
80,000
90,000
100,000
New SouthWales
Victoria Queensland WesternAustralia
SouthAustralia
Tasmania
State
Num
ber o
f stu
dent
s
Natural and Physical SciencesInformation TechnologyEngineering, Related Technologies and Architecture and BuildingAgriculture, Environmental and Related StudiesHealthManagement and CommerceHumanities, Social Sciences and Other
Source: Commonwealth Department of Education, Science and Training, 2002, Table 32
AEGIS/UWS 21

Figure 3.6: All Students by Institution in NSW and Broad Field of Education 2001
02000400060008000
10000120001400016000
Cha
rles
Stu
rt U
nive
rsity
Mac
quar
ie U
nive
rsity
Sou
ther
n C
ross
Uni
vers
ity
The
Uni
vers
ity o
f New
Eng
land
The
Uni
vers
ity o
f New
Sou
th W
ales
The
Uni
vers
ity o
fN
ewca
stle
The
Uni
vers
ity o
f Syd
ney
Uni
vers
ity o
f Tec
hnol
ogy,
Syd
ney
Uni
vers
ity o
f Wes
tern
Syd
ney
Uni
vers
ity o
f Wol
long
ong
University
Num
ber o
f stu
dent
sNatural and Physical SciencesInformation TechnologyEngineering, Related Technologies and Architecture and BuildingAgriculture, Environmental and Related StudiesHealthManagement and CommerceHumanities, Social Sciences and Other
Source: Commonwealth Department of Education, Science and Training, 2002, Table 32
As Figures 3.6 and 3.7 show, the patterns of enrolments across the disciplines in individual universities in NSW also show differences in knowledge transmission between the two research powerhouses, the University of Sydney and UNSW. At the University of Sydney, students in the Humanities, Social Sciences and ‘Other’ predominate. At UNSW, in contrast, as befits its professional business image, student enrolments more closely match the university’s research strengths in the Humanities, Social Sciences, Health, and Engineering student groups. The University of Wollongong has a balance between its Science, IT and Engineering groups.
AEGIS/UWS 22

Figure 3.7: Bachelor's Pass Domestic Undergraduate Students by AEGIS grouping of RFCD and by University 2001
0100020003000400050006000700080009000
10000
Agric
ultu
re, V
eter
inar
y an
dEn
viro
nmen
tal S
cien
ces
Econ
omic
s an
d C
omm
erce
Engi
neer
ing
and
Tech
nolo
gy
Hum
anitie
s, S
ocia
l Sci
ence
s an
dO
ther
(1)
Info
rmat
ion,
Com
pute
r and
Com
mun
icat
ion
Scie
nces
Law
, Jus
tice
and
Law
Enfo
rcem
ent
Med
ical
and
Hea
lth S
cien
ce
Nat
ural
and
Phy
sica
l Sci
ence
s
Num
ber o
f stu
dent
sCharles Sturt UniversityMacquarie UniversitySouthern Cross UniversityThe University of New EnglandThe University of New South WalesThe University of NewcastleThe University of SydneyUniversity of Technology, SydneyUniversity of Western SydneyUniversity of Wollongong
(1) Includes the RFCD categories Education, Studies in Human Society, Behavioural and Cognitive Sciences and Other Research Fields (excluding Law, Justice and Law Enforcement). ‘Other Research Fields’ includes Architecture, Urban Environment and Building, Policy and Political Science, Journalism, Librarianship and Curatorial Studies, The Arts, Language and Culture, History and Archaeology and Philosophy and Religion. These categories are used in Figures 3.8 and 3.9 below.
Source: Commonwealth Department of Education, Science and Training, 2002. Commissioned data.
Shifting to look at domestic students following courses leading to Bachelor Pass degrees and using the AEGIS regroupings of RFCD categories changes the picture somewhat. We have changed from Broad Field of Education to RFCD because we have more detailed data from DEST that we can categorise by RFCD. With this regrouping we can see for the first time the significance of law and justice studies – in many cases there are more students there than in ICC.
Honours and Postgraduate Students As Honours students in universities, they undertake their first training in the realm of research. Figure 3.8 indicates the spread of domestic Honours students in NSW in 2001. As with pass degree students, we see the dominance of the three blocks of the Humanities and Social Sciences, Economics and Commerce and the Natural Sciences, fairly closely followed by Health and Medical Sciences. There are almost no Honours students in Law, Engineering and Technology, ICC or Agriculture, Veterinary And Environmental Sciences. This indicates the lack of a base for potential researchers in these fields.
AEGIS/UWS 23

Figure 3.8: Bachelor's Honours Domestic Undergraduate Students by AEGIS grouping of RFCD 2001
0200400600800
10001200140016001800
Hum
anitie
s, S
ocia
l Sci
ence
s an
dO
ther
Nat
ural
and
Phy
sica
l Sci
ence
s
Med
ical
and
Hea
lth S
cien
ce
Econ
omic
s an
d C
omm
erce
Agric
ultu
re, V
eter
inar
y an
dEn
viro
nmen
tal S
cien
ces
Info
rmat
ion,
Com
pute
r and
Com
mun
icat
ion
Scie
nces
Engi
neer
ing
and
Tech
nolo
gy
Law
, Jus
tice
and
Law
Enf
orce
men
t
Num
ber o
f Stu
dent
s
Source: Commonwealth Department of Science, Education and Training, 2002. Commissioned data.
Figure 3.9: Bachelor's Honours Domestic Undergraduate Students by AEGIS grouping of RFCD and by University, 2001
0
50
100
150
200
250
300
350
400
Agric
ultu
re,
Vete
rinar
y an
dEn
viro
nmen
tal
Scie
nces
Econ
omic
s an
dC
omm
erce
Engi
neer
ing
and
Tech
nolo
gyH
uman
ities,
Soci
alSc
ienc
es a
ndO
ther
Info
rmat
ion,
Com
pute
r and
Com
mun
icat
ion
Scie
nces
Law
, Jus
tice
and
Law
Enfo
rcem
ent
Med
ical
and
Hea
lth S
cien
ce
Nat
ural
and
Phys
ical
Scie
nces
Num
ber o
f stu
dent
s
Charles Sturt UniversityMacquarie UniversitySouthern Cross UniversityThe University of New EnglandThe University of New South WalesThe University of New castleThe University of SydneyUniversity of Technology, SydneyUniversity of Western SydneyUniversity of Wollongong
Source: Commonwealth Department of Science, Education and Training, 2002. Commissioned data.
AEGIS/UWS 24

Figure 3.8 and 3.9 show the distribution of domestic Honours students in NSW in 2001. Overall, Humanities and Social Sciences considered broadly but not including Economics and Commerce dominate the picture. They also dominate in several universities.
Postgraduate Research and Coursework Knowledge transmission in universities takes place not only in relation to undergraduates but also to research and coursework postgraduate students. Research students in some disciplines, especially in the sciences where they are more likely to work in teams with researchers, are part of both knowledge transmission and generation within a knowledge hub. For the purposes of this report, they are included under knowledge transmission as they are ‘apprentice’ researchers and require specific supervision (teaching).
While postgraduate coursework students are not usually trainee researchers, they are deepening and / or broadening their education and there is anecdotal evidence that some of them later return to undertake research degrees. Some information on numbers and distribution is presented here as they are a pool of expertise for the State.
First, a picture Australia-wide of the patterns of enrolment of postgraduate students by State. Figure 3.10 shows that NSW and Victoria have almost the same number of research students enrolled. This suggests that Victorian universities devote proportionately more resources to the training of research students than do their NSW counterparts. In all States except Tasmania there are many more postgraduate coursework students than research students but both numbers there are small.
Figure 3.10: All Students Enrolled in Postgraduate Studies by Research and Coursework by State in Australia, 2000
0
5000
10000
15000
20000
25000
30000
35000
40000
45000
New SouthWales
Victoria Queensland WesternAustralia
SouthAustralia
Tasmania
State
Num
ber o
f Stu
dent
s
Postgraduate by ResearchPostgraduate by Coursework
AEGIS/UWS 25Source: Commonwealth Department of Education, Science and Training, 2002, Table 29

Figure 3.11 below shows the distribution of both postgraduate research and coursework students by institutions of enrolment in NSW. The patterns of enrolment of the two kinds of students differ markedly. The University of Sydney leads by a long way in relation to numbers of research postgraduate students enrolled (3157) and has only relatively few more coursework postgraduates (3962). In other universities, the pattern is quite different, with coursework students dominating by far. These different proportions are especially stark at UNSW, Charles Sturt, Macquarie and UTS. For its size in terms of undergraduate numbers, UWS has strikingly few postgraduates preparing either coursework or research degrees (this may reflect in part recent shifts in Commonwealth postgraduate policies which have reduced the number of HECS-funded places at some universities, but the effects in 2001 were small).
Figure 3.11: All Students Enrolled in Postgraduate Studies by Research and Coursework by Institution in NSW, 2001
0100020003000400050006000700080009000
10000
Cha
rles
Stu
rt U
nive
rsity
Mac
quar
ie U
nive
rsity
Sou
ther
n C
ross
Uni
vers
ity
The
Uni
vers
ity o
f New
Eng
land
The
Uni
vers
ity o
f New
Sou
thW
ales
The
Uni
vers
ity o
f New
cast
le
The
Uni
vers
ity o
f Syd
ney
Uni
vers
ity o
f Tec
hnol
ogy,
Syd
ney
Uni
vers
ity o
f Wes
tern
Syd
ney
Uni
vers
ity o
f Wol
long
ong
University
Num
ber o
f Stu
dent
s
Postgraduate by Research
Postgraduate by Coursework
Source: Commonwealth Department of Education, Science and Training, 2002, Table 29
The following discussion takes account only of domestic students as these are perhaps of most interest when discussing the situation of NSW as a knowledge hub.
Figure 3.12 shows the distribution between NSW universities in 2001 of domestic Master degree level research students. Here the University of Sydney dominates, with relatively small differences between the next several universities given other differences in their student numbers and research profiles.
AEGIS/UWS 26

Figure 3.12: Masters by Research Domestic Students by Institution in NSW 2001
0
100
200
300
400
500
600
700
Uni
vers
ity o
f Syd
ney
Uni
vers
ity o
f New
Sou
thW
ales
Uni
vers
ity o
f New
cast
le
Uni
vers
ity o
f Wes
tern
Syd
ney
Uni
vers
ity o
f New
Eng
land
Mac
quar
ie U
nive
rsity
Uni
vers
ity o
f Tec
hnol
ogy,
Syd
ney
Uni
vers
ity o
f Wol
long
ong
Cha
rles
Stu
rt U
nive
rsity
Sou
ther
n C
ross
Uni
vers
ity
University
Num
ber o
f stu
dent
s
Source: Commonwealth Department of Education, Science and Training, 2002. Commissioned data.
Domestic Master degree candidates are concentrated overwhelmingly in the Humanities, Social Sciences and Other (including education). There are relatively small differences between the next three categories and then between the last three (see Figure 3.13).
AEGIS/UWS 27

Figure 3.13: Masters by Research Domestic Students in NSW by AEGIS grouping of RFCD, 2001
0100200300400500600700800900
100011001200
Hum
anitie
s, S
ocia
l Sci
ence
s an
dO
ther
(1)
Med
ical
and
Hea
lth S
cien
ce
Nat
ural
and
Phy
sica
l Sci
ence
s
Engi
neer
ing
and
Tech
nolo
gy
Econ
omic
s an
d C
omm
erce
Agric
ultu
re, V
eter
inar
y an
dEn
viro
nmen
tal S
cien
ces
Law
, Jus
tice
and
Law
Enfo
rcem
ent
Info
rmat
ion,
Com
pute
r and
Com
mun
icat
ion
Scie
nces
Num
ber o
f stu
dent
s
(1) Includes the RFCD categories Education, Studies in Human Society, Behavioural and Cognitive Sciences and Other Research Fields (excluding Law, Justice and Law Enforcement). Other Research Fields includes Architecture, Urban Environment and Building, Policy and Political Science, Journalism, Librarianship and Curatorial Studies, The Arts, Language and Culture, History and Archaeology and Philosophy and Religion. These categories are also used in Figures 3.14, 3.15, 3.16, 3.18 and 3.19 below. Source: Commonwealth Department of Education, Science and Training, 2002. Commissioned data.
Patterns of enrolment also differ by university (see Figure 3.14). The profile of Sydney University, for example, shows very strong specialisation in the Humanities, Social Sciences and Other (including Education) and Health and Medical fields. There is some further emphasis on the Sciences and Engineering and Technology. UNSW similarly specialises in the Humanities, Social Sciences and Other but to a much lesser extent and has a relatively lesser emphasis on Health and more on Engineering and Technology. UWS, in contrast, specialises in the Humanities, Social Sciences and Other and in Economics and Commerce.
AEGIS/UWS 28

Figure 3.14: Masters by Research Domestic Students by Institution in NSW and AEGIS grouping of RFCD, 2001
0
50
100
150
200
250
300C
harle
sS
turt
Uni
vers
ity
Mac
quar
ieU
nive
rsity
Sou
ther
nC
ross
Uni
vers
ityU
nive
rsity
of
New
Eng
land
Uni
vers
ity o
fN
ew S
outh
Wal
es
Uni
vers
ity o
fN
ewca
stle
Uni
vers
ity o
fS
ydne
y
Uni
vers
ity o
fTe
chno
logy
,S
ydne
yU
nive
rsity
of
Wes
tern
Syd
ney
Uni
vers
ity o
fW
ollo
ngon
g
University
Num
ber o
f stu
dent
sAgriculture, Veterinary and Environmental SciencesEconomics and CommerceEngineering and TechnologyHumanities, Social Sciences and OtherInformation, Computer and Communication SciencesLaw, Justice and Law EnforcementMedical and Health ScienceNatural and Physical Sciences
Source: Commonwealth Department of Education, Science and Training, 2002. Commissioned data.
Figure 3.15 shows the same data reconfigured to emphasise discipline areas rather than institutions.
Figure 3.15: Masters by Research Domestic Students by AEGIS grouping of RFCD, by Institution in NSW 2001
0
50
100
150
200
250
300
Agr
icul
ture
,V
eter
inar
y an
dE
nviro
nmen
tal
Sci
ence
s
Eco
nom
ics
and
Com
mer
ce
Eng
inee
ring
and
Tech
nolo
gy
Hum
aniti
es,
Soc
ial S
cien
ces
and
Oth
erIn
form
atio
n,C
ompu
ter a
ndC
omm
unic
atio
nS
cien
ces
Law
, Jus
tice
and
Law
Enf
orce
men
t
Med
ical
and
Hea
lth S
cien
ce
Nat
ural
and
Phy
sica
lS
cien
ces
Num
ber o
f stu
dent
s
Charles Sturt UniversityMacquarie UniversitySouthern Cross UniversityThe University of New EnglandThe University of New South WalesThe University of NewcastleThe University of SydneyUniversity of Technology, SydneyUniversity of Western SydneyUniversity of Wollongong
Source: Commonwealth Department of Education, Science and Training, 2002. Commissioned data.
AEGIS/UWS 29

At doctoral level, the number of domestic students is greater than at research masters level but the patterns between discipline areas are similar (Figure 3.16).
Figure 3.16: Doctorate by Research Domestic Students in NSW by AEGIS grouping of RFCD, 2001
0
500
1000
1500
2000
2500
3000H
uman
ities,
Soc
ial S
cien
ces
and
Oth
er
Med
ical
and
Hea
lth S
cien
ce
Nat
ural
and
Phy
sica
l Sci
ence
s
Engi
neer
ing
and
Tech
nolo
gy
Econ
omic
s an
d C
omm
erce
Agric
ultu
re, V
eter
inar
y an
dEn
viro
nmen
tal S
cien
ces
Law
, Jus
tice
and
Law
Enfo
rcem
ent
Info
rmat
ion,
Com
pute
r and
Com
mun
icat
ion
Scie
nces
Num
ber o
f stu
dent
s
Source: Commonwealth Department of Education, Science and Training, 2002. Commissioned data.
Some differences are apparent in terms of the spread across NSW universities. The University of Sydney and UNSW dominate but numbers enrolled as doctoral candidates show the following group of six universities as very similar among themselves, although a long way behind, with only Charles Sturt and Southern Cross well below (Figure 3.17).
AEGIS/UWS 30

Figure 3.17: Doctorate by Research Domestic Students by Institution in NSW 2001
0200400600800
10001200140016001800200022002400
Uni
vers
ity o
f Syd
ney
Uni
vers
ity o
f New
Sou
thW
ales
Uni
vers
ity o
f Wes
tern
Syd
ney
Uni
vers
ity o
f New
cast
le
Mac
quar
ie U
nive
rsity
Uni
vers
ity o
f Wol
long
ong
Uni
vers
ity o
f Tec
hnol
ogy,
Syd
ney
Uni
vers
ity o
f New
Eng
land
Sou
ther
n C
ross
Uni
vers
ity
Cha
rles
Stu
rt U
nive
rsity
University
Num
ber o
f stu
dent
s
Source: Commonwealth Department of Education, Science and Training, 2002. Commissioned data.
Patterns of specialisation also differ substantially by institution, as can be seen from Figures 3.18 and 3.19.
Figure 3.18: Doctorate by Research Domestic Students by AEGIS grouping of RFCD, in NSW 2001
0
100
200
300
400
500
600
700
800
Agr
icul
ture
,V
eter
inar
y an
dE
nviro
nmen
tal
Sci
ence
s
Eco
nom
ics
and
Com
mer
ce
Eng
inee
ring
and
Tech
nolo
gy
Hum
aniti
es,
Soc
ial S
cien
ces
and
Oth
erIn
form
atio
n,C
ompu
ter a
ndC
omm
unic
atio
nS
cien
ces
Law
, Jus
tice
and
Law
Enf
orce
men
t
Med
ical
and
Hea
lth S
cien
ce
Nat
ural
and
Phy
sica
lS
cien
ces
Num
ber o
f stu
dent
s
Charles Sturt UniversityMacquarie UniversitySouthern Cross UniversityThe University of New EnglandThe University of New South WalesThe University of NewcastleThe University of SydneyUniversity of Technology, SydneyUniversity of Western SydneyUniversity of Wollongong
Source: Commonwealth Department of Education, Science and Training, 2002. Commissioned data.
AEGIS/UWS 31

Figure 3.19: Doctorate by Research Domestic Students by Institution in NSW and AEGIS grouping of RFCD, 2001
0100200300400500600700800
Cha
rles
Stu
rtU
nive
rsity
Mac
quar
ieU
nive
rsity
Sou
ther
nC
ross
Uni
vers
ityU
nive
rsity
of
New
Eng
land
Uni
vers
ity o
fN
ew S
outh
Wal
es
Uni
vers
ity o
fN
ewca
stle
Uni
vers
ity o
fS
ydne
yU
nive
rsity
of
Tech
nolo
gy,
Syd
ney
Uni
vers
ity o
fW
este
rnS
ydne
yU
nive
rsity
of
Wol
long
ong
University
Num
ber o
f stu
dent
s
Agriculture, Veterinary and Environmental SciencesEconomics and CommerceEngineering and TechnologyHumanities, Social Sciences and OtherInformation, Computer and Communication SciencesLaw, Justice and Law EnforcementMedical and Health ScienceNatural and Physical Sciences
Source: Commonwealth Department of Education, Science and Training, 2002. Commissioned data.
AEGIS/UWS 32

Chapter 4 : Knowledge Generation by Universities in NSW
New South Wales hosts many public sector research-intensive organisations. There are ten universities, 24 CSIRO laboratories and several medical research institutes in NSW while 15 CRCs are headquartered in the State including two awarded in late 2002 but not established when this report was written.
There are the three particular points to note in relation to knowledge generation in NSW.
The first is that knowledge-generation facilities are geographically concentrated, following the same pattern as the knowledge-intensive institutions as a whole in NSW seen in Chapter One of this report. Most NSW universities and their research staff are concentrated within a few kilometres of the coast, as are most of the CSIRO laboratories and the medical research institutes.
The second point is that the universities are quite diverse in their research profiles as between discipline strengths.
The third is that two university institutions alone, as seen in research expenditure, are clearly the research powerhouses of the State.
In this chapter we present different aspects of the knowledge generation activities undertaken by NSW universities. The scope of the present project did not allow detailed analysis of the activities of CSIRO laboratories or of the medical institutes. For the sake of simplicity, R&D carried out by businesses in NSW is described in Chapter Five, on knowledge transfer, below.
Global research expenditure Within Australia as a whole, the universities spent about $2.7 billion dollars on research in the year 2000. Of this, NSW universities spent $801.88 million, the largest share in Australia as befits our most populous State, and just ahead of the national figure for the CSIRO (see Figure 4.1). Australia-wide, medical research institutes spent $146 million, of which those in NSW spent a relatively small share, about $17 million (see Figure 4.2).
The figures on research expenditure are collected by the ABS and usually, but not completely, include staff time spent on research activity. Data on external research income can also be used to indicate relative success in obtaining research grants, including CRCs. There are advantages and disadvantages in the use of each measure. External research income figures are more limited in that they do not include research undertaken by staff who did not need or receive external funding for their work. This underestimates research activity. In this report we therefore use research expenditure as the indicator.
AEGIS/UWS 33

Figure 4.1: Research Expenditure on Research and Development by Universities by State, Australia, 2000
0
100
200
300
400
500
600
700
800
900
New SouthWales
Victoria Queensland WesternAustralia
SouthAustralia
Tasmania
State
Exp
endi
ture
($m
)
Source: Commonwealth Department of Education, Science and Training, 2000, Table 3
Figure 4.2: Research Expenditure in Australia and NSW by Type of Research Institution in 2000
0
500
1,000
1,500
2,000
2,500
3,000
TotalUniversities
Australia
TotalUniversities
NSW
Total MedicalInstitutesAustralia
Total MedicalInstitutes
NSW
CSIROAustralia
Research Institution
Exp
endi
ture
($m
)
Source: ARC National Survey of Research Commercialisation, 2002, p. 93. Figures not available by state for CSIRO.
AEGIS/UWS 34

Research expenditure by fields Two principal measures of ‘field’ or ‘focus’ of research are now used in Australia. These are Socio-Economic Objective (SEO) and Research Fields, Courses and Disciplines (RFCD). These each present a slightly different picture and each is used below. SEO classifications describe the purposes of research, which might be biotechnological, agricultural or environmental.
First, looking to the spread across fields Australia-wide as measured by ‘socio-economic objective’, the two greatest areas of research expenditure by universities were the category ‘non-oriented’ (i.e. ‘pure basic research’, for the purpose of the advancement of knowledge) and Health. The next biggest research focus as measured by SEO was Society. Then comes Economic Development and Agriculture (see Figure 4.3).
Figure 4.3: Expenditure on Research and Development by the Higher Education Sector by Socio-Economic Objective (SEO), by Location 2000-01
0
50
100
150
200
250
Def
ence
Agr
icul
ture
Min
eral
Res
ourc
es(e
xcl.
Ene
rgy)
Ene
rgy
Info
rmat
ion
and
Com
mun
icat
ion
Ser
vice
s
Man
ufac
turin
g
Oth
er E
cono
mic
Dev
elop
men
t
Hea
lth
Soc
iety
Env
ironm
ent
Non
-Orie
nted
Res
earc
h
SEO
Exp
endi
ture
($m
)
NSWVicQldSAWATas
Source: Australian Bureau of Statistics, 8111, 2002, p.13
When grouped using the other major classification of research focus, Research Fields, Courses and Disciplines (RFCD), the Medical and Health sciences field emerges even more strongly in university expenditure on research than it does using SEO (see Figure 4.4), receiving around $667 million of such R&D expenditure. Biological Sciences come next but received in 2000-2001 only half the amount, closely followed by Engineering and Technology, and ‘other’. Given the small size of the field within the higher education sector in terms of student numbers, Agriculture, Veterinary Science and Environment as a grouping does reasonably well, receiving $204 million.
AEGIS/UWS 35

The surprise is that ICCT receives so little – $113 million approximately – given the importance of the field to all industries. The relatively low place of ICC is matched by Commerce, Management and Tourism, also an important area of concern to many industries.
Figure 4.4: Total Expenditure by Higher Education Sector on Research and Development by Research Fields, Courses and Disciplines (RFCD) Australia 2000-01
0100
200300
400500
600700
Med
ical
& H
ealth
Sci
ence
s
Biol
ogic
al S
cien
ces
Oth
er R
esea
rch
Fiel
ds (1
)
Engi
neer
ing
& Te
chno
logy
Agric
ultu
ral,
Vete
rinar
y &
Envi
ronm
enta
l Sci
ence
s
Che
mic
al S
cien
ces
Info
rmat
ion,
Com
pute
rs &
Com
mun
icat
ion
Tech
nolo
gies
Phys
ical
Sci
ence
s
Com
mer
ce, M
anag
emen
t, To
uris
m&
Serv
ices Earth
Sci
ence
s
Stud
ies
in H
uman
Soc
iety
Beha
viou
ral &
Cog
nitiv
e Sc
ienc
es
Educ
atio
n
Econ
omic
s
Mat
hem
atic
al S
cien
ces
RFCD
Exp
endi
ture
($m
)
(1) Other Research Fields includes Architecture, Urban Environment and Building, Policy and Political Science, Law, Justice and Law Enforcement, Journalism, Librarianship and Curatorial Studies, The Arts, Language and Culture, History and Archaeology and Philosophy and Religion. Source: Australian Bureau of Statistics, 8111, 2002, p.8
Regrouping again, however, as in Figure 4.5 below, shows that the Sciences as a group receive most university R&D dollars, closely followed by Medical and Health Sciences, then the Humanities, Social Sciences and Other, and Engineering and Technology receive only approximately half the amount received by the last category. ICCT is last on this measure. Reducing the number of categories permits the reader to see the overall picture more clearly.
AEGIS/UWS 36

Figure 4.5: Total Expenditure by the Higher Education Sector on Research and Development by AEGIS grouping of RFCD, Australia, 2000-01. Regrouped categories.
0
100
200
300
400
500
600
700
800
Nat
ural
and
Phy
sica
lS
cien
ces
(1)
Med
ical
and
Hea
lthS
cien
ces
Hum
aniti
es,
Soc
ial S
cien
ces
and
Oth
er (2
)
Eng
inee
ring
and
Tech
nolo
gy
Agr
icul
tura
l,V
eter
inar
y an
dE
nviro
nmen
tal
Sci
ence
s
Eco
nom
ics
and
Com
mer
ce
Info
rmat
ion,
Com
pute
rs a
ndC
omm
unic
atio
nTe
chno
logi
es
Exp
endi
ture
($m
)
(1) Includes Biological Sciences, Chemical Sciences, Physical Sciences, Earth Sciences and Mathematical Sciences. (2) Includes the RFCD categories Education, Studies in Human Society, Behavioural and Cognitive Sciences and Other Research Fields. Other Research Fields includes Architecture, Urban Environment and Building, Policy and Political Science, Law, Justice and Law Enforcement, Journalism, Librarianship and Curatorial Studies, The Arts, Language and Culture, History and Archaeology and Philosophy and Religion. Source: Australian Bureau of Statistics, 8111, p.8
Looking by State shows some variety by RFCD, as is seen in Figure 4.6. In all States except Tasmania, Health leads the field by far and the differences between the States in the field are sharp, with NSW and Victoria spending in the year 2000 almost twice as much as Queensland.
As a whole in NSW, the research expenditure pattern shows Health first, then the Sciences, then the Humanities, Social Sciences and Other, closely followed by Economics and Commerce and then Engineering. ICCT R&D expenditure levels in NSW are about the same in dollar terms as they are in Victoria and not much above the levels of Queensland.
AEGIS/UWS 37

Figure 4.6: Expenditure on Research and Development by Universities by State in Australia and AEGIS grouping of RFCD 2000
0
20
40
60
80
100
120
140
160
180
200
220
New SouthWales
Victoria Queensland WesternAustralia
SouthAustralia
Tasmania
State
Exp
endi
ture
($m
)Natural and Physical SciencesInformation, Computer and Communication SciencesEngineering and TechnologyAgricultural, Veterinary and Environmental SciencesLaw, Justice and Law EnforcementMedical and Health SciencesHumanities, Social Sciences and Other (1)Economics and Commerce
(1) Includes the RFCD categories Education, Studies in Human Society, Behavioural and Cognitive Sciences and Other Research Fields (excluding Law, Justice and Law Enforcement). Other Research Fields includes Architecture, Urban Environment and Building, Policy and Political Science, Journalism, Librarianship and Curatorial Studies, The Arts, Language and Culture, History and Archaeology and Philosophy and Religion. These categories are used in Figures 4.9, 4.10 and 4.11 below. Source: Commonwealth Department of Education, Science and Training, 2000, Table 3
There are differences in research expenditure as between the universities in NSW. As shown in Figure 4.7, within NSW, the University of Sydney took the lead in expenditure on research, spending just over $255 million in year 2000. Sydney was followed by UNSW, which spent just over $203 million. Newcastle came next, a long way behind, spending $75 million, ahead of Wollongong, Macquarie and UTS, themselves ahead of UNE and UWS, which in turn spent approximately twice as much as did Charles Stuart, Southern Cross and the Australian Catholic University (ACU). The lowest spender expended about $9 million, less than one twentieth of the expenditure of Sydney. UWS, although almost as large in student numbers as the University of Sydney, spent only $30 million on research, rather more than one tenth of the University of Sydney. It should be noted that all figures in this section and collected by the ABS or use ABS categories so they include some estimates of staff time spent on research as well as the actual dollars allocated to internal grants and received as grants from external organisations.
AEGIS/UWS 38

Figure 4.7: Research Expenditure by Universities in NSW in 2000
0
50
100
150
200
250
300
The
Uni
vers
ity o
f Syd
ney
The
Uni
vers
ity o
f New
Sou
th W
ales
The
Uni
vers
ity o
fN
ewca
stle
Uni
vers
ity o
f Wol
long
ong
Mac
quar
ie U
nive
rsity
Uni
vers
ity o
f Tec
hnol
ogy,
Syd
ney
The
Uni
vers
ity o
f New
Eng
land
Uni
vers
ity o
f Wes
tern
Syd
ney
Cha
rles
Stu
rt U
nive
rsity
Sou
ther
n C
ross
Uni
vers
ity
Aus
tralia
n C
atho
licU
nive
rsity
Universities
Exp
endi
ture
($m
)
Source: ARC National Survey of Research Commercialisation, 2002, p.93
Between the discipline field (as shown in Figure 4.8), the type of research undertaken differs – basic research dominates in the Sciences and Medical Sciences and in the Humanities, Social Sciences and Other, while applied research dominates in ICCT, Engineering and Technology, Agriculture and related fields and in Economics and Commerce. Universities undertake virtually no experimental development. The patterns within universities are compared with those in industry in Chapter 5 below.
AEGIS/UWS 39

Figure 4.8: Expenditure by the Higher Education Sector on Research and Development by AEGIS grouping of RFCD and by the Type of Activity, Australia, 2000-01
0200400600800
1,0001,2001,4001,600
Nat
ural
and
Phy
sica
l Sci
ence
s
Info
rmat
ion,
Com
pute
rs a
ndC
omun
icat
ion
Tech
nolo
gies
Eng
inee
ring
and
Tech
nolo
gy
Agr
icul
tura
l, V
eter
inar
y an
dE
nviro
nmen
tal S
cien
ces
Med
ical
and
Hea
lth S
cien
ces
Hum
aniti
es, S
ocia
l Sci
ence
san
d O
ther
(1)
Eco
nom
ics
and
Com
mer
ce
Tota
l
Exp
endi
ture
($m
) Basic Research
Applied Research
Experimental Development
(1) Includes the RFCD categories Education, Studies in Human Society, Behavioural and Cognitive Sciences and Other Research Fields. Other Research Fields includes Architecture, Urban Environment and Building, Policy and Political Science, Law, Justice and Law Enforcement, Journalism, Librarianship and Curatorial Studies, The Arts, Language and Culture, History and Archaeology and Philosophy and Religion. These categories are used in Figures 4.12 and 4.13 below. Source: Australian Bureau of Statistics, 8111, 2002, p.10
Research expenditure by focus in university institutions in NSW Within NSW, different universities show particular patterns of research activity (see Figure 4.9). The University of Sydney spends a very large amount on Medical and Health research, with the Sciences about one third behind and the next biggest category, Economics and Commerce, two thirds behind. Spending on Engineering and Technology research is much lower, receiving only three quarters of the funds spent on Economics and Commerce and being close to Agriculture. At UNSW, the pattern is different; while Health expenditure is clearly in the lead, expenditure on pure sciences is much lower than at Sydney while, in contrast, the amount of dollars going to Engineering and Technology is much more important as this category receives a little more than the natural sciences. Economics and Commerce as a research area at UNSW is also important (Sydney and UNSW share a joint Graduate School of Business) but the Humanities, Social Sciences and Other category at UNSW receives only half the expenditure of Sydney in that field. ICCT is higher at UNSW than at Sydney but is low in both cases.
AEGIS/UWS 40

Figure 4.9: Expenditure on Research and Development by AEGIS grouping of RFCD and Institution in NSW 2000
0102030405060708090
Cha
rles
Stur
t Uni
vers
ity
Mac
quar
ie U
nive
rsity
Sout
hern
Cro
ss U
nive
rsity
The
Uni
vers
ity o
f New
Engl
and
The
Uni
vers
ity o
f New
Sout
h W
ales
The
Uni
vers
ity o
fN
ewca
stle
The
Uni
vers
ity o
f Syd
ney
Uni
vers
ity o
f Tec
hnol
ogy,
Sydn
ey
Uni
vers
ity o
f Wes
tern
Sydn
ey
Uni
vers
ity o
f Wol
long
ong
University
Exp
endi
ture
($m
)
Natural and Physical SciencesInformation, Computer and Communication SciencesEngineering and TechnologyAgricultural, Veterinary and Environmental SciencesLaw, Justice and Law EnforcementMedical and Health SciencesHumanities, Social Sciences and OtherEconomics and Commerce
Source: Commonwealth Department of Education, Science and Training, 2000, Table 3
Beyond these two major research institutions, the patterns are quite variable. Only two of the other universities have medical schools, although health-related research is visible at most of them. Agriculture is the key expenditure field at UNE and Charles Sturt, with some at UWS. Figures 4.10 and 4.11 exemplify the contrasting patterns at UNSW and UWS.
AEGIS/UWS 41

Figure 4.10: Research and Development Expenditure of the University of New South Wales by AEGIS groupings of RFCD in 2000
Agricultural, Veterinary and Environmental
Sciences0%
Law, Justice and Law
Enforcement1%
Information, Computer and
Communication Sciences
4%Economics and
Commerce7%
Humanities, Social Sciences
and Other12%
Natural and Physical Sciences
20%
Engineering and Technology
21%
Medical and Health Sciences
35%
Source: Commonwealth Department of Education, Science and Training, 2000, Table 3
Figure 4.11: Research and Development Expenditure of the University of Western Sydney by Broad Field of Research in 2000
Humanities, Social Sciences
and Other38%
Natural and Physical Sciences
14%
Agricultural, Veterinary and Environmental
Sciences13%
Engineering and Technology
13%
Medical and Health Sciences
13%
Economics and Commerce
5%
Information, Computer and
Communication Sciences
3%
Law, Justice and Law
Enforcement1%
Source: Commonwealth Department of Education, Science and Training, 2000, Table 3
AEGIS/UWS 42
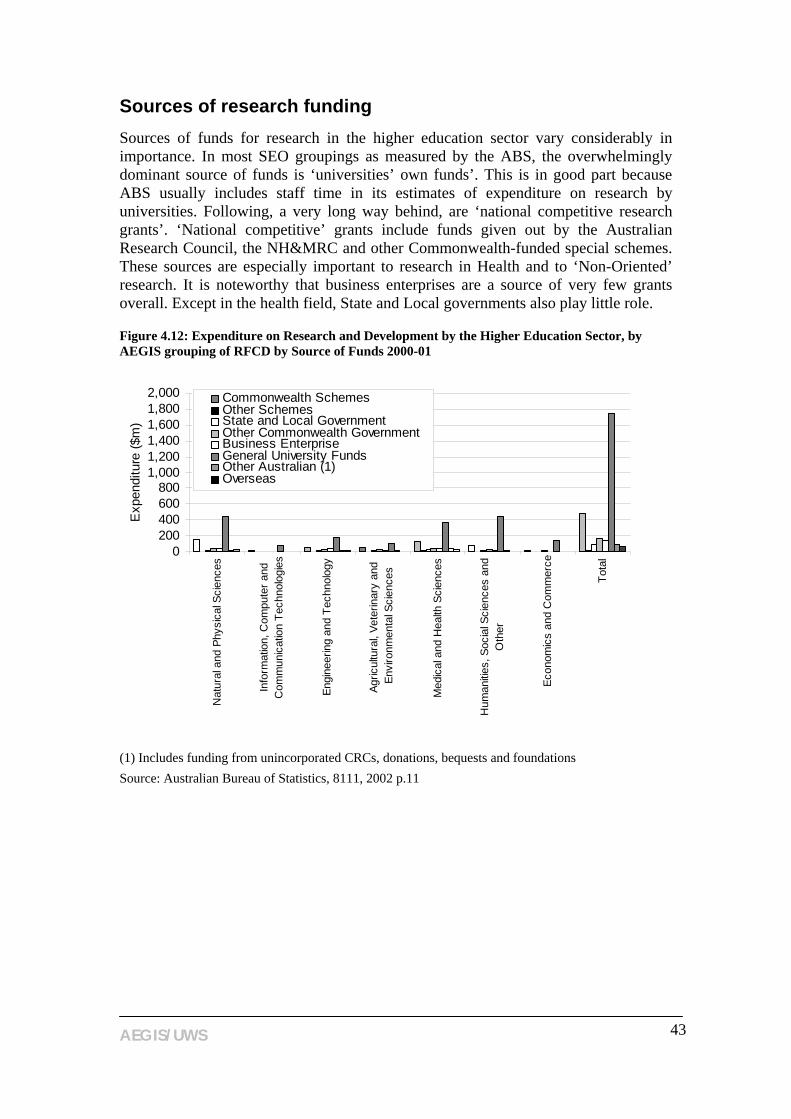
Sources of research funding Sources of funds for research in the higher education sector vary considerably in importance. In most SEO groupings as measured by the ABS, the overwhelmingly dominant source of funds is ‘universities’ own funds’. This is in good part because ABS usually includes staff time in its estimates of expenditure on research by universities. Following, a very long way behind, are ‘national competitive research grants’. ‘National competitive’ grants include funds given out by the Australian Research Council, the NH&MRC and other Commonwealth-funded special schemes. These sources are especially important to research in Health and to ‘Non-Oriented’ research. It is noteworthy that business enterprises are a source of very few grants overall. Except in the health field, State and Local governments also play little role.
Figure 4.12: Expenditure on Research and Development by the Higher Education Sector, by AEGIS grouping of RFCD by Source of Funds 2000-01
0200400600800
1,0001,2001,4001,6001,8002,000
Nat
ural
and
Phy
sica
l Sci
ence
s
Info
rmat
ion,
Com
pute
r and
Com
mun
icat
ion
Tech
nolo
gies
Engi
neer
ing
and
Tech
nolo
gy
Agric
ultu
ral,
Vete
rinar
y an
dEn
viro
nmen
tal S
cien
ces
Med
ical
and
Hea
lth S
cien
ces
Hum
anitie
s, S
ocia
l Sci
ence
s an
dO
ther
Econ
omic
s an
d C
omm
erce
Tota
l
Exp
endi
ture
($m
)
Commonwealth SchemesOther SchemesState and Local GovernmentOther Commonwealth GovernmentBusiness EnterpriseGeneral University FundsOther Australian (1)Overseas
(1) Includes funding from unincorporated CRCs, donations, bequests and foundations Source: Australian Bureau of Statistics, 8111, 2002 p.11
AEGIS/UWS 43

Figure 4.13: Expenditure on Research and Development by the Higher Education Sector, AEGIS grouping of RFCD by Source of Funds, Australia 2000-01, excluding General University Funds
0
100
200
300
400
500
600
Nat
ural
and
Phy
sica
l Sci
ence
s
Info
rmat
ion,
Com
pute
r and
Com
mun
icat
ion
Tech
nolo
gies
Engi
neer
ing
and
Tech
nolo
gy
Agric
ultu
ral,
Vete
rinar
y an
dEn
viro
nmen
tal S
cien
ces
Med
ical
and
Hea
lth S
cien
ces
Hum
anitie
s, S
ocia
l Sci
ence
s an
dO
ther
Econ
omic
s an
d C
omm
erce
Tota
l
Exp
endi
ture
($m
)
Commonwealth SchemesOther SchemesState and Local GovernmentOther Commonwealth GovernmentBusiness EnterpriseOther Australian (1)Overseas
(1) Includes funding from unincorporated CRCs, donations, bequests and foundations Source: Adapted from Australian Bureau of Statistics, 8111, 2002, p.11
AEGIS/UWS 44
Chapter 5 : Knowledge Transfer
Well-functioning knowledge hubs require input from both producers and users of knowledge. Interactions between what are generally called ‘users’ and producers of knowledge both create new knowledge, through implementation of technologies, prototyping, pilot plant trials and other forms of testing, and generate the critical mass needed for sustained innovation. The simple linear model of knowledge flows as between PSR organisations and companies has long ago been replaced by an interactive model (Kline and Rosenberg 1986).
Both specialised public sector researchers and companies generate new knowledge and refine and add to existing technological know-how. If public sector research is to be maximally effective researchers need to interact with user organizations, often not once but at many stages of their projects (Faulkner & Senker 1995). For this interaction to occur, there needs to be a body of enterprises within the field of technology covered by the researchers which is capable of ‘receiving’ such knowledge (‘receiving’ here means understanding, contributing expertise to or implementing new technology and taking information back to the researchers). Such companies thus need the relevant technology ‘complementary assets’ (Teece 1987).
The present chapter looks at the general population of enterprises in NSW that are the potential clients, co-funders and sponsors of or co-participants in the research undertaken in public sector research organisations (PSR) in the State and hence in the development of one or more knowledge hubs.
The Business Population of NSW The proportions of businesses in NSW in different industry groups are shown in Figure 5.1 below. Their distribution as between groups highlights a number of features relevant to the discussion in and conclusions of this report.
First, Figure 5.1 demonstrates the overwhelming importance of the services sector as a whole in the New South Wales economy in 1998, the latest date available. Moreover, it shows a further NSW specialisation in that the business and property segment of the services sector alone constitutes 16% of all NSW businesses. A further 24% of businesses operate in the wholesale and retail trade. In contrast, only 7% of businesses are in manufacturing. The picture is indicated perhaps more clearly still in Figure 5.2 where the smaller categories have been regrouped.
AEGIS/UWS
45

Figure 5.1: Number of Businesses in Industry Groups in NSW, 1998
05000
1000015000200002500030000350004000045000
Prop
erty
and
Bus
ines
s Se
rvic
es
Ret
ail T
rade
Con
stru
ctio
n
Hea
lth a
nd C
omm
unity
Ser
vice
s
Who
lesa
le T
rade
Man
ufac
turin
gSc
ient
ific R
esea
rch,
Tec
hnic
alan
d C
ompu
ter S
ervi
ces
Acco
mm
odat
ion,
Caf
es a
ndR
esta
uran
ts
Tran
spor
t and
Sto
rage
Pers
onal
and
Oth
er S
ervi
ces
Fina
nce
and
Insu
ranc
eC
ultu
ral a
nd R
ecre
atio
nal
Serv
ices Ed
ucat
ion
Agric
ultu
re, F
ores
try a
nd F
ishi
ng
Com
mun
icat
ion
Serv
ices
Min
ing
Elec
trici
ty, G
as a
nd W
ater
Sup
ply
Industry Group
Num
ber o
f bus
ines
ses
Source: ABS Business Register - Counts of Management Units by ANZSIC Group, selected Postcodes and States by employment size ranges as at Sept 1998. Most recent year available.
Figure 5.2: Proportion of businesses in Industry Groups in NSW as at September 1998
Construction14.05%
Cultural and Recreational Services and Personal and
Other Services7.33%
Wholesale and Retail Trade
23.94%
Manufacturing7.11%
Transport and Storage4.94%
Agriculture and Mining1.30%
Education1.27%Electricity, Gas
and Water Supply0.11%
Finance and Insurance and Property and
Business Services20.82%
Scientific Research,
Technical and Computer Services6.67%
Accommodation, Cafes and
Restaurants 5.07%
Health and Community
Services7.37%
Source: ABS Business Register - Counts of Management Units by ANZSIC Group, selected Postcodes and States by employment size ranges as at Sept 1998. Most recent year available.
AEGIS/UWS
46

Innovation propensities: Expenditure on R&D While the broad categories of ‘services’ or ‘manufacturing’ tell us little in themselves about the innovative capacity and knowledge-intensity of businesses, it is generally accepted in the international literature that, as a whole, manufacturing is more technology-intensive than are services and engages more in R&D. It is thus manufacturing that is most ‘innovative’ according to the usual definitions and manufacturing businesses are likely to be the more effective partners for science-based researchers. Some service areas, however, such as finance, are known to be innovative and some, such as logistics, information services and health, are both R&D- and high technology-intensive. Others, notably tourism, score low on most innovation tests.
It seems, therefore, from the figures in front of us that most NSW businesses are not very likely to be potential partners for public sector researchers. The next graph (Figure 5.3) indicates the extent of investment in R&D in Australian companies and confirms the generally accepted picture.
Figure 5.3: Number of Businesses Undertaking Research and Development (R&D) in Australia by ANZSIC Code 2000-2001
0
500
1000
1500
2000
2500
3000
3500
4000
Fina
nce
and
Insu
ranc
e
Min
ing
(incl
udin
gse
rvic
es to
Sci
entif
icR
esea
rch
Oth
er n
.e.c
.
Who
lesa
lean
d R
etai
lTr
ade
Pro
perty
and
Bus
ines
sS
ervi
ces
Man
ufac
turin
g
Tota
l
Industry by ANZSIC Code
Num
ber o
f bus
ines
ses
Source: Australian Bureau of Statistics 8104, 2002, p.8
Figures 5.3 and 5.4 confirm manufacturing Australia-wide as spending the most on R&D sector, with property and businesses services the next biggest spender, although investing only about half the amount of manufacturing, despite vastly larger proportions of businesses.
AEGIS/UWS
47

Figure 5.4: Expenditure on Research and Development by Industry ANZSIC Code 2000-01 in Australia
0
1000
2000
3000
4000
5000
6000
Sci
entif
ic R
esea
rch
Fina
nce
and
Insu
ranc
e
Who
lesa
le a
nd R
etai
l Tra
de
Min
ing
(incl
udin
g se
rvic
es to
Min
ing) O
ther
n.e
.c.
Pro
perty
and
Bus
ines
sS
ervi
ces
Man
ufac
turin
g
Tota
l
Industry by ANZSIC Code
Exp
endi
ture
on
R&
D (
$m)
Source: Australian Bureau of Statistics 8104, 2002, p.8
Figures 5.5 and 5.6 shows that manufacturing businesses in NSW in 2000-2001 constituted only 6.8% of all businesses but spent over $727 million a year on R&D, while their nearest competitors – property and businesses services – spent only around half as much, despite being a far bigger sector in terms of numbers of enterprises. Mining enterprises in NSW spent only $53 million or so and wholesale and retail trade $157 million in the same year.
AEGIS/UWS
48

Figure 5.5: Expenditure by Industry by Location 2000-01
0200400600800
1,0001,2001,4001,6001,800
Min
ing
(incl
udin
g se
rvic
es to
Min
ing)
Man
ufac
turin
g
Who
lesa
le a
nd R
etai
l Tra
de
Fina
nce
and
Insu
ranc
e
Pro
perty
and
Bus
ines
sS
ervi
ces
Sci
entif
ic R
esea
rch
Oth
er n
.e.c
.
Tota
l
ANZSIC Code
Exp
endi
ture
($m
) NSWVicQldSAWA
Source: Australian Bureau of Statistics 8104, 2002, p.12
Figure 5.6: Expenditure by Location by Industry 2000-01
0
100
200
300
400
500
600
700
800
900
1,000
NSW Vic Qld SA WA
State
Exp
endi
ture
($m
)
Mining (including services to Mining)ManufacturingWholesale and Retail TradeFinance and InsuranceProperty and Business ServicesScientific ResearchOther n.e.c.
Source: Australian Bureau of Statistics 8104, 2002, p12
In comparison with Victoria, NSW business as a whole spent proportionately less on R&D. Taking all sectors together, Victoria and NSW spent almost the same amounts.
AEGIS/UWS
49

In contrast, property and business services in NSW spent almost exactly twice as much as did their counterpart in Victoria but the two sectors were also bigger in NSW.
Sources of R&D Funding R&D is expensive to conduct. It is therefore important to understand how it is funded in different fields of business and by different kinds of enterprise. By far the largest source of funds for R&D in Australia is companies’ own resources (Figure 5.7). This is especially evident in manufacturing. Excluding own funds, overseas funding played a role in Australia as a whole, injecting around $207m into R&D. This was concentrated in three fields – property and business services ($72 million), manufacturing ($62 million) and wholesale and retail trade ($51 million). In relation to the number of businesses, however, overseas funding was especially important for scientific research companies ($20m), where it followed the Commonwealth ($46 million) as a source of funds. Interestingly, other businesses played a significant funding role both in this sector ($19m) and in property and business services ($41 m). The picture is made even clearer in Figure 5.8, which shows funding sources excluding own funds.
Figure 5.7: Expenditure by Industry by Source of Funds 2000-01 in Australia
0
500
1,000
1,500
2,000
2,500
Min
ing
(incl
udin
gse
rvic
es to
Min
ing)
Man
ufac
turin
g
Who
lesa
lean
d R
etai
lTr
ade
Fina
nce
and
Insu
ranc
e
Pro
perty
and
Bus
ines
sS
ervi
ces
Sci
entif
icR
esea
rch
Oth
er n
.e.c
.
ANZSIC Code
Exp
endi
ture
($m
) Own FundsOther BusinessesCommonwealth GovernmentState and Local GovernmentOther Australian (1)Overseas
(1) Includes unincorporated CRCs, donations, bequests and foundations. Source: Australian Bureau of Statistics, 8104, 2002, p.11
AEGIS/UWS
50

Figure 5.8: Expenditure by Industry, by Source of Funds 2000-01 in Australia excluding Own Funds
0
30
60
90
120
150
180
210
Min
ing
(incl
udin
gse
rvic
es to
Man
ufac
turin
g
Who
lesa
lean
d R
etai
lTr
ade
Fina
nce
and
Insu
ranc
e
Pro
perty
and
Bus
ines
sS
ervi
ces
Sci
entif
icR
esea
rch
Oth
er n
.e.c
.
Tota
l
ANZSIC Code
Exp
endi
ture
($m
) Other BusinessesCommonwealth GovernmentState and Local GovernmentOther Australian (1)Overseas
(1) Includes unincorporated CRCs, donations, bequests and foundations Source: Australian Bureau of Statistics, 8104, 2002, p.11
R&D Funding and Business Size Business expenditure on formal R&D varies by size of enterprise as measured by number of employees (see Figures 5.9 and 5.10). NSW businesses, like most Australian businesses, are in great majority small. R&D expenditure Australia-wide is concentrated in large businesses, those employing more than 1000 people. These enterprises spent almost $1.385 billion over the period 2000-2001 despite the small number of such enterprises, whereas expenditure by businesses employing 500-999 people was $523 million, around a third of that of their larger counterparts. The group employing 100-199 spent almost exactly the same amount as did the 500-999 group, however, so that together the medium-sized enterprises spent around $1.428 billion. The numbers of enterprises concerned, however, is much larger that the large firms.
AEGIS/UWS
51

Figure 5.9: Expenditure by Industry on Research and Development by Business Employment Size 2000-2001 in Australia
0
200
400
600
800
1,000
1,200
1,400
Min
ing
(incl
udin
gse
rvic
es to
Man
ufac
turin
g
Who
lesa
lean
d R
etai
lTr
ade
Fina
nce
and
Insu
ranc
e
Pro
perty
and
Bus
ines
sS
ervi
ces
Sci
entif
icR
esea
rch
Oth
er n
.e.c
.
Tota
l
ANZSIC Code
Exp
endi
ture
($m
)
Less than 1010-1920-4950-99100-199200-499500-9991000 or more
Source: Australian Bureau of Statistics, 8104, 2002, p.17
Figure 5.10: Expenditure by Industry on Research and Development, by Business Employment Size 2000-2001 in NSW
050
100150200250300350400450500550600650700
Min
ing
(incl
udin
gse
rvic
es to
Min
ing)
Man
ufac
turin
g
Who
lesa
lean
d R
etai
lTr
ade
Fina
nce
and
Insu
ranc
e
Pro
perty
and
Bus
ines
sS
ervi
ces
Oth
erIn
dust
ries
Tota
l
ANZSIC Code
Exp
endi
ture
($m
)
0 to 19
20 to 99
100 to 499
500 or more
Source: Commissioned data on the location of R&D expenditure by management unit employment size. ABS (2002) 8104 Research and experimental development: Businesses Australia 2000-2001 Canberra ABS
AEGIS/UWS
52
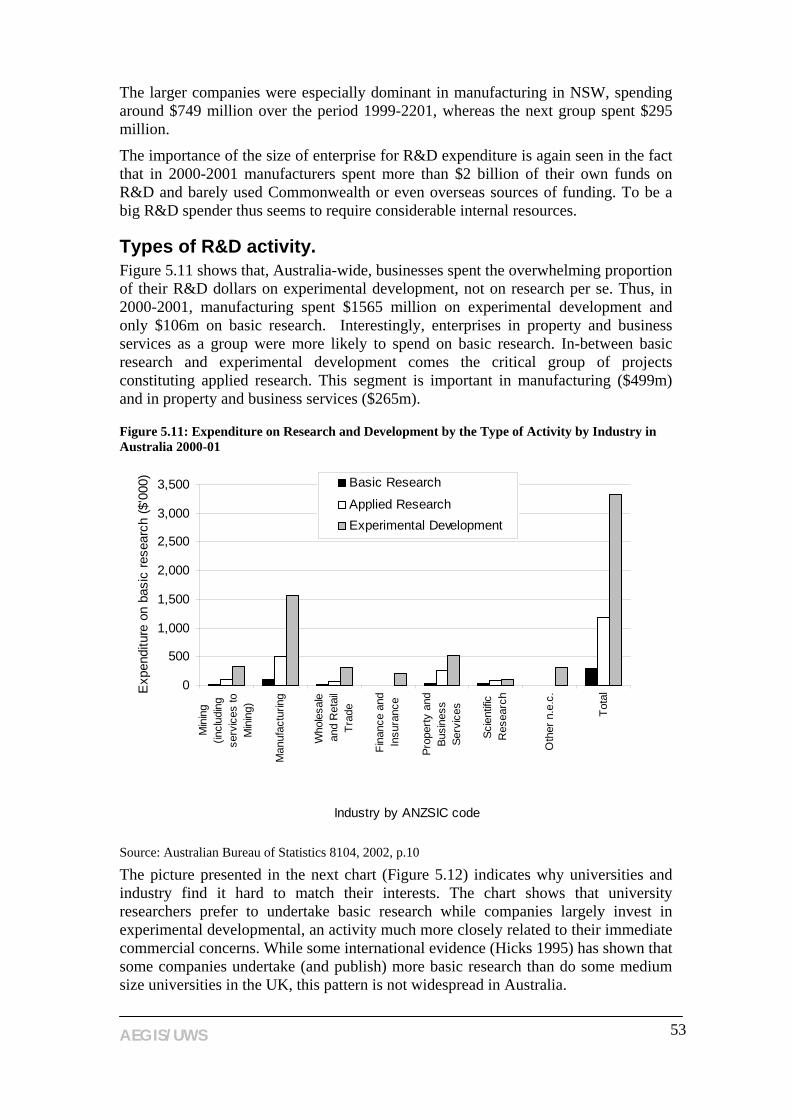
The larger companies were especially dominant in manufacturing in NSW, spending around $749 million over the period 1999-2201, whereas the next group spent $295 million.
The importance of the size of enterprise for R&D expenditure is again seen in the fact that in 2000-2001 manufacturers spent more than $2 billion of their own funds on R&D and barely used Commonwealth or even overseas sources of funding. To be a big R&D spender thus seems to require considerable internal resources.
Types of R&D activity. Figure 5.11 shows that, Australia-wide, businesses spent the overwhelming proportion of their R&D dollars on experimental development, not on research per se. Thus, in 2000-2001, manufacturing spent $1565 million on experimental development and only $106m on basic research. Interestingly, enterprises in property and business services as a group were more likely to spend on basic research. In-between basic research and experimental development comes the critical group of projects constituting applied research. This segment is important in manufacturing ($499m) and in property and business services ($265m).
Figure 5.11: Expenditure on Research and Development by the Type of Activity by Industry in Australia 2000-01
0
500
1,000
1,500
2,000
2,500
3,000
3,500
Min
ing
(incl
udin
gse
rvic
es to
Min
ing)
Man
ufac
turin
g
Who
lesa
lean
d R
etai
lTr
ade
Fina
nce
and
Insu
ranc
e
Prop
erty
and
Busi
ness
Serv
ices
Scie
ntific
Res
earc
h
Oth
er n
.e.c
.
Tota
l
Industry by ANZSIC code
Exp
endi
ture
on
basi
c re
sear
ch ($
'000
) Basic Research
Applied ResearchExperimental Development
Source: Australian Bureau of Statistics 8104, 2002, p.10
The picture presented in the next chart (Figure 5.12) indicates why universities and industry find it hard to match their interests. The chart shows that university researchers prefer to undertake basic research while companies largely invest in experimental developmental, an activity much more closely related to their immediate commercial concerns. While some international evidence (Hicks 1995) has shown that some companies undertake (and publish) more basic research than do some medium size universities in the UK, this pattern is not widespread in Australia.
AEGIS/UWS
53

Figure 5.12: Expenditure by Higher Education Sector and Industry on Research and Development by Type of Activity, 2000-01
0
500
1,000
1,500
2,000
2,500
3,000
3,500
Universities Industry
Sector
Exp
endi
ture
($m
)
Basic Research
Applied Research
Experimental Development
Source: Australian Bureau of Statistics, 8111, 2002, p.10; Australian Bureau of Statistics, 8104, 2002, p.10
The same chart also shows that the critical segment of research activity where universities and industries can perhaps best meet is the field of applied research which is almost equally important to both sets of players. While in theory companies could use the basic research undertaken in universities as the underlying ingredient needed for new products, in reality only some pharmaceutical and biotechnology firms and their products are sufficiently close to basic research to do so.
Overall, industry spends more on R&D than does the Higher Education (HE) sector. This is especially clear in New South Wales and Victoria (see Figure 5.13). Interestingly, in Queensland and South Australia, although the pattern remains the same, the differences in expenditure between the two sectors are less pronounced. We have already seen the differences between the two sectors in terms of the types of R&D undertaken.
AEGIS/UWS
54

Figure 5.13: Expenditure on Research and Development by the Higher Education Sector and Industry by location 2000-01
0
200
400
600
800
1000
1200
1400
1600
1800
Universities Industry
Sector
Exp
endi
ture
($m
)
NSW
Vic
Qld
SA
WA
Source: Australian Bureau of Statistics, 8111, 2002, p.13; Australian Bureau of Statistics, 8104, 2002, p.12
AEGIS/UWS
55

Figure 5.14: Expenditure by Higher Education Sector on Research and Development by AEGIS grouping of RFCD and by the Type of Activity, Australia, 2000-01
0200400600800
1,0001,2001,4001,600
Nat
ural
and
Phy
sica
l Sci
ence
s
Info
rmat
ion,
Com
pute
rs a
ndC
omm
unic
atio
n Te
chno
logi
es
Engi
neer
ing
and
Tech
nolo
gy
Agric
ultu
ral,
Vete
rinar
y an
dEn
viro
nmen
tal S
cien
ces
Hea
lth a
nd M
edic
al S
cien
ces
Hum
anitie
s, S
ocia
l Sci
ence
s an
dO
ther
(1)
Econ
omic
s an
d C
omm
erce
Tota
l
Exp
endi
ture
($m
) Basic ResearchApplied ResearchExperimental Development
(1) Includes the RFCD categories Education, Studies in Human Society, Behavioural and Cognitive Sciences and Other Research Fields. Other Research Fields includes Architecture, Urban Environment and Building, Policy and Political Science, Law, Justice and Law Enforcement, Journalism, Librarianship and Curatorial Studies, The Arts, Language and Culture, History and Archaeology and Philosophy and Religion Source: Australian Bureau of Statistics, 8111, 2002, p.10
Figure 5.14 shows differences in the Research Fields, Courses and Disciplines (RFCD) in which R&D expenditure is made. Thus, in the sciences, medical and health sciences, the humanities and ‘studies in human society’ the greater emphasis is on basic research, although applied research is also common in the medical and health fields. As could be expected, in ICCT, Engineering and technology and the economic-related social sciences, the pattern is reversed, with applied research dominant (remembering that the sums involved are small).
Figure 5.15 shows the pattern in the higher education sector for Australia as a whole in 2000-2001 when measured by SEO. This measurement highlights the same pattern as above in the categories of health, ‘total society’ and ‘non-oriented’ research and to some extent in the manufacturing and environment categories, although again the sums are small.
AEGIS/UWS
56

Figure 5.15: Expenditure by Higher Education Sector on Research and Development by Socio-Economic Objective by the Type of Activity, Australia 2000-01
0
100
200
300
400
500
600
Def
ense
Agr
icul
ture
Min
eral
Res
ourc
es(e
xclu
ding
Ene
rgy)
Ene
rgy
Res
ourc
es a
ndS
uppl
y
Man
ufac
turin
g
Oth
er E
cono
mic
Dev
elop
men
t
Hea
lth
Tota
l Soc
iety
Tota
l Env
ironm
ent
Non
-orie
nted
Res
earc
h
SEO
Exp
endi
ture
($m
) Basic Research
Applied Research
Experimental Development
Source: Australian Bureau of Statistics, 8111, 2002, p.8
Figure 5.16: Expenditure by Higher Education Sector on Research and Development in NSW by AEGIS grouping of RFCD and by the Type of Activity, 2000-01
0
20
40
60
80
100
120
140
Agric
ultu
ral,
Vete
rinar
y an
dEn
viro
nmen
tal S
cien
ces
Econ
omic
s an
d C
omm
erce
Engi
neer
ing
and
Tech
nolo
gy
Hum
anitie
s, S
ocia
l Sci
ence
s an
dO
ther
(1)
Info
rmat
ion,
Com
pute
r and
Com
mun
icat
ion
Scie
nces
Law
, Jus
tice
and
Law
Enfo
rcem
ent
Med
ical
and
Hea
lth S
cien
ces
Nat
ural
and
Phy
sica
l Sci
ence
s
Exp
endi
ture
($m
)
Basic ResearchApplied researchExperimental development
(1) Categories as Figure 5.13 Source: Commissioned data on the location of R&D expenditure by management unit employment size. ABS (2002) 8104 Research and experimental development: Businesses Australia 2000-2001 Canberra ABS
Figure 5.16 indicates the pattern for RFCD for NSW in 2000-2001. In all, the Higher
AEGIS/UWS
57

AEGIS/UWS
58
Education sector in NSW spent around $810m on R&D (including staff time). Of this, around $462m was spent on basic research, well ahead of the approximately $269m spent on applied research and the very small ($80m) spent on experimental development.
The NSW RFCD distributional pattern differs somewhat from the national picture, with basic research in economics-commerce and ICT fields being slightly ahead of applied and basic and applied being virtually identical in Engineering and Technology.
The RFCD basic-applied-experimental patterns may indicate the areas in which business has most chance of its interests coinciding with those of Higher Education researchers. In some industries, however, notably in health, anecdotal evidence suggests that firms look to higher education for scientific breakthrough work.
Using public sector research and expertise. There are many ways in which the research generated in the public sector can be used in the private sector. Both CSIRO and the universities have been increasing their efforts to commercialise their intellectual property through spin-out companies and by executing licence, option and assignment agreements in particular. The CSIRO and the ARC jointly recently commissioned a study to map the activities of public sector research organisations in these fields in the year 2000 (ARC/CSIRO 2001). Suffice it here to point to a few especially salient elements of the study.
There is considerable debate in public circles about the commercialisation of intellectual property as a major mechanism for the renewal and upgrading of Australia’s industrial structure and the shift in the economy towards the use of higher technologies. The evidence presented in the present report suggests that the relationship is positive but, taken in the context of the broader population of businesses, sounds a note of warning. This warning is that the number of new spin-out businesses from PSR organizations remains very small indeed while patent uptake and the exercising of licences, options and assignments is low when seen in the broader context.
Licences, Options and Assignments and Patents Most Australian universities now seek to patent breakthrough knowledge wherever this is appropriate, as does the CSIRO (and probably most medical institutes). Thus, in 2000, Australia-wide, universities were issued 219 patents across the world including, 96 Australian patents and 67 US patents (see Figure 5.17). CSIRO were issued with 257 patents, with relatively few being for Australia (40) and for the US (41). Medical institutes in Australia together took out 22 world patents, seven each for Australia and the US.
Of the Australian HE total patents, NSW universities took out 56, with 24 Australian and 21 US ones. Medical institutes in NSW took out 5 patents, including one for Australia. Data by State were not available for the CSIRO for this study.

Figure 5.17: Number of Patents Issued to Institutions in Australia in 2000
0
50
100
150
200
250
300
Total NSWUniversities
Total AustraliaUniversities
Total NSWMedical
Institutes
Total AustraliaMedical
Institutes
CSIROAustralia
Institution Type
Num
ber o
f Pat
ents
Number of Patents issued worldwide
Number of Australian Patents issued
Number of US patents issued
Source: ARC National Survey of Research Commercialisation, 2002, p.103. The number of patents issued worldwide includes both Australian and US patents.
Figure 5.18 shows patenting activity by universities and confirms the dominance in NSW of the University of Sydney and UNSW (respectively 23 and 20 patents, with Sydney focusing more on the US and UNSW on Australia. These universities were followed a long way behind by UTS and UWS (each with five patents).
AEGIS/UWS
59

Figure 5.18: Number of Patents issued to Universities in NSW in 2000
0
5
10
15
20
25
The
Uni
vers
ity o
f Syd
ney
The
Uni
vers
ity o
f New
Sou
th W
ales
Uni
vers
ity o
f Tec
hnol
ogy,
Syd
ney
Uni
vers
ity o
f Wes
tern
Syd
ney
Uni
vers
ity o
f Wol
long
ong
The
Uni
vers
ity o
fN
ewca
stle
Aus
tralia
n C
atho
licU
nive
rsity
Cha
rles
Stu
rt U
nive
rsity
Mac
quar
ie U
nive
rsity
The
Uni
vers
ity o
f New
Eng
land
Sou
ther
n C
ross
Uni
vers
ity
University
Num
ber o
f pat
ents Number of Patents issued worldwide
Number of Australian Patents issued
Number of US patents issued
Source: ARC National Survey of Research Commercialisation, 2002, p.103
Figure 5.19 shows that in the year 2000 in Australia, universities executed two-hundred and thirty-four Licences, Options and Assignments (LOAs) while a further 168 were executed by CSIRO and 15 by medical institutes.
Figure 5.19: Total Licences, Options and Assignments Executed in Australia
0
50
100
150
200
250
Total NSWUniversities
TotalAustralia
Universities
Total NSWMedical
Institutes
TotalAustraliaMedical
Institutes
CSIROAustralia
Institution type
Num
ber o
f LO
As
Source: ARC National Survey of Research Commercialisation, 2000, p.94
AEGIS/UWS
60

In the same year in NSW, seventy-eight LOAs were executed by universities and four by medical institutes (the CSIRO also executed LOAs but the information is not available by State). Of the university LOAs, close to half (31) were executed by one university alone, the University of Sydney (Figure 5.20). Sydney was followed by UNSW with twelve (15%), the University of New England with eleven and UTS with nine. These four universities thus account for sixty-three of the seventy-eight LOAs executed (80%).
Figure 5.20: Number of Licences, Options and Assignments (LOAs) Executed by Universities in NSW in 2000
05
1015
20253035
The
Uni
vers
ity o
f Syd
ney
The
Uni
vers
ity o
f New
Sou
th W
ales
The
Uni
vers
ity o
f New
Eng
land
Uni
vers
ity o
f Tec
hnol
ogy,
Syd
ney
Sou
ther
n C
ross
Uni
vers
ity
Mac
quar
ie U
nive
rsity
The
Uni
vers
ity o
fN
ewca
stle
Uni
vers
ity o
f Wes
tern
Syd
ney
Uni
vers
ity o
f Wol
long
ong
Aus
tralia
n C
atho
licU
nive
rsity
Cha
rles
Stu
rt U
nive
rsity
Universities
Num
ber o
f LO
As
Source: ARC National Survey of Research Commercialisation, 2002, p.94
AEGIS/UWS
61

Figure 5.21: Proportion of total Licences, Options and Assignments (LOAs) executed by Universities in NSW
The University Sydney
39%
The University of New South
Wales15%
The University of New England
14%
University of Technology,
Sydney12%
Southern Cross University
5%
The University of Newcastle
4%Macquarie University
4%
University of Western Sydney
4%University of Wollongong
3%
Source: ARC National Survey of Research Commercialisation, 2000 p.94
LOA rates in 2000 were higher in most universities than were patenting rates taken alone. The exceptions were at UNSW and UWS while rates at Wollongong were the same for each. The University of Queensland was considerably more active in executing LOAs than were any universities in NSW, executing 63 in 2000. This is twice the number of the University of Sydney. Griffith University was also active in the same way, executing 19 LOAs in 2000 (ARC 2002: 94). Thus, these two Queensland universities alone were more active than all their sister institutions in NSW.
Figure 5.22 shows which disciplines in Australia and NSW were the most likely to be the basis for LOA. The ARC/CSIRO study showed that, nationwide, in universities and medical institutes the Biological Sciences are overwhelmingly the most frequent basis for LOAs. These are followed at a distance by Engineering and Environmental Sciences and the Health and Clinical Sciences. Well below these come the Physical, Chemical and Earth Sciences, not much above the Mathematical and ICCT disciplines.
AEGIS/UWS
62

Figure 5.22: LOAs by Discipline Group for Institutions in Australia in 2000
0123456789
10111213141516
Total NSWUniversities
Total AustraliaUniversities
Total NSWMedical
Institutes
Total AustrailaMedical
Institutes
CSIROAustralia
Institution
Num
ber o
f LO
As
Biological Sciences and BiotechnologyPhysical, Chemical and Earth SciencesMathematics, Information and Communication SciencesSocial, Behavioural and EconomicHumanities and Creative ArtsEngineering and Environmental SciencesHealth and Clinical SciencesOther
N/A
Note that the categories used here are the questionnaire categories used in the ARC National Survey of Research Commercialisation. Source: ARC National Survey of Research Commercialisation, 2002, p.108
Figure 5.22 also shows that the pattern in NSW universities also demonstrates a lesser emphasis on the biological sciences and an almost even spread between these and the physical and mathematical categories. The reader should, however, bear in mind that the numbers involved are tiny.
The clients for PSR research The business clients for university research (as seen in LOAs), both Australia-wide and in NSW, varied in size. Australia-wide, large firms were the single biggest client category for universities as they were for the CSIRO (of CSIRO clients, 71 were large firms and only 14 small) (see Figures 5.23 and 5.24). This is presumably because in general the large firms are the most research-intensive and thus the most probable receptors of knowledge.
In NSW the pattern was slightly different, however. In NSW nine client firms were start-ups generated by the research organisations concerned in the IP generation while the biggest single group (33) of clients was classified by the ARC/CSIRO study as small companies and the next biggest group (27) was composed of large firms. Most of the small companies were clients of the University of Sydney, with SMEs a good way behind and start-ups well behind these. This particular concentration at the University of Sydney may represent specialisation in particular technologies.
AEGIS/UWS
63

Figure 5.23: Licences, Options and Assignments Executed in NSW and Australia to Start-ups, and Small, Medium and Large Companies in 2000 (1)
0
20
40
60
80
100
120
TotalUniversities
Australia
TotalUniversities
NSW
Total MedicalInstitutesAustralia
Total MedicalInstitutes
NSW
CSIROAustralia
Institution type
Num
ber o
f LO
As
LOAs executed: Start-UpsLOAs executed: Small companiesLOAs executed: Medium companiesLOAs executed: Large companies
(1) Note that the year 2000 in this and the following figure represents the institution’s reporting period and may be either the institution’s fiscal or calendar year. Source: ARC National Survey of Research Commercialisation, 2002, p.95
Figure 5.24: Licences, Options and Assignments Executed by Universities in NSW to Start-ups, and Small, Medium and Large Companies in 2000
02468
101214161820
The
Uni
vers
ity o
f Syd
ney
The
Uni
vers
ity o
f New
Sou
thW
ales
The
Uni
vers
ity o
f New
Eng
land
Uni
vers
ity o
f Tec
hnol
ogy,
Syd
ney
Sou
ther
n C
ross
Uni
vers
ity
Mac
quar
ie U
nive
rsity
The
Uni
vers
ity o
f New
cast
le
Uni
vers
ity o
f Wes
tern
Syd
ney
Uni
vers
ity o
f Wol
long
ong
Aus
tralia
n C
atho
licU
nive
rsity
Cha
rles
Stu
rt U
nive
rsity
Universities
Num
ber o
f LO
As
LOAs executed: Start-UpsLOAs executed: Small companiesLOAs executed: Medium companiesLOAs executed: Large companies
Source: ARC National Survey of Research Commercialisation, 2002, p.95.
AEGIS/UWS
64

AEGIS/UWS
65
University commercial arms University commercial arms undertake knowledge transfer activities through staff consultancies and training provisions as well as LOAs. In the present study it proved difficult to collect data on these activities for reasons of commercial confidentiality. Unisearch, the commercial arm of the University of New South Wales, in its 1999 Annual Report indicated, however, that the organisation dealt with more than 500 clients on 1600 matters in that year. These projects involved 233 consultants, most of whom were UNSW staff, with a further 7% retired UNSW staff. UNSW has been making a special effort to develop Expert Opinion Services as an arm of Unisearch and it trains staff as expert witnesses.
University-industry research partnerships There have been several attempts by governments to bring universities and the CSIRO and business clients closer together over the last 10-15 years. The CSIRO was given an external income target of 30% in the late 1980s, a target only questioned in the last two to three years. The Australian Research Council introduced its Collaborative Grants Scheme in the early 1990s, a scheme followed by the SPIRT grants scheme in the later 1990s and by the Linkage grant scheme in 2001. The idea was to link university researchers, including graduate research students, to industry partners to work on common projects. Analysis of the partnerships in 1999-2000 grants, however, shows that in New South Wales the so-called ‘industry’ partners were in high proportion located in the public sector (government departments, schools and hospitals principally) or the quasi-public sector, such as private schools or nursing homes although there may have been some changes since. In most universities, public or quasi public sector partners were the majority, UNSW being the most notable exception. The private sector as such was best represented, as might be expected, in the health-related fields, such as pharmaceuticals, and energy. Only a very tiny proportion of potential partners from the private sector was in fact represented.
Cooperative Research Centres The Cooperative Research Centre (CRC) scheme, started in the early 1990s, is another important policy mechanism for linking public sector researchers (both CSIRO and universities) and industry more closely together in knowledge generation activities.
NSW is the headquarters for thirteen CRCs, a number rising to fifteen once the two awarded in late 2002 are established. These are headquartered predominantly at the Universities of Sydney and NSW. The two new ones are in agricultural products, making the agricultural total seven out of the fifteen. CRCs in NSW thus seem disproportionately concentrated in agricultural fields, given the proportion of NSW state product from that sector. A further CRC is ‘rural’ in orientation, being for the conservation and management of marsupials. Of the fifteen, one is related to manufacturing (welded structures), one to the environment, two to medical/health areas and two to advanced technologies (IT-related).
AEGIS/UWS
66
Technology Parks New South Wales hosts six technology parks, all but one in Sydney, the exception being ‘Cellulose Valley’ located at Lismore and attached to Southern Cross University. None of the parks hosts many companies by international standards. The Australian Technology Park (ATP), co-owned by three Sydney universities and the Australian National University, hosts the most, with 30 companies and 70 on its Biznet site. Some of the thirty are spin-outs from the universities or CRCs, including the Bandwidth Foundry for example. The Macquarie Technology Park is relatively new and hosts twelve firms, including branches of some of the same ones that are located in the ATP. A small park is attached to the CSIRO site at North Ryde and a private company provides incubator facilities in the Macquarie Park. ANSTO has its own business and technology park. Attempts to create a technology park in the west of Sydney at Penrith seem to have foundered. A new ‘biotech’ park seems to be emerging around Westmead Hospital and the nearby UWS Westmead Campus.
Spotlight on Greater Western Sydney This section indicates some basic data on the situation of Greater Western Sydney (GWS) as the area of most interest to the Office of Western Sydney. Further data can be added later.
Greater Western Sydney, defined by postcodes (see Appendix 2), covers a large area of Sydney and hosts a large proportion of Sydney’s population. The population is extremely mixed in terms of ethnic origin, levels of English, educational and skill levels and employment rates and levels. School retention rates are some of the poorest in the State in some areas but the region also hosts several very successful high schools.
GWS is an area of small businesses. Of the 63,000 or so businesses in the region registered in 1998 (the latest year available), the great majority employ fewer than ten people. Figure 5.25 and Figure 5.26 show the distribution of the businesses by field of activity. The great majority of businesses are in service sectors of different kinds, with only 10.24% in manufacturing, a little above the State average. The technological levels of the majority of businesses are low, in common with much of NSW enterprise, although work by the Office of Western Sydney suggests that there are increasing numbers of innovative businesses in many fields, from biomedical to animation to advanced manufacturing and optics. The particular business or industrial structure indicated in the following graphs means that overall in GWS there are very few receptors for research findings and the small size of businesses means that there is little room for interaction with external research partners in the region.

Figure 5.25: Number of Businesses in Industry Groups in Greater Western Sydney as at September 1998
0
3000
6000
9000
12000
15000
Con
stru
ctio
n
Ret
ail T
rade
Prop
erty
and
Bus
ines
s Se
rvic
es
Man
ufac
turin
g
Who
lesa
le T
rade
Hea
lth a
nd C
omm
unity
Ser
vice
sSc
ient
ific R
esea
rch,
Tec
hnic
alan
d C
ompu
ter S
ervi
ces
Tran
spor
t and
Sto
rage
Pers
onal
and
Oth
er S
ervi
ces
Acco
mm
odat
ion,
Caf
es a
ndR
esta
uran
ts
Fina
nce
and
Insu
ranc
e
Cul
tura
l and
Rec
reat
iona
l Ser
vice
s
Educ
atio
n
Com
mun
icat
ion
Serv
ices
Agric
ultu
re, F
ores
try a
nd F
ishi
ng
Min
ing
Elec
trici
ty, G
as a
nd W
ater
Sup
ply
Industry Group
Num
ber o
f bus
ines
ses
Source: ABS Business Register – Counts of management units by ANZSIC group, selected postcodes and States by employment size ranges as at September 1998 (most recent data available as at December 2002)
Figure 5.26: Proportion of Businesses in Principal Industry Groups in Greater Western Sydney as at September 1998
Wholesale and Retail Trade
24.78%
Finance and Insurance and Property and
Business Services16.95%
Manufacturing10.24%
Cultural and Recreational Services and Personal and
Other Services6.02%
Transport and Storage5.68%
Accommodation, Cafes and Restaurants
2.77%Education1.06%
Health and Community
Services7.08%
Scientific Research,
Technical and Computer Services6.30%
Construction19.13%
Source: ABS Business Register – Counts of management units by ANZSIC group, selected postcodes and States by employment size ranges as at September 1998 (most recent data available as at December 2002)
AEGIS/UWS
67
AEGIS/UWS
68
The GWS area suffers from sparse local knowledge generation, transmission and transfer resources. The University of Western Sydney’s many campuses constitute the tertiary education and research locations closest to most areas of the population. The University is very large at undergraduate level and trains very large numbers of local students (as well as some from outside the GWS region) at that level. UWS is a broad multidisciplinary university, offering courses in all major areas and professions except medicine and veterinary science and architecture. It has a very large College of Law and Business which trains in all areas of those fields and UWS is also strong in the humanities and social sciences in terms of teaching. The latter (Social Sciences) field includes teacher education, a UWS speciality.
In comparison with some other NSW universities, UWS is not, however, a research-intensive institution, with a relatively very small number of students preparing postgraduate research degrees, expected at doctoral level. The number of postgraduate research students is now also declining significantly following shifts in federal government research student funding policies. The current major research strengths of UWS lie in the agricultural sciences, auditory cognition and psychology, and some areas of the social sciences such as industry analysis and innovation and urban development and regeneration. The university undertakes relatively little technology transfer by the standards of UNSW or the University of Sydney and holds very few patents. Technology transfer, particularly in agricultural research, and on-farm impact is not negligible however, while the Centre for Construction Technology Research has begun to have impact within the construction industry on product development.
UWS as a university is increasingly committed to engagement with its region, however, and has created an Office of Regional Development to encourage university-region interaction. That Office has recently funded some small, largely action-oriented, projects to this effect.
It is hard to judge from data currently available the extent to which research undertaken at UWS relates to the GWS region. Analysis of SPIRT grant partners for 2000 and 2001 suggests that some are local but most are not, being mainly State government or other public bodies, although some are the ‘local’ arms of these departments, such as local schools. The UWS Vacation Programs which link undergraduates with local industry are linked more much closely with the local community, the vast majority of companies hosting students being in the GWS region.
UWS thus has a major knowledge transmission role in the region but presently a much less significant knowledge generation and transfer capacity, although this potential strength may develop further over time.
The GWS region also hosts several TAFE institute locations, notably the north west and south west Sydney ones. These have a knowledge transmission function but little or no knowledge generation or transfer capacity. Staff of TAFE, however, are increasingly working closely with local enterprises to ensure the relevance of their courses. A major initiative, largely funded by the Commonwealth Government, was recently announced to train toolmakers for GWS manufacturing industry. This is Austool, the brainchild of a local businessman.
The region hosts no CRC headquarters or technology parks, although one is under consideration by Liverpool Council and there is an emerging Biotechnology concentration around Westmead hospital and the UWS Westmead campus.

AEGIS/UWS
69
The NSW Innovation Council some years ago set up the ‘Australian Technology Showcase’ (ATS) to promote firms which had developed especially innovative technologies. Firms apply to the Innovation Council which reviews applications and some outstanding companies are recommended for adoption into the ATS. Preliminary analysis of the companies (see Map 5.1) in the ATS indicates great concentrations in central Sydney and on the far north shore, with lesser concentrations in the lower north shore/Ryde areas. Many fewer are recorded as located in the rest of the city, except in Camden.

Map 2.4: Location of Australian Technology Showcase Companies in NSW
Source: New South Wales Department of State and Regional Development, last viewed December 2002.
AEGIS/UWS 70

Chapter 6 : Conclusions
The small study reported on here began the complex process of mapping existing or emerging knowledge hub(s) in NSW through an initial mapping of the locations and major activities of knowledge transmission, generation and transfer organisations. Limited resources dictated a focus on universities for knowledge generation and knowledge transfer but the study makes a point of including CSIRO, CRCs, technology parks and medical research institutes in the geographical maps and where possible in the text. Detailed analysis of the activities of the non-university public sector and, especially, a greater focus on private sector knowledge-intensive activities and the interaction between public and private sectors, must await a later phase of the study.
The present project shows that New South Wales clearly has a number of important assets relating to all three elements of a knowledge hub or hubs. In particular, there are many teaching and research strengths. The State has approximately 231,561 students enrolled in its ten universities and a fast growing graduate population available for employment. In research, two major universities are key knowledge generation powerhouses for the State while others are growing research and the CSIRO and medical science systems are distinguished in several specialised fields.
The State also has a large and growing financial and property and business services sector which provides employment for graduates and quite a few high technology businesses. These innovative and knowledge-intensive businesses, for example in the IT and biotechnology fields, also have the potential not only to receive information or knowledge from others but also to contribute to the generation and diffusion of new knowledge themselves. They too are potential employers of graduates in the State.
On the other, less positive, side of the equation, however, NSW does not seem to have an effective knowledge hub as yet. Its major knowledge institutions are not widely spread across the State but are concentrated within Sydney. Even within Sydney itself, where the overall concentration occurs, there are many areas with relatively little access, notably most of the greater western Sydney.
Given such a concentration of knowledge-intensive entities, there is little evidence of the creation of a knowledge hub or hubs in the full sense which involves collaborations and constant innovation-related interactions among key knowledge players and potentially convergence or integration. Initial study indicates that there is little systematic collaboration among the universities or their associated centres, such as teaching hospitals, except through CRCs, and even there the major partners may well be inter-state rather than local. Moreover, some of the stronger elements are as yet only weakly integrated. Even less systematic interaction seems to occur between the universities and the CSIRO, except through the medium of the CRCs. Within the arena of research and postgraduate research training, there is little collaboration between universities.
This situation partly stems from the different developmental trajectories of the organizations concerned, partly – perhaps mostly – from the federal government’s heavy emphasis on competition rather than collaboration between universities and
AEGIS/UWS 71
partly from the lack of vision of the institutions concerned as to how things could be done and developed differently. The NSW Government could also assist by bringing businesses and knowledge institutions onto more knowledge-intensive, and potentially converging, lines of development.
Some institutional boundaries could, for example, be redrawn so that a major medical sciences university, training not only doctors and medical researchers but also nurses and nursing researchers, biomedical engineering staff and students and the associated technological and materials development and deployment could be developed from the strengths currently spread across many competing institutions. Training in hospital management and local specialist medical software development companies could also be included. In this way critical mass in many areas and their associated specialisations, such as cancer research and treatment (The Cancer Institute was decided on since this report was written), could be better developed. The recently allocated IT Centre of Excellence may prove a step in this direction in the IT field. Recent Federal Government choices of research priorities could also stimulate re-thinking and perhaps reorganisation in R&D in these fields in NSW.
International experiences Overseas experience and the international literature on innovation suggest the importance of policies to encourage collaboration between knowledge organisations and the associated knowledge creation and better development and diffusion of innovation. This is the international route to the creation of critical mass and greater innovation.
A recent AEGIS / University of Wollongong study carried out for the government of Western Australia brought together some international examples of successful knowledge hub creation and the policy mechanisms behind them. A small sample of these examples is presented briefly below. Further details can be found in The Organisation of Knowledge: Optimising the Role of Universities in a Western Australian ‘Knowledge Hub’.
Canada and the US: Knowledge Generation and Transfer
Canada Underlying the strategy adopted in some regions in Canada is the recognition that it is not simply increases in R&D or technical training in the public sector that are necessary to generate economic development but also linkages between knowledge producers, and diffusers and better informed and more competitive business users. Some Provincial governments, such as British Columbia and Alberta, are increasing the level of targeted R&D investments to promote world-class research in strategic areas in industry. The strategic areas include information technology, telecommunications, energy, sustainable forestry, value-added agriculture products and environmental technologies. These investments are designed to run in parallel with policies to:
• expand the network of public and private institutions that support industry requirements for applied R&D, technology transfer, knowledge prospecting and acquisition;
AEGIS/UWS 72
• build joint industry/university R&D consortia; and • recruit key companies to create critical mass in R&D intensive clusters such as
biopharmaceuticals, agri-food, information technology and telecommunications. Universities in these Canadian Provinces have also learned to specialise and offer complementary courses and specialisms rather than compete unproductively. Thus, for example, Simon Fraser University and the University of British Columbia recognise each other’s strengths so that in engineering UBC has the traditional disciplines, such as electrical and mechanical, while SFU emphasises computer and environmental engineering. In other places, including the high tech Okanagan valley, industry and universities have created a knowledge centre in which the main Canadian Research Councils have also located. In other centres, notably the Ottawa-Carleton region, business took the lead in creating a knowledge hub, the information technology sector taking a leading role in establishing its own network or consortium of organizations as a source of entrepreneurs to lead economic growth in the region. Various other actors and agencies, including the universities, have contributed substantially to this process. Collaborations here have been aided by a high degree of mobility and exchange among researchers and academic staff at each of the three sets of R&D institutions located there – universities, industry and the federal laboratories. Non-profit, private sector catalyst organizations, such as the Ottawa-Carleton Research Institute (OCRI), have also found this regional economic context conducive to the development of a dense social web permitting ever more communication and interaction among the relevant actors. Into this landscape has flowed ample public sector funding to support world-class research.
One further important feature of the British Columbia case has been the integration between ‘life-style’ options and knowledge-intensive development. This could also be a relevant connection for Sydney.
The USA Georgia Tech An important activity of Georgia Tech is the central role it plays in supporting alliances with other universities. The Georgia Research Alliance, for example, involves six Georgia universities and makes strategic investments in building centres of research excellence, primarily in the sciences where there are obvious linkages to current or expected economic growth. Since it was established in 1990, the Alliance has received US$276 million in State funds, making it the most significant component of the State’s technology-based economic development strategy.
Numerous other collaborative activities at Georgia Tech are significant and a potential model for NSW. For example, the University is a key partner in the industrial enterprise ‘Yamacraw’. Through Yamacraw, universities, private industry, and the State government utilised Georgia’s technology base in broadband technology and have developed the State into a world leader in broadband infrastructure systems, chips and devices. Academic participation in Yamacraw involves researchers from both Georgia Tech and several other Georgia Universities. Yamacraw in turn can thus provide Georgia-based companies with ‘elite faculty researchers and their graduate
AEGIS/UWS 73

students’. Participating companies have a choice of either pledging US$1.25 million over a five year period or (and preferably) paying a membership fee of $25,000 annually and committing to hire high-tech employees in Georgia.
Georgia Tech’s Advanced Technology Development Centre (ATDC) is another example of its ‘best-practice’ approach to high technology. Within ATDC the Faculty Research Commercialisation Program (FRCP) allocates small grants from State funds to faculty researchers to develop early stage innovations into workable prototypes or to conduct ‘proof-of-concept applied research’. Although Georgia Tech manages the program, entities from all of Georgia’s research universities are eligible for grants.
In the many other collaborative examples in which Georgia Tech is the central player, the outstanding feature is that most of the initiatives involve State government in partnerships with academic institutions and business.
The Research Triangle in North Carolina The Research Triangle in North Carolina is often seen as a successful example of a knowledge hub which is generating employment and economic growth for its region. Contributing to the sustained nature of organisational partnerships in the Research Triangle has been the role played by intermediary agencies, notably the Southern Growth Policies Board. The Southern Growth Policies Board has recognised the critical role of developing partnerships between universities as well as between universities and firms, saying that when they identify solutions and best practices in building capacity for the knowledge economy they find that many share a common structure: that of public-private partnership (Southern Growth Policies Board. Invented Here: Transforming the Southern Economy, Southern Growth Policies Board 2001, Report on the Future of the South).
It is notable that in both Canada and the USA specific public agencies played important roles in the creation of successful knowledge hubs.
Europe: Collaboration for the Transmission of Knowledge
Postgraduate Cooperation across the Dutch University System A problem confronting many smaller countries, which in some critical ways resemble Australian States, is the achievement of critical mass in research and research training. The following example from the Netherlands shows one way that such critical mass can be achieved in the area of postgraduate training.
Recognising its limited expertise in several fields due to its small size, the Netherlands has put policies in place that enable students to come together to learn in a common environment with the best research teachers in the country. For example, the national Graduate School of Management brings together all universities in the Netherlands teaching management into common courses and advanced student teaching and research. A few other smaller scale initiatives are also in operation.
Despite different localities of different Graduate Schools, subjects can be organised across several universities. Schools must achieve a certain size and be accredited every five years by the Dutch Academy. One such example, created five years ago, involves the University of Twente and two others in the field of science, technology and society. In this example, doctoral students from participating universities were
AEGIS/UWS 74

required to partake in common workshops during the first three years of their four year doctoral course.
Such arrangements go far towards reducing the isolation of students in emerging and multidisciplinary fields and in situations where the expertise they need is spread between several institutions. They also build important networks for the students’ future academic and professional careers and facilitate later collaborations of many kinds. As increasingly the case in Australia, doctoral completions are important to Dutch universities because they receive quite large funding amounts for each completion.
In most cases, collaboration in graduate training and research rather than in undergraduate teaching programs provides the platform for developing the knowledge hub. If these areas are functioning effectively undergraduate programs tend to follow.
POLICY PROPOSALS There are a number of ways in which the present knowledge potential of NSW could be actualised through the encouragement of one or more functioning knowledge hubs.
In many overseas cases public sector knowledge organisations, especially universities, have had to undergo considerable organisational change to enable them to adapt to new and challenging industrial and social demands. This change has required building more flexibility into the ways in which knowledge generation, transfer and transmission are managed.
Developing properly functioning knowledge hubs in Australia may similarly involve some radical organisational rethinking concerning knowledge-intensive institutions. In a book on Australia’s universities published in 2000, Marceau, for example, argued that it is time for universities to rethink both their internal organisation and their external relationships (in Coady 2000). If universities can be thought of as flexible collections of staff united in the aim of teaching students and furthering knowledge creation we may move one step ahead. Most research, broadly considered, does not take place inside particular institutions except when the focus is on provision of resources (laboratories etc) but university staff currently have little alternative but to pursue research careers within the same formal organisation as they teach. They could, however, teach in one institution and conduct research in another, more specialist, arena where the small, flexible groups with which they actually work are more relevant. One possible way forward, and it is one in which NSW could lead the nation, therefore involves devising new organisational forms whereby staff could choose different organisational environments for the different segments of their activities. Many high tech firms have been experimenting in recent years with hybrid, sometimes ‘cellular’, forms of organisation which represent an attempt to come to terms with the value systems and peer interlinkages which drive scientific research in the universities and mix these in new ways to meet the needs of the production system. This could be further encouraged inside public sector research organizations.
Reforming knowledge institutions in the public sector alone is not enough, however. In line with policies for education, training and research, public policy attention also needs to be focused on moving many existing businesses in NSW further toward the
AEGIS/UWS 75
technological and organisational edges in their fields. No knowledge institutions can ever create enough new businesses to make a substantial difference to the industrial
structure – at regional or State level – within a short period of time. Sophisticated policies to assist existing businesses to be both more demanding customers and higher quality suppliers need to be put in place and to have a scale sufficient to make a difference. Again, there is international evidence to call on, especially in the field of extensive network creation, the development of ‘clubs’ of companies to use research and the use of public funding to encourage the development of new and core technologies
A further critically important message for Australian governments considering seriously how best to reconfigure the knowledge generation, transmission and transfer system in their State also comes from the international evidence available, some of which is mentioned above. This evidence suggests that in almost all cases of the successful creation of knowledge hubs, some form of agency or authority has been instrumental in promoting partnerships. Two-way partnerships between universities and industry are important but collaboration across a whole range of institutions and organisations is necessary for a well functioning knowledge hub.
Finally here, and this is linked to the need for an agency, governments need to recognise that almost all overseas cases of successful knowledge hub creation has required the commitment of public resources to steer collaboration toward achieving regional public policy goals.
Successful international experiences underscore the necessity for institutional cooperation in each of the three knowledge hub activities. In Australia, the need for institutionalised cooperation is all the more important because of the size and spread of the institutions and organizations concerned. Yet our research system emphasises competition between organisations for scarce resources rather than consolidation of resources. While a certain level of competition is necessary to promote excellence, a well-functioning knowledge hub consolidates an excellent knowledge basis and builds links between institutions and firms. As a State in a small country, NSW cannot afford excessive fragmentation of knowledge generation, transmission and transfer.
Knowledge hubs are sophisticated forms of collaboration between organisations that are themselves sophisticated producers, users and transmitters of new and existing knowledge. They seldom create themselves as a collaborative hub, however. The first step in thinking about the issues and the appropriate policies needed is to map and understand better what is already there and the assets on which further development will depend. The study reported on here has been the first step to such understanding in New South Wales. It has highlighted both positive and less positive aspects of the present situation. Further work is now urgently needed to provide a more detailed map of current strengths and weaknesses as the basis for making New South Wales into a truly innovative State.
AEGIS/UWS 76

References ABS (2000) 8111.0 Research and Experimental Development, Higher Education Organisations Australia, 2000, Canberra: ABS. ABS (2000) 8104.0 Research and Experimental Development, Business Australia, 2000, Canberra: ABS. ABS (2002) ABS Business Register - Counts of Management Units by ANZSIC Group, selected Postcodes and States by employment size ranges as at Sept 1998 Canberra: ABS. ABS (2002) 8104 Research and experimental development: Businesses Australia 2000-2001 Canberra: ABS. ARC (Centre for Research Policy) 1993 Crossing the Innovation Boundary. Canberra: ARC. Audretsch, D. (1995) Innovation and industry evolution, Cambridge, Mass: MIT Press. Australian Research Council, Commonwealth Scientific and Industrial Research Organisation and National Health and Medical Research Council (2002) National Survey of Research Commercialisation Year 2000.Canberra: ARC, CSIRO and NH&MRC. See also: http://www.arc.gov.au/publications/commercialisation.htm Commonwealth Department of Education, Science and Training (2002) Students, Selected Higher Education Statistics (DEST) Commissioned Data Canberra: DEST. Commonwealth Department of Education, Science and Training (2002) Students 2001 Selected Higher Education Statistics Canberra: DEST. Cumpston, A., R. Blakers, C. Evans, M. Maclachlan, and T. Karmel (2001) Atlas of Higher Education: A community focus. Occasional Paper Series 01/A, Higher Education Division, Department of Education, Training and Youth Affairs, Canberra. www.dest.gov.au/uniatlas/paper/default.htm Faulkner, W. and Senker, J. (1995) Knowledge Frontiers. Oxford: Oxford University Press. Garlic, S. (2000) Engaging Universities and Regions: Knowledge contribution to regional economic development in Australia, Occasional Paper Series 00/15, Higher Education Division, Department of Education, Training and Youth Affairs, Canberra. http://www.detya.gov.au/highered/eippubs/eip00_15/00_15.pdf Hicks D. (1995) ‘Published Papers, Tacit Competencies and Corporate Management of the Public-private Character of Knowledge’, Industrial and Corporate Change, 4(2), pp. 401-423.
AEGIS/UWS 77

Kline S.J. and N. Rosenberg (1986) The Positive Sum Strategy, Harnessing Technology for Economic Growth “An Overview of Innovation”, Washington D.C.: National Academy Press. Maskell, P. (2001) ‘Towards a knowledge-based theory of the geographical cluster’, Industrial and Corporate Change 10 (4): 921-943. New South Wales Department of State and Regional Development, December 2002 http://ats.business.gov.au/ OECD (1999) Benchmarking Knowledge-based Economies. Paris: OECD. OECD (2001a) Innovative Clusters: Drivers of National Innovation Systems. Paris: OECD. OECD (2001b) Cities and Regions in the New Learning Economy. Paris: OECD Smith, K. (2000) 'Innovation as a Systemic Phenomenon: Rethinking the Role of Policy', Enterprise and Innovation Management Studies 1 (1): 73-102. Senker, J., W. Faulkner, and L. Velho (1998) ‘Science and technology knowledge flows between industrial and academic research: a comparative study’. In H. Etzkowitz, A. Webster and P. Healey (eds), Capitalizing Knowledge: New Intersections of Industry and Academia New York: State University of New York Press, p. 111-132. Teece, D. (1987) ‘Profiting from technological innovation: Implications for integration, collaboration, licensing and public policy’. In D. Teece (ed.), The competitive challenge: Strategies for industrial innovation and renewal. Cambridge, MA: Ballinger, pp. 185-219. Tornatzky, L., O, Gray and P. Waugaman, (2001) Making the Future: Universities, Their States and the Knowledge Economy. Raleigh: Southern Growth Policies Board, p. 3. Western Australian Technology & Industry Advisory Council, (2002) The Organisation of Knowledge: Optimising the Role of Universities in a Western Australian ‘Knowledge Hub’. Perth: Technology & Industry Advisory Council, pp. 41-46.
AEGIS/UWS 78

Appendices Appendix 1A: Field of Education Classification by DEST
Natural and Physical Sciences
Mathematical Sciences
Physics and Astronomy
Chemical Sciences
Earth Sciences
Biological Sciences
Other Natural and Physical Sciences
Information Technology
Computer Science
Information Systems
Other Information Technology
Engineering and Related Technologies
Manufacturing Engineering and Technology
Process and Resources Engineering
Automotive Engineering and Technology
Mechanical and Industrial Engineering and Technology
Civil Engineering
Geomatic Engineering
Electrical and Electronic Engineering and Technology
Aerospace Engineering and Technology
Maritime Engineering and Technology
Other Engineering and Related Technologies
Architecture and Building
Architecture and Urban Environment
Building
Agricultural, Environmental and Related Studies
Agriculture
AEGIS/UWS 79
Horticulture and Viticulture
Forestry Studies
Fisheries Studies
Environmental Studies
Other Agricultural, Environmental and Related Studies
Health
Medical Studies
Nursing
Pharmacy
Dental Studies
Optical Science
Veterinary Studies
Public Health
Radiography
Rehabilitation Therapies
Complementary Therapies
Other Health
Education
Teacher Education
Curriculum and Education Studies
Other Education
Management and Commerce
Accounting
Business and Management
Sales and Marketing
Tourism
Office Studies
Banking, Finance and Related Fields
Other Management and Commerce
Society and Culture
Political Science and Policy Studies
AEGIS/UWS 80

Studies in Human Society
Human Welfare Studies and Services
Behavioural Science
Law
Justice and Law Enforcement
Librarianship, Information Management and Curatorial Studies
Language and Literature
Philosophy and Religious Studies
Economics and Econometrics
Sport and Recreation
Other Society and Culture
Creative Arts
Performing Arts
Visual Arts and Crafts
Graphic and Design Studies
Communication and Media Studies
Other Creative Arts
Food, Hospitality and Personal Services
Food and Hospitality
Personal Services
Mixed Field Programmes
General Education Programmes
Social Skills Programmes
Employment Skills Programmes
Other Mixed Field Programmes
AEGIS/UWS 81

Appendix 1B: ABS Research Fields, Courses and Disciplines Classification by AEGIS
Natural and Physical Sciences
Mathematical Sciences
Physical Sciences
Chemical Sciences
Earth Sciences
Biological Sciences
Information, Computing and Communication Services
Engineering and Technology
Agricultural, Veterinary and Environmental Sciences
Medical and Health Sciences
Humanities, Social Sciences and Other
Education
Studies in Human Society
Behavioural and Cognitive Sciences
Other Research Fields
Architecture, Urban Environment and Building
Policy and Political Science
Law, Justice and Law Enforcement
Journalism, Librarianship and Curatorial Studies
The Arts
Language and Culture
History and Archaeology
Philosophy and Religion
Economics and Commerce
Economics
Commerce, Management, Tourism and Services
AEGIS/UWS 82

Appendix 2: GWS Postcodes 2114 2168 2749
2115 2170 2750
2116 2171 2752
2117 2173 2753
2118 2174 2754
2121 2176 2755
2122 2177 2756
2125 2190 2757
2127 2196 2758
2128 2197 2759
2136 2198 2760
2141 2199 2761
2142 2200 2762
2143 2211 2763
2144 2212 2765
2145 2213 2766
2146 2214 2767
2147 2250 2768
2148 2558 2770
2150 2559 2773
2151 2560 2774
2152 2563 2775
2153 2564 2776
2154 2565 2777
2155 2566 2778
2156 2567 2779
2157 2568 2780
2158 2569 2782
2160 2570 2783
2161 2571 2784
2162 2572 2785
2163 2573 2786
2164 2574 2787
2165 2745
2166 2747
2167 2748
AEGIS/UWS 83

University ofWestern SydneyBringing knowledge to life
AEGIS is a Research Centre of the University of Western Sydney.Level 8, 263 Clarence StreetSydney NSW 2000PO Box Q1287QVB Post Offi ceNSW 1230
Phone: (02) 8255 6200Fax: (02) 8255 6222Email: [email protected]: aegis.uws.edu.au
AustralianExpertGroup inIndustryStudies