Embed Size (px)
Citation preview

OFFICE OF THE AUDITOR GENERAL
Report to the House of Assemblyon the Audit of the Financial Statements of the
Province of Newfoundland and Labrador
For the Year EndedMarch 31, 2018

Office of the Auditor General Newfoundland and Labrador
The Auditor General reports to the House of Assembly on significant matters which result from the examinations of Government, its departments and agencies of the Crown. The Auditor General is also the independent auditor of the Province’s financial statements and the financial statements of many agencies of the Crown and, as such, expresses an opinion as to the fair presentation of their financial statements.
VISION
The Office of the Auditor General is an integral component of Government accountability.
Office Location
7 Pippy Place
St. John’s Newfoundland and Labrador
Canada A1B 3X2
Mailing Address
P.O. Box 8700 St. John’s
Newfoundland and Labrador Canada
A1B 4J6 Telephone: (709) 729-2700 Email: [email protected]
Website: www.ag.gov.nl.ca/ag

7 Pippy Place, St. John’s, Box 8700 ♦ St. John’s, NL ♦ A1B 4J6 ♦ (709) 729-2700 Email: [email protected]
December 2018 The Honourable Perry Trimper, M.H.A. Speaker House of Assembly Dear Sir: In compliance with the Auditor General Act, I have the honour to submit, for transmission to the House of Assembly, my Report on the Audit of the Financial Statements of the Province of Newfoundland and Labrador for the year ended March 31, 2018. Respectfully submitted, JULIA MULLALEY, CPA, CA Auditor General
AUDITOR GENERAL of Newfoundland and Labrador

Intentionally Left Blank

Table of Contents
Auditor General of Newfoundland and Labrador Table of Contents, December 2018
Chapter
Page
1 Introduction 1
2
Independent Auditor’s Report Responsibility for the Consolidated Summary
Financial Statements Independent Auditor’s Report
3 3
3 3
The Financial Condition of the Province
Province’s Consolidated Financial Results - 2018
Sustainability
Flexibility
Vulnerability
Other Financial Highlights - Revenues and Expenses
Economic Outlook
Fiscal Outlook 2018-19 to 2022-23
5
5
5
15
17
23
29
32
4
Understanding the Consolidated Summary Financial Statements
Consolidated Statement of Financial Position
Consolidated Statement of Change in Net Debt
Consolidated Statement of Operations
Consolidated Statement of Change in Accumulated Deficit
Consolidated Statement of Cash Flows
39
39
43
43
45
45

Table of Contents
Table of Contents, December 2018 Auditor General of Newfoundland and Labrador
Chapter 5
Other Matters Opportunities for Improvements Identified
Monitoring Nalcor’s Status as a Government Business Enterprise
Timing of Release of Consolidated Summary Financial Statements
Reports Issued Pursuant to Section 15(1) of the Auditor General Act
Page
47
47
51
51
53
Appendix I
Government Reporting Entity
57

CHAPTER
1
INTRODUCTION

Introduction
Auditor General of Newfoundland and Labrador Chapter 1, December 2018 1
Introduction The Consolidated Summary Financial Statements (commonly referred to as the Public Accounts) reflect the financial position and annual operating results of all organizations in the Government Reporting Entity. This includes Government departments and the Legislature and all other Government entities that are controlled by Government and are accountable to either a Minister of a Government Department or directly to the Legislature for the administration of their financial affairs and resources. A full listing of the Government Reporting Entity is included in Appendix I. The Consolidated Summary Financial Statements provide the most complete information about the financial position and operating results of the Province. They are an important document which serve as the principal means by which Government reports to the House of Assembly and to all Newfoundlanders and Labradorians on its accountability and stewardship of public funds. This Report provides information on the Consolidated Summary Financial Statements of the Province of Newfoundland and Labrador for the year ended March 31, 2018. This information is intended to provide an overview of the financial condition of the Province and changes in its financial position and operations from the previous year. It also includes observations on other matters that came to my attention during our audit of the Province’s financial statements. As Auditor General, I am responsible for this Report to the House of Assembly. Acknowledgements I acknowledge the cooperation and assistance my Office has received from the Office of the Comptroller General during the completion of the audit, as well as from officials of the various Government departments and Crown agencies. I also thank the staff of the Office of the Auditor General for their hard work, professionalism and dedication.
JULIA MULLALEY, CPA, CA Auditor General

Introduction
Chapter 1, December 2018 Auditor General of Newfoundland and Labrador 2

CHAPTER
2
INDEPENDENT AUDITOR’S REPORT

Independent Auditor’s Report
Auditor General of Newfoundland and Labrador Chapter 2, December 2018 3
Responsibility for the Consolidated Summary Financial Statements Government, through the Office of the Comptroller General, is responsible for providing the House of Assembly with the Province’s Consolidated Summary Financial Statements. These statements are prepared in accordance with Canadian Public Sector Accounting Standards - the standards which are considered to be generally accepted accounting principles (GAAP) for Canadian governments. The Comptroller General is responsible for preparing the Consolidated Summary Financial Statements, including related notes and schedules. To prepare financial statements in accordance with GAAP, the Comptroller General is required to make judgments, estimates and assumptions that affect the application of accounting policies and the reported amounts of assets, liabilities, revenues and expenses. The Consolidated Summary Financial Statements include a Statement of Responsibility, signed by the Minister of Finance and President of Treasury Board and the Comptroller General. This Statement outlines Government’s responsibility for maintaining a system of internal control in order to provide reasonable assurance that transactions are properly authorized, assets are safeguarded, financial records are properly maintained, and financial statements are prepared that are free from material misstatement whether due to fraud or error.
Independent Auditor’s Report The responsibility of the Office of the Auditor General is to perform an audit of the Consolidated Summary Financial Statements in accordance with Canadian generally accepted auditing standards (GAAS). The Office forms an opinion based upon the results of the audit and, in accordance with GAAS, issues an Independent Auditor’s Report on the Consolidated Summary Financial Statements. Some key points about the Independent Auditor’s Report include: Audit Opinion An unqualified audit opinion was issued on the Consolidated Summary Financial Statements for the year ended March 31, 2018, concluding that they were fairly presented, in all material respects, in accordance with Canadian Public Sector Accounting Standards. This audit opinion does not extend to the effectiveness of internal controls as this is not the focus of a financial statement audit. Consistent with GAAS, however, if we identify matters during our audit which result in recommendations to improve controls or management practices, we communicate these matters in writing to Government. Recommendations communicated to Government as a result of our audit of the Consolidated Summary Financial Statements for the year ended March 31, 2018 are outlined in Chapter 5 - Other Matters.

Independent Auditor’s Report
Chapter 2, December 2018 Auditor General of Newfoundland and Labrador 4
Level of Assurance The audit is designed to obtain reasonable, but not absolute, assurance that the Consolidated Summary Financial Statements, as a whole, are free of material misstatement. Reasonable assurance means that sufficient appropriate audit evidence has been obtained to reduce audit risk to an acceptably low level to support the conclusion that the financial statements are free of material misstatement. This is consistent with GAAS. Materiality The Independent Auditor’s Report provides an opinion on whether the Consolidated Summary Financial Statements present fairly, in all material respects, the consolidated financial position of the Province at a point in time (e.g. March 31, 2018), and the consolidated results of its operations, the change in its net debt, the change in its accumulated deficit, and its cash flows for the year then ended (e.g. the year ended March 31, 2018) in accordance with Canadian Public Sector Accounting Standards. Audit procedures are performed to detect material misstatements in the financial statements. Materiality means how significant a financial statement omission or misstatement, either individually or in the aggregate, would need to be in order for such omissions or misstatements to be expected to influence or change the decisions of reasonably knowledgeable users relying on those financial statements. Guidance is provided by GAAS and professional judgment is exercised in order to set an overall level of materiality for the audit. All errors or misstatements noted during the audit are accumulated and an assessment is made whether they would individually, or in aggregate, cause the financial statements to be materially misstated, based on the level of materiality chosen for the audit or because of other qualitative considerations associated with the information irrespective of the magnitude of the misstatement or omission. Audit Procedures and Evidence An audit involves performing procedures to obtain audit evidence about the amounts and disclosures in the Consolidated Summary Financial Statements. The procedures selected depend on the auditor’s judgment, including an assessment of risks of material misstatement of the Consolidated Summary Financial Statements, whether due to fraud or error. Internal controls relevant to the preparation of the Consolidated Summary Financial Statements are considered in order to design audit procedures, but not for the purpose of expressing an opinion on the effectiveness of Government’s system of internal controls. The audit also includes evaluating the appropriateness of accounting policies used and the reasonableness of accounting estimates made by Government, as well as evaluating the overall presentation of the Consolidated Summary Financial Statements.

CHAPTER
3
THE FINANCIAL CONDITION
OF THE PROVINCE

The Financial Condition of the Province
Auditor General of Newfoundland and Labrador Chapter 3, December 2018 5
Province’s Consolidated Financial Results - 2018 This chapter reports on the financial condition of the Province by expanding on the information contained in the Consolidated Summary Financial Statements. It provides an overview of the Province’s financial position at March 31, 2018 with comparative information for the 10-year period ending March 31, 2018. It also considers forecasted financial information for 2018-19 to 2022-23 obtained from Budget 2018, the November 2018 Fiscal and Economic Update and other publicly available information. The 2018 Fiscal and Economic Update provided an update on the expected financial results for 2018-19 but did not provide any further update to the forecast from 2019-20 to 2022-23. The most recent medium-term projections discussed in this Chapter are outlined in Budget 2018. These medium-term projections are expected to be updated in Budget 2019. Various indicators can be used to assess the Province’s financial condition. The indicators discussed in this chapter are among those recommended for reporting by the Public Sector Accounting Board. These indicators combined assess the financial condition of a government: its financial health as measured by sustainability, flexibility and vulnerability, looked at in the context of the Province’s overall economic and financial environment.
Sustainability - whether a government is living within its means
Flexibility - whether a government can meet rising commitments by expanding its revenues
or increasing its debt
Vulnerability - the extent to which a government relies on sources of funding outside its control to pay for existing programs and services
Sustainability Sustainability is the degree to which a government can maintain existing programs and meet existing creditor requirements without increasing the debt burden on the economy. Sustainability indicators included in this chapter include Government’s: annual surplus or deficit; deficit as a percentage of province’s gross domestic product; net debt; net debt per capita; and net debt as a percentage of province’s gross domestic product.
Each of these indicators provides useful insight into the sustainability of a government’s revenue raising and spending practices.

The Financial Condition of the Province
Chapter 3, December 2018 Auditor General of Newfoundland and Labrador 6
-3.00
-2.00
-1.00
0.00
1.00
2.00
3.00
2009 2010 2011 2012 2013 2014 2015 2016 2017 2018 2019r 2020f 2021f 2022f 2023f
ForecastActual
Annual surplus or deficit A surplus occurs when the amount of annual revenue available is more than expenses in the same year. A deficit occurs when the amount of expenses is more than the amount of revenue available in the same year. It is an indicator of whether a government is living within its means.
Observations 1. The Province reported a deficit of $0.9 billion in 2017-18. While this is less than half of
the deficit recorded in 2015-16 and a modest improvement over 2016-17, it is still a significant deficit.
2. The Province has incurred annual deficits over the last six years (2012-13 to 2017-18) totaling approximately $5.9 billion and is predicting that deficits will persist in the next four years before returning to a small surplus in 2022-23.
3. The Province has revised its forecasted deficit for 2018-19 downward from $0.7 billion to $0.5 billion primarily in anticipation of increased oil revenues. However, since the forecast was revised, the temporary shutdown of all offshore production facilities due to a winter storm and the continued shutdown of the Searose due to an oil spill in November 2018 may impact oil royalties for 2018-19.
4. The estimated cumulative net deficit for the next five years, 2018-19 to 2022-23, is $1.9 billion.
Source: Public Accounts (actual); Department of Finance (forecast)
SURPLUS/(DEFICIT)
$ B
illi
ons

The Financial Condition of the Province
Auditor General of Newfoundland and Labrador Chapter 3, December 2018 7
2017-18 For the year ended March 31, 2018, the Province recorded a deficit of $0.9 billion, which was $0.1 billion more than predicted in Budget 2017. While this is less than half of the deficit recorded in 2015-16 and a modest improvement over 2016-17, it is still a significant deficit. Over the past 10 years, the Province recorded a cumulative net deficit (adding annual surplus or deficit for each of these years) of $2.1 billion. The cumulative deficit for the past five years is approximately $5.7 billion, representing a downward or deteriorating trend. The Province has incurred annual deficits over the last six year period 2012-13 to 2017-18 totaling approximately $5.9 billion. 2018-19 to 2022-23 The 2018 Fiscal and Economic Update released by the Province in November 2018 provided an update on the expected financial results for 2018-19 but did not provide any further update to the forecasted surpluses and deficits from 2019-20 to 2022-23. The most recent medium-term surplus and deficit projections are outlined in Budget 2018. Budget 2018 originally forecast a deficit of $0.7 billion for 2018-19 but the Province recently revised the forecast deficit to $0.5 billion. This improvement in forecast is primarily the result of higher anticipated oil revenues. However, since the forecast was revised, the temporary shutdown of all offshore production facilities due to a winter storm and the continued shutdown of the Searose due to an oil spill in November 2018 may impact oil royalties for 2018-19. The Province is forecasting deficits in each of the next four years (2018-19 to 2021-22), with a small surplus in year five (2022-23). The projected cumulative net deficit for the five-year period from 2018-19 to 2022-23 is $1.9 billion. A discussion on risks to Government’s forecast is outlined at the end of this chapter. Deficit as a percentage of GDP While the absolute amount of the deficit is an important indicator of financial performance, an additional and more informative indicator is to express the deficit as a percentage of Gross Domestic Product (GDP). GDP is the measure of the value of goods and services produced by the economy. This indicator relates the deficit to the size of the Province’s economy and provides a basis for comparison of financial performance among other provincial jurisdictions.
Observations 5. Newfoundland and Labrador’s deficit as a percentage of GDP for 2017-18 is 2.8%, the
highest in Canada. 6. The forecast deficit as a percentage of GDP for 2018-19 is expected to narrow or improve
to 1.6% but is still expected to be higher than the average of all other provinces and the Maritimes.

The Financial Condition of the Province
Chapter 3, December 2018 Auditor General of Newfoundland and Labrador 8
-10%
-8%
-6%
-4%
-2%
0%
2%
4%
6%
8%
10%
2009 2010 2011 2012 2013 2014 2015 2016 2017 2018 2019r
Newfoundland and Labrador (actual) Average - all other provinces Average - MaritimesNewfoundland and Labrador (forecast)
2017-18 and 2018-19 Newfoundland and Labrador’s deficit as a percentage of provincial GDP for 2017-18, at 2.8%, is the highest in Canada. The Province’s forecast deficit as a percentage of GDP for 2018-19 is expected to narrow or improve to 1.6% as a result of a smaller forecast deficit and a modest growth in GDP. While the average for all other provinces is expected to decline in 2018-19 mainly due to deteriorating operating results expected for a number of provinces, the Province’s forecast deficit as a percentage of GDP is still expected to be higher than the average of all other provinces and the Maritimes. Source: Economic Updates - all provinces; Statistics Canada; Public Accounts - all provinces
Net Debt Net Debt represents all the liabilities of the Province less its financial assets and indicates whether there are enough financial assets to cover the liabilities for future generations. Net Debt is a commonly used indicator to measure the financial health of the Province.
DEFICIT AS A PERCENTAGE OF GDP

The Financial Condition of the Province
Auditor General of Newfoundland and Labrador Chapter 3, December 2018 9
Liabilities are amounts that the Province owes others and include those items which are payable for items purchased in the ordinary course of doing business, amounts borrowed and which will be repaid over a longer time frame, and obligations related to employee post-retirement benefits. These benefits include pensions and group health and life insurance. Financial assets are amounts that the Province has available to pay its liabilities or finance future operations. Financial assets consist of cash and temporary investments, amounts receivable from third parties, investments, inventories held for resale and equity in Government Business Enterprises and Government Business Partnerships. Government Business Enterprises of the Province of Newfoundland and Labrador include Nalcor and its subsidiaries and the Newfoundland and Labrador Liquor Corporation. The Province’s only Government Business Partnership is its 25% equity interest in the Atlantic Lottery Corporation. Government Business Enterprises and Government Business Partnerships generate revenue for the Provincial treasury through the sale of goods and services. Net Debt is impacted by annual surpluses or deficits and the purchase of tangible capital assets. Surpluses reduce Net Debt while deficits and purchases of tangible capital assets increase Net Debt.
Observations 7. Net Debt of the Province at March 31, 2018, was $14.7 billion, an increase of $1.1 billion
from the previous year and the highest level in the Province’s history. 8. At March 31, 2018, Net Debt had increased by approximately $6.8 billion from its low point
in 2011-12, primarily the result of deficits totaling $5.9 billion in the 2012-13 through 2017-18 fiscal years plus the impact of tangible capital asset acquisitions during this period.
9. For the period 2018-19 to 2022-23, the Province is forecasting net deficits, combined with
spending on infrastructure, to further increase Net Debt to $16.8 billion by 2022-23.
2017-18 Net Debt of the Province at March 31, 2018 was $14.7 billion, an increase of $1.1 billion from the previous year and the highest level in the Province’s history. At March 31, 2018, Net Debt had increased by approximately $6.8 billion from its low point in 2011-12, primarily the result of deficits totaling $5.9 billion in the 2012-13 through 2017-18 fiscal years plus the impact of tangible capital asset acquisition during this period.

The Financial Condition of the Province
Chapter 3, December 2018 Auditor General of Newfoundland and Labrador 10
Source: Public Accounts (actual); Department of Finance (forecast)
Tangible capital assets (infrastructure) represent the physical infrastructure of the Province (excluding those owned by GBEs) and include hospitals, schools and roads. The cost of the infrastructure asset must be financed in the year it is acquired or built and increases Net Debt in that year. The cost of the asset is included as an expense evenly over the estimated life of the asset and impacts deficits over time.
0
2
4
6
8
10
12
14
16
18
2009 2010 2011 2012 2013 2014 2015 2016 2017 2018 2019r 2020f 2021f 2022f 2023f
Net Debt (actual) Net Debt (forecast)
$ B
illi
ons
NET DEBT

The Financial Condition of the Province
Auditor General of Newfoundland and Labrador Chapter 3, December 2018 11
0
100
200
300
400
500
600
700
800
2009 2010 2011 2012 2013 2014 2015 2016 2017 2018 2019f
Tangible Capital Asset Acquisitions (forecast)Tangible Capital Asset Acqusitions (actual)
TANGIBLE CAPITAL ASSET ACQUISITIONS
In response to the recession of 2008 and 2009, annual spending on tangible capital assets spiked significantly through 2010 to 2012 as the federal and provincial governments supported the economy through spending on infrastructure. Annual infrastructure spending since 2012 has declined with 2017 reaching near pre-recession levels. In 2018, infrastructure spending levels increased by $128 million. 2018-19 to 2022-23 The Province is expecting cumulative net deficits of $1.9 billion from 2018-19 through 2022-23. Infrastructure spending in 2019 is projected to increase by $86 million from 2018 levels which is part of the Province’s nearly $2.5 billion infrastructure plan over the next five years. This $2.5 billion includes federal funding. These net deficits, combined with spending on infrastructure over the period, will further increase Net Debt, albeit with more modest annual increases forecasted than in recent years, with net debt projected to level off by 2022-23. Information obtained from the Department of Finance indicates that, at the time Budget 2018 was released, the Province expected Net Debt to increase to $16.8 million by 2022-23. The 2018 Fiscal and Economic Update did not provide any further update to expected Net Debt beyond 2018-19. Investments in infrastructure and programs will have to continue to be prioritized to allow a prudent pace of deficit reduction and timely stabilization of the net debt burden.
$ M
illi
ons

The Financial Condition of the Province
Chapter 3, December 2018 Auditor General of Newfoundland and Labrador 12
Net Debt per Capita Net Debt per capita is a measure of the burden of the Province’s debt attributed to each resident of the Province.
Observations 10. At March 31, 2018, Net Debt per capita has risen to $27,761 - the highest in the Province’s
history. This represents a significant financial burden attributed to each and every Newfoundlander and Labradorian.
11. Net Debt per capita is expected to rise to $29,256 by March 31, 2019 and continue to increase through to 2021-22 before leveling off in 2022-23. The overall projected increase in Net Debt is the result of projected net deficits and a population decline.
Source: Public Accounts - all provinces; Statistics Canada; Department of Finance (forecast)
0
5
10
15
20
25
30
35
2008 2009 2010 2011 2012 2013 2014 2015 2016 2017 2018 2019r 2020f 2021f 2022f 2023f
Newfoundland and Labrador Average - all other provinces Average - MaritimesNewfoundland and Labrador (forecast)
$T
hou
san
ds
NET DEBT PER CAPITA

The Financial Condition of the Province
Auditor General of Newfoundland and Labrador Chapter 3, December 2018 13
For several years, the Province’s Net Debt per capita was approaching the average of all other provinces (as well as the average of the Maritimes) and at March 31, 2012, had reached its lowest point at $14,927. This occurred as a result of an improvement in both the Province’s Net Debt and population from 2008 to 2012. The average of all other provinces and the Maritimes deteriorated during that same period. At March 31, 2018, Net Debt per capita has risen to $27,761, the highest in the Province’s history. This represents a significant financial burden attributed to each and every Newfoundlander and Labradorian. Net Debt per capita is expected to rise to $29,256 by March 31, 2019 and continue to increase through to 2021-22 before leveling off in 2022-23. The overall projected increase in Net Debt is the result of projected net deficits and a population decline. Net Debt as a percentage of GDP Another commonly used indicator to measure a province’s financial position is Net Debt as a percentage of GDP. This indicator is perhaps the most widely used and relates provincial Net Debt to the size of the economy that supports the debt level. Because it is a relative measure, it is also used to compare jurisdictions to one another. GDP is an indicator of the ability of the Province to raise revenue and support debt. The financial demands placed on the economy by Government spending and revenue raising practices can be assessed for sustainability by comparing the level of Net Debt to provincial GDP. When a province’s Net Debt as a percentage of GDP is high, it is an indication that the level of Net Debt may not be sustainable.
Observation 12. The Province’s Net Debt as a percentage of GDP has fluctuated over the last ten years -
from a low of 23.4% in 2012 to a high of 44.5% at March 31, 2018 and is now significantly higher than the average of 30.0% of all other provinces.
13. By March 31, 2019, the Province’s Net Debt as a percentage of GDP is forecasted to be
45.0%. The expectation of continued deficits and modest GDP growth beyond 2018-19 could continue to increase the ratio of Net Debt to GDP in the future.

The Financial Condition of the Province
Chapter 3, December 2018 Auditor General of Newfoundland and Labrador 14
Source: Public Accounts - all provinces; Statistics Canada; Economic Updates - all provinces; Department of Finance (forecast)
Over the past 10 years, Net Debt as a percentage of GDP averaged 32.2% with a low of 23.4% at March 31, 2012. For fiscal 2012, 2013 and 2014, the Net Debt to GDP ratio of Newfoundland and Labrador was lower than the average of all other provinces and well below the average of the Maritimes. Over the past five years, the Net Debt as a percentage of GDP averaged 37.2% - an upward and deteriorating trend. At March 31, 2018, the Province’s Net Debt as a percentage of GDP climbed to 44.5%, which is significantly higher than the average of 30.0% for all other provinces and higher than the average of 36.4% for the Maritimes. By March 31, 2019, the Province’s Net Debt as a percentage of GDP is forecasted to be 45.0%. The expectation of continued deficits and modest GDP growth beyond 2018-19 could continue to increase the ratio of Net Debt to GDP in the future.
0%
5%
10%
15%
20%
25%
30%
35%
40%
45%
50%
55%
60%
2008 2009 2010 2011 2012 2013 2014 2015 2016 2017 2018 2019r
Newfoundland and Labrador (actual) Average - all other provinces Average - MaritimesNewfoundland and Labrador (forecast)
NET DEBT AS A PERCENTAGE OF GDP

The Financial Condition of the Province
Auditor General of Newfoundland and Labrador Chapter 3, December 2018 15
Flexibility Flexibility is the degree to which a government can increase its financial resources to respond to rising commitments, by either expanding its revenues or increasing its debt. Flexibility indicators include debt expenses as a percentage of total revenue. Debt expenses as a percentage of total revenue
Debt expenses as a percentage of revenue, sometimes called the “interest bite”, is an important indicator of the state of government finances. It indicates how much of a province’s revenues first must go to pay for past borrowings before being able to fund existing or new government programs and services.
Observations 14. Over the past 10 years, debt expenses as a percentage of revenue averaged 11.5% with a
low of 8.6% for 2009. Over the past five years, debt expenses as a percentage of revenue averaged 12.9% - an upward and deteriorating trend. Debt expenses as a percentage of revenue for 2017-18 are 13.7%.
15. Between 2018-19 and 2022-23, the Province expects, on average, to allocate 13.8% of every
dollar of revenue generated to debt expense. Money allocated to servicing debt is money that is not available to fund programs and services.
16. Over the period 2018-19 to 2022-23, the Province expects to borrow up to $6.7 billion in
the capital markets, which will have associated debt expenses. Borrowings are required to: Re-finance existing debt as it comes due. Satisfy commitments under the promissory notes issued as part of the pension reform
process. Finance deficits and infrastructure spending. Fund the Province’s currently expected share of equity for the Muskrat Falls project.
Any additional cost overruns on the Muskrat Falls project would require additional equity and borrowings by the Province.
Government incurs interest costs on its borrowings, as well as on its liabilities related to employee post-retirement benefits. At March 31, 2018, Government borrowings (net of sinking funds), its unfunded pension liability and unfunded group health and life insurance retirement benefits liability totaled $19.6 billion, an increase of $9.8 billion or approximately 100% over the last ten years. The net borrowings do not include the borrowings of Government business enterprises and partnership (Nalcor, Newfoundland Labrador Liquor Corporation and the Province’s share of Atlantic Lottery Corporation) as these entities are considered investments. Thus, their assets and liabilities are recorded as equity in the Consolidated Summary Financial Statements.

The Financial Condition of the Province
Chapter 3, December 2018 Auditor General of Newfoundland and Labrador 16
0
5
10
15
20
25
2008 2009 2010 2011 2012 2013 2014 2015 2016 2017 2018
Net Borrowings Unfunded Pension Liability Group Health and Life Insurance Liability
LIABILITIES FOR NET BORROWINGSAND POST-RETIREMENT BENEFITS
Source: Public Accounts Over the last 10 years, annual debt expense averaged $852 million and debt expenses as a percentage of revenue averaged 11.5% with a low of 8.6% for 2009. Over the past five years, debt expenses as a percentage of revenue averaged 12.9% - an upward and deteriorating trend. Debt expenses as a percentage of revenue for 2017-18 are 13.7%.
Source: Public Accounts (actual); Department of Finance (forecast)
0%
5%
10%
15%
20%
0.0
0.2
0.4
0.6
0.8
1.0
1.2
2009 2010 2011 2012 2013 2014 2015 2016 2017 2018 2019r 2020f 2021f 2022f 2023f
Debt expenses Debt expenses as a % of revenue Debt expenses (forecast)
$ B
illio
ns
8.6%
13.7%
DEBT EXPENSES AS A PERCENTAGE OF REVENUE
$ B
illi
ons

The Financial Condition of the Province
Auditor General of Newfoundland and Labrador Chapter 3, December 2018 17
Budget 2018 forecast debt servicing expenses to be $1.0 billion for 2018-19 and an annual average of $1.1 billion between 2019-20 and 2022-23. Debt expenses as a percentage of revenue are estimated to average 13.8% between 2018-19 and 2022-23. In recent years, Government has implemented measures to reduce liabilities for post-retirement benefits. These measures included, for example, pension reform to address the significant growing unfunded pension liability, elimination of severance moving forward and amendments to other post-retirement benefits. Over the period 2018-19 to 2022-23, the Province expects to borrow up to $6.7 billion in the capital markets, which will have associated debt expenses. This borrowing will be used to:
Re-finance existing debt as it comes due. Make the required payments under the promissory notes issued as part of changes made to
the public service and teachers’ pension plans. Finance deficits and infrastructure acquisitions. Fund the Province’s currently expected share of equity for the Muskrat Falls project. Any
additional cost overruns on the Muskrat Falls project would require additional equity and borrowings by the Province.
Vulnerability
Vulnerability is the degree to which a government becomes dependent on, and therefore vulnerable to, sources of funding outside of its control or influence. Important vulnerability indicators include:
Federal Government and own source revenues compared to total revenues; and offshore oil royalties as a percentage of own source revenues. Federal Government and own source revenues compared to total revenues A comparison of Federal Government and own source revenues to total revenues reflects how dependent Government is on these different revenue sources for financing its programs and services and thus, how vulnerable Government is to changes in these revenue sources.
Observations
17. Over the ten-year period 2009 to 2018, the Province has become more reliant on own source revenues and less reliant on Federal revenues – from 70.4% for own source revenues in 2009 to a high of 86.8% in 2013, with an average of 84.5% over the last five years. Federal revenue as a percentage of total revenue has seen a downward trend from a high of 29.6% in 2009 to a low of 13.2% in 2013, with an average of 15.5% over the last five years.
18. Own source revenues include oil royalties that are subject to volatile pricing and production
swings – factors outside of Government’s control. Thus, there is vulnerability associated with reliance on this source of revenue to finance existing programs and services. Continued efforts to diversify the economy over the medium to longer-term timeframe, and thus reducing reliance on oil royalties, will remain important.

The Financial Condition of the Province
Chapter 3, December 2018 Auditor General of Newfoundland and Labrador 18
Federal revenues primarily consist of Health and Social Transfers and cost-shared programs. Newfoundland and Labrador has not received any equalization payments since 2008. However, equalization transfers are affected by each province’s performance in relation to the performance of other provincial economies, and therefore are subject to change. Over the ten-year period from 2009 to 2018, Federal revenue as a percentage of total revenue has seen a downward trend from a high of 29.6% in 2009 to a low of 13.2% in 2013. Since 2013, this percentage has generally remained consistent with some modest increases, with an average of 15.5%. During this same period, own source revenues as a percentage of total revenue has seen a corresponding increase from 70.4% in 2009 to 86.8% in 2013, with an average of 84.5% over the last five years. Thus, the Province has become more reliant on its ability to generate own source revenues to finance its programs and services. Own source revenues include oil royalties, however, which are subject to volatile pricing and production swings that are outside of Government’s control. Thus, there is vulnerability associated with reliance on this source of revenue to finance programs and services. For example, in 2016, as a result of production declines and oil prices, oil royalties declined $1.0 billion from 2015. The impact of this vulnerability from oil prices, production and exchange rates is outlined in more detail below. Continued efforts by Government to diversify the economy in the medium to longer-term timeframe, and thus reducing reliance on oil royalties, will remain important.
Source: Public Accounts (actual); Department of Finance (forecast)
0%
10%
20%
30%
40%
50%
60%
70%
80%
90%
100%
0
1
2
3
4
5
6
7
8
9
2009 2010 2011 2012 2013 2014 2015 2016 2017 2018 2019r
Total Revenue (actual) Total Revenue (forecast) Federal Revenue Provincial Revenue
$ B
illi
ons
70.4%
29.6%
86.8%
13.2%
83.7%
16.3%
FEDERAL GOVERNMENT AND OWN SOURCE REVENUE TO TOTAL REVENUE

The Financial Condition of the Province
Auditor General of Newfoundland and Labrador Chapter 3, December 2018 19
Oil royalties as a percentage of revenues Oil royalties are a significant revenue source for the Province but are subject to volatility in commodity prices, exchange rates and oil production – factors that are outside of Government’s control. Therefore, changes in these factors can result in significant differences between forecast revenues and actual revenues. This is an important fiscal planning consideration for Government so that expenditure levels are not built to be reliant on oil royalties.
Observations
19. For the ten-year period 2008-09 to 2017-18, oil royalties accounted for, on average, 23% of revenues (including Atlantic Accord revenues) with a peak in 2011-12 of 31.7%. For the last five-year period from 2013-14 to 2017-18, this had dropped to, on average, 17%. For 2017-18, oil royalties had dropped to 13% of revenues. The volatility associated with oil royalties is an important fiscal planning consideration for Government so that expenditure levels are not built to be reliant on this revenue source.
20. Annual production of offshore oil, while fluctuating significantly, has shown an overall downward trend since 2007-08 when production peaked at 133.8 million barrels. Production fell to a low of 61.7 million barrels in 2016, increasing to 81.0 million barrels in 2017-18.
21. While the 2018 Fiscal and Economic Update revised the forecasted production for 2018-19
downward from 88.3 million barrels to 85.8 million, production for 2018-19 to 2022-23 is forecast to increase each year, primarily as a result of increased production from the Hebron field. Oil production is forecast to reach 112.4 million barrels in 2022-23.
22. The average annual price of Brent Crude peaked in 2011-12 at $US114.65 per barrel and
has declined since that time. In 2017-18, prices trended slightly upward for most of the year compared to the previous year and the price of Brent crude averaged $US57.41 per barrel.
23. The Province recently revised its forecast price of Brent crude upward for 2018-19 from an
average of $US63 per barrel to $US74. Budget 2018 forecast an average of $US63 per barrel in 2019-20 with steady annual increases to $US74 per barrel by 2022-23. If these price increases do not materialize or the Canadian dollar is stronger than forecast, the Province will have increased pressure to achieve its surplus/deficit targets. The 2018 Fiscal and Economic Update, for the timeframe October 2018 to March 2019, estimated that from a sensitivity perspective: Every $1.00 decline in oil price would result in a loss of revenue of $10.4 million
($19.9 million in additional revenue for every $1.00 increase in oil price). Every one-cent increase in the CAD/USD exchange rate would result in a loss of
revenue of $9.8 million ($19.5 million in additional revenue for every one-cent decrease).

The Financial Condition of the Province
Chapter 3, December 2018 Auditor General of Newfoundland and Labrador 20
For the ten-year period 2008-09 to 2017-18, oil royalties accounted for, on average, 23% of revenues (including Atlantic Accord revenues) with a peak in 2011-12 of 31.7%. For the last five-year period from 2013-14 to 2017-18, this had dropped to, on average, 17%. For 2017-18, oil royalties had dropped to 13% of revenues.
Note: Total revenue includes revenues received under the Atlantic Accords. Source: Public Accounts Oil Production 2017-18 Oil production commenced in the Newfoundland and Labrador offshore area in 1997 and peaked in 2007-08 at 133.8 million barrels. Since that time, production, while fluctuating significantly, has been on a general downward trend. Production fell to a low of 61.7 million barrels in 2016, increasing to 81.0 million barrels in 2017-18. 2018-19 to 2022-23 Production for 2018-19 to 2022-23 is forecast by the Province to increase each year, commencing with 2018-19. The increase in production is attributed, primarily, to the commencement of production from the Hebron field, which produced first oil on November 27, 2017. By 2022-23, total oil production is forecast to be 112.4 million barrels.
0.0%
5.0%
10.0%
15.0%
20.0%
25.0%
30.0%
35.0%
0
1
2
3
4
5
6
7
8
9
10
2009 2010 2011 2012 2013 2014 2015 2016 2017 2018
Total revenue Offshore Royalties
25.9%31.7%
13.0%$ B
illi
ons
OIL ROYALTIES AS A PERCENTAGE OF TOTAL REVENUE

The Financial Condition of the Province
Auditor General of Newfoundland and Labrador Chapter 3, December 2018 21
0
20
40
60
80
100
120
140
160
Production (actual) Production (forecast)
Production for 2018-19 had initially been forecast to be 88.3 million barrels in Budget 2018; however, the 2018 Fiscal and Economic Update revised the forecasted production for 2018-19 downward to 85.8 million barrels. There is still risk that the revised production forecast may not be achieved. Since the forecast was revised, the temporary shutdown of all offshore production facilities due to a winter storm and the continued shutdown of the Searose due to an oil spill in November 2018 will further impact production in 2018-19.
Source: Canada-Newfoundland and Labrador Offshore Petroleum Board (Actual) Department of Finance (forecasted)
Oil Price and Exchange Rate The price of Brent Crude (quoted in US dollars), and the Canada-US exchange rate are subject to significant fluctuation that can have a significant impact on oil revenues.
ANNUAL OIL PRODUCTION
Mil
lion
Bar
rels

The Financial Condition of the Province
Chapter 3, December 2018 Auditor General of Newfoundland and Labrador 22
Source: US Department of Energy – Energy Information Administration (Brent Crude price) Bank of Canada – (Canada-US Exchange Rate) Department of Finance (forecasted information)
2017-18 The average annual price of Brent Crude peaked in 2011-12 at $US114.65 per barrel. From 2011-12, the average price steadily declined until 2015-16 when it reached $US47.30 per barrel. There was a slight increase in 2016-17, and in 2017-18, the average price of Brent crude increased to $US57.41 per barrel. The average annual Canada-US (CAD/USD) exchange rate also peaked in 2011-12 at 1.008. From 2011-2012, the exchange rate steadily declined until 2016-17 when it reached 0.761. The average annual exchange rate increased to 0.780 in 2017-18. 2018-19 to 2022-23 Budget 2018 forecast the price of Brent crude to be $US63 per barrel for 2018-19; however, the 2018 Fiscal and Economic Update has since revised the forecasted price for 2018-19 to $US74 per barrel. The price of Brent crude has averaged $US75.74 from April to October 2018. Some risk remains around oil prices for the remainder of the fiscal year. Budget 2018 forecast the average CAD/USD exchange rate at 0.79 for 2018-19 which was revised to 0.77. The 2018 Fiscal and Economic Update, for the timeframe October 2018 to March 2019, estimated that from a sensitivity perspective:
0.0
0.2
0.4
0.6
0.8
1.0
1.2
0
20
40
60
80
100
120
140
Brent Crude Actual (LHS) Exchange Rate Actual(RHS)
$US
Per
Bar
rel
Exc
han
ge R
ate
Brent Crude Forecast (LHS) Exchange Rate Forecast (RHS)
BRENT CRUDE - AVERAGE MONTHLY SPOT PRICE AND CAD/USD EXCHANGE RATE

The Financial Condition of the Province
Auditor General of Newfoundland and Labrador Chapter 3, December 2018 23
Every $1.00 decline in oil price would result in a loss of revenue of $10.4 million ($19.9 million in additional revenue for every $1.00 increase in oil price).
Every one-cent increase in the CAD/USD exchange rate would result in a loss of revenue of $9.8 million ($19.5 million in additional revenue for every one-cent decrease).
The Province is forecasting the price of Brent crude to average $US63 in 2019-20 and expects to see steady annual increases to $US74 per barrel by 2022-23. The average annual exchange rate is forecast at 0.796 in 2019-20 with steady annual increases to 0.813 by 2022-23. If these price increases do not materialize or the Canadian dollar is stronger than forecast, the Province will have increased pressure to achieve its surplus/deficit targets. Of greater risk is the forecast from 2019-20 to 2022-23. The farther in the future the forecast extends, the greater the risk around predicting the oil fundamentals at that time. The Province will have to closely monitor oil prices as it manages the deficit and adjust as circumstances warrant. Other Financial Highlights - Revenues and Expenses
Observations
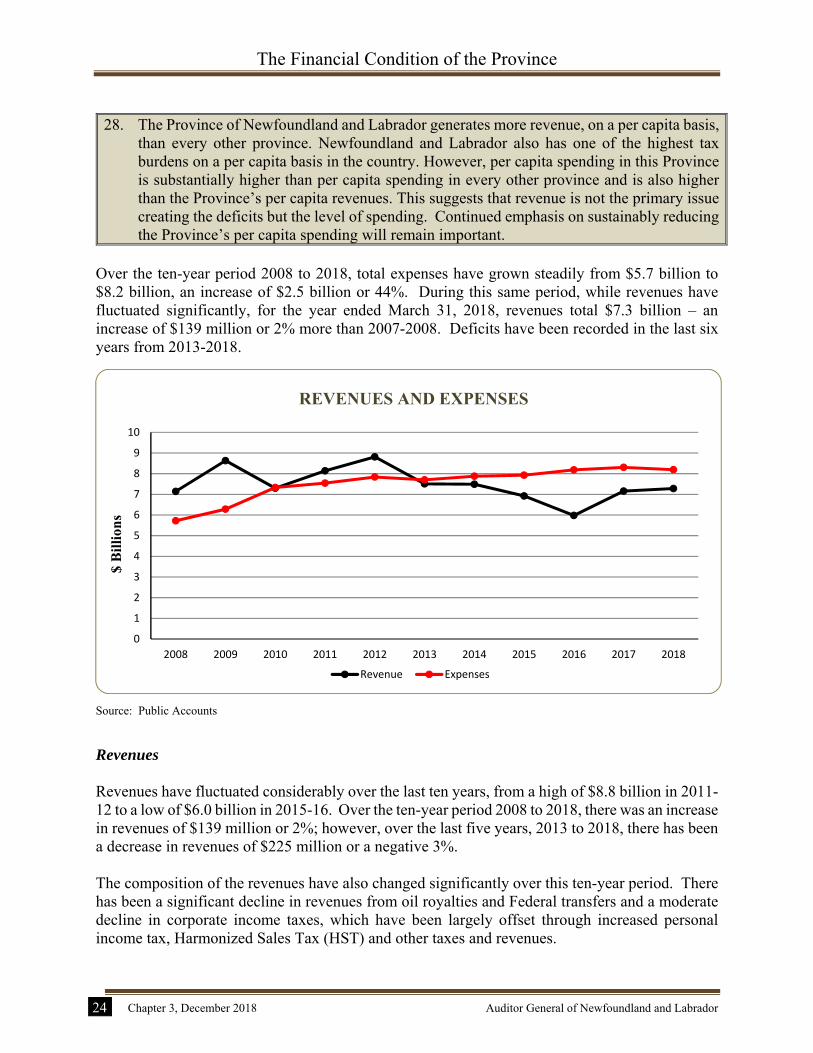
24. Over the ten-year period 2008 to 2018, total expenses have grown steadily from $5.7 billion to $8.2 billion, an increase of $2.5 billion or 44%. During this same period, while revenues have fluctuated significantly, for the year ended March 31, 2018, revenues total $7.3 billion – an increase of $139 million or 2% more than 2007-2008. Deficits have been recorded in the last six years from 2013-2018.
25. The composition of the revenues have changed significantly between 2008 and 2018. There
has been a significant decline in revenues from oil royalties and Federal transfers and a moderate decline in corporate income taxes. These declines have been largely offset through increased personal income tax, Harmonized Sales Tax (HST) and other taxes and revenues.
26. During the period 2008 to 2012, total expenses grew by 37% or an average of 9.3% per year.
While expenses continued to grow from 2012 to 2018, the average rate of growth decreased to 0.8% per year.
27. Program expenses include all those expenses incurred by the Province other than those
required to service debt and for the year ended March 31, 2018, represent $7.2 billion of the $8.2 billion in total expenses. Of the $7.2 billion, approximately: 72%, or $5.2 billion, was directed to the health, education and skills development
sectors; 49%, or $3.5 billion, was spent on salaries and employee benefits.
The Financial Condition of the Province
Chapter 3, December 2018 Auditor General of Newfoundland and Labrador 24
28. The Province of Newfoundland and Labrador generates more revenue, on a per capita basis, than every other province. Newfoundland and Labrador also has one of the highest tax burdens on a per capita basis in the country. However, per capita spending in this Province is substantially higher than per capita spending in every other province and is also higher than the Province’s per capita revenues. This suggests that revenue is not the primary issue creating the deficits but the level of spending. Continued emphasis on sustainably reducing the Province’s per capita spending will remain important.
Over the ten-year period 2008 to 2018, total expenses have grown steadily from $5.7 billion to $8.2 billion, an increase of $2.5 billion or 44%. During this same period, while revenues have fluctuated significantly, for the year ended March 31, 2018, revenues total $7.3 billion – an increase of $139 million or 2% more than 2007-2008. Deficits have been recorded in the last six years from 2013-2018.
Source: Public Accounts
Revenues Revenues have fluctuated considerably over the last ten years, from a high of $8.8 billion in 2011-12 to a low of $6.0 billion in 2015-16. Over the ten-year period 2008 to 2018, there was an increase in revenues of $139 million or 2%; however, over the last five years, 2013 to 2018, there has been a decrease in revenues of $225 million or a negative 3%. The composition of the revenues have also changed significantly over this ten-year period. There has been a significant decline in revenues from oil royalties and Federal transfers and a moderate decline in corporate income taxes, which have been largely offset through increased personal income tax, Harmonized Sales Tax (HST) and other taxes and revenues.
0
1
2
3
4
5
6
7
8
9
10
2008 2009 2010 2011 2012 2013 2014 2015 2016 2017 2018
Revenue Expenses
$ B
illi
ons
REVENUES AND EXPENSES
$ B
illi
ons

The Financial Condition of the Province
Auditor General of Newfoundland and Labrador Chapter 3, December 2018 25
10-Year/5-Year Trend of Change in Total Revenue ($Millions)
Revenue Type 2007-08 2012-13 2017-18 5-Year Trend (2013-2018)
10-Year Trend (2008-2018)
Amount % Amount % Oil Royalties $ 1,754 $ 1,828 $ 944 $ (884) -48% $ (810) -46%
Personal Income Tax 804 1,159 1,473 314 27% 669 83%
Corporate Income Tax 484 767 302 (465) -61% (182) -38%
HST and Other Taxes 1,333 1,596 1,992 396 25% 659 49%
Other Revenues 978 1,163 1,385 222 19% 407 42%
Federal Transfers 1,788 992 1,184 192 19% (604) -34%
Total Revenues $ 7,141 $ 7,505 $ 7,280 $ (225) -3% $ 139 2%
Source: Public Accounts
Expenses Expenses, in general, have grown steadily over the last ten years with an overall increase of $2.5 billion or 44%. During the period 2008 to 2012, expenses grew by 37% or an average of 9.3% per year. While expenses continued to grow from 2012 to 2018, the average rate of growth decreased to 0.8% per year. Program Expenses Program expenses include all those expenses incurred by the Province other than those required to service debt and for the year ended 31 March 2018, represent $7.2 billion of the $8.2 billion in total expenses. Since 2007-08, program expenses have grown by $2.2 billion, representing cumulative growth of 45%. Over the last five years, program expenses have grown by 4% or an average of 0.8% per year, with most increases for social programs and services.
5-Year Trend of Change in Total Expenses ($Millions) 1
Expense by Department or Sector 2012-13 2017-18 5-Year Trend
Amount % Health and Community Services $ 2,832 $ 3,172 $ 340 12%
Advanced Education, Skills and Labour 1,144 1,161 17 1%
Education and Early Childhood Development 758 797 39 5%
General Government Sector and Legislative Branch 1,123 947 (176) -16%
Resource Sector - Other 364 314 (50) -14%
Social Sector - Other 700 802 102 15%
Total Program Expenses 6,921 7,193 272 4%
Debt expenses 780 998 218 28%
Total Expenses $ 7,701 $ 8,191 $ 490 6%
Source: Public Accounts Note 1: Unlike revenue, due to restructuring of departments, comparative 10-year expenses by department or sector information
was not readily available.

The Financial Condition of the Province
Chapter 3, December 2018 Auditor General of Newfoundland and Labrador 26
Approximately 72% of program expenses in 2017-18, or $5.2 billion, were incurred for social programs and services: $3.2 billion or 44% of program expenses were attributed to the Department of Health and
Community Services and includes the operations of the four regional health authorities across the Province.
$2.0 billion or approximately 28% of program expenses were attributed to the the
Departments of Advanced Education, Skills and Labour, and Education and Early Childhood Development. This includes spending on the K-12 system, the university and college, as well as income support and skills development.
Source: Public Accounts
As with any organization providing programs and services, the Province spends the majority of its expenses on human resources – its employees. In 2017-18, the Province spent $3.5 billion, on salaries and employee benefits, representing 49% of the total program spending.
HCS$3,171,966
AESL$1,160,961
EECD$797,173
Other$2,063,029
44%
29%
11%
16%
PROGRAM EXPENSES BY DEPARTMENT: 2017-18 ($000s)

The Financial Condition of the Province
Auditor General of Newfoundland and Labrador Chapter 3, December 2018 27
Source: Public Accounts
Revenue and Expenses per Capita On a per capita basis, Newfoundland and Labrador generates more revenue than every other province. Newfoundland and Labrador also has one of the highest tax burdens on a per capita basis in the country. However, per capita spending in this Province is substantially higher than other provinces. We spend more than every other province by a considerable margin - in excess of 18% more per capita than the next highest province - Alberta. We also spend more per capita than our per capita revenues. Overall, this suggests that revenue is not the primary issue creating the deficits but the level of spending. Continued emphasis on sustainably reducing the Province’s per capita spending will remain important.
Source: Public Accounts - all provinces; Statistics Canada
Salaries and Benefits$3,513,407
Operating$1,161,683
Grants and Subsidies$1,602,041
Professional Services$528,648
Amortization$314,715
Property, Furnishings and Equipment
$72,635
49%
(1%)5%
7%
22%
16%
0
2
4
6
8
10
12
14
16
NL NS PE NB QC ON MB SK AB BC
Own Source Federal
$ T
hou
san
ds
PROGRAM EXPENSES BY CATEGORY: 2017-18 ($000s)
PER CAPITA REVENUE: 2017-18

The Financial Condition of the Province
Chapter 3, December 2018 Auditor General of Newfoundland and Labrador 28
Source: Public Accounts - all provinces; Statistics Canada
Source: Public Accounts - all provinces; Statistics Canada
0
2
4
6
8
10
12
14
16
18
NL NS PE NB QC ON MB SK AB BC
Program Debt Expenses
$ T
hou
san
ds
0123456789
10
NL NS PE NB QC ON MB SK AB BC
Taxation and Fees per Capita
$ T
hou
san
ds
PER CAPITA EXPENSES: 2017-18
PER CAPITA TAXES AND FEES: 2017-18

The Financial Condition of the Province
Auditor General of Newfoundland and Labrador Chapter 3, December 2018 29
Government is reviewing the Province’s tax system to ensure it is competitive and fair. The Independent Tax Review Committee was mandated to submit a final report to the Minister of Finance in 2018-19.
Economic Outlook Economic forecasts predict how well the economy will perform and provides essential information for Government in developing multi-year plans and annual budgets.
Observations
29. The Province’s economic forecast is based on assumptions and future expectations and, like any forecast, is subject to potential upside opportunities but is also subject to downside risks and change.
30. The economic forecast for 2019 is expected to improve over 2017 and 2018 with increased
capital investment, increased exports and growth in real GDP. The medium-term outlook beyond 2019 is expected to remain challenging due to declining major project investment and Government fiscal restraint.
31. GDP growth is forecast as modest from 2018 to 2022 based on increases in oil prices and
oil production and increases in activities in the mining and aquaculture sectors. 32. Capital investment is expected to decline significantly from 2018 through 2022 as compared
to its peak in 2016, which will have a corresponding negative impact on employment and revenue to the treasury.
33. Budget 2018 forecasted employment would drop from 224,100 persons in 2017 to 214,800 persons by 2022. This is a decrease of 9,300 persons over a five-year period and a decrease of 27,900 from the high of 242,700 in 2013. While only one of a number of factors that impact tax revenues, this will negatively impact personal income tax revenue and will also impact retail sales with an associated negative impact on HST revenue and other consumption taxes such as gasoline tax. The forecast did not include assumptions on the Bay du Nord project which was announced since the Budget. A framework agreement for the development of this project was announced in July 2018 with project sanction anticipated in 2020, followed by commencement of construction in 2022.
The Province’s economic forecast is based on assumptions and future expectations and, like any forecast, is subject to upside potential opportunities but is also subject to downside risks and change. The Province’s 2018 Fiscal and Economic Update indicated that in 2019, the outlook is expected to improve over 2017 and 2018 with increased capital investment, increased exports and growth in real GDP. The medium-term outlook beyond 2019 is expected to remain challenging due to declining major project investment and Government fiscal restraint.

The Financial Condition of the Province
Chapter 3, December 2018 Auditor General of Newfoundland and Labrador 30
Despite these medium-term challenges, the 2018 Fiscal and Economic Update highlighted opportunities for a more positive long-term outlook including anticipated sanction of the Bay du Nord offshore oil project in 2020 with construction expected to commence in 2022. The Update also highlighted, among other things, the Province’s substantial oil and gas resources available for future development and continued strong interest by industry in offshore land sales and exploration. Gross Domestic Product Gross domestic product (GDP) is the measure of the value of goods and services produced by the economy. GDP can be expressed in either nominal or real terms. Nominal GDP values the goods and services at today’s prices while real GDP excludes the impact of changing prices on the value. Nominal GDP could be considered an economic proxy for the base on which government revenue is generated and an appropriate indicator to use to examine the potential for government revenue generation in the future. Nominal GDP has experienced considerable fluctuation over the past ten years. Most notably in 2015 and 2016, GDP was impacted by both oil price and oil production declines. The Province’s economic forecast for 2018 to 2022 predicts, in general, modest GDP growth, driven by anticipated increases in oil prices and oil production and increases in activities in the mining and aquaculture sectors.
Source: Department of Finance Much of the increased oil production is expected from the Hebron field. Because of the structure of the royalty regime, it would not be expected that overall royalty revenue from all projects would increase in proportion to the increase in production. Royalty rates increase as cumulative profitability increases which is impacted by oil prices and time. The heavier nature of Hebron crude will also have a dampening impact on the oil price received for the production from this development as compared to other projects.
0
5
10
15
20
25
30
35
40
2009 2010 2011 2012 2013 2014 2015 2016 2017e 2018f 2019f 2020f 2021f 2022f
Actual Forecast
$B
illi
ons
NOMINAL GDP
$ B
illi
ons

The Financial Condition of the Province
Auditor General of Newfoundland and Labrador Chapter 3, December 2018 31
Capital Investment The Newfoundland and Labrador economy is primarily resource based and activity in recent years has been dominated by large, capital and labour intensive projects, such as construction of the Long Harbour nickel processing facility and development of the Hebron oil field and Muskrat Falls. These projects generate strong levels of employment and considerable benefits throughout the economy and to the treasury during the construction cycle.
Source: Department of Finance
The 2018 Fiscal and Economic Update forecasts that capital investment will increase in 2019 from 2018 levels as a result of investment at the West White Rose project and the underground mine at Voisey’s Bay, which is expected to more than offset declining construction activity at Muskrat Falls. Overall, during the period 2018 through 2022, the Province is forecasting significant overall declines in the level of capital investment compared to its peak of $14.2 billion in 2016. This decline is a result of the conclusion of the construction phases of the Long Harbour, Hebron and Muskrat Falls projects. While only one of a number of factors that impact tax revenues, declines in capital investment will have a corresponding drop in employment and will negatively impact revenue to the treasury from tax sources such as personal income tax and consumption taxes such as HST.
0
1
2
3
4
5
6
7
8
9
10
11
12
13
14
15
2009 2010 2011 2012 2013 2014 2015 2016 2017e 2018f 2019f 2020f 2021f 2022f
Actual Forecast
CAPITAL INVESTMENT
$ B
illi
ons

The Financial Condition of the Province
Chapter 3, December 2018 Auditor General of Newfoundland and Labrador 32
Employment Consistent with the decline in capital investment, Budget 2018 also forecasted a significant decline in employment levels from 2018 through 2022. Again, while only one of a number of factors that impact tax revenues, this decline will negatively impact personal income tax revenue and will also impact retail sales with an associated negative impact on HST revenue and other consumption taxes such as gasoline tax.
Source: Department of Finance Budget 2018 forecasted employment would drop from 224,100 persons in 2017 to 214,800 persons by 2022. This is a decrease of 9,300 persons over a five-year period and a decrease of 27,900 from the high of 242,700 in 2013. The forecast did not include assumptions on the Bay du Nord project which was announced since the Budget. A framework agreement for the development of this project was announced in July 2018 with project sanction anticipated in 2020, followed by commencement of construction in 2022.
Fiscal Outlook: 2018-19 to 2022-23 The Province is forecasting the following fiscal outlook over the five-year period 2018-19 to 2022-23:
deficits over the four-year period 2018-19 to 2021-22, ranging from $243 million to $654 million;
return to a small surplus in 2022-23; increase in revenue of $769 million - 10.6% or an average of 2.11% per year; and decrease in net expenses of $283 million. This $283 million is comprised of an estimated
increase in debt expenses of $117 million with offsetting decrease in program expenses of $400 million - 5.6% or an average of 1.12% per year.
195
200
205
210
215
220
225
230
235
240
245
250
2009 2010 2011 2012 2013 2014 2015 2016 2017e 2018f 2019f 2020f 2021f 2022f
Actual Forecast
Th
ousa
nd
s
EMPLOYMENT

The Financial Condition of the Province
Auditor General of Newfoundland and Labrador Chapter 3, December 2018 33
The 2018 Fiscal and Economic Update provided an update on the expected financial results for 2018-19 but did not provide any further update to the forecasted surpluses and deficits from 2019-20 to 2022-23. Thus, the most recent medium-term surplus and deficit projections discussed in this Chapter are outlined in Budget 2018. These medium-term projections are expected to be updated in Budget 2019.
Observations 34. The Province is projecting deficits over the four-year period 2018-19 to 2021-22, ranging
from $243 million to $654 million, with a return to a small surplus in 2022-23 through a combination of: increased revenue of $769 million - 10.6% or an average of 2.11% per year; and
decreased program expenses of $400 million - 5.6% or an average of 1.12% per year and increased debt expenses of $117 million.
35. The Province’s fiscal outlook for 2019 to 2023 is subject to considerable risks:
The Province’s economic forecast is based on assumptions and future expectations and impacted by global and national economic environments, including trade relations, and so like any forecast, is subject to considerable risk and change. Given that the economic forecast provides the basis for predicting taxation and other provincial revenues, this risk also extends to the Province’s revenue forecast.
The forecast includes an increase in corporate tax revenues which are subject to volatility as some of the largest remitters are commodity-based and commodity prices and production are factors outside of the Government’s control.
The forecast at Budget 2018 included a provision for carbon tax revenues of $20 per tonne commencing 2019 and increasing to $50 per tonne by 2022-23. Subsequent to Budget 2018, Government announced that carbon tax rates will commence at $20 per tonne and will only increase based on Atlantic parity. To ensure regional competitiveness, the carbon tax rate will only increase on fuels beyond 2019 if carbon pricing in the other three Atlantic Provinces allows for such increases. This introduces risk that the Budget 2018 forecasted revenues from carbon tax may not materialize.
The forecast includes an increase in oil royalties based on an assumption of increasing oil prices and oil production to 2022-23 – factors outside the Province’s control.
The expected average decline in program expenses of 1.12% per year is less than the expected rate of inflation and would not allow for inflationary or other pressures. Keeping expenses at these forecast levels will be challenging, particularly in the area of health costs with the Province’s rapidly aging population.
Any mitigation measures implemented by Government to reduce electricity rates during 2020-2023, beyond the amounts included in the Budget 2018 forecast, may impact the Province’s forecasted surplus/deficit.
36. While there is a potential upside for economic performance to be stronger than forecast and
opportunities for increased revenues, should the downside risks to the forecast materialize and result in significantly less revenues than expected or more expenses than expected, Government would be significantly challenged to address such a shortfall and remain on target to return to surplus in 2022-23. There is limited flexibility, for example, to address such a shortfall with increased taxes as the Province currently has one of the highest tax

The Financial Condition of the Province
Chapter 3, December 2018 Auditor General of Newfoundland and Labrador 34
burdens on a per capita basis in the country. Further, current borrowing levels are significant and any additional borrowings would further increase the debt expense burden which is currently forecast at 13.8% of total revenues.
The Province is forecasting deficits in each of the next four years, ranging from $243 million to $654 million, with a small surplus in year five.
Source: Department of Finance
Forecast revenue growth Over the five-year period 2018-19 to 2022-23, gross revenues are forecast to grow by 10.6%, or an average of 2.11% per year. The forecast indicates increases in all categories of own source revenues, including taxation revenues and offshore royalties. There are a number of risks associated with the revenue forecast:
The Province’s economic forecast is based on assumptions and future expectations and impacted by global and national economic environments, including trade relations, and so, like any forecast, is subject to considerable risk and change. Given that the economic forecast provides the basis for predicting taxation and other provincial revenues, this risk also extends to the Province’s revenue forecast.
The forecast of increased corporate tax revenues is subject to volatility as some of the largest
remitters are commodity-based and commodity prices and production are factors outside the Government’s control. Further, taxes paid by these companies in this Province are often based on inter-jurisdictional taxable income and thus is impacted by a company’s operating results in other jurisdictions. For example, expected increases in taxes in our Province from an offshore oil company could be reduced if the company incurs losses in other Canadian jurisdictions.
7.0
7.2
7.4
7.6
7.8
8.0
8.2
8.4
8.6
2019r 2020f 2021f 2022f 2023f
Revenue Expenses Revenue Adjusted for Oil Risk
$ B
illi
ons
FORECAST REVENUE AND EXPENSE

The Financial Condition of the Province
Auditor General of Newfoundland and Labrador Chapter 3, December 2018 35
-6%
-4%
-2%
0%
2%
4%
6%
2019r 2020f 2021f 2022f 2023f
Program Expense Growth Average Growth Rate CPI Forecast
The forecast at Budget 2018 included a provision for carbon tax revenues of $20 per tonne commencing 2019 and increasing to $50 per tonne by 2022-23. Subsequent to Budget 2018, Government announced that carbon tax rates will commence at $20 per tonne and will only increase based on Atlantic parity. To ensure regional competitiveness, the carbon tax rate will only increase on fuels beyond 2019 if carbon pricing in the other three Atlantic Provinces allows for such increases. This introduces risk that the Budget 2018 forecasted revenues from carbon tax may not materialize.
The forecasted increase in oil royalties is based on an assumption of increasing oil prices and oil production to 2022-23 - factors outside of the Province’s control. A stronger Canadian dollar than forecasted would also negatively impact oil royalties.
Forecast decline in program expenses The forecast expects an average decline in program expenses from 2018-19 to 2022-23 of $400 million - 5.6% or an average of 1.12% per year, which is less than the Province’s expected CPI growth over the same period. Therefore, the forecasted decline in program expenses would not allow for inflationary or other pressures. Source: Department of Finance
FORECAST PROGRAM EXPENSE GROWTH

The Financial Condition of the Province
Chapter 3, December 2018 Auditor General of Newfoundland and Labrador 36
The Province is challenged to afford the services that are currently being provided and there is continuing pressure for enhanced spending on existing services and for additional spending in new areas. One key pressure on expenditures stems from the Province’s rapidly aging population. This demographic challenge has cost implications on programs and services. Health care costs, in particular, increase with age, with significantly higher costs later in life. Almost 21% of the Province’s population is age 65 and older and this is expected to increase to 27% by 2028.
Source: National Health Expenditure Database, Canadian Institute for Health Information
Another key risk on constraining expenses pertains to overall costs of the Muskrat Falls project and how it will ultimately impact ratepayers and Government expenses. The Project is currently expected to cost $12.7 billion, including interest during construction/pre-funded financing costs of $2.6 billion. This represents an increase of $5.3 billion from the expected cost when it was sanctioned. As of September 30, 2018, Nalcor Energy and/or its subsidiaries had spent $9.9 billion related to the Project and had contractual commitments to spend a further $0.5 billion.
0
5
10
15
20
25
30
35
40
45
50
Expenditure per Capita - 2016 Expenditure per Capita - 2007
HEALTH CARE EXPENDITURES PER CAPITA BY AGE CATEGORY
$ T
hou
san
ds

The Financial Condition of the Province
Auditor General of Newfoundland and Labrador Chapter 3, December 2018 37
A portion of the Project has been financed through an issuance of bonds of $7.9 billion by Nalcor Energy project subsidiaries. The bonds are fully guaranteed by the Government of Canada. The Province has also provided a guarantee to the Government of Canada to compensate it for any costs under this Guarantee that are triggered by legislative or regulatory actions of the Province. The remaining cost of $4.8 billion is expected to be financed through equity contributions from the Province and Nalcor Energy, as well as Emera, which has a minority partnership interest in the Labrador-Island Link. The Province has also committed to fund all additional equity that may be required to cover any further cost overruns on each aspect of the Project. Any further cost overruns may require additional borrowings by the Province which will in turn increase the planned level of debt expenses. During 2012-13, the Lower Churchill Project Regulatory Regime was adopted by the Province. This regulatory regime allows costs, expenses or allowances related to the Project to be recovered in full from the ratepayers in the Province. Such expenditures were exempted from review by the Public Utilities Board. In 2018, Government announced that it is examining options to mitigate the impact of expected electricity rate increases resulting from Muskrat Falls. There has been no decision, however, on the specifics of mitigation measures. On September 5, 2018, Government requested the Public Utilities Board to examine options to mitigate impacts of the Muskrat Falls project with an interim report to be provided to Government by February 15, 2019 and a final report by January 31, 2020. Any mitigation measures implemented by Government to reduce electricity rates during 2020-2023, beyond the amounts included in the Budget 2018 forecast, may impact the Province’s forecasted surplus/deficit. Overall Risk to Forecast While there is a potential upside for economic performance to be stronger than forecast and opportunities for increased revenues, should the downside risks to the forecast materialize and result in significantly less revenues than expected or more expenses than expected, Government would be significantly challenged to address such a shortfall and remain on target to return to surplus. There is limited flexibility, for example, to address such a shortfall with increased taxes as the Province currently has one of the highest tax burdens on a per capita basis in the country. Further, current borrowing levels are significant and any additional borrowings would further increase the debt expense burden which is currently forecast at 13.8% of total revenues.

The Financial Condition of the Province
Chapter 3, December 2018 Auditor General of Newfoundland and Labrador 38

CHAPTER
4
UNDERSTANDING THE CONSOLIDATED
SUMMARY FINANCIAL STATEMENTS

Understanding the Consolidated Summary Financial Statements
Auditor General of Newfoundland and Labrador Chapter 4, December 2018 39
Understanding the Consolidated Summary Financial Statements While the annual Budget outlines Government’s fiscal forecast or plan for the year, the Consolidated Summary Financial Statements are the financial report card of the actual results for the fiscal year – from April 1 to March 31. Included with the financial statements, the Department of Finance provides a commentary - Understanding the Financial Health of the Province of Newfoundland and Labrador. This commentary is intended to provide readers of the financial statements with an overview of changes in Government’s financial position and highlight key figures and comparative information from previous years. This chapter provides an overview of the five financial statements that comprise the Consolidated Summary Financial Statements. These statements are each designed to provide separate important pieces of information that link together to present a complete and comprehensive picture of the Province’s financial position and its operations for the fiscal year. These five statements include: Consolidated Statement of Financial Position Consolidated Statement of Change in Net Debt Consolidated Statement of Operations Consolidated Statement of Change in Accumulated Deficit Consolidated Statement of Cash Flows
The statements also include Notes and Schedules that provide considerable additional detail and explanation around information contained in the financial statements. The notes are an integral part of the financial statements.
Consolidated Statement of Financial Position This statement provides a snapshot of the financial position of the Province at a point in time - the end of the fiscal year (e.g. March 31, 2018). Comparative figures are also shown for the same point in time for the previous year. This allows the reader to be able to make comparisons and consider trends related to financial results. Five main components make up the financial position of the Province at March 31, 2018:
Component Amount at March 31, 2018 (000s)
Financial Assets $ 7,858,667
Liabilities 22,532,383
Net Debt 14,673,716
Non-financial Assets 4,493,026
Accumulated Deficit $ 10,180,690

Understanding the Consolidated Summary Financial Statements
Chapter 4, December 2018 Auditor General of Newfoundland and Labrador 40
Cash and temporary investments$1,752,858
Receivables (net) $563,781
Inventories held for resale$4,531
(0.1%)
Loans, advances and investments (net)
$396,909
Equity in government business enterprises
and partnership$5,140,588
65.4%
22.3%
7.1%
5.1%
Financial Assets Financial assets are assets that can be used to discharge existing liabilities or finance future operations.
Total: $ 7,858,667
Equity in Government Business Enterprises (GBEs) and Government Business Partnership (GBP) reflects the net assets (assets less liabilities) of Nalcor Energy, the Newfoundland and Labrador Liquor Corporation, and Government’s 25% equity interest in the Atlantic Lottery Corporation, Inc. This equity is used by these entities to generate a profit each year, which accrues to the benefit of the Province. At March 31, 2018, equity in GBEs/GBP represents more than 65% of Province’s consolidated financial assets. The net equity of the GBEs/GBP of $5.1 billion is comprised of assets of $18.1 billion less liabilities of $13.0 billion.
FINANCIAL ASSETS: 2017-18 ($000s)

Understanding the Consolidated Summary Financial Statements
Auditor General of Newfoundland and Labrador Chapter 4, December 2018 41
Capital and Intangible Assets
$14,550,097
Cash and Temporary Investments$2,567,525
Receivables$411,246 (2.3%)
Investments$338,000 (1.9%)
Other$293,959 (1.6%)
GBE/GBP's ASSETS: 2017-18 ($000s)
80.1%
14.1%
Accounts Payable, Accruals and Other
$3,106,228
Borrowings$9,914,011
GBE/GBP's LIABILITIES: 2017-18 ($000s)
76.1%
23.9%
Total: $18,160,827
Total: $13,020,239

Understanding the Consolidated Summary Financial Statements
Chapter 4, December 2018 Auditor General of Newfoundland and Labrador 42
Payables, accrued and other liabilities
$2,968,467
Deferred revenue$168,5230.7%
Borrowings, net of sinking funds +
unamortized unrealized foreign exchange gains
(losses) and unamortized premiums
(discounts) and issuance fees.$11,505,532
Group health and life insurance retirement
benefits$2,937,396
Unfunded pension liability
$4,952,465
13.0%
13.2%
22.0%51.1%
Liabilities Liabilities represent amounts that are payable or will be required to be paid to third parties and include amounts payable in the normal course of operations, deferred revenue, amounts due to bond holders and other lenders that have provided money to finance the Province’s operations and amounts the Province is responsible for related to employee future benefit obligations.
Total: $ 22,532,383 Net Debt Net Debt represents the difference between liabilities and financial assets. This is one of the key measures that is used to evaluate the financial health of all senior governments in Canada.
The Province’s Net Debt at March 31, 2018, was $14.7 billion (2017 - $13.6 billion).
LIABILITIES: 2017-18 ($000s)

Understanding the Consolidated Summary Financial Statements
Auditor General of Newfoundland and Labrador Chapter 4, December 2018 43
Non-financial Assets Non-financial assets are assets consumed in the delivery of government services but not intended to reduce existing or future liabilities. The most significant non-financial assets are the Province’s investment in tangible capital assets, which comprise such things as land, buildings, roads, equipment, vehicles and other items that have a useful life extending beyond one year.
Non-financial assets of the Province at March 31, 2018, were $4.5 billion (2017 - $4.4 billion). This balance was comprised of tangible capital assets of $4.4 billion and prepaid expenses, deferred charges and inventories of $0.1 billion.
Accumulated Deficit This is the accumulated amount of deficits that the Province has incurred over time, less any surpluses.
The accumulated deficit at March 31, 2018, was $10.2 billion (2017 - $9.2 billion).
Consolidated Statement of Change in Net Debt This statement provides information on how Net Debt has changed from one year to the next. There are two main elements that impact Net Debt from year to year: 1. Surplus or deficit for the year - If the Province operates with a surplus for the year, this will
reduce Net Debt. Similarly, a deficit will increase Net Debt. 2. Changes in Tangible Capital Assets -The acquisition of tangible capital assets increases Net
Debt each year. This amount is adjusted for the net book value of any disposals of tangible capital assets during the year and by the amount of amortization which is already included in determining the surplus or deficit for the year.
Consolidated Statement of Operations This statement shows the consolidated results of the operations of the Government Reporting Entity for the year April 1, 2017 to March 31, 2018. These results are compared to the original estimates that were presented to the Legislature and approved as part of the budget process. The statement provides the amount of revenues that the Province generated during the year and is broken down by major categories.

Understanding the Consolidated Summary Financial Statements
Chapter 4, December 2018 Auditor General of Newfoundland and Labrador 44
Taxation$3,767,084
Investment$103,890 (1.4%)
Fees and fines$364,312
Offshore royalties$943,946
Miscellaneous$543,276
Government of Canada $1,184,240
Net income of government business
enterprises and partnership $373,397
51.7%
5.0%
13.0%
7.5%
16.3%
5.1%
Total: $7,280,145 The statement also provides information on the expenses incurred by the Province during the year by major functional area.
REVENUES BY SOURCE: 2017-18 ($000s)

Understanding the Consolidated Summary Financial Statements
Auditor General of Newfoundland and Labrador Chapter 4, December 2018 45
General Government Sector and
Legislative Branch$1,869,188
Resource Sector$1,506,129
Social Sector$4,815,578
58.8%
22.8%
18.4%
Total: $8,190,895 The difference between revenues and expenses for the year is the annual surplus or deficit. When revenues exceeds expenses, a surplus results and, conversely, when expenses exceeds revenues, a deficit is the result. The Province recorded a deficit of $0.9 billion for the year ended March 31, 2018 (2017 - $1.1 billion deficit).
Consolidated Statement of Change in Accumulated Deficit This statement provides the details of what comprises the change in accumulated deficit for the year. The main element impacting the accumulated deficit is the annual surplus or deficit.
Consolidated Statement of Cash Flows This statement provides useful information to the reader regarding how cash resources were generated during the year and how they were used. The four main categories that cash is provided from or applied to are: Operations Capital Transactions Financing Activities Investing Activities
EXPENSES BY MAJOR FUNCTIONAL AREA: 2017-18 ($000s)

Understanding the Consolidated Summary Financial Statements
Chapter 4, December 2018 Auditor General of Newfoundland and Labrador 46

CHAPTER
5
OTHER MATTERS

Other Matters
Auditor General of Newfoundland and Labrador Chapter 5, December 2018 47
Opportunities for Improvements Identified Audits of financial statements of the Province and other Government entities are directed primarily to expressing an opinion on the financial statements and are not designed to express an opinion as to whether the systems of controls established by management have been properly designed or have been operating effectively. However, each year during these audits, matters may come to the auditors’ attention for which the auditor identifies recommendations to improve internal controls, financial statement preparation or financial reporting.
Audit of the Consolidated Summary Financial Statements During the audit of the Consolidated Summary Financial Statements for the year ended March 31, 2018, our Office identified and communicated the following recommendations to Government: Control environment and internal controls Internal controls help to minimize operational, fraud, and financial reporting risks. Therefore, it is important to proactively assess risks and address issues that are identified to ensure internal controls are operating effectively. The Professional Services and Internal Audit (PSIA) Division of the Department of Finance has developed a methodology for assessing risk and has provided this methodology to departments for their use. Further, PSIA has been completing fraud risk assessments at government departments since 2014-15 and has completed further assessments during the 2017-18 fiscal year. These assessments have identified areas where there are greater risks of fraud occurring. Government should continue assessments of fraud risk and, where appropriate, implement controls to minimize this risk. Subsequent to year end, in June 2018, a Government wide Fraud Management Policy was implemented. Compliance with Canadian Public Sector Accounting Standards Government does not record a liability and expense for accumulating non-vesting sick leave benefits for employees in Government departments using actuarial valuations as required by Canadian Public Sector Accounting Standards. The liability and expense for these sick leave benefits is determined by using management’s best estimate of the probability of the employees utilizing these benefits. Estimation of taxation revenues The Province often has significant amounts owing from or to the Government of Canada related to underpayments or overpayments under the Tax Collection Agreement. These underpayments or overpayments are included with or recovered from future entitlements under the Agreement. The Government of Canada, with input from the Province and in accordance with the Agreement, provides revenue estimates to the Province for Corporate Income Tax, Personal Income Tax, and Harmonized Sales Tax. These estimates are revised in subsequent periods as information that is more accurate becomes available. The resulting adjustments are recorded as they become known in future periods.

Other Matters
Chapter 5, December 2018 Auditor General of Newfoundland and Labrador 48
A review of the methodology to estimate these revenues may provide opportunities to improve reliability of the estimates and reduce the likelihood of significant adjustments. Completeness of the Government Reporting Entity Ensuring the completeness of the Government Reporting Entity will provide users of the Public Accounts with the most comprehensive accounting of the Province’s financial position and the results of its operations. The Office of the Comptroller General is responsible for assessing whether entities should be included or excluded from the Government Reporting Entity. If an assessment determines that Government controls an entity, it will be included in the Government Reporting Entity. We have identified an entity that should be considered for inclusion in the Government Reporting Entity and have requested the Office of the Comptroller General to complete an assessment to determine whether control exists. Also, certain entities which are presently included in the Government Reporting Entity indicate they should not be included as they do not consider themselves to be controlled, either directly or indirectly, by Government. The Office of the Comptroller General has commenced a comprehensive review of entities both included and excluded from the Government Reporting Entity to ensure accuracy and completeness of the Government Reporting Entity. We encourage the Office of the Comptroller General to continue with this comprehensive review. Preparation of the Public Accounts It is important to use complete and accurate information to prepare the Public Accounts to reduce the risk of error and improve the timeliness of completing the Public Accounts. We noted instances where the Office of the Comptroller General received incomplete or inaccurate information from departments and Crown corporations for use in preparing the Public Accounts. The comparison of actual and budgeted financial results provides key accountability information about the Government's performance in achieving its operational goals. We noted instances where budget information that was included in the Public Accounts was prepared on a basis that was inconsistent with the presentation and classification in the Public Accounts. As a result, in these instances, it may be difficult to compare actual results to planned results.
Audit of Financial Statements of Crown entities The Consolidated Summary Financial Statements include the financial activities of Government departments and the Legislature (Consolidated Revenue Fund) as well as 43 other Crown entities. A listing of these entities is included in Appendix I. In addition to the audit of the Consolidated Revenue Fund, our Office audits the financial statements of 16 of these 43 Crown entities as well as the Province of Newfoundland and Labrador Pooled Pension Fund and the Newfoundland and Labrador Government Sinking Fund. Private sector auditors perform audits of the financial statements for 24 of the 43 Crown entities (outlined in Appendix I). Audits of three Crown entities were not completed during 2017-18 as the entities were not material to the Government Reporting Entity, inactive or had ceased operations during the year.

Other Matters
Auditor General of Newfoundland and Labrador Chapter 5, December 2018 49
Section 14 of the Auditor General Act requires private sector auditors to provide our Office with access to all working papers, reports, schedules and other documents related to their audit of a Crown entity. Also, as the group auditor of the Consolidated Summary Financial Statements, we request certain information from private sector auditors and will review their audit documentation if a Crown entity is considered significant. We reviewed management letters and other communications that the private sector auditors issued to these entities to identify issues which may be of interest to the House of Assembly. The following is a summary of the issues communicated to the entities during the current year from our Office and from private sector auditors.
Number of issues Number of entities
audited by the Office of the Auditor General
Number of entities audited by private
sector auditors No issues 8 14
1 to 4 issues 8 8
5 or more issues 2 2
Total 18 24
We have summarized the issues noted by the following categories: internal controls, maintenance of accounting records, financial statement preparation, and other.
Issue
Number of entities audited by the Office of
the Auditor General where the issue was
identified
Number of entities audited by private sector
auditors where the issue was
identified Internal controls 6 6
Maintenance of accounting records 4 6
Financial statement preparation 3 2
Other 5 5
Internal controls Issues that were identified related to internal controls included:
absence of an audit committee; absence of a formal risk assessment process; bank reconciliations not approved or not approved on a timely basis; absence of an internal audit function; and deficiencies related to controls over purchasing. Internal controls help to minimize operational, fraud, and financial reporting risks. Therefore, it is important to address issues that are identified with internal controls.

Other Matters
Chapter 5, December 2018 Auditor General of Newfoundland and Labrador 50
Maintenance of accounting records Issues that were identified related to the maintenance of accounting records included: accounts not being reconciled on a timely basis; employee leave records not being properly maintained; the need for an entity to use a system to account for its tangible capital assets; Harmonized Sales Tax not being charged on rentals; and Holdback account not being reviewed on a timely basis.
It is necessary for entities to maintain their accounting records accurately and in a timely manner to promptly identify and address transactions that are potentially incorrect or inappropriate. Financial statement preparation Issues that were identified related to financial statement preparation included: inappropriate application of accounting policies; need to develop accounting policies related to tangible capital assets; and need to develop accounting policies related to the write off of accounts receivable. Accounting policies should be developed and applied appropriately to ensure consistent accounting for transactions and to provide users of the entity’s financial statements with financial information that is comparable with other entities in the Public Sector. Other Other issues identified included: non-compliance with direction from the Lieutenant-Governor in Council; allowing employees to carry forward annual leave in excess of provisions of the collective
agreement; operating under the terms of an expired contract; use of outdated pay scales; overpayment of rent for office space; non-compliance with the Public Tender Act; use of incorrect shift premiums; and use of expired or outdated employment contracts. Crown entities should comply with legislation, direction from Government, and collective agreements. Crown entities should also ensure that they maintain current contracts with their employees and suppliers. The absence of current contracts that clearly and comprehensively define the risks and obligations of each party may increase financial and performance risk for the entities.

Other Matters
Auditor General of Newfoundland and Labrador Chapter 5, December 2018 51
Monitoring Nalcor’s Status as a Government Business Enterprise Under Canadian Public Sector Accounting Standards, Nalcor is considered a Government Business Enterprise (GBE). A GBE is a crown corporation whose operations are commercial in nature and self-sustaining. The debt of GBEs is fully supported by its customers – in the case of the electrical generation and distribution business of Nalcor, the ratepayers. Because of the self-sustaining nature of GBEs, they are considered investments and therefore, under Canadian Public Sector Accounting Standards, their assets and liabilities are not combined with the assets and liabilities of other government entities. Rather, the net of the GBEs assets less liabilities is recorded in one line as “equity in GBE” on the Province’s Consolidated Statement of Financial Position. In essence, the debt of a GBE is not explicitly shown on the Province’s Consolidated Statement of Financial Position as the debt is offset by the asset which generates the revenue to support the debt. Each year, Government must assess the value of assets owned by the Crown, directly or through Crown corporations, regardless of whether they are a GBE or otherwise, to ensure there is no impairment in value. In simple terms, an asset of a GBE would be considered impaired if expected future revenues are less than the cost of the asset. If that were the case, the value of the asset would be reduced, resulting in an increase in the Provincial deficit and Net Debt. The existing Muskrat Falls business, regulatory and financing structure ensures costs, expenses or allowances related to the Project will be recovered, in full, from ratepayers in the Province. Because this structure ensures there will be sufficient revenue generated from ratepayers over the life of the project to cover the capital and operating costs of Muskrat Falls, it is unlikely that the Muskrat Falls assets would be considered impaired in value on the financial statements of Nalcor. However, Government has indicated that it is examining options to mitigate the impact of expected electricity rate increases resulting from Muskrat Falls. There has been no decision on the specifics of mitigation measures. On September 5, 2018, Government requested the Public Utilities Board to examine options to mitigate impacts of the Muskrat Falls project with an interim report to be provided to Government by February 15, 2019 and a final report by January 31, 2020. The impact of any Government measures to effectively reduce electricity rates will have to be evaluated to determine whether the substance of these measures have any potential impact on the Consolidated Summary Financial Statements of the Province. Our Office will continue to monitor this matter.
Timing of Release of Consolidated Summary Financial Statements In order for financial statement information to be useful to users, it should possess four principle characteristics - understandability, relevance, reliability and comparability. One of the ways relevance is achieved is by ensuring the information is received by users and decision makers in a timely manner. The usefulness of information for decision making declines as time elapses.

Other Matters
Chapter 5, December 2018 Auditor General of Newfoundland and Labrador 52
Since 2013, the Office of the Auditor General (OAG) and the Office of the Controller General (OCG) have made considerable progress in concluding the audit of the Public Accounts earlier. With the exception of 2015, where timing was influenced by the general election, the Consolidated Summary Financial Statements have been available approximately six months after the year end.
Year End Audit Report Date Number of Days After
Year-end March 31, 2013 December 30, 2013 274
March 31, 2014 October 10, 2014 193
March 31, 2015 January 4, 2016 296 March 31, 2016 October 14, 2016 197 March 31, 2017 September 29, 2017 182 March 31, 2018 October 4, 2018 187
Source: Public Accounts
While there has been progress, there is still room for improvement. A review of other jurisdictions in Canada indicates a range of audit report dates.
Jurisdiction Audit Report Date
March 31, 2018 March 31, 2017
Newfoundland and Labrador October 4, 2018 September 29, 2017
Nova Scotia July 19, 2018 July 20, 2017
Prince Edward Island October 25, 2018 October 24, 2017
New Brunswick August 13, 2018 August 22, 2017 Quebec September 28, 2018
and November 22, 2018 September 29, 2017
Ontario September 12, 2018 August 18, 2017 Manitoba September 21, 2018 September 5, 2017 Saskatchewan June 29, 2018 June 15, 2017 Alberta June 19, 2018 June 29, 2017 British Columbia August 22, 2018 August 22, 2017 Canada September 12, 2018 September 6, 2017
Source: Public Accounts – all provinces and Canada
In 2017, the Financial Administration Act (the Act) was amended to require that the Public Accounts be tabled before November 1 of the following fiscal year. The previous date was February 1. The Act was further amended to require that, in the year of a general election, the Public Accounts to be tabled no less than 15 days prior to the fixed election date, generally the 2nd Tuesday in October every four years. This would require the Public Accounts to be tabled in mid-September in the year of an election.

Other Matters
Auditor General of Newfoundland and Labrador Chapter 5, December 2018 53
Both the OCG and the OAG are actively looking for opportunities to reduce the time required to prepare and audit the Public Accounts. Given that the earliest audit report date has been September 29, 2017, ensuring the legislated tabling requirements are met in an election year will require further improvements by both the OAG and the OCG. One impediment to an earlier release date is the current provision in the Act, which requires that the books of the Province remain open for up to one month after the year end to facilitate processing certain transactions which relate to the previous year. This essentially means that the Province is one month late in starting to prepare the year-end financial statements, which has a corresponding impact on the timing of audit work. This provision in the Act is a throwback to the days when the Province used a cash basis of accounting. The Province moved to full accrual accounting in the 1990s and the interplay between the Estimates process and accounting has not been brought up to date. Newfoundland and Labrador is the only province that follows this practice - which is unnecessary and an impediment to more timely release of the Public Accounts. The Province should strongly consider amendments to the Act to reflect modern accounting and controllership practices.
Reports Issued Pursuant to Section 15(1) of the Auditor General Act Section 15(1) of the Auditor General Act (the Act) requires the Auditor General to report to the Lieutenant-Governor in Council instances the Auditor General becomes aware of during the course of an audit which may involve improper retention or misappropriation of public money or another activity that may constitute an offence under the Criminal Code or another Act. Section 31 of the Act requires the report be made through the Minister of Finance. In addition, Section 15(2) of the Act requires that I attach to my annual report a list containing a general description of the incidents and the date reported to the Lieutenant-Governor in Council. During the audit of the Public Accounts for the year ended March 31, 2018, my Office became aware of matters addressed under Section 15(1) of the Act. I reported the following matters to the Minister of Finance on December 3, 2018: The Professional Services and Internal Audit (PSIA) Division of the Department of Finance
informed my Office of the following matters:
In February 2018, the PSIA Division was requested to perform a review of leave records for an employee of the Department of Finance. The Department of Finance also reported this matter to my Office. The Department informed my Office that the review, which was performed with the assistance of the Human Resource Secretariat (HRS), identified that an employee had an overlap of employment between the Department and another Government entity. Disciplinary action was taken.

Other Matters
Chapter 5, December 2018 Auditor General of Newfoundland and Labrador 54
In April 2018, the PSIA Division completed a review of tire purchases for one of the regions of the Department of Transportation and Works. The review highlighted several unusual tire purchases and a significant risk of fraudulent activity due to lack of proper controls. It was also noted that purchases were being made from petty cash to a business that appeared to be not at arm’s length with the petty cash custodian. The Department informed my Office that this matter was not referred to the police.
In June 2018, the HRS reported an instance whereby a Government employee appears to
have attempted to submit a fraudulent claim to the Group Insurance Plan. It further appears that the employee colluded with a vendor on this incident. A police investigation is ongoing.
The Department of Children, Seniors and Social Development informed my Office that throughout the 2017-18 year there were five instances of suspected fraud related to the use of corporate travel cards for non-business related purchases. In these cases, the HRS imposed applicable disciplinary actions. The Province has been fully reimbursed in one instance and has collection activity in progress in the remaining four instances.
Service NL informed my Office that in March 2018 an allegation of fraud was reported in the
Motor Registration Division. An employee is alleged to have requested a co-worker to alter the driving record of a family member. Service NL reported the incident to the HRS to investigate. As a result of the HRS investigation, the two employees were terminated. This incident was referred to the police. The incident was also reported to the Office of the Information and Privacy Commissioner as it also constituted a privacy breach.
The Department of Transportation and Works informed my Office of the following matters:
The Department received an anonymous tip regarding the theft of salt and sand at a depot.
The Department is also aware of a shortage in the salt and sand inventory at another depot in the same region that appears to be related to the above noted shortage. These instances have been referred to the police for investigation.
The Department received an anonymous complaint regarding the theft of salt and sand
inventory held at a depot in another region. The Department investigated the complaint. The HRS was also informed of this investigation. It was determined that the allegations were unsubstantiated and the matter was not referred to the police.
The Department received an anonymous letter indicating an employee was engaged in fraudulent activity. The Department investigated and determined that there was no validity to the allegation.
Other Matters
Auditor General of Newfoundland and Labrador Chapter 5, December 2018 55
Three employees used their Government supplied travel card to purchase personal items, which is a violation of the Travel Card Agreement. Also, the three employees did not pay the outstanding balances on their travel cards promptly after they were reimbursed for work related costs incurred on the card. The three employees have had their travel cards cancelled and they are no longer entitled to a travel card. Two employees received suspensions while the third individual is not currently a Government employee.
An employee was terminated for forging physician sick note(s) to alter their
payroll/employment record.
An employee was terminated for allegedly stealing money from various Government cubicles/offices. An investigation was conducted by the police and charges were laid. The matter is still before the Courts.
An employee was accused of theft. The police investigated the matter but was unable to
obtain sufficient evidence to pursue the matter further.
An employee of the Department accused a co-worker of reselling commuter tickets for a provincial ferry service. An investigation was completed by the HRS and the Department and it was determined that there was no evidence to support the allegation. Later in the year, another case of an employee reselling commuter tickets was reported by a co-worker. This later case is under investigation by HRS and the Department.
The Department of Natural Resources informed my Office that in June 2017 a theft of an
employee’s personal property had occurred by a third-party contractor hired to provide cleaning services. It was also determined that petty cash issued to another employee in the same vicinity was missing. The services of the third-party contractor were terminated. The matter was referred to the police for investigation.
As part of the audit of the Public Accounts for the year ended March 31, 2018, my Office reviewed the audit working papers of significant Crown entities for which I am not the auditor. As a result of this review, my Office became aware of an instance of possible fraud at a Crown entity. During the 2017-18 audit, the auditor of this entity was informed that approximately $600-$700 in cash had gone missing during the year. The entity has taken action to address this matter. Throughout the past year, the Department of Advanced Education, Skills and Labour (AESL) informed my Office of the following instances of possible fraud:
An Income Support client is alleged to have cashed three cheques twice by initially depositing the cheques electronically and subsequently cashing the physical cheques. The Department of Finance identified this potential fraud, informed the bank, and was able to recover the funds. AESL informed my Office that it did not report this matter to the police. Instead, AESL indicated that it has taken steps to prevent this client from further attempts of this nature. I reported this matter to the Minister of Finance on December 19, 2017.

Other Matters
Chapter 5, December 2018 Auditor General of Newfoundland and Labrador 56
An Income Support client is alleged to have altered a cheque for a higher amount. This individual then cashed the altered cheque. The Office of the Comptroller General detected the altered cheque, immediately stopped payment on the altered cheque, and there was no financial loss to Government. This matter was reported to the police. I reported this matter to the Minister of Finance on March 20, 2018.
An Income Support client is alleged to have altered two separate cheques for a higher amount. The Office of the Comptroller General detected the altered cheques, immediately stopped payment on the altered cheques, and there was no financial loss to Government. This matter has been reported to the police. I reported this matter to the Minister of Finance on May 16, 2018.
Two different Income Support clients are alleged to have deposited cheques using mobile banking applications and subsequently deposited the cheques a second time. The Office of the Comptroller General detected both instances of duplicate cheques being deposited and issued a stop payment on the cheques. As a result, there was no financial loss to Government. Both instances have been reported to the police for investigation. I reported this matter to the Minister of Finance on July 16, 2018.
During our audits of the financial statements of the Support Enforcement Division of the Department of Justice and Public Safety (Support Enforcement), my Office became aware of the following instances of possible fraud:
During January, March and April 2017, three cheques which were potentially fraudulent cleared Support Enforcement’s bank. Officials at Support Enforcement became aware of the three transactions and contacted its bank, which confirmed the possible fraud. It was determined that the three cheques, which were payable to three different payees, were either deposited twice using mobile cheque technology or deposited using mobile cheque technology and also deposited at a bank branch. The bank reimbursed Support Enforcement. My Office reported this matter to the Minister of Finance on October 31, 2017.
During its bank reconciliation procedures for November 2017, Support Enforcement
discovered an instance of possible fraud. It was discovered that a cheque was initially deposited using mobile cheque technology and subsequently deposited at the bank branch. The bank reimbursed Support Enforcement. Support Enforcement informed my Office of this matter and I reported it to the Minister of Finance on December 19, 2017.
Two cheques previously issued in March and December 2017 cleared the bank a second time
in February 2018. Support Enforcement officials contacted their bank to confirm the possible fraud. It was discovered that the cheques were initially deposited using mobile cheque technology and subsequently deposited at a bank branch. The bank reimbursed Support Enforcement. I reported this matter to the Minister of Finance on November 23, 2018.

APPENDIX
I
GOVERNMENT REPORTING ENTITY

Appendix I: Government Reporting Entity
Auditor General of Newfoundland and Labrador Appendix I, December 2018 57
Government Reporting Entity The Government Reporting Entity includes Government departments and the Legislature (known as the Consolidated Revenue Fund) and all other Government entities that are controlled by Government and are accountable to either a Minister of a Government Department or directly to the Legislature for the administration of their financial affairs and resources. Control is defined as the power to govern the financial and operating policies of another organization with expected benefits or the risk of loss to the government from the other organization's activities.
In addition to Government departments and the Legislature, the Government Reporting Entity includes 43 other Government entities. The financial statements of these entities are audited by either the Office of the Auditor General or a private sector auditor.
Audited by the Office of the Auditor General Audited by a Private Sector Auditor
Business Investment Corporation Atlantic Lottery Corporation Inc.
C.A Pippy Park Commission Board of Commissioners of Public Utilities
Consolidated Revenue Fund Central Regional Health Authority
Heritage Foundation of Newfoundland and Labrador
Chicken Farmers of Newfoundland and Labrador
Livestock Owners Compensation Board College of the North Atlantic
Newfoundland and Labrador Arts Council Conseil scolaire francophone provincial de Terre-Neuve et Labrador
Newfoundland and Labrador Crop Insurance Agency
Credit Union Deposit Guarantee Corporation
Newfoundland and Labrador Housing Corporation
Dairy Farmers of Newfoundland and Labrador
Newfoundland and Labrador Immigrant Investor Fund Limited
Eastern Regional Health Authority
Newfoundland and Labrador Industrial Development Corporation
Egg Farmers of Newfoundland and Labrador
Newfoundland and Labrador Legal Aid Commission
Labrador-Grenfell Regional Health Authority
Consolidated Summary Financial Statements: March 31, 2018
Consolidated Revenue Fund
(16 Departments and Legislature)
4 Regional Health
Authorities
2 School Districts
37 Crown Agencies

Appendix I: Government Reporting Entity
Appendix I, December 2018 Auditor General of Newfoundland and Labrador 58
Audited by the Office of the Auditor General Audited by a Private Sector Auditor
Newfoundland and Labrador Municipal Financing Corporation
Marble Mountain Development Corporation
Provincial Advisory Council on the Status of Women - Newfoundland and Labrador
Memorial University of Newfoundland
Provincial Information and Library Resources Board
Multi-Materials Stewardship Board
Research & Development Corporation of Newfoundland and Labrador
Municipal Assessment Agency Inc.
Student Loan Corporation of Newfoundland and Labrador
Nalcor Energy
The Rooms Corporation of Newfoundland and Labrador
Newfoundland and Labrador 911 Bureau Inc.
Newfoundland and Labrador Centre for Health Information Newfoundland and Labrador English School District Newfoundland and Labrador Film Development Corporation Newfoundland and Labrador Liquor Corporation
Newfoundland and Labrador Sports Centre Inc.
Newfoundland Hardwoods Limited
Western Regional Health Authority
Unaudited
Churchill Falls (Labrador) Corporation Trust 1
Newfoundland Ocean Enterprises Limited 2
No Financial Statements Prepared Newfoundland and Labrador Farm Products Corporation 3
1 - No audit completed as not considered material. 2 - No audit completed as the entity ceased operations during the year. 3 - No audit completed as the entity is inactive.