Embed Size (px)
Citation preview
INTERNATIONAL REVIEW OF COST RECOVERY ISSUES
OFFICE OF GAS AND ELECTRICITY MARKETS
FINAL REPORT
February 2017
Prepared by:
Cambridge Economic Policy Associates Ltd
and
TNEI Services Ltd

CONTENTS
1. Introduction .............................................................................................................. 1
1.1. Terms of reference ...................................................................................................... 1
1.2. International case studies ........................................................................................... 1
1.3. Document structure .................................................................................................... 1
2. Summary of findings .................................................................................................. 2
3. United States of America ......................................................................................... 11
3.1. The problem .............................................................................................................. 11
3.2. Changes introduced .................................................................................................. 12
3.3. The impact ................................................................................................................. 12
3.4. Two specific USA State case-studies ......................................................................... 12
3.5. Lessons for GB ........................................................................................................... 17
4. Victoria - Australia ................................................................................................... 19
4.1. The problem .............................................................................................................. 19
4.2. Changes introduced .................................................................................................. 23
4.3. The impact ................................................................................................................. 25
4.4. Lessons for GB ........................................................................................................... 26
5. The Netherlands ...................................................................................................... 27
5.1. The problem .............................................................................................................. 27
5.2. Changes introduced .................................................................................................. 27
5.3. The impact ................................................................................................................. 29
5.4. Lessons for GB ........................................................................................................... 30
6. Spain ....................................................................................................................... 31
6.1. The problem .............................................................................................................. 31
6.2. Changes introduced .................................................................................................. 32
6.3. Impact ........................................................................................................................ 35
6.4. Lessons for GB ........................................................................................................... 36
7. Italy ......................................................................................................................... 38
7.1. The problem .............................................................................................................. 38
7.2. Changes introduced .................................................................................................. 38
7.3. Impact ........................................................................................................................ 40
7.4. Lessons for GB ........................................................................................................... 41

IMPORTANT NOTICE
This report has been commissioned by Ofgem. However, the views expressed are those of
CEPA and TNEI alone. CEPA and TNEI accept no liability for use of this report or any
information contained therein by any third party.
© All rights reserved by Cambridge Economic Policy Associates Ltd.

1
1. INTRODUCTION
As part of Ofgem’s July 2016 open letter on Charging Arrangements for Embedded Generators
and the more recent joint call for evidence with the Department for Business, Energy &
Industrial Strategy (BEIS) on a smart and flexible energy system, Ofgem has committed to a
targeted review of certain issues related to electricity network charging.1
One of the two issues considered in the Targeted Charging Review will be the allocation of
sunk/fixed costs within the network charging methodologies and their implications for
storage and ‘behind the meter’ generation. An expected output is a set of principles for how
cost-recovery charges should be structured, with the principles ideally compatible with future
charging regimes that may emerge in Great Britain (GB).
1.1. Terms of reference
Ofgem has commissioned CEPA and TNEI to provide a review of how different approaches to
addressing the issues of ‘behind the meter’ and cost recovery have manifested and been
addressed in practice in different jurisdictions. The objective of the work is to highlight
possible implications and lessons that could be learned for the GB market in taking forward
its Targeted Charging Review on sunk/fixed cost allocation issues.
1.2. International case studies
Following a short-listing process, we undertook research into the following international case
studies:
United States of America (USA);
Victoria, Australia;
Netherlands;
Spain; and
Italy.
1.3. Document structure
The rest of this report is structured as follows:
Section 2 provides a summary of findings from the international review and some of
the possible implications for GB.
Sections 3 – 7 present the detailed individual country case studies and the findings for
each.
1 Ofgem (2016): ‘Update on charging arrangements for Embedded Generation’
2
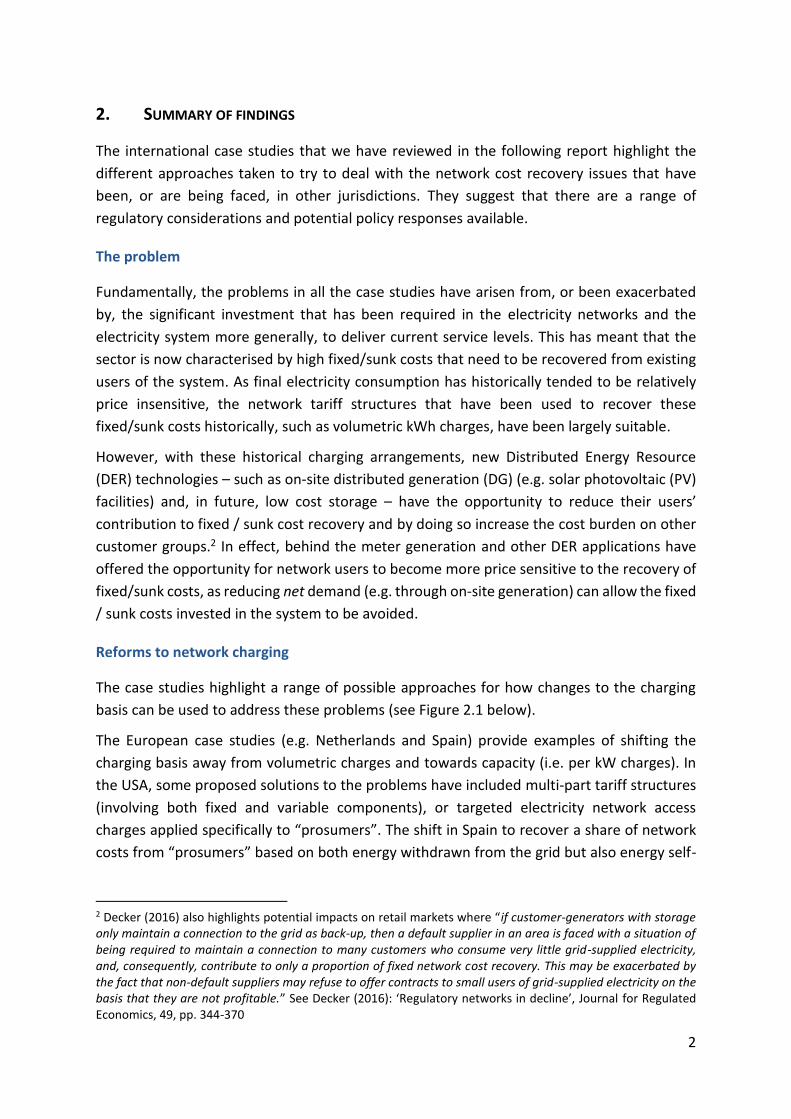
2. SUMMARY OF FINDINGS
The international case studies that we have reviewed in the following report highlight the
different approaches taken to try to deal with the network cost recovery issues that have
been, or are being faced, in other jurisdictions. They suggest that there are a range of
regulatory considerations and potential policy responses available.
The problem
Fundamentally, the problems in all the case studies have arisen from, or been exacerbated
by, the significant investment that has been required in the electricity networks and the
electricity system more generally, to deliver current service levels. This has meant that the
sector is now characterised by high fixed/sunk costs that need to be recovered from existing
users of the system. As final electricity consumption has historically tended to be relatively
price insensitive, the network tariff structures that have been used to recover these
fixed/sunk costs historically, such as volumetric kWh charges, have been largely suitable.
However, with these historical charging arrangements, new Distributed Energy Resource
(DER) technologies – such as on-site distributed generation (DG) (e.g. solar photovoltaic (PV)
facilities) and, in future, low cost storage – have the opportunity to reduce their users’
contribution to fixed / sunk cost recovery and by doing so increase the cost burden on other
customer groups.2 In effect, behind the meter generation and other DER applications have
offered the opportunity for network users to become more price sensitive to the recovery of
fixed/sunk costs, as reducing net demand (e.g. through on-site generation) can allow the fixed
/ sunk costs invested in the system to be avoided.
Reforms to network charging
The case studies highlight a range of possible approaches for how changes to the charging
basis can be used to address these problems (see Figure 2.1 below).
The European case studies (e.g. Netherlands and Spain) provide examples of shifting the
charging basis away from volumetric charges and towards capacity (i.e. per kW charges). In
the USA, some proposed solutions to the problems have included multi-part tariff structures
(involving both fixed and variable components), or targeted electricity network access
charges applied specifically to “prosumers”. The shift in Spain to recover a share of network
costs from “prosumers” based on both energy withdrawn from the grid but also energy self-
2 Decker (2016) also highlights potential impacts on retail markets where “if customer-generators with storage only maintain a connection to the grid as back-up, then a default supplier in an area is faced with a situation of being required to maintain a connection to many customers who consume very little grid-supplied electricity, and, consequently, contribute to only a proportion of fixed network cost recovery. This may be exacerbated by the fact that non-default suppliers may refuse to offer contracts to small users of grid-supplied electricity on the basis that they are not profitable.” See Decker (2016): ‘Regulatory networks in decline’, Journal for Regulated Economics, 49, pp. 344-370

3
consumed, highlights the possibility of addressing cost recovery problems by shifting the
charging basis to gross rather than net consumption.
Figure 2.1: Potential measures to reform the charging basis
Source: CEPA & TNEI
Note: these options are not necessarily mutually exclusive and could be used in combination
Common themes and challenges
While the different options presented above can have a clear supporting rationale in public /
welfare economic theory and principles, they can in themselves also lead to major impacts on
different stakeholder groups if their adoption requires a shift from the existing network
charging basis (e.g. volumetric, kWh, charges). Reforms in some countries have been
considered highly controversial by certain stakeholders, particularly those whose business
models have faced potential negative effects.
The case-studies also illustrate how reducing the sunk/fixed cost avoidance benefits from the
uptake of DERs is likely to create a starker focus on how the net-benefits that DERs can
contribute to the system (from the perspective of future rather than sunk costs and
investments) should be valued and reflected in the network tariff structure.3 The USA and
Australian (Victoria) case studies provide examples of this.
All the international case studies highlight the importance of the regulator carefully managing
the trade-offs between more efficient pricing structures and their distributional impacts.
Another clear theme is the importance of developing potentially challenging transition
processes to reform the existing charging basis to minimise distortions or windfall effects.
Some of the case studies presented below suggest some success in mitigating consumer harm
or opposition to reform through carefully designed transitional arrangements, though not
without some coordinated effort and cost (e.g. the Netherlands). Others have initially avoided
transitional arrangements such as grandfathering, only to revise (or continue to be in the
process of revising) arrangements at a later date.
3 Of course, GB is already relatively advanced in this area compared to many other countries given that ‘cost reflective’ charging structures are a core part of the existing regulatory system.

4
Finally, distribution effects are almost inevitable with changes in the charging basis and care
needs to be taken to ensure that any changes are not unduly discriminatory against particular
customer groups. Some of the case studies demonstrate consideration of the impacts on
vulnerable customers and how these can be mitigated, perhaps through revisions to wider
regulation or policy.
Summary of changes to network charging arrangements and their impact by case study
Table 2.1 provides a summary of each of the case-studies, the general conclusions and key
issues that have been observed in the charging reform programme in question. Subsequent
sections of the report review each of the case studies in more detail.
5
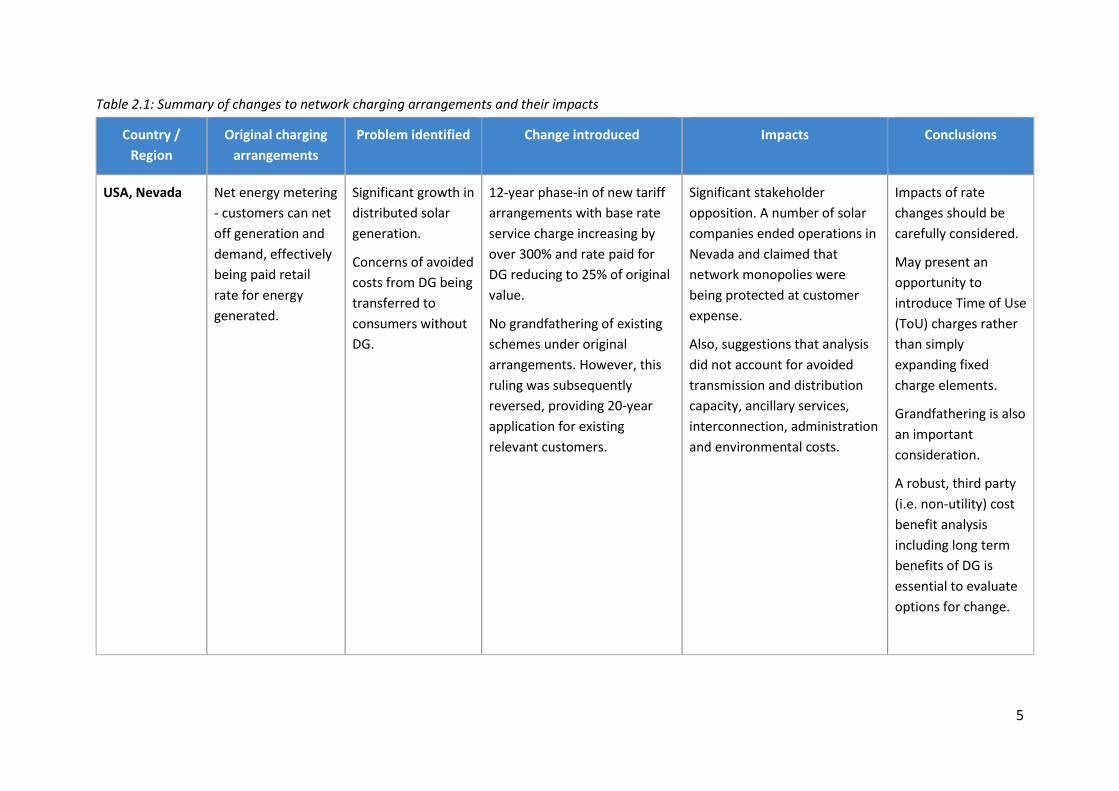
Table 2.1: Summary of changes to network charging arrangements and their impacts
Country /
Region
Original charging
arrangements
Problem identified Change introduced Impacts Conclusions
USA, Nevada Net energy metering
- customers can net
off generation and
demand, effectively
being paid retail
rate for energy
generated.
Significant growth in
distributed solar
generation.
Concerns of avoided
costs from DG being
transferred to
consumers without
DG.
12-year phase-in of new tariff
arrangements with base rate
service charge increasing by
over 300% and rate paid for
DG reducing to 25% of original
value.
No grandfathering of existing
schemes under original
arrangements. However, this
ruling was subsequently
reversed, providing 20-year
application for existing
relevant customers.
Significant stakeholder
opposition. A number of solar
companies ended operations in
Nevada and claimed that
network monopolies were
being protected at customer
expense.
Also, suggestions that analysis
did not account for avoided
transmission and distribution
capacity, ancillary services,
interconnection, administration
and environmental costs.
Impacts of rate
changes should be
carefully considered.
May present an
opportunity to
introduce Time of Use
(ToU) charges rather
than simply
expanding fixed
charge elements.
Grandfathering is also
an important
consideration.
A robust, third party
(i.e. non-utility) cost
benefit analysis
including long term
benefits of DG is
essential to evaluate
options for change.
6
Country /
Region
Original charging
arrangements
Problem identified Change introduced Impacts Conclusions
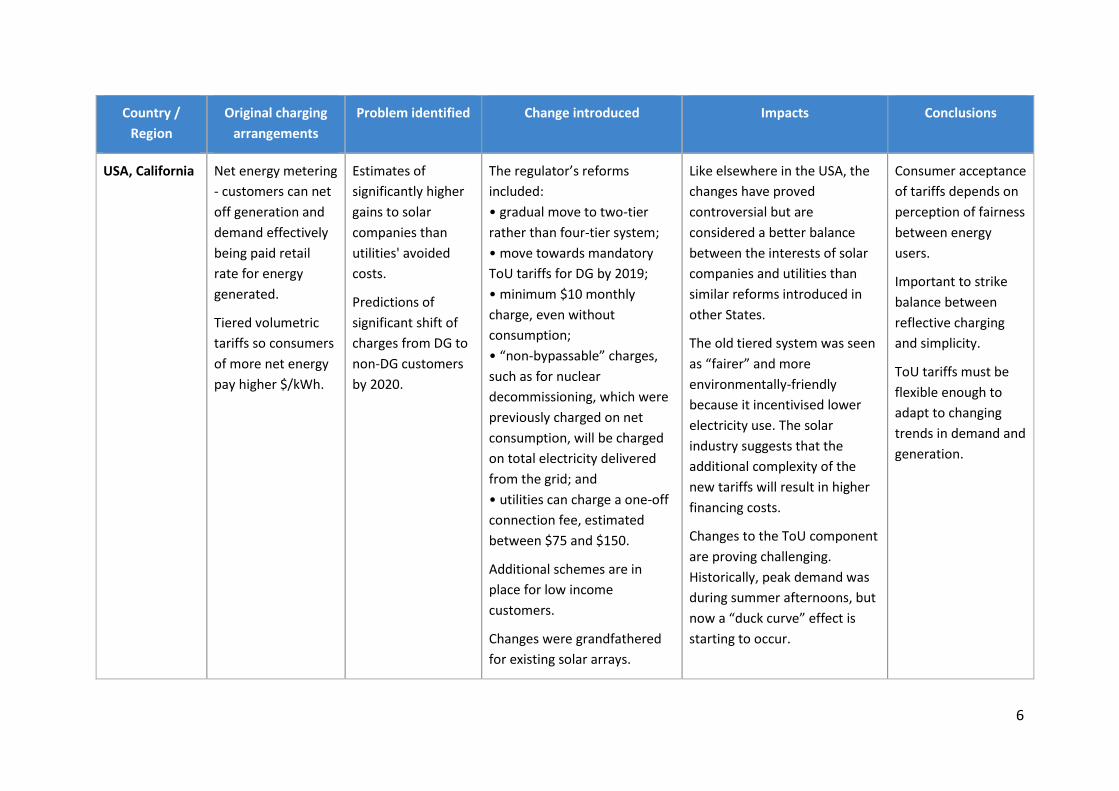
USA, California Net energy metering
- customers can net
off generation and
demand effectively
being paid retail
rate for energy
generated.
Tiered volumetric
tariffs so consumers
of more net energy
pay higher $/kWh.
Estimates of
significantly higher
gains to solar
companies than
utilities' avoided
costs.
Predictions of
significant shift of
charges from DG to
non-DG customers
by 2020.
The regulator’s reforms
included:
• gradual move to two-tier
rather than four-tier system;
• move towards mandatory
ToU tariffs for DG by 2019;
• minimum $10 monthly
charge, even without
consumption;
• “non-bypassable” charges,
such as for nuclear
decommissioning, which were
previously charged on net
consumption, will be charged
on total electricity delivered
from the grid; and
• utilities can charge a one-off
connection fee, estimated
between $75 and $150.
Additional schemes are in
place for low income
customers.
Changes were grandfathered
for existing solar arrays.
Like elsewhere in the USA, the
changes have proved
controversial but are
considered a better balance
between the interests of solar
companies and utilities than
similar reforms introduced in
other States.
The old tiered system was seen
as “fairer” and more
environmentally-friendly
because it incentivised lower
electricity use. The solar
industry suggests that the
additional complexity of the
new tariffs will result in higher
financing costs.
Changes to the ToU component
are proving challenging.
Historically, peak demand was
during summer afternoons, but
now a “duck curve” effect is
starting to occur.
Consumer acceptance
of tariffs depends on
perception of fairness
between energy
users.
Important to strike
balance between
reflective charging
and simplicity.
ToU tariffs must be
flexible enough to
adapt to changing
trends in demand and
generation.
7
Country /
Region
Original charging
arrangements
Problem identified Change introduced Impacts Conclusions
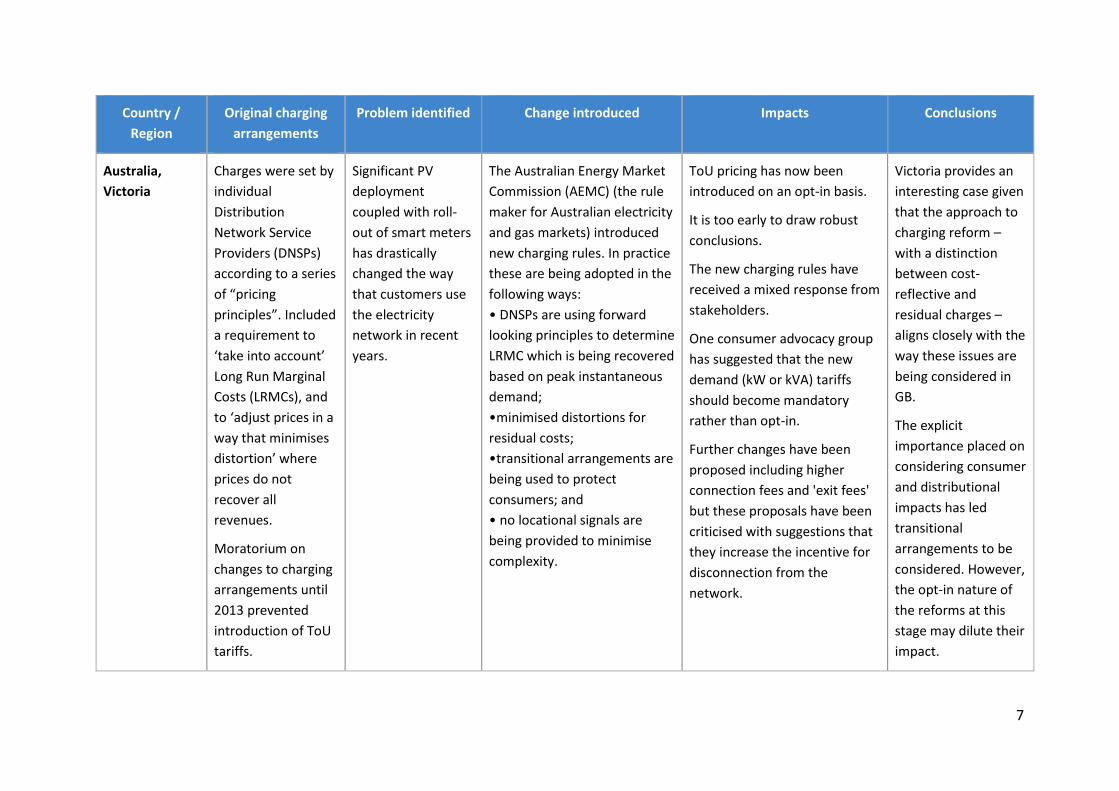
Australia,
Victoria
Charges were set by
individual
Distribution
Network Service
Providers (DNSPs)
according to a series
of “pricing
principles”. Included
a requirement to
‘take into account’
Long Run Marginal
Costs (LRMCs), and
to ‘adjust prices in a
way that minimises
distortion’ where
prices do not
recover all
revenues.
Moratorium on
changes to charging
arrangements until
2013 prevented
introduction of ToU
tariffs.
Significant PV
deployment
coupled with roll-
out of smart meters
has drastically
changed the way
that customers use
the electricity
network in recent
years.
The Australian Energy Market
Commission (AEMC) (the rule
maker for Australian electricity
and gas markets) introduced
new charging rules. In practice
these are being adopted in the
following ways:
• DNSPs are using forward
looking principles to determine
LRMC which is being recovered
based on peak instantaneous
demand;
•minimised distortions for
residual costs;
•transitional arrangements are
being used to protect
consumers; and
• no locational signals are
being provided to minimise
complexity.
ToU pricing has now been
introduced on an opt-in basis.
It is too early to draw robust
conclusions.
The new charging rules have
received a mixed response from
stakeholders.
One consumer advocacy group
has suggested that the new
demand (kW or kVA) tariffs
should become mandatory
rather than opt-in.
Further changes have been
proposed including higher
connection fees and 'exit fees'
but these proposals have been
criticised with suggestions that
they increase the incentive for
disconnection from the
network.
Victoria provides an
interesting case given
that the approach to
charging reform –
with a distinction
between cost-
reflective and
residual charges –
aligns closely with the
way these issues are
being considered in
GB.
The explicit
importance placed on
considering consumer
and distributional
impacts has led
transitional
arrangements to be
considered. However,
the opt-in nature of
the reforms at this
stage may dilute their
impact.

8
Country /
Region
Original charging
arrangements
Problem identified Change introduced Impacts Conclusions
The
Netherlands
Distribution and
transmission tariffs
were partly
volumetric and
partly capacity
based. Charges were
only applied to
demand.
Consumers received
separate bills from
the supplier and
from their
distribution
company.
The Dutch
government
reviewed the
charging
arrangements in
2008 mainly to
simplify them and
introduce a retail-
centred supply
model.
Making distribution
charging more
consistent with
drivers of
distribution
network costs was a
secondary policy
driver.
Following the review, in 2009,
a flat capacity charge was
introduced for household and
small industrial consumers.
The charge was based on
either the capacity of
connection or the maximum
power admissible by their
connection, with fuse size used
as a proxy where needed.
The Dutch government
introduced transitional
arrangements to minimise
windfall distributional effects
from the change to the
charging structure and to
encourage consumers to
reduce the size of their
connections.
Transmission charging changes
followed in 2015 to base them
on contracted peak capacity
and monthly measured peak
demand.
While transitional
arrangements could not
completely prevent negative
impacts on certain consumer
types, the transitional
arrangements seem to have
minimised negative consumer
impact and the simplification of
tariffs has been welcomed.
The European Distribution
System Operators for Smart
Grids (EDSOSG) are advocates
of the Dutch arrangements
which they suggest have
reduced revenue uncertainty
for Distribution System
Operators (DSOs).
The Netherlands case
study seems to
suggest that capacity
based network
charging can work as
a stable mechanism
for network cost
recovery.
The transitional
arrangements and
efforts of
Government and
utilities to publicise
the arrangements
and work with
consumers to prevent
negative effects,
seems to have been
important in
enhancing
acceptance of new
arrangements.

9
Country /
Region
Original charging
arrangements
Problem identified Change introduced Impacts Conclusions
Spain The charging
structure until early
2013 involved a
contracted capacity
component and a
dominant
volumetric energy
component.
For some years,
Spain had
experienced a tariff
deficit with
revenues for DSOs
not being sufficient
to cover regulated
allowed revenues.
This revenue under-
recovery has led to
steadily increasing
tariffs.
Cost recovery
problems have been
exacerbated by the
rapid take-up of
DERs, in particular
from on-site
generation with
solar PV.
The Spanish regulator has
shifted revenue recovery from
volumetric based charges onto
capacity.
Provisions were also
introduced which require
consumers (larger than 10 kW)
to pay charges on the
electricity produced on their
premises alongside the
electricity they source from
the grid (the so-called ‘sun-
tax’).
While it is too early to draw
conclusions, capacity based
charging seems to have
reduced contracted capacity
requirements at low voltage
levels.
The 'sun tax' has been highly
contentious with significant
opposition from the solar PV
industry. Spanish MPs have
recently indicated that the 'sun
tax' arrangements may be
reviewed.
Spain provides
another European
example in which the
network charging
basis has shifted
more to connection
capacity.
However, the 'sun
tax' reforms have
been highly
contentious and
continue to be under
review.
This highlights the
opposition that may
occur where
significant changes
are introduced to the
contribution self-
generating facilities
are expected to make
to recovery of fixed /
sunk network and
other system costs.

10
Country /
Region
Original charging
arrangements
Problem identified Change introduced Impacts Conclusions
Italy All households
faced:
• capacity based
charging elements,
set through their
smart meters (roll-
out complete);
• a flat component;
and
• a progressive
volumetric
component.
While less of an
issue than in Spain,
Italy has also faced
a tariff revenue
deficit.
This has been
resolved by passing
any under-recovery
through to
allowances in
subsequent years.
The Italian regulator is
gradually eliminating the
progressive structure of the
distribution network tariffs.
By 2018, the network and
system charge tariffs will be
the same for all consumption
levels.
Capacity components have
also recently been introduced
into transmission tariffs for HV
and EHV customers but not for
MV and LV customers.
Self-generation projects are
gradually being required to
contribute to the grid costs,
depending on their capacity.
The changes are currently in
progress or yet to be
introduced. Hence it is too early
to evaluate impacts.
As the reduction of
importance of the
progressive
volumetric element is
likely to result in
regressive
distributional
impacts, the re-
distribution of
charges may become
a contentious issue.
The reforms will also
lower incentives to
reduce consumption
from the grid.
Source: CEPA and TNEI

11
3. UNITED STATES OF AMERICA
Distribution charge as percentage of retail bill: 28% in 20164
Mature retail competition in place? No
3.1. The problem
In the USA, the majority of states have vertically integrated utilities, operating as regulated
monopolies. Typically, customers experience bundled tariffs, based on the average costs of
serving customer classes.
Net Energy Metering
Most US States have Net Energy Metering (NEM) policies (see Figure 3.1). Domestic
customers can net off their export against their import, effectively being paid the retail rate -
which includes transmission and distribution costs - for their generated electricity. Opponents
argue that the fixed costs of the distribution and transmission networks are increasingly borne
by the remaining customers who do not have PV. Solar advocates argue that these
calculations do not capture the full longer term benefits of distributed solar power.
The NEM tariffs have the benefit of simplicity, giving a clear signal to households, but they are
unable to accurately reflect the costs and benefits of PV to the distribution network, or
provide signals for customers and utilities to reduce longer term whole-system costs.
Figure 3.1: States with NEM policies
Source: DSIRE, July 2016, dsireusa.org/resources/detailed-summary-maps)
4 EIA Annual Energy Outlook 2016, Table 8
12
3.2. Changes introduced
Proposed changes
Many states and utilities are exploring potential changes. In the year July 2014-155:
48 utilities across 24 states proposed significantly increased fixed charges for
residential customers.
17 utilities across 12 states proposed extra monthly charges for customers with
residential PV.
Many states are also considering charges on instantaneous peak demand.
Many utilities and states are reconsidering the details of net metering, such as system
size limits, compensation for excess generation, and aggregate caps.
Utilities’ proposals have received mixed responses from regulators.
Value of solar
There have been attempts by utilities and regulators to design “Value of Solar” (VOS) tariffs.
Under VOS tariff designs, customers purchase electricity at the standard retail rate, but sell
generated electricity back to the grid at a VOS rate, calculated based on studies estimating
the benefit/cost to the network. However, these have not been widely adopted by utilities.
3.3. The impact
Proposed changes have often proved very controversial. Tariff changes have in many cases
had a significant impact on the solar industry and on vulnerable consumers, whereas it has
been suggested rates appear less likely to impact investment decisions on commercial and
domestic developments.
3.4. Two specific USA State case-studies
Two states where changes to NEM have already been introduced, Nevada and California, are
compared in the table below. In both states the changes have proved very controversial.
Although it is too early to see the long-term impacts, California appears to have been broadly
more successful than Nevada in achieving a change that is accepted by stakeholders.
5 https://nccleantech.ncsu.edu/wp-content/uploads/Q32016_FinalExecSummary.pdf
13
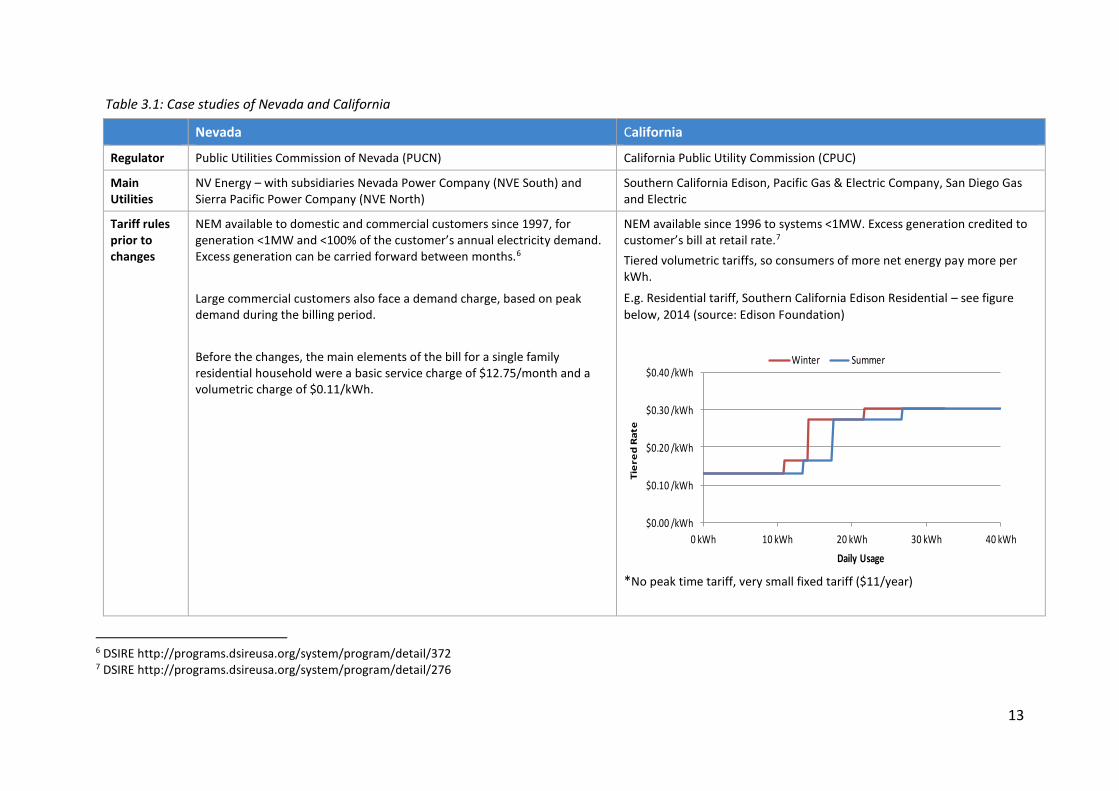
Table 3.1: Case studies of Nevada and California
Nevada California
Regulator Public Utilities Commission of Nevada (PUCN) California Public Utility Commission (CPUC)
Main Utilities
NV Energy – with subsidiaries Nevada Power Company (NVE South) and Sierra Pacific Power Company (NVE North)
Southern California Edison, Pacific Gas & Electric Company, San Diego Gas and Electric
Tariff rules prior to changes
NEM available to domestic and commercial customers since 1997, for generation <1MW and <100% of the customer’s annual electricity demand. Excess generation can be carried forward between months.6
Large commercial customers also face a demand charge, based on peak demand during the billing period.
Before the changes, the main elements of the bill for a single family residential household were a basic service charge of $12.75/month and a volumetric charge of $0.11/kWh.
NEM available since 1996 to systems <1MW. Excess generation credited to customer’s bill at retail rate.7
Tiered volumetric tariffs, so consumers of more net energy pay more per kWh.
E.g. Residential tariff, Southern California Edison Residential – see figure
below, 2014 (source: Edison Foundation)
*No peak time tariff, very small fixed tariff ($11/year)
6 DSIRE http://programs.dsireusa.org/system/program/detail/372 7 DSIRE http://programs.dsireusa.org/system/program/detail/276
$0.00 /kWh
$0.10 /kWh
$0.20 /kWh
$0.30 /kWh
$0.40 /kWh
0 kWh 10 kWh 20 kWh 30 kWh 40 kWh
Tie
red
Ra
te
Daily Usage
Winter Summer

14
Nevada California
The problem Solar grew by >80% in 2014 to 2016, due to incentives and good solar resource. NEM generation in 2016 was forecast as 234MW, i.e. 1% of total energy generation in Nevada. Installed capacity was forecast at approx. 3% of peak demand.8
There were concerns from the regulator and utility that DG-customers were avoiding utility costs and shifting cost onto non DG-customers. The PUCN found that the disparity constituted a monthly subsidy of $9 to $114 to DG customers. 9
It was estimated that a 4kW solar project gains Net Present Value (NPV) of $20k from NEM. It is argued that this is far higher than the utility’s avoided costs. Tiered tariffs mean higher energy consumers particularly stand to gain from PV. 75% of rooftop solar is leased, and most of the benefit goes to the leasing company rather than the householder.10
It was predicted that by 2020, approximately $1.1billion/year would be shifted from DG to non-DG customers. This equates to 3% of the utility’s revenue requirement.11
Changes introduced
A tariff change was agreed with a 12-year phase-in. The rates for a single residential household are shown below12. The basic service charge will increase by over 300%, and the rate paid for generated electricity will decrease to <25% of its current value.
Basic Service Charge
(monthly)
Volumetric Charge (per
kWh)
Credit for generated
energy (per kWh)
Prior Rate $12.75 $0.11289 effectively $0.11289
2016 $17.90 $0.11067 $0.09199
2019 $23.05 $0.10845 $0.07429
2022 $28.21 $0.10623 $0.05747
Legislation was passed in October 2013, directing the CPUC to reform residential tariffs by Dec 2015.
In Jan 2016, the CPUC voted the following changes:
gradual move to two-tier rather than four-tier system;
add a super-user surcharge (affects <10% of customers);
move towards mandatory ToU tariffs for DG by 2019;
minimum charge of $10 monthly, even if net consumption is zero;
“non-bypassable” charges, such as for nuclear decommissioning, which were previously charged on net consumption, will be charged on total electricity delivered from the grid; and
utilities can charge a one-off connection fee, estimated between $75 and $150.
However, the CPUC rejected calls for fixed charges, access charges, installed capacity fees etc, stating that further work and discussion is needed.
8 Nevada Net Energy Metering Impacts Evaluation, Energy+Environmental Economics, July 2014 9 R Street Policy Study No.59, March 2016, Rash Ratemaking: Lessons from Nevada’s NEM Reforms, Devin Hartman 10 Net Energy Metering: Subsidy Issues and Regulatory Solutions. Issue Brief September 2014, The Edison Foundation 11 Energy+Environmental Economics, Inc, California Net Metering Ratepayer Impacts Evaluation, October 28,2013, p.6 12 NV Energy, Net Metering https://www.nvenergy.com/renewablesenvironment/renewablegenerations/NetMetering.cfm

15
Nevada California
2025 $33.36 $0.10418 $0.04157
2028 $38.51 $0.10179 $0.02649
There was no grandfathering of existing schemes to avoid the rate increase.
There are additionally schemes in place to help low income customers. Existing solar arrays were grandfathered.
Impact assessment
17,000 householders who had already invested in solar lost out through the ruling. Solar companies including Vivint Solar, SunRun and SolarCity have ended their operations in the state. SunRun criticised the retrospective application of the new tariffs for undermining investor confidence in the Nevada government. SolarCity claimed the PUCN had protected the utilities’ monopoly, at the cost of Nevada customers.
Some experts argue that the analysis behind the changes did not adequately consider avoided transmission and distribution capacity, the cost of ancillary services, interconnection, administration and environmental costs. 13
In September 2016, the ruling regarding grandfathering was reversed, such that the original scheme will now apply for 20 years for customers already approved under NEM or with already submitted applications. This is estimated to affect 32,000 businesses and householders.
The decision was seen as striking a balance between utilities and solar companies, with a much better deal for solar companies than other states such as Nevada or Hawaii.
It is too soon to see the full impact. As elsewhere in the US, the attempted changes proved controversial - in 2015, solar advocates delivered wheelbarrows of petitions from over 130,000 electricity users to CPUC.
Lessons learnt
A robust third party analysis of costs and benefits should be undertaken. This must consider the long-term benefits of DG, including how this can interact with network planning to reduce long-term costs. Where the utility is a competitor to DG this is problematic to achieve, as the utility holds the necessary data for quantification of these benefits, but may have a financial incentive not to release them.14
A cost-shift towards non-PV customers is not sufficient evidence that PV is being under-charged, if the methodology was not cost-reflective to begin with.
The old tiered system was seen as “fairer” and more environmentally-friendly because it incentivised lower electricity use. Consumer acceptance of tariffs depends on perception of fairness between energy users.
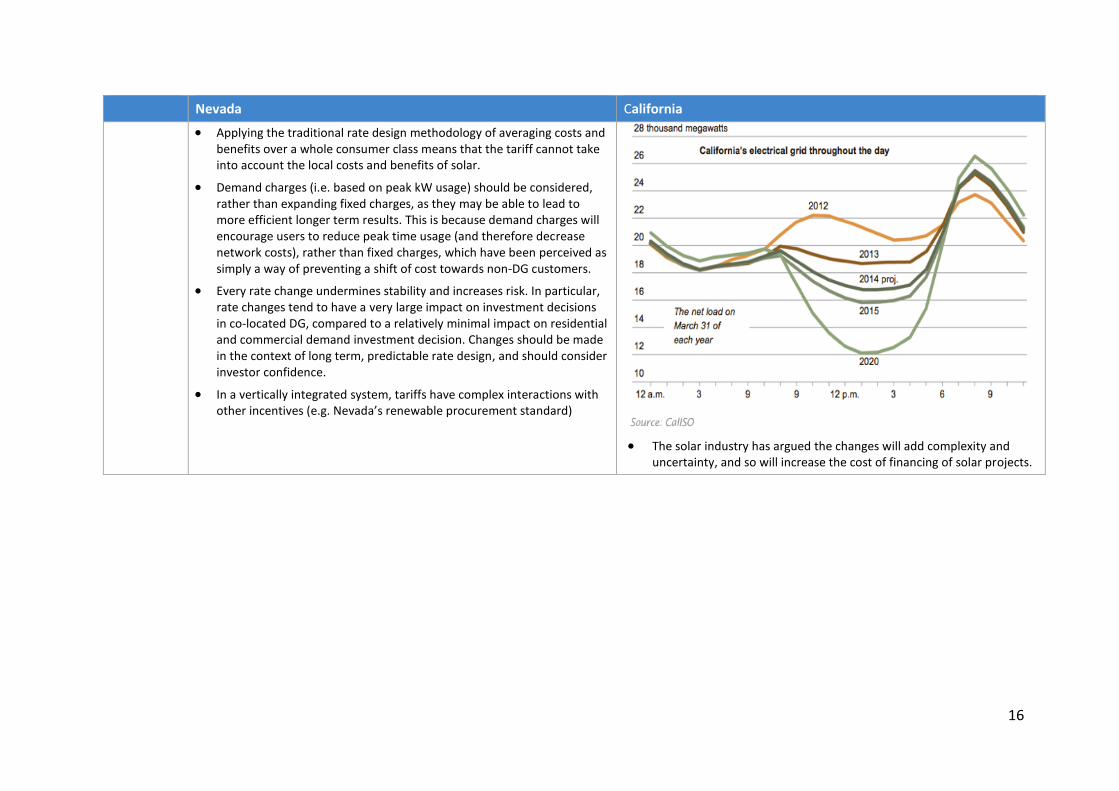
ToU tariffs are challenging to implement well, since historically peak demand was during summer afternoons, but now a “duck curve” effect is starting to occur (see figure below). ToU tariffs must be flexible enough to adapt to changing trends in demand and generation.
13 R Street Policy Study No.59, March 2016, Rash Ratemaking: Lessons from Nevada’s NEM Reforms, Devin Hartman 14 R Street Policy Study No.59, March 2016, Rash Ratemaking: Lessons from Nevada’s NEM Reforms, Devin Hartman
16
Nevada California
Applying the traditional rate design methodology of averaging costs and benefits over a whole consumer class means that the tariff cannot take into account the local costs and benefits of solar.
Demand charges (i.e. based on peak kW usage) should be considered, rather than expanding fixed charges, as they may be able to lead to more efficient longer term results. This is because demand charges will encourage users to reduce peak time usage (and therefore decrease network costs), rather than fixed charges, which have been perceived as simply a way of preventing a shift of cost towards non-DG customers.
Every rate change undermines stability and increases risk. In particular, rate changes tend to have a very large impact on investment decisions in co-located DG, compared to a relatively minimal impact on residential and commercial demand investment decision. Changes should be made in the context of long term, predictable rate design, and should consider investor confidence.
In a vertically integrated system, tariffs have complex interactions with other incentives (e.g. Nevada’s renewable procurement standard)
The solar industry has argued the changes will add complexity and uncertainty, and so will increase the cost of financing of solar projects.

17
3.5. Lessons for GB
Energy rates changes and NEM issues have become a controversial topic in the USA. As most
states have vertical integration between distribution and supply, this includes network
charges. Changes to energy rates have a particularly pronounced impact on vulnerable
consumers and on the domestic solar industry – for example, in Nevada many domestic solar
companies have ceased trading in the state due to rates changes.
In the US, there has been a tension between the avoidance of “rate shock” – rapid changes in
tariffs for individual customer groups – and the development of cost reflective tariffs.
Although in GB, network charges are more cost-reflective than in the US, changes to cost
recovery could still have a significant impact on the overall charge seen by customers.
US precedent would also suggest that reforms to the network charging basis are more likely
to be accepted by the DG industry if they are based on a robust and impartial assessment of
the costs and benefits of DG, and have long term validity. Grandfathering should also be
considered carefully, to balance the aim of overall reduced cost to the consumer against the
risk of a large impact on individual households.15
The controversy in Nevada, where critics argued that the rates changes did not take into
account the long-term benefits of solar PV highlights the importance of basing changes on a
robust and independent analysis that includes the long-term network benefits of DG. Due to
the vertically integrated nature of the US market, there are particular issues with accusations
of bias, as networks are seen as competitors to DG. In GB, the electricity network companies
do not directly compete with DG in energy generation. However, flexibility providers and DG
have the potential to defer or reduce network reinforcement, therefore, reducing the
potential asset base of the network owner. Therefore, the US example suggests that forward-
looking, LRMC based assessments, of the impacts of DG on network costs are appropriate,
but that any proposals made by the utilities themselves, need to be independently scrutinised
by Ofgem and other interested stakeholders.
The US reform process also shows that the benefits of simplicity in fixed and volumetric
charges need to be weighed up against the benefits of sending an efficient signal to
consumers, via demand charges (i.e. based on peak kW usage) or ToU charges (based on
energy usage in specified periods). In:
Nevada, the change to a large fixed charge and a reduced credit for generated energy
does not give any scope for realising the potential benefits of PV to the network;
whereas
California, ToU tariffs have the potential to encourage efficient investment that
reduces network costs.
15 In Nevada, the decision not to grandfather existing tariffs to households who had invested in PV was particularly controversial and was eventually reversed.

18
Demand and ToU charges are more likely to be accepted by the DG industry. However, they
are more difficult to implement technically, and ToU charges must be flexible enough to adapt
to changing system usage and generation patterns. In California, the opportunity has been
taken to simplify other parts of the charging system (the tiered charging structures)
somewhat balancing out the increased complexity of the ToU charging.
In the US, at domestic and small-scale commercial level, rates are usually set to be cost-
reflective for the ‘average’ customer for large classes of customers; similar to GB’s CDCM16.
Critics have argued that this severely limits the ability to send efficient signals to customers,
as it is difficult to send a useful signal to specific customers even if the methodology captures
the average benefit of solar. In reality the LRMC of each customer’s actions may vary
significantly, but these effects tend to be averaged out in the CDCM. Whilst it may be
impractical to have a higher granularity of analysis for small scale customers, it is important
to consider whether the customer classes in the CDCM (a group of customers who had a
similar network impact prior to the growth of flexibility and DERs) are still appropriate. For
example, will sending the same ToU signal to all customers in a given class have the desired
impact? Again, a balance must be struck between efficient signals and simplicity.
16 The Common Distribution Charging Methodology (CDCM) is the methodology, principles and assumptions that underpin the calculation of electricity distribution use of system charges for HV and LV networks in GB.

19
4. VICTORIA - AUSTRALIA
Distribution charge as percentage of retail bill: approximately 20% in 201317
Mature retail competition in place? Yes18
4.1. The problem
The way that customers use the electrical networks in Australia has changed significantly in
recent years. We have looked at the state of Victoria as an example, although similar case
studies can be found in other states in Australia (see references below).
Smart Meters
In Victoria, the smart meter roll-out is essentially complete19 – 2.8m smart meters have been
deployed by Victoria’s five electricity DNSPs – CitiPower, Jemena, Powercor, SP AusNet and
United Energy. This allows for both the utilities and their consumers to obtain better
information about their electricity consumption.
PV Deployment
There has been a significant deployment of solar PV across the whole country, as
demonstrated in Figure 4.1, which shows that since 2010 the cumulative capacity of installed
PV has risen from 133 MW in 2010 to an estimated 5.5 GW in late 2015.
Figure 4.1: Australian PV installations since April 2001: total capacity (kW)
Source: APVI
Figure 4.1 shows the density of PV installations by Local Government Area in Victoria. Around
10-20% households have PV deployed, with some LGAs having a penetration of PV of >30%.
17 http://talkingelectricity.com.au/wp/wp-content/uploads/2014/07/Topic-1_Bill-Breakdown.pdf 18 http://www.aemc.gov.au/getattachment/6856bf1b-648a-432a-bf5f-54ea453a3d8a/Infographic.aspx 19 http://www.smartmeters.vic.gov.au/about-smart-meters/end-of-rollout

20
Figure 4.1: Density of PV installations in Australia by LGA
Source: APVI
Charging Reforms
Significant PV deployment coupled with the roll-out of smart meters has drastically changed
the way that customers have started to use the network in recent years.
In 2010, concerns about the impact on consumers of ToU tariffs following the smart-meter
rollout led to a moratorium on tariff reform activities in Victoria20. This moratorium was in
place from March 2010 to September 2013 and stopped the introduction of ToU tariffs until
an assessment had been made. ToU pricing was eventually introduced on an opt-in basis.
In other states (such as Queensland), the rapid uptake of PV under the existing basis of
network cost recovery has also been observed as having had major distributional impacts
between different customer groups – see text box below.21
20 http://www.energynetworks.com.au/sites/default/files/position-paper_towards-a-national-approach-to-electricity-network-tariff-reform_december-2014_1.pdf 21 This Queensland case study was prepared by Michael Pollitt as part of work undertaken by CEPA and TNEI on flexibility and network charging and is also included in the Cambridge Energy Policy Research Group (EPRG) working paper ‘Electricity Network Charging for Flexibility’

21
Box 4-1 Net-Metering in South Queensland Case Study22
South Queensland in Australia has one of the highest penetration rates of domestic solar
PV in the world. 22% of households had PV in 2014 (and 75% have air-conditioning).
Distribution charges in South Queensland are charged based on 20% fixed cost and 80% per
kWh. The massive increase in solar PV (from close to zero at the start of 2009) has resulted
in a huge transfer of wealth and costs between customer groups. Solar PV consumers have
lower metered consumption due to own production. This significantly reduces their share
of the per kWh costs of the distribution system.
Meanwhile the revenue cap regulation of the distribution charges means that the same
revenue has been recovered as the number of units has fallen, thus per unit charges have
risen and the distribution of their payment between different types of households has
dramatically changed.
Simshauser (2014)23 analysed four types of household in this new situation in Queensland:
households with no PV and no air-conditioning (this is the poorest group); households with
air-conditioning and no PV; households with PV and no air-conditioning; and households
with PV and air-conditioning. He looked at how the charging mechanism has shifted
network charge payments between different customer groups and also considered a more
cost reflective charging regime where each household pays a fixed charge, a per kW peak
charge and a variable per kWh charge to better reflect underlying costs.
Simshauser’s analysis found that households with PV and air-conditioning have only a
fractionally lower peak per kW usage relative to those with no PV but air-conditioning.
Meanwhile, households with air-conditioning and no PV currently pay less than they should
towards distribution charges, given their relative cost of service.
This reveals that the starting point of charging is already unfairly subsidising peaky users
with air-conditioning AND that the system has rapidly become much more unfair with the
high take-up of PV (as described above, the installed PV reduces these customers net-
metered consumption, which in turn reduces their contribution towards volumetric
charges). When the more cost reflective three-part tariff scheme was considered by
Simshauser (involving a fixed charge, a per kW charge and a variable per kWh charge), the
result was customers with PV and air-conditioning paying 28 per cent more than currently,
and those customer without PV and air-conditioning paying 15 per cent less (with the result
that the poorer households pay around 180 AUD (£95) less).
Simshauser’s analysis of the differences in network charges for residual customer groups
under the existing charging mechanism in South Queensland, is shown in the table below.
22 Pollitt (2016): ‘Electricity Network Charging for Flexibility’ 23 Simshauser, P. (2014). Network tariffs: resolving rate instability and hidden subsidies, AGL Applied Economic and Policy Research Working Paper No.45 –

22
Box 4-1 Net-Metering in South Queensland Case Study22
Table 4-1: Differences in Network Charges for Residential Consumers in South Queensland
House A House B House C House D
Air-Con?
Solar PV
Maximum Demand
(kW) 1.41 1.40 2.14 2.09
Metered Import (kWh) 6,253.4 3,820.1 7,560.6 4,707.1
Solar Export (kWh) 2,259.1 1,838.8
Gross Demand (kWh) 6,253.4 6,253.4 7,560.6 7,560.6
Number of customers 283,849 26,151 694,643 235,357
% of customers 23 2 57 19
Base network Tariff $1,006.14 $698.57 $1,171.37 $810.69
Difference $307.57 $360.68
Source: Pollitt (2016): ‘Electricity Network Charging for Flexibility’24
In 2014, the AEMC carried out a comprehensive review of network charging, with a view to
introducing more cost reflective charges. External advice was sought from consultants and
the AEMC looked in detail at several issues, including the recovery of residual costs.
Prior to the reform process, DNSPs had the freedom to choose how they set their charges,
and would submit proposals to the Australian Energy Regulator (AER). The AEMC’s initial
Consultation Paper sets out the existing pricing principles which all DNSPs had to comply with.
These included that:
the revenue of each price class must be greater than the incremental cost and less
than the standalone cost of the service;
the DNSP ‘take into account’ the LRMC;
DNSPs consider tariff transaction costs and responsiveness of retail customers; and
24 http://www.eprg.group.cam.ac.uk/eprg-working-paper-1623/

23
that prices are adjusted ‘in a way that minimises distortion to efficient patterns of
consumption’ if prices do not recover all revenues.
4.2. Changes introduced
New Rules from the AEMC
As a result of their 2014 review, the AEMC introduced new rules for network charges. These
are detailed in the final determination25, and summarised as follows:
‘Each network tariff must be based on the long run marginal cost of providing the
service.’
‘... the total revenue determined by the AER in the business’ distribution determination
must be recovered in a way that minimises distortions to price signals...’
‘Distribution businesses must also give effect to a consumer impact principle when
developing their tariffs.’ This consumer impact principle has two parts.
o ‘The first part requires distribution businesses to consider the impact on
consumers of changes in network prices.’
o ‘The second part of this principle requires network prices to be reasonably
capable of being understood by consumers.’
The first and second of these rules are comparable with the issues under consideration by
Ofgem relating to network charges – that is, the distinction between cost-reflectivity
(currently achieved based on LRMC type principles) and cost-recovery (where Ofgem have
identified some potential existing market distortions e.g. relating to embedded benefits).
The third rule highlights another important facet of tariff reform (which was also highlighted
by the initial moratorium) – that ultimately, tariff reform has the potential to affect end
consumers of electricity and distributional impacts should be considered.
Stakeholder Views26
The Australian Energy Networks Association (ENA) broadly welcomed the intent of the
proposals. They identified with the issues being considered by the AEMC and agreed with the
proposals for greater engagement with stakeholders on the structure of tariffs and on
improving the transparency of arrangements.
25 http://www.aemc.gov.au/getattachment/de5cc69f-e850-48e0-9277-b3db79dd25c8/Final-determination.aspx 26 Not unexpectedly, the AEMC’s proposals received significant interest throughout their development. Below
we have summarised the views of three stakeholder groups of particular interest. Further insight into how
proposals were received can be found at the following link: http://www.aemc.gov.au/Rule-
Changes/Distribution-Network-Pricing-Arrangements

24
However, they had concerns with the reduction of flexibility for distribution networks to
introduce cost reflective tariffs within their own jurisdictions. They also asked the AEMC to
recognise the importance that the ENA placed on the continued role of fixed charge tariff
components for those customers without smart meters. They suggested that fixed charge
components may need to increase to ensure cost recovery as volumetric elements were
reduced. They noted the distributional impact that this could have on vulnerable customers
requesting that the government review customer hardship programmes.
Consumer groups similarly welcomed the introduction of changes to tariff arrangements.
They identified benefits in terms of enhanced efficiency and avoided investment potential.
However, they also identified the potential for increased complexity of tariff structures and
for consumer disengagement which they believed could undermine the benefits case of
reform. In their consultation response to the draft proposals, consumer bodies advocated
clear communication of reforms and for retailers to reflect tariff changes in their consumer
offerings. They proposed that the AEMC include a consumer impact and understanding
principle to the rule changes being developed, which was included within the AEMC’s final
rule changes.
The Energy Retailers Association of Australia (ERAA) shared the consumer advocacy group’s
view regarding minimising complexity of tariffs and communicating reform effectively. They
said that less complex tariff structures would make it easier for them to pass through
reflective signals in retail offerings. They also emphasised the importance of a smooth
transitioning process of the revised arrangements over one or two price control periods with
improved affordability initiatives to soften any impacts on vulnerable consumers.
Implementation of the New Rules
The AER’s Final Decision27 on the tariff structures of the Victorian DNSPs from August 2016
shows how these rules have been implemented in practice. This decision highlights the
following:
The DNSPs are using forward looking principles to calculate LRMC: Average
incremental costs (including capital and operational costs) associated with expected
increase in demand are calculated over a period of 10 – 20 years (depending on the
DNSP) and used to determine tariffs. The AER noted that replacement capex should
be included in LRMC estimates.
Locational signals are not provided: Cost reflective tariffs are calculated for each
voltage level (LV residential, LV business, HV business, Sub-transmission) but not at
individual locations. This does reduce the extent to which the tariffs are ‘cost
reflective’. However, this appears to have been in response to a stakeholder message
that ‘locational tariffs are complex for consumers to understand.’
27 https://www.aer.gov.au/system/files/AER%20-%20Final%20decision%20-%20Victorian%20distribution%20businesses%20-%20Tariff%20Structure%20Statement%202017-20.pdf
25
LRMC tariffs are being recovered based on peak instantaneous demand: All the
DNSPs have linked the LRMC to proposed kW or kVA demand charges. For these,
charging windows which target peak demand periods have been proposed. This aligns
with the principle that peak demand is what drives network investment.
Residual costs are being recovered in a manner which minimises distortions: All the
Victorian DNSPs will recover residual costs either from fixed $ charges or from $/kWh
energy charges, although the AER notes that all the DNSPs have proposed to reduce
the kWh component and increase the fixed component in order to signal ‘to customers
the value of being connected to the network’. This would preclude the possibility of
‘embedded benefit’ style distortions due to the triad arrangements. However, where
charges are based on energy consumption (particularly net-metered energy
consumption) there would still be potential for users with behind-the-meter
generation to reduce their contribution to network cost-recovery.
Transitional arrangements are used to protect consumers: Capacity based demand
(i.e. kW or kVA) tariffs will be opt-in only for all customers with a demand of less than
40 MWh/annum, with a higher threshold of 60 MWh/annum for business customers
proposed by some DNSPs. For all other consumers, demand tariffs will apply
automatically but the magnitude of these tariffs will gradually increase over a
transitional period between 2017 and 2020. In their decision, the AER noted that the
transitional arrangements contribute ‘to the achievement of compliance with the
distribution pricing principles by enabling these customers to become aware of how
the new charges will affect them.’ This may suggest that applying new tariffs on an
opt-in or transitional basis has been part of the DNSPs’ responses to the “consumer
impact” rule.
4.3. The impact
These rules have been supported by some but others have opposed them. The Consumer
Utilities Advocacy Centre, a consumer advocacy group, has suggested that the switch to
demand tariffs should be mandatory, preceded by an 18 month period of communication in
order to ensure that customers are informed.
They point out that if demand tariffs are rolled out on an opt-in basis, then consumers would
only choose these if it would result in them paying less. Any users who would pay more with
a demand charge will presumably not opt in. However, the DNSP still has a regulated revenue
that they need to recover, and so their residual costs would increase accordingly. Therefore,
the fixed/volumetric tariffs would increase for all other users.
The ENA published further proposals in 2015 for how tariff reform activities could continue,
but these have been criticised by some stakeholders. The ENA discussed a range of options,
including higher connection costs and even ‘exit fees’ for recovery of sunk costs when users
disconnect.

26
As reforms are ongoing, it is too early to opine on exactly what the impact of the review and
rule changes has been, although debate on the subject continues and it seems certain that
any proposals will attract criticism from certain parties.
4.4. Lessons for GB
Well informed debate on charging reform is taking place in other countries, and the Victorian
case study provides a particularly good example of a case with very good information. The
review has been wide ranging, detailed and transparent with lots of published information
and analysis available from a number of groups including third parties. The approach to
charging reform – with a distinction between cost-reflective and residual charges – aligns
closely with the way these issues are starting to be considered in GB.
The new rules have encouraged a move towards a charging structure which appears to more
broadly align with the principles we would consider to be efficient – cost reflective elements
are recovered based on peak kW demand and cost recovery elements are recovered through
fixed charges (with some energy charges).
Consumer impacts have been considered throughout and change will be introduced
incrementally. There is even a specific rule the DNSPs must follow which requires them to
consider consumer impacts. However, the reforms may need to go further and make some
changes (e.g. the introduction of peak demand charges) compulsory for all users to
completely prevent adverse distributional impacts.
27
5. THE NETHERLANDS
Distribution charge as percentage of retail bill: approximately 21-23%28
Mature retail competition in place? Yes
5.1. The problem
The Dutch Government sets the principles of the tariff structure by law. The network
operators then decide which structure to adopt, while the regulatory authority determines
the authorised revenue. The Government launched a review of tariff structures in 2008. The
primary reason for launching the review was not the cost recovery issue that is being
considered in the UK. Rather, the Government wanted to reform the supply model to centre
it around energy retailers. Prior to the review, consumers received separate bills from
suppliers and from Dutch DSOs. Therefore, the primary aim of the review was to reform and
simplify the billing process to allow improved consumer interfaces.
However, the Government had also identified that network costs were mainly capacity driven
and determined by peak demand. As a secondary consideration within their review, they
wanted to consider how distribution charging approaches could be made more consistent
with the drivers of distribution network costs.
5.2. Changes introduced
Following the review, the Dutch Government revised the distribution tariff structure. While
the previous charges had been based partly on volume and partly on capacity, this was
replaced with a flat capacity charge for:
household customers with a connection of less than 3x25A; and
small industrial customers with a connection of less than 3x80A.
Charges continued to be applied to those with a demand connection only. The charge was
based on either the capacity of connection or the maximum power admissible by their
connection. Where necessary, fuse size is used as a proxy for this.
Transitional considerations
Within its review, the government had identified that this change to tariffs could cause bills
of certain customers (i.e. those with relatively low energy usage and relatively high installed
capacity) to increase significantly.
28 ACER/CEER Annual Report on the Results of Monitoring the Internal Electricity and Gas Markets in 2015 Retail Markets p. 12. http://www.ceer.eu/portal/page/portal/EER_HOME/EER_PUBLICATIONS/NATIONAL_REPORTS/National_Reporting_2016. NB: Breakdown by distribution and transmission charge not available.

28
To mitigate distributional effects and avoid a public backlash, the government coincided the
changes to tariffs with reforms to a separate energy tax. This energy tax was introduced to
stimulate energy efficiency and included a variable volumetric component. At the time of
distribution tariff changes, the volumetric component was increased (to replace the energy
efficiency incentive that had been in place through the demand tariff) and a fixed tax rebate
introduced for the first two years in order to leave ‘standard connection’ customers with a
relatively similar overall energy payment as they had had previously throughout a transitional
period. See examples of charges pre and post reforms below.
Figure 5.1: Example charges before and after distribution tariff reform
Source: Liander
Alongside the change, they also put time and resources into a public awareness media
campaign in the lead up to the date of reforms going live. This was designed to inform
consumers of the nature and high level reasons for the changes and to encourage them to
take time to consider the level of connection that they needed, informing them that they may
be able to save money by switching to a lower connection.
DSOs also worked with consumers directly to encourage them to consider the size of their
connection. In 2009 and 2010, they introduced a subsidised charge for reducing the
connection capacity, e.g. by installing a smaller fuse or other form of connection capacity. In
2013, they agreed to compensate consumers who had not realised they were paying more

29
than they needed to and changed their contracted capacity for free. The total capacity of
connection to a DSO’s network is part of a calculation to determine allowed revenues in the
Netherlands. Thus, it seems that DSOs may have been offering services to reduce capacity in
contrast to natural incentives to maintain high connection capacity on their distribution
network. Government and regulatory pressure may have played an important part in
achieving this.
Changes to transmission charging
Following the move to capacity charging at distribution level, similar reforms have been
introduced at transmission level. In 2015, transmission charges were introduced based on:
contracted peak capacity; and
monthly measured peak demand.
Energy based drivers do remain in some areas of the transmission charging structure. For
example, consumers that use the grid for loading in less than 600 hours of the year receive
reduced tariff rates. Again, these changes were mainly driven by simplification considerations.
The Dutch regulator (ACM) is considering additional changes to further simplify charging
arrangements by removing the contracted peak capacity element of the transmission charge
moving to measured peak demand charging only.
5.3. The impact
The ACM considers the changes to have been beneficial. While meeting the primary objective
of simplification, the reforms introduced in the Netherlands also seem to have been able to
avoid some of the issues that may have arisen in the presence of volume based charges.
While there has been some consideration of distributional effects with certain customer types
(i.e. those with high capacity needs but low volume requirements (e.g. buildings with
elevators)) losing out, customers seem to have benefited from the improved charging
simplicity more generally. The changes have also removed DSOs’ volume risk, allowing them
to better forecast charges and recover costs.
The EDSOSG are an advocate of the changes introduced in the Netherlands29. They suggest
that the reforms have brought several benefits including:
transparency surrounding energy bills for consumers;
a simplification of billing and tariff structures, substantially reducing administrative
costs; and
reduced revenue uncertainty for DSOs.
29 http://www.edsoforsmartgrids.eu/wp-content/uploads/151014_Adapting-distribution-network-
tariffs-to-a-decentralised-energy-future_final.pdf

30
However, even where they accept that the move to capacity based charging may have been
a beneficial step in the right direction, others have questioned whether further reforms may
be needed. For example, some have considered whether the smart meter rollout (due for
completion in 2020) should be used to introduce dynamic pricing. They argue that the
capacity based charge has reduced the energy efficiency incentives placed on consumers.
In 2012, a Dutch DSO, Enexis carried out three pilot dynamic pricing projects (see box below).
EDSOSG argue that there has been no measurable impact on energy efficiency as energy
based incentives are retained under the energy tax and supplier charge components of a
consumer’s bill.
5.4. Lessons for GB
The charging reform process followed in the Netherlands seems to suggest that capacity
based charging can work as a means to simplify charging arrangements and to create a stable
mechanism for network cost recovery.
While concerns were raised regarding the potential negative impact on energy efficiency,
energy use since the change suggests that volume based incentives which exist in other areas
of the consumer’s bill have avoided this effect.
Commentators suggest that consumers (save for certain exceptions who have been more
negatively impacted by the changes) have benefited from the improved simplicity of charges
and billing. Dutch DSOs meanwhile seem to have avoided some of the cost recovery issues
being faced in other jurisdictions and the European DSO community identifies the
Netherlands as a case study of where capacity based tariffs have been effective.
Another interesting element of this case study is the hands on transitional approach adopted
by the Dutch Government and DSOs, with close working between the Government and the
regulator to mitigate windfall impacts on consumers resulting from the change. A publicity
campaign of the reforms also helped, though some consumers had to be compensated, and
changes to consumer capacities performed by the DSO for free, after it was established that
some consumers had not fully understood the changes and what it meant for them.
Your Energy Moment: dynamic pricing trials
300 homes took place in three pilot projects which ran from 2012-2015. The consumers were
provided with smart meters, solar panels and smart utilities and faced dynamic price tariffs.
According to Enexis’ analysis of results there was a significant impact on consumer behaviour, 90%
of consumers changed their settings to activate their utilities at the cheapest time of day while 10%
preferred to base demand on levels of renewable energy.
Enexis are following up with further studies including one which is studying the effects of storage
behind the meter and another testing the impact of dynamic tariffs on electric vehicles.

31
6. SPAIN
Distribution charge as percentage of retail bill: 22% of bill30
Mature retail competition in place? Yes
6.1. The problem
In 2013, Spain began an electricity market reform process, with the main aim of eliminating a
persistent and significant ‘tariff deficit’ estimated at around €30bn in 2013.31
The ’tariff deficit’ has accumulated over a 15-year period as tariff revenues for the network
companies had not been enough to cover their regulated revenues which include renewable
support mechanisms. The revenue under-recovery and the accrued interest has led to steady
increases in tariff levels which presently account for about half the electricity cost paid by
consumers. The figure below shows the evolution of regulated costs in the Spanish electricity
system from 2000 to 2013. These costs have increased from around €5bn to over €20bn over
the period. While there has been some increase in transmission and distribution costs, most
of the increase has come from rising renewable support costs.
Figure 6.1: Evolution of regulated costs in the Spanish electricity system 2000-2013
Source: European Commission32
Spain has experienced significant uptake of DERs, particularly in the form of PV solar panels
which has exacerbated the tariff deficit problem, due to the historic network tariff structure
used to recover network and other system costs.
30 ACER/CEER Annual Report on the Results of Monitoring the Internal Electricity and Gas Markets in 2015 Retail Markets p. 12. http://www.ceer.eu/portal/page/portal/EER_HOME/EER_PUBLICATIONS/NATIONAL_REPORTS/National_Reporting_2016 31European Commission, Electricity Tariff Deficit: Temporary or Permanent Problem in the EU?, http://ec.europa.eu/economy_finance/publications/economic_paper/2014/pdf/ecp534_en.pdf 32 European Commission, Electricity Tariff Deficit: Temporary or Permanent Problem in the EU?, http://ec.europa.eu/economy_finance/publications/economic_paper/2014/pdf/ecp534_en.pdf

32
Electricity users in Spain have historically been charged three types of costs through their
electricity bill:
grid costs for transmission and distribution networks;
other system costs (non-Transmission System Operator (TSO) costs) – e.g. support
mechanisms for renewable generation sources and non-peninsular generation
systems; and
energy costs including the cost of generation, losses, system reserves and back-up.
The charging structure faced by most consumer in Spain until early 2013 involved a contracted
capacity component and a dominant volumetric energy component.33 The charging structure
meant that a portion of the fixed network and policy costs were covered by a volumetric
consumption charge which could be reduced through on-site generation.
Figure 6.2: Tariff structure (until early 2013) and system costs covered by tariffs in Spain
Source: https://www.iea.org/media/workshops/2015/esapworkshopiv/Laveron.pdf
6.2. Changes introduced
The Spanish Parliament passed a new Electricity Law in December 2013, which was followed
by a range of new secondary regulations in 2014.34
The new Electricity Law35 sets out the requirement that self-consumption units should in
general pay for the system costs in the same proportion as the rest of network users although
33 There was also a separate tariff component which covers the use of metering devices. A single uniform tariff also applies to all of Spain so there are no locational signals given through transmission or distribution tariffs. 34 https://ec.europa.eu/energy/sites/ener/files/documents/2014_countryreports_spain.pdf 35 Electricity Sector Law 24/2013 (26 December)
33
there can be reductions where self-consumption brings reductions in system costs, and for
consumers with capacity (consumption and self-generation) no greater than 10 kW.
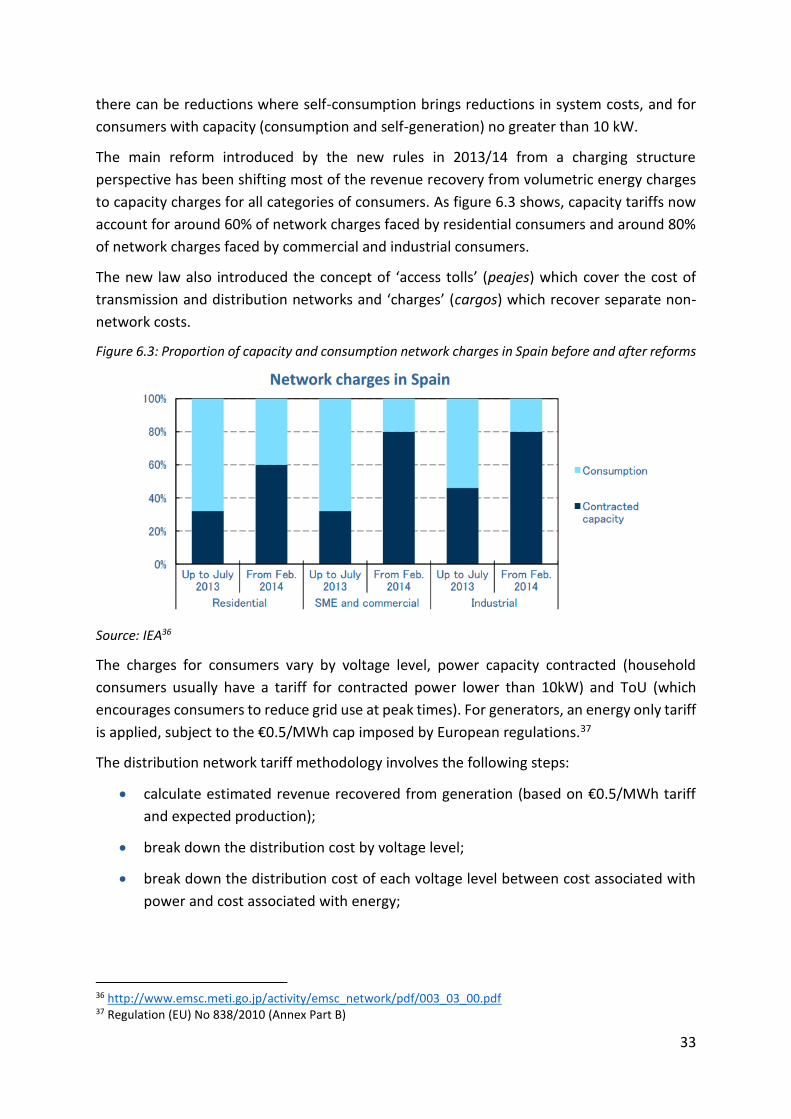
The main reform introduced by the new rules in 2013/14 from a charging structure
perspective has been shifting most of the revenue recovery from volumetric energy charges
to capacity charges for all categories of consumers. As figure 6.3 shows, capacity tariffs now
account for around 60% of network charges faced by residential consumers and around 80%
of network charges faced by commercial and industrial consumers.
The new law also introduced the concept of ‘access tolls’ (peajes) which cover the cost of
transmission and distribution networks and ‘charges’ (cargos) which recover separate non-
network costs.
Figure 6.3: Proportion of capacity and consumption network charges in Spain before and after reforms
Source: IEA36
The charges for consumers vary by voltage level, power capacity contracted (household
consumers usually have a tariff for contracted power lower than 10kW) and ToU (which
encourages consumers to reduce grid use at peak times). For generators, an energy only tariff
is applied, subject to the €0.5/MWh cap imposed by European regulations.37
The distribution network tariff methodology involves the following steps:
calculate estimated revenue recovered from generation (based on €0.5/MWh tariff
and expected production);
break down the distribution cost by voltage level;
break down the distribution cost of each voltage level between cost associated with
power and cost associated with energy;
36 http://www.emsc.meti.go.jp/activity/emsc_network/pdf/003_03_00.pdf 37 Regulation (EU) No 838/2010 (Annex Part B)

34
break down the distribution cost associated with power at each voltage level by time
period; and
break down the distribution cost associated with energy at each voltage level by time
period.
The costs associated with each ToU period are allocated using a simplified network model.
In addition, Spain also introduced provisions targeted specifically at self-consumers. In
October 2015, Spain adopted the so-called ‘sun tax’ which requires consumers to pay
tolls/charges on the electricity produced on their premises alongside the electricity sourced
from the grid.
The self-consumption regulation reflected the following principles:38
those users that generate electricity for their own consumption without being
connected to the grid should not have to pay any of the costs of the network system;
in contrast, those users that are connected to the grid have a guarantee of supplies,
including when self-generated electricity is not enough to cover consumption, thus
benefiting from system reserves and capacity and should therefore contribute
towards the costs of the system;
a self-consumer connected to the system should contribute to the general costs of the
system which do not depend on whether the electricity is self-consumed or not – such
as: subsidies for renewable generation and electricity systems outside the peninsula
(where generation is more expensive), historical debt, etc.;
if self-consumers do not pay a share of these costs, this will result in higher bills for
the other consumers which would be regressive given that vulnerable consumers are
also less likely to be self-consumers; and
a self-consumer connected to the system would still benefit by not paying for the
electricity it produces including the taxes and losses that would be associated with it.
Thus, self-consumers are now being charged tariffs for the electricity produced on their
premises to reflect:39
the “charges associated with the electricity system cost” which includes costs
associated with renewable and non-peninsular generation support schemes and
historical tariff deficit – as it is considered that these costs should be paid by all grid
connected electricity users irrespective of how the electricity is generated; as well as
38http://www.minetad.gob.es/en-US/GabinetePrensa/NotasPrensa/2015/Paginas/20151009-rd-autoconsumo.aspx 39 To be able to measure the total electricity consumed, prosumers are required to install an additional meter that measures the amount of electricity self-generated.

35
the ‘charge for other services of the system’ (i.e. back-up provided by the electrical
system) – as it is considered that self-consumers benefit from system reserves even
when self-consuming electricity.
The regulation also included two exceptions to the requirement to share network costs:
island consumers where self-consumption reduces the cost of generation in those
locations hence provides a saving for all consumers; and
small consumers of up to 10 kW.
The regulation also distinguishes between two types of self-consumption modalities:
Type 1: consumer with a contracted power of maximum 100 kW, owning at least one
generation facility within its internal network, not registered as a production facility;
and
Type 2: ‘production with self-consumption’ – consumer associated to at least one
generation facility connected within its network; the total power of the production
facilities must be lower or equal to the consumer contracted power.
Installations with capacity less than 100 kW do not receive compensation for the energy
injected into the system. Installations with capacity higher than 100 kW can register to sell
their surplus electricity at spot electricity prices, however, they are also liable for any levies
applied to generators, including tariffs for feeding energy into the network (the €0.5/MWh
tariff applied to generation).
One of the other main points of contention is the fact that self-consumers providing surplus
electricity to the grid are charged on a gross metering basis – based on energy withdrawn
from the grid without netting off the energy injected into the system. The introduction of a
net-metering system as used in other countries has been considered in Spain in the past but
never implemented.
6.3. Impact
Because of the new rules, most self-consumers have to pay ‘access tolls’ to the grid to
contribute to its maintenance and operations. These access tolls are levied mainly in relation
to the capacity contracted but also depend on the actual use of the grid (i.e. kWh consumed).
In addition, all self-consumers must pay the “charges associated with the electricity system
cost”, as well as the ‘charge for other services of the system’ (i.e. back-up provided by the
electrical system) on all electricity consumed (including the self-generated energy). Some
existing facilities (e.g. cogeneration, small generation of <50 MW) are also temporarily
exempt from the charges until the end of 2019.
The ’sun tax’ reduces the incentive to invest in self-generation facilities and to locate behind
the meter in order to avoid a share of the fixed costs. The solar PV industry complained that
due to the new charges, it could take over 30 years for a new solar PV project to recoup

36
investment costs. More recently, Spanish MPs have signalled that the ‘sun tax’ provisions may
be reviewed, however the measures are still currently in place.40
There also seems to be some evidence of the impact of increasing capacity charges. Figure
6.4 shows a dip in contracted capacity in late 2013 for consumers connected to low voltage
levels and contracted capacity less than 10 kW. This reduction in contracted capacity
coincides with the introduction of higher capacity tariffs.
Figure 6.4: Evolution of contracted capacity of consumers connected to low voltage levels and contracted capacity less than 10 kW
Source: CNMC
Note: The red line shows annual contracted capacity (in kW). The blue line shows the monthly growth
rate in contracted capacity.
6.4. Lessons for GB
Like the Netherlands, Spain offers an example where the balance of cost recovery has been
shifted to capacity charges. Although capacity charges existed in Spain for many years, a shift
from volumetric to capacity charges has taken place recently to deal with the problem of
revenue under-recovery. Compared to GB, the cap on average tariffs applied to generation is
much lower, hence the burden of cost recovery falls overwhelmingly on consumers.41
As network charges represent a significant proportion of the final electricity cost in Spain
(particularly due to inclusion of costs associated with various support schemes), it might be
expected that the tariff structure would have a noticeable impact on the behaviour of
40 http://www.pv-tech.org/news/spains-new-minority-government-a-blessing-in-disguise-for-big-solar 41 According to Regulation (EU) No 838/2010 (Annex Part B), the annual average generation transmission charges in Spain should not exceed €0.5/MWh while in GB the cap is set at €1.2/MWh.

37
network users. There are signs that (even) household consumers have responded to higher
capacity charges by reducing the contracted capacity, although it is still to early to definitively
determine whether this effect will be sustained or indeed significant.
Spain has also adopted measures which seek to make grid-connected consumers with self-
generating facilities contribute more extensively to cost-recovery of fixed network costs. This
has been met with widespread opposition from the affected consumers and the renewable
energy industry. Particularly in Spain, where support schemes such as feed-in tariffs have
already been removed, it is argued that these latest measures will significantly reduce the
take-up of renewable energy technologies.

38
7. ITALY
Distribution charge as percentage of retail bill: 17% of bill42
Mature retail competition in place? No
7.1. The problem
Italy has experienced a revenue under-recovery for network companies, however, unlike in
Spain, the deficit has been much smaller and has been eliminated by feeding the under-
recovery into tariffs in subsequent years. Italy is one of the few countries where capacity
charges are applied to households. All households in Italy are equipped with smart meters,
which can be set to limit the maximum power delivered to the house.43 In Italy, the electricity
distribution grid tariff for household customers consists of three components:
a flat component (€/point of delivery);
a capacity component (€/kW); and
a progressive volumetric component (€/kWh).
The progressive volumetric component of the Italian charging regime has been designed to
reflect equity concerns about applying cost-reflective tariffs to all consumers. However,
changes are being currently introduced that will see the progressive tariff being eliminated in
the current tariff period. We discuss these changes in more detail further below.
7.2. Changes introduced
Italy has recently moved towards a larger share of distribution costs being attributed to fixed
and capacity tariff components (in the past most of the costs were recovered through the
volumetric charge).
In December 2015, the Italian Regulatory Authority for Electricity Gas and Water (AEEGSI)
adopted its final decision on the fifth electricity transmission and distribution price control
review (for the period 2016-2018).44 Following this decision, the capacity component of the
tariff tripled and the fixed component for households increased by 66%.
42 ACER/CEER Annual Report on the Results of Monitoring the Internal Electricity and Gas Markets in 2015 Retail Markets p. 12. http://www.ceer.eu/portal/page/portal/EER_HOME/EER_PUBLICATIONS/NATIONAL_REPORTS/National_Reporting_2016 43 Capacity charges for households in Italy seem to predate smart meters however with the maximum power before smart meters being adjusted by a technician (Brattle report for AEMC) 44 Decision 654/2015

39
Distribution tariffs
There is a defined “ideal” tariff structure for households towards which tariffs are supposed
to evolve over time, but actual tariffs are currently different from the ideal in order to protect
low-income customers.
The ideal tariff is considered to be a cost-reflective tariff. The fixed charge (€/point of delivery)
covers the cost of metering and some other customer related costs. The capacity charge and
variable charge cover the cost of the network.
Figure 7.1 shows household tariff structures for the previous regulatory period. For
households there are three tariffs defined:
D1 tariff is the ‘ideal’ reference tariff for households. It is deemed a cost reflective
tariff but it is not currently applied to customers;
D2 tariff is for households in their place of residence, with contractual power up to 3.3
kW (about 80% of customers);
D3 tariff is for:
o households in their place of residence with contractual power over 3.3 kW;
and
o households in their spare homes (about 20% of customers).
The variable charge for tariffs D2 and D3 is progressive - i.e. with a kWh unit cost that grows
for bands with increasing withdrawals. The tariff structure means that customers with lowest
consumption pay tariffs below the cost reflective level (i.e. below the ideal tariff rates) while
those with highest consumption pay tariffs above the cost reflective level. The progressive
tariff structure provides incentives to reduce consumption from the grid.
Figure 7.1: Illustration of Italian distribution tariff structure for households
Source: Brattle report for AEMC based on AEEGSI published tariffs45
45http://www.brattle.com/system/publications/pdfs/000/005/076/original/The_Structure_of_Electricity_Distribution_Network_Tariffs_and_Residual_Costs.pdf?1422374425

40
Changes introduced in the current regulatory period aim to gradually replace the current
progressive structure of the distribution network tariffs. At the end of the current regulatory
period (2018), the network tariff (i.e. costs paid for the transmission, distribution and
measurement of electricity) and the system charges tariff (i.e. costs for supporting activities
of general interest for the electric system) will be the same for all consumption levels.
Distribution network charges in Italy are uniform across all regions of the country despite the
fact that DNOs receive different revenues. The uniform network charge is calculated so that,
on aggregate, the sum of the DNO allowed revenues equals the amount expected to be raised
through tariffs. The DNOs are then made whole through an ‘equalisation’ process (called
‘perequazione’), which provides for any differences between total revenue raised nationally
from charges and the total revenue that should be earned by the electricity DNOs in total.
Transmission tariffs
From 2016, Italy adopted a new transmission tariff structure. The tariff for all final users but
households is differentiated by class:
A two-part tariff (capacity and energy) was introduced for HV and EHV users only:
o TRASp (€cents/kW); and
o TRASe (€cents/kWh);
For LV and MV users a single part tariff TRASe (€cents/kWh) still applies.
Previously a single part tariff (€/MWh) was charged to DSOs for injecting or withdrawing
energy from the transmission network. Transmission costs are included in the distribution
tariff paid by households. Generation does not pay transmission tariffs in Italy.
In Italy, self-consumption projects are gradually called to contribute to the grid costs,
depending on their capacity:
< 20kW, exempted from grid and system costs;
20-200kW partially exempted; and
>200kW exempted only from system costs.46
7.3. Impact
The impact of the changes taking place in this regulatory period would see tariffs rise at the
lowest consumption levels and reduce at the highest consumption levels – this should lower
the incentives to reduce consumption from the grid.
46http://ec.europa.eu/energy/sites/ener/files/documents/1_EN_autre_document_travail_service_part1_v6.pdf

41
However, it may be too early to see any actual evidence of the impact of tariff structure
changes introduced in 2016.
7.4. Lessons for GB
Italy provides yet another example of a European country that has moved towards a greater
reliance on capacity charges as the basis for network cost recovery. The tariff structure
appears to be broadly in line with efficient charging principles – i.e. recovering (most) fixed
costs through fixed and capacity charges. The tariff structure has been supported by the
widespread availability of smart meters in Italy.
Italy also proves an interesting example of where consumers have not been charged the ‘cost-
reflective’ tariff due to equity concerns. This however is being eliminated in the current tariff
period which may result in regressive distributional impacts.
Given that the changes described in this study have been introduced relatively recently, the
lessons that can be drawn from this case study are limited.