Embed Size (px)
Citation preview

HOW ARE YOU ADAPTING TO A RAPIDLY CHANGING ENERGY LANDSCAPE?Trish Kelliher Shareholder
Everything you want to know about how we’re tackling the big questions.
ANN
UAL R
EPOR
T 2017

ORIGIN ENERGY
CONTENTS
02 WELCOME TO THE 2017 ANNUAL REPORT
04 YEAR AT A GLANCE
08 DIRECTORS' REPORT
12 OPERATING AND FINANCIAL REVIEW
38 RENUMERATION REPORT
67 LEAD AUDITOR’S INDEPENDENCE DECLARATION
68 BOARD OF DIRECTORS
70 EXECUTIVE MANAGEMENT TEAM
73 CORPORATE GOVERNANCE STATEMENT
82 FINANCIAL STATEMENTS
145 DIRECTORS’ DECLARATION
146 INDEPENDENT AUDITOR’S REPORT
152 SHARE AND SHAREHOLDER INFORMATION
154 EXPLORATION AND PRODUCTION PERMITS AND DATA
156 ANNUAL RESERVES REPORT
164 FIVE YEAR FINANCIAL HISTORY
166 GLOSSARY AND INTERPRETATION
On the cover of this Annual Report is Trish Kelliher, an Origin shareholder and also one of our employees. When we recently spoke to Trish, she asked what Origin is doing to ensure that energy remains affordable for families; and how are we making life easier for customers? This information is found in the Energy Markets section of the Operating and Financial Review, as well as in our Shareholder Review and Sustainability Report.

1ORIGIN ENERGY
Origin is focused on a cleaner, smarter and customer-centric energy future.

2 WELCOME TO THE 2017 ANNUAL REPORT 2
WELCOME TO THE 2017 ANNUAL REPORT
In compiling this year’s report, we spent time reflecting on common questions we've been hearing from our shareholders.
Did you meet your commitments for the year? Is the business in good shape? What are you doing for your customers? How are you planning to grow? Are we getting a dividend?
These are all important questions, and we’ve taken time to answer them, among others, in our reporting suite. On that note, we’d like to thank Trish Kelliher, one of our shareholders and also one of our employees, for appearing on the front cover of the report and sharing her questions.
PROGRESS ON COMMITMENTSThis year, we have made good progress towards our commitments, delivering a $1 billion reduction in debt and improving business performance.
Our operational performance for the year was solid, driving increases in Underlying EBITDA and Underlying Profit. However, the full year statutory result was significantly impacted by non-cash impairment charges.
Given our primary focus was to reduce debt, the Board determined not to pay a dividend for the second half of FY2017. We are acutely aware of the importance of dividends to many of our shareholders and this decision was not taken lightly. The Board’s view is that suspension of the dividend is in the best interests of all shareholders at this time.
IMPROVED BUSINESS PERFORMANCEOur solid operational performance delivered an increase in Underlying EBITDA of $834 million, or 49 per cent, to $2.5 billion.
In Energy Markets, our electricity business is performing well and our natural gas portfolio remains a core differentiator.
Australia Pacific LNG has made a strong start to operations, producing 10 per cent above nameplate capacity through the recent 90-day two train Lenders’ Test, proving its resources and facilities are world class. In response to the low oil price environment, Australia Pacific LNG is focused on improving productivity and significantly reducing its cost base.

3WELCOME TO THE 2017 ANNUAL REPORT
WHAT WE’RE DOING FOR CUSTOMERS We are aware that rising energy prices are hurting many Australian households and businesses. Origin is helping those in hardship by making sure they will not pay the recent price increases and ensuring they are on our best offer with no conditions attached. We are also behind the push to simplify energy and help customers more easily compare offers.
Bringing energy prices down will require a whole of industry response, including networks, generators and retailers. Origin is taking action to put downwards pressure on prices by increasing our supply of low-cost renewables to more than 25 per cent of our generation mix within three years, and boosting generation from Eraring.
We will continue to advocate for policy certainty, particularly the adoption of a Clean Energy Target as the critical action needed to stimulate further investment in new supply and deliver a genuine reduction in prices for Australians.
OUTLOOK FOR GROWTHThrough our two businesses Energy Markets and Integrated Gas, Origin is focused on a cleaner, smarter and customer-centric energy future.
We expect our two businesses to underpin growth in the year ahead, subject to market conditions and the regulatory environment. Energy Markets Underlying EBITDA for FY2018 is expected to be in the range of $1.7 billion to $1.8 billion, up 14 to 21 per cent on FY2017.
Integrated Gas is expected to achieve production in the range of 245 to 265 PJ in FY2018, up 7 to 16 per cent on FY2017.
Debt reduction remains a key priority and Origin is targeting adjusted net debt of below $7 billion by the end of FY2018, pending the divestment of Lattice Energy, our conventional gas assets. We remain on track to execute this by the end of 2017.
NEW LEADERS This year we were pleased to welcome to our leadership team, Lawrie Tremaine as Chief Financial Officer and Mark Schubert as head of Integrated Gas.
Teresa Engelhard joined the Board as an independent non-executive director, bringing valuable expertise in technology and innovation as we transition to a cleaner and smarter energy future. We farewelled Helen Nugent and thank her for her enormous contribution.
Our employees are the heart and soul of Origin and central to any success we achieve. We acknowledge their incredible efforts and the great pride they take in Origin.
In closing, we are operating in an environment where stakeholder expectations are evolving rapidly. We are committed to meeting those expectations by being more responsive, efficient and adaptable.
We’re confident if we do this, we can continue to build on our core strengths, grow new businesses and transform our culture to position Origin for success.
We look forward to speaking with many of you at our forthcoming AGM on 18 October.
Thank you for your continued support.
Gordon Cairns Chairman
Frank Calabria Managing Director
increase in underlying EBITDA to $2.5 billion
49%
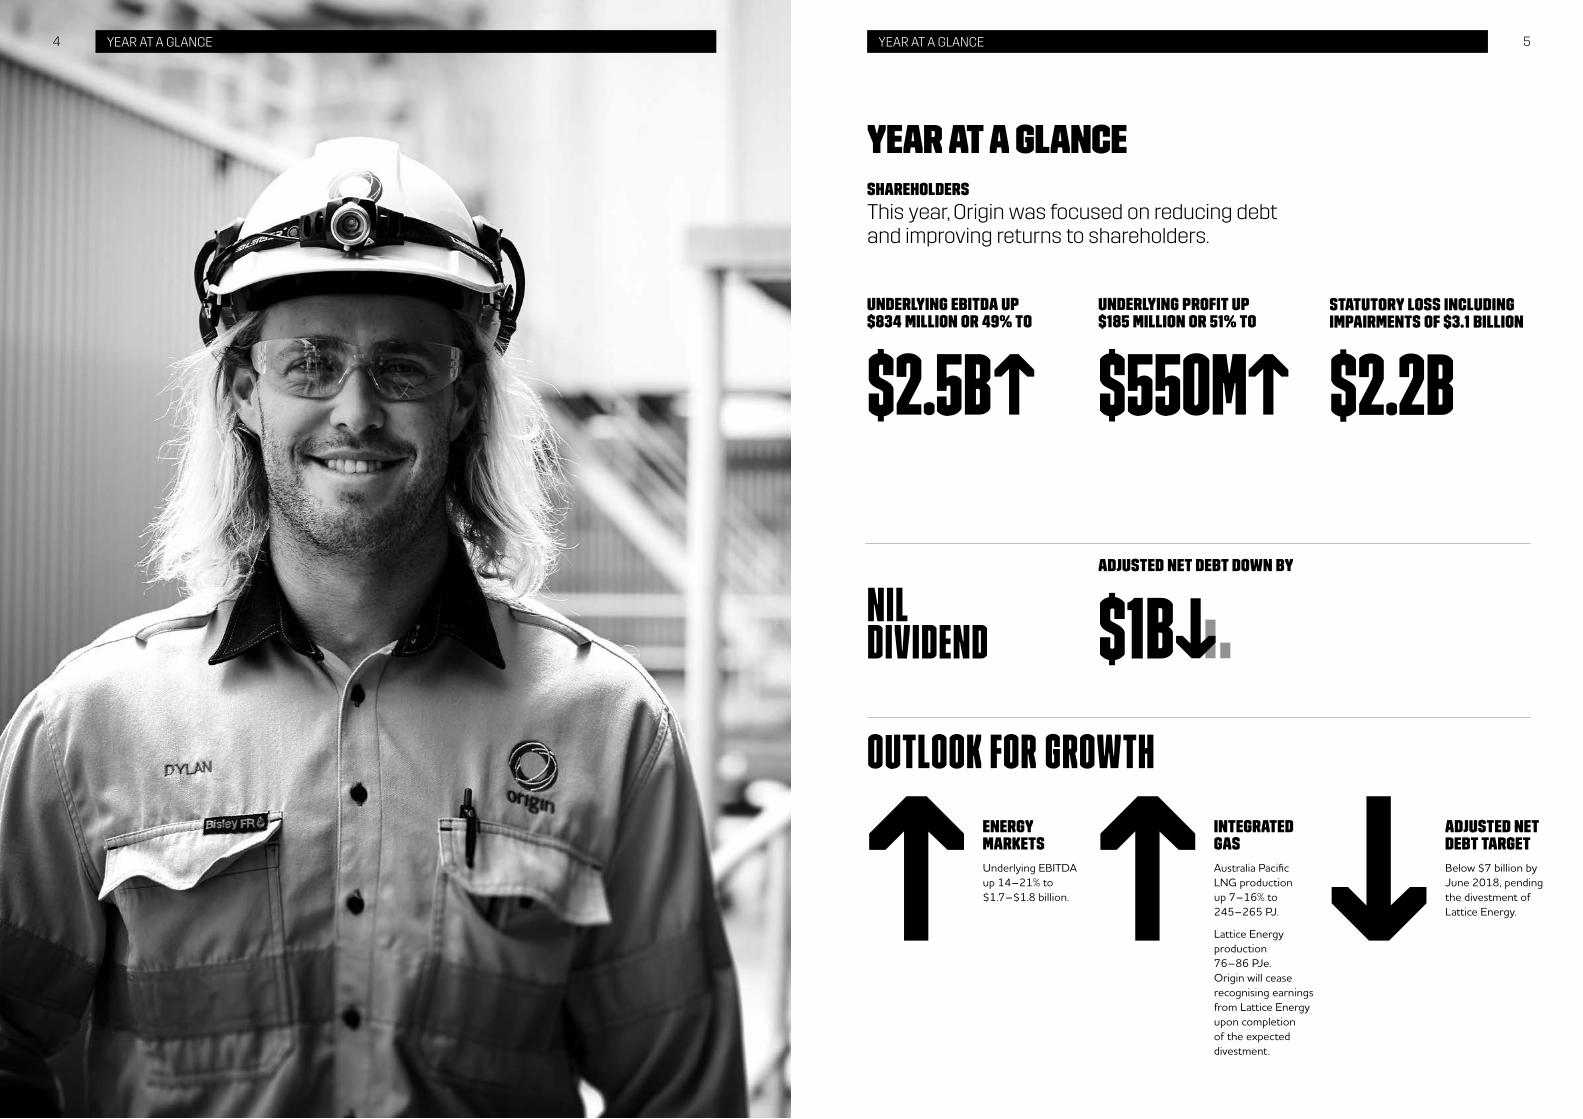
4 5YEAR AT A GLANCE YEAR AT A GLANCE
OUTLOOK FOR GROWTH
NIL DIVIDEND
STATUTORY LOSS INCLUDING IMPAIRMENTS OF $3.1 BILLION
$2.2B
YEAR AT A GLANCE SHAREHOLDERS
This year, Origin was focused on reducing debt and improving returns to shareholders.
ADJUSTED NET DEBT DOWN BY
$1B
↑ENERGY MARKETS
Underlying EBITDA up 14–21% to $1.7–$1.8 billion. ↑
INTEGRATED GAS
Australia Pacific LNG production up 7–16% to 245–265 PJ.
Lattice Energy production 76–86 PJe. Origin will cease recognising earnings from Lattice Energy upon completion of the expected divestment.
↓ADJUSTED NET DEBT TARGET
Below $7 billion by June 2018, pending the divestment of Lattice Energy.
UNDERLYING EBITDA UP $834 MILLION OR 49% TO
$2.5B↑UNDERLYING PROFIT UP $185 MILLION OR 51% TO
$550M↑

6 7YEAR AT A GLANCEYEAR AT A GLANCE6
CUSTOMERS PEOPLE
In 2017, Origin was also focused on delivering better outcomes for customers, our people and the community.
IMPROVING OUR CULTURE
– New leaders – Creating a more
responsive, efficient and adaptable company
- NPS ↑ 4 points to 16.1 - business customer
satisfaction ↑ 11 points to 76- ombudsman complaints ↓
IMPROVED CUSTOMER SATISFACTION
with domestic commercial and industrial customers
760 GAS DEALS
COMMUNITIES
EMPLOYEE ENGAGEMENT
↑ 5 percentage points to 58%
DIGITAL MAKING LIFE EASIER FOR CUSTOMERS
– Online sales ↑ 23% – My Accounts visits ↑ 30%
to 2.5 million customers – 1.8 million customers on
e-billing, ↑ 15%
HELPING CUSTOMERS IN HARDSHIP
Customers in financial hardship program will not pay recent price rises
3.2our best ever result
IMPROVED SAFETY PERFORMANCE WITH TRIFR OF
Connected home solution focusing on home monitoring
Technology to itemise energy use in the home
INVESTING IN FUTURE ENERGY SOLUTIONS
OUR PEOPLE VOLUNTEERED THEIR TIME TO SUPPORT GOOD CAUSES
to support good causes in education and help Australians reach their potential
+$20MSINCE 2010 THE ORIGIN FOUNDATION HAS CONTRIBUTED
5,912 HRS

8
4 EVENTS SUBSEQUENT TO BALANCE DATE
No matters or circumstances have arisen since 30 June 2017, which have significantly affected, or may significantly affect the Company’s operations, the results of those operations or the Company’s state of affairs in future financial years.
5 DIVIDENDS
No Dividends were paid during the year by the Company and the Directors have determined that no final dividend will be payable for the year ended 30 June 2017.
6 DIRECTORS
The Directors of the Company at any time during or since the end of the financial year are:
Gordon Cairns (Chairman)Frank Calabria (Chief Executive Officer & Managing Director) (appointed 19 October 2016)Grant King (Managing Director) (retired 19 October 2016)John AkehurstMaxine BrennerTeresa Engelhard (appointed 1 May 2017)Bruce MorganHelen Nugent (retired 3 March 2017)Scott PerkinsSteve Sargent
7 INFORMATION ON DIRECTORS AND COMPANY SECRETARIES
Information relating to current Directors’ qualifications, experience and special responsibilities is set out on pages 68 and 69. The qualifications and experience of the Company Secretaries are also set out below.
Andrew Clarke Group General Counsel and Company Secretary
Andrew Clarke joined Origin in May 2009 and is responsible for the company secretarial and legal functions. He was a partner of a national law firm for 15 years and was Managing Director of a global investment bank for more than two years prior to joining Origin. Andrew has a Bachelor of Laws (Hons) and a Bachelor of Economics from the University of Sydney, and is a member of the Australian Institute of Company Directors.
Helen Hardy Company Secretary
Helen Hardy joined Origin in March 2010. She was previously General Manager, Company Secretariat of a large ASX listed company, and has advised on governance, financial reporting and corporate law at a Big 4 accounting firm and a national law firm. Helen is a Chartered Accountant and Chartered Secretary and a Graduate Member of the Australian Institute of Company Directors. She holds a Bachelor of Laws and a Bachelor of Commerce from the University of Melbourne, and is admitted to practice in New South Wales and Victoria.
In accordance with the Corporations Act 2001 (Cth), the Directors of Origin Energy Limited (Company) report on the Company and the consolidated entity Origin Energy Group (Origin), being the Company and its controlled entities for the year ended 30 June 2017.
The Operating and Financial Review and Remuneration Report form part of this Directors’ Report.
1 PRINCIPAL ACTIVITIES
During the year, the principal activity of Origin was the operation of energy businesses including:
– exploration and production of oil and gas;
– electricity generation;
– wholesale and retail sale of electricity and gas; and
– sale of liquefied natural gas.
There were no other significant changes in the nature of these activities during the year.
2 REVIEW OF OPERATIONS & FUTURE DEVELOPMENTS
A review of the operations and results of operations of Origin during the year, the financial position of Origin and the business strategies and prospects for future financial years, is set out in the Operating and Financial Review, which forms part of this Directors’ Report.
3 SIGNIFICANT CHANGES IN THE STATE OF AFFAIRS
The following significant changes in the state of affairs of the Company occurred during the year:
AUSTRALIA PACIFIC LNGIn October 2016, the second train of Australia Pacific LNG’s two train CSG to LNG project was commissioned. In July, Australia Pacific LNG completed the 90-day operational phase of the two-train project finance lenders’ test, producing more than 10% above nameplate capacity.
DEVELOPMENTIn the Otway Basin, production commenced from the Halladale and Speculant wells. In the Bass Basin, the Yolla compressor was successfully commissioned in June 2017 which is expected to maximise production over the life of the field.
ACTIONS TAKEN TO REDUCE DEBTOrigin achieved $1 billion of asset sales, above the target of $800 million.
Origin announced the intention to divest Lattice Energy, the name given to the upstream conventional gas business, via a dual track Initial Public Offering (IPO)/trade sale process.
Adjusted net debt reduced by $1 billion to $8.1 billion driven by proceeds from asset sales and operating cash flows which were more than sufficient to fund capital expenditure, including net contributions to Australia Pacific LNG and interest payments.
The events described above and those disclosed in the Financial Statements represent the significant changes in the state of affairs of Origin for the year ended 30 June 2017.
DIRECTORS’ REPORT
DIRECTORS’ REPORT FOR THE YEAR ENDED 30 JUNE 2017

9
8 DIRECTORS’ MEETINGS
The number of Directors’ meetings, including Board committee meetings, and the number of meetings attended by each Director during the financial year are shown in the table below:
BOARD MEETINGS COMMITTEE MEETINGS
SCHEDULED ADDITIONAL AUDIT
HEALTH, SAFETY AND
ENVIRONMENT (HSE) NOMINATION
REMUNERATION AND PEOPLE RISK
DIRECTORS H A H A H A H A H A H A H A
G Cairns 10 10 4 4 6 6 4 4 1 1 7 7 5 5F Calabria1 8 8 3 3 – – 3 2 – – – – – –J Akehurst 10 10 4 4 – – 4 4 1 1 – – 5 5M Brenner 10 10 4 4 6 6 – – 1 1 – – 5 5G King2 3 3 – – 1 1 1 1 – – – – – –B Morgan 10 10 4 4 6 6 4 4 1 1 – – 5 5T Engelhard3 2 2 – – – – – – – – 1 1 – –H Nugent4 6 6 4 4 5 5 – – – – 4 4 3 3S Perkins 10 10 4 3 6 6 – – 1 1 7 7 1 1S Sargent 10 10 4 4 – – 4 4 – – 7 7 – –
1 From the date of appointment on 19 October 2016.2 Up to the date of retirement on 19 October 2016.3 From the date of appointment on 1 May 2017.4 Up to the date of retirement on 3 March 2017.H Number of scheduled meetings held during the time that the Director held office or was a member of the committee during the year.A Number of meetings attended.
The Board held ten scheduled meetings, including a two-day strategic review meeting and four additional meetings to deal with urgent matters. There were also seven Board or Committee workshops to consider matters of particular relevance. In addition, the Board conducted visits of Company operations at various sites and met with operational management during the year.
DIRECTORS’ REPORT

10
9 DIRECTORS’ INTERESTS IN SHARES, OPTIONS AND RIGHTS
The relevant interests of each Director as at 30 June 2017 in the shares and Options or Rights over such instruments issued by the companies within the consolidated entity and other related bodies corporate at the date of this report are as follows:
DIRECTORORDINARY SHARES HELD
DIRECTLY AND INDIRECTLYOPTIONS OVER
ORDINARY SHARES
DEFERRED SHARE RIGHTS (DSR) OVER ORDINARY SHARES
PERFORMANCE SHARE RIGHTS (PSR) OVER ORDINARY SHARES
G Cairns 163,660 – – –F Calabria 163,530 1,096,0461 107,9212 145,0292
J Akehurst 71,200 – – –M Brenner 22,117 – – –T Engelhard – – – –B Morgan 47,143 – – –S Sargent 31,429 – – –S Perkins 30,000 – – –
Exercise price for Options and Rights:1 67,124: $13.97; 227,065: $15.65; 570,150: $6.78; 231,707: $5.67.2 Nil.
No Director other than the Chief Executive Officer & Managing Director participates in the Company’s Equity Incentive Plan.
OPTIONS AND RIGHTS GRANTED BY ORIGINNon-executive Directors do not receive Options or Rights as part of their remuneration. The following Options and Rights were granted to the Chief Executive Officer & Managing Director and the 5 most highly remunerated officers (other than Directors) of the Company during the year ended 30 June 2017:
OPTIONS DSRS PSRS
J Briskin – 11,548 35,657G Jarvis 71,708 21,817 20,741G Mallett 71,951 19,748 20,811M Schubert 70,391 49,776 20,360A Clarke 110,365 28,941 77,815
Each of these awards was made in accordance with the Company’s Equity Incentive Plan as part of the relevant executive’s remuneration. Further details on options and rights granted during the financial year, and unissued shares under Options and Rights, are included in Section 6 of the Remuneration Report.
No Options or Rights were granted since the end of the financial year.
ORIGIN SHARES ISSUED ON THE EXERCISE OF OPTIONS AND RIGHTSOptionsNo Options granted under the Equity Incentive Plan were exercised during or since the year ended 30 June 2017, so no ordinary shares in Origin were issued as a result.
Rights1,908,079 ordinary shares of Origin were issued during the year ended 30 June 2017 on the vesting and exercise of DSRs granted under the Equity Incentive Plan. No amount is payable on the vesting of those DSRs and, accordingly, no amounts remain unpaid in respect of any of those shares.
Since 30 June 2017, 57,729 ordinary shares were issued on the vesting of DSRs granted under the Equity Incentive Plan. No amount is payable on the vesting of those DSRs and, accordingly, no amounts remain unpaid in respect of any of those shares.
DIRECTORS’ REPORT

11DIRECTORS’ REPORT
13 NON-AUDIT SERVICES
The amounts paid or payable to KPMG for non-audit services provided during the year was $971,000 (shown to nearest thousand dollar). Amounts paid to KPMG are included in F7 to the full financial statements.
Based on written advice received from the Audit Committee Chairman pursuant to a resolution passed by the Audit Committee, the Board has formed the view that the provision of those non-audit services by KPMG is compatible with, and did not compromise, the general standards of independence for auditors imposed by the Corporations Act 2001 (Cth). The Board’s reasons for concluding that the non-audit services provided by KPMG did not compromise its independence are:
– all non-audit services provided were subjected to the Company’s corporate governance procedures and were either below the pre-approved limits imposed by the Audit Committee or separately approved by the Audit Committee;
– all non-audit services provided did not, and do not, undermine the general principles relating to auditor independence as they did not involve reviewing or auditing the auditor’s own work, acting in a management or decision making capacity for the Company, acting as an advocate for the Company or jointly sharing risks and rewards; and
– there were no known conflict of interest situations nor any other circumstance arising out of a relationship between Origin (including its Directors and officers) and KPMG which may impact on auditor independence.
14 PROCEEDINGS ON BEHALF OF THE COMPANY
No proceedings have been brought on behalf of the Company, nor have any applications been made in respect of the Company under section 237 of the Corporations Act 2001 (Cth).
15 ROUNDING OF AMOUNTS
The Company is of a kind referred to in ASIC Corporations (Rounding in Financial/Directors’ Reports) Instrument 2016/191 dated 24 March 2016 and in accordance with that class order, amounts in the financial report and Directors’ Report have been rounded off to the nearest million dollars unless otherwise stated.
16 REMUNERATION
The Remuneration Report forms part of this Directors’ Report.
10 ENVIRONMENTAL REGULATION AND PERFORMANCE
The Company’s operations are subject to environmental regulation under Commonwealth, State, and Territory legislation. For the year ended 30 June 2017, the Company’s Australian operations recorded some environmental incidents arising from Origin’s activities including those where Origin was the operator of a joint venture. These incidents resulted in environmental impacts mostly with a moderate and temporary nature. Regulators were notified of reportable environmental incidents. The Company received 12 notices that included requests for further information, and official warnings. These included four penalty infringement notices totalling $46,964. Appropriate remedial actions have been taken or are being undertaken in response to each notice and reportable environmental incident.
11 INDEMNITIES AND INSURANCE FOR DIRECTORS AND OFFICERS
Under its Constitution, the Company may indemnify current and past Directors and Officers for losses or liabilities incurred by them as a Director or Officer of the Company or its related bodies corporate to the extent allowed under law. The Constitution also permits the Company to purchase and maintain a Directors’ and Officers’ insurance policy. No indemnity has been granted to an auditor of the Company in their capacity as auditor of the Company.
The Company has entered into agreements with current Directors and certain former Directors whereby it will indemnify those Directors from all losses or liabilities in accordance with the terms of, and subject to the limits set by, the Constitution.
The agreements stipulate that the Company will meet the full amount of any such liability, including costs and expenses to the extent allowed under law. The Company is not aware of any liability having arisen, and no claim has been made against the Company during or since the year ended 30 June 2017 under these agreements.
During the year, the Company has paid insurance premiums in respect of Directors’ and Officers’ liability, and legal expense insurance contracts for the year ended 30 June 2017.
The insurance contracts insure against certain liability (subject to exclusions) of persons who are or have been Directors or Officers of the Company and its controlled entities. A condition of the contracts is that the nature of the liability indemnified and the premium payable not be disclosed.
12 AUDITOR INDEPENDENCE
There is no former partner or director of KPMG, the Company’s auditors, who is or was at any time during the year ended 30 June 2017 an officer of the Origin Energy Group. The auditor’s independence declaration for the financial year (made under section 307C of the Corporations Act (Cth)) is attached to and forms part of this Report.

12 ORIGIN ENERGY PAGE TITLE 12 OPERATING AND FINANCIAL REVIEW
IMPORTANT INFORMATION
This Operating and Financial Review (OFR) contains forward looking statements, including statements of current intention, statements of opinion and predictions as to possible future events and future financial prospects. Such statements are not statements of fact and there can be no certainty of outcome in relation to the matters to which the statements relate. Forward looking statements involve known and unknown risks, uncertainties, assumptions and other important factors that could cause the actual outcomes to be materially different from the events or results expressed or implied by such statements, and the outcomes are not all within the control of Origin. Statements about past performance are not necessarily indicative of future performance.
Neither the Company nor any of its subsidiaries, affiliates and associated companies (or any of their respective officers, employees or agents) (the ‘Relevant Persons’) makes any representation, assurance or guarantee as to the accuracy or likelihood of fulfilment of any forward looking statement or any outcomes expressed or implied in any forward looking statement. The forward looking statements in this OFR reflect views held only at the date of this report and except as required by applicable law or the ASX Listing Rules, the Relevant Persons disclaim any obligation or undertaking to publicly update any forward looking statements, or discussion of future financial prospects, whether as a result of new information or future events.
This OFR and Directors’ Report refer to Origin’s financial results, including Origin’s Statutory Profit and Underlying Profit. Origin’s Statutory Profit contains a number of items that when excluded provide a different perspective on the financial and operational performance of the business. Income Statement amounts, presented on an underlying basis such as Underlying Profit, are non-International Financial Reporting Standards (IFRS) financial measures, and exclude the impact of these items consistent with the manner in which senior management reviews the financial and operating performance of the business. Each underlying measure disclosed has been adjusted to remove the impact of these items on a consistent basis. A reconciliation and description of the items that contribute to the difference between Statutory Profit and Underlying Profit is provided in Section 2.2 of this OFR.
Certain other non-IFRS financial measures are also included in this OFR. These non-IFRS financial measures are used internally by management to assess the performance of Origin’s business and make decisions on allocation of resources. Further information regarding the non-IFRS financial measures is included in the Glossary on pages 166 to 168. Non-IFRS measures have not been subject to audit or review. Certain comparative amounts from the prior corresponding period have been re-presented to conform to the current period’s presentation.
A dual track Initial Public Offering (IPO)/trade sale process is currently underway for Lattice Energy, the name given to Origin’s upstream conventional business. On 10 August 2015, Origin divested its entire 53.09 per cent interest in Contact Energy. Origin has also undertaken the sales program of a number of infrastructure assets in recent periods. Lattice Energy, Contact Energy and other selected assets are treated as ‘held for sale’ and ‘discontinued operations’ in Origin’s statutory financial statements. Financial information in this report, unless otherwise stated, references total operations including those classified as discontinued, consistent with the way Origin management assesses performance. Note E4 of Origin’s accounts contains earnings, cash flow and statement of financial position for Discontinued Operations.
Disclosures of Origin and Australia Pacific LNG’s reserves and resources are as at 30 June 2017. These reserves and resources were announced on the same date as the release of this Operating and Financial Review in Origin’s Annual Reserves Report for the year ended 30 June 2017. Petroleum reserves and contingent resources are typically prepared by deterministic methods with support from probabilistic methods. Petroleum reserves and contingent resources are aggregated by arithmetic summation by category and as a result, proved reserves (1P reserves) may be a conservative estimate due to the portfolio effects of the arithmetic summation. Proved plus probable plus possible (3P reserves) may be an optimistic estimate due to the same aforementioned reasons.
Some of Australia Pacific LNG’s CSG interests are subject to reversionary rights to transfer back to Tri-Star a 45 per cent interest in Australia Pacific LNG’s share of those CSG interests that were acquired from Tri-Star in 2002 if certain conditions are met. Please refer to section 5 for further information.
OPERATING AND FINANCIAL REVIEW FOR THE YEAR ENDED 30 JUNE 2017

13ORIGIN ENERGY PAGE TITLE 13OPERATING AND FINANCIAL REVIEW
ORIGIN IS A LEADING AUSTRALIAN INTEGRATED ENERGY COMPANYThrough its two businesses, Energy Markets and Integrated Gas, Origin is focused on a cleaner, smarter, customer-centric energy future.
– Retail sales of electricity, gas and other customer solutions
– Electricity generation
– Wholesale trading of electricity and gas
ENERGY MARKETS IS FOCUSED ON:
– Transforming customer experience through digital, innovative products and future energy solutions;
– Building on the strength of its gas and electricity supply portfolio; and
– Accelerating the growth of renewable energy.
ENERGY MARKETS
LEADING ENERGY RETAILER
LARGE AND FLEXIBLE GAS SUPPLY
SIGNIFICANT GENERATION PORTFOLIO
4.2 million gas, electricity and LPG customer accounts
Contracted gas supply beyond 2022
~ 6,000MW with fuel and geographic diversity
GROWING RENEWABLE SUPPLY
From approximately 10% of our generation mix to more than 25% by 2020
14 ORIGIN ENERGY PAGE TITLE 14 OPERATING AND FINANCIAL REVIEW
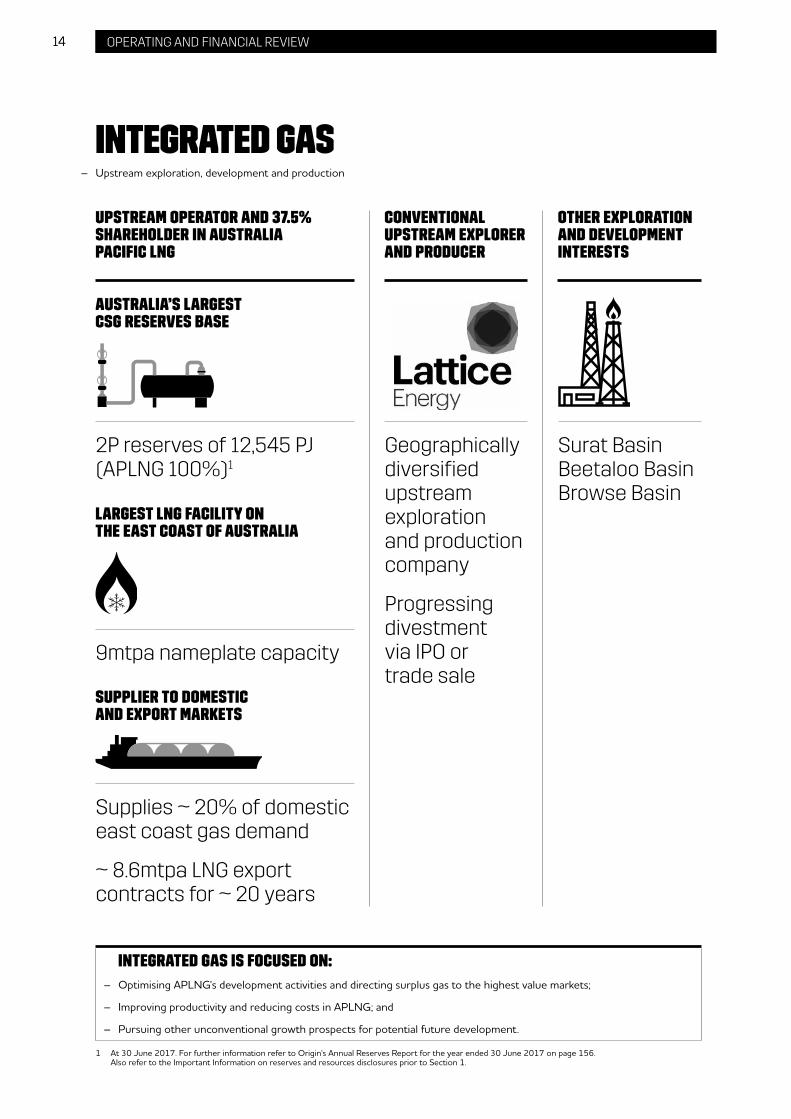
– Upstream exploration, development and production
INTEGRATED GAS
INTEGRATED GAS IS FOCUSED ON:
– Optimising APLNG's development activities and directing surplus gas to the highest value markets;
– Improving productivity and reducing costs in APLNG; and
– Pursuing other unconventional growth prospects for potential future development.
1 At 30 June 2017. For further information refer to Origin's Annual Reserves Report for the year ended 30 June 2017 on page 156. Also refer to the Important Information on reserves and resources disclosures prior to Section 1.
AUSTRALIA’S LARGEST CSG RESERVES BASE
LARGEST LNG FACILITY ON THE EAST COAST OF AUSTRALIA
SUPPLIER TO DOMESTIC AND EXPORT MARKETS
UPSTREAM OPERATOR AND 37.5% SHAREHOLDER IN AUSTRALIA PACIFIC LNG
CONVENTIONAL UPSTREAM EXPLORER AND PRODUCER
OTHER EXPLORATION AND DEVELOPMENT INTERESTS
2P reserves of 12,545 PJ (APLNG 100%)1
Geographically diversified upstream exploration and production company
Progressing divestment via IPO or trade sale
Surat BasinBeetaloo BasinBrowse Basin
9mtpa nameplate capacity
Supplies ~ 20% of domestic east coast gas demand
~ 8.6mtpa LNG export contracts for ~ 20 years

15ORIGIN ENERGY PAGE TITLE 15OPERATING AND FINANCIAL REVIEW
Discover our interactive map online
UPSTREAM ACREAGEOrigin Energy
Australia Pacific LNG
Lattice Energy
GENERATIONPower station (gas-fired)Power station (coal-fired)Contracted wind generationPumped hydro generation Contracted solar generation
Production facility
Development proposal
Under construction
Office
LPG seaboard terminal
Customer accounts.
In addition to the seven LPG seaboard terminals on the east coast of Australia, Origin also operates 37 inland terminals, servicing every state/territory of Australia; and in eight countries across the Pacific and Vietnam with 25 seaboard and inland terminals.
16 ORIGIN ENERGY PAGE TITLE 16 OPERATING AND FINANCIAL REVIEW
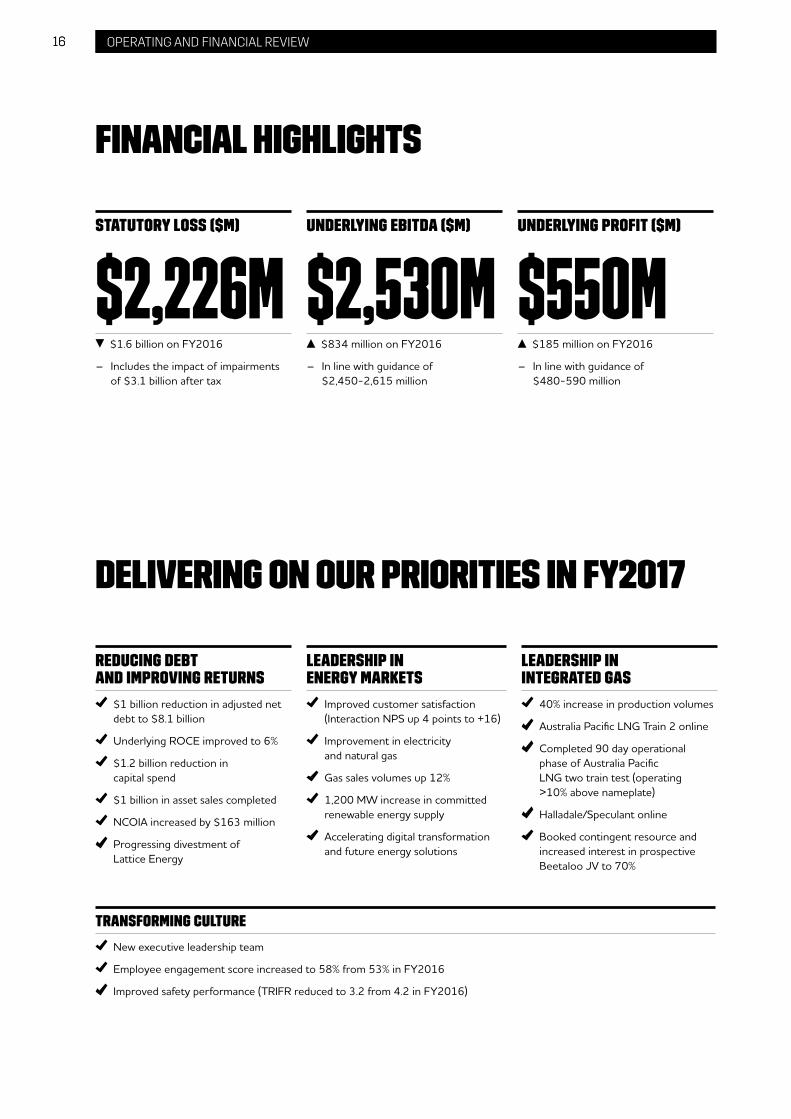
STATUTORY LOSS ($M)
$2,226MUNDERLYING EBITDA ($M)
$2,530MUNDERLYING PROFIT ($M)
$550M
$1.6 billion on FY2016
– Includes the impact of impairments of $3.1 billion after tax
$834 million on FY2016
– In line with guidance of $2,450-2,615 million
$185 million on FY2016
– In line with guidance of $480-590 million
REDUCING DEBT AND IMPROVING RETURNS
LEADERSHIP IN ENERGY MARKETS
LEADERSHIP IN INTEGRATED GAS
$1 billion reduction in adjusted net debt to $8.1 billion
Underlying ROCE improved to 6%
$1.2 billion reduction in capital spend
$1 billion in asset sales completed
NCOIA increased by $163 million
Progressing divestment of Lattice Energy
Improved customer satisfaction (Interaction NPS up 4 points to +16)
Improvement in electricity and natural gas
Gas sales volumes up 12%
1,200 MW increase in committed renewable energy supply
Accelerating digital transformation and future energy solutions
40% increase in production volumes
Australia Pacific LNG Train 2 online
Completed 90 day operational phase of Australia Pacific LNG two train test (operating >10% above nameplate)
Halladale/Speculant online
Booked contingent resource and increased interest in prospective Beetaloo JV to 70%
FINANCIAL HIGHLIGHTS
DELIVERING ON OUR PRIORITIES IN FY2017
TRANSFORMING CULTURE
New executive leadership team
Employee engagement score increased to 58% from 53% in FY2016
Improved safety performance (TRIFR reduced to 3.2 from 4.2 in FY2016)
17ORIGIN ENERGY PAGE TITLE 17OPERATING AND FINANCIAL REVIEW
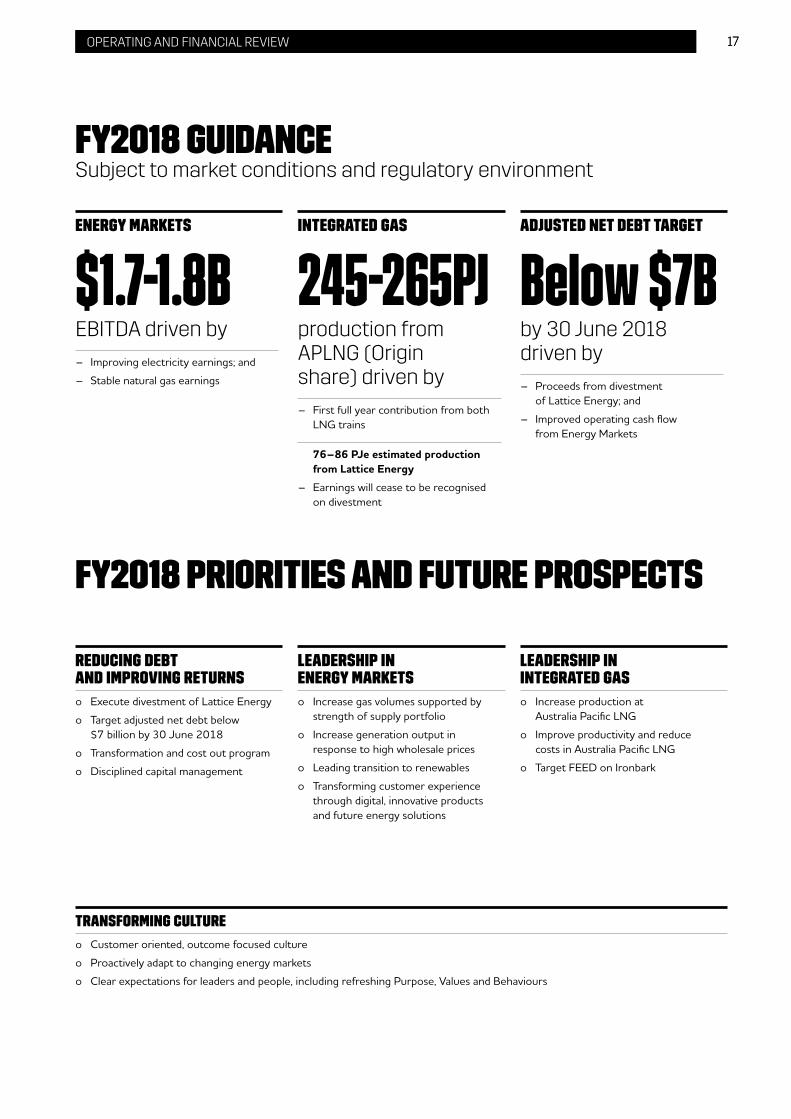
ENERGY MARKETS
$1.7-1.8BINTEGRATED GAS
245-265PJADJUSTED NET DEBT TARGET
Below $7B
EBITDA driven by – Improving electricity earnings; and
– Stable natural gas earnings
production from APLNG (Origin share) driven by
– First full year contribution from both LNG trains
76–86 PJe estimated production from Lattice Energy
– Earnings will cease to be recognised on divestment
by 30 June 2018 driven by
– Proceeds from divestment of Lattice Energy; and
– Improved operating cash flow from Energy Markets
FY2018 GUIDANCESubject to market conditions and regulatory environment
FY2018 PRIORITIES AND FUTURE PROSPECTS
REDUCING DEBT AND IMPROVING RETURNS
LEADERSHIP IN ENERGY MARKETS
LEADERSHIP IN INTEGRATED GAS
o Execute divestment of Lattice Energy
o Target adjusted net debt below $7 billion by 30 June 2018
o Transformation and cost out program
o Disciplined capital management
o Increase gas volumes supported by strength of supply portfolio
o Increase generation output in response to high wholesale prices
o Leading transition to renewables
o Transforming customer experience through digital, innovative products and future energy solutions
o Increase production at Australia Pacific LNG
o Improve productivity and reduce costs in Australia Pacific LNG
o Target FEED on Ironbark
TRANSFORMING CULTURE
o Customer oriented, outcome focused culture
o Proactively adapt to changing energy markets
o Clear expectations for leaders and people, including refreshing Purpose, Values and Behaviours
18 ORIGIN ENERGY PAGE TITLE 18 OPERATING AND FINANCIAL REVIEW
REDUCING DEBT AND IMPROVING RETURNSOver the last 6 months, Adjusted Net Debt has been reduced from $9.1 billion to $8.1 billion. With the expected proceeds from the sale of Lattice Energy and continued focus on improving returns and cash flow, Adjusted Net Debt is expected to reduce to below $7 billion by 30 June 2018.
LEADERSHIP IN ENERGY MARKETSOrigin aspires to take a leading role in the transition to a cleaner and smarter energy future by accelerating the development of large scale renewables and focusing on developing new products to improve customer experience and lifetime value.
In the near term, the Australian energy market is expected to continue to be characterised by tight gas and electricity markets with high wholesale prices. Origin’s large and flexible gas supply portfolio will continue to meet the needs of major industrial and residential customers as well as support energy security through gas-fired generation. With strong gas supply beyond and flexible transport, Origin’s gas portfolio is expected to support volume growth and sustainable earnings in FY2018. The electricity supply portfolio is also well positioned to deliver a competitive cost of energy and support continued improvement in returns in FY2018.
Renewables represent the lowest cost investment in new electricity generation today and will support a competitive cost of energy over the medium to long term. Origin has an ambition to add up to 1,500 MW of new renewable supply to its portfolio by 2020 which is expected to increase the proportion of renewables in its generation mix from approximately 10 per cent today to more than 25 per cent by 2020. Since March 2016, Origin has already committed to approximately 1,200 MW of new renewables which will progressively come into its portfolio from 2H FY2018. As Origin generates less energy than it sells, it is well placed to bring renewables into its portfolio without stranding existing generation assets. Origin also operates Australia’s largest fleet of peaking gas-fired generators which are expected to play an increasingly important role in supporting the growth of intermittent non-dispatchable renewable energy, along with batteries in the longer term.
Customers are increasingly attracted to technologies and services that enhance their energy experience and give them greater transparency, control and efficiency. These include solar generation and battery storage, connected homes, energy efficiency technology and energy usage management. In response to these changing customer needs, Origin is proactively engaging with cutting edge start-up companies in order to conduct trials of new energy technologies, and explore new ways of interacting with customers. Origin has established a small presence in Silicon Valley in the US via an office sharing arrangement with innogy, a large German new energy company. Origin and innogy are also co-founders of the Free Electrons initiative – a global accelerator that brings together eight forward-thinking utilities and 12 leading start-ups in the areas of renewables, smart grids, electric vehicles and home energy management.
Origin is equally committed to supporting, working with, and investing in, Australian innovation. This includes recently becoming principal sponsor of EnergyLab, the new home for clean energy innovation in Australia, hosted by the University of Technology, Sydney.
LEADERSHIP IN INTEGRATED GASIn July 2017 Australia Pacific LNG successfully concluded the 90-day operational phase of the two train project finance lenders’ test, with the plant performing at more than 10 per cent above design nameplate capacity during the 90 day period. All other elements of the project finance completion tests are on track and Australia Pacific LNG expects that formal certification that they have been satisfied will be provided during the first quarter of FY2018. When formal certifications are received, the remaining US$3.4 billion of shareholder guarantees relating to Australia Pacific LNG’s US$8.5 billion project finance facility will be formally released. Australia Pacific LNG now has the opportunity to take advantage of potential opportunities to sell additional gas into the domestic market.
As upstream operator of Australia Pacific LNG, Origin is focused on improving productivity and reducing its cost base. This includes optimising well designs, well placement and well maintenance to maximise output and minimise unit rate development and operating costs. As well as focusing on leaner operating processes; and integrated planning to drive strategic long term decisions and optimise medium term capital deployment.
Origin is also continuing to pursue other unconventional growth prospects for future development, including at its 100 per cent owned Ironbark resource, where it aims to enter FEED on a Phase 1 Development concept during FY2018. In the Beetaloo Basin, Origin continues to support the Northern Territory Government’s Scientific Inquiry into Hydraulic Fracturing of Onshore Unconventional reservoirs, having announced in February 2017 the discovery of a gross 2C contingent resource of 6.6 Tcf, based on early exploration results (refer to Origin’s announcement to the ASX on 15 February 2017 for further information regarding this discovery).

19ORIGIN ENERGY PAGE TITLE 19OPERATING AND FINANCIAL REVIEW
2. REVIEW OF OPERATIONS
2.1 FINANCIAL PERFORMANCE
YEAR ENDED 30 JUNE2017
($MILLION)2016
($MILLION)CHANGE
($MILLION)
STATUTORY FINANCIAL PERFORMANCE1:
Statutory profit/(loss)2 (2,226) (628) (1,598)Statutory earnings per share (126.9¢) (39.8¢) (87.1¢)Items excluded from underlying profit (post-tax)3 (2,776) (993) (1,783)
UNDERLYING FINANCIAL PERFORMANCE:
Energy Markets underlying EBITDA 1,492 1,330 162Integrated Gas underlying EBITDA 1,104 386 718Corporate underlying EBITDA (66) (81) 15Contact Energy underlying EBITDA – 61 (61)Underlying EBITDA 2,530 1,696 834Underlying depreciation and amortisation (477) (624) 147Underlying share of ITDA (925) (296) (629)Underlying EBIT 1,128 776 352Underlying net financing costs4 (296) (109) (187)Underlying profit before income tax and non-controlling interests 832 667 165Underlying income tax expense (279) (286) 7Non-controlling interests’ share of underlying profit (3) (16) 13Underlying profit 550 365 185Underlying earnings per share 31.3¢ 23.2¢ 8.1¢Final dividend per share Nil Nil –
Statutory Loss of $2,226 million includes an impairment charge of $3,064 million. Excluding this charge and other adjustments to statutory profit results in an underlying profit of $550 million. See below for a reconciliation from statutory to underlying profit.
Underlying EBITDA of $2,530 million increased by $834 million driven by volume growth and improving returns in Electricity, the ramp up of LNG earnings5 and the commencement of production from the Halladale/Speculant field.
Underlying Profit of $550 million increased by $185 million reflecting higher EBITDA and lower underlying depreciation and amortisation relating to Contact Energy and Lattice Energy6. This was partially offset by an increase in the amount of Australia Pacific LNG interest, tax, depreciation and amortisation (ITDA) and net financing costs associated with the funding of Origin’s interest in Australia Pacific LNG that was recognised in underlying earnings. Refer to Appendix 1 for additional detail on underlying net financing costs.
The Board has decided to not pay a final dividend in respect of earnings for the second half of the financial year.
1 Refer to Glossary on pages 166 to 168 for definitions of terms set out in the table.2 FY2016 statutory profit/(loss) has been restated to reflect adjustments in accounting for power purchase arrangements, as noted in Note F12 of the 30 June 2017
Origin Consolidated Financial Statements.3 Refer to Section 2.2 for additional detail.4 Refer to Appendix 1 for additional detail.5 FY2017 reflects revenue and costs from a full year of Train 1 and 8 months of Train 2 compared to 4 months of Train 1 in FY2016.6 In line with accounting standard requirements, depreciation and amortisation of Lattice Energy assets ceased from 7 December 2016.

20 ORIGIN ENERGY PAGE TITLE 20 OPERATING AND FINANCIAL REVIEW
2.2 RECONCILIATION FROM STATUTORY TO UNDERLYING PROFIT
YEAR ENDED 30 JUNE2017
($MILLION)2016
($MILLION)MOVEMENT ($MILLION)
Statutory Profit/(Loss)1 (2,226) (628) (1,598)Items Excluded from Underlying ProfitFair value and foreign exchange movements 96 (234) 330LNG items pre revenue recognition (36) (222) 186Disposals, impairments and business restructuring (2,836) (537) (2,299)Total Items Excluded from Underlying Profit (2,776) (993) (1,783)Underlying Profit 550 365 185
Fair value and foreign exchange movements primarily reflected non-cash fair value gains associated with oil hedging2 and the Oil Forward Sale (following the announced intention to terminate post the proposed divestment of Lattice Energy), as well as fair value gains related to interest rate swaps and other financial instruments impacting Energy Markets, partially offset by foreign exchange movements relating to LNG funding.
LNG related items pre revenue recognition relate to net financing costs associated with Australia Pacific LNG that would otherwise have been capitalised if the development project was held directly by Origin, rather than via an equity accounted investment.
The disposals, impairments and business restructuring category include gains associated with the asset sales programme of $303 million, more than offset by restructuring costs of $75 million and non-cash impairments of $3,064 million.
Restructuring costs comprised transaction costs and tax loss write-off arising from the asset sales programme and the Lattice Energy divestment process and costs associated with restructuring and cost reductions programs.
Non-cash impairment charges of $3,064 million included:
– $1,893 million recognised in H1 FY2017 relating to Origin’s share of Australia Pacific LNG’s impairment ($1,031 million), Browse Basin ($578 million), upstream exploration assets held for sale ($170 million), and Origin’s interest in Energia Austral SpA in Chile ($114 million); and
– $1,172 million recognised in H2 FY2017 relating to Origin’s share of further impairments by Australia Pacific LNG ($815 million) and a review of the carrying value of Lattice Energy (which reflects the cessation of depreciation and amortisation from 7 December 2016) against the expected proceeds from divestment net of estimated cost of disposal ($357 million).
In determining the carrying value of its assets, Australia Pacific LNG considers a range of project and macro assumptions – including oil price, AUD/USD exchange rates, discount rates and costs. Since the last assessment at 31 December 2016, a number of relevant assumptions have changed but the principal change is a reduction in the long term oil price assumptions to US$67/bbl (real) from 2022.
1 FY2016 statutory profit/(loss) has been restated to reflect adjustments in accounting for power purchase arrangements, as noted in Note F12 of the 30 June 2017 Origin Consolidated Financial Statements.
2 On 22 December, 2015 Origin announced the purchase of put options over 15 million barrels of oil for the 2017 financial year. Origin has purchased put options over a further 20 million barrels for the 2018 financial year.

21ORIGIN ENERGY PAGE TITLE 21OPERATING AND FINANCIAL REVIEW
2.3 CASH FLOWS
YEAR ENDED 30 JUNE2017
($MILLION)2016
($MILLION)CHANGE
($MILLION)CHANGE
(%)
Movements excluding Contact EnergyUnderlying EBITDA 2,530 1,635 895 55Non-cash items in Underlying EBITDA1 (821) (187) (634) 339Change in working capital (319) 161 (480) N/AOil Puts premium paid (64) (117) 53 (45)Insurance relating to completion of APLNG (7) (37) 30 (81)Re-structuring costs (13) (102) 89 (87)Other (70) (54) (16) 30Tax paid/refund received 53 34 19 56
Total cash flow from operating activities (ex- Contact Energy) 1,289 1,333 (44) (3)Contact Energy – cash flow from operating activities – 71 (71) N/A
Total cash flow from operating activities 1,289 1,404 (115) (8)
Capital expenditure (501) (701) 200 (29)APLNG net contribution (170) (1,206) 1,036 (86)APLNG – reserve accounts2 (127) – (127) N/ANet disposals 887 1,718 (830) (48)Total cash flow from investing activities 89 (189) 278 N/A
Net cash flow from operating and investing activities (NCOIA) 1,378 1,215 163 13
Net proceeds/(repayment) of debt (956) (2,690) 1,734 (64)APLNG – loan proceeds2 127 – 127 N/AInterest paid (540) (611) 71 (12)Dividends paid (2) (418) 416 (99)Proceeds from share issue – 2,496 (2,496) N/A
Total cash flow from financing activities (1,371) (1,223) (148) 12
Operating cash flow decreased by $115 million to $1,289 million, of which $71 million related to Contact Energy which was sold in August 2015. The remaining $44 million reflected unfavourable working capital movements ($480 million), partially offset by higher cash EBITDA1 ($261 million) and reductions in other costs ($175 million).
Working capital decreased by $161 million in FY2016 (excluding Contact Energy), primarily in Energy Markets driven by favourable collections ($87 million) and tariff reductions from lower network charges ($48 million). In FY2017, working capital increased $319 million primarily in Energy Markets driven by revenue growth ($187 million) as well as a delayed AEMO settlement ($43 million, fully recovered in July 2017) and a delay relating to a new Business customer billing platform ($94 million, expected to be recovered in Q1 FY2018).
Investing cash flow improved $278 million driven by reductions in capital expenditure and contributions to Australia Pacific LNG, partially offset by lower disposal proceeds due to the sale of Contact Energy in the prior period.
Net cash from operating and investing activities (NCOIA) of $1,378 million together with proceeds returned from Australia Pacific LNG in relation to the funding of reserve accounts was used to meet interest payments and repay debt.
1 Non-cash items in EBITDA include the contribution from equity accounted Australia Pacific LNG operations ($859 million: FY2016 $111 million), exploration expense ($62 million: FY2016 $63 million), amortisation of oil hedge premiums ($117 million: FY2016 Nil) and the impact of the Oil Forward Sale ($141 million; FY2016 $139 million).
2 Australia Pacific LNG – reserve accounts represents cash provided to Australia Pacific LNG to satisfy project finance debt service reserve account requirements. Upon issue of a bank guarantee to Australia Pacific LNG by Origin, this amount was returned to Origin as a loan (denominated in US Dollars and classified as a financing cash flow, ‘Australia Pacific LNG – loan proceeds’).

22 ORIGIN ENERGY PAGE TITLE 22 OPERATING AND FINANCIAL REVIEW
2.4 FINANCIAL POSITION AND RETURN ON CAPITAL
AS AT30 JUNE 2017
($MILLION)30 JUNE 2016
($MILLION)
Net Assets1 11,418 14,060including:Investment in APLNG 5,463 5,945MRCPS2 issued by APLNG 3,609 4,848
Non-cash fair value uplift4 (30) (1,923)
Adjusted net assets 11,388 12,137Origin Adjusted Net Debt 8,111 9,131Net derivative liabilities 565 692Origin’s share of APLNG project finance 3,642 4,163
Capital employed 23,706 26,123
Underlying EBIT 1,128 776
Origin’s equity share of APLNG interest and tax 324 31Dilution depreciation adjustment (relating to APLNG Non-cash fair value uplift4) 47 22
Adjusted EBIT4 1,500 829
Average capital employed 24,914 28,106
Underlying ROCE3 6.0% 2.9%
As at 30 June 2017, capital employed of $23,706 million included $12,684 million capital related to Australia Pacific LNG, comprising the carrying value of its equity accounted investment, the balance of MRCPS and Origin’s share of Australia Pacific LNG project finance less the non-cash fair value uplift recorded on the creation of Australia Pacific LNG and subsequent share issues by Australia Pacific LNG to Sinopec. Capital employed reduced by $2,417 million primarily reflecting asset impairments for assets held for sale, upstream investment in the Browse Basin and International Development assets in Chile.
Adjusted EBIT increased by $671 million to $1,500 million reflecting increased earnings across all segments.
Average capital employed decreased by $3,192 million to $24,914 million primarily reflecting the impact of the divestment of Contact Energy in August 2015, impairments of assets held for sale, upstream investment in the Browse Basin and International Development assets in Chile.
Underlying ROCE increased from 2.9 per cent in the prior period to 6.0 per cent for the 2017 financial year. Australia Pacific LNG is ramping up to full operations in a low oil price environment, and as a result, the impact of this business is not yet fully reflected in the 2017 results.
1 30 June 2016 net assets has been restated to reflect adjustments in accounting for power purchase arrangements, as noted in Note F12 of the 30 June 2017 Origin Consolidated Financial Statements.
2 Mandatorily redeemable cumulative preference shares (MRCPS).3 Underlying ROCE is calculated as Adjusted EBIT/Average Capital Employed. Refer to definition in the Glossary on page 167.4 Refer to definition in the Glossary.
23ORIGIN ENERGY PAGE TITLE 23OPERATING AND FINANCIAL REVIEW
2.5 FUNDING AND CAPITAL MANAGEMENT
AS AT30 JUNE 2017
($MILLION)30 JUNE 2016
($MILLION)
Total interest bearing liabilities 8,515 9,616Less: cash and cash equivalents (151) (146)Net Debt 8,364 9,470Fair value adjustments on FX hedging transactions (253) (339)Adjusted Net Debt1 8,111 9,131
Statutory average interest rate 6.3% 6.5%Underlying average interest rate 6.3% 5.9%
Adjusted net debt decreased by $1 billion to $8.1 billion driven by $0.9 billion net proceeds from asset sales and $1.3 billion of operating cash flows, which were more than sufficient to fund $0.5 billion of capital expenditure, $0.2 billion of net contributions to Australia Pacific LNG and $0.5 billion of interest payments.
Liquidity remains sufficient for all foreseeable funding requirements with $6.6 billion of committed undrawn debt facilities and cash (excluding bank guarantees). During the period, the maturity of $4.5 billion of syndicated bank loans was extended by 34 months to October 2021 and the A$900 million of Subordinated Notes were redeemed.
The increase in underlying average interest rate reflects an increase in financing costs associated with funding the investment in Australia Pacific LNG being recognised within underlying profit following commencement of revenue recognition for both trains. The funding of this investment included hybrid debt incurring a higher interest rate relative to the portfolio average.
AUSTRALIA PACIFIC LNG DEBTDuring the period, Australia Pacific LNG drew down the remaining US$38 million from its US$8,500 million project finance facility and also made its first principal repayment of US$267 million. Interest on the project finance facility of US$38 million was capitalised during the current period and US$300 million has been recorded in the Income Statement. As at 30 June 2017, the total outstanding balance of the project finance facility was US$8,233 million.
SHARE CAPITALDuring the period, Origin issued an additional two million shares under employee incentive plans resulting in a total number of 1,755 million shares on issue as at 30 June 2017. The weighted average number of shares used to calculate basic EPS at 30 June 2017 increased by 176 million to 1,754 million from 1,578 million at 30 June 2016.
2.6 FINAL DIVIDENDAs a result of the primary focus on reducing debt, the Board has decided not to pay a dividend in respect of earnings for the second half of the financial year. While the Board will review each dividend decision in light of the prevailing circumstances, the Board’s view is that suspension of the dividend is in the best overall interest of shareholders.
1 Adjusted net debt represents interest bearing liabilities adjusted to reflect associated cross currency interest rate swaps used to hedge some foreign currency denominated debt into either AUD or USD, less cash and cash equivalents. Refer to Glossary for details of Adjusted Net Debt.

24 ORIGIN ENERGY PAGE TITLE 24 OPERATING AND FINANCIAL REVIEW
3. FY2018 OUTLOOK
FY2018 earnings is expected to be underpinned by growth in Energy Markets and in Integrated Gas, subject to market conditions and the regulatory environment.
ENERGY MARKETSEnergy Markets FY2018 EBITDA is expected to be in the range of $1.7–$1.8 billion, representing 14–21 per cent growth on FY2017. This growth is expected to be driven by:
– Continued improvement in Electricity returns from higher wholesale market prices partially offset by higher hedging costs, higher gas and coal supply costs for generation and the benefit from the sale of RECs in FY2017 not repeating. Eraring Power station output is expected to be up 5–10 per cent on full year FY2017 levels (to 14.6–15.3 TWh); and
– Relatively stable gross profit in Natural Gas in FY2018. Gas procurement costs are expected to increase reflecting repricing of gas contracts and higher wholesale gas prices. Offsetting the higher gas procurement costs are increased volumes and higher revenue rates.
Growth in Electricity is expected to be weighted towards the second half of FY2018 with supply from renewable PPAs increasing and assuming the extreme weather event in the second half of FY2017 does not repeat. The generation fleet will be utilised evenly in both halves with planned outages at Darling Downs Power Station (6 weeks) in the first half and one unit at the Eraring Power Station (10 weeks) in the second half to reduce risk to the portfolio.
INTEGRATED GASGrowth in Integrated Gas in FY2018 is expected to be underpinned by a first full year of production from both Australia Pacific LNG trains. Origin’s share of Australia Pacific LNG production is expected to increase 7–16 per cent to 245–265 PJ. This includes the impact of planned maintenance shutdowns1 of the LNG trains in FY2018.
In FY2018, Australia Pacific LNG is expected to be cash flow break-even at US$45/boe (assuming AUD:USD exchange rate of 0.70) or at US$48/boe (assuming AUD:USD exchange rate of 0.75). Origin has hedged approximately 95 per cent of its FY2018 and approximately 25 per cent of its FY2019 Australia Pacific LNG related JCC oil price exposure2.
Origin has also purchased $194.5 million FY2018 AUD/USD currency call options with a strike of 82 cents at a hedge premium cost of A$1 million (pre-tax). This currency hedge combined with Origin’s share of Australia Pacific LNG’s USD project finance principal and interest payments and interest payments on Origin’s USD denominated debt mitigates an estimated 55 per cent of Origin’s share of Australia Pacific LNG’s USD denominated cash flow exposure in FY2018.
Earnings contribution from Lattice Energy is expected to be driven by full year production in the range of 76–86 PJe. Origin will cease to recognise earnings from Lattice Energy upon completion of the expected divestment of the business.
CAPITAL EXPENDITURECapital expenditure (excluding Lattice Energy) is expected to be $360–$420 million, including investment in future energy solutions.
ADJUSTED NET DEBTAdjusted Net Debt is expected to be below $7 billion, driven by expected proceeds from the sale of Lattice Energy and improved operating cash flow from Energy Markets.
1 In the first quarter of FY2018, Australia Pacific LNG expects to complete maintenance shutdowns for both trains, involving one train shutdown for approximately two weeks, and one train running at half rates for approximately one week.
2 FY2018 oil hedges premiums of A$64 million (pre-tax) include a combination of puts and collars (40 per cent in puts with a floor of US$45/bbl and 60 per cent in collars with strikes of US$45-71/bbl). FY2019 hedges to 11 August 2017 include 4.6 million barrels hedged through collars with strikes of US$44-62bbl and 1 million barrels hedged through a three way option with strikes of U$40-50-60/bbl at a cost of A$7 million (pre-tax) to be settled in FY2019 (hedge rates are in Brent crude oil equivalent). The three way oil option comprises a long U$50/bbl strike put, a short U$40/bbl strike put and a short U$60/bbl strike call.

25ORIGIN ENERGY PAGE TITLE 25OPERATING AND FINANCIAL REVIEW
4. REVIEW OF SEGMENT OPERATIONS
4.1 ENERGY MARKETSEnergy Markets is an integrated provider of energy solutions to retail and wholesale markets. As Australia’s leading retailer, it continues to develop product offerings to improve customer experience and value. It has a diverse portfolio of gas and coal supply contracts, operates one of Australia’s largest and most diverse generation portfolios, and is increasing its investment in renewables. Earnings are reported across Natural Gas, Electricity, LPG, Solar & Energy Services and Future Energy. Natural Gas and Electricity customers comprise Retail (residential and SMEs) and Business (commercial and industrial, and LNG producers for Natural Gas).
YEAR ENDED 30 JUNE2017
($MILLION)20161
($MILLION)CHANGE
(%)
Total Segment Revenue2 13,558 11,423 19Electricity gross profit 1,426 1,282 11Natural Gas gross profit 528 518 2Electricity & Natural Gas cost to serve (541) (542) (0)LPG EBITDA 88 76 16Solar & Energy Services EBITDA 5 (3) N/AFuture Energy costs (14) – N/A
Underlying EBITDA 1,492 1,330 12Underlying EBIT margin 10.6% 10.1% 5Cash flow from operating activities 1,134 1,388 (18)Capital expenditure 278 236 18Net cash flow from operating and investing activities 1,292 1,262 2
EBITDA increased by $162 million to $1,492 million primarily driven by growth in Electricity.
– Increased Electricity gross profit was driven by volume growth and improving returns underpinned by a generation portfolio that maintained a competitive cost of energy in a rising wholesale price environment.
– Increased Natural Gas gross profit reflects higher sales volumes offset by lower realised oil price on sales to GLNG and higher procurement costs due to benefits of low-cost ramp gas in FY2016 not repeating.
– Electricity and Natural Gas cost to serve improved reflecting the benefit of cost reduction initiatives, partially offset by increased acquisition activity in a competitive market.
– Growth in LPG EBITDA reflects ongoing cost reduction initiatives, and profitability in Solar & Energy Services was driven by increased solar installations and margins and serviced hot water customer growth.
– Future Energy relates to activities focused on technology innovation and related strategy development.
Cash flow from operating activities decreased as EBITDA growth was more than offset by unfavourable working capital movements. FY2016, working capital decreased $154 million, largely driven by favourable collections ($87 million) and tariff reductions from lower network charges ($48 million). Conversely, FY2017 working capital increased $298 million driven by revenue growth ($187 million), timing of AEMO settlements associated with extreme weather in early 2017 ($43 million, fully recovered in July), and a one-off delay relating to roll out of a new Business customer billing platform in May 2017 ($94 million, expected to be recovered in Q1 FY2018).
Capital expenditure increased due to the 1 in 20 year planned maintenance outage at Eraring ($45 million).
Growth in net cash flow from operating and investing activities reflected lower operating cash flow and higher capital expenditure, offset by higher proceeds from asset sales ($436 million compared to $110 million in FY2016).
1 FY2016 has been restated to reflect changes in the treatment of certain items previously included Electricity and Natural Gas gross profit and cost to serve. See Glossary on pages 166 to 168 for details of the Electricity and Natural Gas cost to serve restatement.
2 Refer to Glossary on pages 166 to 168.

26 ORIGIN ENERGY PAGE TITLE 26 OPERATING AND FINANCIAL REVIEW
4.1.1 ELECTRICITYVOLUME SUMMARY
2017 2016 CHANGE CHANGE
YEAR ENDED 30 JUNEVOLUMES SOLD (TWH) RETAIL BUSINESS TOTAL RETAIL BUSINESS TOTAL TWH %
NSW 9.0 9.1 18.1 8.9 8.5 17.4 0.7 4Victoria 3.4 4.8 8.2 3.4 4.5 7.9 0.3 4Queensland 5.2 5.4 10.6 5.2 5.5 10.7 (0.1) (1)South Australia 1.1 1.7 2.8 1.0 1.2 2.2 0.6 27Total volumes sold 18.6 21.1 39.7 18.4 19.6 38.1 1.6 4
FINANCIAL SUMMARY
YEAR ENDED 30 JUNE 2017 $/MWH 2016 $/MWH CHANGE %CHANGE ($/MWH)
Revenue ($m)1 8,085 203.8 7,293 191.5 11 12.3Retail (consumer & SME)1 5,065 272.4 4,783 259.4 6 13.0Business 3,017 143.1 2,463 125.4 22 17.7Externally contracted generation 3 47 (93)
Cost of goods sold ($m) (6,660) (167.9) (6,012) (157.9) 11 (10.0)Network costs (3,829) (96.5) (3,674) (96.5) 4 0.0Wholesale energy costs (2,629) (66.3) (2,093) (55.0) 26 (11.3)Generation operating costs1 (202) (5.1) (244) (6.4) (17) 1.3
Energy procurement costs (2,831) (71.4) (2,337) (61.4) 21 (10.0)
Gross profit ($m)1 1,426 35.9 1,282 33.7 11 2.3Gross margin % 17.6% 17.6% 0.2%
Period-end customer accounts (‘000) 2,716 2,741 (1)Average customer accounts (‘000) 2,736 2,758 (1)$ Gross profit per customer 521 465 56
Retail revenue rates increased $13/MWh and Business revenue rate increased $17.7/MWh reflecting pass through of higher market wholesale prices for energy and LRET certificates and higher network costs for Business customers. Electricity total revenue rate increased by $12.3/MWh or 11 per cent reflecting a higher proportion of lower priced Business sales and reduced revenues from externally contracted generation due to the end of the Worsley joint venture.
Wholesale energy costs increased $11.3/MWh reflecting the impact of higher pool prices including the extreme weather event in February, higher coal and gas costs used in generation and contract costs for assets sold, offset by trading gains on sale of RECs. Wholesale energy costs increased less than market wholesale prices due to the benefit of Origin’s wholesale and REC portfolio and resulted in recovering returns.
Generation operating costs decreased $42 million reflecting the end of the Worsley joint venture and underlying cost reductions through operational efficiencies.
Electricity gross profit increased by 11 per cent or $144 million to $1,426 million reflecting volume growth and recovering returns in both customer segments.
1 FY2016 has been restated to reflect changes in the treatment of certain items previously included in Electricity and Natural Gas gross profit and cost to serve. See Glossary on pages 166 to 168 for details of the Electricity and Natural Gas cost to serve restatement.

27ORIGIN ENERGY PAGE TITLE 27OPERATING AND FINANCIAL REVIEW
ELECTRICITY SUPPLYPerformance of the generation portfolio, including contracted plant is summarised below:
YEAR ENDED 30 JUNE 2017
NAMEPLATE CAPACITY
(MW) TYPE1
EQUIVALENT RELIABILITY
FACTOR2CAPACITY
FACTOR
ELECTRICITY OUTPUT
(GWH)
POOL REVENUE
($MILLION)
POOL REVENUE ($/MWH)
Eraring 2,880 Black Coal 89.6% 55% 13,882 1,197 86Darling Downs 644 CCGT 99.0% 55% 3,129 342 109Osborne3 180 CCGT 100.0% 59% 937 124 132Uranquinty 664 OCGT 99.7% 10% 588 108 183Mortlake 566 OCGT 98.9% 22% 1,086 122 112Mount Stuart 423 OCGT 84.6% 2% 71 53 741Quarantine 224 OCGT 98.7% 13% 257 58 226Ladbroke Grove 80 OCGT 98.2% 26% 185 35 188Roma 80 OCGT 97.5% 6% 39 13 332Shoalhaven 240 Pump/Hydro 90.5% 6% 117 22 192Cullerin Range4 30 Wind 93.0% 48% 4 0 91
Internal Generation 6,011 91.9% 20,295 2,073 102
Renewable PPAs 732 Solar/Wind n.a. 32% 2,105
Owned and Contracted Generation 6,743 22,400
Owned and contracted electricity generation for the period was 22.4 TWh (22.7 TWh in the prior period) representing 56 per cent (59 per cent in the prior period) of the 39.7 TWh of electricity volumes sold.
Output from Eraring increased to 13.9 TWh in FY2017 (13.5 TWh in FY2016) despite the planned 1 in 20 year maintenance outage in the first half. In the second half, Eraring operated at an average capacity factor of 64 per cent and generated 73 per cent of its annual revenue as coal inventory build-up was utilised in the second half at higher average pool prices.
Output from the gas-fired generation fleet was relatively stable in FY2017 despite decreased availability of low-cost ramp gas.
During the period contracted renewable capacity of 732 MW contributed 2.1 TWh of energy. Since March 2016, Origin has committed to increase its renewable energy supply by approximately 1,200 MW, some of which is already operating and the remainder (approximately 1,150 MW) is expected to come into production over the coming years, with 496 MW expected to come during the second half of FY2018.
4.1.2 NATURAL GASVOLUME SUMMARY
2017 2016 CHANGE CHANGE
YEAR ENDED 30 JUNEVOLUMES SOLD (TWH) RETAIL BUSINESS TOTAL RETAIL BUSINESS TOTAL PJ %
NSW 9.4 23.4 32.8 8.2 16.7 24.9 7.9 32Victoria 25.6 40.9 66.5 25.6 39.3 64.9 1.6 2Queensland 2.9 69.1 72.0 3.0 57.5 60.5 11.5 19South Australia 5.1 11.3 16.4 5.3 11.4 16.7 (0.3) (2)
External volumes sold 43.1 144.7 187.9 42.1 124.9 167.1 20.8 12
Internal sales (generation) 61.5 61.1 0.3 (3)
Total volumes sold 249.4 228.2 21.2 9
1 OCGT = Open cycle gas turbine; CCGT = Combined cycle gas turbine.2 Availability for Eraring = Equivalent Availability Factor (which takes into account de-ratings).3 Origin has a 50 per cent interest in the 180 MW plant and contracts 100 per cent of the output.4 The sale of the Cullerin Range wind farm completed in July 2016.
28 ORIGIN ENERGY PAGE TITLE 28 OPERATING AND FINANCIAL REVIEW
FINANCIAL SUMMARY
YEAR ENDED 30 JUNE 2017 $/GJ 20161 $/GJ CHANGE %CHANGE
($/GJ)
Revenue ($m)2 2,154 11.5 1,942 11.6 11 (0.1)Retail (consumer & SME)2 1,030 23.9 991 23.5 4 0.4Business 1,124 7.8 951 7.6 18 0.2
Cost of goods sold ($m) (1,627) (8.7) (1,425) (8.5) 14 0.1Network costs (709) (3.8) (696) (4.2) 2 0.4Energy procurement costs (918) (4.9) (729) (4.4) 26 (0.5)
Gross profit ($m)2 528 2.8 518 3.1 2 (0.3)Gross margin % 24.5% 26.7% (8)
Period-end customer accounts (‘000) 1,112 1,089 2Average customer accounts (‘000) 1,105 1,080 2
$ Gross profit per customer 478 480 (0)
Revenue rates for both Retail and Business increased reflecting pass through of higher market wholesale gas prices. Higher Business revenue rates were achieved despite an increase in sales to GLNG at a lower average price (including the impact of lower realised oil prices). Natural Gas total revenue rate declined by $0.1/GJ to $11.5/GJ despite higher rates in each customer segment due to a higher proportion of lower priced Business revenue.
Energy procurement costs increased $0.50/GJ to $4.90/GJ as low-cost ramp gas in FY2016 was replaced with higher priced gas purchases in FY2017.
Natural Gas gross profit increased by 2 per cent or $10 million to $528 million reflecting increased volume, partially offset by lower unit margin driven by the absence of low-cost ramp gas and a lower realised oil price on sales to GLNG.
4.1.3 ELECTRICITY AND NATURAL GAS OPERATING COSTS
YEAR ENDED 30 JUNE 2017 20163 CHANGECHANGE
(%)
Cost to maintain ($ per average customer4) (115) (117) 2 (2)Cost to acquire/retain ($ per average customer4) (31) (29) (2) 6Elec & Natural Gas Cost to Serve ($ per average customer4) (146) (145) (1) 1
Maintenance Costs ($m) (427) (435) 8 (2)Acquisition & Retention Costs5 ($m) (114) (107) (7) 6
Elec & Natural Gas cost to serve ($m) (541) (542) 1 0
Maintenance Costs decreased by $8 million driven by ongoing cost reduction initiatives including offshore resourcing, lower Ombudsmen costs, cost recovery fees and continued digitisation of customer experience. Online sales increased by 23 per cent and ‘My Account’ visits increased by 30 per cent to 2.5 million customers. Paperless billing increased, with around 1.8 million customer accounts now taking up e-billing (15 per cent increase) and 1.0 million customers accounts are now paying by direct debit (17 per cent increase).
Acquisition and Retention Costs increased by $7 million or 6 per cent driven by an increase in wins and new connections (including the use of third party sales channels in a competitive market).
Improvements in customer experience have led to an increase in the Interaction Net Promoter Score (NPS)6 of 4 points to +16.1 and a reduction in Ombudsman complaints from 3.4 to 2.5 (per 1,000 customers).
1 Osborne gas sales reclassified as internal due to new operational agreement. As a result prior period external sales volumes, revenues and costs have been revised with no impact on gross profit.
2 FY2016 has been restated to reflect changes in the treatment of certain items previously included Electricity and Natural Gas gross profit and cost to serve. See Glossary on pages 166 to 168 for details of the Electricity and Natural Gas cost to serve restatement.
3 FY2016 has been restated to reflect changes in the treatment of certain items previously included Electricity and Natural Gas gross profit and cost to serve. See Glossary on pages 166 to 168 for details of the Electricity and Natural Gas cost to serve restatement.
4 Represents Cost to Serve per average customer account, excluding serviced hot water accounts.5 Customer wins (FY17:552,000; FY16: 509,000) and retains (FY17: 1,509,000; FY16: 1,493,000). Note prior year has been restated to be net of cancellations.6 Refer to Glossary on pages 166 to 168.
29ORIGIN ENERGY PAGE TITLE 29OPERATING AND FINANCIAL REVIEW
4.1.4 LPG
YEAR ENDED 30 JUNE 2017 2016CHANGE
(%)
Volumes (kt) 448 457 (2)Revenue ($m) 628 593 6Cost of Goods Sold ($m) (418) (385) 8Gross Profit ($m) 211 208 1Operating Costs ($m)1 (122) (133) (8)Underlying EBITDA ($m) 88 76 16
LPG volumes decreased due to declines in the Autogas segment, partially offset by increases in the stationary LPG market. LPG gross profit remained stable and operating costs decreased $11 million driven by ongoing cost reduction initiatives and improved logistics efficiency.
4.1.5 SOLAR & ENERGY SERVICES
YEAR ENDED 30 JUNE 2017 2016CHANGE
(%)
Revenue ($m) 148 138 7Cost of Goods Sold ($m) (74) (83) (12)Gross Profit ($m) 74 55 35Operating Costs ($m)2 (69) (59) 18Underlying EBITDA ($m) 5 (3) N/A
Solar & Energy Services gross profit increased $19 million driven by an increased contribution from the solar business with higher installations and margins (lower cost contractor model and reduced panel costs), as well as growth in serviced hot water.
4.1.6 FUTURE ENERGY
YEAR ENDED 30 JUNE 2017 2016CHANGE
(%)
Operating Costs ($m) (14) – N/AInvestments ($m) 2 4 N/A
Future Energy relates to activities focused on technological innovation and customer related strategy development.
Origin has established a shared office in Silicon Valley with German energy company innogy and is a foundation member of the ‘Free Electrons’ global accelerator program. During the period, Origin made a small investment in People Power (a US start up focused on connected home solutions) and has undertaken a number of technology trials in home energy management, peer to peer trading, metering communications and internet of things (IOT) home security and monitoring.
4.1.7 NATURAL GAS, ELECTRICITY AND LPG CUSTOMER ACCOUNTS
30JUNE 2017 30JUNE 2016
AS AT CUSTOMER ACCOUNTS (‘000) ELECTRICITYNATURAL
GAS TOTAL ELECTRICITYNATURAL
GAS TOTAL CHANGE
NSW3 1,213 262 1,475 1,240 252 1,492 (17)Victoria 553 478 1,031 566 478 1,044 (13)Queensland 752 168 920 761 160 921 (1)South Australia4 198 203 401 174 199 372 29
Total 2,716 1,112 3,828 2,741 1,089 3,830 (2)
Customer accounts were relatively stable overall during the period reflecting the loss of 25,000 Electricity customers and the addition of 23,000 Natural Gas customers.
As at 30 June 2017, penetration of dual fuel (Electricity and Natural Gas) customer accounts was 35.8 per cent, increasing from 34.9 per cent at 30 June 2016. As at 30 June 2017, Origin had 382,000 LPG customer accounts, a decrease of 2,000 accounts from 30 June 2016.
1 FY2016 has been restated to reflect changes in the treatment of certain items previously included Electricity and Natural Gas gross profit and cost to serve. See Glossary on pages 166 to 168 for details of the Electricity and Natural Gas cost to serve restatement.
2 The period ending 30 June 2016 has been restated to reflect changes in the treatment of certain items previously included Electricity and Natural Gas gross profit and cost to serve. See Glossary on pages 166 to 168 for details of the Electricity and Natural Gas cost to serve restatement.
3 Australian Capital Territory (ACT) customer accounts are included in New South Wales.4 Northern Territory customers are included in South Australia.

30 ORIGIN ENERGY PAGE TITLE 30 OPERATING AND FINANCIAL REVIEW
4.2 INTEGRATED GASIntegrated Gas comprises LNG which includes a 37.5 per cent equity accounted share of Australia Pacific LNG and other activities and transactions arising from the upstream operatorship of Australia Pacific LNG1 and management of exposure to LNG pricing risk; and E&P which represents the conventional upstream business now known as Lattice Energy (held for sale) as well as other exploration and development interests in the Surat, Beetaloo and Browse basins.
2017 2016
YEAR ENDED 30 JUNE E&P ($M) LNG ($M)INTEGRATED
GAS ($M) E&P ($M) LNG ($M)INTEGRATED
GAS ($M) CHANGE (%)
Production (PJe) 95 229 323 75 157 231 40Underlying EBITDA 355 749 1,104 269 117 386 186Cash flow from operating activities 280 (77) 203 142 (116) 26 681Capital expenditure 200 11 211 412 20 432 (51)
Contribution to APLNG – 170 170 – 1,206 1,206 (86)
Net cash flow from operating and investing activities2 483 (385) 98 (262) (1,343) (1,605) N/A
Production increased 92 PJe or 40 per cent due to the ramp up in LNG production at Australia Pacific LNG and the commencement of production at Halladale/Speculant in E&P.
Underlying EBITDA increased $718 million or 186 per cent to $1,104 million reflecting:
– $632 million increase in LNG EBITDA to $749 million driven by an increase in Origin’s share of Australia Pacific LNG EBITDA from the ramp up of LNG sales and higher prices ($748 million), partially offset by the cost of oil hedges entered into by Origin net of hedge payout ($103 million); and
– $86 million increase in E&P to $355 million driven primarily by the commencement of production from Halladale/Speculant in August 2016.
Cash flow from operating activities increased by $177 million to $203 million comprising:
– $138 million increase in E&P to $280 million due to higher EBITDA and lower working capital requirements primarily relating to purchases and lower inventory in the Cooper Basin; and
– $39 million improvement in LNG to an outflow of $77 million driven primarily by lower oil hedging cash costs.
Net cash flow from operating and investing activities increased by $1,703 million reflecting:
– $958 million improvement in LNG due to a lower contribution to Australia Pacific LNG and lower oil hedging cash costs.
– $745 million improvement in E&P driven by higher operating cash flows, lower capital expenditure, and proceeds from the sale of the Darling Downs Pipelines.
4.2.1 LNGAUSTRALIA PACIFIC LNG PRODUCTION AND SALES
2017 2016
YEAR ENDED 30 JUNEVOLUMES (PJ) 100% APLNG ORIGIN SHARE 100% APLNG ORIGIN SHARE
Production volumes 610 229 418 157Natural Gas (domestic) 195 73 296 111Natural Gas (LNG feed gas) 415 156 122 46
Gross sales volumes3 608 228 388 146Natural Gas 214 80 291 109LNG 394 148 98 37
Gross realised price (A$/GJ)3
Natural Gas 3.04 2.03
LNG 8.16 7.24
Total Australia Pacific LNG production increased by 192 PJe or 46 per cent to 610 PJ as Train 2 came online during the year with the LNG plant operating well above design nameplate capacity during the 90 day two train operational test in May and June. Domestic volumes decreased reflecting a reduction in sales to QGC and other short term domestic sales, with volumes directed to LNG feed gas to maximise LNG production.
Net Realised Price for Natural Gas increased due to lower volumes sold to QGC under oil-linked contracts, and higher prices achieved on incremental domestic sales. LNG price increased in line with higher realised oil prices.1 Origin’s share of Australia Pacific LNG’s Underlying EBITDA is included in the Underlying EBITDA of the Integrated Gas segment. Origin’s share of Australia Pacific LNG’s
Underlying interest, tax, depreciation and amortisation expense is accounted for between Underlying EBITDA and Underlying EBIT in the line item ‘Share of interest, tax, depreciation and amortisation of equity accounted investees’.
2 Includes cash (classified as investing activity) provided to Australia Pacific LNG to satisfy Project Finance reserve requirements ($127 million) via bank guarantee returned to Origin as a loan (classified as financing activity).
3 Gross sales volumes and realised prices are inclusive of 20 PJ (FY2016: 93 PJ) that were capitalised for accounting purposes.

31ORIGIN ENERGY PAGE TITLE 31OPERATING AND FINANCIAL REVIEW
AUSTRALIA PACIFIC LNG UNDERLYING FINANCIAL PERFORMANCE
2017 2016
YEAR ENDED 30 JUNE$ MILLION 100% APLNG ORIGIN SHARE 100% APLNG ORIGIN SHARE
Operating revenue 3,754 1,408 880 330Operating expenses (1,465) (549) (585) (219)
Underlying EBITDA 2,289 859 295 111D&A expense (1,614) (605) (700) (263)Net financing expense (952) (357) (291) (109)Income tax benefit 87 32 209 78
Underlying ITDA1 (2,479) (930) (782) (293)
Underlying profit (190) (71) (487) (182)
Australia Pacific LNG’s financial performance during the period reflected earnings associated with domestic gas sales and the ramp up of LNG sales with a full year contribution from Train 1 and an eight month contribution from Train 2. Earnings relating to Train 2 were recognised in the income statement from November 2016.
AUSTRALIA PACIFIC LNG SUSTAINING CAPITAL EXPENDITURE AND FUNDINGAustralia Pacific LNG FY2017 sustaining capital expenditure of $1.0 billion was $0.4 billion lower than guidance primarily due to savings achieved from reduced drilling and connection costs, lower owner’s costs and the timing of non-operated activity deferred from FY2017 into FY2018. This contributed to lower than expected net contributions by Origin to Australia Pacific LNG ($170 million in FY2017).
Guidance for FY2018 sustaining capital expenditure is unchanged at $1.4 billion as recurring savings achieved in FY2017 are expected to be offset by deferred non-operated spend from FY2017 into FY2018 and acceleration of other non-operated activity previously assumed in FY2019. Compared to FY2017, the FY2018 operated sustaining capital program is expected to include increased rate of fracture stimulation wells, and non-operated activity is expected to increase.
AUSTRALIA PACIFIC LNG OPERATIONSIn July 2017 Australia Pacific LNG successfully concluded the 90-day operational phase of the two-train project finance lenders’ test, with the plant performing at more than 10 per cent above design nameplate capacity during the 90 day period. Australia Pacific LNG is expected to satisfy all other requirements of the project finance tests during Q1 FY2018 which will result in the release of the remaining US$3.4 billion of shareholder guarantees relating to Australia Pacific LNG’s US$8.5 billion project finance facility. Australia Pacific LNG now has the flexibility to take advantage of potential opportunities to sell additional gas into the domestic market.
A total of 413 development wells were commissioned in FY2017 including 41 horizontal/vertical pairs and multi-laterals in Spring Gully (represented as 80 wells). On average, these wells have provided higher production rates and faster ramp up than standard vertical wells in the same area. Australia Pacific LNG will continue to utilise these new well technologies to target improved productivity.
Ongoing development and operations at Australia Pacific LNG are focused on improving productivity and debottlenecking its existing facilities. In FY2018, Australia Pacific LNG expects to deliver increased annual production and has the flexibility to direct excess volumes (above contractual requirements) to either the domestic or export LNG market.
1 Origin’s share of the Australia Pacific LNG underlying ITDA differs slightly to the share of ITDA recognised by Origin due to a MRCPS elimination adjustment (see Glossary for details).

32 ORIGIN ENERGY PAGE TITLE 32 OPERATING AND FINANCIAL REVIEW
AUSTRALIA PACIFIC LNG RESERVES AND RESOURCES1
Origin’s share of Australia Pacific LNG’s 2P reserves decreased 369 PJ, including 229 PJe of production. Excluding production, Australia Pacific LNG’s 2P reserves decreased by 3 per cent primarily due to reduced recovery estimates in low permeability areas.
Origin share of reserves and resources (37.5 per cent share in Australia Pacific LNG)
RESERVES (PJe)30/06/16
RESERVESACQUISITION/DIVESTMENT
NEW BOOKING/DISCOVERIES
REVISIONS/EXTENSIONS PRODUCTION
30/06/17 RESERVES
1P 2,659 – – 389 (229) 2,8192P 5,073 – – (141) (229) 4,7043P 5,601 – – (354) (229) 5,018
RESOURCES (PJe) RESOURCES
2C 1,135 0 0 349 0 1,483
Development activity during FY2017 focused on drilling for near term production ahead of the two train lenders’ test which is reflected in an increase in 1P reserves of 160 PJe (Origin share) after production. Australia Pacific LNG is now focused on exploration and appraisal activities to identify and mature resources to reserves.
4.2.2 EXPLORATION & PRODUCTION
YEAR ENDED 30 JUNE 2017 2016CHANGE
(%)
Total Production (PJe) 94.6 74.6 27Total Sales (PJe) 105.6 82.6 28
Commodity Sales Revenue ($m)> 747 592 26Other income 79 63 25Cost of goods sold and stock movements (110) (80) 38Exploration expense (62) (63) (2)Other expenses (299) (243) 23Underlying EBITDA 355 269 32
Cash flow from operating activities 280 142 97Proved plus Probable (2P) reserves ex-APLNG (PJe) 1,084 1,204 (10)
> Includes gain/(loss) – forward sale and hedging of $28 million in current period ($43 million prior period).
Origin’s share of total production increased 20 PJe to 94.6 PJe due to higher Otway Basin production (23 PJe) following the commencement of production from Halladale/Speculant, partly offset by lower Bass Basin production (2 PJe) due to a planned statutory maintenance shutdown.
Sales volumes increased 23 PJe to 105.6 PJe due to increased production and the use of inventory to meet higher gas nominations in the Cooper Basin. Commodity Sales Revenue increased by $155 million or 26 per cent to $747 million, in line with higher sales volumes.
Other income relates primarily to tolling revenue. This increased 25 per cent primarily driven by the impact of Halladale/Speculant volumes (100 per cent owned) tolled through the Otway joint venture (67.23 per cent interest). This is offset by higher tolling costs included in other expenses.
Higher stock movement reflected a reduction in gas inventory due to higher customer nominations within the Cooper Basin.
Exploration expense included the write-off of T/34P, an exploration permit in the Otway Basin following an application for consent to surrender ($26 million), Enterprise 2 3D transition zone seismic survey acquisition ($14 million) and Crowes Foot 3D offshore seismic survey acquisition ($11 million).
Other expenses increased 23 per cent primarily due to tolling charges associated with the commencement of production at Halladale/Speculant.
E&P EBITDA increased $86 million to $355 million primarily due to commencement of production from Halladale/Speculant.
Further information regarding production, sales volumes and revenues is provided in Origin’s June 2017 Quarterly Production Report, available at www.originenergy.com.au.
1 Refer to the Important Information on reserves and resources disclosures prior to Section 1.

33ORIGIN ENERGY PAGE TITLE 33OPERATING AND FINANCIAL REVIEW
CAPITAL EXPENDITURECapital expenditure decreased $212 million from the prior year following the completion of development projects across the Otway, Bass and Cooper basins. Capital expenditure for the year of $200 million included:
– Otway Basin including Halladale/Speculant - $47 million;
– Cooper Basin - $39 million;
– Beetaloo and Cooper Basin farm-ins - $37 million;
– Bass Basin - $16 million;
– Perth Basin - $11 million; and
– Other assets - $48 million.
EXPLORATION & PRODUCTION RESERVESProved plus probable (2P) reserves decreased by 119 PJe (after production of 94.6 PJe) to a total of 1,084 PJe excluding Origin’s share of Australia Pacific LNG reserves, compared with 30 June 2016.
Origin undertakes a full assessment of its reserves resources on an annual basis at the end of the financial year. A full statement of reserves and resources attributable to Origin at 30 June 2017 is included in the Annual Reserves Report on pages 156 to 163.
5. RISKS RELATED TO FUTURE FINANCIAL PROSPECTS
The scope of operations and activities means that Origin is exposed to risks that can have a material impact on its future financial prospects. Material risks, and the company’s approach to managing them, are summarised below.
RISK MANAGEMENT FRAMEWORKOrigin’s risk management framework supports the identification, management and reporting of material risks and uncertainties that can impact the delivery of key priorities. Overseen by the Board and the Board Risk Committee, the framework incorporates a ‘three lines of defence’ model for managing risks and controls. All employees are responsible for making risk-based decisions and managing risk within understood limits.
If a risk, such as a natural disaster, cannot be fully managed to reflect the risk appetite of the company using internal controls, it is transferred to third parties via insurance where commercially appropriate. Origin’s business resilience processes also help minimise the impact of risk events.
THREE LINES OF DEFENCE
LINE OF DEFENCE RESPONSIBILITY PRIMARY ACCOUNTABILITY
First lineLines of business
– Identifies, assesses, records, prioritises, manages and monitors risks.
Management
Second lineOversight functions
– Provides the risk management framework, tools and systems to support effective risk management.
Management
Third lineInternal audit
– Provides assurance on the effectiveness of governance, risk management and internal controls.
Board, Board Committees and management
MATERIAL RISKSThe risks identified in this section have the potential to materially affect Origin’s ability to meet its key priorities and impact on the company’s future financial performance, either separately or in combination.
These risks are not exhaustive and are not arranged in order of significance.
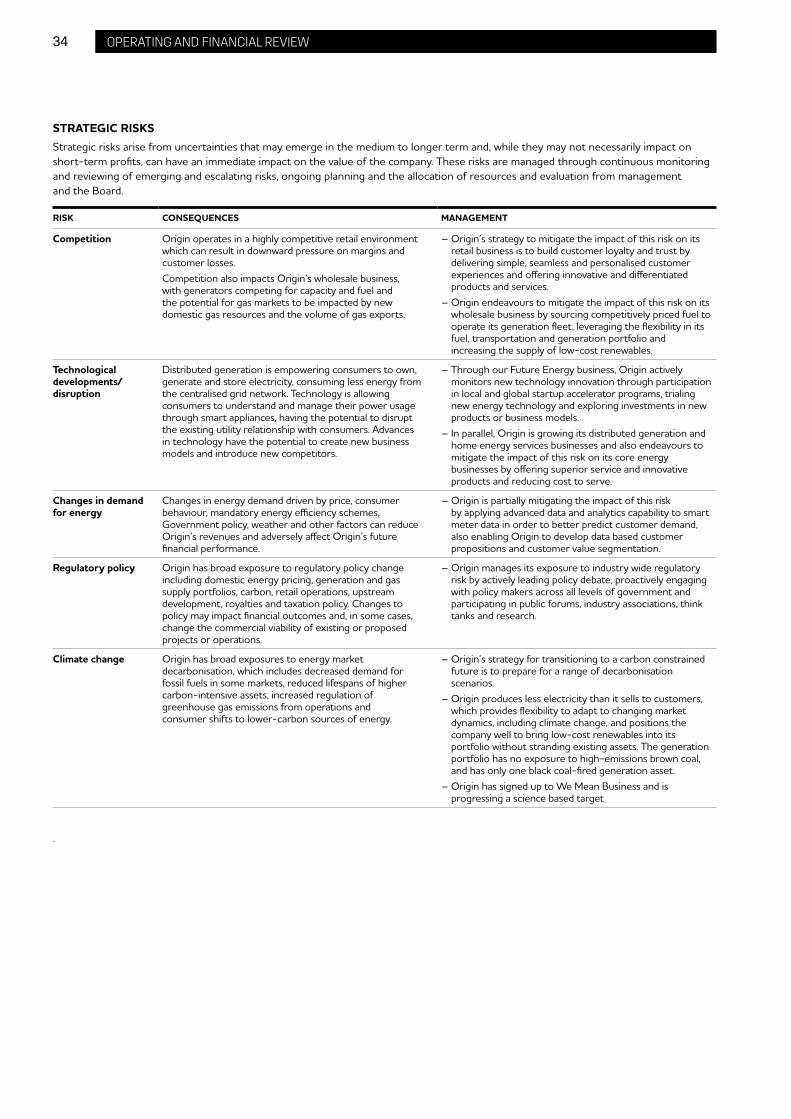
34 ORIGIN ENERGY PAGE TITLE 34 OPERATING AND FINANCIAL REVIEW
STRATEGIC RISKSStrategic risks arise from uncertainties that may emerge in the medium to longer term and, while they may not necessarily impact on short-term profits, can have an immediate impact on the value of the company. These risks are managed through continuous monitoring and reviewing of emerging and escalating risks, ongoing planning and the allocation of resources and evaluation from management and the Board.
RISK CONSEQUENCES MANAGEMENT
Competition Origin operates in a highly competitive retail environment which can result in downward pressure on margins and customer losses.Competition also impacts Origin’s wholesale business, with generators competing for capacity and fuel and the potential for gas markets to be impacted by new domestic gas resources and the volume of gas exports.
– Origin’s strategy to mitigate the impact of this risk on its retail business is to build customer loyalty and trust by delivering simple, seamless and personalised customer experiences and offering innovative and differentiated products and services.
– Origin endeavours to mitigate the impact of this risk on its wholesale business by sourcing competitively priced fuel to operate its generation fleet, leveraging the flexibility in its fuel, transportation and generation portfolio and increasing the supply of low-cost renewables.
Technological developments/disruption
Distributed generation is empowering consumers to own, generate and store electricity, consuming less energy from the centralised grid network. Technology is allowing consumers to understand and manage their power usage through smart appliances, having the potential to disrupt the existing utility relationship with consumers. Advances in technology have the potential to create new business models and introduce new competitors.
– Through our Future Energy business, Origin actively monitors new technology innovation through participation in local and global startup accelerator programs, trialing new energy technology and exploring investments in new products or business models.
– In parallel, Origin is growing its distributed generation and home energy services businesses and also endeavours to mitigate the impact of this risk on its core energy businesses by offering superior service and innovative products and reducing cost to serve.
Changes in demand for energy
Changes in energy demand driven by price, consumer behaviour, mandatory energy efficiency schemes, Government policy, weather and other factors can reduce Origin’s revenues and adversely affect Origin’s future financial performance.
– Origin is partially mitigating the impact of this risk by applying advanced data and analytics capability to smart meter data in order to better predict customer demand, also enabling Origin to develop data based customer propositions and customer value segmentation.
Regulatory policy Origin has broad exposure to regulatory policy change including domestic energy pricing, generation and gas supply portfolios, carbon, retail operations, upstream development, royalties and taxation policy. Changes to policy may impact financial outcomes and, in some cases, change the commercial viability of existing or proposed projects or operations.
– Origin manages its exposure to industry wide regulatory risk by actively leading policy debate, proactively engaging with policy makers across all levels of government and participating in public forums, industry associations, think tanks and research.
Climate change Origin has broad exposures to energy market decarbonisation, which includes decreased demand for fossil fuels in some markets, reduced lifespans of higher carbon-intensive assets, increased regulation of greenhouse gas emissions from operations and consumer shifts to lower-carbon sources of energy.
– Origin’s strategy for transitioning to a carbon constrained future is to prepare for a range of decarbonisation scenarios.
– Origin produces less electricity than it sells to customers, which provides flexibility to adapt to changing market dynamics, including climate change, and positions the company well to bring low-cost renewables into its portfolio without stranding existing assets. The generation portfolio has no exposure to high-emissions brown coal, and has only one black coal-fired generation asset.
– Origin has signed up to We Mean Business and is progressing a science based target
.
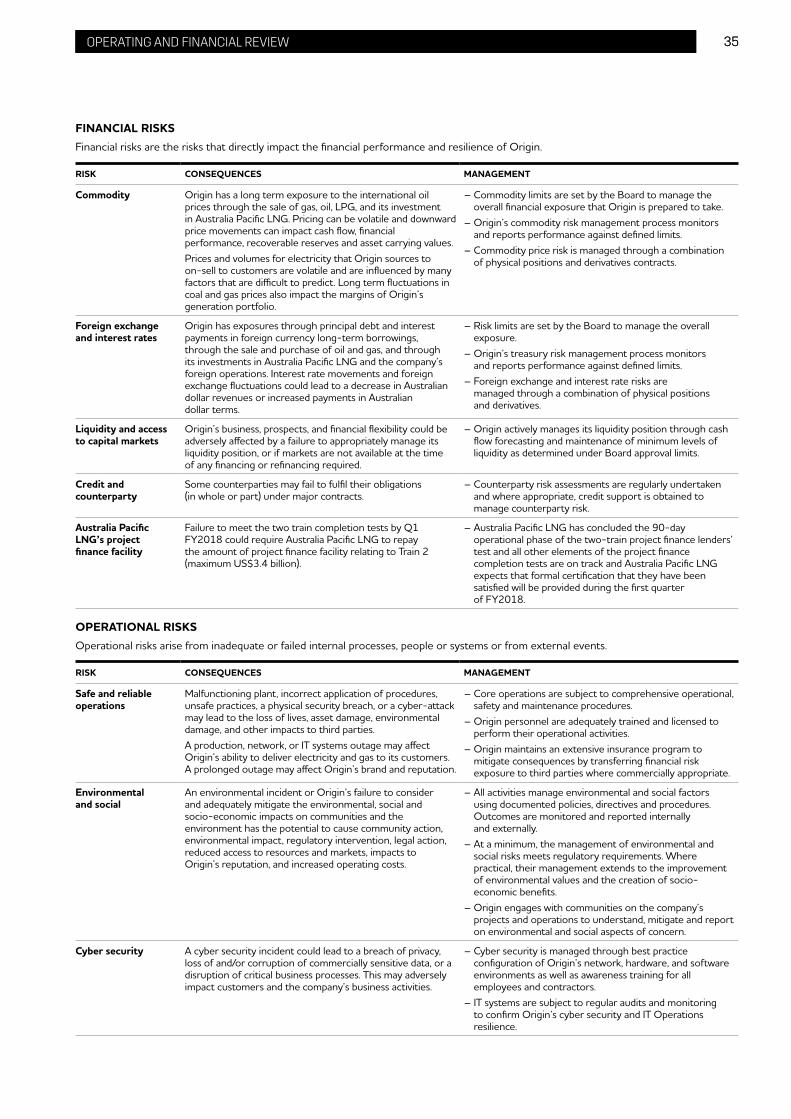
35ORIGIN ENERGY PAGE TITLE 35OPERATING AND FINANCIAL REVIEW
FINANCIAL RISKSFinancial risks are the risks that directly impact the financial performance and resilience of Origin.
RISK CONSEQUENCES MANAGEMENT
Commodity Origin has a long term exposure to the international oil prices through the sale of gas, oil, LPG, and its investment in Australia Pacific LNG. Pricing can be volatile and downward price movements can impact cash flow, financial performance, recoverable reserves and asset carrying values.Prices and volumes for electricity that Origin sources to on-sell to customers are volatile and are influenced by many factors that are difficult to predict. Long term fluctuations in coal and gas prices also impact the margins of Origin’s generation portfolio.
– Commodity limits are set by the Board to manage the overall financial exposure that Origin is prepared to take.
– Origin’s commodity risk management process monitors and reports performance against defined limits.
– Commodity price risk is managed through a combination of physical positions and derivatives contracts.
Foreign exchange and interest rates
Origin has exposures through principal debt and interest payments in foreign currency long-term borrowings, through the sale and purchase of oil and gas, and through its investments in Australia Pacific LNG and the company’s foreign operations. Interest rate movements and foreign exchange fluctuations could lead to a decrease in Australian dollar revenues or increased payments in Australian dollar terms.
– Risk limits are set by the Board to manage the overall exposure.
– Origin’s treasury risk management process monitors and reports performance against defined limits.
– Foreign exchange and interest rate risks are managed through a combination of physical positions and derivatives.
Liquidity and access to capital markets
Origin’s business, prospects, and financial flexibility could be adversely affected by a failure to appropriately manage its liquidity position, or if markets are not available at the time of any financing or refinancing required.
– Origin actively manages its liquidity position through cash flow forecasting and maintenance of minimum levels of liquidity as determined under Board approval limits.
Credit and counterparty
Some counterparties may fail to fulfil their obligations (in whole or part) under major contracts.
– Counterparty risk assessments are regularly undertaken and where appropriate, credit support is obtained to manage counterparty risk.
Australia Pacific LNG’s project finance facility
Failure to meet the two train completion tests by Q1 FY2018 could require Australia Pacific LNG to repay the amount of project finance facility relating to Train 2 (maximum US$3.4 billion).
– Australia Pacific LNG has concluded the 90-day operational phase of the two-train project finance lenders’ test and all other elements of the project finance completion tests are on track and Australia Pacific LNG expects that formal certification that they have been satisfied will be provided during the first quarter of FY2018.
OPERATIONAL RISKSOperational risks arise from inadequate or failed internal processes, people or systems or from external events.
RISK CONSEQUENCES MANAGEMENT
Safe and reliable operations
Malfunctioning plant, incorrect application of procedures, unsafe practices, a physical security breach, or a cyber-attack may lead to the loss of lives, asset damage, environmental damage, and other impacts to third parties.A production, network, or IT systems outage may affect Origin’s ability to deliver electricity and gas to its customers. A prolonged outage may affect Origin’s brand and reputation.
– Core operations are subject to comprehensive operational, safety and maintenance procedures.
– Origin personnel are adequately trained and licensed to perform their operational activities.
– Origin maintains an extensive insurance program to mitigate consequences by transferring financial risk exposure to third parties where commercially appropriate.
Environmental and social
An environmental incident or Origin’s failure to consider and adequately mitigate the environmental, social and socio-economic impacts on communities and the environment has the potential to cause community action, environmental impact, regulatory intervention, legal action, reduced access to resources and markets, impacts to Origin’s reputation, and increased operating costs.
– All activities manage environmental and social factors using documented policies, directives and procedures. Outcomes are monitored and reported internally and externally.
– At a minimum, the management of environmental and social risks meets regulatory requirements. Where practical, their management extends to the improvement of environmental values and the creation of socio-economic benefits.
– Origin engages with communities on the company’s projects and operations to understand, mitigate and report on environmental and social aspects of concern.
Cyber security A cyber security incident could lead to a breach of privacy, loss of and/or corruption of commercially sensitive data, or a disruption of critical business processes. This may adversely impact customers and the company’s business activities.
– Cyber security is managed through best practice configuration of Origin’s network, hardware, and software environments as well as awareness training for all employees and contractors.
– IT systems are subject to regular audits and monitoring to confirm Origin’s cyber security and IT Operations resilience.

36 ORIGIN ENERGY PAGE TITLE 36 OPERATING AND FINANCIAL REVIEW
RISK CONSEQUENCES MANAGEMENT
Oil and gas reserves and resources
There is uncertainty about the productivity, and therefore economic viability, of resources and undeveloped reserves. As a result, there is a risk that actual production may vary from that estimated, and in the longer term, that there will be insufficient reserves to supply the full duration and volumes to meet contractual requirements.
– Origin employs established industry procedures to identify and consider areas for exploration to mature contingent and prospective resources.
– Origin monitors reservoir performance and adjusts development plans accordingly and/or acquires reserves from alternate sources.
Conduct Lack of ethical business practices and integrity, and failure to comply with Origin’s Compass may affect Origin’s risk profile, business operations and financial prospects.
– Origin’s Purpose, Values and Behaviours guide conduct and decision making in a way that is common across Origin.
Joint venture Third party joint venture operators may have economic or other business interests that are inconsistent with Origin’s own and may take actions contrary to the company’s objectives, interests or standards. This may lead to potential financial, reputational and environmental damage in the event of a serious incident.
– Enterprise-wide joint venture governance and management standards are being revised to provide a more consistent approach to managing Origin’s joint ventures.
– Origin actively monitors and participates in its joint ventures through participation in their respective boards and committees.
Australia Pacific LNG reversion
The CSG interests that Australia Pacific LNG acquired from Tri-Star in 2002 are subject to reversionary rights. If triggered, these rights will require Australia Pacific LNG to transfer back to Tri-Star a 45 per cent interest in those CSG interests for no additional consideration. The reversion trigger will occur when the revenue from the sale of petroleum from those CSG interests, plus any other revenue derived from or in connection with those CSG interests, exceeds the aggregate of all expenditure relating to those CSG interests plus interest on that expenditure, royalty payments and the original acquisition price. Approximately 21 per cent of Australia Pacific LNG’s 3P CSG reserves as of 30 June 2017 are subject to these reversionary rights.Tri-Star has commenced proceedings against Australia Pacific LNG claiming that reversion has occurred. If Tri-Star’s claim is not successfully defended, Tri-Star may be entitled to an order that reversion occurred as early as 1 November 2008 and the reserves and resources that are subject to reversion may not be available for Australia Pacific LNG to sell or use. These events may have a material adverse impact on the financial performance of Australia Pacific LNG and, if unmitigated, may significantly affect the amount and timing of cash flows from Australia Pacific LNG to its shareholders, including Origin.
– Australia Pacific LNG denies the claim and is defending it.
PROJECT RISKSOrigin undertakes investments in a variety of major projects including gas and oil projects, electricity generation, major transactions, and operational systems. These major projects are exposed to the effectiveness of Origin’s project management and to events outside of Origin’s control, such as weather events or natural disasters, which may result in adverse cost and schedule implications, and, in turn, Origin’s financial prospects.
RISK CONSEQUENCES MANAGEMENT
Divestment of Origin’s conventional upstream business
A dual track IPO/trade sale process is currently underway for Lattice Energy. A failure to complete the divestment or lower than expected divestment proceeds will adversely impact Origin’s debt reduction program.Material adverse changes in the state of equity capital markets and the interest of potential acquirers may impact the ability to successfully divest this business.
– A dedicated project team, supported by independent advice, has been established to coordinate the divestment of identified assets at the maximum market value.

37ORIGIN ENERGY PAGE TITLE 37OPERATING AND FINANCIAL REVIEW
APPENDIX 1 – NET FINANCING COSTS
YEAR ENDED 30 JUNE2017
$MILLION2016
$MILLIONCHANGE
$MILLION
STATUTORY NET FINANCING COST – TOTAL OPERATION
Total interest charged by other parties (560) (643) 83Impact of discounting on long term provisions (15) (16) 1Capitalised interest 10 90 (80)Total interest expense (565) (569) 4MRCPS interest income 222 220 2Other interest income 2 2 –Statutory Net financing costs (341) (347) 6Average interest rate1 6.3% 6.5% (0.2%)
ITEMS EXCLUDED FROM UNDERLYING NET FINANCING COSTS RELATING TO FUNDING OF APLNG
Total interest expense (68) (400) 332MRCPS interest income 23 162 (139)Net financing costs relating to funding of APLNG (45) (238) 193Average interest rate1 6.5% 6.9% (0.5%)
UNDERLYING NET FINANCING COST – TOTAL OPERATIONS
Total interest charged by other parties (excluding costs associated with funding of APLNG) (96) (155) 59Total interest charged by other parties (costs associated with funding of APLNG) (396) (88) (308)Impact of discounting on long term provisions (15) (16) 1Capitalised interest 10 90 (80)Total interest expense (497) (169) (328)MRCPS interest income (in Underlying) 199 58 141Other interest income 2 2 –Underlying Net financing costs (296) (109) (187)Average interest rate1 6.3% 5.9% 0.4%
APPENDIX 2 – RECONCILIATION OF ADJUSTED NET DEBT
Between 2011 and 2015, Origin raised foreign currency denominated debt in the US and Euro markets. This foreign currency debt was hedged into either AUD or USD using cross currency interest rate swap (CCIRS) derivatives. Accounting standards require the foreign currency debt and the linked CCIRS derivatives to be disclosed in different lines on the Statement of Financial Position (Balance Sheet). Foreign currency debt is translated at the current market spot rate and classified as interest-bearing liabilities, whilst the associated CCIRS derivatives are measured at current market rates (fair value) and are classified as either derivative assets or derivative liabilities on the Statement of Financial Position. It is the combination of the interest-bearing liabilities and the derivative assets or derivative liabilities that reflect the Company’s adjusted net debt position or the quantum of funds the Company is required to repay upon maturity of the debt.
As at 30 June 2017, Origin’s interest bearing liabilities on the Statement of Financial Position were $8,515 million. The associated CCIRS was a net derivative asset of $253 million on the Statement of Financial Position. Adjusted Net Debt of $8,111 million decreased $1,020 million compared to the prior period.
ISSUE CURRENCY
ISSUE NOTIONAL
HEDGED CURRENCY
HEDGED NOTIONAL
AUD $M JUNE 2017
AUD $M JUNE 2017
AUD $M JUNE 2017
Interest-bearing
liabilities
Fair value adjustments on
FX hedging transactions
Adjusted net debt
AUD debt AUD 517 AUD 517 517 0 517USD Debt left in USD USD 850 USD 850 1,105 0 1,105USD debt swapped to AUD USD 895 AUD 1,004 1,166 (162) 1,004EUR debt swapped to AUD EUR 2,700 AUD 3,727 4,106 (378) 3,727EUR debt swapped to USD EUR 1,000 USD 1,372 1,487 298 1,784NZD debt swapped to AUD NZD 141 AUD 125 134 (10) 124
Total 8,515 (253) 8,262Cash and cash equivalents (151)Adjusted net debt (8,111)
1 Average interest rate calculated using total interest charged by other parties.

3838 ORIGIN ENERGY ANNUAL REPORT 2017 PAGE TITLE REMUNERATION REPORT
LETTER FROM THE CHAIRMAN OF THE REMUNERATION AND PEOPLE COMMITTEE
On behalf of the Remuneration and People Committee (RPC) and the Board, I am pleased to present the Remuneration Report for the year ended 30 June 2017.
During the year there were significant changes to both the management structure of the company and to the composition and scope of the RPC. A new Chief Executive Officer (CEO), Frank Calabria, was appointed following the retirement of Grant King from the role which he held since 2000. The RPC expanded its mandate to cover general people accountabilities for the company. I succeeded Dr Helen Nugent as Chairman, and more recently Teresa Engelhard joined the RPC.
The expanded scope of the RPC enables a more direct linkage between the policies governing people and their performance and the company’s overall strategic objectives.
The objectives of the executive remuneration framework are to enable the company to attract and retain high-calibre individuals from diverse backgrounds in a competitive market, and to structure rewards such that they align the interests of the executives with our shareholders. The RPC and the Board review the operation and outcomes of the framework to assure its fitness for this purpose in a dynamic business and commercial context.
In FY2017, Origin recorded a solid operational performance. While financial returns remain unsatisfactory, the company recorded meaningful progress against its three key priorities of reducing debt, improving returns, and maintaining our leadership in Energy Markets and Integrated Gas. The company’s share price rose by 19.3 per cent over the period, a marked improvement on recent years.
In terms of executive performance in FY2017, annual short term incentive (STI) outcomes were generally close to their targets, reflecting the levels of achievement against financial and non-financial targets (as detailed in tables 3 and 9). The fifth successive year of nil vesting and forfeiture of all long-term incentive (LTI) awards demonstrates the direct link between long term company performance and executive remuneration outcomes.
To further simplify the current structure and emphasise the importance of share ownership, the Board intends to modify the remuneration structure, beginning in FY2018. Directors have carefully considered the modifications and have taken external advice.
The proposed changes are summarised in section 4 of the Remuneration Report. We are confident these changes will strengthen the framework to meet the objectives described above.
We have re-ordered and streamlined the content of this report in order to make it clearer, more concise and more informative.
Scott Perkins Chairman, Remuneration and People Committee
CONTENTS
The Remuneration Report for the 12 months ended 30 June 2017 (FY2017, the Period) forms part of the Directors’ Report. Except as otherwise noted it has been prepared in accordance with the Corporations Act 2001 (Cth) (the Act) and in compliance with AASB 124 Related Party Disclosures, and audited as required by section 308(3C) of the Act. The report is divided into the following sections:
1 People covered by the report
2 Remuneration outcomes for FY2017
3 Executive remuneration policy and structure
4 Changes for FY2018
5 Remuneration governance
6 Statutory disclosures
7 Loans and other transactions with Key Management Personnel
REMUNERATION REPORT FOR THE YEAR ENDED 30 JUNE 2017
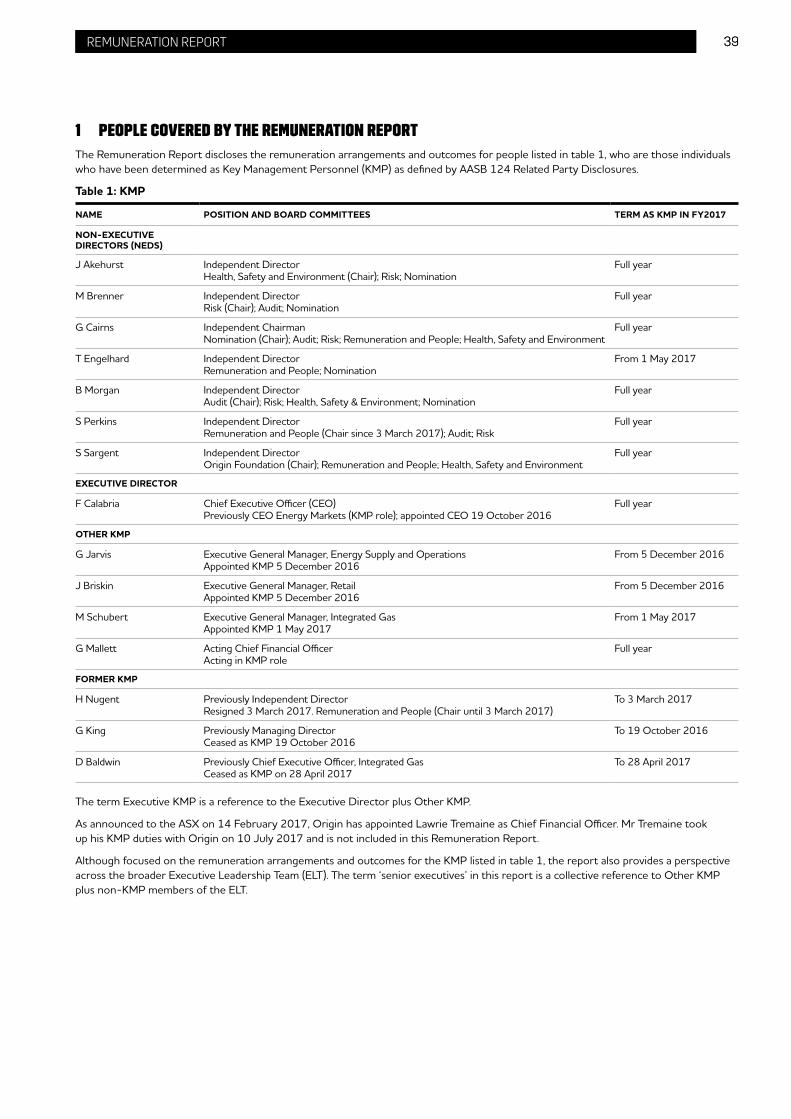
39ORIGIN ENERGY PAGE TITLE 39REMUNERATION REPORT
1 PEOPLE COVERED BY THE REMUNERATION REPORT
The Remuneration Report discloses the remuneration arrangements and outcomes for people listed in table 1, who are those individuals who have been determined as Key Management Personnel (KMP) as defined by AASB 124 Related Party Disclosures.
Table 1: KMP
NAME POSITION AND BOARD COMMITTEES TERM AS KMP IN FY2017
NON-EXECUTIVE DIRECTORS (NEDS)
J Akehurst Independent DirectorHealth, Safety and Environment (Chair); Risk; Nomination
Full year
M Brenner Independent DirectorRisk (Chair); Audit; Nomination
Full year
G Cairns Independent ChairmanNomination (Chair); Audit; Risk; Remuneration and People; Health, Safety and Environment
Full year
T Engelhard Independent DirectorRemuneration and People; Nomination
From 1 May 2017
B Morgan Independent DirectorAudit (Chair); Risk; Health, Safety & Environment; Nomination
Full year
S Perkins Independent DirectorRemuneration and People (Chair since 3 March 2017); Audit; Risk
Full year
S Sargent Independent DirectorOrigin Foundation (Chair); Remuneration and People; Health, Safety and Environment
Full year
EXECUTIVE DIRECTOR
F Calabria Chief Executive Officer (CEO)Previously CEO Energy Markets (KMP role); appointed CEO 19 October 2016
Full year
OTHER KMP
G Jarvis Executive General Manager, Energy Supply and OperationsAppointed KMP 5 December 2016
From 5 December 2016
J Briskin Executive General Manager, RetailAppointed KMP 5 December 2016
From 5 December 2016
M Schubert Executive General Manager, Integrated GasAppointed KMP 1 May 2017
From 1 May 2017
G Mallett Acting Chief Financial OfficerActing in KMP role
Full year
FORMER KMP
H Nugent Previously Independent DirectorResigned 3 March 2017. Remuneration and People (Chair until 3 March 2017)
To 3 March 2017
G King Previously Managing DirectorCeased as KMP 19 October 2016
To 19 October 2016
D Baldwin Previously Chief Executive Officer, Integrated GasCeased as KMP on 28 April 2017
To 28 April 2017
The term Executive KMP is a reference to the Executive Director plus Other KMP.
As announced to the ASX on 14 February 2017, Origin has appointed Lawrie Tremaine as Chief Financial Officer. Mr Tremaine took up his KMP duties with Origin on 10 July 2017 and is not included in this Remuneration Report.
Although focused on the remuneration arrangements and outcomes for the KMP listed in table 1, the report also provides a perspective across the broader Executive Leadership Team (ELT). The term ‘senior executives’ in this report is a collective reference to Other KMP plus non-KMP members of the ELT.
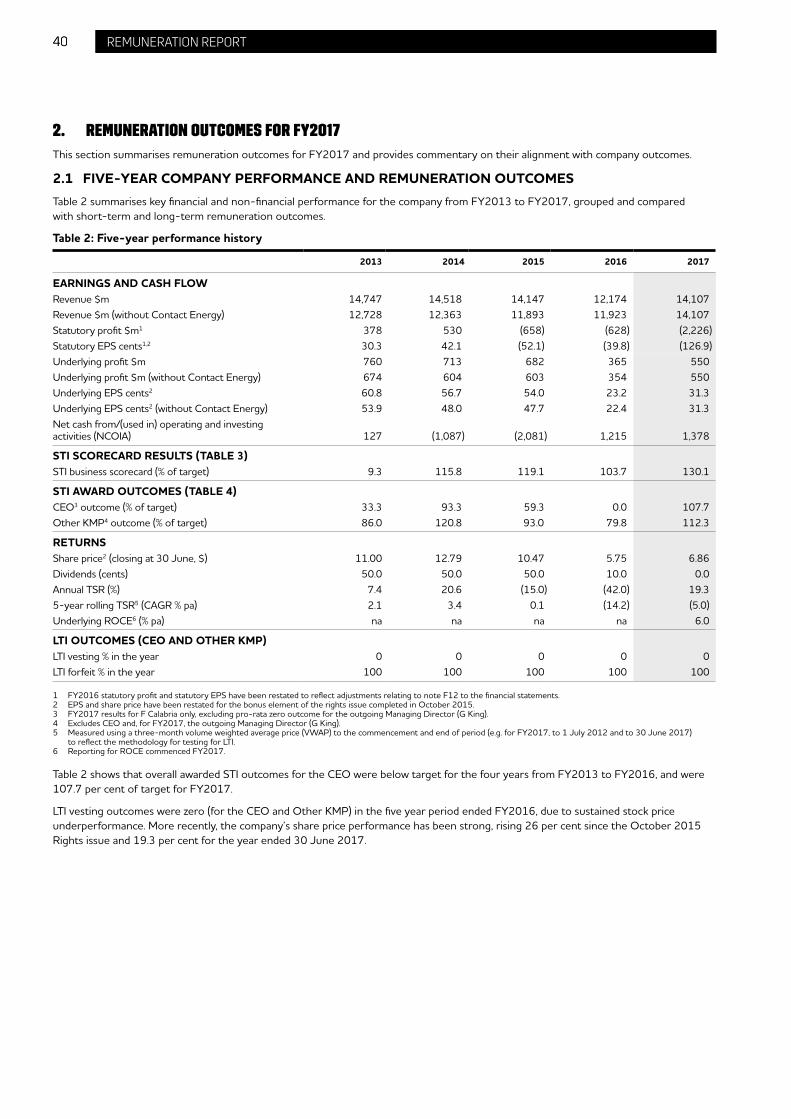
40 ORIGIN ENERGY PAGE TITLE 40 REMUNERATION REPORT
2. REMUNERATION OUTCOMES FOR FY2017
This section summarises remuneration outcomes for FY2017 and provides commentary on their alignment with company outcomes.
2.1 FIVE-YEAR COMPANY PERFORMANCE AND REMUNERATION OUTCOMESTable 2 summarises key financial and non-financial performance for the company from FY2013 to FY2017, grouped and compared with short-term and long-term remuneration outcomes.
Table 2: Five-year performance history
2013 2014 2015 2016 2017
EARNINGS AND CASH FLOWRevenue $m 14,747 14,518 14,147 12,174 14,107Revenue $m (without Contact Energy) 12,728 12,363 11,893 11,923 14,107Statutory profit $m1 378 530 (658) (628) (2,226)Statutory EPS cents1,2 30.3 42.1 (52.1) (39.8) (126.9)Underlying profit $m 760 713 682 365 550Underlying profit $m (without Contact Energy) 674 604 603 354 550Underlying EPS cents2 60.8 56.7 54.0 23.2 31.3Underlying EPS cents2 (without Contact Energy) 53.9 48.0 47.7 22.4 31.3Net cash from/(used in) operating and investing activities (NCOIA) 127 (1,087) (2,081) 1,215 1,378
STI SCORECARD RESULTS (TABLE 3)STI business scorecard (% of target) 9.3 115.8 119.1 103.7 130.1
STI AWARD OUTCOMES (TABLE 4)CEO3 outcome (% of target) 33.3 93.3 59.3 0.0 107.7Other KMP4 outcome (% of target) 86.0 120.8 93.0 79.8 112.3
RETURNSShare price2 (closing at 30 June, $) 11.00 12.79 10.47 5.75 6.86Dividends (cents) 50.0 50.0 50.0 10.0 0.0Annual TSR (%) 7.4 20.6 (15.0) (42.0) 19.35-year rolling TSR5 (CAGR % pa) 2.1 3.4 0.1 (14.2) (5.0)Underlying ROCE6 (% pa) na na na na 6.0
LTI OUTCOMES (CEO AND OTHER KMP)LTI vesting % in the year 0 0 0 0 0LTI forfeit % in the year 100 100 100 100 100
1 FY2016 statutory profit and statutory EPS have been restated to reflect adjustments relating to note F12 to the financial statements.2 EPS and share price have been restated for the bonus element of the rights issue completed in October 2015.3 FY2017 results for F Calabria only, excluding pro-rata zero outcome for the outgoing Managing Director (G King).4 Excludes CEO and, for FY2017, the outgoing Managing Director (G King).5 Measured using a three-month volume weighted average price (VWAP) to the commencement and end of period (e.g. for FY2017, to 1 July 2012 and to 30 June 2017)
to reflect the methodology for testing for LTI.6 Reporting for ROCE commenced FY2017.
Table 2 shows that overall awarded STI outcomes for the CEO were below target for the four years from FY2013 to FY2016, and were 107.7 per cent of target for FY2017.
LTI vesting outcomes were zero (for the CEO and Other KMP) in the five year period ended FY2016, due to sustained stock price underperformance. More recently, the company’s share price performance has been strong, rising 26 per cent since the October 2015 Rights issue and 19.3 per cent for the year ended 30 June 2017.
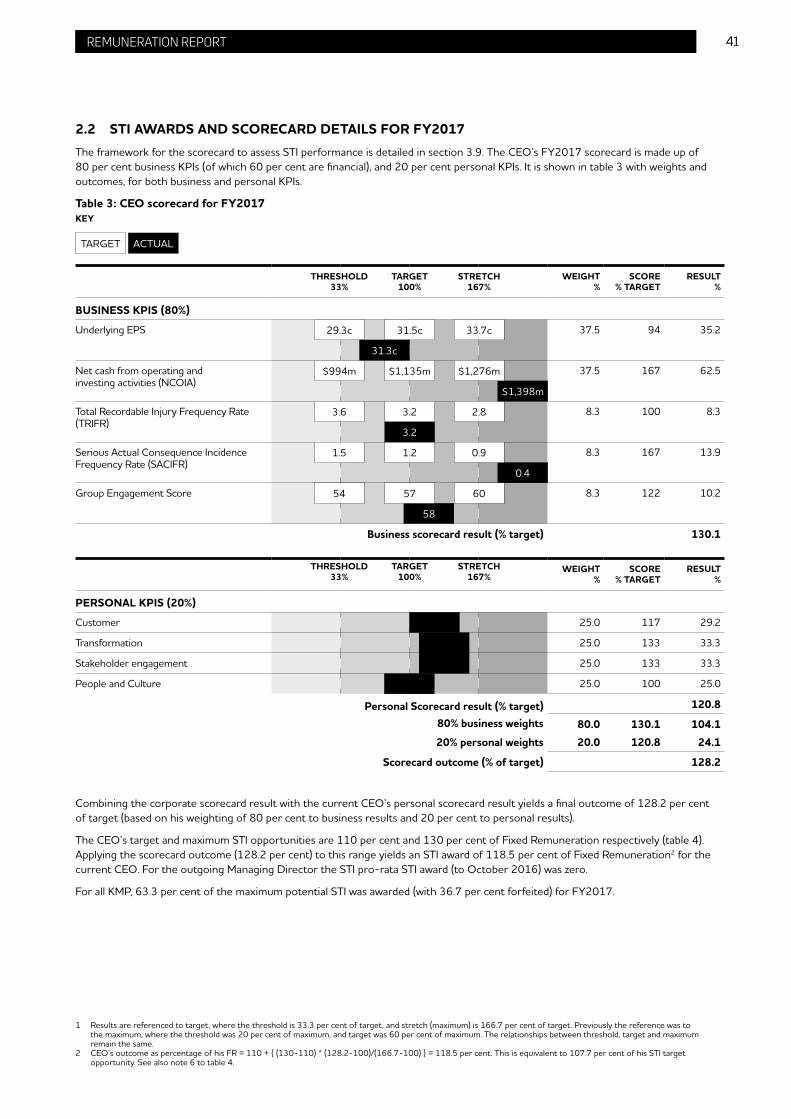
41ORIGIN ENERGY PAGE TITLE 41REMUNERATION REPORT
2.2 STI AWARDS AND SCORECARD DETAILS FOR FY2017The framework for the scorecard to assess STI performance is detailed in section 3.9. The CEO’s FY2017 scorecard is made up of 80 per cent business KPIs (of which 60 per cent are financial), and 20 per cent personal KPIs. It is shown in table 3 with weights and outcomes, for both business and personal KPIs.
Table 3: CEO scorecard for FY2017KEY
TARGET
ACTUAL
WEIGHT%
SCORE% TARGET
RESULT%
BUSINESS KPIS (80%)
Underlying EPS 37.5 94 35.2
Net cash from operating and investing activities (NCOIA)
37.5 167 62.5
Total Recordable Injury Frequency Rate (TRIFR)
8.3 100 8.3
Serious Actual Consequence Incidence Frequency Rate (SACIFR)
8.3 167 13.9
Group Engagement Score 8.3 122 10.2
Business scorecard result (% target) 130.1
WEIGHT%
SCORE% TARGET
RESULT%
PERSONAL KPIS (20%)
Customer 25.0 117 29.2
Transformation 25.0 133 33.3
Stakeholder engagement 25.0 133 33.3
People and Culture 25.0 100 25.0
Personal Scorecard result (% target) 120.8
80% business weights 80.0 130.1 104.120% personal weights 20.0 120.8 24.1
Scorecard outcome (% of target) 128.2
Combining the corporate scorecard result with the current CEO’s personal scorecard result yields a final outcome of 128.2 per cent of target (based on his weighting of 80 per cent to business results and 20 per cent to personal results).
The CEO’s target and maximum STI opportunities are 110 per cent and 130 per cent of Fixed Remuneration respectively (table 4). Applying the scorecard outcome (128.2 per cent) to this range yields an STI award of 118.5 per cent of Fixed Remuneration2 for the current CEO. For the outgoing Managing Director the STI pro-rata STI award (to October 2016) was zero.
For all KMP, 63.3 per cent of the maximum potential STI was awarded (with 36.7 per cent forfeited) for FY2017.
1 Results are referenced to target, where the threshold is 33.3 per cent of target, and stretch (maximum) is 166.7 per cent of target. Previously the reference was to the maximum, where the threshold was 20 per cent of maximum, and target was 60 per cent of maximum. The relationships between threshold, target and maximum remain the same.
2 CEO’s outcome as percentage of his FR = 110 + { (130-110) * (128.2-100)/(166.7-100) } = 118.5 per cent. This is equivalent to 107.7 per cent of his STI target opportunity. See also note 6 to table 4.
29.3c
THRESHOLD33%
THRESHOLD33%
31.5c
TARGET 100%
TARGET 100%
33.7c
STRETCH 167%
STRETCH 167%
58
0.4
1.5 1.2 0.9
3.2
3.6 3.2 2.8
$1,398m
$994m $1,135m $1,276m
31.3c
54 57 60

42 ORIGIN ENERGY PAGE TITLE 42 REMUNERATION REPORT
2.3 LTI ALLOCATIONS FOR FY2017LTI awards for FY2017 are listed in table 4. These have generally been at target level, noting that their vesting depends on future achievements against the long-term company performance hurdles (see table 13).
From time to time the Board exercises its discretion to adjust the award allocation (as it did in FY2016). It did not find reason to vary from the target level allocations for FY2017. This was especially appropriate given that the ELT was substantially restructured during the period.
2.4 VARIABLE PAY OUTCOMESTable 4 summarises variable pay outcomes (STI and LTI) for Executive KMP for FY2017 and FY2016, segmented into cash and deferred payments.
Almost two-thirds (62 per cent) of the award amounts are equity-based and subject to the risk of forfeiture, and they are deferred for periods of up to five years after the end of FY2017.

43ORIGIN ENERGY PAGE TITLE 43REMUNERATION REPORT
2.5 ACTUAL PAY RECEIVEDIn line with general market practice a (non-AIFRS) presentation of actual pay received is provided in table 5 in addition to the statutory requirements (table 17). This gives shareholders a more informative picture of actual remuneration outcomes.
In addition to Fixed Remuneration (FR) and the cash component of STI, actual pay received includes equity that has vested from equity grants made in prior periods, whether from Deferred STI allocations or from LTI allocations.
The value of Deferred STI that vests, even though it is not subject to further performance conditions, depends on the company’s share price at the time of vesting. This ensures that the original award is moderated in value by such increases or decreases in share price over the deferral period.
With respect to LTI awards table 5 shows no value crystallised in FY2017 (or FY2016) from prior year LTI allocations. This reflects that the company’s performance in recent years has not reached levels at which executives derive any value from the LTI part of their remuneration package.
Further, LTI awards which have been previously reported and disclosed as statutory remuneration attributed to the executives, have been forfeited. The amount shown in table 5 in the forfeiture column is the value of the remuneration that was previously attributed to the executive but which was ultimately of no value. Over the past two years, KMP have forfeited just short of $20 million of previously reported statutory remuneration.
These observations demonstrate the strong alignment that exists between executive remuneration and long-term company performance.
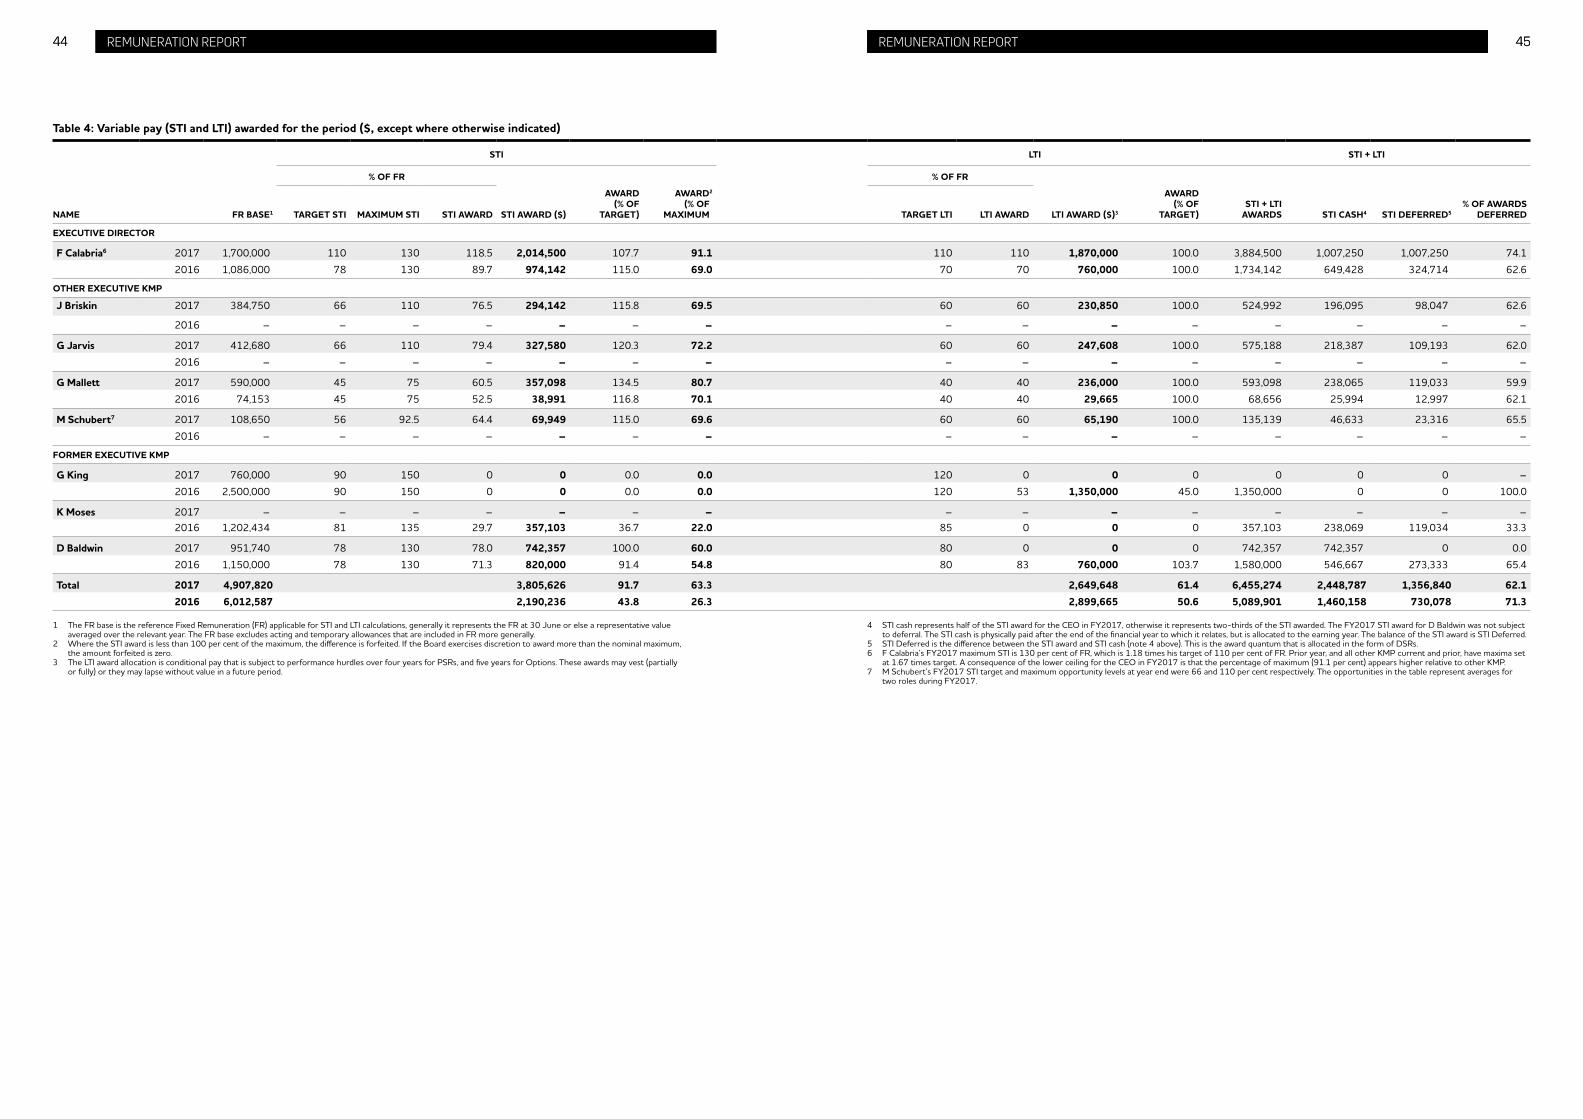
44 45ORIGIN ENERGY PAGE TITLE ORIGIN ENERGY PAGE TITLE 44 45REMUNERATION REPORT REMUNERATION REPORT
Table 4: Variable pay (STI and LTI) awarded for the period ($, except where otherwise indicated)
STI LTI STI + LTI
% OF FR % OF FR
NAME FR BASE1 TARGET STI MAXIMUM STI STI AWARD STI AWARD ($)
AWARD (% OF
TARGET)
AWARD2 (% OF
MAXIMUM TARGET LTI LTI AWARD LTI AWARD ($)3
AWARD (% OF
TARGET)STI + LTI
AWARDS STI CASH4 STI DEFERRED5% OF AWARDS
DEFERRED
EXECUTIVE DIRECTOR
F Calabria6 2017 1,700,000 110 130 118.5 2,014,500 107.7 91.1 110 110 1,870,000 100.0 3,884,500 1,007,250 1,007,250 74.1
2016 1,086,000 78 130 89.7 974,142 115.0 69.0 70 70 760,000 100.0 1,734,142 649,428 324,714 62.6
OTHER EXECUTIVE KMP
J Briskin 2017 384,750 66 110 76.5 294,142 115.8 69.5 60 60 230,850 100.0 524,992 196,095 98,047 62.6
2016 – – – – – – – – – – – – – – –
G Jarvis 2017 412,680 66 110 79.4 327,580 120.3 72.2 60 60 247,608 100.0 575,188 218,387 109,193 62.0
2016 – – – – – – – – – – – – – – –
G Mallett 2017 590,000 45 75 60.5 357,098 134.5 80.7 40 40 236,000 100.0 593,098 238,065 119,033 59.9
2016 74,153 45 75 52.5 38,991 116.8 70.1 40 40 29,665 100.0 68,656 25,994 12,997 62.1
M Schubert7 2017 108,650 56 92.5 64.4 69,949 115.0 69.6 60 60 65,190 100.0 135,139 46,633 23,316 65.5
2016 – – – – – – – – – – – – – – –
FORMER EXECUTIVE KMP
G King 2017 760,000 90 150 0 0 0.0 0.0 120 0 0 0 0 0 0 –
2016 2,500,000 90 150 0 0 0.0 0.0 120 53 1,350,000 45.0 1,350,000 0 0 100.0
K Moses 2017 – – – – – – – – – – – – – – –2016 1,202,434 81 135 29.7 357,103 36.7 22.0 85 0 0 0 357,103 238,069 119,034 33.3
D Baldwin 2017 951,740 78 130 78.0 742,357 100.0 60.0 80 0 0 0 742,357 742,357 0 0.0
2016 1,150,000 78 130 71.3 820,000 91.4 54.8 80 83 760,000 103.7 1,580,000 546,667 273,333 65.4
Total 2017 4,907,820 3,805,626 91.7 63.3 2,649,648 61.4 6,455,274 2,448,787 1,356,840 62.12016 6,012,587 2,190,236 43.8 26.3 2,899,665 50.6 5,089,901 1,460,158 730,078 71.3
1 The FR base is the reference Fixed Remuneration (FR) applicable for STI and LTI calculations, generally it represents the FR at 30 June or else a representative value averaged over the relevant year. The FR base excludes acting and temporary allowances that are included in FR more generally.
2 Where the STI award is less than 100 per cent of the maximum, the difference is forfeited. If the Board exercises discretion to award more than the nominal maximum, the amount forfeited is zero.
3 The LTI award allocation is conditional pay that is subject to performance hurdles over four years for PSRs, and five years for Options. These awards may vest (partially or fully) or they may lapse without value in a future period.
4 STI cash represents half of the STI award for the CEO in FY2017, otherwise it represents two-thirds of the STI awarded. The FY2017 STI award for D Baldwin was not subject to deferral. The STI cash is physically paid after the end of the financial year to which it relates, but is allocated to the earning year. The balance of the STI award is STI Deferred.
5 STI Deferred is the difference between the STI award and STI cash (note 4 above). This is the award quantum that is allocated in the form of DSRs.6 F Calabria’s FY2017 maximum STI is 130 per cent of FR, which is 1.18 times his target of 110 per cent of FR. Prior year, and all other KMP current and prior, have maxima set
at 1.67 times target. A consequence of the lower ceiling for the CEO in FY2017 is that the percentage of maximum (91.1 per cent) appears higher relative to other KMP.7 M Schubert’s FY2017 STI target and maximum opportunity levels at year end were 66 and 110 per cent respectively. The opportunities in the table represent averages for
two roles during FY2017.
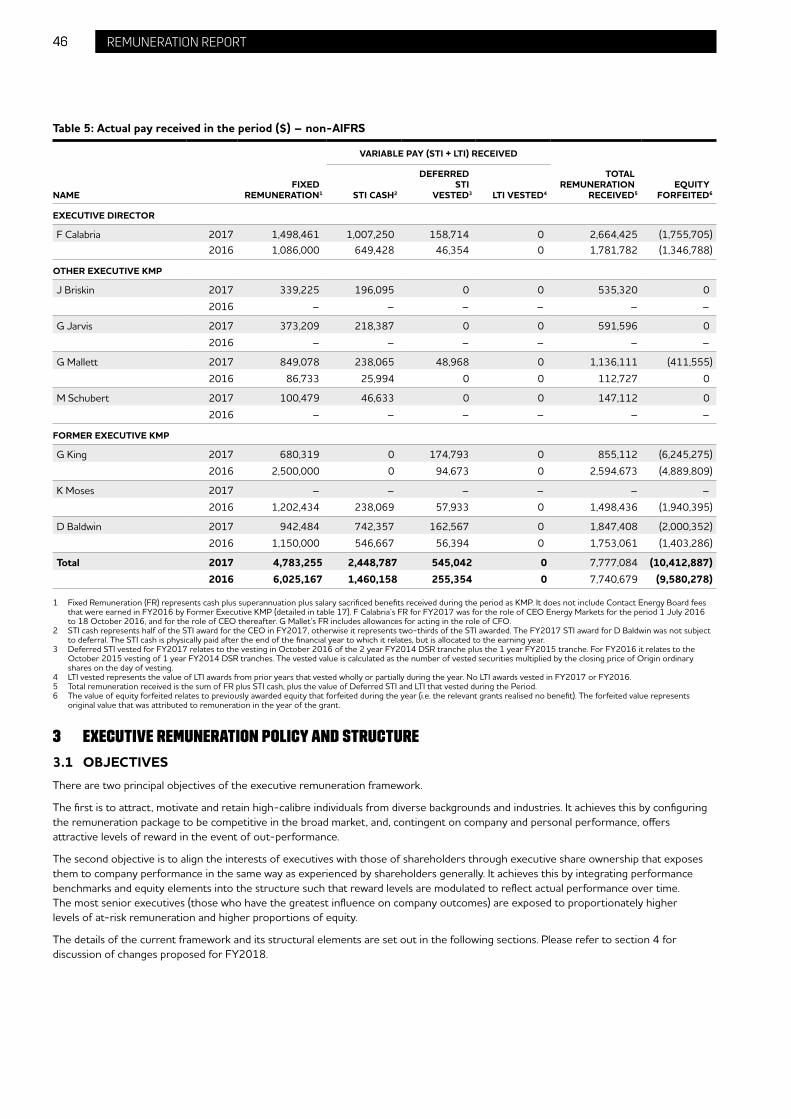
46 ORIGIN ENERGY PAGE TITLE 46 REMUNERATION REPORT
Table 5: Actual pay received in the period ($) – non-AIFRS
VARIABLE PAY (STI + LTI) RECEIVED
NAMEFIXED
REMUNERATION1 STI CASH2
DEFERRED STI
VESTED3 LTI VESTED4
TOTAL REMUNERATION
RECEIVED5EQUITY
FORFEITED6
EXECUTIVE DIRECTOR
F Calabria 2017 1,498,461 1,007,250 158,714 0 2,664,425 (1,755,705)2016 1,086,000 649,428 46,354 0 1,781,782 (1,346,788)
OTHER EXECUTIVE KMP
J Briskin 2017 339,225 196,095 0 0 535,320 0
2016 – – – – – –
G Jarvis 2017 373,209 218,387 0 0 591,596 0
2016 – – – – – –
G Mallett 2017 849,078 238,065 48,968 0 1,136,111 (411,555)
2016 86,733 25,994 0 0 112,727 0
M Schubert 2017 100,479 46,633 0 0 147,112 0
2016 – – – – – –
FORMER EXECUTIVE KMP
G King 2017 680,319 0 174,793 0 855,112 (6,245,275)
2016 2,500,000 0 94,673 0 2,594,673 (4,889,809)
K Moses 2017 – – – – – –
2016 1,202,434 238,069 57,933 0 1,498,436 (1,940,395)
D Baldwin 2017 942,484 742,357 162,567 0 1,847,408 (2,000,352)
2016 1,150,000 546,667 56,394 0 1,753,061 (1,403,286)
Total 2017 4,783,255 2,448,787 545,042 0 7,777,084 (10,412,887)2016 6,025,167 1,460,158 255,354 0 7,740,679 (9,580,278)
1 Fixed Remuneration (FR) represents cash plus superannuation plus salary sacrificed benefits received during the period as KMP. It does not include Contact Energy Board fees that were earned in FY2016 by Former Executive KMP (detailed in table 17). F Calabria’s FR for FY2017 was for the role of CEO Energy Markets for the period 1 July 2016 to 18 October 2016, and for the role of CEO thereafter. G Mallet’s FR includes allowances for acting in the role of CFO.
2 STI cash represents half of the STI award for the CEO in FY2017, otherwise it represents two-thirds of the STI awarded. The FY2017 STI award for D Baldwin was not subject to deferral. The STI cash is physically paid after the end of the financial year to which it relates, but is allocated to the earning year.
3 Deferred STI vested for FY2017 relates to the vesting in October 2016 of the 2 year FY2014 DSR tranche plus the 1 year FY2015 tranche. For FY2016 it relates to the October 2015 vesting of 1 year FY2014 DSR tranches. The vested value is calculated as the number of vested securities multiplied by the closing price of Origin ordinary shares on the day of vesting.
4 LTI vested represents the value of LTI awards from prior years that vested wholly or partially during the year. No LTI awards vested in FY2017 or FY2016.5 Total remuneration received is the sum of FR plus STI cash, plus the value of Deferred STI and LTI that vested during the Period.6 The value of equity forfeited relates to previously awarded equity that forfeited during the year (i.e. the relevant grants realised no benefit). The forfeited value represents
original value that was attributed to remuneration in the year of the grant.
3 EXECUTIVE REMUNERATION POLICY AND STRUCTURE
3.1 OBJECTIVESThere are two principal objectives of the executive remuneration framework.
The first is to attract, motivate and retain high-calibre individuals from diverse backgrounds and industries. It achieves this by configuring the remuneration package to be competitive in the broad market, and, contingent on company and personal performance, offers attractive levels of reward in the event of out-performance.
The second objective is to align the interests of executives with those of shareholders through executive share ownership that exposes them to company performance in the same way as experienced by shareholders generally. It achieves this by integrating performance benchmarks and equity elements into the structure such that reward levels are modulated to reflect actual performance over time. The most senior executives (those who have the greatest influence on company outcomes) are exposed to proportionately higher levels of at-risk remuneration and higher proportions of equity.
The details of the current framework and its structural elements are set out in the following sections. Please refer to section 4 for discussion of changes proposed for FY2018.
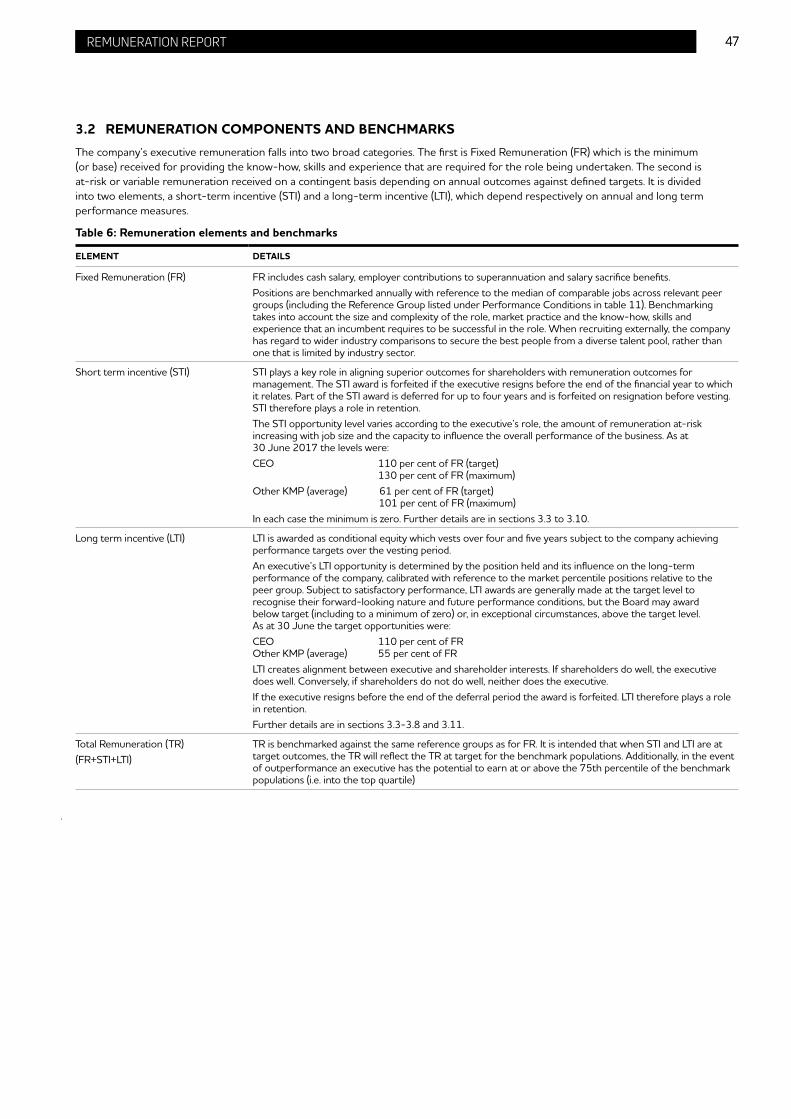
47ORIGIN ENERGY PAGE TITLE 47REMUNERATION REPORT
3.2 REMUNERATION COMPONENTS AND BENCHMARKSThe company’s executive remuneration falls into two broad categories. The first is Fixed Remuneration (FR) which is the minimum (or base) received for providing the know-how, skills and experience that are required for the role being undertaken. The second is at-risk or variable remuneration received on a contingent basis depending on annual outcomes against defined targets. It is divided into two elements, a short-term incentive (STI) and a long-term incentive (LTI), which depend respectively on annual and long term performance measures.
Table 6: Remuneration elements and benchmarks
ELEMENT DETAILS
Fixed Remuneration (FR) FR includes cash salary, employer contributions to superannuation and salary sacrifice benefits.Positions are benchmarked annually with reference to the median of comparable jobs across relevant peer groups (including the Reference Group listed under Performance Conditions in table 11). Benchmarking takes into account the size and complexity of the role, market practice and the know-how, skills and experience that an incumbent requires to be successful in the role. When recruiting externally, the company has regard to wider industry comparisons to secure the best people from a diverse talent pool, rather than one that is limited by industry sector.
Short term incentive (STI) STI plays a key role in aligning superior outcomes for shareholders with remuneration outcomes for management. The STI award is forfeited if the executive resigns before the end of the financial year to which it relates. Part of the STI award is deferred for up to four years and is forfeited on resignation before vesting. STI therefore plays a role in retention.The STI opportunity level varies according to the executive’s role, the amount of remuneration at-risk increasing with job size and the capacity to influence the overall performance of the business. As at 30 June 2017 the levels were:CEO 110 per cent of FR (target) 130 per cent of FR (maximum)Other KMP (average) 61 per cent of FR (target) 101 per cent of FR (maximum)In each case the minimum is zero. Further details are in sections 3.3 to 3.10.
Long term incentive (LTI) LTI is awarded as conditional equity which vests over four and five years subject to the company achieving performance targets over the vesting period.An executive’s LTI opportunity is determined by the position held and its influence on the long-term performance of the company, calibrated with reference to the market percentile positions relative to the peer group. Subject to satisfactory performance, LTI awards are generally made at the target level to recognise their forward-looking nature and future performance conditions, but the Board may award below target (including to a minimum of zero) or, in exceptional circumstances, above the target level. As at 30 June the target opportunities were:CEO 110 per cent of FROther KMP (average) 55 per cent of FRLTI creates alignment between executive and shareholder interests. If shareholders do well, the executive does well. Conversely, if shareholders do not do well, neither does the executive.If the executive resigns before the end of the deferral period the award is forfeited. LTI therefore plays a role in retention.Further details are in sections 3.3-3.8 and 3.11.
Total Remuneration (TR)(FR+STI+LTI)
TR is benchmarked against the same reference groups as for FR. It is intended that when STI and LTI are at target outcomes, the TR will reflect the TR at target for the benchmark populations. Additionally, in the event of outperformance an executive has the potential to earn at or above the 75th percentile of the benchmark populations (i.e. into the top quartile)
.

48 ORIGIN ENERGY PAGE TITLE 48 REMUNERATION REPORT
3.3 REMUNERATION RANGE, MIX AND DEFERRALThe possible range of remuneration outcomes and their mix is shown in table 7. It demonstrates that the proportion of packages at risk and delivered as deferred equity increases with seniority of the role.
For ‘at target’ or expected outcomes the CEO’s remuneration package is 62 per cent at risk, with 58 per cent delivered as cash and 42 per cent as deferred equity (deferred for up to five years). At maximum outcomes it is 72 per cent at risk and is mostly deferred. For Other KMP, on average, the package ‘at target’ or expected outcomes is 47 per cent at risk with approximately one-quarter delivered in deferred pay, and at maximum outcomes is 61 per cent at risk with more than one-third deferred.
Table 7: Remuneration range and mix
0
1,000
2,000
3,000
4,000
5,000
6,000
7,000
8,000
Fixed Cash STI Deferred STI LTI
MaximumExpected/TargetMinimum
CEO Other KMP (average)
$000
0
500
1,000
1,500
2,000
MaximumExpected/TargetMinimum
1,700 1,700
703 703
278
139
203
703
463
231
407
935
935
935
1,105
1,105
2,210
1,700
COMPONENT 100% Fixed 38% Fixed
41% STI
21% LTI
28% Fixed
36% STI
36% LTI
100% Fixed 53% Fixed
32% STI
15% LTI
39% Fixed
38% STI
23% LTI
RISK 100% Fixed 38% Fixed
62% At Risk
28% Fixed
72% At Risk100% Fixed 53% Fixed
47% At Risk
39% Fixed
61% At Risk
DEFERRAL 100% Cash 58% Cash
42% Deferred
46% Cash
54% Deferred100% Cash 74% Cash
26% Deferred
65% Cash
35% Deferred
To enable consistent comparisons the remuneration in table 7 is annualised at the rates applicable on 30 June 2017 (i.e. the data is not pro-rated). LTI is assumed to be wholly allocated in performance rights1, and the following definitions apply:
Minimum Zero STI awarded and zero LTI awarded (or zero LTI vested outcome)
Expected ‘At target’ STI awarded and target LTI allocated with a 50% vested outcome
Maximum Maximum STI awarded and maximum LTI allocated with a 100% vested outcome
1 A maximum value cannot be calculated for Options, because their face value is zero (they are granted with an exercise price equal to the market value).
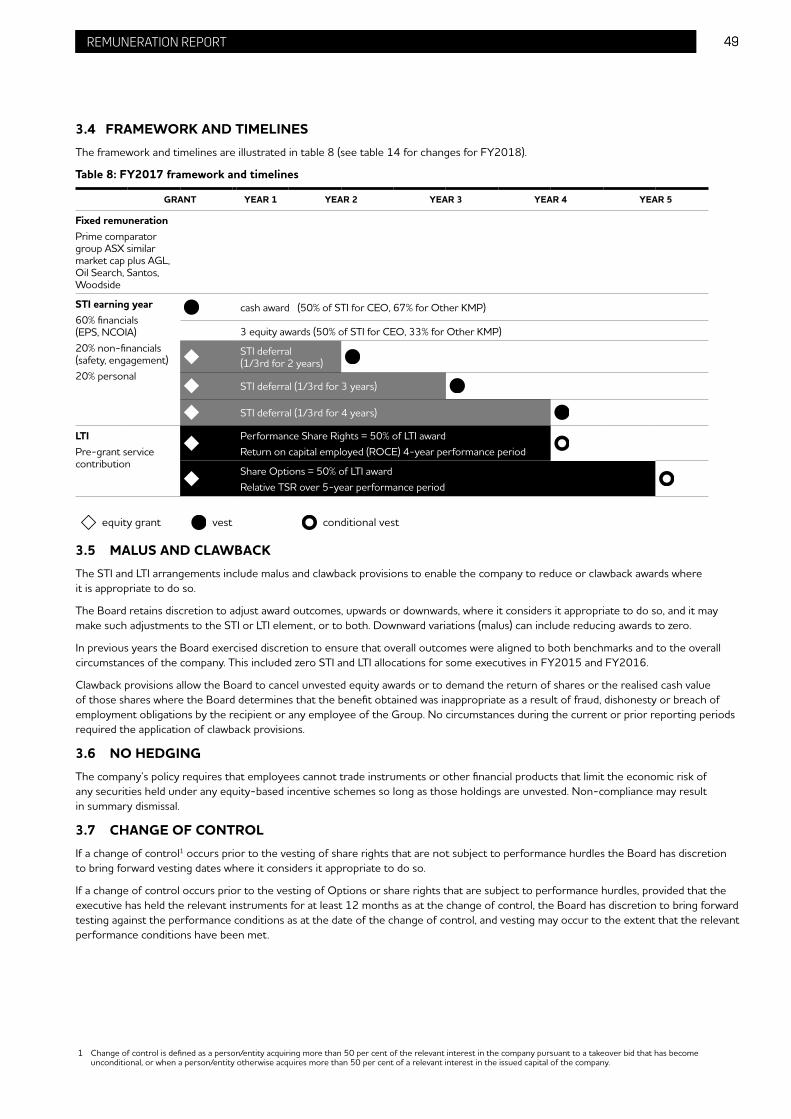
49ORIGIN ENERGY PAGE TITLE 49REMUNERATION REPORT
3.4 FRAMEWORK AND TIMELINESThe framework and timelines are illustrated in table 8 (see table 14 for changes for FY2018).
Table 8: FY2017 framework and timelines
GRANT YEAR 1 YEAR 2 YEAR 3 YEAR 4 YEAR 5
Fixed remunerationPrime comparator group ASX similar market cap plus AGL, Oil Search, Santos, Woodside
STI earning year60% financials (EPS, NCOIA)20% non-financials (safety, engagement)20% personal
cash award (50% of STI for CEO, 67% for Other KMP)
3 equity awards (50% of STI for CEO, 33% for Other KMP)
STI deferral (1/3rd for 2 years)
STI deferral (1/3rd for 3 years)
STI deferral (1/3rd for 4 years)
LTIPre-grant service contribution
Performance Share Rights = 50% of LTI awardReturn on capital employed (ROCE) 4-year performance period
Share Options = 50% of LTI awardRelative TSR over 5-year performance period
equity grant vest conditional vest
3.5 MALUS AND CLAWBACKThe STI and LTI arrangements include malus and clawback provisions to enable the company to reduce or clawback awards where it is appropriate to do so.
The Board retains discretion to adjust award outcomes, upwards or downwards, where it considers it appropriate to do so, and it may make such adjustments to the STI or LTI element, or to both. Downward variations (malus) can include reducing awards to zero.
In previous years the Board exercised discretion to ensure that overall outcomes were aligned to both benchmarks and to the overall circumstances of the company. This included zero STI and LTI allocations for some executives in FY2015 and FY2016.
Clawback provisions allow the Board to cancel unvested equity awards or to demand the return of shares or the realised cash value of those shares where the Board determines that the benefit obtained was inappropriate as a result of fraud, dishonesty or breach of employment obligations by the recipient or any employee of the Group. No circumstances during the current or prior reporting periods required the application of clawback provisions.
3.6 NO HEDGINGThe company’s policy requires that employees cannot trade instruments or other financial products that limit the economic risk of any securities held under any equity-based incentive schemes so long as those holdings are unvested. Non-compliance may result in summary dismissal.
3.7 CHANGE OF CONTROLIf a change of control1 occurs prior to the vesting of share rights that are not subject to performance hurdles the Board has discretion to bring forward vesting dates where it considers it appropriate to do so.
If a change of control occurs prior to the vesting of Options or share rights that are subject to performance hurdles, provided that the executive has held the relevant instruments for at least 12 months as at the change of control, the Board has discretion to bring forward testing against the performance conditions as at the date of the change of control, and vesting may occur to the extent that the relevant performance conditions have been met.
1 Change of control is defined as a person/entity acquiring more than 50 per cent of the relevant interest in the company pursuant to a takeover bid that has become unconditional, or when a person/entity otherwise acquires more than 50 per cent of a relevant interest in the issued capital of the company.

50 ORIGIN ENERGY PAGE TITLE 50 REMUNERATION REPORT
3.8 CAPITAL REORGANISATIONOn a capital reorganisation, the number of unvested share rights and/or Options held by participants may be adjusted in a manner determined by the Board to minimise or eliminate any material advantage or disadvantage to the participant. If new awards are granted, they will, unless the Board determines otherwise, be subject to the same terms and conditions as the original awards.
3.9 STI SCORECARD STRUCTUREThe STI program operates on an annual financial year scorecard basis consisting of business and personal key performance indicators (KPIs). The KPIs applicable for FY2017 were as set out in table 9.1
Table 9 – FY2017 scorecard structure (see section 4 for changes for FY2018)
BUSINESS SCORECARD WEIGHT
Financial Net cash from operating and investing activities (NCOIA); 37.5%
Business KPIs are weighted 80% for the CEO, and 75% for Other KMPAll division heads are exposed to the company’s financial metrics. Heads of operating divisions are also exposed to their division metrics.
Underlying earnings per share (EPS) 37.5%
Safety Total recordable injury frequency rate (TRIFR) 8.3%
Serious actual consequence incidence frequency rate (SACIFR) 8.3%
People Engagement score 8.4%
100%
PERSONAL SCORECARD
Personal KPIs are individually structured to cover the key value-adding priorities for the role in the current year. They may include customer measures, profitability, production metrics, project delivery milestones, safety performance and risk containment, and measures that reflect strategic and people priorities.
Personal KPIs are weighted 20% for the CEO and 25% for Other KMP
100%
The two financials (NCOIA and EPS) represent 75 per cent of the business scorecard reflecting the importance of earnings per share and cash generation after investment as key drivers of returns to shareholders; while safety and engagement measures represent 25 per cent of the business scorecard and reflect the importance of sustainability and productivity.
The scorecard method of assessment facilitates objective evaluation against target performance levels. Each KPI is assessed on a threshold, target and stretch basis. Unless the threshold level is achieved, the award for the KPI is zero. Threshold level performance results in a pay outcome of one-third of the target outcome. Performance at the target level results in an ‘at target’ pay outcome for the KPI. The stretch performance level is set on the basis of significantly exceeding budget and operational targets. Achieving stretch-level KPIs results in a pay outcome equivalent to 1.67 times the target level (i.e. the target represents 60 per cent of the stretch). Between target and threshold, and between threshold and stretch, outcomes are calculated on a proportionate basis.
The KPIs and outcomes for Executive KMP are approved by the Board on advice from the RPC.
1 Where the executive changed roles during the year, the scorecard weights will vary on a pro-rata basis.

51ORIGIN ENERGY PAGE TITLE 51REMUNERATION REPORT
3.10 STI DEFERRALAll senior executives have a proportion of their STI award deferred on the terms and conditions set out in table 10. The portion of the STI award that is not deferred is paid in cash (less applicable tax and superannuation) approximately three months after the end of the financial year in which it was earned.
Table 10: FY2017 details of STI deferral (see section 4 for changes for FY2018)
PARAMETER STI DEFERRAL DETAILS
Deferred STI award quantum The proportion of the STI award that is subject to deferral is:CEO 50 per cent of the STI awardOther KMP 33.3 per cent of the STI award
Instrument Deferred STI is awarded in the form of deferred share rights (DSRs).1 A DSR is the right to a fully paid share in the company. There is no cost for the right as it represents the earned benefit from the proportion of STI that has been deferred. DSRs carry no entitlement to dividends or voting rights (future allocations of DSRs at simple face value may have a dividend-adjusted vesting conversion).
Service conditions and cessation of employment
DSRs will be forfeited if the holder does not remain in ongoing employment with satisfactory service through to the end of the relevant deferral period (see below).Where the executive is unable to meet the service obligation by virtue of death, disability, redundancy, genuine retirement or other exceptional circumstances as approved by the Board, unvested DSRs will vest at cessation of employment, unless the Board determines otherwise. In these circumstances pro-rata awards or grants of DSRs not yet made will be made in cash (deferral proportion set to zero).
Deferral periods The DSRs vest in three equal tranches (by number), one-third each after two years, three years and four years respectively.
Allocation The number of DSRs to be allocated is the Deferred STI amount divided by the face value of a share determined as the volume weighted average price (VWAP) over 30 days to the 30 June preceding grant. This was $7.37 to 30 June 2017, which will be the allocation value for DSRs to be granted in respect of FY2017 STI awards. The Board’s recommendation for the CEO’s Deferred STI equity award is submitted for approval at the first Annual General Meeting (AGM) following the end of the financial year. Once approved, the DSRs are granted shortly thereafter.
Vesting and exercise DSRs vest on meeting the service and personal performance conditions. Exercise of DSRs is automatic on vesting and the exercise price is nil.
1 The Board has discretion to award in alternative forms including cash and deferred cash. Where the deferral amount calculates below a threshold (currently $2,000 as defined in the equity incentive plan rules), the deferral proportion is set to zero.

52 ORIGIN ENERGY PAGE TITLE 52 REMUNERATION REPORT
3.11 LTI PLAN DESCRIPTIONLong term incentives are provided in the form of conditional equity that may vest in the future subject to the executive meeting service and performance obligations and the company meeting or exceeding long-term performance targets.
The principles, terms and arrangements are summarised in table 11.
Table 11: Summary of the FY2017 LTI plan (see section 4 for changes for FY2018)
PARAMETER LTI PLAN DETAILS
LTI award quantum The LTI award quantum allocated at the end of the year is conditional on satisfactory performance during that year. Subject to that condition the award will generally be at the target levels shown below. However, the Board may determine that the award quantum should be varied from the target value, up or down (including to zero).Target opportunitiesCEO 110 per cent of FROther KMP (average FY2017) 53 per cent of FR
Instruments Executive KMP have LTIs awarded in two instruments:– Options (half of the LTI award value): Rights to fully paid ordinary shares on payment of an exercise price (outlined below);
and– PSRs (half of the LTI award value): Rights to fully paid ordinary shares.There is no cost for the Options or PSRs as they represent allocations to executives as part of their remuneration packages. Options and PSRs carry no voting rights or dividend entitlements.
Service conditions and cessation of employment
Options and PSRs will ordinarily be forfeited if the holder does not remain in ongoing employment with satisfactory service through to the end of the relevant deferral period (see below). These service conditions are in addition to the company performance hurdles. Where the executive is unable to meet the service obligation by virtue of death, disability, redundancy, genuine retirement or other exceptional circumstances as approved by the Board, unvested Options or PSRs may be held ‘on foot’ subject to specified performance hurdles and other plan conditions being met, or dealt with in an appropriate manner determined by the Board.An executive who holds vested but unexercised instruments at the date of cessation of employment must exercise within 60 days of cessation, otherwise the instruments lapse and are forfeited.
Performance conditions (hurdles)
Return on capital employed (ROCE)The ROCE hurdle reflects the importance of the level of return and the capital employed to generate that return. It is referenced to statutory EBIT divided by average capital employed (ACE).1
The hurdle has two gates, both of which must be achieved to trigger vesting. The first gate is to achieve or exceed the average ROCE target over four financial years. Each annual target is set by the Board in advance, based on the approved budget for that year and the current strategic plan. The four-year target (and the actual outcome) are measured on the basis of a simple arithmetic average of the four numbers.The second gate is to reach a ROCE level at least equivalent to the company’s pre-tax weighted average cost of capital (WACC) in either of the last two years of the four year performance period.Total shareholder return (TSR)Relative TSR is a measure that represents an assessment of the company’s ability to invest and achieve a return on capital relative to a Reference Group other companies which represent comparable investment choices that investors in the company will have.As with the prior year, the Reference Group for FY2017 was selected on the basis of a ‘ten-up/ten-down’ market capitalisation reference plus AGL, Oil Search, Santos and Woodside (if not already in that group).The Reference Group for an equity grant is determined at the beginning of the performance period. For LTI awards due to be granted in 2017 the Reference Group was set on 1 July 2017 as AGL Energy, AMP, APA Group, Aristocrat Leisure, ASX Limited, Aurizon, Brambles, Cimic Group, Goodman Group, Lendlease, Newcrest Mining, Oil Search, Qantas, Ramsay Health, ResMed, Santos, Sonic Healthcare, South32, Stockland, Sydney Airport, Treasury Wine Estates, Vicinity Centres and Woodside Petroleum.The TSR for Origin and for each company in the Reference Group is measured on the basis of a three-month weighted average prior to the first and last dates of the performance period.Each of the two performance conditions is transparent, robust and capable of being tested objectively. TSR testing for both Origin and the comparator companies is carried out independently.
1 The ROCE numerator is Origin’s earnings before interest and tax (EBIT) and Origin’s share of Australia Pacific LNG (APLNG) EBIT plus the dilution adjustment, with adjustment to remove:– Origin’s share of APLNG interest and tax (which is included in Origin’s reported EBIT); and– Items excluded from underlying earnings in the (decrease)/increase in fair value of financial instruments and LNG items category (the LNG items category ceased once
Train 2 commenced operations on 5 November 2016). Gains or losses on disposals and impairments are included unless specifically excluded by the Board. The denominator average capital employed (ACE) is shareholders equity plus Origin debt plus Origin’s share of APLNG project finance less the non-cash fair value uplift
in Origin’s investment in APLNG plus net derivative liabilities. The adjustment to ACE reflects the impact of the accounting uplift in the asset base of APLNG of $1.9 billion which was recorded on the creation of the APLNG Joint Venture. This balance was reduced by $1,846 million during FY2017 reflecting Origin’s share of the impairment recorded by APLNG of its non-current assets. The remaining non-cash fair value uplift balance of $30 million will be depreciated in APLNG’s income statement on an ongoing basis and, therefore, a dilution adjustment is made to remove this depreciation. From Origin’s perspective, cash was received for this amount up-front at the time of the creation of the Joint Venture. The non-cash fair value adjustments are disclosed and explained in Note E1.2 in the financial statements. ACE is a simple average of opening and closing capital employed in any one year.
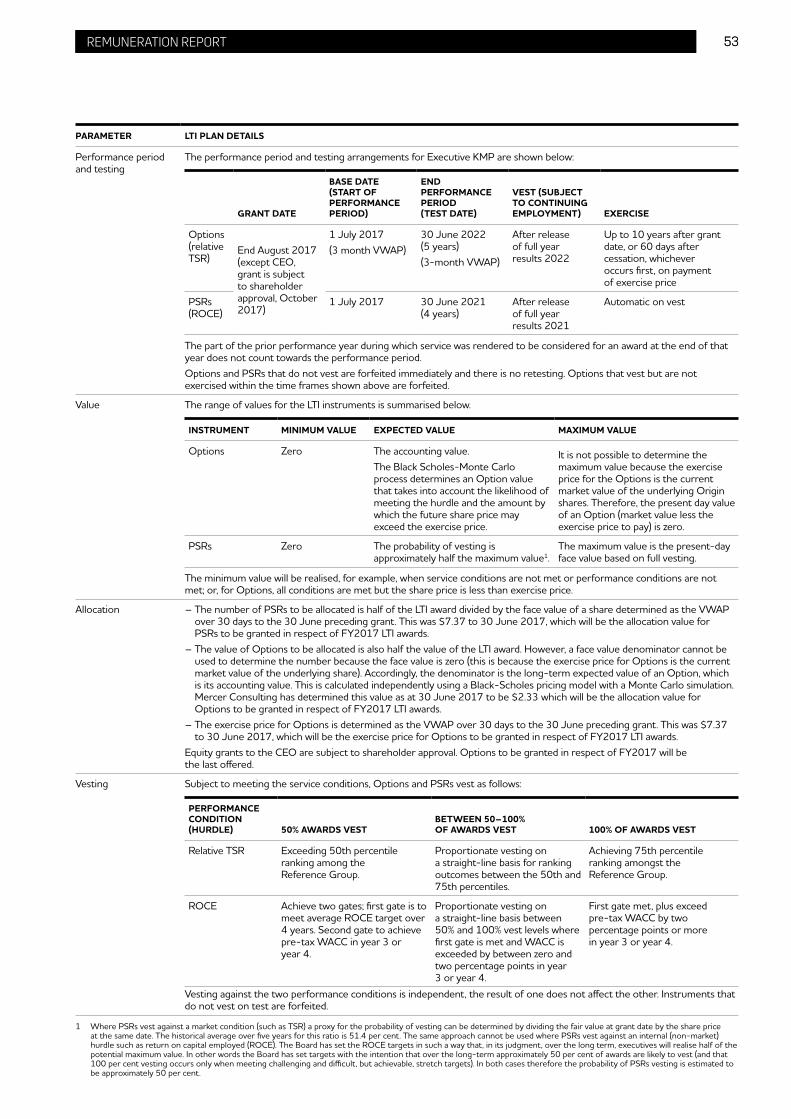
53ORIGIN ENERGY PAGE TITLE 53REMUNERATION REPORT
PARAMETER LTI PLAN DETAILS
Performance period and testing
The performance period and testing arrangements for Executive KMP are shown below:
GRANT DATE
BASE DATE(START OF PERFORMANCE PERIOD)
END PERFORMANCE PERIOD (TEST DATE)
VEST (SUBJECT TO CONTINUING EMPLOYMENT) EXERCISE
Options (relative TSR)
End August 2017 (except CEO, grant is subject to shareholder approval, October 2017)
1 July 2017(3 month VWAP)
30 June 2022 (5 years)(3-month VWAP)
After release of full year results 2022
Up to 10 years after grant date, or 60 days after cessation, whichever occurs first, on payment of exercise price
PSRs (ROCE)
1 July 2017 30 June 2021 (4 years)
After release of full year results 2021
Automatic on vest
The part of the prior performance year during which service was rendered to be considered for an award at the end of that year does not count towards the performance period.Options and PSRs that do not vest are forfeited immediately and there is no retesting. Options that vest but are not exercised within the time frames shown above are forfeited.
Value The range of values for the LTI instruments is summarised below.
INSTRUMENT MINIMUM VALUE EXPECTED VALUE MAXIMUM VALUE
Options Zero The accounting value.The Black Scholes-Monte Carlo process determines an Option value that takes into account the likelihood of meeting the hurdle and the amount by which the future share price may exceed the exercise price.
It is not possible to determine the maximum value because the exercise price for the Options is the current market value of the underlying Origin shares. Therefore, the present day value of an Option (market value less the exercise price to pay) is zero.
PSRs Zero The probability of vesting is approximately half the maximum value1.
The maximum value is the present-day face value based on full vesting.
The minimum value will be realised, for example, when service conditions are not met or performance conditions are not met; or, for Options, all conditions are met but the share price is less than exercise price.
Allocation – The number of PSRs to be allocated is half of the LTI award divided by the face value of a share determined as the VWAP over 30 days to the 30 June preceding grant. This was $7.37 to 30 June 2017, which will be the allocation value for PSRs to be granted in respect of FY2017 LTI awards.
– The value of Options to be allocated is also half the value of the LTI award. However, a face value denominator cannot be used to determine the number because the face value is zero (this is because the exercise price for Options is the current market value of the underlying share). Accordingly, the denominator is the long-term expected value of an Option, which is its accounting value. This is calculated independently using a Black-Scholes pricing model with a Monte Carlo simulation. Mercer Consulting has determined this value as at 30 June 2017 to be $2.33 which will be the allocation value for Options to be granted in respect of FY2017 LTI awards.
– The exercise price for Options is determined as the VWAP over 30 days to the 30 June preceding grant. This was $7.37 to 30 June 2017, which will be the exercise price for Options to be granted in respect of FY2017 LTI awards.
Equity grants to the CEO are subject to shareholder approval. Options to be granted in respect of FY2017 will be the last offered.
Vesting Subject to meeting the service conditions, Options and PSRs vest as follows:
PERFORMANCE CONDITION (HURDLE) 50% AWARDS VEST
BETWEEN 50–100% OF AWARDS VEST 100% OF AWARDS VEST
Relative TSR Exceeding 50th percentile ranking among the Reference Group.
Proportionate vesting on a straight-line basis for ranking outcomes between the 50th and 75th percentiles.
Achieving 75th percentile ranking amongst the Reference Group.
ROCE Achieve two gates; first gate is to meet average ROCE target over 4 years. Second gate to achieve pre-tax WACC in year 3 or year 4.
Proportionate vesting on a straight-line basis between 50% and 100% vest levels where first gate is met and WACC is exceeded by between zero and two percentage points in year 3 or year 4.
First gate met, plus exceed pre-tax WACC by two percentage points or more in year 3 or year 4.
Vesting against the two performance conditions is independent, the result of one does not affect the other. Instruments that do not vest on test are forfeited.
1 Where PSRs vest against a market condition (such as TSR) a proxy for the probability of vesting can be determined by dividing the fair value at grant date by the share price at the same date. The historical average over five years for this ratio is 51.4 per cent. The same approach cannot be used where PSRs vest against an internal (non-market) hurdle such as return on capital employed (ROCE). The Board has set the ROCE targets in such a way that, in its judgment, over the long term, executives will realise half of the potential maximum value. In other words the Board has set targets with the intention that over the long-term approximately 50 per cent of awards are likely to vest (and that 100 per cent vesting occurs only when meeting challenging and difficult, but achievable, stretch targets). In both cases therefore the probability of PSRs vesting is estimated to be approximately 50 per cent.

54 ORIGIN ENERGY PAGE TITLE 54 REMUNERATION REPORT
3.12 OTHER EQUITY/SHARE PLANSThe company operates a general employee share plan in which all full-time and part-time employees can be awarded up to $1,000 worth of company shares on an annual basis. For FY2017 the award was subject to meeting a safety target, and eligibility required service throughout the year on which the safety target applied. The target was for employees to record and close 40,000 safety observations. The target was surpassed with 56,444 closed observations. Accordingly a $1,000 award was approved by the Board. Shares are purchased on-market during late August for allocation to employees on a restricted basis (the shares cannot be traded until the earlier of cessation of employment or three years). Section 4 highlights that improvements to the Employee Share Plan will be implemented during FY2018.
To help preserve shareholder value, retention plans may be used selectively to retain key people. The RPC regularly assesses the risk of the Group losing key people in areas of intense market activity. Typically, they are critical senior executives who manage core activities or have skills that are being actively solicited in the market.
The RPC may consider putting in place deferred payment arrangements to reduce the risk of critical loss. Key people may be offered DSRs or deferred cash payments subject to the condition of remaining in ongoing employment with the company through to a nominated date and achieving personal performance targets over that period. Where DSRs are used for this purpose they represent the same equity vehicle described in section 3.10 for deferred STI, but their purpose is for retention and the vesting period will vary according to the specific circumstances.
No deferred cash or retention DSRs were provided to KMP during the current or prior period.
From time to time it may be necessary to offer DSRs, PSRs or Options, or a combination of those, to replace similar or equivalent equity that an executive forfeits when leaving another employer to take up employment with the company. ‘Sign-on’ equity of this sort, where required, is targeted to the particular circumstances and will have vesting periods matching those circumstances. No sign-on equity was granted to KMP during the current or prior period. Such equity is expected to be granted in 2018, as noted in table 19.
3.13 MINIMUM SHAREHOLDING REQUIREMENT (MSR) FOR SENIOR EXECUTIVESAs noted in section 4, the Board is introducing a new Executive Share Ownership Policy that requires the CEO and all senior executives to build and maintain a minimum shareholding in the company. The policy requirement is to meet, within a period of four years, a holding equivalent to two times annual FR for the CEO, and one times annual FR for senior executives.
3.14 REMUNERATION AND CONTRACTUAL DETAILS FOR EXECUTIVE KMPTable 12 sets out the main employment terms and conditions for Executive KMP as at 30 June 2017.
Table 12: Executive service agreements and remuneration terms
CEO OTHER KMP
Basis of contract Ongoing (no fixed term) Ongoing (no fixed term)
Notice period 12 months by either party, or shorter notice by agreement. No notice for misconduct or breach of contract
Up to six months by either party or shorter notice by agreement. No notice for misconduct or breach of contract
Termination benefits for cause
Statutory entitlements only Statutory entitlements only
Termination benefits for resignation
Notice as above or payment in lieu of notice that is not worked; current-year STI forfeited; all unvested equity lapses; statutory entitlements
Notice as above or payment in lieu of notice that is not worked; current-year STI forfeited; all unvested equity lapses; statutory entitlements
Termination benefits for other than resignation or cause
Notice worked (or payment in lieu of any portion not worked); pro rata STI for the period worked (no deferral applicable); all unvested equity lapses unless held ‘on foot’ in accordance with Equity Incentive Plan Rules (in cases of death, disability, genuine retirement or extraordinary circumstance); and statutory entitlements
Notice worked (or payment in lieu of any portion not worked); pro rata STI for the period worked (no deferral applicable); all unvested equity lapses unless held ‘on foot’ in accordance with Equity Incentive Plan Rules (in cases of death, disability, bona fide redundancy, genuine retirement or extraordinary circumstance); and statutory entitlements.Payment in accordance with the company’s general redundancy policy of three weeks FR per year of service with a minimum of 18 weeks and a maximum of 74 weeks)
Fixed Remuneration (FR) $1,700,000 per annum Up to $724,000 per annum
STI opportunity 0 per cent of FR (minimum)110 per cent of FR (target)130 per cent of FR (maximum)Half deferred over two, three and four years
0 per cent of FR (minimum)66 per cent of FR (target)110 per cent of FR (maximum)One-third deferred over two, three and four years
LTI opportunity 0 per cent of FR (minimum)110 per cent of FR (target)130 per cent of FR (maximum)Deferred over four and five years
0 per cent of FR (minimum)60 per cent of FR (target and maximum)Deferred over four and five years

55ORIGIN ENERGY PAGE TITLE 55REMUNERATION REPORT
4. CHANGES FOR FY2018
The Board has tested the effectiveness of the current remuneration framework and identified opportunities to simplify the structure and improve shareholding levels. An integrated package of changes will be implemented for the FY2018 year. These changes and the rationale behind them are summarised in table 13.
Table 13 – FY2018 remuneration framework changes
FY2018 CHANGE RATIONALE FOR CHANGE
1 Increase the deferral of STI from one-third to one-half of the STI award, for all senior executives
Increase executive equity accretion; one standard for all senior executives
2 Rebalance STI performance metrics Part of a new standardised structure for scorecards that broadens operating and financial measures (preserving the 60% weighting and key role for eps and NCOIA), elevates customer measures, and reduces personal bespoke measures
3 Simplify the STI and LTI vesting schedules Current structure (table 8) is excessively complex and outside market norms. New structure (table 14) reflects the strategic context and the timing of key initiatives for both Energy Markets and for Integrated Gas and achieves deferral objectives by integrating the vesting profile with a holding lock mechanism and new minimum shareholding requirement
4 Discontinue the use of Options in LTI awards Simplify LTI arrangements by using one vehicle (PSRs) that is well understood in the domestic market
5 Allocate all equity awards on the basis of simple face value
Adopt one simple standard – face value (a mix of allocation methodologies has applied to recent awards). The discontinuation of Options eliminates the allocation problem of zero face value (market price less exercise price equals zero)
6 Add a share price growth condition to the relative TSR hurdle and adopt ASX-50 as the Reference Group
Imposing a share price growth condition prevents vesting where Origin outperforms on returns but its share price falls (e.g. in a falling market). Use of the ASX-50 improves the efficacy of the Reference Group by broadening it. ROCE will continue to be used as a second performance hurdle
7 Introduce a new Minimum Shareholding Requirement (MSR) for executives
Increased executive share ownership strengthens shareholder and employee alignment. The new requirement is to build and then hold a minimum equity level1 equivalent to two times FR for the CEO, and one times FR for senior executives, within four years
8 Strengthen the Minimum Shareholding Requirement for NEDs
Modify the MSR for NEDs by re-expressing the policy in terms of holding a minimum value of shares equivalent to one times the NED Base Fee, and introduce a new level for the Chairman at twice the NED Base Fee
9 Upgrade the general employee share plan Widen the plan to reduce service eligibility from one year to six months, incorporate salary sacrifice, and introduce matching facilities to encourage greater share ownership across the company
1 For the purposes of the Executive MSR, only fully paid shares and unvested equity that is not subject to performance hurdles may be counted against the requirement. It is assessed at the end of the year against the FR at the beginning of the year.
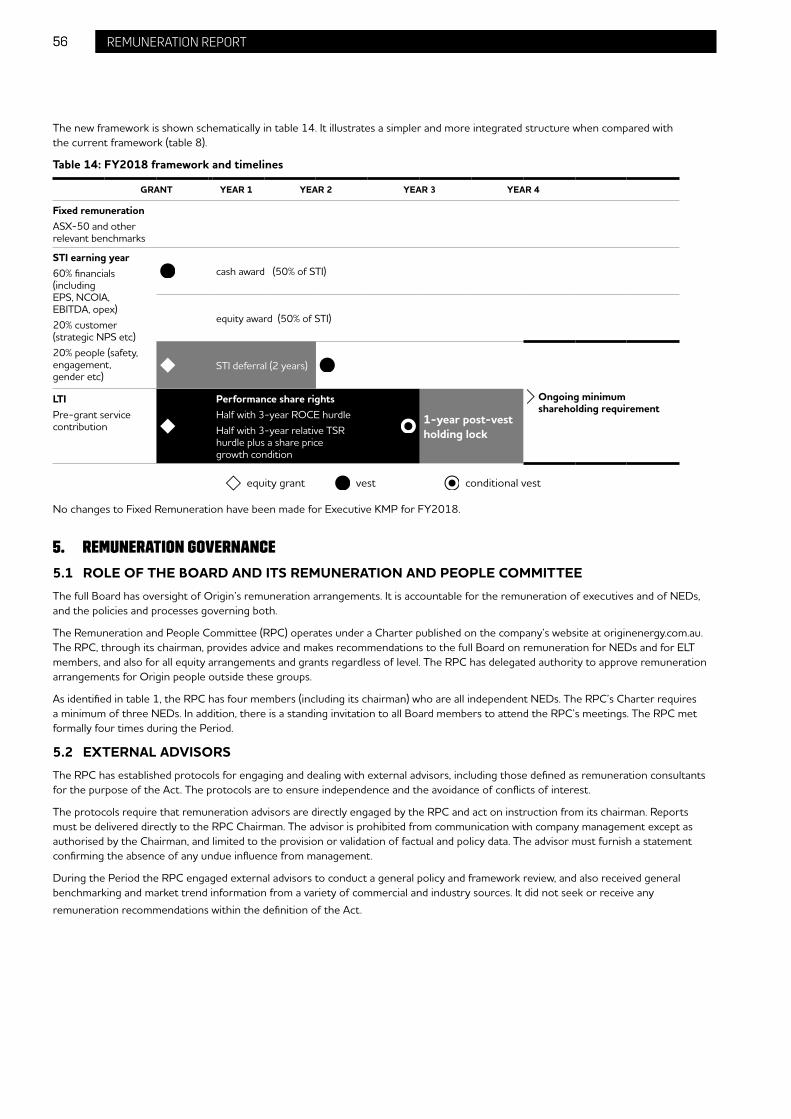
56 ORIGIN ENERGY PAGE TITLE 56 REMUNERATION REPORT
The new framework is shown schematically in table 14. It illustrates a simpler and more integrated structure when compared with the current framework (table 8).
Table 14: FY2018 framework and timelines
GRANT YEAR 1 YEAR 2 YEAR 3 YEAR 4
Fixed remunerationASX-50 and other relevant benchmarks
STI earning year60% financials (including EPS, NCOIA, EBITDA, opex)20% customer (strategic NPS etc)20% people (safety, engagement, gender etc)
cash award (50% of STI)
equity award (50% of STI)
STI deferral (2 years)
Ongoing minimum shareholding requirement
LTIPre-grant service contribution
Performance share rightsHalf with 3-year ROCE hurdleHalf with 3-year relative TSR hurdle plus a share price growth condition
1-year post-vest holding lock
equity grant vest conditional vest
No changes to Fixed Remuneration have been made for Executive KMP for FY2018.
5. REMUNERATION GOVERNANCE
5.1 ROLE OF THE BOARD AND ITS REMUNERATION AND PEOPLE COMMITTEEThe full Board has oversight of Origin’s remuneration arrangements. It is accountable for the remuneration of executives and of NEDs, and the policies and processes governing both.
The Remuneration and People Committee (RPC) operates under a Charter published on the company’s website at originenergy.com.au. The RPC, through its chairman, provides advice and makes recommendations to the full Board on remuneration for NEDs and for ELT members, and also for all equity arrangements and grants regardless of level. The RPC has delegated authority to approve remuneration arrangements for Origin people outside these groups.
As identified in table 1, the RPC has four members (including its chairman) who are all independent NEDs. The RPC’s Charter requires a minimum of three NEDs. In addition, there is a standing invitation to all Board members to attend the RPC’s meetings. The RPC met formally four times during the Period.
5.2 EXTERNAL ADVISORSThe RPC has established protocols for engaging and dealing with external advisors, including those defined as remuneration consultants for the purpose of the Act. The protocols are to ensure independence and the avoidance of conflicts of interest.
The protocols require that remuneration advisors are directly engaged by the RPC and act on instruction from its chairman. Reports must be delivered directly to the RPC Chairman. The advisor is prohibited from communication with company management except as authorised by the Chairman, and limited to the provision or validation of factual and policy data. The advisor must furnish a statement confirming the absence of any undue influence from management.
During the Period the RPC engaged external advisors to conduct a general policy and framework review, and also received general benchmarking and market trend information from a variety of commercial and industry sources. It did not seek or receive any remuneration recommendations within the definition of the Act.

57ORIGIN ENERGY PAGE TITLE 57REMUNERATION REPORT
5.3 REMUNERATION POLICY AND STRUCTURE FOR NEDSNED remuneration is designed to ensure independence by setting fees that are fixed and not dependent on company results. There are no bonus or incentive-based payments. This ensures that NEDs are able to independently and objectively assess both executive and company performance.
Shareholders approve the aggregate cap for overall NED remuneration. The current cap of $2,700,000 was approved at the 2010 AGM. Shareholder approval will be sought at the 2017 AGM for an increase in the aggregate cap to $3,200,000 to provide sufficient flexibility for the appointment of additional directors. In addition to the timespan since the last increase, a decrease in the number of executive directors and an increase in the number of non-executive directors is a relevant factor for this proposed increase.
Board and committee fees take into account market rates for similar positions at relevant Australian organisations (those of comparable size and complexity) that fairly reflect the time commitments and responsibilities involved. Per diem fees may also be paid on occasions where approved special work is undertaken outside of the expected commitments. No per diem fees were paid during the Period.
The Origin Chairman receives a single fee that is inclusive of committee activities, while other NEDs receive a NED Base Fee and separate fees for their role on specific committees, other than the Nomination Committee, which is considered within the NED Base Fee. All fees include superannuation contributions.
Tables 15 and 16 set out the structure and level of NED fees that applied during FY2017. The same fee levels will apply during FY2018. Fees were last increased in FY2013 (fees for the Risk Committee were introduced in FY2016).
Table 15: NED fees ($)
ROLE FY2017 AND FY2018
Board chairman (including all committee work) 677,000
NED Base Fee (excluding committee work, table 16) 196,000
Table 16: Committee fees ($)
FY2017 AND FY2018
COMMITTEE CHAIR MEMBER
Audit 57,000 29,000
Remuneration and People 47,000 21,000
Heath, Safety and Environment 42,000 21,000
Risk 42,000 21,000
Nomination Nil Nil
5.4 MINIMUM SHAREHOLDING REQUIREMENT FOR NEDSTo align the interests of the Board and shareholders, NEDs are required to build and then maintain a minimum shareholding in the company.
Commencing 1 July 2017 the MSR for NEDs has been increased from 20,000 shares to the equivalent of one times the NED Base Fee (table 15). At the share price on 30 June 2017 this represents an increase to approximately 28,600 shares. A new policy will apply to the Chairman of the Board whose MSR will be twice the NED Base Fee.
NEDs are required to reach the requirement within three years of their appointment, or where the requirement has been increased, to meet the increased level within two years of that increase.
At the date of this Remuneration Report, all NEDs either met the minimum requirement or were on track to meet it within the required time period. Details on NED shareholdings are included in table 20.
A Non-executive Director Share Plan (NEDSP) is in suspension and closed to new entrants. The NEDSP provided for NEDs to sacrifice annual fees toward the acquisition of shares, which were then acquired on market by the Trustee of the plan. The Trustee could transfer shares acquired on behalf of the relevant NED after a period of five years, or on retirement from office, or in case of death. The plan was closed in August 2013 to new entrants or new acquisitions by existing participants. One participant remains in it.

58 59ORIGIN ENERGY PAGE TITLE ORIGIN ENERGY PAGE TITLE 58 59REMUNERATION REPORT REMUNERATION REPORT
6. STATUTORY DISCLOSURES
Table 17: Executive KMP statutory remuneration (A-IFRS) ($, except where otherwise indicated)
SHORT-TERM BENEFITSPOST-EMPLOYMENT
BENEFITS ACCOUNTING VALUE OF LONG-TERM BENEFITS TOTALS
BASE SALARY
CONTACT ENERGY
FEES1 CASH STI2NON-MONETARY
BENEFITS3 SUPERANNUATION DEFERRED STI4LTI (OPTIONS &
PSRs)5ACCRUED LEAVE
CHANGETERMINATION
BENEFITS6TOTAL
REMUNERATION AT RISK (%)SHARE
BASED (%)
EXECUTIVE DIRECTOR
F Calabria 2017 1,471,005 – 1,007,250 32,312 27,456 433,397 458,546 265,312 – 3,695,278 51 242016 1,046,655 – 649,428 33,284 27,144 254,243 491,259 27,178 – 2,529,191 55 29
OTHER EXECUTIVE KMP
J Briskin 2017 328,035 – 196,095 4,375 11,190 61,343 35,477 13,903 – 650,418 45 152016 – – – – – – – – – – – –
G Jarvis 2017 357,798 – 218,387 15,236 15,411 81,009 73,845 37,868 – 799,554 47 192016 – – – – – – – – – – – –
G Mallett7 2017 824,046 – 238,065 26,282 25,032 112,805 131,850 15,000 – 1,373,080 35 182016 84,327 – 25,994 2,722 3,184 12,248 18,390 1,814 – 148,679 38 21
M Schubert 2017 97,200 – 46,633 1,672 3,279 30,180 10,123 1,881 – 190,968 46 212016 – – – – – – – – – – – –
FORMER EXECUTIVE KMP
G King4,5,6 2017 673,026 – 0 21,000 7,293 20,796 272,492 15,738 2,173,077 3,183,422 9 92016 2,478,168 22,389 0 53,597 21,832 (71,677) 1,304,780 62,515 – 3,871,604 32 32
K Moses5,7 2017 – – – – – – – – – – – –2016 1,169,595 14,650 238,069 34,367 30,030 113,763 565,359 34,320 – 2,200,153 42 31
D Baldwin4,5,6 2017 926,237 – 742,357 27,649 16,247 142,087 507,254 23,945 746,019 3,131,795 44 212016 1,118,480 14,602 546,667 32,867 19,320 249,188 705,161 160,438 – 2,846,723 53 34
D Barnes7 2017 – – – – – – – – – – – –2016 89,094 – – 29 4,697 43,000 172,697 1,537 – 311,054 69 69
TOTAL 2017 4,677,347 0 2,448,787 128,526 105,908 881,617 1,489,587 373,647 2,919,096 13,024,515 37 182016 5,986,319 51,641 1,460,158 156,866 106,207 600,765 3,257,646 287,802 0 11,907,404 45 32
1 G King, D Baldwin, and K Moses were the company’s nominees on the Board of Contact Energy, from 1 July to 10 August 2015 on completion of the sale of the company’s interest in Contact Energy. FY2016 fees converted to Australian dollars using an exchange rate of $1.1166 for the period 1 July 2015 to 10 August 2015.
2 STI cash represents one half of the STI award for the CEO in FY2017, otherwise it represents two-thirds of the STI awarded. For Former Executive KMP the STI award may not be subject to deferral. The STI cash is physically paid after the end of the financial year to which it relates, but is allocated to the earning year. The balance of the STI award is STI deferred.
3 Non-monetary benefits include insurance premiums and fringe benefits such as car parking and expenses associated with travel.4 Deferred STI is that portion of the accounting value of equity granted or to be granted (DSRs) for the current and prior periods attributable to the reporting period. In following
reporting periods the accumulated expense is adjusted for the number of instruments then expected to vest. A ‘bring-forward’ of future-period accounting expense may occur where a cessation of employment occurs before the normal vesting date. Such ‘bring-forward’ is an accounting adjustment that does not represent actual remuneration. The table does not include a ‘bring-forward’ accounting expense of $62,807 in relation to the cessation of employment of G King on 28 October 2016.
5 LTI is that portion of the accounting value of LTI equity granted or to be granted (Options and/or PSRs) for the current and prior periods attributable to the reporting period. Where instruments vest against a market condition (such as TSR) the application of accounting rule AASB-2 determines a fair value that takes into account that market condition. This involves assumptions for the volatility of Origin shares and the shares of all other companies in the comparator group, dividend yields, and the risk-free rate (see note F3(a)(i) to the financial statements). In the case of Options it also includes assumptions on the timing of exercise. This fair value, amortised over the service/vesting period is used for expensing purposes. The value is not adjusted for the actual outcome against the market condition. Where instruments vest against a non-market condition (such as ROCE), AASB-2 does not take into account the hurdle. The initial grant date expense is represented by face value less dividends foregone over the vesting period. True-ups then occur each reporting period for the expected vesting outcome, based on reasonable and successive forecasts of the final vesting outcome, lastly with a final true-up when
the outcome is known. A ‘bring-forward’ of future-period accounting expense may occur where a cessation of employment occurs before the normal vesting date where prior years’ awards remain on foot at cessation. At cessation, if unvested Options or PSRs remain on foot then any unvested expense is brought forward, but if forfeited, previously booked expense is reversed. Neither treatment has any bearing on what the executive may ultimately forfeit or receive. The applicable treatment may not be known at the end of the reporting period even if a cessation is expected in the near future.
At the time of FY2016 reporting, the ‘on-foot/lapse’ position for K Moses cessation was unknown and no accounting adjustments were made or reported. Subsequently, following cessation of employment (which occurred in FY2017 and was not from a KMP role), the actual bring-forward of accounting expense was determined as $716,975 (and was wholly in relation to LTI). At the time of FY2017 reporting, the ‘on-foot/lapse’ position for D Baldwin was unknown and no accounting adjustments have been made. When known, it will be disclosed in the relevant Remuneration Report. In relation to G King (whose cessation was on 28 October 2016), the bring-forward of accounting expense was $2,207,624 in relation to LTI awards (see note 4 for deferred STI awards). These disclosures are made, when known, on the basis of transparency and irrespective of whether the executive remains in a KMP role at the time of cessation of employment.
6 For G King, the termination benefit represents contractual notice payment. As a result of the restructure announced on 18 April 2017, D Baldwin stepped down from his KMP role and is expected to leave the company during FY2018. Although he has not ceased employment at the date of this report, and will not be in a KMP role at the time of cessation, the expected termination payment has been included in the table on the basis that it ultimately relates to his KMP tenure. In both cases payments are pursuant to and within shareholder authorisation obtained by AGM resolution in October 2015.
7 For FY2016 comparatives, pro-rata periods for KMP office are: G Mallett 16 May 2016 to 30 June 2016; K Moses 1 July 2015 to 16 May 2016; and D Barnes 1 July 2015 to 10 August 2015.
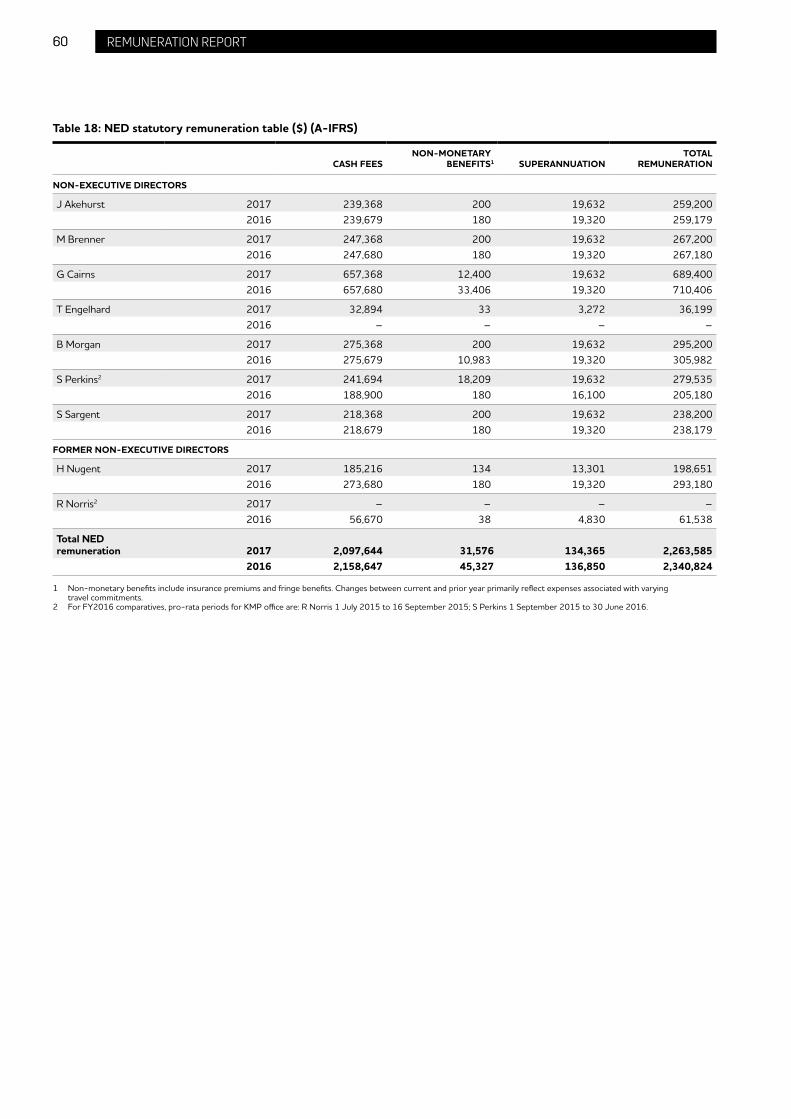
60 ORIGIN ENERGY PAGE TITLE 60 REMUNERATION REPORT
Table 18: NED statutory remuneration table ($) (A-IFRS)
CASH FEESNON-MONETARY
BENEFITS1 SUPERANNUATIONTOTAL
REMUNERATION
NON-EXECUTIVE DIRECTORS
J Akehurst 2017 239,368 200 19,632 259,2002016 239,679 180 19,320 259,179
M Brenner 2017 247,368 200 19,632 267,2002016 247,680 180 19,320 267,180
G Cairns 2017 657,368 12,400 19,632 689,4002016 657,680 33,406 19,320 710,406
T Engelhard 2017 32,894 33 3,272 36,1992016 – – – –
B Morgan 2017 275,368 200 19,632 295,2002016 275,679 10,983 19,320 305,982
S Perkins2 2017 241,694 18,209 19,632 279,5352016 188,900 180 16,100 205,180
S Sargent 2017 218,368 200 19,632 238,2002016 218,679 180 19,320 238,179
FORMER NON-EXECUTIVE DIRECTORS
H Nugent 2017 185,216 134 13,301 198,6512016 273,680 180 19,320 293,180
R Norris2 2017 – – – –2016 56,670 38 4,830 61,538
Total NED remuneration 2017 2,097,644 31,576 134,365 2,263,585
2016 2,158,647 45,327 136,850 2,340,824
1 Non-monetary benefits include insurance premiums and fringe benefits. Changes between current and prior year primarily reflect expenses associated with varying travel commitments.
2 For FY2016 comparatives, pro-rata periods for KMP office are: R Norris 1 July 2015 to 16 September 2015; S Perkins 1 September 2015 to 30 June 2016.

61ORIGIN ENERGY PAGE TITLE 61REMUNERATION REPORT
Table 19: Details of, and movements in, rights to equityRights to equity in the company (Options, PSRs and DSRs) are granted to Executive KMP only, no NEDs hold rights to equity. This table covers holdings and movements for rights held by Executive KMP (directly, indirectly or beneficially including related parties) over the Period (or KMP portion of the Period), including grants, transactions and forfeits, by value and by number. Details of the terms and vesting and exercise conditions attaching to the rights are set out in tables 19 and 21. The company expects to make equity awards to its new CFO (L Tremaine) in late August or early September 2017 as an offset to equity forfeited from his prior employment and as a direct consequence of accepting employment with the company. As at the date of this Report the arrangements were not finalised. The allocation will be disclosed in the 2018 Remuneration Report.

62 63ORIGIN ENERGY PAGE TITLE ORIGIN ENERGY PAGE TITLE 62 63REMUNERATION REPORT REMUNERATION REPORT
Table 19: Details of, and movements in, rights to equity
RIGHTS GRANTED
TYPEHELD AT
START1 GRANT DATENUMBER
GRANTED
FAIRVALUE2,3
($) VALUE ($)EXERCISE PRICE ($) VEST DATE4 EXPIRY DATE5
RIGHTS VESTED
RIGHTS EXERCISED
VALUE AT EXERCISE6
($)RIGHTS
FORFEITED7VALUE8
($)
VESTED EXERCISABLE
AT END HELD AT END1
EXECUTIVE DIRECTOR
F Calabria OptionsPSRsDSRs
1,409,891148,552
77,295
30 Aug 201630 Aug 201630 Aug 2016
231,70767,01959,001
1.374.955.10
317,439331,744300,905
5.67––
23 Aug 202124 Aug 2020
2018 to 2020
28 Aug 2026Vest dateVest date
00
28,375
00
28,375
00
158,714
545,55270,542
0
1,068,822686,883
0
000
1,096,046145,029107,921
OTHER EXECUTIVE KMP
J Briskin OptionsPSRsDSRs
17,76960,73325,163
–––
000
–––
000
–––
–––
–––
000
000
000
000
000
000
17,76960,73325,163
G Jarvis OptionsPSRsDSRs
229,98254,31942,679
–––
000
–––
000
–––
–––
–––
000
000
000
000
000
000
229,98254,31942,679
G Mallett OptionsPSRsDSRs
263,66356,82028,585
30 Aug 201630 Aug 201630 Aug 2016
71,95120,81119,748
1.374.955.23
98,573103,014103,296
5.67––
23 Aug 202124 Aug 2020
2018 to 2020
28 Aug 2026Vest dateVest date
00
8,823
00
8,823
00
48,968
103,34423,196
0
200,266211,289
0
000
232,27054,43539,510
M Schubert OptionsPSRsDSRs
153,64145,65252,578
–––
000
–––
000
–––
–––
–––
000
000
000
000
000
000
153,64145,65252,578
FORMER KMP
G King OptionsPSRsDSRs
3,018,530307,838
31,984
19 Oct 201619 Oct 2016
–
450,000129,558
–
1.765.32
–
792,000689,249
–
5.21––
23 Aug 202124 Aug 2020
–
28 Aug 2026Vest date
–
00
31,984
00
31,984
00
174,793
2,021,610234,128
0
3,934,4872,310,788
0
000
1,446,920203,268
0
D Baldwin OptionsPSRsDSRs
1,632,647202,324
77,714
30 Aug 201630 Aug 201630 Aug 2016
231,70767,01949,665
1.374.955.10
317,439331,744253,292
5.67––
23 Aug 202124 Aug 2020
2018 to 2020
28 Aug 2026Vest dateVest date
00
29,080
00
29,080
00
162,567
493,495111,102
0
981,3271,019,025
0
000
1,370,859158,241
98,299
1 The number of instruments that are held at the start/end of the Period, or, where the holder is KMP for part-year only, on the relevant start/end dates of holding KMP office.2 Accounting expense value at grant date (Black-Scholes Monte Carlo for Relative TSR performance conditions; discounted cash flow for DSRs) or as estimated at first reporting
period (ROCE non-market hurdle).3 For DSRs this is the weighted average fair value for the three tranches vesting respectively in 2018, 2019 and 2020.4 Vest dates are the scheduled test dates. Where identified as 2018 to 2020, the vesting is tranched into three parcels (equal in number) vesting on 20 August 2018, 26 August
2019 and 24 August 2020.5 The expiry date is the same as the vesting date where the terms of the grant apply automatic exercise on vesting. Where there is no automatic exercise on vesting, the expiry
date is the last possible expiry. Rights may expire earlier, for example if the rights fail to vest on test, they will lapse and expire on the vesting date.
6 The value of rights exercised is calculated as the closing market price of the company’s shares on the Australian Securities Exchange (ASX) on the date of exercise, after deducting any exercise price. The exercise price for PSRs and DSRs is nil.
7 Forfeited Options were granted in October 2011 and October 2012. Forfeited PSRs were granted in October 2011 and October 2013.8 The value of equity or rights forfeited represents prior year Origin equity allocations that were forfeited during the year (i.e. the relevant grants realised no benefit and
lapsed without value). The forfeited value represents the grant date value that was disclosed and attributed to remuneration at the time of the grant.
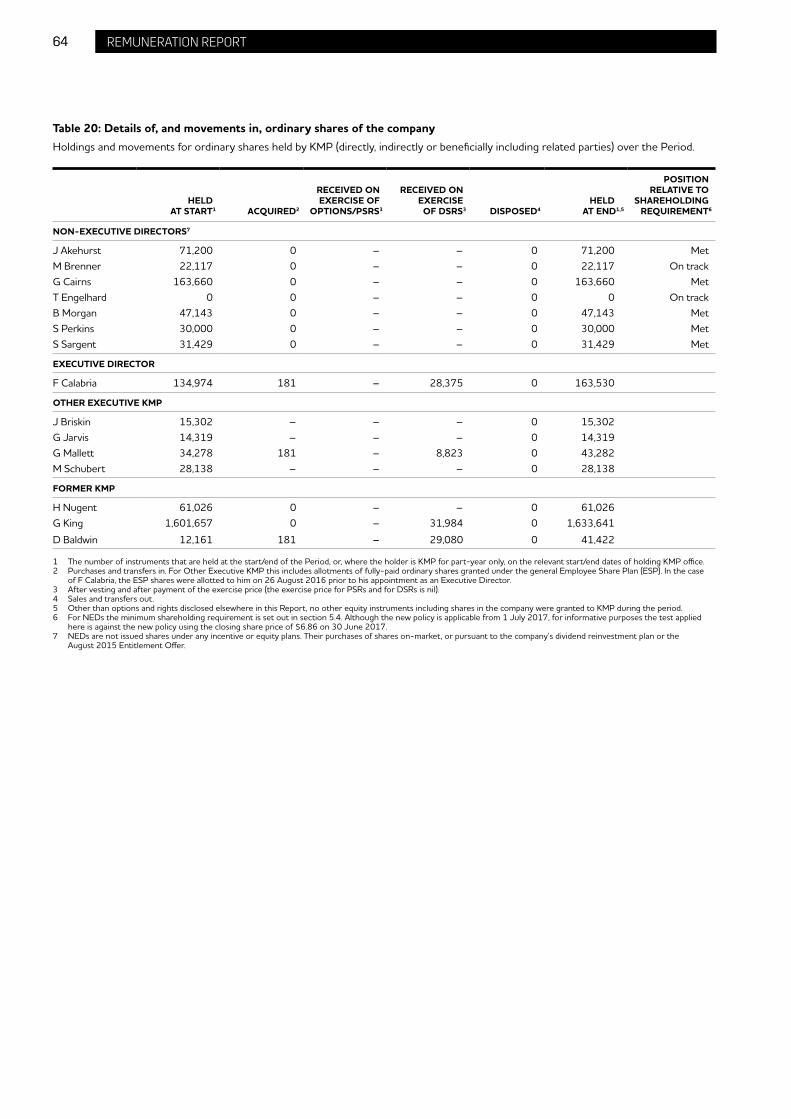
64 ORIGIN ENERGY PAGE TITLE 64 REMUNERATION REPORT
Table 20: Details of, and movements in, ordinary shares of the companyHoldings and movements for ordinary shares held by KMP (directly, indirectly or beneficially including related parties) over the Period.
HELD AT START1 ACQUIRED2
RECEIVED ON EXERCISE OF
OPTIONS/PSRS3
RECEIVED ON EXERCISE
OF DSRS3 DISPOSED4HELD
AT END1,5
POSITION RELATIVE TO
SHAREHOLDING REQUIREMENT6
NON-EXECUTIVE DIRECTORS7
J Akehurst 71,200 0 – – 0 71,200 MetM Brenner 22,117 0 – – 0 22,117 On trackG Cairns 163,660 0 – – 0 163,660 MetT Engelhard 0 0 – – 0 0 On trackB Morgan 47,143 0 – – 0 47,143 MetS Perkins 30,000 0 – – 0 30,000 MetS Sargent 31,429 0 – – 0 31,429 Met
EXECUTIVE DIRECTOR
F Calabria 134,974 181 – 28,375 0 163,530
OTHER EXECUTIVE KMP
J Briskin 15,302 – – – 0 15,302G Jarvis 14,319 – – – 0 14,319G Mallett 34,278 181 – 8,823 0 43,282M Schubert 28,138 – – – 0 28,138
FORMER KMP
H Nugent 61,026 0 – – 0 61,026G King 1,601,657 0 – 31,984 0 1,633,641
D Baldwin 12,161 181 – 29,080 0 41,422
1 The number of instruments that are held at the start/end of the Period, or, where the holder is KMP for part-year only, on the relevant start/end dates of holding KMP office.2 Purchases and transfers in. For Other Executive KMP this includes allotments of fully-paid ordinary shares granted under the general Employee Share Plan (ESP). In the case
of F Calabria, the ESP shares were allotted to him on 26 August 2016 prior to his appointment as an Executive Director.3 After vesting and after payment of the exercise price (the exercise price for PSRs and for DSRs is nil).4 Sales and transfers out.5 Other than options and rights disclosed elsewhere in this Report, no other equity instruments including shares in the company were granted to KMP during the period.6 For NEDs the minimum shareholding requirement is set out in section 5.4. Although the new policy is applicable from 1 July 2017, for informative purposes the test applied
here is against the new policy using the closing share price of $6.86 on 30 June 2017.7 NEDs are not issued shares under any incentive or equity plans. Their purchases of shares on-market, or pursuant to the company’s dividend reinvestment plan or the
August 2015 Entitlement Offer.

65ORIGIN ENERGY PAGE TITLE 65REMUNERATION REPORT
Table 21: Details of equity grantedThe table below lists all unissued shares potentially arising from equity-based incentive grants current at 30 June 2017 held by current or former employees (including Executive Directors and Executive KMP). Equity-based incentives are not granted to NEDs. No terms of equity-settled share-based transactions have been altered or modified subsequent to grant. Equity grants that failed to meet their performance hurdles on their final test dates prior to 30 June 2017 have all been lapsed.
GRANTED NUMBER OUTSTANDING EXERCISE PRICE LAST POSSIBLE EXPIRY1
OPTIONS
14 October 2013 2,625,749 $13.97 14 October 202022 October 2014 2,148,904 $15.65 22 October 202122 October 2015 2,945,660 $6.78 21 October 202530 August 2016 1,715,801 $5.67 28 August 202619 October 2016 450,000 $5.21 28 August 2026
PERFORMANCE SHARE RIGHTS
22 October 2014 473,828 – 22 October 201822 October 2015 1,398,651 – 21 October 201930 August 2016 1,484,320 – 24 August 202019 October 2016 129,558 – 24 August 2020
DEFERRED SHARE RIGHTS
14 October 2013 4,240 – 14 October 201722 October 2014 27,702 – 23 October 201722 October 2015 603 – 14 October 201722 October 2015 2,289,152 – 23 October 201722 October 2015 57,300 – 22 October 20187 December 2015 24,288 – 23 October 20177 December 2015 13,830 – 22 October 20187 December 2015 19,152 – 15 January 20187 December 2015 10,068 – 15 January 201930 August 2016 12,346 – 21 August 201730 August 2016 2,864,366 – 20 August 201830 August 2016 55,805 – 26 August 201930 August 2016 55,805 – 24 August 2020
1 The expiry date is the same as the vesting date where the terms of the grant apply automatic exercise on vesting. Where there is no automatic exercise on vesting, the expiry date is the last possible expiry. Rights may expire earlier, for example if the rights fail to vest on test, they will lapse and expire on the vesting date.
66 ORIGIN ENERGY PAGE TITLE 66 REMUNERATION REPORT
7. LOANS AND OTHER TRANSACTIONS WITH KMP
There were no loans with KMP during the year.
7.1 OTHER TRANSACTIONS WITH THE CONSOLIDATED ENTITY OR ITS CONTROLLED ENTITIES
Transactions entered into during the year with KMP which are within normal employee, customer or supplier relationships on terms and conditions no more favourable than dealings in the same circumstances on an arm’s length basis include:
– the receipt of dividends from Origin Energy Limited;
– participation in the Employee Share Plan, Equity Incentive Plan and NED Share Plan;
– participation in the August 2016 rights issue as a shareholder;
– terms and conditions of employment or directorship appointment;
– reimbursement of expenses incurred in the normal course of employment;
– purchases of goods and services; and
– receipt of interest on Retail Notes
Certain directors of Origin Energy Limited are also directors of other companies which supply Origin Energy Limited with goods and services or acquire goods or services from Origin Energy Limited. Those transactions are approved by management within delegated limits of authority and the directors do not participate in the decisions to enter into such transactions. If the decision to enter into those transactions should require approval of the Board, the director concerned will not vote upon that decision nor take part in its consideration.
Signed in accordance with a resolution of Directors
Gordon Cairns, ChairmanSydney, 16 August 2017

67ORIGIN ENERGY PAGE TITLE 67
LEAD AUDITOR’S INDEPENDENCE DECLARATION
LEAD AUDITOR’S INDEPENDENCE DECLARATION

68 ORIGIN ENERGY PAGE TITLE 68 BOARD OF DIRECTORS
BOARD OF DIRECTORS
GORDON CAIRNSINDEPENDENT NON-EXECUTIVE CHAIRMAN
Gordon Cairns joined the Board in June 2007 and became Chairman in October 2013. He is Chairman of the Nomination Committee and a member of the Risk, Remuneration and People, Audit and Health, Safety and Environment committees.
He has extensive Australian and international experience as a senior executive, as Chief Executive Officer of Lion Nathan Ltd, and has held senior management positions in marketing, operations and finance with PepsiCo, Cadbury Ltd and Nestlé.
Gordon is Chairman of Woolworths Ltd (since September 2015), a Director of Macquarie Group Limited (since November 2014), Macquarie Bank Limited (since November 2014) and Non-executive Director of World Education Australia (since November 2007). He was previously Chairman of the Origin Foundation, David Jones Ltd (March 2014 – August 2014), Rebel Group (2010-2012), Director of The Centre for Independent Studies (May 2006 – August 2011), Director of Quick Service Restaurant Group (October 2011 – May 2017) and Director of Westpac Banking Corporation (July 2004 – December 2013). He also was a senior advisor to McKinsey & Company.
Gordon holds a Master of Arts (Honours) from the University of Edinburgh.
JOHN AKEHURSTINDEPENDENT NON-EXECUTIVE DIRECTOR
John Akehurst joined the Board in April 2009. He is Chairman of the Health, Safety and Environment Committee and a member of the Nomination and Risk committees.
His executive career was in the upstream oil and gas and LNG industries, initially with Royal Dutch Shell and then as Chief Executive of Woodside Petroleum Ltd. John is currently a member of the Board of the Reserve Bank of Australia (since September 2007) and Chairman of Transform Exploration Pty Ltd.
He is Chairman of the National Centre for Asbestos Related Diseases and of the Fortitude Foundation, a former Chairman of Alinta Limited (January 2007–September 2007), and Coogee Resources Ltd (2008–2012), and a former Director of CSL Limited (April 2004–October 2016), Oil Search Limited (1998-2003), Securency Ltd (2008–2012), Murdoch Film Studios Pty Ltd and the University of Western Australia Business School.
John holds a Masters in Engineering Science from Oxford University and is a Fellow of the Institution of Mechanical Engineers.
MAXINE BRENNERINDEPENDENT NON-EXECUTIVE DIRECTOR
Maxine Brenner joined the Board in November 2013. She is Chairman of the Risk Committee and a member of the Audit and Nomination committees.
Maxine is a Non-executive Director of Orica Ltd (since April 2013) and Qantas Airways Ltd (since August 2013). She is also an Independent Director and Chairman of the Audit and Risk Committee for Growthpoint Properties Australia and a member of the University of NSW Council.
Maxine was formerly a Managing Director of Investment Banking at Investec Bank (Australia) Ltd. Prior to Investec, Maxine was a Lecturer in Law at the University of NSW and a lawyer at Freehills, specialising in corporate law. Her former directorships include Treasury Corporation of NSW, Bulmer Australia Ltd, Neverfail Springwater Ltd (1993–2003) and Federal Airports Corporation, where she was Deputy Chair. In addition, Maxine has served as a Council Member of the State Library of NSW and as a member of the Takeovers Panel.
Maxine holds a Bachelor of Arts and a Bachelor of Laws.
FRANK CALABRIACHIEF EXECUTIVE OFFICER & MANAGING DIRECTOR
Frank Calabria was appointed Chief Executive Officer and Managing Director in October 2016. Frank is a member of the Health, Safety and Environment Committee.
Frank first joined Origin as Chief Financial Officer in November 2001 and was appointed Chief Executive Officer, Energy Markets in March 2009. In that latter role, Frank was responsible for the integrated business within Australia including retailing and trading of natural gas, electricity and LPG, power generation and solar and energy services.
Frank is Chairman of the Australian Energy Council (AEC) and a director of the Australian Petroleum Production & Exploration Association (APPEA). He is a former director of the Australian Energy Market Operator (AEMO).
Frank has a Bachelor of Economics from Macquarie University and a Master of Business Administration (Executive) from the Australian Graduate School of Management.
Frank is also a Fellow of Chartered Accountants Australia and New Zealand and a Fellow of the Financial Services Institute of Australasia.

69ORIGIN ENERGY PAGE TITLE 69BOARD OF DIRECTORS
TERESA ENGELHARDINDEPENDENT NON-EXECUTIVE DIRECTOR
Teresa Engelhard joined the Board of the Company in May 2017. She is a member of the Remuneration and People Committee.
Teresa has more than 20 years’ experience in the information, communication, technology and energy sectors as a senior executive and venture capitalist. Teresa is a Non-executive Director of RedBubble Limited (since July 2011), Planet Innovation Ltd (since April 2016), StartupAUS (since March 2016), Redkite (since February 2017) and a member of Innovation and Science Australia’s Entrepreneurs’ Programme Committee (since May 2015). Teresa started her career at McKinsey & Company in California, and spent a decade in Silicon Valley as a venture capitalist and executive before moving to Australia in 2006. More recently, she has focused on energy sector innovation as a venture investor and board member. Teresa’s past directorships include Daintree Networks, Redfern Integrated Optics and Zen Ecosystems.
Teresa holds a Bachelor of Science (Hons) degree from the California Institute of Technology (Caltech), an MBA from Stanford University and is a graduate of the Australian Institute of Company Directors.
BRUCE MORGANINDEPENDENT NON-EXECUTIVE DIRECTOR
Bruce Morgan joined the Board in November 2012. He is Chairman of the Audit Committee and a member of the Health, Safety and Environment, Nomination and Risk committees.
He is Chairman of Sydney Water Corporation (since October 2013), a Director of Caltex Australia Ltd (since June 2013), Chairman of Redkite (since April 2015), a Director of the University of NSW Foundation and the European Australian Business Council. Bruce has a Bachelor of Commerce (Accounting and Finance) from the University of NSW.
Bruce served as Chairman of the Board of PricewaterhouseCoopers (PwC) Australia between 2005 and 2012. In 2009, he was elected as a member of the PwC International Board, serving a four year term. He was previously Managing Partner of PwC’s Sydney and Brisbane offices. An audit partner of the firm for over 25 years, he was focused on the financial services and energy and mining sectors leading some of the firm’s most significant clients in Australia and internationally.
He is a Fellow of Chartered Accountants Australia and New Zealand and of the Australian Institute of Company Directors.
SCOTT PERKINSINDEPENDENT NON-EXECUTIVE DIRECTOR
Scott Perkins joined the Board in September 2015. He is Chairman of the Remuneration and People Committee and a member of the Audit, Risk and Nomination committees.
Scott is a Non-executive Director of Woolworths Limited (since September 2014) and Brambles Limited (since May 2015). He is Chairman of Sweet Louise (since 2005), a Director of the Museum of Contemporary Art in Sydney (since 2011) and the New Zealand Initiative (since 2012). Scott was previously a Non-executive Director of Meridian Energy (1999–2002).
Scott has extensive Australian and international experience as a leading corporate adviser. He was formerly Head of Corporate Finance for Deutsche Bank Australia and New Zealand and a member of the Executive Committee with overall responsibility for the Bank’s activities in this region. Prior to that he was Chief Executive Officer of Deutsche Bank New Zealand and Deputy CEO of Bankers Trust New Zealand.
He has a longstanding commitment to breast cancer causes, the visual arts and public policy development.
Scott holds a Bachelor of Commerce and a Bachelor of Laws (Hons) from Auckland University.
STEVE SARGENTINDEPENDENT NON-EXECUTIVE DIRECTOR
Steve Sargent joined the Board in May 2015. He is Chairman of the Origin Foundation and a member of the Health, Safety and Environment and Remuneration and People committees.
Steve is Chairman of OFX Group Ltd (since November 2016). He is a Non-executive Director of Nanosonics Ltd (since July 2016) and the Great Barrier Reef Foundation (since March 2015). Over recent years Steven has been a Non-executive Director of Veda Group Limited (2015–2016) and Bond University Ltd (2010–2016). Steve was also a member of the Australian Treasurer’s Financial Sector Advisory Council, President of the American Chamber of Commerce and a Director on the Board of the Business Council of Australia.
Steve’s most recent executive role was President and Chief Executive Officer of GE Mining, GE’s global mining technology and services business. He joined GE Capital in 1993 and held a number of global leadership positions with the company, spanning the US, Europe and Asia. He was a member of the Australian B20 Leadership Group and Coordinating Chair of the B20 Human Capital Taskforce.
Steve holds a Bachelor of Business from Charles Sturt University in New South Wales and is a Fellow with the Australian Institute of Company Directors and Fellow with the Australian Academy of Technological Sciences and Engineering.

70 ORIGIN ENERGY PAGE TITLE 70
TONY LUCASEXECUTIVE GENERAL MANAGER, FUTURE ENERGY AND BUSINESS DEVELOPMENT
Tony Lucas joined Origin as Risk Analysis Manager in 2002 and was appointed as General Manager, Energy Risk Management in February 2011.
Tony leads the team responsible for Strategy and Risk for Energy Markets. He will also ensure that Origin is uniquely positioned to lead the transition into a low carbon, technology-enabled world where customers are empowered with greater choice by investing in, incubating and deploying the best future energy solutions.
Originally from New Zealand, Tony began his career in the banking industry before moving to London where he worked for Lehman Brothers. He moved to Australia in 1997 and worked with Bankers Trust and Integral Energy. Tony has an NZ Diploma in Business Studies and Master of Applied Finance.
CARL McCAMISHEXECUTIVE GENERAL MANAGER, TECHNOLOGY, RISK, HSE, AND TRANSFORMATION
Carl McCamish joined Origin in March 2008 and is responsible for Information Technology, Company transformation and risk. Carl was previously Executive General Manager Corporate Development and subsequently Executive General Manager Corporate Affairs, and more recently Executive General Manager, People & Culture.
Before joining Origin, Carl was head of strategic development at the private equity firm, Terra Firma. He was previously Senior Energy Advisor in the United Kingdom Prime Minister's Strategy Unit. Before that he worked at McKinsey & Company management consultants.
Carl has a Bachelor of Arts and Laws from the University of Melbourne and a Masters in Industrial Relations and Labour Economics from Oxford University where he was a Rhodes Scholar.
JON BRISKINEXECUTIVE GENERAL MANAGER, RETAIL
Jon Briskin joined Origin in 2010 and was appointed General Manager, Retail in May 2016.
Jon leads the teams responsible for energy sales, marketing, product development and service experience for Origin’s residential and SME customers.
Jon has held various roles at Origin, leading customer operations, service transformation and customer experience.
Prior to Origin Jon worked as a management consultant across financial services, energy, technology and government sectors. Jon holds a Bachelor of Commerce (Accounting and Finance) from Monash University.
ANDREW CLARKEGROUP GENERAL COUNSEL AND COMPANY SECRETARY
Andrew Clarke joined Origin in May 2009 and is responsible for the company secretarial and legal functions. He was a partner of a national law firm for 15 years and was Managing Director of a global investment bank for more than two years prior to joining Origin. Andrew has a Bachelor of Laws (Hons) and a Bachelor of Economics from Sydney University and is a member of the Australian Institute of Company Directors.
GREG JARVISEXECUTIVE GENERAL MANAGER, ENERGY SUPPLY AND OPERATIONS.
Greg Jarvis joined Origin in 2002 as Electricity Trading Manager and was appointed General Manager, Wholesale, Trading and Business Sales in February 2011.
Greg is responsible for Wholesale, Trading, Business Energy, Solar, Generation and LPG.
Holding 19 years' experience in the financial market industry, with 14 years' experience in energy markets, Greg began his career in the banking industry in Australia before moving overseas to work. He has a Masters in Applied Finance and a Bachelor of Business.
EXECUTIVE MANAGEMENT TEAM
EXECUTIVE MANAGEMENT TEAM

71ORIGIN ENERGY PAGE TITLE 71EXECUTIVE MANAGEMENT TEAM
SHARON RIDGWAYEXECUTIVE GENERAL MANAGER, PEOPLE AND CULTURE
Sharon Ridgway joined Origin in 2009 and is responsible for People and Culture, internal communications and The Origin Foundation. Sharon was appointed in 2012 as the Head of P&C for the LNG business unit before being appointed as the General Manager P&C for Energy Markets in 2015.
Sharon's team provides strategic support to the business in key areas such as engagement, diversity, talent management, communications and culture change.
Originally from the UK, Sharon spent most of her early career with the Dixons Group, a large European electrical retailer. There she held a number of operational roles before being appointed as the Head of HR and subsequently the Head of European Recruitment. Sharon holds a Bachelor of Business Administration and a Postgraduate Diploma in HR Management.
MARK SCHUBERTEXECUTIVE GENERAL MANAGER, INTEGRATED GAS
Mark Schubert joined Origin in April 2015 and was appointed Executive General Manager, IG, in April, 2017. He is responsible for Origin’s Integrated Gas business, which manages the Company’s portfolio of natural gas and LNG interests across Australia, New Zealand and internationally. Integrated Gas includes Origin's interests in Australia Pacific LNG, as operator of the upstream and pipeline components of the joint venture and as gas marketing agent. Mark’s prior Origin role was General Manager, Commercial where he was responsible for strategy, business performance, exploration and new resources, gas marketing, LNG portfolio management, joint ventures and our non-operated interests.
Mark also held a number of senior positions during his 18 year career with Shell. Most recently Mark served as General Manager Production where he had direct accountability for developing Prelude FLNG - the world's first floating LNG facility. Mark’s other roles in Shell included General Manager Geelong Refinery and General Manager Oceania Supply & Marine. Mark holds a Masters of Finance and Financial Law from the University of London and a Bachelor of Engineering (Chemical) from the University of Sydney.
LAWRIE TREMAINECHIEF FINANCIAL OFFICER
Lawrie Tremaine joined Origin in July 2017 and holds the position of Chief Financial Officer.
Lawrie leads the teams responsible for all finance activities, corporate strategy, corporate development, and investor relations.
Lawrie has over 30 years’ experience in financial leadership, predominantly in the resource, oil and gas and minerals processing industries.
Prior to joining Origin, Lawrie spent 10 years at Woodside Petroleum, where he held a number of senior positions, including Chief Financial Officer for more than 6 years. Before joining Woodside Lawrie worked at Alcoa for 17 years culminating in 5 years in Tokyo and Beijing as Vice President Finance, Alcoa Asia Pacific.
Lawrie has extensive experience in capital markets, managing corporate finances and leading change.
Lawrie has a Bachelor of Business from Chisholm Institute (now Monash University) and is a Fellow of CPA Australia.

7272 CORPORATE GOVERNANCE STATEMENT

73ORIGIN ENERGY PAGE TITLE 73CORPORATE GOVERNANCE STATEMENT
Origin is committed to the creation of shareholder value and meeting the expectations of stakeholders to practice sound corporate governance.
Origin aspires to the highest standards of integrity, personal safety and environmental performance. To achieve this, every employee and contractor is required to act in accordance with Origin’s governance and business conduct standards across its operations in Australia and internationally.
COMPLIANCE WITH THE ASX CORPORATE GOVERNANCE PRINCIPLES AND RECOMMENDATIONS (ASX PRINCIPLES)
This statement has been approved by the Board and summarises the Company’s governance practices which were in place throughout the financial year ended 30 June 2017. During the financial year and to the date of this Report, Origin has complied with all of the ASX Principles.
PRINCIPLE 1: LAY SOLID FOUNDATIONS FOR MANAGEMENT AND OVERSIGHT
The Board’s roles and responsibilities are formalised in a Board Charter, which is available on the Company’s website. The Charter sets out those functions that are delegated to management and those that are reserved for the Board. The Company Secretary is accountable directly to the Board, through the Chairman, on all matters to do with the proper functioning of the Board.
Before a Director is appointed, Origin undertakes appropriate evaluations. These include independent checks of a candidate’s character, experience, education, criminal record, bankruptcy history, and any other factors which would affect the Company’s or the individual’s reputation.
Where a candidate is standing for election or re-election as Director, the notice of meeting will set out information on the candidate including biographical details, qualifications and experience, independence status, outside interests and the recommendation of the rest of the Board on the resolution.
At the time of joining Origin, Directors and senior executives are provided with letters of appointment, together with key Company documents and information, setting out their term of office, duties, rights and responsibilities, and entitlements on termination.
The performance of all key executives, including the Chief Executive Officer (CEO), is reviewed annually against:
– a set of personal financial and non-financial goals;
– Company and Business-Unit specific goals; and
– adherence to the Company’s Compass, which reflects the role that Origin’s Purpose, Principles, Values and Commitments play in everyday decision making.
The Remuneration and People Committee and the Board consider the performance of the Chief Executive Officer and all members of the Executive Leadership Team (ELT) when deciding whether to award performance-related remuneration through short-term and long-term incentives for the year completed and when assessing fixed remuneration for future periods. Further information on the outcomes of the FY2017 assessment of executive remuneration is set out in the Remuneration Report.
Each year, the Directors review the performance of the whole Board, Board committees and individual Directors. This year, a full review was undertaken with assistance from an independent external consultant, covering individual Director performance, the Board and Committees’ activities and work program, time commitments, meeting efficiency and Board contribution to Company strategy, monitoring, compliance and governance. The results of the review were discussed by the whole Board, and initiatives to improve or enhance Board performance and effectiveness were considered and recommended.
CORPORATE GOVERNANCE STATEMENT FOR THE YEAR ENDED 30 JUNE 2017

74 ORIGIN ENERGY PAGE TITLE 74 CORPORATE GOVERNANCE STATEMENT
DIVERSITYOrigin’s Diversity and Inclusion Policy applies to all aspects of employment including recruitment, selection, promotion, training, remuneration benefits and performance management. There are also procedures in place to prevent and eliminate unlawful discrimination and harassment.
Origin promotes a culture where managers and employees proactively apply the diversity policies and programs through effective leadership and communication. The Company offers flexible working arrangements to support diversity in the workforce and a more inclusive culture.
In FY2017 Origin launched the ‘All Roles Flex’ initiative. This challenges the organisation, both employees and managers, to find flexibility in any role. The aim is to improve productivity by further removing barriers to workplace diversity. This program also targets greater flexibility for employees working in roles that are traditionally less flexible due to shift rosters or remote locations, such as an operational role at a power station.
During FY2017, as part of the parental leave program, the entitlement of paid partner leave doubled from five days to 10 days. This leave can also be taken on a flexible basis.
Gender diversityThe Board oversees Origin’s strategies on gender diversity, including monitoring achievement against gender targets set by the Board.
Improving gender diversity at Origin continues to be a priority. During FY2017, Origin was again recognised as a Workplace Gender Equality Agency Employer of Choice for Gender Equality. Origin’s three gender diversity targets, and FY2017 performance against those targets, are outlined below.
Definition of seniorityFor the purpose of gender diversity targets, ‘senior roles’ includes all people in Hay Pay Scale job grades that pay approximately $150,000 per annum in fixed remuneration1.
We define seniority by reference to standard Hay Pay Scale job grades, rather than reporting relationship to the CEO, for two reasons:
– to make genuine comparisons of seniority. In recent years executives leading four support functions have reported to the CEO. A large number of people in corporate support areas such as legal, company secretary, human resources, strategy and communications are therefore only two or three levels below the CEO, while in the operating businesses there are many roles with significant line management responsibility that are more than three levels below; and
– to make analysis comparable over time. Any restructure that changes Executive Leadership Team (ELT) roles also changes the reporting relationships for hundreds of people at lower levels, making it less valid to accurately compare progress on gender pay equality at those levels before and after the restructure. While Origin does not use reporting relationship to the CEO to define Origin’s gender diversity targets, the gender profile of these cohorts is of interest to some external stakeholders and is presented in the cohorts by gender in the table below.
1 The dollar number is approximate because the boundary is defined by Korn Ferry Hay Group position grading methodology. The corresponding market rate varies with time.

75ORIGIN ENERGY PAGE TITLE 75CORPORATE GOVERNANCE STATEMENT
3. Reduce the gap between male and female turnover to zero
Turnover for both men and women was lower than in the prior year. Achieving the same turnover for men and women across the Company overall continues to be a stretch target. During the year, 17 per cent of women and 11.1 per cent of men in senior roles left the Company, resulting in a gap of 5.9 per cent.
FY2018 TARGETSOrigin’s diversity targets for FY2018 will be to:
– continue to deliver equal average pay for men and women at each job grade;
– improve the rate of appointment of women to senior roles by 15 per cent compared to FY2017; and
– improve our retention of women in senior roles with a goal to reduce the gap between male and female turnover to zero.
The Board has set itself a target of females being at least 40 per cent of the Board by 2020.
PERFORMANCE AGAINST TARGETS1. Deliver equal average pay for men and women at
each job gradeAt the end of FY2017, the average difference between male and female pay across all job grades was just below one per cent. While the average female pay is higher at some grades than average male pay; it is reversed at other grades.
Gender pay gap (graded population weighted average) to 30 Jun 2017
-1
0
1
2
3
4
5
6
2. Improve the rate of appointment of women to senior roles to 36 per cent
The percentage of women recruited into senior roles was 38.7 per cent. This was much higher than in the prior year, and significantly better than Origin’s previous best of approximately 36 per cent in FY2015.
At the end of FY2017, there were 1,636 people in senior roles, of which 28.9 per cent were women.
Rate of appointment of women to senior roles (among new hires)
20
25
30
35
40
FY17FY16FY15FY14FY13
38.7
%
28.6
%
35.9
%
32.5
%
24.5
%
Cohorts by gender
FY2015 FY2016 FY2017
COHORT1# PEOPLE IN
COHORTPERCENTAGE
FEMALE# PEOPLE IN
COHORTPERCENTAGE
FEMALE# PEOPLE IN
COHORTPERCENTAGE
FEMALE
Board 9 33 8 25 7 29CEO-1 (ELT) 9 11 6 17 9 11CEO-2 51 29 36 25 65 26CEO-3 158 34 143 34 178 38Senior roles 1,861 28.1 1,574 27.4 1,636 28.8
1 Definitions for CEO-1, CEO-2 and CEO-3 are as per Workplace Gender Equality Agency guidelines. That is, they do not include clerical and administrative staff or other staff that do not themselves manage other people. With all staff included, CEO-3 at Origin was 34 per cent female out of a total cohort of 158 as at 30 June 2017.
1 Definitions for CEO-1, CEO-2 and CEO-3 are as per Workplace Gender Equality Agency guidelines. That is, they do not include clerical and administrative staff or other staff that do not themselves manage other people. With all staff included, CEO-3 at Origin was 34 per cent female out of a total cohort of 158 as at 30 June 2017.

76 ORIGIN ENERGY PAGE TITLE 76 CORPORATE GOVERNANCE STATEMENT
The Board seeks to have an appropriate mix of skills, experience, expertise and diversity to enable it to discharge its responsibilities and add value to the Company. The Board values diversity in all respects, including gender and differences in background and life experience, communication styles, interpersonal skills, education, functional expertise and problem solving skills.
Together, the Directors contribute the following key skills and experience:
Score:1: weak 5: average 10: strong
SKILLS AND EXPERIENCE
BOARD SCORE
(OUT OF 10)
GovernanceA commitment to and experience in setting best practice corporate governance policies, practices and standards. Ability to assess the effectiveness of senior management. 9
IndustryExperience in the energy or oil and gas industry, or upstream or integrated exploration and production company including in-depth knowledge of the Company’s strategy, markets, competitors, operational issues, technology and regulatory concerns. This includes advisory roles for these industries. 7
DiversityDiversity in gender, background, geographic origin, experience (industry and public, private and non-profit sectors). 7
InternationalExposure to international regions either through experience working in an organisation with global operations or through management of international stakeholder relationships. Understanding of different cultural, political, regulatory and business requirements. 9
StrategySenior executive and directorship experience, dealing with complex business models and projects. Experience in developing, setting and executing strategic direction and driving growth. 8
Financial and risk managementSenior executive experience in financial accounting and reporting, corporate finance, risk and internal controls. Experience in anticipating and evaluating risks that could impact the business, recognising and managing these risks through sound risk governance policies and frameworks. 8
SustainabilityExperience in programs implementing health, safety and environment, including mental health and physical wellbeing. Ability to identify economically, socially and environmentally sustainable developments and to set and monitor sustainability aspirations. 8
Regulatory and public policyExperience in the identification and resolution of legal and regulatory issues. Experience in public and regulatory policy, including how it affects corporations. 7
PeopleExperience in building workforce capability, setting a remuneration framework which attracts and retains a high calibre of executives, promotion of diversity and inclusion. 8
CustomerExperience in a customer first industry. 7
DisruptionBackground in an industry that has faced disruptive change. 6
PRINCIPLE 2: STRUCTURE THE BOARD TO ADD VALUE
The Board is structured to facilitate the effective discharge of its duties and to add value through its deliberations.
In FY2017, the Board had 10 scheduled meetings, including a two-day strategic planning meeting. The Board and Committees also had seven separate scheduled workshops to consider matters of particular relevance. Outside of scheduled meetings, the full Board met on four other occasions to consider significant matters. In addition, the Board conducted visits of Company operations and met with operational management during the year.
From time to time, the Board delegates its authority to non-standing committees of Directors to consider transactional or other matters. In the 12 months to 30 June 2017, five such additional Board Committee meetings were held. In addition, the Board established a Due Diligence Committee as part of the proposed divestment of Origin’s conventional Upstream assets via a proposed IPO. This Committee met three times to 30 June 2017.
At Board meetings, Directors receive reports from executive management on financial and operational performance, risk, strategy, people, HSE, and major projects or initiatives in which Origin is involved. In addition, the Directors receive reports from Board Committees and, as appropriate, presentations on opportunities and risks for the Company.
Non-executive Directors also meet without the presence of management (including the Chief Executive Officer) to address such matters as succession planning, key strategic issues, and Board operation and effectiveness. All Directors have access to Company employees, advisers and records. In carrying out their duties and responsibilities, Directors have access to advice and counsel from the Chairman, the Company Secretary and the Group General Counsel, and are able to seek independent professional advice at the Company’s expense, after consultation with the Chairman.
New Directors undergo an induction program which includes sessions with members of management, Chairman of the Board, and Chairs of each relevant Board Committee, and visits to key operations to familiarise them with Origin’s business and administration. Directors also receive continuing education through ongoing briefings and workshops on industry, regulatory or other relevant topics and attendance at industry or governance conferences.
The Board’s size and composition is determined by the Directors, within limits set by Origin’s Constitution, which requires a Board of between five and 12 Directors. As at 30 June 2017, the Board comprised eight Directors, including seven Non-executive Directors, all of whom are considered independent by the Board, and the Chief Executive Officer & Managing Director. Of the eight Directors, two are women. Directors’ profiles, duration of office and details of their skills, experience and special expertise are set out in the Directors’ Report.
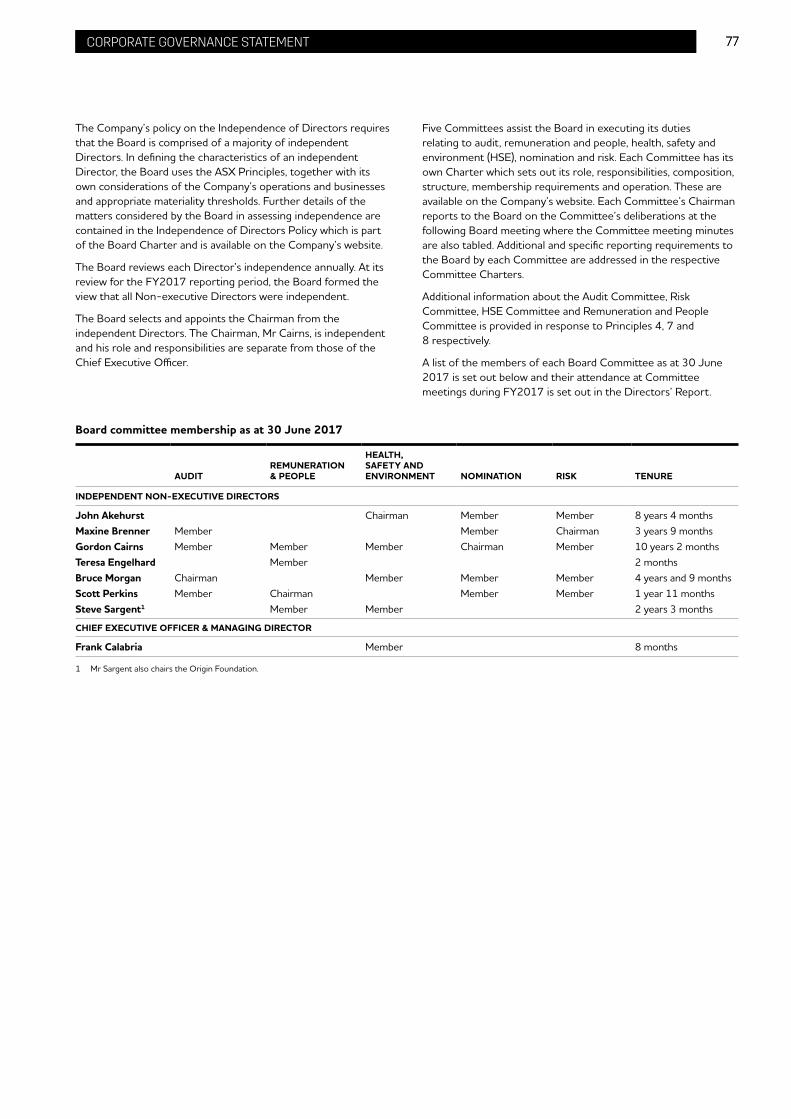
77ORIGIN ENERGY PAGE TITLE 77CORPORATE GOVERNANCE STATEMENT
Five Committees assist the Board in executing its duties relating to audit, remuneration and people, health, safety and environment (HSE), nomination and risk. Each Committee has its own Charter which sets out its role, responsibilities, composition, structure, membership requirements and operation. These are available on the Company’s website. Each Committee’s Chairman reports to the Board on the Committee’s deliberations at the following Board meeting where the Committee meeting minutes are also tabled. Additional and specific reporting requirements to the Board by each Committee are addressed in the respective Committee Charters.
Additional information about the Audit Committee, Risk Committee, HSE Committee and Remuneration and People Committee is provided in response to Principles 4, 7 and 8 respectively.
A list of the members of each Board Committee as at 30 June 2017 is set out below and their attendance at Committee meetings during FY2017 is set out in the Directors’ Report.
The Company’s policy on the Independence of Directors requires that the Board is comprised of a majority of independent Directors. In defining the characteristics of an independent Director, the Board uses the ASX Principles, together with its own considerations of the Company’s operations and businesses and appropriate materiality thresholds. Further details of the matters considered by the Board in assessing independence are contained in the Independence of Directors Policy which is part of the Board Charter and is available on the Company’s website.
The Board reviews each Director’s independence annually. At its review for the FY2017 reporting period, the Board formed the view that all Non-executive Directors were independent.
The Board selects and appoints the Chairman from the independent Directors. The Chairman, Mr Cairns, is independent and his role and responsibilities are separate from those of the Chief Executive Officer.
Board committee membership as at 30 June 2017
AUDITREMUNERATION & PEOPLE
HEALTH, SAFETY AND ENVIRONMENT NOMINATION RISK TENURE
INDEPENDENT NON-EXECUTIVE DIRECTORS
John Akehurst Chairman Member Member 8 years 4 monthsMaxine Brenner Member Member Chairman 3 years 9 monthsGordon Cairns Member Member Member Chairman Member 10 years 2 monthsTeresa Engelhard Member 2 monthsBruce Morgan Chairman Member Member Member 4 years and 9 monthsScott Perkins Member Chairman Member Member 1 year 11 monthsSteve Sargent1 Member Member 2 years 3 months
CHIEF EXECUTIVE OFFICER & MANAGING DIRECTOR
Frank Calabria Member 8 months
1 Mr Sargent also chairs the Origin Foundation.

78 ORIGIN ENERGY PAGE TITLE 78 CORPORATE GOVERNANCE STATEMENT
Ms Teresa Engelhard joined the Board in May 2017 and will be standing for election at the AGM in accordance with the ASX Listing Rules. Appropriate background checks in relation to character, experience, education, criminal record and bankruptcy history were conducted prior to the appointment of Ms Engelhard. The Board considers Mr Engelhard’s extensive experience in disruption, technology, innovation and growth, together with her global corporate perspectives, will further strengthen the Board and complement the skills of the existing Directors. The Board (with Ms Engelhard absent) recommends Ms Engelhard for election.
PRINCIPLE 3: ACT ETHICALLY AND RESPONSIBLY
All Directors and employees are expected to comply with the law and act with a high level of integrity. Origin has a Code of Conduct and a number of policies governing conduct in pursuit of Company objectives in dealing with shareholders, employees, customers, communities, business partners, suppliers, contractors and other stakeholders. The Code of Conduct is based on the Company’s Purpose, Principles, Values and Commitments, which serves as a guide to Origin’s decision making, behaviours and actions for its employees.
Origin’s Purpose, Principles, Values and Commitments and a summary of the Code of Conduct is available on Origin’s website.
Origin prohibits the offer, payment, solicitation or acceptance of bribes and facilitation payments in any form. It also prohibits the provision of gifts and gratuities, both directly and indirectly, to public officials or relatives or associates of public officials. The giving or receiving of gifts or hospitality is prohibited in all circumstances that influence, create obligations or conflicts of interest, indicate favouritism or do not align with Origin’s Code of Conduct.
Origin encourages individuals to report known or suspected instances of inappropriate conduct, including breaches of the Code of Conduct and other policies and directives. There are policies in place designed to protect employees and contractors from any reprisal, discrimination or being personally disadvantaged as a result of their reporting a concern.
The Nomination Committee is comprised of the Chairman of the Board and the Chairman of each other Board Committee, and is chaired by Mr Cairns. The Nomination Committee met once during FY2017, and provides support and advice to the Board by:
– assessing the range of skills and experience required on the Board and of Directors as part of the Company’s continued consideration of Board renewal and succession planning;
– reviewing the performance of Directors and the Board;
– establishing processes to identify suitable Directors, including the use of professional intermediaries;
– recommending Directors’ appointments and re-elections; and
– considering the appropriate induction and continuing education provided for Directors.
When identifying potential candidates, the Nomination Committee considers the current and future needs of Origin and desired attributes and skill sets for a new Director. Where a candidate is recommended by the Nomination Committee, the Board will assess that candidate against a range of criteria including background, experience, professional qualifications and the potential for the candidate’s skills to augment the existing Board and his/her availability to commit to the Board’s activities. If these criteria are met and the Board appoints the candidate as a Director, that Director will stand for election by shareholders at the following Annual General Meeting.
Each year the performance of the Directors retiring by rotation and seeking re-election under the Constitution is reviewed by the Nomination Committee (other than the relevant Director), the results of which form the basis of the Board’s recommendation to shareholders. The review considers a Director’s expertise, skill and experience, along with his/her understanding of the Company’s business, preparation for meetings, relationships with other Directors and management, awareness of ethical and governance issues, independence of thought and overall contribution.
The Board reviewed the performance of Ms Maxine Brenner, who is standing for re-election at the Annual General Meeting (AGM) in October 2017. Ms Brenner was not present for her own review. The Board (with Ms Brenner absent) found that Ms Brenner had been a high performing Director and concluded that she should be proposed for re-election.
79ORIGIN ENERGY PAGE TITLE 79CORPORATE GOVERNANCE STATEMENT
PRINCIPLE 5: MAKE TIMELY AND BALANCED DISCLOSURE
Origin has adopted policies and procedures designed to ensure compliance with its continuous disclosure obligations and make senior management accountable for that compliance.
Origin provides timely, full and accurate disclosure and keeps the market informed with quarterly releases detailing exploration, development and production, and half and full year reports to shareholders including in digital format on the Company’s website.
All material matters are disclosed immediately to the stock exchanges on which Origin’s securities are listed (and subsequently to the media, where relevant), as required by the relevant listing rules. All material investor presentations are released to the stock exchanges and are posted on the Company’s website. Other reports or media statements that do not contain price sensitive information are included on the Company’s website. Shareholders can subscribe to an email notification service and receive notice of any announcements released by the Company.
Both the Continuous Disclosure Policy and the Communications with Shareholders Policy are available on the Company’s website.
PRINCIPLE 6: RESPECT THE RIGHTS OF SHAREHOLDERS
Origin respects the rights of its shareholders and has adopted policies to facilitate the effective exercise of those rights through participation at general meetings and with the provision of information about Origin and its operations.
Origin provides a high standard of communication to shareholders and other stakeholders so that they have all available information reasonably required to make informed assessments of the Company’s business value and prospects.
Shareholders can review the financial and non-financial performance of Origin via a half year report, shareholder review, Annual Report, Sustainability Report and annual general meeting materials. These reports are also available on the ASX on Origin’s website. Shareholders may also request hardcopies.
Sustainability reporting is guided by the Global Reporting Initiative and includes disclosures of material environmental, social and governance (ESG) aspects of the Company’s business activities.
Origin also discloses other ESG information via regulated National Greenhouse Emissions Reporting, as well as voluntary disclosure platforms such as the Carbon Disclosure Project. Origin regularly engages with and provides requested information to research firms. Origin was again included in the FSTE4Good Index and the Dow Jones Sustainability Australia Index during the period.
All communications from, and most communications to, the Company’s share registry are available electronically, including company reports, and shareholders are encouraged to take up the option of e-communications.
PRINCIPLE 4: SAFEGUARD INTEGRITY IN CORPORATE REPORTING
The Board has an Audit Committee which comprises four Non-executive Directors, all of whom are independent. The Chairman of the Board cannot chair the Audit Committee. The Chairman of the Audit Committee, Mr Bruce Morgan, is an independent Director with significant financial expertise. All members of the Committee are financially literate and the Committee possesses sufficient accounting and financial expertise and knowledge of the industry in which Origin operates.
Prior to approval of the Company’s financial statements for each financial period, the Chief Executive Officer and the Chief Financial Officer give the Board a declaration that, in their opinion, the financial records have been properly maintained, that the financial statements complied with the accounting standards and gave a true and fair view, and that their opinion had been formed on the basis of a sound system of risk management and internal compliance and control which was operating effectively.
The Audit Committee oversees the structure and management systems that are designed to protect the integrity of the Company’s corporate reporting. The Audit Committee reviews the Company’s half and full year financial reports and makes recommendations to the Board on adopting the financial statements. The Committee provides additional assurance to the Board with regard to the quality and reliability of financial information. The Committee has the authority to seek information from any employee or external party.
The internal and external auditors have direct access to the Audit Committee Chairman and, following each scheduled Committee meeting, meet separately with the Committee without management present.
The Committee reviews the independence of the external auditor, including the nature and level of non-audit services provided, and reports its findings to the Board every six months.
The names of the members of the Audit Committee are set out in the table under Principle 2 and their attendance at meetings of the Committee is set out in the Directors’ Report.
The external auditor attends the Company’s AGM and is available to answer questions from shareholders relevant to the audit.

80 ORIGIN ENERGY PAGE TITLE 80 CORPORATE GOVERNANCE STATEMENT
PRINCIPLE 7: RECOGNISE AND MANAGE RISK
Origin’s approach to risk management aims to embed a risk-aware culture in all decision-making and to manage risk in a proactive and effective manner. The Board has an overarching policy governing the Company’s approach to risk oversight and management and internal control systems. This policy and further information on Origin’s approach to managing its material risks is available on the Company’s website.
The Board has an established Risk Committee to oversee Origin's policies and procedures in relation to risk management and internal control systems. The Risk Committee is comprised of the Chairman of the Board and the Chairman of each other Board Committee, and is chaired by independent Non-executive Director Ms Maxine Brenner. The Risk Committee Charter is available on the Company’s website. The names of the members of the Risk Committee are set out in the table under Principle 2 and a record of their attendance at meetings of the Committee is set out in the Directors’ Report.
The Company’s risk policies are designed to identify, assess, manage and monitor strategic, operational, financial and project risks and mitigate the impact in the event that they materialise. The Board has also approved policies for hedging interest rates, foreign exchange rates and commodities. Certain specific risks are covered by insurance.
Management is responsible for the design and implementation of the risk management and internal control systems to manage the Company’s risks. Management reports to the Risk Committee on how material risks are being managed and the effectiveness of controls in place to mitigate those risks. The Risk Committee has an annual calendar that includes regular detailed risk profile reviews.
The Risk Committee reviews the Company’s risk management framework annually to satisfy itself that it continues to be sound. An independent review of the risk management framework was completed during the financial year and it found the framework to be sound. Management has reported to the Risk Committee and the Board that, as at 30 June 2017, the framework is sound.
Origin also has an internal audit function which utilises both internal and external resources to provide an independent appraisal of the adequacy and effectiveness of the Company’s risk management and internal control systems. The internal audit function has direct access to the Chairmen of the Audit, Risk and HSE Committees and management, and has the right to seek information. A risk-based approach is used to develop the annual internal audit plan, aligning planned internal audit activities to the Company’s material risks. The internal audit plan is approved by the Audit, Risk and HSE Committees annually and reviewed quarterly.
In addition to internal audit activities, second line assurance activity is undertaken across the business in the management of risk. The findings of this activity are reported through to the relevant executive and, where appropriate, Board Committee.
Origin’s website contains a list of key dates and all recent announcements, presentations, past and current company reports and notices of meetings. Shareholder meetings and results announcements are webcast and an archive of these meetings is published on the Company’s website.
Origin welcomes and encourages shareholders to attend and participate in its AGM, either in person, by proxy or attorney, or by other means adopted by the Board. At each AGM, the Chairman allows a reasonable opportunity for shareholders to ask questions of the Board and the external auditors. Shareholders who are unable to attend the AGM can view a webcast of the meeting (and certain past general meetings) on the Company’s website.
Origin has a wide stakeholder engagement program and a dedicated investor relations function to facilitate effective two-way communication with investors.
The Communications with Shareholders Policy is available on the Company’s website.
In addition to shareholders, the Company’s projects and operations necessitate interaction with a range of stakeholders including local communities, business partners, government, industry, media, suppliers and NGOs. Origin has a program to support these stakeholder interactions and facilitate constructive relationships. These include:
– dedicated community advisors to help facilitate and implement the Company’s engagement with local communities and regular dialogue with the communities in which Origin operates;
– a government relations team which regularly interacts with policy makers within the jurisdictions of Origin’s operations, particularly to help develop sound and stable policy to ensure business certainty;
– dedicated external affairs team with regular interaction with media and NGOs to create a better understanding of Origin’s business; and
– making a contribution to the formulation of public policy through submissions to various enquiries.
Further information on the Company’s stakeholder engagement program can be found in the Sustainability Report under Stakeholder Engagement.
Customers are a central part of Origin’s engagement, innovation and value creation. Origin continues to adapt processes, introduce new products and invest in technology to provide customers with greater choice and an improved customer experience. The Sustainability Report provides further information on Origin’s interaction with its customers.

81ORIGIN ENERGY PAGE TITLE 81CORPORATE GOVERNANCE STATEMENT
Origin’s approach to the management of risks and controls reflects the ‘three lines of defence’ model. The first line of defence comprises operational business managers that own and manage risks. The second line of defence comprises the corporate functions that oversee/monitor/challenge risks. The third line of defence comprises the Origin group internal audit function that assures compliance with policies and standards.
The Board’s HSE Committee supports and advises the Board on HSE matters and HSE related risks arising out of the activities and operations of Origin and its related companies. The HSE Committee comprises the Chief Executive Officer and four independent Non-executive Directors. The Chairman, Mr John Akehurst, is an independent Director. The Board considers that the direct impact the deliberations of the HSE Committee can have on the day-to-day operations of Origin makes it appropriate for the Chief Executive Officer to be a member of that Committee.
The names of the members of the HSE Committee are set out under Principle 2 and a record of their attendance at meetings of the Committee is set out in the Directors’ Report.
Beyond the financial results, Origin is witnessing changes in community attitudes and increased focus on local and global environmental challenges. Origin recognises the need for disclosure and transparency of decision making to help investors assess both short term and long term risks and prospects.
Origin assesses the environmental and social risks associated with projects and operations. Projects are developed with precautionary engineering and management measures in place to mitigate or manage key environmental and social risks, and operations are managed using policies and procedures to control remaining environmental and social risks. Environmental and social risk management is subject to periodic audits and assurance.
As one of Australia’s largest power generators, Origin closely measures, manages and reports on the greenhouse gas emissions associated with its operations. These emissions are governed by laws and regulations. Management of emissions extends to the development of a low carbon power generation portfolio including natural gas, wind and solar.
Further information on Origin’s management and performance in the social, environmental and economic aspects in operating its business is contained in the Sustainability Report.
Origin measures its reputation, that is, how Origin is perceived by Australians (including shareholders) using RepTrak® methodology. Origin’s reputation performance and reputation risk issues are periodically reported to the Board.
In addition to stakeholder measurement through RepTrak, Origin also engages external advisors to provide real-time monitoring of mainstream and social media to evaluate the external operating environment and ensure emerging risks, issues and shifting public and policy debates are identified and addressed accordingly. Quarterly quantitative and qualitative mainstream media analysis is undertaken to better understand external trends, and sentiment and key public influencers.
These insights influence and inform Origin’s external affairs and stakeholder engagement strategies, as well as customer facing positioning and community engagement programs.
PRINCIPLE 8: REMUNERATE FAIRLY AND RESPONSIBLY
The Remuneration Report sets out details of the Company’s policies and practices for remunerating Directors, key management personnel and employees.
The Board has a Remuneration and People Committee which comprises four Non-executive Directors, all of whom are independent. The Chairman, Mr Scott Perkins, is an independent Director. The names of the members of the Remuneration and People Committee are set out under Principle 2 and a record of their attendance at meetings of the Committee is set out in the Directors’ Report.
Further information about the Remuneration and People Committee’s activities is provided in the Remuneration Report.
The remuneration of Non-executive Directors is structured separately from that of the Executive Directors and senior executives. Information on remuneration for Non-executive Directors is in the Remuneration Report.
Origin has established a policy which governs dealings in its securities. This precludes any Origin personnel from engaging in short-term dealings in the Company’s securities and margin loans should not be entered into if they could cause a dealing that is in breach of the general insider trading provisions of the Corporations Act or the Policy. Origin personnel are prohibited from entering into hedging transactions which operate to limit the economic risk of any of their unvested equity-based incentives. The Dealing in Securities Policy is available on the Company’s website.
The Code of Conduct, Dealings in Securities Policy and other relevant policies are supported by appropriate training programs and regular updates.
Information referred to in this Corporate Governance Statement as being on the Company’s website may be found at the web address: www.originenergy.com.au under the section ‘About – Investors & Media – Governance’.

82 ORIGIN ENERGY PAGE TITLE 82 NOTES TO THE FINANCIAL STATEMENTS
PRIMARY STATEMENTS Income statement 83Statement of comprehensive income 84 Statement of financial position 85 Statement of changes in equity 86 Statement of cash flows 87 OVERVIEW 88 A RESULTS FOR THE YEAR 90 A1 Segments 90 A2 Income 96 A3 Expenses 96 A4 Results of equity accounted investees 97 A5 Earnings per share 98 A6 Dividends 98 B OPERATING ASSETS AND LIABILITIES 99 B1 Trade and other receivables 99 B2 Exploration, evaluation and development assets 100 B3 Property, plant and equipment 101 B4 Intangible assets 103 B5 Provisions 104 B6 Other financial assets and liabilities 105 C CAPITAL, FUNDING AND RISK MANAGEMENT 106 C1 Interest-bearing liabilities 106 C2 Risk management 107 C3 Capital management 110 C4 Fair value of financial assets and liabilities 111 C5 Hedging and derivatives 114 C6 Share capital and reserves 117 C7 Other comprehensive income 118 D TAXATION 119 D1 Income tax expense 119 D2 Deferred tax 121 E GROUP STRUCTURE 123 E1 Joint arrangements 123 E2 Business combinations 127 E3 Controlled entities 128 E4 Discontinued operations, assets held for sale and disposals 132 F OTHER INFORMATION 134 F1 Contingent liabilities 134 F2 Commitments 135 F3 Share-based payments 135 F4 Related party disclosures 137 F5 Key management personnel 138 F6 Notes to the statement of cash flows 138 F7 Auditors' remuneration 139 F8 Master netting or similar agreements 139 F9 Deed of Cross Guarantee 140 F10 Parent entity disclosures 142 F11 New standards and interpretations not yet adopted 142 F12 Power Purchase Arrangements adjustment 144 F13 Subsequent events 144 DIRECTORS' DECLARATION 145 INDEPENDENT AUDITOR'S REPORT 146
FINANCIAL STATEMENTS
FINANCIAL STATEMENTS

83ORIGIN ENERGY PAGE TITLE 83NOTES TO THE FINANCIAL STATEMENTSINCOME STATEMENT
NOTE2017
$MILLION2016
$MILLION1
CONTINUING OPERATIONS
Revenue A2 13,646 11,456Other income A2 187 41Expenses A3 (13,667) (11,222)Results of equity accounted investees A4 (1,912) (228)Interest income A2 224 222Interest expense A3 (553) (548)
LOSS BEFORE INCOME TAX (2,075) (279)Income tax benefit/(expense) D1 26 (17)
LOSS FOR THE PERIOD FROM CONTINUING OPERATIONS (2,049) (296)
DISCONTINUED OPERATIONS
Loss from discontinued operations E4 (174) (319)
LOSS FOR THE PERIOD (2,223) (615)
(LOSS)/PROFIT FOR THE PERIOD ATTRIBUTABLE TO:
Members of the parent entity (2,226) (628)Non-controlling interests 3 13
LOSS FOR THE PERIOD (2,223) (615)
EARNINGS PER SHARE
Basic earnings per share A5 (126.9) cents (39.8) centsDiluted earnings per share A5 (126.9) cents (39.8) cents(LOSS)/PROFIT FOR THE PERIOD FROM CONTINUING OPERATIONS ATTRIBUTABLE TO:
Members of the parent entity (2,052) (302)Non-controlling interests 3 6
LOSS FOR THE PERIOD (2,049) (296)
EARNINGS PER SHARE FROM CONTINUING OPERATIONS
Basic earnings per share A5 (117.0) cents (19.1) centsDiluted earnings per share A5 (117.0) cents (19.1) cents
1 Certain amounts have been re-presented to separately show those operations classified as discontinued operations and also to reflect adjustments relating to note F12.
The income statement should be read in conjunction with the accompanying notes set out on pages 88 to 144.
INCOME STATEMENT FOR THE YEAR ENDED 30 JUNE
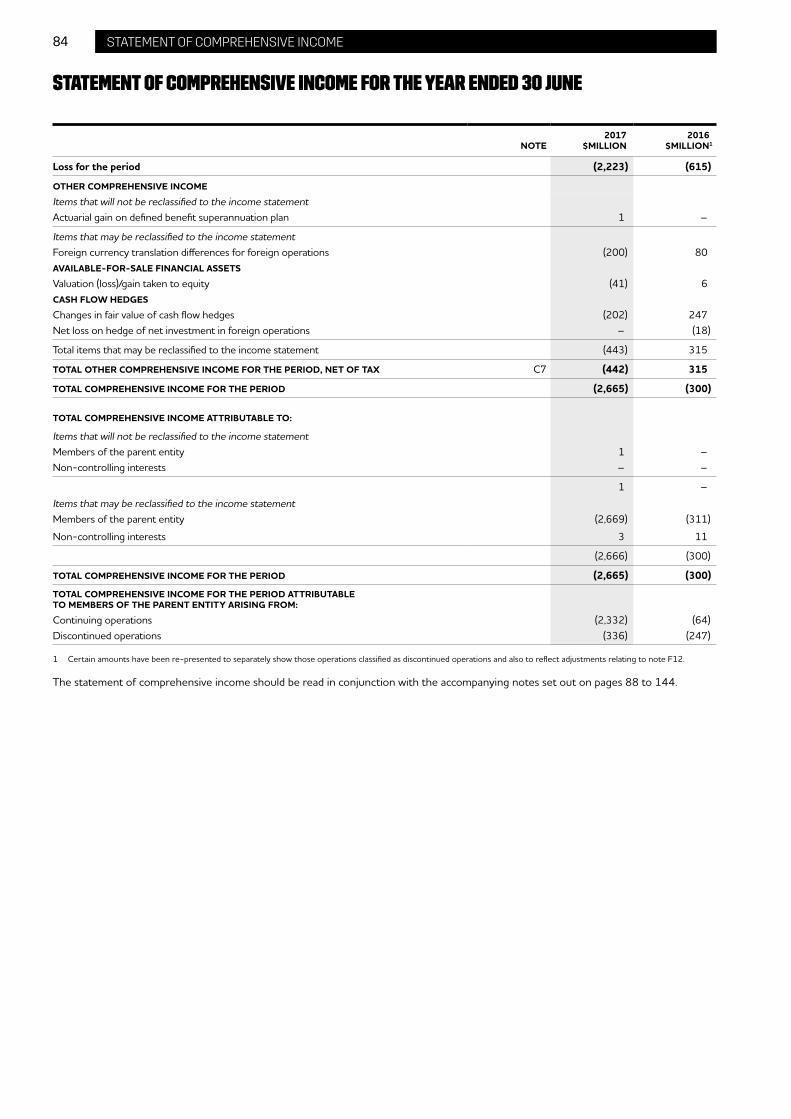
84 ORIGIN ENERGY PAGE TITLE 84 NOTES TO THE FINANCIAL STATEMENTSSTATEMENT OF COMPREHENSIVE INCOME
NOTE2017
$MILLION2016
$MILLION1
Loss for the period (2,223) (615)
OTHER COMPREHENSIVE INCOME
Items that will not be reclassified to the income statementActuarial gain on defined benefit superannuation plan 1 –
Items that may be reclassified to the income statementForeign currency translation differences for foreign operations (200) 80AVAILABLE-FOR-SALE FINANCIAL ASSETS
Valuation (loss)/gain taken to equity (41) 6CASH FLOW HEDGES
Changes in fair value of cash flow hedges (202) 247Net loss on hedge of net investment in foreign operations – (18)
Total items that may be reclassified to the income statement (443) 315
TOTAL OTHER COMPREHENSIVE INCOME FOR THE PERIOD, NET OF TAX C7 (442) 315
TOTAL COMPREHENSIVE INCOME FOR THE PERIOD (2,665) (300)
TOTAL COMPREHENSIVE INCOME ATTRIBUTABLE TO:
Items that will not be reclassified to the income statementMembers of the parent entity 1 –Non-controlling interests – –
1 –
Items that may be reclassified to the income statementMembers of the parent entity (2,669) (311)
Non-controlling interests 3 11
(2,666) (300)
TOTAL COMPREHENSIVE INCOME FOR THE PERIOD (2,665) (300)
TOTAL COMPREHENSIVE INCOME FOR THE PERIOD ATTRIBUTABLE TO MEMBERS OF THE PARENT ENTITY ARISING FROM:
Continuing operations (2,332) (64)Discontinued operations (336) (247)
1 Certain amounts have been re-presented to separately show those operations classified as discontinued operations and also to reflect adjustments relating to note F12.
The statement of comprehensive income should be read in conjunction with the accompanying notes set out on pages 88 to 144.
STATEMENT OF COMPREHENSIVE INCOME FOR THE YEAR ENDED 30 JUNE

85ORIGIN ENERGY PAGE TITLE 85NOTES TO THE FINANCIAL STATEMENTSSTATEMENT OF FINANCIAL POSITION
NOTE2017
$MILLION2016
$MILLION1
AS AT 1 JULY 2015
$MILLION1
CURRENT ASSETS
Cash and cash equivalents 117 146 151Trade and other receivables B1 2,278 1,945 2,085Inventories 138 248 239Derivatives C5 241 237 15Other financial assets B6 86 312 207Income tax receivable – 59 79Assets classified as held for sale E4 2,050 471 5,441Other assets 101 137 104
TOTAL CURRENT ASSETS 5,011 3,555 8,321
NON-CURRENT ASSETS
Trade and other receivables B1 4 3 5Derivatives C5 1,055 1,065 861Other financial assets B6 3,700 4,943 3,553Investments accounted for using the equity method A4 5,463 5,945 6,467Property, plant and equipment (PPE) B3 3,714 5,685 6,505Exploration and evaluation assets B2 858 1,932 1,894Development assets B2 – 292 239Intangible assets B4 5,325 5,366 5,481Deferred tax assets 35 92 38Other assets 34 27 43
TOTAL NON-CURRENT ASSETS 20,188 25,350 25,086
TOTAL ASSETS 25,199 28,905 33,407
CURRENT LIABILITIES
Trade and other payables 1,892 2,048 2,037Payables to joint ventures 130 – –Interest-bearing liabilities C1 133 110 38Derivatives C5 300 18 31Other financial liabilities B6 387 375 156Provision for income tax 52 6 4Employee benefits 184 215 260Provisions B5 56 71 74Liabilities classified as held for sale E4 720 46 2,575
TOTAL CURRENT LIABILITIES 3,854 2,889 5,175
NON-CURRENT LIABILITIES
Trade and other payables 10 68 89Interest-bearing liabilities C1 8,382 9,506 11,839Derivatives C5 1,309 1,637 1,927Employee benefits 35 35 35Provisions B5 191 710 614
TOTAL NON-CURRENT LIABILITIES 9,927 11,956 14,504
TOTAL LIABILITIES 13,781 14,845 19,679
NET ASSETS 11,418 14,060 13,728
EQUITY
Share capital C6 7,150 7,150 4,599Reserves 439 857 576Retained earnings 3,807 6,032 7,117
TOTAL PARENT ENTITY INTEREST 11,396 14,039 12,292Non-controlling interests - Contact Energy – – 1,244Non-controlling interests - other 22 21 192
TOTAL EQUITY 11,418 14,060 13,728
1 Certain amounts have been restated to reflect adjustments relating to note F12.
The statement of financial position should be read in conjunction with the accompanying notes set out on pages 88 to 144.
STATEMENT OF FINANCIAL POSITION AS AT 30 JUNE

86 ORIGIN ENERGY PAGE TITLE 86 NOTES TO THE FINANCIAL STATEMENTSSTATEMENT OF CHANGES IN EQUITY
$MILLIONSHARE
CAPITAL
SHARE-BASED
PAYMENTS RESERVE
FOREIGN CURRENCY
TRANSLATION RESERVE
HEDGING RESERVE
AVAILABLE-FOR-SALE RESERVE
RETAINED EARNINGS
NON-CONTROLLING
INTERESTSTOTAL
EQUITY
BALANCE AS AT 1 JULY 2016 7,150 197 314 321 25 6,032 21 14,060Other comprehensive income (refer to note C7) – – (200) (202) (41) 1 – (442)(Loss)/profit – – – – – (2,226) 3 (2,223)
TOTAL COMPREHENSIVE INCOME FOR THE PERIOD – – (200) (202) (41) (2,225) 3 (2,665)Dividends paid (refer to note A6) – – – – – – (2) (2)Share-based payments – 25 – – – – – 25
TOTAL TRANSACTIONS WITH OWNERS RECORDED DIRECTLY IN EQUITY – 25 – – – – (2) 23
BALANCE AS AT 30 JUNE 2017 7,150 222 114 119 (16) 3,807 22 11,418
BALANCE AS AT 1 JULY 2015 4,599 171 315 71 19 7,548 1,436 14,159Power Purchase Arrangements adjustment, net of tax (refer to note F12) – – – – – (431) – (431)
BALANCE AS AT 1 JULY 2015 (RESTATED)1 4,599 171 315 71 19 7,117 1,436 13,728(Loss)/profit as reported in 2016 financial statements – – – – – (589) 13 (576)Power Purchase Arrangements adjustment, net of tax (refer to note F12) – – – – (39) – (39)
Restated (loss)/profit for the period – – – – – (628) 13 (615)Other comprehensive income (refer to note C7) – – 64 247 6 – (2) 315
TOTAL COMPREHENSIVE INCOME FOR THE PERIOD – – 64 247 6 (628) 11 (300)
Dividends paid (refer to note A6) – – – – – (452) (8) (460)Movement in share capital (refer to note C6) 2,551 – – – – – – 2,551Share-based payments – 32 – – – – – 32Sale of Contact Energy – (6) (65) 3 – – (1,423) (1,491)Transfer within reserves – – – – – (5) 5 –
TOTAL TRANSACTIONS WITH OWNERS RECORDED DIRECTLY IN EQUITY 2,551 26 (65) 3 – (457) (1,426) 632
BALANCE AS AT 30 JUNE 2016 RESTATED1 7,150 197 314 321 25 6,032 21 14,060
1 Certain amounts have been restated to reflect adjustments relating to note F12.
The statement of changes in equity should be read in conjunction with the accompanying notes set out on pages 88 to 144.
STATEMENT OF CHANGES IN EQUITY FOR THE YEAR ENDED 30 JUNE

87ORIGIN ENERGY PAGE TITLE 87NOTES TO THE FINANCIAL STATEMENTSSTATEMENT OF CASH FLOWS
NOTE2017
$MILLION2016
$MILLION
CASH FLOWS FROM OPERATING ACTIVITIES
Cash receipts from customers 15,263 14,040Cash paid to suppliers (14,027) (12,688)
Cash generated from operations 1,236 1,352Income taxes paid, net of refunds received 53 52
NET CASH FROM OPERATING ACTIVITIES F6 1,289 1,404
CASH FLOWS FROM INVESTING ACTIVITIES
Acquisition of PPE (354) (460)Acquisition of exploration and development assets (65) (112)Acquisition of other assets (82) (119)Investment in equity accounted investees (389) (10)Loans to equity accounted investees – (1,544)Interest received from equity accounted investees 218 338Investment in equity accounted investees (funding of APLNG debt service reserve account)1 (127) –Interest received from other parties 1 1Net proceeds from sale of investment in Contact Energy – 1,599Net proceeds from sale of non-current assets 887 118
NET CASH FROM/(USED IN) INVESTING ACTIVITIES 89 (189)
CASH FLOWS FROM FINANCING ACTIVITIES
Proceeds from borrowings 4,017 9,102Repayment of borrowings (4,973) (11,792)Proceeds from share rights issue – 2,496Interest paid (540) (611)Dividends paid by the parent entity – (410)Loan from equity accounted investees1 127 –Dividends paid to non-controlling interests (2) (8)
NET CASH USED IN FINANCING ACTIVITIES (1,371) (1,223)
NET INCREASE/(DECREASE) IN CASH AND CASH EQUIVALENTS 7 (8)CASH AND CASH EQUIVALENTS AT THE BEGINNING OF THE PERIOD 146 155
Effect of exchange rate changes on cash (2) (1)
CASH AND CASH EQUIVALENTS AT THE END OF THE PERIOD2 151 146
1 Relates to cash calls paid by the Group to Australia Pacific LNG, to allow it to meet its project finance Debt Service Reserve Account requirements. These amounts were subsequently loaned back to the Group by Australia Pacific LNG after the provision of a guarantee by the Group. The loan is disclosed as a payable to joint ventures in the statement of financial position.
2 Cash and cash equivalents at the end of the period of $151 million includes $34 million of cash and cash equivalents which are classified as held for sale.
The statement of cash flows should be read in conjunction with the accompanying notes set out on pages 88 to 144.
STATEMENT OF CASH FLOWS FOR THE YEAR ENDED 30 JUNE

88 ORIGIN ENERGY PAGE TITLE 88 NOTES TO THE FINANCIAL STATEMENTS
OVERVIEW
Origin Energy Limited (the Company) is a for-profit company domiciled in Australia. The address of the Company’s registered office is Level 45, Australia Square, 264–278 George Street, Sydney NSW 2000. The nature of the operations and principal activities of the Company and its controlled entities (the Group) are described in the Segment information.
The consolidated general purpose financial statements of the Group for the year ended 30 June 2017 were authorised for issue in accordance with a resolution of the directors on 16 August 2017.
The financial statements:
– have been prepared in accordance with the requirements of the Corporations Act 2001 (Cth), Australian Accounting Standards and other authoritative pronouncements of the Australian Accounting Standards Board (AASB) and International Financial Reporting Standards as issued by the International Accounting Standards Board;
– have been prepared on a historical cost basis, except for derivative financial instruments, environmental scheme certificates, surrender obligations, available-for-sale financial assets and assets and liabilities classified as held for sale that are carried at their fair value; and trade and other receivables that are initially recognised at fair value, and subsequently measured at amortised cost less accumulated impairment losses;
– are presented in Australian dollars;
– are rounded to the nearest million dollars, unless otherwise stated, in accordance with Australian Securities and Investments Commission (ASIC) Corporations (Rounding in Financial/Directors’ Reports) Instrument 2016/191;
– present reclassified comparative information where required for consistency with the current year’s presentation;
– adopt all new and amended Accounting Standards and Interpretations issued by the AASB that are relevant to the operations of the Group and effective for reporting periods beginning on or after 1 July 2016; and
– do not early adopt any Accounting Standards and Interpretations that have been issued or amended but are not yet effective. Refer to note F11 for further details.
NOTES TO THE FINANCIAL STATEMENTS

89ORIGIN ENERGY PAGE TITLE 89NOTES TO THE FINANCIAL STATEMENTS
KEY JUDGEMENTS AND ESTIMATESIn the process of applying the Group’s accounting policies, a number of judgements and estimates have been made. Judgements and estimates which are material to the financial statements are found in the following notes:
– Income (note A2)
– Trade and other receivables (note B1)
– Exploration, evaluation and development assets (note B2)
– Property, plant and equipment (note B3)
– Intangible assets (note B4)
– Provisions (note B5)
– Fair value of financial assets and liabilities (note C4)
– Income tax expense (note D1)
Estimates of recoverable amounts are based on an asset’s value in use or fair value less costs to sell, using a discounted cash flow method. This requires estimates and assumptions to be made about highly uncertain external factors such as future commodity prices, foreign exchange rates, discount rates, the effects of inflation, climate change policies, supply-and-demand conditions, reserves, future operating profiles and production costs.
The recoverable amounts of non-current assets have been assessed at 30 June 2017 based on the types of judgements and estimates described above. Where required, any impairment has been recognised in the income statement.
Errors can arise in respect of recognition, measurement, presentation or disclosure of elements of financial statements. In the case where the Group identifies a material error during the year relating to prior period, the error is corrected retrospectively by restating the comparative amounts for the prior period(s) presented in which the error occurred.
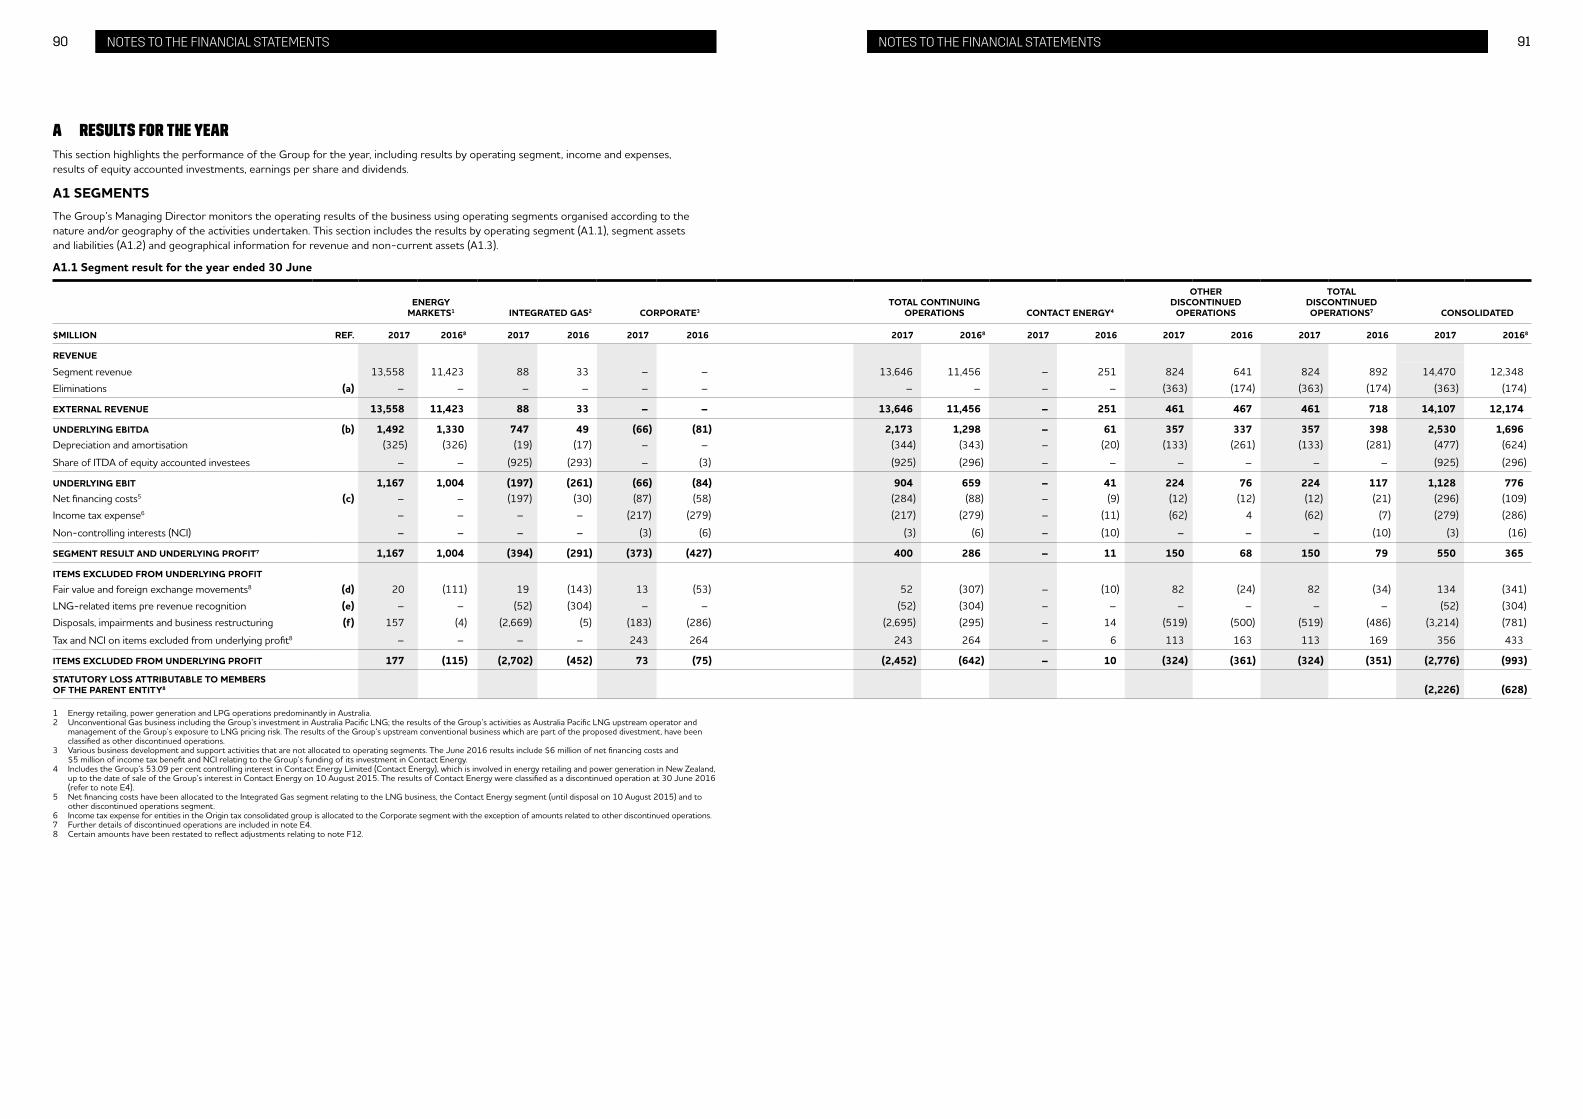
90 91ORIGIN ENERGY PAGE TITLE ORIGIN ENERGY PAGE TITLE 90 91NOTES TO THE FINANCIAL STATEMENTSNOTES TO THE FINANCIAL STATEMENTS
A RESULTS FOR THE YEAR
This section highlights the performance of the Group for the year, including results by operating segment, income and expenses, results of equity accounted investments, earnings per share and dividends.
A1 SEGMENTSThe Group’s Managing Director monitors the operating results of the business using operating segments organised according to the nature and/or geography of the activities undertaken. This section includes the results by operating segment (A1.1), segment assets and liabilities (A1.2) and geographical information for revenue and non-current assets (A1.3).
A1.1 Segment result for the year ended 30 June
ENERGY MARKETS1 INTEGRATED GAS2 CORPORATE3
TOTAL CONTINUING OPERATIONS CONTACT ENERGY4
OTHER DISCONTINUED
OPERATIONS
TOTAL DISCONTINUED OPERATIONS7 CONSOLIDATED
$MILLION REF. 2017 20168 2017 2016 2017 2016 2017 20168 2017 2016 2017 2016 2017 2016 2017 20168
REVENUE
Segment revenue 13,558 11,423 88 33 – – 13,646 11,456 – 251 824 641 824 892 14,470 12,348
Eliminations (a) – – – – – – – – – – (363) (174) (363) (174) (363) (174)
EXTERNAL REVENUE 13,558 11,423 88 33 – – 13,646 11,456 – 251 461 467 461 718 14,107 12,174
UNDERLYING EBITDA (b) 1,492 1,330 747 49 (66) (81) 2,173 1,298 – 61 357 337 357 398 2,530 1,696Depreciation and amortisation (325) (326) (19) (17) – – (344) (343) – (20) (133) (261) (133) (281) (477) (624)
Share of ITDA of equity accounted investees – – (925) (293) – (3) (925) (296) – – – – – – (925) (296)
UNDERLYING EBIT 1,167 1,004 (197) (261) (66) (84) 904 659 – 41 224 76 224 117 1,128 776Net financing costs5 (c) – – (197) (30) (87) (58) (284) (88) – (9) (12) (12) (12) (21) (296) (109)
Income tax expense6 – – – – (217) (279) (217) (279) – (11) (62) 4 (62) (7) (279) (286)
Non-controlling interests (NCI) – – – – (3) (6) (3) (6) – (10) – – – (10) (3) (16)
SEGMENT RESULT AND UNDERLYING PROFIT7 1,167 1,004 (394) (291) (373) (427) 400 286 – 11 150 68 150 79 550 365
ITEMS EXCLUDED FROM UNDERLYING PROFIT
Fair value and foreign exchange movements8 (d) 20 (111) 19 (143) 13 (53) 52 (307) – (10) 82 (24) 82 (34) 134 (341)
LNG-related items pre revenue recognition (e) – – (52) (304) – – (52) (304) – – – – – – (52) (304)
Disposals, impairments and business restructuring (f) 157 (4) (2,669) (5) (183) (286) (2,695) (295) – 14 (519) (500) (519) (486) (3,214) (781)
Tax and NCI on items excluded from underlying profit8 – – – – 243 264 243 264 – 6 113 163 113 169 356 433
ITEMS EXCLUDED FROM UNDERLYING PROFIT 177 (115) (2,702) (452) 73 (75) (2,452) (642) – 10 (324) (361) (324) (351) (2,776) (993)
STATUTORY LOSS ATTRIBUTABLE TO MEMBERS OF THE PARENT ENTITY8 (2,226) (628)
1 Energy retailing, power generation and LPG operations predominantly in Australia.2 Unconventional Gas business including the Group’s investment in Australia Pacific LNG; the results of the Group’s activities as Australia Pacific LNG upstream operator and
management of the Group’s exposure to LNG pricing risk. The results of the Group’s upstream conventional business which are part of the proposed divestment, have been classified as other discontinued operations.
3 Various business development and support activities that are not allocated to operating segments. The June 2016 results include $6 million of net financing costs and $5 million of income tax benefit and NCI relating to the Group’s funding of its investment in Contact Energy.
4 Includes the Group’s 53.09 per cent controlling interest in Contact Energy Limited (Contact Energy), which is involved in energy retailing and power generation in New Zealand, up to the date of sale of the Group’s interest in Contact Energy on 10 August 2015. The results of Contact Energy were classified as a discontinued operation at 30 June 2016 (refer to note E4).
5 Net financing costs have been allocated to the Integrated Gas segment relating to the LNG business, the Contact Energy segment (until disposal on 10 August 2015) and to other discontinued operations segment.
6 Income tax expense for entities in the Origin tax consolidated group is allocated to the Corporate segment with the exception of amounts related to other discontinued operations.7 Further details of discontinued operations are included in note E4.8 Certain amounts have been restated to reflect adjustments relating to note F12.
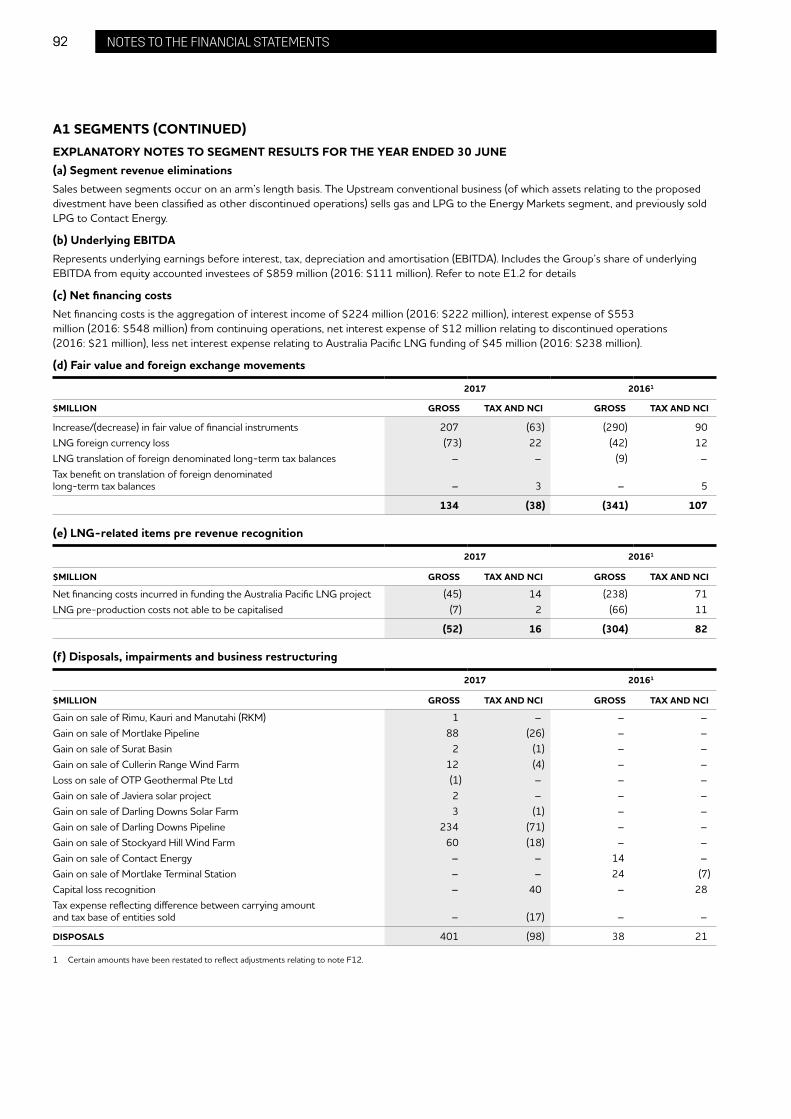
92 ORIGIN ENERGY PAGE TITLE 92 NOTES TO THE FINANCIAL STATEMENTS
A1 SEGMENTS (CONTINUED)EXPLANATORY NOTES TO SEGMENT RESULTS FOR THE YEAR ENDED 30 JUNE(a) Segment revenue eliminationsSales between segments occur on an arm’s length basis. The Upstream conventional business (of which assets relating to the proposed divestment have been classified as other discontinued operations) sells gas and LPG to the Energy Markets segment, and previously sold LPG to Contact Energy.
(b) Underlying EBITDARepresents underlying earnings before interest, tax, depreciation and amortisation (EBITDA). Includes the Group’s share of underlying EBITDA from equity accounted investees of $859 million (2016: $111 million). Refer to note E1.2 for details
(c) Net financing costsNet financing costs is the aggregation of interest income of $224 million (2016: $222 million), interest expense of $553 million (2016: $548 million) from continuing operations, net interest expense of $12 million relating to discontinued operations (2016: $21 million), less net interest expense relating to Australia Pacific LNG funding of $45 million (2016: $238 million).
(d) Fair value and foreign exchange movements
2017 20161
$MILLION GROSS TAX AND NCI GROSS TAX AND NCI
Increase/(decrease) in fair value of financial instruments 207 (63) (290) 90LNG foreign currency loss (73) 22 (42) 12LNG translation of foreign denominated long-term tax balances – – (9) –Tax benefit on translation of foreign denominated long-term tax balances – 3 – 5
134 (38) (341) 107
(e) LNG-related items pre revenue recognition
2017 20161
$MILLION GROSS TAX AND NCI GROSS TAX AND NCI
Net financing costs incurred in funding the Australia Pacific LNG project (45) 14 (238) 71LNG pre-production costs not able to be capitalised (7) 2 (66) 11
(52) 16 (304) 82
(f) Disposals, impairments and business restructuring
2017 20161
$MILLION GROSS TAX AND NCI GROSS TAX AND NCI
Gain on sale of Rimu, Kauri and Manutahi (RKM) 1 – – –Gain on sale of Mortlake Pipeline 88 (26) – –Gain on sale of Surat Basin 2 (1) – –Gain on sale of Cullerin Range Wind Farm 12 (4) – –Loss on sale of OTP Geothermal Pte Ltd (1) – – –Gain on sale of Javiera solar project 2 – – –Gain on sale of Darling Downs Solar Farm 3 (1) – –Gain on sale of Darling Downs Pipeline 234 (71) – –Gain on sale of Stockyard Hill Wind Farm 60 (18) – –Gain on sale of Contact Energy – – 14 –Gain on sale of Mortlake Terminal Station – – 24 (7)Capital loss recognition – 40 – 28Tax expense reflecting difference between carrying amount and tax base of entities sold – (17) – –
DISPOSALS 401 (98) 38 21
1 Certain amounts have been restated to reflect adjustments relating to note F12.

93ORIGIN ENERGY PAGE TITLE 93NOTES TO THE FINANCIAL STATEMENTS
A1 SEGMENTS (CONTINUED)EXPLANATORY NOTES TO SEGMENT RESULTS FOR THE YEAR ENDED 30 JUNE (CONTINUED)(f) Disposals, impairments and business restructuring (continued)
2017 2016
$MILLION GROSS TAX AND NCI GROSS TAX AND NCI
Integrated GasShare of Australia Pacific LNG impairment of non-current assets1 (1,846) – – –Browse Basin (825) 248 – –Assets held for sale (753) 226 – –New Zealand onshore assets – – 30 (9)Cooper Basin – – (111) 34BassGas – – (204) 61Otway Basin – – (236) 70Surat Basin – – 30 (9)CorporateInvestment in Energia Austral SpA (114) – – –IT transformation – – (94) 29Investment in Energia Andina S.A. – – (86) –Investment in OTP Geothermal Pte Ltd – – (20) –
IMPAIRMENTS (3,538) 474 (691) 176
Transaction costs in respect of the Lattice Energy divestment (40) 12 – –Restructure costs (17) 5 (111) 33Corporate transaction costs (20) 6 (12) 3Integration and transformation costs – – (5) 2De-recognition of New Zealand tax losses forecast to be no longer available post divestment – (21) – –Uplift in tax cost base – – – 9
BUSINESS RESTRUCTURING (77) 2 (128) 47
TOTAL DISPOSALS, IMPAIRMENTS AND BUSINESS RESTRUCTURING (3,214) 378 (781) 244
1 As the Group equity accounts for its share of net profit after tax of Australia Pacific LNG the above amount is presented post-tax.

94 95ORIGIN ENERGY PAGE TITLE ORIGIN ENERGY PAGE TITLE 94 95NOTES TO THE FINANCIAL STATEMENTSNOTES TO THE FINANCIAL STATEMENTS
A1 SEGMENTS (CONTINUED)
A1.2 SEGMENT ASSETS AND LIABILITIES AS AT 30 JUNE
ENERGY MARKETS INTEGRATED GAS CORPORATETOTAL CONTINUING
OPERATIONS
CONTACT ENERGY ASSETS AND
LIABILITIES HELD FOR SALE
OTHER ASSETS AND LIABILITIES HELD FOR
SALE
TOTAL ASSETS AND LIABILITIES HELD
FOR SALE2 CONSOLIDATED
$MILLION 2017 20163 2017 2016 2017 2016 2017 20163 2017 2016 2017 2016 2017 2016 2017 20163
ASSETS Segment assets 12,188 12,048 973 4,431 126 118 13,287 16,597 – – 1,696 318 1,696 318 14,983 16,915
Investments accounted for using the equity method (refer to note A4) – – 5,463 5,945 – – 5,463 5,945 – – – 152 – 152 5,463 6,097
Cash, funding related derivatives and tax assets – – 3,609 4,848 790 1,044 4,399 5,892 – – 354 1 354 1 4,753 5,893
TOTAL ASSETS 12,188 12,048 10,045 15,224 916 1,162 23,149 28,434 – – 2,050 471 2,050 471 25,199 28,905
LIABILITIES (3,884) (4,507) – – (720) (46) (720) (46) (4,604) (4,553)
Segment liabilities (2,852) (2,834) (565) (1,293) (467) (380)Financial liabilities, interest-bearing liabilities, funding related derivatives and tax liabilities – – (7,633) (6,905) (1,544) (3,387) (9,177) (10,292) – – – – – – (9,177) (10,292)
TOTAL LIABILITIES (2,852) (2,834) (8,198) (8,198) (2,011) (3,767) (13,061) (14,799) – – (720) (46) (720) (46) (13,781) (14,845)
Acquisitions of non-current assets (includes capital expenditure)1 276 223 396 383 11 15 683 621 – 7 113 25 113 32 796 653
1 The Integrated Gas segment includes $388 million of cash contributions to Australia Pacific LNG. June 2016 cash contributions of $1,544 million to Australia Pacific LNG are not treated as acquisitions as they are accounted for as loans rather than an increase in the Group’s investment.
2 Further details of held for sale amounts are included in note E4.3 Certain amounts have been restated to reflect adjustments relating to note F12. A1.3 GEOGRAPHICAL INFORMATION
Detailed below is revenue based on the location of the customer and non-current assets (excluding derivatives and other financial assets) based on the location of the assets.
2017$MILLION
2016$MILLION
REVENUE FOR THE YEAR ENDED 30 JUNE
Australia 13,515 11,300Other 131 156
REVENUE FROM CONTINUING OPERATIONS 13,646 11,456
Australia 318 335New Zealand 143 383
REVENUE FROM DISCONTINUED OPERATIONS 461 718
TOTAL EXTERNAL REVENUE 14,107 12,174
NON-CURRENT ASSETS AS AT 30 JUNE
Australia 15,359 18,712New Zealand – 495Other 39 43
TOTAL NON-CURRENT ASSETS1 15,398 19,250
1 Excludes amounts which are classified as held for sale at 30 June 2016 and 30 June 2017. Refer to note E4.

96 ORIGIN ENERGY PAGE TITLE 96 NOTES TO THE FINANCIAL STATEMENTS
A2 INCOME2017
$MILLION12016
$MILLION1
INCOME FROM CONTINUING OPERATIONS
Revenue2 13,646 11,456
Net gain on sale of assets 167 25Other 20 16
OTHER INCOME 187 41
Interest earned from other parties 2 2Interest earned on Australia Pacific LNG MRCPS (refer to note E1) 222 220
INTEREST INCOME3 224 222
1 Excludes amounts classified as discontinued operations at 30 June 2016 and 30 June 2017. Refer to note E4.2 Revenue from the sale of oil and gas by the Integrated Gas segment is recognised when title to the commodity passes to the customer. Revenue from the sale of electricity
and gas by the Energy Markets segment is recognised on delivery of the product. Amount excludes revenue from discontinued operations of $461 million (2016: $718 million restated). Note A1 provides segment revenue.
3 Interest income is recognised as it accrues.
KEY ESTIMATE: UNBILLED REVENUEAt the end of each period, the volume of energy supplied since a customer’s last bill is estimated in determining the unbilled revenue included in income. This estimation requires judgement and is based on historical customer consumption and payment patterns.
Related to this are unbilled network expenses for unread gas and electricity meters, which are estimated based on historical customer consumption patterns and accrued at the end of the reporting period. This is recorded within trade and other payables in the statement of financial position.
A3 EXPENSES2017
$MILLION12016
$MILLION1
EXPENSES FROM CONTINUING OPERATIONS
Raw materials and consumables used 11,099 8,952Labour2 618 691Exploration – 53Depreciation and amortisation 344 343Impairment of assets 939 141(Increase)/decrease in fair value of financial instruments5 (125) 256Net foreign exchange loss 75 43Other3 717 743
EXPENSES5 13,667 11,222
Interest charged by other parties 86 56Impact of discounting on long-term provisions 3 4Interest expense related to Australia Pacific LNG funding 464 488
INTEREST EXPENSE 553 548
Financing costs capitalised4 2 64
1 Excludes amounts classified as discontinued operations at 30 June 2016 and 30 June 2017. Refer to note E4.2 Includes contributions to defined contribution superannuation funds from continuing operations of $61 million (2016: $66 million).3 Includes operating lease rental expense of $67 million (2016: $79 million) from continuing operations.4 Financing costs incurred for the construction of a qualifying asset are capitalised while the asset is being constructed or prepared for use at the rate applicable to the
relevant borrowings. Where borrowings are not specific to an asset, financing costs are calculated at an average rate based on the general borrowings of the Group (2017: 4.10 per cent; 2016: 4.40 per cent).
5 Certain comparative amounts have been restated to reflect adjustments relating to note F12.

97ORIGIN ENERGY PAGE TITLE 97NOTES TO THE FINANCIAL STATEMENTS
A4 RESULTS OF EQUITY ACCOUNTED INVESTEES
$MILLION FOR THE YEAR ENDED 30 JUNE 2017
SHARE OF EBITDA
SHARE OF INTEREST, TAX,
DEPRECIATION AND AMORTISATION
(ITDA)SHARE OF NET (LOSS)/PROFIT
Australia Pacific LNG1 (1,778) (134) (1,912)
TOTAL (1,778) (134) (1,912)
Group’s share of Australia Pacific LNG’s items excluded from underlying consolidated profit2 2,637 (791) 1,846
TOTAL EXCLUDING GROUP’S SHARE OF AUSTRALIA PACIFIC LNG’S ITEMS EXCLUDED FROM UNDERLYING CONSOLIDATED PROFIT3 859 (925) (66)
$MILLION FOR THE YEAR ENDED 30 JUNE 2016
Australia Pacific LNG1 62 (287) (225)Other joint venture entities – (3) (3)
TOTAL 62 (290) (228)
Group’s share of Australia Pacific LNG’s items excluded from underlying consolidated profit2 49 (6) 43
TOTAL EXCLUDING GROUP’S SHARE OF AUSTRALIA PACIFIC LNG’S ITEMS EXCLUDED FROM UNDERLYING CONSOLIDATED PROFIT3 111 (296) (185)
EQUITY ACCOUNTED INVESTMENT CARRYING AMOUNT
$MILLIONAS AT 2017 2016
Australia Pacific LNG1 5,463 5,945Other joint venture entities – –
5,463 5,945
1 Australia Pacific LNG’s summary financial information is separately disclosed in note E1.2 Detailed further in note E1.3 Disclosure is provided to enable the reconciliation to share of ITDA of equity accounted investees included in the segment analysis in note A1.
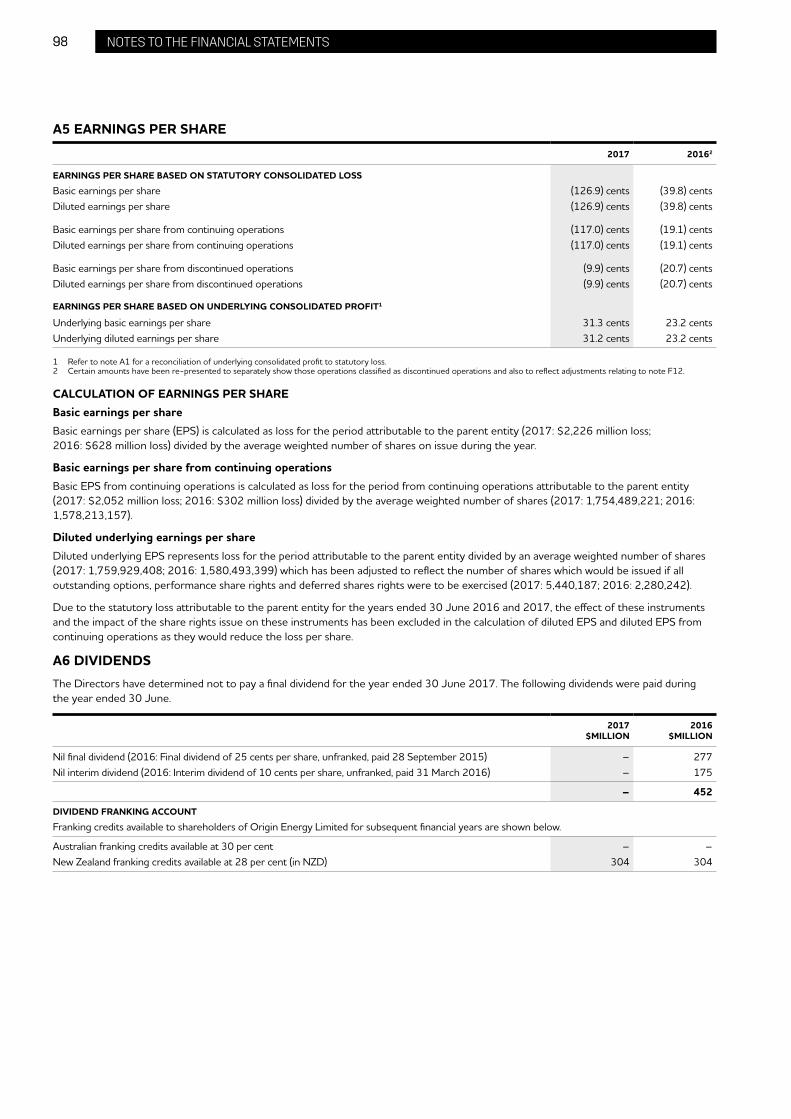
98 ORIGIN ENERGY PAGE TITLE 98 NOTES TO THE FINANCIAL STATEMENTS
A5 EARNINGS PER SHARE
2017 20162
EARNINGS PER SHARE BASED ON STATUTORY CONSOLIDATED LOSS
Basic earnings per share (126.9) cents (39.8) centsDiluted earnings per share (126.9) cents (39.8) cents
Basic earnings per share from continuing operations (117.0) cents (19.1) centsDiluted earnings per share from continuing operations (117.0) cents (19.1) cents
Basic earnings per share from discontinued operations (9.9) cents (20.7) centsDiluted earnings per share from discontinued operations (9.9) cents (20.7) cents
EARNINGS PER SHARE BASED ON UNDERLYING CONSOLIDATED PROFIT1
Underlying basic earnings per share 31.3 cents 23.2 centsUnderlying diluted earnings per share 31.2 cents 23.2 cents
1 Refer to note A1 for a reconciliation of underlying consolidated profit to statutory loss.2 Certain amounts have been re-presented to separately show those operations classified as discontinued operations and also to reflect adjustments relating to note F12.
CALCULATION OF EARNINGS PER SHAREBasic earnings per shareBasic earnings per share (EPS) is calculated as loss for the period attributable to the parent entity (2017: $2,226 million loss; 2016: $628 million loss) divided by the average weighted number of shares on issue during the year.
Basic earnings per share from continuing operationsBasic EPS from continuing operations is calculated as loss for the period from continuing operations attributable to the parent entity (2017: $2,052 million loss; 2016: $302 million loss) divided by the average weighted number of shares (2017: 1,754,489,221; 2016: 1,578,213,157).
Diluted underlying earnings per shareDiluted underlying EPS represents loss for the period attributable to the parent entity divided by an average weighted number of shares (2017: 1,759,929,408; 2016: 1,580,493,399) which has been adjusted to reflect the number of shares which would be issued if all outstanding options, performance share rights and deferred shares rights were to be exercised (2017: 5,440,187; 2016: 2,280,242).
Due to the statutory loss attributable to the parent entity for the years ended 30 June 2016 and 2017, the effect of these instruments and the impact of the share rights issue on these instruments has been excluded in the calculation of diluted EPS and diluted EPS from continuing operations as they would reduce the loss per share.
A6 DIVIDENDSThe Directors have determined not to pay a final dividend for the year ended 30 June 2017. The following dividends were paid during the year ended 30 June.
2017$MILLION
2016$MILLION
Nil final dividend (2016: Final dividend of 25 cents per share, unfranked, paid 28 September 2015) – 277Nil interim dividend (2016: Interim dividend of 10 cents per share, unfranked, paid 31 March 2016) – 175
– 452
DIVIDEND FRANKING ACCOUNT
Franking credits available to shareholders of Origin Energy Limited for subsequent financial years are shown below.
Australian franking credits available at 30 per cent – –New Zealand franking credits available at 28 per cent (in NZD) 304 304

99ORIGIN ENERGY PAGE TITLE 99NOTES TO THE FINANCIAL STATEMENTS
B OPERATING ASSETS AND LIABILITIES
This section provides information on the assets used to generate the Group’s trading performance and the liabilities incurred as a result.
B1 TRADE AND OTHER RECEIVABLESThe following balances are amounts which are due from the Group’s customers.
2017$MILLION
2016$MILLION
CURRENT
Trade receivables net of allowance for impairment 728 632Unbilled revenue net of allowance for impairment 1,193 992Other receivables 357 321
2,278 1,945
NON-CURRENT
Trade receivables 4 3
4 3
Trade and other receivables are initially recorded at the amount billed to customers. Unbilled receivables represent estimated gas and electricity services supplied to customers since their previous bill was issued. Trade and other receivables (including unbilled revenue) reflect the amount anticipated to be collected. The collectability of these balances is assessed on an ongoing basis. When there is evidence that an amount will not be collected, it is provided for, and then if recovery is not possible it is written off. If receivables are subsequently recovered, the amounts are credited against other expenses in the income statement when collected.
The Group’s customers are required to pay in accordance with agreed payment terms. Depending on the customer segment, settlement terms are generally 14 to 30 days from the date of the invoice. Credit approval processes are in place for large customers. All credit and recovery risk associated with trade receivables has been provided for in the statement of financial position.
KEY JUDGEMENTS AND ESTIMATESRecoverability of trade receivables: Judgement is required in determining the level of provisioning for customer debts. Impairment allowances take into account the age of the debt, prevailing economic conditions and historic collection trends.
Unbilled revenue: Unbilled gas and electricity revenue is not collectable until customers’ meters are read and invoices issued. Refer to note A2 for judgement applied in determining the amount of unbilled gas and electricity revenue to recognise.
The average age of trade receivables is 19 days (2016: 18 days). The ageing of trade receivables that were not impaired at 30 June are shown below.
2017$MILLION
2016$MILLION
Not yet due 500 4191–30 days past due 111 9931–60 days past due 46 3261–90 days past due 23 2191 days past due 48 61
728 632
The movement in the allowance for impairment in respect of trade receivables and unbilled revenue during the year is shown below.Balance as at 1 July 87 97Impairment losses recognised 75 67Transfers to held for sale – (2)Amounts written off (52) (75)
BALANCE AS AT 30 JUNE 110 87

100 ORIGIN ENERGY PAGE TITLE 100 NOTES TO THE FINANCIAL STATEMENTS
B2 EXPLORATION, EVALUATION AND DEVELOPMENT ASSETSEXPLORATION AND
EVALUATION ASSETS DEVELOPMENT ASSETS
2017$MILLION
2016$MILLION
2017$MILLION
2016$MILLION
Balance as at 1 July 1,932 1,894 292 239Additions 58 107 – 53Exploration expense – continuing operations – (53) – –Exploration expense – discontinued operations (64) (10) – –Net impairment loss1 (1,068) – – –Transfers to held for sale2 – (9) – –Transfers to PPE – – (292) –Effect of movements in foreign exchange rates – 3 – –
BALANCE AS AT 30 JUNE 858 1,932 – 292
1 Reflects impairment of $243 million (tax benefit $73 million) relating to assets subsequently transferred to held for sale and the Browse Basin exploration asset of $825 million (tax benefit $248 million).
2 Relates to amounts classified as held for sale. Refer to note E4.
The Group holds a number of exploration permits that are grouped into areas of interest according to geographical and geological attributes. Expenditure incurred in each area of interest is accounted for using the successful efforts method. Under this method all general exploration and evaluation costs are expensed as incurred except the direct costs of acquiring the rights to explore, drilling exploratory wells and evaluating the results of drilling. These direct costs are capitalised as exploration and evaluation assets pending the determination of the success of the well. If a well does not result in a successful discovery, the previously capitalised costs are immediately expensed.
The carrying amounts of exploration and evaluation assets are reviewed at each reporting date to determine whether any of the following indicators of impairment are present:
– the right to explore has expired, or will expire in the near future, and is not expected to be renewed;
– further exploration for and evaluation of resources in the specific area is not budgeted or planned;
– the Group has decided to discontinue activities in the area; or
– there is sufficient data to indicate the carrying value is unlikely to be recovered in full from successful development or by sale.
Where an indicator of impairment exists, the asset’s recoverable amount is estimated and an impairment is recognised in the income statement if required.
KEY JUDGEMENT: RECOVERABILITY OF EXPLORATION AND EVALUATION ASSETSAssessment of the recoverability of capitalised exploration and evaluation expenditure requires certain estimates and assumptions to be made as to future events and circumstances, particularly in relation to whether economic quantities of reserves have been discovered. Such estimates and assumptions may change as new information becomes available. If it is concluded that the carrying value of an exploration and evaluation asset is unlikely to be recovered by future exploitation or sale, the relevant amount will be written off to the income statement.
Upon approval of the commercial development of a project, the exploration and evaluation asset is classified as a development asset. Once production commences, development assets are transferred to PPE.

101ORIGIN ENERGY PAGE TITLE 101NOTES TO THE FINANCIAL STATEMENTS
B3 PROPERTY, PLANT AND EQUIPMENT
$MILLION
GENERATION PROPERTY, PLANT AND
EQUIPMENTOTHER LAND
AND BUILDINGS
OTHER PLANT AND
EQUIPMENT
PRODUCING AREAS OF INTEREST
CAPITAL WORK IN PROGRESS TOTAL
2017
Cost 4,392 79 814 – 205 5,490Accumulated depreciation (1,151) (37) (588) – – (1,776)
3,241 42 226 – 205 3,714
BALANCE AS AT 1 JULY 2016 3,327 78 1,274 559 447 5,685Additions 94 – 139 39 66 338Disposals – (9) (150) – (68) (227)Depreciation/amortisation – continuing operations (187) (3) (46) – – (236)Depreciation/amortisation – discontinued operations – – (51) (81) – (132)Net impairment loss1 – (6) (282) (207) (15) (510)Transfers within PP&E 7 – 176 – (183) –Transfers from Development assets – – – 292 – 292Transfers to held for sale2 – (17) (822) (598) (42) (1,479)Effect of movements in foreign exchange rates – (1) (12) (4) – (17)
BALANCE AS AT 30 JUNE 2017 3,241 42 226 – 205 3,714
2016
Cost 4,327 118 2,944 1,850 447 9,686Accumulated depreciation (1,000) (40) (1,670) (1,291) – (4,001)
3,327 78 1,274 559 447 5,685
BALANCE AS AT 1 JULY 2015 3,715 69 1,659 738 324 6,505Additions 92 15 37 155 219 518Disposals (85) – – (1) – (86)Depreciation/amortisation – continuing operations (184) (7) (29) – – (220)Depreciation/amortisation – discontinued operations – – (128) (133) – (261)Net impairment loss1 – – (354) (137) – (491)Transfers within PP&E – 1 86 – (87) –Transfers to held for sale2 (211) – (7) (67) (9) (294)Effect of movements in foreign exchange rates – – 10 4 – 14
BALANCE AS AT 30 JUNE 2016 3,327 78 1,274 559 447 5,685
1 Reflects impairments of $510 million (tax benefit $153 million) relating to assets held for sale at 30 June 2017. Reflects impairments of $204 million (tax benefit $61 million) relating to BassGas assets, impairment of $111 million (tax benefit $34 million) relating to the Cooper Basin
and impairment of $236 million (tax benefit $70 million) relating to the Otway Basin offset by a reversal of prior impairment on the sale of Surat Basin assets of $30 million (tax expense $9 million); and a reversal of prior impairment on New Zealand onshore assets of $30 million (tax expense $9 million) at 30 June 2016.
2 Relates to amounts classified as held for sale. Refer to note E4.
PPE is recorded at cost less accumulated depreciation, depletion, amortisation and impairment charges. Cost includes the estimated future cost of required closure and rehabilitation.
The carrying amounts of assets are reviewed to determine if there is any indication of impairment. If any such indication exists, the asset’s recoverable amount is estimated and if required, an impairment is recognised in the income statement.

102 ORIGIN ENERGY PAGE TITLE 102 NOTES TO THE FINANCIAL STATEMENTS
B3 PROPERTY, PLANT AND EQUIPMENT (CONTINUED)Several different depreciation methodologies are used by the Group. Sub-surface assets relating to producing areas of interest are amortised on a units of production basis. This method applies an average unit depletion cost to current period production. The proved and probable reserves (2P), expenditure to date and an estimate of future development expenditure required to develop those reserves are used to derive the unit depletion cost. Land and capital work in progress are not depreciated. All other assets are depreciated on a straight-line basis over their useful lives.
The range of depreciation rates for the current and comparative period for each class of asset are set out below.
%
Generation PPE 1 – 35Other land and buildings 0 – 10Other plant and equipment 1 – 50Producing areas of interest 1 – 28
At 30 June 2017, the Group reassessed the carrying amounts of its non-current assets for indicators of impairment.
Estimates of recoverable amounts are based on an asset’s value in use or fair value less costs to sell (level 3 fair value hierarchy). The recoverable amount of these assets is most sensitive to those assumptions highlighted in the key judgements and estimates below.
KEY JUDGEMENTS AND ESTIMATES
Recoverability of carrying values: Assets are grouped together into the smallest group of assets that generate largely independent cash inflows (cash generating unit). A Cash Generating Unit’s (CGU) recoverable amount comprises the present value of the future cash flows which will arise from use of the assets. Assessment of a CGU’s recoverable amount requires estimates and assumptions to be made about highly uncertain external factors such as future commodity prices, foreign exchange rates, discount rates, the effects of inflation, climate change policies and the outlook for global or regional market supply-and-demand conditions. In addition, the Group makes estimates and assumptions about reserves, future operating profiles and production costs. Such estimates and assumptions may change as new information becomes available. If it is concluded that the carrying value of a CGU is not likely to be recovered by use or sale, the relevant amount will be written off to the income statement.
Estimation of reserves: Conventional reserves are estimates of the amount of product that can be extracted from an area of interest. A range of assumptions are used to estimate economically recoverable 2P reserves. As the economic assumptions change from period to period, and because additional geological information becomes available during the course of operations, estimates of 2P reserves may change from period to period. These changes could impact the asset carrying values, unit of production depletion calculations, restoration provisions and deferred tax balances. Refer note E1.2 for information regarding Australia Pacific LNG’s unconventional reserve estimation policy.
Estimation of commodity prices: The Group’s best estimate of future commodity prices is made with reference to internally derived forecast data, current spot prices, external market analysts’ forecasts and forward curves. Where volumes are contracted, future prices reflect the contracted price. Future commodity price assumptions impact the recoverability of carrying values and are reviewed at least annually.
Estimation of useful economic lives: A technical assessment of the operating life of an asset requires significant judgement. Useful lives are amended prospectively when a change in those assessments occurs.
Restoration provisions: An asset’s carrying value includes the estimated future cost of required closure and rehabilitation activities. Refer to note B5 for key judgement related to restoration provisions.
Future downhole costs: The depletion and amortisation calculation for producing areas of interest depends in part on the estimated future downhole expenditure required to develop and extract 2P undeveloped reserves. Changes in future downhole expenditure can therefore impact amortisation recognised. Future expenditure estimates have been based on the proposed development profiles for the fields.

103ORIGIN ENERGY PAGE TITLE 103NOTES TO THE FINANCIAL STATEMENTS
B4 INTANGIBLE ASSETS2017
$MILLION2016
$MILLION
Goodwill at cost – Energy Markets 4,827 4,827Software and other intangible assets at cost less impairment losses 1,169 1,123Less: Accumulated amortisation (671) (584)
5,325 5,366
Reconciliations of the carrying amounts of each class of intangible asset are set out below.
$MILLION GOODWILL
SOFTWARE AND OTHER
INTANGIBLES TOTAL
Balance as at 1 July 2016 4,827 539 5,366Additions – 72 72Disposals – (1) (1)Amortisation expense – continuing operations – (108) (108)Amortisation expense – discontinued operations – (1) (1)Transfers to held for sale2 – (3) (3)
BALANCE AS AT 30 JUNE 2017 4,827 498 5,325
BALANCE AS AT 1 JULY 2015 4,815 666 5,481Additions 12 95 107Impairment loss1 – (94) (94)Amortisation expense – continuing operations – (122) (122)Transfers to held for sale2 – (6) (6)
BALANCE AS AT 30 JUNE 2016 4,827 539 5,366
1 During the prior period a decision was made to write-off an organisation-wide IT implementation. As a consequence, an impairment charge of $94 million was recognised in the financial statements which reflects the write-off of the intangible asset relating to this project. The intangible assets relating to this project are allocated across the reportable segments, however the impairment is recorded in the Corporate segment.
2 Relates to amounts classified as held for sale. Refer to note E4.
Goodwill is stated at cost less any accumulated impairment losses and is not amortised. Software and other intangible assets are stated at cost less accumulated amortisation and impairment losses. Amortisation is recognised as an expense on a straight-line basis over the estimated useful lives of the intangible assets.
The average amortisation rate for software and other intangibles (excluding capital work in progress) was 12% (2016: 12%).
KEY JUDGEMENT
Carrying values of assets: Refer to note B3 for key judgement relating to carrying values of assets.
IMPAIRMENT TESTING
The recoverable amount of the Energy Markets goodwill has been determined using a value in use model which includes an appropriate terminal value. The key inputs and assumptions in the calculation of value in use are set out below.
KEY INPUT/ASSUMPTIONS ENERGY MARKETS
Period of cash flow projections Either 40 years, or the life of each Generation asset, based on the Group’s five-year business plan.The Energy Markets business is considered a long-term business and as such projection of long-term cash flows is appropriate for a more accurate forecast. The growth rate used to extrapolate cash flow projections beyond the five year plan is 2.5%.
Customer numbers and customer churn Based on review of actual customer numbers and historical data regarding movements in customer numbers and levels of customer churn. The historical analysis is considered against current and expected market trends and competition for customers.
Gross margin and other operating costs per customer
Based on review of actual gross margins and cost per customer, and consideration of current and expected market movements and impacts.
Discount rate Pre-tax discount rate of 10.3 per cent (2016: 8.5 per cent).

104 ORIGIN ENERGY PAGE TITLE 104 NOTES TO THE FINANCIAL STATEMENTS
B5 PROVISIONS$MILLION RESTORATION OTHER TOTAL
BALANCE AS AT 1 JULY 2016 693 88 781Provisions recognised 67 19 86Provisions released (84) (1) (85)Payments/utilisation (3) (35) (38)Transfers to held for sale1 (496) (1) (497)
BALANCE AS AT 30 JUNE 2017 177 70 247
Current 18 38 56Non-current 159 32 191
177 70 247
1 Relates to amounts classified as held for sale at 30 June 2017. Refer to note E4.
Restoration provisions are initially recognised at the best estimate of the costs to be incurred in settling the obligation. Where restoration activities are expected to occur more than 12 months from the reporting period the provision is discounted using a pre-tax rate that reflects current market assessments of the time value of money.
At each reporting date, the restoration provision is remeasured in line with changes in discount rates, and changes to the timing or amount of the costs to be incurred based on current legal requirements and technology. Any changes in the estimated liability in future periods are added to or deducted from the related asset. The unwinding of the discount is recognised in each period as interest expense.
KEY ESTIMATE: RESTORATION, REHABILITATION AND DISMANTLING COSTSThe Group estimates the cost of future site restoration activities at the time of installation or construction of an asset, or when an obligation arises. Restoration often does not occur for many years and thus significant judgement is required as to the extent of work, cost and timing of future activities.

105ORIGIN ENERGY PAGE TITLE 105NOTES TO THE FINANCIAL STATEMENTS
B6 OTHER FINANCIAL ASSETS AND LIABILITIES
OTHER FINANCIAL ASSETS2017
$MILLION2016
$MILLION
CURRENT
Environmental scheme certificates 58 261Available-for-sale financial assets 28 51
86 312
NON-CURRENT
Available-for-sale financial assets 91 95
Mandatorily Redeemable Cumulative Preference Shares issued by Australia Pacific LNG (refer to note E1)1 3,609 4,848
3,700 4,943
1 The Mandatorily Redeemable Cumulative Preference Shares (MRCPS) were cancelled on 1 July 2016 and replaced with US$2.8 billion of MRCPS and US$0.8 billion capital contribution.
OTHER FINANCIAL LIABILITIES
CURRENT
Environmental scheme surrender obligations 276 270Other financial liabilities 111 105
387 375
Financial assets are recognised (or derecognised) on the date on which the Group commits to purchase (or sell) the asset.
The environmental scheme certificates and surrender obligations are initially recorded at cost. Subsequently, they are recorded at their market price (i.e. fair value) where there is an active market. If there is no active market, certificates continue to be recorded at cost.
Other financial assets are designated as available-for-sale if they do not have fixed maturities and fixed or determinable payments and are intended to be held for the medium to long term.
The Group’s available-for-sale assets are primarily Settlement Residual Agreements.
The Group’s other financial liabilities primarily represent the net amount owed for exchange-traded derivative contracts which have not settled as at 30 June 2017.

106 ORIGIN ENERGY PAGE TITLE 106 NOTES TO THE FINANCIAL STATEMENTS
C CAPITAL, FUNDING AND RISK MANAGEMENT
This section focuses on the Group’s capital structure, and related financing costs. Information is also presented about how the Group manages capital and the various financial risks to which the Group is exposed through its operating and financing activities.
C1 INTEREST-BEARING LIABILITIES2017
$MILLION2016
$MILLION
CURRENT
Bank loans – unsecured 6 8Capital market borrowings – unsecured 126 101
Total current borrowings 132 109Lease liabilities – secured 1 1
TOTAL CURRENT INTEREST-BEARING LIABILITIES 133 110
NON-CURRENT
Bank loans – unsecured 787 726Capital market borrowings – unsecured 7,588 8,772
TOTAL NON-CURRENT BORROWINGS 8,375 9,498Lease liabilities – secured 7 8
TOTAL NON-CURRENT INTEREST-BEARING LIABILITIES 8,382 9,506
Interest-bearing liabilities are initially recorded at the amount of proceeds received (fair value) less transaction costs. After that date the liability is amortised to face value at maturity using an effective interest rate method with any gains or losses recognised in the income statement.
The contractual maturities of non-current borrowings are as set out below.
2017$MILLION
2016$MILLION
One to two years 1,044 137Two to five years 4,773 3,935Over five years 2,558 5,426
TOTAL NON-CURRENT BORROWINGS 8,375 9,498Lease liabilities 7 8
Total non-current interest-bearing liabilities 8,382 9,506
Some of the Group’s borrowings are subject to terms that allow the lender to call on the debt. As at 30 June 2017, these terms had not been triggered.
SIGNIFICANT FUNDING TRANSACTIONSIn October 2016, the Group amended $4.5 billion of syndicated loan facilities to extend the existing maturity by 34 months to October 2021. The interest cost of the bank loan facilities was increased by 0.2 per cent per annum and flexibility was added with increased USD, bank guarantee and letter of credit drawdown capacity.
In October 2015, the Group completed a rights issue of 636,086,881 shares at $4.00 per share. The rights issue was fully underwritten and was completed on 2 October 2015 (Institutional rights offer) and 28 October 2015 (Retail rights offer). The net proceeds from the rights issue of $2.5 billion were used to pay down Group borrowings.

107ORIGIN ENERGY PAGE TITLE 107NOTES TO THE FINANCIAL STATEMENTS
C2 RISK MANAGEMENTThe Group holds or issues financial instruments for the following purposes:
– Funding: used to finance the Group’s operating activities. The principal types of instruments include syndicated bank loans, bank guarantee facilities, senior notes, hybrid securities, cash and short-term deposits;
– Operating: the Group’s day-to-day business activities generate financial instruments such as cash, trade receivables and trade payables; and
– Risk management: to reduce risks arising from the financial instruments described above, the Group holds derivatives such as forward exchange contracts and interest rate swaps (including cross currency). In addition, a range of standard and bespoke financial instruments are held to manage the Group’s exposure to fluctuations in commodity prices.
– A number of these financial instruments are recorded at the value that reflects current market conditions, i.e. at fair value. The Group’s methodology for calculating fair value can be found in note C4.
– These risks are managed under policies approved by the Board of Directors. The key financial risks to which the Group is exposed are explained further in the following sections. They include:
– Credit risk;
– Liquidity risk;
– Market risk (including foreign exchange and price risk); and
– Interest rate risk.
C2.1 CREDIT RISKCredit risk is the risk that a counterparty will not fulfil its financial obligations under a contract or other arrangement. In order to manage credit risk the Group has credit limits which determine the level of exposure that it is prepared to accept with respect to counterparties. The Group is exposed to credit risk through its normal operating activities primarily through customer contracts, financing activities (including Mandatorily Redeemable Cumulative Preference Shares), deposits and the collection risk from arrangements entered into to manage financial risk.
The Group has Board approved credit risk management policies which allocate credit limits to counterparties based on publicly available credit information from recognised providers where available. Credit policies cover exposures generated from the sale of products and the use of derivative instruments. The Group also utilises International Swaps and Derivative Association (ISDA) agreements with all derivative counterparties in order to limit exposure to credit risk through the netting of amounts receivable from and amounts payable to individual counterparties when a counterparty defaults under the terms of the ISDA. Refer note F8.
The carrying amounts of financial assets, which are disclosed in more detail in notes B1, B6 and C5, best represents the Group’s maximum exposure to credit risk at the reporting date. The Group holds no significant collateral as security and there are no other significant credit enhancements in respect of these assets. All financial assets are monitored in order to identify any potential changes in the credit quality.
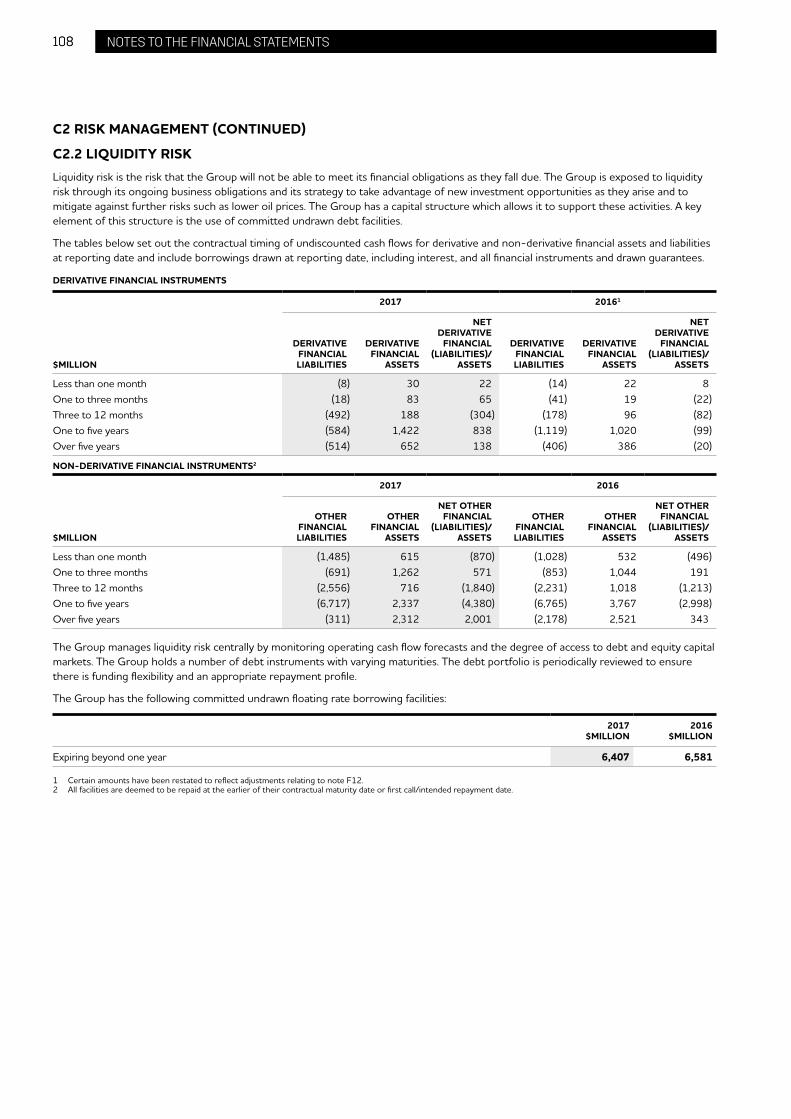
108 ORIGIN ENERGY PAGE TITLE 108 NOTES TO THE FINANCIAL STATEMENTS
C2 RISK MANAGEMENT (CONTINUED)
C2.2 LIQUIDITY RISKLiquidity risk is the risk that the Group will not be able to meet its financial obligations as they fall due. The Group is exposed to liquidity risk through its ongoing business obligations and its strategy to take advantage of new investment opportunities as they arise and to mitigate against further risks such as lower oil prices. The Group has a capital structure which allows it to support these activities. A key element of this structure is the use of committed undrawn debt facilities.
The tables below set out the contractual timing of undiscounted cash flows for derivative and non-derivative financial assets and liabilities at reporting date and include borrowings drawn at reporting date, including interest, and all financial instruments and drawn guarantees.
DERIVATIVE FINANCIAL INSTRUMENTS
2017 20161
$MILLION
DERIVATIVE FINANCIAL LIABILITIES
DERIVATIVE FINANCIAL
ASSETS
NET DERIVATIVE
FINANCIAL (LIABILITIES)/
ASSETS
DERIVATIVE FINANCIAL LIABILITIES
DERIVATIVE FINANCIAL
ASSETS
NET DERIVATIVE
FINANCIAL (LIABILITIES)/
ASSETS
Less than one month (8) 30 22 (14) 22 8One to three months (18) 83 65 (41) 19 (22)Three to 12 months (492) 188 (304) (178) 96 (82)One to five years (584) 1,422 838 (1,119) 1,020 (99)Over five years (514) 652 138 (406) 386 (20)
NON-DERIVATIVE FINANCIAL INSTRUMENTS2
2017 2016
$MILLION
OTHER FINANCIAL LIABILITIES
OTHER FINANCIAL
ASSETS
NET OTHER FINANCIAL
(LIABILITIES)/ASSETS
OTHER FINANCIAL LIABILITIES
OTHER FINANCIAL
ASSETS
NET OTHER FINANCIAL
(LIABILITIES)/ASSETS
Less than one month (1,485) 615 (870) (1,028) 532 (496)One to three months (691) 1,262 571 (853) 1,044 191Three to 12 months (2,556) 716 (1,840) (2,231) 1,018 (1,213)One to five years (6,717) 2,337 (4,380) (6,765) 3,767 (2,998)Over five years (311) 2,312 2,001 (2,178) 2,521 343
The Group manages liquidity risk centrally by monitoring operating cash flow forecasts and the degree of access to debt and equity capital markets. The Group holds a number of debt instruments with varying maturities. The debt portfolio is periodically reviewed to ensure there is funding flexibility and an appropriate repayment profile.
The Group has the following committed undrawn floating rate borrowing facilities:
2017$MILLION
2016$MILLION
Expiring beyond one year 6,407 6,581
1 Certain amounts have been restated to reflect adjustments relating to note F12.2 All facilities are deemed to be repaid at the earlier of their contractual maturity date or first call/intended repayment date.

109ORIGIN ENERGY PAGE TITLE 109NOTES TO THE FINANCIAL STATEMENTS
C2 RISK MANAGEMENT (CONTINUED)
C2.3 FOREIGN EXCHANGE (FX) RISKFX risk is the risk that fluctuations in exchange rates will impact the Group’s result. FX risk arises from future commercial transactions (including interest payments and principal debt repayments on foreign currency long-term borrowings, the sale and purchase of oil and gas, LPG, LNG and the purchase of capital equipment), the recognition of assets and liabilities (including foreign receivables and borrowings) and net investments in foreign operations. The Group is mainly exposed to fluctuations in the US dollar and the Euro through its operations (both overseas and in Australia), its financing facilities and through arrangements put in place to manage risk.
As at 30 June 2017, after hedging, the Group is exposed to FX risk on receivables of US$553 million (A$719 million). As at 30 June 2016, after hedging, the Group was exposed to FX risk on borrowings of US$2,247 million (A$3,021 million).
To manage FX risk the Group uses forward foreign exchange contracts and cross-currency interest rate swaps (both fixed-to-fixed and fixed-to-floating). In certain circumstances borrowings are left in the foreign currency, or hedged from one currency to another, to match payments of interest and principal against expected future business cash flows in that currency.
The Group has certain investments in foreign operations whose net assets are exposed to FX translation risk. This currency exposure is managed primarily by borrowing in the currency to which the foreign operation is exposed.
Significant transactions undertaken in the normal course of operations which are denominated in a foreign currency are managed on a case-by-case basis.
The table below shows the impact of a 10 per cent change in FX rates (holding all other things constant) on profit and equity based solely on the Group’s borrowings and related financial instruments (excluding debt designated as a net investment hedge) existing at the reporting date but does not take into account any mitigating actions that management might take if the rate change occurred.
IMPACT ON POST-TAX PROFIT IMPACT ON EQUITY
$MILLION INCREASE DECREASE INCREASE DECREASE
2017
US dollar (65) 69 (74) 79Euro1 9 (9) 17 (17)
2016
US dollar 189 (184) 156 (151)Euro1 (5) 5 (12) 12
1 Exposure to Euro is a result of ineffectiveness of some fair value hedges that are swapped in AUD.
C2.4 COMMODITY PRICE RISKCommodity price risk is the risk that fluctuations in commodity prices will impact the Group’s result. The Group is exposed to fluctuations in prices of electricity, oil, gas and environmental scheme certificates.
To manage its price risks the Group utilises a range of financial and derivative instruments including fixed-price swaps, options, futures and fixed price forward purchase contracts. Refer to note C5. The policy for managing price risk permits the active hedging of price and volume exposures within prescribed limits. The full hedge portfolio is tested on an ongoing basis against these limits.
The table below shows the impact of a 10 per cent change in commodity prices (holding all other things constant) on profit and equity based solely on the Group’s hedged and unhedged price exposures existing at the reporting date but does not take into account any mitigating actions that management might take if the price change occurred.
IMPACT ON POST-TAX PROFIT IMPACT ON EQUITY
$MILLION INCREASE DECREASE INCREASE DECREASE
2017
Electricity forward price 202 (202) 238 (238)Oil forward prices 9 (2) 28 (21)Environmental scheme certificate prices 25 (25) 25 (25)
2016
Electricity forward price1 95 (95) 113 (113)Oil forward prices – – 28 (28)Environmental scheme certificate prices 32 (32) 32 (32)
1 Certain amounts have been restated to reflect adjustments relating to note F12.

110 ORIGIN ENERGY PAGE TITLE 110 NOTES TO THE FINANCIAL STATEMENTS
C2 RISK MANAGEMENT (CONTINUED)
C2.5 INTEREST RATE RISKInterest rate risk is the risk that fluctuations in interest rates affect the Group’s results. Borrowings issued at variable interest rates expose the Group to cash flow interest rate risk. Borrowings issued at fixed rates expose the Group to fair value interest rate risk.
The exposure of the Group’s borrowings (excluding lease liabilities), after hedging, to interest rate changes and the contractual repricing periods at the reporting date are set out below.
2017$MILLION
2016$MILLION
Variable rate borrowings 2,838 3,403Fixed interest rate – repricing datesSix months or less 1,900 900Six to twelve months 742 –One to five years 2,695 4,298Over five years 332 1,006
8,507 9,607
The Group’s risk management policy is to manage interest rate exposures using Profit at Risk and Value at Risk methodologies. Exposure limits are set to ensure that the Group is not exposed to excess risk from interest rate volatility.
The Group manages its cash flow interest rate risk by entering into fixed-rate interest rate swap contracts and fixed-rate debt securities, with rates ranging between 2.25 per cent to 7.91 per cent per annum, at a weighted average rate of 5.29 per cent per annum (2016: 2.25 per cent to 7.91 per cent per annum, at a weighted average rate of 5.14 per cent per annum). Such interest rate swaps have the economic effect of converting borrowings from floating to fixed rates.
The Group manages its fair value interest rate risk by using fixed-to-floating interest rate swaps. Where possible these are designated to hedge the interest rate costs associated with underlying debt obligations.
The table below shows the effect on profit and equity if interest rates had been 100 basis points higher or lower based on the relevant interest rate yield curve applicable to the underlying currency of the Group’s interest-bearing assets and liabilities. All other variables have been held constant and the impact of any mitigating actions that management might take if the rate change occurred have not been taken into account.
IMPACT ON POST-TAX PROFIT IMPACT ON EQUITY
$MILLION INCREASE DECREASE INCREASE DECREASE
2017
Interest rates 8 (13) 5 (10)
2016
Interest rates 15 (20) 14 (19)
C3 CAPITAL MANAGEMENTThe Group’s objectives when managing capital are to safeguard the ability to continue as a going concern, so that it can continue to provide returns for shareholders and benefits for other stakeholders, and to maintain an optimal capital structure to reduce the cost of capital.
To maintain or adjust the capital structure, the Group monitors its current and future funding requirements for at least the next five years and regularly assesses a range of funding alternatives to meet these requirements in advance of when the funds are required.
Key factors considered in determining the Group’s capital structure and funding strategy at any point in time include expected operating cash flows, capital expenditure plans, maturity profile of existing debt facilities, dividend policy and the ability to access funding from banks, capital markets, and other sources.
The Group monitors its capital requirements through a number of metrics including the gearing ratio. This ratio is calculated as adjusted net debt divided by total capital. Net debt is adjusted to take into account the effect of FX hedging transactions on the Group’s foreign currency debt obligations. The Group maintains a gearing ratio designed to optimise the cost of capital while providing flexibility to fund growth opportunities.
The Group also monitors various other credit metrics including funds from operations to net adjusted debt and EBITDA to interest expense.

111ORIGIN ENERGY PAGE TITLE 111NOTES TO THE FINANCIAL STATEMENTS
C3 CAPITAL MANAGEMENT (CONTINUED)
2017$MILLION
2016$MILLION
Total interest-bearing liabilities 8,515 9,616Less: Cash and cash equivalents (151) (146)
Net debt 8,364 9,470Fair value adjustments on FX hedging transactions (253) (339)
Adjusted net debt 8,111 9,131Total equity1 11,418 14,060
Total capital1 19,529 23,191Gearing ratio 42% 39%
1 Certain amounts have been restated to reflect adjustments relating to note F12.
C4 FAIR VALUE OF FINANCIAL ASSETS AND LIABILITIESThe following table summarises the methods that are used to estimate the fair value of the Group’s financial instruments.
INSTRUMENT FAIR VALUE METHODOLOGY
Financial instruments traded in active markets
Quoted market prices at reporting date.
Forward foreign exchange contracts
Present value of expected future cash flows using quoted forward exchange rates.
Commodity option contracts which are regularly traded
Most recent available transaction prices for same or similar instruments.
Long-term debt and other financial assets
Quoted market prices, dealer quotes for similar instruments, or present value of estimated future cash flows.
Commodity swaps and non-exchange traded futures
Present value of expected future cash flows using market forward prices.
Interest rate swaps and cross currency interest rate swaps
Present value of expected future cash flows of these instruments. Key variables include market pricing data, discount rates and credit risk of the Group or counterparty where relevant. Variables reflect those which would be used by market participants to execute and value the instruments.
Structured electricity derivatives which are not regularly traded and with no observable market price
The valuation models for long-term electricity derivatives reflect the fair value of the avoided costs of construction of the physical assets which would be required to achieve an equivalent risk management outcome for the Group. The methodology takes into account all relevant variables including forward commodity prices, physical generation plant variables, the risk-free discount rate and related credit adjustments, and asset lives. The valuation models for short-term electricity derivatives include premiums for lack of volume in the market relative to the size of the instruments being valued.
Power purchase arrangement electricity derivatives
The discounted cash flow methodology reflects the difference in the contract price and long term forecast electricity pool prices which are not observable in the market. The valuation also requires estimation of forecast electricity volumes, the risk-free discount rate and related credit adjustments.
Oil forward structured derivative instrument
Valued with reference to the observable market oil forward prices, foreign exchange rates and discount rates. As a result of the structured nature of the instrument, certain risk premium and credit variables utilised in the valuation model are unobservable.
Commodity option contracts which are not regularly traded
Valued using an established pricing model (such as Monte Carlo or Black-Scholes) to generate potential future cash flow outcomes over the period covered by the option contract. Variables reflect those which would be used by market participants to value the option including commodity price and foreign exchange data, the risk-free discount rate and related credit adjustments.
Valuation methodologies are determined based on the nature of the underlying instrument. To the maximum extent possible, valuations are based on assumptions which are supported by independent and observable market data. Where valuation models are used, instruments are discounted at the market interest rate applicable to the instrument.
KEY ESTIMATE: FAIR VALUETo estimate the fair value of financial assets and financial liabilities, the Group uses a variety of methods (outlined in the table above) and makes assumptions based on market conditions which exist at each reporting date.

112 ORIGIN ENERGY PAGE TITLE 112 NOTES TO THE FINANCIAL STATEMENTS
C4 FAIR VALUE OF FINANCIAL ASSETS AND LIABILITIES (CONTINUED)The following table provides information about the reliability of the inputs used in determining the fair value of financial assets and liabilities carried at fair value. The three levels in the hierarchy reflect the level of independent observable market data used in determining the fair values and are defined as follows:
– Level 1: quoted prices (unadjusted) in active markets for identical instruments.
– Level 2: other valuation methods for which all inputs that have a significant impact on fair value are observable, either directly (as prices) or indirectly (derived from prices).
– Level 3: one or more key inputs for the instrument are not based on observable market data (unobservable inputs).
$MILLION NOTE LEVEL 1 LEVEL 2 LEVEL 3 TOTAL
2017
Derivative financial assets C5 116 882 298 1,296Environmental scheme certificates B6 58 – – 58Available-for-sale financial assets B6 119 – – 119
FINANCIAL ASSETS CARRIED AT FAIR VALUE 293 882 298 1,473
Derivative financial liabilities C5 (16) (842) (751) (1,609)Environmental scheme surrender obligations B6 (276) – – (276)
FINANCIAL LIABILITIES CARRIED AT FAIR VALUE (292) (842) (751) (1,885)
$MILLION NOTE LEVEL 1 LEVEL 2 LEVEL 3 TOTAL
20161
Derivative financial assets C5 115 937 250 1,302Environmental scheme certificates B6 261 – – 261Available-for-sale financial assets B6 146 – – 146
FINANCIAL ASSETS CARRIED AT FAIR VALUE 522 937 250 1,709
Derivative financial liabilities C5 (3) (717) (935) (1,655)Environmental scheme surrender obligations B6 (270) – – (270)
FINANCIAL LIABILITIES CARRIED AT FAIR VALUE (273) (717) (935) (1,925)
The following table shows a reconciliation of movements in the value of instruments included in Level 3 of the fair value hierarchy.
$MILLION
BALANCE AS AT 1 JULY 20161 (685)Net gain recognised in other comprehensive income 13Net loss realised in revenue line (26)Net loss realised in cost of sales (229)Net gain from financial instruments at fair value 145Cash settlements on existing instruments 327New instruments in the period 2
BALANCE AS AT 30 JUNE 2017 (453)
1 Certain amounts have been restated to reflect adjustments relating to note F12.

113ORIGIN ENERGY PAGE TITLE 113NOTES TO THE FINANCIAL STATEMENTS
C4 FAIR VALUE OF FINANCIAL ASSETS AND LIABILITIES (CONTINUED)The following is a summary of the main inputs and assumptions used by the Group in measuring the fair value of level 3 financial instruments.
Discount rates: Based on observable market rates for risk-free instruments of the appropriate term.
Credit adjustments: Applied to the discount rate depending on the asset/liability position of a financial instrument to reflect the risk of default by either the Group or a specific counterparty. Where a counterparty specific credit curve is not observable, an estimated curve is applied which takes into consideration the credit rating of the counterparty and its industry.
Forward commodity prices: Including both observable external market data and internally derived forecast data. For oil derivatives, internally derived data principally relates to the forward price path for Japanese Customs-cleared Crude (JCC) which is not readily observable in the market. The forward curve for JCC is inferred from the observable Brent oil forward curve. For certain long term electricity derivatives, internally derived forecast spot pool prices and renewable energy certificate prices are applied as market prices are not readily observable for the corresponding term.
Physical generation plant variables: Variables which would be used in the valuation of physical generation assets with equivalent risk management outcomes including new build capital costs, operating costs and plant efficiency factors. For derivatives related to renewable generation, further assumptions are applied to forecast generation volumes over the life of the instrument.
Liquidity premiums: Applied to allow for the lack of volume in the market relative to the size of the instruments being valued.
Strike premiums: Applied to allow for instances where instruments have different strike prices to those associated with instruments which have observable market prices.
The use of different methodologies or assumptions could lead to different measurements of fair value. For fair value measurements in Level 3, a 10 per cent increase or decrease in the unobservable assumptions would have the following effects:
2017 20161
IMPACT ON POST-TAX PROFIT IMPACT ON POST-TAX PROFIT
$MILLION INCREASE DECREASE INCREASE DECREASE
Electricity derivative assets 130 (130) 55 (55)Electricity derivative liabilities 138 (138) 112 (112)Oil derivative assets (1) 1 (5) 14
1 Certain amounts have been restated to reflect adjustments relating to note F12.
GAINS/(LOSSES) ON INITIAL RECOGNITION OF FINANCIAL INSTRUMENTSAny differences between the fair value at initial recognition (transaction price) and the amount that would be determined at that date using the relevant valuation technique are deferred in the statement of financial position and recognised in the income statement over the life of the instrument. The following has been recognised during the year.
2017$MILLION
DERIVATIVE ASSETS
Opening balance – gain 72Change in classification 83Recognised in the income statement (38)New instruments in the period 416
Closing balance – gain 533
DERIVATIVE LIABILITIES
Opening balance – gain 282Change in classification (83)Recognised in the income statement (7)New instruments in the period 182
Closing balance – gain 374

114 ORIGIN ENERGY PAGE TITLE 114 NOTES TO THE FINANCIAL STATEMENTS
C4 FAIR VALUE AND FINANCIAL ASSETS AND LIABILITIES (CONTINUED)Except as noted below, the carrying amounts of financial assets and liabilities are reasonable approximations of their fair values.
The Group has the following non-current financial instruments which are not measured at fair value in the statement of financial position.
FAIR VALUE HIERARCHY LEVEL CARRYING VALUE FAIR VALUE
2017 $MILLION
2016$MILLION
2017$MILLION
2016$MILLION
ASSETS
Other financial assets 2 3,609 4,848 3,115 5,128
LIABILITIES
Bank loans – unsecured 2 787 726 744 764Capital markets borrowings – unsecured 2 7,588 8,772 7,959 8,642
8,375 9,498 8,703 9,406
The fair value of these financial instruments reflect the present value of estimated future cash flows of the instrument. Key variables used to determine the present value include:
– market pricing data (for the relevant underlying interest rates, foreign exchange rates or commodity prices);
– discount rates; and
– the credit risk of the Group or counterparty where appropriate.
For these instruments, each of these variables is taken from observed market pricing data at the valuation date and therefore these variables represent those which would be used by market participants to execute and value the instruments.
C5 HEDGING AND DERIVATIVESThe Group is exposed to risk from movements in foreign exchange and interest rates, and electricity and oil prices. As part of the risk management strategy set out in note C2, the Group holds the following types of derivative instruments:
ASSETS LIABILITIES
2017$MILLION
2016$MILLION1
2017$MILLION
2016$MILLION1
CURRENT
Interest rate swaps – – – (2)Cross-currency interest rate swaps – 7 (229) –Forward foreign exchange contracts – – (1) (1)Electricity derivatives 184 185 (58) (10)Oil derivatives 55 45 (12) (5)Other commodity derivatives 2 – – –
241 237 (300) (18)
NON-CURRENT
Interest rate swaps – – (8) (35)Cross-currency interest rate swaps 597 738 (74) (347)Forward foreign exchange contracts – – (300) (286)Electricity derivatives 451 317 (621) (688)Oil derivatives 5 9 (303) (281)Other commodity derivatives 2 1 (3) –
1,055 1,065 (1,309) (1,637)
TOTAL 1,296 1,302 (1,609) (1,655)
1 Certain amounts have been restated to reflect adjustments relating to note F12.

115ORIGIN ENERGY PAGE TITLE 115NOTES TO THE FINANCIAL STATEMENTS
C5 HEDGING AND DERIVATIVES (CONTINUED)Derivatives are initially recognised at fair value on the date they are entered into and are subsequently remeasured at their fair value. The method of recognising the resulting gain or loss depends on whether the derivative is designated as a hedging instrument, and if so, the nature of the item being hedged. Gains or losses on derivatives which are not designated as hedging instruments are recognised in the income statement and resulted in a $109 million gain in the year ended 30 June 2017 (20161: $254 million loss). This includes an $82 million gain relating to discontinued operations (2016: $10 million loss).
The Group designates certain derivatives as either:
– hedges of the fair value of recognised assets, liabilities or firm commitments (fair value hedge);
– hedges of a particular cash flow risk associated with a recognised asset, liability or highly probable forecast transaction (cash flow hedge); or
– hedges of a net investment in a foreign operation (net investment hedge).
The Group documents at the inception of these transactions the relationship between hedging instruments and hedged items, as well as the risk management objective and strategy for undertaking various hedge transactions. The Group also documents its assessment, both at hedge inception and on an ongoing basis, of whether the derivatives that are used in hedging transactions are highly effective in offsetting changes in fair values or cash flows of hedged items.
The following table shows the fair value of instruments which have been designated as hedging instruments.
ASSETS LIABILITIES
2017$MILLION
2016$MILLION
2017$MILLION
2016$MILLION
Fair value hedges (a) 484 620 34 25Cash flow hedges (b) 351 358 65 298Net investment hedges (c) – – – 1,264
ANALYSIS OF FINANCIAL INSTRUMENTS WHICH HAVE BEEN DESIGNATED AS HEDGING INSTRUMENTS(a) Fair value hedgesThe Group designates certain cross currency interest rate swaps in fair value hedge relationships. Changes in the fair value of these interest swaps are recorded in the income statement, together with any changes in the fair value of the hedged item. If the hedge no longer meets the criteria for hedge accounting, the adjustment to the carrying amount of the hedged item for which the effective interest method is used is amortised to profit and loss over the remaining life using a recalculated effective interest rate.
The changes in the fair values of the hedged items and hedging instruments recognised in the income statement for the year are disclosed in the following table.
2017$MILLION
2016$MILLION
(Loss)/gain on the hedging instruments (145) 189Gain/(loss) on the hedged item attributable to the hedge risk 121 (172)
(24) 17
1 Certain amounts have been restated to reflect adjustments relating to note F12.
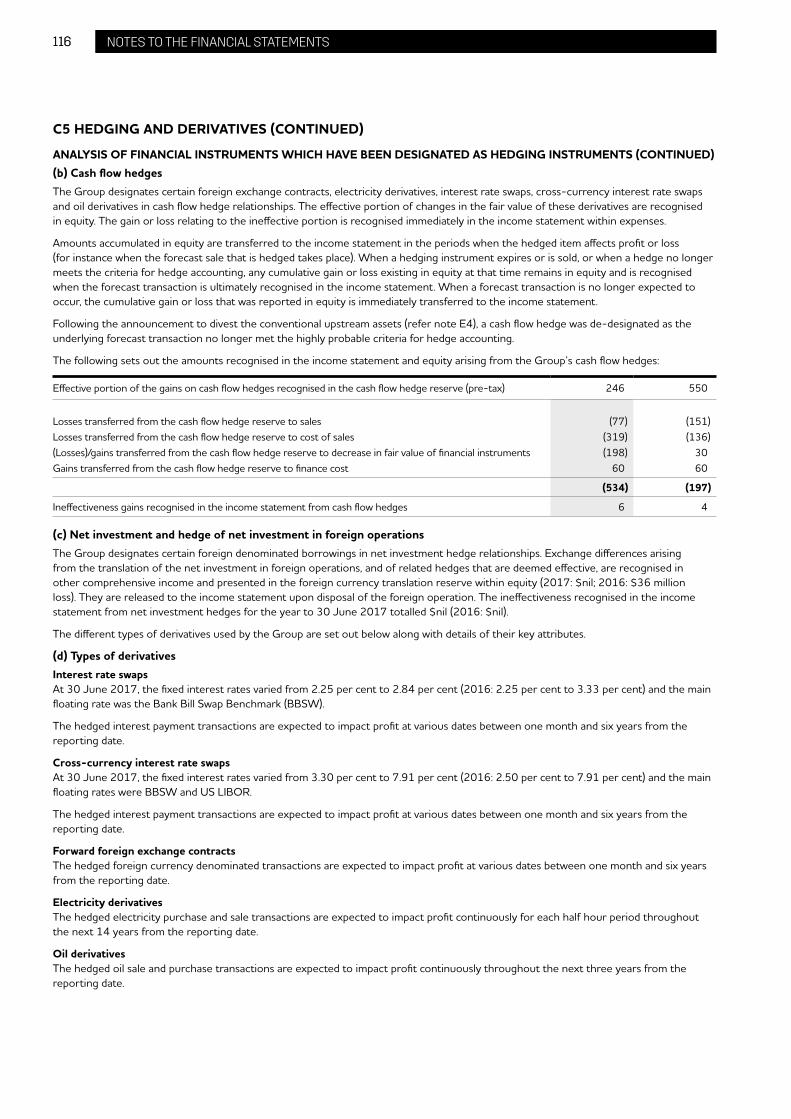
116 ORIGIN ENERGY PAGE TITLE 116 NOTES TO THE FINANCIAL STATEMENTS
C5 HEDGING AND DERIVATIVES (CONTINUED)
ANALYSIS OF FINANCIAL INSTRUMENTS WHICH HAVE BEEN DESIGNATED AS HEDGING INSTRUMENTS (CONTINUED)(b) Cash flow hedgesThe Group designates certain foreign exchange contracts, electricity derivatives, interest rate swaps, cross-currency interest rate swaps and oil derivatives in cash flow hedge relationships. The effective portion of changes in the fair value of these derivatives are recognised in equity. The gain or loss relating to the ineffective portion is recognised immediately in the income statement within expenses.
Amounts accumulated in equity are transferred to the income statement in the periods when the hedged item affects profit or loss (for instance when the forecast sale that is hedged takes place). When a hedging instrument expires or is sold, or when a hedge no longer meets the criteria for hedge accounting, any cumulative gain or loss existing in equity at that time remains in equity and is recognised when the forecast transaction is ultimately recognised in the income statement. When a forecast transaction is no longer expected to occur, the cumulative gain or loss that was reported in equity is immediately transferred to the income statement.
Following the announcement to divest the conventional upstream assets (refer note E4), a cash flow hedge was de-designated as the underlying forecast transaction no longer met the highly probable criteria for hedge accounting.
The following sets out the amounts recognised in the income statement and equity arising from the Group’s cash flow hedges:
Effective portion of the gains on cash flow hedges recognised in the cash flow hedge reserve (pre-tax) 246 550
Losses transferred from the cash flow hedge reserve to sales (77) (151)Losses transferred from the cash flow hedge reserve to cost of sales (319) (136)(Losses)/gains transferred from the cash flow hedge reserve to decrease in fair value of financial instruments (198) 30Gains transferred from the cash flow hedge reserve to finance cost 60 60
(534) (197)
Ineffectiveness gains recognised in the income statement from cash flow hedges 6 4
(c) Net investment and hedge of net investment in foreign operationsThe Group designates certain foreign denominated borrowings in net investment hedge relationships. Exchange differences arising from the translation of the net investment in foreign operations, and of related hedges that are deemed effective, are recognised in other comprehensive income and presented in the foreign currency translation reserve within equity (2017: $nil; 2016: $36 million loss). They are released to the income statement upon disposal of the foreign operation. The ineffectiveness recognised in the income statement from net investment hedges for the year to 30 June 2017 totalled $nil (2016: $nil).
The different types of derivatives used by the Group are set out below along with details of their key attributes.
(d) Types of derivativesInterest rate swapsAt 30 June 2017, the fixed interest rates varied from 2.25 per cent to 2.84 per cent (2016: 2.25 per cent to 3.33 per cent) and the main floating rate was the Bank Bill Swap Benchmark (BBSW).
The hedged interest payment transactions are expected to impact profit at various dates between one month and six years from the reporting date.
Cross-currency interest rate swapsAt 30 June 2017, the fixed interest rates varied from 3.30 per cent to 7.91 per cent (2016: 2.50 per cent to 7.91 per cent) and the main floating rates were BBSW and US LIBOR.
The hedged interest payment transactions are expected to impact profit at various dates between one month and six years from the reporting date.
Forward foreign exchange contractsThe hedged foreign currency denominated transactions are expected to impact profit at various dates between one month and six years from the reporting date.
Electricity derivativesThe hedged electricity purchase and sale transactions are expected to impact profit continuously for each half hour period throughout the next 14 years from the reporting date.
Oil derivativesThe hedged oil sale and purchase transactions are expected to impact profit continuously throughout the next three years from the reporting date.
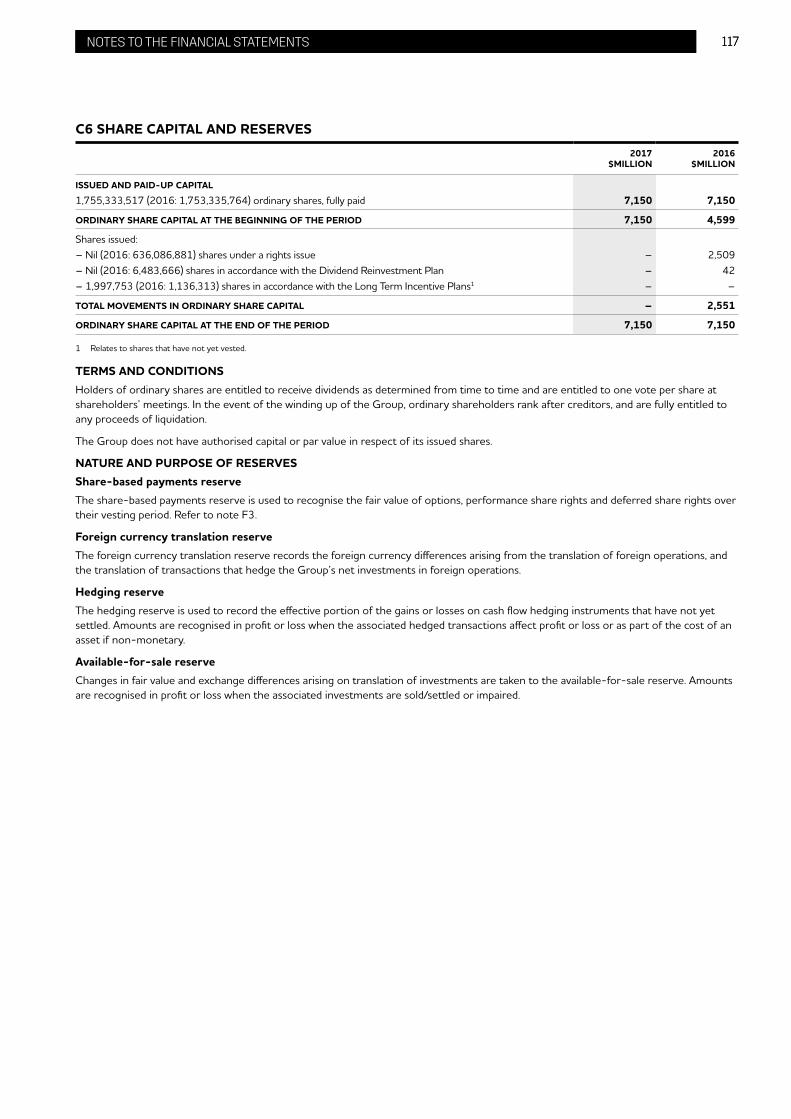
117ORIGIN ENERGY PAGE TITLE 117NOTES TO THE FINANCIAL STATEMENTS
C6 SHARE CAPITAL AND RESERVES2017
$MILLION2016
$MILLION
ISSUED AND PAID-UP CAPITAL
1,755,333,517 (2016: 1,753,335,764) ordinary shares, fully paid 7,150 7,150
ORDINARY SHARE CAPITAL AT THE BEGINNING OF THE PERIOD 7,150 4,599
Shares issued:– Nil (2016: 636,086,881) shares under a rights issue – 2,509– Nil (2016: 6,483,666) shares in accordance with the Dividend Reinvestment Plan – 42– 1,997,753 (2016: 1,136,313) shares in accordance with the Long Term Incentive Plans1 – –
TOTAL MOVEMENTS IN ORDINARY SHARE CAPITAL – 2,551
ORDINARY SHARE CAPITAL AT THE END OF THE PERIOD 7,150 7,150
1 Relates to shares that have not yet vested.
TERMS AND CONDITIONSHolders of ordinary shares are entitled to receive dividends as determined from time to time and are entitled to one vote per share at shareholders’ meetings. In the event of the winding up of the Group, ordinary shareholders rank after creditors, and are fully entitled to any proceeds of liquidation.
The Group does not have authorised capital or par value in respect of its issued shares.
NATURE AND PURPOSE OF RESERVESShare-based payments reserveThe share-based payments reserve is used to recognise the fair value of options, performance share rights and deferred share rights over their vesting period. Refer to note F3.
Foreign currency translation reserveThe foreign currency translation reserve records the foreign currency differences arising from the translation of foreign operations, and the translation of transactions that hedge the Group’s net investments in foreign operations.
Hedging reserveThe hedging reserve is used to record the effective portion of the gains or losses on cash flow hedging instruments that have not yet settled. Amounts are recognised in profit or loss when the associated hedged transactions affect profit or loss or as part of the cost of an asset if non-monetary.
Available-for-sale reserveChanges in fair value and exchange differences arising on translation of investments are taken to the available-for-sale reserve. Amounts are recognised in profit or loss when the associated investments are sold/settled or impaired.
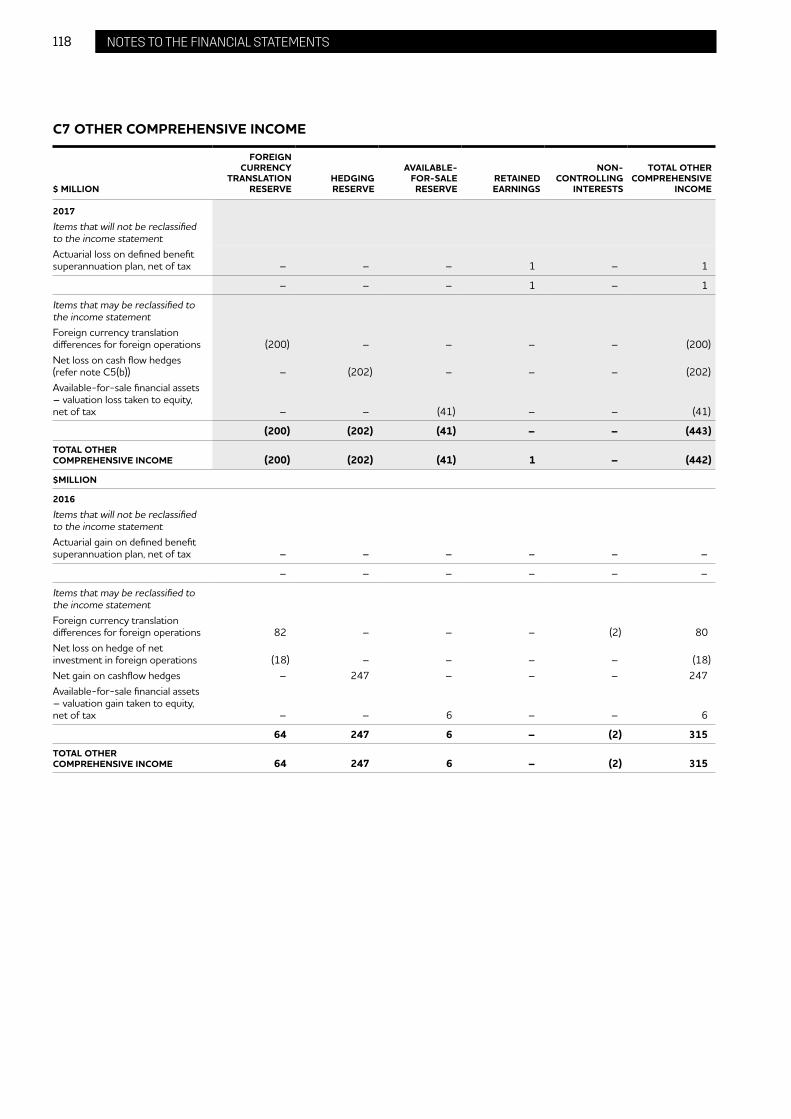
118 ORIGIN ENERGY PAGE TITLE 118 NOTES TO THE FINANCIAL STATEMENTS
C7 OTHER COMPREHENSIVE INCOME
$ MILLION
FOREIGN CURRENCY
TRANSLATION RESERVE
HEDGING RESERVE
AVAILABLE-FOR-SALE RESERVE
RETAINED EARNINGS
NON-CONTROLLING
INTERESTS
TOTAL OTHER COMPREHENSIVE
INCOME
2017
Items that will not be reclassified to the income statementActuarial loss on defined benefit superannuation plan, net of tax – – – 1 – 1
– – – 1 – 1
Items that may be reclassified to the income statementForeign currency translation differences for foreign operations (200) – – – – (200)Net loss on cash flow hedges (refer note C5(b)) – (202) – – – (202)Available-for-sale financial assets – valuation loss taken to equity, net of tax – – (41) – – (41)
(200) (202) (41) – – (443)
TOTAL OTHER COMPREHENSIVE INCOME (200) (202) (41) 1 – (442)
$MILLION
2016
Items that will not be reclassified to the income statementActuarial gain on defined benefit superannuation plan, net of tax – – – – – –
– – – – – –
Items that may be reclassified to the income statementForeign currency translation differences for foreign operations 82 – – – (2) 80Net loss on hedge of net investment in foreign operations (18) – – – – (18)Net gain on cashflow hedges – 247 – – – 247Available-for-sale financial assets – valuation gain taken to equity, net of tax – – 6 – – 6
64 247 6 – (2) 315
TOTAL OTHER COMPREHENSIVE INCOME 64 247 6 – (2) 315

119ORIGIN ENERGY PAGE TITLE 119NOTES TO THE FINANCIAL STATEMENTS
D TAXATION
This section provides details of the Group’s income tax expense, current tax provision and deferred tax balances and the Group’s tax accounting policies.
D1 INCOME TAX EXPENSE2017
$MILLION2016
$MILLION1
INCOME TAX
Current tax expense/(benefit) 77 (13)Deferred tax benefit (158) (116)Under provided in prior years 5 3Tax effect of PPAs adjustment (refer to note F12) – (17)
TOTAL INCOME TAX BENEFIT (76) (143)
INCOME TAX BENEFIT ATTRIBUTABLE TO:
(Loss)/profit from continuing operations (26) 17Loss from discontinued operations (50) (160)
(76) (143)
RECONCILIATION BETWEEN TAX EXPENSE AND PRE-TAX NET PROFIT
Loss from continuing operations before income tax (2,075) (279)Loss from discontinued operations before income tax (224) (479)
(2,299) (758)
Income tax using the domestic corporation tax rate of 30 per cent (2016: 30 per cent)Prima facie income tax expense on pre-tax accounting profit:– at Australian tax rate of 30 per cent (690) (228)– adjustment for difference between Australian and overseas tax rates 5 15
INCOME TAX BENEFIT ON PRE-TAX ACCOUNTING PROFIT AT STANDARD RATES (685) (213)
INCREASE/(DECREASE) IN INCOME TAX EXPENSE DUE TO:
Impairment expense not recoverable 28 23Write-off exploration expense – 13Sale of Contact Energy – (3)Capital loss recognition (40) (30)Recognition of change in net tax loss position 21 –Recognition of cost base on disposal of entities 17 –Reset of tax bases on consolidation of Uranquinty into tax group – (9)Share of results of equity accounted investees 574 65Tax benefit on translation of foreign denominated tax balances (3) (3)Other 7 11
604 67Under provided in prior years 5 3
TOTAL INCOME TAX BENEFIT (76) (143)
DEFERRED TAX MOVEMENTS RECOGNISED DIRECTLY IN OTHER COMPREHENSIVE INCOME (INCLUDING FOREIGN CURRENCY TRANSLATION)
Financial instruments at fair value (103) 98Property, plant and equipment (4) (28)Provisions 2 –Other items – 8
(105) 78
1 Certain amounts have been restated to reflect adjustments relating to note F12.
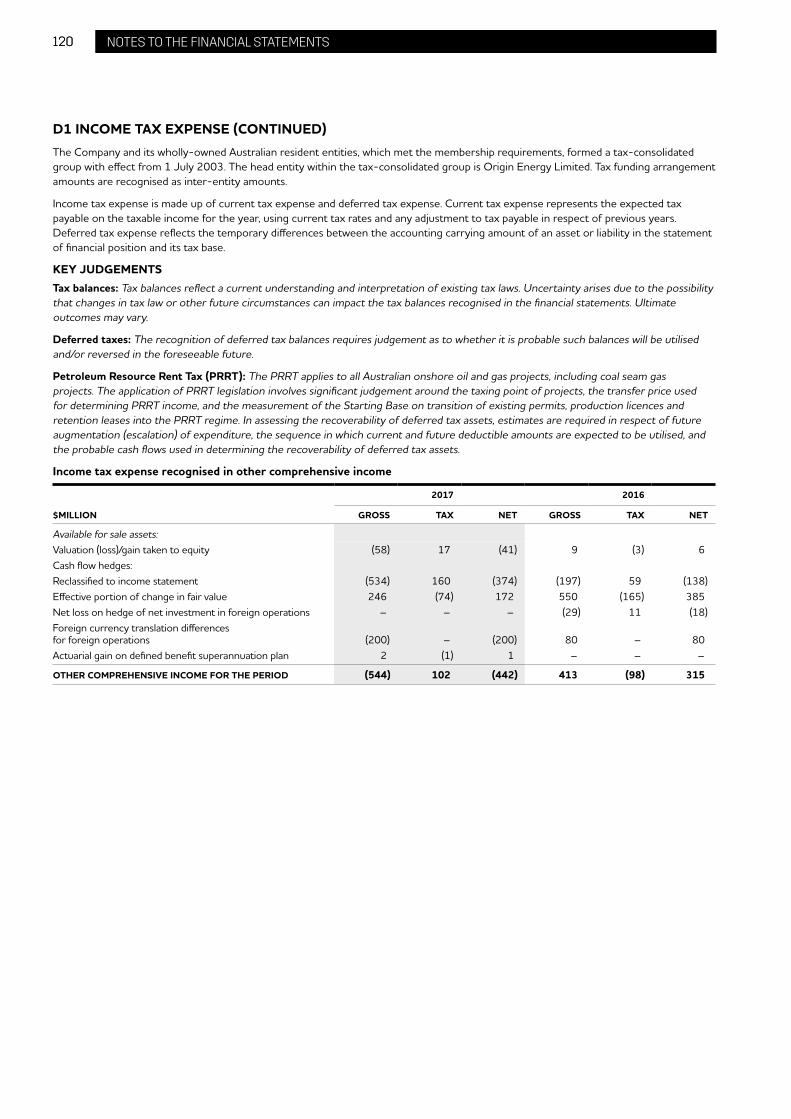
120 ORIGIN ENERGY PAGE TITLE 120 NOTES TO THE FINANCIAL STATEMENTS
D1 INCOME TAX EXPENSE (CONTINUED)The Company and its wholly-owned Australian resident entities, which met the membership requirements, formed a tax-consolidated group with effect from 1 July 2003. The head entity within the tax-consolidated group is Origin Energy Limited. Tax funding arrangement amounts are recognised as inter-entity amounts.
Income tax expense is made up of current tax expense and deferred tax expense. Current tax expense represents the expected tax payable on the taxable income for the year, using current tax rates and any adjustment to tax payable in respect of previous years. Deferred tax expense reflects the temporary differences between the accounting carrying amount of an asset or liability in the statement of financial position and its tax base.
KEY JUDGEMENTSTax balances: Tax balances reflect a current understanding and interpretation of existing tax laws. Uncertainty arises due to the possibility that changes in tax law or other future circumstances can impact the tax balances recognised in the financial statements. Ultimate outcomes may vary.
Deferred taxes: The recognition of deferred tax balances requires judgement as to whether it is probable such balances will be utilised and/or reversed in the foreseeable future.
Petroleum Resource Rent Tax (PRRT): The PRRT applies to all Australian onshore oil and gas projects, including coal seam gas projects. The application of PRRT legislation involves significant judgement around the taxing point of projects, the transfer price used for determining PRRT income, and the measurement of the Starting Base on transition of existing permits, production licences and retention leases into the PRRT regime. In assessing the recoverability of deferred tax assets, estimates are required in respect of future augmentation (escalation) of expenditure, the sequence in which current and future deductible amounts are expected to be utilised, and the probable cash flows used in determining the recoverability of deferred tax assets.
Income tax expense recognised in other comprehensive income
2017 2016
$MILLION GROSS TAX NET GROSS TAX NET
Available for sale assets:Valuation (loss)/gain taken to equity (58) 17 (41) 9 (3) 6Cash flow hedges:Reclassified to income statement (534) 160 (374) (197) 59 (138)Effective portion of change in fair value 246 (74) 172 550 (165) 385Net loss on hedge of net investment in foreign operations – – – (29) 11 (18)Foreign currency translation differences for foreign operations (200) – (200) 80 – 80Actuarial gain on defined benefit superannuation plan 2 (1) 1 – – –
OTHER COMPREHENSIVE INCOME FOR THE PERIOD (544) 102 (442) 413 (98) 315

121ORIGIN ENERGY PAGE TITLE 121NOTES TO THE FINANCIAL STATEMENTS
D2 DEFERRED TAXDeferred tax balances arise when there are temporary differences between accounting carrying amounts and the tax bases of assets and liabilities, other than for the following:
– where the difference arises from the initial recognition of an asset or liability in a transaction that is not a business combination and affects neither the accounting profit nor taxable profit or loss;
– where temporary differences relate to investments in subsidiaries, associates and interests in joint arrangements to the extent the Group is able to control the timing of the reversal of the temporary differences and it is probable that they will not reverse in the foreseeable future; and
– where temporary differences arise on initial recognition of goodwill.
Deferred tax assets and liabilities are measured at the tax rates that are expected to apply to the year when the asset is realised or the liability is settled, based on tax rates and tax laws that have been enacted or substantively enacted at the balance sheet date.
A deferred tax asset is recognised only to the extent that it is probable that future taxable profits will be available against which the asset can be utilised. Deferred tax assets are reduced if it is no longer probable that the related tax benefit will be realised.
Movement in temporary differences during the year
ASSET/(LIABILITY)$MILLION
1 JULY20152
RECOGNISED IN INCOME2
RECOGNISED IN EQUITY
TRANSFERS TO HELD
FOR SALE1
30 JUNE 20162
RECOGNISED IN INCOME
RECOGNISED IN EQUITY
TRANSFERSTO HELD
FOR SALE1
30 JUNE 2017
Accrued expenses not incurred for tax 5 2 – – 7 (4) – – 3Employee benefits 79 (9) – – 70 (1) – (7) 62Acquired environmental scheme certificate purchase obligations 8 (2) – – 6 (2) – – 4Acquired energy purchase obligations 17 (8) – – 9 (7) – – 2Provisions 239 30 – (5) 264 (12) (2) (149) 101Tax value of carry-forward tax losses recognised 138 25 1 – 164 (154) (1) – 9Property, plant and equipment (467) 89 28 (11) (361) 186 4 (249) (420)Exploration and evaluation assets (356) (102) – 15 (443) 273 – 85 (85)Financial instruments at fair value 347 21 (98) – 270 (125) 103 – 248APLNG MRCPS elimination (refer note E1.2) 22 28 – – 50 3 – – 53Business related costs (deductible under s.40-880 ITAA97) 1 20 – – 21 2 – – 23
Other items 5 39 (9) – 35 (1) 1 – 35
NET DEFERRED TAX ASSETS 38 133 (78) (1) 92 158 105 (320) 35
1 Relates to amounts classified as held for sale at 30 June 2016 and 30 June 2017. Refer to note E4.2 Certain amounts have been re-presented to reflect adjustments relating to note F12.

122 ORIGIN ENERGY PAGE TITLE 122 NOTES TO THE FINANCIAL STATEMENTS
D2 DEFERRED TAX (CONTINUED)
UNRECOGNISED DEFERRED TAX ASSETS AND LIABILITIES2017
$MILLION2016
$MILLION
Deferred tax assets have not been recognised in respect of the following items:Revenue losses 53 33Capital losses 2 33Petroleum resource rent tax, net of income tax1 2,459 2,083Acquisition transaction costs 57 57Investment in joint ventures 67 39Intangible assets 8 24
2,646 2,269
Deferred tax liabilities have not been recognised in respect of the following items:Investment in Australia Pacific LNG2 (1,190) (1,817)
(1,190) (1,817)
1 PRRT is considered, for accounting purposes, to be a tax based on income under AASB 112 Income Taxes. Accordingly, any current and deferred PRRT expense is measured and disclosed on the same basis as income tax. The application of PRRT legislation relies on a forecast of future years expenditure in order to determine whether the utilisation of the PRRT base will be required. As the forecast indicates that no utilisation is required, no deferred tax asset has been recognised with respect to PRRT in these financial statements.
2 A deferred tax liability has not been recorded in respect of the investment in Australia Pacific LNG as the Group is able to control the timing of the reversal of the temporary difference through its voting rights and it is not expected that the temporary difference will reverse in the foreseeable future.

123ORIGIN ENERGY PAGE TITLE 123NOTES TO THE FINANCIAL STATEMENTS
E GROUP STRUCTURE
The following section provides information on the Group’s structure and how this impacts the results of the Group as a whole, including details of joint arrangements, controlled entities, transactions with non-controlling interests and changes made to the Group structure during the year.
E1 JOINT ARRANGEMENTSJoint arrangements are those entities over whose activities the Group has joint control, established by contractual agreement and require consent of two or more parties for strategic, financial and operating decisions. The Group classifies its interests in joint arrangements as either joint operations or joint ventures depending on its rights to the assets and obligations for the liabilities of the arrangements.
E1.1 INTERESTS IN JOINT VENTURESInterests in joint ventures are initially recognised at cost and are subsequently adjusted for changes in the Group’s share of the joint venture’s net assets.
OWNERSHIP INTEREST (%)
JOINT VENTURE ENTITY REPORTING DATE COUNTRY OF INCORPORATION 2017 2016
Australia Pacific LNG Pty Ltd1 30 June Australia 37.5 37.5Energia Andina S.A.2 31 December Chile 49.9 49.9Energia Austral SpA3 31 December Chile 34.0 34.0KUBU Energy Resources (Pty) Limited 30 June Botswana 50.0 50.0OTP Geothermal Pte Ltd4 31 December Singapore – 50.0PNG Energy Developments Limited 31 December PNG 50.0 50.0Venn Energy Trading Pte Limited 31 March Singapore 50.0 50.0
1 Australia Pacific LNG is a separate legal entity. Operating, management and funding decisions require the unanimous support of the Foundation Shareholders, which includes the Group and ConocoPhillips. Accordingly, joint control exists and the Group has classified the investment in Australia Pacific LNG as a joint venture.
2 Energia Andina S.A. is a separate legal entity. Key decisions require super majority (four directors) approval, with the Group entitled to appoint two of the five directors. As a consequence joint control exists and the Group has classified the investment as a joint venture.
3 Energia Austral SpA is a separate legal entity. Key decisions require super majority (four directors) approval, with the Group entitled to appoint two of the five directors. As a consequence joint control exists and the Group has classified the investment as a joint venture. The Group’s ownership interest can change between reporting periods when equity contributions are made to the joint venture.
4 OTP Geothermal Pte Ltd is a separate legal entity. On 16 August 2016, the Group sold its interest in OTP Geothermal Pte Ltd.

124 ORIGIN ENERGY PAGE TITLE 124 NOTES TO THE FINANCIAL STATEMENTS
E1 JOINT ARRANGEMENTS (CONTINUED)
E1.2 INVESTMENT IN AUSTRALIA PACIFIC LNG PTY LTDAustralia Pacific LNG’s second LNG train commenced production during the period, with revenue recognition for the second train commencing in November 2016. A summary of Australia Pacific LNG’s financial performance and its financial position for the periods ended 30 June 2017 and 30 June 2016 follows.
2017 2016
$MILLIONTOTAL APLNG
ORIGIN INTEREST
TOTAL APLNG
ORIGIN INTEREST
Operating revenue 3,754 880Operating expenses (1,465) (585)
EBITDA 2,289 859 295 111Depreciation and amortisation expense (1,614) (700)Interest income 3 5Interest expense (955) (296)Income tax benefit 87 209UNDERLYING RESULT FOR THE PERIOD (190) (71) (487) (182)
Elimination of MRCPS depreciation1 – 5 – –
TOTAL UNDERLYING RESULT FOR THE PERIOD (190) (66) (487) (182)
ITEMS EXCLUDED FROM SEGMENT RESULT:
Impairment of non-current assets (4,922) (1,846) – –Net foreign exchange loss – – (7) (3)Tax expense on translation of foreign denominated tax balances – – (23) (9)Pre-production costs not able to be capitalised – – (75) (28)Restructure costs – – (9) (3)
TOTAL ITEMS EXCLUDED FROM SEGMENT RESULT (4,922) (1,846) (114) (43)
NET LOSS FOR THE PERIOD (5,112) (1,912) (601) (225)
Other comprehensive income – – 95 36
TOTAL COMPREHENSIVE INCOME (5,112) (1,912) (506) (189)
1 During project construction, interest paid by Australia Pacific LNG (APLNG) to the Group on Mandatorily Redeemable Cumulative Preference Shares (MRCPS) was capitalised by APLNG. These capitalised interest amounts in APLNG now form part of the cost of APLNG’s assets and these assets have been depreciated since commencement of operations. During the project construction period, when the Group received interest on the MRCPS from APLNG, it recorded the interest as income after eliminating a proportion of this interest which related to its ownership interest in APLNG. When the Group now takes up its share of APLNG’s net profit after tax (NPAT) the result contains an element of depreciation relating to this capitalised interest. As these amounts were previously eliminated by the Group against its investment at the time the interest was received, an adjustment is made to reverse the impact of this depreciation on APLNG NPAT.
Impairment of investment for the year ended 30 June
$MILLION 2017 2016
Share of Australia Pacific LNG impairment of non-current assets 1,846 –
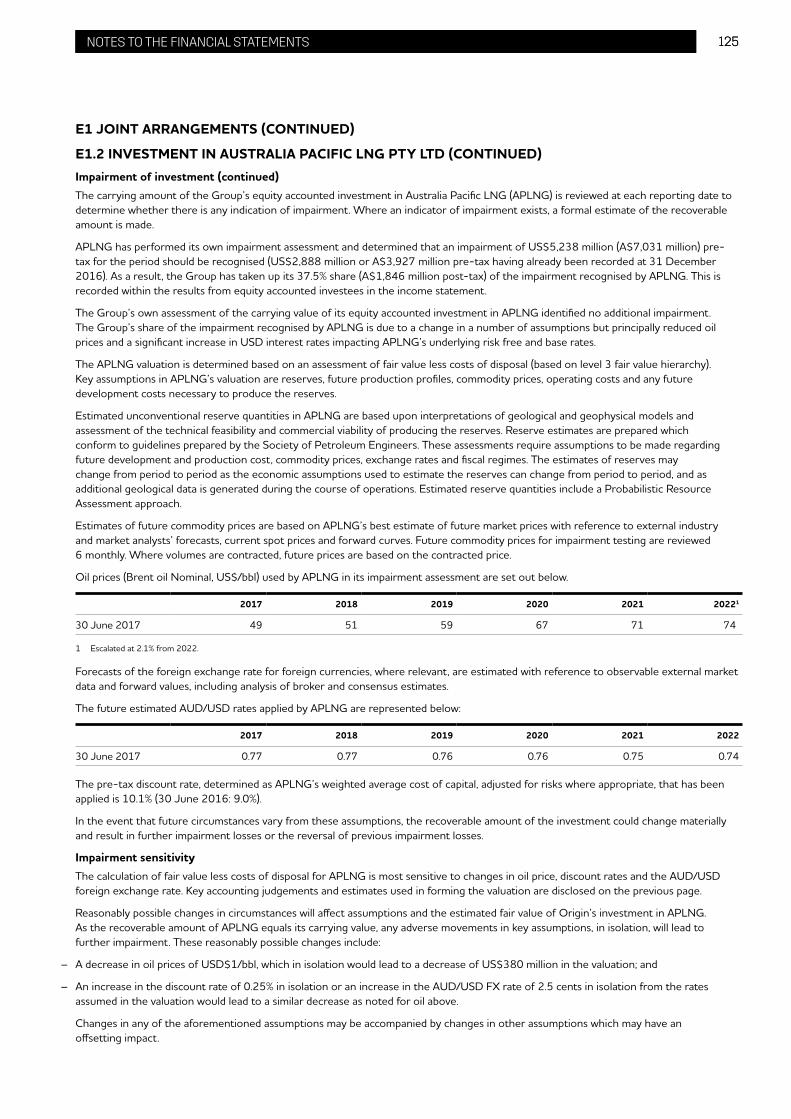
125ORIGIN ENERGY PAGE TITLE 125NOTES TO THE FINANCIAL STATEMENTS
E1 JOINT ARRANGEMENTS (CONTINUED)
E1.2 INVESTMENT IN AUSTRALIA PACIFIC LNG PTY LTD (CONTINUED)Impairment of investment (continued)The carrying amount of the Group’s equity accounted investment in Australia Pacific LNG (APLNG) is reviewed at each reporting date to determine whether there is any indication of impairment. Where an indicator of impairment exists, a formal estimate of the recoverable amount is made.
APLNG has performed its own impairment assessment and determined that an impairment of US$5,238 million (A$7,031 million) pre-tax for the period should be recognised (US$2,888 million or A$3,927 million pre-tax having already been recorded at 31 December 2016). As a result, the Group has taken up its 37.5% share (A$1,846 million post-tax) of the impairment recognised by APLNG. This is recorded within the results from equity accounted investees in the income statement.
The Group’s own assessment of the carrying value of its equity accounted investment in APLNG identified no additional impairment. The Group’s share of the impairment recognised by APLNG is due to a change in a number of assumptions but principally reduced oil prices and a significant increase in USD interest rates impacting APLNG’s underlying risk free and base rates.
The APLNG valuation is determined based on an assessment of fair value less costs of disposal (based on level 3 fair value hierarchy). Key assumptions in APLNG’s valuation are reserves, future production profiles, commodity prices, operating costs and any future development costs necessary to produce the reserves.
Estimated unconventional reserve quantities in APLNG are based upon interpretations of geological and geophysical models and assessment of the technical feasibility and commercial viability of producing the reserves. Reserve estimates are prepared which conform to guidelines prepared by the Society of Petroleum Engineers. These assessments require assumptions to be made regarding future development and production cost, commodity prices, exchange rates and fiscal regimes. The estimates of reserves may change from period to period as the economic assumptions used to estimate the reserves can change from period to period, and as additional geological data is generated during the course of operations. Estimated reserve quantities include a Probabilistic Resource Assessment approach.
Estimates of future commodity prices are based on APLNG’s best estimate of future market prices with reference to external industry and market analysts’ forecasts, current spot prices and forward curves. Future commodity prices for impairment testing are reviewed 6 monthly. Where volumes are contracted, future prices are based on the contracted price.
Oil prices (Brent oil Nominal, US$/bbl) used by APLNG in its impairment assessment are set out below.
2017 2018 2019 2020 2021 20221
30 June 2017 49 51 59 67 71 74
1 Escalated at 2.1% from 2022.
Forecasts of the foreign exchange rate for foreign currencies, where relevant, are estimated with reference to observable external market data and forward values, including analysis of broker and consensus estimates.
The future estimated AUD/USD rates applied by APLNG are represented below:
2017 2018 2019 2020 2021 2022
30 June 2017 0.77 0.77 0.76 0.76 0.75 0.74
The pre-tax discount rate, determined as APLNG’s weighted average cost of capital, adjusted for risks where appropriate, that has been applied is 10.1% (30 June 2016: 9.0%).
In the event that future circumstances vary from these assumptions, the recoverable amount of the investment could change materially and result in further impairment losses or the reversal of previous impairment losses.
Impairment sensitivityThe calculation of fair value less costs of disposal for APLNG is most sensitive to changes in oil price, discount rates and the AUD/USD foreign exchange rate. Key accounting judgements and estimates used in forming the valuation are disclosed on the previous page.
Reasonably possible changes in circumstances will affect assumptions and the estimated fair value of Origin’s investment in APLNG. As the recoverable amount of APLNG equals its carrying value, any adverse movements in key assumptions, in isolation, will lead to further impairment. These reasonably possible changes include:
– A decrease in oil prices of USD$1/bbl, which in isolation would lead to a decrease of US$380 million in the valuation; and
– An increase in the discount rate of 0.25% in isolation or an increase in the AUD/USD FX rate of 2.5 cents in isolation from the rates assumed in the valuation would lead to a similar decrease as noted for oil above.
Changes in any of the aforementioned assumptions may be accompanied by changes in other assumptions which may have an offsetting impact.

126 ORIGIN ENERGY PAGE TITLE 126 NOTES TO THE FINANCIAL STATEMENTS
E1 JOINT ARRANGEMENTS (CONTINUED)
E1.2 INVESTMENT IN AUSTRALIA PACIFIC LNG PTY LTD (CONTINUED)Summary statement of financial position of Australia Pacific LNG
$MILLION 2017 2016
Cash and cash equivalents 747 286Other current assets 677 584
CURRENT ASSETS 1,424 870
Receivables from shareholders 333 –Property, plant and equipment 33,853 40,011Exploration, evaluation and development assets 351 1,354Other non-current assets 2,425 379
NON-CURRENT ASSETS 36,962 41,744
TOTAL ASSETS 38,386 42,614
Bank loans – secured 927 360Other current liabilities 915 890
CURRENT LIABILITIES 1,842 1,250
Bank loans – secured 9,532 10,742Payable to shareholders 9,624 12,927Other non-current liabilities 2,413 1,463
NON-CURRENT LIABILITIES 21,569 25,132
TOTAL LIABILITIES 23,411 26,382
NET ASSETS 14,975 16,232
2017$MILLION
2016$MILLION
Group’s interest of 37.5 per cent of APLNG net assets 5,615 6,087Group’s own costs 25 25Mandatorily Redeemable Cumulative Preference Shares elimination1 (177) (167)
INVESTMENT IN AUSTRALIA PACIFIC LNG PTY LTD 5,463 5,945
1 The Mandatorily Redeemable Cumulative Preference Shares (MRCPS) are recognised as a financial asset by the Group and the MRCPS dividend is recognised as interest revenue in the Group’s income statement. The proportion attributable to the Group’s own interest (37.5 per cent) is eliminated through the equity accounted investment balance as Australia Pacific LNG has capitalised a portion of interest expense associated with the MRCPS.
In calculating Origin’s return on capital employed, an adjustment is made to the carrying value of the Australia Pacific LNG equity accounted investment as noted below.
2017$MILLION
2016$MILLION
Investment in Australia Pacific LNG Pty Ltd 5,463 5,945Less: Non-cash fair value uplift1 (30) (1,923)
ADJUSTED INVESTMENT IN AUSTRALIA PACIFIC LNG PTY LTD 5,433 4,022
1 Non-cash fair value uplift represents the increase in Origin's equity accounted investment in Australia Pacific LNG arising from the partly paid shares issued by Australia Pacific LNG Pty Ltd to ConocoPhillips (CoP) in October 2009 and the dilution impact of subsequent share issues by Australia Pacific LNG Pty Ltd to Sinopec (August 2011 and July 2012).
In the initial years, Origin was not required to make an equivalent contribution and instead recorded a non-cash fair value uplift to its investment in Australia Pacific LNG. The amount has been reduced by the $1,846 million impairment during the period. The equity contributions made by CoP and Sinopec to Australia Pacific LNG were used to fund construction of the LNG project assets, which will be depreciated over their useful lives (approximately 30 years).
In each period Origin’s equity accounted share of Australia Pacific LNG’s earnings will include a depreciation charge referrable to the non-cash fair value uplift. When these earnings are reflected in Origin’s investment balance this depreciation amount will reduce the remaining balance of the non-cash fair value uplift.
The 30 June 2017 balance includes an estimated depreciation charge of $47 million (30 June 2016: $22 million) associated with the non-cash fair value uplift described above.
Australia Pacific LNG is subject to the Petroleum Resource Rent Tax legislation and has an unrecognised deferred tax asset balance of $5,377 million (100 per cent Australia Pacific LNG) at 30 June 2017 (30 June 2016: $3,747 million). Any future recognition of this balance by Australia Pacific LNG will result in an increase in the Group’s equity accounted investment in Australia Pacific LNG, rather than a deferred tax asset, as the Group equity accounts its 37.5 per cent interest.
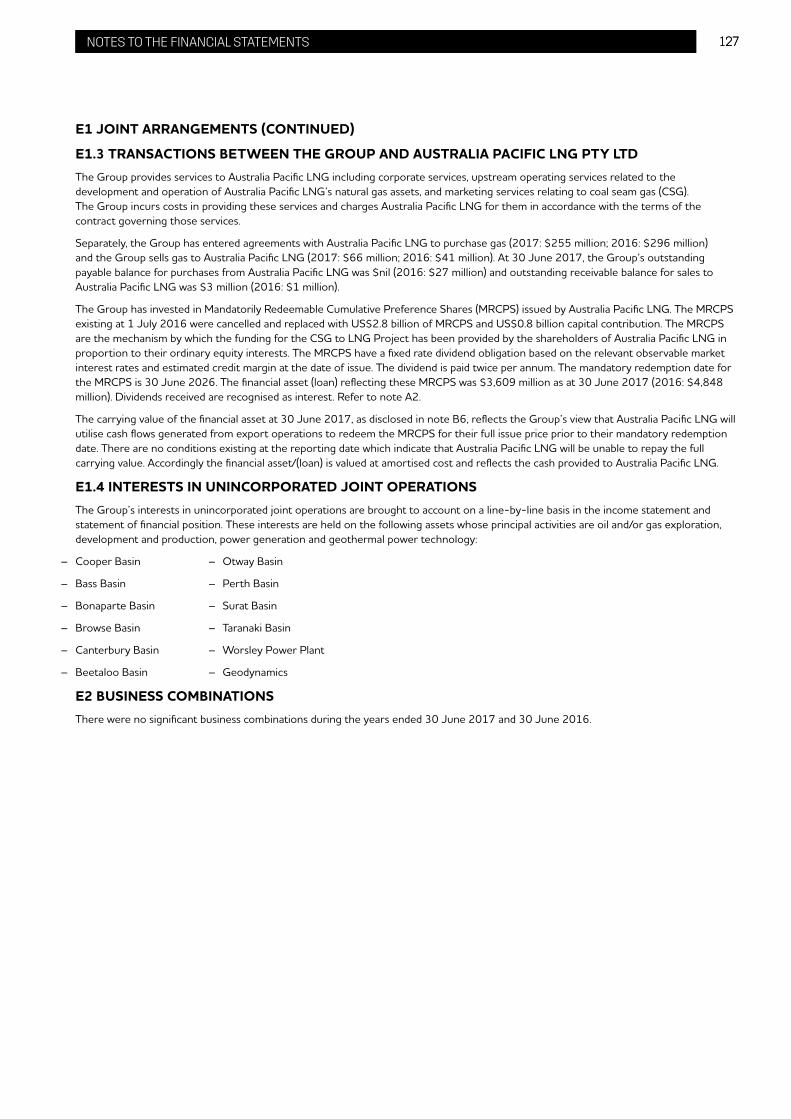
127ORIGIN ENERGY PAGE TITLE 127NOTES TO THE FINANCIAL STATEMENTS
E1 JOINT ARRANGEMENTS (CONTINUED)
E1.3 TRANSACTIONS BETWEEN THE GROUP AND AUSTRALIA PACIFIC LNG PTY LTDThe Group provides services to Australia Pacific LNG including corporate services, upstream operating services related to the development and operation of Australia Pacific LNG’s natural gas assets, and marketing services relating to coal seam gas (CSG). The Group incurs costs in providing these services and charges Australia Pacific LNG for them in accordance with the terms of the contract governing those services.
Separately, the Group has entered agreements with Australia Pacific LNG to purchase gas (2017: $255 million; 2016: $296 million) and the Group sells gas to Australia Pacific LNG (2017: $66 million; 2016: $41 million). At 30 June 2017, the Group’s outstanding payable balance for purchases from Australia Pacific LNG was $nil (2016: $27 million) and outstanding receivable balance for sales to Australia Pacific LNG was $3 million (2016: $1 million).
The Group has invested in Mandatorily Redeemable Cumulative Preference Shares (MRCPS) issued by Australia Pacific LNG. The MRCPS existing at 1 July 2016 were cancelled and replaced with US$2.8 billion of MRCPS and US$0.8 billion capital contribution. The MRCPS are the mechanism by which the funding for the CSG to LNG Project has been provided by the shareholders of Australia Pacific LNG in proportion to their ordinary equity interests. The MRCPS have a fixed rate dividend obligation based on the relevant observable market interest rates and estimated credit margin at the date of issue. The dividend is paid twice per annum. The mandatory redemption date for the MRCPS is 30 June 2026. The financial asset (loan) reflecting these MRCPS was $3,609 million as at 30 June 2017 (2016: $4,848 million). Dividends received are recognised as interest. Refer to note A2.
The carrying value of the financial asset at 30 June 2017, as disclosed in note B6, reflects the Group’s view that Australia Pacific LNG will utilise cash flows generated from export operations to redeem the MRCPS for their full issue price prior to their mandatory redemption date. There are no conditions existing at the reporting date which indicate that Australia Pacific LNG will be unable to repay the full carrying value. Accordingly the financial asset/(loan) is valued at amortised cost and reflects the cash provided to Australia Pacific LNG.
E1.4 INTERESTS IN UNINCORPORATED JOINT OPERATIONSThe Group’s interests in unincorporated joint operations are brought to account on a line-by-line basis in the income statement and statement of financial position. These interests are held on the following assets whose principal activities are oil and/or gas exploration, development and production, power generation and geothermal power technology:
– Cooper Basin – Otway Basin
– Bass Basin – Perth Basin
– Bonaparte Basin – Surat Basin
– Browse Basin – Taranaki Basin
– Canterbury Basin – Worsley Power Plant
– Beetaloo Basin – Geodynamics
E2 BUSINESS COMBINATIONSThere were no significant business combinations during the years ended 30 June 2017 and 30 June 2016.
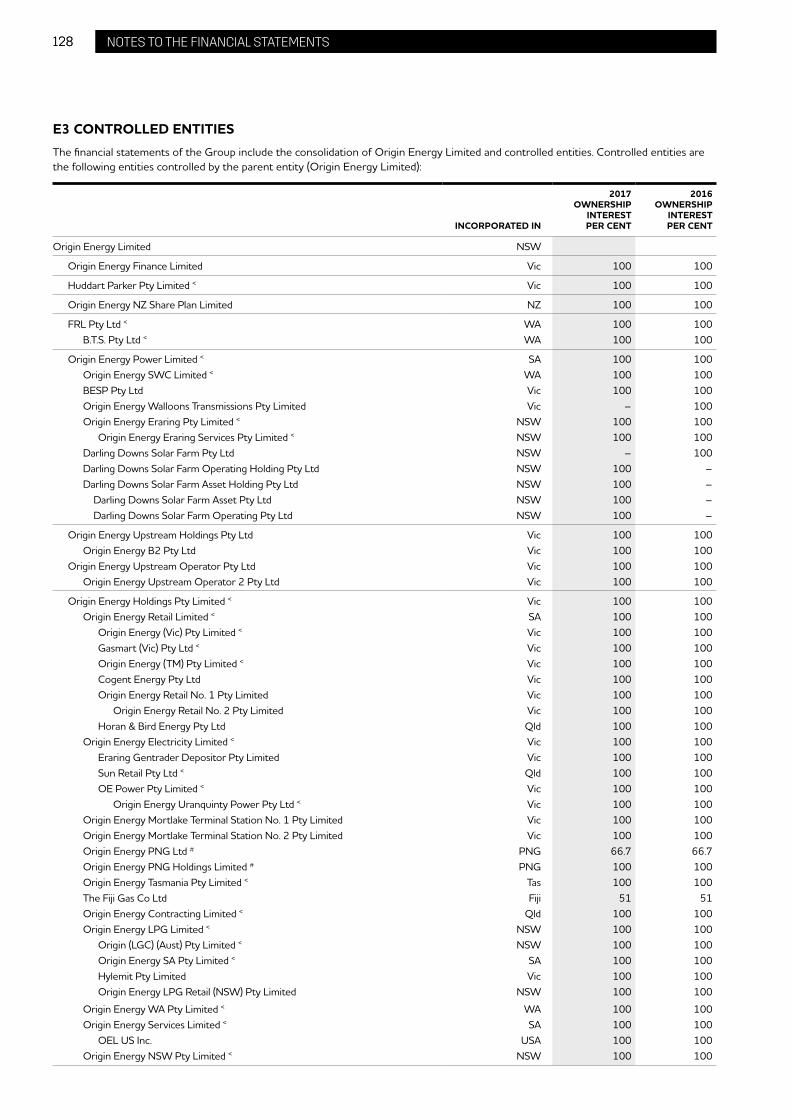
128 ORIGIN ENERGY PAGE TITLE 128 NOTES TO THE FINANCIAL STATEMENTS
E3 CONTROLLED ENTITIESThe financial statements of the Group include the consolidation of Origin Energy Limited and controlled entities. Controlled entities are the following entities controlled by the parent entity (Origin Energy Limited):
INCORPORATED IN
2017OWNERSHIP
INTEREST PER CENT
2016OWNERSHIP
INTEREST PER CENT
Origin Energy Limited NSW
Origin Energy Finance Limited Vic 100 100
Huddart Parker Pty Limited < Vic 100 100
Origin Energy NZ Share Plan Limited NZ 100 100
FRL Pty Ltd < WA 100 100B.T.S. Pty Ltd < WA 100 100
Origin Energy Power Limited < SA 100 100Origin Energy SWC Limited < WA 100 100BESP Pty Ltd Vic 100 100Origin Energy Walloons Transmissions Pty Limited Vic – 100Origin Energy Eraring Pty Limited < NSW 100 100
Origin Energy Eraring Services Pty Limited < NSW 100 100Darling Downs Solar Farm Pty Ltd NSW – 100Darling Downs Solar Farm Operating Holding Pty Ltd NSW 100 –Darling Downs Solar Farm Asset Holding Pty Ltd NSW 100 – Darling Downs Solar Farm Asset Pty Ltd NSW 100 – Darling Downs Solar Farm Operating Pty Ltd NSW 100 –
Origin Energy Upstream Holdings Pty Ltd Vic 100 100Origin Energy B2 Pty Ltd Vic 100 100
Origin Energy Upstream Operator Pty Ltd Vic 100 100Origin Energy Upstream Operator 2 Pty Ltd Vic 100 100
Origin Energy Holdings Pty Limited < Vic 100 100Origin Energy Retail Limited < SA 100 100
Origin Energy (Vic) Pty Limited < Vic 100 100Gasmart (Vic) Pty Ltd < Vic 100 100Origin Energy (TM) Pty Limited < Vic 100 100Cogent Energy Pty Ltd Vic 100 100Origin Energy Retail No. 1 Pty Limited Vic 100 100
Origin Energy Retail No. 2 Pty Limited Vic 100 100Horan & Bird Energy Pty Ltd Qld 100 100
Origin Energy Electricity Limited < Vic 100 100Eraring Gentrader Depositor Pty Limited Vic 100 100Sun Retail Pty Ltd < Qld 100 100OE Power Pty Limited < Vic 100 100
Origin Energy Uranquinty Power Pty Ltd < Vic 100 100Origin Energy Mortlake Terminal Station No. 1 Pty Limited Vic 100 100Origin Energy Mortlake Terminal Station No. 2 Pty Limited Vic 100 100Origin Energy PNG Ltd # PNG 66.7 66.7Origin Energy PNG Holdings Limited # PNG 100 100Origin Energy Tasmania Pty Limited < Tas 100 100The Fiji Gas Co Ltd Fiji 51 51Origin Energy Contracting Limited < Qld 100 100Origin Energy LPG Limited < NSW 100 100
Origin (LGC) (Aust) Pty Limited < NSW 100 100Origin Energy SA Pty Limited < SA 100 100Hylemit Pty Limited Vic 100 100Origin Energy LPG Retail (NSW) Pty Limited NSW 100 100
Origin Energy WA Pty Limited < WA 100 100Origin Energy Services Limited < SA 100 100
OEL US Inc. USA 100 100Origin Energy NSW Pty Limited < NSW 100 100
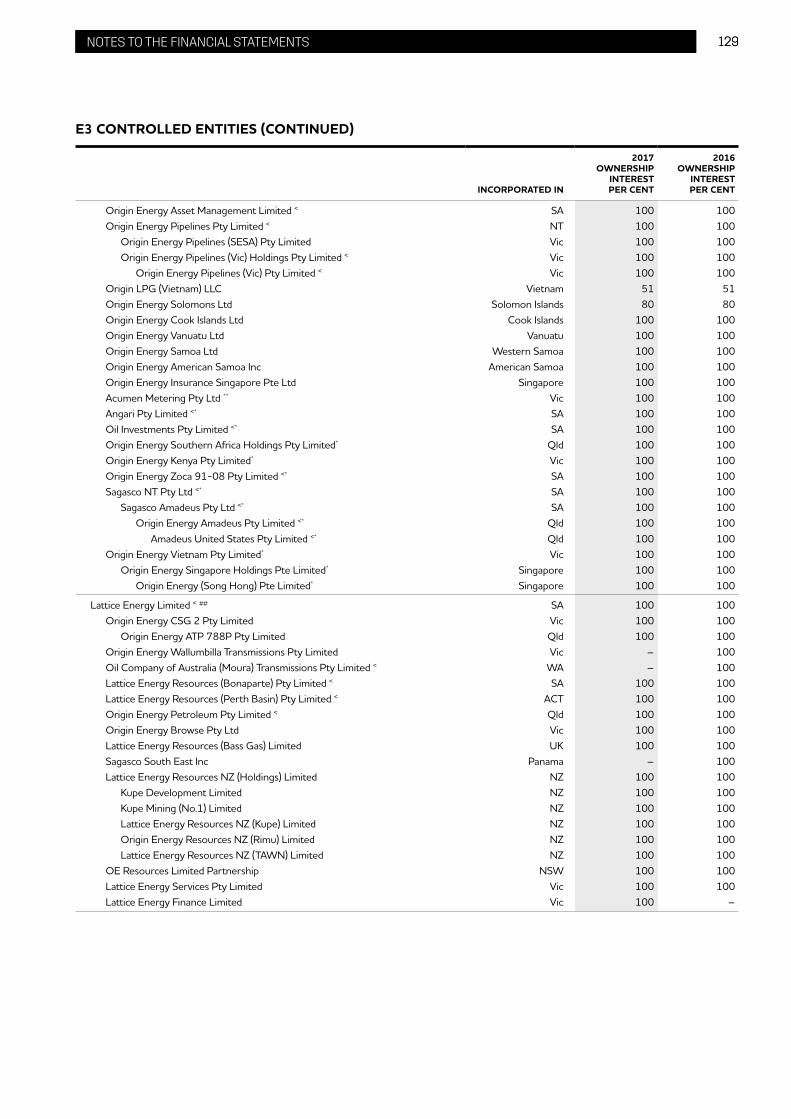
129ORIGIN ENERGY PAGE TITLE 129NOTES TO THE FINANCIAL STATEMENTS
INCORPORATED IN
2017OWNERSHIP
INTEREST PER CENT
2016OWNERSHIP
INTEREST PER CENT
Origin Energy Asset Management Limited < SA 100 100Origin Energy Pipelines Pty Limited < NT 100 100
Origin Energy Pipelines (SESA) Pty Limited Vic 100 100Origin Energy Pipelines (Vic) Holdings Pty Limited < Vic 100 100
Origin Energy Pipelines (Vic) Pty Limited < Vic 100 100Origin LPG (Vietnam) LLC Vietnam 51 51Origin Energy Solomons Ltd Solomon Islands 80 80Origin Energy Cook Islands Ltd Cook Islands 100 100Origin Energy Vanuatu Ltd Vanuatu 100 100Origin Energy Samoa Ltd Western Samoa 100 100Origin Energy American Samoa Inc American Samoa 100 100Origin Energy Insurance Singapore Pte Ltd Singapore 100 100Acumen Metering Pty Ltd ** Vic 100 100Angari Pty Limited <* SA 100 100Oil Investments Pty Limited <* SA 100 100Origin Energy Southern Africa Holdings Pty Limited* Qld 100 100Origin Energy Kenya Pty Limited* Vic 100 100Origin Energy Zoca 91-08 Pty Limited <* SA 100 100Sagasco NT Pty Ltd <* SA 100 100
Sagasco Amadeus Pty Ltd <* SA 100 100Origin Energy Amadeus Pty Limited <* Qld 100 100
Amadeus United States Pty Limited <* Qld 100 100Origin Energy Vietnam Pty Limited* Vic 100 100
Origin Energy Singapore Holdings Pte Limited* Singapore 100 100Origin Energy (Song Hong) Pte Limited* Singapore 100 100
Lattice Energy Limited < ## SA 100 100Origin Energy CSG 2 Pty Limited Vic 100 100
Origin Energy ATP 788P Pty Limited Qld 100 100Origin Energy Wallumbilla Transmissions Pty Limited Vic – 100Oil Company of Australia (Moura) Transmissions Pty Limited < WA – 100Lattice Energy Resources (Bonaparte) Pty Limited < SA 100 100Lattice Energy Resources (Perth Basin) Pty Limited < ACT 100 100Origin Energy Petroleum Pty Limited < Qld 100 100Origin Energy Browse Pty Ltd Vic 100 100Lattice Energy Resources (Bass Gas) Limited UK 100 100Sagasco South East Inc Panama – 100Lattice Energy Resources NZ (Holdings) Limited NZ 100 100
Kupe Development Limited NZ 100 100Kupe Mining (No.1) Limited NZ 100 100Lattice Energy Resources NZ (Kupe) Limited NZ 100 100Origin Energy Resources NZ (Rimu) Limited NZ 100 100Lattice Energy Resources NZ (TAWN) Limited NZ 100 100
OE Resources Limited Partnership NSW 100 100Lattice Energy Services Pty Limited Vic 100 100Lattice Energy Finance Limited Vic 100 –
E3 CONTROLLED ENTITIES (CONTINUED)

130 ORIGIN ENERGY PAGE TITLE 130 NOTES TO THE FINANCIAL STATEMENTS
INCORPORATED IN
2017OWNERSHIP
INTEREST PER CENT
2016OWNERSHIP
INTEREST PER CENT
Origin Energy VIC Holdings Pty Limited < Vic 100 100Origin Energy New Zealand Limited NZ 100 100
Origin Energy Universal Holdings Limited NZ 100 100Origin Energy Five Star Holdings Limited NZ 100 100Origin Energy Contact Finance Limited NZ 100 100Origin Energy Contact Finance No.2 Limited NZ 100 100Origin Energy Pacific Holdings Limited NZ 100 100
Origin Energy Capital Ltd< Vic 100 100
Origin Energy Finance Company Pty Limited < Vic 100 100
OE JV Co Pty Limited < Vic 100 100OE JV Holdings Pty Limited Vic 100 100Origin Energy LNG Holdings Pte Limited Singapore 100 100Origin Energy LNG Portfolio Pty Ltd Victoria 100 100
Origin Energy Australia Holding BV # Netherlands 100 100Origin Energy Mt Stuart BV # Netherlands 100 100
OE Mt Stuart General Partnership # Netherlands 100 100
Parbond Pty Limited NSW 100 100
Origin Foundation Pty Limited Vic 100 100
Origin Renewable Energy Investments No 1 Pty Ltd Vic 100 100Origin Renewable Energy Investments No 2 Pty Ltd Vic 100 100Origin Renewable Energy Pty Ltd Vic 100 100
Origin Energy Geothermal Holdings Pty Ltd Vic 100 100Origin Energy Geothermal Pty Ltd Vic 100 100Origin Energy Chile Holdings Pty Limited Vic 100 100
Origin Energy Chile S.A. # Chile 100 100Origin Energy Geothermal Chile Limitada # Chile 100 100Nido Energy SpA # Chile 100 100Pleiades S.A Chile 100 100
Origin Energy Geothermal Singapore Pte Limited Singapore 100 100Origin Energy Wind Holdings Pty Ltd Vic 100 100
Cullerin Range Wind Farm Pty Ltd NSW – 100Crystal Brook Wind Farm Pty Limited NSW 100 100Wind Power Pty Ltd Vic 100 100
Wind Power Management Pty Ltd Vic 100 100Lexton Wind Farm Pty Ltd Vic 100 100Stockyard Hill Wind Farm Pty Ltd Vic – 100Tuki Wind Farm Pty Ltd Vic 100 100
Dundas Tablelands Wind Farm Pty Limited Vic 100 100Origin Energy Hydro Bermuda Limited Bermuda 100 100
Origin Energy Hydro Chile SpA # Chile 100 100
< Entered into ASIC Corporations (Wholly-owned Companies) Instrument 2016/785 and related deed of cross guarantee with Origin Energy Limited.# Controlled entity has a financial reporting period ending 31 December.## Origin Energy Resources Limited has changed its name to Lattice Energy Limited on 29 June 2017.* Origin Energy Resources Limited (subsequently renamed Lattice Energy Limited) transferred its shares in certain entities to Origin Energy Holdings Pty Limited on 28
June 2017.** Origin Energy Power Limited transferred its shares in Acumen Metering Pty Ltd (previously named Origin Energy Pinjar Security Pty Ltd) to Origin Energy Holdings Pty Limited
on 6 April 2017.
E3 CONTROLLED ENTITIES (CONTINUED)
131ORIGIN ENERGY PAGE TITLE 131NOTES TO THE FINANCIAL STATEMENTS
E3 CONTROLLED ENTITIES (CONTINUED) CHANGES IN CONTROLLED ENTITIES2017Sagasco South East Inc was deregistered on 10 October 2016.
Cullerin Range Wind Farm Pty Ltd and Stockyard Hill Wind Farm Pty Ltd were sold during the year ended 30 June 2017.
Darling Downs Solar Farm Operating Holding Pty Ltd, Darling Downs Solar Farm Asset Holding Pty Ltd, Darling Downs Solar Farm Asset Pty Ltd and Darling Downs Solar Farm Operating Pty Ltd were incorporated during the year ended 30 June 2017.
The following name changes occurred on 1 February 2017:
Origin Energy Pinjar Holdings No. 1 Pty Limited changed its name to Origin Energy Upstream Holdings Pty Ltd
Origin Energy Pinjar Holdings No. 2 Pty Limited changed its name to Origin Energy Upstream Operator Pty Ltd
Origin Energy Pinjar No. 1 Pty Limited changed its name to Origin Energy B2 Pty Ltd
Origin Energy Pinjar No. 2 Pty Limited changed its name to Origin Energy Upstream Operator 2 Pty Ltd
Origin Energy Darling Downs Solar Farm Pty Ltd changed its name to Darling Downs Solar Farm Pty Ltd on 26 April 2017. Darling Downs Solar Farm Pty Ltd was sold on 6 April 2017.
On 28 April 2017 Origin Energy Fairview Transmissions Pty Limited changed its name to Lattice Energy Services Pty Limited.
Origin Energy Walloons Transmissions Pty Limited, Origin Energy Wallumbilla Transmissions Pty Limited and Oil Company of Australia (Moura) Transmissions Pty Ltd were sold on 6 June 2017.
Lattice Energy Finance Limited was incorporated on 26 June 2017.
Origin Energy Pinjar Security Pty Ltd changed its name to Acumen Metering Pty Ltd effective from 27 June 2017.
Origin Energy Resources Limited changed its name to Lattice Energy Limited on 29 June 2017.
The following name changes occurred on 28 June 2017:
Origin Energy Developments Pty Limited changed its name to Lattice Energy Resources (Perth Basin) Pty Limited
Origin Energy Bonaparte Pty Limited changed its name to Lattice Energy Resources (Bonaparte) Pty Limited
Origin Energy Northwest Limited changed its name to Lattice Energy Resources (Bass Gas) Limited
Origin Energy Resources (Kupe) Limited changed its name to Lattice Energy Resources NZ (Kupe) Limited
Origin Energy Resources NZ Limited changed its name to Lattice Energy Resources NZ (Holdings) Limited
Origin Energy Resources NZ (TAWN) Limited changed its name to Lattice Energy Resources NZ (TAWN) Limited
2016On 10 August 2015 Contact Energy Limited ceased to be controlled by the Group (refer note E4).
On 2 November 2015 the Group acquired 100 per cent of Horan & Bird Energy Pty Ltd.
On 18 February 2016 the Group registered Origin Energy LNG Portfolio Pty Ltd.
On 15 March 2016 the Group registered Origin Energy Darling Downs Solar Farm Pty Ltd.
Origin Energy Generacion Chile SpA changed its name to Nido Energy SpA on 23 February 2016.
Origin Energy (Block 31) Pte Limited, Origin Energy (Block 01) Pte Limited, Origin Energy (L15/50) Pte Limited, Origin Energy (L26/50) Pte Limited and Origin Energy (Savannahket) Pte Limited were struck off.
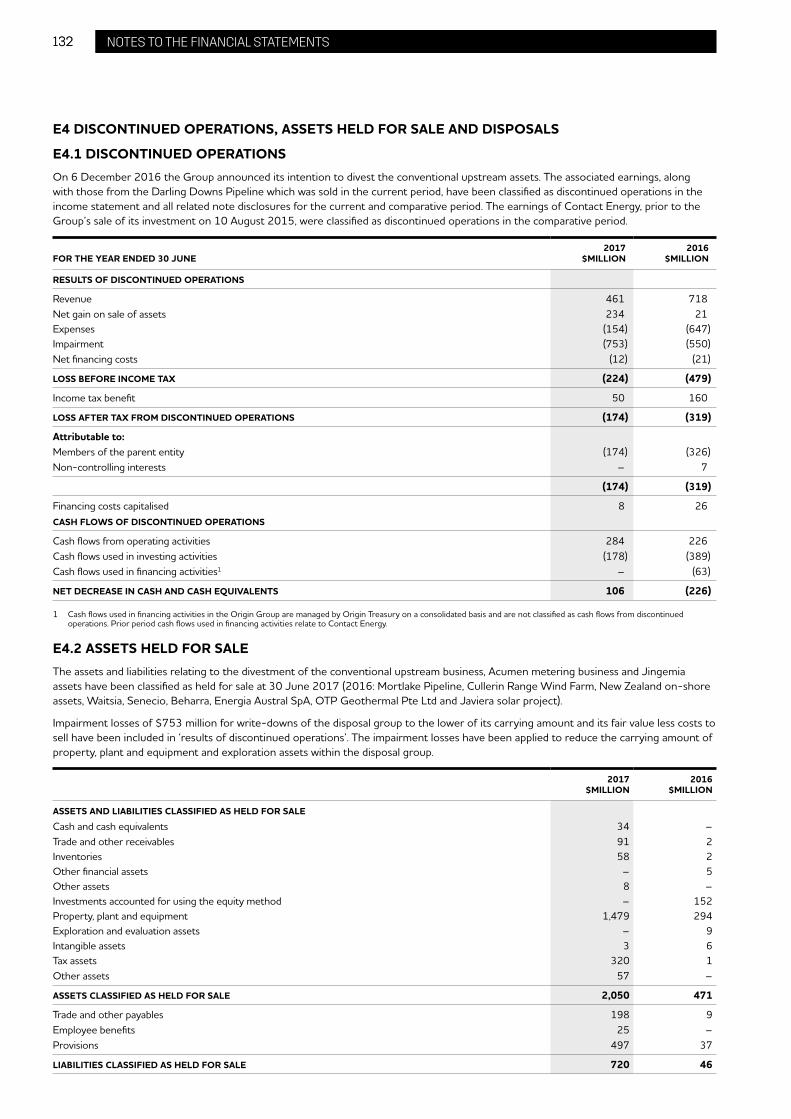
132 ORIGIN ENERGY PAGE TITLE 132 NOTES TO THE FINANCIAL STATEMENTS
E4 DISCONTINUED OPERATIONS, ASSETS HELD FOR SALE AND DISPOSALS
E4.1 DISCONTINUED OPERATIONSOn 6 December 2016 the Group announced its intention to divest the conventional upstream assets. The associated earnings, along with those from the Darling Downs Pipeline which was sold in the current period, have been classified as discontinued operations in the income statement and all related note disclosures for the current and comparative period. The earnings of Contact Energy, prior to the Group’s sale of its investment on 10 August 2015, were classified as discontinued operations in the comparative period.
FOR THE YEAR ENDED 30 JUNE2017
$MILLION2016
$MILLION
RESULTS OF DISCONTINUED OPERATIONS
Revenue 461 718Net gain on sale of assets 234 21Expenses (154) (647)Impairment (753) (550)Net financing costs (12) (21)
LOSS BEFORE INCOME TAX (224) (479)
Income tax benefit 50 160
LOSS AFTER TAX FROM DISCONTINUED OPERATIONS (174) (319)
Attributable to:Members of the parent entity (174) (326)Non-controlling interests – 7
(174) (319)
Financing costs capitalised 8 26CASH FLOWS OF DISCONTINUED OPERATIONS
Cash flows from operating activities 284 226Cash flows used in investing activities (178) (389)Cash flows used in financing activities1 – (63)
NET DECREASE IN CASH AND CASH EQUIVALENTS 106 (226)
1 Cash flows used in financing activities in the Origin Group are managed by Origin Treasury on a consolidated basis and are not classified as cash flows from discontinued operations. Prior period cash flows used in financing activities relate to Contact Energy.
E4.2 ASSETS HELD FOR SALEThe assets and liabilities relating to the divestment of the conventional upstream business, Acumen metering business and Jingemia assets have been classified as held for sale at 30 June 2017 (2016: Mortlake Pipeline, Cullerin Range Wind Farm, New Zealand on-shore assets, Waitsia, Senecio, Beharra, Energia Austral SpA, OTP Geothermal Pte Ltd and Javiera solar project).
Impairment losses of $753 million for write-downs of the disposal group to the lower of its carrying amount and its fair value less costs to sell have been included in ‘results of discontinued operations’. The impairment losses have been applied to reduce the carrying amount of property, plant and equipment and exploration assets within the disposal group.
2017$MILLION
2016$MILLION
ASSETS AND LIABILITIES CLASSIFIED AS HELD FOR SALE
Cash and cash equivalents 34 –Trade and other receivables 91 2Inventories 58 2Other financial assets – 5Other assets 8 –Investments accounted for using the equity method – 152Property, plant and equipment 1,479 294Exploration and evaluation assets – 9Intangible assets 3 6Tax assets 320 1Other assets 57 –
ASSETS CLASSIFIED AS HELD FOR SALE 2,050 471
Trade and other payables 198 9Employee benefits 25 –Provisions 497 37
LIABILITIES CLASSIFIED AS HELD FOR SALE 720 46
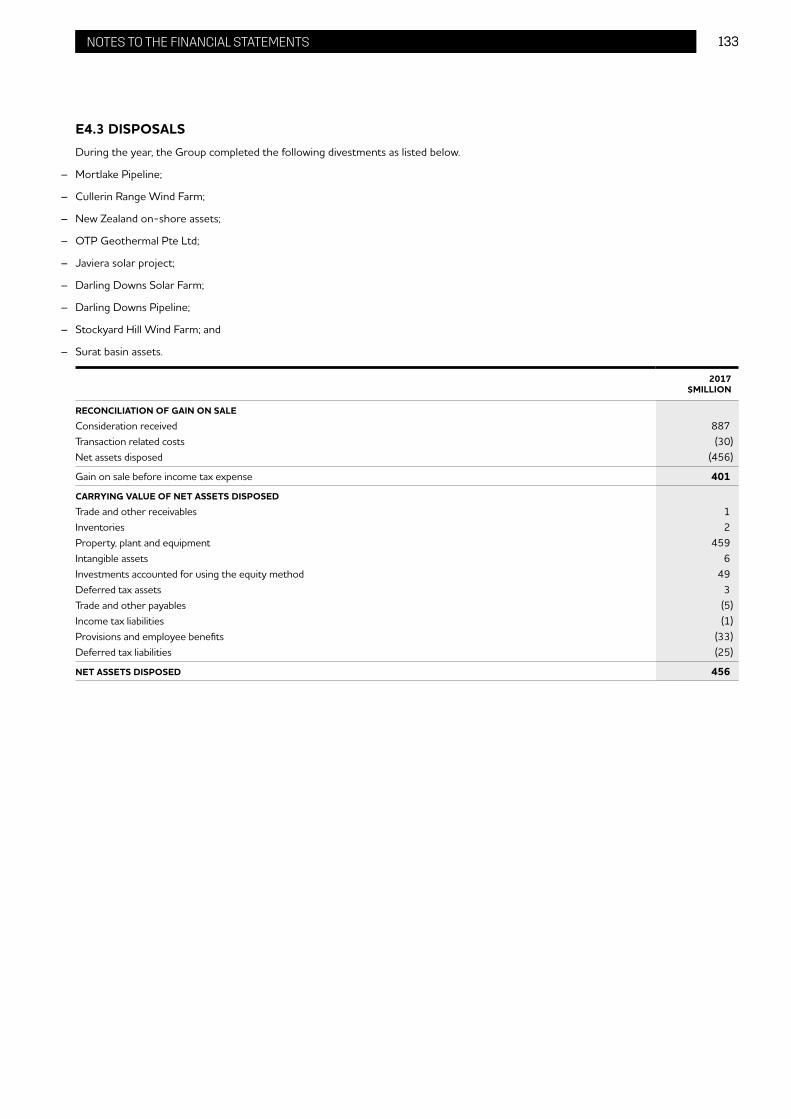
133ORIGIN ENERGY PAGE TITLE 133NOTES TO THE FINANCIAL STATEMENTS
E4.3 DISPOSALSDuring the year, the Group completed the following divestments as listed below.
– Mortlake Pipeline;
– Cullerin Range Wind Farm;
– New Zealand on-shore assets;
– OTP Geothermal Pte Ltd;
– Javiera solar project;
– Darling Downs Solar Farm;
– Darling Downs Pipeline;
– Stockyard Hill Wind Farm; and
– Surat basin assets.
2017$MILLION
RECONCILIATION OF GAIN ON SALE
Consideration received 887Transaction related costs (30)Net assets disposed (456)
Gain on sale before income tax expense 401
CARRYING VALUE OF NET ASSETS DISPOSED
Trade and other receivables 1Inventories 2Property, plant and equipment 459Intangible assets 6Investments accounted for using the equity method 49Deferred tax assets 3Trade and other payables (5)Income tax liabilities (1)Provisions and employee benefits (33)Deferred tax liabilities (25)
NET ASSETS DISPOSED 456

134 ORIGIN ENERGY PAGE TITLE 134 NOTES TO THE FINANCIAL STATEMENTS
F OTHER INFORMATION
This section includes other information to assist in understanding the financial performance and position of the Group, or items required to be disclosed to comply with accounting standards and other pronouncements.
F1 CONTINGENT LIABILITIESDiscussed below are items for which it is not probable that the Group will have to make future payments or the amount of the future payments cannot be reliably measured.
GUARANTEESBank guarantees and letters of credit have been provided mainly to Australian Energy Market Operator Limited to support the Group’s obligations to purchase electricity from the National Electricity Market.
2017$MILLION1
2016$MILLION2
Bank guarantees – unsecured 368 398Letters of credit – unsecured 2 2
1 Includes unsecured bank guarantees of $13 million related to discontinued operations.2 Includes unsecured bank guarantees of $3 million related to discontinued operations.
The Group’s share of guarantees for certain contractual commitments of its joint ventures is shown at note F2. The Group has also given letters of comfort to its bankers in respect of financial arrangements provided by the banks to certain partly-owned controlled entities.
JOINT ARRANGEMENTSAs a participant in certain joint arrangements, the Group is liable for its share of liabilities incurred by these arrangements. In some circumstances the Group may incur more than its proportionate share of such liabilities, but will have the right to recover the excess liability from the other joint arrangement participants.
Australia Pacific LNG has secured US$8.5 billion in funding through a project finance facility. As of 30 June 2017, Australia Pacific LNG has drawn down US$8.5 billion under the facility for capital expenditure, fees and interest. The Group guarantees its share of amounts drawn under the facility during the construction phase of the project (37.5 per cent share at 30 June 2017 being US$3.2 billion). On 31 October 2016 US$5.1 billion (37.5 per cent share being US$1.9 billion) of shareholder guarantees were released after the project’s first production train successfully satisfied lender’s completion tests. The remaining US$3.4 billion remains guaranteed at 30 June 2017 (37.5 per cent share being US$1.3 billion). Principal repayments of US$267 million were made during the year (30 June 2016: $nil).
In September 2016, APLNG made a loan to the Group of $US96 million and receipt of this $US96 million from APLNG is shown as a current payable to joint ventures in the statement of financial position. The loan was made by APLNG to the Group in accordance with the terms of the APLNG project financing facility, which allows APLNG to make a loan to a shareholder if the shareholder provides the project financiers with a letter of credit for the amount of the loan.
The Group continues to provide parent company guarantees in excess of its 37.5 per cent shareholding in Australia Pacific LNG in respect of certain historical domestic contracts.
LEGAL AND REGULATORYCertain entities within the Group (and joint venture entities, such as Australia Pacific LNG) are subject to various lawsuits and claims as well as audits and reviews by government or regulatory bodies. In most instances it is not possible to reasonably predict the outcome of these matters or their impact on the Group. Where outcomes can be reasonably predicted, provisions are recorded.
A number of sites owned/operated (or previously owned/operated) by the Group have been identified as contaminated. These properties are subject to ongoing environmental management programs. For sites where the requirements can be assessed and remediation costs can be estimated, such costs have been expensed or provided for.
Warranties and indemnities have also been given and/or received by entities in the Group in relation to environmental liabilities for certain properties divested and/or acquired.
CAPITAL EXPENDITUREAs part of the acquisition of Browse Basin exploration permits, the Group agreed to pay cash consideration of US$75 million contingent upon a project Final Investment Decision (FID) and US$75 million contingent upon first production. The Group will pay further contingent consideration of up to US$50 million upon first production if 2P reserves, at the time of FID, reach certain thresholds. These obligations have not been provided for at the reporting date as they are dependent upon uncertain future events not wholly within the Group’s control.

135ORIGIN ENERGY PAGE TITLE 135NOTES TO THE FINANCIAL STATEMENTS
F2 COMMITMENTSDetailed below are the Group’s contractual commitments that are not recognised as liabilities as the relevant assets have not yet been received.
2017$MILLION
2016$MILLION
Capital expenditure commitments 72 81Joint venture commitments1 740 993Operating lease commitments 398 296
1 Includes $623 million (2016: $822 million) in relation to the Group’s share of Australia Pacific LNG’s capital, joint venture and operating lease commitments.
The Group leases property, plant and equipment under operating leases with terms of one to ten years. The future minimum lease payments under non-cancellable operating leases are shown below.
2017$MILLION
2016$MILLION
Less than one year 58 67Between one and five years 159 161More than five years 181 68
398 296
F3 SHARE-BASED PAYMENTSThis section sets out details of the Group’s share-based remuneration arrangements including details of the Company’s Equity Incentive Plan and Employee Share Plan.
The table below shows share-based remuneration expense that was recognised during the year.
REF.2017
$MILLION2016
$MILLION
Origin Equity Incentive Plan (a) 25 32Origin Employee Share Plan (b) 5 5
30 37
EXPLANATORY NOTES TO SHARE-BASED PAYMENTS FOR THE YEAR ENDED 30 JUNE(a) Equity Incentive PlanEligible employees are granted share-based remuneration under the Origin Energy Limited Equity Incentive Plan. Participation in the plan is at the Board’s discretion and no individual has a contractual right to participate or to receive any guaranteed benefits. Equity incentives are offered in the form of Options and/or share rights.
(i) Short Term Incentive (STI)STI includes the award of Deferred Share Rights (DSRs) which vest where the employee remains employed with satisfactory performance for a set period (generally between two and four years). DSRs do not carry voting or dividend entitlements. Once vested, a DSR entitles the holder to one fully paid ordinary share of the Company. As there is no exercise price for DSRs, they are exercised automatically upon vesting. The fair value of DSRs is recognised as an employee expense over the related service period. DSRs are forfeited if the service and performance conditions are not met. In exceptional circumstances1 the DSRs, which represent a portion of ‘earned’ STI, will vest at cessation unless the Board determines otherwise. Fair value is measured at grant date as the market value of an Origin share less the discounted value of dividends foregone (two year vesting period: $5.25, three year vesting period: $5.10 and four year vesting period: $4.95).
1 The Equity Incentive Plan Rules set out the circumstances as death, disability, redundancy, genuine retirement, or other exceptional circumstances approved by the Board.

136 ORIGIN ENERGY PAGE TITLE 136 NOTES TO THE FINANCIAL STATEMENTS
F3 SHARE-BASED PAYMENTS (CONTINUED)EXPLANATORY NOTES TO SHARE-BASED PAYMENTS FOR THE YEAR ENDED 30 JUNE (CONTINUED)(ii) Long Term Incentive (LTI)LTI includes the award of Performance Share Rights (PSRs) and/or Options which do not carry dividend or voting entitlements and will only vest if certain performance standards are met. PSRs have a performance period of four years, and Options have a performance period of five years. Half of each LTI award is subject to a market hurdle, namely Origin’s Total Shareholder Return (TSR) relative to a Reference Group of ASX-listed companies identified in the Remuneration Report. Half of each LTI award is subject to an internal hurdle, namely Return on Capital Employed (ROCE) as set out in the Remuneration Report. The number of awards that may vest depends on performance against each hurdle, considered separately. For awards subject to the relative TSR hurdle, no vesting occurs unless Origin’s TSR over the performance period (4 years if the award is in PSRs, 5 years if the award is in Options) is ranked above the 50th percentile of the Reference Group. 50 per cent vesting occurs if the 50th percentile is exceeded. Full vesting occurs if Origin is ranked at or above the 75th percentile of the Reference Group, with pro-rata vesting between these two vesting points. The relative TSR hurdle may apply to either PSRs or Options. For KMP the relative TSR hurdle applies only to Options. For awards subject to the ROCE hurdle, no vesting occurs unless Origin achieves two conditions, the first to meet the average of the four annual target ROCEs, and the second to achieve Origin’s weighted average cost of capital in the third or fourth year. 50 per cent vesting occurs if those two conditions are met. Full vesting occurs if Origin exceeds the weighted average cost of capital by two percentage points in the third or fourth year. Pro rata vesting occurs between those two vesting points. The ROCE hurdle applies only to PSRs, including for key management personnel.
Vested Options may be exercised up to a maximum of 10 years after grant date. The exercise price of Options is based on the weighted average price of the Company’s shares over a period of 30 trading days referenced to 30 June, or in the case of awards to the Chief Executive Officer subject to shareholder approval, as announced in the relevant shareholder resolution. As there is no exercise price for PSRs, once vested they are exercised automatically. When exercised, either automatically or upon payment of the exercise price, a vested award is converted into one fully paid ordinary share that carries voting and dividend entitlements.
The fair value of the awards granted is recognised as an employee expense, with a corresponding increase in equity, over the vesting period. In exceptional circumstances1 unvested PSRs or Options may be held ‘on foot’ subject to the specified performance hurdles and other plan conditions being met, or dealt with in an appropriate manner determined by the Board. For PSRs or Options subject to the relative TSR condition fair value is measured at grant date using a Monte Carlo simulation model that takes into account the exercise price, share price at grant date, price volatility, dividend yield, risk-free interest rate for the term of the security and the likelihood of meeting the TSR market condition. The expected volatility reflects the assumption that the historical volatility over a period similar to the life of the options is indicative of future trends, which may not necessarily be the actual outcome. The amount recognised as an expense is adjusted to reflect the actual number of awards that vest except where due to non-achievement of the TSR market condition. Set out below are the inputs used to determine the fair value of the PSRs and Options granted during the year. For PSRs subject to the ROCE condition, the initial fair value at grant date is the market value of an Origin share less the discounted value of dividends foregone, and the expensing value is trued-up at each reporting period to the expected outcome as assessed at that time.
OPTIONS PSRS
Grant date 30-Aug-16 19-Oct-16 30-Aug-16 19-Oct-16Grant date share price $5.25 $5.62 $5.25 $5.62Exercise price $5.67 $5.21 Nil NilVolatility (per cent) 38% 39% 38% 39%Dividend yield (per cent)2 1.8% 1.8% 1.5% 1.5%Risk-free rate (per cent) 1.69% 2.05% 1.47% 1.78%
Grant date fair value (per award) $2.79 (TSR)
$1.37 $1.76 $4.95 (ROCE) $5.32 (ROCE)
1 The Equity Incentive Plan Rules set out the circumstances as death, disability, redundancy, genuine retirement, or other exceptional circumstances approved by the Board.2 Dividend assumptions are the compound average per annum rate over the vesting period (4 years PSRs, and 5 years Options).

137ORIGIN ENERGY PAGE TITLE 137NOTES TO THE FINANCIAL STATEMENTS
F3 SHARE-BASED PAYMENTS (CONTINUED)EXPLANATORY NOTES TO SHARE-BASED PAYMENTS FOR THE YEAR ENDED 30 JUNE (CONTINUED)Equity Incentive Plan awards outstandingSet out below is a summary of awards outstanding at the beginning and end of the financial year.
OPTIONS
WEIGHTED AVERAGE EXERCISE
PRICE PSRS DSRS
Outstanding at 1 July 2016 18,022,234 $11.99 5,479,633 4,199,028Granted 2,302,631 $5.58 1,725,214 3,497,212Exercised – – – 1,986,376Forfeited 10,438,751 $12.13 3,718,490 275,207
OUTSTANDING AT 30 JUNE 2017 9,886,114 $10.35 3,486,357 5,434,657
Exercisable at 30 June 2017 – – – –
Outstanding at 1 July 2015 19,322,406 $13.30 8,725,038 1,518,469Granted1 3,709,418 $6.92 1,831,456 3,999,436Exercised – – – 1,147,690Forfeited 5,009,590 $13.27 5,076,861 171,187
OUTSTANDING AT 30 JUNE 2016 18,022,234 $11.99 5,479,633 4,199,028
Exercisable at 30 June 2016 – – – –
1 The number of DSRs issued in 2014 was adjusted for the October 2015 rights issue for all participants except Executive Directors to eliminate any material advantage or disadvantage to participants.
The weighted average share price during 2017 was $6.39 (2016: $5.67). The options outstanding at 30 June 2017 have an exercise price in the range of $5.21 to $15.65 and a weighted average contractual life of 6.3 years (2016: 4.3 years).
For more information on these share plans and performance rights issued to KMPs, refer to the Remuneration Report.
(b) Employee Share Plan (ESP)Under the ESP all full-time and permanent part-time employees of the Company who are based in Australia or New Zealand with at least one year of continuous service at 30 June of the performance year are granted up to AUD $1,000 of fully paid Origin shares conditional upon the Company meeting certain safety targets. The shares are granted for no consideration. Shares awarded under the ESP are purchased on-market, registered in the name of the employee, and are restricted for three years, or until cessation of employment, whichever occurs first. New Zealand employees may elect to have shares held in trust for three years.
Details of the shares awarded under the ESP during the year are set out below.
GRANT DATESHARES
GRANTEDCOST PER
SHARE1TOTAL COST
$’000
2017
26-Aug-16 870,302 $5.51 4,795
870,302 4,795
2016
25-Sep-15 708,647 $7.18 5,088
708,647 5,088
1 The cost per share represents the weighted average market price of the Company’s shares on the grant date.
F4 RELATED PARTY DISCLOSURESThe Group’s interests in equity accounted entities and details of transactions with these entities are set out in note E1.
Certain directors of Origin Energy Limited are also directors of other companies that supply Origin Energy Limited with goods and services or acquire goods or services from Origin Energy Limited. Those transactions are approved by management within delegated limits of authority and the Directors do not participate in the decisions to enter into such transactions. If the decision to enter into those transactions should require approval of the Board, the Director concerned will not vote upon that decision nor take part in the consideration of it.

138 ORIGIN ENERGY PAGE TITLE 138 NOTES TO THE FINANCIAL STATEMENTS
F5 KEY MANAGEMENT PERSONNEL
2017$
2016$
Short-term employee benefits 9,383,880 9,858,958Post-employment benefits 240,273 243,057Other long-term benefits 373,647 287,802Termination benefits 2,919,096 –Share-based payments 2,371,204 3,858,411
15,288,100 14,248,228
LOANS AND OTHER TRANSACTIONS WITH KEY MANAGEMENT PERSONNELThere were no loans with key management personnel during the year.
Transactions entered into during the year with key management personnel are normal employee, customer or supplier relationships and have terms and conditions which are no more favourable than dealings in the same circumstances on an arm’s length basis. These transactions include:
– the receipt of dividends from Origin Energy Limited or participation in the Dividend Reinvestment Plan;
– participation in the Employee Share Plan, Equity Incentive Plan and Non-Executive Director Share Plan;
– participation in the October 2015 rights issue as a shareholder;
– terms and conditions of employment or directorship appointment;
– reimbursement of expenses incurred in the normal course of employment;
– purchases of goods and services; and
– receipt of interest on Retail Notes.
F6 NOTES TO THE STATEMENT OF CASH FLOWSCash includes cash on hand, at bank and short-term deposits, net of outstanding bank overdrafts.
The following table reconciles profit to net cash provided by operating activities.
NOTE2017
$MILLION2016
$MILLION2
LOSS FOR THE PERIOD (2,223) (615)
Adjustments to reconcile profit to net cash provided by operating activities:Depreciation and amortisation 481 623Executive share-based payment expense 25 32Impairment losses recognised – trade and other receivables 75 67Exploration expense 62 63Impairment of assets 1,692 691(Increase)/decrease in fair value of financial instruments (207) 290Net financing costs 341 347Increase in tax balances (23) (92)Gain on sale of assets (401) (39)Non-cash share of net profits of equity accounted investees 1,912 228Unrealised foreign exchange loss 76 40Oil forward sale (141) (139)Oil option premium 53 (117)Changes in assets and liabilities, net of effects from acquisitions/disposals:– Receivables (487) 8– Inventories 52 (11)– Payables 58 96– Provisions (24) (39)– Other (32) (29)
TOTAL ADJUSTMENTS1 3,512 2,019
NET CASH FROM OPERATING ACTIVITIES 1,289 1,404
The following non-cash financing and investing activities have not been included in the statement of cash flows:
Issue of shares in respect of the Dividend Reinvestment Plan C6 – 42
1 Adjustments include amounts that are classified as discontinued operations and held for sale at 30 June 2017 and 30 June 2016. Refer to note E4 for details of cash flows relating to discontinued operations.
2 Certain amounts have been restated to reflect adjustments relating to note F12.

139ORIGIN ENERGY PAGE TITLE 139NOTES TO THE FINANCIAL STATEMENTS
F7 AUDITORS’ REMUNERATIONDuring the year the following fees were paid or payable for services provided by the auditor of the parent entity, its related practices and non-related audit firms:
2017$'000
2016$'000
AUDIT AND REVIEW SERVICES OF THE FINANCIAL REPORTS BY:
Auditors of the Group (KPMG)1 3,042 2,431Other auditors 82 76
3,124 2,507
OTHER SERVICES BY:
Auditors of the Group (KPMG)Accounting advice 45 20Taxation services 65 17Legal services 211 –Assurance services:– equity and debt transactions2 632 159– contract compliance – 140– other 18 45
971 381
4,095 2,888
1 Included in this amount is $534,000 relating to the audit and review of financial reports for Lattice Energy in 2017.2 Includes IPO transaction services and US 144A advisory services for Lattice Energy in 2017 (2016: equity raising fees).
F8 MASTER NETTING OR SIMILAR AGREEMENTSThe Group enters into derivative transactions under International Swaps and Derivatives Association (ISDA) master netting agreements. In general, under such agreements the amounts owed by each counterparty on a single day in respect of all transactions outstanding in the same currency are aggregated into a net amount payable by one party to the other.
Financial assets and liabilities are offset, and the net amount reported in the statement of financial position, where the Group has a legally enforceable right to offset recognised amounts and there is an intention to settle on a net basis or realise the asset and settle the liability simultaneously. The Group has also entered into arrangements that do not meet the criteria for offsetting, but still allow for the related amounts to be offset in certain circumstances, such as a loan default or the termination of a contract.
The following table presents the recognised financial instruments that are offset, or subject to master netting arrangements but not offset, as at reporting date. The column ‘net amount’ shows the impact on the Group’s statement of financial position if all set-off rights were exercised.
GROSS AMOUNT
$MILLION
AMOUNT OFFSET IN THE
STATEMENT OF FINANCIAL
POSITION $MILLION
AMOUNT IN THE
STATEMENT OF FINANCIAL
POSITION $MILLION
RELATED AMOUNT
NOT OFFSET $MILLION
NET AMOUNT $MILLION
30 JUNE 2017
Derivative financial assets 1,708 (412) 1,296 (414) 882Derivative financial liabilities (2,021) 412 (1,609) 414 (1,195)
30 JUNE 20161
Derivative financial assets 1,674 (372) 1,302 (437) 865Derivative financial liabilities (2,027) 372 (1,655) 437 (1,218)
1 Certain amounts have been restated to reflect adjustments relating to note F12.

140 ORIGIN ENERGY PAGE TITLE 140 NOTES TO THE FINANCIAL STATEMENTS
F9 DEED OF CROSS GUARANTEEThe parent entity has entered into a Deed of Cross Guarantee through which the Group guarantees the debts of certain controlled entities. The controlled entities that are party to the Deed, are shown in note E3.
The following consolidated statement of comprehensive income and retained profits, and statement of financial position comprises the Company and its controlled entities which are party to the Deed of Cross Guarantee after eliminating all transactions between parties to the Deed.
FOR THE YEAR ENDED 30 JUNE2017
$MILLION2016
$MILLION1
CONSOLIDATED STATEMENT OF COMPREHENSIVE INCOME AND RETAINED PROFITS
Revenue 13,646 11,526Other income 393 105Expenses (12,509) (11,698)Share of results of equity accounted investees (1,912) (225)Impairment (753) –Interest income 224 222Interest expense (590) (629)
LOSS BEFORE INCOME TAX (1,501) (699)Income tax (expense)/benefit (102) 180
LOSS FOR THE PERIOD (1,603) (519)Other comprehensive income 1 –
TOTAL COMPREHENSIVE INCOME FOR THE PERIOD (1,602) (519)
RETAINED EARNINGS AT THE BEGINNING OF THE PERIOD 5,834 6,748Adjustments for entities entering the Deed of Cross Guarantee – 57
RETAINED EARNINGS AT THE BEGINNING OF THE PERIOD 5,834 6,805Dividends paid – (452)
RETAINED EARNINGS AT THE END OF THE PERIOD 4,232 5,834
1 Certain amounts have been restated to reflect adjustments relating to note F12.

141ORIGIN ENERGY PAGE TITLE 141NOTES TO THE FINANCIAL STATEMENTS
F9 DEED OF CROSS GUARANTEE (CONTINUED)
AS AT 30 JUNE2017
$MILLION2016
$MILLION1
STATEMENT OF FINANCIAL POSITIONCURRENT ASSETS
Cash and cash equivalents 44 49Trade and other receivables 3,321 4,403Inventories 123 231Derivatives 240 237Other financial assets 86 312Income tax receivable – 56Assets classified as held for sale 2,050 220Other assets 99 135
TOTAL CURRENT ASSETS 5,963 5,643
NON-CURRENT ASSETS
Trade and other receivables 1,831 845Derivatives 1,055 1,065Other financial assets 4,614 6,041Investments accounted for using the equity method 5,451 5,933Property, plant and equipment 2,934 4,700Exploration and evaluation assets 63 310Development assets – 292Intangible assets 5,131 5,172Deferred tax assets 187 457Other assets 34 27
TOTAL NON-CURRENT ASSETS 21,300 24,842
TOTAL ASSETS 27,263 30,485
CURRENT LIABILITIES
Trade and other payables 2,544 2,938Payables to joint ventures 130 –Interest-bearing liabilities 127 102Derivatives 300 18Other financial liabilities 387 375Provision for income tax 51 –Employee benefits 179 209Provisions 33 49Liabilities classified as held for sale 720 19
TOTAL CURRENT LIABILITIES 4,471 3,710
NON-CURRENT LIABILITIES
Trade and other payables 8,625 8,703Interest-bearing liabilities 1,016 2,055Derivatives 1,309 1,637Employee benefits 34 35PROVISIONS 64 577
TOTAL NON-CURRENT LIABILITIES 11,048 13,007
TOTAL LIABILITIES 15,519 16,717
NET ASSETS 11,744 13,768
EQUITY
Share capital 7,150 7,150Reserves 362 784Retained earnings 4,232 5,834
TOTAL EQUITY 11,744 13,768
1 Certain amounts have been restated to reflect adjustments relating to note F12.

142 ORIGIN ENERGY PAGE TITLE 142 NOTES TO THE FINANCIAL STATEMENTS
F10 PARENT ENTITY DISCLOSURESThe following table sets out the results and financial position of the parent entity, Origin Energy Limited.
ORIGIN ENERGY LIMITED2017
$MILLION2016
$MILLION
Loss for the period (17) (30)Other comprehensive income, net of income tax 1 3
TOTAL COMPREHENSIVE INCOME FOR THE PERIOD (16) (27)
FINANCIAL POSITION OF THE PARENT ENTITY AT PERIOD END
Current assets 1,517 1,418Non-current assets 17,813 17,949
TOTAL ASSETS 19,330 19,367
Current liabilities 2,344 994Non-current liabilities 9,173 10,568
TOTAL LIABILITIES 11,517 11,562
Share capital 7,150 7,150Share-based payments reserve 221 197Hedging reserve (25) (26)Retained earnings 467 484
TOTAL EQUITY 7,813 7,805
CONTINGENT LIABILITIES OF THE PARENT ENTITY
Bank guarantees – unsecured 1 11
The parent entity has entered into a deed of indemnity for the cross-guarantee of liabilities of a number of controlled entities. Refer to note E3.
The parent entity has also provided guarantees for certain contractual commitments of its joint ventures associated with capital projects.
F11 NEW STANDARDS AND INTERPRETATIONS NOT YET ADOPTEDA number of new standards, amendments to standards and interpretations are effective for annual periods beginning on or after 1 July 2017 and have not been applied in preparing these financial statements. The Group has reviewed these standards and interpretations, and, with the exception of AASB 9 Financial Instruments, AASB 15 Revenue from Contracts with Customers and AASB 16 Leases, determined that none of these standards and interpretations materially impact the Group.
The Group has commenced a project to implement the changes resulting from AASB 9, AASB 15 and AASB 16. The first phase of this project, a qualitative impact assessment, was completed in the period. The Group’s initial assessment of impacts arising from each standard is disclosed below. These are not necessarily exhaustive and will evolve as work progresses.
AASB 9 Financial Instruments and AASB 2014-7 Amendments to Australian Accounting Standards arising from AASB 9AASB 9 replaces AASB 139 Financial Instruments: Recognition and Measurement. The standard will become effective for the Group for the reporting period beginning 1 July 2018. Retrospective application is required with some exceptions. The Group does not intend to early adopt the standard.
Whilst further work is required to quantify any changes, the Group currently expects the following impacts upon initial adoption of AASB 9:
– Classification of available-for-sale financial assets – The Group has available-for-sale financial assets which are likely to be reclassified to either amortised cost or to fair value. The Group does not hold any financial liabilities at fair value through profit and loss and as such there is no impact of the new standard on financial liabilities.
– Hedge relationships – The standard introduces a new hedge accounting model which more closely aligns hedge accounting with risk management objectives. As a general rule more hedge relationships are eligible for hedge accounting and the Group is actively reviewing options to expand its hedging relationships. Existing hedge relationships should continue to qualify as effective hedge relationships upon adoption of the new standard.
– Bad debt provisioning – The standard introduces a new impairment model for financial assets. Bad debt provisioning will need to move from the existing incurred model (based on the historical experience of bad debts) to an expected loss model (based on expected level of bad debts with reference to current and forecast credit conditions). The model will need to be applied to the Group’s trade receivables and unbilled revenue and, for some categories of debt, may result in the earlier recognition of bad debt provisions. Currently, allowances for doubtful receivables are recognised by assessing each receivable balance for collectability based on analysis of various historical factors.
AASB 7 Financial Instruments: Disclosures has been amended to reflect the requirements of AASB 9 and also introduces a number of new disclosure requirements. The Group is currently assessing the extent of these new disclosure requirements but expects that there will be an impact on future statutory reporting.

143ORIGIN ENERGY PAGE TITLE 143NOTES TO THE FINANCIAL STATEMENTS
F11 NEW STANDARDS AND INTERPRETATIONS NOT YET ADOPTED (CONTINUED)AASB 15 Revenue from Contracts with CustomersAASB 15 replaces AASB 111 Construction Contracts, AASB 118 Revenue and related Interpretations. Retrospective application is required, however the Group will have the option to either restate comparative period balances or record a cumulative adjustment at the beginning of the period in which the standard is first adopted. The Group will adopt the new standard when it becomes effective in the financial year beginning 1 July 2018.
AASB 15 applies to the recognition of revenue for the Group’s contracts with customers. Where a bundle of goods and/or services is sold under one contract the standard requires consideration for each component of the sale be recognised as revenue when an entity transfers control of each individual promised good or service to its customer. The Group’s work to date has focused on identifying the areas of the business that have the highest potential impact.
Significant work is required to understand the financial statement impact and any changes to systems, processes and policies in order to implement the new standard due to the following factors:
– The new requirements are far more comprehensive than existing revenue standards;
– AASB 15 requires the identification and assessment of individual rights and obligations in each customer contract;
– The highly contracted nature of revenues earned by the Group; and
– The pervasiveness and importance of revenue recognition.
To date, the Group has identified certain areas of the business where work effort will be prioritised to understand and assess individual components of each contract and the potential differences between current revenue recognition and the requirements of AASB 15. Initially, this will focus on electricity retailing to Mass Market customers and the estimates and judgements involved in the unbilled revenue recognition process; long-term gas sales arrangements and the associated complexities with take-or-pay terms and specific quantitative and qualitative disclosures required under AASB 15.
The Group is currently in the process of determining the potential impact of adopting AASB 15 and management cannot at this stage reasonably quantify the estimated impact in the period of initial application.
AASB 16 LeasesAASB 16 replaces AASB 117 Leases and related Interpretations. It is effective for the Group for the reporting period beginning 1 July 2019. The new standard must be implemented retrospectively, either by restating comparatives or by recognising the cumulative impact at the date of initial application. The Group is currently assessing the most appropriate transition option, however adoption of AASB 16 will have an impact on the Group’s balance sheet and retained earnings.
AASB 16 requires lessees to account for all leases under a single on-balance sheet model in a similar way to finance leases under the current standard. The standard further introduces a new definition of a lease, which focuses on the right to control the use of an identified asset.
At commencement of a lease arrangement, a lessee will recognise a liability to make lease payments (“the lease liability”) and an asset representing the right to use the underlying asset during the lease term (“the right-of-use asset”). Lessees will be required to separately recognise interest expense on the lease liability and depreciation expense on the right-of-use asset. For lease arrangements which would have been treated as operating leases under the current accounting standard there would be a corresponding reduction in “other operating expenses” where operating lease expenses are currently recognised.
The standard includes two recognition exemptions for lessees – leases of ’low-value’ assets (e.g., personal computers) and short-term leases (leases with a duration of 12 months or less) however the total value of leases which have not been recognised is required to be disclosed in the financial statements.
At 30 June 2017, the Group has $398 million of non-cancellable operating lease commitments. Related information is disclosed in note F2 of the financial statements. Upon implementation of the new standard all lease arrangements will be recognised on the balance sheet. The Group has identified certain areas of the business where further work is required to understand and assess arrangements that may contain a lease under the new definition which are not leases under the current definition and therefore are not included in the non-cancellable operating lease commitment disclosures. In addition, the Group will be required to assess option or renewal periods identified in lease agreements. Where such options are reasonably certain of exercise, further lease payments will be included in the calculation of the lease liability and right-of-use asset, in addition to those currently disclosed in operating lease commitments.
The Group cannot reasonably estimate the impact in the period of initial application at this stage and will continue to work through the implications of the new standard across the business. To date, work has focused on identifying the provisions of the standard that will most impact the Group. In the remainder of 2017, work on these issues and their resolution will continue. This will include a detailed review of contracts, consideration of financial reporting impacts and an assessment of required changes to systems.

144 ORIGIN ENERGY PAGE TITLE 144 NOTES TO THE FINANCIAL STATEMENTS
F12 POWER PURCHASE ARRANGEMENTS ADJUSTMENTPower Purchase Arrangements (PPAs) are entered into with third parties (power generator entities) by the Group in order to ensure it can continue to purchase electricity at predetermined prices and to meet its commitments under the Renewable Energy Target Scheme. The Group has historically concluded that all PPAs were supply contracts for the delivery of electricity and Renewable Energy Certificates (RECs) as the contracts required physical delivery of the products and the view that the Australian Electricity Market Operator (AEMO) was a market clearing house that is used to settle such arrangements. As the Group has a short generation position (i.e. it needs to purchase energy from the market to meet electricity demand of its customers) the accounting outcome reflected the economic rationale for entering into the arrangements.
Whilst the accounting standards that outline the measurement and presentation requirements to be applied to PPAs have not changed, there has been a review of the accounting treatment for these contracts since the half year ended 31 December 2016. As a number of the PPAs require net settlement due to the structure of the electricity market, it has been concluded that the net payment made to or received from the third party should be accounted for as a derivative financial instrument. As a result, the Group has determined the fair value of these arrangements and recognised a derivative asset or liability at each reporting date. This change in accounting treatment has been reflected in both the current and comparative periods.
The Group has restated each of the affected financial statement line items for the prior year, as detailed below.
Impact on equity (increase/(decrease))
30 JUNE 2016
PREVIOUSLY REPORTED
$MILLIONADJUSTMENT
$MILLIONRESTATED $MILLION
Derivative assets – current 253 (16) 237Derivative assets – non-current 1,134 (69) 1,065Deferred tax assets – 92 92TOTAL ASSETS 28,898 7 28,905Derivative liabilities – non-current 1,050 587 1,637Deferred tax liabilities 110 (110) –TOTAL LIABILITIES 14,368 477 14,845NET IMPACT ON EQUITY 14,530 (470) 14,060
1 JULY 2015 $MILLION $MILLION $MILLION
Derivative assets – non-current 859 2 861Deferred tax assets – 38 38TOTAL ASSETS 33,367 40 33,407Derivative liabilities – non-current 1,309 618 1,927Deferred tax liabilities 147 (147) –TOTAL LIABILITIES 19,208 471 19,679Retained earnings 7,548 (431) 7,117NET IMPACT ON EQUITY 14,159 (431) 13,728
IMPACT ON INCOME STATEMENT (INCREASE/(DECREASE)) 30 JUNE 2016 $MILLION $MILLION $MILLION1
Expenses (12,127) (56) (12,183)
NET IMPACT ON PROFIT FOR THE YEAR (576) (39) (615)
1 Excludes impact of discontinued operations re-presentation.
IMPACT ON BASIC AND DILUTED EARNINGS PER SHARE (EPS) (INCREASE/(DECREASE) IN EPS)EARNINGS PER SHARE
Basic earnings per share (2.5)Diluted earnings per share (2.5)
The change did not have an impact on OCI for the period or the Group’s operating, investing and financing cash flows.
F13 SUBSEQUENT EVENTSNo item, transaction or event of a material nature has arisen since 30 June 2017 that would significantly affect the operations of the Group, the results of those operations, or the state of affairs of the Group, in future financial periods.

145ORIGIN ENERGY PAGE TITLE 145NOTES TO THE FINANCIAL STATEMENTSDIRECTORS' DECLARATION
1 In the opinion of the Directors of Origin Energy Limited (the Company):
(a) the consolidated financial statements and notes are in accordance with the Corporations Act 2001 (Cth), including:
(i) giving a true and fair view of the financial position of the Group as at 30 June 2017 and of its performance, for the year ended on that date; and
(ii) complying with Australian Accounting Standards (including the Australian Accounting Interpretations) and the Corporations Regulations 2001 (Cth).
(b) the consolidated financial statements also comply with International Financial Reporting Standards as disclosed in the Overview of the consolidated financial statements.
(c) there are reasonable grounds to believe that the Company will be able to pay its debts as and when they become due and payable.
2 There are reasonable grounds to believe that the Company and the controlled entities identified in note E3 will be able to meet any obligations or liabilities to which they are or may become subject to by virtue of the Deed of Cross Guarantee between the Company and those controlled entities pursuant to ASIC Corporations (Wholly-owned Companies) Instrument 2016/785.
3 The Directors have been given the declarations required by section 295A of the Corporations Act 2001 (Cth) from the Chief Executive Officer and the Chief Financial Officer for the financial year ended 30 June 2017.
Signed in accordance with a resolution of the Directors:
Gordon M Cairns, Chairman Director Sydney, 16 August 2017
DIRECTORS' DECLARATION
146 ORIGIN ENERGY PAGE TITLE 146 INDEPENDENT AUDITOR'S REPORT
INDEPENDENT AUDITOR'S REPORT

147ORIGIN ENERGY PAGE TITLE 147INDEPENDENT AUDITOR'S REPORT

148 ORIGIN ENERGY PAGE TITLE 148 INDEPENDENT AUDITOR'S REPORT

149ORIGIN ENERGY PAGE TITLE 149INDEPENDENT AUDITOR'S REPORT

150 ORIGIN ENERGY PAGE TITLE 150 INDEPENDENT AUDITOR'S REPORT
151ORIGIN ENERGY PAGE TITLE 151 INDEPENDENT AUDITOR'S REPORT

152 ORIGIN ENERGY PAGE TITLE 152
Information set out below was applicable as at 16 August 2017.
As at 16 August 2017, there were:
– 152,397 holders of ordinary shares in the Company; and
– 105 holders of 9,874,379 Options, 88 holders of 3,486,357 Performance Share Rights, and 480 holders of 6,242,583 Deferred Share Rights granted under the Origin Energy Equity Incentive Plan.
There is not a current on-market buy-back of Origin shares.
During the reporting period, 870,302 Origin shares were purchased on-market for the purpose of the Employee Share Plan. The average price per share purchased was $5.51.
ANALYSIS OF SHARES
HOLDINGS RANGES HOLDERS TOTAL UNITSPERCENTAGE OF
TOTAL UNITS
1–1,000 61,458 27,536,629 1.6
1,001–5,000 66,218 159,847,961 9.1
5,001–10,000 15,216 106,641,495 6.1
10,001–100,000 9,270 188,313,375 10.7
100,001–99,999,999,999 235 1,273,098,715 72.5
TOTALS 152,397 1,755,438,175 100.0
At 16 August 2017, 6,659 shareholders held less than a marketable parcel.
SUBSTANTIAL SHAREHOLDERSThere were no substantial shareholders as disclosed by notices received by the Company as at 16 August 2017.
TOP 20 HOLDINGS
SHAREHOLDERNUMBER OF
SHARESPERCENTAGE OF
ISSUED SHARES
HSBC Custody Nominees 502,103,622 28.6JP Morgan Nominees Australia 303,035,562 17.3Citicorp Nominees Pty Limited 146,794,466 8.4National Nominees Limited 104,739,007 6.0BNP Paribas Nominees Pty Ltd <Agency Lending DRP A/C> 48,242,864 2.8BNP Paribas Noms Pty Ltd <DRP> 26,135,095 1.5Citicorp Nominees Pty Limited <Colonial First State Inv A/C> 18,893,675 1.1Argo Investments Limited 10,959,203 0.6AMP Life Limited 10,516,444 0.6HSBC Custody Nominees (Australia) Limited <NT-Comnwlth Super Corp A/C> 8,363,915 0.5Australian Foundation Investment Company Limited 6,000,000 0.3CS Third Nominees Pty Limited <HSBC Cust Nom Au Ltd 13 A/C> 3,896,466 0.2The Senior Master of The Supreme Court <Common Fund No 3 A/C> 3,580,943 0.2RBC Investor Services Australia Nominees Pty Limited <MBA A/C> 3,418,150 0.2Forsyth Barr Custodians Ltd <Forsyth Barr Ltd-Nominee A/C> 2,848,215 0.2
HSBC Custody Nominees (Australia) Limited-GSCO Eca 2,715,523 0.2Navigator Australia Ltd <MLC Investment Sett A/C> 1,954,151 0.1RBC Investor Services Australia Nominees Pty Ltd <VFA A/C> 1,822,597 0.1National Nominees Limited <DB A/C> 1,800,555 0.1IOOF Investment Management Limited <IPS Super A/C> 1,687,239 0.1Total Securities of Top 20 Holdings 1,209,507,692 68.9
Total of securities 1,755,438,175
SHARE AND SHAREHOLDER INFORMATION
SHARE AND SHAREHOLDER INFORMATION

153ORIGIN ENERGY PAGE TITLE 153
SHAREHOLDER ENQUIRIESFor information about your shareholding, to notify a change of address, to make changes to your dividend payment instructions or for any other shareholder enquiries, contact Origin Energy’s share registry, Boardroom Pty Ltd on 1300 664 446. Please note that broker sponsored holders are required to contact their broker to amend their address.
When contacting the share registry, shareholders should quote their security holder reference number, which can be found on the holding or dividend statements.
Shareholders with internet access can update and obtain information regarding their shareholding at https://www.originenergy.com.au/about/investors-media.html
TAX FILE NUMBERFor resident shareholders who have not provided the share registry with their Tax File Number (TFN) or exemption category details, tax at the top marginal tax rate (plus Medicare levy) will be deducted from dividends to the extent they are not fully franked. For those shareholders who have not as yet provided their TFN or exemption category details, forms are available from the share registry. Shareholders are not obliged to provide this information if they do not wish to do so.
INFORMATION ON ORIGIN The main source of information for shareholders is the Annual Report and the Shareholder Review. Both the Annual Report and Shareholder Review will be provided to shareholders on request and free of charge. Shareholders not wishing to receive the Annual Report should advise the share registry in writing so that their names can be removed from the mailing list. Origin’s website www.originenergy.com.au is another source of information for shareholders.
SECURITIES EXCHANGE LISTINGOrigin shares are traded on the Australian Securities Exchange Limited (ASX). The symbol under which Origin shares are traded is ‘ORG’.
VOTING RIGHTS OF MEMBERSAt a meeting of members, each member who is entitled to attend and vote may attend and vote in person or by proxy, attorney or representative. On a show of hands, every person present who is a member, proxy, attorney or representative, shall have one vote and on a poll, every member who is present in person or by proxy, attorney or representative shall have one vote for each fully paid share held.
SHARE AND SHAREHOLDER INFORMATION
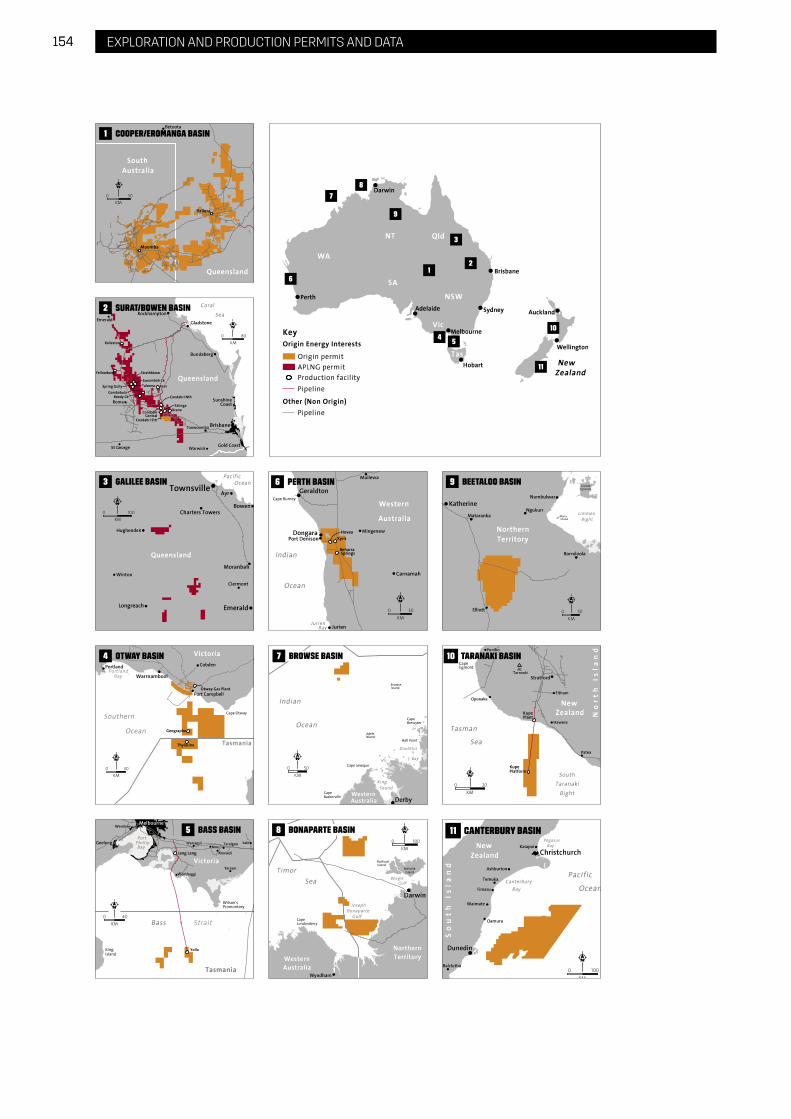
154 ORIGIN ENERGY PAGE TITLE 154 EXPLORATION AND PRODUCTION PERMITS AND DATA
5 BASS BASIN
4 OTWAY BASIN
3 GALILEE BASIN
2 SURAT/BOWEN BASIN
1 COOPER/EROMANGA BASIN
10
11
54
12
3
9
8
7
6
BONAPARTE BASIN8
BROWSE BASIN7
BASS BASIN 6 PERTH BASIN
11 CANTERBURY BASIN
9 BEETALOO BASIN
10 TARANAKI BASIN

155EXPLORATION AND PRODUCTION PERMITS AND DATA
BASIN/PROJECT AREA INTEREST
AUSTRALIACOOPER BASIN (South Australia)Patchawarra East Block PPLs 10.54%SA Unit PPLs 13.19%Reg Sprigg West Unit(PPL 194/PPL 211 ) 7.90%PEL 637 and PRL 106 40.00%PELs 638 33.75%
COOPER BASIN (Queensland)SWQ Unit Subleases 16.74%Aquitaine A & B Blocks of ATP 1189P and associated PLs 25.00%Aquitaine C Block of ATP 1189P and associated PLs 27.00%Wareena Block of ATP 1189P and associated PLs 10.00%
GALILEE BASIN (Queensland)ATP’s 666P, 667P and 668P 37.50% *1
SURAT BASIN (Queensland)ATP 788P (Shallows) 100.0% *ATP 788P (Deeps) 25.00% *
DENISON TROUGH (Queensland)PL’s 41, 42, 43, 44, 45, 54, 67, 173, 183 and 218 18.75% *1ATP 1191 Farm-out (Production) 11.25% *1ATP 337P (Exploration) and PL’s 450(A), 451(A), 457(A) and 1012(A) 18.75% 1ATP 1191 18.75% 1ATP 1177P 18.75% 1PPL’s 10 and 11 18.75% *1
LNG (Gladstone)PPL’s 162 and 163 37.50% *1PFL 20 37.50% *1
CSG (Queensland)FairviewATP 526P, ATP 2012P** and PL’s 90, 91, 92, 99, 100, 232, 233, 234, 235 and 236, PL(A) 1017 8.97% 1
Spring GullyATP 592P and PL’s 195, 203, 414, 415, 416, 417, 418, 268(A)~ and 419(A) 35.44% *1PL 204 37.40% *1PL 200 35.89% *1PPL 180 37.50% *1
BASIN/PROJECT AREA INTEREST
AUSTRALIATalinga/OranaATP 692P and PL’s 209, 215, 226, 272, 216(A), 225(A), 445(A)) 37.50% *1PPL’s 171 and 181 37.50% *1PFL 26 37.50% *1
Kenya/Argyle/Lauren/BellevuePL’s 179, 180, 228, 229 and 263 15.23% 1PL 247 11.02% 1ATP 648 and PL’s 257, 273, 274, 275, 278, 279, 442, 466, 474 and 503 11.72% 1PL 1025 11.72% 1PFL 19 11.72% 1PPL’s 107, 176 and 2014 15.23% 1
PeatPL 101 37.50% *1
Other Bowen BasinATP 804P 10.99% 1ATP 745P and PL’s 420, 421 and 440 8.94% 1PL’s 219 and 220 37.50% *1
Other Surat BasinATP 606P and PL’s 297, 403, 404, 407, 408, 405(A), 406(A), 412(A), 413(A) and 444(A) 34.77% *1ATP 631P and PL’s 281(A) and 282(A) 6.79% 1ATP 663P and PL’s 434(A), 435(A), 436(A), 437(A), 438(A) and 439(A) 37.50% *1ATP 973P and PL’s 265, 266 and 267 37.50% *1ATP 972P and PL’s 469(A), 470(A) and 471(A) 34.77% *1PL 1011 37.50% *1PL 1018 37.50% *1PPL’s 143, 177, 178, 185, 186, and 2000 37.50% *1
ONSHORE OTWAY BASINVictoriaPPL’s 6,9 and PRL1 90.00% *PPL’s 4, 5, 7, 10 and 12 100.00% *PPL 2 Ex (Iona Exclusion) 100.00% *PPL 8 100.00% *
OFFSHORE OTWAY BASINVictoriaVic/P42 (V) 100.00% *Vic/P43 70.77% * 2Vic/L23 67.23% *Vic/P69 100.00% *Vic/L1(V) 100.00% *
BASIN/PROJECT AREA INTEREST
AUSTRALIATasmaniaT/L2 and T/L3 67.23% *T/30P 70.77% *
Bass Basin (Tasmania)T/L1 42.50% *T/RL 2, 3, 4 and 5 39.00% *
PERTH BASIN (Western Australia)EP320 and L11 67.00% *L 14 49.19% *L1/L2 (Excluding Dongara, Mondarra and Yardarino) 50.00%
BROWSE BASIN (Western Australia)WA-315-P, WA-398-P and TP/28 40.00%
BONAPARTE BASIN (Western Australia & Northern Territory)WA-454-PNT/RL1 and WA-6-R 100.005.00% * 3NT/P84 50.00% *NT/P85 50.00%
BEETALOO BASIN (NORTHERN TERRITORY)EP 76, EP 98 and EP117 35.00% *4
NEW ZEALANDTARANAKI BASINPML 38146 50.00% *
CANTERBURY BASINPEP 38264 45.00%
Notes:* Operatorship1 Interest held through 37.5 per cent ownership
of Australia Pacific LNG Joint Venture.** Replacement tenure for parts of ATP 526.~ Replacement tenure for PL 203.2 Percentage increase due to Toyota Tsucho
Gas E&P Otway Ltd withdrawal.3 Percentage increase due to Drysdale Offshore
Exploration Pty Ltd withdrawal.4 Origin has entered into an agreement to, subject
to completion, acquire an additional 35 per cent interest in these permits.
PPL 90, PPL 133, PPL 134 sold on 6 June 2017.
1. ORIGIN’S INTERESTSOrigin held interests in the following permits at 30 June 2017.

156 ANNUAL RESERVES REPORT
This Annual Reserves Report provides an update on the reserves and resources of Origin Energy Limited (Origin) and its share of Australia Pacific LNG (APLNG), as at 30 June 2017. It also identifies the reserves and resources for Lattice Energy (the conventional upstream business that Origin intends to divest via a dual track IPO/trade sale process). The data is compared with and reconciled to the position at 30 June 2016.
HIGHLIGHTS
AUSTRALIA PACIFIC LNG – Activity during the 2017 Financial Year (FY 2017) focused on increasing near term production ahead of the two-train lenders’
test contributing to:
– a strong production result with Origin’s share of Australia Pacific LNG production increasing by 72 PJe to 229 PJe; and
– an increase in Origin’s share of proven reserves (1P) of 389 PJe before production as a result of development drilling. After production 1P increased by 160 PJe to 2,819 PJe.
– Following completion of the operational phase of the two-train lenders’ test, Australia Pacific LNG is now focused on exploration and appraisal activities to identify and mature resources to reserves.
LATTICE ENERGY – The completion of the Halladale/Speculant project during August 2016 contributed to a 20 PJe increase in annual production to
95 PJe relative to FY2016.
– Proved plus probable (2P) reserves decreased by 113 PJe to 835 PJe primarily reflecting production.
– Stage 2 of the Waitsia Gas Project continues to progress with FID on the 100 TJ/day project anticipated by the end of FY2018.
Table 1: Origin 2P reserves (by area)
RESERVES (2P) BY AREA (PJE)2P
30/06/16ACQUISITION/DIVESTMENT
NEW BOOKING/
DISCOVERYREVISIONS/
EXTENSIONS PRODUCTION2P
30/06/17
Australia Pacific LNGSurat/Bowen (Unconventional) 5,073 – – (141) (229) 4,704
OtherIronbark (Unconventional) 256 – – (7) – 249
Lattice EnergyOtway Basin (Thylacine, Geographe) 177 – – 4 (26) 156Otway Basin (HBWS)1 78 – – (14) (22) 42Bass Basin 50 – – 7 (8) 48SA Cooper Basin 149 – – (18) (10) 120SWQ Cooper Basin 35 – – 2 (6) 31Perth Basin (Operated)2 23 – – 3 (3) 23Perth Basin (Non Operated)3 232 – – 2 (1) 233NZ Onshore Taranaki - – – 0 (0) –NZ Offshore Taranaki (Kupe) 204 – – (3) (18) 184 Sub Total (Lattice Energy) 948 – – (18) (95) 836
Total 6,277 – – (166) (323) 5,788
Notes to table 1 1 HBWS: Halladale, Black Watch, Speculant.2 Operated: Beharra Spring Terrace, Redback Terrace.3 Non Operated: Waitsia.
ANNUAL RESERVES REPORT

157ANNUAL RESERVES REPORT
SUMMARY OF 2P RESERVES MOVEMENTProved plus probable (2P) reserves decreased by 489 PJe to a total of 5,788 PJe, when compared to 30 June 2016. The key changes in 2P reserves included:
– 323 PJe decrease due to production.
– 166 PJe net decreases resulting from revisions/extensions mostly associated with Australia Pacific LNG.
– The revisions/extensions of 166 PJe of 2P reserves included movements in the following areas:
– Australia Pacific LNG decreased by 141 PJe primarily due to reduced recovery estimates in low permeability areas.
– Cooper decreased 17 PJe due to field development revisions.
– Ironbark (unconventional) decreased by 7 PJe due to updated regional permeability mapping.
– Otway Basin decreased by 10 PJe due to lower than expected performance at Halladale Field partly offset by the successful Thylacine TA-1 well intervention which extended production.
– Bass Basin increased 7 PJe reflecting an updated reservoir model.
ADDITIONAL NOTES
– At 30/06/2017, 86 per cent of Origin 2P reserves are unconventional.
– The current Waitsia appraisal drilling results are being evaluated and are not included in this update.
Table 2: Origin 2P reserves (by product and development type)
TOTAL (PJe)
RESERVES (2P) BY PRODUCT/DEVELOPMENT
GAS(PJ)
LPG(KT)
CONDENSATE(kbbl)
OIL(kbbl) DEVELOPED UNDEVELOPED
TOTAL(PJe)
Australia Pacific LNGSurat/Bowen (Unconventional) 4,704 – – – 2,387 2,317 4,704
OtherIronbark (Unconventional) 249 – – – – 249 249
Lattice Energy –Otway Basin (Thylacine, Geographe) 132 262 1,935 – 80 75 156Otway Basin (HBWS)1 37 49 414 – 31 10 42Bass Basin 36 101 1,197 – 48 – 48SA Cooper Basin 93 196 1,448 1,527 86 34 120SWQ Cooper Basin 25 49 359 385 21 10 31Perth Basin (Operated)2 23 – 16 – 18 5 23Perth Basin (Non Operated)3 232 – 94 – 45 188 233NZ Onshore Taranaki – – – – – – –NZ Offshore Taranaki (Kupe) 133 571 4,194 – 95 88 184 Sub Total (Lattice Energy) 712 1,230 9,658 1,912 425 411 836
Total 5,664 1,230 9,658 1,912 2,812 2,976 5,788
Notes to table 2 1 HBWS: Halladale, Black Watch, Speculant.2 Operated: Beharra Spring Terrace, Redback Terrace.3 Non Operated: Waitsia
Table 3: Origin 2P reserves changes (by product)
RESERVES (2P) BY PRODUCTGAS(PJ)
LPG(KT)
CONDENSATE(kbbl)
OIL(kbbl)
TOTAL(PJe)
2P 30/06/16 6,133 1,394 11,411 2,287 6,277Acquisition/divestment – – – – –New bookings/discoveries – – – – –Revisions/extensions (163) (21) (272) (64) (166)Production (306) (143) (1,482) (311) (323)
2P 30/06/17 5,664 1,230 9,658 1,912 5,788Change (469) (164) (1,754) (375) (489)Change (percentage) (8) (12) (15) (16) (8)

158 ANNUAL RESERVES REPORT
SUMMARY OF 1P RESERVESProved (1P) reserves increased by 110 PJe (after production) to a total of 3,271 PJe, when compared to previous reporting period. Approximately 86per cent of 1P reserves are unconventional.
Table 4: Origin 1P reserves (by area)
RESERVES (1P) BY AREA (PJE)1P
30/06/16ACQUISITION/DIVESTMENT
NEW BOOKING/
DISCOVERYREVISIONS/
EXTENSIONS PRODUCTION1P
30/06/17
Australia Pacific LNGSurat/Bowen (Unconventional) 2,659 – – 389 (229) 2,819
OtherIronbark (Unconventional) – – – – – –
Lattice EnergyOtway Basin (Thylacine, Geographe) 127 – – (11) (26) 91Otway Basin (HBWS)1 47 – – (6) (22) 19Bass Basin 39 – – (0) (8) 31SA Cooper Basin 64 – – (2) (10) 51SWQ Cooper Basin 16 – – 4 (6) 14Perth Basin (Operated)2 9 – – 2 (3) 8Perth Basin (Non Operated)3 57 – – 64 (1) 120NZ Onshore Taranaki – – – 0 (0) –NZ Offshore Taranaki (Kupe) 143 – – (8) (18) 117 Sub Total (Lattice Energy) 502 – – 45 (95) 452
Total 3,160 – – 434 (323) 3,271
Notes to table 4 1 HBWS: Halladale, Black Watch, Speculant.2 Operated: Beharra Spring Terrace, Redback Terrace.3 Non Operated: Waitsia.
Table 5: Origin 1P reserves (by product and development)
TOTAL (PJe)
RESERVES (1P) BY PRODUCTGAS(PJ)
LPG(KT)
CONDENSATE(kbbl)
OIL(kbbl) DEVELOPED UNDEVELOPED
TOTAL(PJe)
Australia Pacific LNGSurat/Bowen (Unconventional) 2,819 – – – 2,387 432 2,819
OtherIronbark (Unconventional) – – – – – – –
Lattice Energy –Otway Basin (Thylacine, Geographe) 76 157 1,163 – 53 38 91Otway Basin (HBWS)1 17 24 198 – 19 – 19Bass Basin 23 66 750 – 31 – 31SA Cooper Basin 40 83 572 776 37 14 52SWQ Cooper Basin 11 25 158 124 10 4 14Perth Basin (Operated)2 8 – 8 – 8 – 8Perth Basin (Non Operated) 120 – 48 – 34 86 120NZ Onshore Taranaki – – – – – – –NZ Offshore Taranaki (Kupe) 83 355 3,195 – 78 40 117 Sub Total (Lattice Energy) 379 709 6,093 899 271 181 452
Total 3,198 709 6,093 899 2,658 613 3,271
Notes to table 5 1 HBWS: Halladale, Black Watch, Speculant.2 Operated: Beharra Spring Terrace, Redback Terrace.3 Non Operated: Waitsia.

159ANNUAL RESERVES REPORT
Table 6: Origin 1P reserve changes (by product)
RESERVES (1P) BY PRODUCTGAS(PJ)
LPG(KT)
CONDENSATE(kbbl)
OIL(kbbl)
TOTAL(PJe)
1P 30/06/16 3,067 899 8,083 877 3,160Acquisition/divestment – – – – –New bookings/discoveries – – – – –Revisions/extensions 437 (47) (508) 333 434Production (306) (143) (1,482) (311) (323)1P 30/06/17 3,198 709 6,093 899 3,271
Change 131 (190) (1,990) 23 111Change (percentage) 4 (21) (25) 3 4
SUMMARY OF 3P RESERVES AND 2C CONTINGENT RESOURCES FOR LATTICE ENERGYThe following tables summarise the 3P reserve estimate and the 2C contingent resource estimate for the Lattice Energy assets as at 30 June 2017.
Table 7: Lattice energy 3P reserves (by area & product)
RESERVES/RESOURCE CLASSIFICATION (PJe)
GAS(PJ)
LPG(KT)
CONDENSATE(kbbl)
OIL(kbbl)
3P(PJe)
Otway Basin (Thylacine, Geographe) 180 347 2,565 – 211Otway Basin (HBWS)1 52 69 586 – 59Bass Basin 45 123 1,481 – 59Bonaparte Basin – – – – –SA Cooper Basin 154 375 2,844 3,070 206SWQ Cooper Basin 45 92 726 505 57Perth Basin (Operated)2 31 – 25 – 31Perth Basin (Non Operated)3 353 – 143 – 354NZ Onshore Taranaki – – – – –NZ Offshore Taranaki (Kupe) 165 709 5,036 – 227
Total 1,026 1,715 13,406 3,575 1,204
Notes table 7 1 HBWS: Halladale, Black Watch, Speculant.2 Operated: Beharra Spring Terrace, Redback Terrace.3 Non Operated: Waitsia, Senecio, Synaphea, Irwin.
Table 8: Lattice energy 2C contingent resources (by area & product)
RESERVES/RESOURCE CLASSIFICATION (PJe)
GAS(PJ)
LPG(KT)
CONDENSATE(kbbl)
OIL(kbbl)
2C(PJe)
Otway Basin (Thylacine, Geographe) 94 157 1,201 – 108Otway Basin (HBWS)1 29 50 375 – 34Bass Basin 67 214 3,262 560 99Bonaparte Basin 54 16 216 – 56SA Cooper Basin 316 467 3,348 4,039 381SWQ Cooper Basin 38 60 476 255 45Perth Basin (Operated)2 – – – 111 1Perth Basin (Non Operated)3 474 – 1,735 – 483NZ Onshore Taranaki – – – – –NZ Offshore Taranaki (Kupe) 12 52 1,165 305 23
Total 1,084 1,015 11,777 5,270 1,229
Notes to table 8 1 HBWS: Halladale, Black Watch, Speculant.2 Operated: Beharra Spring Terrace, Redback Terrace.3 Non Operated: Waitsia, Senecio, Synaphea, Irwin.
ADDITIONAL COMMENTSBeetalooA material contingent resource announcement of 6.6 Tscf (gross) or 2.3 Tscf (net) for the Beetaloo Basin was provided on 15 February 2017 to the ASX
IronbarkIronbark (unconventional) 3P reserves decreased by 77 PJe to 635 PJe and 2C increased by 3 PJe to 332 PJe. These changes are due to updated regional permeability mapping
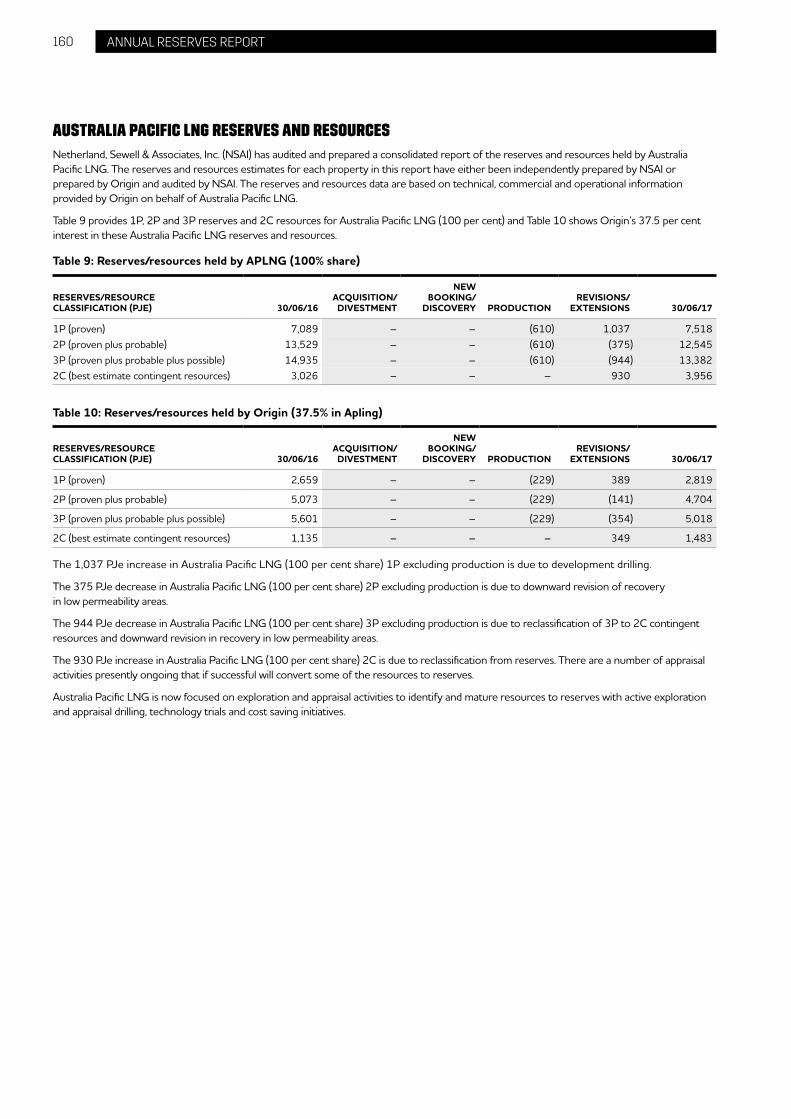
160 ANNUAL RESERVES REPORT
AUSTRALIA PACIFIC LNG RESERVES AND RESOURCES
Netherland, Sewell & Associates, Inc. (NSAI) has audited and prepared a consolidated report of the reserves and resources held by Australia Pacific LNG. The reserves and resources estimates for each property in this report have either been independently prepared by NSAI or prepared by Origin and audited by NSAI. The reserves and resources data are based on technical, commercial and operational information provided by Origin on behalf of Australia Pacific LNG.
Table 9 provides 1P, 2P and 3P reserves and 2C resources for Australia Pacific LNG (100 per cent) and Table 10 shows Origin’s 37.5 per cent interest in these Australia Pacific LNG reserves and resources.
Table 9: Reserves/resources held by APLNG (100% share)
RESERVES/RESOURCE CLASSIFICATION (PJE) 30/06/16
ACQUISITION/DIVESTMENT
NEW BOOKING/
DISCOVERY PRODUCTIONREVISIONS/
EXTENSIONS 30/06/17
1P (proven) 7,089 – – (610) 1,037 7,5182P (proven plus probable) 13,529 – – (610) (375) 12,5453P (proven plus probable plus possible) 14,935 – – (610) (944) 13,3822C (best estimate contingent resources) 3,026 – – – 930 3,956
Table 10: Reserves/resources held by Origin (37.5% in Apling)
RESERVES/RESOURCE CLASSIFICATION (PJE) 30/06/16
ACQUISITION/DIVESTMENT
NEW BOOKING/
DISCOVERY PRODUCTIONREVISIONS/
EXTENSIONS 30/06/17
1P (proven) 2,659 – – (229) 389 2,819
2P (proven plus probable) 5,073 – – (229) (141) 4,704
3P (proven plus probable plus possible) 5,601 – – (229) (354) 5,018
2C (best estimate contingent resources) 1,135 – – – 349 1,483
The 1,037 PJe increase in Australia Pacific LNG (100 per cent share) 1P excluding production is due to development drilling.
The 375 PJe decrease in Australia Pacific LNG (100 per cent share) 2P excluding production is due to downward revision of recovery in low permeability areas.
The 944 PJe decrease in Australia Pacific LNG (100 per cent share) 3P excluding production is due to reclassification of 3P to 2C contingent resources and downward revision in recovery in low permeability areas.
The 930 PJe increase in Australia Pacific LNG (100 per cent share) 2C is due to reclassification from reserves. There are a number of appraisal activities presently ongoing that if successful will convert some of the resources to reserves.
Australia Pacific LNG is now focused on exploration and appraisal activities to identify and mature resources to reserves with active exploration and appraisal drilling, technology trials and cost saving initiatives.

161ANNUAL RESERVES REPORT
NOTES RELATING TO THE RESERVES REPORTa. Methodology regarding Reserves and ResourcesThe Reserves Report has been prepared to be consistent with the Petroleum Resources Management System (PRMS) 2007 published by Society of Petroleum Engineers (SPE). This document may be found at the SPE website: spe.org/industry/docs/Petroleum_Resources_Management_System_2007.pdf. Additionally, this Reserves Report has been prepared to be consistent with the ASX reporting guidelines. For all assets Origin reports reserves and resources consistent with SPE guidelines as follows: proved reserves (1P); proved plus probable reserves (2P); proved plus probable plus possible reserves (3P); best estimate contingent resource (2C). Reserves must be discovered, recoverable, commercial and remaining.
The conventional (non-CSG) reserves estimates are prepared by employees who are qualified petroleum reserves and resource evaluators working in each of our assets utilising an Origin approved Reserves and Resources Process. RISC Operations Pty Ltd (RISC) has performed an independent audit of Origin Energy’s estimates of reserves and contingent resources for the Lattice Energy assets as listed in this report and believe these reserves and resources estimates to be reasonable and have been prepared in accordance with the standards, definitions and guidelines contained within the Petroleum Resources Management System (PRMS) and generally accepted petroleum engineering and evaluation principles as set out in the SPE Reserves Auditing Standards. RISC consents to being named in this report.
The CSG reserves and resources held within Australia Pacific LNG’s properties have either been independently prepared by NSAI or prepared by Origin and audited by NSAI. An independent assessment of our CSG reserves and resources within ATP 788 (Ironbark) permit has been undertaken by NSAI.
Origin does not intend to report Prospective or Undiscovered Resources as defined by the SPE in any of its areas of interest on an ongoing basis.
b. Economic test for reservesThe assessment of reserves requires a commercial test to establish that reserves can be economically recovered. Within the commercial test, operating cost and capital cost estimates are combined with fiscal regimes and product pricing to confirm the economic viability of producing the reserves.
In the case of oil, condensate and LPG, forward estimates of prices are used in line with the forward curves available through various international benchmarking agencies, appropriately adjusted for local market conditions.
Gas reserves are assessed against existing contractual arrangements, local market conditions, as appropriate. In the case of gas reserves where contracts are not in place, a forward price scenario based on monetisation of the reserves through domestic markets has been used, including power generation opportunities, direct sales to LNG and other end users and utilisation of Origin’s wholesale and retail channels to market.
For CSG reserves that are intended to supply the Australia Pacific LNG CSG to LNG project, the economic test is based on internal transfer prices based on the Residual Pricing Mechanism (RPM). The RPM mechanism is used within the Petroleum Resource Rent Tax (PRRT) regime to determine an appropriate transfer price for integrated gas to liquids projects.
RPM applies the same rate of return to the upstream and downstream businesses of the Australia Pacific LNG project, and divides residual profit equally between the businesses. The residual profit is a function of the upstream “cost plus” and the downstream “net back” prices. The residual price is exposed to changes in the supply/demand balance in the market through the oil price-linked LNG contract, as well as other market forces through the long term bond rate.
c. Reversionary RightsThe CSG interests that Australia Pacific LNG acquired from Tri-Star in 2002 are subject to reversionary rights. If triggered, these rights will require Australia Pacific LNG to transfer back to Tri-Star a 45 per cent interest in those CSG interests for no additional consideration. Origin has assessed the potential impact of these reversionary rights based on economic tests consistent with the reserves and resources referable to the CSG interests and based on that assessment does not consider that the existence of these reversionary rights impacts the reserves and resources quoted in this report. Tri-Star has commenced proceedings against Australia Pacific LNG claiming that reversion has occurred. Australia Pacific LNG denies that reversion has occurred and is defending the claim.

162 ANNUAL RESERVES REPORT
d. Information regarding the preparation of this Reserves ReportThe internationally recognised petroleum consultant NSAI has prepared assessments of the reserves and resources for the Ironbark asset. The CSG reserves and resources held within Australia Pacific LNG’s properties have either been independently prepared by NSAI or prepared by Origin and audited by NSAI. All assessments are based on technical, commercial and operational data provided by Origin on behalf of Australia Pacific LNG.
The statements in this Reserves Report relating to reserves and resources as of 30 June 2017 for Australia Pacific LNG and the Ironbark asset are based on information in the NSAI reports dated 26 July 2017 and 5 July 2017, respectively. The data has been compiled by Mr. Dan Paul Smith, a full-time employee of NSAI. Mr. Dan Paul Smith has consented to the statements based on this information, and to the form and context in which these statements appear.
The statements in this Reserves Report relating to reserves and resources for other assets have been compiled by Andrew Mayers, a full-time employee of Origin. Andrew Mayers is a qualified reserves and resources evaluator and has consented to the form and context in which these statements appear.
e. RoundingInformation on reserves is quoted in this Reserves Report rounded to the nearest whole number. Some totals in tables in this Reserves Report may not add due to rounding. Items that round to zero are represented by the number 0, while items that are actually zero are represented with a dash “-”.
f. Abbreviations
bbl Barrel
Bscf Billion standard cubic feet
CSG Coal seam gas
kbbls Kilo barrels = 1,000 barrels
ktonnes Kilo tonnes = 1,000 tonnes
mmboe Million barrels of oil equivalent
PJ Petajoule = 1 x 10¹⁵ joules
PJe Petajoule equivalent
Tscf Trillions of standard cubic feet of gas
g. Conversion Factors for PJe
Crude oil 0.00583 PJ/kbbls = 5.83 PJ/mmboe
Condensate 0.00541 PJ/kbbls
LPG 0.0493 PJ/ktonnes
CSG 1.038 PJ/Bscf
h. Reference PointReference points for Origin’s petroleum reserves and contingent resources are defined points within Origin’s operations where normal exploration and production business ceases, and quantities of the produced product are measured under defined conditions prior to custody transfer. Fuel, flare and vent consumed to the reference points are excluded.
i. Preparing and Aggregating Petroleum ResourcesPetroleum reserves and contingent resources are typically prepared by deterministic methods with the support from probabilistic methods. Petroleum reserves and contingent resources are aggregated by arithmetic summation by category and as a result, proved reserves may be a conservative estimate due to the portfolio effects of the arithmetic summation. Proved plus probable plus possible may be an optimistic estimate due to the same aforementioned reasons.
j. Methodology and Internal ControlsThe reserves estimates undergo an assurance process to ensure that they are technically reasonable given the available data and have been prepared according to our reserves and resources process, which includes adherence to the PRMS Guidelines. The assurance process includes peer reviews of the technical and commercial assumptions. The annual reserves report is reviewed by management with the appropriate technical expertise, including Chief Petroleum Engineer and Integrated Gas General Managers.

163ANNUAL RESERVES REPORT
k. Qualified Petroleum Reserves and Resources EvaluatorsThe material presented in this report is based on, and fairly represents, information and supporting documentation prepared by, or under the supervision of the listed qualified reserves and resources evaluators. These individuals have consented to the statements based on this information, and to the form and context in which these statements appear.
NAME EMPLOYER PROFESSIONAL ORGANISATION*
Andrew Mayers Origin Energy (Chief Petroleum Engineer) SPE, APEGA, RPEQ
Chung Chen Origin Energy SPE, EA, RPEQ
Samantha Phillips Origin Energy SPE, EA, APEGA, RPEQ
Ian Meynink Origin Energy SPE, EA, RPEQ
Rod Trubshaw Origin Energy SPE, RPEQ
Graham Sutherland Origin Energy SPE, EA, RPEQ
Simon Smith Origin Energy SPE, EA, RPEQ
Alistair Jones Origin Energy SPE, EA
Reneke van Soest Origin Energy SPE
Julie Moriarty Origin Energy SPE
Alexander Cote Origin Energy SPE, APEGA, EA
Sarah Bishop Origin Energy (Lattice Energy) SPE, EA, RPEQ
Alan Mourgues Origin Energy (Lattice Energy) SPE, EA, RPEQ
Petrina Weatherstone Origin Energy (Lattice Energy) SPE
Arvo Nagel Origin Energy (Lattice Energy) SPE
Pedro Paris Origin Energy (Lattice Energy) SPE
Jocelyn Young Origin Energy (Lattice Energy) SPE
David MacDougal Origin Energy (Lattice Energy) SPE
Nick Allen Origin Energy (Lattice Energy) SPE
Rowan Wilson Origin Energy (Lattice Energy) SPE
Notes to table* SPE: Society of Petroleum Engineers; AAPG: American Association of Petroleum Geologists; APEGA: The Association of Professional Engineers and Geoscientists
of Alberta; EA: Engineers of Australia; RPEQ: Board of Professional Engineers Queensland; RPEQ: Registered Professional Engineer of Queensland.
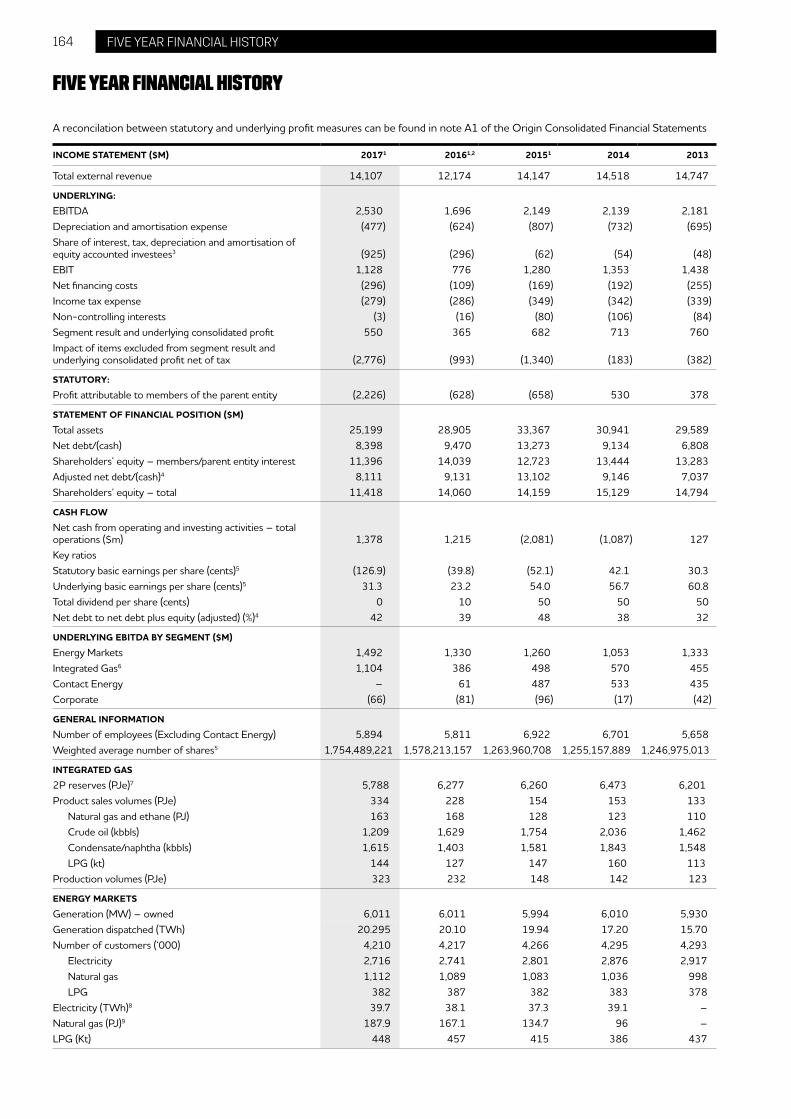
164
A reconcilation between statutory and underlying profit measures can be found in note A1 of the Origin Consolidated Financial Statements
INCOME STATEMENT ($M) 20171 20161,2 20151 2014 2013
Total external revenue 14,107 12,174 14,147 14,518 14,747
UNDERLYING:
EBITDA 2,530 1,696 2,149 2,139 2,181Depreciation and amortisation expense (477) (624) (807) (732) (695)Share of interest, tax, depreciation and amortisation of equity accounted investees3 (925) (296) (62) (54) (48)EBIT 1,128 776 1,280 1,353 1,438Net financing costs (296) (109) (169) (192) (255)Income tax expense (279) (286) (349) (342) (339)Non-controlling interests (3) (16) (80) (106) (84)Segment result and underlying consolidated profit 550 365 682 713 760Impact of items excluded from segment result and underlying consolidated profit net of tax (2,776) (993) (1,340) (183) (382)
STATUTORY:
Profit attributable to members of the parent entity (2,226) (628) (658) 530 378
STATEMENT OF FINANCIAL POSITION ($M)
Total assets 25,199 28,905 33,367 30,941 29,589Net debt/(cash) 8,398 9,470 13,273 9,134 6,808Shareholders’ equity – members/parent entity interest 11,396 14,039 12,723 13,444 13,283Adjusted net debt/(cash)4 8,111 9,131 13,102 9,146 7,037Shareholders’ equity – total 11,418 14,060 14,159 15,129 14,794
CASH FLOW
Net cash from operating and investing activities – total operations ($m) 1,378 1,215 (2,081) (1,087) 127Key ratiosStatutory basic earnings per share (cents)5 (126.9) (39.8) (52.1) 42.1 30.3Underlying basic earnings per share (cents)5 31.3 23.2 54.0 56.7 60.8Total dividend per share (cents) 0 10 50 50 50Net debt to net debt plus equity (adjusted) (%)4 42 39 48 38 32
UNDERLYING EBITDA BY SEGMENT ($M)
Energy Markets 1,492 1,330 1,260 1,053 1,333Integrated Gas6 1,104 386 498 570 455Contact Energy – 61 487 533 435Corporate (66) (81) (96) (17) (42)
GENERAL INFORMATION
Number of employees (Excluding Contact Energy) 5,894 5,811 6,922 6,701 5,658Weighted average number of shares5 1,754,489,221 1,578,213,157 1,263,960,708 1,255,157,889 1,246,975,013
INTEGRATED GAS
2P reserves (PJe)7 5,788 6,277 6,260 6,473 6,201Product sales volumes (PJe) 334 228 154 153 133
Natural gas and ethane (PJ) 163 168 128 123 110Crude oil (kbbls) 1,209 1,629 1,754 2,036 1,462Condensate/naphtha (kbbls) 1,615 1,403 1,581 1,843 1,548LPG (kt) 144 127 147 160 113
Production volumes (PJe) 323 232 148 142 123
ENERGY MARKETS
Generation (MW) – owned 6,011 6,011 5,994 6,010 5,930Generation dispatched (TWh) 20.295 20.10 19.94 17.20 15.70Number of customers (‘000) 4,210 4,217 4,266 4,295 4,293
Electricity 2,716 2,741 2,801 2,876 2,917Natural gas 1,112 1,089 1,083 1,036 998LPG 382 387 382 383 378
Electricity (TWh)8 39.7 38.1 37.3 39.1 –Natural gas (PJ)9 187.9 167.1 134.7 96 –LPG (Kt) 448 457 415 386 437
FIVE YEAR FINANCIAL HISTORY
FIVE YEAR FINANCIAL HISTORY

165
1 Includes discontinued operations and assets held for sale unless stated otherwise.2 Certain amounts above have been restated to reflect adjustments as noted in Note F12 of the consolidated financial statements.3 Origin discloses its equity accounted results in two lines: ‘share of EBITDA of equity accounted investees,’ included in EBITDA; and ‘share of interest, tax, depreciation and
amortisation of equity accounted investees,’ included between EBITDA and EBIT.4 Total current and non-current interest-bearing liabilities only, less cash and cash equivalents, less fair value adjustments on foreign exchange hedging transactions.5 Prior period adjusted for the bonus element (discount to market price) of the September 2015 rights issue.6 The Integrated Gas segment combines the former Exploration & Production and Australia Pacific LNG segments, as announced in August 2015.7 Includes Origin’s share of Australia Pacific LNG reserves. Shareholding was 42.5 per cent at 30 June 2012 and post-Sinopec completion on 12 July 2012 was 37.5 per cent.8 FY2015 and FY2014 were restated to better reflect the recognition of volumes, revenues and costs associated with feed-in volumes from solar customers with no impact on
gross profit. Comparable figures for FY2013 are not available.9 Includes external volumes sold. Osborne gas sales were reclassified as internal due to new operational agreement. As a result, FY2015 and FY2014 external sales volumes,
revenues and costs were revised with no impact on gross profit. Comparable figures for FY2013 are not available.
FIVE YEAR FINANCIAL HISTORY

166
FINANCIAL MEASURES
STATUTORY FINANCIAL MEASURESStatutory Financial Measures are measures included in the Financial Statements for the Origin Consolidated Group, which are measured and disclosed in accordance with applicable Australian Accounting Standards. Statutory Financial Measures also include measures that have been directly calculated from, or disaggregated directly from financial information included in the Financial Statements for the Origin Consolidated Group.
TERM MEANING
Statutory Profit/Loss Net profit/loss after tax and non-controlling interests as disclosed in the Income Statement of the Origin Consolidated Financial Statements.
Statutory earnings per share Statutory profit divided by weighted average number of shares.
Cash flows from operating activities Statutory cash flows from operating activities as disclosed in the Cash Flow Statement of the Origin Consolidated Financial Statements.
Cash flows used in investing activities
Statutory cash flows used in investing activities as disclosed in the Cash Flow Statement of the Origin Consolidated Financial Statements.
Cash flows from financing activities Statutory cash flows from financing activities as disclosed in the Cash Flow Statement of the Origin Consolidated Financial Statements
External revenue Revenue after elimination of intersegment sales on consolidation as disclosed in the Income Statement of the Origin Consolidated Financial Statements
Net Debt Total current and non-current interest bearing liabilities only, less cash and cash equivalents.
Non-controlling interest Economic interest in a controlled entity of the consolidated entity that is not held by the Parent entity or a controlled entity of the consolidated entity.
Statutory net financing costs Interest expense net of interest income as disclosed in the Origin Consolidated Financial Statements.
NON-IFRS FINANCIAL MEASURESThis document includes certain Non-IFRS Financial Measures. Non-IFRS Financial Measures are defined as financial measures that are presented other than in accordance with all relevant Accounting Standards. Non-IFRS Financial Measures are used internally by management to assess the performance of Origin’s business, and to make decisions on allocation of resources. The Non-IFRS Financial Measures have been derived from Statutory Financial Measures included in the Origin Consolidated Financial Statements, and are provided in this report, along with the Statutory Financial Measures to enable further insight and a different perspective into the financial performance, including profit and loss and cash flow outcomes, of the Origin business.
The principle non-IFRS profit and loss measure of Underlying Profit has been reconciled to Statutory Profit in Section 2.2. The key Non-IFRS Financial Measures included in this report are defined below.
TERM MEANING
Current period Year ended 30 June 2017.
Electricity& Natural Gas cost to serve restatement
The period ending 30 June 2016 has been restated to reflect the following changes to Electricity and Natural Gas cost to serve:– Other income (relating to late payment fees) included as an offset, previously recognised in Electricity and
Natural Gas gross profit; and– HSE, procurement, solar marketing costs and corporate recharges reallocated to Electricity gross profit,
LPG and Solar & Energy Services.
Items excluded from Underlying Profit
Items that do not align with the manner in which the Managing Director reviews the financial and operating performance of the business which are excluded from Underlying Profit. Items excluded from Underlying Profit are categorised as:Fair value and foreign exchange movements – reflecting the impact of mark to market movements on financial assets and liabilities from period to period.LNG related items before revenue recognition – primarily comprising net financing costs incurred (but unable to be capitalised) in funding Origin’s investment in Australia Pacific LNG which relate to the period prior to revenue recognition for each of the two LNG Trains.Disposals, impairments and business restructuring – reflecting the impact of actions and decisions to dispose, acquire, revalue or restructure the company’s assets and business operations.
MRCPS elimination adjustment The interest on MRCPS was capitalised by Australia Pacific LNG prior to commencement of revenue recognition. As the project is now operational, previously capitalised interest is being unwound through depreciation. The proportion of the unwind attributable to Origin’s share is eliminated as Origin had previously eliminated the impact of the capitalised interest through the equity investment balance.
Prior period Year ended 30 June 2016.
Total Segment Revenue Total revenue for the Energy Markets, Integrated Gas, Contact Energy and Corporate segments, including inter-segment sales, as disclosed in note A1 of the Origin Consolidated Financial Statements.
GLOSSARY AND INTERPRETATION
GLOSSARY AND INTERPRETATION
167
TERM MEANING
Underlying Profit Underlying net profit after tax and non-controlling interests as disclosed in note A1 of the Origin Consolidated Financial Statements.
Underlying earnings per share Underlying profit/loss divided by weighted average number of shares.
Underlying average interest rate Underlying interest expense for the current period divided by Origin’s average drawn debt during the current period (excluding funding related to Australia Pacific LNG).
Underlying EBITDA Underlying earnings before underlying interest, underlying tax, underlying depreciation and amortisation (EBITDA) as disclosed in note A1 of the Origin Consolidated Financial Statements.
Underlying depreciation and amortisation
Underlying depreciation and amortisation as disclosed in note A1 of the Origin Consolidated Financial Statements.
Underlying EBIT Underlying earnings before underlying interest and underlying tax (EBIT) as disclosed in note A1 of the Origin Consolidated Financial Statements.
Underlying income tax expense Underlying income tax expense as disclosed in note A1 of the Origin Consolidated Financial Statements.
Underlying net financing costs Underlying interest expense net of interest income as disclosed in note A1 of the Origin Consolidated Financial Statements.
Underlying profit before tax Underlying profit before tax as disclosed in note A1 of the Origin Consolidated Financial Statements.
Underlying share of ITDA The Group’s share of underlying interest, underlying tax, underlying depreciation and underlying amortisation (ITDA) of equity accounted investees as disclosed in note A1 of the Origin Consolidated Financial Statements.
Underlying ROCE Underlying ROCE is calculated as Adjusted EBIT / Average Capital Employed.– Average Capital Employed = Shareholders Equity + Origin Debt + Origin’s Share of Australia Pacific
LNG project finance - Non-cash fair value uplift + net derivative liabilities. The average is a simple average of opening and closing in any year.
– Adjusted EBIT = Origin Underlying EBIT and Origin’s share of Australia Pacific LNG Underlying EBIT + Dilution Adjustment = Statutory Origin EBIT adjusted to remove the following items: a) Items excluded from underlying earnings; b) Origin’s share of Australlia Pacific LNG underlying interest and tax; and c) the depreciation of the Non-cash fair value uplift adjustment.
– In contrast, for remuneration purposes Origin’s statutory EBIT is adjusted to remove Origin’s share of Australia Pacific LNG statutory interest and tax (which is included in Origin’s reported EBIT) and certain items excluded from underlying earnings. Gains and losses on disposals and impairments will only be excluded subject to Board discretion. The Remuneration Report provides specific details.
Gross Profit Revenue less cost of goods sold.
Adjusted Net Debt Net Debt adjusted to remove fair value adjustments on hedged borrowings.
Non-cash fair value uplift Reflects the impact of the accounting uplift in the asset base of Australia Pacific LNG of $1.9 billion which was recorded on the creation of Australia Pacific LNG and subsequent share issues to Sinopec. This balance will be depreciated in Australia Pacific LNG’s income statement on an ongoing basis and, therefore, a dilution adjustment is made to remove this depreciation. The non-cash fair value uplift adjustments are disclosed and explained in Note E1.2 of the financial statements.
TRIFR Total Recordable Incident Frequency Rate.
NON-FINANCIAL TERMSTERM MEANING
1P reserves Proved Reserves are those reserves which analysis of geological and engineering data can be estimated with reasonable certainty to be commercially recoverable. There should be at least a 90 per cent probability that the quantities actually recovered will equal or exceed the estimate.
2P reserves The sum of Proved plus Probable Reserves. Probable Reserves are those additional reserves which analysis of geological and engineering data indicate are less likely to be recovered than Proved Reserves but more certain than Possible Reserves. There should be at least a 50 per cent possibility that the quantities actually recovered will equal or exceed the best estimate of Proved plus Probable Reserves (2P).
3P reserves Proved plus Probable plus Possible Reserves. Possible Reserves are those additional Reserves which analysis of geological and engineering data suggest are less likely to be recoverable than Probable Reserves. The total quantities ultimately recovered from the project have at least a 10 per cent probability of exceeding the sum of Proved plus Probable plus Possible (3P), which is equivalent to the high estimate scenario.
2C resources The best estimate quantity of petroleum estimated to be potentially recoverable from known accumulations by application of development oil and gas projects, but which are not currently considered to be commercially recoverable due to one or more contingencies. The total quantities ultimately recovered from the project have at least a 50 per cent probability to equal or exceed the best estimate for 2C contingent resources.
Boe Barrel of oil equivalent
Capacity factor A generation plant’s output over a period compared with the expected maximum output from the plant in the period based on 100 per cent availability at the manufacturer’s operating specifications.
GLOSSARY AND INTERPRETATION

168 GLOSSARY AND INTERPRETATION
TERM MEANING
Discounting For Energy Markets, discounting refers to offers made to customers at a reduced price to the published tariffs. While a customer bill comprises a fixed and a variable portion, Origin’s discounts only apply to the variable portion. In some cases, these discounts are conditional, such as requiring direct debit payment or on-time payments.
Equivalent reliability factor Equivalent reliability factor is the availability of the plant after scheduled outages.
FEED Front End Engineering Design
GJ Gigajoule = 109 joules
GJe Gigajoules equivalent = 10-6 PJe
Joule Primary measure of energy in the metric system.
kT Kilo tonnes = 1,000 tonnes
kW Kilowatt = 103 watts
kWh Kilowatt hour = standard unit of electrical energy representing consumption of one kilowatt over one hour.
Mtpa Million tonnes per annum
MW Megawatt = 106 watts
MWh Megawatt hour = 103 kilowatt hours
NPS Net Promoter Score (NPS) is a measure of customers’ propensity to recommend Origin to friends and family
Oil Forward Sale Agreements Agreements to sell a portion of future oil and condensate production from July 2015 for 72 months at prices linked to the oil forward pricing curve at the agreement date. The cash proceeds were received upfront in the 2013 financial year at a locked-in price of $62.40/bbl.
PJ Petajoule = 1015 joules
PJe Petajoules equivalent = an energy measurement Origin uses to represent the equivalent energy in different products so the amount of energy contained in these products can be compared. The factors used by Origin to convert to PJe are: 1 million barrels crude oil = 5.8 PJe; 1 million barrels condensate = 5.4 PJe; 1 million tonnes LPG = 49.3 PJe; 1 TWh of electricity = 3.6 PJe.
Ramp gas Short term Queensland gas supply as upstream assets associated with CSG-to-LNG projects gradually increase production in advance of first LNG
Tscf Trillions of standard cubic feet of gas
TW Terawatt = 1012 watts
TWh Terawatt hour = 109 kilowatt hours
Watt A measure of power when a one ampere of current flows under one volt of pressure.
INTERPRETATIONAll comparable results reflect a comparison between the current period and the prior period ended 30 June 2016, unless specifically stated otherwise.
A reference to APLNG or Australia Pacific LNG is a reference to Australia Pacific LNG Pacific LNG Pty Limited in which Origin holds a 37.5 per cent shareholding. Origin’s shareholding in Australia Pacific LNG is equity accounted.
A reference to $ is a reference to Australian dollars unless specifically marked otherwise.
All references to debt are a reference to interest bearing debt only.
Individual items and totals are rounded to the nearest appropriate number or decimal. Some totals may not add down the page due to rounding of individual components.
When calculating a percentage change, a positive or negative percentage change denotes the mathematical movement in the underlying metric, rather than a positive or a detrimental impact.
Percentage changes on measures for which the numbers change from negative to positive, or vice versa, are labelled as not applicable.


Shareholders wishing to receive their shareholder communications electronically, including annual reports, notices of meetings and dividend statements and other company related information should contact the share registry.
REGISTERED OFFICELevel 45, Australia Square 264–278 George Street Sydney NSW 2000
GPO Box 5376 Sydney NSW 2001
T (02) 8345 5000 F (02) 9252 9244
SECRETARIESAndrew Clarke Helen Hardy
SHARE REGISTRYBoardroom Pty Limited Level 12, 225 George Street Sydney NSW 2000
GPO Box 3993 Sydney NSW 2001
T Australia 1300 664 446 T International (+61 2) 8016 2896 F (02) 9279 0664
www.boardroomlimited.com.au [email protected]
AUDITORKPMG
DIRECTORY ORIGIN ENERGY LIMITED
Further information about Origin’s performance can be found at: www.originenergy.com.au
Shareholders can contact Origin at: [email protected]