Embed Size (px)
Citation preview

Document type: Report
Ref: 126/10
Electricity and Gas Supply Market Report
Our indicator of the net profit margin from gas and electricity supply has decreased slightly
since our last report in June. It shows a net margin for supplying a typical, standard tariff, dual
fuel customer of approximately £65 per customer for the year from August 2010, down from
£70 in June.
We estimate wholesale energy costs will begin to increase over the coming months. This is
because prices in forward markets have increased since our June report. The effect of
increasing wholesale prices is to decrease our estimate of net margin in the coming months.
This effect is more pronounced in the market for gas than in electricity. Our analysis assumes
no changes in prices to end customers.
Ofgem continues to monitor the market closely, both in terms of the pricing behaviour of
suppliers and the effectiveness of our market reforms. If we feel that the current arrangements
and our proposed reforms are insufficient to protect consumers, we will not hesitate to consider
further action.
Date of publication: 29 September 2010

1
Electricity and Gas Supply Market Report 29 September 2010
Energy Supply Probe — Intial Findings Report. October 2008. Reference number
140/08
http://www.ofgem.gov.uk/MARKETS/RETMKTS/ENSUPPRO/Documents1/Energy%
20Supply%20Probe%20-%20Initial%20Findings%20Report.pdf
Quarterly Wholesale/Retail Price Report. February 2009. Reference number 15/09
http://www.ofgem.gov.uk/MARKETS/RETMKTS/ENSUPPRO/Documents1/Wholesal
e%20retail%20price%20link%20report%20-%20February09.pdf
Quarterly Wholesale/Retail Price Report. May 2009. Reference number 57/09
http://www.ofgem.gov.uk/MARKETS/RETMKTS/ENSUPPRO/Documents1/Wholesal
e%20retail%20report%20-%20May.pdf
Quarterly Wholesale/Retail Price Report. August 2009. Reference number 111/09
http://www.ofgem.gov.uk/MARKETS/RETMKTS/ENSUPPRO/Documents1/August%
20quarterly%20price%20report.pdf
Quarterly Wholesale/Retail Price Report. December 2009. Reference number
150/09
http://www.ofgem.gov.uk/MARKETS/RETMKTS/ENSUPPRO/Documents1/Quarterl
y%20Wholesale%20Retail%20Price%20Report%20November%202009.pdf
Electricity and Gas Supply Market Report. February 2010. Reference number
23/10
http://www.ofgem.gov.uk/Markets/RetMkts/ensuppro/Documents1/QPR%20final
%20feb.pdf
Electricity and Gas Supply Market Report. June 2010. Reference number 73/10
http://www.ofgem.gov.uk/Markets/RetMkts/ensuppro/Documents1/Electricity%2
0and%20Gas%20Supply%20Market%20Report%20June%202010.pdf
Energy supply probe remedy: publication of segmental generation and supply
accounts by energy companies. July 2010
http://www.ofgem.gov.uk/Markets/RetMkts/ensuppro/Documents1/location%20o
f%20these%20accounting%20statements%20on%20each%20suppliers‘%20web
site.pdf
Associated documents

2
Electricity and Gas Supply Market Report 29 September 2010
Our indicator of the net profit margin from gas and electricity supply has decreased
slightly since our last report. It shows a net margin for supplying a standard tariff,
dual fuel customer of £65 for the year from August 2010. This is down slightly from
£70 in our June report. Net margins therefore remain above the average level since
2004.
Typical dual fuel customer bill, costs and net margin
We forecast our estimate of wholesale energy costs to begin to increase over the
coming months. This is because prices in forward markets have further increased
since our June report. This effect is more pronounced in the market for gas. We
estimate that by spring 2011 gas purchase costs may increase by 13%. This would
shrink the net margin on gas supply from £50 today to around £10. For electricity
supply, net margin is also expected to decrease, but at a slower rate.
Whether margins follow this path is dependent on energy suppliers maintaining
prices at their current levels. We have already observed one supplier announce an
increase to some of their electricity prices from October. This price increase has been
incorporated into our forward-looking analysis. Any further price increases will have
the effect of increasing net margins relative to the forecast current downward trend.
-200
0
200
400
600
800
1000
1200
£/cu
sto
mer
/yea
r
DUAL FUEL
Customer bill
Wholesale energy cost
Other costs and VAT
Net margin
Summary

3
Electricity and Gas Supply Market Report 29 September 2010
Table of Contents
Customer bills, wholesale energy costs and net margin .................... 4 Appendices ........................................................................................ 9
Appendix 1 – Feedback and questions ............................................. 10
Appendix 2 – Hedging strategies ..................................................... 11 Appendix 3 – Wholesale prices and wholesale costs ....................... 13 Appendix 4 – Methodology .............................................................. 15 Appendix 5 – The Authority’s powers and duties ............................. 19
Appendix 6 – Feedback questionnaire ............................................. 22

4
Electricity and Gas Supply Market Report 29 September 2010
Customer bills, wholesale energy costs and net margin
The estimated net margin for supplying a standard tariff, dual fuel customer is £65
for the year from August 2010. This is down slightly from £70 in our June report.
1.1. This report examines the relationship between wholesale energy costs and
standard tariff energy bills for a typical customer. It provides an indicator of the
margin from supplying energy to a typical customer, rather than an estimate of
energy supply company profits. It has been carried out by Ofgem based on
information from publicly available sources as well as information gathered as part of
the Energy Supply Probe. Suppliers use different hedging strategies and their
operating costs will vary, so the actual margin for individual suppliers will differ from
our indicator.
1.2. We welcome feedback on our methodology as well as our findings. In particular,
we have welcomed the responses to our previous reports. Please see Appendix 4 for
more details about our assumptions, including figure 4.2 for a summary of the
changes since the previous report.
1.3. Each point on the charts in this section represents the expected cost, revenue or
margin for the following year, for an average customer on a £/year basis. Wholesale
costs are estimated using our 18-month hedging strategy. The cost of the average
customer bill are represented by the black line. Wholesale costs are represented by
the blue shaded area. Other costs, such as network costs, environmental charges,
and VAT, are represented by the grey shaded area. The area between the customer
bill and the combined wholesale and other costs lines represents gross margin (which
includes profits and operating costs). Subtracting operating costs from the gross
margin gives the net margin, represented by the green line.
1.4. Operating costs include: staff costs, IT costs and overheads. They also include
discretionary elements (such as marketing) and bad debts costs. We have made
assumptions about how these have been affected by the current economic downturn,
although there is uncertainty around how these costs have changed. Please refer to
Appendix 4 for further details on how we calculate net margin.

5
Electricity and Gas Supply Market Report 29 September 2010
Figure 1.1: Typical dual fuel customer bill, costs and net margin
1.5. Figure 1.1 shows that the estimated net margin on supplying a typical dual fuel
customer for the year from August 2010 has declined to £65. This represents a small
adjustment from £70 in our last report in June, mainly due to a small increase in
environmental costs. Retail bills and our estimate of hedged wholesale energy costs
have remained largely stable since June.
1.6. Wholesale energy costs are estimated using our assumed 18-month hedging
strategy. These costs have fallen over the past year, stabilising in August at around
£485 per year, from a 12-month high of £635. This is a result of falling wholesale
electricity and gas forward prices over 2009 and 2010. However, wholesale forward
prices have generally trended up in recent months as a result of, among other
things, a recovery in demand in both the UK and Europe. As a result, our simulated
hedging strategy indicates that our estimate of wholesale costs will begin to increase
from October 2010. This is predominantly due to increases in wholesale gas prices,
which are set to rise faster than wholesale electricity prices.
1.7. Future wholesale energy costs are unpredictable, so our estimate may vary over
time. However, if wholesale energy costs do rise in line with our forecasts, this would
reduce our estimate of dual fuel, net margins by over two thirds by spring 2011. In
addition, we have already observed one supplier announce an increase to some of
their electricity prices from October. This price increase has been incorporated into
our forward-looking analysis. Any further price increases will have the effect of
increasing net margins relative to the current forecast downward trend.
-200
0
200
400
600
800
1000
1200
£/cu
sto
mer
/yea
r
DUAL FUEL
Customer bill
Wholesale energy cost
Other costs and VAT
Net margin

6
Electricity and Gas Supply Market Report 29 September 2010
Figure 1.2: Typical electricity customer bill, costs and net margin
1.8. Figure 1.2 replicates figure 1.1 for a typical, stand-alone electricity customer
account. The figure shows that since June wholesale electricity costs, as estimated
by our 18-month hedging strategy, have remained at around £200 per year for a
typical customer. Similarly, our estimate of other costs - including environmental,
social, network, metering, balancing costs – have remained virtually constant over
the same period. Since average electricity bills have only increased slightly since our
last report, the net margin has remained at around £30 per customer account.
1.9. In the coming months, our estimate of wholesale electricity costs is forecast to
increase only marginally, implying net margins should remain at around their current
level until spring 2011. Whether margins follow this path is dependent on energy
suppliers maintaining prices at their current levels.
-100
0
100
200
300
400
500
600
£/cu
sto
mer
/yea
r
ELECTRICITY
Customer bill
Wholesale energy cost
Other costs and VAT
Net margin

7
Electricity and Gas Supply Market Report 29 September 2010
Figure 1.3: Typical gas customer bill, costs and net margin
1.10. Figure 1.3 shows our analysis for a typical stand-alone gas customer account.
There have been no changes to gas prices since the last round of cuts in February
and March of this year. These cuts brought the margin down by a third to an
estimated £50 per customer from an historic high in March of £75. Since June
wholesale gas costs, as estimated by our 18-month hedging strategy, have remained
at around £280 per year for a typical customer. This combined with stable retail
prices has led to only a small reduction in the net margin since June.
1.11. Looking forward, we estimate that by spring 2011 gas purchase costs may
have increased by 13%. Assuming there are no changes to retail gas prices, this will
decrease margins to around £10, for a typical gas customer account.
1.12. To enable comparison of customer bills and supplier costs over time, we
assume a constant level of consumption. A declining consumption trend impacts on
net margin as a substantial proportion of supplier costs are fixed. Holding
consumption constant over time means we may have overstated margin in recent
years, but understated margin in even earlier periods. The margins over time at
constant consumption are presented in the tables overleaf.
-150
-50
50
150
250
350
450
550
650
750
850
£/cu
sto
mer
/yea
r
GAS
Customer bill
Wholesale energy cost
Other costs and VAT
Net margin

8
Electricity and Gas Supply Market Report 29 September 2010
Figure 1.4: Dual fuel summary table (£/customer/year)
Figure 1.5: Electricity summary table (£/customer/year)
Figure 1.6: Gas summary table (£/customer/year)
Aug-2006 Aug-2007 Aug-2008 Aug-2009 Aug-2010
Customer bill £910 £865 £1100 £1145 £1105
Wholesale costs £610 £470 £635 £615 £485
VAT and other costs £305 £335 £380 £410 £430
Gross margins -£10 £60 £85 £125 £190
Operating costs £105 £110 £120 £125 £125
Implied net margins -£115 -£50 -£35 £0 £65
Notes:
Customer bill is for standard tariffs, weighted by payment method and market share. Average figures assume
electricity consumption of 4MWh/yr, gas consumption of 16.9MWh/yr. Figures rounded to nearest 5 & may
not sum due to rounding.
Aug-2006 Aug-2007 Aug-2008 Aug-2009 Aug-2010
Customer bill £425 £420 £500 £510 £505
Wholesale costs £225 £195 £260 £250 £205
VAT and other costs £140 £150 £170 £190 £205
Gross margins £55 £70 £65 £70 £95
Operating costs £55 £55 £60 £60 £65
Implied net margins £0 £15 £5 £10 £35
Notes:Customer bill is for standard tariffs, weighted by payment method and market share. Average figures assume
electricity consumption of 4MWh/yr. Figures rounded to nearest 5 & may not sum due to rounding.
Aug-2006 Aug-2007 Aug-2008 Aug-2009 Aug-2010
Customer bill £495 £465 £640 £665 £625
Wholesale costs £380 £275 £375 £360 £280
VAT and other costs £165 £185 £215 £220 £225
Gross margins -£50 £5 £50 £85 £115
Operating costs £50 £55 £60 £60 £65
Implied net margins -£105 -£50 -£5 £20 £50
Notes:Customer bill is for standard tariffs, weighted by payment method and market share. Average figures assume
gas consumption of 16.9MWh/yr. Figures rounded to nearest 5 & may not sum due to rounding.

9
Electricity and Gas Supply Market Report 29 September 2010
Appendices
Index
Appendix Name of Appendix Page Number
1 Feedback and questions 10
2 Hedging strategies 11
3 Wholesale prices and wholesale costs 13
4 Methodology 15
5 The Authority's powers and duties 19
6 Feedback questionnaire 22

10
Electricity and Gas Supply Market Report 29 September 2010
Appendix 1 – Feedback and questions
1.1. Ofgem would like to hear the views of interested parties in relation to any of the
issues set out in this document.
1.2. Feedback should be received by 31 October 2010 and should be sent to:
Stefan Bojanowski
GB Markets
9 Millbank
London
SW1P 3GE
020 7901 7068
1.3. Unless marked confidential, all responses will be published by placing them in
Ofgem‘s library and on its website www.ofgem.gov.uk. Respondents may request
that their response is kept confidential. Ofgem shall respect this request, subject to
any obligations to disclose information, for example, under the Freedom of
Information Act 2000 or the Environmental Information Regulations 2004.
1.4. Respondents who wish to have their responses remain confidential should clearly
mark the document/s to that effect and include the reasons for confidentiality. It
would be helpful if responses could be submitted both electronically and in writing.
Respondents are asked to put any confidential material in the appendices to their
responses. Having considered the responses to this consultation, Ofgem intends to
incorporate them in the next edition of this report.
1.5. Any questions on this document should, in the first instance, be directed to
Stefan Bojanowski, whose contact details are given above.

11
Electricity and Gas Supply Market Report 29 September 2010
Appendix 2 – Hedging strategies
1.1. Suppliers use a range of hedging strategies and can change their approach
through time. This section compares the cost to a supplier of adopting different
wholesale energy hedging strategies. The four strategies are designed based on
information collected in the Energy Supply Probe. Note these strategies are intended
to represent the industry as a whole rather than any particular firm. Please refer to
Appendix 4 for an explanation of the methodology.
Figure 2.1: Electricity hedging strategies
1.2. Figure 2.1 shows that the downward trend in wholesale electricity costs has
slowed across all four of the hedging strategies presented and has started to rise for
the 12-month hedging strategy. Depending on the hedging strategy, the current
average value of the contracted position is in the range £47-54/MWh.
0
20
40
60
80
100
£/M
Wh
12 month hedging strategy
18 month hedging strategy
18 month hedging strategy + 10% bought day-ahead
2 year hedging strategy
12
Electricity and Gas Supply Market Report 29 September 2010
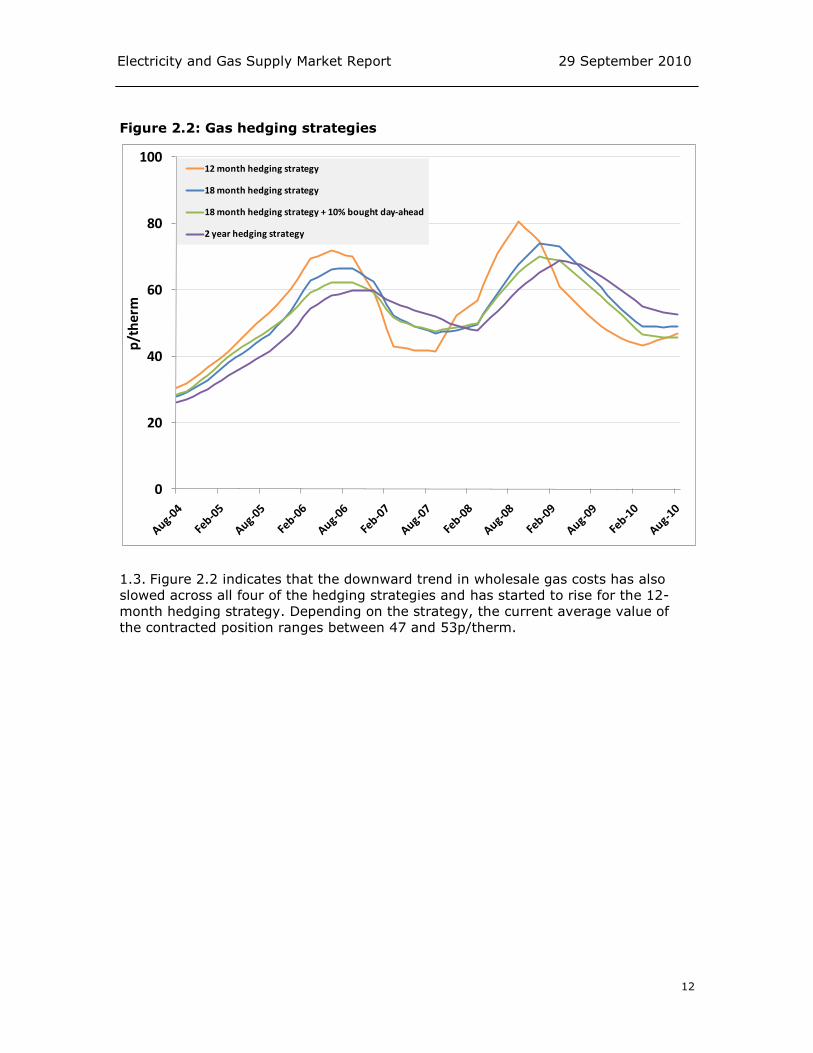
Figure 2.2: Gas hedging strategies
1.3. Figure 2.2 indicates that the downward trend in wholesale gas costs has also
slowed across all four of the hedging strategies and has started to rise for the 12-
month hedging strategy. Depending on the strategy, the current average value of
the contracted position ranges between 47 and 53p/therm.
0
20
40
60
80
100
p/t
her
m
12 month hedging strategy
18 month hedging strategy
18 month hedging strategy + 10% bought day-ahead
2 year hedging strategy

13
Electricity and Gas Supply Market Report 29 September 2010
Appendix 3 – Wholesale prices and wholesale costs
1.1. This section illustrates the relationship between the price of wholesale products
and our estimate of wholesale costs1. It shows the extent of variation in wholesale
prices and how suppliers can smooth costs by hedging. The charts compare day-
ahead and annual forward products with our wholesale cost estimate based on an
18-month hedging strategy. Please refer to Appendix 4 for an explanation of the
methodology.
Figure 3.1: Electricity forward prices vs. 18-month hedge
1.2. Figures 3.1 and 3.2 illustrate the relationship between wholesale electricity and
gas prices (wholesale prompt and annual forward prices) with the wholesale cost
based on our 18-month hedging strategy. Hedged wholesale costs are much less
volatile than wholesale prices, illustrating the reduction in risk to which suppliers are
exposed when they hedge through purchasing their energy requirement in advance.
1 Wholesale product prices are based on quoted prices in Heren‘s EDEM and ESGM reports.
0
20
40
60
80
100
120
£/M
Wh
Day-ahead
Annual forward contract
Wholesale energy cost (18mth hedge)

14
Electricity and Gas Supply Market Report 29 September 2010
Figure 3.2: Gas forward prices vs. 18-month hedge
1.3. Figures 3.1 and 3.2 also illustrate the lag between wholesale price changes and
changes in suppliers‘ forward energy costs. A longer hedging period leads to a
greater lag between wholesale market prices and supplier energy costs but also to
smoother price variations on average.
0
20
40
60
80
100
120
p/t
he
rm
Day-ahead
Annual forward
Wholesale energy cost (18mth hedge)

15
Electricity and Gas Supply Market Report 29 September 2010
Appendix 4 – Methodology
1.1. This section provides a detailed description of the methodology behind the
following data we have used in this report:
consumption levels;
average customer bill;
wholesale energy costs;
other supply costs (including network, environmental and some meter costs);
gross margin (which includes profits and operating costs); and
net margin.
1.2. Prices and costs are calculated at an average consumption per annum of 4MWh
of electricity and 16.9MWh of gas and are held constant over time in the analysis
presented in the text. This reflects data from DECC‘s Energy Trends, December 2009
publication. These values differ from the consumption figures we currently use in
average bill calculations in other Ofgem publications, and does not represent a
change in Ofgem‘s standard consumption figures (used for example in our ‗Energy
bills explained‘ factsheets). In August we published a consultation seeking views on
reviewing these standard consumption figures. This consultation recently closed. We
are considering responses before coming to a decision about implementation.
1.3. All cost items are expressed in nominal terms.
Figure 4.1: Illustrative breakdown of a typical dual fuel customer bill
44%
5%11%
8%
5%
21%
6% Wholesale electricity and gas cost
VAT
Operational costs
environmental and social costs
Other (including BSUOS, RBD, balancing and meter costs)
Network costs
Net margin

16
Electricity and Gas Supply Market Report 29 September 2010
Average customer bill
1.4. The average customer bill is an estimate of the average cost paid by UK retail
energy customers on standard tariffs. All price changes announced before September
1st have been included.
1.5. The average customer bill in the report is constructed using monthly prices
charged by the Big 6 companies and those charged by suppliers bought by, or
merged with, the Big 62. Each supplier‘s standard regional tariffs are averaged to
give a national average price for each payment method. These national averages are
weighted by the proportion of customers on each payment method and weighted by
the market share of each company.
1.6. We have not taken into account the impact of discounted and fixed price tariffs
as we are carrying out the analysis from the perspective of a typical customer and
standard tariffs remain the most popular tariff form. We are not trying to model
supply business profits.
Wholesale energy costs
1.7. The proportion of a customer‘s final energy bill which is accounted for by
wholesale costs varies between suppliers and over time with changing wholesale
costs and other costs.
1.8. Wholesale prices can be volatile. Suppliers therefore buy much of their energy
requirement ahead of delivery (hedging), to reduce the effect of large changes in the
wholesale price. This helps suppliers to smooth costs and provides them with more
certainty over future costs. Wholesale prices on any given day are therefore not a
good indicator of suppliers‘ wholesale costs, nor are short term products such as
within-day or day-ahead products. We use wholesale energy price data up to
September 1st.
1.9. We estimate the relationship between wholesale prices and suppliers‘ wholesale
energy costs. Our analysis is based on forward looking wholesale costs: it estimates
the expected cost of supplying energy to a customer for the next year at each point
in time, based on pricing information available at that time. Costs are based on
buying seasonal and quarterly products in electricity and gas, respectively.
1.10. We have estimated costs based on a range of different hedging strategies.
These strategies draw on information provided to us as part of the Energy Supply
Probe. Our model shows, what we believe, are generally representative of wholesale
costs across the industry. However, it is important to note that hedging strategies
2 Source: www.TheEnergyShop.com

17
Electricity and Gas Supply Market Report 29 September 2010
vary between suppliers and suppliers may change their strategies over time in
reaction to market conditions.
1.11. Firms operate a range of trading strategies, including purchasing energy
internally and on long-term contracts. By using market-based prices to estimate
wholesale costs, we are pricing energy at the price which firms are able to sell the
energy at on the wholesale market3.
1.12. The actual weighted average cost of electricity and gas could be different from
this if companies purchase energy internally from their upstream generation business
at a price different from the prevailing market price. Any margin made on energy
bought below market prices would mean an equivalently lower margin in the
generation business.
1.13. In Appendix 2 we present costs based on four different hedging strategies. In
the report we choose a central hedging strategy where costs are based on firms
starting to purchase energy 18 months ahead of time t, and have bought all their
energy requirements for the year ahead at time t. Figures 2.1 and 2.2 in Appendix 2
show how wholesale costs vary with alternative hedging strategies. The alternative
hedging strategies used are:
Firms start to purchase energy 12 months ahead of time t;
Firms start to purchase energy 2 years ahead of time t; and
Firms start to purchase energy 18 months ahead of time t, but only hedge 90%
with the remaining 10% purchased day-ahead.
1.14. Prices are weighted to take account of seasonal consumption trends (by
quarter for gas and by season for electricity). For electricity, wholesale costs include
both losses and our proxy for shaping costs. Wholesale energy cost is calculated by
averaging forward electricity and gas product prices over the buying period,
assuming a constant rate of purchase.
1.15. The wholesale cost model calculates wholesale costs on a quarterly basis,
which are then converted into a monthly series by taking a straight line average
between quarterly points.
Other supply costs
1.16. The components of other supply costs are network charges (transmission and
distribution), balancing costs, meter costs, RBD costs, environmental costs (Energy
Efficiency Commitment – EEC, Community Energy Savings Programme -CESP,
Carbon Emissions Reduction Target – CERT, and Renewables Obligation Certificates –
3 Formally this is known as an opportunity cost methodology.

18
Electricity and Gas Supply Market Report 29 September 2010
ROCs), other direct costs such as social tariffs and VAT. Note that electricity losses
and shaping costs are included within the wholesale cost.
1.17. Other costs are the expected costs over the next year. This means for
example, that suppliers' costs for the year from August 2010 also take into account
the extended CERT scheme introduced from April 2011.
Gross Margin
1.18. Gross margin is calculated as the difference between the average customer bill
and the sum of wholesale costs and other supply costs. In addition to operating
profit, gross margin includes suppliers‘ operating costs such as customer service
staffing, IT, marketing, billing and bad debt costs.
1.19. The analysis in the Energy Supply Probe – Initial Findings Report is at a net
margin level i.e. supplier‘s own internal operating costs were deducted and the net
margin therefore equated to supplier profit.
Net margin
1.20. The net margin is calculated as the difference between the average customer
bill and the sum of wholesale costs, other supply costs (as defined above) and
operating costs. Operating costs include customer service staffing, IT, marketing,
billing and bad debt costs.
1.21. Detailed operating cost data was collected from the Big 6 as part of the Energy
Supply Probe for the period 2005 to 2007. The data has been updated based on a
range of sources including publically available information and data provided to
Ofgem on a bilateral basis by the companies. This includes updated information on
the evolution of bad debt costs.
1.22. It is important to recognise that the net margin calculations are inherently
more uncertain than the gross margin calculations where network, fuel and
environmental costs account for the majority of total suppliers' costs. We have had
to use a range of assumptions to derive the figures for recent years where certain
cost data items are not available to us. The key assumption here is that where
updated operating cost information is not available, it is assumed that costs increase
in line with changes in previous years. We have also equalised the operating cost
data between electricity and gas.
Figure 4.2: Summary of changes since the last report
Updates Source
Tranmission and distribution losses updated DECC's DUKES
ROC assumptions updated Ofgem
Customer numbers updated Datamonitor

19
Electricity and Gas Supply Market Report 29 September 2010
Appendix 5 – The Authority‘s powers and duties
1.1. Ofgem is the Office of Gas and Electricity Markets which supports the Gas and
Electricity Markets Authority (―the Authority‖), the regulator of the gas and electricity
industries in Great Britain. This appendix summarises the primary powers and duties
of the Authority. It is not comprehensive and is not a substitute to reference to the
relevant legal instruments (including, but not limited to, those referred to below).
1.2. The Authority's powers and duties are largely provided for in statute (such as
the Gas Act 1986, the Electricity Act 1989, the Utilities Act 2000, the Competition Act
1998, the Enterprise Act 2002 and the Energy Acts of 2004, 2008 and 2010) as well
as arising from directly effective European Community legislation.
1.3. References to the Gas Act and the Electricity Act in this appendix are to Part 1 of
those Acts.4 Duties and functions relating to gas are set out in the Gas Act and
those relating to electricity are set out in the Electricity Act. This appendix must be
read accordingly.5
1.4. The Authority‘s principal objective is to protect the interests of existing and
future consumers in relation to gas conveyed through pipes and electricity conveyed
by distribution or transmission systems. The interests of such consumers are their
interests taken as a whole, including their interests in the reduction of greenhouse
gases and in the security of the supply of gas and electricity to them.
1.5. The Authority is generally required to carry out its functions in the manner it
considers is best calculated to further the principal objective, wherever appropriate
by promoting effective competition between persons engaged in, or commercial
activities connected with,
the shipping, transportation or supply of gas conveyed through pipes;
the generation, transmission, distribution or supply of electricity;
the provision or use of electricity interconnectors.
1.6. Before deciding to carry out its functions in a particular manner with a view to
promoting competition, the Authority will have to consider the extent to which the
interests of consumers would be protected by that manner of carrying out those
functions and whether there is any other manner (whether or not it would promote
competition) in which the Authority could carry out those functions which would
better protect those interests.
4 Entitled ―Gas Supply‖ and ―Electricity Supply‖ respectively. 5 However, in exercising a function under the Electricity Act the Authority may have regard to the interests of consumers in relation to gas conveyed through pipes and vice versa in the case of it exercising a function under the Gas Act.

20
Electricity and Gas Supply Market Report 29 September 2010
1.7. In performing these duties, the Authority must have regard to:
the need to secure that, so far as it is economical to meet them, all reasonable
demands in Great Britain for gas conveyed through pipes are met;
the need to secure that all reasonable demands for electricity are met;
the need to secure that licence holders are able to finance the activities which are
the subject of obligations on them6; and
the need to contribute to the achievement of sustainable development.
1.8. In performing these duties, the Authority must have regard to the interests of
individuals who are disabled or chronically sick, of pensionable age, with low
incomes, or residing in rural areas.7
1.9. Subject to the above, the Authority is required to carry out the functions
referred to in the manner which it considers is best calculated to:
promote efficiency and economy on the part of those licensed8 under the relevant
Act and the efficient use of gas conveyed through pipes and electricity conveyed
by distribution systems or transmission systems;
protect the public from dangers arising from the conveyance of gas through pipes
or the use of gas conveyed through pipes and from the generation, transmission,
distribution or supply of electricity; and
secure a diverse and viable long-term energy supply, and shall, in carrying out
those functions, have regard to the effect on the environment.
1.10. In carrying out these functions the Authority must also have regard to:
the principles under which regulatory activities should be transparent,
accountable, proportionate, consistent and targeted only at cases in which action
is needed and any other principles that appear to it to represent the best
regulatory practice; and
certain statutory guidance on social and environmental matters issued by the
Secretary of State.
1.11. The Authority may, in carrying out a function under the Gas Act and the
Electricity Act, have regard to any interests of consumers in relation to
communications services and electronic communications apparatus or to water or
6 Under the Gas Act and the Utilities Act, in the case of Gas Act functions, or the Electricity Act, the Utilities Act and certain parts of the Energy Acts in the case of Electricity Act
functions. 7 The Authority may have regard to other descriptions of consumers. 8 Or persons authorised by exemptions to carry on any activity.

21
Electricity and Gas Supply Market Report 29 September 2010
sewerage services (within the meaning of the Water Industry Act 1991), which are
affected by the carrying out of that function.
1.12. The Authority has powers under the Competition Act to investigate suspected
anti-competitive activity and take action for breaches of the prohibitions in the
legislation in respect of the gas and electricity sectors in Great Britain and is a
designated National Competition Authority under the EC Modernisation Regulation9
and therefore part of the European Competition Network. The Authority also has
concurrent powers with the Office of Fair Trading in respect of market investigation
references to the Competition Commission.
9 Council Regulation (EC) 1/2003.

22
Electricity and Gas Supply Market Report 29 September 2010
Appendix 6 – Feedback questionnaire
1.1. We are keen to consider any comments or complaints. In particular, we would
be keen to get your answers to the following questions:
1. Do you have any comments about the overall process?
2. Do you have any comments about the overall tone and content of the report?
3. Was the report easy to read and understand, could it have been better written?
4. To what extent did the report‘s conclusions provide a balanced view?
5. To what extent did the report make reasoned recommendations for
improvement?
6. Please add any further comments?
1.2. Please send your comments to:
Andrew MacFaul
Co-ordinator
Ofgem
9 Millbank
London
SW1P 3GE