Embed Size (px)
Citation preview

October 2005 Water Sampling
Validation Data Package forGround Water Interim ActionWell FieldBiogeochemical Sampling EventMoab, Utah
February 2006
DOE /GJ1130–2006–EM
U.S. Departmentof Energy
Work Performed Under DOE Contract No.for the U.S. Department of Energy Office of Management.
DE–AC01–02GJ79491Environmental
Approved for public release; distribution is unlimited.
Office of Environmental ManagementOffice of Environmental ManagementOffice of Environmental Management
MM AABBUMTRA ProjectUMTRA Project
Office of Environmental Management – Grand Junction

October 2005 Water Sampling
Validation Data Package for
Ground Water Interim Action Well Field
Biogeochemical Sampling Event Moab, Utah
February 2006

U.S. Department of Energy Biogeochemical Sampling⎯October 2005 February 2006 RIN: 05100240 and 05100245 Page ii
Moab, Utah October 25–28, 2005 Data Package Contents This data package includes the following information: Item No. Description of Contents 1. Sampling Event Summary
2. Sample Location Maps
3. Data Assessment Summary
Water Sampling Field Activities Verification Checklist Laboratory Performance Assessment Field Analyses/Activities Certification
Attachment 1—Data Presentation Minimums and Maximums Report Anomalous Data Review Checksheet Water Quality Data ESL Water Quality Data Water Level Data Blanks Report Time Versus Concentration Graphs Attachment 2—Trip Report

Sampling Event Summary
U.S. Department of Energy Biogeochemical Sampling⎯October 2005 February 2006 RIN: 05100240 and 05100245 Page 1
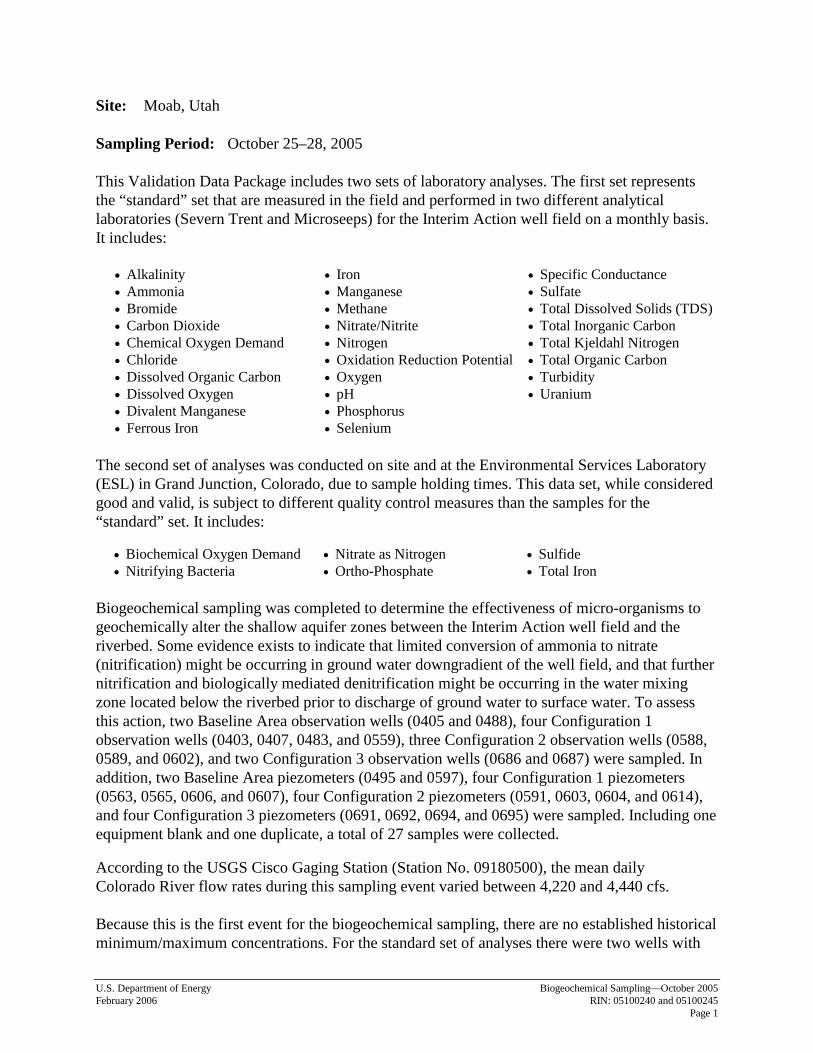
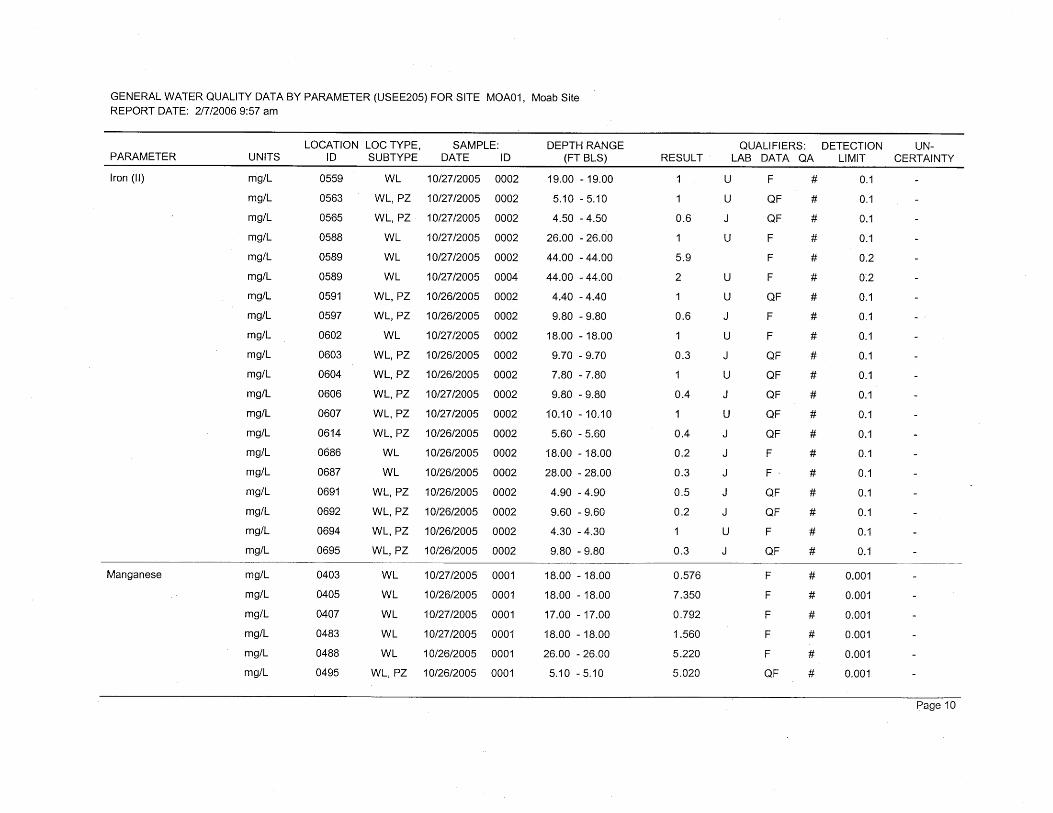
Site: Moab, Utah Sampling Period: October 25–28, 2005 This Validation Data Package includes two sets of laboratory analyses. The first set represents the “standard” set that are measured in the field and performed in two different analytical laboratories (Severn Trent and Microseeps) for the Interim Action well field on a monthly basis. It includes:
• Alkalinity • Iron • Specific Conductance • Ammonia • Manganese • Sulfate • Bromide • Methane • Total Dissolved Solids (TDS)• Carbon Dioxide • Nitrate/Nitrite • Total Inorganic Carbon • Chemical Oxygen Demand • Nitrogen • Total Kjeldahl Nitrogen • Chloride • Oxidation Reduction Potential • Total Organic Carbon • Dissolved Organic Carbon • Oxygen • Turbidity • Dissolved Oxygen • pH • Uranium • Divalent Manganese • Phosphorus • Ferrous Iron • Selenium
The second set of analyses was conducted on site and at the Environmental Services Laboratory (ESL) in Grand Junction, Colorado, due to sample holding times. This data set, while considered good and valid, is subject to different quality control measures than the samples for the “standard” set. It includes:
• Biochemical Oxygen Demand • Nitrate as Nitrogen • Sulfide • Nitrifying Bacteria • Ortho-Phosphate • Total Iron
Biogeochemical sampling was completed to determine the effectiveness of micro-organisms to geochemically alter the shallow aquifer zones between the Interim Action well field and the riverbed. Some evidence exists to indicate that limited conversion of ammonia to nitrate (nitrification) might be occurring in ground water downgradient of the well field, and that further nitrification and biologically mediated denitrification might be occurring in the water mixing zone located below the riverbed prior to discharge of ground water to surface water. To assess this action, two Baseline Area observation wells (0405 and 0488), four Configuration 1 observation wells (0403, 0407, 0483, and 0559), three Configuration 2 observation wells (0588, 0589, and 0602), and two Configuration 3 observation wells (0686 and 0687) were sampled. In addition, two Baseline Area piezometers (0495 and 0597), four Configuration 1 piezometers (0563, 0565, 0606, and 0607), four Configuration 2 piezometers (0591, 0603, 0604, and 0614), and four Configuration 3 piezometers (0691, 0692, 0694, and 0695) were sampled. Including one equipment blank and one duplicate, a total of 27 samples were collected.
According to the USGS Cisco Gaging Station (Station No. 09180500), the mean daily Colorado River flow rates during this sampling event varied between 4,220 and 4,440 cfs. Because this is the first event for the biogeochemical sampling, there are no established historical minimum/maximum concentrations. For the standard set of analyses there were two wells with


Sample Location Maps

U.S. D
epartment of E
nergy
Biogeochem
ical Sampling⎯
October 2005
February 2006
RIN
: 05100240 and 05100245
P
age 4
Sample Locations at the Interim Action Well Field and Baseline Area (may include locations not sampled)

U.S. Department of Energy Biogeochemical Sampling⎯October 2005 February 2006 RIN: 05100240 and 05100245 Page 5
Existing Well Locations

Data Assessment Summary

Water Sampling Field Activities Verification Checklist
Project Moab, Utah Date(s) of Water Sampling October 25–28, 2005
Date(s) of Verification January 17, 2006 Name of Verifier Jeff Price
Response
(Yes, No, NA) Comments
1. Is the SAP the primary document directing field procedures? Yes
2. List other documents, SOP’s, instructions. NA 3. Were the sampling locations specified in the planning documents
sampled? Yes 4. Was a pre-trip calibration conducted as specified in the above named
documents? Yes 5. Was an operational check of the field equipment conducted twice daily? Yes
6. Did the operational checks meet criteria? Yes 7. Were the number and types (alkalinity, temperature, Ec, pH, turbidity,
DO, ORP) of field measurements taken as specified? Yes 8. Was the Category of the well documented? Yes 9. Were the following conditions met when purging a Category I well:
10. Was one pump/tubing volume purged prior to sampling? Yes
11. Did the water level stabilize prior to sampling? Yes
12. Did pH, specific conductance, and turbidity measurements stabilize prior to sampling? Yes
13. Was the flow rate less than 500 mL/min? Yes
14. If a portable pump was used, was there a 4-hour delay between pump installation and sampling? NA
U.S. D
epartment of E
nergy
Biogeochem
ical Sampling⎯
October 2005
February 2006
RIN
: 05100240 and 05100245
Page 7

Water Sampling Field Activities Verification Checklist (Continued)
Response
(Yes, No, NA) Comments
15. Were the following conditions met when purging a Category II well:
16. Was the flow rate less than 500 mL/min? Yes
17. Was one pump/tubing volume removed prior to sampling? Yes 18. Were duplicates taken at a frequency of one per 20 samples? Yes 19. Were equipment blanks taken at a frequency of one per 20 samples that
were collected with nondedicated equipment? Yes 20. Were trip blanks prepared and included with each shipment of VOC
samples? NA 21. Were QC samples assigned a fictitious site identification number? Yes
22. Was the true identity of the samples recorded on the Quality Assurance Sample Log? Yes
23. Were samples collected in the containers specified? Yes 24. Were samples filtered and preserved as specified? Yes 25. Were the number and types of samples collected as specified? Yes 26. Were chain of custody records completed and was sample custody
maintained? Yes 27. Are field data sheets signed and dated by both team members? Yes 28. Was all other pertinent information documented on the field data
sheets? Yes 29. Was the presence or absence of ice in the cooler documented at every
sample location? Yes 30. Were water levels measured at the locations specified in the planning
documents? Yes
U.S. D
epartment of E
nergy
Biogeochem
ical Sampling⎯
October 2005
February 2006
RIN
: 05100240 and 05100245
Page 8

U.S. Department of Energy Biogeochemical Sampling⎯October 2005 February 2006 RIN: 05100240 and 05100245 Page 9
Laboratory Performance Assessment Severn Trent, St. Louis
General Information Requisition No.: 05100240 Sample Event: October 26−28, 2005 Site(s): Moab, Utah Laboratory: Severn Trent, St. Louis Work Order No.: F5K010102 Analysis: Inorganics Validator: Steve Donivan Review Date: December 29, 2005 This validation was performed according to the Environmental Procedures Catalog (STO 6), “Standard Practice for Validation of Laboratory Data”, GT-9(P) (2004). All analyses were successfully completed. The samples were prepared and analyzed using accepted procedures based on methods specified by line item code, which are listed in Table 1.
Table 1. Analytes and Methods
Analyte Line Item Code Prep Method Analytical Method Ammonia as N, NH3-N WCH-A-005 MCAWW 350.1 MCAWW 350.1
Bromide, Br MIS-A-038 MCAWW 300.0A MCAWW 300.0A
Chemical Oxygen Demand, COD WCH-A-010 MCAWW 410.4 MCAWW 410.4
Chloride, Cl MIS-A-039 MCAWW 300.0A MCAWW 300.0A
Dissolved Organic Carbon, DOC WCH-A-024 MCAWW 415.1 MCAWW 415.1
Iron, Fe GJO-16 SW-846 3005A SW-846 6010B
Manganese, Mn GJO-17 SW-846 3005A SW-846 6010B
Nitrite/Nitrate as N, NO2/NO3-N WCH-A-005 MCAWW 353.2 MCAWW 353.2
Phosphate as P WCH-A-029 MCAWW 365.2 MCAWW 365.2
Selenium, Se GJO-14 SW-846 3005A SW-846 6020A
Sulfate, SO4 MIS-A-044 MCAWW 300.0A MCAWW 300.0A
Total Dissolved Solids, TDS WCH-A-033 MCAWW 160.1 MCAWW 160.1
Total Inorganic Carbon, TIC GJO-49 MCAWW 415.1 MCAWW 415.1
Total Kjeldahl Nitrogen, TKN WCH-A-039 MCAWW 351.2 MCAWW 351.2
Total Organic Carbon, TOC WCH-A-025 MCAWW 415.1 MCAWW 415.1
Uranium, U GJO-01 SW-846 3005A SW-846 6020A
Data Qualifier Summary Analytical results were qualified as listed in Table 2. Refer to the sections below for an explanation of the data qualifiers applied.

U.S. Department of Energy Biogeochemical Sampling⎯October 2005 February 2006 RIN: 05100240 and 05100245 Page 10
Table 2. Data Qualifiers
Sample Number
Location Analyte Flag Reason
All All DOC J Result above the calibration range
All All TOC J Result above the calibration range
All All P J Matrix spike failure
HN21P 0607 Mn U Less than 5 times the calibration blank
HN20C 0483 Se U Less than 5 times the calibration blank
HN20M 0559 Se U Less than 5 times the calibration blank
HN216 2244 (Equip Blank) Se U Less than 5 times the calibration blank
HN21P 0607 Se U Less than 5 times the calibration blank
HN2X8 0407 Se U Less than 5 times the calibration blank
Sample Shipping/Receiving
Severn Trent Laboratories in St. Louis, Missouri, received 47 water samples under air bill number 8191 2834 3420 on October 29, 2005, accompanied by a COC form. The COC form was checked to confirm that all of the samples were listed on the form with sample collection dates and times, and that signatures and dates were present indicating sample relinquishment and receipt. The sample submittal documents, including the COC and the Sample Tickets, had no errors or omissions. Preservation and Holding Times The sample shipment was received cool and intact with the temperature within the chilled coolers between 2 °C and 3 °C, which complies with requirements. All samples were received in the correct container types and had been preserved correctly for the requested analyses with the following exception. The sample bottle from location 0695 submitted for COD, P, and TKN analysis was received with a pH of 8. The laboratory adjusted the pH to less than 2 with sulfuric acid. All samples were analyzed within the applicable holding times with the exception of TIC. The TIC analysis was performed beyond the nominal 28 day holding time; however, method 415.1 does not have an established holding time. Laboratory Instrument Calibration Compliance requirements for satisfactory instrument calibration are established to ensure that the instrument is capable of producing acceptable qualitative and quantitative data for all analytes. Initial calibration demonstrates that the instrument is capable of acceptable performance in the beginning of the analytical run and of producing a linear curve. Compliance requirements for continuing calibration checks are established to ensure that the instrument continues to be capable of producing acceptable qualitative and quantitative data. All laboratory instrument calibrations were performed correctly in accordance with the cited methods.

U.S. Department of Energy Biogeochemical Sampling⎯October 2005 February 2006 RIN: 05100240 and 05100245 Page 11
Method SW-846 6010B Calibrations for iron and manganese were performed on November 7, 2005, using three calibration standards resulting in calibration curves with correlation coefficient (r2) values greater than 0.995. The absolute values of the calibration curve intercepts were less than 3 times the method detection limit (MDL). Calibration and laboratory spike standards were prepared from independent sources. Initial and continuing calibration verification (CCV) checks were made at the required frequency resulting in 13 CCVs. All calibration checks met the acceptance criteria. Reporting limit verification checks were made at the beginning and end of the analytical sequence to verify the linearity of the calibration curve near the practical quantitation limit. All results were within the acceptance range. Method SW-846 6020A Calibrations for selenium and uranium were performed on November 2, 2005. The initial calibrations were performed using five calibration standards resulting in calibration curves with correlation coefficient (r2) values greater than 0.995. The absolute values of the curve intercepts were less than 3 times the MDL. Calibration and laboratory spike standards were prepared from independent sources. Initial and CCV checks were made at the required frequency resulting in 6 CCVs. All calibration check results met the acceptance criteria. A reporting limit verification check was made at the required frequency to verify the linearity of the calibration curve near the practical quantitation limit. The check results for all analytes were within the acceptance criteria range. Mass calibration and resolution verifications were performed at the beginning of each analytical run in accordance with the analytical procedure. Internal standard recoveries were stable and within acceptable ranges. Method MCAWW 300.0A The initial calibrations for bromide, chloride and sulfate were performed using five calibration standards each on November 20, 2005. The calibration curve r2 values were greater than 0.995 and intercepts were less than 3 times the MDL. Initial calibration and calibration check standards were prepared from independent sources. Initial and continuing calibration checks were made at the required frequency resulting in 21 CCVs. All calibration checks met the acceptance criteria. Method MCAWW 160.1 There is no initial or continuing calibration requirement associated with the determination of TDS. Method MCAWW 350.1 The initial calibrations for ammonia as N were performed using six calibration standards on November 3, 2005, resulting in a calibration curve with a correlation coefficient (r2) value greater than 0.995 and an intercept less than 3 times the MDL. Initial and CCV checks were made at the required frequency resulting in 8 CCVs. All calibration check results met the acceptance criteria.

U.S. Department of Energy Biogeochemical Sampling⎯October 2005 February 2006 RIN: 05100240 and 05100245 Page 12
Method MCAWW 351.2 The initial calibrations for total Kjeldahl nitrogen were performed using five calibration standards on November 8, 2005, resulting in calibration curves with correlation coefficient (r2) values greater than 0.995 and intercepts less than 3 times the MDL. Initial and CCV checks were made at the required frequency resulting in 7 CCVs. All calibration check results met the acceptance criteria. Method MCAWW 353.2 The initial calibrations for nitrite/nitrate as N were performed using seven calibration standards on November 7, 2005, resulting in calibration curves with correlation coefficient (r2) values greater than 0.995 and intercepts less than 3 times the MDL. Initial and CCV checks were made at the required frequency resulting in 7 CCVs. All calibration check results met the acceptance criteria. Method MCAWW 365.2 The initial calibrations for phosphate as P were performed using four calibration standards on November 14, 2005, resulting in calibration curves with correlation coefficient (r2) values greater than 0.995 and intercepts less than 3 times the MDL. Initial and CCV checks were made at the required frequency resulting in 7 CCVs. All calibration check results met the acceptance criteria. Method MCAWW 410.4 There is no initial or continuing calibration requirement associated with the determination of chemical oxygen demand (COD). Method MCAWW 415.1 Organic Carbon, Total and Dissolved The initial calibrations for organic carbon were performed using three calibration standards on November 21, 2005 resulting in a calibration curve with correlation coefficient (r2) values greater than 0.995 and an intercept less than 3 times the MDL. Initial and CCV checks were made at the required frequency resulting in 6 CCVs. All calibration check results met the acceptance criteria. All sample concentrations were above the linear range of the calibration curve. Dilution and re-analysis of the samples resulted in results below the detection limit indicating a matrix interference. All results are qualified with a “J” flag as estimated values. Method MCAWW 415.1 Total Inorganic Carbon The initial calibrations for total inorganic carbon were performed using three calibration standards on November 29, 2005, and December 1, 2005, resulting in calibration curves with correlation coefficient (r2) values greater than 0.995 and intercepts less than 3 times the MDL. Initial and CCV checks were made at the required frequency resulting in 7 CCVs. All calibration check results met the acceptance criteria.

U.S. Department of Energy Biogeochemical Sampling⎯October 2005 February 2006 RIN: 05100240 and 05100245 Page 13
Method and Calibration Blanks Method blanks are analyzed to assess any contamination that may have occurred during sample preparation. Calibration blanks are analyzed to assess instrument contamination prior to and during sample analysis. All method blanks and calibration blanks were below the required detection limits. In cases where blank concentration exceeds the instrument detection limit, the associated sample results are qualified with a “U” flag (not detected) when the sample result is greater than the MDL but less than 5 times the blank concentration.
Inductively Coupled Plasma Interference Check Sample Analysis Inductively coupled plasma interference check samples were analyzed at the required frequency to verify the instrumental interelement and background correction factors. All check sample results met the acceptance criteria.
Matrix Spike Analysis Matrix spike samples were analyzed for all analytes as a measure of method performance in the sample matrix with the exception of ammonia. Laboratory control samples were analyzed for ammonia in lieu of matrix spike samples because of the large dilution factors required. The spike recoveries met the recovery and precision criteria for all analytes with the following exceptions. The organic carbon matrix spike data were not evaluated because the unspiked sample concentration was greater than 4 times the spike amount. The phosphate as P spike recovery was outside the acceptance range. All results are qualified with a “J” flag as estimated values. Laboratory Replicate Analysis The relative percent difference values for the laboratory replicate sample and matrix spike duplicate sample results for all analytes were less than 20 percent, indicating acceptable laboratory precision. Laboratory Control Sample Laboratory control samples were analyzed at the correct frequency to provide information on the accuracy of the analytical method and the overall laboratory performance, including sample preparation. The results were acceptable for all analytes. Metals Serial Dilution Serial dilutions were performed during the metals analysis to monitor physical or chemical interferences that may exist in the sample matrix. All results met the acceptance criteria, with the exception of potassium. Potassium results were not qualified based on the serial dilution results because the concentration of the undiluted samples was less than 50 times the practical quantitation limit.

U.S. Department of Energy Biogeochemical Sampling⎯October 2005 February 2006 RIN: 05100240 and 05100245 Page 14
Detection Limits/Dilutions Samples were diluted in a consistent and acceptable manner when required. The samples were diluted prior to analysis of uranium to reduce interferences. The required detection limits were achieved for all analytes Completeness Results were reported in the correct units for all analytes requested using contract-required laboratory qualifiers. Chromatography Peak Integration The integration of analyte peaks was reviewed for all ion chromatography data. There were no manual integrations performed, and all peak integrations were satisfactory. Electronic Data Deliverable File The electronic data deliverable (EDD) file arrived on December 8, 2005. The Sample Management System EDD validation module was used to verify that the EDD file was complete and in compliance with requirements. The module compares the contents of the file to the requested analyses to ensure all and only the requested data are delivered. The contents of the EDD were manually examined to verify that the sample results accurately reflect the data contained in the sample data package.

U.S. Department of Energy Biogeochemical Sampling⎯October 2005 February 2006 RIN: 05100240 and 05100245 Page 15
Laboratory Performance Assessment Microseeps, Pittsburgh, PA
General Information Report Number (RIN): 05100245
Sample Event: October 26-28, 2005 Site(s): Moab, Utah Laboratory: Microseeps, Pittsburgh, PA Work Order No.: P0510497 Analysis: Dissolved Gasses, Reduced Metals Validator: Steve Donivan Review Date: December 29, 2005 This validation was performed according to the Environmental Procedures Catalog (STO 6), “Standard Practice for Validation of Laboratory Data,” GT-9(P) (2004). See attached Data Validation Worksheets for supporting documentation on the data review and validation. All analyses were successfully completed. The samples were prepared and analyzed using accepted procedures based on methods specified by line item code, which are listed in Table 1.
Table 1. Analytes and Methods
Analyte Line Item Code Prep Method Analytical Method Dissolved Gasses GJO-52 AM20GAX AM20GAX
Manganese (II) GJO-53 Mod.7199 Mod.7199
Iron (II) GJO-54 Mod.7199 Mod.7199
Data Qualifier Summary None of the analytical results required qualification. Sample Shipping/Receiving Microseeps in Pittsburgh, Pennsylvania, received 18 water samples on October 28, 2005, accompanied by a COC form. The COC form was checked to confirm that all of the samples were listed on the form with sample collection dates and times, and that signatures and dates were present indicating sample relinquishment and receipt. The COC form was complete with no errors or omissions. Preservation and Holding Times The sample shipment was received cool and intact with a temperature within the cooler of 17.0 °C. All samples were received in the correct container types and had been preserved correctly for the requested analyses. There are no standard holding times for these analytes and the analyses were completed as quickly as possible.

U.S. Department of Energy Biogeochemical Sampling⎯October 2005 February 2006 RIN: 05100240 and 05100245 Page 16
Laboratory Instrument Calibration Data for this RIN were reported at Analysis Report Category II (results plus quality control) and do not include calibration data. Method Blanks All method blank results were below the practical quantitation limits. Matrix Spike Analysis Matrix spike and matrix spike duplicate samples (MS/MSD) were analyzed for iron (II) and manganese (II) as a measure of method performance in the sample matrix. The MS/MSD analyses resulted in acceptable recovery and precision for both analytes. Laboratory Replicate Analysis The relative percent difference (RPD) values for the laboratory control sample duplicate samples and MSD sample results for all analytes were less than 20 percent indicating acceptable precision. Laboratory Control Sample Laboratory control samples (LCS) were analyzed at the correct frequency to provide information on the accuracy of the analytical method and the overall laboratory performance, including sample preparation. The LCS results were acceptable for all analysis categories. Detection Limits/Dilutions Samples were diluted in a consistent and acceptable manner when required. The required detection limits were met for all analytes. Completeness
Results were reported in the correct units for all analytes requested using contract-required laboratory qualifiers. Electronic Data Deliverable (EDD) File An EDD file arrived on December 6, 2005. The contents of the EDD were manually examined to verify that the sample results accurately reflect the data contained in the sample data package.

U.S. Department of Energy Biogeochemical Sampling⎯October 2005 February 2006 RIN: 05100240 and 05100245 Page 17
Field Analyses/Activities
The following information summarizes the field analyses and activities for this sampling event period. Field Activities All monitor well results were qualified with an “F” flag in the database indicating the wells were purged and sampled using the low-flow sampling method. Extraction wells are not sampled using the low-flow sampling method. An equipment blank was collected and analyzed for the same constituents as the Moab environmental samples. Analyte concentrations, with the exception of chemical oxygen demand, TDS, and uranium, measured in the equipment blank were below their respective contract required detection limits. It is expected that the equipment decontamination process was less than sufficient, or that the water used during the decontamination process and later submitted for analysis was less than sufficient. A duplicate sample was collected from location 0589. There are no established regulatory criteria for the evaluation of field duplicate samples; therefore, U.S. Environmental Protection Agency (EPA) guidance for laboratory duplicates (which is conservative for field duplicates +/-20 RPD) was used to assess the precision of the field duplicates. The following analytes did not meet the duplicate criteria: chemical oxygen demand, chloride, dissolved organic carbon, phosphorus, sulfate, and TDS.


Attachment 1
Data Presentation

Minimums and Maximums Report

Minimums and Maximums Report The Minimums and Maximums Report is generated by a data validation application (DataVal) used to query the SEEPro database. The DataVal compares the new data set with historical data and lists all new data that fall outside the historical data range. Values listed in the report are further screened and the results are not considered anomalous if: (1) identified low concentrations are the result of low detection limits; (2) the concentration detected is within 50 percent of historical minimum or maximum values; or (3) there were fewer than five historical samples for comparison.


Anomalous Data Review Checksheet


Water Quality Data


ESL Water Quality Data


Water Level Data


Blanks Report


Time Versus Concentration Graphs

Moab Site (MOA01)
Ammonia Total as N Concentration
0
100
200
300
400
500
600
700
800
900
1000
05/0
6/20
04
06/0
6/20
04
07/0
6/20
04
08/0
6/20
04
09/0
6/20
04
10/0
6/20
04
11/0
6/20
04
12/0
6/20
04
01/0
6/20
05
02/0
6/20
05
03/0
6/20
05
04/0
6/20
05
05/0
6/20
05
06/0
6/20
05
07/0
6/20
05
08/0
6/20
05
09/0
6/20
05
10/0
6/20
05
11/0
6/20
05
Date
Am
mo
nia
To
tal a
s N
(m
g/L
)
Loc 0405
Loc 0488
Moab Site (MOA01)
Uranium Concentration
0
0.5
1
1.5
2
2.5
3
3.5
4
05/0
6/20
04
06/0
6/20
04
07/0
6/20
04
08/0
6/20
04
09/0
6/20
04
10/0
6/20
04
11/0
6/20
04
12/0
6/20
04
01/0
6/20
05
02/0
6/20
05
03/0
6/20
05
04/0
6/20
05
05/0
6/20
05
06/0
6/20
05
07/0
6/20
05
08/0
6/20
05
09/0
6/20
05
10/0
6/20
05
11/0
6/20
05
Date
Ura
niu
m (
mg
/L)
Loc 0405
Loc 0488

Moab Site (MOA01)
Ammonia Total as N Concentration
0
200
400
600
800
1000
1200
1400
1600
04/0
7/20
04
05/0
7/20
04
06/0
7/20
04
07/0
7/20
04
08/0
7/20
04
09/0
7/20
04
10/0
7/20
04
11/0
7/20
04
12/0
7/20
04
01/0
7/20
05
02/0
7/20
05
03/0
7/20
05
04/0
7/20
05
05/0
7/20
05
06/0
7/20
05
07/0
7/20
05
08/0
7/20
05
09/0
7/20
05
10/0
7/20
05
Date
Am
mo
nia
To
tal a
s N
(m
g/L
)
Loc 0483
Loc 0559
Loc 0563
Moab Site (MOA01)
Uranium Concentration
0
0.5
1
1.5
2
2.5
3
3.5
04/0
7/20
04
05/0
7/20
04
06/0
7/20
04
07/0
7/20
04
08/0
7/20
04
09/0
7/20
04
10/0
7/20
04
11/0
7/20
04
12/0
7/20
04
01/0
7/20
05
02/0
7/20
05
03/0
7/20
05
04/0
7/20
05
05/0
7/20
05
06/0
7/20
05
07/0
7/20
05
08/0
7/20
05
09/0
7/20
05
10/0
7/20
05
Date
Ura
niu
m (
mg
/L)
Loc 0483
Loc 0559
Loc 0563

Moab Site (MOA01)
Ammonia Total as N Concentration
0
200
400
600
800
1000
1200
1400
1600
08/1
8/20
04
09/1
8/20
04
10/1
8/20
04
11/1
8/20
04
12/1
8/20
04
01/1
8/20
05
02/1
8/20
05
03/1
8/20
05
04/1
8/20
05
05/1
8/20
05
06/1
8/20
05
07/1
8/20
05
08/1
8/20
05
09/1
8/20
05
10/1
8/20
05
Date
Am
mo
nia
To
tal a
s N
(m
g/L
)
Loc 0588
Loc 0589
Loc 0591
Loc 0603
Moab Site (MOA01)
Uranium Concentration
0
0.5
1
1.5
2
2.5
3
08/1
8/20
04
09/1
8/20
04
10/1
8/20
04
11/1
8/20
04
12/1
8/20
04
01/1
8/20
05
02/1
8/20
05
03/1
8/20
05
04/1
8/20
05
05/1
8/20
05
06/1
8/20
05
07/1
8/20
05
08/1
8/20
05
09/1
8/20
05
10/1
8/20
05
Date
Ura
niu
m (
mg
/L)
Loc 0588
Loc 0589
Loc 0591
Loc 0603

Attachment 2
Trip Report

DATE: February 2, 2006 TO: John Ford FROM: K. G. Pill SUBJECT: REVISED Trip Report Site: Moab – Interim Action Well Field Biogeochemical Sampling Event – October 2005 Date of Sampling Event: October 25 through 28, 2005. Team Members: Emile Bettez and Michelle Hershey. Sarah Morris was also on site to complete ESL analytical work. Sampling Event Background: This biogeochemical sampling is the first in a series of events designed to relatively measure micro-organism populations in area where the shallow aquifer intersects the riverbed of the Moab site, and evaluate the attenuation of contaminant concentrations in ground water and the river because of biologically mediated reactions. Specific locations from the baseline area, Configuration 1, 2, and 3 were sampled.
Number of Locations Sampled: Two Baseline Area observation wells (0405 and 0488), four Configuration 1 observation wells (0403, 0407, 0483, and 0559), three Configuration 2 observation wells (0588, 0589, and 0602), and two Configuration 3 observation wells (0686 and 0687). In addition, two Baseline Area piezometers (0495 and 0597), four Configuration 1 piezometers (0563, 0565, 0606, and 0607), four Configuration 2 piezometers (0591, 0603, 0604, and 0614), and four Configuration 3 piezometers (0691, 0692, 0694, and 0695) were sampled. Including one equipment blank and one duplicate, a total of 27 samples were collected. Locations Not Sampled/Reason: None Field Variance: Two ticket numbers were assigned to each sampled because the samples were submitted to two different labs for analysis (two RIN numbers were also assigned for the same reason). Limited sample volume was available for analysis from a majority of the piezometers. These samples were analyzed for highest priority analytes, and split and preserved as directed by the laboratory for proper analysis. Only one duplicate was collected from this event because of the limited sample volume collected from the piezometers. Sample Analysis: Samples were analyzed by Severn Trent Laboratories, St. Louis, Microseeps, Inc., and the Grand Junction Office Environmental Science Laboratory (ESL) for the following analytes:

Biogeochemical Sampling Event February 2, 2006 Page 2
Analyte Laboratory Priority Nitrate / Nitrite as N Severn Trent High
Ferrous Iron / Divalent Manganese Microseeps
Carbon Dioxide / Methane / Nitrogen / Oxygen Microseeps
Bromide / Chloride / Sulfate Severn Trent
Nitrifying Bacteria ESL
Biological Oxygen Demand ESL
Total Dissolved Solids Severn Trent
Total Iron ESL
Nitrite (as N) ESL
Sulfide ESL
Orthophosphate ESL
Ammonia (as N) Severn Trent
Dissolved Organic Carbon / Total Inorganic Carbon Severn Trent
Iron / Manganese / Selenium / Uranium Severn Trent
Total Organic Carbon Severn Trent Chemical Oxygen Demand / Total Phosphorus / Total Kjeldahl
Nitrogen Severn Trent Low
The analytes are listed from high to low priority for locations in which sufficient sample volume was not available (i.e., riverbed piezometers) for complete analyses. Quality Control Sample Cross Reference: Following are the false identifications assigned to the quality control samples:
False ID True ID Sample Type Associated Matrix
Ticket Number
2243 and 2246 0589 Duplicate from 44 ft bgs Ground Water NDV 171 and NDZ 172
2244 and 2247 NA Equipment Blank – GW Equip DI Water NDZ 179 and NDZ 180
RIN Numbers Assigned: All samples sent to Severn Trent Laboratories were assigned to RIN 05100240. Samples sent to Microseeps, Inc for analysis were assigned to RIN 05100245. Sample Shipment: One half of the samples were shipped in one cooler overnight FEDEX to Microseeps, Inc. from Moab, Utah, on October 27, 2005 (Airbill No. 829324093130). The remaining samples were shipped to Microseeps, Inc., and Severn Trent Laboratories in 5 coolers from Moab, Utah, on October 28, 2005 (Airbill Nos. 829324093107 and 829324093118). Location Specific Information – Observation Wells: All observation wells were sampled using micro-purge techniques with a peristaltic pump and downhole tubing. Sample depths and water levels for each observation well are listed in the following table.

Biogeochemical Sampling Event February 2, 2006 Page 3
Well No.
Area Date Time Depth to
Water (ft btoc)
Sample Depth (ft bgs)
0405 Baseline Area 10/26/05 11:06 14.45 18 0488 Baseline Area 10/26/05 10:05 14.31 26 0403 CF1 10/27/05 16:15 16.36 18 0407 CF1 10/27/05 18:20 16.98 17 0483 CF1 10/27/05 17:40 16.89 18 0559 CF1 10/27/05 17:00 17.42 19 0588 CF2 10/27/05 13:33 15.28 26 0589 CF2 10/27/05 15:05 15.14 44 0602 CF2 10/27/05 14:20 16.08 18 0686 CF3 10/26/05 14:26 15.41 18 0687 CF3 10/26/05 13:39 15.91 28
Location Specific Information – Piezometer Sampling: All piezometers were purged on October 25, and sampled on October 26, 27, and 28 (if necessary). The table below presents the water level, stick up height, and depth to the river surface for the piezometers prior to the initial purge.
PZ No.
Area
Date
Time
Depth to Water
(ft btoc)
Stick Up Height
(ft)
Depth to River Surface
(ft btoc) 0495 Baseline Area 10/25/05 15:00 3.86 0.4 Dry at base 0597 Baseline Area 10/25/05 15:16 5.79 2.22 Dry at base 0563 CF1 10/25/05 17:31 2.73 0.38 Dry at base 0565 CF1 10/25/05 17:13 1.87 1.0 Dry at base 0606 CF1 10/25/05 17:25 4.92 2.22 Dry at base 0607 CF1 10/25/05 17:08 5.06 1.97 Dry at base 0591 CF2 10/25/05 16:25 1.06 1.09 1.1 0603 CF2 10/25/05 16:33 2.51 2.28 Dry at base 0604 CF2 10/25/05 16:48 5.46 - Dry at base 0614 CF2 10/25/05 16:43 2.27 1.38 Dry at base 0691 CF3 10/25/05 15:30 5.96 2.08 Dry at base 0692 CF3 10/25/05 15:38 6.74 2.35 Dry at base 0694 CF3 10/25/05 15:49 3.50 2.68 Dry at base 0695 CF3 10/25/05 15:56 3.69 2.42 Dry at base
Limited sample volume was available for analysis from all locations with the exception of 0695. These samples were analyzed for highest priority analytes, and split and preserved as directed by the laboratory for proper analysis.
Well Inspection Summary: A well inspection was not conducted.
Equipment: No issues to report.
Site Issues: According to the USGS Cisco Gaging Station (Station No. 09180500), the mean daily Colorado River flows during this sampling event are provided in the following table.

Biogeochemical Sampling Event February 2, 2006 Page 4
Date Daily Mean Flow (cfs)
10/24/2005 4,440
10/25/2005 4,290
10/26/2005 4,260
10/27/2005 4,220
10/28/2005 4,260
10/29/2005 4,260
Corrective Action Required/Taken: None.
(KGP/lcg)
cc: C. I. Bahrke, Stoller (e) L. E. Cummins, Stoller (e) S. E. Donivan, Stoller (e) K. E. Karp, Stoller (e) K. E. Miller, Stoller K. G. Pill, Stoller (e) J. E. Price, Stoller (e) Document Production (e)
K:\SMO\Moab\DATA VALIDATION PACKAGES\BioGeochemical\IntActWellFieldBioGeoChemSampling-Oct2005.doc
Baseline Area Piezometers 0495 and 0597
PZ 0495
PZ 0597

Biogeochemical Sampling Event February 2, 2006 Page 5
CF1 Piezometers 0563 and 0606
CF1 Piezometers 0565 and 0607
PZ 0563
PZ 0565
PZ 0607
PZ 0606

Biogeochemical Sampling Event February 2, 2006 Page 6
CF2 Piezometers 0591 and 0603
CF2 Piezometers 0604 and 0614
PZ 0603
PZ 0591
PZ 0604
PZ 0614

Biogeochemical Sampling Event February 2, 2006 Page 7
CF3 Piezometers 0691 and 0692
CF3 Piezometers 0694 and 0695
PZ 0691
PZ 0692
PZ 0694 PZ 0695