Embed Size (px)
Citation preview

Dissecting the Sun’s Turmoil
22 February 2011 sky & telescope
of the
The Solar Dynamics Observatory is taking
continuous, fi ne-scale movies of every
layer from the Sun’s surface up.
monica bobra OFF-PLANET ECLIPSE From its position in geosynchronous orbit 22,000 miles above Earth’s surface, SDO sometimes sees the Moon cross the Sun. Low lunar hills are visible on the limb against gossamer loops of plasma in the solar atmosphere.NASA / SDO / AIA SCIENCE TEAM
ART SDO Layout.indd 22 12/1/10 2:04:15 PM

was a remarkably active day on the Sun. Several fl ares erupted, sending gusts of charged particles across the solar system. Some of these particles slid down Earth’s magnetic fi eld lines, plunged into the atmosphere, and created vivid curtains of auroral light. Further eruptions have been taking place, and it seems that a new solar-activity cycle is fi nally under way —providing scientists with a long-awaited opportunity to study renewed solar activity with a new suite of space-borne instruments.
On February 11, 2010, NASA launched its most ambi-tious endeavor to study the Sun: the nearly $1 billion, three-instrument Solar Dynamics Observatory. SDO was designed to image the activity in every layer of the Sun simultaneously, continuously, and at high resolution and high speed (S&T: January 2010, page 22). SDO began observing last April. Here are some early returns from its three instruments.
Helioseismic and Magnetic Imager (HMI)Like swarms of needles poking up through a swath of fabric, magnetic fi eld lines poke through the visible solar surface. In his fi rst look at the Sun through a telescope, Galileo unknowingly viewed these fi eld lines; they cause the Sun to be pockmarked with spots. Sunspots, regions of extremely strong, dense magnetic fi eld, appear dark because they’re about a thousand degrees Celsius cooler than the surrounding plasma (ionized gas). Such a strong magnetic fi eld inhibits convection and turnover of surface material, allowing it time to cool.
Although people have observed sunspots for millennia (Chinese astronomers noted them around 20 B.C.), they remain bewilderingly complex and unpredictable. Take, for example, the spot at the top of the next page. Over nine days this solitary spot underwent an astrophysical mitosis, splitting into two identical off spring. Why?
The magnetic fi eld loops emerging from below the solar surface are far from random. Sunspots often cluster in groups, which implies some sort of common process occurring below. Thanks to HMI, scientists will be able to infer better what happens down inside. By combining HMI data with theory, they will model the fl ow of plasma to a depth of some 20,000 km (12,000 miles) underneath every single sunspot for the next fi ve years. That’s 5% of the way down to the Sun’s center.
In addition, using a 16-megapixel camera, HMI takes images of the ubiquitous magnetic fi eld at the solar sur-face. At the bottom of the next page is a high-resolution map of the solar magnetic fi eld, constructed from HMI data. Studying the ebbs and fl ows of the Sun’s surface
August 1, 2010,
SkyandTelescope.com February 2011 23
FAST ACTION The resolution of SDO’s AIA camera, which took this extreme-ultraviolet image, isn’t new. SDO’s prede-cessor, the Transition Region and Coronal Explorer (TRACE), began taking images at 1-arcsecond resolution some 12 years ago. But AIA takes full-disk images at about 500 times the rate (“cadence”).
NA
SA /
SD
O /
AIA
SC
IEN
CE
TEA
M
ART SDO Layout.indd 23 12/1/10 2:04:19 PM

24 February 2011 sky & telescope
Dissecting the Sun’s Turmoil
magnetism is a key to understanding many of the frenetic things happening on and above the Sun, as told on the facing page.
Atmospheric Imaging Assembly (AIA)The magnetic fi eld is tightly anchored in the Sun’s surface. When a fl are erupts, the surface itself generally remains unperturbed. The atmosphere above, however, rapidly changes shape. The solar magnetic fi eld is like a willow tree — the branches fl ail in stormy winds, but the roots stay fi rm in the ground.
In the AIA image of the solar atmosphere on the previ-ous page, the colors represent diff erent layers spanning more than 2 million degrees Celsius. Blue is the cool-est, and red is the hottest. There’s a lot going on: bright patches, dark holes, tiny spots … a circular magnetic wellspring marks an active region, the source of solar fl ares. Dark, rope-like fi laments run across the upper
atmosphere. (Where fi laments appear against the back-ground of space rather than the solar surface, they glow as prominences.) After this frame was taken, several fl ares went off in the tangled mess of magnetic activity, sending the fi laments fl ying off the Sun in the direction of Earth. AIA fi lmed the whole thing.
Already, AIA is challenging the notion that fl ares are isolated patches of activity. Instead, data show that a fl are is inextricably linked to the rest of the features across the Sun’s 865,000-mile-wide disk.
The AIA movies will likely give scientists clues as to how fi laments form in the fi rst place. Some think that shear motions on the churning surface are what create them. Others suspect that fi laments bubble up as-is from the solar interior.
When a fi lament lifts off the Sun, it cools and dis-perses into interplanetary space. And because the four AIA telescopes take simultaneous exposures in four wavelengths, they can study how this twisted rope of magnetic material changes in temperature, structure, and mass during the beginning of its journey across the solar system.
Extreme-ultraviolet Variability Experiment (EVE)When a solar eruption hits Earth, it dumps a lot more than just particles into the upper atmosphere. It also delivers lots of high-energy, ionizing radiation, aff ecting the shape of Earth’s ionosphere. Determining how Earth’s atmosphere reacts to such energy is an outstanding prob-
MAGNETIC MAP This is a frame from an SDO movie that maps the swarming magnetic activ-ity in the Sun’s light-emit-ting layer, or photosphere. The photosphere is strangely cooler than the tenuous corona; a mere 6,000ºC, compared to the corona’s millions of degrees. Magnetic struc-tures leading up from the surface are likely a major part of the coronal heating mechanism.
Above: A sunspot’s umbra, or dark inner area, is held in the grip of a strong magnetic fi eld. Nevertheless this one, for reasons not well understood, split in two.Left: To watch movies of the Sun in action, you can load the free Microsoft Tag app onto your phone from the URL at left. Then take a picture with your phone of the code square. A page with movies from SDO will open on your screen.
Get the free tag-linking app for your phone at http://gettag.mobi.
NASA / SDO / HMI SCIENCE TEAM
NA
SA /
SD
O /
AIA
SC
IEN
CE
TEA
M
ART SDO Layout.indd 24 12/1/10 2:04:24 PM

SkyandTelescope.com February 2011 25
THE SUN IS JUST A BALL OF GAS, mostly hydrogen. How can something so simple produce such complex, bizarre, unpredictable structures and behavior?
The key is that the Sun’s gas is hot enough to be ionized: some of its atoms have had an electron knocked off . These free electrons can move around. Any substance with freely movable electrons conducts electricity; metal is an example. So for this purpose, you can think of the Sun as like a churning ball of liquid copper.
The slightest electric current in a conductor creates a magnetic fi eld. Magnetic fi eld lines try to stay fi xed in a conductor, like strings in clay. It takes energy to drag the lines sideways through the material, like dragging strings sideways through clay. Instead, if the fi eld lines move they’ll tend to drag the conducting material — the gas of the Sun — along with them.
But the Sun’s ionized gas doesn’t want to cooperate. It has its own agenda: churning and boiling, driven by heat fl owing up from below. So the gas sometimes overpowers the magnetic fi eld lines and carries them with it.
And as you learned in school, a moving magnetic fi eld generates electric current. This current in turn creates newmagnetic fi eld, which generates new current, and so on.
Here comes the important part. Wherever in nature
a runaway positive-feedback arrangement like this gets going, you’re likely to see it spawn remarkable, chaotic, endless complexity. Unpredictable emergent phenomenaappear from it — forms of higher-level organization and structure that you could never have predicted from fi rst principles.
And why does that occur? Because — key point, now! — we live in a universe with an interesting property: energy fl owing through a system tends to organize that system into greater complexity, producing emergent phenomena (at the expense of greater disorder, or entropy, elsewhere).
After all, that’s the only kind of universe we could arise to fi nd ourselves living in. Life is an example of this process. On Earth, the energy fl ow consists of sunlight arriving, driving processes and complexifi cation on the ground, and eventually radiating away to space as waste heat. In the Sun’s own case, the energy fl ow consists of heat coming up from the interior and radiating to space.
The interaction between magnetic fi elds and fl uid conductors is called magnetohydrodynamics, or MHD. It is a notoriously diffi cult fi eld, precisely because MHD systems break so easily into positive feedback, chaos, and emergent phenomena. — Alan MacRobert
Why Is the Sun So Complicated?
This wild solar land-scape was imaged in the extreme ultraviolet (17.1 nm) by TRACE, the Transition Region and Coronal Explorer.
NA
SA /
TR
AC
E
ART SDO Layout.indd 25 12/1/10 2:04:28 PM

AIA BandsESP Bands
0 5 10 15 20 25 30 35 40 45 50Wavelength (nanometers)
Inte
nsity
55 60 65 70 75 80 85 90 95 100 105
Dissecting the Sun’s Turmoil
26 February 2011 sky & telescope
lem in space physics with many practical consequences. EVE is helping solve this problem by monitoring the
Sun’s total extreme-ultraviolet output. It sees the Sun as one pixel but resolves a thousand wavelengths from 0.1 to 105 nanometers (1 to 1050 angstrom units), as seen in the spectrum below. Using EVE and AIA data, scien-tists found a peculiar behavior of solar fl ares: they shine brightest in ultraviolet when they erupt, but they almost
BROAD SPECTRUM Instead of taking images, the EVE instrument watches the Sun’s ultraviolet spectrum from 0.1 to 105 nanome-ters. This spectrum is typical. The gray bands indicate the wavelengths that AIA can see. The orange bands show the wavelengths covered by the Extreme Ultraviolet Spectrophotometer, one of EVE’s fi ve channels.
LAYER BY LAYER These images, taken at the same time, show the Sun in diff erent combinations of wavelengths, highlighting layers from the chromosphere just above the white-light surface (30.4 nanometers, shown red) to the upper corona (9.4 nm, blue). The tem-perature skyrockets in the “transition region” above the chromosphere. As a result, a lot of solar activity happens in this layer.
always emit another burst of ultraviolet light some hours later, like an aftershock following an earthquake. That sort of result is integral to learning how fl ares aff ect Earth’s atmosphere.
EVE scientists have also deduced that a tiny, long-dura-tion fl are dumps as much energy into Earth’s ionosphere as a huge brief one. The latter ones get the press, but the former are just as important.
NASA / SDO / AIA SCIENCE TEAM (3)
DA
TA: N
ASA
/ S
DO
/ E
VE
SCIE
NC
E TE
AM
ART SDO Layout.indd 26 12/1/10 2:04:29 PM
SkyandTelescope.com February 2011 27
Working ContinuouslyBecause it’s critical to study not only transient, big events but also the ever-present small ones, SDO doesn’t have time to blink. Taking images nearly continuously (95% of the time for the next 5 years), SDO sends back nearly two terabytes of data a day, the highest rate of any spacecraft NASA has fl own. By comparison, the Hubble Space Telescope sends down about a thousandth as much.
With so much data, solar scientists hope they can fi nally study the entire Sun for what it is — not just the star that gives life to Earth, but an immense untapped opportunity to view important universal phenomena up close. ✦
Former S&T editorial intern Monica Bobra is now a member of the SDO HMI science team. She studies the solar magnetic fi eld at Stanford University.
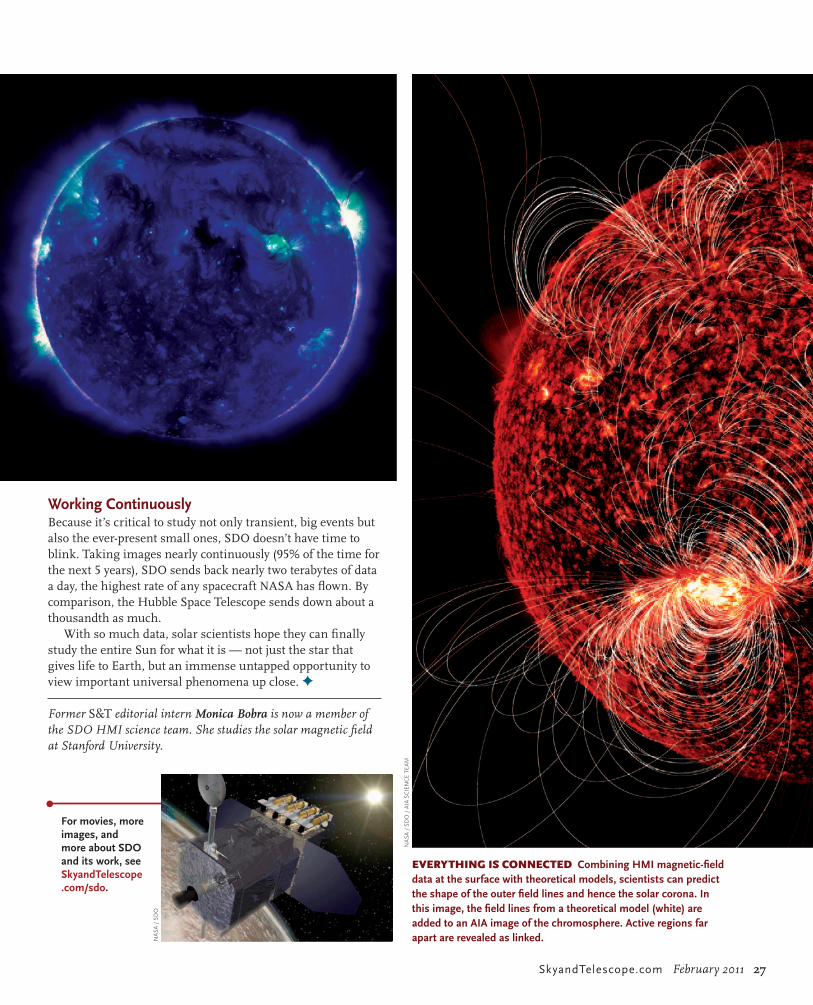
EVERYTHING IS CONNECTED Combining HMI magnetic-fi eld data at the surface with theoretical models, scientists can predict the shape of the outer fi eld lines and hence the solar corona. In this image, the fi eld lines from a theoretical model (white) are added to an AIA image of the chromosphere. Active regions far apart are revealed as linked.
For movies, more images, and more about SDO and its work, see SkyandTelescope.com/sdo.
NA
SA /
SD
O
NA
SA /
SD
O /
AIA
SC
IEN
CE
TEA
M
ART SDO Layout.indd 27 12/1/10 2:04:32 PM