Embed Size (px)
Citation preview

DEVELOPMENT CHARGESBACKGROUND STUDY
CONSOLIDATION STUDY
HEMSON C o n s u l t i n g L t d.
May 16, 2018
TABLE OF CONTENTS
Executive Summary .......................................................................................... 1 I Introduction .......................................................................................... 12 II The Methodology Combines A City-Wide and Area-Specific Approach to
Align Development-Related Costs and Benefits .................................... 14
A. Both City-Wide and Area-Specifc Development Charges are Proposed ..................................................................................... 14
B. Key Steps in Determining Development Charges for Future Growth-Related Projects ............................................................. 16
III Population is Forecast To Increase by 67,000 and Non-Residential
Building Space by 2.8 Million Square Metres by 2027 .......................... 20
A. Vaughan has Experienced Rapid Growth in Recent Years ........... 20 B. The Residential Forecast is Based on The Region Of York
Projections .................................................................................. 21 C. Non-Residential Space Forecast is Based On Forecast Employment
Growth ....................................................................................... 22 IV Summary of Historical Capital Service Levels ....................................... 24 V The Development-Related Capital Forecast .......................................... 26
A. A Development-Related Capital Forecast is Provided for Council’s Approval ..................................................................................... 26
B. The Development-Related Capital Forecast for City-Wide Services ....................................................................................... 26
C. The Development-Related Capital Forecast for Area-Specific Services ....................................................................................... 30
VI Proposed Development Charges are Calculated in Accordance With the
DCA ...................................................................................................... 32
A. Unadjusted Development Charge Calculation for City-Wide Services ....................................................................................... 32
B. Proposed City-Wide Residential and Non-Residential Development Charges ....................................................................................... 37
C. Development Charges for Area-Specific Services ........................ 40 VII Comparison of Proposed and Existing Development Charges ............... 42
VIII Long-Term Capital and Operating Costs ............................................... 45
A. Net Operating Costs for The City’s Services Estimated to Increase by $39.2 Million Over the Forecast Period .................................. 45
HEMSON
B. Long-Term Capital Financing from Non-Development Charge Sources Totals $77.5 Million ....................................................... 45
IX Asset Management Plan ........................................................................ 49
A. Annual Capital Provisions Will Reach $10.2 Million by 2028 for General Services and $22.9 Million by 2032 for City-Wide Engineered Services .................................................................... 49
X Development Charges Administration .................................................. 51
APPENDIX A Development Forecast .................................................................. 52
APPENDIX B General Government .................................................................... 77
APPENDIX C Library Service .............................................................................. 86
APPENDIX D Fire and Rescue Service ................................................................ 97
APPENDIX E Community Services ................................................................... 109
APPENDIX F Public Works: Buildings and Fleet ............................................... 213
APPENDIX G City-Wide Engineering ................................................................ 229
APPENDIX H Area-Specific Development Charges ........................................... 251
APPENDIX I Reserve Funds ............................................................................. 277
APPENDIX J Long-Term Capital and Operating Impacts .................................. 280
APPENDIX K Asset Management Plan .............................................................. 284
APPENDIX L Draft DC By-Law ........................................................................ 290
HEMSON

HEMSON
EXECUTIVE SUMMARY
The following summarizes the findings of the 2018 Development Charges Background Study.
A. STUDY CONSISTENT WITH DEVELOPMENT CHARGES LEGISLATION
This study calculates development charges for the City of Vaughan in compliance with the provisions of the Development Charges Act, 1997 (DCA) and its associated regulation (Ontario Regulation 82/98) and the recently amended provisions of the legislation.
The City of Vaughan’s existing development charges by-laws, By-law 045-
2013 and the various area-specific by-laws expire on September 22, 2018, and Council must pass new development charges by-laws before this expiry date in order to continue to levy development charges.
The City needs to continue implementing development charges to fund
capital projects related to growth throughout Vaughan so that development pays for its capital requirements to the extent allowed by the DCA and so that new services required by growth are provided in a fiscally responsible manner.
The DCA and O. Reg. 82/98 require that a development charges
background study be prepared in which development charges are determined with reference to:
a forecast of the amount, type and location of housing units, population and non-residential development anticipated in the City;
a review of future capital projects, including an analysis of gross expenditures, funding sources, and net expenditures incurred or to be incurred by the City to provide for the expected development, including the determination of the growth and non-growth-related components of the capital projects; and
1
an examination of the long-term capital and operating costs for the capital infrastructure required for each service to which the development charges by-laws would relate.
This report identifies the development-related net capital costs which are attributable to development that is forecast to occur in the City. These costs are apportioned to types of development (residential, non-residential) in a manner that reflects the increase in the need for each service attributable to each type of development.
B. ALL SERVICES WITH DEVELOPMENT-RELATED COSTS INCLUDED IN THE ANALYSIS
The following City services have been included in the development charge analysis:
General Government; Library; Fire and Rescue; Community Services; Public Works: Buildings and Fleet; City-Wide Engineering (including roads and associated structures,
sidewalks, streetlights, streetscaping and intersections and City-wide Watermains);
Area-Specific Wastewater; and Area-Specific Storm Drainage
C. TWO APPROACHES ARE USED TO CALCULATE DEVELOPMENT CHARGES
A City-wide average cost approach is used to calculate development charges for general government, library, fire & rescue, community services, public works buildings & fleet and city-wide engineering. This approach results in uniform charges throughout the City.
In addition, Area-Specific Development Charges (ASDCs), also called
Special Area Development Charges, are calculated for water (carry forward ASDCs), wastewater and storm drainage services. The area-specific approach more closely aligns costs and benefits for services where benefits
HEMSON
2

are more localized and can be identified. This approach is combined with the average City-wide approach for all other services.
D. THE CITY OF VAUGHAN IS ANTICIPATED TO GROW BY 67,000 PEOPLE AND 42,000 EMPLOYEES OVER 10 YEARS
A development forecast for the 10 year study period, 2018–2027, estimates that the City's population will grow by approximately 67,000 people and by about 102,000 to ultimate development (2031 for the purposes of this study).
Population growth in new housing units is expected to add 70,000 people
over the 2018–2027 period and 104,000 to ultimate development.
The City’s employment is forecast to grow by approximately 42,000 employees over the next 10 years and 56,000 to ultimate development.
This employment growth is projected to generate about 2.8 million square metres of new non-residential building space between 2018 and 2027 and 3.7 million square metres to ultimate development (2031).
Existing 2018 – 2027 2018 – 2031
RESIDENTIAL FORECAST As At 2017
Forecast Change
As At 2027
Forecast Change
As At 2031
Households
96,405
25,177
121,582
37,888
134,293
Population Census 312,853 66,908 379,761 101,779 414,632 In New Households 70,498 104,113
HEMSON
3

The following is a summary of the projected growth for the City:
E. INCREASE IN NEED FOR SERVICE BASED ON “NET” GROWTH
In accordance with the DCA, development charges have been calculated at a level no higher than the average service level provided in the City over the ten-year period immediately preceding the preparation of the background study, on a service by service basis.
The increase in need for service required to service the anticipated development is based on the “net” population and employment growth in the City.
F. THE DEVELOPMENT CHARGES STUDY INCLUDES A $720.5 MILLION DEVELOPMENT-RELATED CAPITAL PROGRAM FOR GENERAL SERVICES OVER THE NEXT 10 YEARS AND A $2.1 BILLION PROGRAM FOR CITY-WIDE ENGINEERING SERVICES TO ULTIMATE DEVELOPMENT
The 2018–2027 development-related capital program for general services including General Government, Library, Fire & Rescue, Community Services, and Public Works Buildings & Fleet, totals $720.5 million.
The City-wide Engineering net capital program totals an additional $2.1
billion. This amount is estimated to provide for development-related infrastructure required to 2031 and beyond.
The DCA requires that the gross capital costs be reduced by grants, subsidies,
and recoveries from other governments; capital replacements or other benefits provided to the existing community; existing reserve fund balances; amounts that exceed historical service levels; and a statutory 10 per cent reduction for eligible soft services when calculating development charges.
Existing 2018 – 2027 2018 – 2031 NON-RESIDENTIAL FORECAST As At
2017 Forecast Change
As At 2027
Forecast Change
As At 2031
Non-Residential Building Space (sq.m)
2,803,031
3,646,989
Employment
214,748
42,180
256,928
55,789 270,537
HEMSON
4
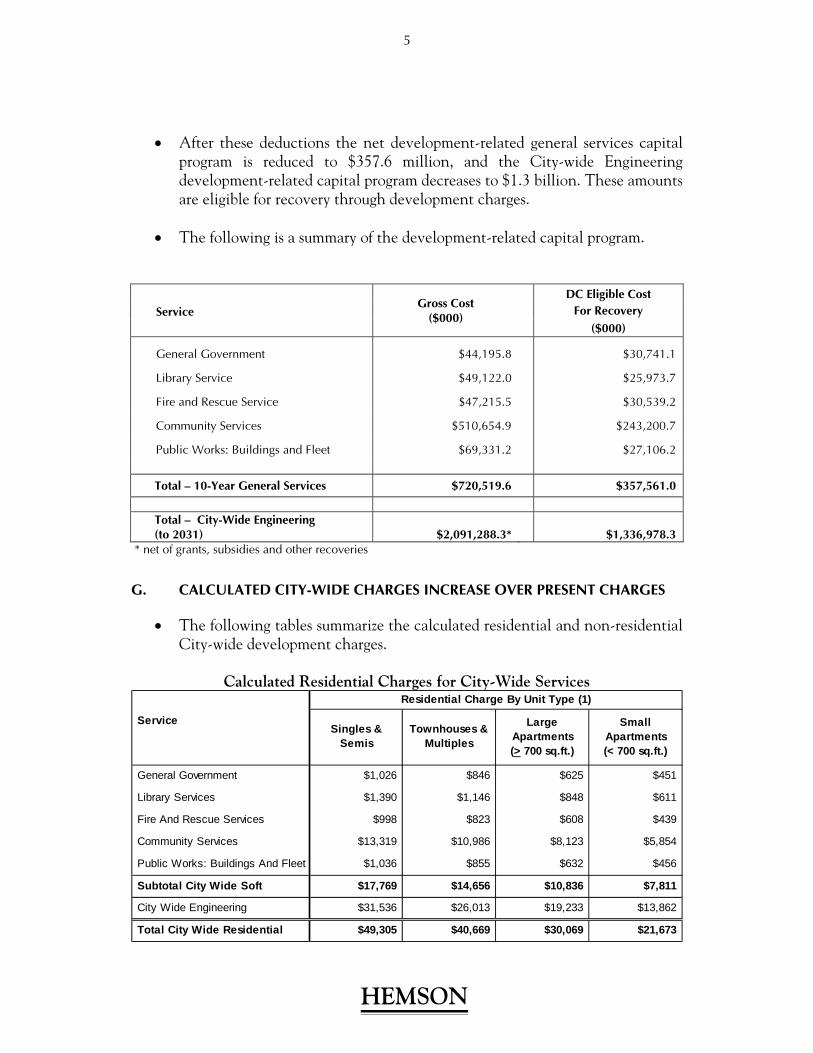
After these deductions the net development-related general services capital
program is reduced to $357.6 million, and the City-wide Engineering development-related capital program decreases to $1.3 billion. These amounts are eligible for recovery through development charges.
The following is a summary of the development-related capital program.
Gross Cost
($000)
DC Eligible Cost Service For Recovery
($000)
General Government $44,195.8 $30,741.1
Library Service $49,122.0 $25,973.7
Fire and Rescue Service $47,215.5 $30,539.2
Community Services $510,654.9 $243,200.7
Public Works: Buildings and Fleet $69,331.2 $27,106.2
Total – 10-Year General Services $720,519.6 $357,561.0
Total – City-Wide Engineering (to 2031) $2,091,288.3* $1,336,978.3
* net of grants, subsidies and other recoveries
G. CALCULATED CITY-WIDE CHARGES INCREASE OVER PRESENT CHARGES
The following tables summarize the calculated residential and non-residential City-wide development charges.
Calculated Residential Charges for City-Wide Services
Service
General Government $1,026 $846 $625 $451
Library Services $1,390 $1,146 $848 $611
Fire And Rescue Services $998 $823 $608 $439
Community Services $13,319 $10,986 $8,123 $5,854
Public Works: Buildings And Fleet $1,036 $855 $632 $456
Subtotal City Wide Soft $17,769 $14,656 $10,836 $7,811
City Wide Engineering $31,536 $26,013 $19,233 $13,862
Total City Wide Residential $49,305 $40,669 $30,069 $21,673
Small Apartments (< 700 sq.ft.)
Large Apartments (> 700 sq.ft.)
Townhouses & Multiples
Residential Charge By Unit Type (1)
Singles &Semis
HEMSON
5

Calculated Non-Residential Charges for City-Wide Services
Service
General Government $4.38
Library Services $0.00
Fire And Rescue Services $4.28
Community Services $0.00
Public Works: Buildings And Fleet $4.46
Subtotal City Wide Soft $13.12
City Wide Engineering $130.80
Total City Wide Non-Residential $143.92
Non-Residential Charge per
Square Metre
As illustrated in the next table, the proposed residential charge is 97 per
cent higher than the present charge for single and semi-detached units.
Comparison of City-Wide Residential Charges
Current CalculatedService Residential Residential
Charge / SDU Charge / SDU
General Government $353 $1,026 $673 190%
Library Services $1,053 $1,390 $337 32%
Fire And Rescue Services $679 $998 $319 47%
Community Services $8,833 $13,319 $4,486 51%
Public Works: Buildings And Fleet $563 $1,036 $473 84%
Subtotal City Wide Soft $11,481 $17,769 $6,288 55%
City Wide Engineering $13,517 $31,536 $18,019 133%
Total City Wide Residential $24,998 $49,305 $24,307 97%
Difference in Charge
The City-wide Engineering charge is calculated to increase by 133 per cent. This increase is due to several factors:
HEMSON
6

A better understanding of the road requirements in the City’s key growth areas including the VMC, northern areas (Blocks 27, 41, and 55) and employment areas (Blocks 34 & 35).
The cost of land has increased significantly in Vaughan and across the GTA and with more intensification the City will have to acquire more land for roads on the open market rather than Planning Act dedications.
The Province is making significant improvement to the GO Transit network and GTA municipalities are required assist in the funding of new and upgraded rail-road grade separations.
Generally the base unit costs of undertaking engineering projects have increased faster than price inflation indices.
The general services portion of the charge increases by 55 per cent over present rates. The increase reflects land and construction cost increases in excess of the legislated indexing rate.
The calculated non-residential development charge is approximately 151
per cent higher than the City’s current charge due to the more extensive City-wide Engineering capital program.
Comparison of City-Wide Non-Residential Charges
Current CalculatedService Non-Res Non-Res
Charge Charge
General Government $1.35 $4.38 $3.03 224%
Library Services $0.00 $0.00 $0.00 0%
Fire And Rescue Services $2.80 $4.28 $1.48 53%
Community Services $0.00 $0.00 $0.00 0%
Public Works: Buildings And Fleet $2.28 $4.46 $2.18 96%
Subtotal City Wide Soft $6.43 $13.12 $6.69 104%
City Wide Engineering $50.99 $130.80 $79.81 157%
Total City Wide Non-Residential $57.42 $143.92 $86.50 151%
Difference in Charge
Non-Residential ($/Square Metre)
HEMSON
7

H. A PORTION OF DEVELOPMENT-RELATED COSTS REQUIRE FUNDING FROM NON-DEVELOPMENT CHARGE SOURCES
The Development Charges Act, 1997 requires that the development-related net capital costs for “soft” services be reduced by 10 per cent in calculating the applicable development charge for these services. The 10 per cent share of development-related net capital costs not included in the development charge calculation must be funded from non-development charge sources.
In total, nearly $59.1 million is identified to provide for the required 10 per
cent reduction. Non-development charge funding for replacement portions of the capital
forecast (e.g. repositioning of Station 7-2) and other benefits to the existing community will total an additional $18.4 million.
In sum, tax-supported funding of $77.5 million will be required over the
2018–2027 period to support the development-related capital program. It is estimated also that net operating costs will increase by about $39.2
million by the year 2027 as the facilities and infrastructure embodied in the capital forecast are operated and maintained.
I. AREA-SPECIFIC CHARGES
Area-Specific Development Charges are proposed to provide for various water (carry forward ASDCs), wastewater and storm drainage services.
The ASDCs calculated for the purposes of this background study are
summarized below. It should be noted that two of the service areas will be charged on a per unit basis for residential development and per square metre of gross floor area for non-residential development, while the balance of the ASDCs will be levied on a land area basis ($/net hectare).
HEMSON
8

Service Area Net CostNet
Developable Area (Ha)
Charge Per Net Developable
Ha
Carry Forward ASDCsRainbow Creek Drainage Works $1,861,629 662.71 $2,809
Pressure District 5 West (Woodbridge Watermain) $1,245,243 155.01 $8,033
Pressure District 7 Watermain West $568,340 203.83 $2,788
Zenway/Huntington Road Sanitary $4,224,249 376.74 $11,213
Huntington Road Sewer (Trade Valley to Rutherford) $2,719,025 308.80 $8,805
Highway 27 South Servicing $881,929 5.11 $172,589
New ASDCsVMC - Interchange Storm Water $39,032,598 54.34 $718,253
Steeles West Sanitary Sewer Impovement Works $2,277,898 37.60 $60,583
Steeles West SWM Works $35,530,895 37.60 $944,982
Woodbridge Avenue Sanitary Sewer Improvements $322,732 26.12 $12,357
Total $88,664,537 1,867.85
New ASDC
VMC SE DOUGHTON SANITARY
SEWER
VMC WEST - INTERCHANGE
SANITARY SEWER
Charge Per Residential Unit:Singles & Semis $765 $514
Townhouses & Multiples $631 $424
Large Apartments (>= 700 sq.ft.) $467 $313
Small Apartments (< 700 sq.ft.) $336 $226
Charge Per m2 of Non-Res GFA $7.39 $4.96
It should be noted the City may pass ASDC by-laws for other service areas in the future as more detailed planning and engineering information becomes available.
The Edgeley Pond and Black Creek Channel Works ASDCs which were completed in 2016 have not been reviewed as part of this study.
J. CONSIDERATION FOR AREA RATED SERVICES
In accordance with the DCA, Council must give consideration to the use of area rating, also know as area-specific development charges, as part of the development charges background study. The City of Vaughan has historically used both City-wide and area-specific charges and this practice is continued in the preparation of this study.
HEMSON
9

K. ASSET MANAGEMENT PLAN
A key function of the Asset Management Plan is to demonstrate that all assets proposed to be funded under the development charges by-law are financially sustainable over their full life-cycle.
By 2028, the City will need to fund an additional $10.2 million per annum to properly fund the full life cycle costs of the new City-wide general service assets supported under the 2018 Development Charges By-Law. A further $22.9 million will be required by 2032 for City-wide engineered services.
The assets proposed to be funded under the development charges by-law are considered to be financially sustainable over their full life-cycle.
L. NO SIGNIFICANT CHANGES ARE RECOMMENDED REGARDING COLLECTION OR BY-LAW ADMINISTRATION
It is recommended that practices regarding collection of development charges and by-law administration continue to the extent possible.
It is further recommended that the collection and administration policies
be as consistent as practicable with those of the Regional Municipality of York in order to simplify by-law administration and aid understanding for those required to pay the charges.
As required under the DCA, the City should codify any rules regarding
application of the by-laws and exemptions within the development charges by-laws proposed for adoption.
It is recommended that the by-law permit the payment of a development
charge in cash or through services in lieu agreements. The municipality is not obligated to enter into services in lieu agreements.
It is recommended that the City continue to pursue cost-sharing and
uploading with the Regional Municipality of York for road-related infrastructure that meets the criteria of Regional significance.
HEMSON
10

It is recommended that the City examine ways to streamline the administration of ASDCs. This may involve the use of external trustees or additional internal resources.
It is recommended that Council adopt the development-related capital
program included in this background study, subject to annual review through the City’s normal capital budget process
HEMSON
11
I INTRODUCTION
This City of Vaughan Development Charges Background Study is presented as part of a process to lead to the approval of new development charge by-laws in compliance with the Development Charges Act, 1997 (DCA).
The DCA and Ontario Regulation 82/98 (O. Reg. 82/98) require that a development charge background study be prepared in which development charges are determined with reference to:
A forecast of the amount, type and location of housing units, population and non-residential development anticipated in the City;
The average capital service levels provided in the City over the 10 year
period immediately preceding the preparation of the background study; A review of capital works in progress and anticipated future capital
projects, including an analysis of gross expenditures, funding sources, and net expenditures incurred or to be incurred by the City or its local boards to provide for the expected development, including the determination of the growth and non-growth-related components of the capital projects; and
An examination of the long term capital and operating costs for the capital
infrastructure required for each service to which the development charges by-laws would relate.
This study presents the results of the review which determines the development-related net capital costs which are attributable to development that is forecast to occur in the community. These development-related net capital costs are then apportioned among various types of development (residential; non-residential) in a manner that reflects the increase in the need for each service attributable to each type of development.
The DCA provides for a period of public review and comment regarding the proposed development charges. Following completion of this process in accordance with the DCA and Council’s review of this study and the comments it receives
HEMSON
12

regarding this study or other information brought to its attention about the proposed charges, it is intended that Council will pass new development charges for the City.
The remainder of this study sets out the information and analysis upon which the proposed development charges are based.
Section II designates the services for which the development charges are proposed and the areas within the City to which the development charges will apply. It also briefly reviews the methodology that has been used in this background study.
Section III presents a summary of the forecast residential and non-residential development which is expected to occur within the City over the 2018–2027 period and to 2031 (ultimate development).
Section IV summarizes the historical ten-year average capital service levels that have been attained in the City which form the basis for the development charge calculations.
In Section V, the development-related capital program that has been developed by various City departments and boards is reviewed.
Section VI summarizes the calculation of applicable development charges and the resulting proposed development charges by class and type of development as well as by geographic area in the City.
Section VII provides a comparison of existing development charge rates in the City with the rates proposed in this study.
Section VIII provides an examination of the long term capital and operating costs for each service included in the development charge calculation.
Section IX presents an Asset Management Plan for the City, demonstrating financial sustainability of assets over the life cycle of the 2018 Development Charges By-law and satisfying the new requirements implicated by the amendment to the Development Charges Act.
Section X provides a review of development charges administrative matters such as collection method and timing of payments, exemptions, credits for services-in-lieu, front-end financing, etc.
HEMSON
13

II THE METHODOLOGY COMBINES A CITY-WIDE AND AREA-SPECIFIC APPROACH TO ALIGN DEVELOPMENT-RELATED COSTS AND BENEFITS
Several key steps are required in calculating any development charge. However, specific circumstances arise in each municipality which must be reflected in the calculation. In this study, therefore, we have tailored our approach to the City of Vaughan’s unique circumstances. The approach to the proposed development charges is focussed on providing a reasonable alignment of development-related costs with the development that necessitates them. This study combines a City-wide approach for certain services which the City provides with an area-specific approach for certain Engineering services.
A. BOTH CITY-WIDE AND AREA-SPECIFIC DEVELOPMENT CHARGES ARE PROPOSED
The City provides a wide range of services to the community it serves and has an extensive inventory of facilities, land, infrastructure, vehicles and equipment. The DCA provides municipalities with flexibility to define services that will be included in the development charge by-laws, provided that the other provisions of the Act and its associated regulations are met. The DCA also requires that the by-laws designate the areas within which the by-laws shall be imposed. The development charges may apply to all lands in the municipality or to other designated development areas as specified in the by-laws.
1. Services Based on a City-Wide Approach
For the majority of services that the City provides, a range of capital facilities, land, equipment and infrastructure is available throughout the City; arenas, community centres, pools, libraries, fire stations, arterial roads, watermains, parks and so on. As new development occurs, new facilities will need to be added so that service levels in newly developing areas are provided at levels enjoyed in existing communities. A widely accepted method for sharing the development-related capital costs for such City services is to apportion them over all new development anticipated in the City.
HEMSON
14

The following services are included in the City-wide development charge calculation:
General Government; Library; Fire and Rescue; Community Services Public Works: Buildings & Fleet; and City-wide Engineering (including roads, associated structures, sidewalks,
streetlights, streetscaping and intersections and City-wide watermains).
These services form a reasonable basis on which to plan and administer the development charges. It is noted that the analysis of each of these services examines the individual capital facilities and equipment that make them up. For example, Community Services includes various indoor facilities such as community centres, pools, arenas; associated land requirements as allowed under the DCA; and equipment.
The resulting development charge for these services would be imposed against all development anywhere in the City.
2. Area-Specific Charges Are Proposed
For some services that the City provides, the need for development-related capital additions to support anticipated development is more localized. For such services, where costs and benefits are more localized, an alternative technique — the area-specific approach — is employed.
The area-specific charges relate to the provision of wastewater (sanitary sewerage) collection trunks and select storm drainage works. It is noted that new water infrastructure are included in the City-wide Engineering development charge rather than as area-specific services.
A review of wastewater (sanitary sewer) and storm drainage capital servicing plans indicates that there are considerable differences in the servicing requirements of the various areas that are to be developed as the City grows. The wastewater and stormwater collection systems require differing additional, identifiable and independent projects in order to provide for anticipated growth. The area-specific approach is applied to these services to more closely align the capital costs with the particular areas that will be serviced by the required infrastructure.
HEMSON
15

Area-Specific Development Charges are therefore calculated for:
Wastewater Services; and Select Storm Drainage Services.
The area-specific approach for these services reflects the fact that the demand for, and benefit from, the projects provided by the City is much more localized than that for other City services. Area-specific charges result in a more accurate distribution of costs among developers than the City-wide approach. The geographic areas that are included coincide with the specific service area for each sanitary sewer or storm drainage project.
The area-specific approach also facilitates front-end financing or credit agreements for the designated services if the City chooses to use these provisions of the DCA. As an alternative that is more commonly used in Vaughan, the area-specific charges also facilitate the use of developer group agreements.
B. KEY STEPS IN DETERMINING DEVELOPMENT CHARGES FOR FUTURE DEVELOPMENT-RELATED PROJECTS
Several key steps are required in calculating development charges for future growth-related projects. These are summarized below.
1. Development Forecast
The first step in the methodology requires a development forecast to be prepared for the ten year study period, 2018–2027, for most City-wide services and for growth to ultimate development (2031) for the engineered services. The forecasts of population, households and employment are based on the 2031 targets for the City as identified in the Region of York’s 2017 Development Charges Background Study, which reflects a 45 per cent intensification scenario as approved by Regional Council. Neither DC forecast includes the small amount of urban boundary expansion land suggested for Vaughan in prior forecasts. The short-term residential forecast has been updated based on 2016 Census releases and CMHC housing starts and completions data.
For the residential portion of the forecast the net population growth and population growth in new units is estimated. Net population growth equals the population in new housing units reduced by the decline in the population in the existing base anticipated over the 10 year period and to build-out (due to reducing household sizes as the community ages). Net population is used in the calculation of the development charges funding envelopes. In calculating the per capita development charge, however, the population growth in new housing units is used.
HEMSON
16

The non-residential portion of the forecast estimates the Gross Floor Area (GFA) of building space to be developed over the 10 year period, 2018–2027, and to 2031. The forecast provides estimates for three categories: population-related development, major office development, and employment land development. The forecast of GFA is based on the employment forecast for the City. Factors for floor space per worker by category are used to convert the employment forecast into gross floor areas for the purposes of the development charges study.
2. Service Categories and Historical Service Levels
The Development Charges Act provides that the increase in the need for service attributable to anticipated development:
... must not include an increase that would result in the level of service exceeding the average level of that service provided in the municipality over the 10-year period immediately preceding the preparation of the background study...(s. 5. (1) 4.)
Historical ten-year average service levels thus form the basis for development charges. A review of City’s capital service levels for buildings, land, vehicles, and so on has therefore been prepared as a reference for the calculation so that the portion of future capital projects that may be included in the development charge can be determined. The historical service levels used in this study have been calculated based on the period 2008–2017 for general and city-wide engineered services.
For the ASDC’s “hard” services, such as wastewater and storm drainage, historical service levels are less applicable and reference is made to the City’s engineering standards as well as Provincial health and environmental requirements.
3. Development-Related Capital Forecast and Analysis of Net Capital Costs to be Included in the Development Charges
A development-related capital forecast has been prepared by the City’s departments and boards as part of the present study. The forecast identifies development-related projects and their gross and net costs, after allowing for capital grants, subsidies or other contributions as required by the Act (DCA, s. 5. (2)). The capital forecast provides another cornerstone upon which development charges are based. The DCA requires that the increase in the need for service attributable to the anticipated development may include an increase:
... only if the council of the municipality has indicated that it intends to ensure that such an increase in need will be met. (s. 5. (1) 3.)
In conjunction with DCA, s. 5. (1) 4. referenced above, these sections have the effect of requiring that the development charge be calculated on the lesser of the historical ten-year average service levels or the service levels embodied in future
HEMSON
17
plans of the City. The development-related capital program prepared for this study ensures that development charges are only imposed to help pay for projects that have been or are intended to be purchased or built in order to accommodate future anticipated development. It is not sufficient in the calculation of development charges merely to have had the service in the past. There must also be a demonstrated commitment to continue to emplace facilities or infrastructure in the future. In this regard, Ontario Regulation 82/98, s. 3 states that:
For the purposes of paragraph 3 of subsection 5 (1) of the Act, the council of a municipality has indicated that it intends to ensure that an increase in the need for service will be met if the increase in service forms part of an official plan, capital forecast or similar expression of the intention of the council and the plan, forecast or similar expression of the intention of the council has been approved by the council.
For some projects in the development-related capital forecast, a portion of the project may confer benefits to existing residents. As required by the DCA, s. 5. (1) 6., these portions of projects and their associated net costs are the funding responsibility of the City from non-development charges sources. The amount of City funding for such non-growth shares of projects is also identified as part of the preparation of the development-related capital program.
There is also a requirement in the DCA to reduce the applicable development charge by the amount of any “uncommitted excess capacity” that is available for a service. Such capacity is available to partially meet the future servicing requirements. Adjustments are made in the analysis to meet this requirement of the Act.
Finally, in calculating development charges, the development-related net capital costs must be reduced by 10 per cent for all services except water, wastewater, storm drainage, services related to highways and fire (DCA, s. 5. (1) 8.). The 10 per cent discount is applied to the other services, e.g. community services, libraries, general government, and the resulting City funding responsibility from non-development charge sources is identified.
4. Attribution to Types of Development
For the City-wide development charge, the next step in the determination of development charges is the allocation of the development-related net capital costs between the residential and the non-residential sectors. This is done by using different apportionments for different services in accordance with the demands, which the two sectors would be expected to place on the various services and the different benefits derived from those services.
HEMSON
18

Where reasonable data exist, the apportionment is based on the expected demand for, and use of, the service by each sector (e.g. shares of population and employment).
Finally, the residential component of the City-wide development charge is applied to different housing types on the basis of average occupancy factors. The non-residential component is applied on the basis of gross building space in square metres.
The Area-Specific Development Charges are apportioned on the basis of net developable land area for some areas while two specific areas are based on a per capita and employment basis where the development charges is applied to different housing types on the basis of average occupancy factors for residential development and the non-residential component is applied on the basis of gross building space in square metres.
5. Final Adjustment
The final determination of the development charge results from adjustments made to development-related net capital costs for each service and sector resulting from the application of any unallocated development-related reserve fund balances that are available to finance the development-related capital costs in the capital forecast. A cash flow analysis is also undertaken to account for the timing of projects and receipt of development charges. Interest earnings or borrowing costs are therefore accounted for in the calculation as allowed under the DCA.
HEMSON
19

III POPULATION IS FORECAST TO INCREASE BY 67,000 AND NON-RESIDENTIAL BUILDING SPACE BY 2.8 MILLION SQUARE METRES BY 2027
This section provides the basis for the development forecasts used in calculating the development charges and provides a summary of the forecast results. The forecasts of population, households and employment are based on the 2031 targets for the City as identified in the Region of York’s 2017 Development Charges Background Study, which reflects a 45 per cent intensification scenario as approved by Regional Council. Neither DC forecast includes the small amount of urban boundary expansion land suggested for Vaughan in prior forecasts. The short-term residential forecast has been updated based on 2016 Census releases and CMHC housing starts and completions data.
This section begins with a brief discussion of recent growth trends in the GTA and in Vaughan. This is followed by a summary of the results of the housing unit and population forecast and of the non-residential employment and space forecast. Details of the forecasts are provided in Appendix A.
A. VAUGHAN HAS EXPERIENCED RAPID GROWTH IN RECENT YEARS
The GTA and Vaughan have been growing rapidly in population and employment over the last 10 years. All indications point to continued growth in the GTA and Vaughan is expected to remain one of the key players in accommodating this growth.
Due to a comparatively strong economy and national rates of immigration the GTA has continued to experience residential and non-residential growth. The City’s population increased from 248,000 people in 2007 to 312,900 in 2017 which represents an increase of 26 per cent. The number of occupied dwelling units in the City also increased significantly during the ten-year historical period, rising from 72,600 in 2007 to 96,400 occupied households in 2017 – a 33 per cent increase
The City has also experienced strong employment growth in recent years adding about 59,600 new employees in the 2008–2017 period.
HEMSON
20

B. THE RESIDENTIAL FORECAST IS BASED ON THE REGION OF YORK PROJECTIONS
As noted above, the residential development forecasts are based on the 2031 targets for the City as identified in the Region of York’s 2017 Development Charges Background Study. A description of the forecast methodology and more detailed tables of results are provided in Appendix A.
Table 1 provides a summary of the residential forecast for two planning periods: a ten-year planning period, 2018–2027, and 2018–ultimate development (being 2031). As noted in Section II, for development charges calculation purposes, the ten-year planning period is applicable to non-engineering services. The ultimate development forecast has been utilized in the calculation of the City-wide Engineering component of development charges.
Table 1 Summary of Residential Development Charges Forecast
2017Estimate
Residential
Total Occupied Dwellings 96,405 25,177 121,582 37,888 134,293 - Singles & Semis 10,214 14,009 - Rows & Other Multiples 4,723 7,881 - Apartments 10,240 15,998
Total PopulationCensus 312,853 66,908 379,761 101,779 414,632 Population In New Dwellings 70,498 104,113
Growth Total at 2027 Growth Total at
2031
General Services Planning Period
2018 - 2027
Hard Services Planning Period
2018 - 2031
The City’s population is expected to increase by about 21 per cent over the next ten years reaching about 379,800 by 2027. The ultimate population is forecast to reach nearly 415,000.
The population figures referred to above reflect the “net” increase in population. This is the increase after taking into account the expected continuation of the decline in occupancy factors in existing housing units. The population residing in new housing units is expected to increase by 70,500 people over the ten-year planning period and 104,100 people to ultimate development.
HEMSON
21
About 25,200 housing units are forecast to be developed between 2018 and 2027. The composition of the new units is forecast to be 41 per cent singles/semis, 19 per cent rows and other multiples, and 41 per cent apartments.
C. NON-RESIDENTIAL SPACE FORECAST IS BASED ON FORECAST EMPLOYMENT GROWTH
The non-residential space forecast is based on the forecast of employment, since most new non-residential space is required to accommodate new employment growth. The forecasts of employment are also based on the 2031 targets for the City as identified in the Region of York’s 2017 Development Charges Background Study, which reflects a 45 per cent intensification scenario as approved by Regional Council.
Non-residential space is forecast according to three categories: population-related employment, major office employment, and employment land employment. Population-related employment includes traditional retail forms, such as regional centres, district centres, neighbourhood convenience, highway commercial, big box and power centres occupied by retail and local service uses. Population related employment also includes institutional space consisting of all community institutional uses such as schools, places of worship and hospitals. Major office employment is defined as that working in free-standing office buildings of 20,000 sq.ft. or greater. Employment land employment consists of buildings in Vaughan’s “industrial” areas and may include some non-traditional retail space and office space associated with industrial or storage uses.
The non-residential space forecast prepared for development charges purposes is summarized on Table 2.
.
HEMSON
22
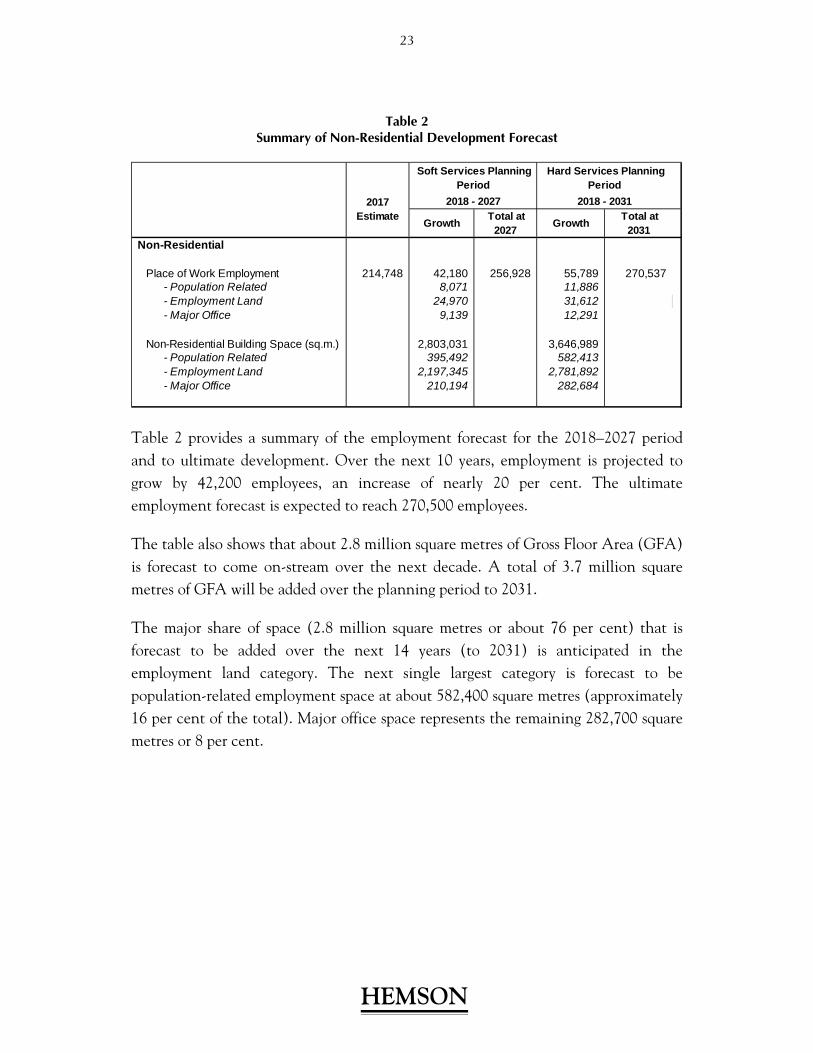
Table 2 Summary of Non-Residential Development Forecast
2017Estimate
Non-Residential
Place of Work Employment 214,748 42,180 256,928 55,789 270,537 - Population Related 8,071 11,886 - Employment Land 24,970 31,612 - Major Office 9,139 12,291
Non-Residential Building Space (sq.m.) 2,803,031 3,646,989 - Population Related 395,492 582,413 - Employment Land 2,197,345 2,781,892 - Major Office 210,194 282,684
Growth Total at 2027 Growth Total at
2031
Soft Services Planning Period
2018 - 2027
Hard Services Planning Period
2018 - 2031
Table 2 provides a summary of the employment forecast for the 2018–2027 period and to ultimate development. Over the next 10 years, employment is projected to grow by 42,200 employees, an increase of nearly 20 per cent. The ultimate employment forecast is expected to reach 270,500 employees.
The table also shows that about 2.8 million square metres of Gross Floor Area (GFA) is forecast to come on-stream over the next decade. A total of 3.7 million square metres of GFA will be added over the planning period to 2031.
The major share of space (2.8 million square metres or about 76 per cent) that is forecast to be added over the next 14 years (to 2031) is anticipated in the employment land category. The next single largest category is forecast to be population-related employment space at about 582,400 square metres (approximately 16 per cent of the total). Major office space represents the remaining 282,700 square metres or 8 per cent.
HEMSON
23
IV SUMMARY OF HISTORICAL CAPITAL SERVICE LEVELS
The DCA and Ontario Regulation 82/98 require that the development charges be set at a level no higher than the average service level provided in the municipality over the 10 year period immediately preceding the preparation of the background study, on a service by service basis.
For non-engineering services (fire and rescue, library, community services etc.) the legislative requirement is met by documenting historical service levels for the preceding 10 years, in this case, for the period 2008 to 2017. Typically, service levels are measured as a ratio of inputs per capita (or per population plus employment). With ASDC services, engineering and legislated environmental and health standards are used in lieu of inputs per capita.
O. Reg. 82/98 requires that when determining historical service levels both quantity and quality of service be taken into consideration. In most cases, the service levels are initially established in quantitative terms. For example, service levels for buildings are presented in terms of square feet per capita. The qualitative aspect is introduced by the consideration of the monetary value of the facility or service. In the case of buildings, for example, the cost would be shown in terms of dollars/square foot to replace or construct a facility of the same quality. This approach helps to ensure that the development-related capital facilities that are to be charged to new growth reflect not only the quantity (number and size) but also the quality (value or replacement cost) of service provided historically by the City. Both the quantitative and qualitative aspects of service levels used in the present analysis are based on information provided by staff of the City and boards based on historical records and their experience with costs to acquire or construct similar facilities, equipment and infrastructure as of 2017.
Table 3 summarizes service levels for all City-wide services included in the development charge calculation. Appendices B through G provide detailed historical inventory data upon which the calculation of service levels is based.
HEMSON
24

Table 3 Summary of Historical Service Levels 2008–2017
Service
1.0 GENERAL GOVERNMENT N/A
2.0 LIBRARY SERVICE $431.33 per capita Buildings $193.48 per capita Land $148.34 per capita Materials $68.90 per capita Furniture and Equipment $20.56 per capita Broadband $0.05 per capita
3.0 FIRE AND RESCUE SERVICE $279.95 per capita & employment Buildings $81.56 per capita & employment Land $120.11 per capita & employment Furniture & Equipment $27.19 per capita & employment Vehicles $51.75 per capita & employment Broadband $0.00 per capita & employment
4.0 COMMUNITY SERVICES $4,038.72 per capita Community Centre Space $1,345.30 per capita Land $860.10 per capita Equipment $19.80 per capita Broadband $0.11 per capita Animal Services $9.66 per capita Activity Spaces $318.29 per capita Parkland Development $751.20 per capita Parks Facilities $495.79 per capita Parks Special $56.33 per capita Trails $3.81 per capita Non-Road Vehicles $67.90 per capita Parks Operation Building & Land $110.43 per capita
5.0 PUBLIC WORKS: BUILDINGS AND FLEET $248.48 per capita & employment Buildings $42.71 per capita & employment Land $176.84 per capita & employment Fixed Equipment $0.28 per capita & employment Roads Related Fleet $28.65 per capita & employment
6.0 CITY-WIDE ENGINEERING $11,312.15 per capita & employment
2008 - 2017Service Level
Indicator
HEMSON
25

V THE DEVELOPMENT-RELATED CAPITAL PROGRAM
A. A DEVELOPMENT-RELATED CAPITAL PROGRAM IS PROVIDED FOR COUNCIL’S APPROVAL
The DCA requires the Council of a municipality to express its intent to provide future capital facilities at the level incorporated in the development charges calculation. As noted above in Section II, Ontario Regulation 82/98, s. 3 states that:
For the purposes of paragraph 3 of subsection 5 (1) of the Act, the council of a municipality has indicated that it intends to ensure that an increase in the need for service will be met if the increase in service forms part of an official plan, capital forecast or similar expression of the intention of the council and the plan, forecast or similar expression of the intention of the council has been approved by the council.
Based on the development forecasts summarized in Section III and detailed in Appendix A, staff of the City departments and the Library Board, in collaboration with the consultants, developed a development-related capital forecast as of December 31, 2017 setting out those projects that are required to service anticipated growth. For all services except City-wide Engineering services, the capital plan covers the 10 year period from 2018 to 2027. As permitted by the DCA s. 5 (1) 4., the development charge for City-wide Engineering services is based on ultimate development expected in the City (2031).
One of the recommendations contained in this background study is for Council to adopt the growth-related capital forecast developed for the purposes of the development charges calculation. It is assumed that future capital budgets and forecasts will continue to bring forward the development-related projects contained herein that are consistent with the growth occurring in the City. It is acknowledged that changes to the forecast presented here may occur through the City’s normal capital budget process.
B. THE DEVELOPMENT-RELATED CAPITAL PROGRAM FOR CITY-WIDE SERVICES
A summary of the development-related capital program for all services is presented in Table 4.
HEMSON
26

Gross Grants/ MunicipalService Cost Subsidies Cost 2018 2019 2020 2021 2022 2023 2024 2025 2026 2027
1.0 GENERAL GOVERNMENT $44,195.8 $0.0 $44,195.8 $15,271.3 $11,493.8 $1,275.0 $1,397.0 $810.0 $910.0 $836.8 $810.0 $10,607.0 $785.0
1.1 Committed Projects - 2017 $12,322.2 $0.0 $12,322.2 $12,322.2 $0.0 $0.0 $0.0 $0.0 $0.0 $0.0 $0.0 $0.0 $0.0
1.2 Municipal Comprehensive Review $18,184.0 $0.0 $18,184.0 $965.0 $7,612.0 $350.0 $0.0 $0.0 $0.0 $0.0 $0.0 $9,257.0 $0.0
1.3 Growth Related Development Planning Studies $2,649.0 $0.0 $2,649.0 $620.0 $1,474.0 $170.0 $55.0 $55.0 $55.0 $55.0 $55.0 $55.0 $55.0
1.4 Growth Related Finance Studies $2,962.0 $0.0 $2,962.0 $265.0 $255.0 $255.0 $492.0 $255.0 $255.0 $255.0 $255.0 $445.0 $230.0
1.5 Parks Development $838.5 $0.0 $838.5 $250.0 $111.8 $0.0 $175.0 $0.0 $100.0 $26.8 $0.0 $175.0 $0.0
1.6 Fire and Rescue Services $350.0 $0.0 $350.0 $0.0 $0.0 $0.0 $175.0 $0.0 $0.0 $0.0 $0.0 $175.0 $0.0
1.7 Building Standards $1,890.1 $0.0 $1,890.1 $349.1 $1,541.0 $0.0 $0.0 $0.0 $0.0 $0.0 $0.0 $0.0 $0.0
1.8 Miscellaneous $5,000.0 $0.0 $5,000.0 $500.0 $500.0 $500.0 $500.0 $500.0 $500.0 $500.0 $500.0 $500.0 $500.0
2.0 LIBRARY SERVICE $49,122.0 $0.0 $49,122.0 $12,256.5 $1,760.5 $5,290.3 $2,786.1 $5,040.9 $1,965.4 $3,252.2 $6,319.5 $2,506.1 $7,944.5
2.1 Commitments 2017 $9,708.8 $0.0 $9,708.8 $9,708.8 $0.0 $0.0 $0.0 $0.0 $0.0 $0.0 $0.0 $0.0 $0.0
2.2 Carrville (Block 11) Library $6,015.7 $0.0 $6,015.7 $0.0 $0.0 $1,834.0 $2,134.0 $2,047.7 $0.0 $0.0 $0.0 $0.0 $0.0
2.3 Block 41 Library $7,635.3 $0.0 $7,635.3 $0.0 $0.0 $2,011.8 $0.0 $0.0 $1,313.3 $2,155.1 $2,155.1 $0.0 $0.0
2.4 VMC Library (1) $9,376.9 $0.0 $9,376.9 $2,547.6 $1,612.1 $652.1 $652.1 $652.1 $652.1 $652.1 $652.1 $652.1 $652.1
2.5 Mackenzie Vaughan Hospital Library $940.7 $0.0 $940.7 $0.0 $148.3 $792.4 $0.0 $0.0 $0.0 $0.0 $0.0 $0.0 $0.0
2.6 Kleinburg Library $10,725.1 $0.0 $10,725.1 $0.0 $0.0 $0.0 $0.0 $2,341.0 $0.0 $445.0 $1,854.0 $1,854.0 $4,231.1
2.7 Block 27 Library $1,658.2 $0.0 $1,658.2 $0.0 $0.0 $0.0 $0.0 $0.0 $0.0 $0.0 $1,658.2 $0.0 $0.0
2.8 Vaughan Mills Library $3,061.3 $0.0 $3,061.3 $0.0 $0.0 $0.0 $0.0 $0.0 $0.0 $0.0 $0.0 $0.0 $3,061.3
3.0 FIRE AND RESCUE SERVICE $47,215.5 $0.0 $47,215.5 $15,006.8 $0.0 $108.0 $1,842.8 $10,834.0 $0.0 $7,765.0 $3,894.0 $7,765.0 $0.0
3.1 Committed Projects 2017 $8,643.9 $0.0 $8,643.9 $8,643.9 $0.0 $0.0 $0.0 $0.0 $0.0 $0.0 $0.0 $0.0 $0.0
3.2 Station 7-2 $8,782.8 $0.0 $8,782.8 $0.0 $0.0 $0.0 $1,842.8 $6,940.0 $0.0 $0.0 $0.0 $0.0 $0.0
3.3 Station 7-4 $2,415.0 $0.0 $2,415.0 $2,415.0 $0.0 $0.0 $0.0 $0.0 $0.0 $0.0 $0.0 $0.0 $0.0
3.4 Station 7-11 $11,659.0 $0.0 $11,659.0 $3,894.0 $0.0 $0.0 $0.0 $0.0 $0.0 $7,765.0 $0.0 $0.0 $0.0
3.5 Station 7-12 $11,659.0 $0.0 $11,659.0 $0.0 $0.0 $0.0 $0.0 $3,894.0 $0.0 $0.0 $0.0 $7,765.0 $0.0
3.6 Station 7-13 $3,894.0 $0.0 $3,894.0 $0.0 $0.0 $0.0 $0.0 $0.0 $0.0 $0.0 $3,894.0 $0.0 $0.0
3.7 Vehicles $161.9 $0.0 $161.9 $54.0 $0.0 $108.0 $0.0 $0.0 $0.0 $0.0 $0.0 $0.0 $0.0
4.0 COMMUNITY SERVICES $510,654.9 $0.0 $510,654.9 $74,005.8 $36,506.3 $83,927.6 $40,209.3 $62,427.2 $33,399.7 $39,842.7 $56,951.2 $20,101.6 $63,283.6
4.1 Committed Projects 2017 - Indoor Recreation $14,546.9 $0.0 $14,546.9 $14,546.9 $0.0 $0.0 $0.0 $0.0 $0.0 $0.0 $0.0 $0.0 $0.0
4.2 Block 41 Community Centre $107,758.8 $0.0 $107,758.8 $0.0 $0.0 $40,006.9 $0.0 $4,067.2 $20,857.5 $20,857.5 $20,857.5 $1,112.1 $0.0
4.3 VMC Community Centre $57,395.0 $0.0 $57,395.0 $14,023.2 $5,277.7 $4,761.7 $4,761.7 $4,761.7 $4,761.7 $4,761.7 $4,761.7 $4,761.7 $4,761.7
4.4 Kleinburg Community Centre $31,928.5 $0.0 $31,928.5 $0.0 $0.0 $0.0 $0.0 $11,853.9 $1,205.1 $6,180.0 $6,180.0 $6,180.0 $329.5
4.5 Carrville Community Centre $66,043.3 $0.0 $66,043.3 $0.0 $0.0 $21,630.0 $21,630.0 $22,783.3 $0.0 $0.0 $0.0 $0.0 $0.0
4.6 Block 27 Community Centre $17,780.9 $0.0 $17,780.9 $0.0 $0.0 $0.0 $0.0 $0.0 $0.0 $0.0 $17,780.9 $0.0 $0.0
4.7 Vaughan Mills Community Centre $32,826.2 $0.0 $32,826.2 $0.0 $0.0 $0.0 $0.0 $0.0 $0.0 $0.0 $0.0 $0.0 $32,826.2
4.8 Animal Services Facility $10,509.9 $0.0 $10,509.9 $509.9 $8,000.0 $0.0 $2,000.0 $0.0 $0.0 $0.0 $0.0 $0.0 $0.0
4.9 Commitments 2017 - Park Development and Fa $20,773.2 $0.0 $20,773.2 $20,773.2 $0.0 $0.0 $0.0 $0.0 $0.0 $0.0 $0.0 $0.0 $0.0
4.10 New Park Development $78,445.2 $0.0 $78,445.2 $12,443.9 $11,525.8 $10,116.0 $8,372.8 $13,229.3 $3,145.3 $5,420.7 $3,772.1 $4,048.0 $6,371.3
4.11 New Playing Fields and Playgrounds $39,498.5 $0.0 $39,498.5 $6,678.7 $10,413.8 $6,664.9 $2,515.2 $4,843.7 $909.6 $725.8 $1,717.0 $2,014.8 $3,015.1
4.12 Trails $3,430.0 $0.0 $3,430.0 $0.0 $300.0 $460.0 $600.0 $370.0 $500.0 $300.0 $300.0 $300.0 $300.0
4.13 Land $2,091.5 $0.0 $2,091.5 $2,091.5 $0.0 $0.0 $0.0 $0.0 $0.0 $0.0 $0.0 $0.0 $0.0
4.14 Operations Facilities $22,547.2 $0.0 $22,547.2 $1,699.5 $0.0 $0.0 $0.0 $0.0 $1,350.0 $1,350.0 $1,350.0 $1,350.0 $15,447.7
4.15 Non-Roads Fleet and Related Equipment $5,080.0 $0.0 $5,080.0 $1,239.0 $989.0 $288.0 $329.5 $518.0 $670.5 $247.0 $232.0 $335.0 $232.0
5.0 PUBLIC WORKS: BUILDINGS AND FLEET $69,331.2 $0.0 $69,331.2 $18,266.0 $270.5 $378.5 $562.5 $240.0 $5,896.0 $5,623.0 $12,468.5 $5,915.0 $19,711.2
5.1 Committed Projects $10,657.5 $0.0 $10,657.5 $10,657.5 $0.0 $0.0 $0.0 $0.0 $0.0 $0.0 $0.0 $0.0 $0.0
5.2 Land $3,884.4 $0.0 $3,884.4 $3,884.4 $0.0 $0.0 $0.0 $0.0 $0.0 $0.0 $0.0 $0.0 $0.0
5.3 Operations Facilities $49,797.2 $0.0 $49,797.2 $1,699.5 $0.0 $0.0 $0.0 $0.0 $5,400.0 $5,400.0 $12,400.0 $5,400.0 $19,497.7
5.4 Roads Fleet and Related Equipment $4,992.0 $0.0 $4,992.0 $2,024.5 $270.5 $378.5 $562.5 $240.0 $496.0 $223.0 $68.5 $515.0 $213.5
TOTAL - 10 YEAR GENERAL SERVICES $720,519.6 $0.0 $720,519.6 $134,806.4 $50,031.0 $90,979.3 $46,797.7 $79,352.1 $42,171.1 $57,319.7 $80,443.2 $46,894.8 $91,724.3
Total Net Capital Program
TABLE 4 - PAGE 1
CITY OF VAUGHANSUMMARY OF DEVELOPMENT-RELATED CAPITAL PROGRAM
FOR GENERAL SERVICES 2018 - 2027(in $000)
HEMSON
27
HEMSON
CITY WIDE ENGINEERING
Net Project
Service Project Description Cost*
6.00 CITY WIDE ENGINEERING
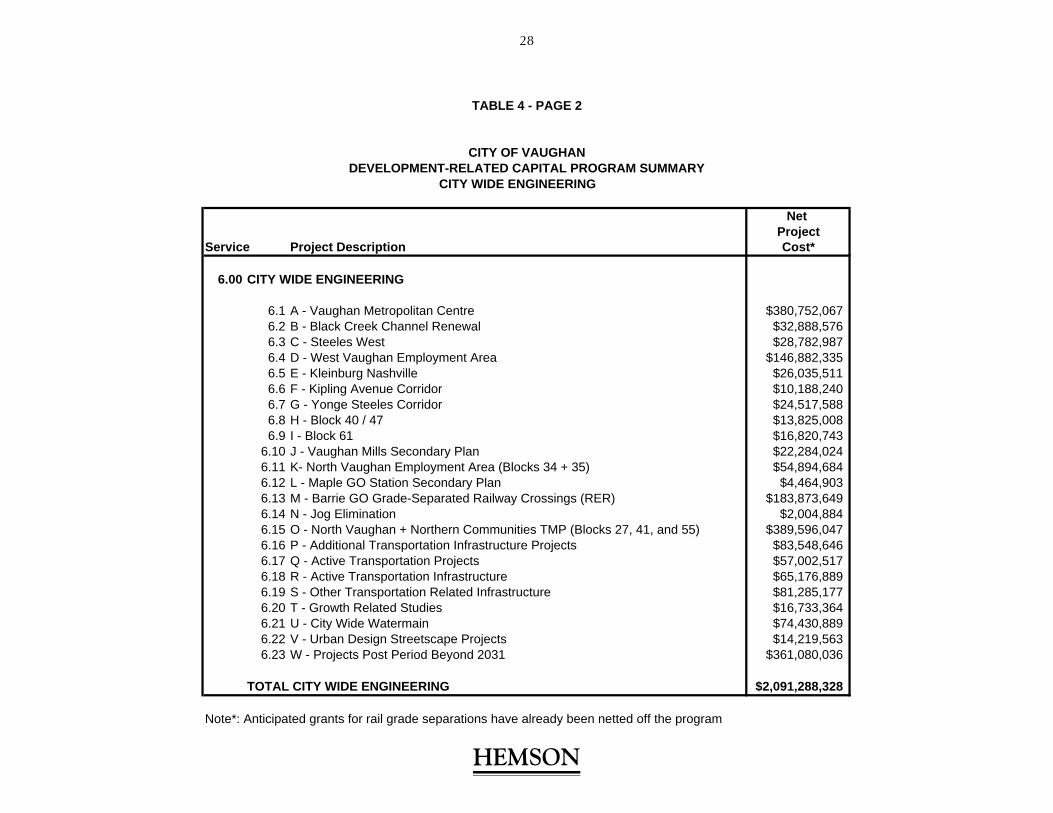
6.1 A - Vaughan Metropolitan Centre $380,752,0676.2 B - Black Creek Channel Renewal $32,888,5766.3 C - Steeles West $28,782,9876.4 D - West Vaughan Employment Area $146,882,3356.5 E - Kleinburg Nashville $26,035,5116.6 F - Kipling Avenue Corridor $10,188,2406.7 G - Yonge Steeles Corridor $24,517,5886.8 H - Block 40 / 47 $13,825,0086.9 I - Block 61 $16,820,743
6.10 J - Vaughan Mills Secondary Plan $22,284,0246.11 K- North Vaughan Employment Area (Blocks 34 + 35) $54,894,6846.12 L - Maple GO Station Secondary Plan $4,464,9036.13 M - Barrie GO Grade-Separated Railway Crossings (RER) $183,873,6496.14 N - Jog Elimination $2,004,8846.15 O - North Vaughan + Northern Communities TMP (Blocks 27, 41, and 55) $389,596,0476.16 P - Additional Transportation Infrastructure Projects $83,548,6466.17 Q - Active Transportation Projects $57,002,5176.18 R - Active Transportation Infrastructure $65,176,8896.19 S - Other Transportation Related Infrastructure $81,285,1776.20 T - Growth Related Studies $16,733,3646.21 U - City Wide Watermain $74,430,8896.22 V - Urban Design Streetscape Projects $14,219,5636.23 W - Projects Post Period Beyond 2031 $361,080,036
TOTAL CITY WIDE ENGINEERING $2,091,288,328
Note*: Anticipated grants for rail grade separations have already been netted off the program
TABLE 4 - PAGE 2
CITY OF VAUGHANDEVELOPMENT-RELATED CAPITAL PROGRAM SUMMARY
28

The table provides a separate total for general services analysed over the ten-year period, 2018–2027, and for the City-wide Engineering services analysed to ultimate development. Further details on the capital plans for each individual service category are available in Appendices B–G.
The development-related capital program for ten-year general services is estimated at a net cost of $720.5 million. No senior government grants, subsidies or other recoveries are expected.
This capital program incorporates those projects identified to be related to development anticipated in the next ten years. It is not implied that all of these costs are to be recovered from new development by way of development charges (see the following Section VI for the method and determination of net capital costs attributable to growth). Portions of this capital program may relate to providing servicing for growth which has occurred prior to 2018 (for which development charge reserve fund balances exist), for replacement of existing capital facilities (e.g. Fire station repositioning) or for growth anticipated to occur beyond the 2018–2027 planning period. In addition, the amounts shown on Table 4 have not been reduced by 10 per cent for various “soft” services as mandated by s. 5 (1) 8. of the DCA.
Of the $720.5 million in ten-year net development-related capital costs for general services, $510.7 million (71 per cent) is related to the provision of Community Services. A variety of playing fields, tennis courts, playground equipment, basketball and other play courts are included in the capital program. This service category also provides for the development of various neighbourhood, district and regional (or City-wide) parks across the City. In addition, the capital program includes Indoor Recreation projects such as the addition of several new community centres and one animal services facility.
An extensive development-related capital servicing plan is forecast for Public Works Buildings and Fleet at $69.3 million (10 per cent). The program is largely attributed to the construction of a new public works facility and additions to the City’s road fleet and equipment inventory.
The net growth-related capital forecast for the Library service totals about $49.1 million (7 per cent). The program includes the addition of several new libraries as well as a replacement for the Kleinburg branch. The capital forecast also includes land and furniture for the new facilities and additions to library collections.
HEMSON
29

Fire and Rescue Services $47.2 million (7 per cent) capital program provides for the construction of three new stations. New vehicles and equipment are also included.
General Government (development-related studies) is included at $44.2 million.
In addition to the development-related capital program for general services, section 6 of Table 4 (page 2) shows an estimate of $2.1 billion for development-related City-wide Engineering projects. The estimates include provisions for project construction, land acquisition for land which is not available through the Planning Act, engineering and design, contingencies and treasury administration. Of note, the forecast provides for $389.6 million in North Vaughan & Northern Communities area, $380.8 million for VMC infrastructure and $183.9 million for the Barrie GO Grade-Separated Railway Crossings. In addition to roads, the program also provides for water mains, structures, sidewalks, streetlights, intersection improvements, traffic signalization and streetscaping.
C. THE DEVELOPMENT-RELATED CAPITAL PROGRAM FOR AREA-SPECIFIC SERVICES
As shown in Table 5, approximately $91.1 million in development-related capital costs are proposed to be recovered through Area-Specific Development Charges in this background study. This includes costs for water (carry forward ASDCs only), sewer and storm drainage services.
HEMSON
30
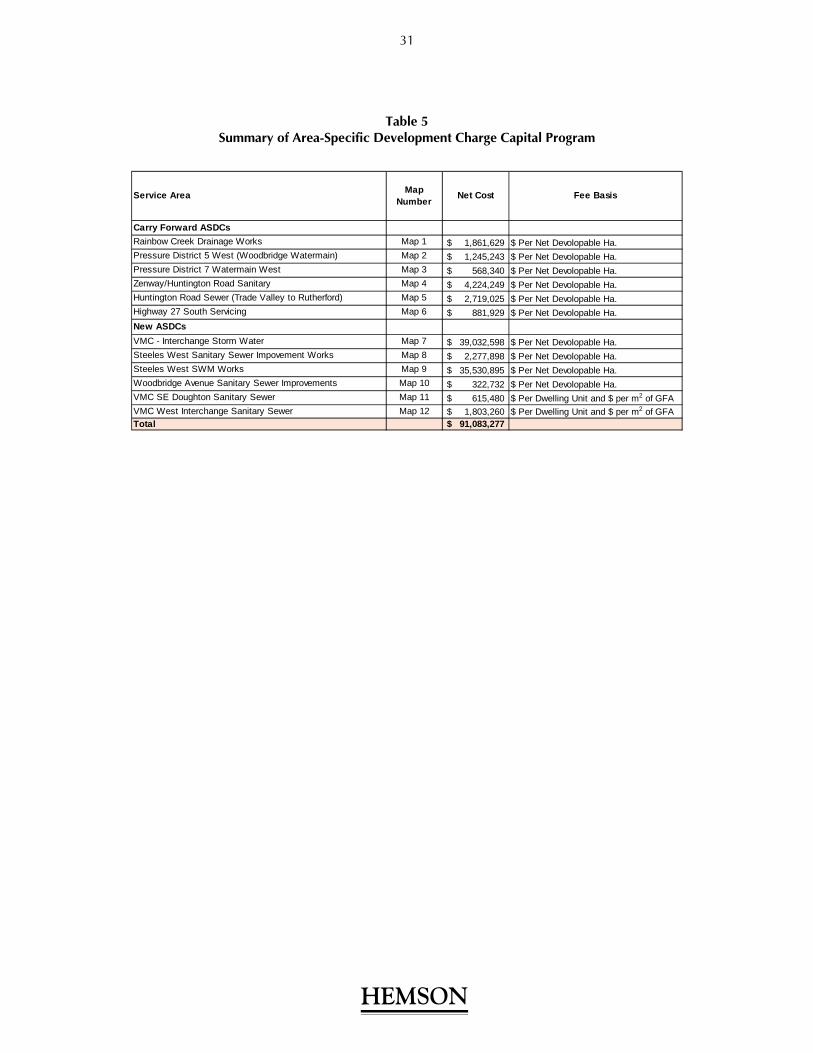
Table 5 Summary of Area-Specific Development Charge Capital Program
Service Area Map Number Net Cost Fee Basis
Carry Forward ASDCsRainbow Creek Drainage Works Map 1 1,861,629$ $ Per Net Devolopable Ha.Pressure District 5 West (Woodbridge Watermain) Map 2 1,245,243$ $ Per Net Devolopable Ha.Pressure District 7 Watermain West Map 3 568,340$ $ Per Net Devolopable Ha.Zenway/Huntington Road Sanitary Map 4 4,224,249$ $ Per Net Devolopable Ha.Huntington Road Sewer (Trade Valley to Rutherford) Map 5 2,719,025$ $ Per Net Devolopable Ha.Highway 27 South Servicing Map 6 881,929$ $ Per Net Devolopable Ha.
New ASDCsVMC - Interchange Storm Water Map 7 39,032,598$ $ Per Net Devolopable Ha.Steeles West Sanitary Sewer Impovement Works Map 8 2,277,898$ $ Per Net Devolopable Ha.Steeles West SWM Works Map 9 35,530,895$ $ Per Net Devolopable Ha.Woodbridge Avenue Sanitary Sewer Improvements Map 10 322,732$ $ Per Net Devolopable Ha.VMC SE Doughton Sanitary Sewer Map 11 615,480$ $ Per Dwelling Unit and $ per m2 of GFAVMC West Interchange Sanitary Sewer Map 12 1,803,260$ $ Per Dwelling Unit and $ per m2 of GFATotal 91,083,277$
HEMSON
31

VI PROPOSED DEVELOPMENT CHARGES ARE CALCULATED IN ACCORDANCE WITH THE DCA
This section summarizes the calculation of development charges for each service category and the resulting total development charge by type of development. For City-wide services, the calculation of the “unadjusted” per capita (residential) and per square metre (non-residential) charges is reviewed. Adjustments to these amounts resulting from a cash flow analysis that takes interest earnings and borrowing costs into account are also discussed.
For residential development, the adjusted total per capita amount is then converted to a variable charge by housing unit type using various unit occupancy factors. For non-residential development, only one development charge rate is proposed. The proposed non-residential charge is based on gross floor area (GFA) of building space.
It is noted that the calculation of the City-wide development charges does not include any provision for exemptions required under the DCA such as the exemption for enlargements of up to 50 per cent on existing industrial buildings. Such legislated exemptions, or other exemptions which Council may choose to provide, will result in loss of development charge revenue for the affected types of development. Any such revenue loss may not be made up, however, by offsetting increases in other portions of the calculated charge.
As noted above, several new as well as a continuation of existing area-specific development charges are also included.
A. UNADJUSTED DEVELOPMENT CHARGE CALCULATION FOR CITY-WIDE SERVICES
A summary of the “unadjusted” residential and non-residential development charges for City-wide services is presented in Tables 6 and 7. The totals in the table separate the ten-year City-wide general services from the City-wide Engineering services which are analysed to ultimate development. Further details of the calculation for each individual service category are available in Appendices B–G.
HEMSON
32

10 Year Growth in Population in New Units 70,498 10 Year Growth in Square Meters 2,803,031
Total DCService Net Replacement Required Eligible
Municipal & Benefit to Service Available Post-2027 Costs forCost Existing Discount DC Reserves Benefit Recovery
($000) ($000) ($000) ($000) ($000) ($000) % ($000) % ($000)
1.0 GENERAL GOVERNMENT $44,195.8 $4,501.1 $3,969.5 $4,984.1 $0.0 $30,741.1 61% $18,854.8 39% $11,886.3
Unadjusted Development Charge Per Capita $267.45Unadjusted Development Charge Per Sq.M $4.24
2.0 LIBRARY SERVICE $49,122.0 $4,998.8 $4,412.3 $10,613.3 $3,123.9 $25,973.7 100% $25,973.7 0% $0.00
Unadjusted Development Charge Per Capita $368.43Unadjusted Development Charge Per Sq.M $0.00
3.0 FIRE AND RESCUE SERVICE $47,215.5 $4,726.5 $0.0 $5,187.8 $6,762.0 $30,539.2 61% $18,731.0 39% $11,808.3
Unadjusted Development Charge Per Capita $265.70Unadjusted Development Charge Per Sq.M $4.21
4.0 COMMUNITY SERVICES $510,654.9 $3,860.7 $50,679.4 $116,992.4 $95,921.6 $243,200.7 100% $243,200.7 0% $0.00
Unadjusted Development Charge Per Capita $3,449.77Unadjusted Development Charge Per Sq.M $0.00
5.0 PUBLIC WORKS: BUILDINGS AND FLEET $69,331.2 $339.9 $0.0 $12,194.8 $29,690.2 $27,106.2 61% $16,625.4 39% $10,480.9
Unadjusted Development Charge Per Capita $235.83Unadjusted Development Charge Per Sq.M $3.74
TOTAL 10-YEAR GENERAL SERVICES $720,519.6 $18,427.0 $59,061.2 $149,972.5 $135,497.8 $357,561.0 $323,385.6 $34,175.5
Unadjusted Development Charge Per Capita $4,587.18Unadjusted Development Charge Per Sq.M $12.19
ShareResidential
ShareNon-Residential
TABLE 6
CITY OF VAUGHANSUMMARY OF UNADJUSTED RESIDENTIAL AND NON-RESIDENTIAL DEVELOPMENT CHARGES
10-YEAR CAPITAL PROGRAM FOR GENERAL SERVICES
Development-Related Capital Program (2018 - 2027)
HEMSON
33

HEMSON
14 Year Growth (to 2031) in Population in New Units 104,113 14 Year Growth (to 2031) in Square Meters 3,646,989
Total DCService Net Replacement Required Eligible
Municipal & Benefit to Service Available Post-2031 Costs forCost Existing Discount DC Reserves Benefit Recovery
($000) ($000) ($000) ($000) ($000) ($000) % ($000) % ($000)
6.0 CITY WIDE ENGINEERING $2,091,288.3 $0.0 $0.0 $87,809.4 $666,500.6 $1,336,978.3 65% $863,603.6 35% $473,374.7
Unadjusted Development Charge Per Capita $8,294.90Unadjusted Development Charge Per Sq.M $129.80
TOTAL 14-YEAR HARD SERVICES $2,091,288.3 $0.0 $0.0 $87,809.4 $666,500.6 $1,336,978.3 $863,603.6 $473,374.7
Unadjusted Development Charge Per Capita $8,294.90Unadjusted Development Charge Per Sq.M $129.80
Residential Non-ResidentialShare Share
TABLE 7
CITY OF VAUGHANSUMMARY OF UNADJUSTED RESIDENTIAL AND NON-RESIDENTIAL DEVELOPMENT CHARGES
14-YEAR CAPITAL PROGRAM FOR CITY-WIDE HARD SERVICES (TO 2031)
Development-Related Capital Program (2018 - 2031)
34
1. General Services
A summary of the “unadjusted” residential and non-residential development charges for the City-wide services is presented in Table 6.
The capital program for the general services incorporates those projects identified to be related to growth anticipated in the next ten years. However, not all of the capital costs are to be recovered from new development by way of development charges. Table 6 shows that $18.4 million of the capital program relates to replacement of existing capital facilities or for shares of projects that provide benefit to the existing community. This amount generally results from the repositioning of one fire station and one library, the decommissioning of the existing animal services facility with the construction of a new facility as well as shares of general government studies. These portions of capital costs will have to be funded from non-development charge revenue sources.
An additional share of $150.0 million has been identified as prior growth and represents the revenues collected from previous development charges. This portion has been netted out of the chargeable capital costs. Another share of the forecast, $135.5 million, is attributable to growth beyond the 2027 period (and may therefore be recovered under future development charge studies).
The DCA, s. 5 (1) 8 requires that development-related net capital costs for “soft” services be reduced by 10 per cent in calculating the applicable development charge. The discount does not apply to the Fire & Rescue service or Public Works: Buildings and Fleet. The 10 per cent share of development-related net capital costs not included in the development charge calculations must be funded from non-development charge sources. In total, about $59.1 million is identified as the required 10 per cent reduction.
The discounted net development-related capital cost for general services is $357.6 million. This amount is allocated between the residential and non-residential sectors to derive the unadjusted development charges. Library and Community Services are all deemed to benefit residential development only, while the General Government, Fire & Rescue, and Public Works: Buildings and Fleet services are allocated between both sectors based on shares of population and employment growth (see appendices B–F for details). Approximately $323.4 million of the general services development charges net discounted capital program is deemed to benefit residential development. When this amount is divided by the ten year population growth in new units (70,498) an unadjusted charge of $4,587.18 per capita is derived. The non-residential share of the general services capital program totals $34.2 million and when this amount is divided by the ten year forecast of non-residential space growth (2,803,031 sq. m) an unadjusted charge of $12.19 per square metre is derived.
HEMSON
35
2. City-Wide Engineering Services
City-wide Engineering services include items such as roads, structures, sidewalks, streetlights, intersection improvements, traffic signalization and development-related studies and new City-wide watermains. The total net capital cost estimated for this infrastructure is $2.1 billion after grants, subsidies, and other recoveries are removed (see Table 7). This infrastructure will be used to service the ultimate development of the lands within the City. This development is expected to occur over the next 14 years.
It is noted that the capital program will be partially offset by the available uncommitted development charge reserve funds that the City has on hand ($87.8 million). These funds are brought into account as a funding source for the capital program.
Following internal review and consultation with the development industry the City has identified projects of shares of projects totalling $666.5 million that has been deferred to beyond the 2018–2031 DC recovery period. It is expected that these costs will be recovered through subsequent development charges by-laws.
The City-wide Engineering net development-related capital program totals $1.34 billion. This amount is allocated to the residential and non-residential sectors based on each sector’s share of forecast future net population and employment growth to ultimate development. On this basis, the allocation to the residential and non-residential sectors is calculated at 64.6 per cent and 35.4 per cent respectively. The residential sector’s “unadjusted” development charge is calculated at $8,294.90 per capita. The non-residential sector’s share results in an “unadjusted” development charge of $129.80 per square metre. These charges are based on population in new units to growth to 2031 of 104,113 and growth in non-residential floor space to 2031 of 3,646,989 square metre respectively (see appendix G for details).
3. Adjusted Rates for City-Wide Residential and Non-Residential Development Charges
Final adjustments to the “unadjusted” development charge rates summarized above are made through a cash flow analysis. The analysis, details of which are included in the Appendices, considers the borrowing cost and interest earnings associated with the timing of expenditures and development charge receipts for each service.
Tables 8 and 9 summarize the results of the adjustment for the residential and non-residential components of the City-wide rates respectively. As shown on Table 8, the adjusted per capita rate for general services increases from $4,587.18 to $4,881.36 after the cash flow analysis. For City-wide Engineering services, the charge increases after the cash flow analysis, from $8,294.90 to $8,663.61 per capita. Table 9 shows that the total adjusted rate for non-residential development increases from $141.99 to $143.92 per square metre.
HEMSON
36
B. PROPOSED CITY-WIDE RESIDENTIAL AND NON-RESIDENTIAL DEVELOPMENT CHARGES
Residential City-wide development charges are proposed to vary by dwelling unit type to reflect their different occupancy factors and resulting demand for services. The proposed residential and non-residential development charges for City-wide services are shown in Table 8. As shown in the Table, the proposed residential charge for City services ranges from $21,673 for small apartments (less than 700 sq.ft) to $49,305 for single detached and semi-detached units. The proposed charge for rows (and other multiple units) is $40,669 and $30,069 for large apartments equal to or greater than 700 sq.ft.
The proposed non-residential development charge for City-wide services is $143.92 per square metre of gross floor area (see Table 9).
HEMSON
37

Service
General Government $267.45 $281.74 $1,026 $846 $625 $451 2.1%
Library Services $368.43 $381.84 $1,390 $1,146 $848 $611 2.8%
Fire And Rescue Services $265.70 $274.08 $998 $823 $608 $439 2.0%
Community Services $3,449.77 $3,658.97 $13,319 $10,986 $8,123 $5,854 27.0%
Public Works: Buildings And Fleet $235.83 $284.73 $1,036 $855 $632 $456 2.1%
Subtotal City Wide General $4,587.18 $4,881.36 $17,769 $14,656 $10,836 $7,811 36.0%
City Wide Engineering $8,294.90 $8,663.61 $31,536 $26,013 $19,233 $13,862 64.0%
Total City Wide Residential $12,882.08 $13,544.96 $49,305 $40,669 $30,069 $21,673 100.0%
(1) Based on Persons Per Unit Of: 3.64 3.00 2.22 1.60
Unadjusted Charge Per
Capita Small Apartments
(< 700 sq.ft.)
Percentage of Charge Large Apartments
(> 700 sq.ft.)Townhouses &
Multiples
Residential Charge By Unit Type (1) Adjusted
Charge Per Capita
Singles &Semis
CITY-WIDE DEVELOPMENT CHARGESRESIDENTIAL DEVELOPMENT CHARGES BY UNIT TYPE
TABLE 8
CITY OF VAUGHAN
HEMSON
38

HEMSON
Service
General Government $4.24 $4.38 3.0%
Library Services $0.00 $0.00 0.0%
Fire And Rescue Services $4.21 $4.28 3.0%
Community Services $0.00 $0.00 0.0%
Public Works: Buildings And Fleet $3.74 $4.46 3.1%
Subtotal City Wide General $12.19 $13.12 9.1%
City Wide Engineering $129.80 $130.80 90.9%
Total City Wide Non-Residential $141.99 $143.92 100.0%
Percentage of Charge
Adjusted Charge per Square Metre
UnadjustedCharge per
Square Metre
TABLE 9
CITY OF VAUGHANCITY-WIDE DEVELOPMENT CHARGES
NON-RESIDENTIAL DEVELOPMENT CHARGES PER SQUARE METRE
39

C. DEVELOPMENT CHARGES FOR AREA-SPECIFIC SERVICES
The development charges for Area-Specific services are summarized on Table 10 for charges levied on a land area basis and Table 11 for charges levied on a per unit basis for residential development and a Gross Floor Area basis for non-residential development. Additional details are contained in Appendix H.
As shown in Table 10 below, the ASDC related to land area based charges range from a low of $2,809 per net hectare to $944,982 per net hectare reflecting the differing relative servicing costs for the water, wastewater and storm drainage projects. It is noted also that some layering of charges may apply in various development areas. In addition to those ASDC levied on a per net hectare basis, two service areas have been calculated on a charge per unit basis for residential development and a charge per square metre for non-residential development. The per unit/GFA approach is utilized in areas where future development densities are generally known and where costs can be more equitably be distributed to the benefiting developments. Schematic representations of the different service areas are shown on the maps in Appendix H.
Six ASDCs have been carried forward from the City’s last development charges study and six new ASDCs are proposed at this time. It should be noted that the Edgeley Pond and Black Creek Channel Works ASDC established in 2016 are not being reviewed as part of this study.
Service Area Map Number Net Cost
Net Developable
Area (Ha)
Charge Per Net Developable
Ha
Carry Forward ASDCsRainbow Creek Drainage Works Map 1 $1,861,629 662.71 $2,809
Pressure District 5 West (Woodbridge Watermain) Map 2 $1,245,243 155.01 $8,033
Pressure District 7 Watermain West Map 3 $568,340 203.83 $2,788
Zenway/Huntington Road Sanitary Map 4 $4,224,249 376.74 $11,213
Huntington Road Sewer (Trade Valley to Rutherford) Map 5 $2,719,025 308.80 $8,805
Highway 27 South Servicing Map 6 $881,929 5.11 $172,589
New ASDCsVMC - Interchange Storm Water Map 7 $39,032,598 54.34 $718,253
Steeles West Sanitary Sewer Impovement Works Map 8 $2,277,898 37.60 $60,583
Steeles West SWM Works Map 9 $35,530,895 37.60 $944,982
Woodbridge Avenue Sanitary Sewer Improvements Map 10 $322,732 26.12 $12,357
Total $88,664,537 1,867.85
TABLE 10CITY OF VAUGHAN
SUMMARY OF AREA-SPECIFIC CHARGES - CHARGE PER NET DEVELOPABLE AREA (HA)
HEMSON
40

New ASDC
VMC SE DOUGHTON SANITARY
SEWER
VMC WEST - INTERCHANGE
SANITARY SEWER
Map Reference Map 11 Map 12
Charge Per Residential Unit:Singles & Semis $765 $514
Townhouses & Multiples $631 $424
Large Apartments (>= 700 sq.ft.) $467 $313
Small Apartments (< 700 sq.ft.) $336 $226
Charge Per m2 of Non-Res GFA $7.39 $4.96
TABLE 11CITY OF VAUGHAN
SUMMARY OF AREA-SPECIFIC CHARGES - PER UNIT AND GFA BASIS
HEMSON
41
VII COMPARISON OF PROPOSED AND EXISTING DEVELOPMENT CHARGES
Tables 12 and 13 present a comparison of total proposed City-wide development charges for a single/semi-detached housing unit and per square metre respectively with the City’s existing charges (as at January 1 2018).
Table 12 shows that the calculated charge per single/semi detached unit of $49,305 will produce an increase of $24,307 over the present development charge. The 97 per cent increase is caused by several factors.
First, there has been a considerable increase in the capital costs for all City services. The inflation adjustment factor that is prescribed by O. Reg. 82/98 and which the City uses has not adequately reflected the increase in capital costs that is being experienced in the municipal sector. This is particularly evident for City-wide Engineering.
The cost of land has increased significantly in Vaughan and across the GTA and with more intensification the City will have to acquire more land for roads on the open market rather than Planning Act dedications
A better understanding of the road requirements in the City’s key growth areas including the VMC, northern areas (Blocks 27, 41, and 55) and employment areas (Blocks 34 & 35).
The Province is making significant improvement to the GO Transit network and GTA municipalities are required assist in the funding of new and upgraded rail-road grade separations.
Table 13 shows the change calculated for the non-residential charge. The proposed charge of $143.92 per square metre represents an increase of about 151 per cent ($86.50) over the existing rate of $57.42.
HEMSON
42

Current CalculatedService Residential Residential
Charge / SDU Charge / SDU
General Government $353 $1,026 $673 190%
Library Services $1,053 $1,390 $337 32%
Fire And Rescue Services $679 $998 $319 47%
Community Services $8,833 $13,319 $4,486 51%
Public Works: Buildings And Fleet $563 $1,036 $473 84%
Subtotal City Wide General $11,481 $17,769 $6,288 55%
City Wide Engineering $13,517 $31,536 $18,019 133%
Total City Wide Residential $24,998 $49,305 $24,307 97%
TABLE 12
COMPARISON OF CURRENT AND CALCULATEDRESIDENTIAL DEVELOPMENT CHARGES
CITY OF VAUGHAN
Difference in Charge
HEMSON
43

Current CalculatedService Non-Res Non-Res
Charge Charge
General Government $1.35 $4.38 $3.03 224%
Library Services $0.00 $0.00 $0.00 0%
Fire And Rescue Services $2.80 $4.28 $1.48 53%
Community Services $0.00 $0.00 $0.00 0%
Public Works: Buildings And Fleet $2.28 $4.46 $2.18 96%
Subtotal City Wide General $6.43 $13.12 $6.69 104%
City Wide Engineering $50.99 $130.80 $79.81 157%
Total City Wide Non-Residential $57.42 $143.92 $86.50 151%
COMPARISON OF CURRENT AND CALCULATED
Difference in Charge
NON-RESIDENTIAL DEVELOPMENT CHARGES
TABLE 13
CITY OF VAUGHAN
Non-Residential ($/Square Metre)
HEMSON
44
VIII LONG-TERM CAPITAL AND OPERATING COSTS
This section provides a brief examination of the long-term capital and operating costs for the capital facilities and infrastructure to be included in the development charges by-law. This examination is required as one of the features of the Development Charges Act, 1997.
A. NET OPERATING COSTS FOR THE CITY’S SERVICES ESTIMATED TO INCREASE BY $39.2 MILLION OVER THE FORECAST PERIOD
Table 14 summarizes the estimated increase in net operating costs that the City will experience for additions associated with the planned capital program. These estimates are based on average costs derived from the City’s supporting plans (i.e. Active Transportation Master Plan and Fire Master Plan) as well as discussions with staff (additional details are included in Appendix J).
As shown in Table 14, by 2027, the City’s net operating costs are estimated to increase by $32.9 million for general services (Page 1) and $6.3 million for city-wide engineering services (Page 2). Significant increases in net operating costs will be experienced as new facilities such as the proposed new fire stations, proposed new community centres and new libraries are opened. Operating and maintenance costs will increase also as additions to the City’s road network and parkland and playing fields are made.
B. LONG-TERM CAPITAL FINANCING FROM NON-DEVELOPMENT CHARGE SOURCES TOTALS $77.5 MILLION
Table 14 also summarizes the components of the Development-Related Capital Program that will require funding from non-development charge sources as discussed above in Section VI. In total $77.5 million will need to be financed from non-development charge sources over the next ten years. In addition, $135.5 million in interim financing, if any, would be addressed through the City’s annual budget process for general services to 2027 (Page 1). Furthermore, an additional $666.5 million in interim financing may be required for the City-wide engineering program (Page 2). Because the by-laws must be revisited at least every five years, however, it is difficult to determine the quantum of interim financing that may be required. Appendix J provides a breakdown of the non-development charge financing requirements by service.
HEMSON
45

The share of the development-related capital program requiring funding from non-development charge sources consists of two components. The most significant, at $59.1 million, is related is related to the mandatory 10 per cent discount for certain City-wide general services. An additional $18.4 million is identified as replacement of existing City facilities with newer and larger facilities and for portions of projects that will benefit the existing community. Council is made aware of these factors so that they understand the operating and capital costs that will not be covered by development charges as it adopts the development-related capital program set out in this study.
HEMSON
46

TABLE 14 - PAGE 1
CITY OF VAUGHANSUMMARY OF LONG-TERM CAPITAL AND
OPERATING COST IMPACTS FOR GENERAL SERVICES(in thousands of constant dollars)
2018 2019 2020 2021 2022 2023 2024 2025 2026 2027 Total
Net Operating Impacts (1)General Government $0.0 $0.0 $0.0 $0.0 $0.0 $0.0 $0.0 $0.0 $0.0 $0.0
Library Service $0.0 $1,076.4 $1,489.9 $1,460.1 $2,374.3 $2,326.8 $3,639.5 $3,566.7 $4,477.7 $4,388.2
Fire And Rescue Service $1,150.0 $1,150.0 $1,150.0 $1,150.0 $1,150.0 $1,150.0 $3,450.0 $3,450.0 $5,750.0 $5,750.0
Community Services $1,154.9 $2,736.1 $4,414.0 $5,904.1 $10,534.9 $11,877.0 $14,392.3 $15,490.7 $20,315.6 $21,372.7
Public Works: Buildings And Fleet $365.3 $370.7 $378.3 $389.5 $394.3 $512.3 $624.7 $874.1 $992.4 $1,386.6
TOTAL NET OPERATING IMPACTS $2,670.2 $5,333.3 $7,432.2 $8,903.8 $14,453.6 $15,866.1 $22,106.5 $23,381.4 $31,535.7 $32,897.5 n/a
Long-term Capital Impact (1)Total Net Cost $134,806.4 $50,031.0 $90,979.3 $46,797.7 $79,352.1 $42,171.1 $57,319.7 $80,443.2 $46,894.8 $91,724.3 $720,519.6
Net Cost From Development Charges $24,269.8 $11,672.1 $60,449.6 $41,741.7 $67,109.9 $38,462.4 $52,726.2 $48,304.8 $9,880.6 $2,944.1 $357,561.0
Prior Growth Share from DC Reserve Balances (2) $98,913.5 $29,722.9 $21,336.1 $0.0 $0.0 $0.0 $0.0 $0.0 $0.0 $0.0 $149,972.5
Portion for Post-2027 Development (3) $0.0 $0.0 $0.0 $0.0 $0.0 $0.0 $0.0 $24,938.9 $30,768.5 $79,790.3 $135,497.8
Funding From Non-DC SourcesDiscount Portion $10,062.0 $4,569.4 $9,033.2 $4,370.7 $6,717.2 $3,618.5 $4,370.9 $6,320.1 $2,996.6 $7,002.6 $59,061.2
Replacement $1,561.2 $4,066.6 $160.4 $685.2 $5,525.0 $90.2 $222.6 $879.3 $3,249.1 $1,987.3 $18,427.0
FUNDING FROM NON-DC SOURCES $11,623.2 $8,636.0 $9,193.7 $5,055.9 $12,242.2 $3,708.7 $4,593.5 $7,199.5 $6,245.7 $8,989.9 $77,488.2
TOTAL NET OPERATING & CAPITAL IMPACTS $14,293.4 $13,969.3 $16,625.9 $13,959.7 $26,695.8 $19,574.8 $26,700.0 $30,580.9 $37,781.4 $41,887.4 n/a
Notes:(1) See Appendix J(2) Existing development charge reserve fund balances collected from growth prior to 2018 are applied to the extent possible to fund initial projects in development-related capital forecast(3) Post 2027 development-related net capital costs may be eligible for development charge funding in future DC by-laws and therefore may only be an interim financing requirement.
HEMSON
47

TABLE 14 - PAGE 2
CITY OF VAUGHANSUMMARY OF LONG-TERM CAPITAL AND
OPERATING COST IMPACTS FOR CITY-WIDE ENGINEERING SERVICES(in thousands of constant dollars)
2018 2019 2020 2021 2022 2023 2024 2025 2026 2027 Total
Net Operating Impacts (1)
City-Wide Engineering $734.7 $1,401.3 $2,074.5 $2,626.9 $3,186.3 $3,759.9 $4,348.3 $4,954.9 $5,571.0 $6,294.2
TOTAL NET OPERATING IMPACTS $734.7 $1,401.3 $2,074.5 $2,626.9 $3,186.3 $3,759.9 $4,348.3 $4,954.9 $5,571.0 $6,294.2 n/a
Long-term Capital Impact (1) 2018-2031Total Net Cost $2,091,288Net Cost From Development Charges $1,336,978
- Available DC Reserves (2) $87,809 - For Post 2031 Development (3) $666,501 Net Cost From Non-DC Sources - Discount Portion $0 - Replacement/BTE $0
TOTAL LONG-TERM NET CAPITAL IMPACTS $0.0
Notes:(1) See Appendix J(2) Existing development charge reserve fund balances collected from growth prior to 2018 are applied to the extent possible to fund initial projects in development-related capital forecast(3) Costs for growth beyond 2031 may be recovered from future DC and therefore may only be an interim financing requirement.
HEMSON
48
IX ASSET MANAGEMENT PLAN
The Development Charges Act now requires that municipalities complete an Asset Management Plan before passing a development charges by-law. A key function of the Asset Management Plan is to demonstrate that all assets proposed to be funded under the development charges by-law are financially sustainable over their full life-cycle. Further details relating to the Asset Management Plan are discussed in Appendix K.
A. ANNUAL CAPITAL PROVISIONS WILL REACH $10.2 MILLION BY 2028 FOR GENERAL SERVICES AND $22.9 MILLION BY 2032 FOR CTIY-WIDE ENGINEERED SERVICES
Tables 15 and 16 summarizes the annual capital provisions required to replace the capital infrastructure proposed to be funded under the development charges by-law. This estimate is based on information obtained through discussions with municipal staff regarding useful life assumptions and the capital cost of acquiring and/or emplacing each asset.
Table 15 illustrates that, by 2028, the City will need to fund an additional $10.2 million per annum in order to properly fund the full life-cycle costs of the new assets related to the general services supported under the development charges by-law. A separate analysis of the annual provisions required for the City-wide engineered services capital program was undertaken as the program extends to 2031. As shown in Table 16 below, the annual provision in 2032 amounts to $22.9 million. Lastly, in addition to the City-wide engineering infrastructure, annual provisions related to the City’s rate related assets covered by the Area-Specific Development Charges amount to $1.3 million.
HEMSON
49

2018-2027Capital Program
Service DC Funded (In Period) Non-DC Funded
DC Related Non-DC Related
Library Services 40,652,000$ 8,470,000$ 1,515,000$ 481,000$ Fire and Rescue Services 35,727,000$ 11,489,000$ 488,000$ 326,000$ Community Services 400,215,000$ 110,440,000$ 7,204,000$ 1,652,000$ Public Works: Buildings and Fleet 39,301,000$ 30,030,000$ 949,000$ 783,000$
General Services Sub-total 515,895,000$ 160,429,000$ 10,156,000$ 3,242,000$
* Non-DC funding includes projects that are replacement shares, post-period shares and associated 10% discount etc.
2018-2031Capital Program
Service DC Funded (In Period) Non-DC Funded
DC Related Non-DC Related
City-Wide Engineering* 1,424,800,000$ 666,501,000$ 22,893,466$ 15,265,068$
Total 2032 Provision 22,893,466$ 15,265,068$
ASDC Assets 1,283,777$ -$
* Calculated Annual Provision has been adjusted to remove land acquisition costs
Table 15Calculated Annual Provision by 2028 General Services
Calculated AMP Annual Provision by 2028
Table 16Calculated Annual Provision by 2031 Engineered Services
Calculated AMP Annual Provision by 2031
The calculated annual funding provision should be considered within the context of the City’s projected growth. Over the next ten years (to 2027) the City is projected to increase by approximately 25,200 households, which represents a 26 per cent increase over the existing base. In addition, the City will also add 42,200 new employees that will result in approximately 2.8 million square metres of additional non-residential building space.
By 2031, there will be an increase of nearly 37,900 new dwelling units and 3.6 million square metres of non-residential building space. This growth will have the effect of increasing the overall assessment base and additional user fee and charges revenues to offset the capital asset provisions required to replace the infrastructure proposed to be funded under the development charges by-law. The collection of these funds is intended to be allocated to the City’s reserves for the future replacement of these assets.
The calculated annual provisions identified are considered to be financially sustainable as it is expected that the increased capital asset management requirements can be absorbed by the tax and user base over the long-term.
HEMSON
50

X DEVELOPMENT CHARGES ADMINISTRATION
No significant changes are recommended to the City’s current policies and practices regarding development charge administration. In this regard:
It is recommended that practices regarding collection of development charges and by-law administration continue to the extent possible.
It is further recommended that the collection and administration policies
be as consistent as practicable with those of the Regional Municipality of York in order to simplify by-law administration and aid understanding for those required to pay the charges.
As required under the DCA, the City should codify any rules regarding
application of the by-laws and exemptions within the development charges by-laws proposed for adoption.
It is recommended that the by-law permit the payment of a development
charge in cash or through services in lieu agreements. The municipality is not obligated to enter into services in lieu agreements.
It is recommended that the City continue to pursue cost-sharing and
uploading with the Regional Municipality of York for road-related infrastructure that meets the criteria of Regional significance.
It is recommended that the City examine ways to streamline the administration of ASDCs. This may involve the use of external trustees or additional internal resources.
It is recommended that Council adopt the development-related capital
program included in this background study, subject to annual review through the City’s normal capital budget process.
HEMSON
51

APPENDIX A
DEVELOPMENT FORECAST
HEMSON
52

APPENDIX A
RESIDENTIAL AND NON-RESIDENTIAL DEVELOPMENT FORECAST
This appendix provides the details of the development forecast used to prepare the 2018 Development Charges (DC) Background Study for the City of Vaughan. The forecast method and key assumptions are discussed. The results of the forecasts are presented in the following tables: Historical Development Table 1 Historical Population, Occupied Dwellings and Employment Summary Table 2 Historical Occupied Households by Unit Type Table 3 Historical Annual Growth in Occupied Households by Unit Type Table 4 Historical Households by Period of Construction Showing Household
Size Table 5 Historical Place of Work Employment Forecast Development Table 6 Forecast Population, Household and Employment Growth Summary Table 7 Forecast of Occupied Households by Unit Type Table 8 Forecast of Annual Growth in Occupied Households by Unit Type Table 9 Forecast Population in New Households by Unit Type Table 10 Forecast of Place of Work Employment Table 11 Forecast of Annual Non-Residential Space Growth The forecasts of population, households and employment are based on the 2031 targets for the City as identified in the Region of York’s 2017 Development Charges Background Study, which reflects a 45 per cent intensification scenario as approved by Regional Council. Neither DC forecast includes the small amount of urban boundary expansion land suggested for Vaughan in prior forecasts. The short-term residential forecast has been updated based on 2016 Census releases and CMHC housing starts and completions data.
A. FORECAST APPROACH AND KEY ASSUMPTIONS
The Development Charges Act (DCA) requires the City to estimate “the anticipated amount, type and location of development” for which development charges may be
HEMSON
53
imposed. The development forecast must cover both residential and non-residential development and be specific enough with regards to quantum, type, location and timing of development to allow the City to prepare a reasonable development-related capital program. A “Census-based” definition of population is used for the purpose of the development charges study. This definition does not include the Census net undercoverage, which is typically included in the definition of “total” population commonly used in municipal planning documents. The forecast is based on Census years and is translated into the time periods required for DC purposes, generally pro-rating the census periods to the DC time period. A ten-year development forecast, from mid-year 2018 to mid-year 2027, has been used for general services (non-engineering) and a forecast from mid-year 2018 to mid-year 2031 is used for the City-wide engineering service category (roads, water, wastewater, stormwater). Employment figures used in DC studies utilize place of work employment values. Place of work employment considers where people work irrespective of their place of residence. The Region’s employment base information is based on employment survey data, adjusted to Census definition base, rather than the exact Census data. The forecast is based on the Schedule 3 employment forecast, which also uses the Census place of work definition of employment. Consistent with the Regional Plan and Schedule 3, the total employment forecast includes workers with no fixed place of work and those who work at home. For DC forecast purposes, the work at home employment is excluded from the calculations since the increased need for service is already captured in the residential forecast.
B. HISTORICAL DEVELOPMENT THE CITY
Historical population and household figures presented in the ensuing tables are based on Statistics Canada Census data. Historical place of work employment values are from the Region of York. For development charges purposes, the ten-year period of 2008 to 2017 is used for calculating historical service levels.
HEMSON
54

1. Growth in Population and Housing Units in Vaughan has been Strong (Table 1)
The City of Vaughan has experienced rapid population and household growth over the last ten years. As shown in Table 1, the City’s population increased from 248,000 people in 2007 to 312,900 in 2017 which represents an increase of 26 per cent. The number of occupied dwelling units in the City also increased significantly during the ten-year historical period, rising from 72,600 in 2007 to 96,400 occupied households in 2017 – a 33 per cent increase. The difference between the rates of population and occupied dwelling unit growth is the result of a decline in the average number of persons residing in housing units.
As shown in Table 1, the City experienced strong employment growth over the 2007 to 2017 period. Employment in the City, excluding those working at home, has grown from 155,100 employees in 2007 to 214,700 employees in 2017 which represents an increase of 38 per cent. This rapid historical employment growth is particularly impressive given much of the province experienced a loss in employment during the 2006 to 2011 Census period that coincided with the global economic downturn.
2. Growth in Occupied households by Unit Type has Recently Shifted to More Apartments (Tables 2 and 3)
Details on historical occupied households by unit type in the City are provided in Table 2 and the annual growth in Table 3. Information in these tables is sourced from Statistics Canada and CMHC. Overall, the dominant type of housing in Vaughan constructed since 2007 has been single and semi-detached housing (58 per cent). This is followed by apartment dwelling units (28 per cent) and finally, rows and other multiple dwellings (14 per cent). In the time period after 2011, there is a significant shift away from single and semi detached dwellings to apartment dwellings. During the last five years, 47 per cent of new occupied unit types have been apartments with only 42 per cent being single and semi-detached dwellings.
3. Historical Occupancy Patterns Show Declining Occupancy Levels in Ground Related Housing (Table 4)
Table 4 provides details on historical occupancy levels in the City. The overall average occupancy level in Vaughan is 3.23 persons per unit (PPU). For development charges calculations, recently constructed dwellings provide a better indication of occupancy levels of new development that will be paying development charges. For single and semi-detached units constructed between 2006 and 2016, the average occupancy is 3.71 persons per housing unit. This value is higher than the City’s overall average for these unit types of 3.51, this outcome is common across Ontario since new dwelling units tend to attract families with children. In many older housing units children have moved out and two or one person occupancies are relatively more common. A 2016 PPU of 3.05 was used for rows and other multiples which is equal to the ten-year average for recently constructed units.
HEMSON
55
The PPU value in for all apartments in the City is 1.76, however this value is low compared to most other GTA communities. Accordingly the PPU value for apartments used in the Region of York’s 2017 DC Study of 1.91 was used which reflects a larger sample size.
As shown in the forthcoming Table 9, the 2016 PPU values in new units for singles and semis and row units are reduced slightly over the forecast period to reflect the aging of the City’s overall population. The development charges rates are calculated by using the first five year average, the life of a DC by-law. The PPUs for apartments is held static over the forecast period, since the occupancies of these units are less prone to change given their smaller size.
4. Growth in Historical Employment by Place of Work (Table 5)
Table 5 summarizes the historical employment growth by place of work. The forecast has been categorized into major office, population related and in employment land. The slow growth in the employment land sector from 2006 to 2011 is largely attributable to significant employment losses in the industrial sector due to the global recession. Following the recession, employment in this sector has grown dramatically between the 2011 and 2016 Censuses.
C. FORECAST RESULTS
This section describes the method used to establish the development forecast for the periods of 2018 to 2027 and 2018 to 2031.
Development charges are levied on residential development as a charge per new unit. Therefore, for the residential forecast, a projection of both the population growth1 as well as the population in new housing is required.
The population growth determines the need for additional facilities and provides the foundation for the development-related capital program.
When calculating the development charge, however, the development-related net capital costs are spread over the total additional population that occupies new dwelling units. This population in new units represents the population from which development charges will be collected.
Development charges are levied on non-residential development as a charge per unit of gross floor area (GFA). The non-residential forecast includes both a projection of
1 Commonly referred to as “net population growth” in the context of development charges.
HEMSON
56
employment growth as well as a projection of the floor space associated with employment growth in the City.
1. Residential Development Forecast
The residential development forecast is based on forecasts of population and households, consistent with the York Region 45 per cent intensification scenario used in the Region’s 2017 Development Charge Background Study update. The population and household growth determines the need for additional facilities and provides the foundation for the development-related capital program. Tables 6, 7 and 8 summarize the population and household growth forecast. The tables show that the City’s Census population is forecast to increase by roughly 66,900 over the ten-year planning period, and approximately 101,800 to 2031. The number of occupied dwellings is forecasted to increase by 25,200 over the ten-year period and 37,900 to 2031.
High and medium density units are expected to increase as a share of the City’s total housing stock. Apartments are forecasted to represent 42 per cent of new housing construction to 2031. Single and Semi detached units are estimated to comprise 37 per cent of new units with rows comprising 21 per cent.
In addition to the net population forecast, a forecast of “population in new units” that will result from the addition of new housing units has been made (see Table 9). Population growth in new units is estimated by applying the PPUs, described above, to the forecasted housing growth. The persons residing in newly constructed units are based upon the historical time series of population growth in housing in the ten-year Census period (2006-2016). In total, 70,500 is the forecasted population in new dwelling units over the ten-year planning period and 104,100 is forecasted to 2031.
2. Non-Residential Development Forecast
City-wide non-residential development charges are calculated on a per square meter basis. Therefore, as required by the DCA, a forecast for non-residential building space is provided. Consistent with the residential forecast, the non-residential building space forecast covers a period from 2018 to 2031. The ten-year forecast period (2018–2027) is used for “soft” services and the forecast to 2031 is used for engineered services. The non-residential forecast used in this study is based on the Region of York’s DC Study employment forecast, the base year data is derived from employment survey results.
The forecast of employment in the City is separated into three categories. They are:
Population-related employment – employment scattered through the community including most retail and institutional employment; work at home employment is excluded;
Major office employment – employment in office buildings of 20,000 square feet or greater; and
HEMSON
57

Employment land employment – the mix of commercial and industrial activities occurring in what are typically (but somewhat inaccurately) called industrial areas.
3. Population-Related Employment and Space Forecast
In 2017, approximately 66,400 or 31 per cent of the City’s 214,700 (non work at home) workers are employed in population-related activities. City-wide population-related employment is forecast to grow by 16 per cent between 2017 and 2027 to a total of 74,500. Growth in the period following 2027 is expected to be modest with total population-related employment increasing to 78,300 at 2031.
For converting population-related employment growth to building space a factor of 49 m2 per employee is used. This is a weighted average of:
Commercial Development; 67 per cent of growth; 40 m2 per employee Institutional Development; 33 per cent of growth; 67 m2 per employee
Over the ten-year planning period 2018–2027, about 395,500 m2 of building space is forecast to be added in this category. Over the period to 2031, 582,400 m2 is projected to be added.
4. Major Office Employment and Space Forecast
In 2017, 15,000 workers or 7.0 per cent of the City's total employment is employed in the major office category. In the ten-year forecast period Vaughan's major office employment is forecast to increase by 61 per cent to 24,100 employees. At 2031, 27,300 employees are forecast to be employed in the major office category.
While major office space has a high profile in the community, employment in this category is not a large part of the existing base in Vaughan. This share of total employment is expected to continue grow rapidly with further development within the VMC.
A ratio of 23 m2 per employee is used in the forecast to estimate future major office building space. Nearly 210,200 m2 of major office space is forecast to be added by 2027. By 2031 over 282,700 m2 is forecasted.
5. Employment Land Forecast
Employment within designated employment lands is by far the largest category of employment in Vaughan, and this is expected to remain the case throughout the forecast. Typical operations that occur on employment lands include manufacturing, distribution and smaller offices.
HEMSON
58

In 2017, an estimated 133,300 people, or 62.1 per cent of the City’s total employment, were employed in the employment lands category. With the development of the West Vaughan Employment Area this amount is expected to grow by 19 per cent over the ten-year forecast period from 2018–2027 and by 24 per cent to 2031.
Growth in building space on employment lands is forecast by applying a ratio of 88 m2 per employee. Approximately 2.2 million m2 are forecast to be added by 2027 and 2.78 million m2 are expected to be added by 2031.
As shown in Table 11, total floor space growth is forecast at 2.8 million m2 over the ten-year period with an accompanying employment growth of 42,200 (excluding work at home employment). Over the longer planning period to 2031, it is forecasted that 55,800 new employees will be accommodated in 3.65 million m2 of new non-residential space.
HEMSON
59
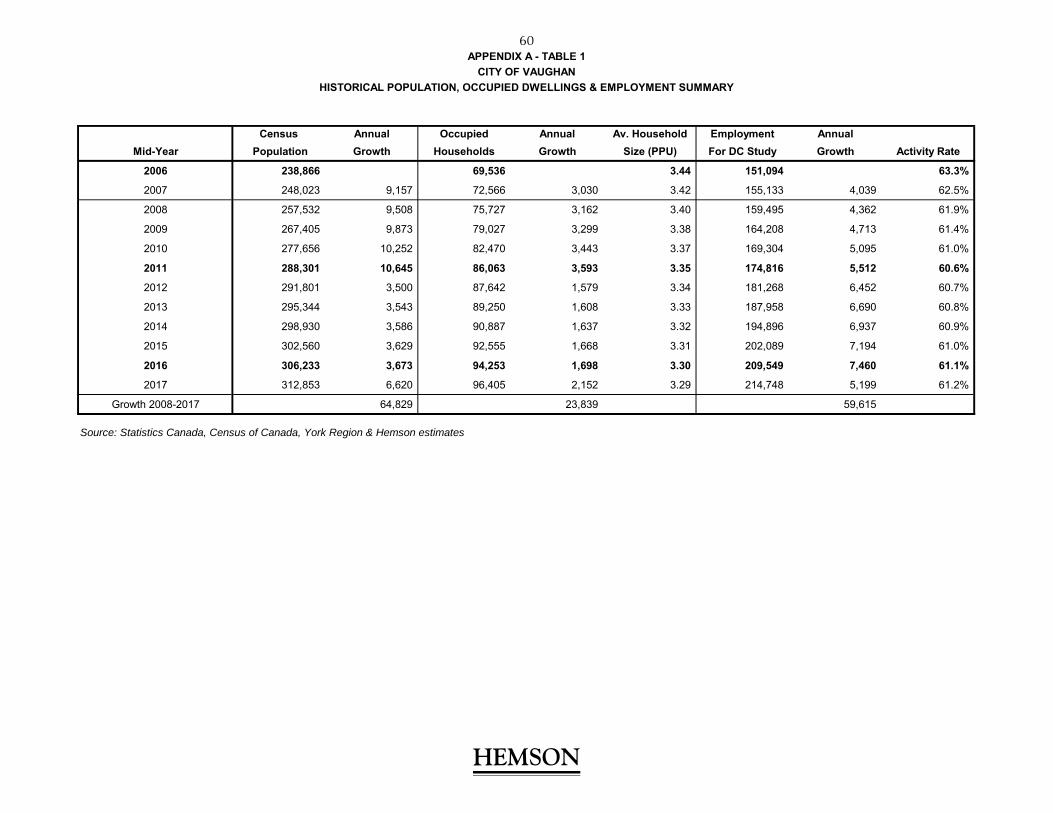
APPENDIX A - TABLE 1
CITY OF VAUGHAN
HISTORICAL POPULATION, OCCUPIED DWELLINGS & EMPLOYMENT SUMMARY
Census Annual Occupied Annual Av. Household Employment Annual
Mid-Year Population Growth Households Growth Size (PPU) For DC Study Growth Activity Rate
2006 238,866 69,536 3.44 151,094 63.3%
2007 248,023 9,157 72,566 3,030 3.42 155,133 4,039 62.5%
2008 257,532 9,508 75,727 3,162 3.40 159,495 4,362 61.9%
2009 267,405 9,873 79,027 3,299 3.38 164,208 4,713 61.4%
2010 277,656 10,252 82,470 3,443 3.37 169,304 5,095 61.0%
2011 288,301 10,645 86,063 3,593 3.35 174,816 5,512 60.6%
2012 291,801 3,500 87,642 1,579 3.34 181,268 6,452 60.7%
2013 295,344 3,543 89,250 1,608 3.33 187,958 6,690 60.8%
2014 298,930 3,586 90,887 1,637 3.32 194,896 6,937 60.9%
2015 302,560 3,629 92,555 1,668 3.31 202,089 7,194 61.0%
2016 306,233 3,673 94,253 1,698 3.30 209,549 7,460 61.1%
2017 312,853 6,620 96,405 2,152 3.29 214,748 5,199 61.2%
Growth 2008-2017 64,829 23,839 59,615
Source: Statistics Canada, Census of Canada, York Region & Hemson estimates
HEMSON
HEMSON
60
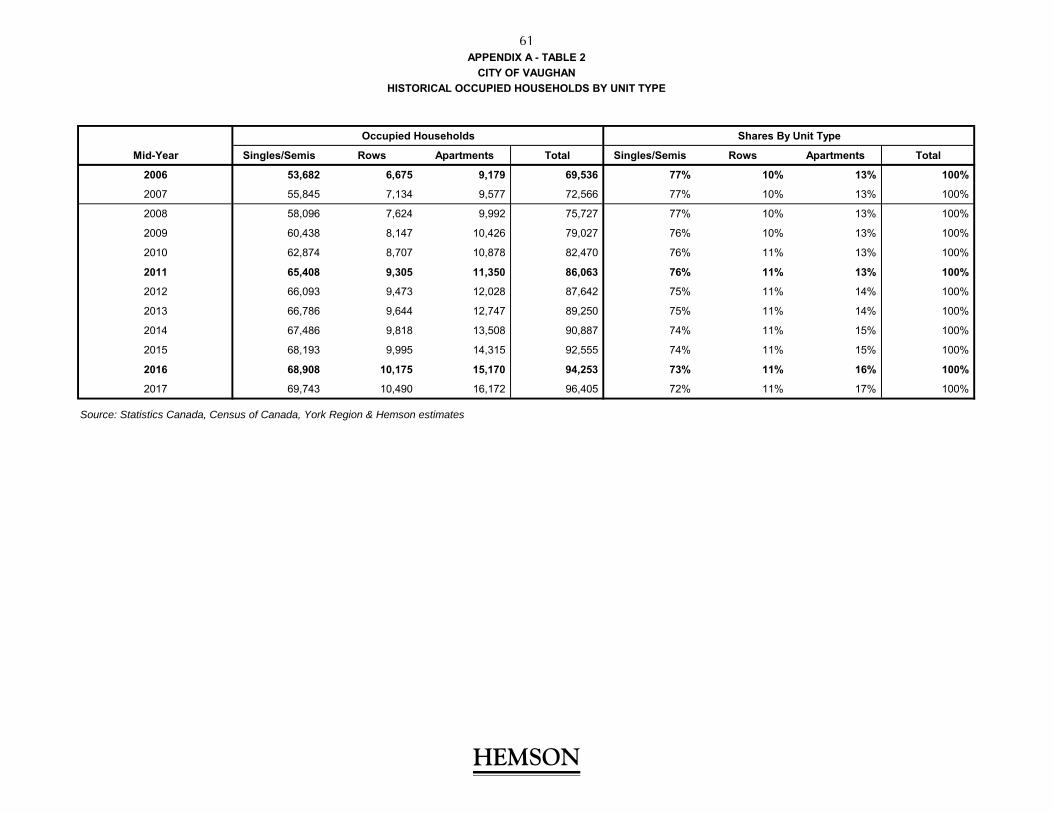
APPENDIX A - TABLE 2
CITY OF VAUGHAN
HISTORICAL OCCUPIED HOUSEHOLDS BY UNIT TYPE
Occupied Households Shares By Unit Type
Mid-Year Singles/Semis Rows Apartments Total Singles/Semis Rows Apartments Total
2006 53,682 6,675 9,179 69,536 77% 10% 13% 100%
2007 55,845 7,134 9,577 72,566 77% 10% 13% 100%
2008 58,096 7,624 9,992 75,727 77% 10% 13% 100%
2009 60,438 8,147 10,426 79,027 76% 10% 13% 100%
2010 62,874 8,707 10,878 82,470 76% 11% 13% 100%
2011 65,408 9,305 11,350 86,063 76% 11% 13% 100%
2012 66,093 9,473 12,028 87,642 75% 11% 14% 100%
2013 66,786 9,644 12,747 89,250 75% 11% 14% 100%
2014 67,486 9,818 13,508 90,887 74% 11% 15% 100%
2015 68,193 9,995 14,315 92,555 74% 11% 15% 100%
2016 68,908 10,175 15,170 94,253 73% 11% 16% 100%
2017 69,743 10,490 16,172 96,405 72% 11% 17% 100%
Source: Statistics Canada, Census of Canada, York Region & Hemson estimates
HEMSON
HEMSON
61

APPENDIX A - TABLE 3
CITY OF VAUGHAN
HISTORICAL ANNUAL GROWTH IN OCCUPIED HOUSEHOLDS BY UNIT TYPE
Annual Growth in Occupied Households Shares By Unit Type
Mid-Year Singles/Semis Rows Apartments Total Singles/Semis Rows Apartments Total
2006
2007 2,164 458 398 3,020 72% 15% 13% 100%
2008 2,251 490 415 3,156 71% 16% 13% 100%
2009 2,342 524 433 3,299 71% 16% 13% 100%
2010 2,436 560 452 3,448 71% 16% 13% 100%
2011 2,534 598 472 3,604 70% 17% 13% 100%
2012 685 168 678 1,531 45% 11% 44% 100%
2013 693 171 719 1,582 44% 11% 45% 100%
2014 700 174 761 1,635 43% 11% 47% 100%
2015 707 177 807 1,691 42% 10% 48% 100%
2016 715 180 855 1,750 41% 10% 49% 100%
2017 835 315 1,002 2,152 39% 15% 47% 100%
Growth 2008-2017 13,898 3,356 6,595 23,849 58% 14% 28% 100%
Source: Statistics Canada, Census of Canada, York Region & Hemson estimates
HEMSON
HEMSON
62

APPENDIX A - TABLE 4
CITY OF VAUGHAN
HISTORICAL HOUSEHOLDS BY PERIOD OF CONSTRUCTION SHOWING HOUSEHOLD SIZE
Period of Construction Period of Construction Summaries
Dwelling Unit Type Pre 1945 1946-1960 1961-1970 1971-1980 1981-1990 1991-1995 1996-2000 2001-2005 2006-2010 2011-2016 Pre 2006 2006-2016 Total
Singles & Semis
Household Population 1,245 2,180 2,815 12,375 56,450 16,350 40,730 48,370 41,830 19,680 180,515 61,510 242,025
Households 420 765 955 4,020 17,275 4,615 11,305 13,080 11,215 5,385 52,435 16,600 69,035
Household Size 2.96 2.85 2.95 3.08 3.27 3.54 3.60 3.70 3.73 3.65 3.44 3.71 3.51
Rows
Household Population 65 100 135 400 2,365 2,585 7,005 8,035 6,945 3,955 20,690 10,900 31,590
Households 25 50 45 160 790 860 2,315 2,425 2,165 1,410 6,670 3,575 10,245
Household Size 2.60 2.00 3.00 2.50 2.99 3.01 3.03 3.31 3.21 2.80 3.10 3.05 3.08
Apartments (excl. Duplexes): Bachelor or 1BR
Household Population 0 0 85 100 215 255 290 720 1,880 2,390 1,180 2,600 3,780
Households 10 0 80 75 155 185 225 490 1,370 1,725 715 1,785 2,500
Household Size n/a n/a 1.06 1.33 1.39 1.38 1.29 1.47 1.37 1.39 1.65 1.46 1.51
Apartments (excl. Duplexes): 2BR or more
Household Population 0 85 0 220 450 1,730 2,130 1,345 2,130 1,760 5,960 3,890 9,850
Households 0 45 0 125 250 945 1,185 705 1,105 980 3,255 2,085 5,340
Household Size n/a 1.89 n/a 1.76 1.80 1.83 1.80 1.91 1.93 1.80 1.83 1.87 1.84
Apartments (excl. Duplexes) - Total
Household Population 105 0 300 730 2,420 2,440 2,500 2,535 4,985 4,860 11,030 9,845 20,875
Households 60 20 180 330 1,385 1,385 1,300 1,355 2,885 2,990 6,015 5,875 11,890
Household Size 1.75 n/a 1.67 2.21 1.75 1.76 1.92 1.87 1.73 1.63 1.83 1.68 1.76
Duplexes
Household Population 60 150 200 1,360 4,225 970 1,390 765 270 195 9,120 465 9,585
Households 20 55 80 485 1,325 315 420 235 85 65 2,935 150 3,085
Household Size 3.00 2.73 2.50 2.80 3.19 3.08 3.31 3.26 3.18 3.00 3.11 3.10 3.11
All UnitsHousehold Population 1,490 2,460 3,455 14,870 65,460 22,360 51,620 59,700 54,040 28,685 221,415 82,725 304,140
Households 520 890 1,265 5,000 20,775 7,170 15,345 17,090 16,355 9,850 68,055 26,205 94,260
Household Size 2.87 2.76 2.73 2.97 3.15 3.12 3.36 3.49 3.30 2.91 3.25 3.16 3.23
Note: Population and household values in this table are based on National Household Survey response rates and may differ from Census valuesSource: Statistics Canada, 2011 National Household Survey Special Run.
HEMSON
HEMSON
63

APPENDIX A - TABLE 5
CITY OF VAUGHAN
HISTORICAL PLACE OF WORK EMPLOYMENT
Annual Annual Annual Total For Annual Work at Annual Total w/ Work Annual
Mid-Year Growth Growth Growth DC Study Growth Home Growth At Home Growth
2006 8,672 35,052 107,371 151,094 8,105 159,199
2007 9,189 517 38,246 3,194 107,698 327 155,133 4,039 8,500 395 163,633 4,434
2008 9,737 548 41,732 3,486 108,026 328 159,495 4,362 8,914 414 168,409 4,776
2009 10,318 581 45,535 3,803 108,355 329 164,208 4,713 9,349 435 173,557 5,148
2010 10,934 616 49,685 4,150 108,685 330 169,304 5,095 9,805 456 179,109 5,551
2011 11,586 652 54,213 4,528 109,017 332 174,816 5,512 10,283 478 185,099 5,990
2012 12,023 437 56,308 2,095 112,937 3,920 181,268 6,452 10,515 232 191,783 6,684
2013 12,476 453 58,484 2,176 116,999 4,061 187,958 6,690 10,752 237 198,711 6,928
2014 12,946 470 60,744 2,260 121,206 4,207 194,896 6,937 10,995 243 205,891 7,180
2015 13,434 488 63,091 2,347 125,565 4,359 202,089 7,194 11,243 248 213,333 7,442
2016 13,940 506 65,529 2,438 130,080 4,515 209,549 7,460 11,497 254 221,046 7,713
2017 14,976 1,036 66,431 902 133,341 3,261 214,748 5,199 11,723 226 226,471 5,425
Growth 2011-2017 4,043 16,746 24,656 45,444 1,918 47,362
Note: Employment Values Include No Fixed Place of Work Employment
Source: Statistics Canada, Census of Canada, York Region & Hemson estimates
OfficePopulation-
RelatedEmployment
Land
HEMSON
HEMSON
64

APPENDIX A - TABLE 6
CITY OF VAUGHAN
POPULATION, HOUSEHOLD & EMPLOYMENT FORECAST SUMMARY
Census Annual Total Annual Total Occupied Annual Av. Household Place of Work Annual
Mid-Year Population Growth Population Growth Households Growth Size (PPU) Employment Growth Activity Rate
2016 306,233 316,032 94,253 3.25 209,549 68.4%
2017 312,853 6,620 322,864 6,832 96,405 2,152 3.25 214,748 5,199 68.6%
2018 319,616 6,763 329,844 6,979 99,344 2,939 3.22 220,118 5,370 68.9%
2019 326,525 6,909 336,974 7,130 102,010 2,667 3.20 225,668 5,549 69.1%
2020 333,583 7,059 344,258 7,284 104,703 2,693 3.19 231,405 5,737 69.4%
2021 340,795 7,211 351,700 7,442 106,913 2,210 3.19 237,338 5,933 69.6%
2022 346,728 5,933 357,823 6,123 109,150 2,237 3.18 240,499 3,161 69.4%
2023 352,764 6,036 364,053 6,230 111,445 2,295 3.17 243,710 3,211 69.1%
2024 358,906 6,142 370,391 6,338 113,798 2,353 3.15 246,973 3,263 68.8%
2025 365,154 6,249 376,839 6,448 116,224 2,426 3.14 250,288 3,315 68.5%
2026 371,512 6,357 383,400 6,561 118,689 2,465 3.13 253,656 3,368 68.3%
2027 379,761 8,249 391,913 8,513 121,582 2,893 3.12 256,928 3,272 67.7%
2028 388,194 8,433 400,616 8,702 124,584 3,002 3.12 260,251 3,323 67.0%
2029 396,814 8,620 409,512 8,896 127,699 3,116 3.11 263,626 3,375 66.4%
2030 405,625 8,811 418,605 9,093 130,934 3,235 3.10 267,054 3,428 65.8%
2031 414,632 9,007 427,900 9,295 134,293 3,359 3.09 270,537 3,483 65.2%
Growth 2018-2027 66,908 69,049 25,177 42,180
Growth 2018-2031 101,779 105,036 37,888 55,789
Source: York Region & Hemson estimates
HEMSON
HEMSON
65

APPENDIX A - TABLE 7
CITY OF VAUGHAN
FORECAST OF OCCUPIED HOUSEHOLDS BY UNIT TYPE
Occupied Households Shares By Unit Type
Mid-Year Singles/Semis Rows Apartments Total Singles/Semis Rows Apartments Total
2016 68,908 10,175 15,170 94,253 73% 11% 16% 100%
2017 69,743 10,490 16,172 96,405 72% 11% 17% 100%
2018 70,410 11,478 17,456 99,344 71% 12% 18% 100%
2019 71,435 11,836 18,739 102,010 70% 12% 18% 100%
2020 72,474 12,206 20,023 104,703 69% 12% 19% 100%
2021 73,529 12,587 20,797 106,913 69% 12% 19% 100%
2022 74,598 12,950 21,601 109,150 68% 12% 20% 100%
2023 75,684 13,324 22,437 111,445 68% 12% 20% 100%
2024 76,785 13,709 23,304 113,798 67% 12% 20% 100%
2025 77,902 14,117 24,205 116,224 67% 12% 21% 100%
2026 79,036 14,512 25,141 118,689 67% 12% 21% 100%
2027 79,957 15,213 26,412 121,582 66% 13% 22% 100%
2028 80,890 15,947 27,747 124,584 65% 13% 22% 100%
2029 81,833 16,717 29,149 127,699 64% 13% 23% 100%
2030 82,787 17,525 30,622 130,934 63% 13% 23% 100%
2031 83,752 18,371 32,170 134,293 62% 14% 24% 100%
Source: York Region & Hemson estimates
HEMSON
HEMSON
66
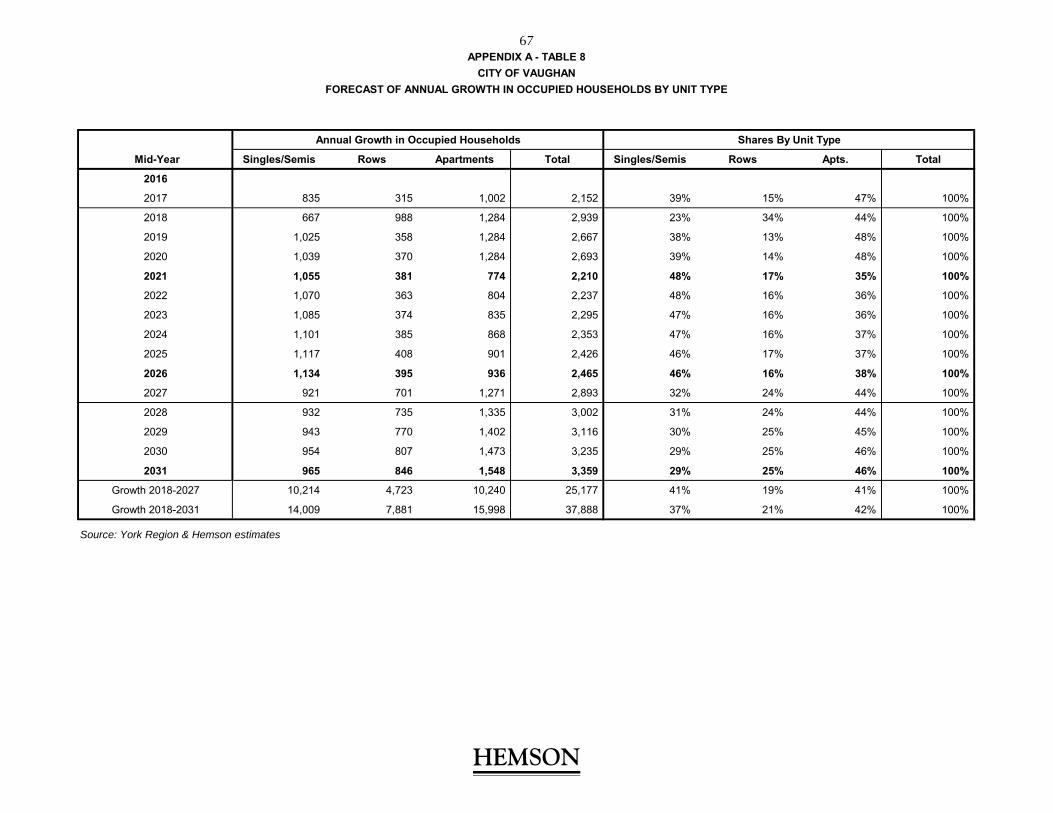
APPENDIX A - TABLE 8
CITY OF VAUGHAN
FORECAST OF ANNUAL GROWTH IN OCCUPIED HOUSEHOLDS BY UNIT TYPE
Annual Growth in Occupied Households Shares By Unit Type
Mid-Year Singles/Semis Rows Apartments Total Singles/Semis Rows Apts. Total
2016
2017 835 315 1,002 2,152 39% 15% 47% 100%
2018 667 988 1,284 2,939 23% 34% 44% 100%
2019 1,025 358 1,284 2,667 38% 13% 48% 100%
2020 1,039 370 1,284 2,693 39% 14% 48% 100%
2021 1,055 381 774 2,210 48% 17% 35% 100%
2022 1,070 363 804 2,237 48% 16% 36% 100%
2023 1,085 374 835 2,295 47% 16% 36% 100%
2024 1,101 385 868 2,353 47% 16% 37% 100%
2025 1,117 408 901 2,426 46% 17% 37% 100%
2026 1,134 395 936 2,465 46% 16% 38% 100%
2027 921 701 1,271 2,893 32% 24% 44% 100%
2028 932 735 1,335 3,002 31% 24% 44% 100%
2029 943 770 1,402 3,116 30% 25% 45% 100%
2030 954 807 1,473 3,235 29% 25% 46% 100%
2031 965 846 1,548 3,359 29% 25% 46% 100%
Growth 2018-2027 10,214 4,723 10,240 25,177 41% 19% 41% 100%
Growth 2018-2031 14,009 7,881 15,998 37,888 37% 21% 42% 100%
Source: York Region & Hemson estimates
HEMSON
HEMSON
67
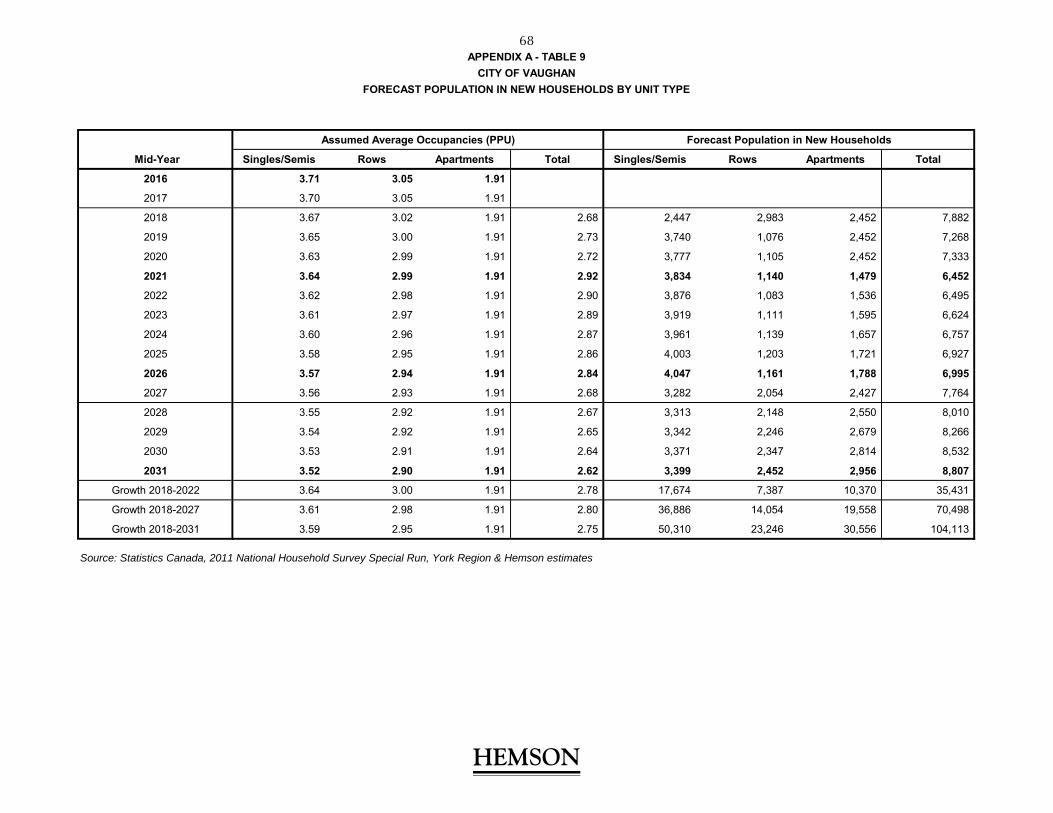
APPENDIX A - TABLE 9
CITY OF VAUGHAN
FORECAST POPULATION IN NEW HOUSEHOLDS BY UNIT TYPE
Assumed Average Occupancies (PPU) Forecast Population in New Households
Mid-Year Singles/Semis Rows Apartments Total Singles/Semis Rows Apartments Total
2016 3.71 3.05 1.91
2017 3.70 3.05 1.91
2018 3.67 3.02 1.91 2.68 2,447 2,983 2,452 7,882
2019 3.65 3.00 1.91 2.73 3,740 1,076 2,452 7,268
2020 3.63 2.99 1.91 2.72 3,777 1,105 2,452 7,333
2021 3.64 2.99 1.91 2.92 3,834 1,140 1,479 6,452
2022 3.62 2.98 1.91 2.90 3,876 1,083 1,536 6,495
2023 3.61 2.97 1.91 2.89 3,919 1,111 1,595 6,624
2024 3.60 2.96 1.91 2.87 3,961 1,139 1,657 6,757
2025 3.58 2.95 1.91 2.86 4,003 1,203 1,721 6,927
2026 3.57 2.94 1.91 2.84 4,047 1,161 1,788 6,995
2027 3.56 2.93 1.91 2.68 3,282 2,054 2,427 7,764
2028 3.55 2.92 1.91 2.67 3,313 2,148 2,550 8,010
2029 3.54 2.92 1.91 2.65 3,342 2,246 2,679 8,266
2030 3.53 2.91 1.91 2.64 3,371 2,347 2,814 8,532
2031 3.52 2.90 1.91 2.62 3,399 2,452 2,956 8,807
Growth 2018-2022 3.64 3.00 1.91 2.78 17,674 7,387 10,370 35,431
Growth 2018-2027 3.61 2.98 1.91 2.80 36,886 14,054 19,558 70,498
Growth 2018-2031 3.59 2.95 1.91 2.75 50,310 23,246 30,556 104,113
Source: Statistics Canada, 2011 National Household Survey Special Run, York Region & Hemson estimates
HEMSON
HEMSON
68

APPENDIX A - TABLE 10
CITY OF VAUGHAN
FORECAST OF PLACE OF WORK EMPLOYMENT
Annual Annual Annual Total For Annual Work at Annual Total w/ Work Annual
Mid-Year Growth Growth Growth DC Study Growth Home Growth At Home Growth
2016 13,940 65,529 130,080 209,549 11,497 221,046
2017 14,976 1,036 66,431 902 133,341 3,261 214,748 5,199 11,723 226 226,471 5,425
2018 16,090 1,113 67,345 914 136,683 3,342 220,118 5,370 11,953 230 232,071 5,600
2019 17,286 1,196 68,272 927 140,109 3,426 225,668 5,549 12,188 235 237,855 5,784
2020 18,571 1,285 69,212 940 143,621 3,512 231,405 5,737 12,427 239 243,832 5,976
2021 19,952 1,381 70,165 953 147,221 3,600 237,338 5,933 12,671 244 250,009 6,177
2022 20,596 644 70,835 670 149,068 1,847 240,499 3,161 12,921 250 253,420 3,411
2023 21,261 665 71,511 676 150,939 1,870 243,710 3,211 13,177 255 256,887 3,466
2024 21,947 686 72,193 683 152,833 1,894 246,973 3,263 13,437 260 260,409 3,523
2025 22,655 708 72,882 689 154,750 1,918 250,288 3,315 13,702 265 263,990 3,580
2026 23,386 731 73,578 696 156,692 1,942 253,656 3,368 13,973 271 267,629 3,639
2027 24,115 729 74,502 924 158,310 1,618 256,928 3,272 14,325 352 271,253 3,624
2028 24,867 752 75,438 936 159,946 1,635 260,251 3,323 14,686 361 274,937 3,684
2029 25,643 775 76,386 948 161,598 1,652 263,626 3,375 15,055 370 278,681 3,745
2030 26,442 800 77,345 960 163,267 1,669 267,054 3,428 15,434 379 282,489 3,807
2031 27,267 825 78,317 972 164,953 1,686 270,537 3,483 15,823 389 286,360 3,871
Growth 2018-2027 9,139 8,071 24,970 42,180 2,602 44,782
Growth 2018-2031 12,291 11,886 31,612 55,789 4,100 59,889
Note: Includes No Fixed Place of Work Employment
Major OfficePopulation-
RelatedEmployment
Land
HEMSON
HEMSON
69

APPENDIX A - TABLE 11
CITY OF VAUGHAN
FORECAST OF ANNUAL NON-RESIDENTIAL SPACE GROWTH
Employment Density
Commercial 40 m2 per employee
Institutional 67 m2 per employee
Population-Related Weighted 49 m2 per employee
Employment Land 88 m2 per employee
Major Office 23 m2 per employee
Major Total For
Mid-Year Office DC Study
2018 25,609 44,808 294,124 364,541
2019 27,513 45,424 301,497 374,435
2020 29,559 46,050 309,054 384,663
2021 31,757 46,683 316,801 395,241
2022 14,809 32,815 162,559 210,183
2023 15,287 33,128 164,598 213,014
2024 15,780 33,444 166,664 215,889
2025 16,290 33,764 168,755 218,808
2026 16,815 34,086 170,872 221,774
2027 16,773 45,290 142,421 204,484
2028 17,296 45,859 143,892 207,047
2029 17,836 46,435 145,378 209,649
2030 18,392 47,018 146,880 212,290
2031 18,966 47,609 148,397 214,971
Growth 2018-2027 210,194 395,492 2,197,345 2,803,031
Growth 2018-2031 282,684 582,413 2,781,892 3,646,989
Note: Includes No Fixed Place of Work Employment
Employment Land
Population- Related
HEMSON
HEMSON
70

APPENDICES B-F
INTRODUCTION AND OVERVIEW
HEMSON
71

GENERAL SERVICES TECHNICAL APPENDICES INTRODUCTION
AND OVERVIEW
The following five appendices provide the detailed analysis undertaken to establish the development charge rates for each of the general services in the City of Vaughan:
Appendix B General Government
Appendix C Library Services
Appendix D Fire and Rescue Service
Appendix E Community Services
Appendix F Public Works: Buildings and Fleet
Every appendix, with the exception of General Government, contains a set of four tables. The tables provide the background data and analysis undertaken to arrive at the calculated development charge rates for that particular service. An overview of the content and purpose of each of the tables is given below.
TABLE 1 HISTORICAL SERVICE LEVELS
Table 1 presents the data used to determine the 10-year historical service level. The DCA and Ontario Regulation 82/98 require that development charges be set at a level no higher than the average service level provided in the municipality over the 10-year period immediately preceding the preparation of the background study, on a service by service basis. For the purpose of this study, the historical inventory period has been defined as 2008 to 2017.
O. Reg. 82/98 requires that when defining and determining historical service levels both the quantity and quality of service be taken into consideration. In most cases, the service levels are initially established in quantitative terms. For example, service levels for buildings are presented in terms of square feet. The qualitative aspect is introduced by considering the monetary value of the facility or service. In the case of buildings, for example, the cost would be shown in terms of cost per square foot to replace or construct a facility of the same quality. This approach helps to ensure that the
HEMSON
72
developmen-related capital facilities that are to be funded by new growth reflect not only the quantity (number and size) but also the quality (replacement value or cost) of service provided by the municipality in the past. Both the quantitative and qualitative aspects of service levels used in the current analysis are based on information provided by City staff. This information is generally based on historical records and experience with costs to acquire or construct similar facilities, equipment and infrastructure. Land values have been based on an appraisal report prepared in December 2017 for the purpose of this study.
The final page of Table 1 shows the calculation of the “maximum allowable” funding envelope, net of uncommitted excess capacity and the legislated ten per cent reduction (for all applicable services). The maximum allowable is defined as the ten-year historical service level (expressed as either $/capita or $/population & employment) multiplied by the forecast increase in net population growth, or net population and employment growth, over the future planning period. The resulting figure is the value of capital infrastructure that would have to be constructed for that particular service so that the ten-year historical service level is maintained.
There is also a requirement in the DCA to consider “excess capacity” within the City’s existing infrastructure that may be available to partially meet the future servicing requirements. If Council has expressed its intent, before or at the time the capacity was created, to recoup the cost of providing the capacity from new development, it is considered “committed excess capacity” under the DCA, and the associated capital cost is eligible for recovery. Should notional “uncommitted excess capacity” exist, if it is determined to be available to service new development appropriate adjustments are made to the calculations.
TABLE 2 2018 – 2027 PROVISIONAL DEVELOPMENT-RELATED CAPITAL PROGRAM AND CALCULATION OF THE “UNADJUSTED” DEVELOPMENT CHARGES
In order to impose a development charge it is not sufficient to merely base the charge on historical service levels. The DCA requires that Council express its intent to provide future capital facilities to support future growth. Based on the development forecasts presented in Appendix A, City staff in collaboration with consultants have developed a development-related capital forecast which sets out the projects required to service anticipated growth for the ten-year period from 2018 to 2027.
HEMSON
73
To determine the share of the program that is eligible for recovery through development charges, the project costs are reduced by any anticipated grants, subsidies or other recoveries; “replacement” shares and benefit to existing shares; and the legislated “10 per cent reduction” for any eligible service
A replacement share occurs when a new facility will at least in part replace a facility that is demolished, redeployed or will otherwise not be available to serve its former function. The replacement share of the capital program is not deemed to be growth-related and is therefore removed from the development charge calculation. The capital cost for replacement will require funding from non-development charge sources, typically property taxes.
When calculating development charges, the development-related net capital cost must be reduced by 10 per cent for all services except fire and rescue, engineered services (DCA s.5.(1)8.) and Public Works. The 10 per cent discount is therefore applied to all general services considered in this appendix with the exception of Fire and Rescue Service and Public Works. As with replacement shares, the 10 per cent mandatory reduction must be funded from non-development charge sources.
The capital program less any replacement shares or benefit to existing shares, 10 per cent discounts, yields the development-related costs. Although deemed development-related, not all of the net development-related capital program may be recoverable from development charges in the period from 2018 to 2027. For some services, reserve fund balances may be available to fund a share of the program. In addition, for some services, a portion of the capital program may service development occurring after 2027. This portion of the capital program is deemed “pre-built” service capacity and is to be considered as committed excess capacity to be recovered under future development charges. The capital costs associated with pre-built service capacity are also removed from the development charge calculation.
The remaining portion of the net capital program represents the development-related cost that may be included in the development charge. In all cases, as required, this amount is equal to or less than the maximum allowable capital amount as calculated on the final page of Table 1. The result is the discounted development-related net capital cost that is eligible for recovery against development over the period from 2018 to 2027.
HEMSON
74

Calculation of the Unadjusted Development Charges Rates
The section below the capital program displays the calculation of the “unadjusted” development charge rates. The term “unadjusted” development charge is used to distinguish the charge that is calculated prior to cash flow financing considerations. The cash flow analysis is shown in Table 3.
The first step when determining the unadjusted development charge rate is to allocate the development-related net capital cost between the residential and non-residential sectors. For General Government, Fire and Rescue Service, and Public Works Buildings and Fleet, the growth-related costs have been apportioned as 61.3 per cent residential and 38.7 per cent non-residential. This apportionment is based on the anticipated shares of net population and employment growth over the 10-year forecast period.
The development-related costs associated with the Library Service and Community Services have been allocated 100 per cent to the residential sector because the need for these services is generally driven by residential development.
The residential share of the 2018-2027 DC eligible costs are then divided by the forecast population growth in new units. This gives the unadjusted residential development charge per capita. The non-residential growth-related net capital costs are divided by the forecast increase in non-residential gross floor area (GFA). This yields a charge per square metre of new non-residential GFA.
TABLE 3 CASH FLOW ANALYSIS
A cash flow analysis is also undertaken to account for the timing of projects and receipt of development charges. Interest earnings or borrowing costs, therefore, are accounted for in the calculation as allowed under the DCA. Based on the growth forecast, the analysis calculates the development charges rate that is required to finance the net development-related capital spending plan including provisions for any borrowing costs or interest earnings on the reserve funds. The cash flow analysis is designed so that the closing cash balance at the end of the planning period is as close to nil as possible.
In order to determine appropriate development charge rates reflecting borrowing and earnings necessary to support the net growth-related funding requirement,
HEMSON
75
assumptions are used for the inflation rate and interest rate. An inflation rate of 2 per cent is used for the funding requirements and an interest rate of 5 per cent is used for borrowing on the funds and an interest rate of 3.5 per cent is applied to positive balances.
Table 3 displays the results of the cash flow analysis and provides the adjusted or final per capita residential and per square metre (of GFA) non-residential development charges.
HEMSON
76

APPENDIX B
GENERAL GOVERNMENT
HEMSON
77

APPENDIX B
GENERAL GOVERNMENT
The DCA allows the cost of development-related studies and other general government functions to be included in the calculation of the development charges as long as they are permitted under the legislation. Consistent with s. 5 (1) 7 of the DCA, the eligible development-related net capital cost for the provision of studies and permitted general government expenditures is reduced by 10 per cent in calculating the development charges.
TABLE 1 2018 – 2027 PROVISIONAL DEVELOPMENT-RELATED CAPITAL PROGRAM AND CALCULATION OF THE “UNADJUSTED” DEVELOPMENT CHARGES
As shown on Table 1, the 2018-2027 development-related gross cost for general government is $44.2 million. The capital program includes various development-related studies committed to be undertaken in preparation for this by-law update and to be funded through the City’s General Government DC reserve Fund. After funding these studies, the General Government DC Reserve is left in a negative position and included in the capital program for recovery from future DC’s. Cumulatively, the committed projects (including the negative DC reserve) totals $12.3 million.
The bulk of the remaining studies relate to updating the City Zoning By-Law, Fire Master Plan, the Municipal Comprehensive Official Plan Review (and associated studies), Park Development studies, fiscal impact analyses for new development, development related studies and consultation sessions for the VMC and other high growth areas.
Recognizing that not all studies under this service are entirely a result of new growth in the City, “benefit to existing” shares have been netted off the total net municipal costs. The benefit to existing shares amount to $4.5 million and this amount will not be recovered through development charges. The legislated 10 percent discount totals $4.0 million. Committed projects totalling $5.0 million are funded from the General Government DC reserve fund leaving no uncommitted reserves available for future projects. No post-period benefit shares have been identified for this service.
HEMSON
78

The remaining $30.7 million is eligible for development charges funding in the ten-year planning period. This amount is included in the development charge calculation and is allocated 61.3 per cent, or $18.9 million to the residential sector and 38.7 per cent, or $11.9 million to the non-residential sector based on shares of ten-year growth in net population and employment. The resulting unadjusted per capita residential charge is $267.45 before cash flow adjustments. The non-residential unadjusted charge is $4.24 per square metre.
TABLE 2 CASH FLOW ANALYSIS
After cash flow consideration, the residential charge increases to $281.74 per capita and the non-residential charge increases to $4.38 per square metre.
Development-Related Capital ProgramTotal Net DC Recoverable $/capita $/sq.m $/capita $/sq.m
$44,195,833 $30,741,083 $267.45 $4.24 $281.74 $4.38
GENERAL GOVERNMENT SUMMARY
Development Charge Development Charge2018 - 2027 AdjustedUnadjusted
HEMSON
79

Gross Grants/ Net TotalProject Description Timing Project Subsidies/Other Municipal Replacement 10% DC Eligible Available 2018- Post
Cost Recoveries Cost & BTE Shares Reduction Costs DC Reserves 2027 2027
1.0 GENERAL GOVERNMENT
1.1 Committed Projects - 2017
1.1.1 BS-1006-15 Zoning Bylaw Review 2018 522,808$ -$ 522,807.8$ -$ 52,281$ 470,527$ 470,527$ -$ -$
1.1.2 BY-9544-17 Animal Services MNR Feasibility 2018 155,000$ -$ 155,000.0$ -$ 15,500$ 139,500$ 139,500$ -$ -$
1.1.3 CO-0082-15 VMC Development Implementation 2018 5,329$ -$ 5,328.9$ -$ 533$ 4,796$ 4,796$ -$ -$
1.1.4 DI-0075-15 Financial Framework-DC Study 2018 60,016$ -$ 60,015.6$ -$ 6,002$ 54,014$ 54,014$ -$ -$
1.1.5 DP-9004-07 Vellore -Master Plan Study 2018 111,000$ -$ 111,000.0$ -$ 11,100$ 99,900$ 99,900$ -$ -$
1.1.6 DP-9028-12 VMC Physical MastPlan Base Mod 2018 67,000$ -$ 67,000.0$ -$ 6,700$ 60,300$ 60,300$ -$ -$
1.1.7 DP-9029-12 Woodb Heritg Dst. Urban Design 2018 28,977$ -$ 28,976.7$ -$ 2,898$ 26,079$ 26,079$ -$ -$
1.1.8 DP-9030-12 VMC Computer 3D Modeling System 2018 9,354$ -$ 9,354.4$ -$ 935$ 8,419$ 8,419$ -$ -$
1.1.9 DP-9525-15 Vaughan Mills Urban Design Str 2018 130,000$ -$ 130,000.0$ -$ 13,000$ 117,000$ 117,000$ -$ -$
1.1.10 DP-9528-14 City-Wide Urban Design Study 2018 111,593$ -$ 111,593.3$ -$ 11,159$ 100,434$ 100,434$ -$ -$
1.1.11 DP-9536-15 Building Pedestrian Level Wind 2018 50,000$ -$ 50,000.0$ -$ 5,000$ 45,000$ 45,000$ -$ -$
1.1.12 DP-9553-17 Plan Update - Implications 2018 243,080$ -$ 243,080.0$ -$ 24,308$ 218,772$ 218,772$ -$ -$
1.1.13 DP-9555-17 VMC - Consultation Services 2018 51,500$ -$ 51,500.0$ -$ 5,150$ 46,350$ 46,350$ -$ -$
1.1.14 EB-9545-17 Economic Development & Employment 2018 140,350$ -$ 140,350.0$ -$ 14,035$ 126,315$ 126,315$ -$ -$
1.1.15 ES-2521-15 Community Sustainability 2018 32,890$ -$ 32,890.0$ -$ 3,289$ 29,601$ 29,601$ -$ -$
1.1.16 FR-3630-16 Fire Master Plan - 2016 Update 2018 81,291$ -$ 81,291.1$ -$ 8,129$ 73,162$ 73,162$ -$ -$
1.1.17 PK-6433-16 Active Together Master Plan Up 2018 110,486$ -$ 110,485.6$ -$ 11,049$ 99,437$ 99,437$ -$ -$
1.1.18 PK-6536-16 VMC-Parks Development Plan 2018 262,032$ -$ 262,032.2$ -$ 26,203$ 235,829$ 235,829$ -$ -$
1.1.19 PL-9003-07 Vaughan Official Plan Review 2018 104,002$ -$ 104,002.2$ -$ 10,400$ 93,602$ 93,602$ -$ -$
1.1.20 PL-9023-11 Weston Road and Highway 7 Secondary 2018 253,000$ -$ 253,000.0$ -$ 25,300$ 227,700$ 227,700$ -$ -$
1.1.21 PL-9025-11 Natural Heritage Network (NHN) 2018 6,082$ -$ 6,082.2$ -$ 608$ 5,474$ 5,474$ -$ -$
1.1.22 PL-9026-11 Vaughan Mills Centre Secondary 2018 109,644$ -$ 109,644.4$ -$ 10,964$ 98,680$ 98,680$ -$ -$
1.1.23 PL-9027-12 Ctr St W Gateway Secondary Pln 2018 6,449$ -$ 6,448.9$ -$ 645$ 5,804$ 5,804$ -$ -$
1.1.24 PL-9533-13 NCASecondary Plan Block 41 2018 206,512$ -$ 206,512.2$ -$ 20,651$ 185,861$ 185,861$ -$ -$
1.1.25 PL-9535-13 NCASecondary Plan Block 27 2018 207,852$ -$ 207,852.2$ -$ 20,785$ 187,067$ 187,067$ -$ -$
1.1.26 PL-9547-14 Land Use Study-Kipling/HWY7 2018 13,242$ -$ 13,242.2$ -$ 1,324$ 11,918$ 11,918$ -$ -$
1.1.27 PL-9550-16 Municipal Comprehensive (Office) 2018 1,789,199$ -$ 1,789,198.9$ -$ 178,920$ 1,610,279$ 1,610,279$ -$ -$
1.1.28 PL-9551-16 Concord GO Centre Secondary Plan 2018 669,253$ -$ 669,253.3$ -$ 66,925$ 602,328$ 602,328$ -$ -$
1.1.29 Recovery of Negative Reserve Fund Balance 2018 6,784,251$ -$ 6,784,251$ -$ 678,425$ 6,105,826$ -$ 6,105,826$ -$
Subtotal Committed Projects 12,322,193$ -$ 12,322,193.3$ -$ 1,232,219$ 11,089,974$ 4,984,148$ 6,105,826$ -$
1.2 Municipal Comprehensive Review
1.2.1 Municipal Comprehensive (Official Plan) Review 2018 161,000$ -$ 161,000.0$ -$ 16,100$ 144,900$ -$ 144,900$ -$
1.2.2 Promenade Mall Secondary Plan 2018 618,000$ -$ 618,000.0$ -$ 61,800$ 556,200$ -$ 556,200$ -$
1.2.3 Urban Schools City-Wide 2018 186,000$ -$ 186,000.0$ -$ 18,600$ 167,400$ -$ 167,400$ -$
1.2.4 Municipal Comprehensive (Official Plan) Review 2019 6,112,000$ -$ 6,112,000.0$ -$ 611,200$ 5,500,800$ -$ 5,500,800$ -$
1.2.5 Intensification Corridor Planning ($1,000,000 over 10 years) 2019 1,000,000$ -$ 1,000,000.0$ -$ 100,000$ 900,000$ -$ 900,000$ -$
1.2.6 OP Background Studies - Climate Change 2019 500,000$ -$ 500,000.0$ 250,000$ 25,000$ 225,000$ -$ 225,000$ -$
1.2.7 OP Background Studies - Housing Strategy 2020 250,000$ -$ 250,000.0$ 62,500$ 18,750$ 168,750$ -$ 168,750$ -$
1.2.8 OP Background Studies - Use of Fiscal Tools 2020 100,000$ -$ 100,000.0$ 25,000$ 7,500$ 67,500$ -$ 67,500$ -$
1.2.9 10 Year OP Review 2026 9,035,000$ -$ 9,035,000.0$ 2,258,750$ 677,625$ 6,098,625$ -$ 6,098,625$ -$
1.2.10 Natural Heritage Network Mapping Update 2026 222,000$ -$ 222,000$ 111,000$ 11,100$ 99,900$ -$ 99,900$ -$
Subtotal Municipal Comprehensive Review 18,184,000$ -$ 18,184,000.0$ 2,707,250$ 1,547,675$ 13,929,075$ -$ 13,929,075$ -$
GENERAL GOVERNMENT
DC Eligible CostsIneligible Costs
APPENDIX BTABLE 1 - PAGE 1
CITY OF VAUGHANDEVELOPMENT-RELATED CAPITAL PROGRAM
HEMSON
HEMSON
80

Gross Grants/ Net Total
Project Description Timing Project Subsidies/Other Municipal Replacement 10% DC Eligible Available 2018- Post
Cost Recoveries Cost & BTE Shares Reduction Costs DC Reserves 2027 2027
1.3 Growth Related Development Planning Studies
1.3.1 Promenade Mall Urban Design Streetscape Plan 2018 181,000$ -$ 181,000.0$ 45,250$ 13,575$ 122,175$ -$ 122,175$ -$
1.3.2 Weston Road / Highway 7 Area Urban Design Streetscape Plan 2018 181,000$ -$ 181,000.0$ 45,250$ 13,575$ 122,175$ -$ 122,175$ -$
1.3.3 Jane St Studies (VMC to Vaughan Mills) -- corridors 2019 212,000$ -$ 212,000.0$ -$ 21,200$ 190,800$ -$ 190,800$ -$
1.3.4 Vaughan Design Review Panel 2018 100,000$ -$ 100,000.0$ -$ 10,000$ 90,000$ -$ 90,000$ -$
1.3.5 Greening Standards Study 2018 103,000$ -$ 103,000.0$ 51,500$ 5,150$ 46,350$ -$ 46,350$ -$
1.3.6 VMC Consultation Services 2018 55,000$ -$ 55,000.0$ -$ 5,500$ 49,500$ -$ 49,500$ -$
1.3.7 VMC Consultation Services 2019 55,000$ -$ 55,000.0$ -$ 5,500$ 49,500$ -$ 49,500$ -$
1.3.8 Kirby Go Master Plan 2019 237,000$ -$ 237,000.0$ -$ 23,700$ 213,300$ -$ 213,300$ -$
1.3.9 Concord West Go Station Master Plan 2019 237,000$ -$ 237,000.0$ -$ 23,700$ 213,300$ -$ 213,300$ -$
1.3.10 VMC Consultation Services 2020 55,000$ -$ 55,000.0$ -$ 5,500$ 49,500$ -$ 49,500$ -$
1.3.11 Update Thornhill HCD Plan 2020 115,000$ -$ 115,000.0$ 57,500$ 5,750$ 51,750$ -$ 51,750$ -$
1.3.12 VMC Consultation Services 2021 55,000$ -$ 55,000.0$ -$ 5,500$ 49,500$ -$ 49,500$ -$
1.3.13 VMC Consultation Services 2022 55,000$ -$ 55,000.0$ -$ 5,500$ 49,500$ -$ 49,500$ -$
1.3.14 VMC Consultation Services 2023 55,000$ -$ 55,000.0$ -$ 5,500$ 49,500$ -$ 49,500$ -$
1.3.15 VMC Consultation Services 2024 55,000$ -$ 55,000.0$ -$ 5,500$ 49,500$ -$ 49,500$ -$
1.3.16 VMC Consultation Services 2025 55,000$ -$ 55,000.0$ -$ 5,500$ 49,500$ -$ 49,500$ -$
1.3.17 VMC Consultation Services 2026 55,000$ -$ 55,000.0$ -$ 5,500$ 49,500$ -$ 49,500$ -$
1.3.18 VMC Consultation Services 2027 55,000$ -$ 55,000.0$ -$ 5,500$ 49,500$ -$ 49,500$ -$
1.3.19 VMC Demonstration Plans/Pilot Projects 2019 158,000$ -$ 158,000.0$ -$ 15,800$ 142,200$ -$ 142,200$ -$
1.3.20 City-Wide Intensification Standards and Guidelines 2019 575,000$ -$ 575,000$ -$ 57,500$ 517,500$ -$ 517,500$ -$
Subtotal Growth Related Development Planning Studies 2,649,000$ -$ 2,649,000$ 199,500$ 244,950$ 2,204,550$ -$ 2,204,550$ -$
TABLE 1 - PAGE 2
CITY OF VAUGHANDEVELOPMENT-RELATED CAPITAL PROGRAM
GENERAL GOVERNMENT
APPENDIX B
Ineligible Costs DC Eligible Costs
HEMSON
HEMSON
81

Gross Grants/ Net Total
Project Description Timing Project Subsidies/Other Municipal Replacement 10% DC Eligible Available 2018- Post
Cost Recoveries Cost & BTE Shares Reduction Costs DC Reserves 2027 2027
1.4 Growth Related Finance Studies
1.4.1 Growth Related Financial Analysis and Long Range Financial Planning 2018 115,000$ -$ 115,000.0$ 16,378$ 9,862$ 88,760$ -$ 88,760$ -$
1.4.2 Secondary Plan and OP Fiscal Impact Analysis 2018 150,000$ -$ 150,000.0$ -$ 15,000$ 135,000$ -$ 135,000$ -$
1.4.3 Growth Related Financial Analysis and Long Range Financial Planning 2019 105,000$ -$ 105,000.0$ 15,425$ 8,958$ 80,618$ -$ 80,618$ -$
1.4.4 Secondary Plan and OP Fiscal Impact Analysis 2019 150,000$ -$ 150,000.0$ -$ 15,000$ 135,000$ -$ 135,000$ -$
1.4.5 Growth Related Financial Analysis and Long Range Financial Planning 2020 105,000$ -$ 105,000.0$ 15,425$ 8,958$ 80,618$ -$ 80,618$ -$
1.4.6 Secondary Plan and OP Fiscal Impact Analysis 2020 150,000$ -$ 150,000.0$ -$ 15,000$ 135,000$ -$ 135,000$ -$
1.4.7 Growth Related Financial Analysis and Long Range Financial Planning 2021 342,000$ -$ 342,000.0$ 15,226$ 32,677$ 294,097$ -$ 294,097$ -$
1.4.8 Secondary Plan and OP Fiscal Impact Analysis 2021 150,000$ -$ 150,000.0$ -$ 15,000$ 135,000$ -$ 135,000$ -$
1.4.9 Growth Related Financial Analysis and Long Range Financial Planning 2022 105,000$ -$ 105,000.0$ 15,226$ 8,977$ 80,797$ -$ 80,797$ -$
1.4.10 Secondary Plan and OP Fiscal Impact Analysis 2022 150,000$ -$ 150,000.0$ -$ 15,000$ 135,000$ -$ 135,000$ -$
1.4.11 Growth Related Financial Analysis and Long Range Financial Planning 2023 105,000$ -$ 105,000.0$ 15,226$ 8,977$ 80,797$ -$ 80,797$ -$
1.4.12 Secondary Plan and OP Fiscal Impact Analysis 2023 150,000$ -$ 150,000.0$ -$ 15,000$ 135,000$ -$ 135,000$ -$
1.4.13 Growth Related Financial Analysis and Long Range Financial Planning 2024 105,000$ -$ 105,000.0$ 15,226$ 8,977$ 80,797$ -$ 80,797$ -$
1.4.14 Secondary Plan and OP Fiscal Impact Analysis 2024 150,000$ -$ 150,000.0$ -$ 15,000$ 135,000$ -$ 135,000$ -$
1.4.15 Growth Related Financial Analysis and Long Range Financial Planning 2025 105,000$ -$ 105,000.0$ 15,226$ 8,977$ 80,797$ -$ 80,797$ -$
1.4.16 Secondary Plan and OP Fiscal Impact Analysis 2025 150,000$ -$ 150,000.0$ -$ 15,000$ 135,000$ -$ 135,000$ -$
1.4.17 Growth Related Financial Analysis and Long Range Financial Planning 2026 295,000$ -$ 295,000.0$ 15,226$ 27,977$ 251,797$ -$ 251,797$ -$
1.4.18 Secondary Plan and OP Fiscal Impact Analysis 2026 150,000$ -$ 150,000.0$ -$ 15,000$ 135,000$ -$ 135,000$ -$
1.4.19 Growth Related Financial Analysis and Long Range Financial Planning 2027 80,000$ -$ 80,000.0$ 15,226$ 6,477$ 58,297$ -$ 58,297$ -$
1.4.20 Secondary Plan and OP Fiscal Impact Analysis 2027 150,000$ -$ 150,000$ -$ 15,000$ 135,000$ -$ 135,000$ -$
Subtotal Growth Related Finance Studies 2,962,000$ -$ 2,962,000$ 153,808$ 280,819$ 2,527,373$ -$ 2,527,373$ -$
Ineligible Costs DC Eligible Costs
APPENDIX BTABLE 1 - PAGE 3
CITY OF VAUGHANDEVELOPMENT-RELATED CAPITAL PROGRAM
GENERAL GOVERNMENT
HEMSON
HEMSON
82

Gross Grants/ Net Total
Project Description Timing Project Subsidies/Other Municipal Replacement 10% DC Eligible Available 2018- Post
Cost Recoveries Cost & BTE Shares Reduction Costs DC Reserves 2027 2027
1.5 Parks Development
1.5.1 Parks Development Studies 2018 250,000$ -$ 250,000.0$ -$ 25,000$ 225,000$ -$ 225,000$ -$
1.5.2 Black Creek Financial Strategy 2019 26,767$ -$ 26,767.0$ -$ 2,677$ 24,090$ -$ 24,090$ -$
1.5.3 Active Together Master Plan Update 2021 175,000$ -$ 175,000.0$ -$ 17,500$ 157,500$ -$ 157,500$ -$
1.5.4 Parks Redevelopment Strategy 2023 100,000$ -$ 100,000.0$ 75,000$ 2,500$ 22,500$ -$ 22,500$ -$
1.5.5 Black Creek Financial Strategy 2024 26,767$ -$ 26,767.0$ -$ 2,677$ 24,090$ -$ 24,090$ -$
1.5.6 Active Together Master Plan 2026 175,000$ -$ 175,000.0$ -$ 17,500$ 157,500$ -$ 157,500$ -$
1.5.7 Maple Nature Reserve Master Plan Update 2019 85,000$ -$ 85,000$ 42,500$ 4,250$ 38,250$ -$ 38,250$ -$
Subtotal Parks Development 838,534$ -$ 838,534$ 117,500$ 72,103$ 648,931$ -$ 648,931$ -$
1.6 Fire and Rescue Services
1.6.1 Fire Master Plan Update 2021 175,000$ -$ 175,000.0$ -$ 17,500$ 157,500$ -$ 157,500$ -$
1.6.2 Fire Master Plan Update 2026 175,000$ -$ 175,000$ -$ 17,500$ 157,500$ -$ 157,500$ -$
Subtotal Fire and Rescue Services 350,000$ -$ 350,000$ -$ 35,000$ 315,000$ -$ 315,000$ -$
1.7 Building Standards
1.7.1 Zoning By-Law Review 2018 349,106$ -$ 349,106.0$ 244,374$ 10,473$ 94,259$ -$ 94,259$ -$
1.7.2 Zoning By-Law Review 2019 1,541,000$ -$ 1,541,000$ 1,078,700$ 46,230$ 416,070$ -$ 416,070$ -$
Subtotal Building Standards 1,890,106$ -$ 1,890,106$ 1,323,074$ 56,703$ 510,329$ -$ 510,329$ -$
1.8 Miscellaneous
1.8.1 Various Growth Related Studies (500,00 per year) various 5,000,000$ -$ 5,000,000$ -$ 500,000$ 4,500,000$ -$ 4,500,000$ -$
Subtotal Various Growth Related Studies (500,00 per year) 5,000,000$ -$ 5,000,000$ -$ 500,000$ 4,500,000$ -$ 4,500,000$ -$
TOTAL GENERAL GOVERNMENT 44,195,833$ -$ 44,195,833$ 4,501,132$ 3,969,470$ 35,725,231$ 4,984,148$ 30,741,083$ -$
Residential Development Charge Calculation
Residential Share of 2018 - 2027 DC Eligible Costs 61.3% $18,854,756 2018 - 2027 Net Funding Envelope N/A
10-Year Growth in Population in New Units 70,498
Unadjusted Development Charge Per Capita $267.45 Reserve Fund Balance
Reserve Fund Balance Before Commitments ($1,121,677)
Non-Residential Development Charge Calculation 2017 Committed Capital Budget Draws ($4,984,149)
Non-Residential Share of 2018 - 2027 DC Eligible Costs 38.7% $11,886,327 Total Uncommitted Reserve Funds (as at Dec 31 2017) ($6,105,826)10-Year Growth in Square Metres 2,803,031
Unadjusted Development Charge Per Square Metre $4.24
APPENDIX BTABLE 1 - PAGE 4
CITY OF VAUGHANDEVELOPMENT-RELATED CAPITAL PROGRAM
GENERAL GOVERNMENT
Ineligible Costs DC Eligible Costs
HEMSON
HEMSON
83

GENERAL GOVERNMENT 2018 2019 2020 2021 2022 2023 2024 2025 2026 2027 TOTAL
OPENING CASH BALANCE $0.00 ($3,010.47) ($6,877.21) ($5,719.58) ($4,894.88) ($3,631.84) ($2,243.31) ($705.08) $1,024.33 ($2,031.30)
2018 - 2027 RESIDENTIAL FUNDING REQUIREMENTS - General Government: Non Inflated $5,150.6 $5,579.2 $615.3 $762.7 $438.7 $452.5 $453.5 $438.7 $4,538.6 $424.9 $18,854.8
- General Government: Inflated $5,150.6 $5,690.8 $640.1 $809.4 $474.9 $499.6 $510.7 $504.0 $5,317.7 $507.8 $20,105.6
NEW RESIDENTIAL DEVELOPMENT
- Population Growth in New Units 7,882 7,268 7,333 6,452 6,495 6,624 6,757 6,927 6,995 7,764 70,498
REVENUE
- DC Receipts: Inflated $2,220.7 $2,088.7 $2,149.6 $1,929.1 $1,980.8 $2,060.6 $2,143.7 $2,241.7 $2,309.0 $2,614.0 $21,737.8
INTEREST
- Interest on Opening Balance $0.0 ($165.6) ($378.2) ($314.6) ($269.2) ($199.8) ($123.4) ($38.8) $35.9 ($111.7) ($1,565.4)
- Interest on In-year Transactions ($80.6) ($99.1) $26.4 $19.6 $26.4 $27.3 $28.6 $30.4 ($82.7) $36.9 ($66.8)
TOTAL REVENUE $2,140.1 $1,824.1 $1,797.7 $1,634.1 $1,737.9 $1,888.2 $2,048.9 $2,233.4 $2,262.1 $2,539.1 $20,105.6
CLOSING CASH BALANCE ($3,010.5) ($6,877.2) ($5,719.6) ($4,894.9) ($3,631.8) ($2,243.3) ($705.1) $1,024.3 ($2,031.3) $0.0
2018 Adjusted Charge Per Capita $281.74 Allocation of Capital ProgramResidential Sector 61.3%
Non-Residential Sector 38.7%
Rates for 2018
Inflation Rate: 2.0%
Interest Rate on Positive Balances 3.5%
Interest Rate on Negative Balances 5.5%
APPENDIX BTABLE 2 - PAGE 1
CITY OF VAUGHANCASHFLOW AND DETERMINATION OF DEVELOPMENT CHARGE
GENERAL GOVERNMENTRESIDENTIAL DEVELOPMENT CHARGE
(in $000)
HEMSON
HEMSON
84

GENERAL GOVERNMENT 2018 2019 2020 2021 2022 2023 2024 2025 2026 2027 TOTAL
OPENING CASH BALANCE $0.0 ($1,696.9) ($3,758.9) ($2,594.0) ($1,388.0) ($755.8) ($70.5) $680.8 $1,500.7 ($722.8)
2018 - 2027 NON-RESIDENTIAL FUNDING REQUIREMENTS- General Government: Non Inflated $3,247.0 $3,517.2 $387.9 $480.8 $276.6 $285.3 $285.9 $276.6 $2,861.2 $267.9 $11,886.3
- General Government: Inflated $3,247.0 $3,587.6 $403.5 $510.3 $299.4 $315.0 $322.0 $317.7 $3,352.4 $320.1 $12,674.9
NEW NON-RESIDENTIAL DEVELOPMENT
- Sq. Metres in New Buildings 364,541 374,435 384,663 395,241 210,183 213,014 215,889 218,808 221,774 204,484 2,803,031
REVENUE
- DC Receipts: Inflated $1,595.5 $1,671.6 $1,751.6 $1,835.8 $995.7 $1,029.3 $1,064.1 $1,100.1 $1,137.3 $1,069.6 $13,250.5
INTEREST
- Interest on Opening Balance $0.0 ($93.3) ($206.7) ($142.7) ($76.3) ($41.6) ($3.9) $23.8 $52.5 ($39.8) ($527.9)
- Interest on In-year Transactions ($45.4) ($52.7) $23.6 $23.2 $12.2 $12.5 $13.0 $13.7 ($60.9) $13.1 ($47.8)
TOTAL REVENUE $1,550.1 $1,525.6 $1,568.4 $1,716.3 $931.6 $1,000.3 $1,073.2 $1,137.6 $1,128.9 $1,042.9 $12,674.9
CLOSING CASH BALANCE ($1,696.9) ($3,758.9) ($2,594.0) ($1,388.0) ($755.8) ($70.5) $680.8 $1,500.7 ($722.8) $0.0
2018 Adjusted Charge Per SQ.M $4.38 Allocation of Capital ProgramResidential Sector 61.3%
Non-Residential Sector 38.7%
Rates for 2018
Inflation Rate: 2.0%
Interest Rate on Positive Balances 3.5%
Interest Rate on Negative Balances 5.5%
APPENDIX BTABLE 2 - PAGE 2
CITY OF VAUGHANCASHFLOW AND DETERMINATION OF DEVELOPMENT CHARGE
GENERAL GOVERNMENTNON-RESIDENTIAL DEVELOPMENT CHARGE
(in $000)
HEMSON
HEMSON
85

APPENDIX C
LIBRARY SERVICE
HEMSON
86

APPENDIX C
LIBRARY SERVICE
The Library Board is responsible for the provision of library service in the City of Vaughan. In 2017, the Board operated ten libraries in various locations throughout the City and the Board expects to expand its service in several growing areas over the next 10 years.
TABLE 1 HISTORICAL SERVICE LEVELS
The total space used in 2017 to provide Library Service in Vaughan totals 176,276 square feet and has a replacement value of $70.3 million (Page 1). The land associated with this space totals 5.58 hectares and is valued at $46.3 million. Materials are valued at $23.1 million and furniture and equipment totals $7.7 million. Broadband materials are valued at $57,000. Computer related equipment is excluded in this total as required by the DCA.
The replacement value of the 2017 inventory of capital assets for Library Service is $147.5 million, and the average historical service level over 10 years is $431.33 per capita (Page 3). The historical service level multiplied by the ten-year forecast of net population growth results in a 10-year maximum allowable funding envelope of $28.9 million (66,908 net population growth x historical service level of $431.33/capita). The 2017 service level exceeds the ten-year average service level, and therefore notional excess capacity of approximately $12.5 million is identified. However, the notional excess capacity identified cannot be used to meet the capital requirements required by future development, and therefore, the associated capital cost is eligible for recovery and no reduction to the funding envelope is made.
Finally, Library Services must be reduced by 10 per cent as required under the DCA. The resulting net maximum allowable funding envelope brought forward to the development charges calculation is reduced to $26.0 million.
TABLE 2 2018 – 2027 PROVISIONAL GROWTH-RELATED CAPITAL PROGRAM & CALCULATION OF THE “UNADJUSTED” DEVELOPMENT CHARGES
The 2018–2027 development-related capital program for Library Service totals $49.1 million and is largely related to the construction of three new buildings identified
HEMSON
87

through the 2017 Active Together Master Plan (ATMP), which is still currently under review. Furthermore, there are several projects in the Library capital program which are considered to be committed projects previously approved in the Capital Budget and to be funded through the City’s Library DC Reserve fund. These projects are cumulatively valued at $9.7 million and mainly related to the construction of the new Vellore Village South branch and the new VMC Library. After deductions, the remaining $8.7 million in committed projects is funded from reserves which leaves about $1.9 million in uncommitted funds to be applied towards new projects outlined below.
In addition to the committed project list, the first main project is a new library in Block 11 at a cost of $6.0 million for the land, building, furnishings and resources. The second project is a new library in Block 41 at a cost of $7.6 million as well as a new branch in the VMC for $9.4 million. The combined value for these three facilities totals $23.0 million including all land acquisition costs, furnishings and resources. It should be noted that the assumed principal portions of the debenture payments associated with the VMC Library have been identified in the program; interest costs have been included in the cash flow calculations (see Table 3).
In addition, the City is looking to reconstruct the Kleinburg library for $10.7 million in 2027, which includes land acquisition, construction and resource costs. The new library is expected to be about 12,000 square feet, in which, the existing Kleinburg library of 5,600 square feet would be decommissioned, for a total net new space of 6,400 square. Replacement shares of $5.0 million is determined and this amount will not be recovered through development charges. This allocation is based on a ratio of the building areas of the existing facility to the building areas of the new facility.
The capital program also includes a provision to acquire land to accommodate the construction of two additional libraries in Block 27 ($1.7 million) and Vaughan Mills ($3.1 million). The capital program only includes for the acquisition of land at this time as the construction of the library would occur outside of the ten-year planning period (post 2027). Lastly, studies and equipment for the Mackenzie Health Hospital Library are included at a cost of $941,000.
Altogether, the total ten-year development-related capital program for Library Service is $49.1 million. No provincial government grants/subsidies are available to offset the cost of the program. Non-growth shares, relating to replacement of the existing
HEMSON
88

Kleinburg Library, total $5.0 million and have been netted off the total cost of the program. The legislated 10 per cent discount totals $4.4 million and is netted off the net municipal costs, leaving $39.7 million as the total development-related costs. About $1.9 million in uncommitted Library DC reserves are available to help fund the cost of the program. Finally, a portion of the capital program, $3.1 million, is deemed a post-period benefit, and will be considered for recovery in subsequent development charge by-laws.
The remaining $26.0 million is related to development between 2018 and 2027, which is allocated entirely against future residential development in the City of Vaughan. This results in an unadjusted development charge of $368.43 per capita.
TABLE 3 CASH FLOW ANALYSIS
The cash flow analysis is displayed in Table 3. It considers the timing of the projects against the timing of the development charge revenues to determine adjusted calculated rates. After cash flow analysis, the residential charge increases to $381.84 per capita.
10-year Hist.
Service Level Development-Related Capital Program
per capita Total Net DC Recoverable $/capita $/sq.m $/capita $/sq.m
$431.33 $49,122,037 $25,973,749 $368.43 $0.00 $381.84 $0.00
Development Charge
LIBRARY SERVICES SUMMARY
2018 - 2027 Unadjusted Adjusted
Development Charge
HEMSON
89
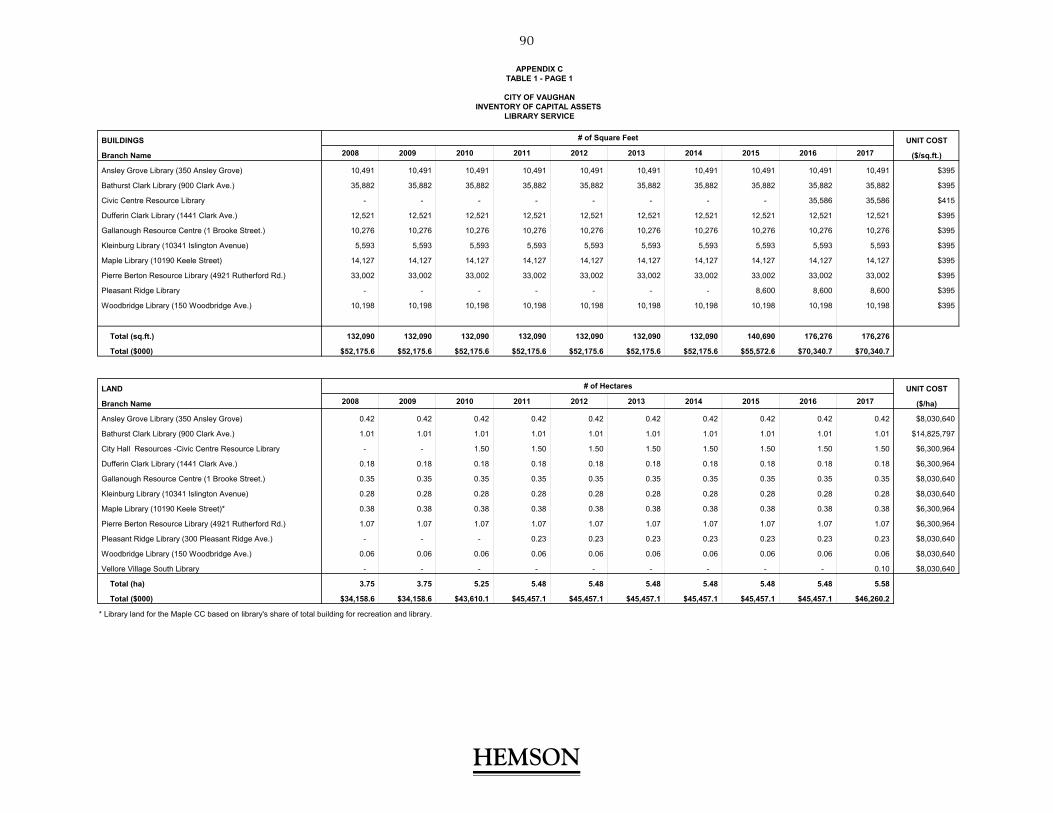
APPENDIX CTABLE 1 - PAGE 1
CITY OF VAUGHANINVENTORY OF CAPITAL ASSETS
LIBRARY SERVICE
BUILDINGS UNIT COST
Branch Name 2008 2009 2010 2011 2012 2013 2014 2015 2016 2017 ($/sq.ft.)
Ansley Grove Library (350 Ansley Grove) 10,491 10,491 10,491 10,491 10,491 10,491 10,491 10,491 10,491 10,491 $395
Bathurst Clark Library (900 Clark Ave.) 35,882 35,882 35,882 35,882 35,882 35,882 35,882 35,882 35,882 35,882 $395
Civic Centre Resource Library - - - - - - - - 35,586 35,586 $415
Dufferin Clark Library (1441 Clark Ave.) 12,521 12,521 12,521 12,521 12,521 12,521 12,521 12,521 12,521 12,521 $395
Gallanough Resource Centre (1 Brooke Street.) 10,276 10,276 10,276 10,276 10,276 10,276 10,276 10,276 10,276 10,276 $395
Kleinburg Library (10341 Islington Avenue) 5,593 5,593 5,593 5,593 5,593 5,593 5,593 5,593 5,593 5,593 $395
Maple Library (10190 Keele Street) 14,127 14,127 14,127 14,127 14,127 14,127 14,127 14,127 14,127 14,127 $395
Pierre Berton Resource Library (4921 Rutherford Rd.) 33,002 33,002 33,002 33,002 33,002 33,002 33,002 33,002 33,002 33,002 $395
Pleasant Ridge Library - - - - - - - 8,600 8,600 8,600 $395
Woodbridge Library (150 Woodbridge Ave.) 10,198 10,198 10,198 10,198 10,198 10,198 10,198 10,198 10,198 10,198 $395
Total (sq.ft.) 132,090 132,090 132,090 132,090 132,090 132,090 132,090 140,690 176,276 176,276
Total ($000) $52,175.6 $52,175.6 $52,175.6 $52,175.6 $52,175.6 $52,175.6 $52,175.6 $55,572.6 $70,340.7 $70,340.7
LAND UNIT COST
Branch Name 2008 2009 2010 2011 2012 2013 2014 2015 2016 2017 ($/ha)
Ansley Grove Library (350 Ansley Grove) 0.42 0.42 0.42 0.42 0.42 0.42 0.42 0.42 0.42 0.42 $8,030,640
Bathurst Clark Library (900 Clark Ave.) 1.01 1.01 1.01 1.01 1.01 1.01 1.01 1.01 1.01 1.01 $14,825,797
City Hall Resources -Civic Centre Resource Library - - 1.50 1.50 1.50 1.50 1.50 1.50 1.50 1.50 $6,300,964
Dufferin Clark Library (1441 Clark Ave.) 0.18 0.18 0.18 0.18 0.18 0.18 0.18 0.18 0.18 0.18 $6,300,964
Gallanough Resource Centre (1 Brooke Street.) 0.35 0.35 0.35 0.35 0.35 0.35 0.35 0.35 0.35 0.35 $8,030,640
Kleinburg Library (10341 Islington Avenue) 0.28 0.28 0.28 0.28 0.28 0.28 0.28 0.28 0.28 0.28 $8,030,640
Maple Library (10190 Keele Street)* 0.38 0.38 0.38 0.38 0.38 0.38 0.38 0.38 0.38 0.38 $6,300,964
Pierre Berton Resource Library (4921 Rutherford Rd.) 1.07 1.07 1.07 1.07 1.07 1.07 1.07 1.07 1.07 1.07 $6,300,964
Pleasant Ridge Library (300 Pleasant Ridge Ave.) - - - 0.23 0.23 0.23 0.23 0.23 0.23 0.23 $8,030,640
Woodbridge Library (150 Woodbridge Ave.) 0.06 0.06 0.06 0.06 0.06 0.06 0.06 0.06 0.06 0.06 $8,030,640
Vellore Village South Library - - - - - - - - - 0.10 $8,030,640
Total (ha) 3.75 3.75 5.25 5.48 5.48 5.48 5.48 5.48 5.48 5.58
Total ($000) $34,158.6 $34,158.6 $43,610.1 $45,457.1 $45,457.1 $45,457.1 $45,457.1 $45,457.1 $45,457.1 $46,260.2
* Library land for the Maple CC based on library's share of total building for recreation and library.
# of Hectares
# of Square Feet
HEMSON
HEMSON
90

APPENDIX CTABLE 1 - PAGE 2
CITY OF VAUGHANINVENTORY OF CAPITAL ASSETS
MATERIALS UNIT COST
Type of Collection 2008 2009 2010 2011 2012 2013 2014 2015 2016 2017 ($/item)
- Books 428,325 441,893 436,794 445,123 420,685 404,367 412,611 455,025 446,234 477,797 $37
- Periodicals 1,289 1,122 1,035 1,066 977 1,208 1,310 1,264 $100
- Audio visual materials 70,982 80,274 82,741 82,717 95,270 95,525 103,973 112,790 118,089 133,705 $34
- Electronic Books 836 1,087 2,219 3,363 4,841 5,905 7,109 7,471 9,820 12,392 $32
- Electronic Products 45 34 34 35 42 38 39 48 55 72 $4,630
Total (#) 501,477 524,410 522,823 532,304 520,838 506,812 523,732 576,542 575,508 625,230
Total ($000) $18,625.4 $19,383.8 $19,306.5 $19,658.2 $19,153.9 $18,672.0 $19,209.7 $21,252.9 $21,225.6 $23,080.8
FURNITURE AND EQUIPMENT
Branch Name 2008 2009 2010 2011 2012 2013 2014 2015 2016 2017
Ansley Grove Library (350 Ansley Grove) $467,000 $478,000 $485,000 $490,000 $468,601 $472,612 $513,126 $518,062 $518,844 $518,844
Bathurst Clark Library (900 Clark Ave.) $1,330,000 $1,360,000 $1,366,000 $1,372,000 $1,386,885 $1,410,495 $1,457,401 $1,478,689 $1,475,099 $1,475,099
Dufferin Clark Library (1441 Clark Ave.) $406,000 $414,000 $417,000 $419,000 $417,648 $418,589 $465,896 $475,660 $482,294 $482,294
Kleinburg Library (10341 Islington Avenue) $124,000 $132,000 $139,000 $139,000 $122,556 $123,185 $126,251 $143,738 $149,187 $149,187
Maple Library (10190 Keele Street) $503,000 $509,000 $516,000 $519,000 $487,451 $489,515 $488,122 $495,779 $495,779 $495,779
Woodbridge Library (150 Woodbridge Ave.) $300,000 $304,000 $307,000 $309,000 $301,796 $305,326 $307,065 $311,440 $313,448 $313,448
Gallanough Resource Centre (1 Brooke Street.) $0 $0 $0 $0 $0 $0 $0 $0 $0 $74,594
Pierre Berton Resource Library (4921 Rutherford Rd.) $1,165,000 $1,172,000 $1,176,000 $1,179,000 $1,183,374 $1,184,919 $1,216,424 $1,270,148 $1,304,955 $1,304,955
Pleasant Ridge Library (300 Pleasant Ridge Ave.) $0 $0 $0 $0 $0 $0 $185,400 $265,200 $265,200 $265,200
Civic Centre Resource Library (2191 Major Mackenzie Dr.) $0 $0 $0 $0 $0 $0 $0 $0 $979,300 $988,600
Vellore Village South Library (xxx) $0 $0 $0 $0 $0 $0 $0 $0 $0 $262,500
System wide circulation equipment and learning media (excl. PC $818,000 $818,000 $818,000 $1,184,000 $1,237,733 $1,261,316 $1,288,210 $1,297,627 $1,355,540 $1,413,452
Total ($000) $5,113.0 $5,187.0 $5,224.0 $5,611.0 $5,606.0 $5,666.0 $6,047.9 $6,256.3 $7,339.6 $7,744.0
BROADBAND UNIT COST
Branch Name 2008 2009 2010 2011 2012 2013 2014 2015 2016 2017 ($/unit)
Ansley Grove Library (350 Ansley Grove) 0 0 0 0 0 0 0 2 2 2 $1,782
Bathurst Clark Library (900 Clark Ave.) 0 0 0 0 0 0 5 5 5 5 $1,782
Civic Centre Resource Library 0 0 0 0 0 0 0 0 10 10 $1,782
Dufferin Clark Library (1441 Clark Ave.) 0 0 0 0 0 0 0 2 2 2 $1,782
Kleinburg Library (10341 Islington Avenue) 0 0 0 0 0 0 0 1 1 1 $1,782
Maple Library (10190 Keele Street) 0 0 0 0 0 0 1 1 1 1 $1,782
Pierre Berton Resource Library (4921 Rutherford Rd.) 0 0 0 0 0 0 0 6 6 6 $1,782
Pleasant Ridge Library 0 0 0 0 0 0 2 2 2 2 $1,782
Woodbridge Library (150 Woodbridge Ave.) 0 0 0 0 0 0 0 3 3 3 $1,782
Total (#) - - - - - - 8 22 32 32
Total ($000) $0.0 $0.0 $0.0 $0.0 $0.0 $0.0 $14.3 $39.2 $57.0 $57.0
# of Collection Materials
Total Value of Furniture and Equipment ($)
# of Access Points
LIBRARY SERVICE
HEMSON
HEMSON
91

2008 2009 2010 2011 2012 2013 2014 2015 2016 2017
Historic Population 257,532 267,405 277,656 288,301 291,801 295,344 298,930 302,560 306,233 312,853
INVENTORY SUMMARY ($000)
Buildings $52,175.6 $52,175.6 $52,175.6 $52,175.6 $52,175.6 $52,175.6 $52,175.6 $55,572.6 $70,340.7 $70,340.7
Land $34,158.6 $34,158.6 $43,610.1 $45,457.1 $45,457.1 $45,457.1 $45,457.1 $45,457.1 $45,457.1 $46,260.2
Materials $18,625.4 $19,383.8 $19,306.5 $19,658.2 $19,153.9 $18,672.0 $19,209.7 $21,252.9 $21,225.6 $23,080.8
Furniture and Equipment $5,113.0 $5,187.0 $5,224.0 $5,611.0 $5,606.0 $5,666.0 $6,047.9 $6,256.3 $7,339.6 $7,744.0
Broadband $0.0 $0.0 $0.0 $0.0 $0.0 $0.0 $14.3 $39.2 $57.0 $57.0
Total ($000) $110,072.6 $110,904.9 $120,316.1 $122,901.9 $122,392.6 $121,970.7 $122,904.6 $128,578.1 $144,420.1 $147,482.7
Average
SERVICE LEVEL ($/capita) Service
Level
Buildings $202.60 $195.12 $187.91 $180.98 $178.81 $176.66 $174.54 $183.67 $229.70 $224.84 $193.48
Land $132.64 $127.74 $157.06 $157.67 $155.78 $153.91 $152.07 $150.24 $148.44 $147.87 $148.34
Materials $72.32 $72.49 $69.53 $68.19 $65.64 $63.22 $64.26 $70.24 $69.31 $73.78 $68.90
Furniture and Equipment $19.85 $19.40 $18.81 $19.46 $19.21 $19.18 $20.23 $20.68 $23.97 $24.75 $20.56
Broadband $0.00 $0.00 $0.00 $0.00 $0.00 $0.00 $0.05 $0.13 $0.19 $0.18 $0.05
Total ($/capita) $427.41 $414.75 $433.33 $426.30 $419.44 $412.98 $411.15 $424.97 $471.60 $471.41 $431.33
CITY OF VAUGHAN
CALCULATION OF MAXIMUM ALLOWABLE FUNDING ENVELOPE
LIBRARY SERVICE
10-Year Funding Envelope Calculation Excess Capacity Calculation
10 Year Average Service Level 2008 - 2017 $431.33 Total Value of Inventory in 2017 $147,482,673
Net Population Growth 2018 - 2027 66,908 Inventory Using Average Service Level $134,943,757
Maximum Allowable Funding Envelope $28,859,721 Excess Capacity $12,538,916
Less: Uncommitted Excess Capacity $0 Excess Capacity: Committed
Less: 10% Legislated Reduction $2,885,972 *Notional excess capacity of $12.5 million exists
Discounted Maximum Allowable Funding Envelope $25,973,749
TABLE 1 - PAGE 3
CITY OF VAUGHANINVENTORY OF CAPITAL ASSETS
LIBRARY SERVICE
APPENDIX C
HEMSON
HEMSON
92
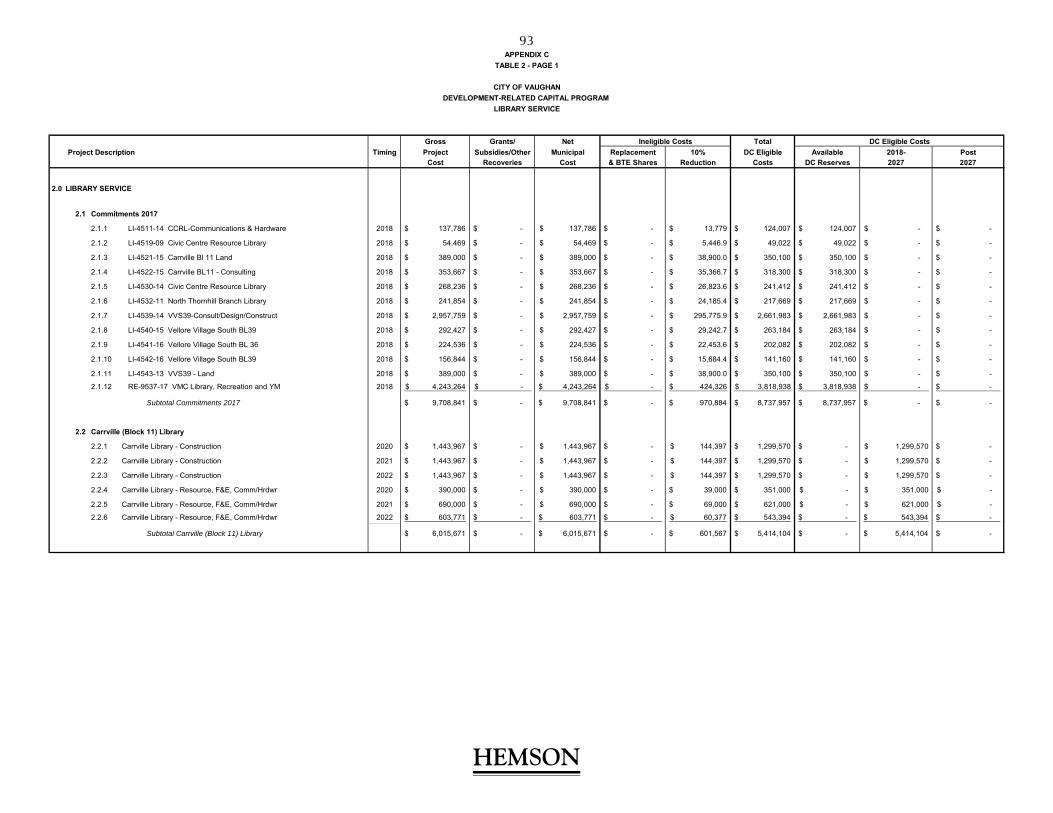
Gross Grants/ Net Total
Project Description Timing Project Subsidies/Other Municipal Replacement 10% DC Eligible Available 2018- PostCost Recoveries Cost & BTE Shares Reduction Costs DC Reserves 2027 2027
2.0 LIBRARY SERVICE
2.1 Commitments 2017
2.1.1 LI-4511-14 CCRL-Communications & Hardware 2018 137,786$ -$ 137,786$ -$ 13,779$ 124,007$ 124,007$ -$ -$
2.1.2 LI-4519-09 Civic Centre Resource Library 2018 54,469$ -$ 54,469$ -$ 5,446.9$ 49,022$ 49,022$ -$ -$
2.1.3 LI-4521-15 Carrville Bl 11 Land 2018 389,000$ -$ 389,000$ -$ 38,900.0$ 350,100$ 350,100$ -$ -$
2.1.4 LI-4522-15 Carrville BL11 - Consulting 2018 353,667$ -$ 353,667$ -$ 35,366.7$ 318,300$ 318,300$ -$ -$
2.1.5 LI-4530-14 Civic Centre Resource Library 2018 268,236$ -$ 268,236$ -$ 26,823.6$ 241,412$ 241,412$ -$ -$
2.1.6 LI-4532-11 North Thornhill Branch Library 2018 241,854$ -$ 241,854$ -$ 24,185.4$ 217,669$ 217,669$ -$ -$
2.1.7 LI-4539-14 VVS39-Consult/Design/Construct 2018 2,957,759$ -$ 2,957,759$ -$ 295,775.9$ 2,661,983$ 2,661,983$ -$ -$
2.1.8 LI-4540-15 Vellore Village South BL39 2018 292,427$ -$ 292,427$ -$ 29,242.7$ 263,184$ 263,184$ -$ -$
2.1.9 LI-4541-16 Vellore Village South BL 36 2018 224,536$ -$ 224,536$ -$ 22,453.6$ 202,082$ 202,082$ -$ -$
2.1.10 LI-4542-16 Vellore Village South BL39 2018 156,844$ -$ 156,844$ -$ 15,684.4$ 141,160$ 141,160$ -$ -$
2.1.11 LI-4543-13 VVS39 - Land 2018 389,000$ -$ 389,000$ -$ 38,900.0$ 350,100$ 350,100$ -$ -$
2.1.12 RE-9537-17 VMC Library, Recreation and YM 2018 4,243,264$ -$ 4,243,264$ -$ 424,326$ 3,818,938$ 3,818,938$ -$ -$
Subtotal Commitments 2017 9,708,841$ -$ 9,708,841$ -$ 970,884$ 8,737,957$ 8,737,957$ -$ -$
2.2 Carrville (Block 11) Library
2.2.1 Carrville Library - Construction 2020 1,443,967$ -$ 1,443,967$ -$ 144,397$ 1,299,570$ -$ 1,299,570$ -$
2.2.2 Carrville Library - Construction 2021 1,443,967$ -$ 1,443,967$ -$ 144,397$ 1,299,570$ -$ 1,299,570$ -$
2.2.3 Carrville Library - Construction 2022 1,443,967$ -$ 1,443,967$ -$ 144,397$ 1,299,570$ -$ 1,299,570$ -$
2.2.4 Carrville Library - Resource, F&E, Comm/Hrdwr 2020 390,000$ -$ 390,000$ -$ 39,000$ 351,000$ -$ 351,000$ -$
2.2.5 Carrville Library - Resource, F&E, Comm/Hrdwr 2021 690,000$ -$ 690,000$ -$ 69,000$ 621,000$ -$ 621,000$ -$
2.2.6 Carrville Library - Resource, F&E, Comm/Hrdwr 2022 603,771$ -$ 603,771$ -$ 60,377$ 543,394$ -$ 543,394$ -$
Subtotal Carrville (Block 11) Library 6,015,671$ -$ 6,015,671$ -$ 601,567$ 5,414,104$ -$ 5,414,104$ -$
DC Eligible CostsIneligible Costs
APPENDIX C
TABLE 2 - PAGE 1
CITY OF VAUGHAN
LIBRARY SERVICE
DEVELOPMENT-RELATED CAPITAL PROGRAM
HEMSON
HEMSON
93
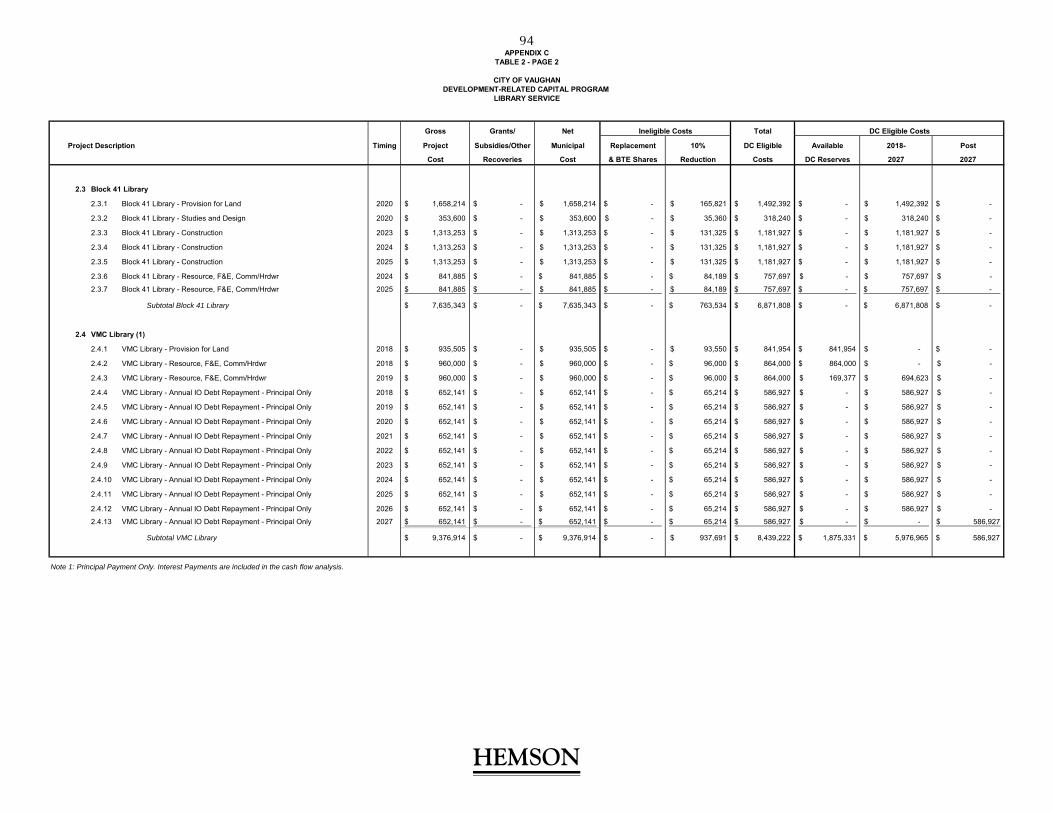
Gross Grants/ Net Total
Project Description Timing Project Subsidies/Other Municipal Replacement 10% DC Eligible Available 2018- Post
Cost Recoveries Cost & BTE Shares Reduction Costs DC Reserves 2027 2027
2.3 Block 41 Library
2.3.1 Block 41 Library - Provision for Land 2020 1,658,214$ -$ 1,658,214$ -$ 165,821$ 1,492,392$ -$ 1,492,392$ -$
2.3.2 Block 41 Library - Studies and Design 2020 353,600$ -$ 353,600$ -$ 35,360$ 318,240$ -$ 318,240$ -$
2.3.3 Block 41 Library - Construction 2023 1,313,253$ -$ 1,313,253$ -$ 131,325$ 1,181,927$ -$ 1,181,927$ -$
2.3.4 Block 41 Library - Construction 2024 1,313,253$ -$ 1,313,253$ -$ 131,325$ 1,181,927$ -$ 1,181,927$ -$
2.3.5 Block 41 Library - Construction 2025 1,313,253$ -$ 1,313,253$ -$ 131,325$ 1,181,927$ -$ 1,181,927$ -$
2.3.6 Block 41 Library - Resource, F&E, Comm/Hrdwr 2024 841,885$ -$ 841,885$ -$ 84,189$ 757,697$ -$ 757,697$ -$
2.3.7 Block 41 Library - Resource, F&E, Comm/Hrdwr 2025 841,885$ -$ 841,885$ -$ 84,189$ 757,697$ -$ 757,697$ -$
Subtotal Block 41 Library 7,635,343$ -$ 7,635,343$ -$ 763,534$ 6,871,808$ -$ 6,871,808$ -$
2.4 VMC Library (1)
2.4.1 VMC Library - Provision for Land 2018 935,505$ -$ 935,505$ -$ 93,550$ 841,954$ 841,954$ -$ -$
2.4.2 VMC Library - Resource, F&E, Comm/Hrdwr 2018 960,000$ -$ 960,000$ -$ 96,000$ 864,000$ 864,000$ -$ -$
2.4.3 VMC Library - Resource, F&E, Comm/Hrdwr 2019 960,000$ -$ 960,000$ -$ 96,000$ 864,000$ 169,377$ 694,623$ -$
2.4.4 VMC Library - Annual IO Debt Repayment - Principal Only 2018 652,141$ -$ 652,141$ -$ 65,214$ 586,927$ -$ 586,927$ -$
2.4.5 VMC Library - Annual IO Debt Repayment - Principal Only 2019 652,141$ -$ 652,141$ -$ 65,214$ 586,927$ -$ 586,927$ -$
2.4.6 VMC Library - Annual IO Debt Repayment - Principal Only 2020 652,141$ -$ 652,141$ -$ 65,214$ 586,927$ -$ 586,927$ -$
2.4.7 VMC Library - Annual IO Debt Repayment - Principal Only 2021 652,141$ -$ 652,141$ -$ 65,214$ 586,927$ -$ 586,927$ -$
2.4.8 VMC Library - Annual IO Debt Repayment - Principal Only 2022 652,141$ -$ 652,141$ -$ 65,214$ 586,927$ -$ 586,927$ -$
2.4.9 VMC Library - Annual IO Debt Repayment - Principal Only 2023 652,141$ -$ 652,141$ -$ 65,214$ 586,927$ -$ 586,927$ -$
2.4.10 VMC Library - Annual IO Debt Repayment - Principal Only 2024 652,141$ -$ 652,141$ -$ 65,214$ 586,927$ -$ 586,927$ -$
2.4.11 VMC Library - Annual IO Debt Repayment - Principal Only 2025 652,141$ -$ 652,141$ -$ 65,214$ 586,927$ -$ 586,927$ -$
2.4.12 VMC Library - Annual IO Debt Repayment - Principal Only 2026 652,141$ -$ 652,141$ -$ 65,214$ 586,927$ -$ 586,927$ -$
2.4.13 VMC Library - Annual IO Debt Repayment - Principal Only 2027 652,141$ -$ 652,141$ -$ 65,214$ 586,927$ -$ -$ 586,927$
Subtotal VMC Library 9,376,914$ -$ 9,376,914$ -$ 937,691$ 8,439,222$ 1,875,331$ 5,976,965$ 586,927$
Note 1: Principal Payment Only. Interest Payments are included in the cash flow analysis.
APPENDIX CTABLE 2 - PAGE 2
CITY OF VAUGHANDEVELOPMENT-RELATED CAPITAL PROGRAM
LIBRARY SERVICE
Ineligible Costs DC Eligible Costs
HEMSON
HEMSON
94
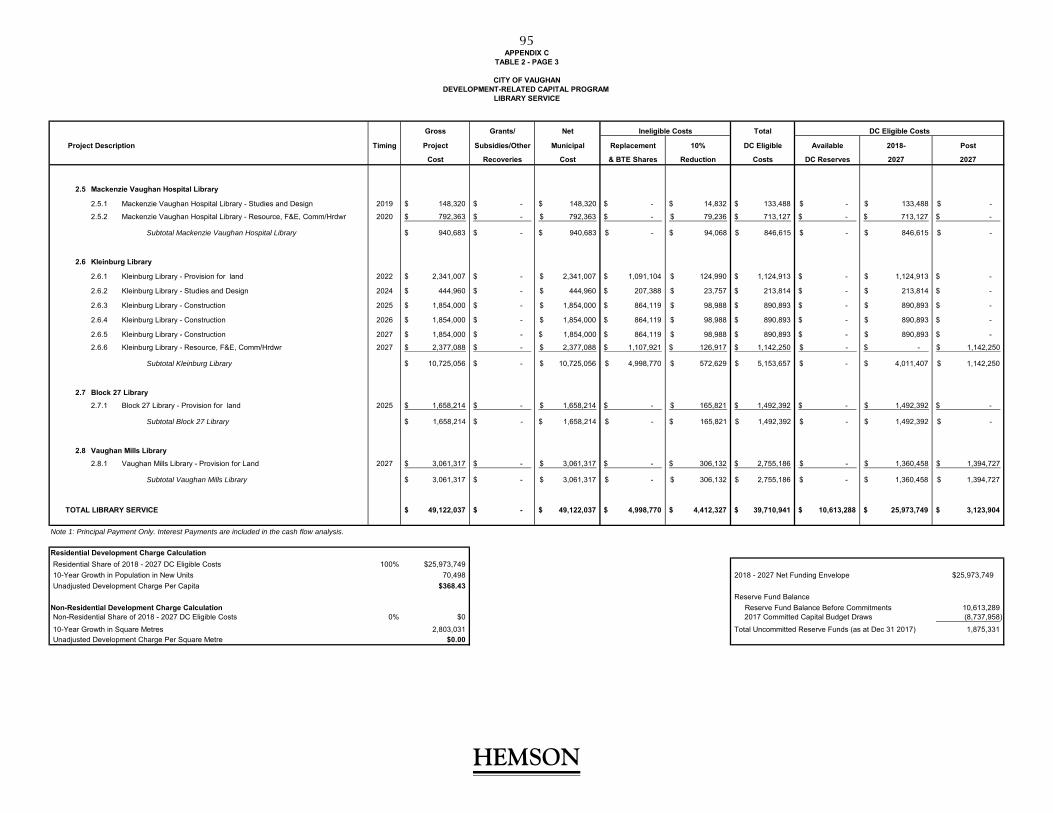
Gross Grants/ Net Total
Project Description Timing Project Subsidies/Other Municipal Replacement 10% DC Eligible Available 2018- Post
Cost Recoveries Cost & BTE Shares Reduction Costs DC Reserves 2027 2027
2.5 Mackenzie Vaughan Hospital Library
2.5.1 Mackenzie Vaughan Hospital Library - Studies and Design 2019 148,320$ -$ 148,320$ -$ 14,832$ 133,488$ -$ 133,488$ -$
2.5.2 Mackenzie Vaughan Hospital Library - Resource, F&E, Comm/Hrdwr 2020 792,363$ -$ 792,363$ -$ 79,236$ 713,127$ -$ 713,127$ -$
Subtotal Mackenzie Vaughan Hospital Library 940,683$ -$ 940,683$ -$ 94,068$ 846,615$ -$ 846,615$ -$
2.6 Kleinburg Library
2.6.1 Kleinburg Library - Provision for land 2022 2,341,007$ -$ 2,341,007$ 1,091,104$ 124,990$ 1,124,913$ -$ 1,124,913$ -$
2.6.2 Kleinburg Library - Studies and Design 2024 444,960$ -$ 444,960$ 207,388$ 23,757$ 213,814$ -$ 213,814$ -$
2.6.3 Kleinburg Library - Construction 2025 1,854,000$ -$ 1,854,000$ 864,119$ 98,988$ 890,893$ -$ 890,893$ -$
2.6.4 Kleinburg Library - Construction 2026 1,854,000$ -$ 1,854,000$ 864,119$ 98,988$ 890,893$ -$ 890,893$ -$
2.6.5 Kleinburg Library - Construction 2027 1,854,000$ -$ 1,854,000$ 864,119$ 98,988$ 890,893$ -$ 890,893$ -$
2.6.6 Kleinburg Library - Resource, F&E, Comm/Hrdwr 2027 2,377,088$ -$ 2,377,088$ 1,107,921$ 126,917$ 1,142,250$ -$ -$ 1,142,250$
Subtotal Kleinburg Library 10,725,056$ -$ 10,725,056$ 4,998,770$ 572,629$ 5,153,657$ -$ 4,011,407$ 1,142,250$
2.7 Block 27 Library
2.7.1 Block 27 Library - Provision for land 2025 1,658,214$ -$ 1,658,214$ -$ 165,821$ 1,492,392$ -$ 1,492,392$ -$
Subtotal Block 27 Library 1,658,214$ -$ 1,658,214$ -$ 165,821$ 1,492,392$ -$ 1,492,392$ -$
2.8 Vaughan Mills Library
2.8.1 Vaughan Mills Library - Provision for Land 2027 3,061,317$ -$ 3,061,317$ -$ 306,132$ 2,755,186$ -$ 1,360,458$ 1,394,727$
Subtotal Vaughan Mills Library 3,061,317$ -$ 3,061,317$ -$ 306,132$ 2,755,186$ -$ 1,360,458$ 1,394,727$
TOTAL LIBRARY SERVICE 49,122,037$ -$ 49,122,037$ 4,998,770$ 4,412,327$ 39,710,941$ 10,613,288$ 25,973,749$ 3,123,904$
Note 1: Principal Payment Only. Interest Payments are included in the cash flow analysis.
Residential Development Charge Calculation
Residential Share of 2018 - 2027 DC Eligible Costs 100% $25,973,749
10-Year Growth in Population in New Units 70,498 2018 - 2027 Net Funding Envelope $25,973,749
Unadjusted Development Charge Per Capita $368.43
Reserve Fund Balance
Non-Residential Development Charge Calculation Reserve Fund Balance Before Commitments 10,613,289 Non-Residential Share of 2018 - 2027 DC Eligible Costs 0% $0 2017 Committed Capital Budget Draws (8,737,958)
10-Year Growth in Square Metres 2,803,031 Total Uncommitted Reserve Funds (as at Dec 31 2017) 1,875,331 Unadjusted Development Charge Per Square Metre $0.00
TABLE 2 - PAGE 3
CITY OF VAUGHANDEVELOPMENT-RELATED CAPITAL PROGRAM
LIBRARY SERVICE
Ineligible Costs DC Eligible Costs
APPENDIX C
HEMSON
HEMSON
95

APPENDIX CTABLE 3
LIBRARY SERVICE 2018 2019 2020 2021 2022 2023 2024 2025 2026 2027 TOTAL
OPENING CASH BALANCE $0.0 $2,205.0 $3,471.2 $1,312.0 $1,163.1 ($98.3) $682.9 $493.2 ($2,151.4) ($797.1)
2018 - 2027 RESIDENTIAL FUNDING REQUIREMENTS
- Library Services: Non Inflated $0.0 $828.1 $4,174.3 $1,920.6 $2,967.9 $1,181.9 $2,153.4 $4,322.9 $890.9 $2,251.4 $20,691.4
- VMC Branch Borrowed Funds $586.9 $586.9 $586.9 $586.9 $586.9 $586.9 $586.9 $586.9 $586.9 $0.0 $5,282.3
- Library Service: Inflated(1) $586.93 $1,431.6 $4,929.9 $2,625.1 $3,799.5 $1,891.9 $3,012.0 $5,552.6 $1,630.8 $2,690.6 $28,150.8
NEW RESIDENTIAL DEVELOPMENT
- Population Growth in New Units 7,882 7,268 7,333 6,452 6,495 6,624 6,757 6,927 6,995 7,764 70,498
REVENUE
- DC Receipts: Inflated $3,009.7 $2,830.8 $2,913.4 $2,614.6 $2,684.6 $2,792.8 $2,905.5 $3,038.3 $3,129.4 $3,542.8 $29,461.8
INTEREST
- Interest on Opening Balance $0.0 $77.2 $121.5 $45.9 $40.7 ($5.4) $23.9 $17.3 ($118.3) ($43.8) $158.9
- Interest on In-year Transactions $42.4 $24.5 ($55.5) ($0.3) ($30.7) $15.8 ($2.9) ($69.1) $26.2 $14.9 ($34.7)
- Interest on VMC Branch ($260.1) ($234.8) ($208.7) ($184.1) ($156.5) ($130.1) ($104.1) ($78.5) ($52.2) ($26.2) ($1,435.2)
TOTAL REVENUE $2,792.0 $2,697.7 $2,770.7 $2,476.1 $2,538.1 $2,673.1 $2,822.4 $2,907.9 $2,985.1 $3,487.6 $28,150.8
CLOSING CASH BALANCE $2,205.0 $3,471.2 $1,312.0 $1,163.1 ($98.3) $682.9 $493.2 ($2,151.4) ($797.1) $0.0
Note 1: Borrowed funds are not inflated.
2018 Adjusted Charge Per Capita $381.84 Allocation of Capital ProgramResidential Sector 100.0%
Non-Residential Sector 0.0%
Rates for 2018
Inflation Rate 2.0%
Interest Rate on Positive Balances 3.5%
Interest Rate on Negative Balances 5.5%
CITY OF VAUGHANCASHFLOW AND DETERMINATION OF DEVELOPMENT CHARGE
LIBRARY SERVICERESIDENTIAL DEVELOPMENT CHARGE
(in $000)
HEMSON
HEMSON
96
APPENDIX D
FIRE AND RESCUE SERVICE
HEMSON
97

APPENDIX D
FIRE AND RESCUE SERVICE
The Vaughan Fire and Rescue Service (VFRS) is responsible for the provision of fire protection services across the City. The Fire Protection and Prevention Act defines fire protection services as “...fire suppression, fire prevention, fire safety education, communication, training of persons involved in the provision of fire protection services, rescue and emergency services and the delivery of all those services.”
TABLE 1 HISTORICAL SERVICE LEVELS
Table 1 displays the ten-year historical inventory for buildings, land, vehicles and equipment. The VFRS currently operates out of nine stations and several other operations-related buildings. The total building area for all fire related buildings in 2017 is 115,247 square feet having a replacement value of $43.9 million.
The land associated with the fire stations and operations buildings totals 9.6 hectares valued at $60.5 million. The 2017 fleet totals 69 vehicles with a replacement value of $25.3 million. Equipment and broadband in all stations is valued at approximately $15.2 million.
The 2017 replacement value of the inventory of capital assets for the Fire and Rescue Service totals $141.3 million and the 10 year historical average service level is $279.95 per capita and employee (page 4). It should be noted, the historical average service level has been adjusted to account for committed excess capacity associated with the negative reserve fund balance for Fire Services. The historical service level, multiplied by the ten-year forecast in net population and employment growth, results in a ten-year maximum allowable funding envelope of $30.5 million. There is no further excess capacity identified for Fire and Rescue Service and as such, no additional reduction to the funding envelope is made. The full maximum allowable funding envelope of $30.5 million is therefore brought forward to the development charges calculation.
HEMSON
98

TABLE 2 2018 – 2027 PROVISIONAL DEVELOPMENT-RELATED CAPITAL PROGRAM & CALCULATION OF THE “UNADJUSTED” DEVELOPMENT CHARGES
The development-related capital program for the VFRS is largely based on the Master Fire Plan and Implementation Strategy Update. In addition, there are several projects in the capital program which are considered to be committed projects previously approved in the Capital Budget and to be funded through the City’s Fire and Rescue DC Reserve fund. These projects are cumulatively valued at $5.2 million and mainly relate to the repositioning of Station 7-4. As a result of funding these projects, the Fire and Rescue Services DC reserve fund balance is in a negative position at year end 2017, and an amount of $3.5 million is included for recovery through DCs.
Station 7-2 Maple is expected to be repositioned in 2022 for a total cost of $8.8 million. Of this amount, about $4.4 million is deducted from the gross project cost to account for the replacement shares related to the decommissioning of the existing station – this amount will not be recovered through development charges.
Furthermore, the capital program also includes for the continued construction of Station 7-4 at a cumulative cost of $2.4 million. About $308,000 is deducted from the gross project cost to account for the replacement shares related to the decommissioning of the existing station (and associated furniture and equipment). Although, some new equipment at Station 7-4 is considered to be entirely growth related and accounts for $245,000 of the $2.4 million cost.
Over the ten-year period the VFRS is expected to construct two new stations. The first new station (7-11) is expected to be developed in 2024 for a total cost of $11.7 million including all land acquisition costs, building, furnishings, equipment and vehicles. Following the completion of Station 7-11, Stations 7-12 is anticipated to be constructed in 2026 for $11.7 million (also including land acquisition, building, furnishings, equipment and vehicle expenses).
The capital program also includes for the purchase of land ($3.9 million) to accommodate Station 7-13. The capital program only includes for the acquisition of land at this time as the construction of the new station would occur outside of the ten-year planning period. Lastly, the remaining $162,000 of the development-related capital program relates to the acquisition of new vehicles.
HEMSON
99

Altogether, the 10 year capital program for the VFRS amounts to $47.2 million. A deduction of $4.7 million is made to this amount to account for the replacement shares related to the decommissioning of Station 7-2 and Station 7-4 when the new facilities are constructed. A further deduction of $5.2 million is also made to account for the reserve funds applied to the existing committed projects. A portion of the capital program, $6.8 million, is deemed a post-period benefit, and will be considered for recovery in subsequent development charge by-laws.
The remaining $30.5 million is related to growth in the 2018–2027 planning period and is eligible for DC recovery. The DCA does not require a 10 per cent statutory discount for fire and rescue services.
The development-related net capital cost of $30.5 million for the VFRS is allocated 61.3 per cent to residential development ($18.7 million) and 38.7 per cent to non-residential development ($11.8 million). This apportionment is based on the anticipated shares of net population and employment growth over the ten-year forecast period. The residential share of the net growth related capital cost is divided by the ten-year forecast growth in population in new units to derive an unadjusted charge of $265.70 per capita. The non-residential share of the net development-related capital cost is divided by the ten-year forecast growth in floor space to derive an unadjusted charge of $4.21 per square metre.
TABLE 3 CASH FLOW ANALYSIS
After cash flow consideration, the residential calculated charge increases to $274.08 per capita and the non-residential charge increases to $4.28 per square metre.
10-year Hist.
Service Level Development-Related Capital Program
per pop & emp Total Net DC Recoverable $/capita $/sq.m $/capita $/sq.m$279.95 $47,215,547 $30,539,236 $265.70 $4.21 $274.08 $4.28
FIRE AND RESCUE SERVICE SUMMARY
2018 - 2027 Unadjusted Adjusted
Development Charge Development Charge
HEMSON
100

APPENDIX DTABLE 1 - PAGE 1
CITY OF VAUGHANINVENTORY OF CAPITAL ASSETS
FIRE AND RESCUE SERVICE
BUILDINGS UNIT COST
Station Name 2008 2009 2010 2011 2012 2013 2014 2015 2016 2017 ($/sq. ft.)
Station 7-1 (Thornhill) Fire Suppression Division 8,224 8,224 8,224 8,224 8,224 8,224 8,224 8,224 8,224 8,224 $335
Station 7-2 (Maple) Fire Suppression Division 8,462 8,462 8,462 8,462 8,462 8,462 8,462 8,462 8,462 8,462 $335
Station 7-3 (Woodbridge-old) Fire Suppression Division 5,054 5,054 5,054 5,054 5,054 5,054 5,054 5,054 5,054 - $335
Station 7-3 (Woodbridge-new) Fire Suppression Division - - - - - - - - - 10,075 $430
Station 7-4 (Kleinburg) Fire Suppression Division 1,461 1,461 1,461 1,461 1,461 1,461 - - - - $335
Station 7-5 (East Woodbridge) Fire Suppression Division 6,443 6,443 6,443 6,443 6,443 6,443 6,443 7,622 7,622 7,622 $335
Station 7-6 (Concord) Fire Suppression Division 6,222 6,222 6,222 6,222 6,222 6,222 6,222 6,222 6,222 6,222 $335
Station 7-7 (West Maple) Fire Suppression Division 6,663 6,663 6,663 6,663 6,663 6,663 6,663 6,663 6,663 6,663 $335
Station 7-8 (East Vaughan) Fire Suppression Division 7,077 7,077 7,077 7,077 7,077 7,077 7,077 7,077 7,077 7,077 $500
Station 7-9 (North Woodbridge) Fire Suppression Division 6,722 6,722 6,722 6,722 6,722 6,722 6,722 6,722 6,722 6,722 $460
Station 7-10 (Dufferin & Teston) - - - - 7,233 7,233 7,233 7,233 7,233 7,233 $650
Joint Operations Centre, Fire and Emergency Services 20,000 46,947 46,947 46,947 46,947 46,947 46,947 46,947 46,947 46,947 $335
Fire Department Headquarters 1,860 - - - - - - - - - $335
Fire Prevention Division 2,170 - - - - - - - - - $335
Fire Communications Centre 480 - - - - - - - - - $335
Total (sq.ft.) 80,838 103,275 103,275 103,275 110,508 110,508 109,047 110,226 110,226 115,247
Total ($000) $29,088.7 $36,605.1 $36,605.1 $36,605.1 $41,306.5 $41,306.5 $40,817.1 $41,212.1 $41,212.1 $43,851.2
LAND UNIT COST
Station Name 2008 2009 2010 2011 2012 2013 2014 2015 2016 2017 ($/ha)
Station 7-1 (Thornhill) Fire Suppression Division 0.40 0.40 0.40 0.40 0.40 0.40 0.40 0.40 0.40 0.40 $6,300,964
Station 7-2 (Maple) Fire Suppression Division 0.25 0.25 0.25 0.25 0.25 0.25 0.25 0.25 0.25 0.25 $6,300,964
Station 7-3 (Woodbridge-new) Fire Suppression Division 0.25 1.01 1.01 1.01 1.01 1.01 1.01 1.01 1.01 1.01 $6,300,964
Station 7-4 (Kleinburg) Fire Suppression Division 0.25 0.25 0.25 0.25 0.25 0.25 - - - 0.39 $6,300,964
Station 7-5 (East Woodbridge) Fire Suppression Division 0.39 0.39 0.39 0.39 0.39 0.39 0.39 0.39 0.39 0.39 $6,300,964
Station 7-6 (Concord) Fire Suppression Division 0.40 0.40 0.40 0.40 0.40 0.40 0.40 0.40 0.40 0.40 $3,088,708
Station 7-7 (West Maple) Fire Suppression Division 0.42 0.42 0.42 0.42 0.42 0.42 0.42 0.42 0.42 0.42 $6,300,964
Station 7-8 (East Vaughan) Fire Suppression Division 0.99 0.99 0.99 0.99 0.99 0.99 0.99 0.99 0.99 0.99 $6,300,964
Station 7-9 (North Woodbridge) Fire Suppression Division 1.01 1.01 1.01 1.01 1.01 1.01 1.01 1.01 1.01 1.01 $6,300,964
Station 7-10 (Dufferin & Teston) - 0.78 0.78 0.78 0.78 0.78 0.78 0.78 0.78 0.78 $8,030,640
Joint Operations Centre, Fire and Emergency Services 1.67 3.55 3.55 3.55 3.55 3.55 3.55 3.55 3.55 3.55 $6,300,964
Fire Department Headquarters 0.28 - - - - - - - - - $6,300,964
Total (ha) 6.31 9.45 9.45 9.45 9.45 9.45 9.20 9.20 9.20 9.59
Total ($000) $38,468.0 $59,590.1 $59,590.1 $59,590.1 $59,590.1 $59,590.1 $58,014.9 $58,014.9 $58,014.9 $60,472.3
# of Square Feet
# of Hectares
HEMSON
HEMSON
101

CITY OF VAUGHANINVENTORY OF CAPITAL ASSETS
FIRE AND RESCUE SERVICE
VEHICLES UNIT COST
Vehicle Type 2008 2009 2010 2011 2012 2013 2014 2015 2016 2017 ($/vehicle)
- Staff vehicles, sedans, wagons, vans, pick-ups 21 23 23 25 24 23 22 22 22 25 $45,000
- Airlight Support Vehicle - - - - - - - - 1 1 $125,000
- Rehab Support Vehicle 1 1 1 1 1 1 1 1 1 1 $300,000
- Mechanical Service 2 2 2 2 2 2 2 3 3 3 $200,000
- Command Unit 1 1 1 1 1 1 1 1 1 1 $350,000
- Command Unit (Small) 1 1 1 1 1 1 2 2 2 2 $60,000
- Tankers 2 2 2 2 2 2 2 2 2 2 $300,000
- Pumpers (light duty commercial) 2 2 2 1 1 - - - - - $493,000
- Haz Mat Unit 1 1 1 1 1 1 1 1 1 1 $850,000
- Pumpers (heavy duty custom) 8 8 8 7 8 8 8 8 8 8 $625,000
- Pumper Telesquirt/Aerial Ladder 2 2 2 - - - - - - - $850,000
- Aerial/Quint (same as engine) 5 5 5 7 7 7 7 7 7 7 $1,200,000
- Aerial/Platform 2 3 3 3 3 3 3 3 3 3 $1,450,000
- Rescue (Heavy Duty Custom) 2 3 3 3 3 3 3 3 3 3 $750,000
- Rescue (Technical) - - 1 1 1 1 1 1 1 1 $750,000
- Foam Trailers 1 1 1 1 1 1 1 1 1 1 $4,000
- Utility Trailer 1 1 1 1 1 1 1 1 2 2 $10,000
- Air Tank Refiller 4 4 4 4 5 5 5 6 7 7 $60,000
- Kawasaki Mule-All Terrain Vehicle - 1 1 1 1 1 1 1 1 1 $12,000
Total (#) 56.00 61.00 62.00 62.00 63.00 61.00 61.00 63.00 66.00 69.00
Total ($000) $21,845.0 $24,147.0 $24,897.0 $24,569.0 $25,209.0 $24,671.0 $24,686.0 $24,946.0 $25,141.0 $25,276.0
# of Vehicles
APPENDIX DTABLE 1 - PAGE 2
HEMSON
HEMSON
102

CITY OF VAUGHANINVENTORY OF CAPITAL ASSETS
FIRE AND RESCUE SERVICE
FURNITURE & EQUIPMENT
Description 2008 2009 2010 2011 2012 2013 2014 2015 2016 2017
Personal Fire Fighter Equipment $1,270,877 $1,270,877 $1,333,530 $1,333,530 $1,385,705 $1,375,270 $1,458,751 $1,537,014 $1,552,667 $1,651,800
Communications Equipment $3,731,797 $3,731,797 $3,731,797 $3,731,797 $3,731,797 $3,731,797 $3,761,925 $3,761,925 $3,761,925 $3,761,925
Public Access Defibrillators $158,000 $158,000 $158,000 $158,000 $158,000 $158,000 $158,000 $158,000 $158,000 $158,000
Truck Defibrillators $113,000 $113,000 $113,000 $113,000 $113,000 $113,000 $113,000 $113,000 $113,000 $113,000
Other Station Equipment (includig vehicle equipment) $4,555,994 $4,792,847 $5,007,796 $4,913,602 $5,171,696 $5,176,046 $5,114,271 $5,364,896 $5,488,721 $5,556,721
Mechanical Division Equipment $1,007,900 $1,007,900 $1,041,900 $1,151,900 $1,146,900 $1,172,900 $1,188,900 $1,208,900 $1,218,900 $1,245,100
Training Division Equipment $176,450 $176,450 $176,450 $176,450 $176,450 $186,450 $248,950 $307,950 $353,950 $1,689,550
Fire Prevention Division Equipment $132,450 $132,450 $132,450 $134,450 $134,450 $144,450 $149,450 $154,450 $154,450 $154,450
Total ($000) $11,146.5 $11,383.3 $11,694.9 $11,712.7 $12,018.0 $12,057.9 $12,193.2 $12,606.1 $12,801.6 $14,330.5
GENERATORS (FIXED EQUIPMENT)
Station Name 2008 2009 2010 2011 2012 2013 2014 2015 2016 2017
Station 7-1 (Thornhill) Generator $75,000 $75,000 $75,000 $75,000 $75,000 $75,000 $75,000 $75,000 $75,000 $75,000
Station 7-2 (Maple) Generator $75,000 $75,000 $75,000 $75,000 $75,000 $75,000 $75,000 $75,000 $75,000 $75,000
Station 7-3 (Woodbridge-old) Generator $75,000 $75,000 $75,000 $75,000 $75,000 $75,000 $75,000 $75,000 $75,000 $0
Station 7-3 (Woodbridge-new) Generator $0 $0 $0 $0 $0 $0 $0 $0 $0 $75,000
Station 7-4 (Kleinburg) Generator $0 $0 $0 $0 $0 $0 $0 $0 $0 $0
Station 7-5 (East Woodbridge) Generator $125,000 $125,000 $125,000 $125,000 $125,000 $125,000 $125,000 $125,000 $125,000 $125,000
Station 7-6 (Concord) Generator $0 $0 $0 $0 $0 $0 $0 $0 $0 $70,000
Station 7-7 (West Maple) Generator $75,000 $75,000 $75,000 $75,000 $75,000 $75,000 $75,000 $75,000 $75,000 $75,000
Station 7-8 (East Vaughan) Generator $125,000 $125,000 $125,000 $125,000 $125,000 $125,000 $125,000 $125,000 $125,000 $125,000
Station 7-9 (North Woodbridge) Generator $125,000 $125,000 $125,000 $125,000 $125,000 $125,000 $125,000 $125,000 $125,000 $125,000
Station 7-10 (Dufferin & Teston) Generator $0 $0 $0 $0 $75,000 $75,000 $75,000 $75,000 $75,000 $75,000
Total Cost ($000) $675.0 $675.0 $675.0 $675.0 $750.0 $750.0 $750.0 $750.0 $750.0 $820.0
BROADBAND UNIT COST
Station Name 2008 2009 2010 2011 2012 2013 2014 2015 2016 2017 ($/unit)
Station 7-1 (Thornhill) Fire Suppression Division 0 0 0 0 0 0 0 0 0 0 $1,782
Station 7-2 (Maple) Fire Suppression Division 0 0 0 0 0 0 0 0 0 0 $1,782
Station 7-3 (Woodbridge-new) Fire Suppression Division 0 0 0 0 0 0 0 0 0 3 $1,782
Station 7-4 (Kleinburg) Fire Suppression Division 0 0 0 0 0 0 0 0 0 0 $1,782
Station 7-5 (East Woodbridge) Fire Suppression Division 0 0 0 0 0 0 0 0 0 0 $1,782
Station 7-6 (Concord) Fire Suppression Division 0 0 0 0 0 0 0 0 0 0 $1,782
Station 7-7 (West Maple) Fire Suppression Division 0 0 0 0 0 0 0 0 0 0 $1,782
Station 7-8 (East Vaughan) Fire Suppression Division 0 0 0 0 0 0 0 0 0 0 $1,782
Station 7-9 (North Woodbridge) Fire Suppression Division 0 0 0 0 0 0 0 0 0 0 $1,782
Station 7-10 (Dufferin & Teston) 0 0 0 0 0 0 0 0 0 0 $1,782
Joint Operations Centre, Fire and Emergency Services 0 0 0 0 0 0 0 0 0 0 $1,782
Fire Department Headquarters 0 0 0 0 0 0 0 0 0 0 $1,782
Total (#) - - - - - - - - - 3.00
Total ($000) $0.0 $0.0 $0.0 $0.0 $0.0 $0.0 $0.0 $0.0 $0.0 $5.3
Total Value of Furniture & Equipment ($)
# of Access Points
Total Value of Generators in Fire Stations
APPENDIX DTABLE 1 - PAGE 3
HEMSON
HEMSON
103

APPENDIX DTABLE 1 - PAGE 4
CITY OF VAUGHANCALCULATION OF SERVICE LEVELS
FIRE AND RESCUE SERVICE
2008 2009 2010 2011 2012 2013 2014 2015 2016 2017
Historic Population 257,532 267,405 277,656 288,301 291,801 295,344 298,930 302,560 306,233 312,853
Historic Employment 159,495 164,208 169,304 174,816 181,268 187,958 194,896 202,089 209,549 214,748
Total Population & Employment 417,027 431,613 446,960 463,117 473,069 483,302 493,826 504,649 515,782 527,601
INVENTORY SUMMARY ($000)
Buildings $29,088.7 $36,605.1 $36,605.1 $36,605.1 $41,306.5 $41,306.5 $40,817.1 $41,212.1 $41,212.1 $43,851.2
Land $38,468.0 $59,590.1 $59,590.1 $59,590.1 $59,590.1 $59,590.1 $58,014.9 $58,014.9 $58,014.9 $60,472.3
Vehicles $21,845.0 $24,147.0 $24,897.0 $24,569.0 $25,209.0 $24,671.0 $24,686.0 $24,946.0 $25,141.0 $25,276.0
Furniture & Equipment $11,821.5 $12,058.3 $12,369.9 $12,387.7 $12,768.0 $12,807.9 $12,943.2 $13,356.1 $13,551.6 $15,150.5
Broadband $0.0 $0.0 $0.0 $0.0 $0.0 $0.0 $0.0 $0.0 $0.0 $5.3
Inventory Adjustment for Negative Reserve Fund Balance $0.0 $0.0 $0.0 $0.0 $0.0 $0.0 $0.0 $0.0 $0.0 ($3,456.1)
Total ($000) $101,223.2 $132,400.6 $133,462.2 $133,152.0 $138,873.7 $138,375.6 $136,461.2 $137,529.1 $137,919.6 $141,299.3
Average
SERVICE LEVEL ($/pop & emp) Service
Level
Buildings $69.75 $84.81 $81.90 $79.04 $87.32 $85.47 $82.65 $81.66 $79.90 $83.11 $81.56
Land $92.24 $138.06 $133.32 $128.67 $125.96 $123.30 $117.48 $114.96 $112.48 $114.62 $120.11
Vehicles $52.38 $55.95 $55.70 $53.05 $53.29 $51.05 $49.99 $49.43 $48.74 $47.91 $51.75
Furniture & Equipment $28.35 $27.94 $27.68 $26.75 $26.99 $26.50 $26.21 $26.47 $26.27 $28.72 $27.19
Broadband $0.00 $0.00 $0.00 $0.00 $0.00 $0.00 $0.00 $0.00 $0.00 $0.01 $0.00
Inventory Adjustment for Negative Reserve Fund Balance $0.00 $0.00 $0.00 $0.00 $0.00 $0.00 $0.00 $0.00 $0.00 ($6.55) ($0.66)
Total ($/pop & emp) $242.73 $306.76 $298.60 $287.51 $293.56 $286.31 $276.33 $272.52 $267.40 $267.81 $279.95
CITY OF VAUGHANCALCULATION OF MAXIMUM ALLOWABLEFIRE AND RESCUE SERVICE
10-Year Funding Envelope Calculation Excess Capacity Calculation
10 Year Average Service Level 2008 - 2017 $279.95 Total Value of Inventory in 2017 $141,299,290
Net Population & Employment Growth 2018 - 2027 109,088 Inventory Using Average Service Level $147,701,864
Maximum Allowable Funding Envelope $30,539,236 Excess Capacity $0
Less: Uncommitted Excess Capacity $0 Excess Capacity: Uncommitted
Discounted Maximum Allowable Funding Envelope $30,539,236
HEMSON
HEMSON
104
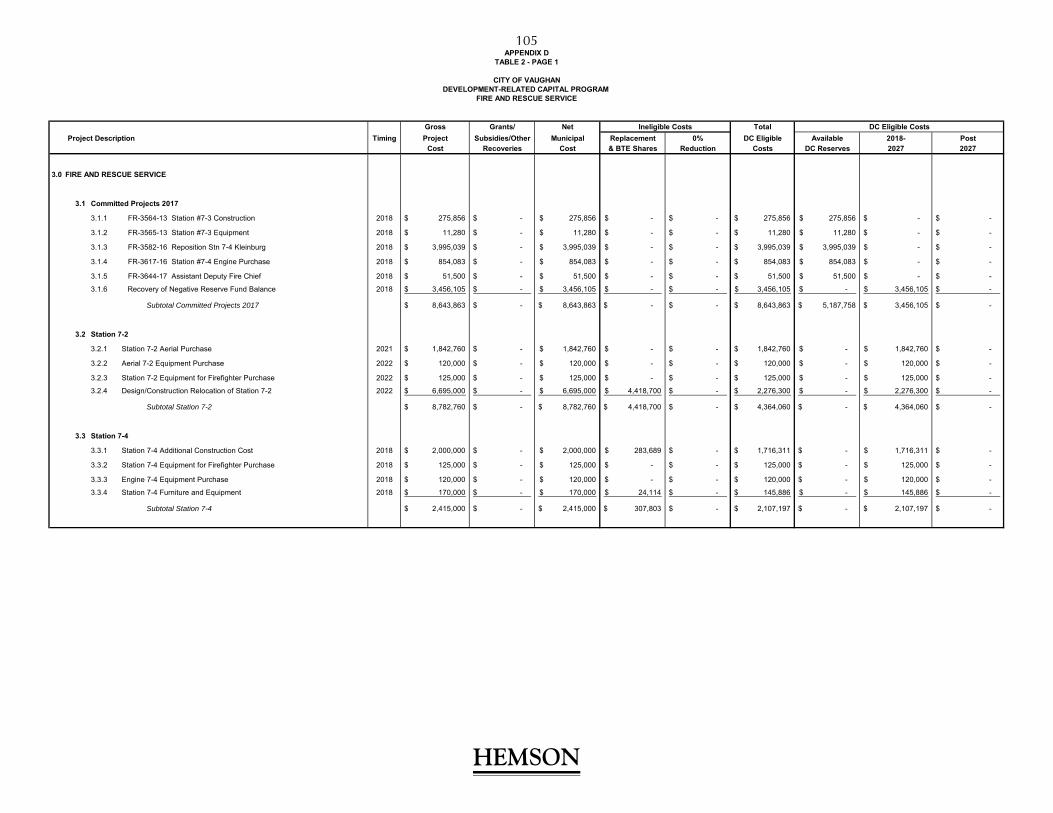
Gross Grants/ Net Total
Project Description Timing Project Subsidies/Other Municipal Replacement 0% DC Eligible Available 2018- PostCost Recoveries Cost & BTE Shares Reduction Costs DC Reserves 2027 2027
3.0 FIRE AND RESCUE SERVICE
3.1 Committed Projects 2017
3.1.1 FR-3564-13 Station #7-3 Construction 2018 275,856$ -$ 275,856$ -$ -$ 275,856$ 275,856$ -$ -$
3.1.2 FR-3565-13 Station #7-3 Equipment 2018 11,280$ -$ 11,280$ -$ -$ 11,280$ 11,280$ -$ -$
3.1.3 FR-3582-16 Reposition Stn 7-4 Kleinburg 2018 3,995,039$ -$ 3,995,039$ -$ -$ 3,995,039$ 3,995,039$ -$ -$
3.1.4 FR-3617-16 Station #7-4 Engine Purchase 2018 854,083$ -$ 854,083$ -$ -$ 854,083$ 854,083$ -$ -$
3.1.5 FR-3644-17 Assistant Deputy Fire Chief 2018 51,500$ -$ 51,500$ -$ -$ 51,500$ 51,500$ -$ -$
3.1.6 Recovery of Negative Reserve Fund Balance 2018 3,456,105$ -$ 3,456,105$ -$ -$ 3,456,105$ -$ 3,456,105$ -$
Subtotal Committed Projects 2017 8,643,863$ -$ 8,643,863$ -$ -$ 8,643,863$ 5,187,758$ 3,456,105$ -$
3.2 Station 7-2
3.2.1 Station 7-2 Aerial Purchase 2021 1,842,760$ -$ 1,842,760$ -$ -$ 1,842,760$ -$ 1,842,760$ -$
3.2.2 Aerial 7-2 Equipment Purchase 2022 120,000$ -$ 120,000$ -$ -$ 120,000$ -$ 120,000$ -$
3.2.3 Station 7-2 Equipment for Firefighter Purchase 2022 125,000$ -$ 125,000$ -$ -$ 125,000$ -$ 125,000$ -$
3.2.4 Design/Construction Relocation of Station 7-2 2022 6,695,000$ -$ 6,695,000$ 4,418,700$ -$ 2,276,300$ -$ 2,276,300$ -$
Subtotal Station 7-2 8,782,760$ -$ 8,782,760$ 4,418,700$ -$ 4,364,060$ -$ 4,364,060$ -$
3.3 Station 7-4
3.3.1 Station 7-4 Additional Construction Cost 2018 2,000,000$ -$ 2,000,000$ 283,689$ -$ 1,716,311$ -$ 1,716,311$ -$
3.3.2 Station 7-4 Equipment for Firefighter Purchase 2018 125,000$ -$ 125,000$ -$ -$ 125,000$ -$ 125,000$ -$
3.3.3 Engine 7-4 Equipment Purchase 2018 120,000$ -$ 120,000$ -$ -$ 120,000$ -$ 120,000$ -$
3.3.4 Station 7-4 Furniture and Equipment 2018 170,000$ -$ 170,000$ 24,114$ -$ 145,886$ -$ 145,886$ -$
Subtotal Station 7-4 2,415,000$ -$ 2,415,000$ 307,803$ -$ 2,107,197$ -$ 2,107,197$ -$
APPENDIX D
CITY OF VAUGHANDEVELOPMENT-RELATED CAPITAL PROGRAM
FIRE AND RESCUE SERVICE
TABLE 2 - PAGE 1
Ineligible Costs DC Eligible Costs
HEMSON
HEMSON
105
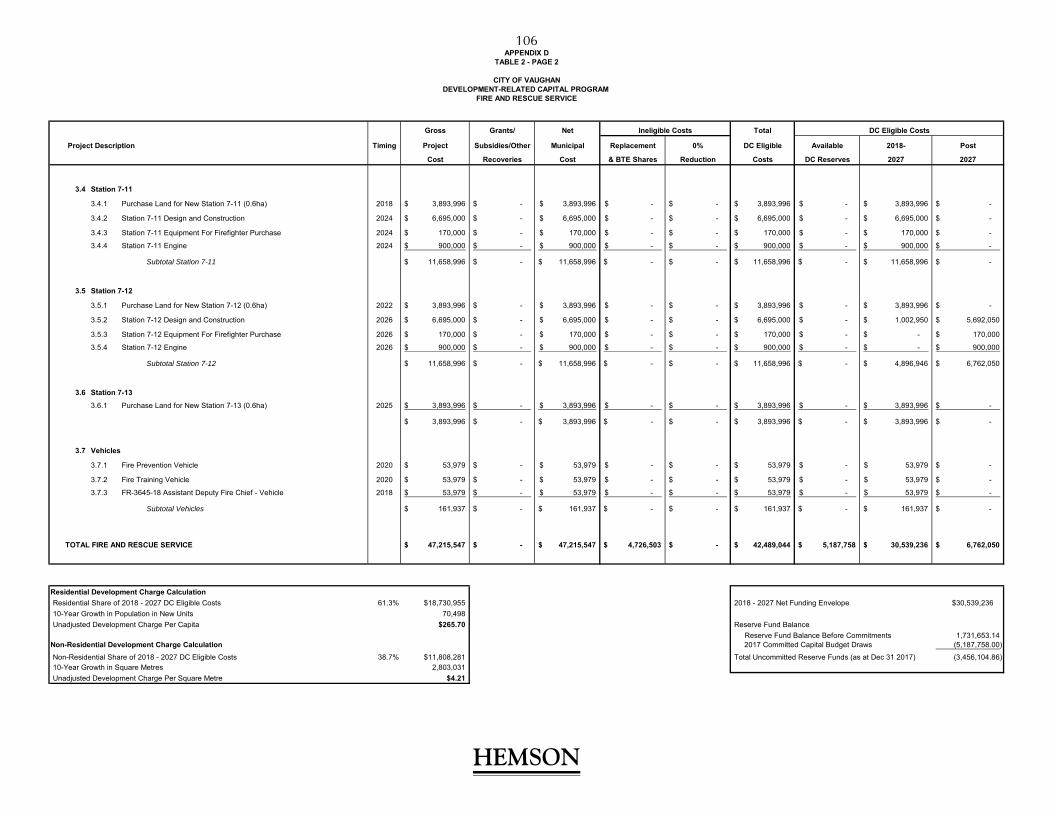
Gross Grants/ Net Total
Project Description Timing Project Subsidies/Other Municipal Replacement 0% DC Eligible Available 2018- Post
Cost Recoveries Cost & BTE Shares Reduction Costs DC Reserves 2027 2027
3.4 Station 7-11
3.4.1 Purchase Land for New Station 7-11 (0.6ha) 2018 3,893,996$ -$ 3,893,996$ -$ -$ 3,893,996$ -$ 3,893,996$ -$
3.4.2 Station 7-11 Design and Construction 2024 6,695,000$ -$ 6,695,000$ -$ -$ 6,695,000$ -$ 6,695,000$ -$
3.4.3 Station 7-11 Equipment For Firefighter Purchase 2024 170,000$ -$ 170,000$ -$ -$ 170,000$ -$ 170,000$ -$
3.4.4 Station 7-11 Engine 2024 900,000$ -$ 900,000$ -$ -$ 900,000$ -$ 900,000$ -$
Subtotal Station 7-11 11,658,996$ -$ 11,658,996$ -$ -$ 11,658,996$ -$ 11,658,996$ -$
3.5 Station 7-12
3.5.1 Purchase Land for New Station 7-12 (0.6ha) 2022 3,893,996$ -$ 3,893,996$ -$ -$ 3,893,996$ -$ 3,893,996$ -$
3.5.2 Station 7-12 Design and Construction 2026 6,695,000$ -$ 6,695,000$ -$ -$ 6,695,000$ -$ 1,002,950$ 5,692,050$
3.5.3 Station 7-12 Equipment For Firefighter Purchase 2026 170,000$ -$ 170,000$ -$ -$ 170,000$ -$ -$ 170,000$
3.5.4 Station 7-12 Engine 2026 900,000$ -$ 900,000$ -$ -$ 900,000$ -$ -$ 900,000$
Subtotal Station 7-12 11,658,996$ -$ 11,658,996$ -$ -$ 11,658,996$ -$ 4,896,946$ 6,762,050$
3.6 Station 7-13
3.6.1 Purchase Land for New Station 7-13 (0.6ha) 2025 3,893,996$ -$ 3,893,996$ -$ -$ 3,893,996$ -$ 3,893,996$ -$
3,893,996$ -$ 3,893,996$ -$ -$ 3,893,996$ -$ 3,893,996$ -$
3.7 Vehicles
3.7.1 Fire Prevention Vehicle 2020 53,979$ -$ 53,979$ -$ -$ 53,979$ -$ 53,979$ -$
3.7.2 Fire Training Vehicle 2020 53,979$ -$ 53,979$ -$ -$ 53,979$ -$ 53,979$ -$
3.7.3 FR-3645-18 Assistant Deputy Fire Chief - Vehicle 2018 53,979$ -$ 53,979$ -$ -$ 53,979$ -$ 53,979$ -$
Subtotal Vehicles 161,937$ -$ 161,937$ -$ -$ 161,937$ -$ 161,937$ -$
TOTAL FIRE AND RESCUE SERVICE 47,215,547$ -$ 47,215,547$ 4,726,503$ -$ 42,489,044$ 5,187,758$ 30,539,236$ 6,762,050$
Residential Development Charge Calculation
Residential Share of 2018 - 2027 DC Eligible Costs 61.3% $18,730,955 2018 - 2027 Net Funding Envelope $30,539,236
10-Year Growth in Population in New Units 70,498
Unadjusted Development Charge Per Capita $265.70 Reserve Fund Balance
Reserve Fund Balance Before Commitments 1,731,653.14 Non-Residential Development Charge Calculation 2017 Committed Capital Budget Draws (5,187,758.00)
Non-Residential Share of 2018 - 2027 DC Eligible Costs 38.7% $11,808,281 Total Uncommitted Reserve Funds (as at Dec 31 2017) (3,456,104.86) 10-Year Growth in Square Metres 2,803,031
Unadjusted Development Charge Per Square Metre $4.21
Ineligible Costs DC Eligible Costs
APPENDIX DTABLE 2 - PAGE 2
CITY OF VAUGHANDEVELOPMENT-RELATED CAPITAL PROGRAM
FIRE AND RESCUE SERVICE
HEMSON
HEMSON
106

APPENDIX DTABLE 3 - PAGE 1
FIRE AND RESCUE SERVICE 2018 2019 2020 2021 2022 2023 2024 2025 2026 2027 TOTAL
OPENING CASH BALANCE $0.0 ($3,774.3) ($1,914.4) $38.0 $728.5 ($1,642.2) $307.1 ($3,050.2) ($3,796.0) ($2,452.6)
2018 - 2027 RESIDENTIAL FUNDING REQUIREMENTS
- Fire And Rescue Service: Non Inflated $5,833.7 $0.0 $66.2 $1,130.2 $3,934.8 $0.0 $4,762.6 $2,388.3 $615.2 $0.0 $18,731.0
- Fire And Rescue Service: Inflated $5,833.7 $0.0 $68.9 $1,199.4 $4,259.1 $0.0 $5,363.5 $2,743.5 $720.7 $0.0 $20,188.7
NEW RESIDENTIAL DEVELOPMENT
- Population Growth in New Units 7,882 7,268 7,333 6,452 6,495 6,624 6,757 6,927 6,995 7,764 70,498
REVENUE
- DC Receipts: Inflated $2,160.3 $2,032.0 $2,091.2 $1,876.7 $1,927.0 $2,004.6 $2,085.5 $2,180.8 $2,246.3 $2,543.0 $21,147.5
INTEREST
- Interest on Opening Balance $0.0 ($207.6) ($105.3) $1.3 $25.5 ($90.3) $10.7 ($167.8) ($208.8) ($134.9) ($877.1)
- Interest on In-year Transactions ($101.0) $35.6 $35.4 $11.9 ($64.1) $35.1 ($90.1) ($15.5) $26.7 $44.5 ($81.7)
TOTAL REVENUE $2,059.3 $1,859.9 $2,021.3 $1,889.9 $1,888.4 $1,949.4 $2,006.1 $1,997.6 $2,064.2 $2,452.6 $20,188.7
CLOSING CASH BALANCE ($3,774.3) ($1,914.4) $38.0 $728.5 ($1,642.2) $307.1 ($3,050.2) ($3,796.0) ($2,452.6) $0.0
2018 Adjusted Charge Per Capita $274.08 Allocation of Capital ProgramResidential Sector 61.3%
Non-Residential Sector 38.7%
Rates for 2018
Inflation Rate 2.0%
Interest Rate on Positive Balances 3.5%
Interest Rate on Negative Balances 5.5%
FIRE AND RESCUE SERVICERESIDENTIAL DEVELOPMENT CHARGE
(in $000)
CITY OF VAUGHANCASHFLOW AND DETERMINATION OF DEVELOPMENT CHARGE
HEMSON
HEMSON
107
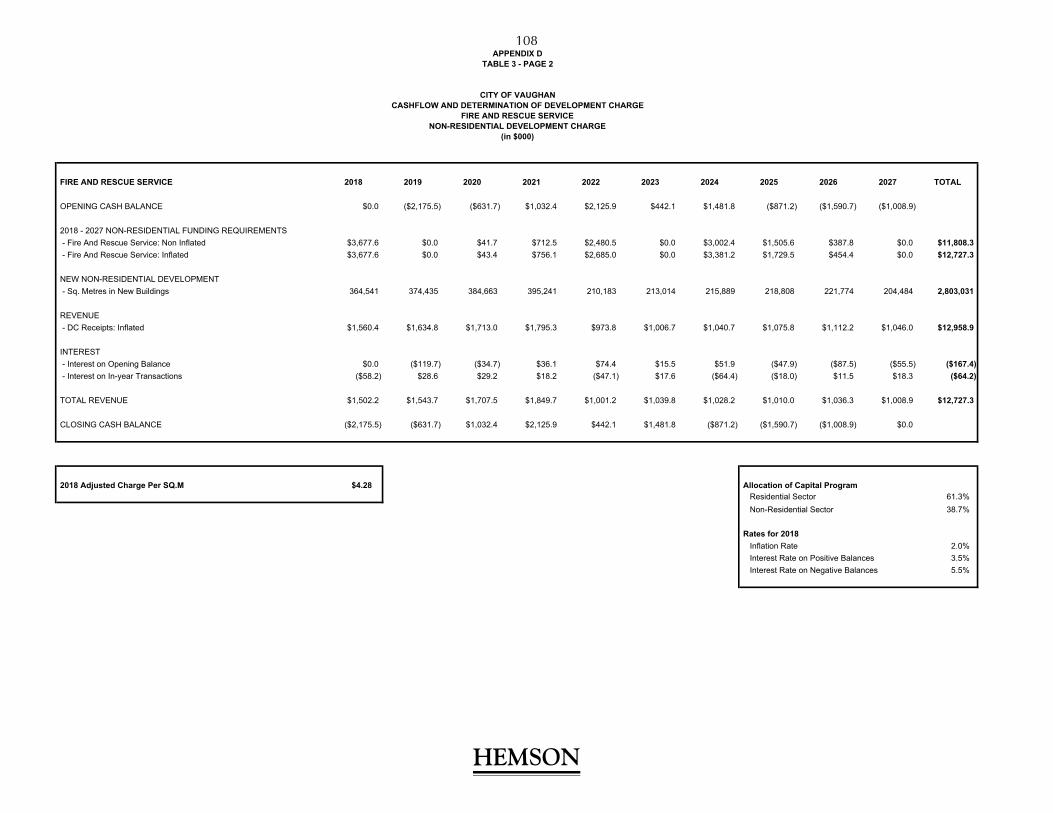
APPENDIX DTABLE 3 - PAGE 2
FIRE AND RESCUE SERVICE 2018 2019 2020 2021 2022 2023 2024 2025 2026 2027 TOTAL
OPENING CASH BALANCE $0.0 ($2,175.5) ($631.7) $1,032.4 $2,125.9 $442.1 $1,481.8 ($871.2) ($1,590.7) ($1,008.9)
2018 - 2027 NON-RESIDENTIAL FUNDING REQUIREMENTS
- Fire And Rescue Service: Non Inflated $3,677.6 $0.0 $41.7 $712.5 $2,480.5 $0.0 $3,002.4 $1,505.6 $387.8 $0.0 $11,808.3
- Fire And Rescue Service: Inflated $3,677.6 $0.0 $43.4 $756.1 $2,685.0 $0.0 $3,381.2 $1,729.5 $454.4 $0.0 $12,727.3
NEW NON-RESIDENTIAL DEVELOPMENT
- Sq. Metres in New Buildings 364,541 374,435 384,663 395,241 210,183 213,014 215,889 218,808 221,774 204,484 2,803,031
REVENUE
- DC Receipts: Inflated $1,560.4 $1,634.8 $1,713.0 $1,795.3 $973.8 $1,006.7 $1,040.7 $1,075.8 $1,112.2 $1,046.0 $12,958.9
INTEREST
- Interest on Opening Balance $0.0 ($119.7) ($34.7) $36.1 $74.4 $15.5 $51.9 ($47.9) ($87.5) ($55.5) ($167.4)
- Interest on In-year Transactions ($58.2) $28.6 $29.2 $18.2 ($47.1) $17.6 ($64.4) ($18.0) $11.5 $18.3 ($64.2)
TOTAL REVENUE $1,502.2 $1,543.7 $1,707.5 $1,849.7 $1,001.2 $1,039.8 $1,028.2 $1,010.0 $1,036.3 $1,008.9 $12,727.3
CLOSING CASH BALANCE ($2,175.5) ($631.7) $1,032.4 $2,125.9 $442.1 $1,481.8 ($871.2) ($1,590.7) ($1,008.9) $0.0
2018 Adjusted Charge Per SQ.M $4.28 Allocation of Capital ProgramResidential Sector 61.3%
Non-Residential Sector 38.7%
Rates for 2018
Inflation Rate 2.0%
Interest Rate on Positive Balances 3.5%
Interest Rate on Negative Balances 5.5%
FIRE AND RESCUE SERVICENON-RESIDENTIAL DEVELOPMENT CHARGE
(in $000)
CITY OF VAUGHANCASHFLOW AND DETERMINATION OF DEVELOPMENT CHARGE
HEMSON
HEMSON
108
APPENDIX E
COMMUNITY SERVICES
HEMSON
109

APPENDIX E
COMMUNITY SERVICES
Community Services combines indoor recreation and parks services in the City of Vaughan. Indoor recreation services are provided through the Recreation and Culture Department and are primarily delivered through community centres located in all areas of the City. Under the Development Charges Act, Cultural facilities are not eligible to be recovered through development charges and therefore are excluded from this study.
The City of Vaughan’s Parks and Forestry Department is responsible for providing parks, trails and outdoor recreation facilities in the City. Outdoor facilities include baseball diamonds, soccer fields, tennis courts, bocce courts, outdoor swimming pools, wading pools, water play equipment, outdoor rinks, basketball courts, playground equipment and other play courts.
TABLE 1 HISTORICAL SERVICE LEVELS
The City of Vaughan’s Community Services inventory is separated into twelve categories: Community Centre Space, Land, Equipment, Broadband, Animal Services, Activity Spaces, Parkland Development, Park Facilities, Special Facilities, Trails, Non-Road Vehicles and Parks Operation Buildings.
The City operates eleven main indoor recreation facilities which have a total area of nearly 1.1 million square feet and a replacement value of $402.7 million (page 4). This space includes indoor pools, gymnasiums, arenas, fitness centres, squash courts, indoor bocce courts, bowling alleys, program rooms and other space. Pages 1-4 includes a detailed breakdown of total space separated by function and facility. The land associated with the City’s eleven indoor recreation facilities totals 37 hectares with a value of $257.2 million (Page 5). Broadband equipment at the City’s recreation buildings adds another $107,000 to the cost of the inventory (Page 6).
Under the Community Services category, the City owns one animal shelter which has a total area of 6,700 square feet and a replacement value of $2.3 million. The land for this shelter amounts to 0.05 hectares with a total cost of $315,000. The equipment at
HEMSON
110

this animal shelter is valued at $600,000. In total, the animal services component of the inventory is valued at $3.2 million (Page 7).
The City also operates 24 activity spaces which have a total area of about 77,500 square feet and a replacement value of $27.1 million (Page 8). The land associated with the activity spaces totals 8.30 hectares with a value of $64.9 million (Page 9).
The City owns a substantial amount of equipment used to provide recreation services. This includes fitness equipment, ice resurfacers, operations equipment, audio/video equipment and furniture and miscellaneous equipment. The total replacement value of all indoor recreation equipment in 2017 is estimated at $6.5 million (Pages 10-22).
Vaughan’s 2017 inventory of parkland includes 366 hectares of neighbourhood parkland (Pages 23-27), 0.31 hectares of public squares (Page 28), 82 hectares of regional parkland (Page 29) and 110 hectares of district parkland (Page 30). The total cost of developing this parkland is estimated at $225.6 million (Page 32). The cost of parkland acquisition cannot be included in the development charges inventory as per the DCA.
The Parks and Forestry Department currently provides a total of 1,073 park facilities (and associated assets), the majority of which are sports related (Pages 33-58). The total replacement value of these park facilities is $149.6 million. Vaughan also has an inventory of special City-wide facilities valued at $16.3 million (Page 59). The City-owned Uplands Golf & Country Club (9 hole golf course) valued at $4.9 million comprises about a third of this amount. The City of Vaughan pedestrian and bicycle trail system add about $1.2 million to the inventory in 2017, which represents only those trails built by the City (Page 60).
The City of Vaughan owns 744 parks non-road vehicles in its fleet (Pages 61-87) and contracts about $1.5 million in vehicles. The combined total value of these vehicles (owned and contracted) is $22.3 million.
The Parks and Forestry department operates from four buildings: The Joint Operations Centre, the Woodbridge Works Building, the Dufferin Yard, and the MNR Parks Building (Page 88). The total area of the four buildings used by Parks and Forestry is 25,736 square feet with a replacement value of $8.0 million. The value of fixed equipment at these buildings is about $333,000. Parks and Forestry’s share of the land
HEMSON
111
associated with these buildings is approximately 3.6 hectares with a value of $20.9 million. In total, the value of the Parks Operations inventory is $29.2 million.
The combined value of capital assets for Community Services is valued at $1.21 billion (Page 89). The ten-year historical average service level is $4,038.71 per capita, and this, multiplied by the ten-year forecast of net population growth, results in a ten- year maximum allowable funding envelope of $270.2 million. No uncommitted excess capacity has been identified for this service.
Community Services is a service for which development-related capital costs must be reduced by 10 per cent under the DCA. The resulting net maximum allowable funding envelope brought forward to the development charges calculation is reduced to $243.2 million.
TABLE 2 2018 – 2027 PROVISIONAL DEVELOPMENT-RELATED CAPITAL PROGRAM & CALCULATION OF THE “UNADJUSTED” DEVELOPMENT CHARGES
The Community Services capital program is based on the 2018 Capital Budget, the 2017 Active Together Master Plan and discussions with City staff. The entire Community Services capital program is delineated into two sub-sections: Indoor Recreation and Park Development and Facilities.
Indoor Recreation
There are three projects pertaining to indoor recreation valued at $14.5 million which are considered to be committed projects in the City’s DC reserve and approved in the Capital Budget. These projects consist of the construction of the North Thornhill, Carrville and VMC Community Centres and after statutory deductions, $13.1 million is to be funded from the City’s Community Services DC reserve fund.
In addition to the committed project list, the construction of four additional community centres are included in the capital program located in Block 41, the VMC, Kleinburg and in Carville Centre. These Community Centres are expected to add new ice rinks, gymnasiums, fitness centres, and multi-purpose program space. The four new community centres are expected to be built at a combined cost $263.1 million (land and equipment inclusive). It should be noted that the assumed principal portions of the debenture payments associated with the VMC Community Centre have been
HEMSON
112

identified in the program; interest costs have been included in the cash flow calculations (see Table 3).
The capital program also includes a provision for the acquisition of land to accommodate the construction of two additional community centres in Block 27 ($17.8 million) and Vaughan Mills ($32.8 million) beyond the planning period.
The City also proposes to construct a new 20,000 square foot animal services facility at a cost of $10.5 million. As a result of this new facility, the existing animal services facility will be decommissioned and the replacement shares ($3.5 million) associated with the existing 6,700 square foot facility is considered in the calculation. The total gross program for the Indoor Recreation portion of the Community Services program amounts to $338.8 million.
Park Development and Facilities
The Community Services capital program also contains various new park developments which are considered to be committed projects in the City’s DC reserve and approved in the Capital Budget. These projects are valued at about $20.8 million and the largest share is related to the construction of the North Maple Regional Park valued at $3.5 million. Other significant projects include the development of Carrville Community Centre and District Park at a cost of $1.2 million and the construction of Block 40 Chatfield District Park at a cost of $3.0 million. After accounting for the 10% statutory deduction, $18.7 million of these committed projects is funded from the City’s available DC reserve fund ultimately reducing the uncommitted balance available for future projects.
Over the next ten-years, several new playing fields and playgrounds are planned to be built on the newly developed parkland. The capital program includes for the development of several new hectares of parkland at a cost of $78.4 million with new fields and playgrounds included at an additional cost of $39.5 million. Furthermore, the development-related capital program includes a provision of about $3.4 million for the expansion of the City’s managed trail network.
Two new operational facilities are included for development in the ten-year capital program: Dufferin Yard and a new North Operations Centre (NOC). The total cost of developing these facilities is estimated to be $24.6 million including the remaining cost of acquiring the land to accommodate the NOC. The Dufferin Yard project has
HEMSON
113

replacement shares valued at $340,000, which is deducted off the total project cost. New additions to the non-road fleets and related equipment category add another $5.1 million to the Park Development and Facilities portion of the Community Services capital program.
The total gross program for the Park Development and Facilities portion of the Community Services program amounts to $171.9 million.
Community Services Summary
The ten year capital forecast for Community Services totals $510.7 million. No provincial government grants or subsidies are anticipated to offset the cost of the program. Non-growth shares in the amount of $3.9 million related to the animal shelter and the Dufferin Yard is netted off the net municipal cost of the program. In addition, the legislated 10 per cent discount totals $50.7 million and is netted off of the net municipal costs, leaving $456.1 million as the total development related costs.
The total reserve fund balance before commitments is about $117.0 million, after considering the funds applied to the committed projects noted, approximately $85.2 million is available in the City’s uncommitted Community Services DC reserve fund to help offset the cost of the program. Lastly, $95.9 million, the portion of the development-related cost which exceeds the maximum allowable funding envelope, is deemed to benefit growth beyond 2027 and can be recovered through subsequent development charges studies.
The 2018–2027 DC costs eligible for recovery amount to $243.2 million, which is allocated entirely against future residential development in the City. This results in an unadjusted development charge of $3,449.77 per capita.
TABLE 3 CASH FLOW ANALYSIS
After cash flow consideration, the residential calculated charge increases to $3,658.97 per capita. The following table summarizes the calculation of the Community Services development charges.
HEMSON
114
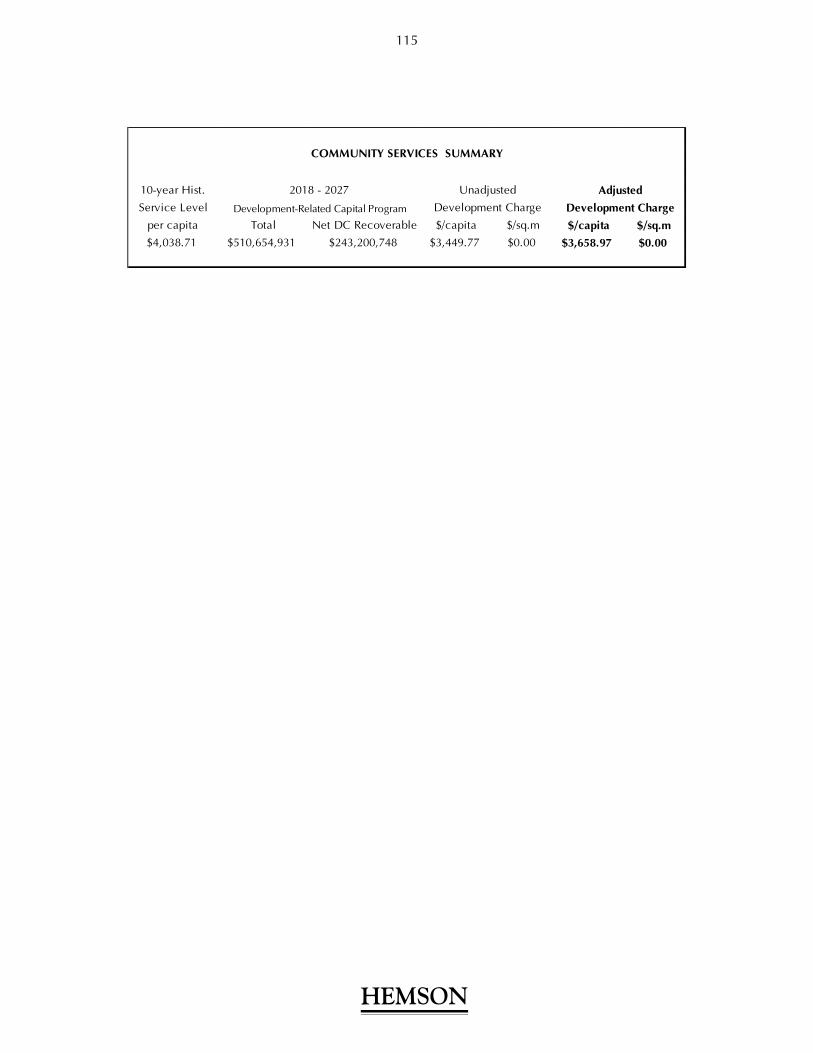
10-year Hist.
Service Level Development-Related Capital Program
per capita Total Net DC Recoverable $/capita $/sq.m $/capita $/sq.m
$4,038.71 $510,654,931 $243,200,748 $3,449.77 $0.00 $3,658.97 $0.00
Adjusted
COMMUNITY SERVICES SUMMARY
2018 - 2027
Development Charge Development Charge
Unadjusted
HEMSON
115
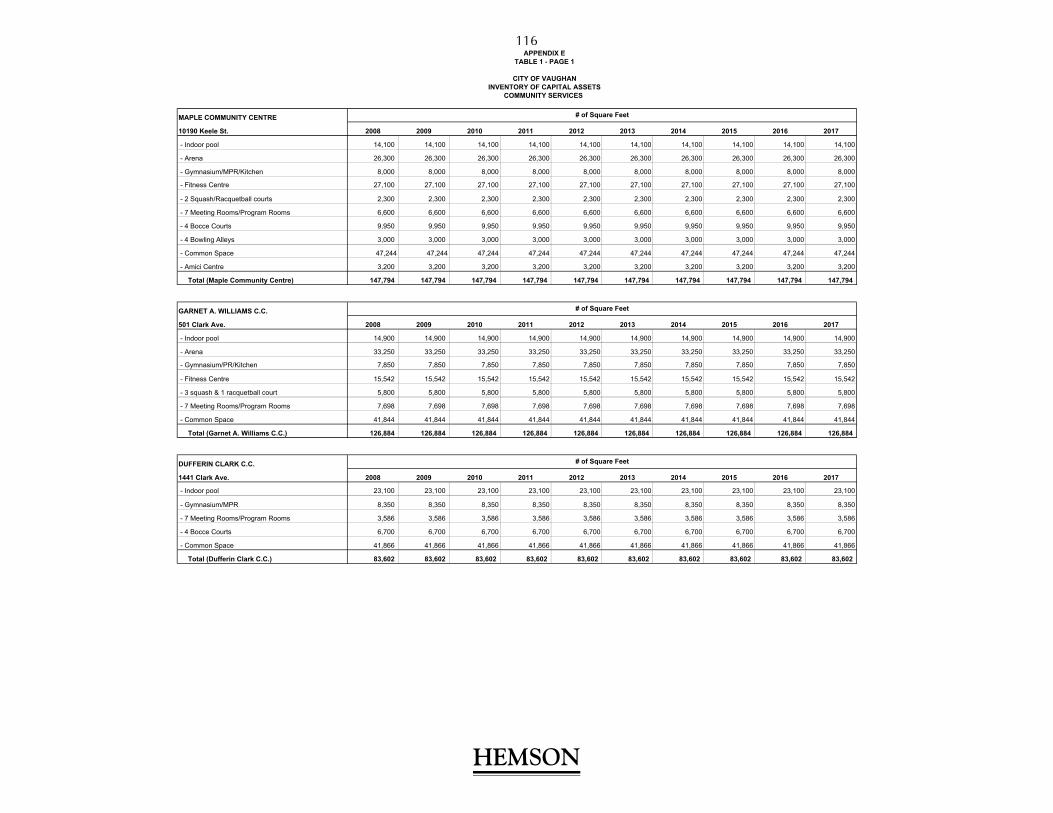
MAPLE COMMUNITY CENTRE
10190 Keele St. 2008 2009 2010 2011 2012 2013 2014 2015 2016 2017
- Indoor pool 14,100 14,100 14,100 14,100 14,100 14,100 14,100 14,100 14,100 14,100
- Arena 26,300 26,300 26,300 26,300 26,300 26,300 26,300 26,300 26,300 26,300
- Gymnasium/MPR/Kitchen 8,000 8,000 8,000 8,000 8,000 8,000 8,000 8,000 8,000 8,000
- Fitness Centre 27,100 27,100 27,100 27,100 27,100 27,100 27,100 27,100 27,100 27,100
- 2 Squash/Racquetball courts 2,300 2,300 2,300 2,300 2,300 2,300 2,300 2,300 2,300 2,300
- 7 Meeting Rooms/Program Rooms 6,600 6,600 6,600 6,600 6,600 6,600 6,600 6,600 6,600 6,600
- 4 Bocce Courts 9,950 9,950 9,950 9,950 9,950 9,950 9,950 9,950 9,950 9,950
- 4 Bowling Alleys 3,000 3,000 3,000 3,000 3,000 3,000 3,000 3,000 3,000 3,000
- Common Space 47,244 47,244 47,244 47,244 47,244 47,244 47,244 47,244 47,244 47,244
- Amici Centre 3,200 3,200 3,200 3,200 3,200 3,200 3,200 3,200 3,200 3,200
Total (Maple Community Centre) 147,794 147,794 147,794 147,794 147,794 147,794 147,794 147,794 147,794 147,794
GARNET A. WILLIAMS C.C.
501 Clark Ave. 2008 2009 2010 2011 2012 2013 2014 2015 2016 2017
- Indoor pool 14,900 14,900 14,900 14,900 14,900 14,900 14,900 14,900 14,900 14,900
- Arena 33,250 33,250 33,250 33,250 33,250 33,250 33,250 33,250 33,250 33,250
- Gymnasium/PR/Kitchen 7,850 7,850 7,850 7,850 7,850 7,850 7,850 7,850 7,850 7,850
- Fitness Centre 15,542 15,542 15,542 15,542 15,542 15,542 15,542 15,542 15,542 15,542
- 3 squash & 1 racquetball court 5,800 5,800 5,800 5,800 5,800 5,800 5,800 5,800 5,800 5,800
- 7 Meeting Rooms/Program Rooms 7,698 7,698 7,698 7,698 7,698 7,698 7,698 7,698 7,698 7,698
- Common Space 41,844 41,844 41,844 41,844 41,844 41,844 41,844 41,844 41,844 41,844
Total (Garnet A. Williams C.C.) 126,884 126,884 126,884 126,884 126,884 126,884 126,884 126,884 126,884 126,884
DUFFERIN CLARK C.C.
1441 Clark Ave. 2008 2009 2010 2011 2012 2013 2014 2015 2016 2017
- Indoor pool 23,100 23,100 23,100 23,100 23,100 23,100 23,100 23,100 23,100 23,100
- Gymnasium/MPR 8,350 8,350 8,350 8,350 8,350 8,350 8,350 8,350 8,350 8,350
- 7 Meeting Rooms/Program Rooms 3,586 3,586 3,586 3,586 3,586 3,586 3,586 3,586 3,586 3,586
- 4 Bocce Courts 6,700 6,700 6,700 6,700 6,700 6,700 6,700 6,700 6,700 6,700
- Common Space 41,866 41,866 41,866 41,866 41,866 41,866 41,866 41,866 41,866 41,866
Total (Dufferin Clark C.C.) 83,602 83,602 83,602 83,602 83,602 83,602 83,602 83,602 83,602 83,602
COMMUNITY SERVICES INVENTORY OF CAPITAL ASSETS
CITY OF VAUGHAN
# of Square Feet
# of Square Feet
TABLE 1 - PAGE 1APPENDIX E
# of Square Feet
HEMSON
HEMSON
116

INVENTORY OF CAPITAL ASSETS
Father Ermano Bulfon C.C.
8141 Martingrove Rd. 2008 2009 2010 2011 2012 2013 2014 2015 2016 2017
- Indoor pool 5,680 5,680 5,680 5,680 5,680 5,680 5,680 5,680 5,680 5,680
- Fitness Centre 3,588 3,588 3,588 3,588 3,588 3,588 3,588 3,588 3,588 3,588
- Gymnasium 6,797 6,797 6,797 6,797 6,797 6,797 6,797 6,797 6,797 6,797
- Youth Room 1,006 1,006 1,006 1,006 1,006 1,006 1,006 1,006 1,006 1,006
- Pre-school / children's room 1,006 1,006 1,006 1,006 1,006 1,006 1,006 1,006 1,006 1,006
- 3 Program Rooms 4,750 4,750 4,750 4,750 4,750 4,750 4,750 4,750 4,750 4,750
- 5 Bocce Courts 12,250 12,250 12,250 12,250 12,250 12,250 12,250 12,250 12,250 12,250
- Common Space 11,850 11,850 11,850 11,850 11,850 11,850 11,850 11,850 11,850 11,850
- Extend Senior Hall - staff and Kitchen 0 0 0 0 0 0 0 22,181 22,181 22,181
Total (Father E. Bulfon C.C.) 46,927 46,927 46,927 46,927 46,927 46,927 46,927 69,108 69,108 69,108
WOODBRIDGE POOL & MEMORIAL ARENA
5020 Highway #7 2008 2009 2010 2011 2012 2013 2014 2015 2016 2017
- Indoor pool 14,700 14,700 14,700 14,700 14,700 14,700 14,700 14,700 14,700 14,700
- Arena 24,900 24,900 24,900 24,900 24,900 24,900 24,900 24,900 24,900 24,900
- Memorial Hall/Kitchen 3,000 3,000 3,000 3,000 3,000 3,000 3,000 3,000 3,000 3,000
- Common Space 13,944 13,944 13,944 13,944 13,944 13,944 13,944 13,944 13,944 13,944
Total (W. Woodbridge Pool & Memorial Arena) 56,544 56,544 56,544 56,544 56,544 56,544 56,544 56,544 56,544 56,544
AL PALLADINI C.C. (sq. ft.)
9201 Islington Ave. 2008 2009 2010 2011 2012 2013 2014 2015 2016 2017
- Indoor pool 18,450 18,450 18,450 18,450 18,450 18,450 18,450 18,450 18,450 18,450
- Arena A 29,550 29,550 29,550 29,550 29,550 29,550 29,550 29,550 29,550 29,550
- Arena B 24,350 24,350 24,350 24,350 24,350 24,350 24,350 24,350 24,350 24,350
- Gymnasium/MPR/Kitchen 5,500 5,500 5,500 5,500 5,500 5,500 5,500 5,500 5,500 5,500
- Fitness Centre 17,950 17,950 17,950 17,950 17,950 17,950 17,950 17,950 17,950 17,950
- 2 Squash Courts 1,650 1,650 1,650 1,650 1,650 1,650 1,650 1,650 1,650 1,650
- 2 Meeting Rooms 2,250 2,250 2,250 2,250 2,250 2,250 2,250 2,250 2,250 2,250
- Common Space 43,985 43,985 43,985 43,985 43,985 43,985 43,985 43,985 43,985 43,985
Total (Al Palladini C.C.) 143,685 143,685 143,685 143,685 143,685 143,685 143,685 143,685 143,685 143,685
# of Square Feet
APPENDIX ETABLE 1 - PAGE 2
COMMUNITY SERVICES
CITY OF VAUGHAN
# of Square Feet
# of Square Feet
HEMSON
HEMSON
117
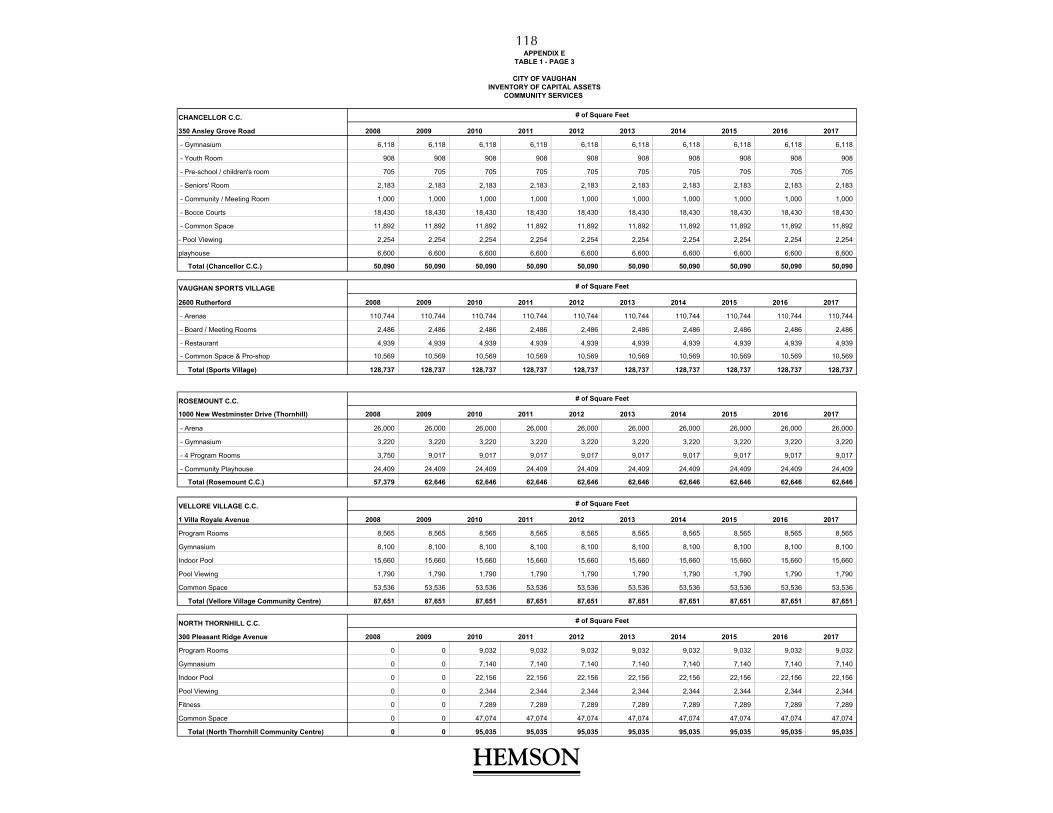
CHANCELLOR C.C.
350 Ansley Grove Road 2008 2009 2010 2011 2012 2013 2014 2015 2016 2017
- Gymnasium 6,118 6,118 6,118 6,118 6,118 6,118 6,118 6,118 6,118 6,118
- Youth Room 908 908 908 908 908 908 908 908 908 908
- Pre-school / children's room 705 705 705 705 705 705 705 705 705 705
- Seniors' Room 2,183 2,183 2,183 2,183 2,183 2,183 2,183 2,183 2,183 2,183
- Community / Meeting Room 1,000 1,000 1,000 1,000 1,000 1,000 1,000 1,000 1,000 1,000
- Bocce Courts 18,430 18,430 18,430 18,430 18,430 18,430 18,430 18,430 18,430 18,430
- Common Space 11,892 11,892 11,892 11,892 11,892 11,892 11,892 11,892 11,892 11,892
- Pool Viewing 2,254 2,254 2,254 2,254 2,254 2,254 2,254 2,254 2,254 2,254
playhouse 6,600 6,600 6,600 6,600 6,600 6,600 6,600 6,600 6,600 6,600
Total (Chancellor C.C.) 50,090 50,090 50,090 50,090 50,090 50,090 50,090 50,090 50,090 50,090
VAUGHAN SPORTS VILLAGE
2600 Rutherford 2008 2009 2010 2011 2012 2013 2014 2015 2016 2017
- Arenas 110,744 110,744 110,744 110,744 110,744 110,744 110,744 110,744 110,744 110,744
- Board / Meeting Rooms 2,486 2,486 2,486 2,486 2,486 2,486 2,486 2,486 2,486 2,486
- Restaurant 4,939 4,939 4,939 4,939 4,939 4,939 4,939 4,939 4,939 4,939
- Common Space & Pro-shop 10,569 10,569 10,569 10,569 10,569 10,569 10,569 10,569 10,569 10,569
Total (Sports Village) 128,737 128,737 128,737 128,737 128,737 128,737 128,737 128,737 128,737 128,737
ROSEMOUNT C.C.
1000 New Westminster Drive (Thornhill) 2008 2009 2010 2011 2012 2013 2014 2015 2016 2017
- Arena 26,000 26,000 26,000 26,000 26,000 26,000 26,000 26,000 26,000 26,000
- Gymnasium 3,220 3,220 3,220 3,220 3,220 3,220 3,220 3,220 3,220 3,220
- 4 Program Rooms 3,750 9,017 9,017 9,017 9,017 9,017 9,017 9,017 9,017 9,017
- Community Playhouse 24,409 24,409 24,409 24,409 24,409 24,409 24,409 24,409 24,409 24,409
Total (Rosemount C.C.) 57,379 62,646 62,646 62,646 62,646 62,646 62,646 62,646 62,646 62,646
VELLORE VILLAGE C.C.
1 Villa Royale Avenue 2008 2009 2010 2011 2012 2013 2014 2015 2016 2017
Program Rooms 8,565 8,565 8,565 8,565 8,565 8,565 8,565 8,565 8,565 8,565
Gymnasium 8,100 8,100 8,100 8,100 8,100 8,100 8,100 8,100 8,100 8,100
Indoor Pool 15,660 15,660 15,660 15,660 15,660 15,660 15,660 15,660 15,660 15,660
Pool Viewing 1,790 1,790 1,790 1,790 1,790 1,790 1,790 1,790 1,790 1,790
Common Space 53,536 53,536 53,536 53,536 53,536 53,536 53,536 53,536 53,536 53,536
Total (Vellore Village Community Centre) 87,651 87,651 87,651 87,651 87,651 87,651 87,651 87,651 87,651 87,651
NORTH THORNHILL C.C.
300 Pleasant Ridge Avenue 2008 2009 2010 2011 2012 2013 2014 2015 2016 2017
Program Rooms 0 0 9,032 9,032 9,032 9,032 9,032 9,032 9,032 9,032
Gymnasium 0 0 7,140 7,140 7,140 7,140 7,140 7,140 7,140 7,140
Indoor Pool 0 0 22,156 22,156 22,156 22,156 22,156 22,156 22,156 22,156
Pool Viewing 0 0 2,344 2,344 2,344 2,344 2,344 2,344 2,344 2,344
Fitness 0 0 7,289 7,289 7,289 7,289 7,289 7,289 7,289 7,289
Common Space 0 0 47,074 47,074 47,074 47,074 47,074 47,074 47,074 47,074
Total (North Thornhill Community Centre) 0 0 95,035 95,035 95,035 95,035 95,035 95,035 95,035 95,035
CITY OF VAUGHAN
COMMUNITY SERVICES INVENTORY OF CAPITAL ASSETS
# of Square Feet
# of Square Feet
# of Square Feet
# of Square Feet
# of Square Feet
APPENDIX ETABLE 1 - PAGE 3
HEMSON
HEMSON
118
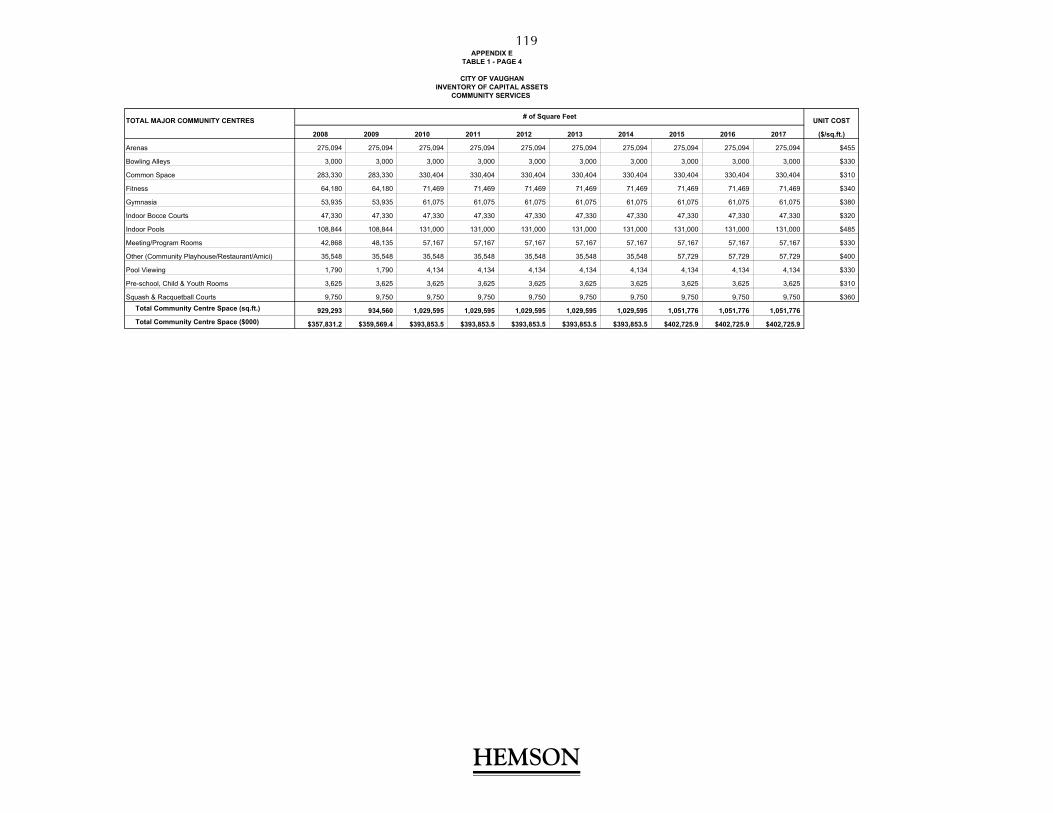
INVENTORY OF CAPITAL ASSETS
TOTAL MAJOR COMMUNITY CENTRES UNIT COST
2008 2009 2010 2011 2012 2013 2014 2015 2016 2017 ($/sq.ft.)
Arenas 275,094 275,094 275,094 275,094 275,094 275,094 275,094 275,094 275,094 275,094 $455
Bowling Alleys 3,000 3,000 3,000 3,000 3,000 3,000 3,000 3,000 3,000 3,000 $330
Common Space 283,330 283,330 330,404 330,404 330,404 330,404 330,404 330,404 330,404 330,404 $310
Fitness 64,180 64,180 71,469 71,469 71,469 71,469 71,469 71,469 71,469 71,469 $340
Gymnasia 53,935 53,935 61,075 61,075 61,075 61,075 61,075 61,075 61,075 61,075 $380
Indoor Bocce Courts 47,330 47,330 47,330 47,330 47,330 47,330 47,330 47,330 47,330 47,330 $320
Indoor Pools 108,844 108,844 131,000 131,000 131,000 131,000 131,000 131,000 131,000 131,000 $485
Meeting/Program Rooms 42,868 48,135 57,167 57,167 57,167 57,167 57,167 57,167 57,167 57,167 $330
Other (Community Playhouse/Restaurant/Amici) 35,548 35,548 35,548 35,548 35,548 35,548 35,548 57,729 57,729 57,729 $400
Pool Viewing 1,790 1,790 4,134 4,134 4,134 4,134 4,134 4,134 4,134 4,134 $330
Pre-school, Child & Youth Rooms 3,625 3,625 3,625 3,625 3,625 3,625 3,625 3,625 3,625 3,625 $310
Squash & Racquetball Courts 9,750 9,750 9,750 9,750 9,750 9,750 9,750 9,750 9,750 9,750 $360
Total Community Centre Space (sq.ft.) 929,293 934,560 1,029,595 1,029,595 1,029,595 1,029,595 1,029,595 1,051,776 1,051,776 1,051,776
Total Community Centre Space ($000) $357,831.2 $359,569.4 $393,853.5 $393,853.5 $393,853.5 $393,853.5 $393,853.5 $402,725.9 $402,725.9 $402,725.9
COMMUNITY SERVICES
# of Square Feet
APPENDIX ETABLE 1 - PAGE 4
CITY OF VAUGHAN
HEMSON
HEMSON
119
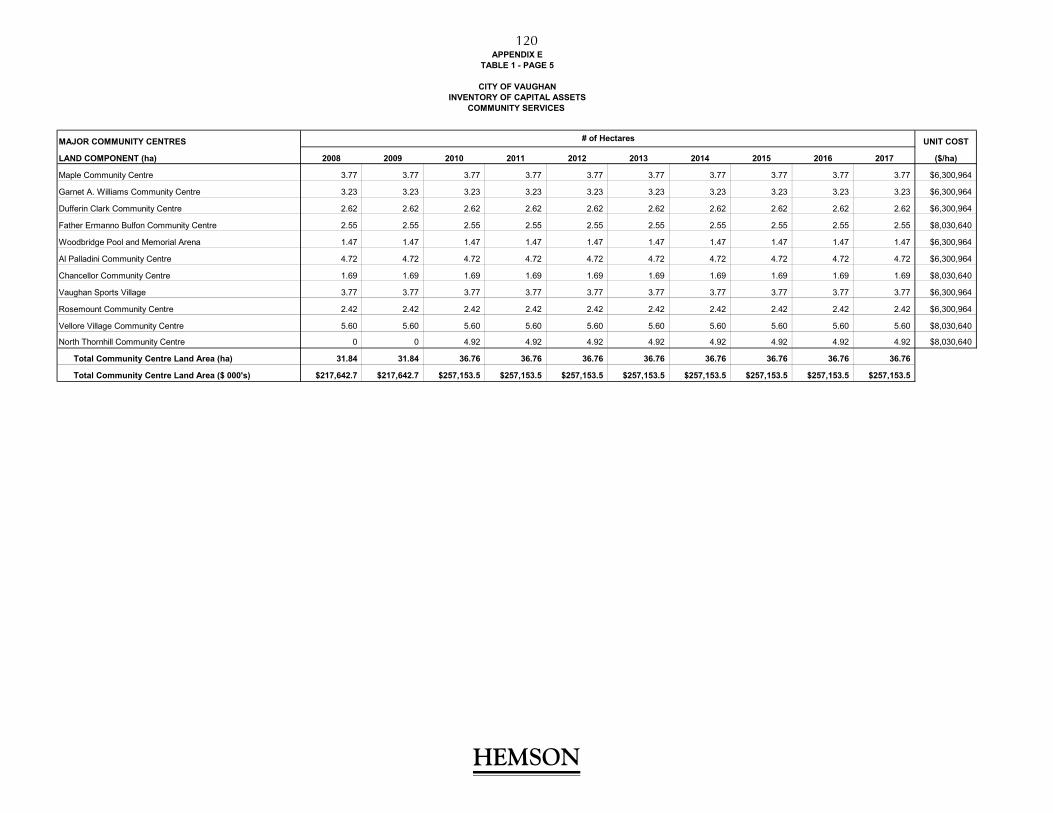
MAJOR COMMUNITY CENTRES UNIT COST
LAND COMPONENT (ha) 2008 2009 2010 2011 2012 2013 2014 2015 2016 2017 ($/ha)
Maple Community Centre 3.77 3.77 3.77 3.77 3.77 3.77 3.77 3.77 3.77 3.77 $6,300,964
Garnet A. Williams Community Centre 3.23 3.23 3.23 3.23 3.23 3.23 3.23 3.23 3.23 3.23 $6,300,964
Dufferin Clark Community Centre 2.62 2.62 2.62 2.62 2.62 2.62 2.62 2.62 2.62 2.62 $6,300,964
Father Ermanno Bulfon Community Centre 2.55 2.55 2.55 2.55 2.55 2.55 2.55 2.55 2.55 2.55 $8,030,640
Woodbridge Pool and Memorial Arena 1.47 1.47 1.47 1.47 1.47 1.47 1.47 1.47 1.47 1.47 $6,300,964
Al Palladini Community Centre 4.72 4.72 4.72 4.72 4.72 4.72 4.72 4.72 4.72 4.72 $6,300,964
Chancellor Community Centre 1.69 1.69 1.69 1.69 1.69 1.69 1.69 1.69 1.69 1.69 $8,030,640
Vaughan Sports Village 3.77 3.77 3.77 3.77 3.77 3.77 3.77 3.77 3.77 3.77 $6,300,964
Rosemount Community Centre 2.42 2.42 2.42 2.42 2.42 2.42 2.42 2.42 2.42 2.42 $6,300,964
Vellore Village Community Centre 5.60 5.60 5.60 5.60 5.60 5.60 5.60 5.60 5.60 5.60 $8,030,640
North Thornhill Community Centre 0 0 4.92 4.92 4.92 4.92 4.92 4.92 4.92 4.92 $8,030,640
Total Community Centre Land Area (ha) 31.84 31.84 36.76 36.76 36.76 36.76 36.76 36.76 36.76 36.76
Total Community Centre Land Area ($ 000's) $217,642.7 $217,642.7 $257,153.5 $257,153.5 $257,153.5 $257,153.5 $257,153.5 $257,153.5 $257,153.5 $257,153.5
# of Hectares
APPENDIX ETABLE 1 - PAGE 5
CITY OF VAUGHANINVENTORY OF CAPITAL ASSETS
COMMUNITY SERVICES
HEMSON
HEMSON
120

BROADBAND UNIT COST
Centre Name 2008 2009 2010 2011 2012 2013 2014 2015 2016 2017 ($/unit)
Garnett A. Williams Community Centre 0 0 0 0 0 0 0 7 7 7 $1,782
Dufferin Clark Community Centre 0 0 0 0 0 0 6 6 6 6 $1,782
Father Ermano Bulfon Community Centre 0 0 0 0 0 0 0 0 6 6 $1,782
Woodbridge Pool & Memorial Arena 0 0 0 0 0 0 0 0 7 7 $1,782
Al Palladini Community Centre 0 0 0 0 0 0 0 7 7 7 $1,782
Chancellor Community Centre 0 0 0 0 0 0 0 5 5 5 $1,782
Rosemount Community Centre 0 0 0 0 0 0 0 4 4 4 $1,782
Vellore Village Community Centre 0 0 0 0 0 0 10 10 10 10 $1,782
North Thornhill Community Centre 0 0 0 0 0 0 8 8 8 8 $1,782
Sub-total (#) - - - - - - 24 47 60 60
Sub-total ($000) $0.0 $0.0 $0.0 $0.0 $0.0 $0.0 $42.8 $83.8 $106.9 $106.9
# of Access Points
APPENDIX ETABLE 1 - PAGE 6
CITY OF VAUGHANINVENTORY OF CAPITAL ASSETS
COMMUNITY SERVICES
HEMSON
HEMSON
121

BUILDING UNIT COST
Facility Name 2008 2009 2010 2011 2012 2013 2014 2015 2016 2017 ($/sq.ft.)
Animal Shelter (70 Tigi Crt., Units 45-47) 6,700 6,700 6,700 6,700 6,700 6,700 6,700 6,700 6,700 6,700 $340
- Total Community Service Facility Space (sq.ft.) 6,700 6,700 6,700 6,700 6,700 6,700 6,700 6,700 6,700 6,700
- Total Community Service Facility Space ($000) $2,278.0 $2,278.0 $2,278.0 $2,278.0 $2,278.0 $2,278.0 $2,278.0 $2,278.0 $2,278.0 $2,278.0
LAND UNIT COST
Facility Name 2008 2009 2010 2011 2012 2013 2014 2015 2016 2017 ($/ha)
Animal Shelter - 70 Tigi Crt 0.05 0.05 0.05 0.05 0.05 0.05 0.05 0.05 0.05 0.05 $6,300,964
- Total Community Service Facility Land (ha.) 0.05 0.05 0.05 0.05 0.05 0.05 0.05 0.05 0.05 0.05
- Total Community Service Facility Land ($000) $315.0 $315.0 $315.0 $315.0 $315.0 $315.0 $315.0 $315.0 $315.0 $315.0
EQUIPMENT
Facility Name 2008 2009 2010 2011 2012 2013 2014 2015 2016 2017
Animal Shelter - 70 Tigi Crt $0 $0 $0 $190,880 $196,880 $233,330 $219,530 $234,655 $393,935 $599,835
Total Cost ($000) $0.0 $0.0 $0.0 $190.9 $196.9 $233.3 $219.5 $234.7 $393.9 $599.8
Total Animal Services ($000) $2,593 $2,593 $2,593 $2,784 $2,790 $2,826 $2,813 $2,828 $2,987 $3,193
# of Square Feet
# of Square Feet
Total Equipment Value
ANIMAL SERVICES
APPENDIX ETABLE 1 - PAGE 7
CITY OF VAUGHANINVENTORY OF CAPITAL ASSETS
COMMUNITY SERVICES
HEMSON
HEMSON
122
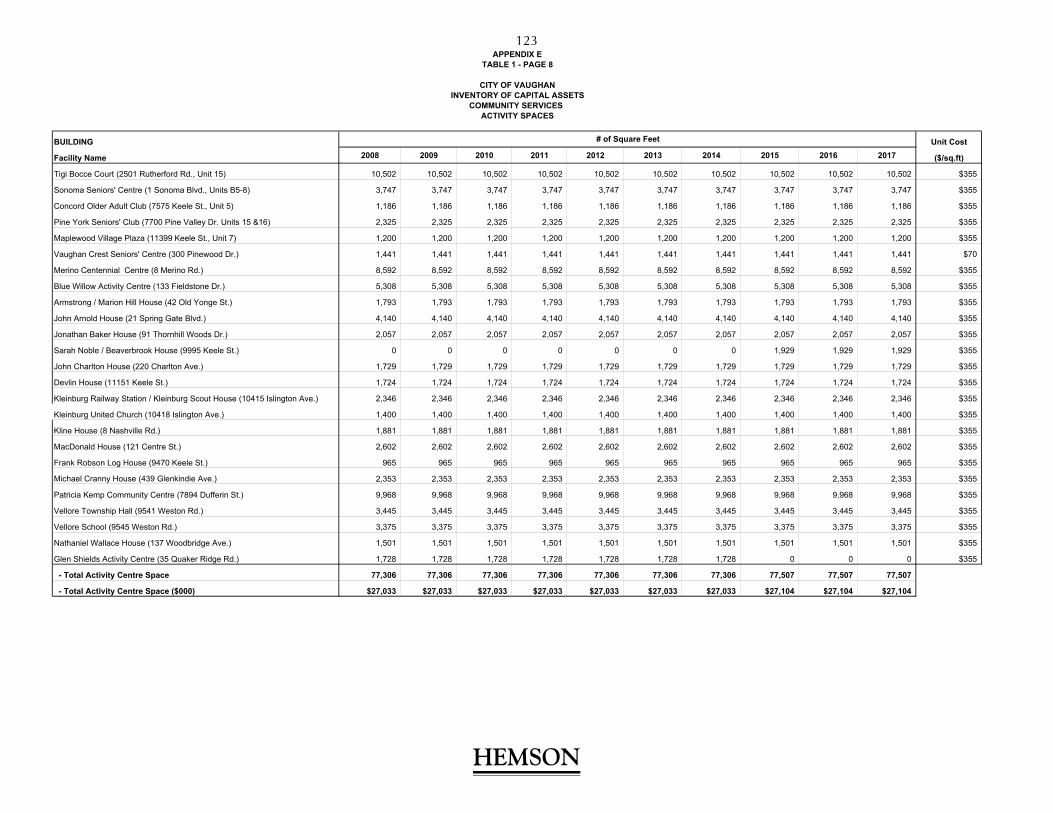
BUILDING Unit Cost
Facility Name 2008 2009 2010 2011 2012 2013 2014 2015 2016 2017 ($/sq.ft)
Tigi Bocce Court (2501 Rutherford Rd., Unit 15) 10,502 10,502 10,502 10,502 10,502 10,502 10,502 10,502 10,502 10,502 $355
Sonoma Seniors' Centre (1 Sonoma Blvd., Units B5-8) 3,747 3,747 3,747 3,747 3,747 3,747 3,747 3,747 3,747 3,747 $355
Concord Older Adult Club (7575 Keele St., Unit 5) 1,186 1,186 1,186 1,186 1,186 1,186 1,186 1,186 1,186 1,186 $355
Pine York Seniors' Club (7700 Pine Valley Dr. Units 15 &16) 2,325 2,325 2,325 2,325 2,325 2,325 2,325 2,325 2,325 2,325 $355
Maplewood Village Plaza (11399 Keele St., Unit 7) 1,200 1,200 1,200 1,200 1,200 1,200 1,200 1,200 1,200 1,200 $355
Vaughan Crest Seniors' Centre (300 Pinewood Dr.) 1,441 1,441 1,441 1,441 1,441 1,441 1,441 1,441 1,441 1,441 $70
Merino Centennial Centre (8 Merino Rd.) 8,592 8,592 8,592 8,592 8,592 8,592 8,592 8,592 8,592 8,592 $355
Blue Willow Activity Centre (133 Fieldstone Dr.) 5,308 5,308 5,308 5,308 5,308 5,308 5,308 5,308 5,308 5,308 $355
Armstrong / Marion Hill House (42 Old Yonge St.) 1,793 1,793 1,793 1,793 1,793 1,793 1,793 1,793 1,793 1,793 $355
John Arnold House (21 Spring Gate Blvd.) 4,140 4,140 4,140 4,140 4,140 4,140 4,140 4,140 4,140 4,140 $355
Jonathan Baker House (91 Thornhill Woods Dr.) 2,057 2,057 2,057 2,057 2,057 2,057 2,057 2,057 2,057 2,057 $355
Sarah Noble / Beaverbrook House (9995 Keele St.) 0 0 0 0 0 0 0 1,929 1,929 1,929 $355
John Charlton House (220 Charlton Ave.) 1,729 1,729 1,729 1,729 1,729 1,729 1,729 1,729 1,729 1,729 $355
Devlin House (11151 Keele St.) 1,724 1,724 1,724 1,724 1,724 1,724 1,724 1,724 1,724 1,724 $355
Kleinburg Railway Station / Kleinburg Scout House (10415 Islington Ave.) 2,346 2,346 2,346 2,346 2,346 2,346 2,346 2,346 2,346 2,346 $355
Kleinburg United Church (10418 Islington Ave.) 1,400 1,400 1,400 1,400 1,400 1,400 1,400 1,400 1,400 1,400 $355
Kline House (8 Nashville Rd.) 1,881 1,881 1,881 1,881 1,881 1,881 1,881 1,881 1,881 1,881 $355
MacDonald House (121 Centre St.) 2,602 2,602 2,602 2,602 2,602 2,602 2,602 2,602 2,602 2,602 $355
Frank Robson Log House (9470 Keele St.) 965 965 965 965 965 965 965 965 965 965 $355
Michael Cranny House (439 Glenkindie Ave.) 2,353 2,353 2,353 2,353 2,353 2,353 2,353 2,353 2,353 2,353 $355
Patricia Kemp Community Centre (7894 Dufferin St.) 9,968 9,968 9,968 9,968 9,968 9,968 9,968 9,968 9,968 9,968 $355
Vellore Township Hall (9541 Weston Rd.) 3,445 3,445 3,445 3,445 3,445 3,445 3,445 3,445 3,445 3,445 $355
Vellore School (9545 Weston Rd.) 3,375 3,375 3,375 3,375 3,375 3,375 3,375 3,375 3,375 3,375 $355
Nathaniel Wallace House (137 Woodbridge Ave.) 1,501 1,501 1,501 1,501 1,501 1,501 1,501 1,501 1,501 1,501 $355
Glen Shields Activity Centre (35 Quaker Ridge Rd.) 1,728 1,728 1,728 1,728 1,728 1,728 1,728 0 0 0 $355
- Total Activity Centre Space 77,306 77,306 77,306 77,306 77,306 77,306 77,306 77,507 77,507 77,507
- Total Activity Centre Space ($000) $27,033 $27,033 $27,033 $27,033 $27,033 $27,033 $27,033 $27,104 $27,104 $27,104
# of Square Feet
APPENDIX ETABLE 1 - PAGE 8
CITY OF VAUGHANINVENTORY OF CAPITAL ASSETS
COMMUNITY SERVICES ACTIVITY SPACES
HEMSON
HEMSON
123

LAND UNIT COST
Facility Name 2008 2009 2010 2011 2012 2013 2014 2015 2016 2017 ($/ha)
Tigi Bocce Court (2501 Rutherford Rd., Unit 15) 0.10 0.10 0.10 0.10 0.10 0.10 0.10 0.10 0.10 0.10 $6,300,964
Sonoma Seniors' Centre (1 Sonoma Blvd., Units B5-8) 0.03 0.03 0.03 0.03 0.03 0.03 0.03 0.03 0.03 0.03 $6,300,964
Concord Older Adult Club (7575 Keele St., Unit 5) 0.01 0.01 0.01 0.01 0.01 0.01 0.01 0.01 0.01 0.01 $6,300,964
Pine York Seniors' Club (7700 Pine Valley Dr. Units 15 &16) 0.02 0.02 0.02 0.02 0.02 0.02 0.02 0.02 0.02 0.02 $6,300,964
Maplewood Village Plaza (11399 Keele St., Unit 7) 0.01 0.01 0.01 0.01 0.01 0.01 0.01 0.01 0.01 0.01 $6,300,964
Vaughan Crest Seniors' Centre (300 Pinewood Dr.) 0.01 0.01 0.01 0.01 0.01 0.01 0.01 0.01 0.01 0.01 $8,030,640
Merino Centennial Centre (8 Merino Rd.) 0.27 0.27 0.27 0.27 0.27 0.27 0.27 0.27 0.27 0.27 $8,030,640
Blue Willow Activity Centre (133 Fieldstone Dr.) 0.80 0.80 0.80 0.80 0.80 0.80 0.80 0.80 0.80 0.80 $8,030,640
Armstrong / Marion Hill House (42 Old Yonge St.) 0.22 0.22 0.22 0.22 0.22 0.22 0.22 0.22 0.22 0.22 $8,030,640
John Arnold House (21 Spring Gate Blvd.) 0.20 0.20 0.20 0.20 0.20 0.20 0.20 0.20 0.20 0.20 $8,030,640
Jonathan Baker House (91 Thornhill Woods Dr.) 0.25 0.25 0.25 0.25 0.25 0.25 0.25 0.25 0.25 0.25 $8,030,640
Sarah Noble / Beaverbrook House (9995 Keele St.) 0.18 0.18 0.18 0.18 0.18 0.18 0.18 0.18 0.18 0.18 $6,300,964
John Charlton House (220 Charlton Ave.) 0.58 0.58 0.58 0.58 0.58 0.58 0.58 0.58 0.58 0.58 $8,030,640
Devlin House (11151 Keele St.) 3.99 3.99 3.99 3.99 3.99 3.99 3.99 3.99 3.99 3.99 $8,030,640
Kleinburg Railway Station / Kleinburg Scout House (10415 Islington Ave.) 0.02 0.02 0.02 0.02 0.02 0.02 0.02 0.02 0.02 0.02 $8,030,640
Kleinburg United Church (10418 Islington Ave.) 0.27 0.27 0.27 0.27 0.27 0.27 0.27 0.27 0.27 0.27 $8,030,640
Kline House (8 Nashville Rd.) 0.04 0.04 0.04 0.04 0.04 0.04 0.04 0.04 0.04 0.04 $6,300,964
MacDonald House (121 Centre St.) 0.15 0.15 0.15 0.15 0.15 0.15 0.15 0.15 0.15 0.15 $8,030,640
Frank Robson Log House (9470 Keele St.) 0.01 0.01 0.01 0.01 0.01 0.01 0.01 0.01 0.01 0.01 $8,030,640
Michael Cranny House (439 Glenkindie Ave.) 0.21 0.21 0.21 0.21 0.21 0.21 0.21 0.21 0.21 0.21 $8,030,640
Patricia Kemp Community Centre (7894 Dufferin St.) 0.23 0.23 0.23 0.23 0.23 0.23 0.23 0.23 0.23 0.23 $8,030,640
Vellore Township Hall (9541 Weston Rd.) 0.63 0.63 0.63 0.63 0.63 0.63 0.63 0.63 0.63 0.63 $6,300,964
Vellore School (9545 Weston Rd.) 0.00 0.00 0.00 0.00 0.00 0.00 0.00 0.00 0.00 0.00 $6,300,964
Nathaniel Wallace House (137 Woodbridge Ave.) 0.05 0.05 0.05 0.05 0.05 0.05 0.05 0.05 0.05 0.05 $8,030,640
Glen Shields Activity Centre (35 Quaker Ridge Rd.) 0.02 0.02 0.02 0.02 0.02 0.02 0.02 0.02 0.02 0.02 $8,030,640
Total Activity Space Land Area (ha) 8.30 8.30 8.30 8.30 8.30 8.30 8.30 8.30 8.30 8.30
Total Activity Space Land Area ($000) $64,890.0 $64,890.0 $64,890.0 $64,890.0 $64,890.0 $64,890.0 $64,890.0 $64,890.0 $64,890.0 $64,890.0
# of Hectares
APPENDIX ETABLE 1 - PAGE 9
CITY OF VAUGHANINVENTORY OF CAPITAL ASSETS
COMMUNITY SERVICES ACTIVITY SPACES
HEMSON
HEMSON
124

CITY OF VAUGHANINVENTORY OF CAPITAL ASSETS
COMMUNITY SERVICES COMMUNITY CENTRE FITNESS EQUIPMENT
Equipment by Centre* 2008 2009 2010 2011 2012 2013 2014 2015 2016 2017
Garnet A. Williams C. C. $671,960 $755,922 $787,257 $810,377 $811,370 $796,565 $826,063 $900,992 $655,969 $923,456
Al Palladini Community Centre $565,021 $660,997 $692,471 $711,011 $738,060 $803,106 $843,707 $900,589 $672,303 $887,007
Father Ermanno Bulfon Community Centre $310,438 $332,178 $361,561 $350,843 $352,571 $376,221 $367,560 $556,869 $329,962 $386,626
Maple Community Centre $710,986 $800,548 $828,128 $849,749 $855,756 $914,737 $947,042 $995,004 $700,387 $954,423
North Thornhill Community Centre $6,035 $6,035 $381,445 $387,629 $392,216 $412,370 $436,472 $450,407 $428,403 $428,403
Vellore Village Community Centre $0 $0 $0 $0 $0 $291,062 $291,062 $294,788 $310,282 $310,282
Total Value All Fitness Equipment (000$) $2,264.4 $2,555.7 $3,050.9 $3,109.6 $3,150.0 $3,594.1 $3,711.9 $4,098.7 $3,097.3 $3,890.2
*This value accounts for items such as: stairmasters, lifefitness equipment, etc.
APPENDIX ETABLE 1 - PAGE 10
Total Value of Fitness Equipment
HEMSON
HEMSON
125

CITY OF VAUGHANINVENTORY OF CAPITAL ASSETS
COMMUNITY SERVICES OPERATIONS EQUIPMENT
COMMUNITY CENTRE OPERATIONS EQUIPMENT UNIT COST
2008 2009 2010 2011 2012 2013 2014 2015 2016 2017 ($/item)
Ice Resurfaces 10 10 11 11 11 11 11 11 11 11 $99,100
Ice Edgers 7 7 7 9 9 9 9 9 9 9 $5,860
V-Plows 4 5 5 5 5 5 5 5 5 $7,320
Portable Ice Painting Machine 1 1 1 1 1 1 1 1 1 1 $11,360
Nets & Pins 5 5 5 5 5 5 5 5 5 5 $2,110
Electronic Scoreboards 4 4 6 6 6 6 6 6 6 6 $14,100
Skate Sharpening Machine 1 1 1 1 1 1 1 1 1 1 $14,890
Forklift 1 1 1 1 1 1 1 1 1 1 $20,650
Floor Scrubber 1 1 1 1 1 1 1 1 1 1 $7,350
Auto Scrubbers 7 7 9 9 9 9 9 9 9 9 $15,890
Burnishers 3 3 3 3 3 3 3 3 3 3 $11,130
Carpet Cleaners 2 2 2 2 2 2 2 2 2 2 $5,080
Swing Scrubbers 9 9 10 10 10 10 10 10 10 10 $3,180
Roto Wash 1 1 1 1 1 1 1 1 1 1 $5,560
Vacuum Cleaners 12 12 12 12 12 12 12 12 12 12 $1,590
Pressure Washers 7 7 8 8 8 8 8 8 8 8 $1,900
Manlifts 6 6 8 8 8 8 8 8 8 8 $19,070
Portable Radio Sets 7 7 8 8 8 8 8 8 8 8 $6,350
AED Defibrilators 23 44 44 44 44 44 44 44 44 44 $3,380
Sub-total (#) 107 132 143 145 145 145 145 145 145 145
Sub-total ($000) $1,611.2 $1,711.4 $1,927.4 $1,939.1 $1,939.1 $1,939.1 $1,939.1 $1,939.1 $1,939.1 $1,939.1
# of Equipment
TABLE 1 - PAGE 11APPENDIX E
HEMSON
HEMSON
126
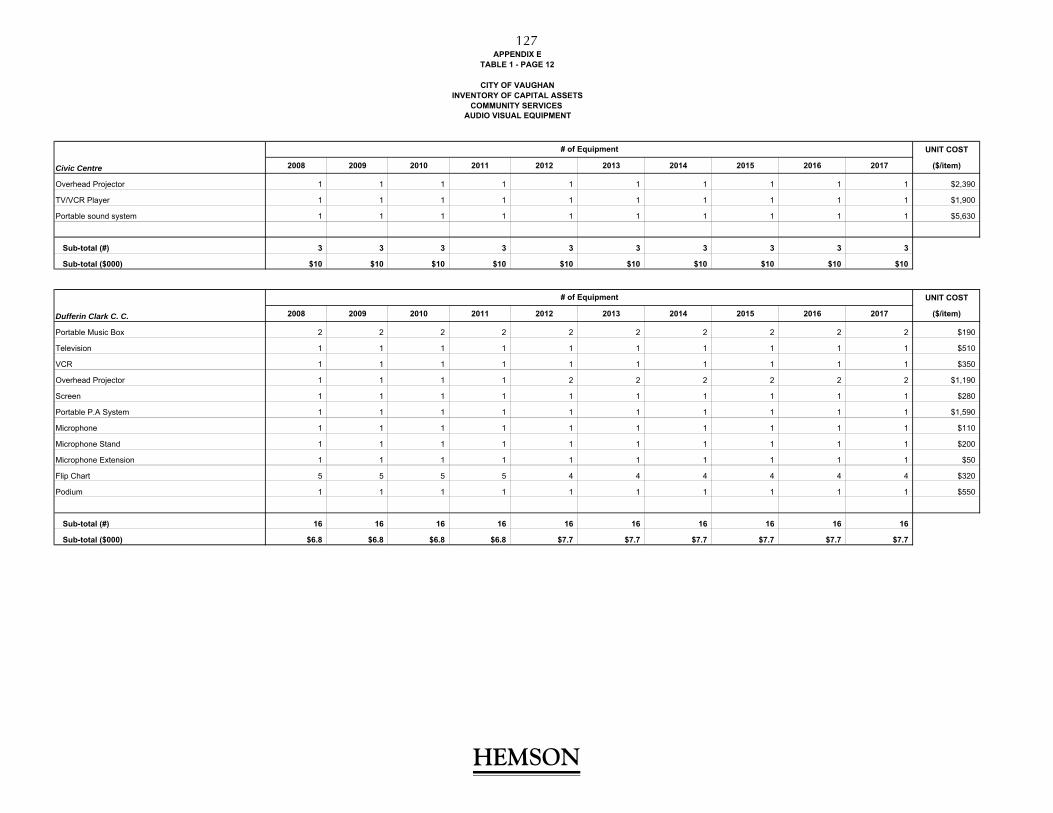
CITY OF VAUGHANINVENTORY OF CAPITAL ASSETS
COMMUNITY SERVICES
UNIT COST
Civic Centre 2008 2009 2010 2011 2012 2013 2014 2015 2016 2017 ($/item)
Overhead Projector 1 1 1 1 1 1 1 1 1 1 $2,390
TV/VCR Player 1 1 1 1 1 1 1 1 1 1 $1,900
Portable sound system 1 1 1 1 1 1 1 1 1 1 $5,630
Sub-total (#) 3 3 3 3 3 3 3 3 3 3
Sub-total ($000) $10 $10 $10 $10 $10 $10 $10 $10 $10 $10
UNIT COST
Dufferin Clark C. C. 2008 2009 2010 2011 2012 2013 2014 2015 2016 2017 ($/item)
Portable Music Box 2 2 2 2 2 2 2 2 2 2 $190
Television 1 1 1 1 1 1 1 1 1 1 $510
VCR 1 1 1 1 1 1 1 1 1 1 $350
Overhead Projector 1 1 1 1 2 2 2 2 2 2 $1,190
Screen 1 1 1 1 1 1 1 1 1 1 $280
Portable P.A System 1 1 1 1 1 1 1 1 1 1 $1,590
Microphone 1 1 1 1 1 1 1 1 1 1 $110
Microphone Stand 1 1 1 1 1 1 1 1 1 1 $200
Microphone Extension 1 1 1 1 1 1 1 1 1 1 $50
Flip Chart 5 5 5 5 4 4 4 4 4 4 $320
Podium 1 1 1 1 1 1 1 1 1 1 $550
Sub-total (#) 16 16 16 16 16 16 16 16 16 16
Sub-total ($000) $6.8 $6.8 $6.8 $6.8 $7.7 $7.7 $7.7 $7.7 $7.7 $7.7
APPENDIX ETABLE 1 - PAGE 12
AUDIO VISUAL EQUIPMENT
# of Equipment
# of Equipment
HEMSON
HEMSON
127

CITY OF VAUGHANINVENTORY OF CAPITAL ASSETS
COMMUNITY SERVICES
UNIT COST
Garnet A. Williams C. C. 2008 2009 2010 2011 2012 2013 2014 2015 2016 2017 ($/item)
CD Player 1 1 1 1 1 1 1 1 1 1 $240
Caliphone (portable dual cassette player) 1 1 1 1 0 0 0 0 0 0 $1,020
Wireless Remote Headphones 2 2 2 2 2 2 2 2 2 2 $280
Camera 1 1 1 1 1 1 1 1 1 1 $1,900
Portable Music Box 1 1 1 1 1 1 1 1 1 1 $190
Sound System 1 1 1 1 1 1 1 1 1 1 $2,270
Duo Cassette Tape Deck 1 1 1 1 0 0 0 0 0 0 $430
Television 1 1 1 1 1 1 1 1 1 1 $510
VCR 1 1 1 1 1 1 1 1 1 1 $350
Overhead Projector 1 1 1 1 1 1 1 1 1 1 $1,190
Screen 1 1 1 1 1 1 1 1 1 1 $280
Podium 1 1 1 1 1 1 1 1 1 1 $550
Portable P.A System 1 1 1 1 1 1 1 1 1 1 $1,590
Microphone 2 2 2 2 2 2 2 2 2 2 $110
Microphone Stand 2 2 2 2 2 2 2 2 2 2 $200
Microphone Extension 1 1 1 1 1 1 1 1 1 1 $50
Flip Chart 4 4 4 4 4 4 4 4 4 4 $320
Sub-total (#) 23 23 23 23 21 21 21 21 21 21
Sub-total ($000) $13.0 $13.0 $13.0 $13.0 $11.6 $11.6 $11.6 $11.6 $11.6 $11.6
APPENDIX ETABLE 1 - PAGE 13
AUDIO VISUAL EQUIPMENT
# of Equipment
HEMSON
HEMSON
128

CITY OF VAUGHANCOMMUNITY SERVICES
UNIT COST
Maple Community Centre 2008 2009 2010 2011 2012 2013 2014 2015 2016 2017 ($/item)
AM/FM Cassette Player 1 1 1 1 1 1 1 1 1 1 $870
Caliphone 1 1 1 1 0 0 0 0 0 0 $1,020
Wireless Remote Headphones 1 1 1 1 1 1 1 1 1 1 $280
Portable Music Box 2 2 2 2 1 1 1 1 1 1 $190
Radio Cassette Player 1 1 1 1 1 1 1 1 1 1 $120
Television 1 1 1 1 1 1 1 1 1 1 $510
VCR 1 1 1 1 0 0 0 0 0 0 $350
Overhead Projector 1 1 1 1 1 1 1 1 1 1 $1,190
Screen 1 1 1 1 1 1 1 1 1 1 $280
Portable P.A System 1 1 1 1 1 1 1 1 1 1 $1,590
Microphone 2 2 2 2 1 1 1 1 1 1 $110
Microphone Stand 1 1 1 1 1 1 1 1 1 1 $200
Microphone Extension 2 2 2 2 1 1 1 1 1 1 $50
Flip Chart 6 6 6 6 3 3 3 3 3 3 $320
Sub-total (#) 22 22 22 22 14 14 14 14 14 14
Sub-total ($000) $9.0 $9.0 $9.0 $9.0 $6.4 $6.4 $6.4 $6.4 $6.4 $6.4
UNIT COST
Rosemount Community Centre 2008 2009 2010 2011 2012 2013 2014 2015 2016 2017 ($/item)
Television 1 1 1 1 2 2 2 2 2 2 $510
VCR 1 1 1 1 1 1 1 1 1 1 $350
Overhead Projector 1 1 1 1 1 1 1 1 1 1 $1,190
Screen 1 1 1 1 0 0 0 0 0 0 $280
Portable P.A System 0 0 0 0 0 0 0 0 0 0 $1,590
Microphone 1 1 1 1 1 1 1 1 1 1 $110
Microphone Stand 1 1 1 1 1 1 1 1 1 1 $200
Microphone Extension 0 0 0 0 1 1 1 1 1 1 $50
Sub-total (#) 6 6 6 6 7 7 7 7 7 7
Sub-total ($000) $2.6 $2.6 $2.6 $2.6 $2.9 $2.9 $2.9 $2.9 $2.9 $2.9
TABLE 1 - PAGE 14APPENDIX E
# of Equipment
AUDIO VISUAL EQUIPMENT
# of Equipment
HEMSON
HEMSON
129

CITY OF VAUGHANINVENTORY OF CAPITAL ASSETS
COMMUNITY SERVICES
UNIT COST
Al Palladini C. C. 2008 2009 2010 2011 2012 2013 2014 2015 2016 2017 ($/item)
Caliphone 1 1 1 1 0 0 0 0 0 0 $1,020
Wireless Remote Headphones 2 2 2 2 2 2 2 2 2 2 $280
AM/FM Cassette Player 1 1 1 1 0 0 0 0 0 0 $870
Audio System 1 1 1 1 1 1 1 1 1 1 $8,070
Portable Music Box 1 1 1 1 2 2 2 2 2 2 $190
Portable Underwater Sound System 1 1 1 1 1 1 1 1 1 1 $7,950
Portable AM/FM Cassette Player 5 5 5 5 0 0 0 0 0 0 $190
Television 1 1 1 1 2 2 2 2 2 2 $510
VCR 1 1 1 1 1 1 1 1 1 1 $350
Overhead Projector 1 1 1 1 1 1 1 1 1 1 $1,190
Screen 1 1 1 1 1 1 1 1 1 1 $280
Podium 1 1 1 1 1 1 1 1 1 1 $550
Microphone 3 3 3 3 3 3 3 3 3 3 $110
Microphone Stand 1 1 1 1 1 1 1 1 1 1 $200
Microphone Extension 2 2 2 2 2 2 2 2 2 2 $50
Flip Chart 4 4 4 4 4 4 4 4 4 4 $320
Sub-total (#) 27 27 27 27 22 22 22 22 22 22
Sub-total ($000) $24.4 $24.4 $24.4 $24.4 $22.3 $22.3 $22.3 $22.3 $22.3 $22.3
APPENDIX ETABLE 1 - PAGE 15
# of Equipment
AUDIO VISUAL EQUIPMENT
HEMSON
HEMSON
130
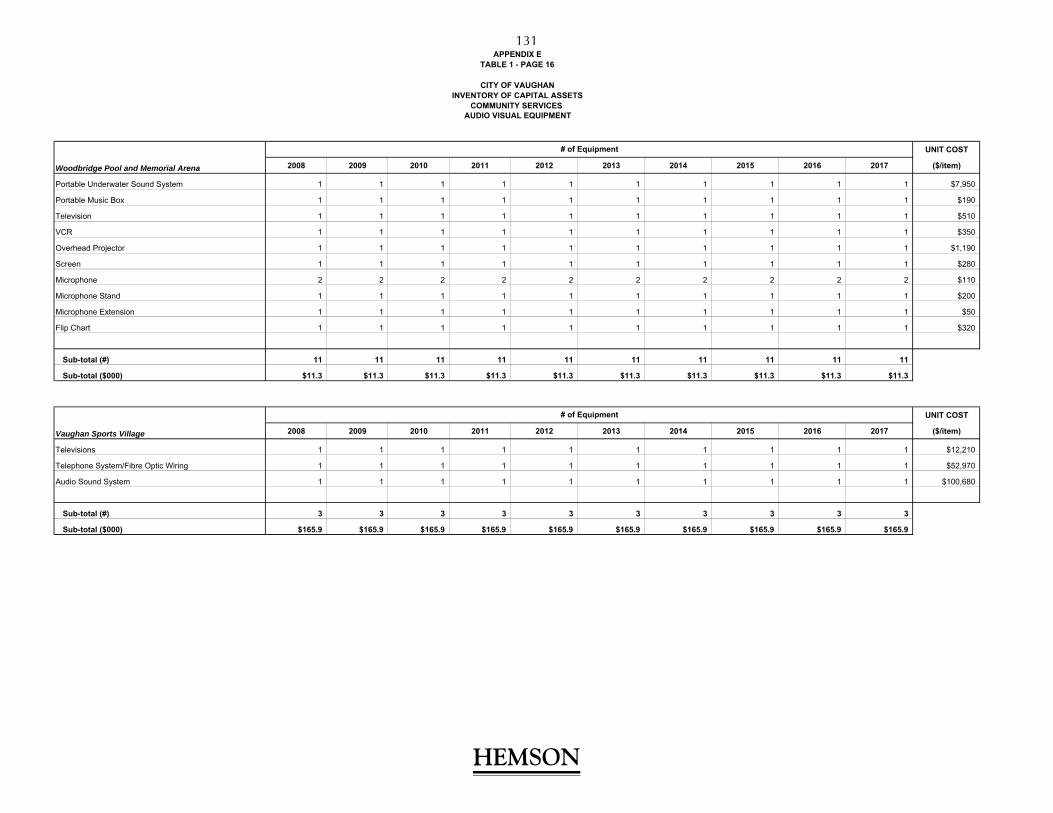
CITY OF VAUGHANINVENTORY OF CAPITAL ASSETS
COMMUNITY SERVICES
UNIT COST
Woodbridge Pool and Memorial Arena 2008 2009 2010 2011 2012 2013 2014 2015 2016 2017 ($/item)
Portable Underwater Sound System 1 1 1 1 1 1 1 1 1 1 $7,950
Portable Music Box 1 1 1 1 1 1 1 1 1 1 $190
Television 1 1 1 1 1 1 1 1 1 1 $510
VCR 1 1 1 1 1 1 1 1 1 1 $350
Overhead Projector 1 1 1 1 1 1 1 1 1 1 $1,190
Screen 1 1 1 1 1 1 1 1 1 1 $280
Microphone 2 2 2 2 2 2 2 2 2 2 $110
Microphone Stand 1 1 1 1 1 1 1 1 1 1 $200
Microphone Extension 1 1 1 1 1 1 1 1 1 1 $50
Flip Chart 1 1 1 1 1 1 1 1 1 1 $320
Sub-total (#) 11 11 11 11 11 11 11 11 11 11
Sub-total ($000) $11.3 $11.3 $11.3 $11.3 $11.3 $11.3 $11.3 $11.3 $11.3 $11.3
UNIT COST
Vaughan Sports Village 2008 2009 2010 2011 2012 2013 2014 2015 2016 2017 ($/item)
Televisions 1 1 1 1 1 1 1 1 1 1 $12,210
Telephone System/Fibre Optic Wiring 1 1 1 1 1 1 1 1 1 1 $52,970
Audio Sound System 1 1 1 1 1 1 1 1 1 1 $100,680
Sub-total (#) 3 3 3 3 3 3 3 3 3 3
Sub-total ($000) $165.9 $165.9 $165.9 $165.9 $165.9 $165.9 $165.9 $165.9 $165.9 $165.9
TABLE 1 - PAGE 16
AUDIO VISUAL EQUIPMENT
# of Equipment
# of Equipment
APPENDIX E
HEMSON
HEMSON
131
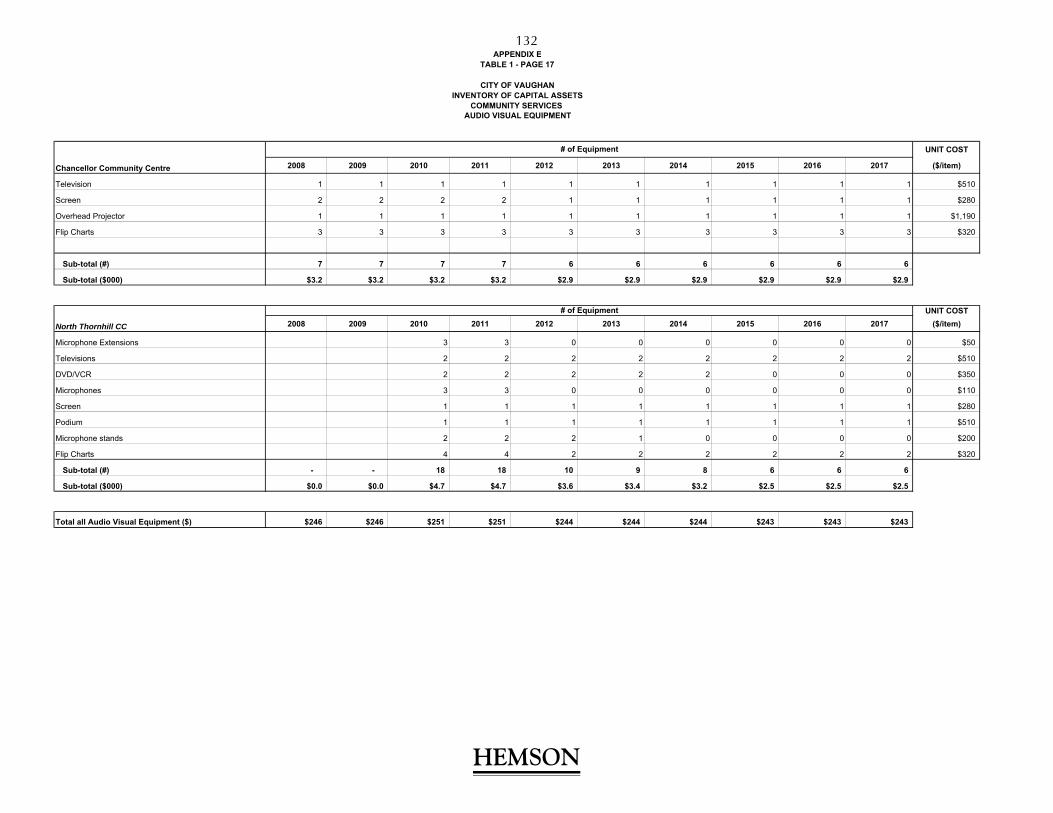
CITY OF VAUGHANINVENTORY OF CAPITAL ASSETS
COMMUNITY SERVICES
UNIT COST
Chancellor Community Centre 2008 2009 2010 2011 2012 2013 2014 2015 2016 2017 ($/item)
Television 1 1 1 1 1 1 1 1 1 1 $510
Screen 2 2 2 2 1 1 1 1 1 1 $280
Overhead Projector 1 1 1 1 1 1 1 1 1 1 $1,190
Flip Charts 3 3 3 3 3 3 3 3 3 3 $320
Sub-total (#) 7 7 7 7 6 6 6 6 6 6
Sub-total ($000) $3.2 $3.2 $3.2 $3.2 $2.9 $2.9 $2.9 $2.9 $2.9 $2.9
UNIT COST
North Thornhill CC 2008 2009 2010 2011 2012 2013 2014 2015 2016 2017 ($/item)
Microphone Extensions 3 3 0 0 0 0 0 0 $50
Televisions 2 2 2 2 2 2 2 2 $510
DVD/VCR 2 2 2 2 2 0 0 0 $350
Microphones 3 3 0 0 0 0 0 0 $110
Screen 1 1 1 1 1 1 1 1 $280
Podium 1 1 1 1 1 1 1 1 $510
Microphone stands 2 2 2 1 0 0 0 0 $200
Flip Charts 4 4 2 2 2 2 2 2 $320
Sub-total (#) - - 18 18 10 9 8 6 6 6
Sub-total ($000) $0.0 $0.0 $4.7 $4.7 $3.6 $3.4 $3.2 $2.5 $2.5 $2.5
Total all Audio Visual Equipment ($) $246 $246 $251 $251 $244 $244 $244 $243 $243 $243
APPENDIX E
AUDIO VISUAL EQUIPMENT
# of Equipment
# of Equipment
TABLE 1 - PAGE 17
HEMSON
HEMSON
132

CITY OF VAUGHAN
UNIT COST
Dufferin Clark C. C. 2008 2009 2010 2011 2012 2013 2014 2015 2016 2017 ($/item)
Standard 6-foot Table 150 150 150 150 150 150 150 150 150 150 $140
8-foot Table 0 0 0 0 0 0 0 0 0 0 $140
5-foot Table 20 20 20 20 20 20 20 20 20 20 $80
Folding Chair 100 100 100 100 100 100 100 100 100 100 $30
Stacking Chair 450 450 450 450 450 450 450 450 450 450 $30
Children's Chair 63 63 63 63 63 63 63 63 63 63 $10
Sub-total (#) 783 783 783 783 783 783 783 783 783 783
Sub-total ($000) $39.7 $39.7 $39.7 $39.7 $39.7 $39.7 $39.7 $39.7 $39.7 $39.7
UNIT COST
Garnet A. Williams C. C. 2008 2009 2010 2011 2012 2013 2014 2015 2016 2017 ($/item)
Standard 6-foot Table 72 72 72 72 72 72 72 72 72 72 $140
Mitey Lite Table 12 12 12 12 12 12 12 12 12 12 $350
4-foot Table 4 4 4 4 4 4 4 4 4 4 $80
Card Table 7 7 7 7 7 7 7 7 7 7 $80
Folding Chair 120 120 120 120 120 120 120 120 120 120 $30
Stacking Chair 500 500 500 500 500 500 500 500 500 500 $30
Sub-total (#) 715 715 715 715 715 715 715 715 715 715
Sub-total ($000) $33.8 $33.8 $33.8 $33.8 $33.8 $33.8 $33.8 $33.8 $33.8 $33.8
APPENDIX ETABLE 1 - PAGE 18
INVENTORY OF CAPITAL ASSETSCOMMUNITY SERVICES
FURNITURE & MISC EQUIPMENT INVENTORY
# of Equipment
# of Equipment
HEMSON
HEMSON
133

UNIT COST
Maple Community Centre 2008 2009 2010 2011 2012 2013 2014 2015 2016 2017 ($/item)
Standard 6-foot Table 100 100 100 100 100 100 100 100 100 100 $140
Card Table 17 17 17 17 9 9 9 9 9 9 $80
Children's Table 9 9 9 9 10 10 10 10 10 10 $80
Folding Chair 50 50 50 50 50 50 50 50 50 50 $30
Stacking Chair 450 450 450 450 443 443 443 443 443 443 $30
Children's Chair 38 38 38 38 46 46 46 46 46 46 $10
Wood Chairs 0 0 0 0 0 0 0 0 0 0 $30
Sub-total (#) 664 664 664 664 658 658 658 658 658 658
Sub-total ($000) $31.5 $31.5 $31.5 $31.5 $30.8 $30.8 $30.8 $30.8 $30.8 $30.8
UNIT COST
Rosemount Community Centre 2008 2009 2010 2011 2012 2013 2014 2015 2016 2017 ($/item)
Standard 6-foot Table Mightlite 31 31 31 31 15 15 15 15 15 15 $350
Card Table 19 19 19 19 10 10 10 10 10 10 $80
Stacking Chair 150 150 150 150 150 150 150 150 150 150 $30
Children's Chair 32 32 32 32 65 65 65 65 65 65 $10
Newer style 6' table 10
Sub-total (#) 232 232 232 232 240 240 240 240 240 250
Sub-total ($000) $17.2 $17.2 $17.2 $17.2 $11.2 $11.2 $11.2 $11.2 $11.2 $11.2
TABLE 1 - PAGE 19APPENDIX E
CITY OF VAUGHANINVENTORY OF CAPITAL ASSETS
COMMUNITY SERVICESFURNITURE & MISC EQUIPMENT INVENTORY
# of Equipment
# of Equipment
HEMSON
HEMSON
134

UNIT COST
Woodbridge Pool and Memorial Arena 2008 2009 2010 2011 2012 2013 2014 2015 2016 2017 ($/item)
Standard 6-foot Table 50 50 50 50 50 50 50 50 50 50 $140
Folding Chair 208 208 208 208 208 208 208 208 208 208 $30
Stacking Chair 26 26 26 26 26 26 26 26 26 26 $30
Sub-total (#) 284 284 284 284 284 284 284 284 284 284
Sub-total ($000) $14.0 $14.0 $14.0 $14.0 $14.0 $14.0 $14.0 $14.0 $14.0 $14.0
UNIT COST
Al Palladini C. C. 2008 2009 2010 2011 2012 2013 2014 2015 2016 2017 ($/item)
Standard 6-foot Table 50 50 50 50 50 50 50 50 50 50 $140
Mitey Lite Table 15 15 15 15 15 15 15 15 15 15 $350
Folding Chair 410 410 410 410 410 410 410 410 410 410 $30
Stacking Chair 190 190 190 190 190 190 190 190 190 190 $30
Children's Chair 39 39 39 39 39 39 39 39 39 39 $10
Sub-total (#) 704 704 704 704 704 704 704 704 704 704
Sub-total ($000) $30.6 $30.6 $30.6 $30.6 $30.6 $30.6 $30.6 $30.6 $30.6 $30.6
FURNITURE & MISC EQUIPMENT INVENTORY
APPENDIX ETABLE 1 - PAGE 20
CITY OF VAUGHANINVENTORY OF CAPITAL ASSETS
COMMUNITY SERVICES
# of Equipment
# of Equipment
HEMSON
HEMSON
135
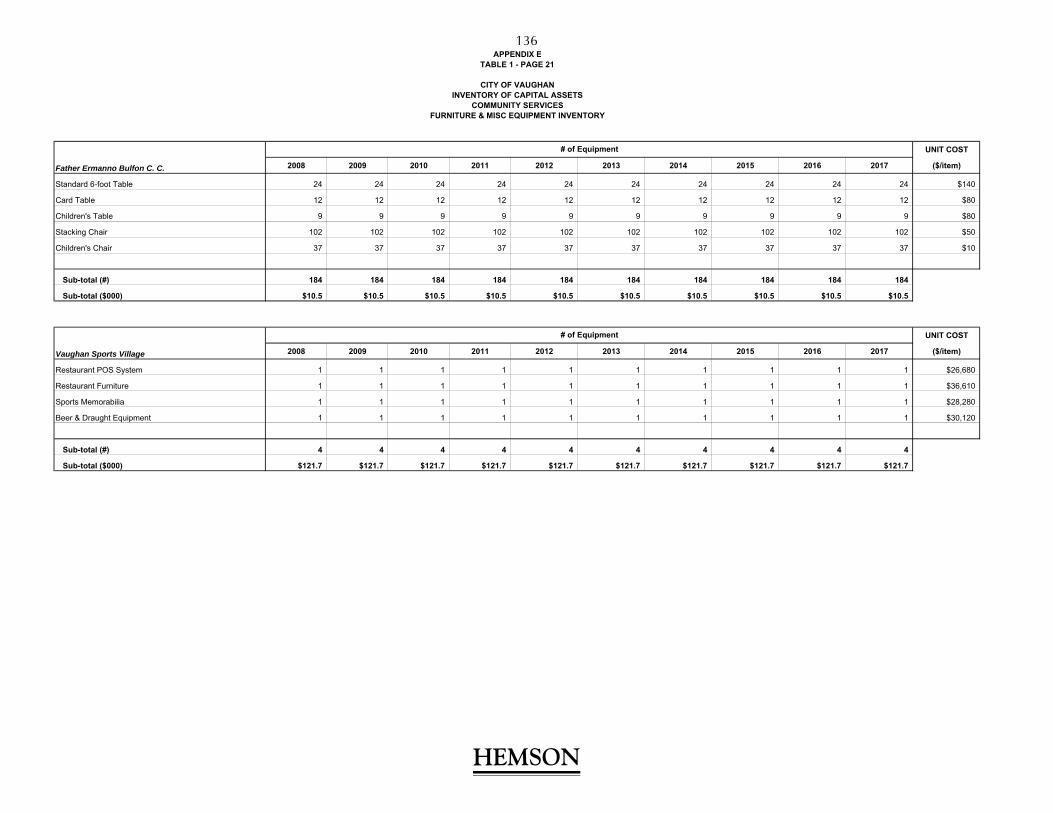
UNIT COST
Father Ermanno Bulfon C. C. 2008 2009 2010 2011 2012 2013 2014 2015 2016 2017 ($/item)
Standard 6-foot Table 24 24 24 24 24 24 24 24 24 24 $140
Card Table 12 12 12 12 12 12 12 12 12 12 $80
Children's Table 9 9 9 9 9 9 9 9 9 9 $80
Stacking Chair 102 102 102 102 102 102 102 102 102 102 $50
Children's Chair 37 37 37 37 37 37 37 37 37 37 $10
Sub-total (#) 184 184 184 184 184 184 184 184 184 184
Sub-total ($000) $10.5 $10.5 $10.5 $10.5 $10.5 $10.5 $10.5 $10.5 $10.5 $10.5
UNIT COST
Vaughan Sports Village 2008 2009 2010 2011 2012 2013 2014 2015 2016 2017 ($/item)
Restaurant POS System 1 1 1 1 1 1 1 1 1 1 $26,680
Restaurant Furniture 1 1 1 1 1 1 1 1 1 1 $36,610
Sports Memorabilia 1 1 1 1 1 1 1 1 1 1 $28,280
Beer & Draught Equipment 1 1 1 1 1 1 1 1 1 1 $30,120
Sub-total (#) 4 4 4 4 4 4 4 4 4 4
Sub-total ($000) $121.7 $121.7 $121.7 $121.7 $121.7 $121.7 $121.7 $121.7 $121.7 $121.7
APPENDIX ETABLE 1 - PAGE 21
CITY OF VAUGHANINVENTORY OF CAPITAL ASSETS
COMMUNITY SERVICESFURNITURE & MISC EQUIPMENT INVENTORY
# of Equipment
# of Equipment
HEMSON
HEMSON
136
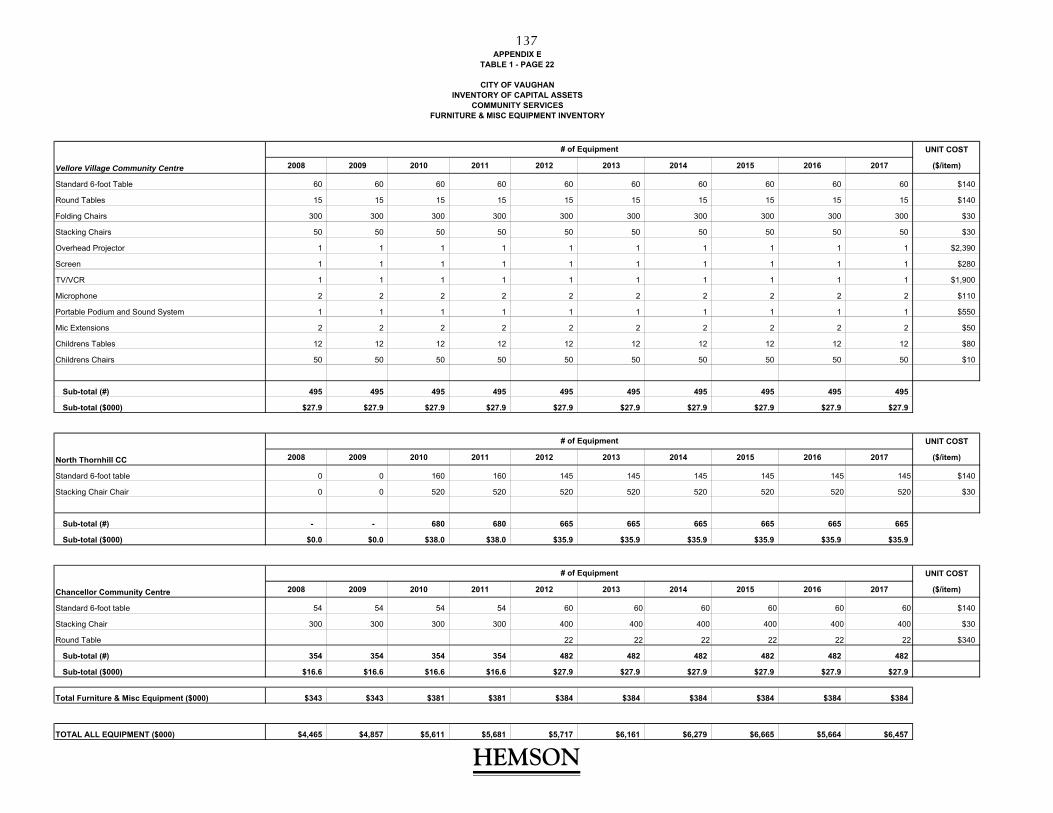
UNIT COST
Vellore Village Community Centre 2008 2009 2010 2011 2012 2013 2014 2015 2016 2017 ($/item)
Standard 6-foot Table 60 60 60 60 60 60 60 60 60 60 $140
Round Tables 15 15 15 15 15 15 15 15 15 15 $140
Folding Chairs 300 300 300 300 300 300 300 300 300 300 $30
Stacking Chairs 50 50 50 50 50 50 50 50 50 50 $30
Overhead Projector 1 1 1 1 1 1 1 1 1 1 $2,390
Screen 1 1 1 1 1 1 1 1 1 1 $280
TV/VCR 1 1 1 1 1 1 1 1 1 1 $1,900
Microphone 2 2 2 2 2 2 2 2 2 2 $110
Portable Podium and Sound System 1 1 1 1 1 1 1 1 1 1 $550
Mic Extensions 2 2 2 2 2 2 2 2 2 2 $50
Childrens Tables 12 12 12 12 12 12 12 12 12 12 $80
Childrens Chairs 50 50 50 50 50 50 50 50 50 50 $10
Sub-total (#) 495 495 495 495 495 495 495 495 495 495
Sub-total ($000) $27.9 $27.9 $27.9 $27.9 $27.9 $27.9 $27.9 $27.9 $27.9 $27.9
UNIT COST
North Thornhill CC 2008 2009 2010 2011 2012 2013 2014 2015 2016 2017 ($/item)
Standard 6-foot table 0 0 160 160 145 145 145 145 145 145 $140
Stacking Chair Chair 0 0 520 520 520 520 520 520 520 520 $30
Sub-total (#) - - 680 680 665 665 665 665 665 665
Sub-total ($000) $0.0 $0.0 $38.0 $38.0 $35.9 $35.9 $35.9 $35.9 $35.9 $35.9
UNIT COST
Chancellor Community Centre 2008 2009 2010 2011 2012 2013 2014 2015 2016 2017 ($/item)
Standard 6-foot table 54 54 54 54 60 60 60 60 60 60 $140
Stacking Chair 300 300 300 300 400 400 400 400 400 400 $30
Round Table 22 22 22 22 22 22 $340
Sub-total (#) 354 354 354 354 482 482 482 482 482 482
Sub-total ($000) $16.6 $16.6 $16.6 $16.6 $27.9 $27.9 $27.9 $27.9 $27.9 $27.9
Total Furniture & Misc Equipment ($000) $343 $343 $381 $381 $384 $384 $384 $384 $384 $384
TOTAL ALL EQUIPMENT ($000) $4,465 $4,857 $5,611 $5,681 $5,717 $6,161 $6,279 $6,665 $5,664 $6,457
TABLE 1 - PAGE 22APPENDIX E
# of Equipment
CITY OF VAUGHANINVENTORY OF CAPITAL ASSETS
COMMUNITY SERVICESFURNITURE & MISC EQUIPMENT INVENTORY
# of Equipment
# of Equipment
HEMSON
HEMSON
137

WARD 1 PARKS: NEIGBOURHOOD Park Address
Park Name No. 2008 2009 2010 2011 2012 2013 2014 2015 2016 2017
Ahmadiyya Park UV1-N7 140 Murray Farm Lane 2.55 2.55 2.55 2.55 2.55 2.55 2.55 2.55 2.55 2.55
Bindertwine Park KN1 299 Stegman's Mill Road 5.06 5.06 5.06 5.06 5.06 5.06 5.06 5.06 5.06 5.06
Breta/H&R MN13 Silmoro Court &Klamath Crt 1.17 1.17 1.17 1.17 1.17 1.17 1.17 1.17 1.17 1.17
Brett Yerex Park (Formerly Springside Park) MN20 177 Springside Rd 1.20 1.20 1.20 1.20 1.20 1.20 1.20 1.20 1.20 1.20
Calvary Baptist Church KS1 6950 Nashville Road 6.17 6.17 6.17 6.17 6.17 6.17 6.17 6.17 6.17 6.17
Castlehill Park MN6-25 70 Castlehill Rd. 1.89 1.89 1.89 1.89 1.89 1.89 1.89 1.89 1.89 1.89
Civic Park MN1 299 Marlott Road 2.25 2.25 2.25 2.25 2.25 2.25 2.25 2.25 2.25 2.25
Cranston Park MN11 Cranston Rd 2.41 2.41 2.41 2.41 2.41 2.41 2.41 2.41 2.41 2.41
Crieff Parkette MP2 45 Crieff Ave 0.30 0.30 0.30 0.30 0.30 0.30 0.30 0.30 0.30 0.30
Discovery Park UV1-N19 90 Discovery Trail 1.52 1.52 1.52 1.52 1.52 1.52 1.52 1.52 1.52 1.52
Emmitt Road Park MN24 65 Emmitt Road 0.85 0.85 0.85 0.85 0.85 0.85 0.85 0.85 0.85 0.85
Fazia Mahdi Park UV1-N22 151 Ahmadiyya Ave 1.14 1.14 1.14 1.14 1.14 1.14 1.14 1.14 1.14 1.14
Frank Robson Park MN5 9470 Keele St. 2.80 2.80 2.80 2.80 2.80 2.80 2.80 2.80 2.80 2.80
Hedgerow Park KN3 165 Hedgerow Lane 0.51 0.51 0.51 0.51 0.51 0.51 0.51 0.51 0.51 0.51
Julliard Park VCC-N2 101 Julliard Drive - 1.94 1.94 1.94 1.94 1.94 1.94 1.94 1.94 1.94
Kelso Parkette MP5 180 Kelso Cres 0.11 0.11 0.11 0.11 0.11 0.11 0.11 0.11 0.11 0.11
Killian Lamar Parkette MP1 108 Mathewson St. 0.18 0.18 0.18 0.18 0.18 0.18 0.18 0.18 0.18 0.18
Maple Airport Park MN7 121 Avro Rd 1.89 1.89 1.89 1.89 1.89 1.89 1.89 1.89 1.89 1.89
Maple Lions Park MN8 350 Cunningham Dr 1.04 1.04 1.04 1.04 1.04 1.04 1.04 1.04 1.04 1.04
Maple Reservoir Park MR 10588 keele St 4.31 4.31 4.31 4.31 4.31 4.31 4.31 4.31 4.31 4.31
Maple Trails Park MN19 61 Athabasca Drive 2.46 2.46 2.46 2.46 2.46 2.46 2.46 2.46 2.46 2.46
Mario Plastina/ Formerly Graywood Park MN12 40 Prestonwood Court 1.07 1.07 1.07 1.07 1.07 1.07 1.07 1.07 1.07 1.07
Mast Park UV1-N20 195 Mast Road 2.49 2.49 2.49 2.49 2.49 2.49 2.49 2.49 2.49 2.49
McNaughton Park MN10 20 McNaughton Road 1.81 1.81 1.81 1.81 1.81 1.81 1.81 1.81 1.81 1.81
Melville Park MN9 201 Melville Ave 3.53 3.53 3.53 3.53 3.53 3.53 3.53 3.53 3.53 3.53
Naylon Parkette MP3 82 Naylon Street 1.14 1.14 1.14 1.14 1.14 1.14 1.14 1.14 1.14 1.14
Netherford Parkette KP4 2493 Major Mackenzie Drive 0.69 0.69 0.69 0.69 0.69 0.69 0.69 0.69 0.69 0.69
Nevada Park MN18 101 Nevada Crescent 1.76 1.76 1.76 1.76 1.76 1.76 1.76 1.76 1.76 1.76
Peak Point Park MN22 68 Peak Point Blvd 1.87 1.87 1.87 1.87 1.87 1.87 1.87 1.87 1.87 1.87
Princeton Gate Park MN14 121 Princeton Gate 2.63 2.63 2.63 2.63 2.63 2.63 2.63 2.63 2.63 2.63
Ramsey Armitage Park MN4 8 Merino Rd. 1.49 1.49 1.49 1.49 1.49 1.49 1.49 1.49 1.49 1.49
Ranch Trail Park KN6 120 Ranch Trail Rd. 1.92 1.92 1.92 1.92 1.92 1.92 1.92 1.92 1.92 1.92
Reeves Park MN2 251 Barrhill Rd. 1.68 1.68 1.68 1.68 1.68 1.68 1.68 1.68 1.68 1.68
Regency View Parkette MN21 83 Regency View Heights 0.17 0.17 0.17 0.17 0.17 0.17 0.17 0.17 0.17 0.17
Rimwood Park KN5 211 Philips Lane 1.68 1.68 1.68 1.68 1.68 1.68 1.68 1.68 1.68 1.68
Ross Guerri Park KP4 67 Park Ridge Drive - 0.69 0.69 0.69 0.69 0.69 0.69 0.69 0.69 0.69
Routley Park MN3 65 DiCarlo Dr. 2.01 2.01 2.01 2.01 2.01 2.01 2.01 2.01 2.01 2.01
Secord Park 61W-N1 65 Secord Ave - - - - - - - - - 1.67
Sherwood Parkette MP4 75 Sherwood Park Drive 0.15 0.15 0.15 0.15 0.15 0.15 0.15 0.15 0.15 0.15
Tinsmith Parkette KP1 50 Tinsmith Court 0.71 0.71 0.71 0.71 0.71 0.71 0.71 0.71 0.71 0.71
Treelawn Parkette KP2 65 Treelawn Blvd 0.35 0.35 0.35 0.35 0.35 0.35 0.35 0.35 0.35 0.35
Vaughan City Centre/ Formerly Komura Rd Pk VCC-N3 Komura Rd 1.75 1.75 1.75 1.75 1.75 1.75 1.75 1.75 1.75 1.75
Vista Gate Parkette MN23 245 Ravineview Drive 0.41 0.41 0.41 0.41 0.41 0.41 0.41 0.41 0.41 0.41
West/Maple Creek MN17 77 Broomlands Drive 2.99 2.99 2.99 2.99 2.99 2.99 2.99 2.99 2.99 2.99
Total 72.14 74.77 74.77 74.77 74.76 74.76 74.76 74.76 74.76 76.43
APPENDIX ETABLE 1 - PAGE 23
CITY OF VAUGHANINVENTORY OF CAPITAL ASSETS
# of Hectares
COMMUNITY SERVICES PARKLAND
HEMSON
HEMSON
138

WARD 2 PARKS: NEIGBOURHOOD Park Address
Park Name No. 2008 2009 2010 2011 2012 2013 2014 2015 2016 2017
Alexander Elisa Park WN12 221 Tall Grass Trail 2.25 2.25 2.25 2.25 2.25 2.25 2.25 2.25 2.25 2.25
Almont Park WN5 41 Kanata Court 1.13 1.13 1.13 1.13 1.13 1.13 1.13 1.13 1.13 1.13
Crest Lawn Parkette WN39 31 Crestlawn Gate - 0.38 0.38 0.38 0.38 0.38 0.38 0.38 0.38 0.38
Crofters Park WN17 225 Crofters Rd. 2.31 2.31 2.31 2.31 2.31 2.31 2.31 2.31 2.31 2.31
Findley Park WN26 70 Panorama Cres 3.96 3.96 3.96 3.96 3.96 3.96 3.96 3.96 3.96 3.96
Fred Armstrong Parkette WP2 28 Woodbridge Ave. 0.26 0.26 0.26 0.26 0.26 0.26 0.26 0.26 0.26 0.26
Tammy Breda Park (Formerly Forest Fountain Park) WN36 181 Forest Fountain Dr 1.42 1.42 1.42 1.42 1.42 1.42 1.42 1.42 1.42 1.42
Hayhoe Park WN6 60 Hayhoe Lane 0.35 0.35 0.35 0.35 0.35 0.35 0.35 0.35 0.35 0.35
Humber Valley Parkette WEA-P1 Napa Valley Avenue 0.27 0.27 0.27 0.27 0.27 0.27 0.27 0.27 0.27 0.27
Kiloran Park WN7 300 Wycliffe Ave. 2.39 2.39 2.39 2.39 2.39 2.39 2.39 2.39 2.39 2.39
Kipling Parkette WP9 7550 Kipling Ave. 0.47 0.47 0.47 0.47 0.47 0.47 0.47 0.47 0.47 0.47
Legion Park WP11 70 Legion Court Road 0.42 0.42 0.42 0.42 0.42 0.42 0.42 0.42 0.42 0.42
Le Park Saint jean De Brebeuf WEA-N5 131 Golden Gate Circle 1.43 1.43 1.43 1.43 1.43 1.43 1.43 1.43 1.43 1.43
Mapes Park WN18 190 Mapes Ave 2.58 2.58 2.58 2.58 2.58 2.58 2.58 2.58 2.58 2.58
Maxey Park WN4 199 Willis Rd. 4.19 4.19 4.19 4.19 4.19 4.19 4.19 4.19 4.19 4.19
McClure Meadows Park WN27 8921 Martin Grove Rd 2.86 2.86 2.86 2.86 2.86 2.86 2.86 2.86 2.86 2.86
Memorial Hill Park WN3 80 Wallace Street 1.08 1.08 1.08 1.08 1.08 1.08 1.08 1.08 1.08 1.08
Michael Barrasso Park (Formerly Morningstar Park) WN19 131 Morningstar Cres. 2.55 2.55 2.55 2.55 2.55 2.55 2.55 2.55 2.55 2.55
Michael Fitzgerald Park WN31 29 Humber Meadow Court 0.51 0.51 0.51 0.51 0.51 0.51 0.51 0.51 0.51 0.51
Napa Valley Park WN33 80 Napa Valley Ave 2.49 2.49 2.49 2.49 2.49 2.49 2.49 2.49 2.49 2.49
Old Firehall Parkette WP7 223 Woodbridge Ave. 0.18 0.18 0.18 0.18 0.18 0.18 0.18 0.18 0.18 0.18
Parwest Park WN23 74 Beechnut Rd 0.63 0.63 0.63 0.63 0.63 0.63 0.63 0.63 0.63 0.63
Rainbow Creek Park WN1 5450 Hwy # 7 22.70 22.70 22.70 22.70 22.70 22.70 22.70 22.70 22.70 22.70
Sunset Ridge Park WEA-N1 535 Napa Valley Ave. 2.44 2.44 2.44 2.44 2.44 2.44 2.44 2.44 2.44 2.44
Sylvan Brook Parkette WP8 2 Ravine Court 0.29 0.29 0.29 0.29 0.29 0.29 0.29 0.29 0.29 0.29
Tanana Parkette WP1 4899 Highway 7 0.37 0.37 0.37 0.37 0.37 0.37 0.37 0.37 0.37 0.37
Thompson Park WN25 301 Vaughan Mills Rd 0.45 0.45 0.45 0.45 0.45 0.45 0.45 0.45 0.45 0.45
Valley Edge Parkette WEA-P2 Julia Valentina Avenue 0.11 0.11 0.11 0.11 0.11 0.11 0.11 0.11 0.11 0.11
Vaughan Mills Park WN24 601 Vaughan Mills Rd 2.34 2.34 2.34 2.34 2.34 2.34 2.34 2.34 2.34 2.34
Via Verde Park WEA-N4 730 Napa Valley Avenue 1.38 1.38 1.38 1.38 1.38 1.38 1.38 1.38 1.38 1.38
Wilson Century Theatre Park WN32 20 Milano Ave. 0.57 0.57 0.57 0.57 0.57 0.57 0.57 0.57 0.57 0.57
Wishing Well Park KP3 1 Hazelridge Crt - - - - - - 0.13 0.13 0.13 0.13
Woodbridge Avenue Parkette WP5 102 Woodbridge Ave. 0.04 0.04 0.04 0.04 0.04 0.04 0.04 0.04 0.04 0.04
Woodbridge College Parkette WP12 71 Bruce Street 0.04 0.04 0.04 0.04 0.04 0.04 0.04 0.04 0.04 0.04
Woodbridge Highlands Park WN22 51 Thompson Creek Blvd. 6.10 6.10 6.10 6.10 6.10 6.10 6.10 6.10 6.10 6.10
Total 70.58 70.96 70.96 70.96 70.94 70.94 71.07 71.07 71.07 71.07
# of Hectares
APPENDIX ETABLE 1 - PAGE 24
CITY OF VAUGHANINVENTORY OF CAPITAL ASSETS
COMMUNITY SERVICES PARKLAND
HEMSON
HEMSON
139

WARD 3 PARKS: NEIGBOURHOOD Park Address
Park Name No. 2008 2009 2010 2011 2012 2013 2014 2015 2016 2017
Aberdeen Parkette WP3 100 Aberdeen Ave. 0.58 0.58 0.58 0.58 0.58 0.58 0.58 0.58 0.58 0.58
Anthony Locilento Park (Formerly Blue Coin Park) WN20 351 Velmar Dr. 3.58 3.58 3.58 3.58 3.58 3.58 3.58 3.58 3.58 3.58
Belairway Park WN14 2 Belairway 2.58 2.58 2.58 2.58 2.58 2.58 2.58 2.58 2.58 2.58
Blue Willow Square WN30 Blue Willow Dr 0.64 0.64 0.64 0.64 0.64 0.64 0.64 0.64 0.64 0.64
Comdel Park UV1-N18 60 Comdel Blvd 1.29 1.29 1.29 1.29 1.29 1.29 1.29 1.29 1.29 1.29
Davos Park UV1-N12 300 Davos Road - 0.92 0.92 0.92 0.92 0.92 0.92 0.92 0.92 0.92
Fennyrose Parkette WP10 250 Fennyrose Cres 0.40 0.40 0.40 0.40 0.40 0.40 0.40 0.40 0.40 0.40
Fossil Hill Park WN35 161 Fossil Hill Rd. 1.41 1.41 1.41 1.41 1.41 1.41 1.41 1.41 1.41 1.41
Giovanni Caboto Park (Formerly Glenvilla) WN29 75 Matthew Dr 6.71 6.71 6.71 6.71 6.71 6.71 6.71 6.71 6.71 6.71
George Stegman Park WN9 460 Aberdeen Ave. 1.84 1.84 1.84 1.84 1.84 1.84 1.84 1.84 1.84 1.84
Hawstone Park UV1-N5 80 Hawstone Road 2.93 2.93 2.93 2.93 2.93 2.93 2.93 2.93 2.93 2.93
Hillside Park UV1-N8 549 Vellore Road Park Avenue - - 3.86 3.86 3.86 3.86 3.86 3.86 3.86 3.86
Jersey Creek (Moved to Neighbourhood from District) WOS6 137 Andrea Lane 7.26 7.26 7.26 7.26 7.26 7.26 7.26 7.26 7.26 7.26
Joey Panetta Park WN15 88 Marieta St. 1.57 1.57 1.57 1.57 1.57 1.57 1.57 1.57 1.57 1.57
Kingsview Park UV1-N4 450 Fossil Hill Road 1.94 1.94 1.94 1.94 1.94 1.94 1.94 1.94 1.94 1.94
La Rocca Square WN34 327 La Rocca Ave 2.03 2.03 2.03 2.03 2.03 2.03 2.03 2.03 2.03 2.03
Lawford Park UV1-D4 300 Lawford Drive - - - - - - - - 2.39 2.39
Marco Park WN8 301 Airdrie Dr. 1.71 1.71 1.71 1.71 1.71 1.71 1.71 1.71 1.71 1.71
Robert Watson Memorial Park WN10 561 Arberdeen Ave. 2.34 2.34 2.34 2.34 2.34 2.34 2.34 2.34 2.34 2.34
Rose Mandarino Park (Weston Downs Park) WN16 80 Green Park Blvd. 5.21 5.21 5.21 5.21 5.21 5.21 5.21 5.21 5.21 5.21
Starling Park UV1-N1 131 Starling Boulevard 1.81 1.81 1.81 1.81 1.81 1.81 1.81 1.81 1.81 1.81
Torii Park WN11 50 Torii St. 2.91 2.91 2.91 2.91 2.91 2.91 2.91 2.91 2.91 2.91
Venice Gate Park UV1-N6 180 Trudeau Drive - - - 1.48 1.48 1.48 1.48 1.48 1.48 1.48
Velmar Downs Park WN21 30 Velmar Dr 2.43 2.43 2.43 2.43 2.43 2.43 2.43 2.43 2.43 2.43
Vellore Heritage Park WN38 9541 Weston Rd 1.41 1.41 1.41 1.41 1.41 1.41 1.41 1.41 1.41 1.41
Vellore Woods Park WN37 335 Vellore Woods Blvd 0.71 0.71 0.71 0.71 0.71 0.71 0.71 0.71 0.71 0.71
Via Campanile Park UV1-N3 181 Via Campanile 2.41 2.41 2.41 2.41 2.41 2.41 2.41 2.41 2.41 2.41
Village Green Park UV1-N2 500 Via Campanile - - - - - - 2.65 2.65 2.65 2.65
Westwind Park UV1-N5 150 Cityview Blvd - - - - 2.60 2.60 2.60 2.60 2.60 2.60
Subtotal 55.68 56.60 60.46 61.94 64.54 64.54 67.19 67.19 69.58 69.58
APPENDIX ETABLE 1 - PAGE 25
CITY OF VAUGHANINVENTORY OF CAPITAL ASSETS
COMMUNITY SERVICES
# of Hectares
PARKLAND
HEMSON
HEMSON
140

WARD 4 PARKS: NEIGBOURHOOD Park Address
Park Name No. 2008 2009 2010 2011 2012 2013 2014 2015 2016 2017
Agostino Park TN39 535 Confederation Parkway 2.32 2.32 2.32 2.32 2.32 2.32 2.32 2.32 2.32 2.32
Alexander Park TN38 145 Dufferin Hill Dr 2.05 2.05 2.05 2.05 2.05 2.05 2.05 2.05 2.05 2.05
Apple Blossom (Miriam Segal Park) UV2-N10 220 Apple Blossom Drive 1.69 1.69 1.69 1.69 1.69 1.69 1.69 1.69 1.69 1.69
Carville Mill Park UV2-N16 501 Marc Santi Blvd - - - 1.99 1.99 1.99 1.99 1.99 1.99 1.99
Clearview Park UV2-N19 150 Via Romano Blvd - - - - - - - - 3.39 3.39
Concord Community Park TN35 7894 Dufferin Street 1.39 1.39 1.39 1.39 1.39 1.39 1.39 1.39 1.39 1.39
Crossroads East UV2-N1 35 Maple Sugar Lane 0.47 0.47 0.47 0.47 0.47 0.47 0.47 0.47 0.47 0.47
Eagles Landing Park UV2-N6 180 Sir Benson Drive - - - 1.50 1.50 1.50 1.50 1.50 1.50 1.50
Forest View Park UV2-N5 125 Lady Delores Ave - - - 0.00 0.00 1.57 1.57 1.57 1.57 1.57
Freedom Trail Park UV2-N21 121 Freedom Trail - - 1.55 1.55 1.55 1.55 1.55 1.55 1.55 1.55
Heritage Park UV2-N18 631 Valley Vista Drive - - - - - - 1.38 1.38 1.38 1.38
Jack Pine Park UV2-N20 61 Petticoat Road - - 2.46 2.46 2.46 2.46 2.46 2.46 2.46 2.46
Langstaff Park TN36 Langstaff Rd 7.88 7.88 7.88 7.88 7.88 7.88 7.88 7.88 7.88 7.88
LeParc Park TN33 172 Connie Cres. 2.57 2.57 2.57 2.57 2.57 2.57 2.57 2.57 2.57 2.57
Mill Race Park UV2-N4 310 Thomas Cook Ave - - - - - - 2.26 2.26 2.26 2.26
Misty Sugar Park UV2-N8 Misty Sugar Trail 1.77 1.77 1.77 1.77 1.77 1.77 1.77 1.77 1.77 1.77
Mosswoood Park UV2-N11 641 Thornhill Woods Drive - 1.16 1.16 1.16 1.16 1.16 1.16 1.16 1.16 1.16
Ohr Menachem Park UV2-N2 55 Autumn Hill Boulevard 2.12 2.12 2.12 2.12 2.12 2.12 2.12 2.12 2.12 2.12
Pheasant Hollow Park UV2-N7 201 Peter Rupert Dr - - - - 1.99 1.99 1.99 1.99 1.99 1.99
Pioneer Park UV2-N15 105 Valley Vista Drive - - - - - - 2.25 2.25 2.25 2.25
Southview Park TN34 1 Southview Dr. 1.06 1.06 1.06 1.06 1.06 1.06 1.06 1.06 1.06 1.06
Spring Blossom Park UV2-N12 1 Apple Blossom Drive - - - - - - 1.29 1.29 1.29 1.29
Sugarbush Heritage Park UV2-N9 91 Thornhill Woods Drive 2.34 2.34 2.34 2.34 2.34 2.34 2.34 2.34 2.34 2.34
Thornhill Woods Park UV2-N3 289 Thornhill Woods Drive 2.52 2.52 2.52 2.52 2.52 2.52 2.52 2.52 2.52 2.52
Trail View Parkette UV2-N23 65 William Bowes Boulevard - - - 0.13 0.13 0.13 0.13 0.13 0.13 0.13
Twelve Oaks Park UV2-N17 525 Via Romano Boulevard - - - 3.17 3.17 3.17 3.17 3.17 3.17 3.17
West Crossroads Park TN19 130 Yellowwood Circle 0.38 0.38 0.38 0.38 0.38 0.38 0.38 0.38 0.38 0.38
Woodrose Park UV2-N13 189 Lady Fenyrose Ave - - - - 2.55 2.55 2.55 2.55 2.55 2.55
Woodrose Greenway LPN7 190 Lady Fenyrose Ave - - - - 0.52 0.52 0.52 0.52 0.52 0.52
Woodvalley Park UV2-N14 2 Marc Santi Boulevard 3.62 3.62 3.62 3.62 3.62 3.62 3.62 3.62 3.62 3.62
Total 32.17 33.33 37.35 44.14 49.21 50.78 57.96 57.96 61.35 61.35
# of Hectares
APPENDIX ETABLE 1 - PAGE 26
CITY OF VAUGHANINVENTORY OF CAPITAL ASSETS
COMMUNITY SERVICES PARKLAND
HEMSON
HEMSON
141
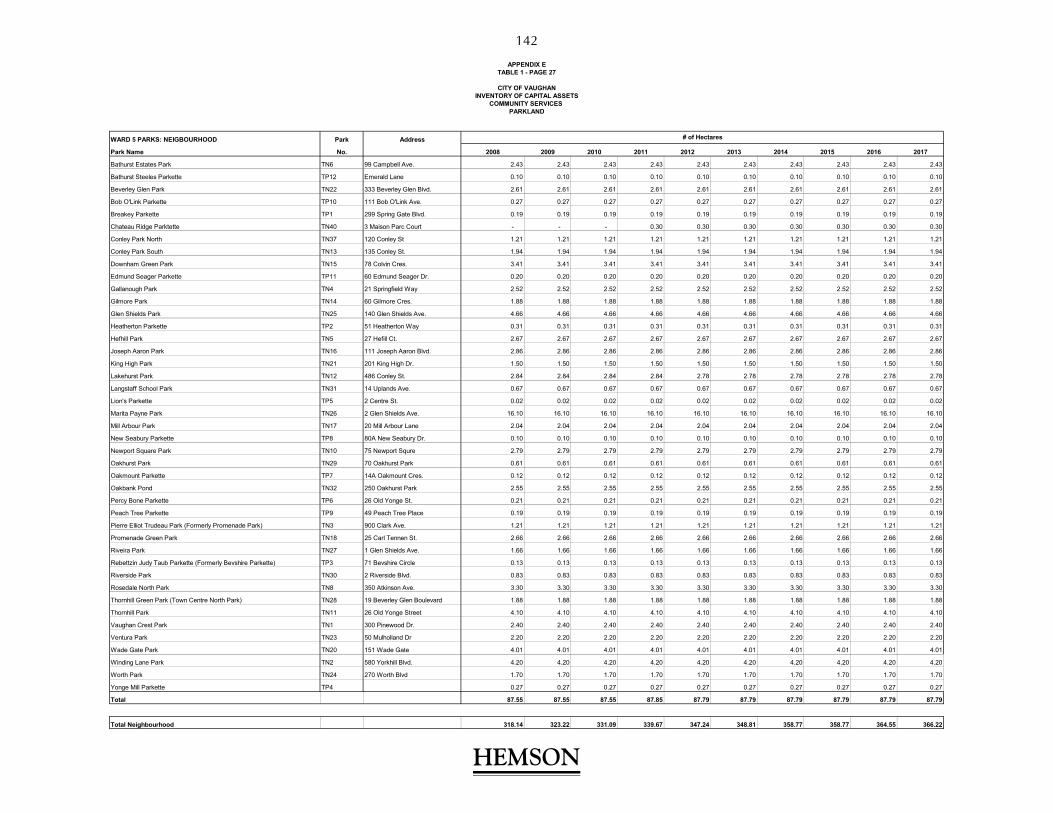
WARD 5 PARKS: NEIGBOURHOOD Park Address
Park Name No. 2008 2009 2010 2011 2012 2013 2014 2015 2016 2017
Bathurst Estates Park TN6 99 Campbell Ave. 2.43 2.43 2.43 2.43 2.43 2.43 2.43 2.43 2.43 2.43
Bathurst Steeles Parkette TP12 Emerald Lane 0.10 0.10 0.10 0.10 0.10 0.10 0.10 0.10 0.10 0.10
Beverley Glen Park TN22 333 Beverley Glen Blvd. 2.61 2.61 2.61 2.61 2.61 2.61 2.61 2.61 2.61 2.61
Bob O'Link Parkette TP10 111 Bob O'Link Ave. 0.27 0.27 0.27 0.27 0.27 0.27 0.27 0.27 0.27 0.27
Breakey Parkette TP1 299 Spring Gate Blvd. 0.19 0.19 0.19 0.19 0.19 0.19 0.19 0.19 0.19 0.19
Chateau Ridge Parktette TN40 3 Maison Parc Court - - - 0.30 0.30 0.30 0.30 0.30 0.30 0.30
Conley Park North TN37 120 Conley St 1.21 1.21 1.21 1.21 1.21 1.21 1.21 1.21 1.21 1.21
Conley Park South TN13 135 Conley St. 1.94 1.94 1.94 1.94 1.94 1.94 1.94 1.94 1.94 1.94
Downham Green Park TN15 78 Colvin Cres. 3.41 3.41 3.41 3.41 3.41 3.41 3.41 3.41 3.41 3.41
Edmund Seager Parkette TP11 60 Edmund Seager Dr. 0.20 0.20 0.20 0.20 0.20 0.20 0.20 0.20 0.20 0.20
Gallanough Park TN4 21 Springfield Way 2.52 2.52 2.52 2.52 2.52 2.52 2.52 2.52 2.52 2.52
Gilmore Park TN14 60 Gilmore Cres. 1.88 1.88 1.88 1.88 1.88 1.88 1.88 1.88 1.88 1.88
Glen Shields Park TN25 140 Glen Shields Ave. 4.66 4.66 4.66 4.66 4.66 4.66 4.66 4.66 4.66 4.66
Heatherton Parkette TP2 51 Heatherton Way 0.31 0.31 0.31 0.31 0.31 0.31 0.31 0.31 0.31 0.31
Hefhill Park TN5 27 Hefill Ct. 2.67 2.67 2.67 2.67 2.67 2.67 2.67 2.67 2.67 2.67
Joseph Aaron Park TN16 111 Joseph Aaron Blvd. 2.86 2.86 2.86 2.86 2.86 2.86 2.86 2.86 2.86 2.86
King High Park TN21 201 King High Dr. 1.50 1.50 1.50 1.50 1.50 1.50 1.50 1.50 1.50 1.50
Lakehurst Park TN12 486 Conley St. 2.84 2.84 2.84 2.84 2.78 2.78 2.78 2.78 2.78 2.78
Langstaff School Park TN31 14 Uplands Ave. 0.67 0.67 0.67 0.67 0.67 0.67 0.67 0.67 0.67 0.67
Lion's Parkette TP5 2 Centre St. 0.02 0.02 0.02 0.02 0.02 0.02 0.02 0.02 0.02 0.02
Marita Payne Park TN26 2 Glen Shields Ave. 16.10 16.10 16.10 16.10 16.10 16.10 16.10 16.10 16.10 16.10
Mill Arbour Park TN17 20 Mill Arbour Lane 2.04 2.04 2.04 2.04 2.04 2.04 2.04 2.04 2.04 2.04
New Seabury Parkette TP8 80A New Seabury Dr. 0.10 0.10 0.10 0.10 0.10 0.10 0.10 0.10 0.10 0.10
Newport Square Park TN10 75 Newport Squre 2.79 2.79 2.79 2.79 2.79 2.79 2.79 2.79 2.79 2.79
Oakhurst Park TN29 70 Oakhurst Park 0.61 0.61 0.61 0.61 0.61 0.61 0.61 0.61 0.61 0.61
Oakmount Parkette TP7 14A Oakmount Cres. 0.12 0.12 0.12 0.12 0.12 0.12 0.12 0.12 0.12 0.12
Oakbank Pond TN32 250 Oakhurst Park 2.55 2.55 2.55 2.55 2.55 2.55 2.55 2.55 2.55 2.55
Percy Bone Parkette TP6 26 Old Yonge St. 0.21 0.21 0.21 0.21 0.21 0.21 0.21 0.21 0.21 0.21
Peach Tree Parkette TP9 49 Peach Tree Place 0.19 0.19 0.19 0.19 0.19 0.19 0.19 0.19 0.19 0.19
Pierre Elliot Trudeau Park (Formerly Promenade Park) TN3 900 Clark Ave. 1.21 1.21 1.21 1.21 1.21 1.21 1.21 1.21 1.21 1.21
Promenade Green Park TN18 25 Carl Tennen St. 2.66 2.66 2.66 2.66 2.66 2.66 2.66 2.66 2.66 2.66
Riveira Park TN27 1 Glen Shields Ave. 1.66 1.66 1.66 1.66 1.66 1.66 1.66 1.66 1.66 1.66
Rebettzin Judy Taub Parkette (Formerly Bevshire Parkette) TP3 71 Bevshire Circle 0.13 0.13 0.13 0.13 0.13 0.13 0.13 0.13 0.13 0.13
Riverside Park TN30 2 Riverside Blvd. 0.83 0.83 0.83 0.83 0.83 0.83 0.83 0.83 0.83 0.83
Rosedale North Park TN8 350 Atkinson Ave. 3.30 3.30 3.30 3.30 3.30 3.30 3.30 3.30 3.30 3.30
Thornhill Green Park (Town Centre North Park) TN28 19 Beverley Glen Boulevard 1.88 1.88 1.88 1.88 1.88 1.88 1.88 1.88 1.88 1.88
Thornhill Park TN11 26 Old Yonge Street 4.10 4.10 4.10 4.10 4.10 4.10 4.10 4.10 4.10 4.10
Vaughan Crest Park TN1 300 Pinewood Dr. 2.40 2.40 2.40 2.40 2.40 2.40 2.40 2.40 2.40 2.40
Ventura Park TN23 50 Mulholland Dr 2.20 2.20 2.20 2.20 2.20 2.20 2.20 2.20 2.20 2.20
Wade Gate Park TN20 151 Wade Gate 4.01 4.01 4.01 4.01 4.01 4.01 4.01 4.01 4.01 4.01
Winding Lane Park TN2 580 Yorkhill Blvd. 4.20 4.20 4.20 4.20 4.20 4.20 4.20 4.20 4.20 4.20
Worth Park TN24 270 Worth Blvd 1.70 1.70 1.70 1.70 1.70 1.70 1.70 1.70 1.70 1.70
Yonge Mill Parkette TP4 0.27 0.27 0.27 0.27 0.27 0.27 0.27 0.27 0.27 0.27
Total 87.55 87.55 87.55 87.85 87.79 87.79 87.79 87.79 87.79 87.79
Total Neighbourhood 318.14 323.22 331.09 339.67 347.24 348.81 358.77 358.77 364.55 366.22
APPENDIX ETABLE 1 - PAGE 27
CITY OF VAUGHANINVENTORY OF CAPITAL ASSETS
COMMUNITY SERVICES
# of Hectares
PARKLAND
HEMSON
HEMSON
142

WARD 1 PARKS: PUBLIC SQUARE Park Address
Park Name No. 2008 2009 2010 2011 2012 2013 2014 2015 2016 2017
Purcell Parkette MP6 200 St. Joan of Arc Ave. 0.22 0.22 0.22 0.22 0.22 0.22 0.22 0.22 0.22 0.22
Total 0.22 0.22 0.22 0.22 0.22 0.22 0.22 0.22 0.22 0.22
WARD 2 PARKS: PUBLIC SQUARE Park Address
Park Name No. 2008 2009 2010 2011 2012 2013 2014 2015 2016 2017
Total 0.00 0.00 0.00 0.00 0.00 0.00 0.00 0.00 0.00 0.00
WARD 3 PARKS: PUBLIC SQUARE Park Address
Park Name No. 2008 2009 2010 2011 2012 2013 2014 2015 2016 2017
Total 0.00 0.00 0.00 0.00 0.00 0.00 0.00 0.00 0.00 0.00
WARD 4 PARKS: PUBLIC SQUARE Park Address
Park Name No. 2008 2009 2010 2011 2012 2013 2014 2015 2016 2017
Forest Run Park CC17-P8 29 Forest Run Blvd - - - - - - 0.09 0.09 0.09 0.09
Total 0.00 0.00 0.00 0.00 0.00 0.00 0.09 0.09 0.09 0.09
WARD 5 PARKS: PUBLIC SQUARE Park Address
Park Name No. 2008 2009 2010 2011 2012 2013 2014 2015 2016 2017
Total 0.00 0.00 0.00 0.00 0.00 0.00 0.00 0.00 0.00 0.00
# of Hectares
# of Hectares
# of Hectares
# of Hectares
# of Hectares
APPENDIX ETABLE 1 - PAGE 28
CITY OF VAUGHANINVENTORY OF CAPITAL ASSETS
PUBLIC SQUARESCOMMUNITY SERVICES
HEMSON
HEMSON
143
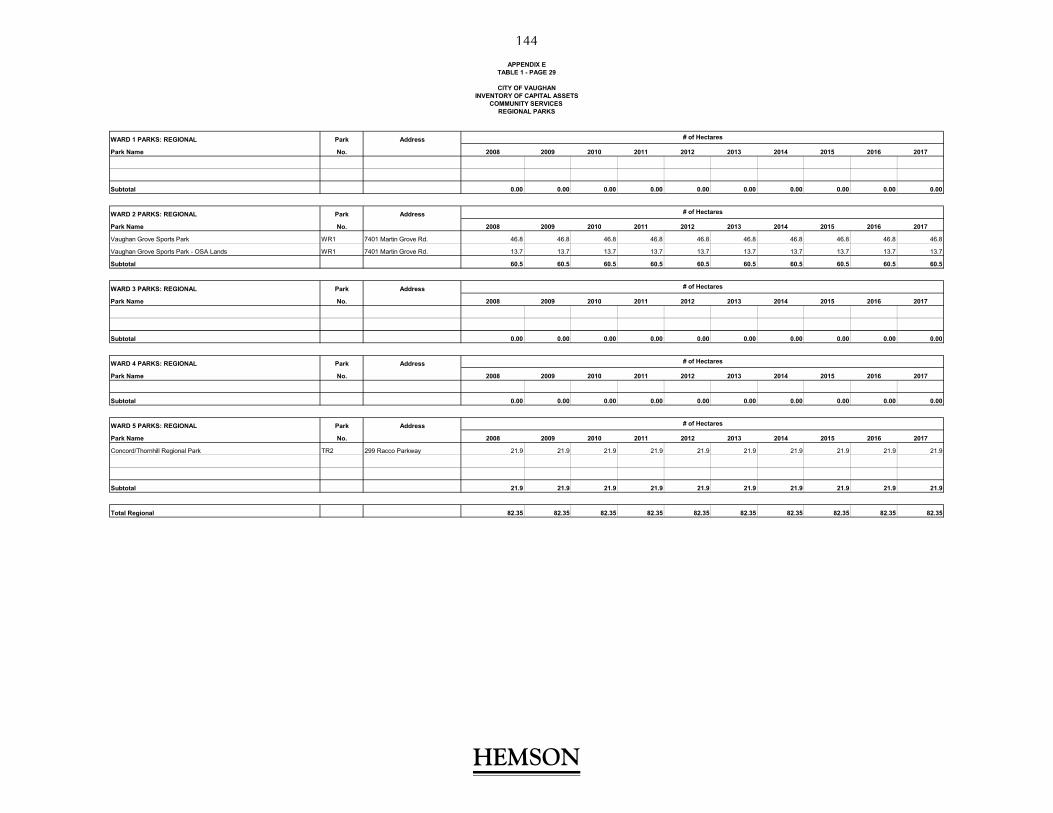
APPENDIX ETABLE 1 - PAGE 29
CITY OF VAUGHANINVENTORY OF CAPITAL ASSETS
REGIONAL PARKS
WARD 1 PARKS: REGIONAL Park Address
Park Name No. 2008 2009 2010 2011 2012 2013 2014 2015 2016 2017
Subtotal 0.00 0.00 0.00 0.00 0.00 0.00 0.00 0.00 0.00 0.00
WARD 2 PARKS: REGIONAL Park Address
Park Name No. 2008 2009 2010 2011 2012 2013 2014 2015 2016 2017
Vaughan Grove Sports Park WR1 7401 Martin Grove Rd. 46.8 46.8 46.8 46.8 46.8 46.8 46.8 46.8 46.8 46.8
Vaughan Grove Sports Park - OSA Lands WR1 7401 Martin Grove Rd. 13.7 13.7 13.7 13.7 13.7 13.7 13.7 13.7 13.7 13.7
Subtotal 60.5 60.5 60.5 60.5 60.5 60.5 60.5 60.5 60.5 60.5
WARD 3 PARKS: REGIONAL Park Address
Park Name No. 2008 2009 2010 2011 2012 2013 2014 2015 2016 2017
Subtotal 0.00 0.00 0.00 0.00 0.00 0.00 0.00 0.00 0.00 0.00
WARD 4 PARKS: REGIONAL Park Address
Park Name No. 2008 2009 2010 2011 2012 2013 2014 2015 2016 2017
Subtotal 0.00 0.00 0.00 0.00 0.00 0.00 0.00 0.00 0.00 0.00
WARD 5 PARKS: REGIONAL Park Address
Park Name No. 2008 2009 2010 2011 2012 2013 2014 2015 2016 2017
Concord/Thornhill Regional Park TR2 299 Racco Parkway 21.9 21.9 21.9 21.9 21.9 21.9 21.9 21.9 21.9 21.9
Subtotal 21.9 21.9 21.9 21.9 21.9 21.9 21.9 21.9 21.9 21.9
Total Regional 82.35 82.35 82.35 82.35 82.35 82.35 82.35 82.35 82.35 82.35
# of Hectares
# of Hectares
# of Hectares
# of Hectares
# of Hectares
COMMUNITY SERVICES
HEMSON
HEMSON
144
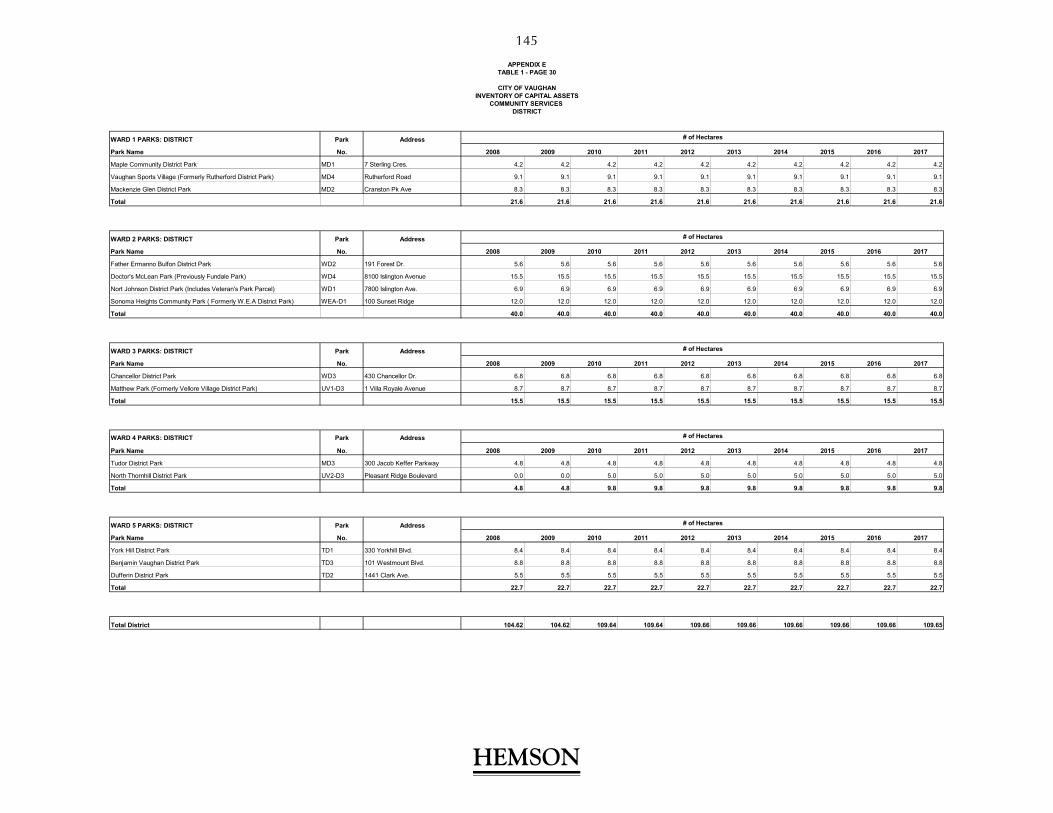
WARD 1 PARKS: DISTRICT Park Address
Park Name No. 2008 2009 2010 2011 2012 2013 2014 2015 2016 2017
Maple Community District Park MD1 7 Sterling Cres. 4.2 4.2 4.2 4.2 4.2 4.2 4.2 4.2 4.2 4.2
Vaughan Sports Village (Formerly Rutherford District Park) MD4 Rutherford Road 9.1 9.1 9.1 9.1 9.1 9.1 9.1 9.1 9.1 9.1
Mackenzie Glen District Park MD2 Cranston Pk Ave 8.3 8.3 8.3 8.3 8.3 8.3 8.3 8.3 8.3 8.3
Total 21.6 21.6 21.6 21.6 21.6 21.6 21.6 21.6 21.6 21.6
WARD 2 PARKS: DISTRICT Park Address
Park Name No. 2008 2009 2010 2011 2012 2013 2014 2015 2016 2017
Father Ermanno Bulfon District Park WD2 191 Forest Dr. 5.6 5.6 5.6 5.6 5.6 5.6 5.6 5.6 5.6 5.6
Doctor's McLean Park (Previously Fundale Park) WD4 8100 Islington Avenue 15.5 15.5 15.5 15.5 15.5 15.5 15.5 15.5 15.5 15.5
Nort Johnson District Park (Includes Veteran's Park Parcel) WD1 7800 Islington Ave. 6.9 6.9 6.9 6.9 6.9 6.9 6.9 6.9 6.9 6.9
Sonoma Heights Community Park ( Formerly W.E.A District Park) WEA-D1 100 Sunset Ridge 12.0 12.0 12.0 12.0 12.0 12.0 12.0 12.0 12.0 12.0
Total 40.0 40.0 40.0 40.0 40.0 40.0 40.0 40.0 40.0 40.0
WARD 3 PARKS: DISTRICT Park Address
Park Name No. 2008 2009 2010 2011 2012 2013 2014 2015 2016 2017
Chancellor District Park WD3 430 Chancellor Dr. 6.8 6.8 6.8 6.8 6.8 6.8 6.8 6.8 6.8 6.8
Matthew Park (Formerly Vellore Village District Park) UV1-D3 1 Villa Royale Avenue 8.7 8.7 8.7 8.7 8.7 8.7 8.7 8.7 8.7 8.7
Total 15.5 15.5 15.5 15.5 15.5 15.5 15.5 15.5 15.5 15.5
WARD 4 PARKS: DISTRICT Park Address
Park Name No. 2008 2009 2010 2011 2012 2013 2014 2015 2016 2017
Tudor District Park MD3 300 Jacob Keffer Parkway 4.8 4.8 4.8 4.8 4.8 4.8 4.8 4.8 4.8 4.8
North Thornhill District Park UV2-D3 Pleasant Ridge Boulevard 0.0 0.0 5.0 5.0 5.0 5.0 5.0 5.0 5.0 5.0
Total 4.8 4.8 9.8 9.8 9.8 9.8 9.8 9.8 9.8 9.8
WARD 5 PARKS: DISTRICT Park Address
Park Name No. 2008 2009 2010 2011 2012 2013 2014 2015 2016 2017
York Hill District Park TD1 330 Yorkhill Blvd. 8.4 8.4 8.4 8.4 8.4 8.4 8.4 8.4 8.4 8.4
Benjamin Vaughan District Park TD3 101 Westmount Blvd. 8.8 8.8 8.8 8.8 8.8 8.8 8.8 8.8 8.8 8.8
Dufferin District Park TD2 1441 Clark Ave. 5.5 5.5 5.5 5.5 5.5 5.5 5.5 5.5 5.5 5.5
Total 22.7 22.7 22.7 22.7 22.7 22.7 22.7 22.7 22.7 22.7
Total District 104.62 104.62 109.64 109.64 109.66 109.66 109.66 109.66 109.66 109.65
# of Hectares
# of Hectares
APPENDIX ETABLE 1 - PAGE 30
CITY OF VAUGHANINVENTORY OF CAPITAL ASSETS
DISTRICT
# of Hectares
# of Hectares
# of Hectares
COMMUNITY SERVICES
HEMSON
HEMSON
145

Development
Neighbourhood 2008 2009 2010 2011 2012 2013 2014 2015 2016 2017 Costs ($/ha.)
Ward 1 Parks : Neighbourhood 72.1 74.8 74.8 74.8 74.8 74.8 74.8 74.8 74.8 76.4 $ 372,000
Ward 2 Parks : Neighbourhood 70.6 71.0 71.0 71.0 70.9 70.9 71.1 71.1 71.1 71.1 $ 372,000
Ward 3 Parks : Neighbourhood 55.7 56.6 60.5 61.9 64.5 64.5 67.2 67.2 69.6 69.6 $ 372,000
Ward 4 Parks : Neighbourhood 32.2 33.3 37.3 44.1 49.2 50.8 58.0 58.0 61.3 61.3 $ 372,000
Ward 5 Parks : Neighbourhood 87.6 87.6 87.6 87.9 87.8 87.8 87.8 87.8 87.8 87.8 $ 372,000
Total (Hectares) 318.1 323.2 331.1 339.7 347.2 348.8 358.8 358.8 364.5 366.2
Total ($000) $118,346.7 $120,238.7 $123,167.0 $126,356.5 $129,172.5 $129,756.6 $133,461.7 $133,461.7 $135,611.9 $136,233.1
Note: All neighbourhood parks are consdered to be Type 2 Parks
Development
Public Square 2008 2009 2010 2011 2012 2013 2014 2015 2016 2017 Costs ($/ha.)
Ward 1 Parks : Public Square 0.22 0.22 0.22 0.22 0.22 0.22 0.22 0.22 0.22 0.22 $ 1,662,400
Ward 2 Parks : Public Square 0.00 0.00 0.00 0.00 0.00 0.00 0.00 0.00 0.00 0.00 $ 1,662,400
Ward 3 Parks : Public Square 0.00 0.00 0.00 0.00 0.00 0.00 0.00 0.00 0.00 0.00 $ 1,662,400
Ward 4 Parks : Public Square 0.00 0.00 0.00 0.00 0.00 0.00 0.09 0.09 0.09 0.09 $ 1,662,400
Ward 5 Parks : Public Square 0.00 0.00 0.00 0.00 0.00 0.00 0.00 0.00 0.00 0.00 $ 1,662,400
Total (Hectares) 0.22 0.22 0.22 0.22 0.22 0.22 0.31 0.31 0.31 0.31
Total ($000) $359.0 $359.0 $359.0 $359.0 $359.0 $359.0 $508.7 $508.7 $508.7 $508.7
Note: All public squares are consdered to be Type 2
COMMUNITY SERVICES
# of Hectares
# of Hectares
PARKLAND SUMMARY
APPENDIX ETABLE 1 - PAGE 31
CITY OF VAUGHANINVENTORY OF CAPITAL ASSETS
HEMSON
HEMSON
146

Development
District 2008 2009 2010 2011 2012 2013 2014 2015 2016 2017 Costs ($/ha.)
Ward 1 Parks : District 21.65 21.65 21.65 21.65 21.65 21.65 21.65 21.65 21.65 21.65 $ 487,700
Ward 2 Parks : District 40.03 40.03 40.03 40.03 40.03 40.03 40.03 40.03 40.03 40.03 $ 487,700
Ward 3 Parks : District 15.50 15.50 15.50 15.50 15.50 15.50 15.50 15.50 15.50 15.49 $ 487,700
Ward 4 Parks : District 4.76 4.76 9.78 9.78 9.80 9.80 9.80 9.80 9.80 9.80 $ 487,700
Ward 5 Parks : District 22.68 22.68 22.68 22.68 22.68 22.68 22.68 22.68 22.68 22.68 $ 487,700
Total (Hectares) 104.62 104.62 109.64 109.64 109.66 109.66 109.66 109.66 109.66 109.65
Total ($000) $51,022.4 $51,022.4 $53,470.7 $53,470.7 $53,480.4 $53,480.4 $53,480.4 $53,480.4 $53,480.4 $53,475.5
Development
Regional 2008 2009 2010 2011 2012 2013 2014 2015 2016 2017 Costs ($/ha.)
Ward 1 Parks : Regional 0.00 0.00 0.00 0.00 0.00 0.00 0.00 0.00 0.00 0.00 $ 430,100
Ward 2 Parks : Regional 60.45 60.45 60.45 60.45 60.45 60.45 60.45 60.45 60.45 60.45 $ 430,100
Ward 3 Parks : Regional 0.00 0.00 0.00 0.00 0.00 0.00 0.00 0.00 0.00 0.00 $ 430,100
Ward 4 Parks : Regional 0.00 0.00 0.00 0.00 0.00 0.00 0.00 0.00 0.00 0.00 $ 430,100
Ward 5 Parks : Regional 21.90 21.90 21.90 21.90 21.90 21.90 21.90 21.90 21.90 21.90 $ 430,100
Total (Hectares) 82.35 82.35 82.35 82.35 82.35 82.35 82.35 82.35 82.35 82.35
Total ($000) $35,418.7 $35,418.7 $35,418.7 $35,418.7 $35,418.7 $35,418.7 $35,418.7 $35,418.7 $35,418.7 $35,418.7
TOTAL PARKLAND (Ha) 505.3 510.4 523.3 531.9 539.5 541.0 551.1 551.1 556.9 558.5
TOTAL PARKLAND ($000) $205,146.8 $207,038.9 $212,415.4 $215,604.9 $218,430.7 $219,014.8 $222,869.5 $222,869.5 $225,019.7 $225,636.0
PARKLAND SUMMARY
APPENDIX ETABLE 1 - PAGE 32
CITY OF VAUGHANINVENTORY OF CAPITAL ASSETS
COMMUNITY SERVICES
# of Hectares
# of Hectares
HEMSON
HEMSON
147

CITY OF VAUGHANINVENTORY OF CAPITAL ASSETS
PARK FACILITIES
BASEBALL PREMIUM SENIOR LIT COM PARK UNIT COST
Park Name NUMBER 2008 2009 2010 2011 2012 2013 2014 2015 2016 2017 ($/facility)
Benjamin Vaughan District Park Baseball Premium Lit T TD3 1 1 1 1 1 1 1 1 1 1 $551,000
Bindertwine Park Baseball Premium Lit KL KN1 1 1 1 1 1 1 1 1 1 1 $551,000
Concord/Thornhill Park Baseball Premium Lit TH TR2 4 4 4 4 4 4 4 4 4 4 $551,000
Maple Community District Park Baseball Premium Lit MP MD1 1 1 1 1 1 1 1 1 1 1 $551,000
Nort Johnson Park Baseball Premium Lit WD WD1 2 2 2 2 2 2 2 2 2 2 $551,000
Tudor District Park Baseball Premium Lit TH MD3 3 3 3 3 3 3 3 3 3 3 $551,000
Vaughan Grove Sports Park Baseball Premium Lit WD WR1 4 4 4 4 4 4 4 4 4 4 $551,000
Vaughan Sports Village (Formerly Rutherford District Park) Baseball Premium Lit MP MD4 1 1 1 1 1 1 1 1 1 1 $551,000
Matthew Park (Frmly.Vellore Village District Park) Baseball Premium Lit WD UV1-D3 1 1 1 1 1 1 1 1 1 1 $551,000
Subtotal (#) 18 18 18 18 18 18 18 18 18 18
Subtotal ($) $9,918.0 $9,918.0 $9,918.0 $9,918.0 $9,918.0 $9,918.0 $9,918.0 $9,918.0 $9,918.0 $9,918.0
BASEBALL SENIOR LIT COM PARK UNIT COST
Park Name NUMBER 2008 2009 2010 2011 2012 2013 2014 2015 2016 2017 ($/facility)
Frank Robson Park Baseball Senior Lit MP MN5 1 1 1 1 1 1 1 1 1 1 $510,500
Marita Payne Park Baseball Senior Lit TH TN26 1 1 1 1 1 1 1 1 1 1 $510,500
Thornhill Park Baseball Senior Lit TH TN11 1 1 1 1 1 1 1 1 1 1 $510,500
Woodbridge College School Baseball Senior Lit WD WPSS1 1 1 1 1 1 1 1 1 1 1 $510,500
Yorkhill District Park Baseball Senior Lit TH TD1 2 2 2 2 2 2 2 2 2 2 $510,500
Sonoma Height Community Park (Frmly. W.E.A District Park) Baseball Senior Lit WD WEA-D1 1 1 1 1 1 1 1 1 1 1 $510,500
Subtotal (#) 7 7 7 7 7 7 7 7 7 7
Subtotal ($) $3,573.5 $3,573.5 $3,573.5 $3,573.5 $3,573.5 $3,573.5 $3,573.5 $3,573.5 $3,573.5 $3,573.5
BASEBALL SENIOR UNLIT COM PARK UNIT COST
Park Name NUMBER 2008 2009 2010 2011 2012 2013 2014 2015 2016 2017 ($/facility)
Wade Gate Park Baseball Senior Unlit TH TN20 1 1 1 1 1 1 1 1 1 1 $325,100
Calvary Church Sports Field Baseball Senior Unlit K KS1 1 1 1 1 1 1 1 1 1 1 $325,100
Giovanni Caboto Park Baseball Senior Unlit WD WN29 1 1 1 1 1 1 1 1 1 1 $325,100
Subtotal (#) 3 3 3 3 3 3 3 3 3 3
Subtotal ($000) $975.3 $975.3 $975.3 $975.3 $975.3 $975.3 $975.3 $975.3 $975.3 $975.3
APPENDIX ETABLE 1 - PAGE 33
# of facilities
# of facilities
# of facilities
COMMUNITY SERVICES
HEMSON
HEMSON
148
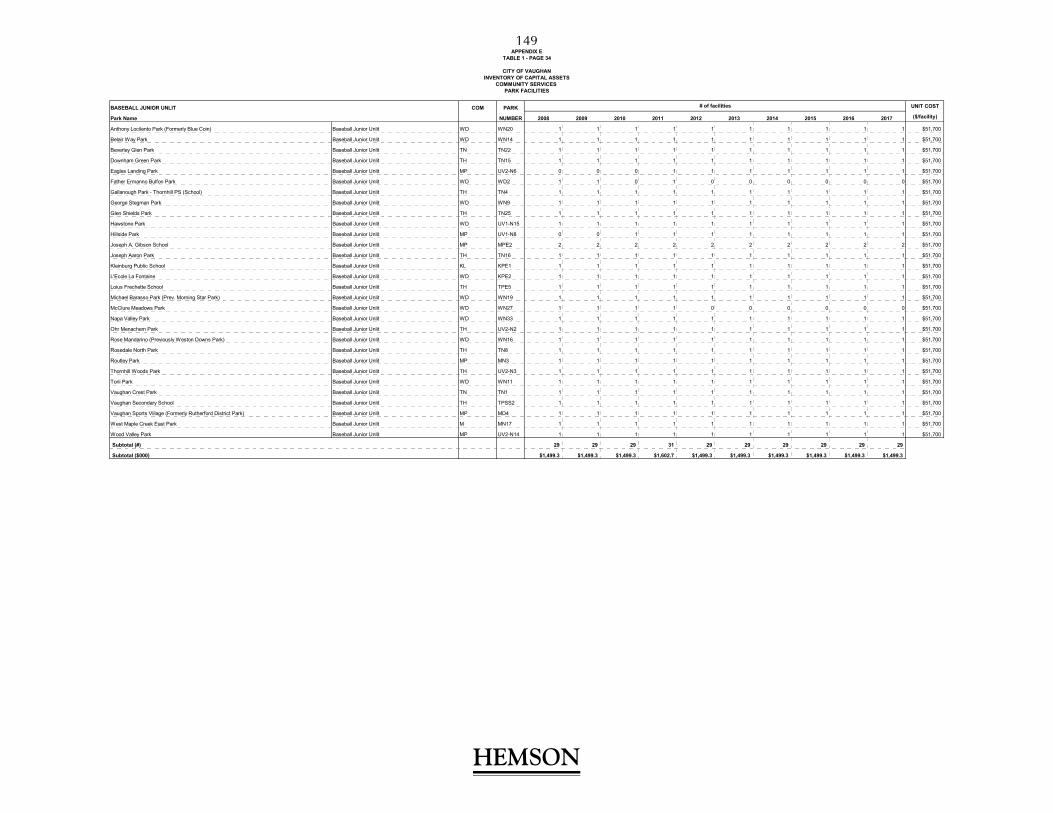
CITY OF VAUGHANINVENTORY OF CAPITAL ASSETS
PARK FACILITIES
BASEBALL JUNIOR UNLIT COM PARK UNIT COST
Park Name NUMBER 2008 2009 2010 2011 2012 2013 2014 2015 2016 2017 ($/facility)
Anthony Locilento Park (Formerly Blue Coin) Baseball Junior Unlit WD WN20 1 1 1 1 1 1 1 1 1 1 $51,700
Belair Way Park Baseball Junior Unlit WD WN14 1 1 1 1 1 1 1 1 1 1 $51,700
Beverley Glen Park Baseball Junior Unlit TN TN22 1 1 1 1 1 1 1 1 1 1 $51,700
Downham Green Park Baseball Junior Unlit TH TN15 1 1 1 1 1 1 1 1 1 1 $51,700
Eagles Landing Park Baseball Junior Unlit MP UV2-N6 0 0 0 1 1 1 1 1 1 1 $51,700
Father Ermanno Bulfon Park Baseball Junior Unlit WD WD2 1 1 0 1 0 0 0 0 0 0 $51,700
Gallanough Park - Thornhill PS (School) Baseball Junior Unlit TH TN4 1 1 1 1 1 1 1 1 1 1 $51,700
George Stegman Park Baseball Junior Unlit WD WN9 1 1 1 1 1 1 1 1 1 1 $51,700
Glen Shields Park Baseball Junior Unlit TH TN25 1 1 1 1 1 1 1 1 1 1 $51,700
Hawstone Park Baseball Junior Unlit WD UV1-N15 1 1 1 1 1 1 1 1 1 1 $51,700
Hillside Park Baseball Junior Unlit MP UV1-N8 0 0 1 1 1 1 1 1 1 1 $51,700
Joseph A. Gibson School Baseball Junior Unlit MP MPE2 2 2 2 2 2 2 2 2 2 2 $51,700
Joseph Aaron Park Baseball Junior Unlit TH TN16 1 1 1 1 1 1 1 1 1 1 $51,700
Kleinburg Public School Baseball Junior Unlit KL KPE1 1 1 1 1 1 1 1 1 1 1 $51,700
L'Ecole La Fontaine Baseball Junior Unlit WD KPE2 1 1 1 1 1 1 1 1 1 1 $51,700
Loius Frechette School Baseball Junior Unlit TH TPE5 1 1 1 1 1 1 1 1 1 1 $51,700
Michael Barasso Park (Prev. Morning Star Park) Baseball Junior Unlit WD WN19 1 1 1 1 1 1 1 1 1 1 $51,700
McClure Meadows Park Baseball Junior Unlit WD WN27 1 1 1 1 0 0 0 0 0 0 $51,700
Napa Valley Park Baseball Junior Unlit WD WN33 1 1 1 1 1 1 1 1 1 1 $51,700
Ohr Menachem Park Baseball Junior Unlit TH UV2-N2 1 1 1 1 1 1 1 1 1 1 $51,700
Rose Mandarino (Previously Weston Downs Park) Baseball Junior Unlit WD WN16 1 1 1 1 1 1 1 1 1 1 $51,700
Rosedale North Park Baseball Junior Unlit TH TN8 1 1 1 1 1 1 1 1 1 1 $51,700
Routley Park Baseball Junior Unlit MP MN3 1 1 1 1 1 1 1 1 1 1 $51,700
Thornhill Woods Park Baseball Junior Unlit TH UV2-N3 1 1 1 1 1 1 1 1 1 1 $51,700
Torii Park Baseball Junior Unlit WD WN11 1 1 1 1 1 1 1 1 1 1 $51,700
Vaughan Crest Park Baseball Junior Unlit TN TN1 1 1 1 1 1 1 1 1 1 1 $51,700
Vaughan Secondary School Baseball Junior Unlit TH TPSS2 1 1 1 1 1 1 1 1 1 1 $51,700
Vaughan Sports Village (Formerly Rutherford District Park) Baseball Junior Unlit MP MD4 1 1 1 1 1 1 1 1 1 1 $51,700
West Maple Creek East Park Baseball Junior Unlit M MN17 1 1 1 1 1 1 1 1 1 1 $51,700
Wood Valley Park Baseball Junior Unlit MP UV2-N14 1 1 1 1 1 1 1 1 1 1 $51,700
Subtotal (#) 29 29 29 31 29 29 29 29 29 29
Subtotal ($000) $1,499.3 $1,499.3 $1,499.3 $1,602.7 $1,499.3 $1,499.3 $1,499.3 $1,499.3 $1,499.3 $1,499.3
TABLE 1 - PAGE 34
# of facilities
APPENDIX E
COMMUNITY SERVICES
HEMSON
HEMSON
149

CITY OF VAUGHANINVENTORY OF CAPITAL ASSETS
PARK FACILITIES
T-BALL COM PARK UNIT COST
Park Name NUMBER 2008 2009 2010 2011 2012 2013 2014 2015 2016 2017 ($/facility)
Castlehill Park T-Ball MP MN6 1 1 1 1 1 1 1 1 1 1 $51,700
Comdel Park T-Ball WD UV1-N18 1 1 1 1 1 1 1 1 1 1 $51,700
Conley Park South T-Ball TH TN13 1 1 1 1 0 0 0 0 0 0 $51,700
Frank Robson Park T-Ball MP MN5 2 2 2 2 2 2 2 2 2 2 $51,700
Hefill Park T-Ball TH TN5 1 1 1 1 0 0 0 0 0 0 $51,700
Lakehurst Park T-Ball TH TN12 1 1 1 1 0 0 0 0 0 0 $51,700
Langstaff School Park T-Ball TH TN31 1 1 1 1 0 0 0 0 0 0 $51,700
Melville Park T-Ball MP MN9 1 1 1 1 0 0 0 0 0 0 $51,700
Rainbow Creek Park T-Ball WD WN1 1 1 1 1 0 0 0 0 0 0 $51,700
Nort Johnston Park T-Ball WD WD1 1 1 1 1 1 1 1 1 1 1 $51,700
Promenade Green Park T-Ball WD TN18 1 1 1 1 1 1 1 1 1 1 $51,700
Ramsey Armitage Park T-Ball MP MN4 1 1 1 1 1 1 1 1 1 1 $51,700
Subtotal (#) 13 13 13 13 7 7 7 7 7 7
Subtotal ($000) $672.1 $672.1 $672.1 $672.1 $361.9 $361.9 $361.9 $361.9 $361.9 $361.9
BATTING CAGE COM PARK UNIT COST
Park Name NUMBER 2008 2009 2010 2011 2012 2013 2014 2015 2016 2017 ($/facility)
Maple Community District Park Batting Cage WD MD1 1 1 1 1 1 1 1 1 1 1 $54,800
Vaughan Grove Sports Park Batting Cage WD WR1 2 2 2 2 2 2 2 2 2 2 $54,800
Subtotal (#) 3 3 3 3 3 3 3 3 3 3
Subtotal ($000) $164.4 $164.4 $164.4 $164.4 $164.4 $164.4 $164.4 $164.4 $164.4 $164.4
SENIOR SOCCER - ARTIFICIAL COM PARK UNIT COST
Park Name NUMBER 2008 2009 2010 2011 2012 2013 2014 2015 2016 2017 ($/facility)
Vaughan Grove Sports Park Artificial Turf WD WR1 1 1 1 1 1 1 1 1 1 1 $2,042,300
McNaughton Park Artificial Turf M MN10 0 0 1 1 1 1 1 1 1 1 $2,042,300
Concord Thornhill Regional Park - Converted from Senior to Artificial in 2013 Artificial Turf TH TR2 0 0 0 0 0 1 1 1 1 1 $2,042,300
Sonoma Heights Artificial Turf WD WEA-D1 0 0 0 1 1 1 1 1 1 1 $2,042,300
Subtotal (#) 1 1 2 3 3 4 4 4 4 4
Subtotal ($000) $2,042.3 $2,042.3 $4,084.6 $6,126.9 $6,126.9 $8,169.2 $8,169.2 $8,169.2 $8,169.2 $8,169.2
APPENDIX ETABLE 1 - PAGE 35
# of facilities
# of facilities
COMMUNITY SERVICES
# of facilities
HEMSON
HEMSON
150

CITY OF VAUGHANINVENTORY OF CAPITAL ASSETS
PARK FACILITIES
SENIOR SOCCER - LIT COM PARK UNIT COST
Park Name NUMBER 2008 2009 2010 2011 2012 2013 2014 2015 2016 2017 ($/facility)
Bindertwine Park Senior Soccer - Lit KL KN1 1 1 1 1 1 1 1 1 1 1 $378,700
Concord/Thornhill Park Premium Senior Soccer - Lit TH TR2 3 3 3 3 3 2 2 2 2 2 $695,100
Dufferin District Park Premium Senior Soccer - Lit TH TD2 2 2 2 2 2 2 2 2 2 2 $695,100
Father Ermanno Bulfon Park Premium Senior Soccer - Lit WD WD2 2 2 2 2 2 2 2 2 2 2 $695,100
Le Parc Park Premium Senior Soccer - Lit TH TN33 1 1 1 1 1 1 1 1 1 1 $695,100
Maple Community District Park Premium Senior Soccer - Lit MP MD1 1 1 1 1 1 1 1 1 1 1 $695,100
Maple Reservoir Park Senior Soccer - Lit MP MR1 2 2 2 2 2 2 2 2 2 2 $378,700
Rainbow Creek Park Premium Senior Soccer - Lit WD WN1 1 1 1 1 1 1 1 1 1 1 $695,100
Vaughan Grove Sports Park Premium Senior Soccer - Lit WD WR1 2 2 2 2 2 2 2 2 2 2 $695,100
Vaughan Grove Sports Park Senior Soccer Lit- Unlit (Installed new lighting 2017) WD WR1 0 0 0 0 0 0 0 0 0 2 $378,700
Matthew Park (Frmly.Vellore Village District Park) Premium Senior Soccer - Lit WD UV1-D3 1 1 1 1 1 1 1 1 1 1 $695,100
Woodbridge College School Premium Senior Soccer - Lit WD WPSS1 1 1 1 1 1 1 1 1 1 1 $695,100
Subtotal (#) 17 17 17 17 17 16 16 16 16 18
Subtotal ($000) $10,867.5 $10,867.5 $10,867.5 $10,867.5 $10,867.5 $10,172.4 $10,172.4 $10,172.4 $10,172.4 $10,929.8
SENIOR SOCCER - UNLIT COM PARK UNIT COST
Park Name NUMBER 2008 2009 2010 2011 2012 2013 2014 2015 2016 2017 ($/facility)
Benjamin Vaughan District Park Senior Soccer - Unlit TH TD3 1 1 1 1 1 1 1 1 1 1 $122,500
Calvary Baptist Church Senior Soccer - Unlit KL KS1 2 2 2 2 2 2 2 2 2 2 $122,500
Chancellor District Park Senior Soccer - Unlit WD WD3 1 1 1 1 1 1 1 1 1 1 $122,500
Concord Community Park Senior Soccer - Unlit TH TN35 2 2 2 2 2 2 2 2 2 2 $122,500
Dufferin District Park Senior Soccer - Unlit TH TD2 1 1 1 1 1 1 1 1 1 1 $122,500
Dufferin Street Reservoir Senior Soccer - Unlit TH TTR 1 1 1 1 0 0 0 0 0 0 $122,500
Emily Carr Secondary School (School Asset) Senior Soccer - Unlit WD WPSS3 1 1 1 1 1 1 1 1 1 1 $122,500
Holy Cross C.H.S. (School Asset) Senior Soccer - Unlit WD WSSS2 2 2 2 2 2 2 2 2 2 2 $122,500
L'Ecole La Fontaine (School Asset) Senior Soccer - Unlit WD KPE2 1 1 1 1 1 1 1 1 1 1 $122,500
Le Parc St. Jean de Brebeuf (School Asset) Senior Soccer - Unlit TH TN33 1 1 1 1 1 1 1 1 1 1 $122,500
MacKenzie Glen Disrtict Park Senior Soccer - Unlit MP MD2 1 1 1 1 1 1 1 1 1 1 $122,500
Maple High School (School Asset) Senior Soccer - Unlit MP MPSS1 1 1 1 1 1 1 1 1 1 1 $122,500
St Elizabeth Catholic H.S. (School Asset) Senior Soccer - Unlit TH TSSS1 1 1 1 1 1 1 1 1 1 1 $122,500
St James Catholic School (School Asset) Senior Soccer - Unlit MP MSE12 1 1 1 1 1 1 1 1 1 1 $122,500
Steven Lewis High School (School Asset) Senior Soccer - Unlit TH UV2-ES5 1 1 1 1 1 1 1 1 1 1 $122,500
Toronto District Christian H.S. (School Asset) Senior Soccer - Unlit WD WPSS2 1 1 1 1 1 1 1 1 1 1 $122,500
Twelve Oaks Park Senior Soccer - Unlit MP UV2-N17 0 0 0 1 1 1 1 1 1 1 $122,500
Vaughan Grove Sports Park Senior Soccer - Unlit (Installed new lighting 2017) WD WR1 2 2 2 2 2 2 2 2 2 0 $122,500
Vaughan Secondary School (School Asset) Senior Soccer - Unlit TH TPSS2 1 1 1 1 1 1 1 1 1 1 $122,500
Village Green Park Senior Soccer - Unlit WD UV1-N2 0 0 0 0 0 0 1 1 1 1 $122,500
Sonoma Height Community Park (Frmly. W.E.A District Park) Senior Soccer - Unlit WD WEA-D1 2 2 2 1 1 1 1 1 1 1 $122,500
Wade Gate Park Senior Soccer - Unlit TH TN20 1 1 1 1 1 1 1 1 1 1 $122,500
Westwind Park (New) Senior Soccer - Unlit MP UV1-N5 0 0 0 0 1 1 1 1 1 1 $122,500
Woodbridge College School (School Asset) Senior Soccer - Unlit WD WPSS1 1 1 1 1 1 1 1 1 1 1 $122,500
Wood Valley Park Senior Soccer - Unlit MP UV2-N14 0 1 1 1 1 1 1 1 1 1 $122,500
Worth Park Senior Soccer - Unlit TH TN24 1 1 1 1 1 1 1 1 1 1 $122,500
Subtotal (#) 27 28 28 28 28 28 29 29 29 27
Subtotal ($000) $3,307.5 $3,430.0 $3,430.0 $3,430.0 $3,430.0 $3,430.0 $3,552.5 $3,552.5 $3,552.5 $3,307.5
# of facilities
# of facilities
COMMUNITY SERVICES
APPENDIX ETABLE 1 - PAGE 36
HEMSON
HEMSON
151

CITY OF VAUGHANINVENTORY OF CAPITAL ASSETS
PARK FACILITIES
9V9 Soccer COM PARK UNIT COST
Park Name NUMBER 2008 2009 2010 2011 2012 2013 2014 2015 2016 2017 ($/facility)
Clearview Park 9V9 Soccer MA UV2-N19 0 0 0 0 0 0 0 0 1 1 $42,500
Lawford Park 9V9 Soccer WD UV1-D4 0 0 0 0 0 0 0 0 1 1 $42,500
Maple Reservoir 9V9 Soccer MA MR 0 0 0 0 0 0 0 1 1 1 $42,500
McClure Meadows Park 9V9 Soccer WD WN27 1 1 1 1 1 1 1 1 1 1 $42,500
Mill Race Park 9V9 Soccer TH UV2-N4 0 0 0 0 0 0 1 1 1 1 $42,500
St. James 9V9 Soccer MA 1 1 1 1 1 1 1 1 1 1 $42,500
Venice Gate Park 9V9 Soccer MA UV1-N6 0 0 0 1 1 1 1 1 1 1 $42,500
Worth Park 9V9 Soccer TH TN24 1 1 1 1 1 1 1 1 1 1 $42,500
Subtotal (#) 3 3 3 4 4 4 5 6 8 8
Subtotal ($000) $127.5 $127.5 $127.5 $170.0 $170.0 $170.0 $212.5 $255.0 $340.0 $340.0
MINI SOCCER COM PARK UNIT COST
Park Name NUMBER 2008 2009 2010 2011 2012 2013 2014 2015 2016 2017 ($/facility)
Agostino Park (1 field, 1 in design/construction) Mini Soccer TH TN39 1 1 2 2 1 1 1 1 1 1 $19,600
Ahmadiyya Park Mini Soccer MP UV1-N7 1 1 1 1 1 1 1 1 1 1 $19,600
Alexander Elisa Park (School Asset) Mini Soccer WD WN12 1 1 1 1 1 1 1 1 1 1 $19,600
Bathurst Estates Park Mini Soccer TH TN6 1 1 1 1 1 1 1 1 1 1 $19,600
Belair Way Park (School Asset) Mini Soccer WD WN14 1 1 1 1 1 1 1 1 1 1 $19,600
Bindertwine Park Mini Soccer KL KN1 1 1 1 1 1 1 1 1 1 1 $19,600
Bishop Scalabrini C.S. (School Asset) Mini Soccer TH TSE1 1 1 1 1 1 1 1 1 1 1 $19,600
Calvary Church Sports Park Mini Soccer KL KS1 2 2 2 2 2 2 2 2 2 2 $19,600
Carrville Mill Park Mini Soccer TH UV2-N16 0 0 0 1 1 1 1 1 1 1 $19,600
Castlehill Park Mini Soccer MP MN6 2 2 2 2 2 2 2 2 2 2 $19,600
Chancellor District Park Mini Soccer WD WD3 4 4 4 4 4 4 4 4 4 4 $19,600
Concord Thornhill Regional Park Mini Soccer TH TR2 1 1 1 1 1 1 1 1 1 1 $19,600
Comdel Park Mini Soccer WD UV7-N18 1 1 1 1 0 0 0 0 0 0 $19,600
Concord Community Park Mini Soccer TH TN35 2 2 2 2 0 0 0 0 0 0 $19,600
Conley Park South Mini Soccer TH TN13 1 1 1 1 0 0 0 0 0 0 $19,600
Crofters Park (School Asset) Mini Soccer WD WN17 1 1 1 1 1 1 1 1 1 1 $19,600
Discovery Park Mini Soccer MP UV1-N19 1 1 1 1 1 1 1 1 1 1 $19,600
Divine Mercy Catholic School (School Asset) Mini Soccer MP MSE5 1 1 1 1 1 1 1 1 1 1 $19,600
Downham Green Park Mini Soccer TH TN15 1 1 1 1 1 1 1 1 1 1 $19,600
Dufferin District Park Mini Soccer TH TD2 1 1 1 1 1 1 1 1 1 1 $19,600
Fazia Mahdi Park Mini Soccer MP UV1-N22 1 1 1 1 1 1 1 1 1 1 $19,600
Freedom Trail Mini Soccer MP UV2-N21 0 0 1 1 1 1 1 1 1 1 $19,600
Fossil Hill Park Mini Soccer WD WN35 1 1 1 1 1 1 1 1 1 1 $19,600
Gallanough Park Mini Soccer TH TN4 1 1 1 1 1 1 1 1 1 1 $19,600
Gilmore Park Mini Soccer TH TN14 1 1 1 1 1 1 1 1 1 1 $19,600
Giovanni Caboto Park (Prev. Glen Villa Park) Mini Soccer WD WN29 2 2 2 2 2 2 2 2 2 2 $19,600
Glen Shields Park Mini Soccer TH TN25 1 1 1 1 1 1 1 1 1 1 $19,600
Hawstone Park Mini Soccer WD UV1-N15 1 1 1 1 1 1 1 1 1 1 $19,600
Hillside Park Mini Soccer MP UV1-N8 0 0 1 1 1 1 1 1 1 1 $19,600
Jack Pine Park Mini Soccer MP UV2-N20 0 0 1 1 1 1 1 1 1 1 $19,600
Joey Panetta Park (Marieta) Mini Soccer WD WN15 1 1 1 1 0 0 0 0 0 0 $19,600
Joseph A. Gibson School (School Asset) Mini Soccer MP MPE2 1 1 1 1 1 1 1 1 1 1 $19,600
Joseph Aaron Park Mini Soccer TH TN16 1 1 1 1 1 1 1 1 1 1 $19,600
Julliard Park Mini Soccer MP VCC-N2 0 1 1 1 1 1 1 1 1 1 $19,600
Kingsview Park Mini Soccer WD UV1-N4 1 1 1 1 1 1 1 1 1 1 $19,600
Kleinburg Public School (School Asset) Mini Soccer KL KPE1 3 3 3 3 3 3 3 3 3 3 $19,600
Lakehurst Park Mini Soccer TH TN12 1 1 1 1 1 1 1 1 1 1 $19,600
Le Petit Prince School (School Asset) Mini Soccer MP MSE4 1 1 1 1 1 1 1 1 1 1 $19,600
L'Ecole La Fontaine (School Asset) Mini Soccer KL KPE2 1 1 1 1 1 1 1 1 1 1 $19,600
Loius Frechette School (School Asset) Mini Soccer TH TPE5 1 1 1 1 1 1 1 1 1 1 $19,600
MacKenzie Glen Disrtict Park (School Asset - Mackenzie Glen PS) Mini Soccer MP MD2 1 1 1 1 1 1 1 1 1 1 $19,600
Maple Airport Park (Changed to 2 Mini Mini Soccer Fields) Mini Soccer MP MN7 1 1 1 1 0 0 0 0 0 0 $19,600
APPENDIX ETABLE 1 - PAGE 37
# of facilities
# of facilities
COMMUNITY SERVICES
HEMSON
HEMSON
152

CITY OF VAUGHANINVENTORY OF CAPITAL ASSETS
PARK FACILITIES
MINI SOCCER CONT'D COM PARK UNIT COST
Park Name NUMBER 2008 2009 2010 2011 2012 2013 2014 2015 2016 2017 ($/facility)
Maple Community District Park (School Asset - St. David) Mini Soccer MP MD1 1 1 1 1 1 1 1 1 1 1 $19,600
Maple Reservoir Park Mini Soccer (Changed to 9V9 in 2015) MP MR1 1 1 1 1 1 1 1 0 0 0 $19,600
Marco Park (Previously Airdrie Park) (School Asset - St. Francis of Assisi) Mini Soccer WD WN8 1 1 1 1 1 1 1 1 1 1 $19,600
Marita Payne Park Mini Soccer TH TN26 1 1 1 1 1 1 1 1 1 1 $19,600
Mast Road Park Mini Soccer MP UV1-N20 2 2 2 2 2 2 2 2 2 2 $19,600
Melville Park Mini Soccer MP MN9 1 1 1 1 1 1 1 1 1 1 $19,600
Michael Barasso Park (Prev. Morning Star Park) (School Asset - San Marco CS) Mini Soccer WD WN19 1 1 1 1 1 1 1 1 1 1 $19,600
Michael Cranny P.S. (School Asset) Mini Soccer MP MPE3 1 1 1 1 1 1 1 1 1 1 $19,600
Mill Arbour Park Mini Soccer TH TN17 1 1 1 1 1 1 1 1 1 1 $19,600
Miriam Segal Park (formally Apple Blossom) Mini Soccer TH UV2-N10 1 1 1 1 1 1 1 1 1 1 $19,600
Misty Sugar Park Mini Soccer TH UV2-N8 1 1 1 1 1 1 1 1 1 1 $19,600
Napa Valley Park Mini Soccer WD WN33 1 1 1 1 1 1 1 1 1 1 $19,600
North Thornhill District Park Mini Soccer TH UV2-D3 0 2 2 2 2 2 2 2 2 2 $19,600
Ohr Menachem Park Mini Soccer TH UV2-N2 0 1 1 1 1 1 1 1 1 1 $19,600
Our Lady of Peace School (School Asset) Mini Soccer MP MSE1 1 1 1 1 1 1 1 1 1 1 $19,600
Our Lady of the Rosary C.S. (School Asset) Mini Soccer TH TSE4 1 1 1 1 1 1 1 1 1 1 $19,600
Pine Grove Public School/Hayhoe Park (School Asset) Mini Soccer WD WPE2 1 1 1 1 1 1 1 1 1 1 $19,600
Rainbow Creek Park (School Asset - St. Peter CS) Mini Soccer W WN1 0 0 0 0 1 1 1 1 1 1 $19,600
Ramsey Armitage Park Mini Soccer MP MN4 1 1 1 1 1 1 1 1 1 1 $19,600
Reeves Park Mini Soccer MP MN2 1 1 1 1 1 1 1 1 1 1 $19,600
Riverside Park Mini Soccer TH TN30 1 1 1 1 1 1 1 1 1 1 $19,600
Robert Watson Memorial Park Mini Soccer WD WN10 1 1 1 1 1 1 1 1 1 1 $19,600
Rosedale North Park Mini Soccer TH TN8 1 1 1 1 0 0 0 0 0 0 $19,600
Sonoma Height Community Park (Frmly. W.E.A District Park) Mini Soccer WD WEA-D1 2 2 2 2 2 2 2 2 2 2 $19,600
Spring Blossom Park (New) Mini Soccer TH UV2-N12 0 0 0 0 0 0 1 1 1 1 $19,600
St John Bosco C.S. (School Asset) Mini Soccer WD WSE11 1 1 1 1 1 1 1 1 1 1 $19,600
St Margaret Mary School (School Asset) Mini Soccer WD WSE4 1 1 1 1 1 1 1 1 1 1 $19,600
St. Angela Merici (School Asset) Mini Soccer WD WSE17 1 1 1 1 1 1 1 1 1 1 $19,600
St. Francis Assisi (School Asset) Mini Soccer WD WSE6 1 1 1 1 1 1 1 1 1 1 $19,600
Starling Park Mini Soccer UV1 UV1-N1 1 1 1 1 1 1 1 1 1 1 $19,600
Tammy Breda Park (Prev. Forest Fountain Park) Mini Soccer WD WN36 1 1 1 1 1 1 1 1 1 1 $19,600
Thornhill Woods Park Mini Soccer TH UV2-N3 0 0 0 1 1 1 1 1 1 $19,600
Torii Park Mini Soccer WD WN11 1 1 1 1 0 0 0 0 0 0 $19,600
UV1-N4 is Kingsview Park Mini Soccer UV1 UV1-N4 1 1 1 1 1 1 1 1 1 1 $19,600
Vaughan Grove Sports Park Mini Soccer WD WR1 2 2 2 2 2 2 2 2 2 2 $19,600
Vellore Woods P.S. (School Asset) Mini Soccer WD UV1-SES6 1 1 1 1 1 1 1 1 1 1 $19,600
Ventura Park (Split between St. Ventura PS and Ventura Park) Mini Soccer TH TN23 1 1 1 1 1 1 1 1 1 1 $19,600
Via Campanile Park Mini Soccer WD UV1-N3 1 1 1 1 1 1 1 1 1 1 $19,600
Via Verde Park (Sonoma Heights) Mini Soccer WD WEA-N4 1 1 1 1 1 1 1 1 1 1 $19,600
Woodrose Park Mini Soccer MP UV2-N13 0 0 0 0 0 1 1 1 1 1 $19,600
Yorkhill District Park (Split between St. Bishop Scalabrini & Yorkhill District Park) Mini Soccer TH TD1 1 1 1 1 1 1 1 1 1 1 $19,600
Subtotal (#) 84 88 92 93 86 87 88 87 87 87
Subtotal ($000) $1,646.4 $1,724.8 $1,803.2 $1,822.8 $1,685.6 $1,705.2 $1,724.8 $1,705.2 $1,705.2 $1,705.2
APPENDIX ETABLE 1 - PAGE 38
# of facilities
COMMUNITY SERVICES
HEMSON
HEMSON
153
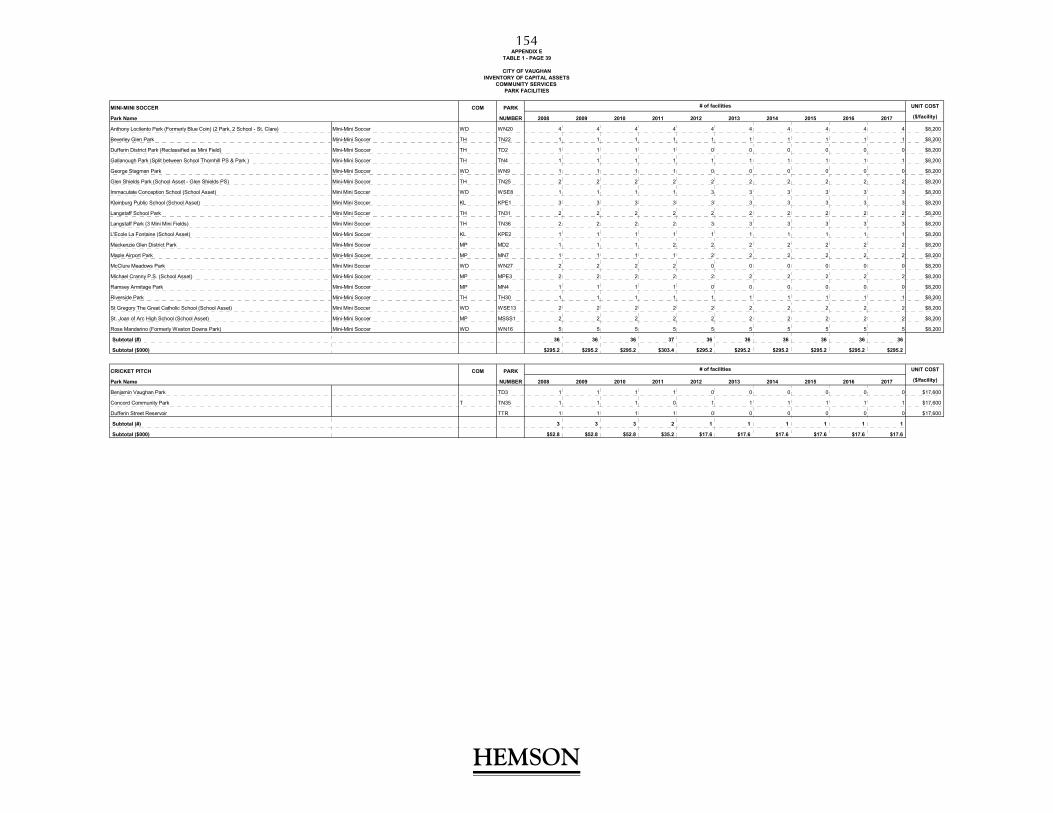
CITY OF VAUGHANINVENTORY OF CAPITAL ASSETS
PARK FACILITIES
MINI-MINI SOCCER COM PARK UNIT COST
Park Name NUMBER 2008 2009 2010 2011 2012 2013 2014 2015 2016 2017 ($/facility)
Anthony Locilento Park (Formerly Blue Coin) (2 Park, 2 School - St. Clare) Mini-Mini Soccer WD WN20 4 4 4 4 4 4 4 4 4 4 $8,200
Beverley Glen Park Mini-Mini Soccer TH TN22 1 1 1 1 1 1 1 1 1 1 $8,200
Dufferin District Park (Reclassified as Mini Field) Mini-Mini Soccer TH TD2 1 1 1 1 0 0 0 0 0 0 $8,200
Gallanough Park (Split between School Thornhill PS & Park ) Mini-Mini Soccer TH TN4 1 1 1 1 1 1 1 1 1 1 $8,200
George Stagman Park Mini-Mini Soccer WD WN9 1 1 1 1 0 0 0 0 0 0 $8,200
Glen Shields Park (School Asset - Glen Shields PS) Mini-Mini Soccer TH TN25 2 2 2 2 2 2 2 2 2 2 $8,200
Immaculate Conception School (School Asset) Mini Mini Soccer WD WSE8 1 1 1 1 3 3 3 3 3 3 $8,200
Kleinburg Public School (School Asset) Mini Mini Soccer KL KPE1 3 3 3 3 3 3 3 3 3 3 $8,200
Langstaff School Park Mini Mini Soccer TH TN31 2 2 2 2 2 2 2 2 2 2 $8,200
Langstaff Park (3 Mini Mini Fields) Mini Mini Soccer TH TN36 2 2 2 2 3 3 3 3 3 3 $8,200
L'Ecole La Fontaine (School Asset) Mini-Mini Soccer KL KPE2 1 1 1 1 1 1 1 1 1 1 $8,200
Mackenzie Glen District Park Mini-Mini Soccer MP MD2 1 1 1 2 2 2 2 2 2 2 $8,200
Maple Airport Park Mini-Mini Soccer MP MN7 1 1 1 1 2 2 2 2 2 2 $8,200
McClure Meadows Park Mini Mini Soccer WD WN27 2 2 2 2 0 0 0 0 0 0 $8,200
Michael Cranny P.S. (School Asset) Mini-Mini Soccer MP MPE3 2 2 2 2 2 2 2 2 2 2 $8,200
Ramsey Armitage Park Mini-Mini Soccer MP MN4 1 1 1 1 0 0 0 0 0 0 $8,200
Riverside Park Mini-Mini Soccer TH TH30 1 1 1 1 1 1 1 1 1 1 $8,200
St Gregory The Great Catholic School (School Asset) Mini Mini Soccer WD WSE13 2 2 2 2 2 2 2 2 2 2 $8,200
St. Joan of Arc High School (School Asset) Mini-Mini Soccer MP MSSS1 2 2 2 2 2 2 2 2 2 2 $8,200
Rose Mandarino (Formerly Weston Downs Park) Mini-Mini Soccer WD WN16 5 5 5 5 5 5 5 5 5 5 $8,200
Subtotal (#) 36 36 36 37 36 36 36 36 36 36
Subtotal ($000) $295.2 $295.2 $295.2 $303.4 $295.2 $295.2 $295.2 $295.2 $295.2 $295.2
CRICKET PITCH COM PARK UNIT COST
Park Name NUMBER 2008 2009 2010 2011 2012 2013 2014 2015 2016 2017 ($/facility)
Benjamin Vaughan Park TD3 1 1 1 1 0 0 0 0 0 0 $17,600
Concord Community Park T TN35 1 1 1 0 1 1 1 1 1 1 $17,600
Dufferin Street Reservoir TTR 1 1 1 1 0 0 0 0 0 0 $17,600
Subtotal (#) 3 3 3 2 1 1 1 1 1 1
Subtotal ($000) $52.8 $52.8 $52.8 $35.2 $17.6 $17.6 $17.6 $17.6 $17.6 $17.6
APPENDIX ETABLE 1 - PAGE 39
# of facilities
# of facilities
COMMUNITY SERVICES
HEMSON
HEMSON
154

CITY OF VAUGHANINVENTORY OF CAPITAL ASSETS
PARK FACILITIES
BEACH VOLLEYBALL COURT COM PARK UNIT COST
Park Name NUMBER 2008 2009 2010 2011 2012 2013 2014 2015 2016 2017 ($/facility)
Mosswood Park UV2-N11 0 1 1 1 1 1 1 1 1 1 $34,000
Subtotal (#) - 1 1 1 1 1 1 1 1 1
Subtotal ($000) $0.0 $34.0 $34.0 $34.0 $34.0 $34.0 $34.0 $34.0 $34.0 $34.0
TENNIS COURTS - LIT COM PARK UNIT COST
Park Name NUMBER 2008 2009 2010 2011 2012 2013 2014 2015 2016 2017 ($/facility)
Anthony Locilento Park (Formerly Blue Coin) ASPHALT WD WN20 3 3 3 3 3 3 3 3 3 3 $106,950
Bindertwine Park PENETRATED ASPHALT, FIBERGLASS & ACRYLIC KL KN1 3 3 3 3 3 3 3 3 3 3 $106,950
Conley Park South ASPHALT TH TN13 3 3 3 3 3 3 3 3 3 3 $106,950
Giovanni Caboto Park ASPHALT WD WN29 3 3 3 3 3 3 3 3 3 3 $106,950
Glen Shields Park ASPHALT & ACRYLIC WD TN25 3 3 3 3 3 3 3 3 3 3 $106,950
Joey Panetta Park (Marieta) PENETRATED ASPHALT & ACRYLIC WD WN15 3 3 3 3 3 3 3 3 3 3 $106,950
Kiloran Park PENETRATED ASPHALT WD WN7 3 3 3 3 3 3 3 3 3 3 $106,950
Le Parc Park ASPHALT TH TN33 2 2 2 2 2 2 2 2 2 2 $106,950
Maple Community District Park PENETRATED ASPHALT MP MD1 2 2 2 2 2 2 2 2 2 2 $106,950
Marco Park (Previously Airdrie Park) ASPHALT WD WN8 3 3 3 3 3 3 3 3 3 3 $106,950
Maxey Park ASPHALT & ACRYLIC WD WN4 2 2 2 2 2 2 2 2 2 2 $106,950
Ohr Manachem Park ASPHALT & ACRYLIC TH UV2-N2 2 2 2 2 0 0 0 0 0 0 $106,950
Promenade Green Park PENETRATED ASPHALT WD TN18 3 3 3 3 3 3 3 3 3 3 $106,950
Rainbow Creek Park ASPHALT WD WN1 2 2 2 2 2 2 2 2 2 2 $106,950
Southview Park PENETRATED ASPHALT, FIBERGLASS & ACRYLIC TH TN34 2 2 2 2 2 2 2 2 2 2 $106,950
Thornhill Park ASPHALT & ACRYLIC TH TN11 4 4 4 4 4 4 4 4 4 4 $106,950
Torii Park PENETRATED ASPHALT WD WN11 3 3 3 3 3 3 3 3 3 3 $106,950
Twelve Oaks Park ASPHALT & ACRYLIC MP UV2-N17 0 0 0 2 2 2 2 2 2 2 $106,950
Vaughan Crest Park PENETRATED ASPHALT & ACRYLIC TH TN1 3 3 3 3 3 3 3 3 3 3 $106,950
Vaughan Mills Park ASPHALT WD WN24 2 2 2 2 2 2 2 2 2 2 $106,950
Matthew Park (Frmly.Vellore Village District Park) ASPHALT WD UV1-D3 2 2 2 2 2 2 2 2 2 2 $106,950
Sonoma Height Community Park (Frmly. W.E.A District Park) ASPHALT WD WEA-D1 2 2 2 2 2 2 2 2 2 2 $106,950
Rose Mandarino (Formerly Weston Downs Park) ASPHALT & ACRYLIC WD WN16 3 3 3 3 3 3 3 3 3 3 $106,950
Westwind Park ASPHALT & ACRYLIC MP UV1-N5 0 0 0 0 2 2 2 2 2 2 $106,950
Woodbridge Highlands Park ASPHALT WD WN22 2 2 2 2 2 2 2 2 2 2 $106,950
Yorkhill District Park PENETRATED ASPHALT TH TD1 6 6 6 6 6 6 6 6 6 6 $106,950
Subtotal (#) 66 66 66 68 68 68 68 68 68 68
Subtotal ($000) $7,058.7 $7,058.7 $7,058.7 $7,272.6 $7,272.6 $7,272.6 $7,272.6 $7,272.6 $7,272.6 $7,272.6
APPENDIX ETABLE 1 - PAGE 40
COMMUNITY SERVICES
# of facilities
# of facilities
HEMSON
HEMSON
155

CITY OF VAUGHANINVENTORY OF CAPITAL ASSETS
PARK FACILITIES
TENNIS COURTS - UNLIT COM PARK UNIT COST
Park Name NUMBER 2008 2009 2010 2011 2012 2013 2014 2015 2016 2017 ($/facility)
Ahmadiyya Park ASPHALT MP UV1-N7 2 2 2 2 2 2 2 2 2 2 $75,150
Bathurst Estates Park PENETRATED ASPHALT & ACRYLIC TH TN6 3 3 3 3 3 3 3 3 3 3 $75,150
Brett Yerex Park ASPHALT MP MN20 1 1 1 1 1 1 1 1 1 1 $75,150
Civic Park PENETRATED ASPHALT & ACRYLIC MP MN1 0 0 0 0 0 0 0 0 2 2 $75,150
Crofters Park ASPHALT WD WN17 2 2 2 2 2 2 2 2 2 2 $75,150
Dufferin District Park PENETRATED ASPHALT & ACRYLIC TH TD2 3 3 3 3 3 3 3 3 3 3 $75,150
George Stegman Park ASPHALT WD WN9 3 3 3 3 3 3 3 3 3 3 $75,150
Hawstone Park ASPHALT WD UV1-N15 1 1 1 1 1 1 1 1 1 1 $75,150
Hefhill Park PENETRATED ASPHALT & ACRYLIC TH TN5 2 2 2 2 2 2 2 2 2 2 $75,150
King High Park (Reclassified as UNLIT) ASPHALT TH TN21 1 1 1 1 1 1 1 1 1 1 $75,150
Komura Parkette ASPHALT MP VCC-N3 1 1 1 1 1 1 1 1 1 1 $75,150
Mapes Park ASPHALT WD WN18 2 2 2 2 2 2 2 2 2 2 $75,150
Maple Trails Park ASPHALT MP MN19 1 1 1 1 1 1 1 1 1 1 $75,150
Mast Road Park ASPHALT MP UV1-N20 1 1 1 1 1 1 1 1 1 1 $75,150
McClure Meadows Park ASPHALT WD WN27 2 2 2 2 2 2 2 2 2 2 $75,150
Melville Park ASPHALT MP MN9 2 2 2 2 2 2 2 2 2 2 $75,150
Mill Race Park ASPHALT 0 0 0 0 0 0 0 0 0 0 $75,150
Mosswood Park PENETRATED ASPHALT & ACRYLIC TH UV2-N11 0 2 2 2 2 2 2 2 2 2 $75,150
Napa Valley Park ASPHALT & ACRYLIC WD WN33 2 2 2 2 2 2 2 2 2 2 $75,150
Newport Square Park ASPHALT TH TN10 2 2 2 2 2 2 2 2 2 2 $75,150
North Thornhill District Park (Block 10 District Park) ASPHALT TH UV2-D3 4 4 4 4 4 4 4 4 4 4 $75,150
Ohr Manachem Park ASPHALT & ACRYLIC TH UV2-N2 0 0 0 0 2 2 2 2 2 2 $75,150
Rimwood Park ASPHALT KL KN5 2 2 2 2 2 2 2 2 2 2 $75,150
Rosedale North Park PENETRATED ASPHALT TH TN8 3 3 3 3 3 3 3 3 3 3 $75,150
Secord Park ASPHALT TH UV2-N2 0 0 0 0 0 0 0 0 0 2 $75,150
Sunset Ridge Park ASPHALT WD WEA-N1 1 1 1 1 2 2 2 2 2 2 $75,150
Velmar Downs Park ASPHALT & ACRYLIC WD WN21 3 3 3 3 2 2 2 2 2 2 $75,150
Venice Gate Park ASPHALT MP UV1-N6 0 0 0 1 1 1 1 1 1 1 $75,150
Ventura Park PENETRATED ASPHALT TH TN23 2 2 2 2 2 2 2 2 2 2 $75,150
Via Campanile Park RECLASSIFIED WD UV1-N3 2 2 2 2 2 2 2 2 2 2 $75,150
Wade Gate Park ASPHALT & ACRYLIC TH TN20 3 3 3 3 3 3 3 3 3 3 $75,150
Subtotal (#) 51 53 53 54 56 56 56 56 58 60
Subtotal ($000) $3,832.7 $3,983.0 $3,983.0 $4,058.1 $4,208.4 $4,208.4 $4,208.4 $4,208.4 $4,358.7 $4,509.0
APPENDIX ETABLE 1 - PAGE 41
# of facilities
COMMUNITY SERVICES
HEMSON
HEMSON
156

CITY OF VAUGHANINVENTORY OF CAPITAL ASSETS
PARK FACILITIES
BOCCE COURTS - LIT COM PARK UNIT COST
Park Name NUMBER 2008 2009 2010 2011 2012 2013 2014 2015 2016 2017 ($/facility)
Alexander Elisa Park Bocce Courts - Lit W WN12 3 3 3 3 3 3 3 3 3 3 $94,300
Belair Way Park Bocce Courts - Lit W WN14 3 3 3 3 3 3 3 3 3 3 $94,300
Father Ermanno Bulfon Park Bocce Courts - Lit W WD2 5 5 5 5 0 0 0 0 0 0 $94,300
Giovanni Caboto Park Bocce Courts - Lit W WN29 3 3 3 3 3 3 3 3 3 3 $94,300
Maple Community District Park Bocce Courts - Lit M MD1 1 1 1 1 0 0 0 0 0 0 $94,300
Marco Park (Previously Airdrie Park) Bocce Courts - Lit W WN8 3 3 3 3 0 0 0 0 0 0 $94,300
Marita Payne Park Bocce Courts - Lit T TN26 3 3 3 3 3 3 3 3 3 3 $94,300
Matthew Park (Frmly.Vellore Village District Park) Bocce Courts - Lit WD UV1-D3 3 3 3 3 3 3 3 3 3 3 $94,300
Maxey Park Bocce Courts - Lit W WN4 5 5 5 5 5 5 5 5 5 5 $94,300
Nort Johnston Park (Veteren's Park) Bocce Courts - Lit WD WD1 1 1 1 1 1 1 1 1 1 1 $94,300
Robert Watson Memorial Park Bocce Courts - Lit W WN10 6 6 6 6 6 6 6 6 6 6 $94,300
Southview Park Bocce Courts - Lit T TN34 3 3 3 3 3 3 3 3 3 3 $94,300
Vaughan Crest Park Bocce Courts - Lit T TN1 3 3 3 3 2 2 2 2 2 2 $94,300
Vaughan Mills Park Bocce Courts - Lit W WN24 2 2 2 2 2 2 2 2 2 2 $94,300
Vaughan Sports Village Bocce Courts - Lit MA WN24 2 2 2 2 2 2 2 2 2 2 $94,300
Sonoma Height Community Park (Frmly. W.E.A District Park) Bocce Courts - Lit WD WEA-D1 4 4 4 4 4 4 4 4 4 4 $94,300
Via Verde Park Bocce Courts - Lit WD WEA-N4 1 1 1 1 1 1 1 1 1 1 $94,300
Woodbridge Highlands Park Bocce Courts - Lit W WN22 3 3 3 3 3 3 3 3 3 3 $94,300
Wade Gate Park Bocce Courts - Lit T TN20 2 2 2 2 2 2 2 2 2 2 $94,300
Subtotal (#) 56 56 56 56 46 46 46 46 46 46
Subtotal ($000) $5,280.8 $5,280.8 $5,280.8 $5,280.8 $4,337.8 $4,337.8 $4,337.8 $4,337.8 $4,337.8 $4,337.8
BOCCE COURTS - UNLIT COM PARK UNIT COST
Park Name NUMBER 2008 2009 2010 2011 2012 2013 2014 2015 2016 2017 ($/facility)
Breta/HR Park Bocce Courts - Unlit M MN13 1 1 1 1 2 2 2 2 2 2 $75,000
Maple Trails Park Bocce Courts - Unlit M MN-19 1 1 1 1 1 1 1 1 1 1 $75,000
Mast Road Park Bocce Courts - Unlit M UV1-N20 2 2 2 2 2 2 2 2 2 2 $75,000
Peak Point Park Bocce Courts - Unlit M MN22 0 1 1 1 1 1 1 1 1 1 $75,000
Vaughan Grove Sports Park Bocce Courts - Unlit WD WR1 0 0 0 0 0 0 0 2 2 2 $75,000
West Maple Creek East Park Bocce Courts - Unlit M MN17 3 3 3 3 3 3 3 3 3 3 $75,000
Rose Mandarino (Formerly Weston Downs Park) Bocce Courts - Unlit W WD16 3 3 3 3 3 3 3 3 3 3 $75,000
Subtotal (#) 10 11 11 11 12 12 12 14 14 14
Subtotal ($000) $750.0 $825.0 $825.0 $825.0 $900.0 $900.0 $900.0 $1,050.0 $1,050.0 $1,050.0
TABLE 1 - PAGE 42
# of facilities
# of facilities
COMMUNITY SERVICES
APPENDIX E
HEMSON
HEMSON
157

CITY OF VAUGHANINVENTORY OF CAPITAL ASSETS
PARK FACILITIES
OUTDOOR SWIMMING POOLS COM PARK UNIT COST
Park Name NUMBER 2008 2009 2010 2011 2012 2013 2014 2015 2016 2017 ($/facility)
Thornhill Park Outdoor Swimming Pools T TN25 1 1 1 1 1 1 1 1 1 1 $1,338,500
Subtotal (#) 1 1 1 1 1 1 1 1 1 1
Subtotal ($000) $1,338.5 $1,338.5 $1,338.5 $1,338.5 $1,338.5 $1,338.5 $1,338.5 $1,338.5 $1,338.5 $1,338.5
OUTDOOR WADING POOLS COM PARK UNIT COST
Park Name NUMBER 2008 2009 2010 2011 2012 2013 2014 2015 2016 2017 ($/facility)
Glen Shields Park Outdoor Wading Pool T TN25 1 1 1 1 0 0 0 0 0 0 $29,790
Thornhill Park Outdoor Wading Pool T TN11 1 1 1 1 1 1 1 1 1 1 $29,790
Subtotal (#) 2 2 2 2 1 1 1 1 1 1
Subtotal ($000) $59.6 $59.6 $59.6 $59.6 $29.8 $29.8 $29.8 $29.8 $29.8 $29.8
WATER PLAY FACILITY (Classification Added: Neighbourhood vs District) COM PARK UNIT COST
Park Name NUMBER 2008 2009 2010 2011 2012 2013 2014 2015 2016 2017 ($/facility)
Anthony Locilento Park (Formerly Blue Coin) (Neighbourhood) Water Play Facility WD WN20 1 1 1 1 1 1 1 1 1 1 $214,700
Chancellor District Park (District) Water Play Facility WD WD3 1 1 1 1 1 1 1 1 1 1 $300,900
Concord/Thornhill Park (District) Water Play Facility TH TR2 1 1 1 1 1 1 1 1 1 1 $300,900
Crief Parkette (Neighbourhood) Water Play Facility WD MP2 1 1 1 1 1 1 1 1 1 1 $214,700
Dufferin District Park (District) Water Play Facility TH TD2 1 1 1 1 1 1 1 1 1 1 $300,900
Father Ermanno Bulfon Park (District) Water Play Facility WD WD2 1 1 1 1 1 1 1 1 1 1 $300,900
MacKenzie Glen Disrtict Park (District) Water Play Facility MP MD2 1 1 1 1 1 1 1 1 1 1 $300,900
Mapes Park (Neighbourhood) Water Play Facility WD WN18 1 1 1 1 1 1 1 1 1 1 $214,700
Maple Airport Park (Neighbourhood) Water Play Facility MP MN7 1 1 1 1 1 1 1 1 1 1 $214,700
Maple Lions Park (Neighbourhood) Water Play Facility MP MN8 1 1 1 1 1 1 1 1 1 1 $214,700
McClure Meadows Park (Neighbourhood) Water Play Facility WD WN27 1 1 1 1 1 1 1 1 1 1 $214,700
Melville Park (Neighbourhood) Water Play Facility MP MN9 1 1 1 1 1 1 1 1 1 1 $214,700
North Thornhill District Park (District) Water Play Facility TH UV2-D3 0 0 1 1 1 1 1 1 1 1 $300,900
Vaughan Mills Park (Neighbourhood) Water Play Facility WD WN24 1 1 1 1 1 1 1 1 1 1 $214,700
Matthew Park (Frmly.Vellore Village District Park) (District) Water Play Facility WD UV1-D3 1 1 1 1 1 1 1 1 1 1 $300,900
Sonoma Height Community Park (Frmly. W.E.A District Park) (District) Water Play Facility WD WEA-D1 1 1 1 1 1 1 1 1 1 1 $300,900
Wade Gate Park (Neighbourhood) Water Play Facility TH TN20 1 1 1 1 1 1 1 1 1 1 $214,700
Subtotal (#) 16 16 17 17 17 17 17 17 17 17
Subtotal ($000) $4,038.6 $4,038.6 $4,339.5 $4,339.5 $4,339.5 $4,339.5 $4,339.5 $4,339.5 $4,339.5 $4,339.5
# of facilities
# of facilities
APPENDIX ETABLE 1 - PAGE 43
# of facilities
COMMUNITY SERVICES
HEMSON
HEMSON
158
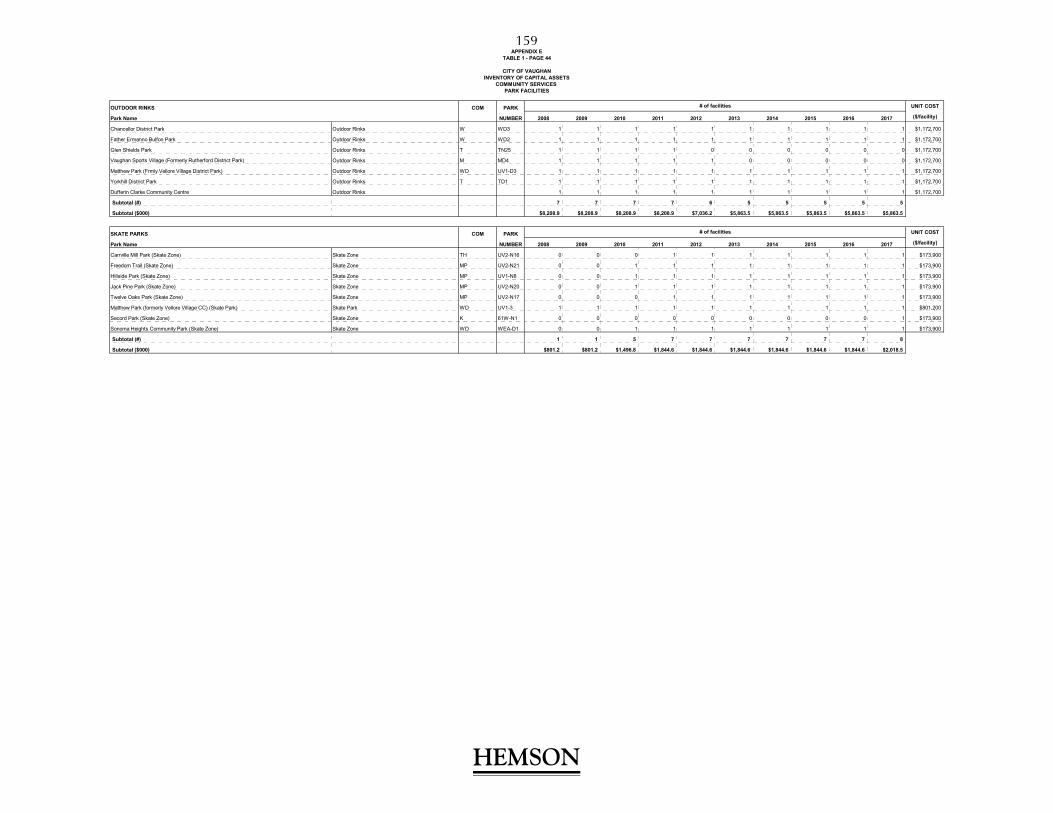
CITY OF VAUGHANINVENTORY OF CAPITAL ASSETS
PARK FACILITIES
OUTDOOR RINKS COM PARK UNIT COST
Park Name NUMBER 2008 2009 2010 2011 2012 2013 2014 2015 2016 2017 ($/facility)
Chancellor District Park Outdoor Rinks W WD3 1 1 1 1 1 1 1 1 1 1 $1,172,700
Father Ermanno Bulfon Park Outdoor Rinks W WD2 1 1 1 1 1 1 1 1 1 1 $1,172,700
Glen Shields Park Outdoor Rinks T TN25 1 1 1 1 0 0 0 0 0 0 $1,172,700
Vaughan Sports Village (Formerly Rutherford District Park) Outdoor Rinks M MD4 1 1 1 1 1 0 0 0 0 0 $1,172,700
Matthew Park (Frmly.Vellore Village District Park) Outdoor Rinks WD UV1-D3 1 1 1 1 1 1 1 1 1 1 $1,172,700
Yorkhill District Park Outdoor Rinks T TD1 1 1 1 1 1 1 1 1 1 1 $1,172,700
Dufferin Clarke Community Centre Outdoor Rinks 1 1 1 1 1 1 1 1 1 1 $1,172,700
Subtotal (#) 7 7 7 7 6 5 5 5 5 5
Subtotal ($000) $8,208.9 $8,208.9 $8,208.9 $8,208.9 $7,036.2 $5,863.5 $5,863.5 $5,863.5 $5,863.5 $5,863.5
SKATE PARKS COM PARK UNIT COST
Park Name NUMBER 2008 2009 2010 2011 2012 2013 2014 2015 2016 2017 ($/facility)
Carrville Mill Park (Skate Zone) Skate Zone TH UV2-N16 0 0 0 1 1 1 1 1 1 1 $173,900
Freedom Trail (Skate Zone) Skate Zone MP UV2-N21 0 0 1 1 1 1 1 1 1 1 $173,900
Hillside Park (Skate Zone) Skate Zone MP UV1-N8 0 0 1 1 1 1 1 1 1 1 $173,900
Jack Pine Park (Skate Zone) Skate Zone MP UV2-N20 0 0 1 1 1 1 1 1 1 1 $173,900
Twelve Oaks Park (Skate Zone) Skate Zone MP UV2-N17 0 0 0 1 1 1 1 1 1 1 $173,900
Matthew Park (formerly Vellore Village CC) (Skate Park) Skate Park WD UV1-3 1 1 1 1 1 1 1 1 1 1 $801,200
Secord Park (Skate Zone) Skate Zone K 61W-N1 0 0 0 0 0 0 0 0 0 1 $173,900
Sonoma Heights Community Park (Skate Zone) Skate Zone WD WEA-D1 0 0 1 1 1 1 1 1 1 1 $173,900
Subtotal (#) 1 1 5 7 7 7 7 7 7 8
Subtotal ($000) $801.2 $801.2 $1,496.8 $1,844.6 $1,844.6 $1,844.6 $1,844.6 $1,844.6 $1,844.6 $2,018.5
APPENDIX ETABLE 1 - PAGE 44
# of facilities
# of facilities
COMMUNITY SERVICES
HEMSON
HEMSON
159
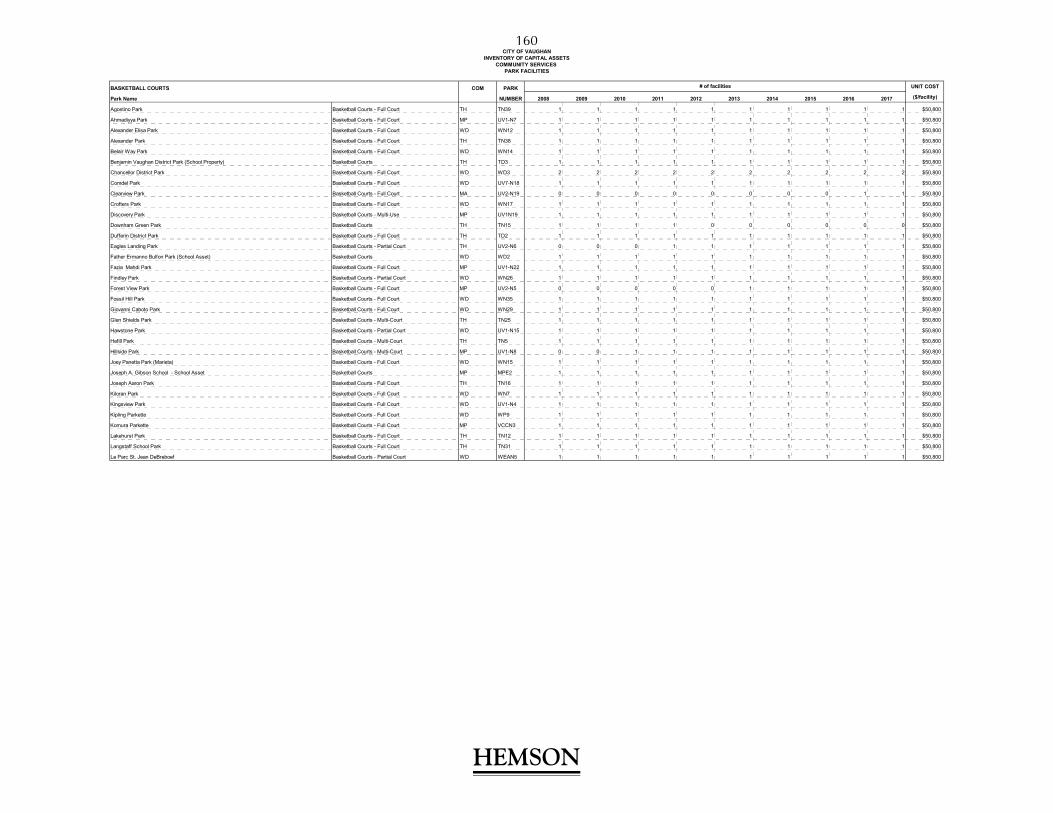
CITY OF VAUGHANINVENTORY OF CAPITAL ASSETS
PARK FACILITIES
BASKETBALL COURTS COM PARK UNIT COST
Park Name NUMBER 2008 2009 2010 2011 2012 2013 2014 2015 2016 2017 ($/facility)
Agostino Park Basketball Courts - Full Court TH TN39 1 1 1 1 1 1 1 1 1 1 $50,800
Ahmadiyya Park Basketball Courts - Full Court MP UV1-N7 1 1 1 1 1 1 1 1 1 1 $50,800
Alexander Elisa Park Basketball Courts - Full Court WD WN12 1 1 1 1 1 1 1 1 1 1 $50,800
Alexander Park Basketball Courts - Full Court TH TN38 1 1 1 1 1 1 1 1 1 1 $50,800
Belair Way Park Basketball Courts - Full Court WD WN14 1 1 1 1 1 1 1 1 1 1 $50,800
Benjamin Vaughan District Park (School Property) Basketball Courts TH TD3 1 1 1 1 1 1 1 1 1 1 $50,800
Chancellor District Park Basketball Courts - Full Court WD WD3 2 2 2 2 2 2 2 2 2 2 $50,800
Comdel Park Basketball Courts - Full Court WD UV7-N18 1 1 1 1 1 1 1 1 1 1 $50,800
Clearview Park Basketball Courts - Full Court MA UV2-N19 0 0 0 0 0 0 0 0 1 1 $50,800
Crofters Park Basketball Courts - Full Court WD WN17 1 1 1 1 1 1 1 1 1 1 $50,800
Discovery Park Basketball Courts - Multi-Use MP UV1N19 1 1 1 1 1 1 1 1 1 1 $50,800
Downham Green Park Basketball Courts TH TN15 1 1 1 1 0 0 0 0 0 0 $50,800
Dufferin District Park Basketball Courts - Full Court TH TD2 1 1 1 1 1 1 1 1 1 1 $50,800
Eagles Landing Park Basketball Courts - Partial Court TH UV2-N6 0 0 0 1 1 1 1 1 1 1 $50,800
Father Ermanno Bulfon Park (School Asset) Basketball Courts WD WD2 1 1 1 1 1 1 1 1 1 1 $50,800
Fazia Mahdi Park Basketball Courts - Full Court MP UV1-N22 1 1 1 1 1 1 1 1 1 1 $50,800
Findley Park Basketball Courts - Partial Court WD WN26 1 1 1 1 1 1 1 1 1 1 $50,800
Forest View Park Basketball Courts - Full Court MP UV2-N5 0 0 0 0 0 1 1 1 1 1 $50,800
Fossil Hill Park Basketball Courts - Full Court WD WN35 1 1 1 1 1 1 1 1 1 1 $50,800
Giovanni Caboto Park Basketball Courts - Full Court WD WN29 1 1 1 1 1 1 1 1 1 1 $50,800
Glen Shields Park Basketball Courts - Multi-Court TH TN25 1 1 1 1 1 1 1 1 1 1 $50,800
Hawstone Park Basketball Courts - Partial Court WD UV1-N15 1 1 1 1 1 1 1 1 1 1 $50,800
Hefill Park Basketball Courts - Multi-Court TH TN5 1 1 1 1 1 1 1 1 1 1 $50,800
Hillside Park Basketball Courts - Multi-Court MP UV1-N8 0 0 1 1 1 1 1 1 1 1 $50,800
Joey Panetta Park (Marieta) Basketball Courts - Full Court WD WN15 1 1 1 1 1 1 1 1 1 1 $50,800
Joseph A. Gibson School - School Asset Basketball Courts MP MPE2 1 1 1 1 1 1 1 1 1 1 $50,800
Joseph Aaron Park Basketball Courts - Full Court TH TN16 1 1 1 1 1 1 1 1 1 1 $50,800
Kiloran Park Basketball Courts - Full Court WD WN7 1 1 1 1 1 1 1 1 1 1 $50,800
Kingsview Park Basketball Courts - Full Court WD UV1-N4 1 1 1 1 1 1 1 1 1 1 $50,800
Kipling Parkette Basketball Courts - Full Court WD WP9 1 1 1 1 1 1 1 1 1 1 $50,800
Komura Parkette Basketball Courts - Full Court MP VCCN3 1 1 1 1 1 1 1 1 1 1 $50,800
Lakehurst Park Basketball Courts - Full Court TH TN12 1 1 1 1 1 1 1 1 1 1 $50,800
Langstaff School Park Basketball Courts - Full Court TH TN31 1 1 1 1 1 1 1 1 1 1 $50,800
Le Parc St. Jean DeBreboef Basketball Courts - Partial Court WD WEAN5 1 1 1 1 1 1 1 1 1 1 $50,800
# of facilities
COMMUNITY SERVICES
HEMSON
HEMSON
160

CITY OF VAUGHANINVENTORY OF CAPITAL ASSETS
PARK FACILITIES
BASKETBALL COURTS CONT'D COM PARK UNIT COST
Park Name NUMBER 2008 2009 2010 2011 2012 2013 2014 2015 2016 2017 ($/facility)
Mapes Park Basketball Courts - Multi-Court WD WN18 1 1 1 1 1 1 1 1 1 1 $50,800
Maple Airport Park Basketball Courts - Full Court MP MN7 1 1 1 1 1 1 1 1 1 1 $50,800
Maple Community District Park Basketball Courts - Partial Court MP MD1 1 1 1 1 1 1 1 1 1 1 $50,800
Maple Trails Park Basketball Courts - Partial Court MP MN19 1 1 1 1 1 1 1 1 1 1 $50,800
Marita Payne Park Basketball Courts - Full Court TH TN26 1 1 1 1 1 1 1 1 1 1 $50,800
McClure Meadows Park Basketball Courts - Full Court WD WN27 1 1 1 1 1 1 1 1 1 1 $50,800
Mill Race Park Basketball Courts - Full Court TH UV2-N4 0 0 0 0 0 0 1 1 1 1 $50,800
Misty Sugar Park Basketball Courts - Full Court TH UV2-N8 1 1 1 1 1 1 1 1 1 1 $50,800
Napa Valley Park Basketball Courts - Partial Court WD WN33 2 2 2 2 2 2 2 2 2 2 $50,800
Newport Square Park Basketball Courts - Partial Court TH TN10 1 1 1 1 1 1 1 1 1 1 $50,800
Newport Square Park Basketball Courts - Full Court TH TN10 1 1 1 1 1 1 1 1 1 1 $50,800
Nort Johnson Park Basketball Courts - Full Court WD WD1 1 1 1 1 1 1 1 1 1 1 $50,800
Ohr Menachem Basketball Courts - Partial Court TH UV2-N2 1 1 1 1 1 1 1 1 1 1 $50,800
Peak Point Park Basketball Courts - Multi-Court MP MN22 0 1 1 1 1 1 1 1 1 1 $50,800
Pheasant Hollow Park Basketball Courts - Full Court MP UV2-N7 0 0 0 0 1 1 1 1 1 1 $50,800
Pioneer Park Basketball Courts - Partial Court TH UV2-N15 0 0 0 0 0 0 1 1 1 1 $50,800
Princeton Gate Park Basketball Courts - Full Court MP MN14 1 1 1 1 1 1 1 1 1 1 $50,800
Promenade Green Park (School asset) Basketball Courts - Partial Court TH TN18 0 0 0 0 0 0 0 0 0 0 $50,800
Reeves Park Basketball Courts - Full Court MP MN2 1 1 1 1 1 1 1 1 1 1 $50,800
Robert Watson Memorial Park Basketball Courts - Full Court WD WN10 1 1 1 1 1 1 1 1 1 1 $50,800
Rosedale North Park Basketball Courts - Partial Court TH TN8 1 1 1 1 1 1 1 1 1 1 $50,800
Southview Park Basketball Courts - Partial Court TH TN34 1 1 1 1 1 1 1 1 1 1 $50,800
Spring Blossom Park Basketball Courts - Full Court TH UV2-N12 0 0 0 0 0 0 1 1 1 1 $50,800
Sunset Ridge Park Basketball Courts - Full Court WD WEA-N1 1 1 1 1 1 1 1 1 1 1 $50,800
Sylvan Brook Parkette Basketball Courts WD WP8 1 1 1 1 1 1 1 0 0 0 $50,800
Tinsmith Parkette Basketball Courts - Full Court KL KP1 1 1 1 1 1 1 1 1 1 1 $50,800
Torii Park Basketball Courts - Full Court WD WN11 1 1 1 1 1 1 1 1 1 1 $50,800
Vellore Woods Park Basketball Courts - Partial Court WD WN37 1 1 1 1 1 1 1 1 1 1 $50,800
Velmar Downs Park Basketball Courts - Partial Court WD WN21 1 1 1 1 1 1 1 1 1 1 $50,800
Sonoma Height Community Park (Frmly. W.E.A District Park) Basketball Courts - Full Court WD WEA-D1 1 1 1 1 1 1 1 1 1 1 $50,800
Wade Gate Park Basketball Courts - Full Court TH TN20 1 1 1 1 1 1 1 1 1 1 $50,800
West Crossroads Park Basketball Courts - Partial Court TH TN19 1 1 1 1 1 1 1 1 1 1 $50,800
West Maple Creek East Park Basketball Courts - Full Court MP MN17 1 1 1 1 1 1 1 1 1 1 $50,800
Rose Mandarino (Formerly Weston Downs Park) Basketball Courts - Full Court WD WN16 1 1 1 1 1 1 1 1 1 1 $50,800
Westwind Park (New) Basketball Courts - Full Court MP UV1-N5 0 0 0 0 1 1 1 1 1 1 $50,800
Wilson Century Theatre Park Basketball Courts - Partial Court WD WN32 1 1 1 1 1 1 1 1 1 1 $50,800
Winding Lane Park Basketball Courts - Full Court TH TN2 1 1 1 1 1 1 1 1 1 1 $50,800
Winding Lane Park (1 more added, 2 onsite) Basketball Courts - Multi Court TH TN2 1 1 1 1 1 1 1 1 1 1 $50,800
Woodbridge Highlands Park Basketball Courts - Full Court WD WN22 1 1 1 1 1 1 1 1 1 $50,800
Worth Park Basketball Courts - Full Court TH TN24 1 1 1 1 1 1 1 1 1 1 $50,800
Yorkhill District Park Basketball Courts - Full Court TH TD1 1 1 1 1 1 1 1 1 1 1 $50,800
Subtotal (#) 66 67 67 69 70 71 74 73 74 74
Subtotal ($000) $3,352.8 $3,403.6 $3,403.6 $3,505.2 $3,556.0 $3,606.8 $3,759.2 $3,708.4 $3,759.2 $3,759.2
APPENDIX ETABLE 1 - PAGE 46
# of facilities
COMMUNITY SERVICES
HEMSON
HEMSON
161

CITY OF VAUGHANINVENTORY OF CAPITAL ASSETS
COMBINED SENIOR/JUNIOR PLAYGROUNDS COM PARK UNIT COST
Park Name NUMBER 2008 2009 2010 2011 2012 2013 2014 2015 2016 2017 ($/facility)
Ahmadiyya Park Combined Playground - Neighbourhood MP UV1-N7 1 1 1 1 1 1 1 1 1 1 $207,600
Benjamin Vaughan District Park Combined Playground - District TH TD3 1 1 1 1 1 1 1 1 1 1 $468,700
Blue Willow Square Combined Playground - Neighbourhood WD WN30 1 1 1 1 1 1 1 1 1 1 $207,600
Carrville Mill Park Combined Playground - Neighbourhood TH UV2-N16 0 0 0 1 1 1 1 1 1 1 $207,600
Castlehill Park Combined Playground - Neighbourhood MP MN6 1 1 1 1 1 1 1 1 1 1 $207,600
Comdel Park Combined Playground - Neighbourhood MP UV1-N18 1 1 1 1 1 1 1 1 1 1 $207,600
Concord Community Park Combined Playground - Neighbourhood TH TN35 1 1 1 1 1 1 1 1 1 1 $207,600
Concord/Thornhill Park Combined Playground - District TH TR2 1 1 1 1 1 1 1 1 1 1 $468,700
Conley Park South Combined Playground - Neighbourhood TH TN13 1 1 1 1 1 1 1 1 1 1 $207,600
Crestlawn Parkette Combined Playground - Neighbourhood WD WN39 0 0 0 1 1 1 1 1 1 1 $207,600
Crofters Park Combined Playground - Neighbourhood WD WN17 1 1 1 1 1 1 1 1 1 1 $207,600
Doctor's McLean Park (Previously Fundale Park) Combined Playground - Neighbourhood WD WD4 1 1 1 1 1 1 1 1 1 1 $207,600
Davos Park Combined Playground - Neighbourhood WD UV1-N12 0 0 0 1 1 1 1 1 1 1 $207,600
Downham Green Park Combined Playground - Neighbourhood TH TN15 1 1 1 1 1 1 1 1 1 1 $207,600
Eagles Landing Park Combined Playground - Neighbourhood MP UV2-N6 0 0 0 1 1 1 1 1 1 1 $207,600
Edmund Seager Parkette Combined Playground - Neighbourhood TH TP11 1 1 1 1 1 1 1 1 1 1 $207,600
Fazia Mahdi Park Combined Playground - Neighbourhood MP UV1-N22 1 1 1 1 1 1 1 1 1 1 $207,600
Forest View Park Combined Playground - Neighbourhood MA UV2-N5 0 0 0 0 0 1 1 1 1 1 $207,600
Fossil Hill Park Combined Playground - Neighbourhood WD WN35 1 1 1 1 1 1 1 1 1 1 $207,600
Fred Armstrong Parkette Combined Playground - Neighbourhood WD WP2 1 1 1 1 1 1 1 1 1 1 $207,600
Gallanough Park Combined Playground - Neighbourhood TH TN4 1 1 1 1 1 1 1 1 1 1 $207,600
George Stegman Park Combined Playground - Neighbourhood WD WN9 1 1 1 1 1 1 1 1 1 1 $207,600
Gilmore Park Combined Playground - Neighbourhood TH TN14 1 1 1 1 1 1 1 1 1 1 $207,600
Giovanni Caboto Park Combined Playground - Neighbourhood WD WN29 1 1 1 1 1 1 1 1 1 1 $207,600
Glen Shields Park Combined Playground - Neighbourhood TH TN25 1 1 1 1 1 1 1 1 1 1 $207,600
Hayhoe Park Combined Playground - Neighbourhood WD WN6 0 0 0 1 1 1 1 1 1 1 $207,600
Heritage Park Combined Playground - Neighbourhood TH UV2-N18 0 0 0 0 0 0 1 1 1 1 $207,600
Jack Pine Park Combined Playground - Neighbourhood MA UV2-N20 0 0 1 1 1 1 1 1 1 1 $207,600
Jersey Creek Combined Playground - Neighbourhood WD WOS6 1 1 1 1 1 1 1 1 1 1 $207,600
Joey Panetta Park (Marieta) Combined Playground - Neighbourhood WD WN15 1 1 1 1 1 1 1 1 1 1 $207,600
Joseph Aaron Park Combined Playground - Neighbourhood TH TN16 1 1 1 1 1 1 1 1 1 1 $207,600
Kiloran Park Combined Playground - Neighbourhood WD WN7 1 1 1 1 1 1 1 1 1 1 $207,600
King High Park Combined Playground - Neighbourhood TH TN21 1 1 1 1 1 1 1 1 1 1 $207,600
Kingsview Park Combined Playground - Neighbourhood WD UV1-N4 1 1 1 1 1 1 1 1 1 1 $207,600
Kipling Parkette Combined Playground - Neighbourhood WD WP9 1 1 1 1 1 1 1 1 1 1 $207,600
La Rocca Park Combined Playground - Neighbourhood WD WN34 1 1 1 1 1 1 1 1 1 1 $207,600
Lakehurst Park Combined Playground - Neighbourhood TH TN12 1 1 1 1 1 1 1 1 1 1 $207,600
Langstaff School Park Combined Playground - Neighbourhood TH TN31 1 1 1 1 1 1 1 1 1 1 $207,600
Le Parc St. Jean de Brebeuf Combined Playground - Neighbourhood WD WEAN5 1 1 1 1 1 1 1 1 1 1 $207,600
MacKenzie Glen Disrtict Park (One combined playground) Combined Playground - District MP MD2 2 2 2 2 1 1 1 1 1 1 $468,700
Mapes Park Combined Playground - Neighbourhood WD WN18 1 1 1 1 1 1 1 1 1 1 $207,600
Maple Community District Park Combined Playground - District MP MD1 1 1 1 1 1 1 1 1 1 1 $468,700
Maple Trails Park Combined Playground - Neighbourhood MP MN19 1 1 1 1 1 1 1 1 1 1 $207,600
APPENDIX ETABLE 1 - PAGE 47
PARK FACILITIES
# of facilities
COMMUNITY SERVICES
HEMSON
HEMSON
162
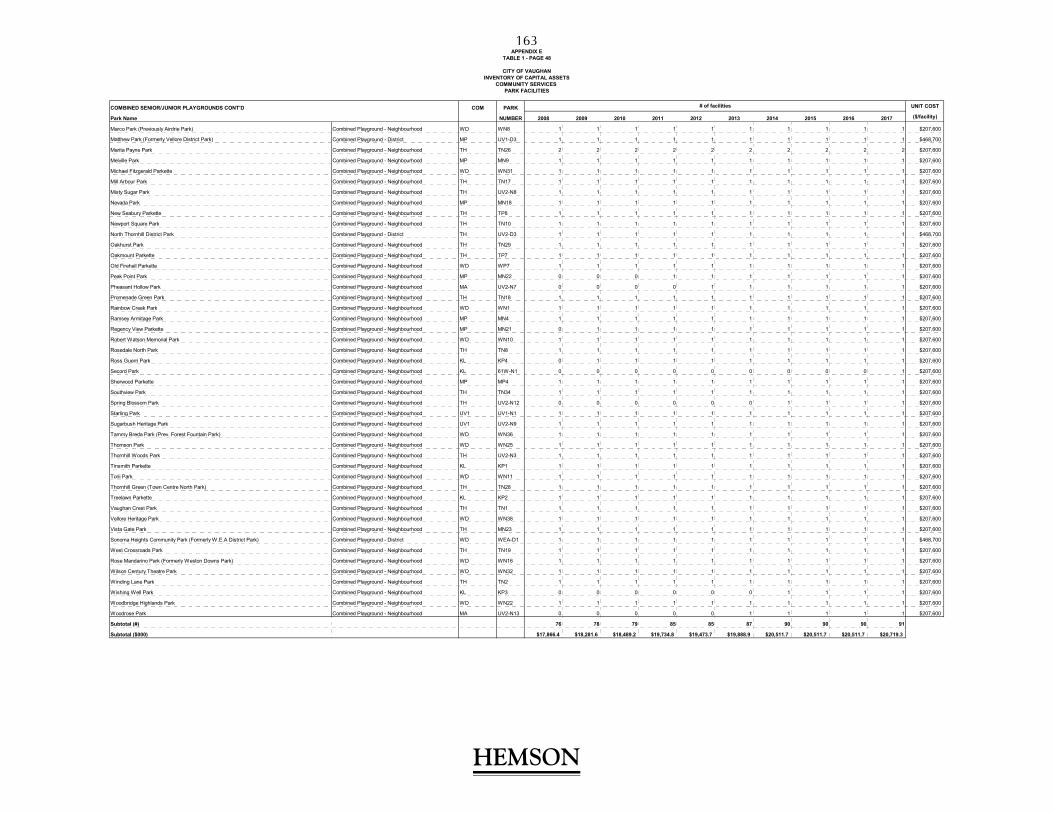
CITY OF VAUGHANINVENTORY OF CAPITAL ASSETS
COMBINED SENIOR/JUNIOR PLAYGROUNDS CONT'D COM PARK UNIT COST
Park Name NUMBER 2008 2009 2010 2011 2012 2013 2014 2015 2016 2017 ($/facility)
Marco Park (Previously Airdrie Park) Combined Playground - Neighbourhood WD WN8 1 1 1 1 1 1 1 1 1 1 $207,600
Matthew Park (Formerly Vellore District Park) Combined Playground - District MP UV1-D3 1 1 1 1 1 1 1 1 1 1 $468,700
Marita Payne Park Combined Playground - Neighbourhood TH TN26 2 2 2 2 2 2 2 2 2 2 $207,600
Melville Park Combined Playground - Neighbourhood MP MN9 1 1 1 1 1 1 1 1 1 1 $207,600
Michael Fitzgerald Parkette Combined Playground - Neighbourhood WD WN31 1 1 1 1 1 1 1 1 1 1 $207,600
Mill Arbour Park Combined Playground - Neighbourhood TH TN17 1 1 1 1 1 1 1 1 1 1 $207,600
Misty Sugar Park Combined Playground - Neighbourhood TH UV2-N8 1 1 1 1 1 1 1 1 1 1 $207,600
Nevada Park Combined Playground - Neighbourhood MP MN18 1 1 1 1 1 1 1 1 1 1 $207,600
New Seabury Parkette Combined Playground - Neighbourhood TH TP8 1 1 1 1 1 1 1 1 1 1 $207,600
Newport Square Park Combined Playground - Neighbourhood TH TN10 1 1 1 1 1 1 1 1 1 1 $207,600
North Thornhill District Park Combined Playground - District TH UV2-D3 1 1 1 1 1 1 1 1 1 1 $468,700
Oakhurst Park Combined Playground - Neighbourhood TH TN29 1 1 1 1 1 1 1 1 1 1 $207,600
Oakmount Parkette Combined Playground - Neighbourhood TH TP7 1 1 1 1 1 1 1 1 1 1 $207,600
Old Firehall Parkette Combined Playground - Neighbourhood WD WP7 1 1 1 1 1 1 1 1 1 1 $207,600
Peak Point Park Combined Playground - Neighbourhood MP MN22 0 0 0 1 1 1 1 1 1 1 $207,600
Pheasant Hollow Park Combined Playground - Neighbourhood MA UV2-N7 0 0 0 0 1 1 1 1 1 1 $207,600
Promenade Green Park Combined Playground - Neighbourhood TH TN18 1 1 1 1 1 1 1 1 1 1 $207,600
Rainbow Creek Park Combined Playground - Neighbourhood WD WN1 1 1 1 1 1 1 1 1 1 1 $207,600
Ramsey Armitage Park Combined Playground - Neighbourhood MP MN4 1 1 1 1 1 1 1 1 1 1 $207,600
Regency View Parkette Combined Playground - Neighbourhood MP MN21 0 1 1 1 1 1 1 1 1 1 $207,600
Robert Watson Memorial Park Combined Playground - Neighbourhood WD WN10 1 1 1 1 1 1 1 1 1 1 $207,600
Rosedale North Park Combined Playground - Neighbourhood TH TN8 1 1 1 1 1 1 1 1 1 1 $207,600
Ross Guerri Park Combined Playground - Neighbourhood KL KP4 0 1 1 1 1 1 1 1 1 1 $207,600
Secord Park Combined Playground - Neighbourhood KL 61W-N1 0 0 0 0 0 0 0 0 0 1 $207,600
Sherwood Parkette Combined Playground - Neighbourhood MP MP4 1 1 1 1 1 1 1 1 1 1 $207,600
Southview Park Combined Playground - Neighbourhood TH TN34 1 1 1 1 1 1 1 1 1 1 $207,600
Spring Blossom Park Combined Playground - Neighbourhood TH UV2-N12 0 0 0 0 0 0 1 1 1 1 $207,600
Starling Park Combined Playground - Neighbourhood UV1 UV1-N1 1 1 1 1 1 1 1 1 1 1 $207,600
Sugarbush Heritage Park Combined Playground - Neighbourhood UV1 UV2-N9 1 1 1 1 1 1 1 1 1 1 $207,600
Tammy Breda Park (Prev. Forest Fountain Park) Combined Playground - Neighbourhood WD WN36 1 1 1 1 1 1 1 1 1 1 $207,600
Thomson Park Combined Playground - Neighbourhood WD WN25 1 1 1 1 1 1 1 1 1 1 $207,600
Thornhill Woods Park Combined Playground - Neighbourhood TH UV2-N3 1 1 1 1 1 1 1 1 1 1 $207,600
Tinsmith Parkette Combined Playground - Neighbourhood KL KP1 1 1 1 1 1 1 1 1 1 1 $207,600
Torii Park Combined Playground - Neighbourhood WD WN11 1 1 1 1 1 1 1 1 1 1 $207,600
Thornhill Green (Town Centre North Park) Combined Playground - Neighbourhood TH TN28 1 1 1 1 1 1 1 1 1 1 $207,600
Treelawn Parkette Combined Playground - Neighbourhood KL KP2 1 1 1 1 1 1 1 1 1 1 $207,600
Vaughan Crest Park Combined Playground - Neighbourhood TH TN1 1 1 1 1 1 1 1 1 1 1 $207,600
Vellore Heritage Park Combined Playground - Neighbourhood WD WN38 1 1 1 1 1 1 1 1 1 1 $207,600
Vista Gate Park Combined Playground - Neighbourhood TH MN23 1 1 1 1 1 1 1 1 1 1 $207,600
Sonoma Heights Community Park (Formerly W.E.A District Park) Combined Playground - District WD WEA-D1 1 1 1 1 1 1 1 1 1 1 $468,700
West Crossroads Park Combined Playground - Neighbourhood TH TN19 1 1 1 1 1 1 1 1 1 1 $207,600
Rose Mandarino Park (Formerly Weston Downs Park) Combined Playground - Neighbourhood WD WN16 1 1 1 1 1 1 1 1 1 1 $207,600
Wilson Century Theatre Park Combined Playground - Neighbourhood WD WN32 1 1 1 1 1 1 1 1 1 1 $207,600
Winding Lane Park Combined Playground - Neighbourhood TH TN2 1 1 1 1 1 1 1 1 1 1 $207,600
Wishing Well Park Combined Playground - Neighbourhood KL KP3 0 0 0 0 0 0 1 1 1 1 $207,600
Woodbridge Highlands Park Combined Playground - Neighbourhood WD WN22 1 1 1 1 1 1 1 1 1 1 $207,600
Woodrose Park Combined Playground - Neighbourhood MA UV2-N13 0 0 0 0 0 1 1 1 1 1 $207,600
Subtotal (#) 76 78 79 85 85 87 90 90 90 91
Subtotal ($000) $17,866.4 $18,281.6 $18,489.2 $19,734.8 $19,473.7 $19,888.9 $20,511.7 $20,511.7 $20,511.7 $20,719.3
APPENDIX ETABLE 1 - PAGE 48
PARK FACILITIES
# of facilities
COMMUNITY SERVICES
HEMSON
HEMSON
163
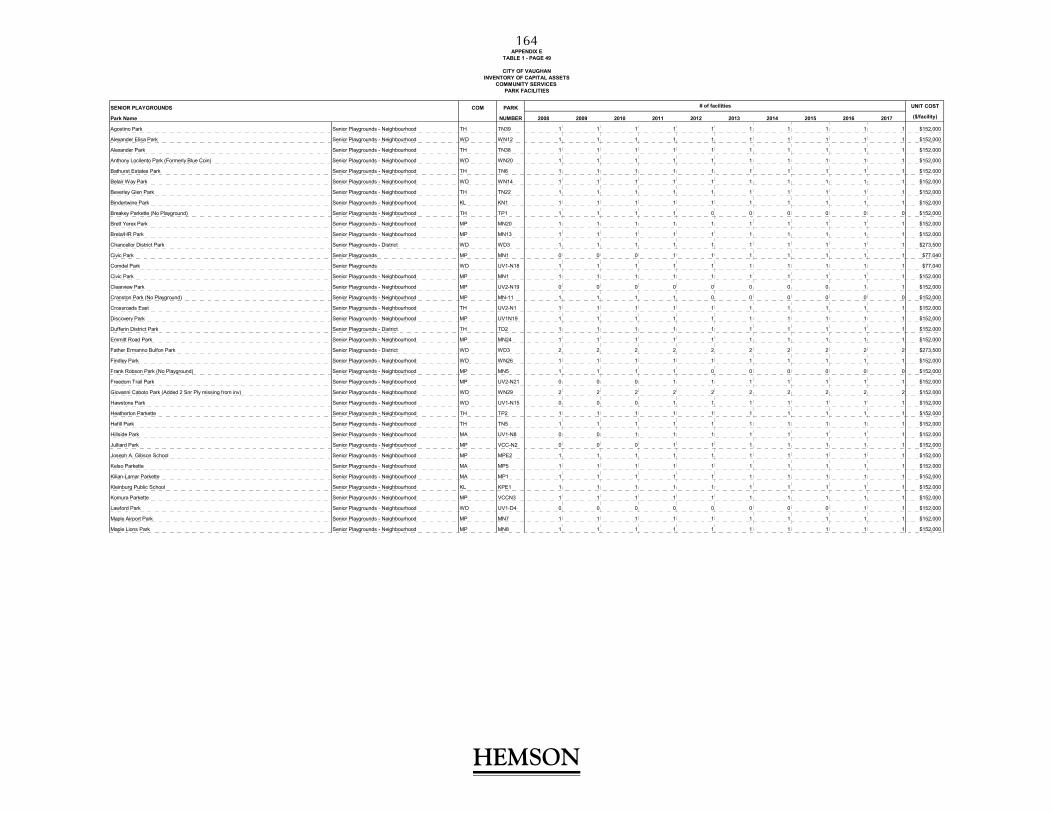
CITY OF VAUGHANINVENTORY OF CAPITAL ASSETS
SENIOR PLAYGROUNDS COM PARK UNIT COST
Park Name NUMBER 2008 2009 2010 2011 2012 2013 2014 2015 2016 2017 ($/facility)
Agostino Park Senior Playgrounds - Neighbourhood TH TN39 1 1 1 1 1 1 1 1 1 1 $152,000
Alexander Elisa Park Senior Playgrounds - Neighbourhood WD WN12 1 1 1 1 1 1 1 1 1 1 $152,000
Alexander Park Senior Playgrounds - Neighbourhood TH TN38 1 1 1 1 1 1 1 1 1 1 $152,000
Anthony Locilento Park (Formerly Blue Coin) Senior Playgrounds - Neighbourhood WD WN20 1 1 1 1 1 1 1 1 1 1 $152,000
Bathurst Estates Park Senior Playgrounds - Neighbourhood TH TN6 1 1 1 1 1 1 1 1 1 1 $152,000
Belair Way Park Senior Playgrounds - Neighbourhood WD WN14 1 1 1 1 1 1 1 1 1 1 $152,000
Beverley Glen Park Senior Playgrounds - Neighbourhood TH TN22 1 1 1 1 1 1 1 1 1 1 $152,000
Bindertwine Park Senior Playgrounds - Neighbourhood KL KN1 1 1 1 1 1 1 1 1 1 1 $152,000
Breakey Parkette (No Playground) Senior Playgrounds - Neighbourhood TH TP1 1 1 1 1 0 0 0 0 0 0 $152,000
Brett Yerex Park Senior Playgrounds - Neighbourhood MP MN20 1 1 1 1 1 1 1 1 1 1 $152,000
Breta/HR Park Senior Playgrounds - Neighbourhood MP MN13 1 1 1 1 1 1 1 1 1 1 $152,000
Chancellor District Park Senior Playgrounds - District WD WD3 1 1 1 1 1 1 1 1 1 1 $273,500
Civic Park Senior Playgrounds MP MN1 0 0 0 1 1 1 1 1 1 1 $77,040
Comdel Park Senior Playgrounds WD UV1-N18 1 1 1 1 1 1 1 1 1 1 $77,040
Civic Park Senior Playgrounds - Neighbourhood MP MN1 1 1 1 1 1 1 1 1 1 1 $152,000
Clearview Park Senior Playgrounds - Neighbourhood MP UV2-N19 0 0 0 0 0 0 0 0 1 1 $152,000
Cranston Park (No Playground) Senior Playgrounds - Neighbourhood MP MN-11 1 1 1 1 0 0 0 0 0 0 $152,000
Crossroads East Senior Playgrounds - Neighbourhood TH UV2-N1 1 1 1 1 1 1 1 1 1 1 $152,000
Discovery Park Senior Playgrounds - Neighbourhood MP UV1N19 1 1 1 1 1 1 1 1 1 1 $152,000
Dufferin District Park Senior Playgrounds - District TH TD2 1 1 1 1 1 1 1 1 1 1 $152,000
Emmitt Road Park Senior Playgrounds - Neighbourhood MP MN24 1 1 1 1 1 1 1 1 1 1 $152,000
Father Ermanno Bulfon Park Senior Playgrounds - District WD WD3 2 2 2 2 2 2 2 2 2 2 $273,500
Findley Park Senior Playgrounds - Neighbourhood WD WN26 1 1 1 1 1 1 1 1 1 1 $152,000
Frank Robson Park (No Playground) Senior Playgrounds - Neighbourhood MP MN5 1 1 1 1 0 0 0 0 0 0 $152,000
Freedom Trail Park Senior Playgrounds - Neighbourhood MP UV2-N21 0 0 0 1 1 1 1 1 1 1 $152,000
Giovanni Caboto Park (Added 2 Snr Ply missing from inv) Senior Playgrounds - Neighbourhood WD WN29 2 2 2 2 2 2 2 2 2 2 $152,000
Hawstone Park Senior Playgrounds - Neighbourhood WD UV1-N15 0 0 0 1 1 1 1 1 1 1 $152,000
Heatherton Parkette Senior Playgrounds - Neighbourhood TH TP2 1 1 1 1 1 1 1 1 1 1 $152,000
Hefill Park Senior Playgrounds - Neighbourhood TH TN5 1 1 1 1 1 1 1 1 1 1 $152,000
Hillside Park Senior Playgrounds - Neighbourhood MA UV1-N8 0 0 1 1 1 1 1 1 1 1 $152,000
Julliard Park Senior Playgrounds - Neighbourhood MP VCC-N2 0 0 0 1 1 1 1 1 1 1 $152,000
Joseph A. Gibson School Senior Playgrounds - Neighbourhood MP MPE2 1 1 1 1 1 1 1 1 1 1 $152,000
Kelso Parkette Senior Playgrounds - Neighbourhood MA MP5 1 1 1 1 1 1 1 1 1 1 $152,000
Kilian-Lamar Parkette Senior Playgrounds - Neighbourhood MA MP1 1 1 1 1 1 1 1 1 1 1 $152,000
Kleinburg Public School Senior Playgrounds - Neighbourhood KL KPE1 1 1 1 1 1 1 1 1 1 1 $152,000
Komura Parkette Senior Playgrounds - Neighbourhood MP VCCN3 1 1 1 1 1 1 1 1 1 1 $152,000
Lawford Park Senior Playgrounds - Neighbourhood WD UV1-D4 0 0 0 0 0 0 0 0 1 1 $152,000
Maple Airport Park Senior Playgrounds - Neighbourhood MP MN7 1 1 1 1 1 1 1 1 1 1 $152,000
Maple Lions Park Senior Playgrounds - Neighbourhood MP MN8 1 1 1 1 1 1 1 1 1 1 $152,000
# of facilities
APPENDIX ETABLE 1 - PAGE 49
PARK FACILITIESCOMMUNITY SERVICES
HEMSON
HEMSON
164

CITY OF VAUGHANINVENTORY OF CAPITAL ASSETS
SENIOR PLAYGROUNDS CONT'D COM PARK UNIT COST
Park Name NUMBER 2008 2009 2010 2011 2012 2013 2014 2015 2016 2017 ($/facility)
Mario Plastina Park Senior Playgrounds - Neighbourhood MP MN12 1 1 1 1 1 1 1 1 1 1 $152,000
Mast Road Park Senior Playgrounds - Neighbourhood MP UV1-N20 1 1 1 1 1 1 1 1 1 1 $152,000
Maxey Park Senior Playgrounds - Neighbourhood WD WN4 1 1 1 1 1 1 1 1 1 1 $152,000
McClure Meadows Park Senior Playgrounds - Neighbourhood WD WN27 1 1 1 1 1 1 1 1 1 1 $152,000
Michael Barasso Park (Prev. Morning Star Park) Senior Playgrounds - Neighbourhood WD WN19 1 1 1 1 1 1 1 1 1 1 $152,000
Mill Race Park Senior Playgrounds - Neighbourhood TH UV2-N4 0 0 0 0 0 0 1 1 1 1 $152,000
Miriam Segal Park (Formerly Apple Blossom) Senior Playgrounds - Neighbourhood TH UV2-N10 1 1 1 1 1 1 1 1 1 1 $152,000
Mosswood Park Senior Playgrounds - Neighbourhood TH UV2-N11 0 0 0 1 1 1 1 1 1 1 $152,000
Napa Valley Park Senior Playgrounds - Neighbourhood WD WN33 1 1 1 1 1 1 1 1 1 1 $152,000
Ohr Menachern Park Senior Playgrounds - Neighbourhood TH UV2-N2 1 1 1 1 1 1 1 1 1 1 $152,000
Parwest Parkette Senior Playgrounds - Neighbourhood WD WN23 1 1 1 1 1 1 1 1 1 1 $152,000
Pine Grove Public School/Hayhoe Park Senior Playgrounds - Neighbourhood WD WN6 1 1 1 1 1 1 1 1 1 1 $152,000
Peachtree Parkette Senior Playgrounds - Neighbourhood TH TP9 1 1 1 1 1 1 1 1 1 1 $152,000
Pierre Elliot Trudeau Senior Playgrounds - Neighbourhood TH TN3 1 1 1 1 1 1 1 1 1 1 $152,000
Pioneer Park Senior Playgrounds - Neighbourhood TH UV2-N15 0 0 0 0 0 0 1 1 1 1 $152,000
Princeton Gate Park Senior Playgrounds - Neighbourhood MP MN14 1 1 1 1 1 1 1 1 1 1 $152,000
Reeves Park Senior Playgrounds - Neighbourhood MP MN2 1 1 1 1 1 1 1 1 1 1 $152,000
Routley Park Senior Playgrounds - Neighbourhood MP MN3 1 1 1 1 1 1 1 1 1 1 $152,000
Sunset Ridge Park Senior Playgrounds - Neighbourhood WD WEA-N1 1 1 1 1 1 1 1 1 1 1 $152,000
Sylvan Brook Parkette Senior Playgrounds - Neighbourhood WD WP8 1 1 1 1 1 1 1 1 1 1 $152,000
Thornhill Park Senior Playgrounds - Neighbourhood TH TN11 1 1 1 1 1 1 1 1 1 1 $152,000
Twelve Oaks Park Senior Playgrounds - Neighbourhood MP UV2-N17 0 0 0 1 1 1 1 1 1 1 $152,000
Vaughan Mills Park Senior Playgrounds - Neighbourhood WD WN24 1 1 1 1 1 1 1 1 1 1 $152,000
Vellore Woods Park Senior Playgrounds - Neighbourhood WD WN37 1 1 1 1 1 1 1 1 1 1 $152,000
Velmar Downs Park Senior Playgrounds - Neighbourhood WD WN21 1 1 1 1 1 1 1 1 1 1 $152,000
Venice Gate Park Senior Playgrounds - Neighbourhood MA UV1-N6 0 0 0 1 1 1 1 1 1 1 $152,000
Ventura Park Senior Playgrounds - Neighbourhood TH TN23 1 1 1 1 1 1 1 1 1 1 $152,000
Venice Gate Park Senior Playgrounds - Neighbourhood MP UV1-N6 0 0 0 1 1 1 1 1 1 1 $152,000
Via Camponile Park Senior Playgrounds - Neighbourhood WD UV1-N3 0 0 0 1 1 1 1 1 1 1 $152,000
Via Campanile Senior Playgrounds - Neighbourhood WD UV1-N3 1 1 1 1 1 1 1 1 1 1 $152,000
Via Verde Park Senior Playgrounds - Neighbourhood WD WEA-N4 1 1 1 1 1 1 1 1 1 1 $152,000
Village Green Park Senior Playgrounds - Neighbourhood WD UV1-N2 0 0 0 0 0 0 1 1 1 1 $152,000
Wade Gate Park Senior Playgrounds - Neighbourhood TH TN20 1 1 1 1 1 1 1 1 1 1 $152,000
West Maple Creek Park Senior Playgrounds - Neighbourhood MP MN17 1 1 1 1 1 1 1 1 1 1 $152,000
Westwind Park Senior Playgrounds - Neighbourhood MA UV1-N5 0 0 0 0 1 1 1 1 1 1 $152,000
Woodbridge College Parkette Senior Playgrounds - Neighbourhood WD WP12 0 0 1 1 1 1 1 1 1 1 $152,000
Wood Valley Park Senior Playgrounds - Neighbourhood MP UV2-N14 1 1 1 1 1 1 1 1 1 1 $152,000
Worth Park Senior Playgrounds - Neighbourhood TH TN24 1 1 1 1 1 1 1 1 1 1 $152,000
Yorkhill District Park Senior Playgrounds - District TH TD1 2 2 2 2 2 2 2 2 2 2 $273,500
Subtotal (#) 64 64 66 75 73 73 76 76 78 78
Subtotal ($000) $10,260.5 $10,260.5 $10,564.5 $11,857.6 $11,553.6 $11,553.6 $12,009.6 $12,009.6 $12,313.6 $12,313.6
# of facilities
APPENDIX ETABLE 1 - PAGE 50
PARK FACILITIESCOMMUNITY SERVICES
HEMSON
HEMSON
165

CITY OF VAUGHANINVENTORY OF CAPITAL ASSETS
JUNIOR PLAYGROUNDS COM PARK UNIT COST
Park Name NUMBER 2008 2009 2010 2011 2012 2013 2014 2015 2016 2017 ($/facility)
Agostino Park Junior Playground - Neighbourhood TH TN39 1 1 1 1 1 1 1 1 1 1 $152,000
Ahmadiyya Park Junior Playground - Neighbourhood MP UV1-N7 1 1 1 1 1 1 1 1 1 1 $152,000
Alexander Park Junior Playground - Neighbourhood TH TN38 1 1 1 1 1 1 1 1 1 1 $152,000
Almont Park Junior Playground - Neighbourhood WD WN5 1 1 1 1 1 1 1 1 1 1 $152,000
Anthony Locilento Park (Formerly Blue Coin) Junior Playground - Neighbourhood WD WN20 2 2 2 2 2 2 2 2 2 2 $152,000
Bathurst Estates Park Junior Playground - Neighbourhood TH TN6 1 1 1 1 1 1 1 1 1 1 $152,000
Beverley Glen Park Junior Playground - Neighbourhood TH TN22 1 1 1 1 1 1 1 1 1 1 $152,000
Bindertwine Park Junior Playground - Neighbourhood KL KN1 1 1 1 1 1 1 1 1 1 1 $152,000
Blue Willow Square Junior Playground - Neighbourhood WD WN30 1 1 1 1 1 1 1 1 1 1 $152,000
Bob O'Link Parkette Junior Playground - Neighbourhood TH TP10 1 1 1 1 1 1 1 1 1 1 $152,000
Breakey Parkette Junior Playground - Neighbourhood TH TP1 1 1 1 1 1 1 1 1 1 1 $152,000
Brett Yerex Park Junior Playground - Neighbourhood MP MN20 1 1 1 1 1 1 1 1 1 1 $152,000
Carrville Mill Park Junior Playground - Neighbourhood TH UV2-N16 0 0 0 1 1 1 1 1 1 1 $152,000
Castlehill Park Junior Playground - Neighbourhood TH TP2 2 2 2 2 2 2 2 2 2 2 $152,000
Chancellor District Park Junior Playground - District WD WD3 1 1 1 1 1 1 1 1 1 1 $273,500
Clearview Park Junior Playground - Neighbourhood MA UV2-N19 0 0 0 0 0 0 0 0 1 1 $152,000
Civic Park Junior Playground - Neighbourhood MP MN1 0 0 0 1 1 1 1 1 1 1 $152,000
Comdel Park Junior Playground - Neighbourhood WD UV7-N18 1 1 1 1 1 1 1 1 1 1 $152,000
Concord/Thornhill Park Junior Playground - District THH TR2 1 1 1 1 1 1 1 1 1 1 $273,500
Conley Park North Junior Playground - Neighbourhood TH TN37 1 1 1 1 1 1 1 1 1 1 $152,000
Crestlawn Junior Playground - Neighbourhood WD WN39 0 0 0 1 1 1 1 1 1 1 $152,000
Crief Parkette Junior Playground - Neighbourhood MP MP2 1 1 1 1 1 1 1 1 1 1 $152,000
Crofters Park Junior Playground - Neighbourhood WD WN17 1 1 1 1 1 1 1 1 1 1 $152,000
Crossroads East Junior Playground - Neighbourhood TH UV2-N1 1 1 1 1 1 1 1 1 1 1 $152,000
Davos Park Junior Playground - Neighbourhood WD UV1-N12 0 0 0 1 1 1 1 1 1 1 $152,000
Discovery Park Junior Playground - Neighbourhood MP UV1N19 1 1 1 1 1 1 1 1 1 1 $152,000
Doctor's McLean Park (Previously Fundale Park) Junior Playground - District WD WD4 1 1 1 1 1 1 1 1 1 1 $273,500
Downham Green Park Junior Playground - Neighbourhood TH TN15 1 1 1 1 1 1 1 1 1 1 $152,000
Dufferin District Park Junior Playground - District TH TD2 1 1 1 1 1 1 1 1 1 1 $152,000
Eagles Landing Park Junior Playground - Neighbourhood MP UV2-N6 0 0 0 1 1 1 1 1 1 1 $152,000
Emmitt Road Park Junior Playground - Neighbourhood MP MN24 1 1 1 1 1 1 1 1 1 1 $152,000
Father Ermanno Bulfon Park Junior Playground - District WD WD2 1 1 1 1 1 1 1 1 1 1 $273,500
Fazia Mahdi Park Junior Playground - Neighbourhood MP UV1-N22 1 1 1 1 1 1 1 1 1 1 $152,000
Fossil Hill Park Junior Playground - Neighbourhood WD WN35 1 1 1 1 1 1 1 1 1 1 $152,000
Fred Armstrong Parkette Junior Playground - Neighbourhood WD WP2 1 1 1 1 1 1 1 1 1 1 $152,000
Freedom Trail Park Junior Playground - Neighbourhood MP UV2-N21 0 0 0 1 1 1 1 1 1 1 $152,000
Gilmore Park Junior Playground - Neighbourhood TH TN14 1 1 1 1 1 1 1 1 1 1 $152,000
Giovanni Caboto Park Junior Playground - Neighbourhood WD WN29 1 1 1 1 1 1 1 1 1 1 $152,000
Glen Shields Park Junior Playground - Neighbourhood TH TN25 1 1 1 1 1 1 1 1 1 1 $152,000
Hawstone Park Junior Playground - Neighbourhood WD UV1-N15 0 0 0 1 1 1 1 1 1 1 $152,000
Hayhoe Park Junior Playground - Neighbourhood WD WN6 0 0 0 1 1 1 1 1 1 1 $152,000
TABLE 1 - PAGE 51
PARK FACILITIES
# of facilities
COMMUNITY SERVICES
APPENDIX E
HEMSON
HEMSON
166

CITY OF VAUGHANINVENTORY OF CAPITAL ASSETS
JUNIOR PLAYGROUNDS CONT'D COM PARK UNIT COST
Park Name NUMBER 2008 2009 2010 2011 2012 2013 2014 2015 2016 2017 ($/facility)
Heatherton Parkette Junior Playground - Neighbourhood TH TP2 1 1 1 1 1 1 1 1 1 1 $152,000
Hefill Park Junior Playground - Neighbourhood TH TN5 1 1 1 1 1 1 1 1 1 1 $152,000
Hillside Park Junior Playground - Neighbourhood UV1-N8 0 0 1 1 1 1 1 1 1 1 $152,000
Jack Pine Park Junior Playground - Neighbourhood UV2-N20 0 0 1 1 1 1 1 1 1 1 $152,000
Jersey Creek Junior Playground - Neighbourhood WD WOS6 1 1 1 1 1 1 1 1 1 1 $152,000
Julliard Park Junior Playground - Neighbourhood MP VCC-N2 0 0 0 1 1 1 1 1 1 1 $152,000
Joseph Aaron Park Junior Playground - Neighbourhood TH TN16 1 1 1 1 1 1 1 1 1 1 $152,000
Kelso Parkette Junior Playground - Neighbourhood MP MP5 1 1 1 1 1 1 1 1 1 1 $152,000
Killian Lamar Parkette Junior Playground - Neighbourhood MP MP1 1 1 1 1 1 1 1 1 1 1 $152,000
Killoran Park Junior Playground - Neighbourhood WN7 1 1 1 1 1 1 1 1 1 1 $152,000
King High Park Junior Playground - Neighbourhood TH TN21 1 1 1 1 1 1 1 1 1 1 $152,000
Kingsview Park Junior Playground - Neighbourhood WD UV1-N4 1 1 1 1 1 1 1 1 1 1 $152,000
Kipling Parkette Junior Playground - Neighbourhood WD WP9 1 1 1 1 1 1 1 1 1 1 $152,000
Komura Parkette Junior Playground - Neighbourhood MP VCCN3 1 1 1 1 1 1 1 1 1 1 $152,000
Lakehurst Park Junior Playground - Neighbourhood TN12 1 1 1 1 1 1 1 1 1 1 $152,000
La Rocca Park Junior Playground - Neighbourhood WD WN34 1 1 1 1 1 1 1 1 1 1 $152,000
Lawford Park Junior Playground - Neighbourhood WD UV1-D4 0 0 0 0 0 0 0 0 1 1 $152,000
Le Parc St. Jean de Brebeuf Junior Playground - Neighbourhood WD WEA-N5 1 1 1 1 1 1 1 1 1 1 $152,000
MacKenzie Glen Disrtict Park Junior Playground - District MP MD2 3 3 3 3 3 3 3 3 3 3 $273,500
Mapes Park Junior Playground - Neighbourhood WD WN18 1 1 1 1 1 1 1 1 1 1 $152,000
Maple Airport Park Junior Playground - Neighbourhood MP MN7 1 1 1 1 1 1 1 1 1 1 $152,000
Maple Community District Park Junior Playground - District MP MD1 1 1 1 1 1 1 1 1 1 1 $152,000
Maple Lions Park Junior Playground - Neighbourhood MP MN8 1 1 1 1 1 1 1 1 1 1 $152,000
Maple Trails Park Junior Playground - Neighbourhood MP MN19 1 1 1 1 1 1 1 1 1 1 $152,000
Mario Plastina Park Junior Playground - Neighbourhood MP MN12 1 1 1 1 1 1 1 1 1 1 $152,000
Marita Payne Park Junior Playground - Neighbourhood TH TN26 1 1 1 1 1 1 1 1 1 1 $152,000
Mast Road Park Junior Playground - Neighbourhood MP UV1-N20 1 1 1 1 1 1 1 1 1 1 $152,000
Mathew Park Junior Playground - District WD UV1-D3 0 0 1 0 0 0 0 0 0 0 $273,500
McClure Meadows Park Junior Playground - Neighbourhood WD WN27 1 1 1 1 1 1 1 1 1 1 $152,000
Melville Park Junior Playground - Neighbourhood MP MN9 1 1 1 1 1 1 1 1 1 1 $152,000
Michael Barrasso Park Junior Playground - Neighbourhood WN19 1 1 1 1 1 1 1 1 1 1 $152,000
Michael Fitzgerald Park Junior Playground - Neighbourhood WD WN31 1 1 1 1 1 1 1 1 1 1 $152,000
Mill Arbour Park Junior Playground - Neighbourhood TH TN17 1 1 1 1 1 1 1 1 1 1 $152,000
Mill Race Park Junior Playground - Neighbourhood TH UV2-N4 0 0 0 0 0 0 1 1 1 1 $152,000
Miriam Segal Park (Formerly Apple Blossom) Junior Playground - Neighbourhood TH UV2-N10 1 1 1 1 1 1 1 1 1 1 $152,000
Misty Sugar Park Junior Playground - Neighbourhood TH UV2-N8 1 1 1 1 1 1 1 1 1 1 $152,000
Mosswood Park Junior Playground - Neighbourhood TH UV2-N11 0 0 0 1 1 1 1 1 1 1 $152,000
Napa Valley Park Junior Playground - Neighbourhood WD WN33 1 1 1 1 1 1 1 1 1 1 $152,000
Naylon Parkette Junior Playground - Neighbourhood MP MP3 1 1 1 1 1 1 1 1 1 1 $152,000
Nevada Park Junior Playground - Neighbourhood MP MN18 1 1 1 1 1 1 1 1 1 1 $152,000
New Seabury Parkette Junior Playground - Neighbourhood TH TP8 1 1 1 1 1 1 1 1 1 1 $152,000
Newport Square Park Junior Playground - Neighbourhood TH TN10 1 1 1 1 1 1 1 1 1 1 $152,000
# of facilities
APPENDIX ETABLE 1 - PAGE 52
COMMUNITY SERVICES PARK FACILITIES
HEMSON
HEMSON
167

CITY OF VAUGHANINVENTORY OF CAPITAL ASSETS
JUNIOR PLAYGROUNDS CONT'D COM PARK UNIT COST
Park Name NUMBER 2008 2009 2010 2011 2012 2013 2014 2015 2016 2017 ($/facility)
Oakhurst Park Junior Playground - Neighbourhood TH TN29 1 1 1 1 1 1 1 1 1 1 $152,000
Ohr Menachern Park Junior Playground - Neighbourhood TH UV2-N2 0 1 1 1 1 1 1 1 1 1 $152,000
Old Firehall Parkette Junior Playground - Neighbourhood TH WP7 1 1 1 1 1 1 1 1 1 1 $152,000
Parwest Parkette Junior Playground - Neighbourhood WD WN23 1 1 1 1 1 1 1 1 1 1 $152,000
Peach Tree Parkette Junior Playground - Neighbourhood TH TP9 1 1 1 1 1 1 1 1 1 1 $152,000
Pioneer Park Junior Playground - Neighbourhood TH UV2-N15 0 0 0 0 0 0 1 1 1 1 $152,000
Pine Grove Public School/Hayhoe Park Junior Playground - Neighbourhood WD WN6 1 1 1 1 1 1 1 1 1 1 $152,000
Peak Point Park Junior Playground - Neighbourhood MP MN22 0 0 0 1 1 1 1 1 1 1 $152,000
Princeton Gate Park Junior Playground - Neighbourhood MP MN14 1 1 1 1 1 1 1 1 1 1 $152,000
Rainbow Creek Park Junior Playground - Neighbourhood WD WN1 1 1 1 1 1 1 1 1 1 1 $152,000
Reeves Park Junior Playground - Neighbourhood MP MN2 1 1 1 1 1 1 1 1 1 1 $152,000
Regency View Parkette Junior Playground - Neighbourhood MP MN21 0 1 1 1 1 1 1 1 1 1 $152,000
Rimwood Park Junior Playground - Neighbourhood KL KN5 1 1 1 1 1 1 1 1 1 1 $152,000
Riverside Park Junior Playground - Neighbourhood TH TN30 1 1 1 1 1 1 1 1 1 1 $152,000
Ross Guerri Park Junior Playground - Neighbourhood KL KP4 0 1 1 1 1 1 1 1 1 1 $152,000
Routley Park Junior Playground - Neighbourhood MP MN3 1 1 1 1 1 1 1 1 1 1 $152,000
Sherwood Parkette Junior Playground - Neighbourhood MP MP4 1 1 1 1 1 1 1 1 1 1 $152,000
Starling Park Junior Playground - Neighbourhood UV1 UV1-N1 1 1 1 1 1 1 1 1 1 1 $152,000
Sugarbush Heritage Park Junior Playground - Neighbourhood TH UV2-N9 1 1 1 1 1 1 1 1 1 1 $152,000
Sunset Ridge Park Junior Playground - Neighbourhood WD WEA-N1 1 1 1 1 1 1 1 1 1 1 $152,000
Tammy Breda Park (Prev. Forest Fountain Park) Junior Playground - Neighbourhood WD WN36 1 1 1 1 1 1 1 1 1 1 $152,000
Thomson Park Junior Playground - Neighbourhood WD WN25 1 1 1 1 1 1 1 1 1 1 $152,000
Thornhill Park Junior Playground - Neighbourhood TH TN11 1 1 1 1 1 1 1 1 1 1 $152,000
Tinsmith Parkette Junior Playground - Neighbourhood KL KP1 1 1 1 1 1 1 1 1 1 1 $152,000
Treelawn Parkette Junior Playground - Neighbourhood KL KP2 1 1 1 1 1 1 1 1 1 1 $152,000
Twelve Oaks Park Junior Playground - Neighbourhood MP UV2-N17 0 0 0 1 1 1 1 1 1 1 $152,000
Vaughan Crest Park Junior Playground - Neighbourhood TH TN1 1 1 1 1 1 1 1 1 1 1 $152,000
Vaughan Sports Village Junior Playground - Neighbourhood WD WN24 1 1 1 1 1 1 1 1 1 1 $152,000
Vaughan Mills Park Junior Playground - Neighbourhood WD WN24 1 1 1 1 1 1 1 1 1 1 $152,000
Vellore Heritage Park Junior Playground - Neighbourhood WD WN38 1 1 1 1 1 1 1 1 1 1 $152,000
Vellore Woods Park Junior Playground - Neighbourhood WD WN37 1 1 1 1 1 1 1 1 1 1 $152,000
Velmar Downs Park Junior Playground - Neighbourhood WD WN21 1 1 1 1 1 1 1 1 1 1 $152,000
Ventura Park Junior Playground - Neighbourhood TH TN23 1 1 1 1 1 1 1 1 1 1 $152,000
Venice Gate Park Junior Playground - Neighbourhood MP UV1-N6 0 0 0 2 2 2 2 2 2 2 $152,000
Via Camponile Park Junior Playground - Neighbourhood WD UV1-N3 0 0 0 1 1 1 1 1 1 1 $152,000
Via Verde Park Junior Playground - Neighbourhood WD WEA-N4 1 1 1 1 1 1 1 1 1 1 $152,000
Village Green Park Junior Playground - Neighbourhood WD UV1-N2 0 0 0 0 0 0 1 1 1 1 $152,000
Vista Gate Park Junior Playground - Neighbourhood TH MN23 1 1 1 1 1 1 1 1 1 1 $152,000
Sonoma Heights Community Park (W.E.A District Park) Junior Playground - District WD WEA-D1 1 1 1 1 1 1 1 1 1 1 $273,500
West Crossroads Park Junior Playground - Neighbourhood TH TN19 1 1 1 1 1 1 1 1 1 1 $152,000
West Maple Creek East Park Junior Playground - Neighbourhood MP MN17 1 1 1 1 1 1 1 1 1 1 $152,000
Westwind Park Junior Playground - Neighbourhood MP UV1-N5 0 0 0 0 1 1 1 1 1 1 $152,000
Wilson Century Theatre Park Junior Playground - Neighbourhood WD WN32 1 1 1 1 1 1 1 1 1 1 $152,000
Wood Valley Park Junior Playground - Neighbourhood MP UV2-N14 1 1 1 1 1 1 1 1 1 1 $152,000
Woodbridge Highlands Park Junior Playground - Neighbourhood WD WN22 1 1 1 1 1 1 1 1 1 1 $152,000
Worth Park Junior Playground - Neighbourhood TH TN24 1 1 1 1 1 1 1 1 1 1 $152,000
Yorkhill District Park Junior Playground - District TH TD1 1 1 1 1 1 1 1 1 1 1 $273,500
Subtotal (#) 108 111 114 128 129 129 132 132 134 134
Subtotal ($000) $17,509.5 $17,965.5 $18,543.0 $20,549.5 $20,701.5 $20,701.5 $21,157.5 $21,157.5 $21,461.5 $21,461.5
NEW CATEGORY SWING PITS COM PARK UNIT COST
Park Name NUMBER 2008 2009 2010 2011 2012 2013 2014 2015 2016 2017 ($/facility)
Aberdeen Parkette Swing Pit WD WP3 1 1 1 1 1 1 1 1 1 1 $37,160
Subtotal (#) 1 1 1 1 1 1 1 1 1 1
Subtotal ($000) $37.2 $37.2 $37.2 $37.2 $37.2 $37.2 $37.2 $37.2 $37.2 $37.2
APPENDIX ETABLE 1 - PAGE 53
PARK FACILITIES
# of facilities
# of facilities
COMMUNITY SERVICES
HEMSON
HEMSON
168

CITY OF VAUGHAN
INVENTORY OF CAPITAL ASSETS
COMMUNITY SERVICES
PLAY COURTS COM PARK UNIT COST
Park Name NUMBER 2008 2009 2010 2011 2012 2013 2014 2015 2016 2017 ($/facility)
Emmitt Road Park (School Property) Play Courts MP MN24 1 1 1 1 1 1 1 1 1 1 $37,160
Frank Robson Park Play Courts MP MN5 1 1 1 1 1 1 1 1 1 1 $37,160
Glen Shields Park Play Courts TH TN25 1 1 1 1 1 1 1 1 1 1 $37,160
Langstaff School Park Play Courts TH TN31 1 1 1 1 0 0 0 0 0 0 $37,160
Mapes Park Play Courts WD WN18 1 1 1 1 0 0 0 0 0 0 $37,160
Maple Community District Park Play Courts MP MD1 1 1 1 1 0 0 0 0 0 0 $37,160
McClure Meadows Park Play Courts WD WN27 1 1 1 1 0 0 0 0 0 0 $37,160
Napa Valley Park Play Courts WD WN33 1 1 1 1 0 0 0 0 0 0 $37,160
Southview Park Play Courts TH TN34 1 1 1 1 0 0 0 0 0 0 $37,160
Tammy Breda Park (Prev. Forest Fountain Park) Play Courts WD WN36 1 1 1 1 0 0 0 0 0 0 $37,160
Tinsmith Parkette Play Courts KL KP1 1 1 1 1 0 0 0 0 0 0 $37,160
Vellore Heritage Park Play Courts WD WN38 0 0 0 0 0 0 0 0 0 0 $37,160
Velmar Downs Park Play Courts WD WN21 1 1 1 1 0 0 0 0 0 0 $37,160
Yorkhill District Park Play Courts TH TD1 1 1 1 1 0 0 0 0 0 0 $37,160
Subtotal (#) 13 13 13 13 3 3 3 3 3 3
Subtotal ($000) $483.1 $483.1 $483.1 $483.1 $111.5 $111.5 $111.5 $111.5 $111.5 $111.5
FITNESS EQUIPMENT COM PARK UNIT COST
Park Name NUMBER 2008 2009 2010 2011 2012 2013 2014 2015 2016 2017 ($/facility)
Heritage Park Fitness Equipment Thornhill UV2-N18 0 0 0 0 0 0 5 5 5 5 $29,600
Jack Pine Park Fitness Equipment Maple UV2-N20 0 0 6 6 6 6 6 6 6 6 $29,600
Village Green Park Fitness Equipment Woodbridge UV1-N2 0 0 0 0 0 0 5 5 5 5 $29,600
Jersey Creek Open Space Fitness Equipment Woodbridge WOS6 0 0 0 6 6 6 6 6 6 6 $29,600
Subtotal (#) 0 0 6 12 12 12 22 22 22 22
Subtotal ($000) $0.0 $0.0 $177.6 $355.2 $355.2 $355.2 $651.2 $651.2 $651.2 $651.2
OFFLEASH DOG PARK COM PARK UNIT COST
Park Name NUMBER 2008 2009 2010 2011 2012 2013 2014 2015 2016 2017 ($/facility)
Concord Thornhill Regional Park Off-Leash Dog Park Thornhill TR2 1 1 1 1 1 1 1 1 1 1 $140,000
Subtotal (#) 1 1 1 1 1 1 1 1 1 1
Subtotal ($000) $140.0 $140.0 $140.0 $140.0 $140.0 $140.0 $140.0 $140.0 $140.0 $140.0
APPENDIX E
TABLE 1 - PAGE 54
PARK FACILITIES
# of facilities
# of facilities
# of facilities
HEMSON
HEMSON
169

CITY OF VAUGHAN
INVENTORY OF CAPITAL ASSETS
COMMUNITY SERVICES
Shade Structure COM PARK UNIT COST
Park Name NUMBER 2008 2009 2010 2011 2012 2013 2014 2015 2016 2017 ($/facility)
Agostino Park PERGOLA Thornhill TN39 1 1 1 1 1 1 1 1 1 1 $28,000
Ahmadyyia Park SHADE SHELTER Maple UV1N7 1 1 1 1 1 1 1 1 1 1 $86,600
Alexander Park PERGOLA Thornhill TN38 3 3 3 3 3 3 3 3 3 3 $28,000
Anthony Locilento Park SHADE SHELTER Woodbridge WN20 1 1 1 1 1 1 1 1 1 1 $86,600
Beverley Glen Park GAZEBO Thornhill TN22 1 1 1 1 1 1 1 1 1 1 $52,500
Bindertwine Park GAZEBO Kleinburg KN1 1 1 1 1 1 1 1 1 1 1 $52,500
Bindertwine Park SHADE SHELTER Kleinburg KN1 1 1 1 1 1 1 1 1 1 1 $86,600
Blue Willow Square OPEN ROOF/TRELLIS Woodbridge WN30 2 2 2 2 2 2 2 2 2 2 $52,500
Calvary Church Sports Fields PERGOLA Kleinburg KS1 0 0 0 1 1 1 1 1 1 1 $28,000
Carville Mill Park SHADE SHELTER Thornhill UV2N16 1 1 1 1 1 1 1 1 1 1 $86,600
Castlehill Park GAZEBO Maple MN6 1 1 1 1 1 1 1 1 1 1 $52,500
Chancellor District Park PICNIC SHELTER Woodbridge WD3 0 0 0 0 0 0 0 0 1 1 $101,300
Clearview Park SHADE SHELTER Maple UV2-N19 1 1 1 1 1 1 1 1 1 1 $86,600
Comdel Park OPEN ROOF/TRELLIS Maple UV1N18 1 1 1 1 1 1 1 1 1 1 $52,500
Conley Park North GAZEBO Thornhill TN37 1 1 1 1 1 1 1 1 1 1 $52,500
Conley Park South SHADE SHELTER Thornhill TN13 2 2 2 2 2 2 2 2 2 2 $86,600
Crofters Park GAZEBO Woodbridge WN17 1 1 1 1 1 1 1 1 1 1 $52,500
Davos Park OPEN ROOF/TRELLIS Woodbridge UV1N12 2 2 2 2 2 2 2 2 2 2 $52,500
Discovery Park GAZEBO Maple UV1N19 1 1 1 1 1 1 1 1 1 1 $52,500
Doctors Mclean District Park PICNIC SHELTER Woodbridge WD4 2 2 2 2 2 2 2 2 2 2 $101,300
Dufferin District Park GAZEBO Thornhill TD2 0 0 0 0 0 0 0 0 0 0 $52,500
Eagles Landing Park OPEN ROOF/TRELLIS Maple UV2N6 1 1 1 1 1 1 1 1 1 1 $52,500
East Crossroads Park DECORATIVE STRUCTURE Thornhill UV2-N1 2 2 2 2 2 2 2 2 2 2 $52,500
East Crossroads Park PERGOLA Thornhill UV2-N1 1 1 1 1 1 1 1 1 1 1 $28,000
Father Emanno Bulfon Park GAZEBO Woodbridge WD2 1 1 1 1 1 1 1 1 1 1 $52,500
Fazia Mahdi Park GAZEBO Maple UV1-N22 1 1 1 1 1 1 1 1 1 1 $52,500
Fenyrose Parkette PERGOLA Woodbridge WP10 1 1 1 1 1 1 1 1 1 1 $28,000
Forest Run Park PERGOLA CC17-P8 0 0 0 0 0 1 1 1 1 1 $28,000
Forest View Park OPEN ROOF/TRELLIS Maple UV2-N5 0 0 0 1 1 1 1 1 1 1 $52,500
Freedom Trail Park PERGOLA Maple UV2-N21 1 1 1 1 1 1 1 1 1 1 $28,000
Gallanough Park GAZEBO Thornhill TN4 1 1 1 1 1 1 1 1 1 1 $52,500
Hawstone Park OPEN ROOF/TRELLIS Maple UV1-N15 0 0 0 1 1 1 1 1 1 1 $52,500
Heritage Park GAZEBO Thornhill UV2-N18 0 0 0 2 2 2 2 2 2 2 $52,500
Hillside Park OPEN ROOF/TRELLIS Maple UV1-N8 1 1 1 1 1 1 1 1 1 1 $52,500
Jack Pine Park PERGOLA Maple UV2-N20 0 0 2 2 2 2 2 2 2 2 $28,000
Joseph Aaron Park GAZEBO Thornhill TN16 0 1 1 1 1 1 1 1 1 1 $52,500
Julliard Park OPEN ROOF/TRELLIS Maple VCC-N2 0 2 2 2 2 2 2 2 2 2 $52,500
Kiloran Park GAZEBO Woodbridge WN7 1 1 1 1 1 1 1 1 1 1 $52,500
King High Park SHADE SHELTER Thornhill TN21 3 3 3 3 3 3 3 3 3 3 $86,600
Kingsview Park GAZEBO Woodbridge UV1-N4 1 1 1 1 1 1 1 1 1 1 $52,500
Kipling Parkette GAZEBO Woodbridge WP9 1 1 1 1 1 1 1 1 1 1 $52,500
Komura Park GAZEBO Maple VCC-N3 1 1 1 1 1 1 1 1 1 1 $52,500
La Rocca Square OPEN ROOF/TRELLIS Woodbridge WN34 1 1 1 1 1 1 1 1 1 1 $52,500
Lakehurst Park GAZEBO Thornhill TN12 0 0 0 0 0 0 0 0 1 1 $52,500
Lawford Park DECORATIVE STRUCTURE Vellore UV1-D4 1 1 1 1 1 1 1 1 1 1 $52,500
Le Parc Saint Jean de Brebeuf GAZEBO Woodbridge WEA-N5 1 1 1 1 1 1 1 1 1 1 $52,500
Mackenzie Glen District Park PICNIC SHELTER Maple MD2 1 1 1 1 1 1 1 1 1 1 $101,300
Mackenzie Glen District Park GAZEBO Maple MD2 1 1 1 1 1 1 1 1 1 1 $52,500
Maple Airport Park GAZEBO Maple MN7 1 1 1 1 1 1 1 1 1 1 $52,500
Maple Lions Park GAZEBO Maple MN8 1 1 1 1 1 1 1 1 1 1 $52,500
Maple Trails Park OPEN ROOF/TRELLIS Maple MN19 1 1 1 1 1 1 1 1 1 1 $52,500
Maple Trails Park GAZEBO Maple MN19 1 1 1 1 1 1 1 1 1 1 $52,500
Mario Plastina Park SHADE SHELTER Maple MN12 1 1 1 1 1 1 1 1 1 1 $86,600
Marita Payne Park SHADE SHELTER Thornhill TN26 1 1 1 1 1 1 1 1 1 1 $86,600
Mast Park GAZEBO Maple UV1-N20 1 1 1 1 1 1 1 1 1 1 $52,500
Matthew Park OPEN ROOF/TRELLIS Woodbridge UV1-D3 1 1 1 1 1 1 1 1 1 1 $52,500
Maxey Park PICNIC SHELTER Woodbridge WN4 1 1 1 1 1 1 1 1 1 1 $101,300
McClure Meadows Park GAZEBO Woodbridge WN27 1 1 1 1 1 1 1 1 1 1 $52,500
APPENDIX E
TABLE 1 - PAGE 55
PARK FACILITIES
# of facilities
HEMSON
HEMSON
170

CITY OF VAUGHAN
INVENTORY OF CAPITAL ASSETS
COMMUNITY SERVICES
Shade Structure CONT'D COM PARK UNIT COST
Park Name NUMBER 2008 2009 2010 2011 2012 2013 2014 2015 2016 2017 ($/facility)
Melville Park GAZEBO Maple MN9 1 1 1 1 1 1 1 1 1 1 $52,500
Michael Barrasso Park GAZEBO Woodbridge WN19 1 1 1 1 1 1 1 1 1 1 $52,500
Michael Fitzgerald Parkette SHADE SHELTER Woodbridge WN31 0 0 0 0 0 0 1 1 1 1 $86,600
Mill Race Park GAZEBO Thornhill UV2-N4 1 1 1 1 1 1 1 1 1 1 $52,500
Misty Sugar Park PERGOLA Thornhill UV2-N8 0 1 1 1 1 1 1 1 1 1 $28,000
Mosswood Park GAZEBO Thornhill UV2-N11 1 1 1 1 1 1 1 1 1 1 $52,500
Napa Valley Park SHADE SHELTER Woodbridge WN33 1 1 1 1 1 1 1 1 1 1 $86,600
Newport Square GAZEBO Thornhill TN10 1 1 1 1 1 1 1 1 1 1 $52,500
Nort Johnston District Park OPEN ROOF/TRELLIS Woodbridge WD1 0 0 1 1 1 1 1 1 1 1 $52,500
North Thornhill Dirstrict Park PERGOLA Thornhill UV2-D3 0 0 3 3 3 3 3 3 3 3 $28,000
Ohr Menachem Park SHADE SHELTER Thornhill UV2-N2 1 1 1 1 1 1 1 1 1 1 $86,600
Old Firehall Parkette OPEN ROOF/TRELLIS Woodbridge WP7 0 0 0 0 1 1 1 1 1 1 $52,500
Pheasant Hollow Park GAZEBO Maple UV2-N7 1 1 1 1 1 1 1 1 1 1 $52,500
Pierre Elliot Turdeau Park SHADE SHELTER Thornhill TN3 0 0 0 0 0 0 1 1 1 1 $86,600
Pioneer Park GAZEBO Thornhill UV2-N15 1 1 1 1 1 1 1 1 1 1 $52,500
Promenade Green Park GAZEBO Thornhill TN18 1 1 1 1 1 1 1 1 1 1 $52,500
Regency View Parkette OPEN ROOF/TRELLIS Maple MN21 1 1 1 1 1 1 1 1 1 1 $52,500
Rosedale Park North GAZEBO Thornhill TN8 0 1 1 1 1 1 1 1 1 1 $52,500
Ross Gurerri Park GAZEBO Kleinburg KP4 1 1 1 1 1 1 1 1 1 1 $52,500
Routley Park GAZEBO Maple MN3 1 1 1 1 1 1 1 1 1 1 $52,500
Secord Park GAZEBO Kleinburg 61W-N1 0 0 0 0 0 0 0 0 0 1 $52,500
Sherwood Parkette PERGOLA Maple MP4 0 0 1 1 1 1 1 1 1 1 $28,000
Sonoma Heights Community Park GAZEBO Woodbridge WEA-D1 0 0 2 2 2 2 2 2 2 2 $52,500
Sonoma Heights Community Park SHADE SHELTER Woodbridge WEA-D1 0 0 2 2 2 2 2 2 2 2 $86,600
Southview Park GAZEBO Thornhill TN34 0 0 0 0 0 0 1 1 1 1 $52,500
Spring Blossom Park SHADE SHELTER Thornhill UV2-N12 1 1 1 1 1 1 1 1 1 1 $86,600
Starling Park SHADE SHELTER Maple UV1-N1 1 1 1 1 1 1 1 1 1 1 $86,600
Sugar Bush Heritage Park PERGOLA Thornhill UV2-N9 1 1 1 1 1 1 1 1 1 1 $28,000
Sugar Bush Heritage Park GAZEBO Thornhill UV2-N9 1 1 1 1 1 1 1 1 1 1 $52,500
Sunset Ridge Park GAZEBO Woodbridge WEA-N1 1 1 1 1 1 1 1 1 1 1 $52,500
Thornhill Green OPEN ROOF/TRELLIS Thornhill TN28 1 1 1 1 1 1 1 1 1 1 $52,500
Thornhill Park / Thornhill Outdoor Pool GAZEBO Thornhill TN11 1 1 1 1 1 1 1 1 1 1 $52,500
Thornhill Woods Park PICNIC SHELTER Thornhill UV2-N3 2 2 2 2 2 2 2 2 2 2 $101,300
Tinsmith Parkette GAZEBO Kleinburg KP1 1 1 1 1 1 1 1 1 1 1 $52,500
Treelawn Parkette GAZEBO Kleinburg KP2 1 1 1 1 1 1 1 1 1 1 $52,500
Vaughan Grove Sports Park PICNIC SHELTER Woodbridge WR1 1 1 1 1 1 1 1 1 1 1 $101,300
Vaughan Grove Sports Park GAZEBO Woodbridge WR1 1 1 1 1 1 1 1 1 1 1 $52,500
Vellore Heritage Park GAZEBO Woodbridge WN38 0 0 0 1 1 1 1 1 1 1 $52,500
Venice Gate Park DECORATIVE STRUCTURE Maple UV1-N6 1 1 1 1 1 1 1 1 1 1 $52,500
Ventura Park PICNIC SHELTER Thornhill TN23 1 1 1 1 1 1 1 1 1 1 $101,300
Via Campanile Park OPEN ROOF/TRELLIS Woodbridge UV1-N3 2 2 2 2 2 2 2 2 2 2 $52,500
Via Verde Park GAZEBO Woodbridge WEA-N4 0 0 0 0 0 0 1 1 1 1 $52,500
Village Green Park DECORATIVE STRUCTURE Woodbridge UV1-N2 1 1 1 1 1 1 1 1 1 1 $52,500
Wade Gate Park GAZEBO Thornhill TN20 1 1 1 1 1 1 1 1 1 1 $52,500
Wade Gate Park OPEN ROOF/TRELLIS Thornhill TN20 1 1 1 1 1 1 1 1 1 1 $52,500
West Crossroads Park GAZEBO Thornhill TN19 1 1 1 1 1 1 1 1 1 1 $52,500
West Maple Creek Park GAZEBO Maple MN17 0 0 0 0 1 1 1 1 1 1 $52,500
Westwind Park DECORATIVE STRUCTURE Maple UV1-N5 1 1 1 1 1 1 1 1 1 1 $52,500
Wilson Century Theatre Park GAZEBO Woodbridge WN32 1 1 1 1 1 1 1 1 1 1 $52,500
Winding Lane Park GAZEBO Thornhill TN2 0 0 0 0 0 1 1 1 1 1 $52,500
Woodrose Park OPEN ROOF/TRELLIS Maple UV2-N13 1 1 1 1 1 1 1 1 1 1 $52,500
York Hill District Park GAZEBO Thornhill TD1 1 1 1 1 1 1 1 1 1 1 $52,500
Subtotal (#) 94 99 110 116 118 120 124 124 126 127
Subtotal ($000) $5,675.0 $5,913.0 $6,411.7 $6,702.2 $6,807.2 $6,887.7 $7,165.9 $7,165.9 $7,319.7 $7,372.2
APPENDIX E
TABLE 1 - PAGE 56
PARK FACILITIES
# of facilities
HEMSON
HEMSON
171

CITY OF VAUGHAN
INVENTORY OF CAPITAL ASSETS
COMMUNITY SERVICES
Park Buildings COM PARK UNIT COST
Park Name NUMBER 2008 2009 2010 2011 2012 2013 2014 2015 2016 2017 ($/facility)
Belair Way Park STORAGE BUILDING Woodbridge WN14 1 1 1 1 1 1 1 1 1 1 $188,700
Bindertwine Park STORAGE BUNKER Kleinburg KN1 1 1 1 1 1 1 1 1 1 1 $188,700
Concord / Thornhill Regional Park WASHROOM & STORAGE Thornhill TR2 1 1 1 1 1 1 1 1 1 1 $443,850
Concord / Thornhill Regional Park WASHROOM & STORAGE Thornhill TR2 1 1 1 1 1 1 1 1 1 1 $443,850
Doctors Mclean District Park WASHROOM Woodbridge WD4 1 1 1 1 1 1 1 1 1 1 $1,551,650
Father Emanno Bulfon Park STORAGE BUNKER Woodbridge WD2 1 1 1 1 1 1 1 1 1 1 $188,700
Fred Armstrong Parkette STORAGE BUNKER Woodbridge WP2 1 1 1 1 1 1 1 1 1 1 $188,700
Glen Shields Park WASHROOM Thornhill TN25 1 1 1 1 1 1 1 1 1 1 $443,850
LeParc Park WASHROOM & STORAGE Thornhill TN33 1 1 1 1 1 1 1 1 1 1 $443,850
Mackenzie Glen District Park WASHROOM Maple MD2 1 1 1 1 1 1 1 1 1 1 $443,850
Maple Nature Reserve WASHROOM & STORAGE <Null> <Null> 1 1 1 1 1 1 1 1 1 1 $443,850
Matthew Park WASHROOM & STORAGE Woodbridge UV1-D3 1 1 1 1 1 1 1 1 1 1 $443,850
Maxey Park STORAGE BUNKER Woodbridge WN4 1 1 1 1 1 1 1 1 1 1 $188,700
Maxey Park WASHROOM Woodbridge WN4 1 1 1 1 1 1 1 1 1 1 $443,850
Melville Park STORAGE BUILDING Maple MN9 1 1 1 1 1 1 1 1 1 1 $188,700
Nort Johnston District Park WASHROOM Woodbridge WD1 1 1 1 1 1 1 1 1 1 1 $443,850
Rainbow Creek Park WASHROOM & STORAGE Woodbridge WN1 1 1 1 1 1 1 1 1 1 1 $443,850
Sonoma Heights Community Park WASHROOM & STORAGE Woodbridge WEA-D1 1 1 1 1 1 1 1 1 1 1 $443,850
Sugar Bush Heritage Park WASHROOM & STORAGE Thornhill UV2-N9 1 1 1 1 1 1 1 1 1 1 $443,850
Tudor District Park WASHROOM & STORAGE Thornhill MD3 1 1 1 1 1 1 1 1 1 1 $443,850
Vaughan Grove Sports Park WASHROOM & STORAGE Woodbridge WR1 1 1 1 1 1 1 1 1 1 1 $443,850
Vaughan Grove Sports Park SOCCER CLUB BUILDING Woodbridge WR1 1 1 1 1 1 1 1 1 1 1 $1,551,650
Woodbridge Highland Park STORAGE BUNKER Woodbridge WN22 1 1 1 1 1 1 1 1 1 1 $188,700
Subtotal (#) 23 23 23 23 23 23 23 23 23 23
Subtotal ($000) $10,638.1 $10,638.1 $10,638.1 $10,638.1 $10,638.1 $10,638.1 $10,638.1 $10,638.1 $10,638.1 $10,638.1
TABLE 1 - PAGE 57
APPENDIX E
PARK FACILITIES
# of facilities
HEMSON
HEMSON
172
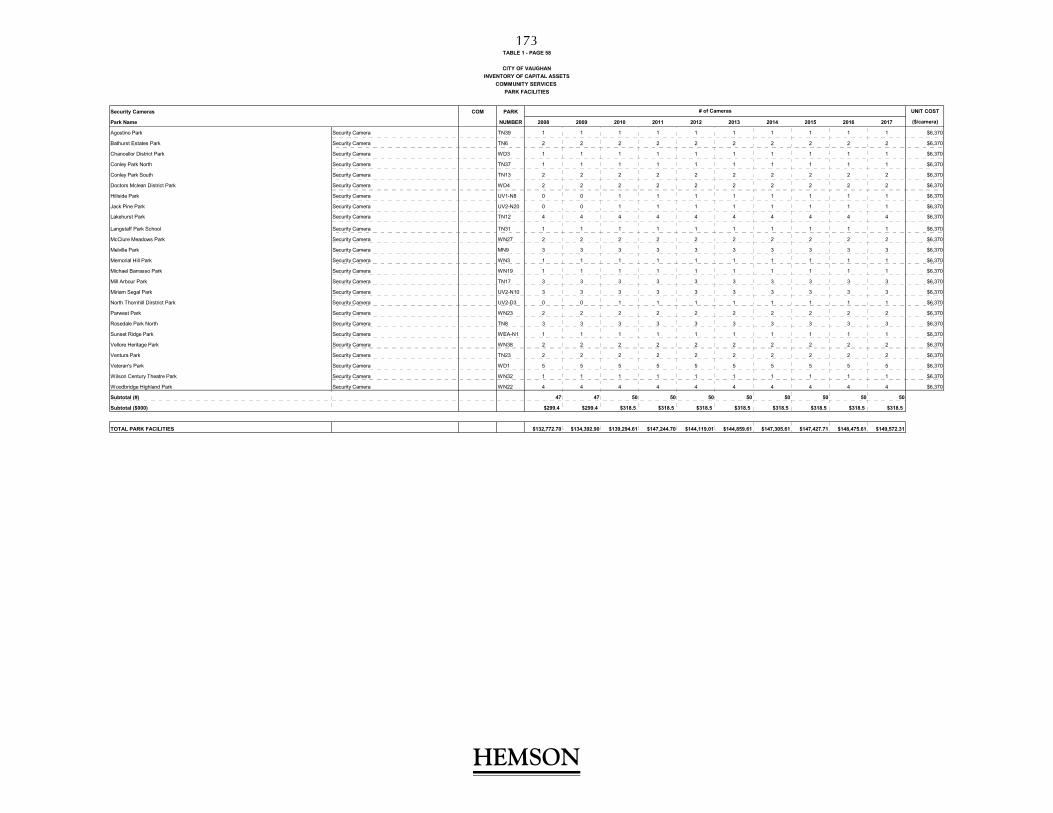
CITY OF VAUGHAN
INVENTORY OF CAPITAL ASSETS
COMMUNITY SERVICES
Security Cameras COM PARK UNIT COST
Park Name NUMBER 2008 2009 2010 2011 2012 2013 2014 2015 2016 2017 ($/camera)
Agostino Park Security Camera TN39 1 1 1 1 1 1 1 1 1 1 $6,370
Bathurst Estates Park Security Camera TN6 2 2 2 2 2 2 2 2 2 2 $6,370
Chancellor District Park Security Camera WD3 1 1 1 1 1 1 1 1 1 1 $6,370
Conley Park North Security Camera TN37 1 1 1 1 1 1 1 1 1 1 $6,370
Conley Park South Security Camera TN13 2 2 2 2 2 2 2 2 2 2 $6,370
Doctors Mclean District Park Security Camera WD4 2 2 2 2 2 2 2 2 2 2 $6,370
Hillside Park Security Camera UV1-N8 0 0 1 1 1 1 1 1 1 1 $6,370
Jack Pine Park Security Camera UV2-N20 0 0 1 1 1 1 1 1 1 1 $6,370
Lakehurst Park Security Camera TN12 4 4 4 4 4 4 4 4 4 4 $6,370
Langstaff Park School Security Camera TN31 1 1 1 1 1 1 1 1 1 1 $6,370
McClure Meadows Park Security Camera WN27 2 2 2 2 2 2 2 2 2 2 $6,370
Melville Park Security Camera MN9 3 3 3 3 3 3 3 3 3 3 $6,370
Memorial Hill Park Security Camera WN3 1 1 1 1 1 1 1 1 1 1 $6,370
Michael Barrasso Park Security Camera WN19 1 1 1 1 1 1 1 1 1 1 $6,370
Mill Arbour Park Security Camera TN17 3 3 3 3 3 3 3 3 3 3 $6,370
Miriam Segal Park Security Camera UV2-N10 3 3 3 3 3 3 3 3 3 3 $6,370
North Thornhill Dirstrict Park Security Camera UV2-D3 0 0 1 1 1 1 1 1 1 1 $6,370
Parwest Park Security Camera WN23 2 2 2 2 2 2 2 2 2 2 $6,370
Rosedale Park North Security Camera TN8 3 3 3 3 3 3 3 3 3 3 $6,370
Sunset Ridge Park Security Camera WEA-N1 1 1 1 1 1 1 1 1 1 1 $6,370
Vellore Heritage Park Security Camera WN38 2 2 2 2 2 2 2 2 2 2 $6,370
Ventura Park Security Camera TN23 2 2 2 2 2 2 2 2 2 2 $6,370
Veteran's Park Security Camera WD1 5 5 5 5 5 5 5 5 5 5 $6,370
Wilson Century Theatre Park Security Camera WN32 1 1 1 1 1 1 1 1 1 1 $6,370
Woodbridge Highland Park Security Camera WN22 4 4 4 4 4 4 4 4 4 4 $6,370
Subtotal (#) 47 47 50 50 50 50 50 50 50 50
Subtotal ($000) $299.4 $299.4 $318.5 $318.5 $318.5 $318.5 $318.5 $318.5 $318.5 $318.5
TOTAL PARK FACILITIES $132,772.70 $134,392.90 $139,294.61 $147,244.70 $144,119.01 $144,859.61 $147,305.61 $147,427.71 $148,475.61 $149,572.31
# of Cameras
TABLE 1 - PAGE 58
PARK FACILITIES
HEMSON
HEMSON
173

APPENDIX ETABLE 1 - PAGE 59
CITY OF VAUGHANINVENTORY OF CAPITAL ASSETS
COMMUNITY SERVICES SPECIAL FACILITIES
SPECIAL CITY-WIDE FACILITIES
Facility Name 2008 2009 2010 2011 2012 2013 2014 2015 2016 2017
9 Hole Golf Course $4,860,000 $4,860,000 $4,860,000 $4,860,000 $4,860,000 $4,860,000 $4,860,000 $4,860,000 $4,860,000 $4,860,000
Club House $1,425,538 $1,425,538 $1,425,538 $1,425,538 $1,425,538 $1,425,538 $1,425,538 $1,425,538 $1,425,538 $1,425,538
Ski Centre $1,425,538 $1,425,538 $1,425,538 $1,425,538 $1,425,538 $1,425,538 $1,425,538 $1,425,538 $1,425,538 $1,425,538
Uplands Ski Chalet $1,312,797 $1,312,797 $1,312,797 $1,312,797 $1,312,797 $1,312,797 $1,312,797 $1,312,797 $1,312,797 $1,312,797
Vaughan Grove Sports Complex $1,900,299 $1,900,299 $1,900,299 $1,900,299 $1,900,299 $1,900,299 $1,900,299 $1,900,299 $1,900,299 $1,900,299
Vaughan Grove Baseball Building $622,577 $622,577 $622,577 $622,577 $622,577 $622,577 $622,577 $622,577 $622,577 $622,577
Vaughan Grove Soccer Building $1,397,979 $1,397,979 $1,397,979 $1,397,979 $1,397,979 $1,397,979 $1,397,979 $1,397,979 $1,397,979 $1,397,979
Memorial Hill Park $1,900,299 $1,900,299 $1,900,299 $1,900,299 $1,900,299 $1,900,299 $1,900,299 $1,900,299 $1,900,299 $1,900,299
Memorial Hall $1,425,538 $1,425,538 $1,425,538 $1,425,538 $1,425,538 $1,425,538 $1,425,538 $1,425,538 $1,425,538 $1,425,538
Total Value ($000) $16,270.6 $16,270.6 $16,270.6 $16,270.6 $16,270.6 $16,270.6 $16,270.6 $16,270.6 $16,270.6 $16,270.6
Total Value of Special Facilities
HEMSON
HEMSON
174

CITY OF VAUGHANINVENTORY OF CAPITAL ASSETS
COMMUNITY SERVICES TRAILS
TRAILS
2008 2009 2010 2011 2012 2013 2014 2015 2016 2017
Value of Trail Development $3,389,185 $3,689,185 $3,989,185 $4,289,185 $4,824,101 $4,824,101 $4,824,101 $4,824,101 $4,824,101 $4,824,101
25% City Built $847,296 $922,296 $997,296 $1,072,296 $1,206,025 $1,206,025 $1,206,025 $1,206,025 $1,206,025 $1,206,025
Total City ($000) $847.3 $922.3 $997.3 $1,072.3 $1,206.0 $1,206.0 $1,206.0 $1,206.0 $1,206.0 $1,206.0
APPENDIX ETABLE 1 - PAGE 60
Total Value of Trail Development ($)
HEMSON
HEMSON
175
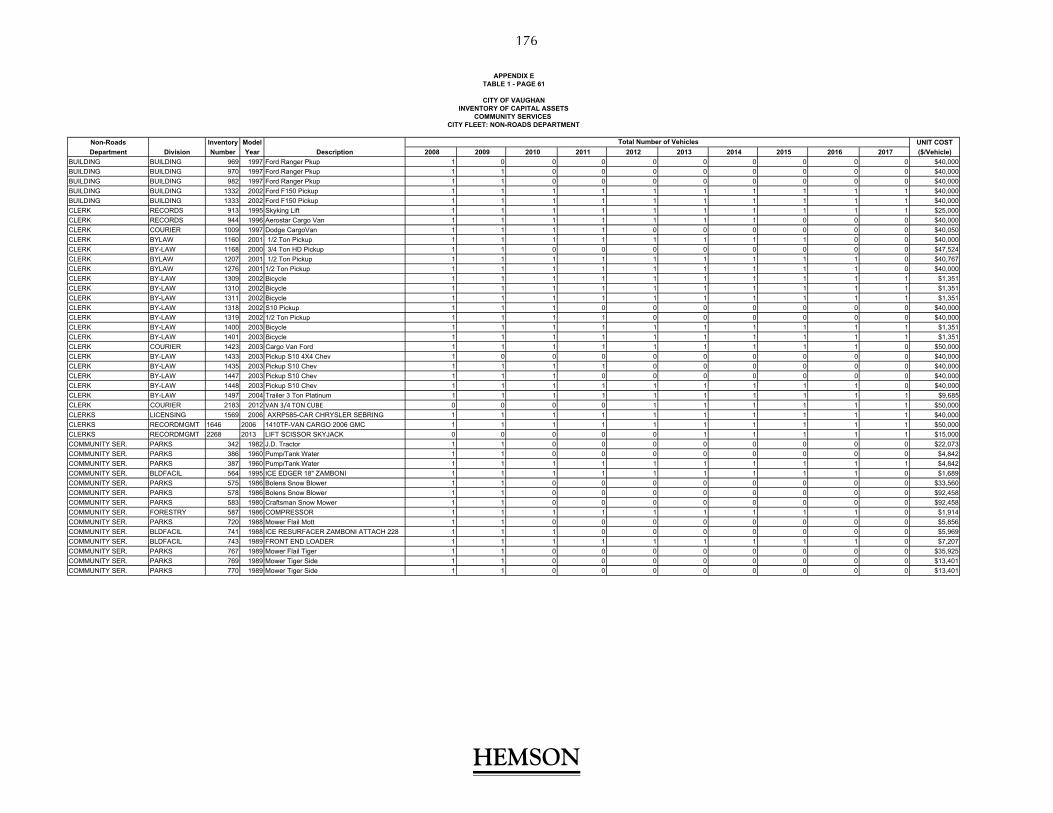
Non-Roads Inventory Model UNIT COST
Department Division Number Year Description 2008 2009 2010 2011 2012 2013 2014 2015 2016 2017 ($/Vehicle)
BUILDING BUILDING 969 1997 Ford Ranger Pkup 1 0 0 0 0 0 0 0 0 0 $40,000
BUILDING BUILDING 970 1997 Ford Ranger Pkup 1 1 0 0 0 0 0 0 0 0 $40,000
BUILDING BUILDING 982 1997 Ford Ranger Pkup 1 1 0 0 0 0 0 0 0 0 $40,000
BUILDING BUILDING 1332 2002 Ford F150 Pickup 1 1 1 1 1 1 1 1 1 1 $40,000
BUILDING BUILDING 1333 2002 Ford F150 Pickup 1 1 1 1 1 1 1 1 1 1 $40,000
CLERK RECORDS 913 1995 Skyking Lift 1 1 1 1 1 1 1 1 1 1 $25,000
CLERK RECORDS 944 1996 Aerostar Cargo Van 1 1 1 1 1 1 1 0 0 0 $40,000
CLERK COURIER 1009 1997 Dodge CargoVan 1 1 1 1 0 0 0 0 0 0 $40,050
CLERK BYLAW 1160 2001 1/2 Ton Pickup 1 1 1 1 1 1 1 1 0 0 $40,000
CLERK BY-LAW 1168 2000 3/4 Ton HD Pickup 1 1 0 0 0 0 0 0 0 0 $47,524
CLERK BYLAW 1207 2001 1/2 Ton Pickup 1 1 1 1 1 1 1 1 1 0 $40,767
CLERK BYLAW 1276 2001 1/2 Ton Pickup 1 1 1 1 1 1 1 1 1 0 $40,000
CLERK BY-LAW 1309 2002 Bicycle 1 1 1 1 1 1 1 1 1 1 $1,351
CLERK BY-LAW 1310 2002 Bicycle 1 1 1 1 1 1 1 1 1 1 $1,351
CLERK BY-LAW 1311 2002 Bicycle 1 1 1 1 1 1 1 1 1 1 $1,351
CLERK BY-LAW 1318 2002 S10 Pickup 1 1 1 0 0 0 0 0 0 0 $40,000
CLERK BY-LAW 1319 2002 1/2 Ton Pickup 1 1 1 1 0 0 0 0 0 0 $40,000
CLERK BY-LAW 1400 2003 Bicycle 1 1 1 1 1 1 1 1 1 1 $1,351
CLERK BY-LAW 1401 2003 Bicycle 1 1 1 1 1 1 1 1 1 1 $1,351
CLERK COURIER 1423 2003 Cargo Van Ford 1 1 1 1 1 1 1 1 1 0 $50,000
CLERK BY-LAW 1433 2003 Pickup S10 4X4 Chev 1 0 0 0 0 0 0 0 0 0 $40,000
CLERK BY-LAW 1435 2003 Pickup S10 Chev 1 1 1 1 0 0 0 0 0 0 $40,000
CLERK BY-LAW 1447 2003 Pickup S10 Chev 1 1 1 0 0 0 0 0 0 0 $40,000
CLERK BY-LAW 1448 2003 Pickup S10 Chev 1 1 1 1 1 1 1 1 1 0 $40,000
CLERK BY-LAW 1497 2004 Trailer 3 Ton Platinum 1 1 1 1 1 1 1 1 1 1 $9,685
CLERK COURIER 2183 2012 VAN 3/4 TON CUBE 0 0 0 0 1 1 1 1 1 1 $50,000
CLERKS LICENSING 1569 2006 AXRP585-CAR CHRYSLER SEBRING 1 1 1 1 1 1 1 1 1 1 $40,000
CLERKS RECORDMGMT 1646 2006 1410TF-VAN CARGO 2006 GMC 1 1 1 1 1 1 1 1 1 1 $50,000
CLERKS RECORDMGMT 2268 2013 LIFT SCISSOR SKYJACK 0 0 0 0 0 1 1 1 1 1 $15,000
COMMUNITY SER. PARKS 342 1982 J.D. Tractor 1 1 0 0 0 0 0 0 0 0 $22,073
COMMUNITY SER. PARKS 386 1960 Pump/Tank Water 1 1 0 0 0 0 0 0 0 0 $4,842
COMMUNITY SER. PARKS 387 1960 Pump/Tank Water 1 1 1 1 1 1 1 1 1 1 $4,842
COMMUNITY SER. BLDFACIL 564 1995 ICE EDGER 18" ZAMBONI 1 1 1 1 1 1 1 1 1 0 $1,689
COMMUNITY SER. PARKS 575 1986 Bolens Snow Blower 1 1 0 0 0 0 0 0 0 0 $33,560
COMMUNITY SER. PARKS 578 1986 Bolens Snow Blower 1 1 0 0 0 0 0 0 0 0 $92,458
COMMUNITY SER. PARKS 583 1980 Craftsman Snow Mower 1 1 0 0 0 0 0 0 0 0 $92,458
COMMUNITY SER. FORESTRY 587 1986 COMPRESSOR 1 1 1 1 1 1 1 1 1 0 $1,914
COMMUNITY SER. PARKS 720 1988 Mower Flail Mott 1 1 0 0 0 0 0 0 0 0 $5,856
COMMUNITY SER. BLDFACIL 741 1988 ICE RESURFACER ZAMBONI ATTACH 228 1 1 1 0 0 0 0 0 0 0 $5,969
COMMUNITY SER. BLDFACIL 743 1989 FRONT END LOADER 1 1 1 1 1 1 1 1 1 0 $7,207
COMMUNITY SER. PARKS 767 1989 Mower Flail Tiger 1 1 0 0 0 0 0 0 0 0 $35,925
COMMUNITY SER. PARKS 769 1989 Mower Tiger Side 1 1 0 0 0 0 0 0 0 0 $13,401
COMMUNITY SER. PARKS 770 1989 Mower Tiger Side 1 1 0 0 0 0 0 0 0 0 $13,401
APPENDIX ETABLE 1 - PAGE 61
CITY OF VAUGHANINVENTORY OF CAPITAL ASSETS
CITY FLEET: NON-ROADS DEPARTMENT
Total Number of Vehicles
COMMUNITY SERVICES
HEMSON
HEMSON
176

Non-Roads Inventory Model UNIT COST
Department Division Number Year Description 2008 2009 2010 2011 2012 2013 2014 2015 2016 2017 ($/Vehicle)
COMMUNITY SER. BLDFACIL 805 1989 ICE EGER 18" ZAMBONI 1 1 1 1 1 1 1 1 0 0 $1,914
COMMUNITY SER. BLDFACIL 852 1993 ICE RESURFACER ZAMBONI 1 1 1 1 1 1 1 1 1 0 $110,000
COMMUNITY SER. PARKS 871 1994 Sprayer 1 0 0 0 0 0 0 0 0 0 $8,784
COMMUNITY SER. PARKS 882 1994 Trailer Showmobile 1 1 1 1 1 1 1 1 0 0 $120,000
COMMUNITY SER. PARKS 909 1994 Top Dresser 1 1 1 1 1 1 1 1 1 1 $21,510
COMMUNITY SER. PARKS 910 1994 Groomer Baseball Diamond 1 1 0 0 0 0 0 0 0 0 $8,784
COMMUNITY SER. PARKS 916 1995 Trailer-Tandem Axle 1 0 0 0 0 0 0 0 0 0 $58,898
COMMUNITY SER. PARKS 923 1995 6 Ton Tag along Trailer 1 0 0 0 0 0 0 0 0 0 $58,898
COMMUNITY SER. PARKS 924 1995 6 Ton Tag Along Trailer 1 1 0 0 0 0 0 0 0 0 $58,898
COMMUNITY SER. BLDFACIL 957 1996 ICE RESURFACER OLYMPIA 1 1 1 1 1 1 1 1 1 1 $62,277
COMMUNITY SER. PARKS 962 1996 J.D. Tractor 1 1 0 0 0 0 0 0 0 0 $52,479
COMMUNITY SER. PARKS 963 1996 Hand All Rotary Mower 1 1 0 0 0 0 0 0 0 0 $53,155
COMMUNITY SER. PARKS 965 1996 Trailer / Sprayer 1 1 1 1 1 1 1 0 0 0 $85,701
COMMUNITY SER. BLDFACIL 974 1996 Ice Resurfacer Olympia 3000 1 1 1 1 1 1 1 1 1 1 $110,000
COMMUNITY SER. BLDFACIL 975 1996 ICE EDGER OLYMPIA 1 1 1 1 1 1 1 1 1 1 $2,252
COMMUNITY SER. PARKS 978 1997 Power Trailer 1 1 1 1 1 1 1 1 1 1 $40,317
COMMUNITY SER. PARKS 1012 1997 F250 Pickup 1 0 0 0 0 0 0 0 0 0 $48,763
COMMUNITY SER. PARKS 1013 1997 Ford Super Duty 1 Tn Dump 1 1 1 0 0 0 0 0 0 0 $70,498
COMMUNITY SER. PARKS 1015 1997 Loader Backhoe 1 1 1 1 1 1 1 1 1 1 $113,179
COMMUNITY SER. PARKS 1016 1997 F350 Chipper Dump 1 1 1 0 0 0 0 0 0 0 $92,345
COMMUNITY SER. PARKS 1025 1998 Spreader Air Way 1 0 0 0 0 0 0 0 0 0 $9,009
COMMUNITY SER. PARKS 1026 1998 10 Ft Ransome Mower 1 0 0 0 0 0 0 0 0 0 $71,962
COMMUNITY SER. PARKS 1027 1998 Mower Slope Kutwick 1 1 1 1 1 1 1 1 0 0 $76,354
COMMUNITY SER. PARKS 1028 1998 Trailer Tag Along 1 1 1 1 1 1 1 1 1 1 $15,992
COMMUNITY SER. PARKS 1029 1998 Trailer Tag Along 1 1 1 1 1 1 1 1 1 1 $15,992
COMMUNITY SER. PARKS 1032 1998 Compact Pickup 1 1 0 0 0 0 0 0 0 0 $34,348
COMMUNITY SER. PARKS 1033 1998 Mid size Pickup 1 1 0 0 0 0 0 0 0 0 $38,627
COMMUNITY SER. PARKS 1036 1997 Aerator Bannerman 1 1 0 0 0 0 0 0 0 0 $4,167
COMMUNITY SER. PARKS 1049 1999 1 Ton Diesel Dump w/Plow 1 1 1 0 0 0 0 0 0 0 $63,853
COMMUNITY SER. FORESTRY 1054 1998 Trailer Spray Tanker 1 1 1 1 1 1 1 1 1 1 $25,451
COMMUNITY SER. BLDFACIL 1055 1998 ICE RESURACER OLYMPIA 1 1 1 1 1 1 1 1 1 1 $110,000
COMMUNITY SER. BLDFACIL 1056 1998 ICE RESURFACER V-PLOW WESTERN 1 1 1 1 1 1 1 1 1 1 $6,194
COMMUNITY SER. BLDFACIL 1057 2002 ICE EDGER OLYMPIA 1 1 1 1 1 1 1 1 1 1 $2,703
COMMUNITY SER. PARKS 1058 1999 6 ton 18 foot tandem axle trailer 1 1 1 1 1 1 1 1 1 1 $12,613
COMMUNITY SER. FORESTRY 1064 1999 CHAIN SAW STIHL 32" 1 1 1 1 1 1 1 1 1 1 $1,126
COMMUNITY SER. FORESTRY 1066 1999 CHAIN SAW STIHL 20" 1 1 1 1 1 1 1 0 0 0 $676
COMMUNITY SER. BLDFACIL 1070 1999 ICE RESURFACER OLYMPIA 1 1 1 1 1 1 1 1 1 1 $110,000
COMMUNITY SER. BLDFACIL 1071 1999 ICE EDGER OLYMPIA 1 1 1 1 1 1 1 1 1 1 $2,252
COMMUNITY SER. BLDFACIL 1072 2000 ICE RESURACER OLYMPIA 1 1 1 1 1 1 1 1 1 1 $110,000
COMMUNITY SER. PARKS 1074 1999 1 Ton Diesel Dump 1 1 1 0 0 0 0 0 0 0 $70,273
COMMUNITY SER. FLEET 1075 1999 3/4 Ton Pickup 1 1 0 0 0 0 0 0 0 0 $48,425
COMMUNITY SER. FLEET 1076 1999 3/4 Ton Pickup 1 1 0 0 0 0 0 0 0 0 $48,425
COMMUNITY SER. FLEET 1077 1999 3/4 Ton Pickup 1 1 1 0 0 0 0 0 0 0 $49,439
APPENDIX ETABLE 1 - PAGE 62
CITY OF VAUGHANINVENTORY OF CAPITAL ASSETS
CITY FLEET: NON-ROADS DEPARTMENTCOMMUNITY SERVICES
Total Number of Vehicles
HEMSON
HEMSON
177

Non-Roads Inventory Model UNIT COST
Department Division Number Year Description 2008 2009 2010 2011 2012 2013 2014 2015 2016 2017 ($/Vehicle)
COMMUNITY SER. FLEET 1078 1999 3/4 Ton Pickup 1 1 0 0 0 0 0 0 0 0 $48,425
COMMUNITY SER. FORESTRY 1079 1997 Stump Cutter Rayco 1 1 1 1 1 1 1 1 1 1 $12,500
COMMUNITY SER. FLEET 1082 1998 Hydraulic Power Cutter 1 0 0 0 1 1 1 1 1 1 $23,199
COMMUNITY SER. PARKS 1087 1999 6 Ton Trailer 1 1 1 1 1 1 1 1 1 1 $13,289
COMMUNITY SER. PARKS 1089 2000 3/4 Ton Pickup 1 1 0 0 0 0 0 0 0 0 $45,000
COMMUNITY SER. PARKS 1090 2000 3/4 Ton Pickup 1 1 0 0 0 0 0 0 0 0 $45,000
COMMUNITY SER. PARKS 1092 1999 Compactor 1 1 1 0 0 0 0 0 0 0 $108,675
COMMUNITY SER. PARKS 1095 1999 10 Foot Rotary Mower 1 0 0 0 0 0 0 0 0 0 $80,408
COMMUNITY SER. PARKS 1096 1999 10 Foot Rotary Mower 1 1 0 0 0 0 0 0 0 0 $80,408
COMMUNITY SER. PARKS 1098 1999 Tractor w/Mower 1 1 1 0 0 0 0 0 0 0 $106,422
COMMUNITY SER. PARKS 1099 1999 6 Ton Trailer 1 1 1 1 1 1 1 1 1 1 $13,289
COMMUNITY SER. PARKS 1102 1995 Aerator Cushman 1 1 0 0 0 0 0 0 0 0 $4,167
COMMUNITY SER. BLDFACIL 1104 1998 PUMP WATER HONDA 1 1 1 1 1 1 1 1 1 0 $1,126
COMMUNITY SER. PARKS 1106 1999 Powerwash 1 1 0 0 0 0 0 0 0 0 $7,771
COMMUNITY SER. PARKS 1108 1999 Groomer Bannerman 1 1 1 1 1 1 1 1 1 1 $8,784
COMMUNITY SER. PARKS 1109 1998 Vacuum Vquip Billy Goat 1 1 1 1 1 1 1 1 1 1 $8,334
COMMUNITY SER. PARKS 1110 1999 Diamond Edger 1 1 1 1 0 0 0 0 0 0 $15,654
COMMUNITY SER. PARKS 1112 1999 New Holland Tractor 1 0 0 0 0 0 0 0 0 0 $54,619
COMMUNITY SER. PARKS 1113 1999 New Holland Tractor 1 0 0 0 0 0 0 0 0 0 $54,619
COMMUNITY SER. PARKS 1114 1999 Mower Haul All 12 ft 1 1 1 0 0 0 0 0 0 0 $27,704
COMMUNITY SER. PARKS 1118 1999 New Holland Tractor 1 0 0 0 0 0 0 0 0 0 $80,000
COMMUNITY SER. PARKS 1130 1999 New Holland Tractor 1 0 0 0 0 0 0 0 0 0 $80,000
COMMUNITY SER. PARKS 1132 1999 New Holland Tractor 1 0 0 0 0 0 0 0 0 0 $80,000
COMMUNITY SER. PARKS 1136 1999 Top Dresser 1 1 1 1 1 1 1 1 1 1 $13,964
COMMUNITY SER. FLEET 1138 2000 Mid-size Car 1 1 1 1 1 1 1 1 1 1 $40,000
COMMUNITY SER. PARKS 1140 2001 3/4 Ton HD Pickup 1 1 1 1 1 1 1 1 1 0 $45,000
COMMUNITY SER. PARKS 1141 2001 3/4 Ton HD Pickup 1 1 1 1 1 1 1 1 1 0 $45,000
COMMUNITY SER. PARKS 1143 2000 3/4 Ton HD Pickup 1 1 0 0 0 0 0 0 0 0 $48,650
COMMUNITY SER. PARKS 1144 2001 3/4 Ton HD Pickup 1 1 1 1 1 1 0 0 0 0 $48,087
COMMUNITY SER. PARKS 1145 2001 3/4 Ton HD Pickup 1 1 1 1 1 1 1 1 1 0 $48,087
COMMUNITY SER. PARKS 1146 2001 3/4 Ton HD Pickup 1 1 1 1 1 1 0 0 0 0 $48,087
COMMUNITY SER. RECREATION 1148 2000 1/2 Ton Cargo Van 1 1 1 1 1 1 1 1 1 1 $40,000
COMMUNITY SER. FLEET 1154 2000 Extended Mini Van 1 1 1 1 1 1 0 0 0 0 $40,000
COMMUNITY SER. FLEET 1158 2001 1/2 Ton Pickup 1 1 1 1 1 1 1 0 0 0 $40,767
COMMUNITY SER. PARKS 1162 2000 10 Ft. Rotary Mower 1 1 0 0 0 0 0 0 0 0 $73,989
COMMUNITY SER. PARKS 1163 2000 10 Ft. Rotary Mower 1 1 1 0 0 0 0 0 0 0 $73,989
COMMUNITY SER. PARKS 1164 2000 10 Ft. Rotary Mower 1 1 0 0 0 0 0 0 0 0 $73,989
COMMUNITY SER. PARKS 1173 2000 305 gal Water Tank/Sprayer 1 1 1 1 1 1 1 1 1 1 $4,617
COMMUNITY SER. PARKS 1174 2000 305 gal Water Tank/Sprayer 1 1 1 1 1 1 1 1 1 1 $4,617
COMMUNITY SER. PARKS 1175 2000 100 gal Water Tank/Sprayer 1 1 1 1 1 1 1 1 1 1 $3,266
COMMUNITY SER. PARKS 1176 2000 100 gal Water Tank/Sprayer 1 1 0 0 0 0 0 0 0 0 $3,266
COMMUNITY SER. PARKS 1178 2000 Wood Chipper 1 1 1 0 0 0 0 0 0 0 $63,000
COMMUNITY SER. PARKS 1179 2000 Crane Mounted Trailer 1 1 1 1 1 1 1 1 1 1 $1,464
CITY FLEET: NON-ROADS DEPARTMENT
APPENDIX E
Total Number of Vehicles
COMMUNITY SERVICES
TABLE 1 - PAGE 63
CITY OF VAUGHANINVENTORY OF CAPITAL ASSETS
HEMSON
HEMSON
178
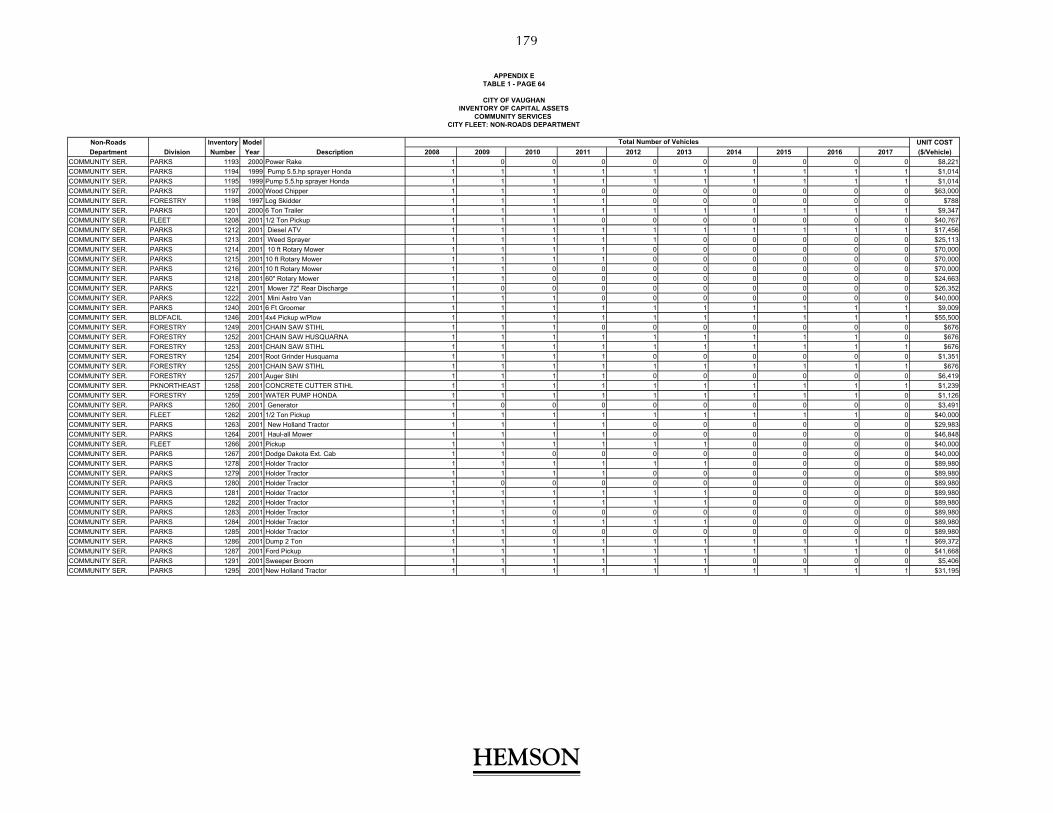
Non-Roads Inventory Model UNIT COST
Department Division Number Year Description 2008 2009 2010 2011 2012 2013 2014 2015 2016 2017 ($/Vehicle)
COMMUNITY SER. PARKS 1193 2000 Power Rake 1 0 0 0 0 0 0 0 0 0 $8,221
COMMUNITY SER. PARKS 1194 1999 Pump 5.5.hp sprayer Honda 1 1 1 1 1 1 1 1 1 1 $1,014
COMMUNITY SER. PARKS 1195 1999 Pump 5.5.hp sprayer Honda 1 1 1 1 1 1 1 1 1 1 $1,014
COMMUNITY SER. PARKS 1197 2000 Wood Chipper 1 1 1 0 0 0 0 0 0 0 $63,000
COMMUNITY SER. FORESTRY 1198 1997 Log Skidder 1 1 1 1 0 0 0 0 0 0 $788
COMMUNITY SER. PARKS 1201 2000 6 Ton Trailer 1 1 1 1 1 1 1 1 1 1 $9,347
COMMUNITY SER. FLEET 1208 2001 1/2 Ton Pickup 1 1 1 0 0 0 0 0 0 0 $40,767
COMMUNITY SER. PARKS 1212 2001 Diesel ATV 1 1 1 1 1 1 1 1 1 1 $17,456
COMMUNITY SER. PARKS 1213 2001 Weed Sprayer 1 1 1 1 1 0 0 0 0 0 $25,113
COMMUNITY SER. PARKS 1214 2001 10 ft Rotary Mower 1 1 1 1 0 0 0 0 0 0 $70,000
COMMUNITY SER. PARKS 1215 2001 10 ft Rotary Mower 1 1 1 1 0 0 0 0 0 0 $70,000
COMMUNITY SER. PARKS 1216 2001 10 ft Rotary Mower 1 1 0 0 0 0 0 0 0 0 $70,000
COMMUNITY SER. PARKS 1218 2001 60" Rotary Mower 1 1 0 0 0 0 0 0 0 0 $24,663
COMMUNITY SER. PARKS 1221 2001 Mower 72" Rear Discharge 1 0 0 0 0 0 0 0 0 0 $26,352
COMMUNITY SER. PARKS 1222 2001 Mini Astro Van 1 1 1 0 0 0 0 0 0 0 $40,000
COMMUNITY SER. PARKS 1240 2001 6 Ft Groomer 1 1 1 1 1 1 1 1 1 1 $9,009
COMMUNITY SER. BLDFACIL 1246 2001 4x4 Pickup w/Plow 1 1 1 1 1 1 1 1 1 1 $55,500
COMMUNITY SER. FORESTRY 1249 2001 CHAIN SAW STIHL 1 1 1 0 0 0 0 0 0 0 $676
COMMUNITY SER. FORESTRY 1252 2001 CHAIN SAW HUSQUARNA 1 1 1 1 1 1 1 1 1 0 $676
COMMUNITY SER. FORESTRY 1253 2001 CHAIN SAW STIHL 1 1 1 1 1 1 1 1 1 1 $676
COMMUNITY SER. FORESTRY 1254 2001 Root Grinder Husquarna 1 1 1 1 0 0 0 0 0 0 $1,351
COMMUNITY SER. FORESTRY 1255 2001 CHAIN SAW STIHL 1 1 1 1 1 1 1 1 1 1 $676
COMMUNITY SER. FORESTRY 1257 2001 Auger Stihl 1 1 1 1 0 0 0 0 0 0 $6,419
COMMUNITY SER. PKNORTHEAST 1258 2001 CONCRETE CUTTER STIHL 1 1 1 1 1 1 1 1 1 1 $1,239
COMMUNITY SER. FORESTRY 1259 2001 WATER PUMP HONDA 1 1 1 1 1 1 1 1 1 0 $1,126
COMMUNITY SER. PARKS 1260 2001 Generator 1 0 0 0 0 0 0 0 0 0 $3,491
COMMUNITY SER. FLEET 1262 2001 1/2 Ton Pickup 1 1 1 1 1 1 1 1 1 0 $40,000
COMMUNITY SER. PARKS 1263 2001 New Holland Tractor 1 1 1 1 0 0 0 0 0 0 $29,983
COMMUNITY SER. PARKS 1264 2001 Haul-all Mower 1 1 1 1 0 0 0 0 0 0 $46,848
COMMUNITY SER. FLEET 1266 2001 Pickup 1 1 1 1 1 1 0 0 0 0 $40,000
COMMUNITY SER. PARKS 1267 2001 Dodge Dakota Ext. Cab 1 1 0 0 0 0 0 0 0 0 $40,000
COMMUNITY SER. PARKS 1278 2001 Holder Tractor 1 1 1 1 1 1 0 0 0 0 $89,980
COMMUNITY SER. PARKS 1279 2001 Holder Tractor 1 1 1 1 0 0 0 0 0 0 $89,980
COMMUNITY SER. PARKS 1280 2001 Holder Tractor 1 0 0 0 0 0 0 0 0 0 $89,980
COMMUNITY SER. PARKS 1281 2001 Holder Tractor 1 1 1 1 1 1 0 0 0 0 $89,980
COMMUNITY SER. PARKS 1282 2001 Holder Tractor 1 1 1 1 1 1 0 0 0 0 $89,980
COMMUNITY SER. PARKS 1283 2001 Holder Tractor 1 1 0 0 0 0 0 0 0 0 $89,980
COMMUNITY SER. PARKS 1284 2001 Holder Tractor 1 1 1 1 1 1 0 0 0 0 $89,980
COMMUNITY SER. PARKS 1285 2001 Holder Tractor 1 1 0 0 0 0 0 0 0 0 $89,980
COMMUNITY SER. PARKS 1286 2001 Dump 2 Ton 1 1 1 1 1 1 1 1 1 1 $69,372
COMMUNITY SER. PARKS 1287 2001 Ford Pickup 1 1 1 1 1 1 1 1 1 0 $41,668
COMMUNITY SER. PARKS 1291 2001 Sweeper Broom 1 1 1 1 1 1 0 0 0 0 $5,406
COMMUNITY SER. PARKS 1295 2001 New Holland Tractor 1 1 1 1 1 1 1 1 1 1 $31,195
CITY OF VAUGHANINVENTORY OF CAPITAL ASSETS
CITY FLEET: NON-ROADS DEPARTMENT
Total Number of Vehicles
COMMUNITY SERVICES
APPENDIX ETABLE 1 - PAGE 64
HEMSON
HEMSON
179

Non-Roads Inventory Model UNIT COST
Department Division Number Year Description 2008 2009 2010 2011 2012 2013 2014 2015 2016 2017 ($/Vehicle)
COMMUNITY SER. BLDFACIL 1296 2002 ICE RESURFACER OLYMPIA 1 1 1 1 1 1 1 1 1 1 $110,000
COMMUNITY SER. PARKS 1314 2002 Trailer 6 Ton 1 1 1 1 1 1 1 1 1 1 $13,852
COMMUNITY SER. PARKS 1315 2002 Trailer 6 Ton 1 1 1 1 1 1 1 1 1 1 $13,852
COMMUNITY SER. PARKS 1316 2002 Utility Vehicle Gator 1 1 1 1 1 0 0 0 0 0 $15,203
COMMUNITY SER. PARKS 1322 2002 Groomer Diamond Master 1 1 1 1 1 1 1 1 1 1 $20,834
COMMUNITY SER. PARKS 1329 2002 SOD Cutter Honda 1 1 1 1 1 1 1 1 1 1 $6,870
COMMUNITY SER. PARKS 1330 2002 SOD Cutter Honda 1 1 1 1 1 1 1 1 1 1 $6,870
COMMUNITY SER. PARKS 1331 2002 Mobile Bleachers 1 1 1 1 1 1 1 1 1 1 $60,000
COMMUNITY SER. PARKS 1334 2002 Mower Outfront John Deere 1 1 0 0 0 0 0 0 0 0 $68,020
COMMUNITY SER. PARKS 1335 2002 Mower Outfront John Deere 1 1 1 1 1 1 1 1 0 0 $68,020
COMMUNITY SER. PARKS 1336 2002 Mower Flail McConnell 1 0 0 0 0 0 0 0 0 0 $8,334
COMMUNITY SER. PARKS 1337 2002 Arm McConnell 1 0 0 0 0 0 0 0 0 0 $8,334
COMMUNITY SER. PARKS 1338 2002 Holder Tractor 1 1 1 1 0 0 0 0 0 0 $111,040
COMMUNITY SER. PARKS 1341 2002 Mower Outfront John Deere 1 1 1 1 1 0 0 0 0 0 $68,020
COMMUNITY SER. PARKS 1342 2002 Mower Outfront Toro 1 1 1 1 1 0 0 0 0 0 $19,483
COMMUNITY SER. PARKS 1343 2002 Mower Outfront Toro 1 1 1 1 1 1 1 1 0 0 $23,875
COMMUNITY SER. PARKS 1345 2002 Mobile Bleachers 1 1 1 1 1 1 1 1 1 1 $55,520
COMMUNITY SER. PARKS 1346 2002 Ford Ranger Pickup 1 1 1 1 1 1 1 0 0 0 $40,000
COMMUNITY SER. PARKS 1347 2002 Ford Ranger Pickup 1 1 1 1 1 1 1 1 1 0 $40,000
COMMUNITY SER. PARKS 1349 2002 Tractor Skid Steer 1 1 1 1 1 1 1 1 1 0 $27,704
COMMUNITY SER. PARKS 1352 2002 Dodge Dakota Pickup 1 0 0 0 1 1 1 1 1 1 $40,000
COMMUNITY SER. PARKS 1353 2002 Trailer 1 1 1 1 1 1 1 1 1 1 $13,852
COMMUNITY SER. PARKS 1354 2002 Trailer 1 1 1 1 1 1 1 1 1 1 $13,852
COMMUNITY SER. PARKS 1355 2002 Trailer 1 1 1 1 1 1 1 1 1 1 $13,852
COMMUNITY SER. PARKS 1356 2002 Mobile Bleachers 1 1 1 1 1 1 1 1 1 1 $60,000
COMMUNITY SER. PARKS 1357 2002 New Holland Tractor 1 1 1 1 1 1 1 1 1 1 $69,372
COMMUNITY SER. PARKS 1358 2002 Spreader lely 1 1 1 1 1 1 1 1 1 1 $788
COMMUNITY SER. PARKS 1359 2002 Spreader lely 1 1 1 1 1 1 1 1 1 1 $788
COMMUNITY SER. PARKS 1360 2002 Spreader lely 1 1 1 1 1 1 1 1 1 1 $788
COMMUNITY SER. PARKS 1361 2002 Holder Tractor 1 1 1 1 1 0 0 0 0 0 $111,040
COMMUNITY SER. PARKS 1367 2003 Pickup Dodge Dakota 1 1 1 1 1 1 1 1 0 0 $40,000
COMMUNITY SER. PARKS DEV 1368 2003 Pickup Dodge Dakota 1 1 1 1 1 1 1 1 1 1 $40,000
COMMUNITY SER. FLEET 1369 2003 Pickup Dodge 2500 3/4 4X4 HD 1 1 1 1 1 1 1 1 1 1 $61,714
COMMUNITY SER. PARKS 1371 2003 Pickup F250 Ford 1 1 1 1 1 1 1 1 1 1 $46,285
COMMUNITY SER. PARKS 1374 2002 Tractor Ford New Holland TN65 1 1 1 1 1 1 0 0 0 0 $55,520
COMMUNITY SER. PARKS 1375 2002 Mower Haul All Rotery 1 1 1 1 1 1 1 1 1 1 $41,330
COMMUNITY SER. FORESTRY 1377 2002 POLE SAW 1 1 1 1 1 0 0 0 0 0 $901
COMMUNITY SER. PARKS 1392 2003 Edger Grass Little Wonderer 1 1 1 1 1 1 1 1 1 1 $1,126
COMMUNITY SER. PARKS 1393 2003 Edger Grass Little Wonderer 1 1 1 1 1 1 1 1 1 1 $1,126
COMMUNITY SER. PARKS 1395 2003 Tiller, Mini Honda 1 1 1 1 0 0 0 0 0 0 $676
COMMUNITY SER. PARKS 1399 2003 Edger Grass Little Wonderer 1 1 1 1 1 1 1 1 1 1 $1,126
COMMUNITY SER. PARKS 1406 2003 Utility Vehicle Gator 1 1 1 1 1 1 1 1 1 1 $676
COMMUNITY SER. PARKS 1419 2003 Trailer 3 Ton Platinum 1 1 0 0 0 0 0 0 0 0 $12,275
INVENTORY OF CAPITAL ASSETS
CITY FLEET: NON-ROADS DEPARTMENT
APPENDIX ETABLE 1 - PAGE 65
CITY OF VAUGHAN
COMMUNITY SERVICES
Total Number of Vehicles
HEMSON
HEMSON
180

Non-Roads Inventory Model UNIT COST
Department Division Number Year Description 2008 2009 2010 2011 2012 2013 2014 2015 2016 2017 ($/Vehicle)
COMMUNITY SER. PARKS 1420 2003 Trailer 3 Ton Platinum 1 1 1 1 1 1 1 1 1 1 $12,275
COMMUNITY SER. PARKS 1421 2003 Trailer 3 Ton Platinum 1 1 1 1 1 1 1 1 1 1 $12,275
COMMUNITY SER. PARKS 1422 2003 Trailer 3 Ton Platinum 1 1 1 1 1 1 1 1 1 1 $12,275
COMMUNITY SER. PARKS-DEV. 1426 2003 Pickup Dodge Dakota 1 1 1 1 1 1 1 1 1 1 $40,000
COMMUNITY SER. BLDFACIL 1427 2003 Pickup Dodge Dakota 1 1 1 1 1 1 1 1 1 1 $40,000
COMMUNITY SER. PARKS 1428 2002 Mower Outfront John Deere 1 1 1 1 1 0 0 0 0 0 $26,803
COMMUNITY SER. PARKS 1429 2003 Mower Outfront John Deere 1 1 0 0 0 0 0 0 0 0 $26,127
COMMUNITY SER. PARKS 1430 2003 Mower Outfront 10 ft Rotary 1 1 1 0 0 0 0 0 0 0 $62,052
COMMUNITY SER. FLEET 1432 2003 Pickup S10 4X4 Chev 1 0 0 0 0 0 0 0 0 0 $40,000
COMMUNITY SER. PARKS 1434 2003 Pickup Chev Silverado 1 1 1 1 1 1 1 1 1 1 $40,000
COMMUNITY SER. PARKS 1436 2003 Cargo Van Ford E250 1 1 1 1 1 1 1 1 1 1 $45,000
COMMUNITY SER. PARKS 1438 2004 Pickup 4x4 W/Plow 1 1 1 1 1 1 1 1 0 0 $49,664
COMMUNITY SER. PARKS 1439 2004 Pickup 4x4 W/Plow 1 1 1 1 1 1 1 1 1 0 $49,664
COMMUNITY SER. PARKS 1440 2003 Overseeder Duke 1 1 1 1 1 1 1 1 1 1 $26,127
COMMUNITY SER. PARKS 1441 2003 Mower Flail Alamo 1 0 0 0 0 0 0 0 0 0 $8,446
COMMUNITY SER. PARKS 1442 2004 Pickup 4x4 W/Plow 1 1 1 1 1 1 1 0 0 0 $55,500
COMMUNITY SER. PARKS 1444 2004 Pickup Crew Cab 1 1 1 1 1 1 1 1 1 1 $45,497
COMMUNITY SER. PARKS 1445 2004 Pickup Crew Cab 1 1 1 1 1 1 1 1 1 1 $44,934
COMMUNITY SER. PARKS 1446 2004 Pickup Crew Cab 1 1 1 1 1 1 1 1 1 1 $44,934
COMMUNITY SER. PARKS 1449 1997 Aerator Ryan Walk Behind 1 1 1 1 1 1 1 1 1 1 $4,392
COMMUNITY SER. PARKS 1450 1997 Aerator Ryan Walk Behind 1 1 1 1 1 1 1 1 1 1 $4,392
COMMUNITY SER. PARKS 1451 1997 Aerator Ryan Walk Behind 1 1 1 1 1 1 1 1 1 1 $4,392
COMMUNITY SER. PARKS 1452 2003 Aerator Bannerman Tow Behind 1 1 1 1 1 1 1 1 1 1 $1,914
COMMUNITY SER. FORESTRY 1455 2004 POLE SAW STIHL 1 1 1 1 1 0 0 0 0 0 $788
COMMUNITY SER. FORESTRY 1456 2004 CHAIN SAW STIHL 1 1 1 1 1 1 1 1 1 1 $676
COMMUNITY SER. FORESTRY 1461 2004 CHAIN SAW STIHL 1 1 1 1 1 1 1 1 1 1 $901
COMMUNITY SER. BLDFACIL 1462 2004 ICE RESURFACER OLYMPIA 1 1 1 1 1 1 1 1 1 1 $110,000
COMMUNITY SER. BLDFACIL 1463 2004 ICE EDGER OLYMPIA 1 1 1 1 1 1 1 1 1 1 $110,000
COMMUNITY SER. BLDFACIL 1464 2004 ICE RESURFACER V-PLOW WESTERN 1 1 1 1 1 1 1 1 1 1 $110,000
COMMUNITY SER. PARKS 1465 2002 Water Tank Sprayer Honda 1 1 0 0 0 0 0 0 0 0 $4,505
COMMUNITY SER. PARKS 1466 2002 Water Tank Sprayer Honda 1 1 1 1 1 1 1 1 1 1 $4,505
COMMUNITY SER. PARKS 1467 2003 Water Tank 300 Gal. Honda 1 1 1 1 1 1 1 1 1 1 $4,392
COMMUNITY SER. PARKS 1468 2003 Water Tank 300 Gal. Honda 1 1 1 1 1 1 1 1 1 1 $4,392
COMMUNITY SER. PARKS 1469 2004 Sweeper Broom Holder 1 1 1 1 1 1 0 0 0 0 $6,081
COMMUNITY SER. PARKS 1470 2004 Sweeper Broom Holder 1 1 1 1 1 1 0 0 0 0 $6,081
COMMUNITY SER. PARKS 1471 2004 Tractor Snowplow Holder 1 1 1 1 1 1 0 0 0 0 $115,544
COMMUNITY SER. PARKS 1472 2004 Tractor Snowplow Holder 1 1 1 1 1 1 0 0 0 0 $115,544
COMMUNITY SER. PARKS 1477 2004 Rototiller Honda 1 1 1 1 0 0 0 0 0 0 $788
COMMUNITY SER. PARKS 1478 2004 Mower Outfront Jacobsen 10 ft 1 1 1 1 1 1 1 0 0 0 $70,000
COMMUNITY SER. PARKS 1479 2004 Mower Outfront Jacobsen 10 ft 1 1 1 1 1 1 1 0 0 0 $70,000
COMMUNITY SER. PARKS 1486 2004 Water Tank 305 Gal. Honda 1 1 1 1 1 1 1 1 1 1 $4,167
COMMUNITY SER. PARKS 1487 2004 Water Tank 305 Gal. Honda 1 1 1 1 1 1 1 1 1 1 $4,167
COMMUNITY SER. FORESTRY 1489 2004 CHAIN SAW 16" STIHL 1 1 1 1 1 1 1 1 1 0 $676
COMMUNITY SERVICES CITY FLEET: NON-ROADS DEPARTMENT
Total Number of Vehicles
APPENDIX ETABLE 1 - PAGE 66
CITY OF VAUGHANINVENTORY OF CAPITAL ASSETS
HEMSON
HEMSON
181

Non-Roads Inventory Model UNIT COST
Department Division Number Year Description 2008 2009 2010 2011 2012 2013 2014 2015 2016 2017 ($/Vehicle)
COMMUNITY SER. FORESTRY 1490 2004 CHAIN SAW 16" STIHL 1 1 1 1 1 1 1 1 1 1 $676
COMMUNITY SER. FORESTRY 1491 2004 CHAIN SAW 20" STIHL 1 1 1 1 1 1 1 1 1 1 $1,014
COMMUNITY SER. PKNORTHEAST 1493 2004 CHAIN SAW 17" STIHL 1 1 1 1 1 1 1 1 1 1 $450
COMMUNITY SER. PKWEST 1500 2004 B7905S-TRAILER 6 TON 1 1 1 1 1 1 1 1 1 1 $13,627
COMMUNITY SER. PKEAST 1502 2004 B7906S-TRAILER 6 TON 1 1 1 1 1 1 1 1 1 1 $13,627
COMMUNITY SER. PKNORTH 1503 2004 B7907S-TRAILER 6 TON 1 1 1 1 1 1 1 1 1 1 $13,627
COMMUNITY SER. PKCENTRAL 1504 2004 B7908S-TRAILER 6 TON 1 1 1 1 1 1 1 1 1 1 $13,627
COMMUNITY SER. FORESTRY 1506 2002 POLE SAW STIHL 1 1 1 1 1 0 0 0 0 0 $676
COMMUNITY SER. FORESTRY 1507 2002 POLE SAW STIHL 1 1 1 1 1 0 0 0 0 0 $676
COMMUNITY SER. PKWEST 1511 2005 TRACTOR SNOWPLOW HOLDER 1 1 1 1 1 1 0 0 0 0 $86,827
COMMUNITY SER. PKNORTH 1512 2005 TRACTOR SNOWPLOW HOLDER 1 1 1 1 1 1 0 0 0 0 $86,827
COMMUNITY SER. PKEAST 1513 2005 TRACTOR SNOWPLOW HOLDER 1 1 1 1 1 1 0 0 0 0 $86,827
COMMUNITY SER. PKCENTAL 1514 2002 SPREADER TAILGATE LESCO 1 1 1 1 0 0 0 0 0 0 $2,478
COMMUNITY SER. PKCENTAL 1515 2005 BLOWER SNOW TORO 2005 1 1 1 1 1 1 1 0 0 0 $1,014
COMMUNITY SER. PKCENTAL 1516 2005 BLOWER SNOW TORO 2005 1 1 1 1 1 1 1 0 0 0 $1,014
COMMUNITY SER. PKCENTAL 1517 2005 BLOWER SNOW TORO 2005 1 1 1 1 1 1 1 0 0 0 $1,014
COMMUNITY SER. PKCENTAL 1518 2005 BLOWER SNOW TORO 2005 1 1 1 1 1 1 1 0 0 0 $1,014
COMMUNITY SER. FORESTRY 1519 2005 7168NV-DUMP STERLING W/BOOM 1 1 1 1 1 1 1 1 1 1 $289,000
COMMUNITY SER. PKEAST 1520 2005 OVERSEEDER DUKE 1 1 1 1 1 1 1 1 1 1 $20,046
COMMUNITY SER. BLDFACIL 1521 2005 7691NZ-PICKUP DODGE DAKOTA 1 1 1 1 1 1 1 1 1 1 $400,000
COMMUNITY SER. PKHORT 1525 2005 ROTOTILLER HONDA 1 1 0 0 0 0 0 0 0 0 $676
COMMUNITY SER. PKHORT 1528 2004 WATER TANK HONDA 2004 1 1 1 1 1 1 1 1 1 1 $4,167
COMMUNITY SER. PKWEST 1530 2005 TRACTOR 2 WHEEL DRIVE J.DEERE 1 1 1 1 1 1 1 1 1 1 $49,101
COMMUNITY SER. PKHORT 1531 2005 4286RC-VAN CHEVROLET 2005 1 1 1 1 1 1 1 1 1 1 $50,000
COMMUNITY SER. BLDFACIL 1532 2005 4287RC-VAN CHEVROLET 2005 1 1 1 1 1 1 1 1 1 1 $50,000
COMMUNITY SER. PKEAST 1534 2005 TRACTOR W/LOADER JOHN DEERE 1 1 1 1 1 1 1 1 1 1 $67,007
COMMUNITY SER. PKCENTRAL 1535 2005 7673RE-VAN 3/4 TON CHEV 2005 1 1 1 1 1 1 1 1 1 1 $39,303
COMMUNITY SER. PKEAST 1555 2005 C4997K-TRAILER 4 TON 1 1 1 1 1 1 1 1 1 1 $12,500
COMMUNITY SER. PKWEST 1556 2005 C4996K-TRAILER 4 TON 1 1 1 1 1 1 1 1 1 1 $12,500
COMMUNITY SER. PKEAST 1559 2005 WEED TANK SPRAYER AQUACIDE 1 1 1 1 1 1 1 1 1 1 $25,000
COMMUNITY SER. PKWEST 1560 2005 MOWER OUTFRONT 10 FT JACOBSEN 1 1 1 1 1 1 1 1 0 0 $70,000
COMMUNITY SER. PKWEST 1561 2005 MOWER OUTFRONT 6 FT NEW HOLLAN 1 1 1 1 1 0 0 0 0 0 $26,915
COMMUNITY SER. PKWEST 1565 2006 TRACTOR JOHN DEERE 2006 1 1 1 1 1 1 1 1 1 1 $103,607
COMMUNITY SER. PKWEST 1566 2006 MOWER 12 FT HAUL ALL 1 1 1 1 1 1 1 1 1 1 $103,607
COMMUNITY SER. BLDFACIL 1570 2005 ICE RESURACER OLYMPIA W/PLOW 1 1 1 1 1 1 1 1 1 1 $110,000
COMMUNITY SER. PKWEST 1571 2006 Tractor w/Loader New Holland 1 1 1 1 1 1 1 1 1 1 $64,642
COMMUNITY SER. PKWEST 1572 2006 C3306W-TRAILER 7 TN PLATINUM 1 1 1 1 1 1 1 1 1 1 $13,401
COMMUNITY SER. PKWEST 1574 2006 MOWER SLOPE KUTKWIK 2006 1 1 1 1 1 0 0 0 0 0 $80,971
COMMUNITY SER. FORESTRY 1577 2006 POLE SAW TELESC. STIHL PRUNER 1 1 1 1 1 1 1 1 1 0 $788
COMMUNITY SER. PKHORT 1578 2006 4806RV-PICKUP DODGE DAKOTA 1 1 1 1 1 1 1 1 1 1 $40,000
COMMUNITY SER. FLEET 1581 2003 CP579X-TRAILER 18' TILT-N-LOAD 1 1 1 1 1 1 1 1 1 1 $18,582
COMMUNITY SER. PKEAST 1582 2006 6749TC-PICKUP 3/4 TON DODGE 06 1 1 1 1 1 1 1 1 1 1 $42,500
COMMUNITY SER. PKHORT 1583 2006 6748TC-PICKUP 3/4 TON DODGE 06 1 1 1 1 1 1 1 1 1 1 $42,500
COMMUNITY SERVICES
APPENDIX ETABLE 1 - PAGE 67
CITY OF VAUGHANINVENTORY OF CAPITAL ASSETS
CITY FLEET: NON-ROADS DEPARTMENT
Total Number of Vehicles
HEMSON
HEMSON
182

Non-Roads Inventory Model UNIT COST
Department Division Number Year Description 2008 2009 2010 2011 2012 2013 2014 2015 2016 2017 ($/Vehicle)
COMMUNITY SER. PKHORT 1584 2006 6750TC-PICKUP 3/4 TON DODGE 06 1 1 1 1 1 1 1 1 1 1 $42,500
COMMUNITY SER. PKEAST 1585 2006 RENOVATOR, SOIL 1 1 1 1 1 1 1 1 1 1 $27,929
COMMUNITY SER. PKCENTRAL 1589 2006 9864TD-PICKUP HYBRID 2006 1 1 1 1 1 1 1 1 1 0 $55,000
COMMUNITY SER. PKEAST 1590 2006 MOWER ZERO TURN 60" JOHN DEERE 1 1 1 1 1 1 0 0 0 0 $17,005
COMMUNITY SER. PKWEST 1591 2006 MOWER ZERO TURN 60" JOHN DEERE 1 1 1 1 1 1 1 1 0 0 $17,005
COMMUNITY SER. PKNORTH 1592 2006 MOWER ZERO TURN 60" JOHN DEERE 1 1 1 1 1 1 1 0 0 0 $17,005
COMMUNITY SER. PKHORT 1593 2006 6866TC-PICKUP 4X4 W/PLOW DODGE 1 1 1 1 1 1 1 1 1 1 $55,500
COMMUNITY SER. PKNORTH 1594 2006 COMPACTOR HAUL-ALL 2006 1 1 1 1 1 1 1 1 1 1 $129,283
COMMUNITY SER. PKHORT 1595 2006 EDGER REDMAX 1 1 1 0 0 0 0 0 0 0 $901
COMMUNITY SER. PKHORT 1596 2006 EDGER REDMAX 1 1 1 1 1 1 0 0 0 0 $901
COMMUNITY SER. FORESTRY 1598 2006 POLE SAW STIHL 1 1 1 0 0 0 0 0 0 0 $788
COMMUNITY SER. FORESTRY 1599 2006 POLE SAW STIHL 1 1 1 1 1 0 0 0 0 0 $788
COMMUNITY SER. FORESTRY 1601 2006 CHAIN SAW STIHL 1 1 1 1 1 1 1 1 1 1 $676
COMMUNITY SER. FORESTRY 1602 2006 CHAIN SAW STIHL 1 1 1 1 1 1 1 1 1 1 $676
COMMUNITY SER. FORESTRY 1605 2006 CHAIN SAW STIHL 1 1 1 1 1 1 1 1 1 1 $1,014
COMMUNITY SER. FORESTRY 1606 2006 CHAIN SAW STIHL 1 1 1 1 1 1 1 1 1 1 $1,014
COMMUNITY SER. PKNORTH 1607 2006 MOWER OUTFRONT 16' JACOBSEN 1 1 1 1 1 1 1 0 0 0 $130,000
COMMUNITY SER. PKEAST 1608 2006 MOWER OUTFRONT 16' JACOBSEN 1 1 1 1 1 1 1 1 1 1 $130,000
COMMUNITY SER. FORESTRY 1633 2006 WOODCHIPPER 18 BRUSH 1 1 1 1 1 1 1 1 1 1 $65,993
COMMUNITY SER. PKHORT 1634 2006 6944TC-PICKUP DODGE 4X4 W/PLOW 1 1 1 1 1 1 1 1 1 1 $55,500
COMMUNITY SER. FORESTRY 1635 2006 CHAIN SAW STIHL 1 1 1 1 1 1 1 1 1 1 $676
COMMUNITY SER. BLDFACIL 1638 2006 1343TF-VAN CARGO 2006 GMC 1 1 1 1 1 1 1 1 1 1 $50,000
COMMUNITY SER. PKEAST 1655 2007 4011TK-PICKUP DODGE RAM 2007 1 1 1 1 1 1 1 1 1 1 $40,000
COMMUNITY SER. PKEAST 1656 2007 4012TK-PICKUP DODGE RAM 2007 1 1 1 1 1 1 0 0 0 0 $40,000
COMMUNITY SER. PKCENTRAL 1657 2006 6097TM-PICKUP F350 4X4 FORD 1 1 1 1 1 1 1 1 1 1 $61,000
COMMUNITY SER. PKEAST 1659 2006 GENERATOR HONDA 1 1 1 1 1 1 1 1 1 1 $1,239
COMMUNITY SER. FORESTRY 1660 2006 6212TM-DUMP F450 FORD 1 1 1 1 1 1 1 1 1 1 $100,000
COMMUNITY SER. PKHORT 1663 2006 ROTOTILLER HONDA 1 1 1 1 0 0 0 0 0 0 $2,590
COMMUNITY SER. PKWEST 1668 2006 OVERSEEDER RYAN 1 1 1 1 1 1 1 1 1 1 $6,982
COMMUNITY SER. PKEAST 1669 2006 OVERSEEDER RYAN 1 1 1 1 1 1 1 1 1 1 $6,982
COMMUNITY SER. BLDFACIL 1670 2006 5554TM-VAN CARGO 1 1 1 1 1 1 1 1 1 1 $35,024
COMMUNITY SER. PKHORT 1672 2007 1431TW-PICKUP DODGE RAM 1 1 1 1 1 1 1 1 1 1 $40,000
COMMUNITY SER. PKEAST 1673 2007 1432TW-PICKUP DODGE RAM 1 1 1 1 1 1 1 1 1 1 $40,000
COMMUNITY SER. BLDFACIL 1674 2006 ICE RESURFACER OLYMPIA W/PLOW 1 1 1 1 1 1 1 1 1 1 $110,000
COMMUNITY SER. PKEAST 1676 2007 9466VA-COMPACTOR FORD 1 1 1 1 1 1 1 1 1 1 $145,000
COMMUNITY SER. PKEAST 1679 2007 ROLLER TURF BROUWER 1 1 1 1 1 1 1 1 1 1 $7,658
COMMUNITY SER. PKWEST 1680 2007 ROLLER TURF BROUWER 1 1 1 1 1 1 1 1 1 1 $7,658
COMMUNITY SER. PKCENTRAL 1681 2007 TRAILER 2 TON 1 1 1 1 1 1 1 1 1 1 $13,514
COMMUNITY SER. PK HORT 1682 2007 TRAILER 2 TON 1 1 1 1 1 1 1 1 1 1 $13,514
COMMUNITY SER. FORESTRY 1683 2007 TRAILER 2 TON 1 1 1 1 1 1 1 1 1 1 $13,514
COMMUNITY SER. PKNORTH 1704 2007 WEED TANK SPRAYER 1 1 1 1 1 1 1 1 1 1 $24,550
COMMUNITY SER. PKWEST 1705 2007 SCRAPER BLADE 1 1 1 1 1 1 1 1 1 1 $2,027
COMMUNITY SERVICES
APPENDIX ETABLE 1 - PAGE 68
CITY OF VAUGHANINVENTORY OF CAPITAL ASSETS
CITY FLEET: NON-ROADS DEPARTMENT
Total Number of Vehicles
HEMSON
HEMSON
183

Non-Roads Inventory Model UNIT COST
Department Division Number Year Description 2008 2009 2010 2011 2012 2013 2014 2015 2016 2017 ($/Vehicle)
COMMUNITY SER. BLDFACIL 1706 2008 Boom Lift 30ft Elect 1 1 1 1 1 1 1 1 1 1 $61,100
COMMUNITY SER. PKEAST 1707 2008 MOWER ZERO TURN JOHN DEERE 1 1 1 1 1 1 1 1 0 0 $15,000
COMMUNITY SER. PKWEST 1708 2008 MOWER ZERO TRUN JOHN DEERE 1 1 1 1 1 1 1 1 0 0 $15,000
COMMUNITY SER. PKWEST 1713 2001 SNOW BLOWER HOLDER 1 1 1 1 1 0 0 0 0 0 $7,320
COMMUNITY SER. PKNORTHWEST 1714 2008 Mower 1 1 1 1 1 1 1 1 0 0 $15,316
COMMUNITY SER. PKNORTHWEST 1715 2008 Trailer 1 1 1 1 1 1 1 1 1 1 $12,275
COMMUNITY SER. PKEAST 1716 2008 Trailer 1 1 1 1 1 1 1 1 1 1 $14,190
COMMUNITY SER. BLDFACIL 1717 2008 Air Compressor 1 1 1 1 1 1 1 1 1 0 $20,834
COMMUNITY SER. PKEAST 1718 2008 Mower 1 1 1 1 1 1 1 0 0 0 $51,691
COMMUNITY SER. PKWEST 1719 2008 Mower 1 1 1 1 1 1 1 1 1 1 $51,691
COMMUNITY SER. PKNORTHEAST 1720 2008 Mower 1 1 1 1 1 1 1 1 1 1 $51,691
COMMUNITY SER. PKNORTHWEST 1721 2008 Tractor 1 1 1 1 1 1 1 1 1 1 $70,000
COMMUNITY SER. PKWEST 1722 2008 Tractor 1 1 1 1 1 1 1 1 1 1 $70,000
COMMUNITY SER. PKNORTHWEST 1723 2008 Crane 1 1 1 1 1 1 1 1 1 1 $36,600
COMMUNITY SER. PKWEST 1724 2008 Dodge Ram 1 1 1 1 1 1 1 1 1 1 $41,893
COMMUNITY SER. BLDFACIL 1728 2008 ICE EDGER OLYMPIA 1 1 1 1 1 1 1 1 1 1 $5,293
COMMUNITY SER. BLDFACIL 1729 2008 ICE EDGER OLYMPIA 1 1 1 1 1 1 1 1 1 1 $5,293
COMMUNITY SER. PKNORTHWEST 1732 2008 Overseeder 1 1 1 1 1 1 1 1 1 1 $20,947
COMMUNITY SER. PKEAST 1772 2008 Dump 1 Ton 1 1 1 1 1 1 1 1 1 1 $65,000
COMMUNITY SER. PKNORTHWEST 1773 2008 Dump 1 Ton 1 1 1 1 1 1 1 1 1 1 $65,000
COMMUNITY SER. FORESTRY 1774 2008 Dump 1 Ton 1 1 1 1 1 1 1 1 1 1 $65,000
COMMUNITY SER. PKWEST 1775 2008 Dump 1 Ton 1 1 1 1 1 1 1 1 1 1 $650,000
COMMUNITY SER. PKNORTHWEST 1780 2008 MOWER ROTARY ATTACHMENT 1 1 1 1 1 1 1 1 1 1 $4,617
COMMUNITY SER. PKNORTHWEST 1781 2008 Overseeder/ Attachment 1 1 1 1 1 1 1 1 1 1 $8,897
COMMUNITY SER. PKNORTHEAST 1787 2008 SOD CUTTER RYAN 1 1 1 1 1 1 1 1 1 1 $5,743
COMMUNITY SER. FORESTRY 1788 2008 POLE SAW TELESCOPIC STIHL 1 1 1 1 1 1 0 0 0 0 $788
COMMUNITY SER. FORESTRY 1789 2008 POLE SAW TELESCOPIC STIHL 1 1 1 1 1 1 1 1 1 0 $788
COMMUNITY SER. FORESTRY 1790 2008 POLE SAW STIHL 1 1 1 1 1 1 1 1 1 1 $788
COMMUNITY SER. PKSDEV 1792 2008 Pickup 1 1 1 1 1 1 1 1 1 1 $40,000
COMMUNITY SER. PKNORTHWEST 1795 2008 Midsize Pickup Truck 1 1 1 1 1 1 1 1 1 1 $40,000
COMMUNITY SER. BLDFACIL 1802 2009 VAN CARGO FORD 0 1 1 1 1 1 1 1 1 1 $50,000
COMMUNITY SER. FORESTRY 1804 2009 POLE SAW STIHL 0 1 1 1 1 1 1 0 0 0 $642
COMMUNITY SER. FORESTRY 1805 2009 POLE SAW STIHL 0 1 1 1 1 1 0 0 0 0 $642
COMMUNITY SER. PKHORT 1807 2009 PICKUP DODGE RAM 0 1 1 1 1 1 1 1 1 1 $40,000
COMMUNITY SER. PKHORT 1808 2009 PICKUP DODGE RAM 0 1 1 1 1 1 1 1 1 1 $40,000
COMMUNITY SER. PKWEST 1809 2009 PICKUP DODGE RAM 0 1 1 1 1 1 1 1 1 1 $40,000
COMMUNITY SER. PKNORTHEAST 1810 2009 PICKUP DODGE RAM 0 1 1 1 1 1 1 1 1 1 $40,000
COMMUNITY SER. PKWEST 1811 2009 PICKUP DODGE RAM 0 1 1 1 1 1 1 1 1 1 $40,000
COMMUNITY SER. PKSDEV 1815 2009 PICKUP DODGE DAKOTA 0 1 1 1 1 1 1 1 1 1 $40,000
COMMUNITY SER. PKWEST 1817 2009 TRAILER LANDSCAPE PLATINUM 0 1 1 1 1 1 1 1 1 1 $19,000
COMMUNITY SER. PKNORTH 1818 2009 TRAILER LANDSCAPE PLATINUM 0 1 0 0 1 1 1 1 1 1 $19,000
COMMUNITY SER. PKEAST 1819 2009 TRAILER LANDSCAPE PLATINUM 0 1 1 1 1 1 1 1 1 1 $19,000
COMMUNITY SER. PKNORTHEAST 1820 2009 TRAILER LANDSCAPE PLATINUM 0 1 1 1 1 1 1 1 1 1 $19,000
COMMUNITY SERVICES
Total Number of Vehicles
TABLE 1 - PAGE 69
CITY OF VAUGHANINVENTORY OF CAPITAL ASSETS
CITY FLEET: NON-ROADS DEPARTMENT
APPENDIX E
HEMSON
HEMSON
184

Non-Roads Inventory Model UNIT COST
Department Division Number Year Description 2008 2009 2010 2011 2012 2013 2014 2015 2016 2017 ($/Vehicle)
COMMUNITY SER. PKNORTHWEST 1821 2009 TRAILER LANDSCAPE PLATINUM 0 1 1 1 1 1 1 1 1 1 $19,000
COMMUNITY SER. FORESTRY 1834 2009 POLE SAW STIHL 0 1 1 1 1 1 0 0 0 0 $619
COMMUNITY SER. BLDFACIL 1841 2009 PICKUP FORD F150 0 1 1 1 1 1 1 1 1 1 $30,200
COMMUNITY SER. BLDFACIL 1842 2009 VAN CARGO CHEVROLET 0 1 1 1 1 1 1 1 1 1 $50,000
COMMUNITY SER. PKEAST 1843 2009 MOWER 16' JACOBSEN 0 1 1 1 1 1 1 1 1 1 $130,000
COMMUNITY SER. PKNORTHWEST 1844 2009 MOWER 10' JACOBSEN 0 1 1 1 1 1 1 1 1 1 $70,000
COMMUNITY SER. PKNORTHEAST 1845 2009 MOWER 10' JACOBSEN 0 1 1 1 1 1 1 1 1 1 $70,000
COMMUNITY SER. PKWEST 1846 2009 MOWER ZERO TRUN JOHN DEERE 0 1 1 1 1 1 1 1 1 1 $15,879
COMMUNITY SER. PKNORTHEAST 1847 2009 MOWER ZERO TRUN JOHN DEERE 0 1 1 1 1 1 1 1 1 0 $15,879
COMMUNITY SER. PKWEST 1848 2009 MOWER ZERO TRUN JOHN DEERE 0 1 1 1 1 1 1 1 1 0 $15,879
COMMUNITY SER. PKEAST 1856 2009 TRACTOR SNOWPLOW W/3 ATTACH 0 1 1 1 1 1 1 1 1 1 $219,940
COMMUNITY SER. PKWEST 1857 2009 TRACTOR SNOWPLOW W/3 ATTACH 0 1 1 1 1 1 1 1 1 1 $219,940
COMMUNITY SER. PKNORTHWEST 1858 2009 TRACTOR SNOWPLOW W/3 ATTACH 0 1 1 1 1 1 1 1 1 1 $219,940
COMMUNITY SER. PKNORTHEAST 1859 2009 GENERATOR HONDA 0 1 1 1 1 1 1 1 1 1 $2,590
COMMUNITY SER. PKNORTHWEST 1860 2009 GENERATOR HONDA 0 1 1 1 1 1 1 1 1 1 $1,802
COMMUNITY SER. PKNORTHWEST 1861 2009 GENERATOR HONDA 0 1 1 1 1 1 1 1 1 1 $1,802
COMMUNITY SER. PKNORTHEAST 1862 2009 TRACTOR SNOWPLOW W/2 ATTACH 0 1 1 1 1 1 1 1 1 1 $131,761
COMMUNITY SER. BLDFACIL 1863 2009 ICE RESURFACER OLYMPIA W/PLOW 0 1 1 1 1 1 1 1 1 1 $110,000
COMMUNITY SER. PKNORTHEAST 1866 2009 TRACTOR SNOWPLOW BENCO 0 1 1 1 1 1 1 1 1 1 $147,978
COMMUNITY SER. PKCENTRAL 1872 2010 PICKUP FORD RANGER 0 0 1 1 1 1 1 1 1 1 $40,000
COMMUNITY SER. PKCENTRAL 1875 2010 PICKUP FORD RANGER 0 0 1 1 1 1 1 1 1 1 $40,000
COMMUNITY SER. BLDFACIL 1877 2010 PICKUP DODGE DAKOTA 0 0 1 1 1 1 1 1 1 1 $40,000
COMMUNITY SER. PKEAST 1878 2010 PICKUP DODGE DAKOTA 0 0 1 1 1 1 1 1 1 1 $40,000
COMMUNITY SER. PKEAST 1881 2009 SNOWPLOW V BLADES 0 1 1 1 1 1 0 0 0 0 $5,068
COMMUNITY SER. PKEAST 1882 2009 SNOWPLOW V BLADES 0 1 1 1 1 1 0 0 0 0 $5,068
COMMUNITY SER. PKEAST 1883 2009 SNOWPLOW V BLADES 0 1 1 1 1 1 0 0 0 0 $5,068
COMMUNITY SER. PKNORTHWEST 1894 2010 MOWER 1600 TURBO JOHN DEERE 0 0 1 1 1 1 1 1 1 1 $70,000
COMMUNITY SER. PKNORTHEAST 1895 2010 MOWER 1600 TURBO JOHN DEERE 0 0 1 1 1 1 1 1 1 1 $70,000
COMMUNITY SER. PKNORTHEAST 1897 2010 PICKUP FORD CREW CAB 0 0 1 1 1 1 1 1 1 1 $40,000
COMMUNITY SER. PKHORT 1898 2010 PICKUP FORD F250 0 0 1 1 1 1 1 1 1 1 $42,500
COMMUNITY SER. FORESTRY 1904 2010 PICKUP 3/4 TON CREW CAB 0 0 1 1 1 1 1 1 1 1 $42,500
COMMUNITY SER. PKNORTHWEST 1905 2010 PICKUP 3/4 TON FORD 0 0 1 1 1 1 1 1 1 1 $42,500
COMMUNITY SER. PKNORTHEAST 1913 2010 TRACTOR JOHN DEERE 0 0 1 1 1 1 1 1 1 1 $70,000
COMMUNITY SER. PKNORTHWEST 1914 2010 TRAILER LANDSCAPE 0 0 1 1 1 1 1 1 1 1 $16,217
COMMUNITY SER. PKNORTHEAST 1915 2010 PICKUP CREW CAB F250 0 0 1 1 1 1 1 1 1 1 $41,781
COMMUNITY SER. PKWEST 1919 2010 PICKUP CREW CAB F350 0 0 1 1 1 1 1 1 1 1 $41,781
COMMUNITY SER. PKNORTHWEST 1920 2010 AQUACIDE ENVIRO WEED CONTROL 0 0 1 1 1 1 1 1 1 1 $25,000
COMMUNITY SER. FORESTRY 1926 2010 POLE SAW STIHL 0 0 1 1 0 0 0 0 0 0 $676
COMMUNITY SER. PKNORTHEAST 1938 2010 PICKUP FORD RANGER 0 0 1 1 1 1 1 1 1 1 $40,000
COMMUNITY SER. PKWEST 1939 2010 PICKUP FORD RANGER 0 0 1 1 1 1 1 1 1 1 $40,000
COMMUNITY SER. PKEAST 1940 2010 PICKUP FORD RANGER 0 0 1 1 1 1 1 1 1 1 $40,000
COMMUNITY SER. PKNORTHWEST 1941 2010 PICKUP FORD RANGER 0 0 1 1 1 1 1 1 1 1 $40,000
COMMUNITY SER. PKHORT 1953 2010 PICKUP 3/4 TON DODGE 0 0 1 1 1 1 1 1 1 1 $42,500
COMMUNITY SERVICES
Total Number of Vehicles
CITY OF VAUGHANINVENTORY OF CAPITAL ASSETS
CITY FLEET: NON-ROADS DEPARTMENT
APPENDIX ETABLE 1 - PAGE 70
HEMSON
HEMSON
185
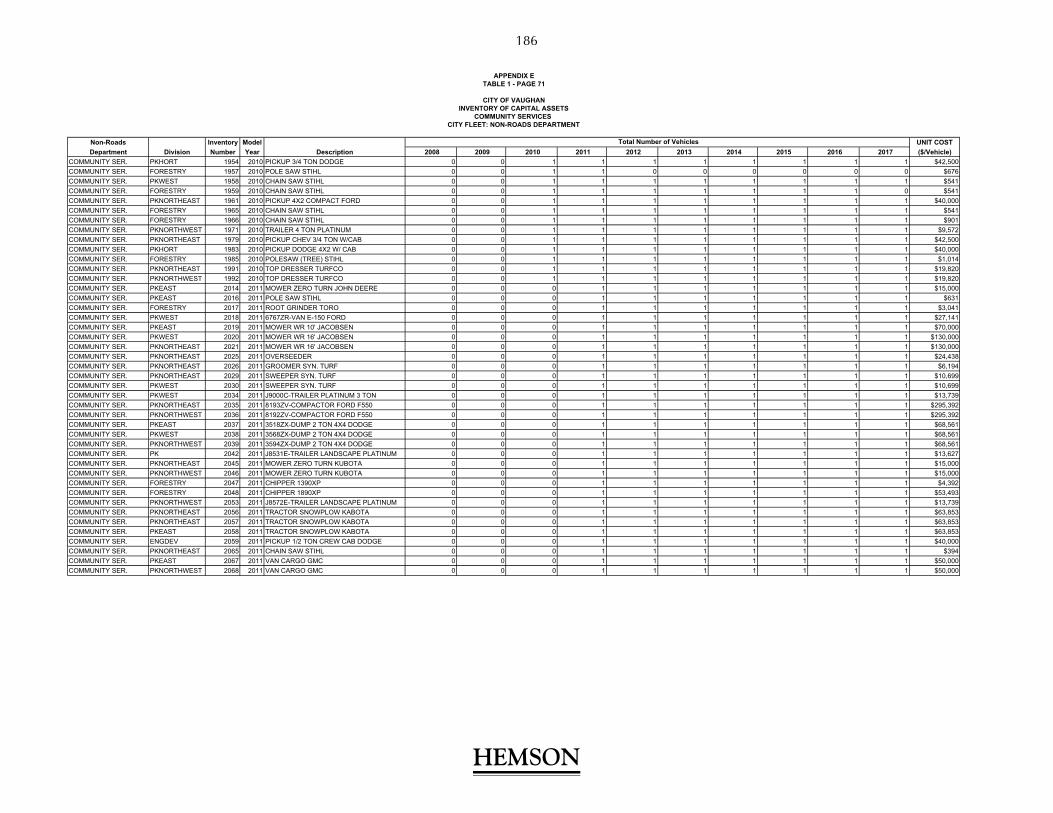
Non-Roads Inventory Model UNIT COST
Department Division Number Year Description 2008 2009 2010 2011 2012 2013 2014 2015 2016 2017 ($/Vehicle)
COMMUNITY SER. PKHORT 1954 2010 PICKUP 3/4 TON DODGE 0 0 1 1 1 1 1 1 1 1 $42,500
COMMUNITY SER. FORESTRY 1957 2010 POLE SAW STIHL 0 0 1 1 0 0 0 0 0 0 $676
COMMUNITY SER. PKWEST 1958 2010 CHAIN SAW STIHL 0 0 1 1 1 1 1 1 1 1 $541
COMMUNITY SER. FORESTRY 1959 2010 CHAIN SAW STIHL 0 0 1 1 1 1 1 1 1 0 $541
COMMUNITY SER. PKNORTHEAST 1961 2010 PICKUP 4X2 COMPACT FORD 0 0 1 1 1 1 1 1 1 1 $40,000
COMMUNITY SER. FORESTRY 1965 2010 CHAIN SAW STIHL 0 0 1 1 1 1 1 1 1 1 $541
COMMUNITY SER. FORESTRY 1966 2010 CHAIN SAW STIHL 0 0 1 1 1 1 1 1 1 1 $901
COMMUNITY SER. PKNORTHWEST 1971 2010 TRAILER 4 TON PLATINUM 0 0 1 1 1 1 1 1 1 1 $9,572
COMMUNITY SER. PKNORTHEAST 1979 2010 PICKUP CHEV 3/4 TON W/CAB 0 0 1 1 1 1 1 1 1 1 $42,500
COMMUNITY SER. PKHORT 1983 2010 PICKUP DODGE 4X2 W/ CAB 0 0 1 1 1 1 1 1 1 1 $40,000
COMMUNITY SER. FORESTRY 1985 2010 POLESAW (TREE) STIHL 0 0 1 1 1 1 1 1 1 1 $1,014
COMMUNITY SER. PKNORTHEAST 1991 2010 TOP DRESSER TURFCO 0 0 1 1 1 1 1 1 1 1 $19,820
COMMUNITY SER. PKNORTHWEST 1992 2010 TOP DRESSER TURFCO 0 0 1 1 1 1 1 1 1 1 $19,820
COMMUNITY SER. PKEAST 2014 2011 MOWER ZERO TURN JOHN DEERE 0 0 0 1 1 1 1 1 1 1 $15,000
COMMUNITY SER. PKEAST 2016 2011 POLE SAW STIHL 0 0 0 1 1 1 1 1 1 1 $631
COMMUNITY SER. FORESTRY 2017 2011 ROOT GRINDER TORO 0 0 0 1 1 1 1 1 1 1 $3,041
COMMUNITY SER. PKWEST 2018 2011 6767ZR-VAN E-150 FORD 0 0 0 1 1 1 1 1 1 1 $27,141
COMMUNITY SER. PKEAST 2019 2011 MOWER WR 10' JACOBSEN 0 0 0 1 1 1 1 1 1 1 $70,000
COMMUNITY SER. PKWEST 2020 2011 MOWER WR 16' JACOBSEN 0 0 0 1 1 1 1 1 1 1 $130,000
COMMUNITY SER. PKNORTHEAST 2021 2011 MOWER WR 16' JACOBSEN 0 0 0 1 1 1 1 1 1 1 $130,000
COMMUNITY SER. PKNORTHEAST 2025 2011 OVERSEEDER 0 0 0 1 1 1 1 1 1 1 $24,438
COMMUNITY SER. PKNORTHEAST 2026 2011 GROOMER SYN. TURF 0 0 0 1 1 1 1 1 1 1 $6,194
COMMUNITY SER. PKNORTHEAST 2029 2011 SWEEPER SYN. TURF 0 0 0 1 1 1 1 1 1 1 $10,699
COMMUNITY SER. PKWEST 2030 2011 SWEEPER SYN. TURF 0 0 0 1 1 1 1 1 1 1 $10,699
COMMUNITY SER. PKWEST 2034 2011 J9000C-TRAILER PLATINUM 3 TON 0 0 0 1 1 1 1 1 1 1 $13,739
COMMUNITY SER. PKNORTHEAST 2035 2011 8193ZV-COMPACTOR FORD F550 0 0 0 1 1 1 1 1 1 1 $295,392
COMMUNITY SER. PKNORTHWEST 2036 2011 8192ZV-COMPACTOR FORD F550 0 0 0 1 1 1 1 1 1 1 $295,392
COMMUNITY SER. PKEAST 2037 2011 3518ZX-DUMP 2 TON 4X4 DODGE 0 0 0 1 1 1 1 1 1 1 $68,561
COMMUNITY SER. PKWEST 2038 2011 3568ZX-DUMP 2 TON 4X4 DODGE 0 0 0 1 1 1 1 1 1 1 $68,561
COMMUNITY SER. PKNORTHWEST 2039 2011 3594ZX-DUMP 2 TON 4X4 DODGE 0 0 0 1 1 1 1 1 1 1 $68,561
COMMUNITY SER. PK 2042 2011 J8531E-TRAILER LANDSCAPE PLATINUM 0 0 0 1 1 1 1 1 1 1 $13,627
COMMUNITY SER. PKNORTHEAST 2045 2011 MOWER ZERO TURN KUBOTA 0 0 0 1 1 1 1 1 1 1 $15,000
COMMUNITY SER. PKNORTHWEST 2046 2011 MOWER ZERO TURN KUBOTA 0 0 0 1 1 1 1 1 1 1 $15,000
COMMUNITY SER. FORESTRY 2047 2011 CHIPPER 1390XP 0 0 0 1 1 1 1 1 1 1 $4,392
COMMUNITY SER. FORESTRY 2048 2011 CHIPPER 1890XP 0 0 0 1 1 1 1 1 1 1 $53,493
COMMUNITY SER. PKNORTHWEST 2053 2011 J8572E-TRAILER LANDSCAPE PLATINUM 0 0 0 1 1 1 1 1 1 1 $13,739
COMMUNITY SER. PKNORTHEAST 2056 2011 TRACTOR SNOWPLOW KABOTA 0 0 0 1 1 1 1 1 1 1 $63,853
COMMUNITY SER. PKNORTHEAST 2057 2011 TRACTOR SNOWPLOW KABOTA 0 0 0 1 1 1 1 1 1 1 $63,853
COMMUNITY SER. PKEAST 2058 2011 TRACTOR SNOWPLOW KABOTA 0 0 0 1 1 1 1 1 1 1 $63,853
COMMUNITY SER. ENGDEV 2059 2011 PICKUP 1/2 TON CREW CAB DODGE 0 0 0 1 1 1 1 1 1 1 $40,000
COMMUNITY SER. PKNORTHEAST 2065 2011 CHAIN SAW STIHL 0 0 0 1 1 1 1 1 1 1 $394
COMMUNITY SER. PKEAST 2067 2011 VAN CARGO GMC 0 0 0 1 1 1 1 1 1 1 $50,000
COMMUNITY SER. PKNORTHWEST 2068 2011 VAN CARGO GMC 0 0 0 1 1 1 1 1 1 1 $50,000
COMMUNITY SERVICES
Total Number of Vehicles
APPENDIX ETABLE 1 - PAGE 71
CITY OF VAUGHANINVENTORY OF CAPITAL ASSETS
CITY FLEET: NON-ROADS DEPARTMENT
HEMSON
HEMSON
186
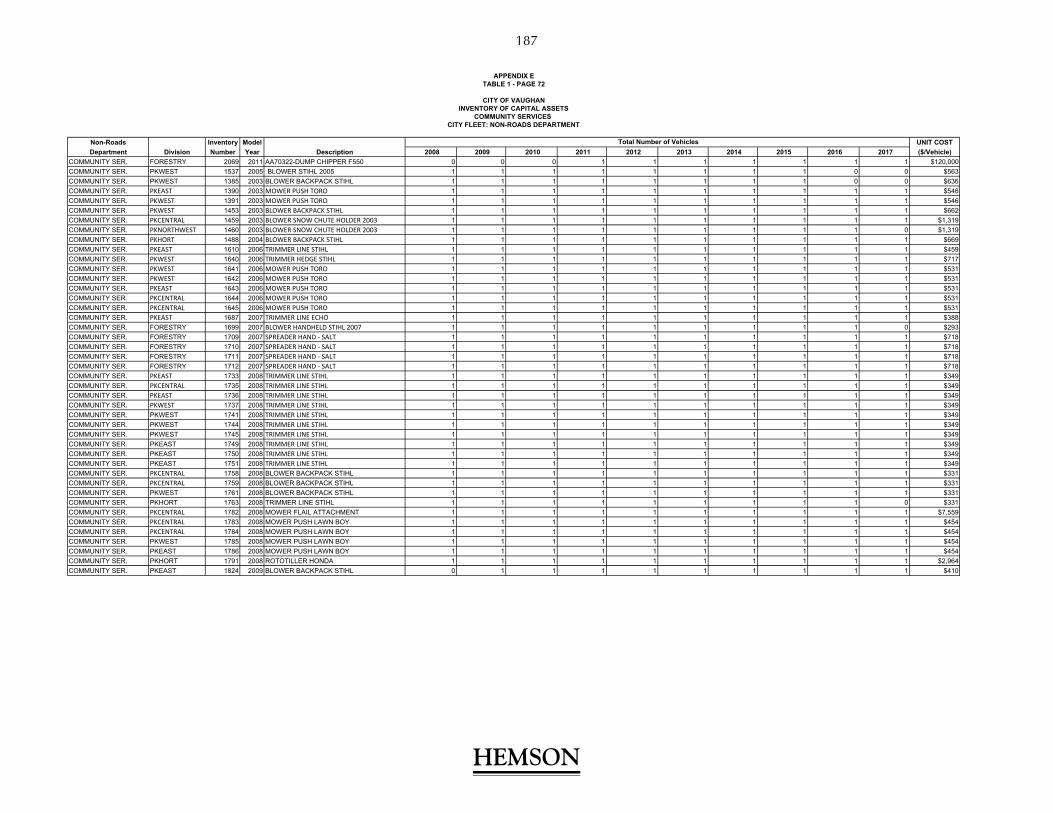
Non-Roads Inventory Model UNIT COST
Department Division Number Year Description 2008 2009 2010 2011 2012 2013 2014 2015 2016 2017 ($/Vehicle)
COMMUNITY SER. FORESTRY 2069 2011 AA70322-DUMP CHIPPER F550 0 0 0 1 1 1 1 1 1 1 $120,000
COMMUNITY SER. PKWEST 1537 2005 BLOWER STIHL 2005 1 1 1 1 1 1 1 1 0 0 $563
COMMUNITY SER. PKWEST 1385 2003 BLOWER BACKPACK STIHL 1 1 1 1 1 1 1 1 0 0 $636
COMMUNITY SER. PKEAST 1390 2003 MOWER PUSH TORO 1 1 1 1 1 1 1 1 1 1 $546
COMMUNITY SER. PKWEST 1391 2003 MOWER PUSH TORO 1 1 1 1 1 1 1 1 1 1 $546
COMMUNITY SER. PKWEST 1453 2003 BLOWER BACKPACK STIHL 1 1 1 1 1 1 1 1 1 1 $662
COMMUNITY SER. PKCENTRAL 1459 2003 BLOWER SNOW CHUTE HOLDER 2003 1 1 1 1 1 1 1 1 1 1 $1,319
COMMUNITY SER. PKNORTHWEST 1460 2003 BLOWER SNOW CHUTE HOLDER 2003 1 1 1 1 1 1 1 1 1 0 $1,319
COMMUNITY SER. PKHORT 1488 2004 BLOWER BACKPACK STIHL 1 1 1 1 1 1 1 1 1 1 $669
COMMUNITY SER. PKEAST 1610 2006 TRIMMER LINE STIHL 1 1 1 1 1 1 1 1 1 1 $459
COMMUNITY SER. PKWEST 1640 2006 TRIMMER HEDGE STIHL 1 1 1 1 1 1 1 1 1 1 $717
COMMUNITY SER. PKWEST 1641 2006 MOWER PUSH TORO 1 1 1 1 1 1 1 1 1 1 $531
COMMUNITY SER. PKWEST 1642 2006 MOWER PUSH TORO 1 1 1 1 1 1 1 1 1 1 $531
COMMUNITY SER. PKEAST 1643 2006 MOWER PUSH TORO 1 1 1 1 1 1 1 1 1 1 $531
COMMUNITY SER. PKCENTRAL 1644 2006 MOWER PUSH TORO 1 1 1 1 1 1 1 1 1 1 $531
COMMUNITY SER. PKCENTRAL 1645 2006 MOWER PUSH TORO 1 1 1 1 1 1 1 1 1 1 $531
COMMUNITY SER. PKEAST 1687 2007 TRIMMER LINE ECHO 1 1 1 1 1 1 1 1 1 1 $388
COMMUNITY SER. FORESTRY 1699 2007 BLOWER HANDHELD STIHL 2007 1 1 1 1 1 1 1 1 1 0 $293
COMMUNITY SER. FORESTRY 1709 2007 SPREADER HAND ‐ SALT 1 1 1 1 1 1 1 1 1 1 $718
COMMUNITY SER. FORESTRY 1710 2007 SPREADER HAND ‐ SALT 1 1 1 1 1 1 1 1 1 1 $718
COMMUNITY SER. FORESTRY 1711 2007 SPREADER HAND ‐ SALT 1 1 1 1 1 1 1 1 1 1 $718
COMMUNITY SER. FORESTRY 1712 2007 SPREADER HAND ‐ SALT 1 1 1 1 1 1 1 1 1 1 $718
COMMUNITY SER. PKEAST 1733 2008 TRIMMER LINE STIHL 1 1 1 1 1 1 1 1 1 1 $349
COMMUNITY SER. PKCENTRAL 1735 2008 TRIMMER LINE STIHL 1 1 1 1 1 1 1 1 1 1 $349
COMMUNITY SER. PKEAST 1736 2008 TRIMMER LINE STIHL 1 1 1 1 1 1 1 1 1 1 $349
COMMUNITY SER. PKWEST 1737 2008 TRIMMER LINE STIHL 1 1 1 1 1 1 1 1 1 1 $349
COMMUNITY SER. PKWEST 1741 2008 TRIMMER LINE STIHL 1 1 1 1 1 1 1 1 1 1 $349
COMMUNITY SER. PKWEST 1744 2008 TRIMMER LINE STIHL 1 1 1 1 1 1 1 1 1 1 $349
COMMUNITY SER. PKWEST 1745 2008 TRIMMER LINE STIHL 1 1 1 1 1 1 1 1 1 1 $349
COMMUNITY SER. PKEAST 1749 2008 TRIMMER LINE STIHL 1 1 1 1 1 1 1 1 1 1 $349
COMMUNITY SER. PKEAST 1750 2008 TRIMMER LINE STIHL 1 1 1 1 1 1 1 1 1 1 $349
COMMUNITY SER. PKEAST 1751 2008 TRIMMER LINE STIHL 1 1 1 1 1 1 1 1 1 1 $349
COMMUNITY SER. PKCENTRAL 1758 2008 BLOWER BACKPACK STIHL 1 1 1 1 1 1 1 1 1 1 $331
COMMUNITY SER. PKCENTRAL 1759 2008 BLOWER BACKPACK STIHL 1 1 1 1 1 1 1 1 1 1 $331
COMMUNITY SER. PKWEST 1761 2008 BLOWER BACKPACK STIHL 1 1 1 1 1 1 1 1 1 1 $331
COMMUNITY SER. PKHORT 1763 2008 TRIMMER LINE STIHL 1 1 1 1 1 1 1 1 1 0 $331
COMMUNITY SER. PKCENTRAL 1782 2008 MOWER FLAIL ATTACHMENT 1 1 1 1 1 1 1 1 1 1 $7,559
COMMUNITY SER. PKCENTRAL 1783 2008 MOWER PUSH LAWN BOY 1 1 1 1 1 1 1 1 1 1 $454
COMMUNITY SER. PKCENTRAL 1784 2008 MOWER PUSH LAWN BOY 1 1 1 1 1 1 1 1 1 1 $454
COMMUNITY SER. PKWEST 1785 2008 MOWER PUSH LAWN BOY 1 1 1 1 1 1 1 1 1 1 $454
COMMUNITY SER. PKEAST 1786 2008 MOWER PUSH LAWN BOY 1 1 1 1 1 1 1 1 1 1 $454
COMMUNITY SER. PKHORT 1791 2008 ROTOTILLER HONDA 1 1 1 1 1 1 1 1 1 1 $2,964
COMMUNITY SER. PKEAST 1824 2009 BLOWER BACKPACK STIHL 0 1 1 1 1 1 1 1 1 1 $410
COMMUNITY SERVICES
Total Number of Vehicles
CITY OF VAUGHANINVENTORY OF CAPITAL ASSETS
CITY FLEET: NON-ROADS DEPARTMENT
APPENDIX ETABLE 1 - PAGE 72
HEMSON
HEMSON
187

Non-Roads Inventory Model UNIT COST
Department Division Number Year Description 2008 2009 2010 2011 2012 2013 2014 2015 2016 2017 ($/Vehicle)
COMMUNITY SER. PKEAST 1825 2009 BLOWER BACKPACK STIHL 0 1 1 1 1 1 1 1 1 1 $410
COMMUNITY SER. PKEAST 1826 2009 BLOWER BACKPACK STIHL 0 1 1 1 1 1 1 1 1 1 $410
COMMUNITY SER. PKEAST 1827 2009 BLOWER BACKPACK STIHL 0 1 1 1 1 1 1 1 1 1 $410
COMMUNITY SER. PKWEST 1828 2009 BLOWER BACKPACK STIHL 0 1 1 1 1 1 1 1 1 1 $410
COMMUNITY SER. PKWEST 1829 2009 BLOWER BACKPACK STIHL 0 1 1 1 1 1 1 1 1 1 $410
COMMUNITY SER. PKCENTRAL 1830 2009 TRIMMER LINE STIHL 0 1 1 1 1 1 1 1 1 1 $356
COMMUNITY SER. PKNORTHEAST 1832 2009 TRIMMER LINE STIHL 0 1 1 1 1 1 1 1 1 0 $356
COMMUNITY SER. PKEAST 1865 2009 TRIMMER HEDGE STIHL 0 1 1 1 1 1 1 1 1 1 $521
COMMUNITY SER. PKWEST 1907 2010 PAINT LINER SLW103 0 0 1 1 1 1 1 1 1 1 $4,187
COMMUNITY SER. PKEAST 1908 2010 PAINT LINER SLW103 0 0 1 1 1 1 1 1 1 1 $4,187
COMMUNITY SER. PKCENTRAL 1909 2010 PAINT LINER SLW103 0 0 1 1 1 1 1 1 1 1 $4,187
COMMUNITY SER. PKEAST 1910 2010 PAINT LINER SLW103 0 0 1 1 1 1 1 1 1 1 $4,187
COMMUNITY SER. PKHORT 1923 2010 BLOWER BACKPACK STIHL 0 0 1 1 1 1 1 1 1 1 $474
COMMUNITY SER. PKHORT 1924 2010 BLOWER BACKPACK STIHL 0 0 1 1 1 1 1 1 1 1 $474
COMMUNITY SER. PKHORT 1927 2010 TRIMMER LINE BRUSH CUTTER STIHL 0 0 1 1 1 1 1 1 1 1 $393
COMMUNITY SER. PKHORT 1928 2010 TRIMMER LINE BRUSH CUTTER STIHL 0 0 1 1 1 1 1 1 1 0 $393
COMMUNITY SER. PKHORT 1930 2010 ROTOTILLER YARDBOSS 0 0 1 1 1 1 1 1 1 1 $395
COMMUNITY SER. PKHORT 1931 2010 ROTOTILLER YARDBOSS 0 0 1 1 1 1 1 1 1 1 $395
COMMUNITY SER. PKHORT 1932 2010 TRIMMER HEDGE STIHL 0 0 1 1 1 1 1 1 1 1 $520
COMMUNITY SER. PKHORT 1933 2010 TRIMMER HEDGE STIHL 0 0 1 1 1 1 1 1 1 1 $520
COMMUNITY SER. PKHORT 1934 2010 TRIMMER HEDGE STIHL 0 0 1 1 1 1 1 1 1 1 $520
COMMUNITY SER. PKHORT 1935 2010 ROTOTILLER HONDA 0 0 1 1 1 1 1 1 1 1 $2,489
COMMUNITY SER. PKWEST 1942 2010 TRIMMER LINE STIHL 0 0 1 1 1 1 1 1 1 1 $436
COMMUNITY SER. PKWEST 1943 2010 TRIMMER LINE STIHL 0 0 1 1 1 1 1 1 1 1 $436
COMMUNITY SER. PKEAST 1946 2010 TRIMMER LINE STIHL 0 0 1 1 1 1 1 1 1 1 $436
COMMUNITY SER. PKEAST 1947 2010 BLOWER BACKPACK STIHL 0 0 1 1 1 1 1 1 1 1 $516
COMMUNITY SER. PKCENTRAL 1948 2010 BLOWER BACKPACK STIHL 0 0 1 1 1 1 1 1 1 1 $516
COMMUNITY SER. PKCENTRAL 1949 2010 TRIMMER LINE STIHL 0 0 1 1 1 1 1 1 1 1 $436
COMMUNITY SER. PKWEST 1950 2010 MOWER PUSH TORO 0 0 1 1 1 1 1 1 1 1 $853
COMMUNITY SER. PKWEST 1951 2010 MOWER PUSH TORO 0 0 1 1 1 1 1 1 1 1 $853
COMMUNITY SER. PKWEST 1952 2010 MOWER PUSH TORO 0 0 1 1 1 1 1 1 1 1 $853
COMMUNITY SER. PKCENTRAL 1955 2010 TRIMMER LINE STIHL 0 0 1 1 1 1 1 1 1 1 $393
COMMUNITY SER. PKWEST 1963 2010 ROTOTILLER YARDBOSS 0 0 1 1 1 1 1 1 1 1 $395
COMMUNITY SER. PKEAST 1964 2010 ROTOTILLER YARDBOSS 0 0 1 1 1 1 1 1 1 1 $395
COMMUNITY SER. PKNORTHWEST 1969 2010 TRIMMER LINE 0 0 1 1 1 1 1 1 1 0 $375
COMMUNITY SER. BLDFACIL 1976 2010 ICE RESURFACER OLYMPIA 0 0 1 1 1 1 1 1 1 1 $110,000
COMMUNITY SER. PKCENTRAL 1988 2010 TRIMMER HEDGE STIHL 0 0 1 1 1 1 1 1 1 1 $520
COMMUNITY SER. PKCENTRAL 1989 2010 TRIMMER HEDGE STIHL 0 0 1 1 1 1 1 1 1 1 $520
COMMUNITY SER. PKCONTRACTS 1993 2010 BLOWER SNOW TORO 0 0 1 1 1 1 1 1 1 1 $827
COMMUNITY SER. PKCONTRACTS 1994 2010 BLOWER SNOW TORO 0 0 1 1 1 1 1 1 1 1 $827
COMMUNITY SER. PKCONTRACTS 1995 2010 BLOWER SNOW TORO 0 0 1 1 1 1 1 1 1 1 $827
COMMUNITY SER. PKCONTRACTS 1996 2010 BLOWER SNOW TORO 0 0 1 1 1 1 1 1 1 1 $827
COMMUNITY SER. PKCONTRACTS 1997 2010 BLOWER SNOW TORO 0 0 1 1 1 1 1 1 1 1 $827
COMMUNITY SERVICES
APPENDIX ETABLE 1 - PAGE 73
CITY OF VAUGHANINVENTORY OF CAPITAL ASSETS
CITY FLEET: NON-ROADS DEPARTMENT
Total Number of Vehicles
HEMSON
HEMSON
188

Non-Roads Inventory Model UNIT COST
Department Division Number Year Description 2008 2009 2010 2011 2012 2013 2014 2015 2016 2017 ($/Vehicle)
COMMUNITY SER. PKCONTRACTS 1998 2010 BLOWER SNOW TORO 0 0 1 1 1 1 1 1 1 1 $827
COMMUNITY SER. PKCONTRACTS 1999 2010 BLOWER SNOW ARIEN 0 0 1 1 1 1 1 1 1 1 $2,161
COMMUNITY SER. BLDFACIL 2002 2011 BLOWER SNOW TORO 0 0 0 1 1 1 1 1 1 1 $1,305
COMMUNITY SER. BLDFACIL 2003 2011 BLOWER SNOW TORO 0 0 0 1 1 1 1 1 1 1 $1,305
COMMUNITY SER. BLDFACIL 2004 2011 BLOWER SNOW TORO 0 0 0 1 1 1 1 1 1 1 $1,305
COMMUNITY SER. BLDFACIL 2005 2011 BLOWER SNOW TORO 0 0 0 1 1 1 1 1 1 1 $1,305
COMMUNITY SER. BLDFACIL 2006 2011 BLOWER SNOW TORO 0 0 0 1 1 1 1 1 1 1 $1,305
COMMUNITY SER. BLDFACIL 2007 2011 BLOWER SNOW TORO 0 0 0 1 1 1 1 1 1 1 $1,305
COMMUNITY SER. BLDFACIL 2008 2011 BLOWER SNOW TORO 0 0 0 1 1 1 1 1 1 1 $1,305
COMMUNITY SER. PKWEST 2010 2011 PAINT LINER RACK 0 0 0 1 1 1 1 1 1 1 $1,402
COMMUNITY SER. PKCENTRAL 2011 2011 PAINT LINER RACK 0 0 0 1 1 1 1 1 1 1 $1,402
COMMUNITY SER. PKEAST 2012 2011 PAINT LINER RACK 0 0 0 1 1 1 1 1 1 1 $1,402
COMMUNITY SER. PKCENTRAL 2013 2011 PAINT LINER RACK 0 0 0 1 1 1 1 1 1 1 $1,402
COMMUNITY SER. PKWEST 2015 2011 TRIMMER HEDGE STIHL 0 0 0 1 1 1 1 1 1 1 $298
COMMUNITY SER. BLDFACIL 2051 2011 BLOWER BACKPACK STIHL 0 0 0 1 1 1 1 1 1 1 $220
COMMUNITY SER. BLDFACIL 2052 2011 BLOWER BACKPACK STIHL 0 0 0 1 1 1 1 1 1 1 $220
COMMUNITY SER. PKHORT 2077 2012 TRIMMER HEDGE STIHL 0 0 0 1 1 1 1 1 1 1 $371
COMMUNITY SER. PKHORT 2078 2012 CHAIN SAW STIHL 0 0 0 1 1 1 1 1 1 1 $578
COMMUNITY SER. PKHORT 2079 2012 CHAIN SAW STIHL 0 0 0 1 1 1 1 1 1 1 $578
COMMUNITY SER. FORESTRY 2080 2011 CHAIN SAW STIHL 0 0 0 1 1 1 1 1 1 1 $619
COMMUNITY SER. FORESTRY 2081 2011 CHAIN SAW STIHL 0 0 0 1 1 1 1 1 1 1 $619
COMMUNITY SER. FORESTRY 2082 2011 CHAIN SAW STIHL 0 0 0 1 1 1 1 1 1 0 $507
COMMUNITY SER. FORESTRY 2083 2011 CHAIN SAW STIHL 0 0 0 1 1 1 1 1 1 1 $811
COMMUNITY SER. FORESTRY 2094 2011 COMPERSSOR DUSTBANE 0 0 0 0 1 1 1 1 1 1 $630
COMMUNITY SER. PKHORT 2095 2012 BLOWER BACKPACK STIHL 0 0 0 0 1 1 1 1 1 1 $497
COMMUNITY SER. PKCENTRAL 2098 2012 PICKUP C.CAB 2500 DODGE 0 0 0 0 1 1 1 1 1 1 $42,500
COMMUNITY SER. PKHORT 2105 2012 VAN CUBE FORD 0 0 0 0 1 1 1 1 1 1 $50,000
COMMUNITY SER. PKWEST 2111 2012 TRIMMER LINE STIHL 0 0 0 0 1 1 1 1 1 1 $359
COMMUNITY SER. PKWEST 2112 2012 TRIMMER LINE STIHL 0 0 0 0 1 1 1 1 1 1 $359
COMMUNITY SER. PKWEST 2113 2012 TRIMMER LINE STIHL 0 0 0 0 1 1 1 1 1 1 $359
COMMUNITY SER. PKEAST 2115 2012 TRIMMER LINE STIHL 0 0 0 0 1 1 1 1 1 1 $359
COMMUNITY SER. PKEAST 2116 2012 TRIMMER LINE STIHL 0 0 0 0 1 1 1 1 1 1 $359
COMMUNITY SER. PKEAST 2118 2012 TRIMMER LINE STIHL 0 0 0 0 1 1 1 1 1 1 $359
COMMUNITY SER. PKWEST 2119 2012 TRIMMER LINE STIHL 0 0 0 0 1 1 1 1 1 1 $359
COMMUNITY SER. PKWEST 2120 2012 TRIMMER LINE STIHL 0 0 0 0 1 1 1 1 1 1 $359
COMMUNITY SER. PKWEST 2121 2012 TRIMMER LINE STIHL 0 0 0 0 1 1 1 1 1 1 $359
COMMUNITY SER. PKCENTRAL 2124 2012 TRIMMER LINE STIHL 0 0 0 0 1 1 1 1 1 1 $359
COMMUNITY SER. PKCENTRAL 2125 2012 TRIMMER LINE STIHL 0 0 0 0 1 1 1 1 1 1 $359
COMMUNITY SER. PKCENTRAL 2126 2012 TRIMMER LINE STIHL 0 0 0 0 1 1 1 1 1 1 $359
COMMUNITY SER. PKWEST 2127 2012 TRIMMER LINE STIHL 0 0 0 0 1 1 1 1 1 1 $359
COMMUNITY SER. PKWEST 2128 2012 TRIMMER LINE STIHL 0 0 0 0 1 1 1 1 1 1 $359
COMMUNITY SER. PKWEST 2129 2012 TRIMMER LINE STIHL 0 0 0 0 1 1 1 1 1 1 $359
COMMUNITY SER. PKWEST 2130 2012 TRIMMER LINE STIHL 0 0 0 0 1 1 1 1 1 1 $359
COMMUNITY SERVICES
Total Number of Vehicles
APPENDIX ETABLE 1 - PAGE 74
CITY OF VAUGHANINVENTORY OF CAPITAL ASSETS
CITY FLEET: NON-ROADS DEPARTMENT
HEMSON
HEMSON
189

Non-Roads Inventory Model UNIT COST
Department Division Number Year Description 2008 2009 2010 2011 2012 2013 2014 2015 2016 2017 ($/Vehicle)
COMMUNITY SER. PKCENTRAL 2131 2012 TRIMMER LINE STIHL 0 0 0 0 1 1 1 1 1 1 $359
COMMUNITY SER. PKHORT 2133 2012 TRIMMER LINE STIHL 0 0 0 0 1 1 1 1 1 1 $359
COMMUNITY SER. PKEAST 2135 2012 TRIMMER LINE STIHL 0 0 0 0 1 1 1 1 1 1 $359
COMMUNITY SER. PKCENTRAL 2136 2012 TRIMMER LINE STIHL 0 0 0 0 1 1 1 1 1 1 $359
COMMUNITY SER. PKCENTRAL 2137 2012 TRIMMER LINE STIHL 0 0 0 0 1 1 1 1 1 1 $359
COMMUNITY SER. PKNORTHWEST 2138 2012 TRIMMER LINE STIHL 0 0 0 0 1 1 1 1 1 0 $359
COMMUNITY SER. PKWEST 2139 2012 BLOWER BACKPACK STIHL 0 0 0 0 1 1 1 1 1 1 $393
COMMUNITY SER. PKWEST 2140 2012 BLOWER BACKPACK STIHL 0 0 0 0 1 1 1 1 1 1 $393
COMMUNITY SER. PKEAST 2141 2012 BLOWER BACKPACK STIHL 0 0 0 0 1 1 1 1 1 1 $393
COMMUNITY SER. PKEAST 2142 2012 BLOWER BACKPACK STIHL 0 0 0 0 1 1 1 1 1 1 $393
COMMUNITY SER. PKCENTRAL 2143 2012 BLOWER BACKPACK STIHL 0 0 0 0 1 1 1 1 1 1 $393
COMMUNITY SER. PKWEST 2144 2012 BLOWER BACKPACK STIHL 0 0 0 0 1 1 1 1 1 1 $393
COMMUNITY SER. PKCENTRAL 2145 2012 BLOWER BACKPACK STIHL 0 0 0 0 1 1 1 1 1 1 $393
COMMUNITY SER. PKCENTRAL 2146 2012 BLOWER BACKPACK STIHL 0 0 0 0 1 1 1 1 1 1 $393
COMMUNITY SER. PKCENTRAL 2147 2012 BLOWER BACKPACK STIHL 0 0 0 0 1 1 1 1 1 1 $393
COMMUNITY SER. PKWEST 2148 2012 BLOWER BACKPACK STIHL 0 0 0 0 1 1 1 1 1 1 $393
COMMUNITY SER. PKWEST 2149 2012 BLOWER BACKPACK STIHL 0 0 0 0 1 1 1 1 1 1 $393
COMMUNITY SER. PKEAST 2150 2012 BLOWER BACKPACK STIHL 0 0 0 0 1 1 1 1 1 1 $393
COMMUNITY SER. PKWEST 2151 2012 TRIMMER HEDGE STIHL 0 0 0 0 1 1 1 1 1 1 $275
COMMUNITY SER. PKWEST 2152 2012 TRIMMER HEDGE STIHL 0 0 0 0 1 1 1 1 1 1 $275
COMMUNITY SER. PKEAST 2153 2012 TRIMMER HEDGE STIHL 0 0 0 0 1 1 1 1 1 1 $275
COMMUNITY SER. PKEAST 2154 2012 TRIMMER HEDGE STIHL 0 0 0 0 1 1 1 1 1 1 $275
COMMUNITY SER. PKEAST 2155 2012 TRIMMER HEDGE STIHL 0 0 0 0 1 1 1 1 1 0 $275
COMMUNITY SER. PKEAST 2156 2012 TRIMMER HEDGE STIHL 0 0 0 0 1 1 1 1 1 0 $275
COMMUNITY SER. PKCENTRAL 2157 2012 TRIMMER HEDGE STIHL 0 0 0 0 1 1 1 1 1 1 $275
COMMUNITY SER. PKCENTRAL 2158 2012 TRIMMER HEDGE STIHL 0 0 0 0 1 1 1 1 1 1 $275
COMMUNITY SER. PKHORT 2159 2012 ROTOTILLER BCS (LARGE) 0 0 0 0 1 1 1 1 1 1 $3,147
COMMUNITY SER. PKEAST 2161 2012 ROTOTILLER STIHL YARD BOSS 0 0 0 0 1 1 1 1 1 1 $375
COMMUNITY SER. PKCENTRAL 2162 2012 ROTOTILLER STIHL YARD BOSS 0 0 0 0 1 1 1 1 1 1 $375
COMMUNITY SER. PKNORTHEAST 2163 2012 ROTOTILLER STIHL YARD BOSS 0 0 0 0 1 1 1 1 1 0 $375
COMMUNITY SER. PKCENTRAL 2164 2012 ROTOTILLER STIHL YARD BOSS 0 0 0 0 1 1 1 1 1 1 $375
COMMUNITY SER. PKCENTRAL 2165 2012 ROTOTILLER STIHL YARD BOSS 0 0 0 0 1 1 1 1 1 1 $375
COMMUNITY SER. PKCENTRAL 2166 2012 ROTOTILLER STIHL YARD BOSS 0 0 0 0 1 1 1 1 1 1 $375
COMMUNITY SER. PKHORT 2167 2012 ROTOTILLER STIHL YARD BOSS 0 0 0 0 1 1 1 1 1 1 $375
COMMUNITY SER. PKWEST 2168 2012 MOWER ZERO TURN KUBOTA 0 0 0 0 1 1 1 1 1 1 $15,000
COMMUNITY SER. PKCENTRAL 2169 2012 SOD ROLLER RIDING BROUWER 0 0 0 0 1 1 1 1 1 1 $5,796
COMMUNITY SER. PKWEST 2172 2012 SOD CUTTER HONDA 0 0 0 0 1 1 1 1 1 1 $5,515
COMMUNITY SER. PKCENTRAL 2173 2012 SOD RENOVATOR 0 0 0 0 1 1 1 1 1 1 $16,285
COMMUNITY SER. PKWEST 2174 2012 MOWER 16' WING JACOBSEN 0 0 0 0 1 1 1 1 1 1 $130,000
COMMUNITY SER. PKHORT 2176 2012 WATER TANK 0 0 0 0 1 1 1 1 1 1 $773
COMMUNITY SER. PKHORT 2177 2012 TRIMMER LINE STIHL 0 0 0 0 1 1 1 1 1 1 $356
COMMUNITY SER. PKCENTRAL 2179 2012 AERATOR 0 0 0 0 1 1 1 1 1 1 $29,810
COMMUNITY SER. FORESTRY 2181 2013 PICKUP 1/2 TON EXT CAB 0 0 0 0 1 1 1 1 1 1 $40,000
Total Number of Vehicles
TABLE 1 - PAGE 75
CITY OF VAUGHANINVENTORY OF CAPITAL ASSETS
CITY FLEET: NON-ROADS DEPARTMENT
APPENDIX E
COMMUNITY SERVICES
HEMSON
HEMSON
190

Non-Roads Inventory Model UNIT COST
Department Division Number Year Description 2008 2009 2010 2011 2012 2013 2014 2015 2016 2017 ($/Vehicle)
COMMUNITY SER. PKWEST 2186 2012 ROTOTILLER HONDA 0 0 0 0 1 1 1 1 1 1 $800
COMMUNITY SER. PKEAST 2187 2012 ROTOTILLER HONDA 0 0 0 0 1 1 1 1 1 1 $800
COMMUNITY SER. PKCENTRAL 2188 2012 ROTOTILLER HONDA 0 0 0 0 1 1 1 1 1 1 $800
COMMUNITY SER. PKCENTRAL 2189 2012 ROTOTILLER HONDA 0 0 0 0 1 1 1 1 1 1 $800
COMMUNITY SER. FORESTRY 2190 2012 PICKUP 1/2 TON 4X4 0 0 0 0 1 1 1 1 1 1 $42,000
COMMUNITY SER. PKWEST 2192 2012 MOWER 10FT WINGED JACOBSEN 0 0 0 0 1 1 1 1 1 1 $70,000
COMMUNITY SER. PKEAST 2193 2012 MOWER 10FT WINGED JACOBSEN 0 0 0 0 1 1 1 1 1 1 $70,000
COMMUNITY SER. PKCENTRAL 2194 2012 MOWER 10FT WINGED JACOBSEN 0 0 0 0 1 1 1 1 1 1 $70,000
COMMUNITY SER. PKWEST 2195 2012 MOWER 10FT WINGED JACOBSEN 0 0 0 0 1 1 1 1 1 1 $70,000
COMMUNITY SER. PKCENTRAL 2198 2012 UTILITY VEHICLE KUBOTA 0 0 0 0 1 1 1 1 1 1 $20,536
COMMUNITY SER. PKEAST 2199 2012 TRACTOR SNOWPLOW KUBOTA 0 0 0 0 1 1 1 1 1 1 $70,000
COMMUNITY SER. PKCENTRAL 2200 2012 TRACTOR SNOWPLOW KUBOTA 0 0 0 0 1 1 1 1 1 1 $70,000
COMMUNITY SER. PKWEST 2201 2012 TRACTOR SNOWPLOW KUBOTA 0 0 0 0 1 1 1 1 1 1 $70,000
COMMUNITY SER. PKEAST 2202 2012 TRACTOR SNOWPLOW KUBOTA 0 0 0 0 1 1 1 1 1 1 $70,000
COMMUNITY SER. PKEAST 2203 2013 PICKUP 4X4 W/PLOW 0 0 0 0 1 1 1 1 1 1 $55,500
COMMUNITY SER. PKCENTRAL 2204 2013 PICKUP 4X4 W/PLOW 0 0 0 0 1 1 1 1 1 1 $55,500
COMMUNITY SER. PKCENTRAL 2205 2012 GROOMER BASEBALL DIAMOND 0 0 0 0 1 1 1 1 1 1 $6,266
COMMUNITY SER. PKHORT 2206 2012 DUMP 1 TON DODGE 0 0 0 0 1 1 1 1 1 1 $44,360
COMMUNITY SER. PKHORT 2207 2012 TRIMMER LINE STIHL 0 0 0 0 1 1 1 1 1 0 $335
COMMUNITY SER. PKHORT 2208 2012 TRIMMER LINE STIHL 0 0 0 0 1 1 1 1 1 1 $335
COMMUNITY SER. PKHORT 2209 2012 BLOWER BACKPACK STIHL 0 0 0 0 1 1 1 1 1 1 $412
COMMUNITY SER. PKHORT 2210 2012 BLOWER BACKPACK STIHL 0 0 0 0 1 1 1 1 1 1 $412
COMMUNITY SER. PKHORT 2211 2012 TRIMMER HEDGE STIHL 0 0 0 0 1 1 1 1 1 1 $296
COMMUNITY SER. PKEAST 2213 2012 CHAIN SAW STIHL 0 0 0 0 1 1 1 1 1 1 $580
COMMUNITY SER. PKCENTRAL 2218 2013 PRESSURE WASHER PORTABLE 0 0 0 0 0 1 1 1 1 1 $1,200
COMMUNITY SER. PKWEST 2219 2013 UTILITY VEHICLE KUBOTA 0 0 0 0 0 1 1 1 1 1 $18,950
COMMUNITY SER. PKWEST 2220 2013 GROMER SYN. TURF 0 0 0 0 0 1 1 1 1 1 $4,930
COMMUNITY SER. PKWEST 2221 2013 TRIMMER LINE STIHL 0 0 0 0 0 1 1 1 1 1 $324
COMMUNITY SER. PKWEST 2222 2013 TRIMMER LINE STIHL 0 0 0 0 0 1 1 1 1 1 $324
COMMUNITY SER. PKWEST 2223 2013 TRIMMER LINE STIHL 0 0 0 0 0 1 1 1 1 1 $324
COMMUNITY SER. PKEAST 2224 2013 TRIMMER LINE STIHL 0 0 0 0 0 1 1 1 1 1 $324
COMMUNITY SER. PKEAST 2225 2013 TRIMMER LINE STIHL 0 0 0 0 0 1 1 1 1 1 $324
COMMUNITY SER. PKEAST 2226 2013 TRIMMER LINE STIHL 0 0 0 0 0 1 1 1 1 1 $324
COMMUNITY SER. PKCENTRAL 2227 2013 TRIMMER LINE STIHL 0 0 0 0 0 1 1 1 1 1 $324
COMMUNITY SER. PKCENTRAL 2228 2013 TRIMMER LINE STIHL 0 0 0 0 0 1 1 1 1 1 $324
COMMUNITY SER. PKCENTRAL 2229 2013 TRIMMER LINE STIHL 0 0 0 0 0 1 1 1 1 1 $324
COMMUNITY SER. PKEAST 2232 2013 POLE SAW PRUNER TELESCOPIC STIHL 0 0 0 0 0 1 1 1 1 1 $540
COMMUNITY SER. PKCENTRAL 2233 2013 POLE SAW PRUNER TELESCOPIC STIHL 0 0 0 0 0 1 1 1 1 1 $505
COMMUNITY SER. PKCENTRAL 2234 2013 POLE SAW PRUNER TELESCOPIC STIHL 0 0 0 0 0 1 1 1 1 1 $505
COMMUNITY SER. PKWEST 2235 2013 TRIMMER HEDGE STIHL 0 0 0 0 0 1 1 1 1 1 $285
COMMUNITY SER. PKEAST 2236 2013 TRIMMER HEDGE STIHL 0 0 0 0 0 1 1 1 1 1 $285
COMMUNITY SER. PKEAST 2237 2013 TRIMMER HEDGE STIHL 0 0 0 0 0 1 1 1 1 0 $285
COMMUNITY SER. PKCENTRAL 2238 2013 TRIMMER HEDGE STIHL 0 0 0 0 0 1 1 1 1 1 $285
Total Number of Vehicles
CITY OF VAUGHANINVENTORY OF CAPITAL ASSETS
CITY FLEET: NON-ROADS DEPARTMENTCOMMUNITY SERVICES
APPENDIX ETABLE 1 - PAGE 76
HEMSON
HEMSON
191

Non-Roads Inventory Model UNIT COST
Department Division Number Year Description 2008 2009 2010 2011 2012 2013 2014 2015 2016 2017 ($/Vehicle)
COMMUNITY SER. PKWEST 2239 2013 TRIMMER HEDGE STIHL 0 0 0 0 0 1 1 1 1 1 $249
COMMUNITY SER. PKEAST 2240 2013 TRIMMER HEDGE STIHL 0 0 0 0 0 1 1 1 1 1 $249
COMMUNITY SER. PKCENTRAL 2241 2013 TRIMMER HEDGE STIHL 0 0 0 0 0 1 1 1 1 1 $249
COMMUNITY SER. PKCENTRAL 2242 2013 TRIMMER HEDGE STIHL 0 0 0 0 0 1 1 1 1 1 $249
COMMUNITY SER. PKEAST 2243 2013 BLOWER BACKPACK STIHL 0 0 0 0 0 1 1 1 1 1 $356
COMMUNITY SER. PKCENTRAL 2244 2013 BLOWER BACKPACK STIHL 0 0 0 0 0 1 1 1 1 1 $356
COMMUNITY SER. PKCENTRAL 2245 2013 BLOWER BACKPACK STIHL 0 0 0 0 0 1 1 1 1 1 $356
COMMUNITY SER. PKWEST 2246 2013 BLOWER BACKPACK STIHL 0 0 0 0 0 1 1 1 1 1 $356
COMMUNITY SER. PKCENTRAL 2247 2013 BLOWER BACKPACK STIHL 0 0 0 0 0 1 1 1 1 1 $356
COMMUNITY SER. PKNORTHWEST 2248 2013 BLOWER BACKPACK STIHL 0 0 0 0 0 1 1 1 1 0 $356
COMMUNITY SER. PKWEST 2249 2013 BLOWER BACKPACK STIHL 0 0 0 0 0 1 1 1 1 1 $356
COMMUNITY SER. PKWEST 2250 2013 BLOWER BACKPACK STIHL 0 0 0 0 0 1 1 1 1 1 $356
COMMUNITY SER. PKEAST 2251 2013 MOWER 10' WINGED ROTARY JACOBSEN 0 0 0 0 0 1 1 1 1 1 $70,000
COMMUNITY SER. PKEAST 2252 2013 MOWER 10' WINGED ROTARY JACOBSEN 0 0 0 0 0 1 1 1 1 1 $70,000
COMMUNITY SER. PKWEST 2253 2013 MOWER 10' WINGED ROTARY JACOBSEN 0 0 0 0 0 1 1 1 1 1 $70,000
COMMUNITY SER. PKCENTRAL 2254 2013 MOWER 10' WINGED ROTARY JACOBSEN 0 0 0 0 0 1 1 1 1 1 $70,000
COMMUNITY SER. PKWEST 2255 2013 MOWER ZERO TURN SCAG 0 0 0 0 0 1 1 1 1 1 $15,000
COMMUNITY SER. PKWEST 2256 2013 MOWER ZERO TURN SCAG 0 0 0 0 0 1 1 1 1 1 $15,000
COMMUNITY SER. PKWEST 2257 2013 MOWER ZERO TURN SCAG 0 0 0 0 0 1 1 1 1 1 $15,000
COMMUNITY SER. PKEAST 2258 2013 MOWER ZERO TURN SCAG 0 0 0 0 0 1 1 1 1 1 $15,000
COMMUNITY SER. PKEAST 2259 2013 MOWER ZERO TURN SCAG 0 0 0 0 0 1 1 1 1 1 $15,000
COMMUNITY SER. PKCENTRAL 2260 2013 MOWER ZERO TURN SCAG 0 0 0 0 0 1 1 1 1 1 $15,000
COMMUNITY SER. PKWEST 2261 2013 RENOVATOR SOD 0 0 0 0 0 1 1 1 1 1 $14,380
COMMUNITY SER. PKCENTRAL 2264 2013 RENOVATOR SOD 0 0 0 0 0 1 1 1 1 1 $14,380
COMMUNITY SER. PKWEST 2266 2013 AQUACIDE SPRAYER 0 0 0 0 0 1 1 1 1 1 $25,000
COMMUNITY SER. PKWEST 2269 2013 TRACTOR SIDEWALK KUBOTA 0 0 0 0 0 1 1 1 1 1 $70,000
COMMUNITY SER. PKEAST 2270 2013 TRACTOR SIDEWALK KUBOTA 0 0 0 0 0 1 1 1 1 1 $70,000
COMMUNITY SER. PKEAST 2271 2013 TRACTOR SIDEWALK KUBOTA 0 0 0 0 0 1 1 1 1 1 $70,000
COMMUNITY SER. PKWEST 2272 2013 TRACTOR SIDEWALK KUBOTA 0 0 0 0 0 1 1 1 1 1 $70,000
COMMUNITY SER. PKEAST 2273 2013 TRACTOR SIDEWALK KUBOTA 0 0 0 0 0 1 1 1 1 1 $70,000
COMMUNITY SER. PKCENTRAL 2274 2013 TRACTOR SIDEWALK KUBOTA 0 0 0 0 0 1 1 1 1 1 $70,000
COMMUNITY SER. PKCENTRAL 2275 2013 WATER TANK SPRAYER 0 0 0 0 0 1 1 1 1 1 $2,543
COMMUNITY SER. PKWEST 2276 2013 TRACTOR SIDEWALK BENCO 0 0 0 0 0 1 1 1 1 1 $211,399
COMMUNITY SER. PKWEST 2286 2014 PICKUP 3/4 TON 4X4 W/PLOW 0 0 0 0 0 1 1 1 1 1 $55,500
COMMUNITY SER. PKWEST 2288 2014 PICKUP 3/4 TON CREW CAB 0 0 0 0 0 1 1 1 1 1 $43,000
COMMUNITY SER. PKHORT 2292 2013 TRIMMER LINE STIHL 0 0 0 0 0 1 1 1 1 1 $325
COMMUNITY SER. PKCENTRAL 2294 2013 TRIMMER LINE STIHL 0 0 0 0 0 1 1 1 1 1 $325
COMMUNITY SER. PKWEST 2295 2013 TRIMMER LINE STIHL 0 0 0 0 0 1 1 1 1 1 $325
COMMUNITY SER. PKCENTRAL 2296 2013 TRIMMER LINE STIHL 0 0 0 0 0 1 1 1 1 1 $325
COMMUNITY SER. PKCENTRAL 2297 2013 TRIMMER LINE STIHL 0 0 0 0 0 1 1 1 1 1 $325
COMMUNITY SER. PKCENTRAL 2298 2013 TRIMMER LINE STIHL 0 0 0 0 0 1 1 1 1 1 $325
COMMUNITY SER. PKEAST 2299 2013 TRIMMER LINE STIHL 0 0 0 0 0 1 1 1 1 1 $325
COMMUNITY SER. PKEAST 2300 2013 TRIMMER LINE STIHL 0 0 0 0 0 1 1 1 1 1 $325
Total Number of Vehicles
INVENTORY OF CAPITAL ASSETS
CITY FLEET: NON-ROADS DEPARTMENT
APPENDIX ETABLE 1 - PAGE 77
CITY OF VAUGHAN
COMMUNITY SERVICES
HEMSON
HEMSON
192
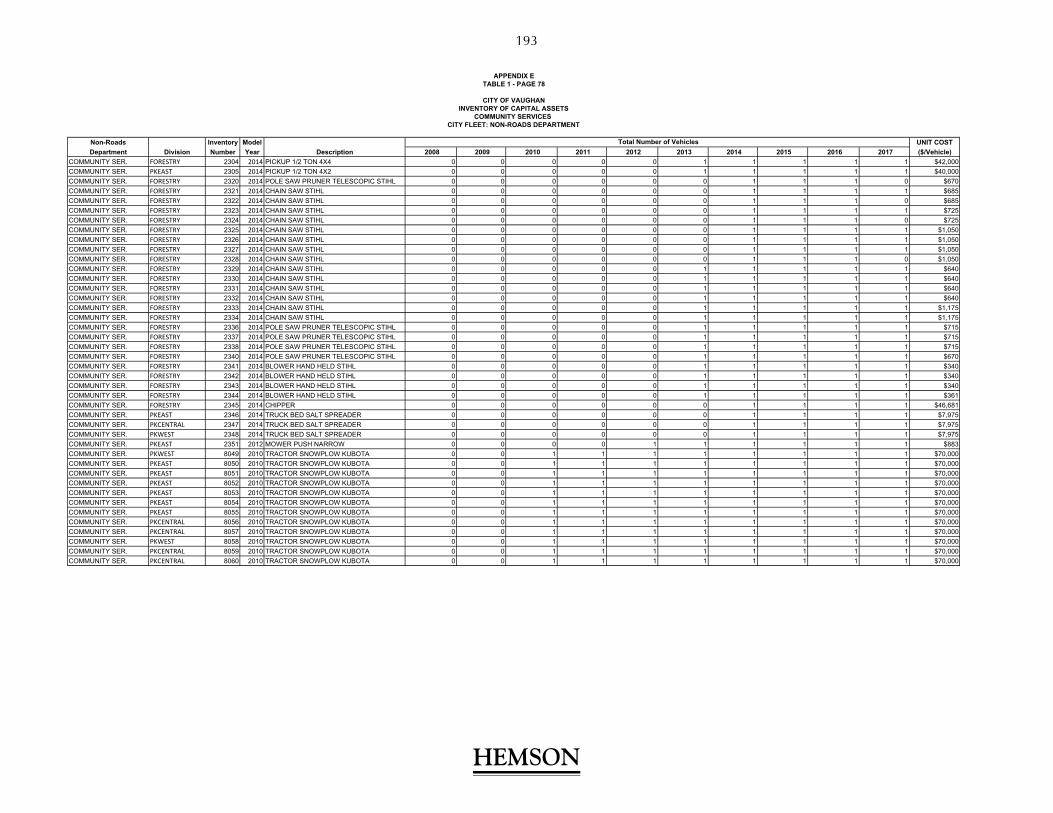
Non-Roads Inventory Model UNIT COST
Department Division Number Year Description 2008 2009 2010 2011 2012 2013 2014 2015 2016 2017 ($/Vehicle)
COMMUNITY SER. FORESTRY 2304 2014 PICKUP 1/2 TON 4X4 0 0 0 0 0 1 1 1 1 1 $42,000
COMMUNITY SER. PKEAST 2305 2014 PICKUP 1/2 TON 4X2 0 0 0 0 0 1 1 1 1 1 $40,000
COMMUNITY SER. FORESTRY 2320 2014 POLE SAW PRUNER TELESCOPIC STIHL 0 0 0 0 0 0 1 1 1 0 $670
COMMUNITY SER. FORESTRY 2321 2014 CHAIN SAW STIHL 0 0 0 0 0 0 1 1 1 1 $685
COMMUNITY SER. FORESTRY 2322 2014 CHAIN SAW STIHL 0 0 0 0 0 0 1 1 1 0 $685
COMMUNITY SER. FORESTRY 2323 2014 CHAIN SAW STIHL 0 0 0 0 0 0 1 1 1 1 $725
COMMUNITY SER. FORESTRY 2324 2014 CHAIN SAW STIHL 0 0 0 0 0 0 1 1 1 0 $725
COMMUNITY SER. FORESTRY 2325 2014 CHAIN SAW STIHL 0 0 0 0 0 0 1 1 1 1 $1,050
COMMUNITY SER. FORESTRY 2326 2014 CHAIN SAW STIHL 0 0 0 0 0 0 1 1 1 1 $1,050
COMMUNITY SER. FORESTRY 2327 2014 CHAIN SAW STIHL 0 0 0 0 0 0 1 1 1 1 $1,050
COMMUNITY SER. FORESTRY 2328 2014 CHAIN SAW STIHL 0 0 0 0 0 0 1 1 1 0 $1,050
COMMUNITY SER. FORESTRY 2329 2014 CHAIN SAW STIHL 0 0 0 0 0 1 1 1 1 1 $640
COMMUNITY SER. FORESTRY 2330 2014 CHAIN SAW STIHL 0 0 0 0 0 1 1 1 1 1 $640
COMMUNITY SER. FORESTRY 2331 2014 CHAIN SAW STIHL 0 0 0 0 0 1 1 1 1 1 $640
COMMUNITY SER. FORESTRY 2332 2014 CHAIN SAW STIHL 0 0 0 0 0 1 1 1 1 1 $640
COMMUNITY SER. FORESTRY 2333 2014 CHAIN SAW STIHL 0 0 0 0 0 1 1 1 1 1 $1,175
COMMUNITY SER. FORESTRY 2334 2014 CHAIN SAW STIHL 0 0 0 0 0 1 1 1 1 1 $1,175
COMMUNITY SER. FORESTRY 2336 2014 POLE SAW PRUNER TELESCOPIC STIHL 0 0 0 0 0 1 1 1 1 1 $715
COMMUNITY SER. FORESTRY 2337 2014 POLE SAW PRUNER TELESCOPIC STIHL 0 0 0 0 0 1 1 1 1 1 $715
COMMUNITY SER. FORESTRY 2338 2014 POLE SAW PRUNER TELESCOPIC STIHL 0 0 0 0 0 1 1 1 1 1 $715
COMMUNITY SER. FORESTRY 2340 2014 POLE SAW PRUNER TELESCOPIC STIHL 0 0 0 0 0 1 1 1 1 1 $670
COMMUNITY SER. FORESTRY 2341 2014 BLOWER HAND HELD STIHL 0 0 0 0 0 1 1 1 1 1 $340
COMMUNITY SER. FORESTRY 2342 2014 BLOWER HAND HELD STIHL 0 0 0 0 0 1 1 1 1 1 $340
COMMUNITY SER. FORESTRY 2343 2014 BLOWER HAND HELD STIHL 0 0 0 0 0 1 1 1 1 1 $340
COMMUNITY SER. FORESTRY 2344 2014 BLOWER HAND HELD STIHL 0 0 0 0 0 1 1 1 1 1 $361
COMMUNITY SER. FORESTRY 2345 2014 CHIPPER 0 0 0 0 0 0 1 1 1 1 $46,681
COMMUNITY SER. PKEAST 2346 2014 TRUCK BED SALT SPREADER 0 0 0 0 0 0 1 1 1 1 $7,975
COMMUNITY SER. PKCENTRAL 2347 2014 TRUCK BED SALT SPREADER 0 0 0 0 0 0 1 1 1 1 $7,975
COMMUNITY SER. PKWEST 2348 2014 TRUCK BED SALT SPREADER 0 0 0 0 0 0 1 1 1 1 $7,975
COMMUNITY SER. PKEAST 2351 2012 MOWER PUSH NARROW 0 0 0 0 1 1 1 1 1 1 $883
COMMUNITY SER. PKWEST 8049 2010 TRACTOR SNOWPLOW KUBOTA 0 0 1 1 1 1 1 1 1 1 $70,000
COMMUNITY SER. PKEAST 8050 2010 TRACTOR SNOWPLOW KUBOTA 0 0 1 1 1 1 1 1 1 1 $70,000
COMMUNITY SER. PKEAST 8051 2010 TRACTOR SNOWPLOW KUBOTA 0 0 1 1 1 1 1 1 1 1 $70,000
COMMUNITY SER. PKEAST 8052 2010 TRACTOR SNOWPLOW KUBOTA 0 0 1 1 1 1 1 1 1 1 $70,000
COMMUNITY SER. PKEAST 8053 2010 TRACTOR SNOWPLOW KUBOTA 0 0 1 1 1 1 1 1 1 1 $70,000
COMMUNITY SER. PKEAST 8054 2010 TRACTOR SNOWPLOW KUBOTA 0 0 1 1 1 1 1 1 1 1 $70,000
COMMUNITY SER. PKEAST 8055 2010 TRACTOR SNOWPLOW KUBOTA 0 0 1 1 1 1 1 1 1 1 $70,000
COMMUNITY SER. PKCENTRAL 8056 2010 TRACTOR SNOWPLOW KUBOTA 0 0 1 1 1 1 1 1 1 1 $70,000
COMMUNITY SER. PKCENTRAL 8057 2010 TRACTOR SNOWPLOW KUBOTA 0 0 1 1 1 1 1 1 1 1 $70,000
COMMUNITY SER. PKWEST 8058 2010 TRACTOR SNOWPLOW KUBOTA 0 0 1 1 1 1 1 1 1 1 $70,000
COMMUNITY SER. PKCENTRAL 8059 2010 TRACTOR SNOWPLOW KUBOTA 0 0 1 1 1 1 1 1 1 1 $70,000
COMMUNITY SER. PKCENTRAL 8060 2010 TRACTOR SNOWPLOW KUBOTA 0 0 1 1 1 1 1 1 1 1 $70,000
COMMUNITY SERVICES
Total Number of Vehicles
CITY FLEET: NON-ROADS DEPARTMENT
APPENDIX ETABLE 1 - PAGE 78
CITY OF VAUGHANINVENTORY OF CAPITAL ASSETS
HEMSON
HEMSON
193

Non-Roads Inventory Model UNIT COST
Department Division Number Year Description 2008 2009 2010 2011 2012 2013 2014 2015 2016 2017 ($/Vehicle)
COMMUNITY SER. PKCENTRAL 8061 2010 TRACTOR SNOWPLOW KUBOTA 0 0 1 1 1 1 1 1 1 1 $70,000
COMMUNITY SER. PKCENTRAL 8062 2010 TRACTOR SNOWPLOW KUBOTA 0 0 1 1 1 1 1 1 1 1 $70,000
COMMUNITY SER. PKCENTRAL 8063 2010 TRACTOR SNOWPLOW KUBOTA 0 0 1 1 1 1 1 1 1 1 $70,000
COMMUNITY SER. PKWEST 8064 2010 TRACTOR SNOWPLOW KUBOTA 0 0 1 1 1 1 1 1 1 1 $70,000
COMMUNITY SER. PKWEST 8065 2010 TRACTOR SNOWPLOW KUBOTA 0 0 1 1 1 1 1 1 1 1 $70,000
COMMUNITY SER. PKWEST 8066 2010 TRACTOR SNOWPLOW KUBOTA 0 0 1 1 1 1 1 1 1 1 $70,000
COMMUNITY SER. PKWEST 8067 2010 TRACTOR SNOWPLOW KUBOTA 0 0 1 1 1 1 1 1 1 1 $70,000
COMMUNITY SER. PKWEST 8068 2010 TRACTOR SNOWPLOW KUBOTA 0 0 1 1 1 1 1 1 1 1 $70,000
COMMUNITY SER. PKWEST 8069 2010 TRACTOR SNOWPLOW KUBOTA 0 0 1 1 1 1 1 1 1 1 $70,000
COMMUNITY SER. PKCENTRAL 12505 2016 PICKUP 1/2 TON 4X2 CREW CAB 0 0 0 0 0 0 0 0 1 1 $40,000
COMMUNITY SER. FORESTRY 12513 2016 PICKUP 1/2 TON 4X2 CREW CAB 0 0 0 0 0 0 0 0 1 1 $40,000
COMMUNITY SER. FORESTRY 12514 2016 PICKUP 1/2 TON 4X4 CREW CAB 0 0 0 0 0 0 0 0 1 1 $42,000
COMMUNITY SER. PKWEST 13500 2016 PICKUP 3/4 TON 4X4 CREW CAB 0 0 0 0 0 0 0 0 1 1 $42,000
COMMUNITY SER. PKCENTRAL 13501 2016 PICKUP 3/4 TON 4X4 CREW CAB 0 0 0 0 0 0 0 0 1 1 $42,000
COMMUNITY SER. PKEAST 13502 2016 PICKUP 3/4 TON 4X4 CREW CAB 0 0 0 0 0 0 0 0 1 1 $42,000
COMMUNITY SER. PKEAST 13503 2016 PICKUP 3/4 TON 4X4 CREW CAB 0 0 0 0 0 0 0 0 1 1 $42,000
COMMUNITY SER. PKWEST 13504 2016 PICKUP 3/4 TON 4X4 CREW CAB 0 0 0 0 0 0 0 0 1 1 $42,000
COMMUNITY SER. PKCENTRAL 13505 2016 PICKUP 3/4 TON 4X4 CREW CAB 0 0 0 0 0 0 0 0 1 1 $42,000
COMMUNITY SER. PKWEST 13506 2016 PICKUP 3/4 TON 4X4 CREW CAB 0 0 0 0 0 0 0 0 1 1 $42,000
COMMUNITY SER. PKWEST 13507 2016 PICKUP 3/4 TON 4X4 CREW CAB 0 0 0 0 0 0 0 0 1 1 $42,000
COMMUNITY SER. PKEAST 13508 2016 PICKUP 3/4 TON 4X4 CREW CAB 0 0 0 0 0 0 0 0 1 1 $42,000
COMMUNITY SER. PKCONTRACTS 13509 2016 PICKUP 3/4 TON 4X4 CREW CAB 0 0 0 0 0 0 0 0 1 1 $42,000
COMMUNITY SER. FORESTRY 13511 2016 PICKUP 3/4 TON W/PLOW 0 0 0 0 0 0 0 0 1 1 $55,000
COMMUNITY SER. PKWEST 13514 2017 PICKUP 3/4 TON 4X4 CREW CAB 0 0 0 0 0 0 0 0 1 1 $42,000
COMMUNITY SER. FORESTRY 21000 2014 BUCKET TRUCK W/CHIPPER BODY 0 0 0 0 0 0 0 0 1 1 $280,000
COMMUNITY SER. PKCENTRAL 35000 2015 MOWER 10' WINGED JACOBSEN 0 0 0 0 0 0 0 1 1 1 $70,000
COMMUNITY SER. PKCENTRAL 35001 2015 MOWER 10' WINGED JACOBSEN 0 0 0 0 0 0 0 1 1 1 $70,000
COMMUNITY SER. PKEAST 35002 2015 MOWER 10' WINGED JACOBSEN 0 0 0 0 0 0 0 1 1 1 $70,000
COMMUNITY SER. PKWEST 35003 2015 MOWER 10' WINGED JACOBSEN 0 0 0 0 0 0 0 1 1 1 $70,000
COMMUNITY SER. PKWEST 36000 2015 MOWER 16' WINGED JACOBSEN 0 0 0 0 0 0 0 1 1 1 $130,000
COMMUNITY SER. PKCENTRAL 36001 2015 MOWER 16' WINGED JACOBSEN 0 0 0 0 0 0 0 1 1 1 $130,000
COMMUNITY SER. PKEAST 36002 2015 MOWER 16' WINGED JACOBSEN 0 0 0 0 0 0 0 1 1 1 $130,000
COMMUNITY SER. PKEAST 36003 2015 MOWER 16' WINGED JACOBSEN 0 0 0 0 0 0 0 1 1 1 $130,000
COMMUNITY SER. PKCENTRAL 37000 2015 MOWER ZERO TURN 0 0 0 0 0 0 0 1 1 1 $15,000
COMMUNITY SER. PKEAST 37001 2015 MOWER ZERO TURN 0 0 0 0 0 0 0 1 1 1 $15,000
COMMUNITY SER. PKWEST 37002 2015 MOWER ZERO TURN 0 0 0 0 0 0 0 1 1 1 $15,000
COMMUNITY SER. PKCENTRAL 37003 2015 MOWER ZERO TURN 0 0 0 0 0 0 0 1 1 1 $15,000
COMMUNITY SER. PKEAST 37004 2015 MOWER ZERO TURN 0 0 0 0 0 0 0 1 1 1 $15,000
COMMUNITY SER. PKWEST 37005 2015 MOWER ZERO TURN 0 0 0 0 0 0 0 1 1 1 $15,000
COMMUNITY SER. PKWEST 37006 2015 MOWER ZERO TURN 0 0 0 0 0 0 0 1 1 1 $15,000
COMMUNITY SER. PKCONTRACTS 37007 2017 MOWER ZERO TURN 0 0 0 0 0 0 0 0 0 1 $15,000
COMMUNITY SER. PKCONTRACTS 37008 2017 MOWER ZERO TURN 0 0 0 0 0 0 0 0 0 1 $15,000
COMMUNITY SER. PKWEST 40000 2014 BLOWER HAND HELD STIHL 0 0 0 0 0 0 1 1 1 1 $458
COMMUNITY SERVICES
Total Number of Vehicles
APPENDIX ETABLE 1 - PAGE 79
CITY OF VAUGHANINVENTORY OF CAPITAL ASSETS
CITY FLEET: NON-ROADS DEPARTMENT
HEMSON
HEMSON
194

Non-Roads Inventory Model UNIT COST
Department Division Number Year Description 2008 2009 2010 2011 2012 2013 2014 2015 2016 2017 ($/Vehicle)
COMMUNITY SER. PKWEST 40001 2014 BLOWER HAND HELD STIHL 0 0 0 0 0 0 1 1 1 1 $458
COMMUNITY SER. FORESTRY 40002 2015 POLE SAW PRUNER TELESCOPIC STIHL 0 0 0 0 0 0 0 1 1 1 $553
COMMUNITY SER. FORESTRY 40003 2015 POLE SAW PRUNER TELESCOPIC STIHL 0 0 0 0 0 0 0 1 1 1 $553
COMMUNITY SER. FORESTRY 40004 2015 POLE SAW PRUNER TELESCOPIC STIHL 0 0 0 0 0 0 0 1 1 1 $553
COMMUNITY SER. FORESTRY 40005 2015 POLE SAW PRUNER TELESCOPIC STIHL 0 0 0 0 0 0 0 1 1 1 $553
COMMUNITY SER. FORESTRY 40006 2015 POLE SAW PRUNER TELESCOPIC STIHL 0 0 0 0 0 0 0 1 1 1 $516
COMMUNITY SER. FORESTRY 40007 2015 POLE SAW PRUNER TELESCOPIC STIHL 0 0 0 0 0 0 0 1 1 1 $516
COMMUNITY SER. FORESTRY 40008 2015 POLE SAW PRUNER TELESCOPIC STIHL 0 0 0 0 0 0 0 1 1 1 $516
COMMUNITY SER. FORESTRY 40009 2015 POLE SAW PRUNER TELESCOPIC STIHL 0 0 0 0 0 0 0 1 1 1 $516
COMMUNITY SER. PKCONTRACTS 40011 2015 BLOWER SNOW TORO 2015 0 0 0 0 0 0 0 1 1 1 $571
COMMUNITY SER. PKCONTRACTS 40012 2015 BLOWER SNOW TORO 2015 0 0 0 0 0 0 0 1 1 1 $571
COMMUNITY SER. PKCONTRACTS 40013 2015 BLOWER SNOW TORO 2015 0 0 0 0 0 0 0 1 1 1 $571
COMMUNITY SER. PKCONTRACTS 40014 2015 BLOWER SNOW TORO 2015 0 0 0 0 0 0 0 1 1 1 $571
COMMUNITY SER. PKCONTRACTS 40015 2015 BLOWER SNOW TORO 2015 0 0 0 0 0 0 0 1 1 1 $571
COMMUNITY SER. PKCONTRACTS 40016 2015 BLOWER SNOW TORO 2015 0 0 0 0 0 0 0 1 1 1 $571
COMMUNITY SER. FORESTRY 40017 2015 POLE SAW PRUNER TELESCOPIC STIHL 0 0 0 0 0 0 0 1 1 1 $585
COMMUNITY SER. FORESTRY 40018 2015 BLOWER HAND HELD STIHL 0 0 0 0 0 0 0 1 1 1 $233
COMMUNITY SER. FORESTRY 40019 2015 CHAIN SAW STIHL 0 0 0 0 0 0 0 1 1 1 $676
COMMUNITY SER. PKEAST 40020 2015 TRIMMER LINE STIHL 0 0 0 0 0 0 0 1 1 1 $385
COMMUNITY SER. PKEAST 40021 2015 TRIMMER LINE STIHL 0 0 0 0 0 0 0 1 1 1 $385
COMMUNITY SER. PKCENTRAL 40022 2015 TRIMMER LINE STIHL 0 0 0 0 0 0 0 1 1 1 $385
COMMUNITY SER. PKCENTRAL 40023 2015 TRIMMER LINE STIHL 0 0 0 0 0 0 0 1 1 1 $385
COMMUNITY SER. PKWEST 40024 2015 TRIMMER LINE STIHL 0 0 0 0 0 0 0 1 1 1 $385
COMMUNITY SER. PKCENTRAL 40025 2015 TRIMMER LINE STIHL 0 0 0 0 0 0 0 1 1 1 $385
COMMUNITY SER. PKEAST 40026 2015 TRIMMER LINE STIHL 0 0 0 0 0 0 0 1 1 1 $385
COMMUNITY SER. PKCENTRAL 40027 2015 TRIMMER LINE STIHL 0 0 0 0 0 0 0 1 1 1 $385
COMMUNITY SER. PKCONTRACTS 40028 2015 TRIMMER LINE STIHL 0 0 0 0 0 0 0 1 1 1 $406
COMMUNITY SER. PKCONTRACTS 40029 2015 TRIMMER LINE STIHL 0 0 0 0 0 0 0 1 1 1 $406
COMMUNITY SER. PKCONTRACTS 40030 2015 TRIMMR HEDGE STIHL 0 0 0 0 0 0 0 1 1 1 $375
COMMUNITY SER. PKCONTRACTS 40031 2015 TRIMMER BIKE STIHL 0 0 0 0 0 0 0 1 1 1 $539
COMMUNITY SER. PKCONTRACTS 40032 2015 BLOWER BACKPACK STIHL 0 0 0 0 0 0 0 1 1 1 $515
COMMUNITY SER. PKHORT 40033 2015 POLE PRUNER REDMAX 0 0 0 0 0 0 0 1 1 1 $770
COMMUNITY SER. PKHORT 40034 2015 POLE PRUNER REDMAX 0 0 0 0 0 0 0 1 1 1 $770
COMMUNITY SER. PKHORT 40035 2015 POLE PRUNER REDMAX 0 0 0 0 0 0 0 1 1 1 $770
COMMUNITY SER. PKHORT 40036 2015 POLE PRUNER REDMAX 0 0 0 0 0 0 0 1 1 1 $770
COMMUNITY SER. PKCONTRACTS 40037 2015 GENERATOR HONDA 0 0 0 0 0 0 0 1 1 1 $2,496
COMMUNITY SER. PKCONTRACTS 40038 2015 GENERATOR HONDA 0 0 0 0 0 0 0 1 1 1 $1,857
COMMUNITY SER. PKWEST 40039 2016 BLOWER BACKPACK STIHL 0 0 0 0 0 0 0 0 1 1 $514
COMMUNITY SER. PKCENTRAL 40040 2016 BLOWER BACKPACK STIHL 0 0 0 0 0 0 0 0 1 1 $514
COMMUNITY SER. PKEAST 40041 2016 CHAIN SAW STIHL 0 0 0 0 0 0 0 0 1 1 $349
COMMUNITY SER. PKWEST 40042 2014 GROOMER 0 0 0 0 0 0 1 1 1 1 $6,288
COMMUNITY SER. PKWEST 40046 2016 TRIMMER LINE STIHL 0 0 0 0 0 0 0 0 1 1 $382
COMMUNITY SER. PKEAST 40047 2016 TRIMMER LINE STIHL 0 0 0 0 0 0 0 0 1 1 $382
Total Number of Vehicles
APPENDIX ETABLE 1 - PAGE 80
CITY OF VAUGHANINVENTORY OF CAPITAL ASSETS
CITY FLEET: NON-ROADS DEPARTMENTCOMMUNITY SERVICES
HEMSON
HEMSON
195
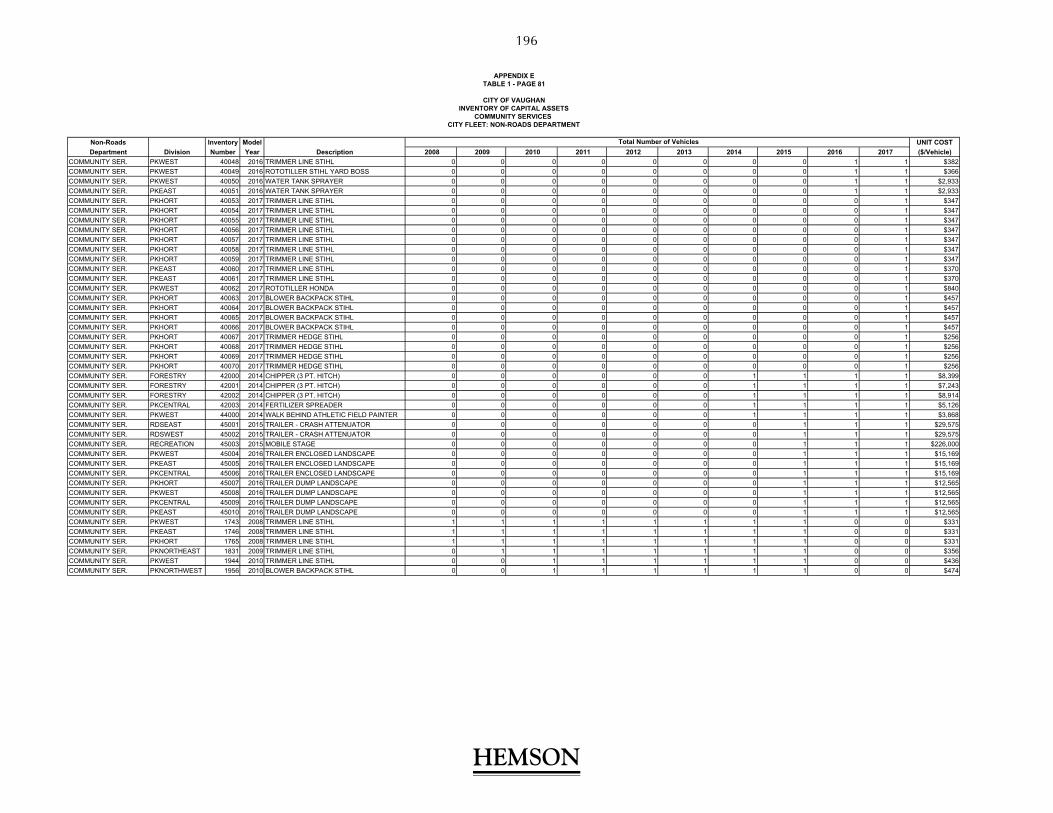
Non-Roads Inventory Model UNIT COST
Department Division Number Year Description 2008 2009 2010 2011 2012 2013 2014 2015 2016 2017 ($/Vehicle)
COMMUNITY SER. PKWEST 40048 2016 TRIMMER LINE STIHL 0 0 0 0 0 0 0 0 1 1 $382
COMMUNITY SER. PKWEST 40049 2016 ROTOTILLER STIHL YARD BOSS 0 0 0 0 0 0 0 0 1 1 $366
COMMUNITY SER. PKWEST 40050 2016 WATER TANK SPRAYER 0 0 0 0 0 0 0 0 1 1 $2,933
COMMUNITY SER. PKEAST 40051 2016 WATER TANK SPRAYER 0 0 0 0 0 0 0 0 1 1 $2,933
COMMUNITY SER. PKHORT 40053 2017 TRIMMER LINE STIHL 0 0 0 0 0 0 0 0 0 1 $347
COMMUNITY SER. PKHORT 40054 2017 TRIMMER LINE STIHL 0 0 0 0 0 0 0 0 0 1 $347
COMMUNITY SER. PKHORT 40055 2017 TRIMMER LINE STIHL 0 0 0 0 0 0 0 0 0 1 $347
COMMUNITY SER. PKHORT 40056 2017 TRIMMER LINE STIHL 0 0 0 0 0 0 0 0 0 1 $347
COMMUNITY SER. PKHORT 40057 2017 TRIMMER LINE STIHL 0 0 0 0 0 0 0 0 0 1 $347
COMMUNITY SER. PKHORT 40058 2017 TRIMMER LINE STIHL 0 0 0 0 0 0 0 0 0 1 $347
COMMUNITY SER. PKHORT 40059 2017 TRIMMER LINE STIHL 0 0 0 0 0 0 0 0 0 1 $347
COMMUNITY SER. PKEAST 40060 2017 TRIMMER LINE STIHL 0 0 0 0 0 0 0 0 0 1 $370
COMMUNITY SER. PKEAST 40061 2017 TRIMMER LINE STIHL 0 0 0 0 0 0 0 0 0 1 $370
COMMUNITY SER. PKWEST 40062 2017 ROTOTILLER HONDA 0 0 0 0 0 0 0 0 0 1 $840
COMMUNITY SER. PKHORT 40063 2017 BLOWER BACKPACK STIHL 0 0 0 0 0 0 0 0 0 1 $457
COMMUNITY SER. PKHORT 40064 2017 BLOWER BACKPACK STIHL 0 0 0 0 0 0 0 0 0 1 $457
COMMUNITY SER. PKHORT 40065 2017 BLOWER BACKPACK STIHL 0 0 0 0 0 0 0 0 0 1 $457
COMMUNITY SER. PKHORT 40066 2017 BLOWER BACKPACK STIHL 0 0 0 0 0 0 0 0 0 1 $457
COMMUNITY SER. PKHORT 40067 2017 TRIMMER HEDGE STIHL 0 0 0 0 0 0 0 0 0 1 $256
COMMUNITY SER. PKHORT 40068 2017 TRIMMER HEDGE STIHL 0 0 0 0 0 0 0 0 0 1 $256
COMMUNITY SER. PKHORT 40069 2017 TRIMMER HEDGE STIHL 0 0 0 0 0 0 0 0 0 1 $256
COMMUNITY SER. PKHORT 40070 2017 TRIMMER HEDGE STIHL 0 0 0 0 0 0 0 0 0 1 $256
COMMUNITY SER. FORESTRY 42000 2014 CHIPPER (3 PT. HITCH) 0 0 0 0 0 0 1 1 1 1 $8,399
COMMUNITY SER. FORESTRY 42001 2014 CHIPPER (3 PT. HITCH) 0 0 0 0 0 0 1 1 1 1 $7,243
COMMUNITY SER. FORESTRY 42002 2014 CHIPPER (3 PT. HITCH) 0 0 0 0 0 0 1 1 1 1 $8,914
COMMUNITY SER. PKCENTRAL 42003 2014 FERTILIZER SPREADER 0 0 0 0 0 0 1 1 1 1 $5,126
COMMUNITY SER. PKWEST 44000 2014 WALK BEHIND ATHLETIC FIELD PAINTER 0 0 0 0 0 0 1 1 1 1 $3,868
COMMUNITY SER. RDSEAST 45001 2015 TRAILER - CRASH ATTENUATOR 0 0 0 0 0 0 0 1 1 1 $29,575
COMMUNITY SER. RDSWEST 45002 2015 TRAILER - CRASH ATTENUATOR 0 0 0 0 0 0 0 1 1 1 $29,575
COMMUNITY SER. RECREATION 45003 2015 MOBILE STAGE 0 0 0 0 0 0 0 1 1 1 $226,000
COMMUNITY SER. PKWEST 45004 2016 TRAILER ENCLOSED LANDSCAPE 0 0 0 0 0 0 0 1 1 1 $15,169
COMMUNITY SER. PKEAST 45005 2016 TRAILER ENCLOSED LANDSCAPE 0 0 0 0 0 0 0 1 1 1 $15,169
COMMUNITY SER. PKCENTRAL 45006 2016 TRAILER ENCLOSED LANDSCAPE 0 0 0 0 0 0 0 1 1 1 $15,169
COMMUNITY SER. PKHORT 45007 2016 TRAILER DUMP LANDSCAPE 0 0 0 0 0 0 0 1 1 1 $12,565
COMMUNITY SER. PKWEST 45008 2016 TRAILER DUMP LANDSCAPE 0 0 0 0 0 0 0 1 1 1 $12,565
COMMUNITY SER. PKCENTRAL 45009 2016 TRAILER DUMP LANDSCAPE 0 0 0 0 0 0 0 1 1 1 $12,565
COMMUNITY SER. PKEAST 45010 2016 TRAILER DUMP LANDSCAPE 0 0 0 0 0 0 0 1 1 1 $12,565
COMMUNITY SER. PKWEST 1743 2008 TRIMMER LINE STIHL 1 1 1 1 1 1 1 1 0 0 $331
COMMUNITY SER. PKEAST 1746 2008 TRIMMER LINE STIHL 1 1 1 1 1 1 1 1 0 0 $331
COMMUNITY SER. PKHORT 1765 2008 TRIMMER LINE STIHL 1 1 1 1 1 1 1 1 0 0 $331
COMMUNITY SER. PKNORTHEAST 1831 2009 TRIMMER LINE STIHL 0 1 1 1 1 1 1 1 0 0 $356
COMMUNITY SER. PKWEST 1944 2010 TRIMMER LINE STIHL 0 0 1 1 1 1 1 1 0 0 $436
COMMUNITY SER. PKNORTHWEST 1956 2010 BLOWER BACKPACK STIHL 0 0 1 1 1 1 1 1 0 0 $474
COMMUNITY SERVICES
Total Number of Vehicles
TABLE 1 - PAGE 81
CITY OF VAUGHANINVENTORY OF CAPITAL ASSETS
CITY FLEET: NON-ROADS DEPARTMENT
APPENDIX E
HEMSON
HEMSON
196

Non-Roads Inventory Model UNIT COST
Department Division Number Year Description 2008 2009 2010 2011 2012 2013 2014 2015 2016 2017 ($/Vehicle)
COMMUNITY SER. PKWEST 2114 2012 TRIMMER LINE STIHL 0 0 0 0 1 1 1 0 0 0 $359
COMMUNITY SER. PKEAST 2117 2012 TRIMMER LINE STIHL 0 0 0 0 1 1 1 1 0 0 $359
COMMUNITY SER. PKNORTHWEST 2122 2012 TRIMMER LINE STIHL 0 0 0 0 1 1 1 1 0 0 $359
COMMUNITY SER. PKNORTHWEST 2132 2012 TRIMMER LINE STIHL 0 0 0 0 1 1 1 0 0 0 $359
COMMUNITY SER. PKWEST 2160 2012 ROTOTILLER STIHL YARD BOSS 0 0 0 0 1 1 1 1 0 0 $375
COMMUNITY SER. PKHORT 2178 2012 TRIMMER LINE STIHL 0 0 0 0 1 1 1 1 0 0 $356
COMMUNITY SER. PKWEST 2293 2013 TRIMMER LINE STIHL 0 0 0 0 0 1 1 1 0 0 $352
COMMUNITY SER. FORESTRY 2316 2014 POLE SAW PRUNER TELESCOPIC STIHL 0 0 0 0 0 0 1 1 0 0 $711
COMMUNITY SER. FORESTRY 1379 2003 BLOWER HAND STIHL 1 1 1 1 1 1 1 0 0 0 $844
COMMUNITY SER. PKWEST 1567 2005 BLOWER SNOW TORO 2005 1 1 1 1 1 1 1 0 0 0 $1,395
COMMUNITY SER. PKEAST 1568 2005 BLOWER SNOW TORO 2005 1 1 1 1 1 1 1 0 0 0 $1,395
COMMUNITY SER. PKEAST 1611 2006 TRIMMER LINE STIHL 1 1 1 1 1 1 1 0 0 0 $459
COMMUNITY SER. PKEAST 1688 2007 TRIMMER LINE ECHO 1 1 1 1 1 1 1 0 0 0 $388
COMMUNITY SER. PKHORT 1739 2008 ROTOTILLER HONDA 1 1 1 1 1 1 1 0 0 0 $430
COMMUNITY SER. PKEAST 1747 2008 TRIMMER LINE STIHL 1 1 1 1 1 1 1 0 0 0 $331
COMMUNITY SER. PKEAST 1748 2008 TRIMMER LINE STIHL 1 1 1 1 1 1 1 0 0 0 $331
COMMUNITY SER. PKNORTHWEST 1755 2008 TRIMMER LINE STIHL 1 1 1 1 1 1 1 0 0 0 $331
COMMUNITY SER. PKWEST 1762 2008 BLOWER BACKPACK STIHL 1 1 1 1 1 1 1 0 0 0 $393
COMMUNITY SER. PKEAST 1864 2009 TRIMMER HEDGE STIHL 0 1 1 1 1 1 1 0 0 0 $521
COMMUNITY SER. PKEAST 1945 2010 TRIMMER LINE STIHL 0 0 1 1 1 1 1 0 0 0 $436
COMMUNITY SER. PKNORTHEAST 1967 2010 TRIMMER LINE 0 0 1 1 1 1 1 0 0 0 $375
COMMUNITY SER. PKNORTHWEST 1986 2010 TRIMMER HEDGE STIHL 0 0 1 1 1 1 1 0 0 0 $520
COMMUNITY SER. PKNORTHEAST 2123 2012 TRIMMER LINE STIHL 0 0 0 0 1 1 1 0 0 0 $359
COMMUNITY SER. PKNORTHWEST 2132 2013 TRIMMER LINE STIHL 0 0 0 0 1 1 1 0 0 0 $359
COMMUNITY SER. FORESTRY 2185 2012 POLE SAW PRUNER TELESCOPIC STIHL 0 0 0 0 1 1 1 0 0 0 $558
COMMUNITY SER. FORESTRY 2230 2013 POLE SAW PRUNER TELESCOPIC STIHL 0 0 0 0 0 1 1 0 0 0 $585
COMMUNITY SER. PKWEST 2231 2013 POLE SAW PRUNER TELESCOPIC STIHL 0 0 0 0 0 1 1 0 0 0 $585
COMMUNITY SER. FORESTRY 2315 2014 POLE SAW PRUNER TELESCOPIC STIHL 0 0 0 0 0 0 1 0 0 0 $711
COMMUNITY SER. FORESTRY 2317 2014 POLE SAW PRUNER TELESCOPIC STIHL 0 0 0 0 0 0 1 0 0 0 $711
COMMUNITY SER. FORESTRY 2138 2014 POLE SAW PRUNER TELESCOPIC STIHL 0 0 0 0 0 0 1 0 0 0 $359
COMMUNITY SER. FORESTRY 2319 2014 POLE SAW PRUNER TELESCOPIC STIHL 0 0 0 0 0 0 1 0 0 0 $711
COMMUNITY SER. FORESTRY 2335 2013 POLE SAW PRUNER TELESCOPIC STIHL 0 0 0 0 0 1 1 0 0 0 $774
COMMUNITY SER. FORESTRY 2339 2013 POLE SAW PRUNER TELESCOPIC STIHL 0 0 0 0 0 1 1 0 0 0 $774
COMMUNITY SER. PKNORTHWEST 2349 2013 FLAIL ATTACHMENT 0 0 0 0 0 0 1 0 0 0 $14,775
COMMUNITY SER. PKWEST 2350 2013 FLAIL ATTACHMENT 0 0 0 0 0 0 1 0 0 0 $14,775
COMMUNITY SER. PKEAST 1292 2001 BLOWER SNOW HOLDER 2001 1 1 1 1 1 1 0 0 0 0 $8,099
COMMUNITY SER. PKEAST 1293 2001 BLOWER SNOW HOLDER 2001 1 1 1 1 1 1 0 0 0 0 $8,099
COMMUNITY SER. PKWEST 1294 2001 BLOWER SNOW HOLDER 2001 1 1 1 1 1 1 0 0 0 0 $8,099
COMMUNITY SER. PKNORTHWEST 1538 2005 BLOWER STIHL 2005 1 1 1 1 1 1 0 0 0 0 $634
COMMUNITY SER. PKHORT 1625 2006 TRIMMER LINE STIHL 1 1 1 1 1 1 0 0 0 0 $459
COMMUNITY SER. FORESTRY 1654 2006 BLOWER HANDHELD STIHL 2006 1 1 1 1 0 0 0 0 0 0 $320
COMMUNITY SER. PKNORTHWEST 1694 2007 TRIMMER LINE ECHO 1 1 1 1 1 1 0 0 0 0 $388
COMMUNITY SER. PKWEST 1740 2008 TRIMMER LINE STIHL 1 1 1 1 1 1 0 0 0 0 $331
COMMUNITY SERVICES
CITY OF VAUGHANINVENTORY OF CAPITAL ASSETS
Total Number of Vehicles
CITY FLEET: NON-ROADS DEPARTMENT
APPENDIX ETABLE 1 - PAGE 82
HEMSON
HEMSON
197

Non-Roads Inventory Model UNIT COST
Department Division Number Year Description 2008 2009 2010 2011 2012 2013 2014 2015 2016 2017 ($/Vehicle)
COMMUNITY SER. PKNORTHEAST 1753 2008 TRIMMER LINE STIHL 1 1 1 1 1 1 0 0 0 0 $331
COMMUNITY SER. PKNORTHEAST 1968 2010 TRIMMER LINE 1 1 1 1 1 1 0 0 0 0 $375
COMMUNITY SER. FORESTRY 2171 2012 POLE SAW PRUNER TELESCOPIC STIHL 0 0 0 0 1 1 0 0 0 0 $558
COMMUNITY SER. PKWEST 1695 2007 TRIMMER LINE ECHO 1 1 1 1 1 0 0 0 0 0 $388
COMMUNITY SER. PKNORTHEAST 1925 2010 BLOWER BACKPACK STIHL 0 0 1 1 1 0 0 0 0 0 $474
COMMUNITY SER. PKHORT 1929 2010 ROTOTILLER YARDBOSS 0 0 1 1 1 0 0 0 0 0 $395
COMMUNITY SER. PKNORTHWEST 1987 2010 TRIMMER HEDGE STIHL 0 0 1 1 1 0 0 0 0 0 $520
COMMUNITY SER. PKWEST 2134 2012 TRIMMER LINE STIHL 0 0 0 0 1 0 0 0 0 0 $359
COMMUNITY SER. FORESTRY 2170 2012 POLE SAW PRUNER TELESCOPIC STIHL 0 0 0 0 1 0 0 0 0 0 $596
COMMUNITY SER. PKWEST 1384 2003 BLOWER BACKPACK STIHL 1 1 1 1 0 0 0 0 0 0 $636
COMMUNITY SER. PKEAST 1386 2003 BLOWER BACKPACK STIHL 1 1 1 1 0 0 0 0 0 0 $636
COMMUNITY SER. PKWEST 1403 2003 BLOWER BACKPACK STIHL 2003 1 1 1 1 0 0 0 0 0 0 $844
COMMUNITY SER. PKEAST 1540 2005 TRIMMER LINE HONDA 2005 1 1 1 1 0 0 0 0 0 0 $486
COMMUNITY SER. PKWEST 1615 2006 TRIMMER LINE STIHL 1 1 1 1 0 0 0 0 0 0 $459
COMMUNITY SER. PKWEST 1616 2006 TRIMMER LINE STIHL 1 1 1 1 0 0 0 0 0 0 $459
COMMUNITY SER. PKWEST 1618 2006 TRIMMER LINE STIHL 1 1 1 1 0 0 0 0 0 0 $459
COMMUNITY SER. PKEAST 1651 2006 TRIMMER LINE STIHL 2006 1 1 1 1 0 0 0 0 0 0 $459
COMMUNITY SER. PKWEST 1653 2006 TRIMMER LINE STIHL 2006 1 1 1 1 0 0 0 0 0 0 $459
COMMUNITY SER. PKWEST 1697 2001 TRIMMER LINE ECHO 1 1 1 1 0 0 0 0 0 0 $437
COMMUNITY SER. PKNORTHWEST 1754 2008 TRIMMER LINE STIHL 1 1 1 1 0 0 0 0 0 0 $331
COMMUNITY SER. PKNORTHEAST 1756 2008 TRIMMER LINE STIHL 1 1 1 1 0 0 0 0 0 0 $331
COMMUNITY SER. PKNORTHWEST 1757 2008 TRIMMER LINE STIHL 1 1 1 1 0 0 0 0 0 0 $331
COMMUNITY SER. PKNORTHWEST 1766 2008 TRIMMER LINE STIHL 1 1 1 1 0 0 0 0 0 0 $331
COMMUNITY SER. PKEAST 1767 2008 TRIMMER LINE STIHL 1 1 1 1 0 0 0 0 0 0 $331
COMMUNITY SER. PKNORTHEAST 1768 2008 TRIMMER LINE STIHL 1 1 1 1 0 0 0 0 0 0 $331
COMMUNITY SER. PKNORTHWEST 1769 2008 TRIMMER LINE STIHL 1 1 1 1 0 0 0 0 0 0 $331
COMMUNITY SER. PKHORT 1779 2008 ROTOTILLER HONDA 1 1 1 1 0 0 0 0 0 0 $596
COMMUNITY SER. PKWEST 1833 2009 TRIMMER LINE STIHL 0 1 1 1 0 0 0 0 0 0 $356
COMMUNITY SER. PKNORTHEAST 1937 2010 ROTOTILLER HONDA 0 0 1 1 0 0 0 0 0 0 $610
COMMUNITY SER. PKEAST 1612 2006 TRIMMER LINE STIHL 1 1 1 0 0 0 0 0 0 0 $459
COMMUNITY SER. PKNORTHWEST 1622 2006 TRIMMER LINE STIHL 1 1 1 0 0 0 0 0 0 0 $459
COMMUNITY SER. PKNORTH 1623 2006 TRIMMER LINE STIHL 1 1 0 0 0 0 0 0 0 0 $459
COMMUNITY SER. PKWEST 1696 2007 TRIMMER LINE ECHO 1 1 1 0 0 0 0 0 0 0 $388
COMMUNITY SER. PKWEST 1698 2007 TRIMMER LINE ECHO 1 1 1 0 0 0 0 0 0 0 $388
COMMUNITY SER. PKWEST 1734 2008 TRIMMER LINE STIHL 1 1 1 0 0 0 0 0 0 0 $349
COMMUNITY SER. PKNORTHWEST 1752 2008 TRIMMER LINE STIHL 1 1 1 0 0 0 0 0 0 0 $331
COMMUNITY SER. PKHORT 1778 2008 ROTOTILLER HONDA 1 1 1 0 0 0 0 0 0 0 $596
COMMUNITY SER. PKWEST 1793 2008 TRIMMER HEDGE STIHL 1 1 1 0 0 0 0 0 0 0 $344
COMMUNITY SER. PKNORTHWEST 1835 2009 ROTOTILLER HONDA 0 1 1 0 0 0 0 0 0 0 $585
COMMUNITY SER. PKNORTHEAST 1936 2010 ROTOTILLER HONDA 0 0 1 0 0 0 0 0 0 0 $610
COMMUNITY SER. FORESTRY 815 1999 CHAIN SAW STIHL 1 1 0 0 0 0 0 0 0 0 $807
COMMUNITY SER. PKWEST 928 1999 MOWER PUSH 1 1 0 0 0 0 0 0 0 0 $707
COMMUNITY SER. PKCENTRAL 948 1999 BLOWER SNOW TORO 1 1 0 0 0 0 0 0 0 0 $2,607
COMMUNITY SERVICES INVENTORY OF CAPITAL ASSETS
CITY FLEET: NON-ROADS DEPARTMENT
Total Number of Vehicles
APPENDIX ETABLE 1 - PAGE 83
CITY OF VAUGHAN
HEMSON
HEMSON
198
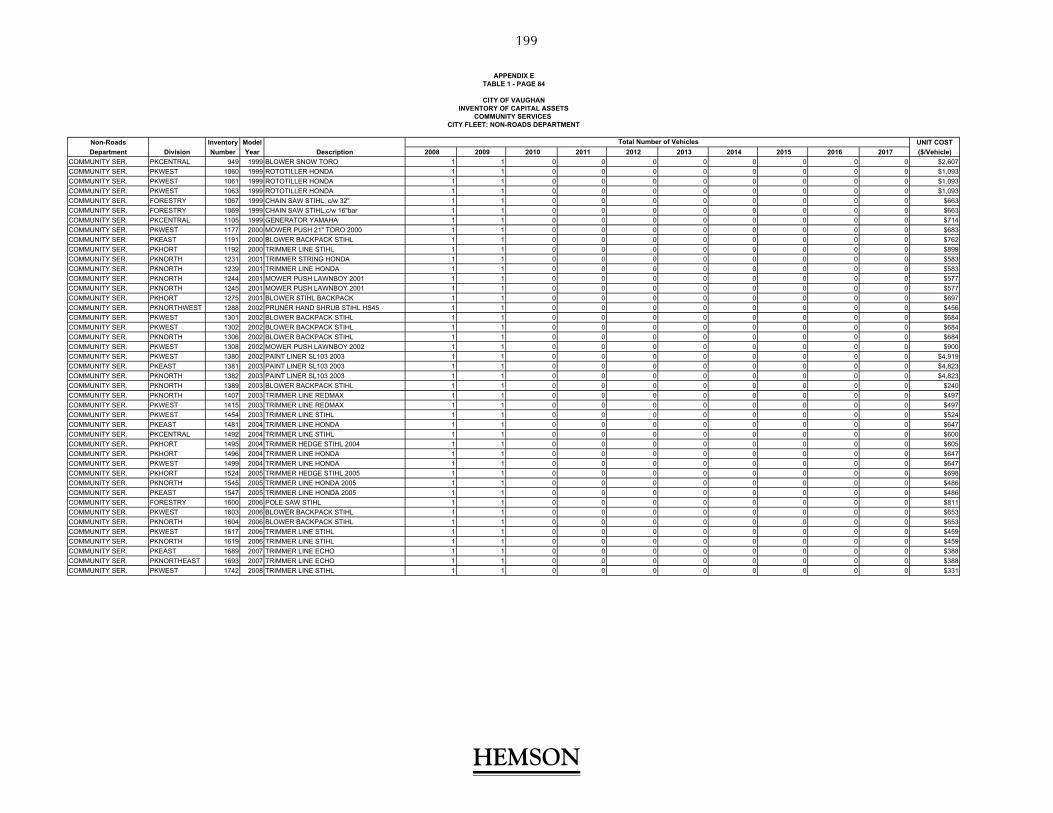
Non-Roads Inventory Model UNIT COST
Department Division Number Year Description 2008 2009 2010 2011 2012 2013 2014 2015 2016 2017 ($/Vehicle)
COMMUNITY SER. PKCENTRAL 949 1999 BLOWER SNOW TORO 1 1 0 0 0 0 0 0 0 0 $2,607
COMMUNITY SER. PKWEST 1060 1999 ROTOTILLER HONDA 1 1 0 0 0 0 0 0 0 0 $1,093
COMMUNITY SER. PKWEST 1061 1999 ROTOTILLER HONDA 1 1 0 0 0 0 0 0 0 0 $1,093
COMMUNITY SER. PKWEST 1063 1999 ROTOTILLER HONDA 1 1 0 0 0 0 0 0 0 0 $1,093
COMMUNITY SER. FORESTRY 1067 1999 CHAIN SAW STIHL, c/w 32" 1 1 0 0 0 0 0 0 0 0 $663
COMMUNITY SER. FORESTRY 1069 1999 CHAIN SAW STIHL,c/w 16"bar 1 1 0 0 0 0 0 0 0 0 $663
COMMUNITY SER. PKCENTRAL 1105 1999 GENERATOR YAMAHA 1 1 0 0 0 0 0 0 0 0 $714
COMMUNITY SER. PKWEST 1177 2000 MOWER PUSH 21" TORO 2000 1 1 0 0 0 0 0 0 0 0 $683
COMMUNITY SER. PKEAST 1191 2000 BLOWER BACKPACK STIHL 1 1 0 0 0 0 0 0 0 0 $762
COMMUNITY SER. PKHORT 1192 2000 TRIMMER LINE STIHL 1 1 0 0 0 0 0 0 0 0 $899
COMMUNITY SER. PKNORTH 1231 2001 TRIMMER STRING HONDA 1 1 0 0 0 0 0 0 0 0 $583
COMMUNITY SER. PKNORTH 1239 2001 TRIMMER LINE HONDA 1 1 0 0 0 0 0 0 0 0 $583
COMMUNITY SER. PKNORTH 1244 2001 MOWER PUSH LAWNBOY 2001 1 1 0 0 0 0 0 0 0 0 $577
COMMUNITY SER. PKNORTH 1245 2001 MOWER PUSH LAWNBOY 2001 1 1 0 0 0 0 0 0 0 0 $577
COMMUNITY SER. PKHORT 1275 2001 BLOWER STIHL BACKPACK 1 1 0 0 0 0 0 0 0 0 $697
COMMUNITY SER. PKNORTHWEST 1288 2002 PRUNER HAND SHRUB STIHL HS45 1 1 0 0 0 0 0 0 0 0 $456
COMMUNITY SER. PKWEST 1301 2002 BLOWER BACKPACK STIHL 1 1 0 0 0 0 0 0 0 0 $684
COMMUNITY SER. PKWEST 1302 2002 BLOWER BACKPACK STIHL 1 1 0 0 0 0 0 0 0 0 $684
COMMUNITY SER. PKNORTH 1306 2002 BLOWER BACKPACK STIHL 1 1 0 0 0 0 0 0 0 0 $684
COMMUNITY SER. PKWEST 1308 2002 MOWER PUSH LAWNBOY 2002 1 1 0 0 0 0 0 0 0 0 $900
COMMUNITY SER. PKWEST 1380 2002 PAINT LINER SL103 2003 1 1 0 0 0 0 0 0 0 0 $4,919
COMMUNITY SER. PKEAST 1381 2003 PAINT LINER SL103 2003 1 1 0 0 0 0 0 0 0 0 $4,823
COMMUNITY SER. PKNORTH 1382 2003 PAINT LINER SL103 2003 1 1 0 0 0 0 0 0 0 0 $4,823
COMMUNITY SER. PKNORTH 1389 2003 BLOWER BACKPACK STIHL 1 1 0 0 0 0 0 0 0 0 $240
COMMUNITY SER. PKNORTH 1407 2003 TRIMMER LINE REDMAX 1 1 0 0 0 0 0 0 0 0 $497
COMMUNITY SER. PKWEST 1415 2003 TRIMMER LINE REDMAX 1 1 0 0 0 0 0 0 0 0 $497
COMMUNITY SER. PKWEST 1454 2003 TRIMMER LINE STIHL 1 1 0 0 0 0 0 0 0 0 $524
COMMUNITY SER. PKEAST 1481 2004 TRIMMER LINE HONDA 1 1 0 0 0 0 0 0 0 0 $647
COMMUNITY SER. PKCENTRAL 1492 2004 TRIMMER LINE STIHL 1 1 0 0 0 0 0 0 0 0 $600
COMMUNITY SER. PKHORT 1495 2004 TRIMMER HEDGE STIHL 2004 1 1 0 0 0 0 0 0 0 0 $605
COMMUNITY SER. PKHORT 1496 2004 TRIMMER LINE HONDA 1 1 0 0 0 0 0 0 0 0 $647
COMMUNITY SER. PKWEST 1499 2004 TRIMMER LINE HONDA 1 1 0 0 0 0 0 0 0 0 $647
COMMUNITY SER. PKHORT 1524 2005 TRIMMER HEDGE STIHL 2005 1 1 0 0 0 0 0 0 0 0 $698
COMMUNITY SER. PKNORTH 1545 2005 TRIMMER LINE HONDA 2005 1 1 0 0 0 0 0 0 0 0 $486
COMMUNITY SER. PKEAST 1547 2005 TRIMMER LINE HONDA 2005 1 1 0 0 0 0 0 0 0 0 $486
COMMUNITY SER. FORESTRY 1600 2006 POLE SAW STIHL 1 1 0 0 0 0 0 0 0 0 $811
COMMUNITY SER. PKWEST 1603 2006 BLOWER BACKPACK STIHL 1 1 0 0 0 0 0 0 0 0 $653
COMMUNITY SER. PKNORTH 1604 2006 BLOWER BACKPACK STIHL 1 1 0 0 0 0 0 0 0 0 $653
COMMUNITY SER. PKWEST 1617 2006 TRIMMER LINE STIHL 1 1 0 0 0 0 0 0 0 0 $459
COMMUNITY SER. PKNORTH 1619 2006 TRIMMER LINE STIHL 1 1 0 0 0 0 0 0 0 0 $459
COMMUNITY SER. PKEAST 1689 2007 TRIMMER LINE ECHO 1 1 0 0 0 0 0 0 0 0 $388
COMMUNITY SER. PKNORTHEAST 1693 2007 TRIMMER LINE ECHO 1 1 0 0 0 0 0 0 0 0 $388
COMMUNITY SER. PKWEST 1742 2008 TRIMMER LINE STIHL 1 1 0 0 0 0 0 0 0 0 $331
COMMUNITY SERVICES
Total Number of Vehicles
APPENDIX ETABLE 1 - PAGE 84
CITY OF VAUGHANINVENTORY OF CAPITAL ASSETS
CITY FLEET: NON-ROADS DEPARTMENT
HEMSON
HEMSON
199

Non-Roads Inventory Model UNIT COST
Department Division Number Year Description 2008 2009 2010 2011 2012 2013 2014 2015 2016 2017 ($/Vehicle)
COMMUNITY SER. PKNORTHEAST 1760 2008 BLOWER BACKPACK STIHL 1 1 0 0 0 0 0 0 0 0 $393
COMMUNITY SER. PKNORTH 1777 2008 ROTOTILLER HONDA 1 1 0 0 0 0 0 0 0 0 $596
COMMUNITY SER. FORESTRY 1806 2009 POLE SAW STIHL 0 1 0 0 0 0 0 0 0 0 $601
COMMUNITY SER. PKNORTH 8018 2004 TRACTOR SNOWPLOW HOLDER 1 1 0 0 0 0 0 0 0 0 $80,000
COMMUNITY SER. PKCENTRAL 8019 2004 TRACTOR SNOWPLOW HOLDER 1 1 0 0 0 0 0 0 0 0 $80,000
COMMUNITY SER. PKWEST 8020 2004 TRACTOR SNOWPLOW HOLDER 1 1 0 0 0 0 0 0 0 0 $80,000
COMMUNITY SER. PKEAST 8021 2005 TRACTOR SNOWPLOW HOLDER 1 1 0 0 0 0 0 0 0 0 $80,000
COMMUNITY SER. PKEAST 8022 2005 TRACTOR SNOWPLOW HOLDER 1 1 0 0 0 0 0 0 0 0 $80,000
COMMUNITY SER. PKNORTH 8023 2005 TRACTOR SNOWPLOW HOLDER 1 1 0 0 0 0 0 0 0 0 $80,000
COMMUNITY SER. PKNORTH 8024 2005 TRACTOR SNOWPLOW HOLDER 1 1 0 0 0 0 0 0 0 0 $80,000
COMMUNITY SER. PKWEST 8025 2005 TRACTOR SNOWPLOW HOLDER 1 1 0 0 0 0 0 0 0 0 $80,000
COMMUNITY SER. PKWEST 8026 2005 TRACTOR SNOWPLOW HOLDER 1 1 0 0 0 0 0 0 0 0 $80,000
COMMUNITY SER. PKEAST 8027 2005 TRACTOR SNOWPLOW HOLDER 1 1 0 0 0 0 0 0 0 0 $80,000
COMMUNITY SER. PKEAST 8028 2005 TRACTOR SNOWPLOW HOLDER 1 1 0 0 0 0 0 0 0 0 $80,000
COMMUNITY SER. PKCENTRAL 8029 2005 TRACTOR SNOWPLOW HOLDER 1 1 0 0 0 0 0 0 0 0 $80,000
COMMUNITY SER. PKNORTH 8030 2005 TRACTOR SNOWPLOW HOLDER 1 1 0 0 0 0 0 0 0 0 $80,000
COMMUNITY SER. PKNORTH 8031 2005 TRACTOR SNOWPLOW HOLDER 1 1 0 0 0 0 0 0 0 0 $80,000
COMMUNITY SER. PKCENTRAL 8032 2005 TRACTOR SNOWPLOW HOLDER 1 1 0 0 0 0 0 0 0 0 $80,000
COMMUNITY SER. PKWEST 8033 2005 TRACTOR SNOWPLOW HOLDER 1 1 0 0 0 0 0 0 0 0 $80,000
COMMUNITY SER. PKCENTRAL 8034 2005 TRACTOR SNOWPLOW HOLDER 1 1 0 0 0 0 0 0 0 0 $80,000
COMMUNITY SER. PKCENTRAL 8035 2005 TRACTOR SNOWPLOW HOLDER 1 1 0 0 0 0 0 0 0 0 $80,000
COMMUNITY SER. PKWEST 625 1999 SWEEPER BROOM SWEEPSTER 1 0 0 0 0 0 0 0 0 0 $35,706
COMMUNITY SER. PKEAST 1122 1999 TRACTOR 1999 NEW HOLLAND 1 0 0 0 0 0 0 0 0 0 $49,989
COMMUNITY SER. PKEAST 1303 2002 BLOWER BACKPACK STIHL 1 0 0 0 0 0 0 0 0 0 $684
COMMUNITY SER. PKEAST 1304 2002 BLOWER BACKPACK STIHL 1 0 0 0 0 0 0 0 0 0 $684
COMMUNITY SER. PKWEST 1351 2002 MOWER OUTFRONT TORO 1 0 0 0 0 0 0 0 0 0 $23,138
COMMUNITY SER. FORESTRY 1376 2003 POLE SAW STIHL HT75 1 0 0 0 0 0 0 0 0 0 $924
COMMUNITY SER. PKNORTH 1383 2003 TRIMMER LINE BANNERMAN 1 0 0 0 0 0 0 0 0 0 $660
COMMUNITY SER. PKEAST 1387 2003 BLOWER BACKPACK STIHL 1 0 0 0 0 0 0 0 0 0 $240
COMMUNITY SER. PKWEST 1498 2004 TRIMMER LINE HONDA 1 0 0 0 0 0 0 0 0 0 $647
COMMUNITY SER. PKCENTRAL 1573 2006 GENERATOR HONDA 1 0 0 0 0 0 0 0 0 0 $1,242
COMMUNITY SER. PKEAST 1609 2006 TRIMMER LINE STIHL 1 0 0 0 0 0 0 0 0 0 $459
COMMUNITY SER. PKNORTH 1621 2006 TRIMMER LINE STIHL 1 0 0 0 0 0 0 0 0 0 $459
COMMUNITY SER. PKNORTH 1652 2006 TRIMMER LINE STIHL 2006 1 0 0 0 0 0 0 0 0 0 $459
COMMUNITY SER. PKCENTRAL 1662 2006 GENERATOR HONDA 2006 1 0 0 0 0 0 0 0 0 0 $1,417
COMMUNITY SER. PKNORTH 1691 2007 TRIMMER LINE EHCO 1 0 0 0 0 0 0 0 0 0 $388
COMMUNITY SER. PKNORTH 1692 2007 TRIMMER LINE ECHO 1 0 0 0 0 0 0 0 0 0 $388
COMMUNITY SER. PKEAST 1738 2008 TRIMMER LINE STIHL 1 0 0 0 0 0 0 0 0 0 $349
COMMUNITY SER. PKNORTH 1776 2008 ROTOTILLER HONDA 1 0 0 0 0 0 0 0 0 0 $596
COMMUNITY SER. BLDFACIL 2101 2011 ICE EDGER OLYMPIA 0 0 0 0 1 1 1 1 1 1 $5,062
COMMUNITY SER. BLDFACIL 2102 2011 ICE EDGER OLYMPIA 0 0 0 0 1 1 1 1 1 1 $5,062
COMMUNITY SER. BLDFACIL 2306 2014 PICKUP 1/2 TON 4X2 0 0 0 0 0 1 1 1 1 1 $40,000
COMMUNITY SER. BLDFACIL 14000 2014 VAN CARGO 1/2 TON 0 0 0 0 0 0 1 1 1 1 $50,000
COMMUNITY SERVICES
Total Number of Vehicles
TABLE 1 - PAGE 85
CITY OF VAUGHANINVENTORY OF CAPITAL ASSETS
CITY FLEET: NON-ROADS DEPARTMENT
APPENDIX E
HEMSON
HEMSON
200
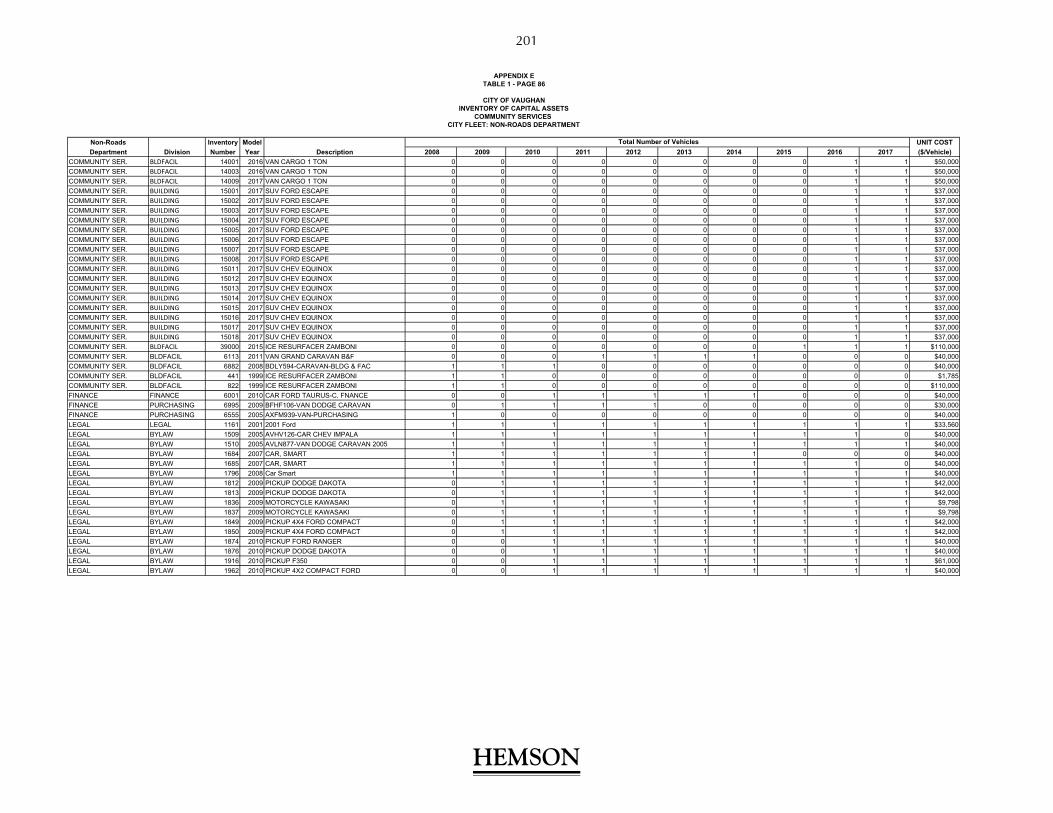
Non-Roads Inventory Model UNIT COST
Department Division Number Year Description 2008 2009 2010 2011 2012 2013 2014 2015 2016 2017 ($/Vehicle)
COMMUNITY SER. BLDFACIL 14001 2016 VAN CARGO 1 TON 0 0 0 0 0 0 0 0 1 1 $50,000
COMMUNITY SER. BLDFACIL 14003 2016 VAN CARGO 1 TON 0 0 0 0 0 0 0 0 1 1 $50,000
COMMUNITY SER. BLDFACIL 14009 2017 VAN CARGO 1 TON 0 0 0 0 0 0 0 0 1 1 $50,000
COMMUNITY SER. BUILDING 15001 2017 SUV FORD ESCAPE 0 0 0 0 0 0 0 0 1 1 $37,000
COMMUNITY SER. BUILDING 15002 2017 SUV FORD ESCAPE 0 0 0 0 0 0 0 0 1 1 $37,000
COMMUNITY SER. BUILDING 15003 2017 SUV FORD ESCAPE 0 0 0 0 0 0 0 0 1 1 $37,000
COMMUNITY SER. BUILDING 15004 2017 SUV FORD ESCAPE 0 0 0 0 0 0 0 0 1 1 $37,000
COMMUNITY SER. BUILDING 15005 2017 SUV FORD ESCAPE 0 0 0 0 0 0 0 0 1 1 $37,000
COMMUNITY SER. BUILDING 15006 2017 SUV FORD ESCAPE 0 0 0 0 0 0 0 0 1 1 $37,000
COMMUNITY SER. BUILDING 15007 2017 SUV FORD ESCAPE 0 0 0 0 0 0 0 0 1 1 $37,000
COMMUNITY SER. BUILDING 15008 2017 SUV FORD ESCAPE 0 0 0 0 0 0 0 0 1 1 $37,000
COMMUNITY SER. BUILDING 15011 2017 SUV CHEV EQUINOX 0 0 0 0 0 0 0 0 1 1 $37,000
COMMUNITY SER. BUILDING 15012 2017 SUV CHEV EQUINOX 0 0 0 0 0 0 0 0 1 1 $37,000
COMMUNITY SER. BUILDING 15013 2017 SUV CHEV EQUINOX 0 0 0 0 0 0 0 0 1 1 $37,000
COMMUNITY SER. BUILDING 15014 2017 SUV CHEV EQUINOX 0 0 0 0 0 0 0 0 1 1 $37,000
COMMUNITY SER. BUILDING 15015 2017 SUV CHEV EQUINOX 0 0 0 0 0 0 0 0 1 1 $37,000
COMMUNITY SER. BUILDING 15016 2017 SUV CHEV EQUINOX 0 0 0 0 0 0 0 0 1 1 $37,000
COMMUNITY SER. BUILDING 15017 2017 SUV CHEV EQUINOX 0 0 0 0 0 0 0 0 1 1 $37,000
COMMUNITY SER. BUILDING 15018 2017 SUV CHEV EQUINOX 0 0 0 0 0 0 0 0 1 1 $37,000
COMMUNITY SER. BLDFACIL 39000 2015 ICE RESURFACER ZAMBONI 0 0 0 0 0 0 0 1 1 1 $110,000
COMMUNITY SER. BLDFACIL 6113 2011 VAN GRAND CARAVAN B&F 0 0 0 1 1 1 1 0 0 0 $40,000
COMMUNITY SER. BLDFACIL 6882 2008 BDLY594-CARAVAN-BLDG & FAC 1 1 1 0 0 0 0 0 0 0 $40,000
COMMUNITY SER. BLDFACIL 441 1999 ICE RESURFACER ZAMBONI 1 1 0 0 0 0 0 0 0 0 $1,785
COMMUNITY SER. BLDFACIL 822 1999 ICE RESURFACER ZAMBONI 1 1 0 0 0 0 0 0 0 0 $110,000
FINANCE FINANCE 6001 2010 CAR FORD TAURUS-C. FNANCE 0 0 1 1 1 1 1 0 0 0 $40,000
FINANCE PURCHASING 6995 2009 BFHF106-VAN DODGE CARAVAN 0 1 1 1 1 0 0 0 0 0 $30,000
FINANCE PURCHASING 6555 2005 AXFM939-VAN-PURCHASING 1 0 0 0 0 0 0 0 0 0 $40,000
LEGAL LEGAL 1161 2001 2001 Ford 1 1 1 1 1 1 1 1 1 1 $33,560
LEGAL BYLAW 1509 2005 AVHV126-CAR CHEV IMPALA 1 1 1 1 1 1 1 1 1 0 $40,000
LEGAL BYLAW 1510 2005 AVLN877-VAN DODGE CARAVAN 2005 1 1 1 1 1 1 1 1 1 1 $40,000
LEGAL BYLAW 1684 2007 CAR, SMART 1 1 1 1 1 1 1 0 0 0 $40,000
LEGAL BYLAW 1685 2007 CAR, SMART 1 1 1 1 1 1 1 1 1 0 $40,000
LEGAL BYLAW 1796 2008 Car Smart 1 1 1 1 1 1 1 1 1 1 $40,000
LEGAL BYLAW 1812 2009 PICKUP DODGE DAKOTA 0 1 1 1 1 1 1 1 1 1 $42,000
LEGAL BYLAW 1813 2009 PICKUP DODGE DAKOTA 0 1 1 1 1 1 1 1 1 1 $42,000
LEGAL BYLAW 1836 2009 MOTORCYCLE KAWASAKI 0 1 1 1 1 1 1 1 1 1 $9,798
LEGAL BYLAW 1837 2009 MOTORCYCLE KAWASAKI 0 1 1 1 1 1 1 1 1 1 $9,798
LEGAL BYLAW 1849 2009 PICKUP 4X4 FORD COMPACT 0 1 1 1 1 1 1 1 1 1 $42,000
LEGAL BYLAW 1850 2009 PICKUP 4X4 FORD COMPACT 0 1 1 1 1 1 1 1 1 1 $42,000
LEGAL BYLAW 1874 2010 PICKUP FORD RANGER 0 0 1 1 1 1 1 1 1 1 $40,000
LEGAL BYLAW 1876 2010 PICKUP DODGE DAKOTA 0 0 1 1 1 1 1 1 1 1 $40,000
LEGAL BYLAW 1916 2010 PICKUP F350 0 0 1 1 1 1 1 1 1 1 $61,000
LEGAL BYLAW 1962 2010 PICKUP 4X2 COMPACT FORD 0 0 1 1 1 1 1 1 1 1 $40,000
COMMUNITY SERVICES
Total Number of Vehicles
APPENDIX ETABLE 1 - PAGE 86
CITY OF VAUGHANINVENTORY OF CAPITAL ASSETS
CITY FLEET: NON-ROADS DEPARTMENT
HEMSON
HEMSON
201

Non-Roads Inventory Model UNIT COST
Department Division Number Year Description 2008 2009 2010 2011 2012 2013 2014 2015 2016 2017 ($/Vehicle)
LEGAL BYLAW 2032 2011 7439ZT-PICKUP 4X4 COM. 4 DOOR CHEV 0 0 0 1 1 1 1 1 1 1 $42,000
LEGAL BYLAW 2049 2011 AA31032-PICKUP COMPACT 4X4 0 0 0 1 1 1 0 0 0 0 $42,000
LEGAL BYLAW 2050 2011 AA31040-PICKUP COMPACT 4X4 0 0 0 1 1 1 1 1 1 1 $42,000
LEGAL BYLAW 2071 2011 PICKUP COMPACT EXT. CAB 0 0 0 1 1 1 1 1 1 1 $18,423
LEGAL BYLAW 2103 2012 MOTORCYCLE KAWASAKI 0 0 0 0 1 1 1 1 1 1 $6,072
LEGAL BYLAW 2303 2014 PICKUP 1/2 TON 4X4 0 0 0 0 0 1 1 1 1 1 $42,000
LEGAL BYLAW 2307 2014 PICKUP 1/2 TON 4X4 0 0 0 0 0 1 1 1 1 1 $42,000
LEGAL BYLAW 11000 2011 MINI VAN 0 0 0 0 0 0 1 1 1 1 $40,000
LEGAL BYLAW 11001 2011 MINI VAN 0 0 0 0 0 0 1 1 1 1 $40,000
LEGAL BYLAW 11002 2011 MINI VAN 0 0 0 0 0 0 1 1 1 1 $40,000
LEGAL BYLAW 11003 2011 MINI VAN 0 0 0 0 0 0 1 1 1 1 $40,000
LEGAL BYLAW 11004 2011 MINI VAN 0 0 0 0 0 0 1 1 1 1 $40,000
LEGAL BYLAW 12500 2016 PICKUP 1/2 TON 4X4 CREW CAB 0 0 0 0 0 0 0 0 1 1 $42,000
LEGAL BYLAW 12506 2016 PICKUP 1/2 TON 4X4 CREW CAB 0 0 0 0 0 0 0 0 1 1 $42,000
LEGAL BYLAW 12507 2016 PICKUP 1/2 TON 4X4 CREW CAB 0 0 0 0 0 0 0 0 1 1 $42,000
LEGAL BYLAW 12509 2016 PICKUP 1/2 TON 4X4 CREW CAB 0 0 0 0 0 0 0 0 1 1 $42,000
LEGAL BYLAW 12512 2016 PICKUP 1/2 TON 4X4 CREW CAB 0 0 0 0 0 0 0 0 1 1 $42,000
LEGAL BYLAW 15000 2017 SUV FORD ESCAPE 0 0 0 0 0 0 0 0 1 1 $37,000
LEGAL BYLAW 15009 2017 SUV CHEV EQUINOX 0 0 0 0 0 0 0 0 1 1 $37,000
LEGAL BYLAW 15010 2017 SUV CHEV EQUINOX 0 0 0 0 0 0 0 0 1 1 $37,000
MAYOR MAYOR 6766 2006 BABH408-CAR JACKSON 1 1 0 0 0 0 0 0 0 0 $80,000
PLANNING BUILDING 1626 2006 9520TE-PICKUP DAKOTA 2006 1 1 1 1 1 1 1 1 1 1 $40,000
PLANNING BUILDING 1627 2006 9526TE-PICKUP DAKOTA 2006 1 1 1 1 1 1 0 0 0 0 $40,000
PLANNING BUILDING 1628 2006 9523TE-PICKUP DAKOTA 2006 1 1 1 1 1 1 1 1 1 1 $40,000
PLANNING BUILDING 1629 2006 9522TE-PICKUP DAKOTA 2006 1 1 1 1 1 1 1 1 1 1 $40,000
PLANNING BUILDING 1630 2006 9525TE-PICKUP DAKOTA 1 1 1 1 1 1 1 1 1 1 $40,000
PLANNING BUILDING 1631 2006 9521TE-PICKUP DAKOTA 2006 1 1 1 1 1 1 1 1 1 1 $40,000
PROPERTY BLDFACIL 228 1972 Ford Tractor 1 1 1 0 0 0 0 0 0 0 $29,618
PROPERTY BLDFACIL 409 1984 Lift Personnel 1 1 1 1 1 1 1 1 1 1 $18,244
PROPERTY BLDFACIL 950 1996 4x4 S10 Pkup 1 1 0 0 0 0 0 0 0 0 $41,893
PROPERTY BLDFACIL 1019 1998 Trailer Tilt Deck 1 1 1 1 1 1 1 1 1 1 $4,842
PROPERTY BLDFACIL 1020 1998 Compact Pickup Truck 4x4 0 0 0 0 0 0 0 0 0 $57,885
PROPERTY BLDFACIL 1035 1998 Lift Skyking 1 1 1 1 1 1 1 1 1 1 $17,568
PROPERTY BLDFACIL 1053 1999 Chev Cargo Van 1 0 0 0 0 0 0 0 0 0 $50,000
PROPERTY BLDFACIL 1147 2000 Compact Pickup, Ext Cab 4x4 1 1 1 1 1 1 1 1 1 1 $40,000
PROPERTY BLDFACIL 1153 2000 Extended Mini Van 1 1 1 1 1 1 1 1 1 0 $40,000
PROPERTY BLDFACIL 1155 2000 1 Ton Cargo Van 1 1 1 1 1 1 1 0 0 0 $50,000
PROPERTY BLDFACIL 1156 2000 1 Ton Cargo Van 1 1 1 1 1 1 1 0 0 0 $50,000
PROPERTY BLDFACIL 1157 2000 1/2 Ton 4x4 Pickup 1 1 1 1 1 1 1 1 1 1 $42,000
PROPERTY BLDFACIL 1241 2001 3/4 Ton Cargo Van 1 1 1 1 1 1 1 1 1 0 $50,000
PROPERTY BLDFACIL 1320 2002 3/4 Ton Cargo Van 1 1 1 1 1 1 1 1 1 1 $50,000
Total Other Departments (#) - Owned Vehicles 577 589 582 607 674 740 736 748 773 744
Total Other Departments ($000) - Owned Vehicles $17,535.4 $18,384.1 $17,925.7 $18,840.5 $19,562.6 $20,571.7 $19,688.2 $20,235.2 $21,667.8 $20,783.7
Public Works Roads Operations ($000) - Contracted Vehicles $0.0 $0.0 $0.0 $0.0 $0.0 $19.0 $29.4 $29.4 $150.4 $1,531.7
COMMUNITY SERVICES
Total Number of Vehicles
TABLE 1 - PAGE 87
CITY OF VAUGHANINVENTORY OF CAPITAL ASSETS
CITY FLEET: NON-ROADS DEPARTMENT
APPENDIX E
HEMSON
HEMSON
202
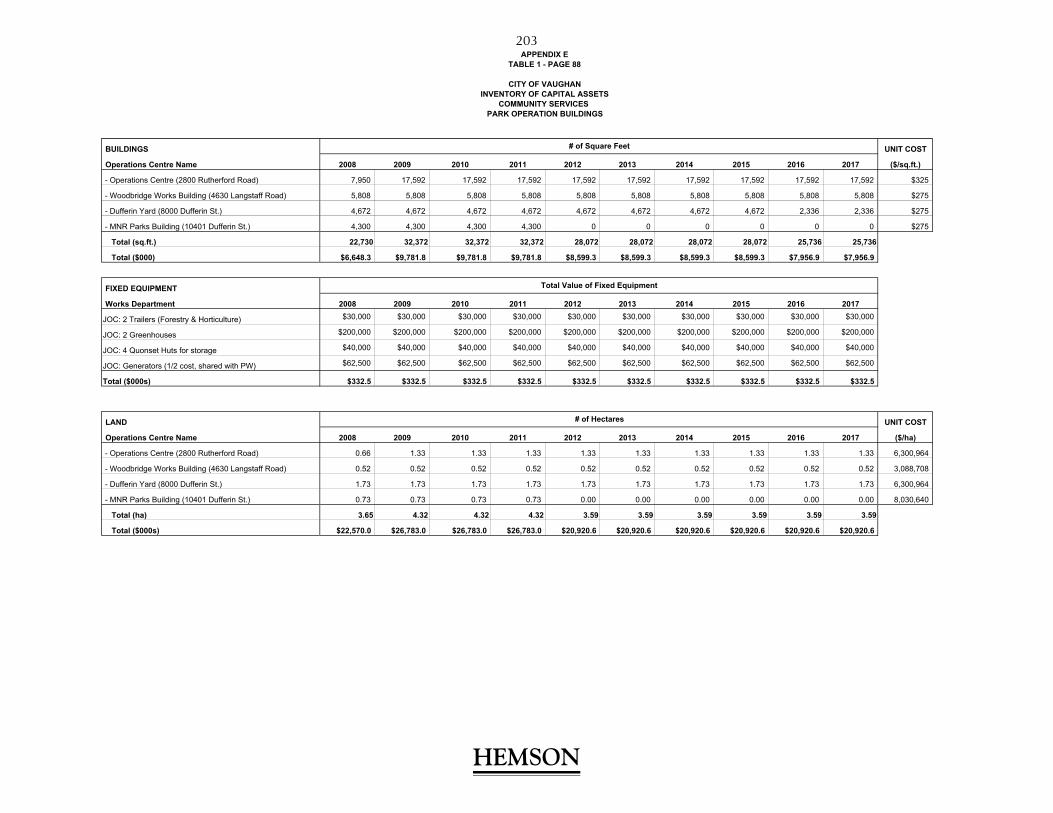
APPENDIX ETABLE 1 - PAGE 88
CITY OF VAUGHANINVENTORY OF CAPITAL ASSETS
COMMUNITY SERVICES PARK OPERATION BUILDINGS
BUILDINGS UNIT COST
Operations Centre Name 2008 2009 2010 2011 2012 2013 2014 2015 2016 2017 ($/sq.ft.)
- Operations Centre (2800 Rutherford Road) 7,950 17,592 17,592 17,592 17,592 17,592 17,592 17,592 17,592 17,592 $325
- Woodbridge Works Building (4630 Langstaff Road) 5,808 5,808 5,808 5,808 5,808 5,808 5,808 5,808 5,808 5,808 $275
- Dufferin Yard (8000 Dufferin St.) 4,672 4,672 4,672 4,672 4,672 4,672 4,672 4,672 2,336 2,336 $275
- MNR Parks Building (10401 Dufferin St.) 4,300 4,300 4,300 4,300 0 0 0 0 0 0 $275
Total (sq.ft.) 22,730 32,372 32,372 32,372 28,072 28,072 28,072 28,072 25,736 25,736
Total ($000) $6,648.3 $9,781.8 $9,781.8 $9,781.8 $8,599.3 $8,599.3 $8,599.3 $8,599.3 $7,956.9 $7,956.9
FIXED EQUIPMENT
Works Department 2008 2009 2010 2011 2012 2013 2014 2015 2016 2017
JOC: 2 Trailers (Forestry & Horticulture) $30,000 $30,000 $30,000 $30,000 $30,000 $30,000 $30,000 $30,000 $30,000 $30,000
JOC: 2 Greenhouses $200,000 $200,000 $200,000 $200,000 $200,000 $200,000 $200,000 $200,000 $200,000 $200,000
JOC: 4 Quonset Huts for storage $40,000 $40,000 $40,000 $40,000 $40,000 $40,000 $40,000 $40,000 $40,000 $40,000
JOC: Generators (1/2 cost, shared with PW) $62,500 $62,500 $62,500 $62,500 $62,500 $62,500 $62,500 $62,500 $62,500 $62,500
Total ($000s) $332.5 $332.5 $332.5 $332.5 $332.5 $332.5 $332.5 $332.5 $332.5 $332.5
LAND UNIT COST
Operations Centre Name 2008 2009 2010 2011 2012 2013 2014 2015 2016 2017 ($/ha)
- Operations Centre (2800 Rutherford Road) 0.66 1.33 1.33 1.33 1.33 1.33 1.33 1.33 1.33 1.33 6,300,964
- Woodbridge Works Building (4630 Langstaff Road) 0.52 0.52 0.52 0.52 0.52 0.52 0.52 0.52 0.52 0.52 3,088,708
- Dufferin Yard (8000 Dufferin St.) 1.73 1.73 1.73 1.73 1.73 1.73 1.73 1.73 1.73 1.73 6,300,964
- MNR Parks Building (10401 Dufferin St.) 0.73 0.73 0.73 0.73 0.00 0.00 0.00 0.00 0.00 0.00 8,030,640
Total (ha) 3.65 4.32 4.32 4.32 3.59 3.59 3.59 3.59 3.59 3.59
Total ($000s) $22,570.0 $26,783.0 $26,783.0 $26,783.0 $20,920.6 $20,920.6 $20,920.6 $20,920.6 $20,920.6 $20,920.6
# of Square Feet
Total Value of Fixed Equipment
# of Hectares
HEMSON
HEMSON
203
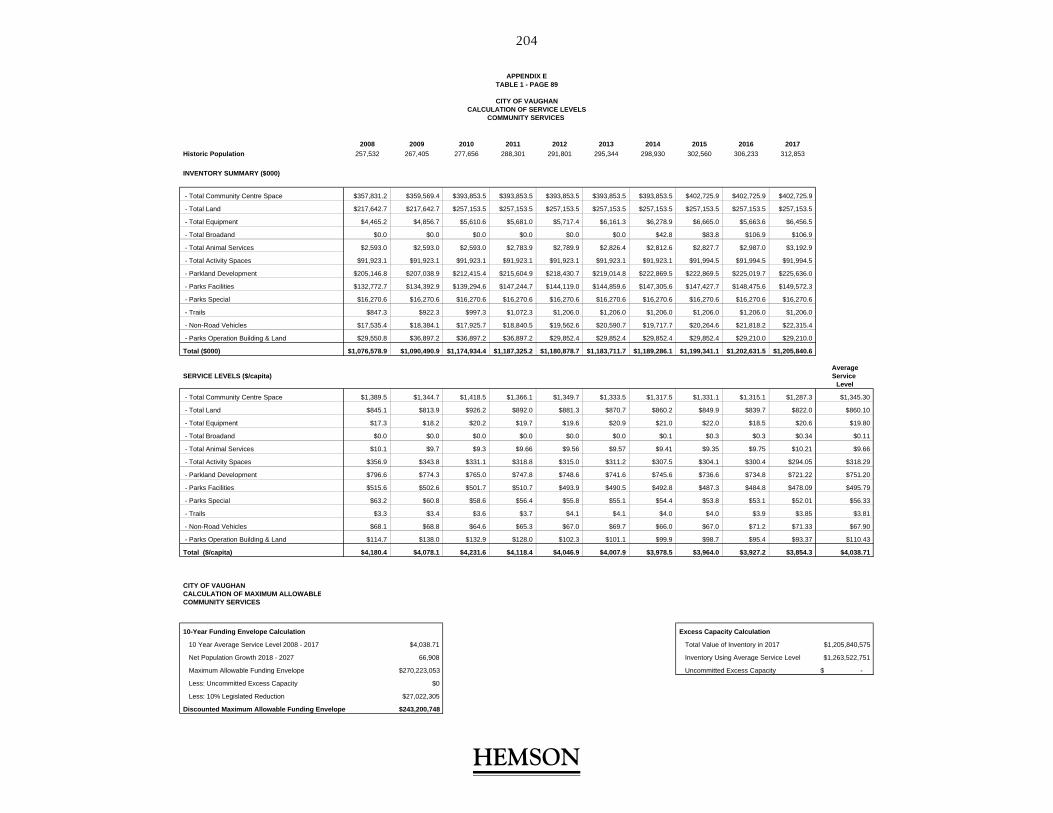
CITY OF VAUGHANCALCULATION OF SERVICE LEVELS
COMMUNITY SERVICES
2008 2009 2010 2011 2012 2013 2014 2015 2016 2017Historic Population 257,532 267,405 277,656 288,301 291,801 295,344 298,930 302,560 306,233 312,853
INVENTORY SUMMARY ($000)
- Total Community Centre Space $357,831.2 $359,569.4 $393,853.5 $393,853.5 $393,853.5 $393,853.5 $393,853.5 $402,725.9 $402,725.9 $402,725.9
- Total Land $217,642.7 $217,642.7 $257,153.5 $257,153.5 $257,153.5 $257,153.5 $257,153.5 $257,153.5 $257,153.5 $257,153.5
- Total Equipment $4,465.2 $4,856.7 $5,610.6 $5,681.0 $5,717.4 $6,161.3 $6,278.9 $6,665.0 $5,663.6 $6,456.5
- Total Broadand $0.0 $0.0 $0.0 $0.0 $0.0 $0.0 $42.8 $83.8 $106.9 $106.9
- Total Animal Services $2,593.0 $2,593.0 $2,593.0 $2,783.9 $2,789.9 $2,826.4 $2,812.6 $2,827.7 $2,987.0 $3,192.9
- Total Activity Spaces $91,923.1 $91,923.1 $91,923.1 $91,923.1 $91,923.1 $91,923.1 $91,923.1 $91,994.5 $91,994.5 $91,994.5
- Parkland Development $205,146.8 $207,038.9 $212,415.4 $215,604.9 $218,430.7 $219,014.8 $222,869.5 $222,869.5 $225,019.7 $225,636.0
- Parks Facilities $132,772.7 $134,392.9 $139,294.6 $147,244.7 $144,119.0 $144,859.6 $147,305.6 $147,427.7 $148,475.6 $149,572.3
- Parks Special $16,270.6 $16,270.6 $16,270.6 $16,270.6 $16,270.6 $16,270.6 $16,270.6 $16,270.6 $16,270.6 $16,270.6
- Trails $847.3 $922.3 $997.3 $1,072.3 $1,206.0 $1,206.0 $1,206.0 $1,206.0 $1,206.0 $1,206.0
- Non-Road Vehicles $17,535.4 $18,384.1 $17,925.7 $18,840.5 $19,562.6 $20,590.7 $19,717.7 $20,264.6 $21,818.2 $22,315.4
- Parks Operation Building & Land $29,550.8 $36,897.2 $36,897.2 $36,897.2 $29,852.4 $29,852.4 $29,852.4 $29,852.4 $29,210.0 $29,210.0
Total ($000) $1,076,578.9 $1,090,490.9 $1,174,934.4 $1,187,325.2 $1,180,878.7 $1,183,711.7 $1,189,286.1 $1,199,341.1 $1,202,631.5 $1,205,840.6
AverageSERVICE LEVELS ($/capita) Service
Level
- Total Community Centre Space $1,389.5 $1,344.7 $1,418.5 $1,366.1 $1,349.7 $1,333.5 $1,317.5 $1,331.1 $1,315.1 $1,287.3 $1,345.30
- Total Land $845.1 $813.9 $926.2 $892.0 $881.3 $870.7 $860.2 $849.9 $839.7 $822.0 $860.10
- Total Equipment $17.3 $18.2 $20.2 $19.7 $19.6 $20.9 $21.0 $22.0 $18.5 $20.6 $19.80
- Total Broadand $0.0 $0.0 $0.0 $0.0 $0.0 $0.0 $0.1 $0.3 $0.3 $0.34 $0.11
- Total Animal Services $10.1 $9.7 $9.3 $9.66 $9.56 $9.57 $9.41 $9.35 $9.75 $10.21 $9.66
- Total Activity Spaces $356.9 $343.8 $331.1 $318.8 $315.0 $311.2 $307.5 $304.1 $300.4 $294.05 $318.29
- Parkland Development $796.6 $774.3 $765.0 $747.8 $748.6 $741.6 $745.6 $736.6 $734.8 $721.22 $751.20
- Parks Facilities $515.6 $502.6 $501.7 $510.7 $493.9 $490.5 $492.8 $487.3 $484.8 $478.09 $495.79
- Parks Special $63.2 $60.8 $58.6 $56.4 $55.8 $55.1 $54.4 $53.8 $53.1 $52.01 $56.33
- Trails $3.3 $3.4 $3.6 $3.7 $4.1 $4.1 $4.0 $4.0 $3.9 $3.85 $3.81
- Non-Road Vehicles $68.1 $68.8 $64.6 $65.3 $67.0 $69.7 $66.0 $67.0 $71.2 $71.33 $67.90
- Parks Operation Building & Land $114.7 $138.0 $132.9 $128.0 $102.3 $101.1 $99.9 $98.7 $95.4 $93.37 $110.43
Total ($/capita) $4,180.4 $4,078.1 $4,231.6 $4,118.4 $4,046.9 $4,007.9 $3,978.5 $3,964.0 $3,927.2 $3,854.3 $4,038.71
CITY OF VAUGHANCALCULATION OF MAXIMUM ALLOWABLECOMMUNITY SERVICES
10-Year Funding Envelope Calculation Excess Capacity Calculation
10 Year Average Service Level 2008 - 2017 $4,038.71 Total Value of Inventory in 2017 $1,205,840,575
Net Population Growth 2018 - 2027 66,908 Inventory Using Average Service Level $1,263,522,751
Maximum Allowable Funding Envelope $270,223,053 Uncommitted Excess Capacity -$
Less: Uncommitted Excess Capacity $0
Less: 10% Legislated Reduction $27,022,305
Discounted Maximum Allowable Funding Envelope $243,200,748
APPENDIX ETABLE 1 - PAGE 89
HEMSON
HEMSON
204

Gross Grants/ Net Total
Project Description Timing Project Subsidies/Other Municipal Replacement 10% DC Eligible Available 2018- PostCost Recoveries Cost & BTE Shares Reduction Costs DC Reserves 2027 2027
4.0 COMMUNITY SERVICES
4.1 Committed Projects 2017 - Indoor Recreation
4.1.1 BF-8114-07 North Thornhill Construction 2018 409,316$ -$ 409,316$ -$ 40,932$ 368,384$ 368,384$ -$ -$
4.1.2 BF-8378-15 Carrville Community Centre 2018 3,632,380$ -$ 3,632,380$ -$ 363,238$ 3,269,142$ 3,269,142$ -$ -$ 4.1.3 RE-9537-17 VMC Library, Recreation 2018 10,505,170$ -$ 10,505,170$ -$ 1,050,517$ 9,454,653$ 9,454,653$ -$ -$
Subtotal Committed Projects 2017 - Indoor Recreation 14,546,866$ -$ 14,546,866$ -$ 1,454,687$ 13,092,179$ 13,092,179$ -$ -$
4.2 Block 41 Community Centre
4.2.1 Block 41 CC - Provision for Land 2020 40,006,936$ -$ 40,006,936$ -$ 4,000,694$ 36,006,243$ -$ 36,006,243$ -$
4.2.2 Block 41 CC - Studies and Design 2022 4,067,213$ -$ 4,067,213$ -$ 406,721$ 3,660,491$ -$ 3,660,491$ -$
4.2.3 Block 41 CC - Building Construction 2023 20,857,500$ -$ 20,857,500$ -$ 2,085,750$ 18,771,750$ -$ 18,771,750$ -$
4.2.4 Block 41 CC - Building Construction 2024 20,857,500$ -$ 20,857,500$ -$ 2,085,750$ 18,771,750$ -$ 18,771,750$ -$
4.2.5 Block 41 CC - Building Construction 2025 20,857,500$ -$ 20,857,500$ -$ 2,085,750$ 18,771,750$ -$ 18,771,750$ -$ 4.2.6 Block 41 CC - Recreation Equipment 2026 1,112,111$ -$ 1,112,111$ -$ 111,211$ 1,000,900$ -$ -$ 1,000,900$
Subtotal Block 41 Community Centre 107,758,760$ -$ 107,758,760$ -$ 10,775,876$ 96,982,884$ -$ 95,981,984$ 1,000,900$
4.3 VMC Community Centre
4.3.1 VMC CC - Provisions for Land 2018 9,261,495$ -$ 9,261,495$ -$ 926,150$ 8,335,346$ 8,335,346$ -$ -$
4.3.2 VMC CC - Furniture and Equipment 2019 516,000$ -$ 516,000$ -$ 51,600$ 464,400$ 464,400$ -$ -$
4.3.3 VMC CC - Annual IO Debt Repayment - Principal Payment Only 2018 4,761,747$ -$ 4,761,747$ -$ 476,175$ 4,285,573$ 4,285,573$ -$ -$
4.3.4 VMC CC - Annual IO Debt Repayment - Principal Payment Only 2019 4,761,747$ -$ 4,761,747$ -$ 476,175$ 4,285,573$ 4,285,573$ -$ -$
4.3.5 VMC CC - Annual IO Debt Repayment - Principal Payment Only 2020 4,761,747$ -$ 4,761,747$ -$ 476,175$ 4,285,573$ -$ 4,285,573$ -$
4.3.6 VMC CC - Annual IO Debt Repayment - Principal Payment Only 2021 4,761,747$ -$ 4,761,747$ -$ 476,175$ 4,285,573$ -$ 4,285,573$ -$
4.3.7 VMC CC - Annual IO Debt Repayment - Principal Payment Only 2022 4,761,747$ -$ 4,761,747$ -$ 476,175$ 4,285,573$ -$ 4,285,573$ -$
4.3.8 VMC CC - Annual IO Debt Repayment - Principal Payment Only 2023 4,761,747$ -$ 4,761,747$ -$ 476,175$ 4,285,573$ -$ 4,285,573$ -$
4.3.9 VMC CC - Annual IO Debt Repayment - Principal Payment Only 2024 4,761,747$ -$ 4,761,747$ -$ 476,175$ 4,285,573$ -$ 4,285,573$ -$
4.3.10 VMC CC - Annual IO Debt Repayment - Principal Payment Only 2025 4,761,747$ -$ 4,761,747$ -$ 476,175$ 4,285,573$ -$ -$ 4,285,573$ 4.3.11 VMC CC - Annual IO Debt Repayment - Principal Payment Only 2026 4,761,747$ -$ 4,761,747$ -$ 476,175$ 4,285,573$ -$ -$ 4,285,573$
4.3.12 VMC CC - Annual IO Debt Repayment - Principal Payment Only 2027 4,761,747$ -$ 4,761,747$ -$ 476,175$ 4,285,573$ -$ -$ 4,285,573$
Subtotal VMC Community Centre 57,394,969$ -$ 57,394,969$ -$ 5,739,497$ 51,655,472$ 17,370,891$ 21,427,863$ 12,856,718$
4.4 Kleinburg Community Centre
4.4.1 Kleinburg CC - Provision for Land 2022 11,853,907$ -$ 11,853,907$ -$ 1,185,391$ 10,668,516$ -$ 10,668,516$ -$
4.4.2 Kleinburg CC - Studies and Design 2023 1,205,100$ -$ 1,205,100$ -$ 120,510$ 1,084,590$ -$ 1,084,590$ -$
4.4.3 Kleinburg CC - Building Construction 2024 6,180,000$ -$ 6,180,000$ -$ 618,000$ 5,562,000$ -$ 5,562,000$ -$
4.4.4 Kleinburg CC - Building Construction 2025 6,180,000$ -$ 6,180,000$ -$ 618,000$ 5,562,000$ -$ 5,562,000$ -$
4.4.5 Kleinburg CC - Building Construction 2026 6,180,000$ -$ 6,180,000$ -$ 618,000$ 5,562,000$ -$ -$ 5,562,000$ 4.4.6 Kleinburg CC - Recreation Equipment 2027 329,514$ -$ 329,514$ -$ 32,951$ 296,563$ -$ -$ 296,563$
Subtotal Kleinburg Community Centre 31,928,521$ -$ 31,928,521$ -$ 3,192,852$ 28,735,669$ -$ 22,877,106$ 5,858,563$
CITY OF VAUGHAN
DEVELOPMENT-RELATED CAPITAL PROGRAM
DC Eligible Costs
COMMUNITY SERVICES
Ineligible Costs
APPENDIX E
TABLE 2 - PAGE 1
HEMSON
HEMSON
205

Gross Grants/ Net Total
Project Description Timing Project Subsidies/Other Municipal Replacement 10% DC Eligible Available 2018- PostCost Recoveries Cost & BTE Shares Reduction Costs DC Reserves 2027 2027
4.5 Carrville Community Centre
4.5.1 Carrville CC - Building Construction 2020 21,630,006$ -$ 21,630,006$ -$ 2,163,001$ 19,467,005$ 6,233,255$ 13,233,750$ -$
4.5.2 Carrville CC - Building Construction 2021 21,630,006$ -$ 21,630,006$ -$ 2,163,001$ 19,467,005$ -$ 19,467,005$ -$
4.5.3 Carrville CC - Building Construction 2022 21,630,006$ -$ 21,630,006$ -$ 2,163,001$ 19,467,005$ -$ 19,467,005$ -$ 4.5.4 Carrville CC - Recreation Equipment 2022 1,153,300$ -$ 1,153,300$ -$ 115,330$ 1,037,970$ -$ 1,037,970$ -$
Subtotal Carrville Community Centre 66,043,318$ -$ 66,043,318$ -$ 6,604,332$ 59,438,986$ 6,233,255$ 53,205,731$ -$
4.6 Block 27 Community Centre4.6.1 Block 27 CC - Provision for Land 2025 17,780,861$ -$ 17,780,861$ -$ 1,778,086$ 16,002,775$ -$ -$ 16,002,775$
Subtotal Block 27 Community Centre 17,780,861$ -$ 17,780,861$ -$ 1,778,086$ 16,002,775$ -$ -$ 16,002,774.5$
4.7 Vaughan Mills Community Centre4.7.1 Vaughan Mills CC - Provision for Land 2027 32,826,204$ -$ 32,826,204$ -$ 3,282,620$ 29,543,584$ -$ -$ 29,543,584$
Subtotal Vaughan Mills Community Centre 32,826,204$ -$ 32,826,204$ -$ 3,282,620$ 29,543,584$ -$ -$ 29,543,584$
4.8 Animal Services Facility
4.8.1 Animal Services Facility - Studies and Design 2018 509,900$ -$ 509,900$ 170,817$ 33,908$ 305,175$ 305,175$ -$ -$
4.8.2 Animal Services Facility - Building Construction 2019 8,000,000$ -$ 8,000,000$ 2,680,000$ 532,000$ 4,788,000$ 4,788,000$ -$ -$ 4.8.3 Animal Services Facility - Equipment 2021 2,000,000$ -$ 2,000,000$ 670,000$ 133,000$ 1,197,000$ -$ 1,197,000$ -$
Subtotal Animal Services Facility 10,509,900$ -$ 10,509,900$ 3,520,817$ 698,908$ 6,290,175$ 5,093,175$ 1,197,000$ -$
SUBTOTAL COMMUNITY SERVICES (INDOOR RECREATION) 338,789,399$ -$ 338,789,399$ 3,520,817$ 33,526,858$ 301,741,724$ 41,789,501$ 194,689,685$ 65,262,539$
Note 1: Only the principal payments are included in the capital program. Interest Payments are included in the cashflow analysis
APPENDIX E
TABLE 2 - PAGE 2
CITY OF VAUGHAN
DEVELOPMENT-RELATED CAPITAL PROGRAM
COMMUNITY SERVICES
Ineligible Costs DC Eligible Costs
HEMSON
HEMSON
206
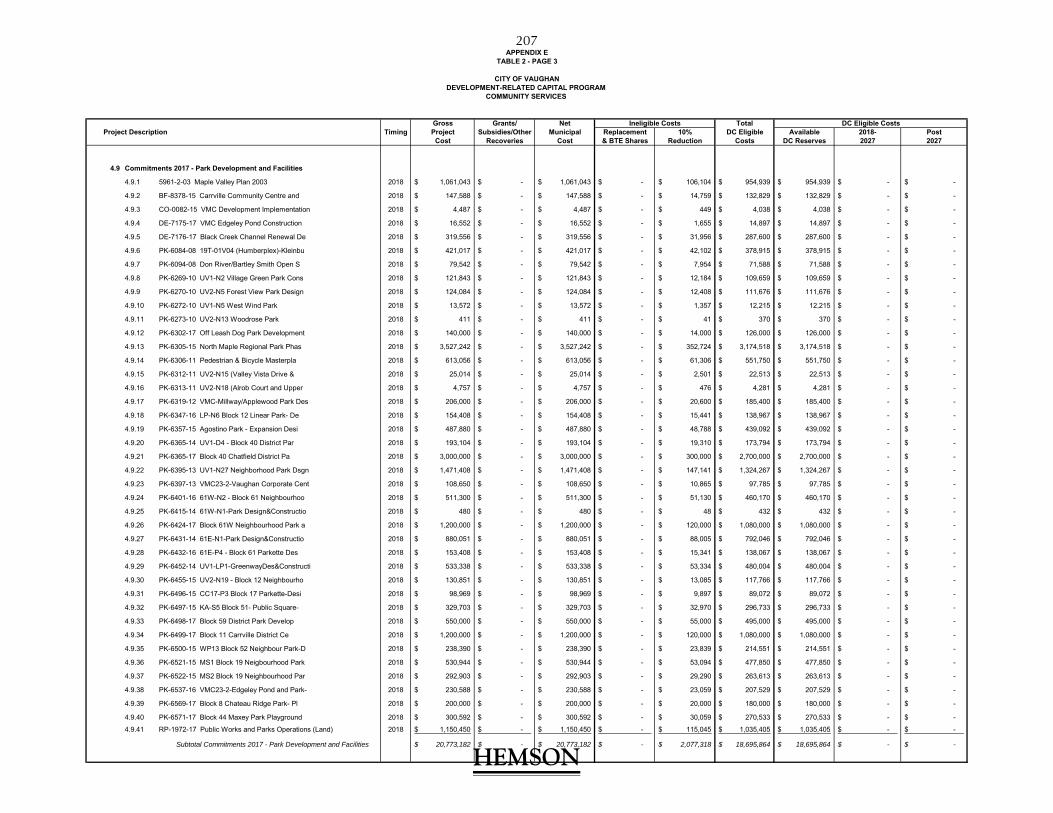
Gross Grants/ Net TotalProject Description Timing Project Subsidies/Other Municipal Replacement 10% DC Eligible Available 2018- Post
Cost Recoveries Cost & BTE Shares Reduction Costs DC Reserves 2027 2027
4.9 Commitments 2017 - Park Development and Facilities
4.9.1 5961-2-03 Maple Valley Plan 2003 2018 1,061,043$ -$ 1,061,043$ -$ 106,104$ 954,939$ 954,939$ -$ -$
4.9.2 BF-8378-15 Carrville Community Centre and 2018 147,588$ -$ 147,588$ -$ 14,759$ 132,829$ 132,829$ -$ -$
4.9.3 CO-0082-15 VMC Development Implementation 2018 4,487$ -$ 4,487$ -$ 449$ 4,038$ 4,038$ -$ -$
4.9.4 DE-7175-17 VMC Edgeley Pond Construction 2018 16,552$ -$ 16,552$ -$ 1,655$ 14,897$ 14,897$ -$ -$
4.9.5 DE-7176-17 Black Creek Channel Renewal De 2018 319,556$ -$ 319,556$ -$ 31,956$ 287,600$ 287,600$ -$ -$
4.9.6 PK-6084-08 19T-01V04 (Humberplex)-Kleinbu 2018 421,017$ -$ 421,017$ -$ 42,102$ 378,915$ 378,915$ -$ -$
4.9.7 PK-6094-08 Don River/Bartley Smith Open S 2018 79,542$ -$ 79,542$ -$ 7,954$ 71,588$ 71,588$ -$ -$
4.9.8 PK-6269-10 UV1-N2 Village Green Park Cons 2018 121,843$ -$ 121,843$ -$ 12,184$ 109,659$ 109,659$ -$ -$
4.9.9 PK-6270-10 UV2-N5 Forest View Park Design 2018 124,084$ -$ 124,084$ -$ 12,408$ 111,676$ 111,676$ -$ -$
4.9.10 PK-6272-10 UV1-N5 West Wind Park 2018 13,572$ -$ 13,572$ -$ 1,357$ 12,215$ 12,215$ -$ -$
4.9.11 PK-6273-10 UV2-N13 Woodrose Park 2018 411$ -$ 411$ -$ 41$ 370$ 370$ -$ -$
4.9.12 PK-6302-17 Off Leash Dog Park Development 2018 140,000$ -$ 140,000$ -$ 14,000$ 126,000$ 126,000$ -$ -$
4.9.13 PK-6305-15 North Maple Regional Park Phas 2018 3,527,242$ -$ 3,527,242$ -$ 352,724$ 3,174,518$ 3,174,518$ -$ -$
4.9.14 PK-6306-11 Pedestrian & Bicycle Masterpla 2018 613,056$ -$ 613,056$ -$ 61,306$ 551,750$ 551,750$ -$ -$
4.9.15 PK-6312-11 UV2-N15 (Valley Vista Drive & 2018 25,014$ -$ 25,014$ -$ 2,501$ 22,513$ 22,513$ -$ -$
4.9.16 PK-6313-11 UV2-N18 (Alrob Court and Upper 2018 4,757$ -$ 4,757$ -$ 476$ 4,281$ 4,281$ -$ -$
4.9.17 PK-6319-12 VMC-Millway/Applewood Park Des 2018 206,000$ -$ 206,000$ -$ 20,600$ 185,400$ 185,400$ -$ -$
4.9.18 PK-6347-16 LP-N6 Block 12 Linear Park- De 2018 154,408$ -$ 154,408$ -$ 15,441$ 138,967$ 138,967$ -$ -$
4.9.19 PK-6357-15 Agostino Park - Expansion Desi 2018 487,880$ -$ 487,880$ -$ 48,788$ 439,092$ 439,092$ -$ -$
4.9.20 PK-6365-14 UV1-D4 - Block 40 District Par 2018 193,104$ -$ 193,104$ -$ 19,310$ 173,794$ 173,794$ -$ -$
4.9.21 PK-6365-17 Block 40 Chatfield District Pa 2018 3,000,000$ -$ 3,000,000$ -$ 300,000$ 2,700,000$ 2,700,000$ -$ -$
4.9.22 PK-6395-13 UV1-N27 Neighborhood Park Dsgn 2018 1,471,408$ -$ 1,471,408$ -$ 147,141$ 1,324,267$ 1,324,267$ -$ -$
4.9.23 PK-6397-13 VMC23-2-Vaughan Corporate Cent 2018 108,650$ -$ 108,650$ -$ 10,865$ 97,785$ 97,785$ -$ -$
4.9.24 PK-6401-16 61W-N2 - Block 61 Neighbourhoo 2018 511,300$ -$ 511,300$ -$ 51,130$ 460,170$ 460,170$ -$ -$
4.9.25 PK-6415-14 61W-N1-Park Design&Constructio 2018 480$ -$ 480$ -$ 48$ 432$ 432$ -$ -$
4.9.26 PK-6424-17 Block 61W Neighbourhood Park a 2018 1,200,000$ -$ 1,200,000$ -$ 120,000$ 1,080,000$ 1,080,000$ -$ -$
4.9.27 PK-6431-14 61E-N1-Park Design&Constructio 2018 880,051$ -$ 880,051$ -$ 88,005$ 792,046$ 792,046$ -$ -$
4.9.28 PK-6432-16 61E-P4 - Block 61 Parkette Des 2018 153,408$ -$ 153,408$ -$ 15,341$ 138,067$ 138,067$ -$ -$
4.9.29 PK-6452-14 UV1-LP1-GreenwayDes&Constructi 2018 533,338$ -$ 533,338$ -$ 53,334$ 480,004$ 480,004$ -$ -$
4.9.30 PK-6455-15 UV2-N19 - Block 12 Neighbourho 2018 130,851$ -$ 130,851$ -$ 13,085$ 117,766$ 117,766$ -$ -$
4.9.31 PK-6496-15 CC17-P3 Block 17 Parkette-Desi 2018 98,969$ -$ 98,969$ -$ 9,897$ 89,072$ 89,072$ -$ -$
4.9.32 PK-6497-15 KA-S5 Block 51- Public Square- 2018 329,703$ -$ 329,703$ -$ 32,970$ 296,733$ 296,733$ -$ -$
4.9.33 PK-6498-17 Block 59 District Park Develop 2018 550,000$ -$ 550,000$ -$ 55,000$ 495,000$ 495,000$ -$ -$
4.9.34 PK-6499-17 Block 11 Carrville District Ce 2018 1,200,000$ -$ 1,200,000$ -$ 120,000$ 1,080,000$ 1,080,000$ -$ -$
4.9.35 PK-6500-15 WP13 Block 52 Neighbour Park-D 2018 238,390$ -$ 238,390$ -$ 23,839$ 214,551$ 214,551$ -$ -$
4.9.36 PK-6521-15 MS1 Block 19 Neigbourhood Park 2018 530,944$ -$ 530,944$ -$ 53,094$ 477,850$ 477,850$ -$ -$
4.9.37 PK-6522-15 MS2 Block 19 Neighbourhood Par 2018 292,903$ -$ 292,903$ -$ 29,290$ 263,613$ 263,613$ -$ -$
4.9.38 PK-6537-16 VMC23-2-Edgeley Pond and Park- 2018 230,588$ -$ 230,588$ -$ 23,059$ 207,529$ 207,529$ -$ -$
4.9.39 PK-6569-17 Block 8 Chateau Ridge Park- Pl 2018 200,000$ -$ 200,000$ -$ 20,000$ 180,000$ 180,000$ -$ -$
4.9.40 PK-6571-17 Block 44 Maxey Park Playground 2018 300,592$ -$ 300,592$ -$ 30,059$ 270,533$ 270,533$ -$ -$
4.9.41 RP-1972-17 Public Works and Parks Operations (Land) 2018 1,150,450$ -$ 1,150,450$ -$ 115,045$ 1,035,405$ 1,035,405$ -$ -$
Subtotal Commitments 2017 - Park Development and Facilities 20,773,182$ -$ 20,773,182$ -$ 2,077,318$ 18,695,864$ 18,695,864$ -$ -$
CITY OF VAUGHAN
Ineligible Costs DC Eligible Costs
COMMUNITY SERVICES DEVELOPMENT-RELATED CAPITAL PROGRAM
APPENDIX ETABLE 2 - PAGE 3
HEMSON
HEMSON
207

Gross Grants/ Net Total
Project Description Timing Project Subsidies/Other Municipal Replacement 10% DC Eligible Available 2018- Post
Cost Recoveries Cost & BTE Shares Reduction Costs DC Reserves 2027 2027
4.10 New Park Development
4.10.1 New Park Development 2018 2018 12,443,926$ -$ 12,443,926$ -$ 1,244,393$ 11,199,534$ 11,199,534$ -$ -$
4.10.2 New Park Development 2019 2019 11,525,770$ -$ 11,525,770$ -$ 1,152,577$ 10,373,193$ 10,373,193$ -$ -$
4.10.3 New Park Development 2020 2020 10,116,019$ -$ 10,116,019$ -$ 1,011,602$ 9,104,417$ 9,104,417$ -$ -$
4.10.4 New Park Development 2021 2021 8,372,795$ -$ 8,372,795$ -$ 837,280$ 7,535,516$ -$ 7,535,516$ -$
4.10.5 New Park Development 2022 2022 13,229,343$ -$ 13,229,343$ -$ 1,322,934$ 11,906,409$ -$ 11,906,409$ -$
4.10.6 New Park Development 2023 2023 3,145,265$ -$ 3,145,265$ -$ 314,527$ 2,830,739$ -$ 2,830,739$ -$
4.10.7 New Park Development 2024 2024 5,420,659$ -$ 5,420,659$ -$ 542,066$ 4,878,593$ -$ 4,878,593$ -$
4.10.8 New Park Development 2025 2025 3,772,113$ -$ 3,772,113$ -$ 377,211$ 3,394,901$ -$ 3,394,901$ -$
4.10.9 New Park Development 2026 2026 4,047,998$ -$ 4,047,998$ -$ 404,800$ 3,643,199$ -$ -$ 3,643,199$
4.10.10 New Park Development 2027 2027 6,371,305$ -$ 6,371,305$ -$ 637,130$ 5,734,174$ -$ -$ 5,734,174$
Subtotal New Park Development 78,445,193$ -$ 78,445,193$ -$ 7,844,519$ 70,600,674$ 30,677,144$ 30,546,158$ 9,377,373$
4.11 New Playing Fields and Playgrounds
4.11.1 New Playing Fields and Playgrounds 2018 2018 6,678,724$ -$ 6,678,724$ -$ 667,872$ 6,010,851$ 6,010,851$ -$ -$
4.11.2 New Playing Fields and Playgrounds 2019 2019 10,413,773$ -$ 10,413,773$ -$ 1,041,377$ 9,372,396$ 9,372,396$ -$ -$
4.11.3 New Playing Fields and Playgrounds 2020 2020 6,664,875$ -$ 6,664,875$ -$ 666,487$ 5,998,387$ 5,998,387$ -$ -$
4.11.4 New Playing Fields and Playgrounds 2021 2021 2,515,235$ -$ 2,515,235$ -$ 251,523$ 2,263,711$ -$ 2,263,711$ -$
4.11.5 New Playing Fields and Playgrounds 2022 2022 4,843,683$ -$ 4,843,683$ -$ 484,368$ 4,359,314$ -$ 4,359,314$ -$
4.11.6 New Playing Fields and Playgrounds 2023 2023 909,576$ -$ 909,576$ -$ 90,958$ 818,619$ -$ 818,619$ -$
4.11.7 New Playing Fields and Playgrounds 2024 2024 725,781$ -$ 725,781$ -$ 72,578$ 653,203$ -$ 653,203$ -$
4.11.8 New Playing Fields and Playgrounds 2025 2025 1,716,975$ -$ 1,716,975$ -$ 171,698$ 1,545,278$ -$ 1,228,708$ 316,569$
4.11.9 New Playing Fields and Playgrounds 2026 2026 2,014,767$ -$ 2,014,767$ -$ 201,477$ 1,813,290$ -$ -$ 1,813,290$
4.11.10 New Playing Fields and Playgrounds 2027 2027 3,015,081$ -$ 3,015,081$ -$ 301,508$ 2,713,573$ -$ -$ 2,713,573$
Subtotal New Playing Fields and Playgrounds 39,498,470$ -$ 39,498,470$ -$ 3,949,847$ 35,548,623$ 21,381,635$ 9,323,556$ 4,843,432$
4.12 Trails
4.12.1 New Trail Development 2019 2019 300,000$ -$ 300,000$ -$ 30,000$ 270,000$ 270,000$ -$ -$
4.12.2 New Trail Development 2020 2020 460,000$ -$ 460,000$ -$ 46,000$ 414,000$ -$ 414,000$ -$
4.12.3 New Trail Development 2021 2021 600,000$ -$ 600,000$ -$ 60,000$ 540,000$ -$ 540,000$ -$
4.12.4 New Trail Development 2022 2022 370,000$ -$ 370,000$ -$ 37,000$ 333,000$ -$ 333,000$ -$
4.12.5 New Trail Development 2023 2023 500,000$ -$ 500,000$ -$ 50,000$ 450,000$ -$ 450,000$ -$
4.12.6 New Trail Development 2024 2024 300,000$ -$ 300,000$ -$ 30,000$ 270,000$ -$ 270,000$ -$
4.12.7 New Trail Development 2025 2025 300,000$ -$ 300,000$ -$ 30,000$ 270,000$ -$ -$ 270,000$
4.12.8 New Trail Development 2026 2026 300,000$ -$ 300,000$ -$ 30,000$ 270,000$ -$ -$ 270,000$
4.12.9 New Trail Development 2027 2027 300,000$ -$ 300,000$ -$ 30,000$ 270,000$ -$ -$ 270,000$
Subtotal Trails 3,430,000$ -$ 3,430,000$ -$ 343,000$ 3,087,000$ 270,000$ 2,007,000$ 810,000$
DC Eligible Costs
APPENDIX ETABLE 2 - PAGE 4
CITY OF VAUGHAN
COMMUNITY SERVICES
Ineligible Costs
DEVELOPMENT-RELATED CAPITAL PROGRAM
HEMSON
HEMSON
208

Gross Grants/ Net Total
Project Description Timing Project Subsidies/Other Municipal Replacement 10% DC Eligible Available 2018- Post
Cost Recoveries Cost & BTE Shares Reduction Costs DC Reserves 2027 2027
4.13 Land
4.13.1 New North Operations Centre - Land 2018 2,091,461$ -$ 2,091,461$ -$ 209,146$ 1,882,315$ 1,882,315$ -$ -$
2,091,461$ -$ 2,091,461$ -$ 209,146$ 1,882,315$ 1,882,315$ -$ -$
4.14 Operations Facilities
4.14.1 Dufferin Yard (office space & storage, additional vehicle parking & outdoo 2018 1,699,500$ -$ 1,699,500$ 339,900$ 135,960$ 1,223,640$ 1,223,640$ -$ -$
4.14.2 New North Operations Centre - Annual IO Debt Repayment - Principal On 2023 1,350,000$ -$ 1,350,000$ -$ 135,000$ 1,215,000$ -$ 1,215,000$ -$
4.14.3 New North Operations Centre - Annual IO Debt Repayment - Principal On 2024 1,350,000$ -$ 1,350,000$ -$ 135,000$ 1,215,000$ -$ 1,215,000$ -$
4.14.4 New North Operations Centre - Annual IO Debt Repayment - Principal On 2025 1,350,000$ -$ 1,350,000$ -$ 135,000$ 1,215,000$ -$ 1,215,000$ -$
4.14.5 New North Operations Centre - Annual IO Debt Repayment - Principal On 2026 1,350,000$ -$ 1,350,000$ -$ 135,000$ 1,215,000$ -$ -$ 1,215,000$
4.14.6 New North Operations Centre - Annual IO Debt Repayment - Principal On 2027 1,350,000$ -$ 1,350,000$ -$ 135,000$ 1,215,000$ -$ -$ 1,215,000$
4.14.7 Dufferin Yard 2027 14,097,725$ -$ 14,097,725$ -$ 1,409,773$ 12,687,953$ -$ -$ 12,687,953$
Subtotal Operations Facilities 22,547,225$ -$ 22,547,225$ 339,900$ 2,220,733$ 19,986,593$ 1,223,640$ 3,645,000$ 15,117,953$
4.15 Non-Roads Fleet and Related Equipment
4.15.1 Facilities Service Van 2018 57,000$ -$ 57,000$ -$ 5,700$ 51,300$ 51,300$ -$ -$
4.15.2 TSPFO - Parks - New Vehicle - Pick-up 2018 47,500$ -$ 47,500$ -$ 4,750$ 42,750$ 42,750$ -$ -$
4.15.3 TSPFO - Parks - New Vehicle - Two Trailers 2018 47,500$ -$ 47,500$ -$ 4,750$ 42,750$ 42,750$ -$ -$
4.15.4 TSPFO - Forestry - New Vehicle - Stake Truck 2018 78,000$ -$ 78,000$ -$ 7,800$ 70,200$ 70,200$ -$ -$
4.15.5 TSPFO - Parks - New Vehicle - Van 2018 57,000$ -$ 57,000$ -$ 5,700$ 51,300$ 51,300$ -$ -$
4.15.6 TSPFO - Forestry - New Vehicle - Chipper Truck 2018 155,000$ -$ 155,000$ -$ 15,500$ 139,500$ 139,500$ -$ -$
4.15.7 TSPFO - Parks - New Vehicle - Compactor 2018 186,000$ -$ 186,000$ -$ 18,600$ 167,400$ 167,400$ -$ -$
4.15.8 TSPFO - Parks - New Vehicle - Compactor 2018 186,000$ -$ 186,000$ -$ 18,600$ 167,400$ 167,400$ -$ -$
4.15.9 LI-4555-18 - VPL Courier Van 2018 62,000$ -$ 62,000$ -$ 6,200$ 55,800$ 55,800$ -$ -$
4.15.10 BY-9544-18 - By-Law Enforcement - New Vehicle - Animal Control Vehicle 2018 134,000$ -$ 134,000$ -$ 13,400$ 120,600$ 120,600$ -$ -$
4.15.11 By-Law Enforcement - New Vehicle - Animal Control Vehicle 2018 134,000$ -$ 134,000$ -$ 13,400$ 120,600$ 120,600$ -$ -$
4.15.12 By-Law Enforcement - New Vehicle - Pick-up 2018 47,500$ -$ 47,500$ -$ 4,750$ 42,750$ 42,750$ -$ -$
4.15.13 By-Law Enforcement - New Vehicle - Pick-up 2018 47,500$ -$ 47,500$ -$ 4,750$ 42,750$ -$ 42,750$ -$
4.15.14 TSPFO - Forestry - New Vehicle - Pick-up 2019 47,500$ -$ 47,500$ -$ 4,750$ 42,750$ -$ 42,750$ -$
4.15.15 TSPFO - Parks - New Vehicle - Pick-up 2019 47,500$ -$ 47,500$ -$ 4,750$ 42,750$ -$ 42,750$ -$
4.15.16 TSPFO - Forestry - New Vehicle - Trailer 2019 21,000$ -$ 21,000$ -$ 2,100$ 18,900$ -$ 18,900$ -$
4.15.17 TSPFO - Parks - New Vehicle - Trailer 2019 21,000$ -$ 21,000$ -$ 2,100$ 18,900$ -$ 18,900$ -$
4.15.18 TSPFO - Forestry - New Vehicle - Van 2019 57,000$ -$ 57,000$ -$ 5,700$ 51,300$ -$ 51,300$ -$
4.15.19 Facilities Service Van 2019 57,000$ -$ 57,000$ -$ 5,700$ 51,300$ -$ 51,300$ -$
4.15.20 By-Law Enforcement - New Vehicle - Pick-up 2019 47,500$ -$ 47,500$ -$ 4,750$ 42,750$ -$ 42,750$ -$
4.15.21 By-Law Enforcement - New Vehicle - Animal Control Vehicle 2019 134,000$ -$ 134,000$ -$ 13,400$ 120,600$ -$ 120,600$ -$
4.15.22 By-Law Enforcement - New Vehicle - Animal Control Vehicle 2019 134,000$ -$ 134,000$ -$ 13,400$ 120,600$ -$ 120,600$ -$
4.15.23 FL-5453-19 - PKS- Additional narrow sidewalk tractor with plow/salter/blow 2019 84,500$ -$ 84,500$ -$ 8,450$ 76,050$ -$ 76,050$ -$
4.15.24 FL-5455-19 - PKs- Additional narrow sidewalk tractor with winter attachme 2019 84,500$ -$ 84,500$ -$ 8,450$ 76,050$ -$ 76,050$ -$
4.15.25 FL-5456-19 - PKs- Additional narrow sidewalk tractor with winter attachm 2019 84,500$ -$ 84,500$ -$ 8,450$ 76,050$ -$ 76,050$ -$
4.15.26 FL-5457-19 - PKS- Additional narrow sidewalk tractor with wnter attachme 2019 84,500$ -$ 84,500$ -$ 8,450$ 76,050$ -$ 76,050$ -$
4.15.27 FL-5458-19 - PKS-Additional narrow sidewalk tractor with winter attachme 2019 84,500$ -$ 84,500$ -$ 8,450$ 76,050$ -$ 76,050$ -$
4.15.28 TSPFO - Parks - New Vehicle - Trailer 2020 21,000$ -$ 21,000$ -$ 2,100$ 18,900$ -$ 18,900$ -$
APPENDIX ETABLE 2 - PAGE 5
CITY OF VAUGHANDEVELOPMENT-RELATED CAPITAL PROGRAM
COMMUNITY SERVICES
Ineligible Costs DC Eligible Costs
HEMSON
HEMSON
209

Gross Grants/ Net Total
Project Description Timing Project Subsidies/Other Municipal Replacement 10% DC Eligible Available 2018- Post
Cost Recoveries Cost & BTE Shares Reduction Costs DC Reserves 2027 2027
4.15 Non-Roads Fleet and Related Equipment - cont'd
4.15.29 TSPFO - Parks - New Vehicle - Pick-up 2020 47,500$ -$ 47,500$ -$ 4,750$ 42,750$ -$ 42,750$ -$
4.15.30 TSPFO - Parks - New Vehicle - Dump Truck 2020 145,000$ -$ 145,000$ -$ 14,500$ 130,500$ -$ 130,500$ -$
4.15.31 By-Law Enforcement - New Vehicle - Pick-up 2020 47,500$ -$ 47,500$ -$ 4,750$ 42,750$ -$ 42,750$ -$
4.15.32 FL-5440-20 - PKS- Additional salt supply systems 2020 27,000$ -$ 27,000$ -$ 2,700$ 24,300$ -$ 24,300$ -$
4.15.33 TSPFO - Forestry - New Vehicle - Dump Truck 2021 145,000$ -$ 145,000$ -$ 14,500$ 130,500$ -$ 130,500$ -$
4.15.34 TSPFO - Forestry - New Vehicle - Pick-up 2021 47,500$ -$ 47,500$ -$ 4,750$ 42,750$ -$ 42,750$ -$
4.15.35 TSPFO - Parks - New Vehicle - Pick-up 2021 47,500$ -$ 47,500$ -$ 4,750$ 42,750$ -$ 42,750$ -$
4.15.36 TSPFO - Parks - New Vehicle - Trailer 2021 21,000$ -$ 21,000$ -$ 2,100$ 18,900$ -$ 18,900$ -$
4.15.37 TSPFO - Forestry - New Vehicle - Trailer 2021 21,000$ -$ 21,000$ -$ 2,100$ 18,900$ -$ 18,900$ -$
4.15.38 By-Law Enforcement - New Vehicle - Pick-up 2021 47,500$ -$ 47,500$ -$ 4,750$ 42,750$ -$ 42,750$ -$
4.15.39 By-Law Enforcement - New Vehicle - Pick-up 2022 47,500$ -$ 47,500$ -$ 4,750$ 42,750$ -$ 42,750$ -$
4.15.40 TSPFO - Parks - New Vehicle - Pick-up 2022 47,500$ -$ 47,500$ -$ 4,750$ 42,750$ -$ 42,750$ -$
4.15.41 TSPFO - Parks - New Vehicle - Trailer 2022 21,000$ -$ 21,000$ -$ 2,100$ 18,900$ -$ 18,900$ -$
4.15.42 By-Law Enforcement - New Vehicle - Animal Control Vehicle 2022 134,000$ -$ 134,000$ -$ 13,400$ 120,600$ -$ 120,600$ -$
4.15.43 By-Law Enforcement - New Vehicle - Animal Control Vehicle 2022 134,000$ -$ 134,000$ -$ 13,400$ 120,600$ -$ 120,600$ -$
4.15.44 By-Law Enforcement - New Vehicle - Animal Control Vehicle 2022 134,000$ -$ 134,000$ -$ 13,400$ 120,600$ -$ 120,600$ -$
4.15.45 By-Law Enforcement - New Vehicle - Pick-up 2023 47,500$ -$ 47,500$ -$ 4,750$ 42,750$ -$ 42,750$ -$
4.15.46 TSPFO - Forestry - New Vehicle - Pick-up 2023 47,500$ -$ 47,500$ -$ 4,750$ 42,750$ -$ 42,750$ -$
4.15.47 TSPFO - Parks - New Vehicle - Pick-up 2023 47,500$ -$ 47,500$ -$ 4,750$ 42,750$ -$ 42,750$ -$
4.15.48 TSPFO - Parks - New Vehicle - Dump Truck 2023 145,000$ -$ 145,000$ -$ 14,500$ 130,500$ -$ 130,500$ -$
4.15.49 TSPFO - Parks - New Vehicle - Two Trailers 2023 42,000$ -$ 42,000$ -$ 4,200$ 37,800$ -$ 37,800$ -$
4.15.50 TSPFO - Forestry - New Vehicle - Trailer 2023 21,000$ -$ 21,000$ -$ 2,100$ 18,900$ -$ 18,900$ -$
4.15.51 TSPFO - Forestry - New Vehicle - Stake Truck 2023 77,500$ -$ 77,500$ -$ 7,750$ 69,750$ -$ 69,750$ -$
4.15.52 TSPFO - Parks - New Vehicle - Van 2023 57,000$ -$ 57,000$ -$ 5,700$ 51,300$ -$ 51,300$ -$
4.15.53 TSPFO - Parks - New Vehicle - Compactor 2023 185,500$ -$ 185,500$ -$ 18,550$ 166,950$ -$ 166,950$ -$
4.15.54 By-Law Enforcement - New Vehicle - Pick-up 2024 47,500$ -$ 47,500$ -$ 4,750$ 42,750$ -$ 42,750$ -$
COMMUNITY SERVICES
Ineligible Costs DC Eligible Costs
APPENDIX ETABLE 2 - PAGE 6
CITY OF VAUGHANDEVELOPMENT-RELATED CAPITAL PROGRAM
HEMSON
HEMSON
210

Gross Grants/ Net Total
Project Description Timing Project Subsidies/Other Municipal Replacement 10% DC Eligible Available 2018- Post
Cost Recoveries Cost & BTE Shares Reduction Costs DC Reserves 2027 2027
4.15 Non-Roads Fleet and Related Equipment - cont'd
4.15.55 TSPFO - Parks - New Vehicle - Two Pick-ups 2024 95,000$ -$ 95,000$ -$ 9,500$ 85,500$ -$ 85,500$ -$
4.15.56 TSPFO - Parks - New Vehicle - Two Trailers 2024 47,500$ -$ 47,500$ -$ 4,750$ 42,750$ -$ 42,750$ -$
4.15.57 TSPFO - Forestry - New Vehicle - Van 2024 57,000$ -$ 57,000$ -$ 5,700$ 51,300$ -$ 51,300$ -$
4.15.58 By-Law Enforcement - New Vehicle - Pick-up 2025 47,500$ -$ 47,500$ -$ 4,750$ 42,750$ -$ 42,750$ -$
4.15.59 TSPFO - Forestry - New Vehicle - Pick-up 2025 47,500$ -$ 47,500$ -$ 4,750$ 42,750$ -$ 42,750$ -$
4.15.60 TSPFO - Parks - New Vehicle - Two Pick-ups 2025 95,000$ -$ 95,000$ -$ 9,500$ 85,500$ -$ 85,500$ -$
4.15.61 TSPFO - Forestry - New Vehicle - Trailer 2025 21,000$ -$ 21,000$ -$ 2,100$ 18,900$ -$ 18,900$ -$
4.15.62 TSPFO - Parks - New Vehicle - Trailer 2025 21,000$ -$ 21,000$ -$ 2,100$ 18,900$ -$ 18,900$ -$
4.15.63 By-Law Enforcement - New Vehicle - Pick-up 2026 47,500$ -$ 47,500$ -$ 4,750$ 42,750$ -$ -$ 42,750$
4.15.64 TSPFO - Parks - New Vehicle - Two Pick-ups 2026 95,000$ -$ 95,000$ -$ 9,500$ 85,500$ -$ -$ 85,500$
4.15.65 TSPFO - Parks - New Vehicle - Dump Truck 2026 145,000$ -$ 145,000$ -$ 14,500$ 130,500$ -$ -$ 130,500$
4.15.66 TSPFO - Parks - New Vehicle - Two Trailers 2026 47,500$ -$ 47,500$ -$ 4,750$ 42,750$ -$ -$ 42,750$
4.15.67 By-Law Enforcement - New Vehicle - Pick-up 2027 47,500$ -$ 47,500$ -$ 4,750$ 42,750$ -$ -$ 42,750$
4.15.68 TSPFO - Forestry - New Vehicle - Pick-up 2027 47,500$ -$ 47,500$ -$ 4,750$ 42,750$ -$ -$ 42,750$
4.15.69 TSPFO - Parks - New Vehicle - Two Pick-ups 2027 95,000$ -$ 95,000$ -$ 9,500$ 85,500$ -$ -$ 85,500$
4.15.70 TSPFO - Forestry - New Vehicle - Trailer 2027 21,000$ -$ 21,000$ -$ 2,100$ 18,900$ -$ -$ 18,900$
4.15.71 TSPFO - Parks - New Vehicle - Trailer 2027 21,000$ -$ 21,000$ -$ 2,100$ 18,900$ -$ -$ 18,900$
Subtotal Non-Roads Fleet and Related Equipment 5,080,000$ -$ 5,080,000$ -$ 508,000$ 4,572,000$ 1,072,350$ 2,989,350$ 510,300$
SUBTOTAL PARKS AND DEVELOPMENT 171,865,532$ -$ 171,865,532$ 339,900$ 17,152,563$ 154,373,069$ 75,202,948$ 48,511,064$ 30,659,058$
TOTAL COMMUNITY SERVICES 510,654,931$ -$ 510,654,931$ 3,860,717$ 50,679,421$ 456,114,793$ 116,992,448$ 243,200,748$ 95,921,597$
Residential Development Charge Calculation
Residential Share of 2018 - 2027 DC Eligible Costs 100% $243,200,748 2018 - 2027 Net Funding Envelope $243,200,748
10-Year Growth in Population in New Units 70,498
Unadjusted Development Charge Per Capita $3,449.77 Reserve Fund Balance
Reserve Fund Balance Before Commitments 116,992,448Non-Residential Development Charge Calculation 2017 Committed Capital Budget Draws (31,788,043)
Non-Residential Share of 2018 - 2027 DC Eligible Costs 0% $0 Total Uncommitted Reserve Funds (as at Dec 31 2017) 85,204,40510-Year Growth in Square Metres 2,803,031
Unadjusted Development Charge Per Square Metre $0.00
APPENDIX ETABLE 2 - PAGE 7
CITY OF VAUGHANDEVELOPMENT-RELATED CAPITAL PROGRAM
COMMUNITY SERVICES
Ineligible Costs DC Eligible Costs
HEMSON
HEMSON
211
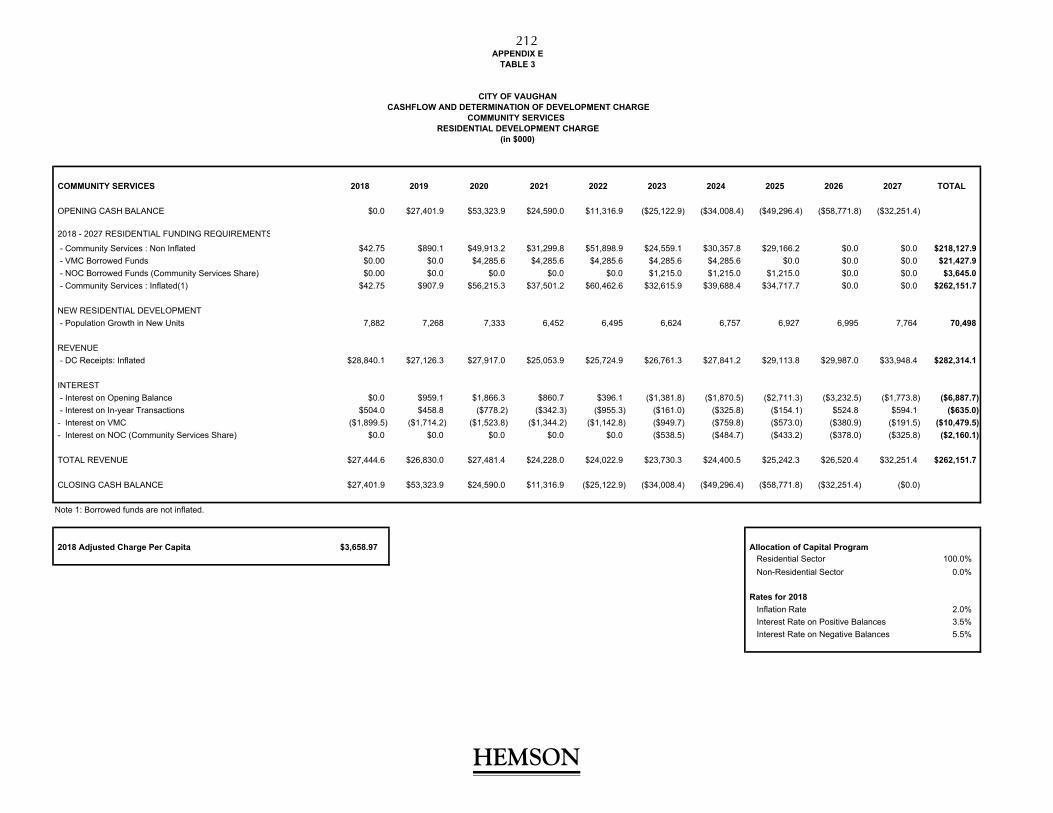
APPENDIX ETABLE 3
COMMUNITY SERVICES 2018 2019 2020 2021 2022 2023 2024 2025 2026 2027 TOTAL
OPENING CASH BALANCE $0.0 $27,401.9 $53,323.9 $24,590.0 $11,316.9 ($25,122.9) ($34,008.4) ($49,296.4) ($58,771.8) ($32,251.4)
2018 - 2027 RESIDENTIAL FUNDING REQUIREMENTS
- Community Services : Non Inflated $42.75 $890.1 $49,913.2 $31,299.8 $51,898.9 $24,559.1 $30,357.8 $29,166.2 $0.0 $0.0 $218,127.9
- VMC Borrowed Funds $0.00 $0.0 $4,285.6 $4,285.6 $4,285.6 $4,285.6 $4,285.6 $0.0 $0.0 $0.0 $21,427.9
- NOC Borrowed Funds (Community Services Share) $0.00 $0.0 $0.0 $0.0 $0.0 $1,215.0 $1,215.0 $1,215.0 $0.0 $0.0 $3,645.0
- Community Services : Inflated(1) $42.75 $907.9 $56,215.3 $37,501.2 $60,462.6 $32,615.9 $39,688.4 $34,717.7 $0.0 $0.0 $262,151.7
NEW RESIDENTIAL DEVELOPMENT
- Population Growth in New Units 7,882 7,268 7,333 6,452 6,495 6,624 6,757 6,927 6,995 7,764 70,498
REVENUE
- DC Receipts: Inflated $28,840.1 $27,126.3 $27,917.0 $25,053.9 $25,724.9 $26,761.3 $27,841.2 $29,113.8 $29,987.0 $33,948.4 $282,314.1
INTEREST
- Interest on Opening Balance $0.0 $959.1 $1,866.3 $860.7 $396.1 ($1,381.8) ($1,870.5) ($2,711.3) ($3,232.5) ($1,773.8) ($6,887.7)
- Interest on In-year Transactions $504.0 $458.8 ($778.2) ($342.3) ($955.3) ($161.0) ($325.8) ($154.1) $524.8 $594.1 ($635.0)
- Interest on VMC ($1,899.5) ($1,714.2) ($1,523.8) ($1,344.2) ($1,142.8) ($949.7) ($759.8) ($573.0) ($380.9) ($191.5) ($10,479.5)
- Interest on NOC (Community Services Share) $0.0 $0.0 $0.0 $0.0 $0.0 ($538.5) ($484.7) ($433.2) ($378.0) ($325.8) ($2,160.1)
TOTAL REVENUE $27,444.6 $26,830.0 $27,481.4 $24,228.0 $24,022.9 $23,730.3 $24,400.5 $25,242.3 $26,520.4 $32,251.4 $262,151.7
CLOSING CASH BALANCE $27,401.9 $53,323.9 $24,590.0 $11,316.9 ($25,122.9) ($34,008.4) ($49,296.4) ($58,771.8) ($32,251.4) ($0.0)
Note 1: Borrowed funds are not inflated.
2018 Adjusted Charge Per Capita $3,658.97 Allocation of Capital ProgramResidential Sector 100.0%
Non-Residential Sector 0.0%
Rates for 2018
Inflation Rate 2.0%
Interest Rate on Positive Balances 3.5%
Interest Rate on Negative Balances 5.5%
(in $000)
CITY OF VAUGHANCASHFLOW AND DETERMINATION OF DEVELOPMENT CHARGE
COMMUNITY SERVICES RESIDENTIAL DEVELOPMENT CHARGE
HEMSON
HEMSON
212
APPENDIX F
PUBLIC WORKS: BUILDINGS AND FLEET
HEMSON
213

APPENDIX F
PUBLIC WORKS: BUILDINGS AND FLEET
This appendix covers the yards and fleet components of the City’s operations. The Public Works Department operates from several works yards located throughout the City to provide repair and maintenance services for roads, sidewalks, streetlights and other infrastructure. The City also operates a centralized fleet maintenance operation for the vehicles of nearly all municipal departments, with the exception of the Fire department which maintains its own rolling stock. The works buildings and fleet maintenance functions referred to in this section are solely related to the provision of Public Works services. Non public works fleets (i.e. parks) are accounted for in the Community Services inventory and capital program in Appendix E. Information regarding roads and related infrastructure can be found in Appendix G.
TABLE 1 HISTORICAL SERVICE LEVELS
The Public Works department operates out of three primary locations: Woodbridge Works Building, the Joint Operations Centre and the Dufferin Yard. Fire Station 7-4 is used as storage for the Public Works service. The current inventory of capital assets for Public Works includes approximately 96,400 square feet of building space, including salt domes, with a replacement value of $19.8 million (Page 1). The 13.7 hectares of land associated with the Public Works yards is valued at $82.8 million. The 179 vehicles used by the public works departments (i.e. excluding fire, community services, etc.) and as well as those vehicles contracted for service add an additional $25.7 million to the value of the capital assets (Pages 2-7). The vehicles that are owned by the City account for $13.2 million of this total, while leased vehicles account for $12.5 million (Page 7). Finally, the Public Works fixed equipment adds $155,000 to the value of the inventory.
As shown on Page 8, the total value of the Public Works capital asset inventory is $128.5 million. The ten-year historical average service level is $248.48 per capita and employee, and this, multiplied by the ten-year forecast growth in net population and employment, results in a ten-year maximum allowable funding envelope of $27.1 million. Under the Development Charges Act, 1997, services related to a highway as defined in subsection 1(1) of the Municipal Act, 2001, need not to be reduced by the
HEMSON
214
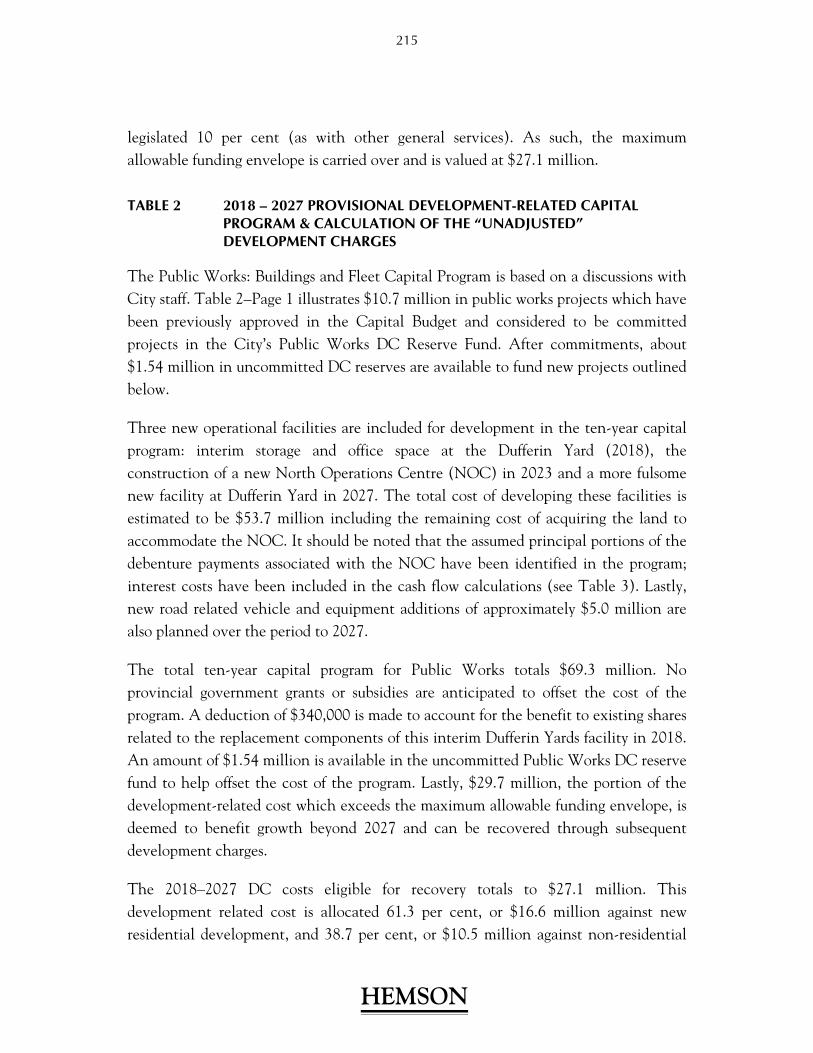
legislated 10 per cent (as with other general services). As such, the maximum allowable funding envelope is carried over and is valued at $27.1 million.
TABLE 2 2018 – 2027 PROVISIONAL DEVELOPMENT-RELATED CAPITAL PROGRAM & CALCULATION OF THE “UNADJUSTED” DEVELOPMENT CHARGES
The Public Works: Buildings and Fleet Capital Program is based on a discussions with City staff. Table 2–Page 1 illustrates $10.7 million in public works projects which have been previously approved in the Capital Budget and considered to be committed projects in the City’s Public Works DC Reserve Fund. After commitments, about $1.54 million in uncommitted DC reserves are available to fund new projects outlined below.
Three new operational facilities are included for development in the ten-year capital program: interim storage and office space at the Dufferin Yard (2018), the construction of a new North Operations Centre (NOC) in 2023 and a more fulsome new facility at Dufferin Yard in 2027. The total cost of developing these facilities is estimated to be $53.7 million including the remaining cost of acquiring the land to accommodate the NOC. It should be noted that the assumed principal portions of the debenture payments associated with the NOC have been identified in the program; interest costs have been included in the cash flow calculations (see Table 3). Lastly, new road related vehicle and equipment additions of approximately $5.0 million are also planned over the period to 2027.
The total ten-year capital program for Public Works totals $69.3 million. No provincial government grants or subsidies are anticipated to offset the cost of the program. A deduction of $340,000 is made to account for the benefit to existing shares related to the replacement components of this interim Dufferin Yards facility in 2018. An amount of $1.54 million is available in the uncommitted Public Works DC reserve fund to help offset the cost of the program. Lastly, $29.7 million, the portion of the development-related cost which exceeds the maximum allowable funding envelope, is deemed to benefit growth beyond 2027 and can be recovered through subsequent development charges.
The 2018–2027 DC costs eligible for recovery totals to $27.1 million. This development related cost is allocated 61.3 per cent, or $16.6 million against new residential development, and 38.7 per cent, or $10.5 million against non-residential
HEMSON
215
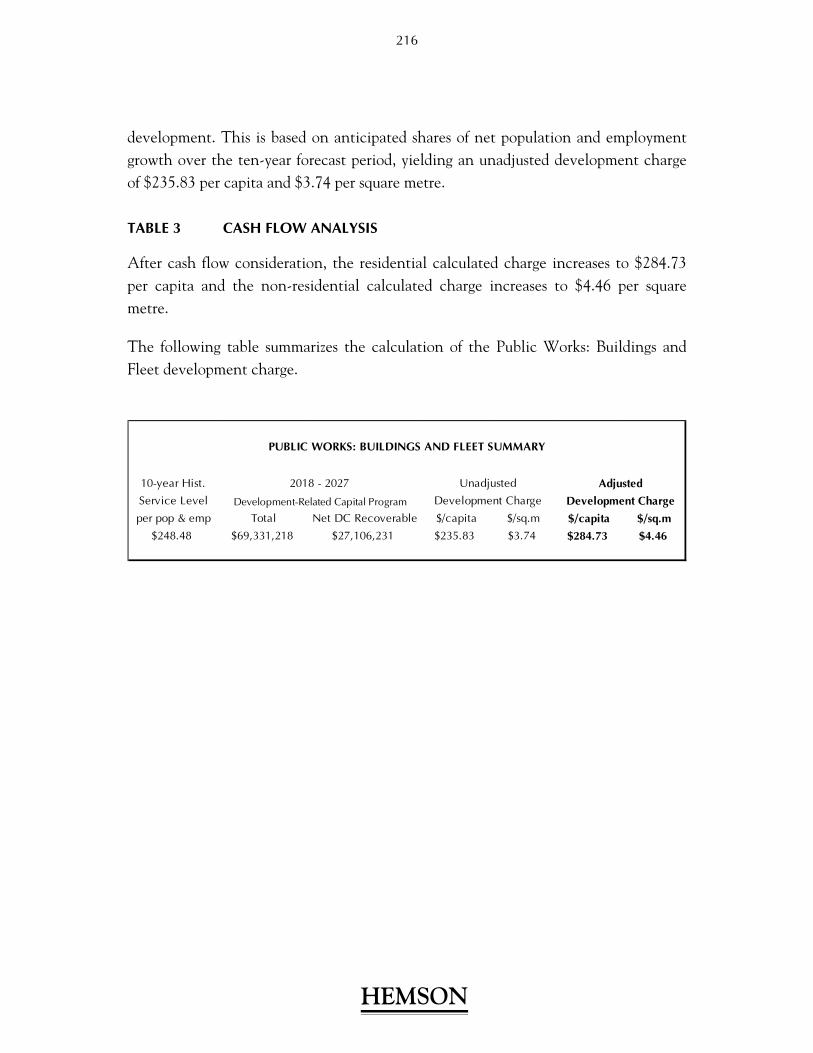
development. This is based on anticipated shares of net population and employment growth over the ten-year forecast period, yielding an unadjusted development charge of $235.83 per capita and $3.74 per square metre.
TABLE 3 CASH FLOW ANALYSIS
After cash flow consideration, the residential calculated charge increases to $284.73 per capita and the non-residential calculated charge increases to $4.46 per square metre.
The following table summarizes the calculation of the Public Works: Buildings and Fleet development charge.
10-year Hist.
Service Level Development-Related Capital Program
per pop & emp Total Net DC Recoverable $/capita $/sq.m $/capita $/sq.m
$248.48 $69,331,218 $27,106,231 $235.83 $3.74 $284.73 $4.46
2018 - 2027 Unadjusted Adjusted
PUBLIC WORKS: BUILDINGS AND FLEET SUMMARY
Development Charge Development Charge
HEMSON
216

BUILDINGS UNIT COST
Works Department 2008 2009 2010 2011 2012 2013 2014 2015 2016 2017 ($/sq.ft)
- Woodbridge Works Building (4630 Langstaff Road) 5,806 5,806 5,806 5,806 5,806 5,806 5,806 5,806 5,806 5,806 $275
- Woodbridge Salt Dome (4630 Langstaff Road) 9,681 9,681 9,681 9,681 9,681 9,681 9,681 9,681 9,681 9,681 $60
- JOC Public Works Admin (2800 Rutherford Road) 12,706 20,821 20,821 20,821 20,821 20,821 20,821 20,821 20,821 20,821 $325
- JOC Other Space (2800 Rutherford Road) 65,227 24,024 24,024 24,024 24,024 24,024 24,024 24,024 24,024 24,024 $325
- JOC Salt Domes (2800 Rutherford Road) 21,146 21,146 21,146 21,146 21,146 21,146 21,146 21,146 21,146 21,146 $60
- Dufferin Yard (e. of Hwy 407) - - - - - - - - 2,336 2,336 $275
- Dufferin Yard Salt Dome (e. of Hwy 407) 11,126 11,126 11,126 11,126 11,126 11,126 11,126 11,126 11,126 11,126 $60
- Station 7-4 (Kleinburg) - PW Storage - - - - - - 1,461 1,461 1,461 1,461 $335
Total (sq. ft.) 125,692 92,603 92,603 92,603 92,603 92,603 94,064 94,064 96,400 96,400
Total ($000) $29,442.1 $18,688.2 $18,688.2 $18,688.2 $18,688.2 $18,688.2 $19,177.7 $19,177.7 $19,820.1 $19,820.1
LAND UNIT COST
Works Department 2008 2009 2010 2011 2012 2013 2014 2015 2016 2017 ($/ha)
- Woodbridge Works Building (4630 Langstaff Road) 1.15 1.15 1.15 1.15 1.15 1.15 1.15 1.15 1.15 1.15 $3,088,708
- JOC (2800 Rutherford Road) 8.03 5.48 5.48 5.48 5.48 5.48 5.48 5.48 5.48 5.48 $6,300,964
- Dufferin Yard (e. of Hwy 407) 4.08 4.08 4.08 4.08 4.08 4.08 4.08 4.08 4.08 4.08 $6,300,964
- Langstaff Snow Dump (w. Of Hwy 27) 2.78 2.78 2.78 2.78 2.78 2.78 2.78 2.78 2.78 2.78 $6,300,964
- Station 7-4 (Kleinburg) - PW Storage 0.00 0.00 0.00 0.00 0.00 0.00 0.25 0.25 0.25 0.25 $6,300,964
Total (ha) 16.04 13.48 13.48 13.48 13.48 13.48 13.73 13.73 13.73 13.73
Total ($000s) $97,357.2 $81,262.1 $81,262.1 $81,262.1 $81,262.1 $81,262.1 $82,837.4 $82,837.4 $82,837.4 $82,837.4
Fixed Equipment
Works Department 2008 2009 2010 2011 2012 2013 2014 2015 2016 2017
JOC: Generators (1/2 cost, shared with PW) $62,500 $62,500 $62,500 $62,500 $62,500 $62,500 $62,500 $62,500 $62,500 $62,500
Other Equipment $69,000 $69,000 $69,000 $69,000 $69,000 $69,000 $69,000 $69,000 $69,000 $92,000
Total ($000s) $131.5 $131.5 $131.5 $131.5 $131.5 $131.5 $131.5 $131.5 $131.5 $154.5
# of Square Feet
Cost in thousands
# of Hectares
APPENDIX FTABLE 1 - PAGE 1
CITY OF VAUGHANINVENTORY OF CAPITAL ASSETS
PUBLIC WORKS: BUILDINGS AND FLEET
HEMSON
HEMSON
217

Roads Inventory Model UNIT COST
Department Division Number Year Description 2008 2009 2010 2011 2012 2013 2014 2015 2016 2017 ($/Vehicle)
DEV. SERV. & PUBLIC WOENGCONST 1557 2006 7847RK-PICKUP CHEVROLET 2006 1 1 1 1 1 1 1 1 1 1 $40,000
DEV. SERV. & PUBLIC WOENGCONST 1558 2006 7846RK-PICKUP CHEVROLET 2006 1 1 1 1 1 1 1 1 1 1 $40,000
DEV. SERV. & PUBLIC WOENGCONST 1588 2006 6831TC-PICKUP RAM QUAD 2006 1 1 1 1 1 1 1 1 1 1 $40,000
DEV. SERV. & PUBLIC WOENGCONST 1632 2006 9524TE-PICKUP DODGE DAKOTA 06 1 1 1 1 1 1 1 1 1 1 $40,000
DEV. SERV. & PUBLIC WOPUBLIC WORKS 1661 2007 5627TK-PICKUP DODGE DAKOTA 1 1 1 1 1 1 1 1 1 1 $40,000
DEV. SERV. & PUBLIC WOROADS 1523 2005 3023RC-PICKUP FORD RANGER 1 1 1 1 1 1 1 0 0 0 $40,000
DEV. SERV. & PUBLIC WOROADS 1527 2005 3922NS-PICKUP 1/2 TON 1 1 1 1 1 1 1 1 1 1 $40,000
DEV. SERV. & PUBLIC WOROADS 1658 2006 6098TM-PICKUP F250 4X4 1 1 1 1 1 0 0 0 0 0 $47,500
DEV. SERV. & PUBLIC WOROADS 1677 2007 9572VA-DUMP STERLING 1 1 1 1 1 1 1 1 1 1 $210,930
DEV. SERV. & PUBLIC WOROADS 1678 2007 9573VA-DUMP STERLING 1 1 1 1 1 1 1 1 1 1 $210,930
DEV. SERV. & PUBLIC WOENG 1364 2003 Pickup Dodge Dakota 1 1 1 1 1 1 1 1 1 1 $40,000
DEV. SERV. & PUBLIC WOENG 1365 2003 Pickup Dodge Dakota 1 1 1 1 1 1 1 1 1 1 $40,000
DEV. SERV. & PUBLIC WOENG 1366 2003 Pickup Dodge Dakota 1 1 1 1 1 1 1 1 1 0 $40,000
DEV. SERV. & PUBLIC WOENG 1398 2003 Pickup Dodge Dakota 1 1 1 1 1 1 1 1 1 0 $37,389
DEV. SERV. & PUBLIC WOROADS 730 1988 Mower Flail 1 1 0 0 0 0 0 0 0 0 $35,720
DEV. SERV. & PUBLIC WOROADS 869 1994 Dump Truck Intl. 1 1 1 0 0 0 0 0 0 0 $67,570
DEV. SERV. & PUBLIC WOROADS 1321 2002 Sweeper Broom Cleansweep 1 1 1 0 0 0 0 0 0 0 $44,483
DEV. SERV. & PUBLIC WOROADS 1344 2002 Sweeper Chassie & Cab Street 1 1 1 1 1 1 1 1 1 1 $425,000
DEV. SERV. & PUBLIC WOROADS 1363 2003 Pickup Dodge Dakota 1 1 1 1 1 1 1 0 0 0 $40,000
DEV. SERV. & PUBLIC WOROADS 1373 2003 Sweeper Chassie & Cab Street 1 1 1 1 1 1 1 1 1 1 $425,000
DEV. SERV. & PUBLIC WOROADS 1443 2004 Pickup Flord F250 8' Box 1 1 1 0 0 0 0 0 0 0 $49,664
DEV. SERV. & PUBLIC WOROADS 1473 2003 Asphalt Grinder 1 1 1 1 1 1 1 1 1 1 $27,253
DEV. SERV. & PUBLIC WOROADS 1494 2004 Flow Spreder Sno-Way 1 1 1 0 0 0 0 0 0 0 $3,942
DEV. SERV. & PUBLIC WOROADS 1508 2005 STACKER CONVEYOR 2005 1 1 1 1 1 1 1 1 1 1 $129,621
DEV. SERV. & PUBLIC WOROADS 1587 2006 ROLLER ASPHALT DYNAPAC 1 1 1 1 1 1 1 1 1 1 $46,511
DEV. SERV. & PUBLIC WOROADS 1666 2006 PLATE TAMPER DYNAPAC 1 1 1 1 1 1 1 1 1 1 $3,153
DEV. SERV. & PUBLIC WOWASTE 1370 2003 Pickup F150 Ford 1 1 1 1 1 1 1 1 1 1 $40,000
ENGINEERING ENGC 946 1996 Compact Pickup Truck 1 1 0 0 0 0 0 0 0 0 $40,000
ENGINEERING ENGC 1047 1999 Compact Pickup 1 1 0 0 0 0 0 0 0 0 $40,000
ENGINEERING ENGC 1088 1999 Mid-size Car 1 1 1 1 1 1 1 1 0 0 $40,000
ENGINEERING ENGC 1268 2001 Dodge Dakota Ext. Cab 1 1 1 1 1 1 1 1 1 0 $40,000
ENGINEERING ENGC 1270 2001 1/2 Ton Pickup 1 1 1 1 1 1 1 0 0 0 $40,000
ENGINEERING ENGDEVTRANS 1086 2000 3/4 Ton Pickup 1 1 1 1 1 1 1 1 1 1 $42,500
ENGINEERING PWADMIN 1034 1998 Compact Pickup 1 1 1 0 0 0 0 0 0 0 $40,000
ENGINEERING PWADMIN 1059 1999 3/4 Ton Pickup 1 1 1 1 1 1 1 1 1 1 $42,500
PUBLIC WORKS EMERMGMT 1505 2005 AVLN576-VAN DODGE GRAND CARAVA 1 1 1 1 1 1 1 1 1 1 $40,000
PUBLIC WORKS ENGCONST 2060 2011 TRAFFIC COUNTER 0 0 0 1 1 1 1 1 1 1 $1,802
PUBLIC WORKS ENGCONST 2061 2011 TRAFFIC COUNTER 0 0 0 1 $1,802
PUBLIC WORKS ENGCONST 2062 2011 TRAFFIC COUNTER 0 0 0 1 1 1 1 1 0 0 $1,802
PUBLIC WORKS ENGCONST 2063 2011 TRAFFIC COUNTER 0 0 0 1 1 1 1 1 1 1 $1,802
PUBLIC WORKS ENGCONST 2064 2011 CAMERA MOBILE 0 0 0 1 1 1 1 1 1 1 $11,036
PUBLIC WORKS ENGCONST 1890 2008 TRAFFIC COUNTER 1 1 0 0 0 0 0 0 0 0 $2,330
PUBLIC WORKS ENGCONST 1891 2008 TRAFFIC COUNTER 1 1 0 0 0 0 0 0 0 0 $2,330
Total Number of Vehicles
APPENDIX F
TABLE 1 - PAGE 2
CITY OF VAUGHAN
INVENTORY OF CAPITAL ASSETS
PUBLIC WORKS: BUILDINGS AND FLEET
CITY FLEET: ROADS DEPARTMENT
HEMSON
HEMSON
218

Roads Inventory Model UNIT COST
Department Division Number Year Description 2008 2009 2010 2011 2012 2013 2014 2015 2016 2017 ($/Vehicle)
PUBLIC WORKS ENGDEVTRANS 1982 2010 PICKUP DODGE 4X2 W/ CAB 0 0 1 1 1 1 1 1 1 1 $22,185
PUBLIC WORKS ENGDEVTRANS 12508 2016 PICKUP 1/2 TON 4X2 CREW CAB 0 0 0 0 0 0 0 0 1 1 $42,000
PUBLIC WORKS ENGDEVTRANS 12510 2016 PICKUP 1/2 TON 4X4 CREW CAB 0 0 0 0 0 0 0 0 1 1 $42,000
PUBLIC WORKS ENGDEVTRANS 12511 2016 PICKUP 1/2 TON 4X4 CREW CAB 0 0 0 0 0 0 0 0 1 1 $42,000
PUBLIC WORKS ENGDEVTRANS 12516 2017 PICKUP 1/2 TON 4X4 CREW CAB 0 0 0 0 0 0 0 0 0 1 $42,000
PUBLIC WORKS ENGSERVICES 1814 2009 PICKUP DODGE DAKOTA 0 1 1 1 1 1 1 1 1 1 $40,000
PUBLIC WORKS ENGSERVICES 1887 2007 TRAFFIC COUNTER 1 1 1 1 1 1 1 1 1 1 $2,478
PUBLIC WORKS ENGSERVICES 1888 2008 TRAFFIC COUNTER 1 1 1 1 1 1 1 1 1 1 $2,365
PUBLIC WORKS ENGSERVICES 1889 2008 TRAFFIC COUNTER 1 1 1 1 1 1 1 1 0 0 $2,365
PUBLIC WORKS FLEET 226 1973 Fudat 6 Ton Trailer 1 0 0 0 0 0 0 0 0 0 $15,879
PUBLIC WORKS INFRADELIV 2182 2013 PICKUP 1/2 TON EXT CAB 0 0 0 0 1 1 1 1 1 1 $40,000
PUBLIC WORKS INFRADELIV 2308 2014 PICKUP 1/2 TON 4X2 0 0 0 0 0 1 1 1 1 1 $40,000
PUBLIC WORKS INFRADELIV 12503 2016 PICKUP 1/2 TON 4X2 CREW CAB 0 0 0 0 0 0 0 0 1 1 $40,000
PUBLIC WORKS INFRADELIV 12504 2016 PICKUP 1/2 TON 4X2 CREW CAB 0 0 0 0 0 0 0 0 1 1 $40,000
PUBLIC WORKS INFRADELIV 12515 2016 PICKUP 1/2 TON 4X2 CREW CAB 0 0 0 0 0 0 0 0 1 1 $40,000
PUBLIC WORKS ITM 1873 2010 VAN MINI DODGE STOW N GO 0 0 1 1 1 1 1 1 1 1 $40,000
PUBLIC WORKS PWADMIN 1816 2009 PICKUP DODGE DAKOTA 0 1 1 1 1 1 1 1 1 1 $40,000
PUBLIC WORKS PWADMIN 1840 2009 PICKUP DODGE DAKOTA 0 1 1 1 1 1 1 1 1 1 $40,000
PUBLIC WORKS PWADMIN 1896 2010 PICKUP DODGE DAKOTA 0 0 1 1 1 1 1 1 1 1 $40,000
PUBLIC WORKS PWADMIN 12502 2016 PICKUP 1/2 TON 4X2 CREW CAB 0 0 0 0 0 0 0 0 1 1 $40,000
PUBLIC WORKS RDSCENTRAL 13512 2016 PICKUP 3/4 TON W/PLOW 0 0 0 0 0 0 0 0 1 1 $55,000
PUBLIC WORKS RDSEAST 1838 2009 TRIMMER LINE STIHL 0 1 1 1 1 1 1 1 1 1 $356
PUBLIC WORKS RDSEAST 1839 2009 TRIMMER LINE STIHL 0 1 1 1 1 1 1 1 1 1 $356
PUBLIC WORKS RDSEAST 2104 2012 LOADER SKID STEER 0 0 0 0 1 1 1 1 1 1 $50,000
PUBLIC WORKS RDSEAST 2175 2012 SAW CUT QUICK STIHL 0 0 0 0 1 1 1 1 1 1 $982
PUBLIC WORKS RDSEAST 2191 2012 PICKUP 1/2 TON 4X4 0 0 0 0 1 1 1 1 1 1 $42,000
PUBLIC WORKS RDSEAST 2196 2012 PICKUP FORD 4X4 W/PLOW 0 0 0 0 1 1 1 1 1 1 $55,500
PUBLIC WORKS RDSEAST 2214 2012 TRUCK BED SALT SPREADER 0 0 0 0 1 1 1 1 1 0 $6,050
PUBLIC WORKS RDSEAST 2287 2014 PICKUP 3/4 TON 4X4 W/PLOW 0 0 0 0 0 1 1 1 1 1 $55,500
PUBLIC WORKS RDSEAST 2291 2014 DUMP 10 TON 0 0 0 0 0 1 1 1 1 1 $300,000
PUBLIC WORKS RDSEAST 2301 2014 PICKUP 1/2 TON 4X4 0 0 0 0 0 1 1 1 1 1 $42,000
PUBLIC WORKS RDSEAST 2302 2014 PICKUP 1/2 TON 4X4 0 0 0 0 0 1 1 1 1 1 $42,000
PUBLIC WORKS RDSEAST 12517 2017 PICKUP 1/2 TON 4X4 CREW CAB 0 0 0 0 0 0 0 0 0 1 $42,000
PUBLIC WORKS RDSEAST 16501 2016 DUMP 4X4 2 TON 0 0 0 0 0 0 0 0 1 1 $75,000
PUBLIC WORKS RDSEAST 22000 2014 SWEEPER 0 0 0 0 0 0 1 1 1 1 $425,000
PUBLIC WORKS RDSEAST 31000 2014 GRADALL 0 0 0 0 0 0 1 1 1 1 $420,840
PUBLIC WORKS RDSEAST 40043 2016 TRIMMER LINE STIHL 0 0 0 0 0 0 0 0 1 1 $382
PUBLIC WORKS RDSEAST 40044 2016 TRIMMER LINE STIHL 0 0 0 0 0 0 0 0 1 1 $382
PUBLIC WORKS RDSEAST 40045 2016 CHAIN SAW STIHL 0 0 0 0 0 0 0 0 1 1 $187
PUBLIC WORKS RDSWEST 2109 2012 TRIMMER LINE 0 0 0 0 1 1 1 1 1 1 $442
PUBLIC WORKS RDSWEST 2110 2012 TRIMMER LINE 0 0 0 0 1 1 1 1 1 1 $442
PUBLIC WORKS RDSWEST 2197 2012 PICKUP FORD 4X4 W/PLOW 0 0 0 0 1 1 1 1 1 1 $55,500
PUBLIC WORKS RDSWEST 2216 2013 TRUCK BED SALT SPREADER 0 0 0 0 0 1 1 1 1 0 $6,050
CITY FLEET: ROADS DEPARTMENT
Total Number of Vehicles
APPENDIX F
TABLE 1 - PAGE 3
CITY OF VAUGHAN
INVENTORY OF CAPITAL ASSETS
PUBLIC WORKS: BUILDINGS AND FLEET
HEMSON
HEMSON
219

Roads Inventory Model UNIT COST
Department Division Number Year Description 2008 2009 2010 2011 2012 2013 2014 2015 2016 2017 ($/Vehicle)
PUBLIC WORKS RDSWEST 2313 2014 DUMP 2 TON 0 0 0 0 0 1 1 1 1 1 $75,000
PUBLIC WORKS RDSWEST 2314 2014 TRAILER ASPHALT HOT MIX 0 0 0 0 0 0 1 1 1 1 $34,990
PUBLIC WORKS RDSWEST 12501 2016 PICKUP 1/2 TON 4X4 CREW CAB 0 0 0 0 0 0 0 0 1 1 $42,000
PUBLIC WORKS RDSWEST 16500 2016 DUMP 4X4 2 TON 0 0 0 0 0 0 0 0 1 1 $75,000
PUBLIC WORKS RDSWEST 40010 2015 SAW CONCRETE STIHL 0 0 0 0 0 0 0 1 1 1 $1,393
PUBLIC WORKS RDSWEST 40052 2012 CHAIN SAW STIHL 0 0 0 0 1 1 1 1 1 1 $174
PUBLIC WORKS RDWD 1159 2001 Tandem Axle Dump 1 1 1 1 1 1 1 1 1 1 $300,000
PUBLIC WORKS RDWD 1209 2001 Tandem Axle Dump 1 1 1 1 1 1 1 1 1 1 $213,070
PUBLIC WORKS ROADS 165 1973 J.C. 4 Ton Trailer 1 1 0 0 0 0 0 0 0 0 $11,487
PUBLIC WORKS ROADS 200 1977 Thompson 10' Steam 1 1 1 0 0 0 0 0 0 0 $21,960
PUBLIC WORKS ROADS 239 1980 Case Vibratory Rollr 1 1 1 0 0 0 0 0 0 0 $21,735
PUBLIC WORKS ROADS 372 1984 Tractor Loader 1 1 1 1 1 1 1 1 1 1 $56,421
PUBLIC WORKS ROADS 438 1985 Trailer Single 1Tn 1 1 0 0 0 0 0 0 0 0 $21,397
PUBLIC WORKS ROADS 526 1987 Champion Grader 1 1 0 0 0 0 0 0 0 0 $420,734
PUBLIC WORKS ROADS 845 1990 SAW CONCRETE STIHL 1 1 1 1 1 1 1 0 0 0 $1,126
PUBLIC WORKS ROADS 858 1993 International Dump 1 1 0 0 0 0 0 0 0 0 $176,019
PUBLIC WORKS ROADS 868 1992 Tag-A-Long Float Trailer 1 1 1 1 1 1 1 1 1 1 $24,438
PUBLIC WORKS ROADS 1073 1999 Case Front End Loader 1 1 1 1 1 1 0 0 0 0 $234,129
PUBLIC WORKS ROADS 1093 2000 2 Ton Asphalt Hauler 1 1 1 1 1 1 0 0 0 0 $21,397
PUBLIC WORKS ROADS 1094 2000 Dump Truck w/Plow 1 1 1 1 1 1 1 1 1 1 $300,000
PUBLIC WORKS ROADS 1142 2000 3/4 Ton HD Pickup 1 1 0 0 0 0 0 0 0 0 $43,000
PUBLIC WORKS ROADS 1151 2000 4x2 Chassis 7 Cab w/Dump 1 1 1 1 1 1 1 0 0 0 $64,080
PUBLIC WORKS ROADS 1152 2000 4x2 Chassis 7 Cab w/Dump/Plow 1 1 1 1 0 0 0 0 0 0 $72,000
PUBLIC WORKS ROADS 1289 2001 7896KL Dump 1 1 1 1 1 1 1 1 1 1 $300,000
PUBLIC WORKS ROADS 1290 2001 7897KL Dump 1 1 1 1 1 1 1 1 1 1 $300,000
PUBLIC WORKS ROADS 1297 2002 Tractor Loader/Backhoe 1 1 1 1 1 1 1 1 1 1 $124,891
PUBLIC WORKS ROADS 1298 2001 S/A Dump and Plow 1 1 1 1 1 1 1 1 1 1 $335,000
PUBLIC WORKS ROADS 1317 2002 Pickup F250 4x4 1 1 0 0 0 0 0 0 0 0 $47,500
PUBLIC WORKS ROADS 1702 2007 UTILITY VEHICLE FORD 1 1 1 1 1 1 1 1 1 1 $80,070
PUBLIC WORKS ROADS 1726 2008 Flusher 1 1 1 1 1 1 1 1 1 1 $255,076
PUBLIC WORKS ROADS 1799 2009 Trailer Asphalt Hot Mix 0 1 1 1 1 1 1 1 1 1 $35,587
PUBLIC WORKS ROADS 1822 2009 DUMP 2 TON 0 1 1 1 1 1 1 1 1 1 $72,000
PUBLIC WORKS ROADS 1823 2009 DUMP 2 TON 0 1 1 1 1 1 1 1 1 1 $72,000
PUBLIC WORKS ROADS 1855 2009 SWEEPER STREET REGENERATIVE 0 1 1 1 1 1 1 1 1 1 $425,000
PUBLIC WORKS ROADS 1868 2010 DUMP FREIGHTLINER 6 TON 0 0 1 1 1 1 1 1 1 1 $250,000
PUBLIC WORKS ROADS 1879 2010 SNOW BLOWER/LOADER ATTACHMENT 0 0 1 1 1 1 1 1 1 1 $146,964
PUBLIC WORKS ROADS 1880 2010 SNOW BLOWER/LOADER ATTACHMENT 0 0 1 1 1 1 1 1 1 1 $146,964
PUBLIC WORKS ROADS 1899 2010 PICKUP FORD F250 0 0 1 1 1 1 1 1 1 1 $40,000
PUBLIC WORKS ROADS 1900 2010 LOADER FRONT END 0 0 1 1 1 1 1 1 1 1 $293,365
PUBLIC WORKS ROADS 1901 2010 LOADER FRONT END 0 0 1 1 1 1 1 1 1 1 $293,365
PUBLIC WORKS ROADS 1902 2010 SIGN TRUCK 0 0 1 1 1 1 1 1 1 1 $100,450
PUBLIC WORKS ROADS 1906 2010 PICKUP 3/4 TON FORD 0 0 1 1 1 1 1 1 1 1 $43,000
PUBLIC WORKS ROADS 1917 2010 PICKUP 4X4 W/PLOW F250 0 0 1 1 1 1 1 1 1 1 $55,000
CITY FLEET: ROADS DEPARTMENT
Total Number of Vehicles
APPENDIX F
TABLE 1 - PAGE 4
CITY OF VAUGHAN
INVENTORY OF CAPITAL ASSETS
PUBLIC WORKS: BUILDINGS AND FLEET
HEMSON
HEMSON
220

Roads Inventory Model UNIT COST
Department Division Number Year Description 2008 2009 2010 2011 2012 2013 2014 2015 2016 2017 ($/Vehicle)
PUBLIC WORKS ROADS 1960 2010 SWEEPER STREET REGENERATIVE 0 0 1 1 1 1 1 1 1 1 $425,000
PUBLIC WORKS ROADS 1975 2010 TRAILER 6TON PLATINUM 0 0 1 1 1 1 1 1 1 1 $9,798
PUBLIC WORKS ROADS 1977 2010 PICKUP FORD 4X4 W/PLOW 0 0 1 1 1 1 1 1 1 1 $55,000
PUBLIC WORKS ROADS 1978 2010 PICKUP FORD 4X4 W/PLOW 0 0 1 1 1 1 1 1 1 1 $55,000
PUBLIC WORKS ROADS 1980 2010 PICKUP CHEV 3/4 TON W/CAB 0 0 1 1 1 1 1 1 1 1 $43,000
PUBLIC WORKS ROADS 1981 2010 PICKUP DODGE 4X4 W/ CAB 0 0 1 1 1 1 1 1 1 1 $29,731
PUBLIC WORKS ROADS 1990 2010 GRADER 0 0 1 1 1 1 1 1 1 1 $279,401
PUBLIC WORKS ROADS 880 1999 SAW STIHL SUPER CUT QUICK 1 1 0 0 0 0 0 0 0 0 $1,000
PUBLIC WORKS ROADS 968 1999 CHAIN SAW 14" BAR STIHL 1 1 0 0 0 0 0 0 0 0 $463
PUBLIC WORKS ROADS 1637 2006 TRIMMER LINE STIHL 1 0 0 0 0 0 0 0 0 0 $459
PUBLIC WORKS ROADS 1764 2008 TRIMMER LINE STIHL 1 0 0 0 0 0 0 0 0 0 $331
PUBLIC WORKS ROADSEAST 2022 2011 J6472A-TRAILER PLATINUM 2 TON 0 0 0 1 1 1 1 1 1 1 $9,460
PUBLIC WORKS ROADSEAST 2033 2011 4970ZV-DUMP 2 TON 4X4 DODGE 0 0 0 1 1 1 1 1 1 1 $75,000
PUBLIC WORKS ROADSEAST 2040 2011 3673ZX-DUMP 2 TON 4X4 DODGE 0 0 0 1 1 1 1 1 1 1 $75,000
PUBLIC WORKS ROADSEAST 2043 2011 SAW CONCRETE 14" 0 0 0 1 1 1 1 1 1 1 $2,027
PUBLIC WORKS ROADSEAST 2054 2011 TRACTOR/BAKCHOE/LOADER 0 0 0 1 1 1 1 1 1 1 $120,000
PUBLIC WORKS ROADSEAST 2055 2011 STEAMER 0 0 0 1 1 1 1 1 1 1 $54,122
PUBLIC WORKS ROADSWEST 2041 2011 3672ZX-DUMP 2 TON 4X4 DODGE 0 0 0 1 1 1 1 1 1 1 $75,000
PUBLIC WORKS ROADSWEST 2044 2011 SAW CONCRETE 12" 0 0 0 1 1 1 1 1 1 1 $1,239
PUBLIC WORKS ROADSWEST 2070 2011 TRACTOR/LOADER/FLAIL 0 0 0 1 1 1 1 1 1 1 $112,616
PUBLIC WORKS SEWER 879 1994 Hydraulic Crane 1 1 1 1 1 1 1 1 1 0 $20,271
PUBLIC WORKS SEWER 947 1996 Cube Van 1 1 1 0 0 0 0 0 0 0 $85,000
PUBLIC WORKS SEWER 986 1997 Ford Pickup F250 1 0 0 0 0 0 0 0 0 0 $55,970
PUBLIC WORKS SEWER 1014 1997 Dodge Pickup 1 1 1 0 0 0 0 0 0 0 $40,000
PUBLIC WORKS SEWER 1182 2000 GVW single axle w/dump & crane 1 1 1 1 1 1 1 1 1 1 $225,000
PUBLIC WORKS SEWER 1199 2000 CRANE HI-AB 1 1 1 1 1 1 1 1 1 1 $3,153
PUBLIC WORKS SEWER 1242 2001 3/4 Ton Cargo Van 1 1 1 1 0 0 0 0 0 0 $50,000
PUBLIC WORKS SEWER 1313 2002 Pickup F250 1 1 0 0 0 0 0 0 0 0 $43,000
PUBLIC WORKS SEWER 1425 2003 PICKUP CHEV EXT CAB - 4758MF 1 1 1 1 1 1 1 1 1 1 $40,000
PUBLIC WORKS SEWER 1533 2005 PICKUP 3/4 TON CHEV - 1428RD 1 1 1 1 1 1 1 0 0 0 $43,000
PUBLIC WORKS SEWER 1580 2006 VAN CUBE FORD 1 1 1 1 1 1 1 1 1 0 $50,000
PUBLIC WORKS SEWER 1586 2006 PICKUP DODGE DAKOTA 1 1 1 1 1 1 1 1 1 1 $40,000
PUBLIC WORKS SEWER 1731 2008 Pickup 1 1 1 1 1 1 1 1 1 1 $48,763
PUBLIC WORKS SEWER 1771 2008 1 TON CHASSIS 1 1 1 1 1 1 1 1 1 1 $62,000
PUBLIC WORKS SEWER 1797 2008 Trailer 1 1 1 1 1 1 1 1 1 1 $9,460
PUBLIC WORKS SEWER 1903 2010 PICKUP 3/4 TON FORD 0 0 1 1 1 1 1 1 1 1 $43,000
PUBLIC WORKS SEWER 1918 2010 PICKUP 4X4 W/PLOW F250 0 0 1 1 1 1 1 1 1 1 $55,000
PUBLIC WORKS SEWER 1921 2010 GATOR UTILITY VEHICLE 0 0 1 1 1 1 1 1 1 1 $14,978
PUBLIC WORKS SEWER 1970 2010 TRAILER 4 TON PLATINUM 0 0 1 1 1 1 1 1 1 1 $9,572
PUBLIC WORKS SEWER 2000 2010 DUMP 1 TON 4X4 CHASSIS 0 0 1 1 1 1 1 1 1 1 $63,178
PUBLIC WORKS SEWER 2001 2010 DUMP 1 TON 4X4 CHASSIS 0 0 1 1 1 1 1 1 1 1 $63,178
PUBLIC WORKS SEWER 2024 2011 6891ZR-VAN E-150 FORD 0 0 0 1 1 1 1 1 1 1 $50,000
PUBLIC WORKS SEWER 2031 2011 6973ZR-VAN E-150 FORD 0 0 0 1 1 1 1 1 1 1 $50,000
CITY FLEET: ROADS DEPARTMENT
Total Number of Vehicles
APPENDIX F
TABLE 1 - PAGE 5
CITY OF VAUGHAN
INVENTORY OF CAPITAL ASSETS
PUBLIC WORKS: BUILDINGS AND FLEET
HEMSON
HEMSON
221
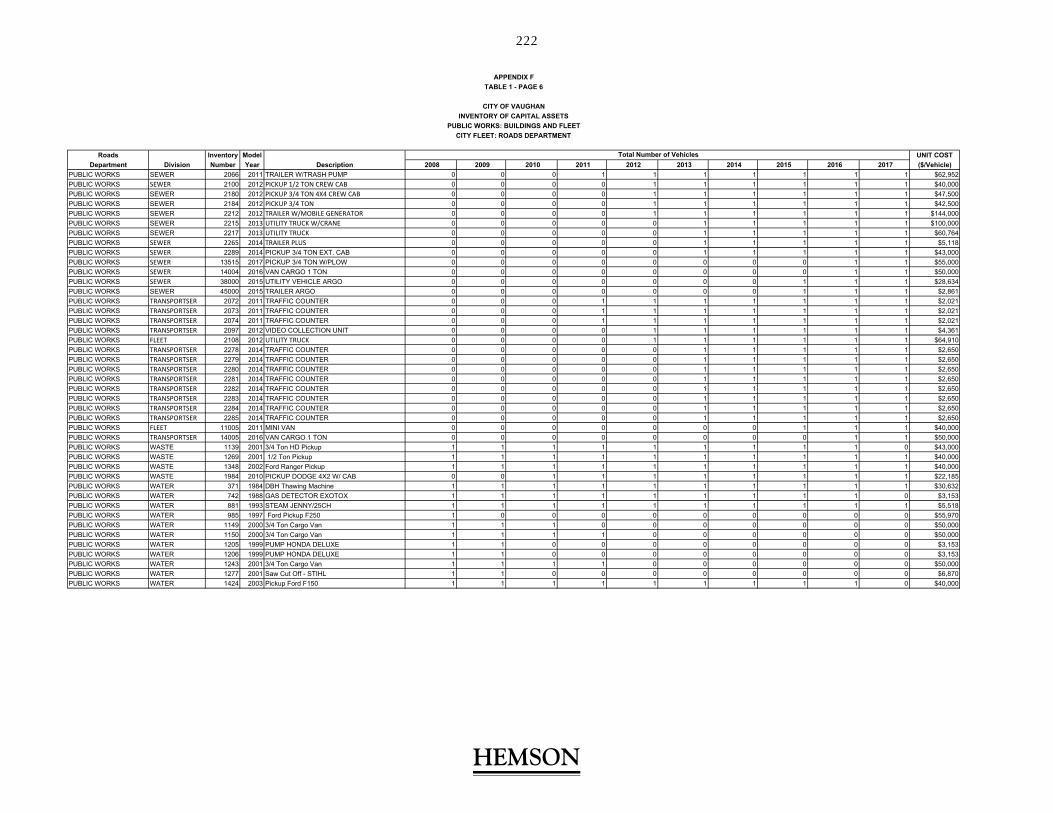
Roads Inventory Model UNIT COST
Department Division Number Year Description 2008 2009 2010 2011 2012 2013 2014 2015 2016 2017 ($/Vehicle)
PUBLIC WORKS SEWER 2066 2011 TRAILER W/TRASH PUMP 0 0 0 1 1 1 1 1 1 1 $62,952
PUBLIC WORKS SEWER 2100 2012 PICKUP 1/2 TON CREW CAB 0 0 0 0 1 1 1 1 1 1 $40,000
PUBLIC WORKS SEWER 2180 2012 PICKUP 3/4 TON 4X4 CREW CAB 0 0 0 0 1 1 1 1 1 1 $47,500
PUBLIC WORKS SEWER 2184 2012 PICKUP 3/4 TON 0 0 0 0 1 1 1 1 1 1 $42,500
PUBLIC WORKS SEWER 2212 2012 TRAILER W/MOBILE GENERATOR 0 0 0 0 1 1 1 1 1 1 $144,000
PUBLIC WORKS SEWER 2215 2013 UTILITY TRUCK W/CRANE 0 0 0 0 0 1 1 1 1 1 $100,000
PUBLIC WORKS SEWER 2217 2013 UTILITY TRUCK 0 0 0 0 0 1 1 1 1 1 $60,764
PUBLIC WORKS SEWER 2265 2014 TRAILER PLUS 0 0 0 0 0 1 1 1 1 1 $5,118
PUBLIC WORKS SEWER 2289 2014 PICKUP 3/4 TON EXT. CAB 0 0 0 0 0 1 1 1 1 1 $43,000
PUBLIC WORKS SEWER 13515 2017 PICKUP 3/4 TON W/PLOW 0 0 0 0 0 0 0 0 1 1 $55,000
PUBLIC WORKS SEWER 14004 2016 VAN CARGO 1 TON 0 0 0 0 0 0 0 0 1 1 $50,000
PUBLIC WORKS SEWER 38000 2015 UTILITY VEHICLE ARGO 0 0 0 0 0 0 0 1 1 1 $28,634
PUBLIC WORKS SEWER 45000 2015 TRAILER ARGO 0 0 0 0 0 0 0 1 1 1 $2,861
PUBLIC WORKS TRANSPORTSER 2072 2011 TRAFFIC COUNTER 0 0 0 1 1 1 1 1 1 1 $2,021
PUBLIC WORKS TRANSPORTSER 2073 2011 TRAFFIC COUNTER 0 0 0 1 1 1 1 1 1 1 $2,021
PUBLIC WORKS TRANSPORTSER 2074 2011 TRAFFIC COUNTER 0 0 0 1 1 1 1 1 1 1 $2,021
PUBLIC WORKS TRANSPORTSER 2097 2012 VIDEO COLLECTION UNIT 0 0 0 0 1 1 1 1 1 1 $4,361
PUBLIC WORKS FLEET 2108 2012 UTILITY TRUCK 0 0 0 0 1 1 1 1 1 1 $64,910
PUBLIC WORKS TRANSPORTSER 2278 2014 TRAFFIC COUNTER 0 0 0 0 0 1 1 1 1 1 $2,650
PUBLIC WORKS TRANSPORTSER 2279 2014 TRAFFIC COUNTER 0 0 0 0 0 1 1 1 1 1 $2,650
PUBLIC WORKS TRANSPORTSER 2280 2014 TRAFFIC COUNTER 0 0 0 0 0 1 1 1 1 1 $2,650
PUBLIC WORKS TRANSPORTSER 2281 2014 TRAFFIC COUNTER 0 0 0 0 0 1 1 1 1 1 $2,650
PUBLIC WORKS TRANSPORTSER 2282 2014 TRAFFIC COUNTER 0 0 0 0 0 1 1 1 1 1 $2,650
PUBLIC WORKS TRANSPORTSER 2283 2014 TRAFFIC COUNTER 0 0 0 0 0 1 1 1 1 1 $2,650
PUBLIC WORKS TRANSPORTSER 2284 2014 TRAFFIC COUNTER 0 0 0 0 0 1 1 1 1 1 $2,650
PUBLIC WORKS TRANSPORTSER 2285 2014 TRAFFIC COUNTER 0 0 0 0 0 1 1 1 1 1 $2,650
PUBLIC WORKS FLEET 11005 2011 MINI VAN 0 0 0 0 0 0 0 1 1 1 $40,000
PUBLIC WORKS TRANSPORTSER 14005 2016 VAN CARGO 1 TON 0 0 0 0 0 0 0 0 1 1 $50,000
PUBLIC WORKS WASTE 1139 2001 3/4 Ton HD Pickup 1 1 1 1 1 1 1 1 1 0 $43,000
PUBLIC WORKS WASTE 1269 2001 1/2 Ton Pickup 1 1 1 1 1 1 1 1 1 1 $40,000
PUBLIC WORKS WASTE 1348 2002 Ford Ranger Pickup 1 1 1 1 1 1 1 1 1 1 $40,000
PUBLIC WORKS WASTE 1984 2010 PICKUP DODGE 4X2 W/ CAB 0 0 1 1 1 1 1 1 1 1 $22,185
PUBLIC WORKS WATER 371 1984 DBH Thawing Machine 1 1 1 1 1 1 1 1 1 1 $30,632
PUBLIC WORKS WATER 742 1988 GAS DETECTOR EXOTOX 1 1 1 1 1 1 1 1 1 0 $3,153
PUBLIC WORKS WATER 881 1993 STEAM JENNY/25CH 1 1 1 1 1 1 1 1 1 1 $5,518
PUBLIC WORKS WATER 985 1997 Ford Pickup F250 1 0 0 0 0 0 0 0 0 0 $55,970
PUBLIC WORKS WATER 1149 2000 3/4 Ton Cargo Van 1 1 1 0 0 0 0 0 0 0 $50,000
PUBLIC WORKS WATER 1150 2000 3/4 Ton Cargo Van 1 1 1 1 0 0 0 0 0 0 $50,000
PUBLIC WORKS WATER 1205 1999 PUMP HONDA DELUXE 1 1 0 0 0 0 0 0 0 0 $3,153
PUBLIC WORKS WATER 1206 1999 PUMP HONDA DELUXE 1 1 0 0 0 0 0 0 0 0 $3,153
PUBLIC WORKS WATER 1243 2001 3/4 Ton Cargo Van 1 1 1 1 0 0 0 0 0 0 $50,000
PUBLIC WORKS WATER 1277 2001 Saw Cut Off - STIHL 1 1 0 0 0 0 0 0 0 0 $6,870
PUBLIC WORKS WATER 1424 2003 Pickup Ford F150 1 1 1 1 1 1 1 1 1 0 $40,000
CITY FLEET: ROADS DEPARTMENT
Total Number of Vehicles
APPENDIX F
TABLE 1 - PAGE 6
CITY OF VAUGHAN
INVENTORY OF CAPITAL ASSETS
PUBLIC WORKS: BUILDINGS AND FLEET
HEMSON
HEMSON
222
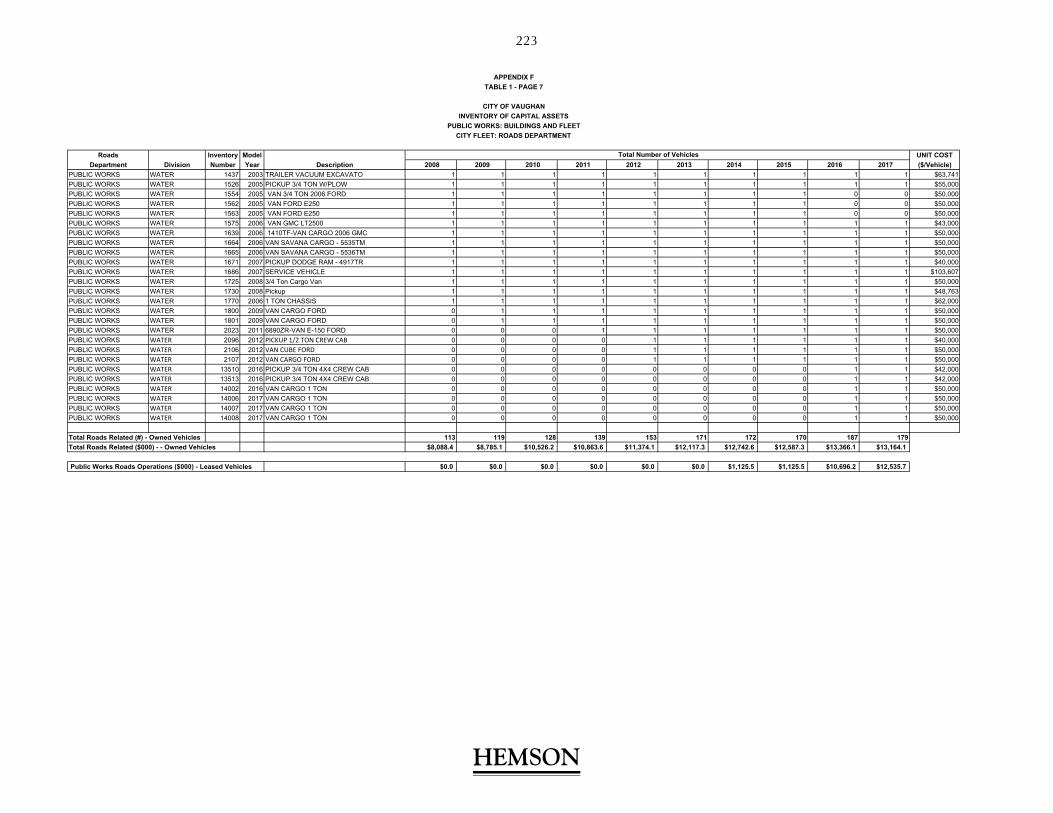
Roads Inventory Model UNIT COST
Department Division Number Year Description 2008 2009 2010 2011 2012 2013 2014 2015 2016 2017 ($/Vehicle)
PUBLIC WORKS WATER 1437 2003 TRAILER VACUUM EXCAVATO 1 1 1 1 1 1 1 1 1 1 $63,741
PUBLIC WORKS WATER 1526 2005 PICKUP 3/4 TON W/PLOW 1 1 1 1 1 1 1 1 1 1 $55,000
PUBLIC WORKS WATER 1554 2005 VAN 3/4 TON 2006 FORD 1 1 1 1 1 1 1 1 0 0 $50,000
PUBLIC WORKS WATER 1562 2005 VAN FORD E250 1 1 1 1 1 1 1 1 0 0 $50,000
PUBLIC WORKS WATER 1563 2005 VAN FORD E250 1 1 1 1 1 1 1 1 0 0 $50,000
PUBLIC WORKS WATER 1575 2006 VAN GMC LT2500 1 1 1 1 1 1 1 1 1 1 $43,000
PUBLIC WORKS WATER 1639 2006 1410TF-VAN CARGO 2006 GMC 1 1 1 1 1 1 1 1 1 1 $50,000
PUBLIC WORKS WATER 1664 2006 VAN SAVANA CARGO - 5535TM 1 1 1 1 1 1 1 1 1 1 $50,000
PUBLIC WORKS WATER 1665 2006 VAN SAVANA CARGO - 5536TM 1 1 1 1 1 1 1 1 1 1 $50,000
PUBLIC WORKS WATER 1671 2007 PICKUP DODGE RAM - 4917TR 1 1 1 1 1 1 1 1 1 1 $40,000
PUBLIC WORKS WATER 1686 2007 SERVICE VEHICLE 1 1 1 1 1 1 1 1 1 1 $103,607
PUBLIC WORKS WATER 1725 2008 3/4 Ton Cargo Van 1 1 1 1 1 1 1 1 1 1 $50,000
PUBLIC WORKS WATER 1730 2008 Pickup 1 1 1 1 1 1 1 1 1 1 $48,763
PUBLIC WORKS WATER 1770 2006 1 TON CHASSIS 1 1 1 1 1 1 1 1 1 1 $62,000
PUBLIC WORKS WATER 1800 2009 VAN CARGO FORD 0 1 1 1 1 1 1 1 1 1 $50,000
PUBLIC WORKS WATER 1801 2009 VAN CARGO FORD 0 1 1 1 1 1 1 1 1 1 $50,000
PUBLIC WORKS WATER 2023 2011 6890ZR-VAN E-150 FORD 0 0 0 1 1 1 1 1 1 1 $50,000
PUBLIC WORKS WATER 2096 2012 PICKUP 1/2 TON CREW CAB 0 0 0 0 1 1 1 1 1 1 $40,000
PUBLIC WORKS WATER 2106 2012 VAN CUBE FORD 0 0 0 0 1 1 1 1 1 1 $50,000
PUBLIC WORKS WATER 2107 2012 VAN CARGO FORD 0 0 0 0 1 1 1 1 1 1 $50,000
PUBLIC WORKS WATER 13510 2016 PICKUP 3/4 TON 4X4 CREW CAB 0 0 0 0 0 0 0 0 1 1 $42,000
PUBLIC WORKS WATER 13513 2016 PICKUP 3/4 TON 4X4 CREW CAB 0 0 0 0 0 0 0 0 1 1 $42,000
PUBLIC WORKS WATER 14002 2016 VAN CARGO 1 TON 0 0 0 0 0 0 0 0 1 1 $50,000
PUBLIC WORKS WATER 14006 2017 VAN CARGO 1 TON 0 0 0 0 0 0 0 0 1 1 $50,000
PUBLIC WORKS WATER 14007 2017 VAN CARGO 1 TON 0 0 0 0 0 0 0 0 1 1 $50,000
PUBLIC WORKS WATER 14008 2017 VAN CARGO 1 TON 0 0 0 0 0 0 0 0 1 1 $50,000
Total Roads Related (#) - Owned Vehicles 113 119 128 139 153 171 172 170 187 179
Total Roads Related ($000) - - Owned Vehicles $8,088.4 $8,785.1 $10,526.2 $10,863.6 $11,374.1 $12,117.3 $12,742.6 $12,587.3 $13,366.1 $13,164.1
Public Works Roads Operations ($000) - Leased Vehicles $0.0 $0.0 $0.0 $0.0 $0.0 $0.0 $1,125.5 $1,125.5 $10,696.2 $12,535.7
CITY FLEET: ROADS DEPARTMENT
Total Number of Vehicles
APPENDIX F
TABLE 1 - PAGE 7
CITY OF VAUGHAN
INVENTORY OF CAPITAL ASSETS
PUBLIC WORKS: BUILDINGS AND FLEET
HEMSON
HEMSON
223

2008 2009 2010 2011 2012 2013 2014 2015 2016 2017
Historic Population 257,532 267,405 277,656 288,301 291,801 295,344 298,930 302,560 306,233 312,853
Employment 159,495 164,208 169,304 174,816 181,268 187,958 194,896 202,089 209,549 214,748
Total Population + Employment 417,027 431,613 446,960 463,117 473,069 483,302 493,826 504,649 515,782 527,601
INVENTORY SUMMARY ($000)
Buildings $29,442.1 $18,688.2 $18,688.2 $18,688.2 $18,688.2 $18,688.2 $19,177.7 $19,177.7 $19,820.1 $19,820.1
Land $97,357.2 $81,262.1 $81,262.1 $81,262.1 $81,262.1 $81,262.1 $82,837.4 $82,837.4 $82,837.4 $82,837.4
Fixed Equipment $131.5 $131.5 $131.5 $131.5 $131.5 $131.5 $131.5 $131.5 $131.5 $154.5
Roads Related Fleet $8,088.4 $8,785.1 $10,526.2 $10,863.6 $11,374.1 $12,117.3 $13,868.1 $13,712.8 $24,062.3 $25,699.9
Total ($000) $135,019.1 $108,866.9 $110,608.1 $110,945.4 $111,456.0 $112,199.1 $116,014.6 $115,859.3 $126,851.2 $128,511.8
Average
SERVICE LEVEL ($/pop + empl) Service
Level
Buildings $70.60 $43.30 $41.81 $40.35 $39.50 $38.67 $38.83 $38.00 $38.43 $37.57 $42.71
Land $233.46 $188.28 $181.81 $175.47 $171.78 $168.14 $167.75 $164.15 $160.61 $157.01 $176.84
- Fixed Equipment $0.32 $0.30 $0.29 $0.28 $0.28 $0.27 $0.27 $0.26 $0.25 $0.29 $0.28
Roads Related Fleet $19.40 $20.35 $23.55 $23.46 $24.04 $25.07 $28.08 $27.17 $46.65 $48.71 $28.65
Total ($/pop + empl) $323.77 $252.23 $247.47 $239.56 $235.60 $232.15 $234.93 $229.58 $245.94 $243.58 $248.48
CITY OF VAUGHAN
CALCULATION OF MAXIMUM ALLOWABLE FUNDING ENVELOPE
PUBLIC WORKS: BUILDINGS AND FLEET
10-Year Funding Envelope Calculation Excess Capacity Calculation
10 Year Average Service Level 2008 - 2017 $248.48 Total Value of Inventory in 2017 $128,511,816
Net Population & Employment Growth 2018 - 2027 109,088 Inventory Using Average Service Level $131,098,265
Maximum Allowable Funding Envelope $27,106,231 Uncommitted Excess Capacity $0
Less: Uncommitted Excess Capacity $0 Excess Capacity: Uncommitted
Less: 10% Legislated Reduction $0
Discounted Maximum Allowable Funding Envelope $27,106,231
CITY OF VAUGHAN
CALCULATION OF SERVICE LEVELS
PUBLIC WORKS: BUILDINGS AND FLEET
APPENDIX F
TABLE 1 - PAGE 8
HEMSON
HEMSON
224

Gross Grants/ Net Ineligible Costs TotalProject Description Timing Project Subsidies/Other Municipal Replacement 0% DC Eligible Available 2018- Post
Cost Recoveries Cost & BTE Shares Reduction Costs DC Reserves 2027 2027
5.0 PUBLIC WORKS: BUILDINGS AND FLEET
5.1 Committed Projects
5.1.1 1363-0-05 Servicing-Dufferin Winter Work 2018 143,701$ -$ 143,701$ -$ -$ 143,701$ 143,701$ -$ -$
5.1.2 1610-0-06 Dufferin Street Works Yard 2018 431,510$ -$ 431,510$ -$ -$ 431,510$ 431,510$ -$ -$
5.1.3 BY-9540-16 Animal Control Vehicle 2018 97,562$ -$ 97,562$ -$ -$ 97,562$ 97,562$ -$ -$
5.1.4 FL-5418-14 PKS-FORESTRY-Small Equipment 2018 9,107$ -$ 9,107$ -$ -$ 9,107$ 9,107$ -$ -$
5.1.5 FL-5441-14 PKS-8 snow blower attachments 2018 74,200$ -$ 74,200$ -$ -$ 74,200$ 74,200$ -$ -$
5.1.6 FL-5451-14 PKS- narrow sidewalk tractor 2018 83,419$ -$ 83,419$ -$ -$ 83,419$ 83,419$ -$ -$
5.1.7 FL-5460-14 PKS-Additional Small Equipment 2018 526$ -$ 526$ -$ -$ 526$ 526$ -$ -$
5.1.8 FL-5499-14 PKS- narrow sidewalk tractor 2018 83,419$ -$ 83,419$ -$ -$ 83,419$ 83,419$ -$ -$
5.1.9 FL-5500-16 PW-RDS- Additional tandem roll 2018 308,288$ -$ 308,288$ -$ -$ 308,288$ 308,288$ -$ -$
5.1.10 FL-5504-15 PW-RDS - Additional Material 2018 28,299$ -$ 28,299$ -$ -$ 28,299$ 28,299$ -$ -$
5.1.11 FL-5505-15 PW-RDS- Additional Small Equip 2018 27,128$ -$ 27,128$ -$ -$ 27,128$ 27,128$ -$ -$
5.1.12 FL-5508-15 PW-RDS - Additional Hydraulic 2018 18,866$ -$ 18,866$ -$ -$ 18,866$ 18,866$ -$ -$
5.1.13 FL-5529-17 BYLAW- Two additional 1/2 ton 2018 71,100$ -$ 71,100$ -$ -$ 71,100$ 71,100$ -$ -$
5.1.14 FL-5530-17 New Vehicle Municipal Inspecto 2018 34,997$ -$ 34,997$ -$ -$ 34,997$ 34,997$ -$ -$
5.1.15 PW-2054-14 EnvironmentalAssessment-NewYar 2018 162,225$ -$ 162,225$ -$ -$ 162,225$ 162,225$ -$ -$
5.1.16 RP-1972-17 Public Works and Parks Operations (New North Operation L 2018 9,083,201$ -$ 9,083,201$ -$ -$ 9,083,201$ 9,083,201$ -$ -$
Subtotal Committed Projects 10,657,548$ -$ 10,657,548$ -$ -$ 10,657,548$ 10,657,548$ -$ -$
5.2 Land
5.2.1 New North Operations Centre - Land 2018 3,884,445$ -$ 3,884,445$ -$ -$ 3,884,445$ 1,537,290$ 2,347,155$ -$
Subtotal Land 3,884,445$ -$ 3,884,445$ -$ -$ 3,884,445$ 1,537,290$ 2,347,155$ -$
5.3 Operations Facilities
5.3.1 Dufferin Operations Centre (office space & storage, additional vehicle parki 2018 1,699,500$ -$ 1,699,500$ 339,900$ -$ 1,359,600$ -$ 1,359,600$ -$
5.3.2 New North Operations Centre - Annual IO Debt Repayment - Principal Paym 2023 5,400,000$ -$ 5,400,000$ -$ -$ 5,400,000$ -$ 5,400,000$ -$
5.3.3 New North Operations Centre - Annual IO Debt Repayment - Principal Paym 2024 5,400,000$ -$ 5,400,000$ -$ -$ 5,400,000$ -$ 5,400,000$ -$
5.3.4 New North Operations Centre - Annual IO Debt Repayment - Principal Paym 2025 5,400,000$ -$ 5,400,000$ -$ -$ 5,400,000$ -$ 5,400,000$ -$
5.3.5 New North Operations Centre - Annual IO Debt Repayment - Principal Paym 2026 5,400,000$ -$ 5,400,000$ -$ -$ 5,400,000$ -$ -$ 5,400,000$
5.3.6 New North Operations Centre - Annual IO Debt Repayment - Principal Paym 2027 5,400,000$ -$ 5,400,000$ -$ -$ 5,400,000$ -$ -$ 5,400,000$
5.3.7 Joint Operations Centre (new salt dome, wash bay, & brine bldg) 2025 7,000,000$ -$ 7,000,000$ -$ -$ 7,000,000$ -$ 3,004,476$ 3,995,524$
5.3.8 Dufferin Yard 2027 14,097,725$ -$ 14,097,725$ -$ -$ 14,097,725$ -$ -$ 14,097,725$
Subtotal Operations Facilities 49,797,225$ -$ 49,797,225$ 339,900$ -$ 49,457,325$ -$ 20,564,076$ 28,893,249$
TABLE 2 - PAGE 1APPENDIX F
DC Eligible Costs
DEVELOPMENT-RELATED CAPITAL PROGRAM PUBLIC WORKS: BUILDINGS AND FLEET
CITY OF VAUGHAN
HEMSON
HEMSON
225
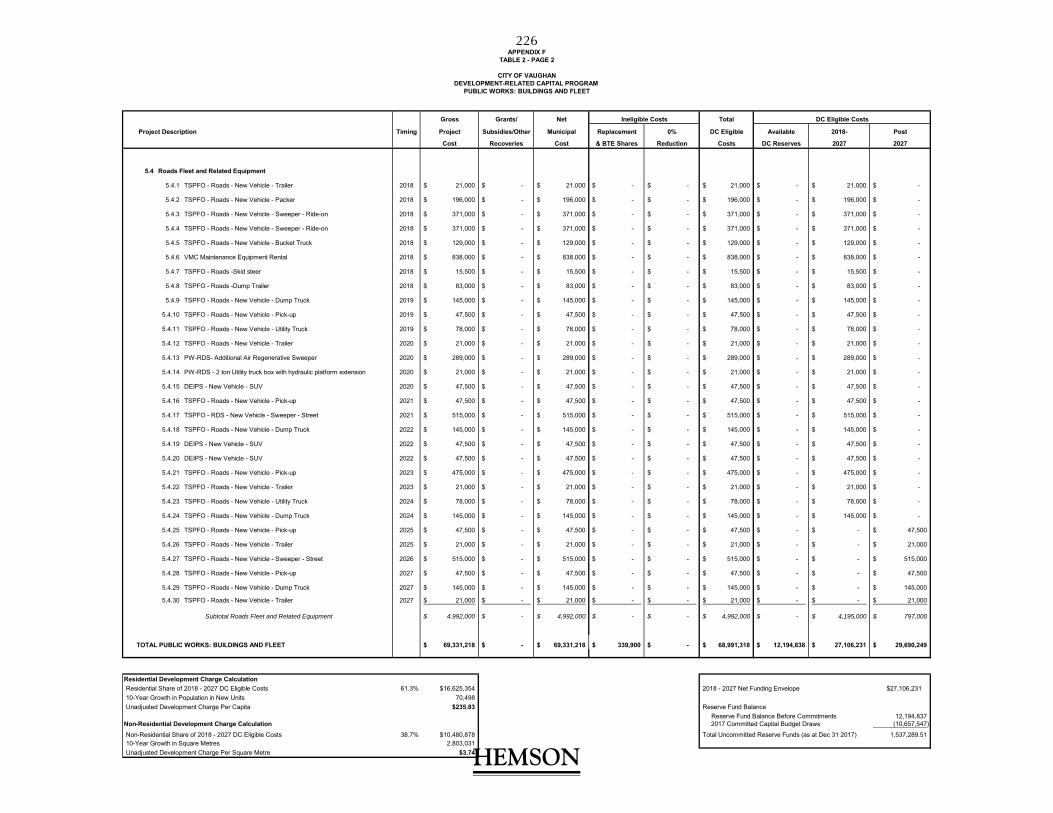
Gross Grants/ Net Ineligible Costs Total
Project Description Timing Project Subsidies/Other Municipal Replacement 0% DC Eligible Available 2018- Post
Cost Recoveries Cost & BTE Shares Reduction Costs DC Reserves 2027 2027
5.4 Roads Fleet and Related Equipment
5.4.1 TSPFO - Roads - New Vehicle - Trailer 2018 21,000$ -$ 21,000$ -$ -$ 21,000$ -$ 21,000$ -$
5.4.2 TSPFO - Roads - New Vehicle - Packer 2018 196,000$ -$ 196,000$ -$ -$ 196,000$ -$ 196,000$ -$
5.4.3 TSPFO - Roads - New Vehicle - Sweeper - Ride-on 2018 371,000$ -$ 371,000$ -$ -$ 371,000$ -$ 371,000$ -$
5.4.4 TSPFO - Roads - New Vehicle - Sweeper - Ride-on 2018 371,000$ -$ 371,000$ -$ -$ 371,000$ -$ 371,000$ -$
5.4.5 TSPFO - Roads - New Vehicle - Bucket Truck 2018 129,000$ -$ 129,000$ -$ -$ 129,000$ -$ 129,000$ -$
5.4.6 VMC Maintenance Equipment Rental 2018 838,000$ -$ 838,000$ -$ -$ 838,000$ -$ 838,000$ -$
5.4.7 TSPFO - Roads -Skid steer 2018 15,500$ -$ 15,500$ -$ -$ 15,500$ -$ 15,500$ -$
5.4.8 TSPFO - Roads -Dump Trailer 2018 83,000$ -$ 83,000$ -$ -$ 83,000$ -$ 83,000$ -$
5.4.9 TSPFO - Roads - New Vehicle - Dump Truck 2019 145,000$ -$ 145,000$ -$ -$ 145,000$ -$ 145,000$ -$
5.4.10 TSPFO - Roads - New Vehicle - Pick-up 2019 47,500$ -$ 47,500$ -$ -$ 47,500$ -$ 47,500$ -$
5.4.11 TSPFO - Roads - New Vehicle - Utility Truck 2019 78,000$ -$ 78,000$ -$ -$ 78,000$ -$ 78,000$ -$
5.4.12 TSPFO - Roads - New Vehicle - Trailer 2020 21,000$ -$ 21,000$ -$ -$ 21,000$ -$ 21,000$ -$
5.4.13 PW-RDS- Additional Air Regenerative Sweeper 2020 289,000$ -$ 289,000$ -$ -$ 289,000$ -$ 289,000$ -$
5.4.14 PW-RDS - 2 ton Utility truck box with hydraulic platform extension 2020 21,000$ -$ 21,000$ -$ -$ 21,000$ -$ 21,000$ -$
5.4.15 DEIPS - New Vehicle - SUV 2020 47,500$ -$ 47,500$ -$ -$ 47,500$ -$ 47,500$ -$
5.4.16 TSPFO - Roads - New Vehicle - Pick-up 2021 47,500$ -$ 47,500$ -$ -$ 47,500$ -$ 47,500$ -$
5.4.17 TSPFO - RDS - New Vehicle - Sweeper - Street 2021 515,000$ -$ 515,000$ -$ -$ 515,000$ -$ 515,000$ -$
5.4.18 TSPFO - Roads - New Vehicle - Dump Truck 2022 145,000$ -$ 145,000$ -$ -$ 145,000$ -$ 145,000$ -$
5.4.19 DEIPS - New Vehicle - SUV 2022 47,500$ -$ 47,500$ -$ -$ 47,500$ -$ 47,500$ -$
5.4.20 DEIPS - New Vehicle - SUV 2022 47,500$ -$ 47,500$ -$ -$ 47,500$ -$ 47,500$ -$
5.4.21 TSPFO - Roads - New Vehicle - Pick-up 2023 475,000$ -$ 475,000$ -$ -$ 475,000$ -$ 475,000$ -$
5.4.22 TSPFO - Roads - New Vehicle - Trailer 2023 21,000$ -$ 21,000$ -$ -$ 21,000$ -$ 21,000$ -$
5.4.23 TSPFO - Roads - New Vehicle - Utility Truck 2024 78,000$ -$ 78,000$ -$ -$ 78,000$ -$ 78,000$ -$
5.4.24 TSPFO - Roads - New Vehicle - Dump Truck 2024 145,000$ -$ 145,000$ -$ -$ 145,000$ -$ 145,000$ -$
5.4.25 TSPFO - Roads - New Vehicle - Pick-up 2025 47,500$ -$ 47,500$ -$ -$ 47,500$ -$ -$ 47,500$
5.4.26 TSPFO - Roads - New Vehicle - Trailer 2025 21,000$ -$ 21,000$ -$ -$ 21,000$ -$ -$ 21,000$
5.4.27 TSPFO - Roads - New Vehicle - Sweeper - Street 2026 515,000$ -$ 515,000$ -$ -$ 515,000$ -$ -$ 515,000$
5.4.28 TSPFO - Roads - New Vehicle - Pick-up 2027 47,500$ -$ 47,500$ -$ -$ 47,500$ -$ -$ 47,500$
5.4.29 TSPFO - Roads - New Vehicle - Dump Truck 2027 145,000$ -$ 145,000$ -$ -$ 145,000$ -$ -$ 145,000$
5.4.30 TSPFO - Roads - New Vehicle - Trailer 2027 21,000$ -$ 21,000$ -$ -$ 21,000$ -$ -$ 21,000$
Subtotal Roads Fleet and Related Equipment 4,992,000$ -$ 4,992,000$ -$ -$ 4,992,000$ -$ 4,195,000$ 797,000$
TOTAL PUBLIC WORKS: BUILDINGS AND FLEET 69,331,218$ -$ 69,331,218$ 339,900$ -$ 68,991,318$ 12,194,838$ 27,106,231$ 29,690,249$
Residential Development Charge Calculation
Residential Share of 2018 - 2027 DC Eligible Costs 61.3% $16,625,354 2018 - 2027 Net Funding Envelope $27,106,231
10-Year Growth in Population in New Units 70,498
Unadjusted Development Charge Per Capita $235.83 Reserve Fund Balance
Reserve Fund Balance Before Commitments 12,194,837 Non-Residential Development Charge Calculation 2017 Committed Capital Budget Draws (10,657,547)
Non-Residential Share of 2018 - 2027 DC Eligible Costs 38.7% $10,480,878 Total Uncommitted Reserve Funds (as at Dec 31 2017) 1,537,289.51 10-Year Growth in Square Metres 2,803,031
Unadjusted Development Charge Per Square Metre $3.74
PUBLIC WORKS: BUILDINGS AND FLEET
DC Eligible Costs
CITY OF VAUGHANDEVELOPMENT-RELATED CAPITAL PROGRAM
APPENDIX FTABLE 2 - PAGE 2
HEMSON
HEMSON
226

APPENDIX FTABLE 3 - PAGE 1
PUBLIC WORKS: BUILDINGS AND FLEET 2018 2019 2020 2021 2022 2023 2024 2025 2026 2027 TOTAL
OPENING CASH BALANCE $0.00 ($1,305.94) $597.85 $2,583.42 $4,285.03 $6,309.72 $3,600.86 $1,202.51 ($3,068.43) ($1,790.25)
2018 - 2027 RESIDENTIAL FUNDING REQUIREMENTS
- Public Works: Buildings And Fleet: Non Inflated $3,515.2 $165.9 $232.1 $345.0 $147.2 $304.2 $136.8 $1,842.8 $0.0 $0.0 $6,689.2
- NOC Borrowed Funds (Public Works Share) $0.0 $0.0 $0.0 $0.0 $0.0 $3,312.0 $3,312.0 $3,312.0 $0.0 $0.0 $9,936.1
- Public Works: Buildings And Fleet: Inflated (1) $3,515.21 $169.2 $241.5 $366.1 $159.3 $3,647.9 $3,466.1 $5,428.8 $0.0 $0.0 $16,994.2
NEW RESIDENTIAL DEVELOPMENT
- Population Growth in New Units 7,882 7,268 7,333 6,452 6,495 6,624 6,757 6,927 6,995 7,764 70,498
REVENUE
- DC Receipts: Inflated $2,244.2 $2,110.9 $2,172.4 $1,949.6 $2,001.8 $2,082.5 $2,166.5 $2,265.5 $2,333.5 $2,641.7 $21,968.6
INTEREST
- Interest on Opening Balance $0.0 ($71.8) $20.9 $90.4 $150.0 $220.8 $126.0 $42.1 ($168.8) ($98.5) $311.2
- Interest on In-year Transactions ($35.0) $34.0 $33.8 $27.7 $32.2 ($43.1) ($35.7) ($87.0) $40.8 $46.2 $14.1
- Interest on NOC (Public Works Share) $0.0 $0.0 $0.0 $0.0 $0.0 ($1,321.2) ($1,189.1) ($1,062.8) ($927.4) ($799.2) ($5,299.6)
TOTAL REVENUE $2,209.3 $2,073.0 $2,227.1 $2,067.7 $2,184.0 $939.1 $1,067.7 $1,157.9 $1,278.2 $1,790.3 $16,994.2
CLOSING CASH BALANCE ($1,305.9) $597.8 $2,583.4 $4,285.0 $6,309.7 $3,600.9 $1,202.5 ($3,068.4) ($1,790.3) $0.0
Note 1: Borrowed funds are not inflated.
2018 Adjusted Charge Per Capita $284.73 Allocation of Capital ProgramResidential Sector 61.3%
Non-Residential Sector 38.7%
Rates for 2018
Inflation Rate: 2.0%
Interest Rate on Positive Balances 3.5%
Interest Rate on Negative Balances 5.5%
CASHFLOW AND DETERMINATION OF DEVELOPMENT CHARGEPUBLIC WORKS: BUILDINGS AND FLEETRESIDENTIAL DEVELOPMENT CHARGE
(in $000)
CITY OF VAUGHAN
HEMSON
HEMSON
227

APPENDIX FTABLE 3 - PAGE 2
PUBLIC WORKS: BUILDINGS AND FLEET 2018 2019 2020 2021 2022 2023 2024 2025 2026 2027 TOTAL
OPENING CASH BALANCE $0.00 ($605.00) $987.84 $2,685.17 $4,449.33 $5,536.17 $3,612.78 $1,859.57 ($1,109.04) ($574.49)
2018 - 2027 NON-RESIDENTIAL FUNDING REQUIREMENTS
- Public Works: Buildings And Fleet: Non Inflated $2,216.0 $104.6 $146.4 $217.5 $92.8 $191.8 $86.2 $1,161.7 $0.0 $0.0 $4,217.0
- NOC Borrowed Funds (Public Works Share) $0.0 $0.0 $0.0 $0.0 $0.0 $2,088.0 $2,088.0 $2,088.0 $0.0 $0.0 $6,263.9
- Public Works: Buildings And Fleet: Inflated(1) $2,216.04 $106.7 $152.3 $230.8 $100.4 $2,299.7 $2,185.1 $3,422.4 $0.0 $0.0 $10,713.4
NEW NON-RESIDENTIAL DEVELOPMENT
- Sq. Metres in New Buildings 364,541 374,435 384,663 395,241 210,183 213,014 215,889 218,808 221,774 204,484 2,803,031
REVENUE
- DC Receipts: Inflated $1,627.2 $1,704.8 $1,786.4 $1,872.3 $1,015.6 $1,049.8 $1,085.3 $1,121.9 $1,159.9 $1,090.9 $13,514.0
INTEREST
- Interest on Opening Balance $0.0 ($33.3) $34.6 $94.0 $155.7 $193.8 $126.4 $65.1 ($61.0) ($31.6) $543.7
- Interest on In-year Transactions ($16.2) $28.0 $28.6 $28.7 $16.0 ($34.4) ($30.2) ($63.3) $20.3 $19.1 ($3.4)
- Interest on NOC (Public Works Share) $0.0 $0.0 $0.0 $0.0 $0.0 ($832.9) ($749.6) ($670.0) ($584.6) ($503.9) ($3,341.0)
TOTAL REVENUE $1,611.0 $1,699.5 $1,849.6 $1,995.0 $1,187.3 $376.3 $431.9 $453.8 $534.6 $574.5 $10,713.4
CLOSING CASH BALANCE ($605.0) $987.8 $2,685.2 $4,449.3 $5,536.2 $3,612.8 $1,859.6 ($1,109.0) ($574.5) ($0.0)
Note 1: Borrowed funds are not inflated.
2018 Adjusted Charge Per SQ.M $4.46 Allocation of Capital ProgramResidential Sector 61.3%
Non-Residential Sector 38.7%
Rates for 2018
Inflation Rate: 2.0%
Interest Rate on Positive Balances 3.5%
Interest Rate on Negative Balances 5.5%
CITY OF VAUGHANCASHFLOW AND DETERMINATION OF DEVELOPMENT CHARGE
PUBLIC WORKS: BUILDINGS AND FLEETNON-RESIDENTIAL DEVELOPMENT CHARGE
(in $000)
HEMSON
HEMSON
228
APPENDIX G
CITY-WIDE ENGINEERING
HEMSON
229

APPENDIX G
CITY-WIDE ENGINEERING
The City’s Development Engineering and Infrastructure Planning Department is responsible for the design and construction of the City’s extensive network of road, water, sewer and stormwater infrastructure.
This appendix provides a brief outline of the City-wide Engineering service which include roads and related infrastructure such as roads, structures, sidewalks, streetlights, intersection improvements, traffic signalization, streetscaping and growth-related studies. Development-related watermains are also included the City-wide Engineering capital program. The development charges for sewer and non-roads related stormwater infrastructure are recovered through area specific charges.
The development-related projects are required in order to provide City-wide engineered services to 2031. As discussed in Appendix A, the City’s population is forecast to increase by about 101,800 people and 55,800 employees, excluding those working at home, over the 2018–2031 period.
The following sections set out the 2018–2031 Development-Related Capital Program and the calculation of the “unadjusted” development charge. The cost, quantum and timing of the projects included in the forecast have been provided by the Development Engineering and Infrastructure Planning Department with support provided by HDR consulting engineers. Consistent with s.5. (1)7. of the DCA, there is no legislated percentage reduction in the eligible development-related capital cost for the provision of roads and related infrastructure.
TABLE 1 HISTORICAL SERVICE LEVELS
Table 1 provides the ten-year historical service level for City-wide engineering. The City’s corporate asset management inventory data was used to populate the DC table. Since the asset management does not separate collector roads between developer funded and DC funded categories, a split of 50:50 was assumed. A similar approach was used for watermains. As shown on Page 3, the total value of the capital asset inventory is $5.5 billion. The ten-year historical average service level is $11,312.15 per capita and
HEMSON
230
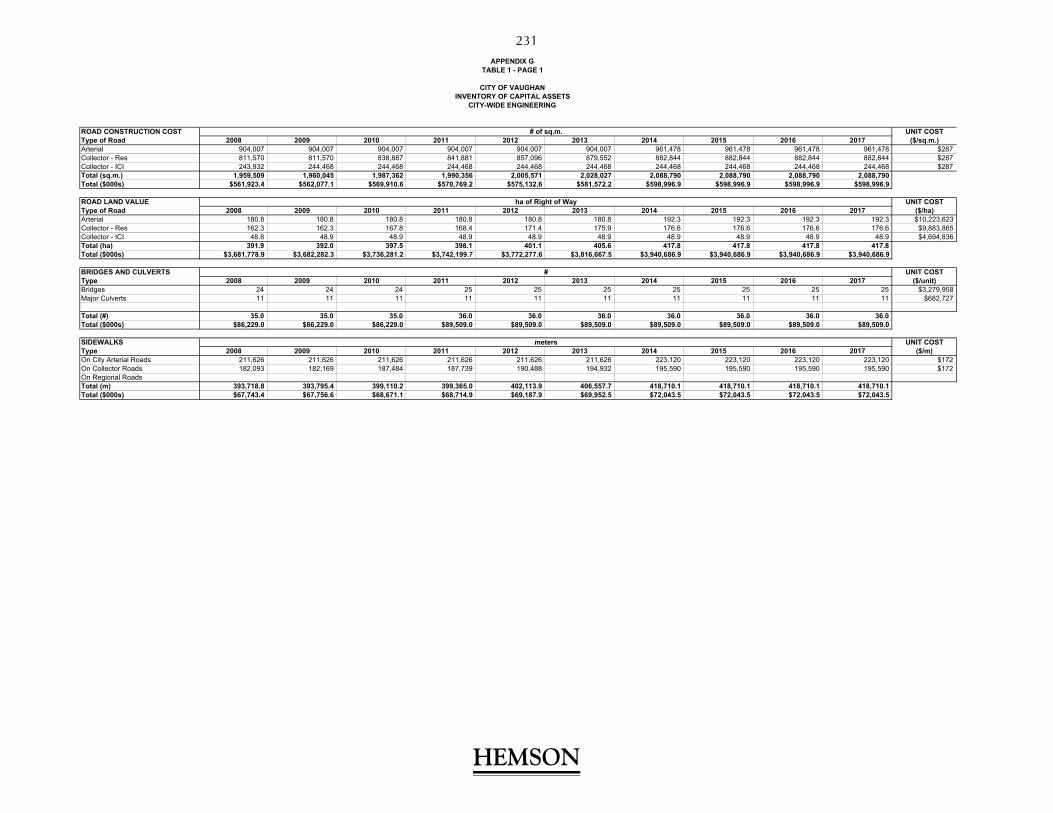
ROAD CONSTRUCTION COST UNIT COSTType of Road 2008 2009 2010 2011 2012 2013 2014 2015 2016 2017 ($/sq.m.)Arterial 904,007 904,007 904,007 904,007 904,007 904,007 961,478 961,478 961,478 961,478 $287Collector - Res 811,570 811,570 838,887 841,881 857,096 879,552 882,844 882,844 882,844 882,844 $287Collector - ICI 243,932 244,468 244,468 244,468 244,468 244,468 244,468 244,468 244,468 244,468 $287Total (sq.m.) 1,959,509 1,960,045 1,987,362 1,990,356 2,005,571 2,028,027 2,088,790 2,088,790 2,088,790 2,088,790 Total ($000s) $561,923.4 $562,077.1 $569,910.6 $570,769.2 $575,132.6 $581,572.2 $598,996.9 $598,996.9 $598,996.9 $598,996.9
ROAD LAND VALUE UNIT COSTType of Road 2008 2009 2010 2011 2012 2013 2014 2015 2016 2017 ($/ha)Arterial 180.8 180.8 180.8 180.8 180.8 180.8 192.3 192.3 192.3 192.3 $10,223,623Collector - Res 162.3 162.3 167.8 168.4 171.4 175.9 176.6 176.6 176.6 176.6 $9,883,865Collector - ICI 48.8 48.9 48.9 48.9 48.9 48.9 48.9 48.9 48.9 48.9 $4,694,836Total (ha) 391.9 392.0 397.5 398.1 401.1 405.6 417.8 417.8 417.8 417.8 Total ($000s) $3,681,778.9 $3,682,282.3 $3,736,281.2 $3,742,199.7 $3,772,277.6 $3,816,667.5 $3,940,686.9 $3,940,686.9 $3,940,686.9 $3,940,686.9
BRIDGES AND CULVERTS UNIT COSTType 2008 2009 2010 2011 2012 2013 2014 2015 2016 2017 ($/unit)Bridges 24 24 24 25 25 25 25 25 25 25 $3,279,958Major Culverts 11 11 11 11 11 11 11 11 11 11 $682,727
Total (#) 35.0 35.0 35.0 36.0 36.0 36.0 36.0 36.0 36.0 36.0 Total ($000s) $86,229.0 $86,229.0 $86,229.0 $89,509.0 $89,509.0 $89,509.0 $89,509.0 $89,509.0 $89,509.0 $89,509.0
SIDEWALKS UNIT COSTType 2008 2009 2010 2011 2012 2013 2014 2015 2016 2017 ($/m)On City Arterial Roads 211,626 211,626 211,626 211,626 211,626 211,626 223,120 223,120 223,120 223,120 $172On Collector Roads 182,093 182,169 187,484 187,739 190,488 194,932 195,590 195,590 195,590 195,590 $172On Regional RoadsTotal (m) 393,718.8 393,795.4 399,110.2 399,365.0 402,113.9 406,557.7 418,710.1 418,710.1 418,710.1 418,710.1 Total ($000s) $67,743.4 $67,756.6 $68,671.1 $68,714.9 $69,187.9 $69,952.5 $72,043.5 $72,043.5 $72,043.5 $72,043.5
APPENDIX GTABLE 1 - PAGE 1
CITY OF VAUGHANINVENTORY OF CAPITAL ASSETS
CITY-WIDE ENGINEERING
# of sq.m.
ha of Right of Way
#
meters
HEMSON
HEMSON
231

STREETLIGHTS UNIT COSTType 2008 2009 2010 2011 2012 2013 2014 2015 2016 2017 ($/m)City share of costs 15,345 15,348 15,556 15,566 15,673 15,846 16,320 16,320 16,320 16,320 $15,000
Total (#) 15,345.5 15,348.5 15,555.6 15,565.6 15,672.7 15,845.9 16,319.6 16,319.6 16,319.6 16,319.6 Total ($000s) $2,640.4 $2,640.9 $2,676.5 $2,678.2 $2,696.7 $2,726.5 $2,807.9 $2,807.9 $2,807.9 $2,807.9
STREETSCAPINGType 2008 2009 2010 2011 2012 2013 2014 2015 2016 2017City share of costs $20,558.0 $20,558.0 $20,558.0 $20,558.0 $20,558.0 $22,795.7 $22,795.7 $22,795.7 $23,985.3 $23,985.3
Total ($000s) $20,558.0 $20,558.0 $20,558.0 $20,558.0 $20,558.0 $22,795.7 $22,795.7 $22,795.7 $23,985.3 $23,985.3
WATERMAINS UNIT COSTType 2008 2009 2010 2011 2012 2013 2014 2015 2016 2017 ($/m)City share of costs 393,719 393,795 399,110 399,365 402,114 406,558 418,710 418,710 418,710 418,710 $1,912
Total (m) 393,718.8 393,795.4 399,110.2 399,365.0 402,113.9 406,557.7 418,710.1 418,710.1 418,710.1 418,710.1 Total ($000s) $752,705.0 $752,851.3 $763,012.1 $763,499.2 $768,754.5 $777,250.2 $800,482.8 $800,482.8 $800,482.8 $800,482.8
meters
APPENDIX GTABLE 1 - PAGE 2
CITY OF VAUGHANINVENTORY OF CAPITAL ASSETS
CITY-WIDE ENGINEERING
#
Value ($000)
HEMSON
HEMSON
232

CITY OF VAUGHANINVENTORY OF CAPITAL ASSETS CITY-WIDE ENGINEERING SUMMARY
Description 2008 2009 2010 2011 2012 2013 2014 2015 2016 2017Road Construction Cost $561,923.4 $562,077.1 $569,910.6 $570,769.2 $575,132.6 $581,572.2 $598,996.9 $598,996.9 $598,996.9 $598,996.9Road Land Value $3,681,778.9 $3,682,282.3 $3,736,281.2 $3,742,199.7 $3,772,277.6 $3,816,667.5 $3,940,686.9 $3,940,686.9 $3,940,686.9 $3,940,686.9Bridges and Culverts $86,229.0 $86,229.0 $86,229.0 $89,509.0 $89,509.0 $89,509.0 $89,509.0 $89,509.0 $89,509.0 $89,509.0Sidewalks $67,743.4 $67,756.6 $68,671.1 $68,714.9 $69,187.9 $69,952.5 $72,043.5 $72,043.5 $72,043.5 $72,043.5Streetlights $2,640.4 $2,640.9 $2,676.5 $2,678.2 $2,696.7 $2,726.5 $2,807.9 $2,807.9 $2,807.9 $2,807.9Streetscaping $20,558.0 $20,558.0 $20,558.0 $20,558.0 $20,558.0 $22,795.7 $22,795.7 $22,795.7 $23,985.3 $23,985.3Watermains $752,705.0 $752,851.3 $763,012.1 $763,499.2 $768,754.5 $777,250.2 $800,482.8 $800,482.8 $800,482.8 $800,482.8
Total ($000) $5,173,578.0 $5,174,395.1 $5,247,338.5 $5,257,928.1 $5,298,116.1 $5,360,473.4 $5,527,322.7 $5,527,322.7 $5,528,512.3 $5,528,512.3
CALCULATION OF SERVICE LEVELSCITY-WIDE ENGINEERING
2008 2009 2010 2011 2012 2013 2014 2015 2016 2017Historic Population 257,532 267,405 277,656 288,301 291,801 295,344 298,930 302,560 306,233 312,853Employment 159,495 164,208 169,304 174,816 181,268 187,958 194,896 202,089 209,549 214,748 Total Population + Employment 417,027 431,613 446,960 463,117 473,069 483,302 493,826 504,649 515,782 527,601
INVENTORY SUMMARY ($000)
Total City-wide Engineering $5,173,578.0 $5,174,395.1 $5,247,338.5 $5,257,928.1 $5,298,116.1 $5,360,473.4 $5,527,322.7 $5,527,322.7 $5,528,512.3 $5,528,512.3 Total ($000) $5,173,578.0 $5,174,395.1 $5,247,338.5 $5,257,928.1 $5,298,116.1 $5,360,473.4 $5,527,322.7 $5,527,322.7 $5,528,512.3 $5,528,512.3
AverageSERVICE LEVEL ($/pop + empl) Service
LevelTotal City-wide Engineering $12,405.86 $11,988.50 $11,740.06 $11,353.35 $11,199.45 $11,091.35 $11,192.86 $10,952.81 $10,718.70 $10,478.59 $11,312.15Total ($/pop + empl) $12,405.86 $11,988.50 $11,740.06 $11,353.35 $11,199.45 $11,091.35 $11,192.86 $10,952.81 $10,718.70 $10,478.59 $11,312.15
CITY OF VAUGHANCALCULATION OF MAXIMUM ALLOWABLE FUNDING ENVELOPECITY-WIDE ENGINEERING
2031 Funding Envelope Calculation Excess Capacity Calculation10 Year Average Service Level 2008 - 2017 $11,312.15 Total Value of Inventory in 2017 $5,528,512,291 Net Population & Employment Growth 2018 - 2031 157,568 Inventory Using Average Service Level $5,968,300,217Maximum Allowable Funding Envelope $1,782,431,831 Uncommitted Excess Capacity $0 Less: Uncommitted Excess Capacity $0 Excess Capacity: UncommittedLess: 10% Legislated Reduction $0
Discounted Maximum Allowable Funding Envelope $1,782,431,831
TABLE 1 - PAGE 3APPENDIX G
Total Value of City-Wide Engineering Capital Assets
HEMSON
HEMSON
233

employee, and this, multiplied by the 2018–2031 forecast growth in net population and employment, results in a maximum allowable funding envelope of $1.8 billion. Under the Development Charges Act, 1997, services related to a highway and water services do not require a 10 per cent discount. As such, the maximum allowable funding envelope to 2031 of $1.8 billion is unchanged.
TABLE 2 CITY-WIDE ENGINEERING PROJECTS TOTAL $2.1 BILLION
Table 2 summarizes the net development-related City-wide engineering capital program to 2031. The total cost of the engineering program is significantly larger than the program included in the City’s last DC Study. This increase is due to several factors:
A better understanding of the road requirements in the City’s key growth areas including the VMC, northern areas (Blocks 27, 41, and 55) and employment areas (Blocks 34 & 35).
The cost of land has increased significantly in Vaughan and across the GTA and with more intensification, the City will have to acquire more land for roads on the open market rather than Planning Act dedications.
The Province is making significant improvement to the GO Transit network and GTA municipalities are required assist in the funding of new and upgraded rail-road grade separations. The municipal share is anticipated to be 15 per cent of total project costs.
Generally the base unit costs of undertaking engineering projects have increased faster than price inflation indices.
The engineering projects are spread out throughout the City with the North Vaughan & Northern Communities area comprising 19 per cent of the capital program, the VMC 18 per cent, Barrie GO Grade-Separated Railway Crossings 9 per cent and the West Vaughan Employment Area 7 per cent. The net municipal cost of the program totals $2.1 billion. The estimates include provisions for project construction, land acquisition for land which is not available through the Planning Act, engineering and design, contingencies and treasury administration. It should be noted that detailed information on most major projects was provided to the development industry and their consultants in advance of the preparation of this Study.
HEMSON
234

Table 3 provides more detail on the capital program including the timing of the expenditures. Additional detailed tables are also provided for Traffic Signals (Table 4) Sidewalks and Streetlighting (Table 5), Studies (Table 6) and Watermains (Table 7). Anticipated grants and subsidies, which are anticipated for rail grade separations, have already been netted off the program.
Vaughan’s City-wide Engineering uncommitted reserve fund balance is $87.8 million which has been collected from prior development. These funds are applied to the first occurring projects as shown in the cash flow statements.
Following internal review and consultation with the development industry the City has identified shares of projects totalling $666.5 million that has been deferred to beyond the 2018–2031 DC recovery period. It is expected that these costs will be recovered through subsequent development charges by-laws.
The City-wide Engineering DC recoverable capital program included in the development charge calculation totals $1.34 billion.
CITY-WIDE ENGINEERING CHARGE IS $8,294.90 PER CAPITA FOR RESIDENTIAL DEVELOPMENT AND $129.80 PER SQUARE METRE FOR NON-RESIDENTIAL DEVELOPMENT
As shown in Table 2, the “unadjusted” residential and non-residential development charges are calculated at $8,294.90 per capita and $129.80 per square metre respectively. The residential development charge represents the residential share of net growth-related capital costs of $863.6 million divided by the population of 104,113 expected in new units between 2018 and 2031. The non-residential development charge represents the non-residential share of net growth-related capital costs of $473.4 million divided by the total growth in GFA of 3.65 million square metres that is forecast between 2018 and 2031. The residential and non-residential allocation of costs is based on each sectors share of population and employment growth that is forecast between 2018 and 2031. On this basis, the residential sector is allocated 64.6 per cent of City-wide Engineering costs, while the non-residential sector is allocated the remaining 35.4 per cent.
The unadjusted development charge rates are further adjusted through a cash flow analysis as presented in Table 8. The resulting residential charge is calculated at $8,663.61 per capita and the non-residential charge is calculated at $130.80 per square
HEMSON
235
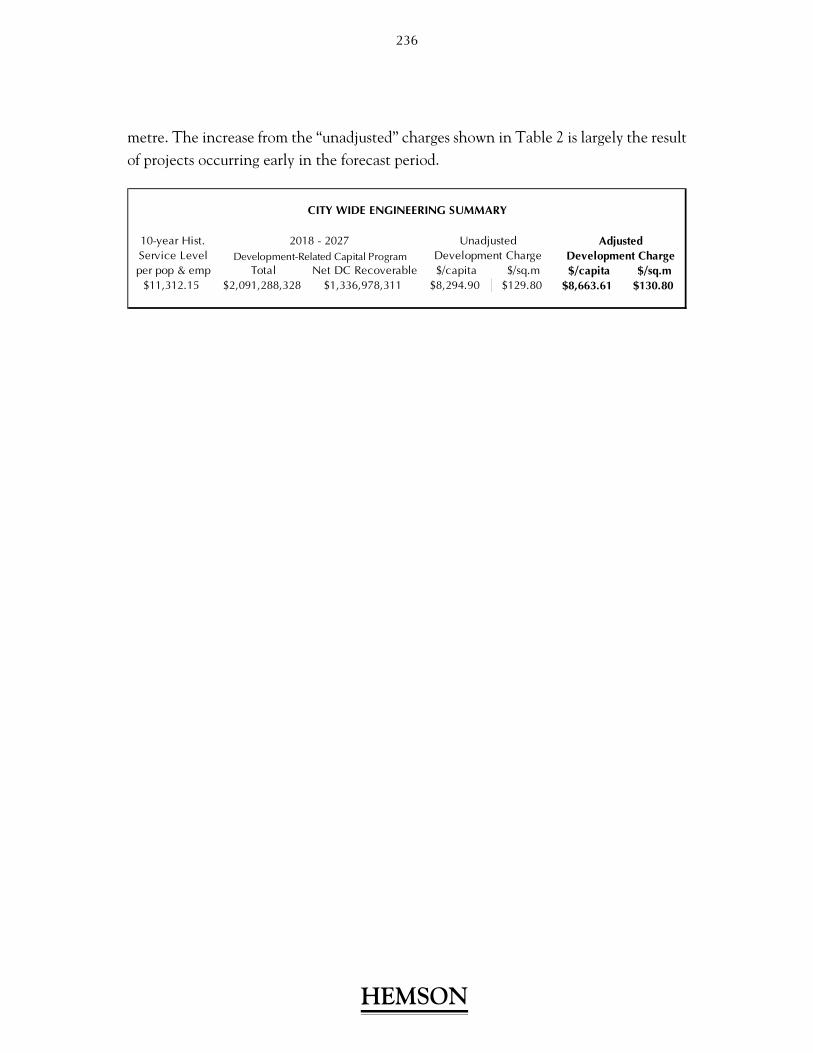
metre. The increase from the “unadjusted” charges shown in Table 2 is largely the result of projects occurring early in the forecast period.
10-year Hist.Service Level Development-Related Capital Programper pop & emp Total Net DC Recoverable $/capita $/sq.m $/capita $/sq.m
$11,312.15 $2,091,288,328 $1,336,978,311 $8,294.90 $129.80 $8,663.61 $130.80
CITY WIDE ENGINEERING SUMMARY
Development Charge Development Charge2018 - 2027 Unadjusted Adjusted
HEMSON
236

HEMSON
Net Total Discounted Development-Related CostsProject Replacement 0% Development DC Reserve 2018- Post
Service Project Description Cost* & BTE Shares Reduction Related Costs Funding 2027 2031
6.00 CITY WIDE ENGINEERING
6.1 A - Vaughan Metropolitan Centre $380,752,067 $0 $0 $380,752,067 $37,403,899 $319,833,128 $23,515,0416.2 B - Black Creek Channel Renewal $32,888,576 $0 $0 $32,888,576 $6,195,902 $26,692,674 $06.3 C - Steeles West $28,782,987 $0 $0 $28,782,987 $1,789,112 $26,993,875 $06.4 D - West Vaughan Employment Area $146,882,335 $0 $0 $146,882,335 $8,764,918 $79,829,894 $58,287,5246.5 E - Kleinburg Nashville $26,035,511 $0 $0 $26,035,511 $1,085,667 $24,949,843 $06.6 F - Kipling Avenue Corridor $10,188,240 $0 $0 $10,188,240 $1,919,370 $8,268,870 $06.7 G - Yonge Steeles Corridor $24,517,588 $0 $0 $24,517,588 $878,893 $23,638,695 $06.8 H - Block 40 / 47 $13,825,008 $0 $0 $13,825,008 $291,064 $13,533,944 $06.9 I - Block 61 $16,820,743 $0 $0 $16,820,743 $2,379,057 $14,441,686 $0
6.10 J - Vaughan Mills Secondary Plan $22,284,024 $0 $0 $22,284,024 $1,668,886 $20,615,138 $06.11 K- North Vaughan Employment Area (Blocks 34 + 35) $54,894,684 $0 $0 $54,894,684 $0 $21,950,200 $32,944,4846.12 L - Maple GO Station Secondary Plan $4,464,903 $0 $0 $4,464,903 $252,344 $4,212,559 $06.13 M - Barrie GO Grade-Separated Railway Crossings (RER) $183,873,649 $0 $0 $183,873,649 $0 $111,276,459 $72,597,1906.14 N - Jog Elimination $2,004,884 $0 $0 $2,004,884 $113,310 $1,891,574 $06.15 O - North Vaughan + Northern Communities TMP (Blocks 27, 41, and 55) $389,596,047 $0 $0 $389,596,047 $3,933,673 $290,793,890 $94,868,4846.16 P - Additional Transportation Infrastructure Projects $83,548,646 $0 $0 $83,548,646 $9,690,210 $73,858,436 $06.17 Q - Active Transportation Projects $57,002,517 $0 $0 $57,002,517 $56,088 $56,946,429 $06.18 R - Active Transportation Infrastructure $65,176,889 $0 $0 $65,176,889 $5,362,196 $59,814,694 $06.19 S - Other Transportation Related Infrastructure $81,285,177 $0 $0 $81,285,177 $3,115,005 $74,047,465 $4,122,7076.20 T - Growth Related Studies $16,733,364 $0 $0 $16,733,364 $675,516 $16,057,848 $06.21 U - City Wide Watermain $74,430,889 $0 $0 $74,430,889 $2,234,276 $53,111,447 $19,085,1666.22 V - Urban Design Streetscape Projects $14,219,563 $0 $0 $14,219,563 $0 $14,219,563 $06.23 W - Projects Post Period Beyond 2031 $361,080,036 $0 $0 $361,080,036 $0 $0 $361,080,036
TOTAL CITY WIDE ENGINEERING $2,091,288,328 $0 $0 $2,091,288,328 $87,809,385 $1,336,978,311 $666,500,631
Note*: Anticipated grants for rail grade separations have already been netted off the program
Residential Development Charge CalculationResidential Share of 2018-2031 DC Eligible Capital Program 64.6% $863,603,615
Growth in Population in New Units to 2031 104,113
Unadjusted Development Charge Per Capita ($) $8,294.90
Non-Residential Development Charge CalculationNon-Residential Share of 2018-2031 DC Eligible Capital Program 35.4% $473,374,696
Growth in Non-Residential Square Metres to 2031 3,646,989
Unadjusted Development Charge Per sq. m ($) $129.80
Ineligible Costs
APPENDIX GTABLE 2
CITY OF VAUGHANDEVELOPMENT-RELATED CAPITAL PROGRAM SUMMARY
CITY WIDE ENGINEERING
237

APPENDIX GTABLE 3 ‐ PAGE 1
CITY‐WIDE ENGINEERING DEVELOPMENT‐RELATED CAPITAL PROGRAM
Item# Road From To Timing Total Cost** 2018 2019 2020 2021 2022 2023 2024 2025 2026 2027 2028 2029 2030 2031 Post 2031
A ‐ Vaughan Metropolitan Centre $380,752,067 $66,181,432 $66,181,432 $66,181,432 $14,413,621 $19,187,887 $19,187,887 $19,187,887 $19,187,887 $19,187,887 $19,187,887 $7,287,947 $7,287,947 $7,287,947 $7,287,947 $23,515,041
1 Millway Avenue Highway 7 Interchange Way 2021 $10,349,585 $3,449,862 $3,449,862 $3,449,8622 Millway Avenue Interchange Way Exchange Way 2021 $2,000,370 $666,790 $666,790 $666,7903 Portage Parkway Highway 400 Jane Street 2021 $22,015,700 $2,201,570 $2,201,570 $2,201,570 $2,201,570 $2,201,570 $2,201,570 $2,201,570 $2,201,570 $2,201,570 $2,201,5704 Portage Parkway Jane Street West of Black Creek 2021 $4,603,324 $460,332 $460,332 $460,332 $460,332 $460,332 $460,332 $460,332 $460,332 $460,332 $460,3325 Portage Parkway West of Black Creek Creditstone Road 2021 $69,507,002 $6,950,700 $6,950,700 $6,950,700 $6,950,700 $6,950,700 $6,950,700 $6,950,700 $6,950,700 $6,950,700 $6,950,7006 Applemill Road Edgeley Applewood Road 2021 $3,202,976 $1,067,659 $1,067,659 $1,067,6597 Applemill Road Millway Jane Street 2021 $1,613,000 $537,667 $537,667 $537,6678 Colossus Drive Highway 400 Midblock Crossing 2026 $71,257,700 $4,774,266 $4,774,266 $4,774,266 $4,774,266 $4,774,266 $4,774,266 $4,774,266 $4,774,266 $4,774,266 $4,774,266 $23,515,0419 Interchange Way Highway 400 Edgeley Blvd 2021 $10,951,310 $3,650,437 $3,650,437 $3,650,4379B Interchange Way Edgeley Blvd Jane Street 2021 $6,005,064 $2,001,688 $2,001,688 $2,001,68810 Interchange Way Jane Street Creditstone Road 2021 $11,946,884 $3,982,295 $3,982,295 $3,982,29511 Edgeley Boulevard North Highway 7 Portage Parkway 2021 $6,823,936 $2,274,645 $2,274,645 $2,274,64512 Edgeley Boulevard South Highway 7 Interchange Way 2021 $6,278,021 $2,092,674 $2,092,674 $2,092,67413 Edgeley Boulevard Interchange Way Exchange Avenue 2021 $1,971,764 $657,255 $657,255 $657,25514 Credistone Road North Highway 7 Portage Parkway 2021 $8,099,359 $809,936 $809,936 $809,936 $809,936 $809,936 $809,936 $809,936 $809,936 $809,936 $809,93615 Credistone Road South Highway 7 Interchange Way 2021 $14,774,020 $1,477,402 $1,477,402 $1,477,402 $1,477,402 $1,477,402 $1,477,402 $1,477,402 $1,477,402 $1,477,402 $1,477,40216 Credistone Road Interchange Way Peelar Road 2021 $1,786,987 $595,662 $595,662 $595,66217 Credistone Road Portage Parkway Langstaff Road 2021 $16,163,818 $5,387,939 $5,387,939 $5,387,93918 Credistone Road Langstaff Road Rutherford Road 2021 $20,572,132 $6,857,377 $6,857,377 $6,857,37719 Applewood Crescent Highway 7 Portage Parkway 2021 $9,955,736 $3,318,579 $3,318,579 $3,318,57920 Commerce Way Applemill Highway 7 2021 $2,000,370 $666,790 $666,790 $666,79021 Commerce Way Highway 7 Commerce St 2021 $233,548 $77,849 $77,849 $77,84922 Commerce Way Commerce St Exchange Avenue 2021 $4,560,843 $1,520,281 $1,520,281 $1,520,28124 Doughton Road Commerce Way Jane Street 2021 $7,343,365 $2,447,788 $2,447,788 $2,447,78825 Doughton Road Jane Street Maplecrete Road 2021 $2,978,052 $992,684 $992,684 $992,68426 Doughton Road Maplecrete Road Creditstone Road 2021 $2,871,693 $957,231 $957,231 $957,23127 Exchange Avenue Commerce Way Jane Street 2021 $6,381,541 $2,127,180 $2,127,180 $2,127,18028 Peelar Road Jane Street Maplecrete Road 2021 $3,935,284 $1,311,761 $1,311,761 $1,311,76129 Peelar Road Maplecrete Road Creditstone Road 2021 $2,871,693 $957,231 $957,231 $957,23130 Barnes Court Maplecrete Road Creditstone Road 2021 $2,978,052 $992,684 $992,684 $992,68431 Maplecrete Road Portage Parkway Barnes Road 2021 $1,188,135 $396,045 $396,045 $396,04532 Maplecrete Road Hwy 7 Peelar Road 2021 $8,339,273 $2,779,758 $2,779,758 $2,779,75833 Highway 7 Enhanced Streetscaping 2031 $24,718,886 $1,765,635 $1,765,635 $1,765,635 $1,765,635 $1,765,635 $1,765,635 $1,765,635 $1,765,635 $1,765,635 $1,765,635 $1,765,635 $1,765,635 $1,765,635 $1,765,63534 Jane Street Enhanced Streetscaping & Edgeley Pond Interface 2031 $10,472,643 $748,046 $748,046 $748,046 $748,046 $748,046 $748,046 $748,046 $748,046 $748,046 $748,046 $748,046 $748,046 $748,046 $748,046
B ‐ Black Creek Channel Renewal $32,888,576 $10,962,859 $10,962,859 $10,962,859 $0 $0 $0 $0 $0 $0 $0 $0 $0 $0 $0 $0
35 Realignment, Earthworks and Restoration 2021 $1,784,621 $594,874 $594,874 $594,87436 Structures 2021 $8,481,601 $2,827,200 $2,827,200 $2,827,20037 Bank Treatments, Urban Design & Landscape 2021 $4,382,817 $1,460,939 $1,460,939 $1,460,93938 Land Acquisitions 2021 $2,517,617 $839,206 $839,206 $839,20639 SWM Pond/Tank Southeast Quadrant of VMC 2021 $15,721,920 $5,240,640 $5,240,640 $5,240,640
C ‐ Steeles West $28,782,987 $3,165,606 $3,165,606 $3,165,606 $894,926 $894,926 $894,926 $894,926 $894,926 $2,468,590 $2,468,590 $2,468,590 $2,468,590 $2,468,590 $2,468,590 $0
40 Primary East West Collector Road (North of Steeles) Jane Street Keele Street 2031 $9,441,988 $1,573,665 $1,573,665 $1,573,665 $1,573,665 $1,573,665 $1,573,66541 North‐South Collector (Street "C") East West Collector Road Steeles Avenue 2021 $6,812,041 $2,270,680 $2,270,680 $2,270,68042 Jane Street Streetscaping 2031 $355,204 $25,372 $25,372 $25,372 $25,372 $25,372 $25,372 $25,372 $25,372 $25,372 $25,372 $25,372 $25,372 $25,372 $25,37243 Keele Street Streetscaping 2031 $186,949 $13,354 $13,354 $13,354 $13,354 $13,354 $13,354 $13,354 $13,354 $13,354 $13,354 $13,354 $13,354 $13,354 $13,35444 Steeles Avenue Streetscaping 2031 $5,412,553 $386,611 $386,611 $386,611 $386,611 $386,611 $386,611 $386,611 $386,611 $386,611 $386,611 $386,611 $386,611 $386,611 $386,61145 Greenway (Steeles West) Streetscaping (E/W) 2031 $4,202,292 $300,164 $300,164 $300,164 $300,164 $300,164 $300,164 $300,164 $300,164 $300,164 $300,164 $300,164 $300,164 $300,164 $300,16446 Greenway UPS (Steeles West) Streetscaping (E/W) 2031 $2,371,961 $169,426 $169,426 $169,426 $169,426 $169,426 $169,426 $169,426 $169,426 $169,426 $169,426 $169,426 $169,426 $169,426 $169,426
HEMSON
HEMSON
238
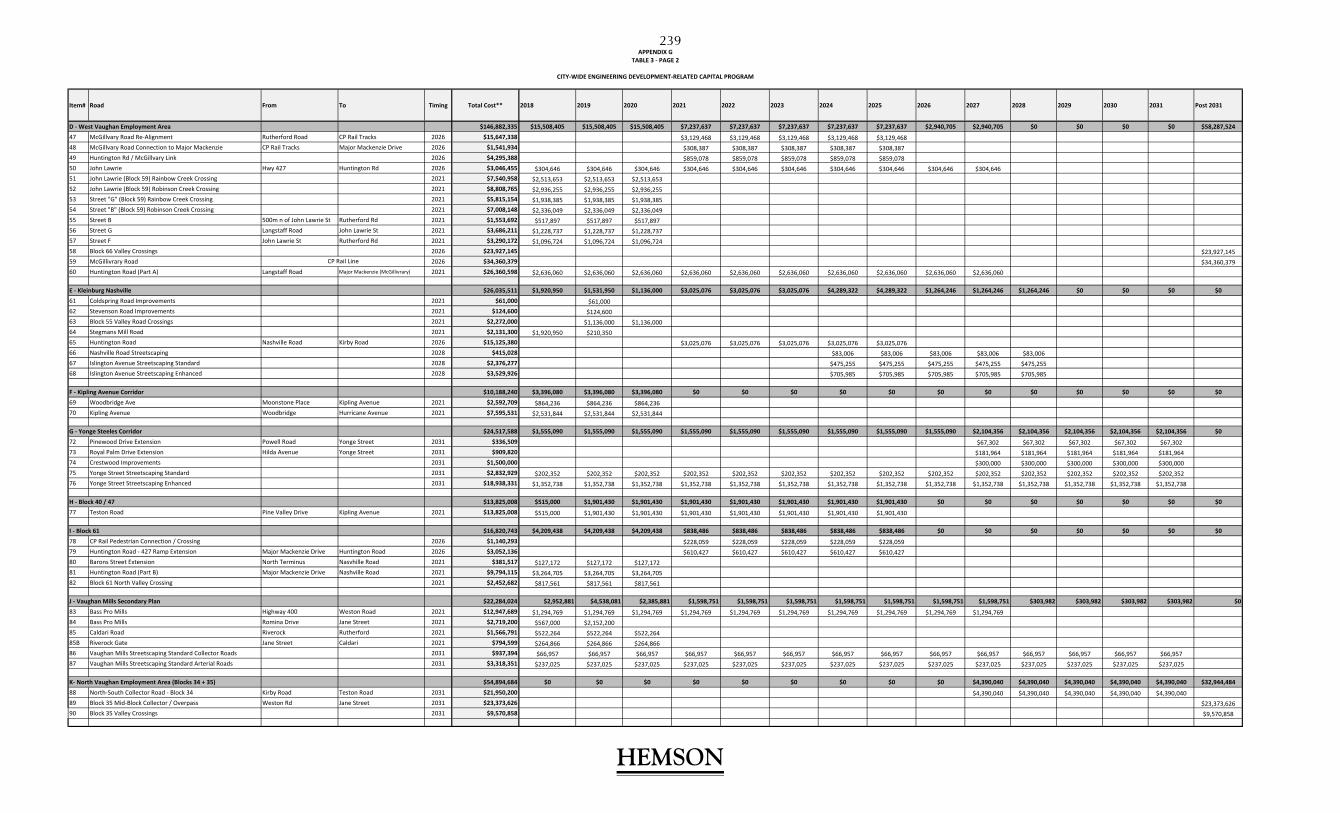
APPENDIX GTABLE 3 ‐ PAGE 2
CITY‐WIDE ENGINEERING DEVELOPMENT‐RELATED CAPITAL PROGRAM
Item# Road From To Timing Total Cost** 2018 2019 2020 2021 2022 2023 2024 2025 2026 2027 2028 2029 2030 2031 Post 2031
D ‐ West Vaughan Employment Area $146,882,335 $15,508,405 $15,508,405 $15,508,405 $7,237,637 $7,237,637 $7,237,637 $7,237,637 $7,237,637 $2,940,705 $2,940,705 $0 $0 $0 $0 $58,287,52447 McGillvary Road Re‐Alignment Rutherford Road CP Rail Tracks 2026 $15,647,338 $3,129,468 $3,129,468 $3,129,468 $3,129,468 $3,129,46848 McGillvary Road Connection to Major Mackenzie CP Rail Tracks Major Mackenzie Drive 2026 $1,541,934 $308,387 $308,387 $308,387 $308,387 $308,38749 Huntington Rd / McGillvary Link 2026 $4,295,388 $859,078 $859,078 $859,078 $859,078 $859,07850 John Lawrie Hwy 427 Huntington Rd 2026 $3,046,455 $304,646 $304,646 $304,646 $304,646 $304,646 $304,646 $304,646 $304,646 $304,646 $304,64651 John Lawrie (Block 59) Rainbow Creek Crossing 2021 $7,540,958 $2,513,653 $2,513,653 $2,513,65352 John Lawrie (Block 59) Robinson Creek Crossing 2021 $8,808,765 $2,936,255 $2,936,255 $2,936,25553 Street "G" (Block 59) Rainbow Creek Crossing 2021 $5,815,154 $1,938,385 $1,938,385 $1,938,38554 Street "B" (Block 59) Robinson Creek Crossing 2021 $7,008,148 $2,336,049 $2,336,049 $2,336,04955 Street B 500m n of John Lawrie St Rutherford Rd 2021 $1,553,692 $517,897 $517,897 $517,89756 Street G Langstaff Road John Lawrie St 2021 $3,686,211 $1,228,737 $1,228,737 $1,228,73757 Street F John Lawrie St Rutherford Rd 2021 $3,290,172 $1,096,724 $1,096,724 $1,096,72458 Block 66 Valley Crossings 2026 $23,927,145 $23,927,14559 McGillivrary Road 2026 $34,360,379 $34,360,37960 Huntington Road (Part A) Langstaff Road Major Mackenzie (McGillivrary) 2021 $26,360,598 $2,636,060 $2,636,060 $2,636,060 $2,636,060 $2,636,060 $2,636,060 $2,636,060 $2,636,060 $2,636,060 $2,636,060
E ‐ Kleinburg Nashville $26,035,511 $1,920,950 $1,531,950 $1,136,000 $3,025,076 $3,025,076 $3,025,076 $4,289,322 $4,289,322 $1,264,246 $1,264,246 $1,264,246 $0 $0 $0 $061 Coldspring Road Improvements 2021 $61,000 $61,00062 Stevenson Road Improvements 2021 $124,600 $124,60063 Block 55 Valley Road Crossings 2021 $2,272,000 $1,136,000 $1,136,00064 Stegmans Mill Road 2021 $2,131,300 $1,920,950 $210,35065 Huntington Road Nashville Road Kirby Road 2026 $15,125,380 $3,025,076 $3,025,076 $3,025,076 $3,025,076 $3,025,07666 Nashville Road Streetscaping 2028 $415,028 $83,006 $83,006 $83,006 $83,006 $83,00667 Islington Avenue Streetscaping Standard 2028 $2,376,277 $475,255 $475,255 $475,255 $475,255 $475,25568 Islington Avenue Streetscaping Enhanced 2028 $3,529,926 $705,985 $705,985 $705,985 $705,985 $705,985
F ‐ Kipling Avenue Corridor $10,188,240 $3,396,080 $3,396,080 $3,396,080 $0 $0 $0 $0 $0 $0 $0 $0 $0 $0 $0 $069 Woodbridge Ave Moonstone Place Kipling Avenue 2021 $2,592,709 $864,236 $864,236 $864,23670 Kipling Avenue Woodbridge Hurricane Avenue 2021 $7,595,531 $2,531,844 $2,531,844 $2,531,844
G ‐ Yonge Steeles Corridor $24,517,588 $1,555,090 $1,555,090 $1,555,090 $1,555,090 $1,555,090 $1,555,090 $1,555,090 $1,555,090 $1,555,090 $2,104,356 $2,104,356 $2,104,356 $2,104,356 $2,104,356 $072 Pinewood Drive Extension Powell Road Yonge Street 2031 $336,509 $67,302 $67,302 $67,302 $67,302 $67,30273 Royal Palm Drive Extension Hilda Avenue Yonge Street 2031 $909,820 $181,964 $181,964 $181,964 $181,964 $181,96474 Crestwood Improvements 2031 $1,500,000 $300,000 $300,000 $300,000 $300,000 $300,00075 Yonge Street Streetscaping Standard 2031 $2,832,929 $202,352 $202,352 $202,352 $202,352 $202,352 $202,352 $202,352 $202,352 $202,352 $202,352 $202,352 $202,352 $202,352 $202,35276 Yonge Street Streetscaping Enhanced 2031 $18,938,331 $1,352,738 $1,352,738 $1,352,738 $1,352,738 $1,352,738 $1,352,738 $1,352,738 $1,352,738 $1,352,738 $1,352,738 $1,352,738 $1,352,738 $1,352,738 $1,352,738
H ‐ Block 40 / 47 $13,825,008 $515,000 $1,901,430 $1,901,430 $1,901,430 $1,901,430 $1,901,430 $1,901,430 $1,901,430 $0 $0 $0 $0 $0 $0 $077 Teston Road Pine Valley Drive Kipling Avenue 2021 $13,825,008 $515,000 $1,901,430 $1,901,430 $1,901,430 $1,901,430 $1,901,430 $1,901,430 $1,901,430
I ‐ Block 61 $16,820,743 $4,209,438 $4,209,438 $4,209,438 $838,486 $838,486 $838,486 $838,486 $838,486 $0 $0 $0 $0 $0 $0 $078 CP Rail Pedestrian Connection / Crossing 2026 $1,140,293 $228,059 $228,059 $228,059 $228,059 $228,05979 Huntington Road ‐ 427 Ramp Extension Major Mackenzie Drive Huntington Road 2026 $3,052,136 $610,427 $610,427 $610,427 $610,427 $610,42780 Barons Street Extension North Terminus Nasvhille Road 2021 $381,517 $127,172 $127,172 $127,17281 Huntington Road (Part B) Major Mackenzie Drive Nashville Road 2021 $9,794,115 $3,264,705 $3,264,705 $3,264,70582 Block 61 North Valley Crossing 2021 $2,452,682 $817,561 $817,561 $817,561
J ‐ Vaughan Mills Secondary Plan $22,284,024 $2,952,881 $4,538,081 $2,385,881 $1,598,751 $1,598,751 $1,598,751 $1,598,751 $1,598,751 $1,598,751 $1,598,751 $303,982 $303,982 $303,982 $303,982 $083 Bass Pro Mills Highway 400 Weston Road 2021 $12,947,689 $1,294,769 $1,294,769 $1,294,769 $1,294,769 $1,294,769 $1,294,769 $1,294,769 $1,294,769 $1,294,769 $1,294,76984 Bass Pro Mills Romina Drive Jane Street 2021 $2,719,200 $567,000 $2,152,20085 Caldari Road Riverock Rutherford 2021 $1,566,791 $522,264 $522,264 $522,26485B Riverock Gate Jane Street Caldari 2021 $794,599 $264,866 $264,866 $264,86686 Vaughan Mills Streetscaping Standard Collector Roads 2031 $937,394 $66,957 $66,957 $66,957 $66,957 $66,957 $66,957 $66,957 $66,957 $66,957 $66,957 $66,957 $66,957 $66,957 $66,95787 Vaughan Mills Streetscaping Standard Arterial Roads 2031 $3,318,351 $237,025 $237,025 $237,025 $237,025 $237,025 $237,025 $237,025 $237,025 $237,025 $237,025 $237,025 $237,025 $237,025 $237,025
K‐ North Vaughan Employment Area (Blocks 34 + 35) $54,894,684 $0 $0 $0 $0 $0 $0 $0 $0 $0 $4,390,040 $4,390,040 $4,390,040 $4,390,040 $4,390,040 $32,944,48488 North‐South Collector Road ‐ Block 34 Kirby Road Teston Road 2031 $21,950,200 $4,390,040 $4,390,040 $4,390,040 $4,390,040 $4,390,04089 Block 35 Mid‐Block Collector / Overpass Weston Rd Jane Street 2031 $23,373,626 $23,373,62690 Block 35 Valley Crossings 2031 $9,570,858 $9,570,858
CP Rail Line
HEMSON
HEMSON
239
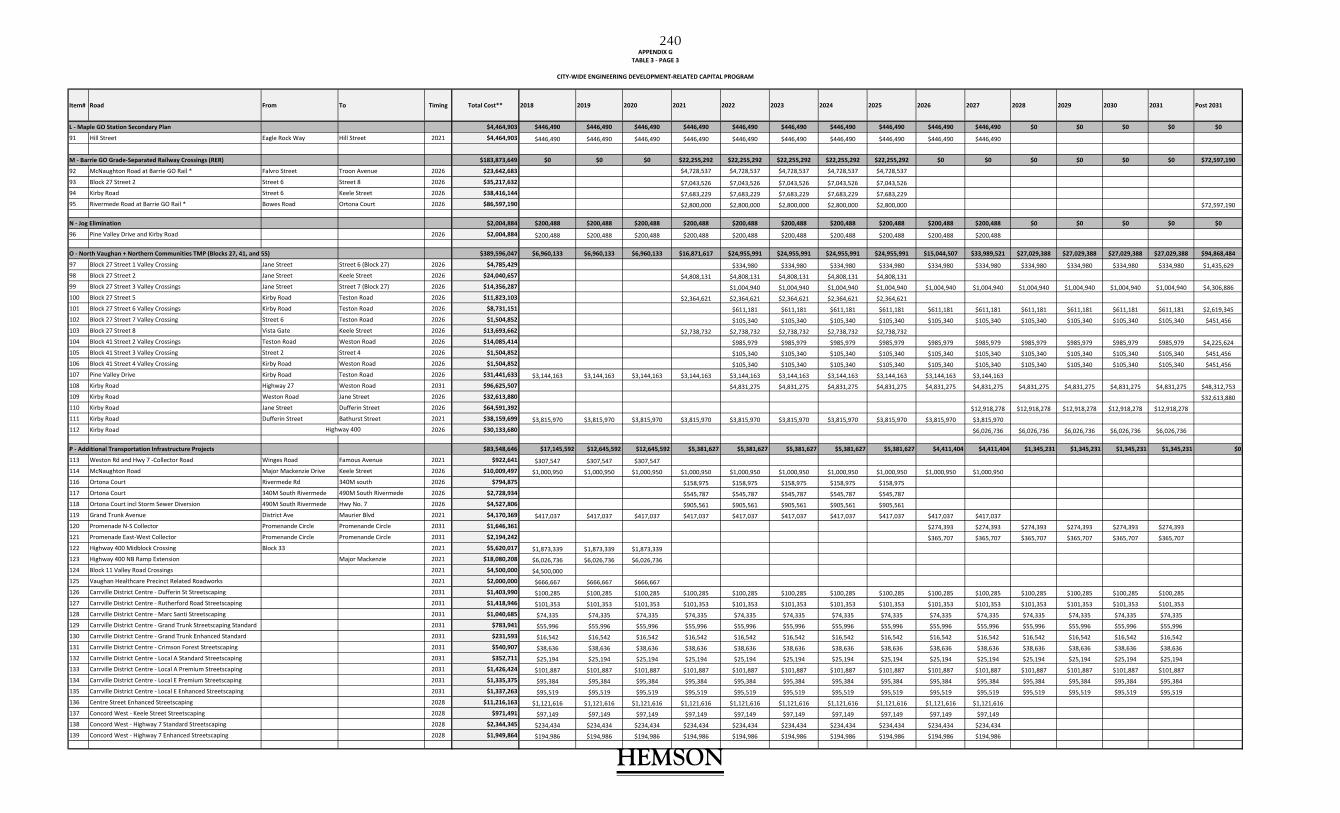
APPENDIX GTABLE 3 ‐ PAGE 3
CITY‐WIDE ENGINEERING DEVELOPMENT‐RELATED CAPITAL PROGRAM
Item# Road From To Timing Total Cost** 2018 2019 2020 2021 2022 2023 2024 2025 2026 2027 2028 2029 2030 2031 Post 2031
L ‐ Maple GO Station Secondary Plan $4,464,903 $446,490 $446,490 $446,490 $446,490 $446,490 $446,490 $446,490 $446,490 $446,490 $446,490 $0 $0 $0 $0 $0
91 Hill Street Eagle Rock Way Hill Street 2021 $4,464,903 $446,490 $446,490 $446,490 $446,490 $446,490 $446,490 $446,490 $446,490 $446,490 $446,490
M ‐ Barrie GO Grade‐Separated Railway Crossings (RER) $183,873,649 $0 $0 $0 $22,255,292 $22,255,292 $22,255,292 $22,255,292 $22,255,292 $0 $0 $0 $0 $0 $0 $72,597,190
92 McNaughton Road at Barrie GO Rail * Falvro Street Troon Avenue 2026 $23,642,683 $4,728,537 $4,728,537 $4,728,537 $4,728,537 $4,728,537
93 Block 27 Street 2 Street 6 Street 8 2026 $35,217,632 $7,043,526 $7,043,526 $7,043,526 $7,043,526 $7,043,52694 Kirby Road Street 6 Keele Street 2026 $38,416,144 $7,683,229 $7,683,229 $7,683,229 $7,683,229 $7,683,22995 Rivermede Road at Barrie GO Rail * Bowes Road Ortona Court 2026 $86,597,190 $2,800,000 $2,800,000 $2,800,000 $2,800,000 $2,800,000 $72,597,190
N ‐ Jog Elimination $2,004,884 $200,488 $200,488 $200,488 $200,488 $200,488 $200,488 $200,488 $200,488 $200,488 $200,488 $0 $0 $0 $0 $0
96 Pine Valley Drive and Kirby Road 2026 $2,004,884 $200,488 $200,488 $200,488 $200,488 $200,488 $200,488 $200,488 $200,488 $200,488 $200,488
O ‐ North Vaughan + Northern Communities TMP (Blocks 27, 41, and 55) $389,596,047 $6,960,133 $6,960,133 $6,960,133 $16,871,617 $24,955,991 $24,955,991 $24,955,991 $24,955,991 $15,044,507 $33,989,521 $27,029,388 $27,029,388 $27,029,388 $27,029,388 $94,868,484
97 Block 27 Street 1 Valley Crossing Jane Street Street 6 (Block 27) 2026 $4,785,429 $334,980 $334,980 $334,980 $334,980 $334,980 $334,980 $334,980 $334,980 $334,980 $334,980 $1,435,62998 Block 27 Street 2 Jane Street Keele Street 2026 $24,040,657 $4,808,131 $4,808,131 $4,808,131 $4,808,131 $4,808,13199 Block 27 Street 3 Valley Crossings Jane Street Street 7 (Block 27) 2026 $14,356,287 $1,004,940 $1,004,940 $1,004,940 $1,004,940 $1,004,940 $1,004,940 $1,004,940 $1,004,940 $1,004,940 $1,004,940 $4,306,886100 Block 27 Street 5 Kirby Road Teston Road 2026 $11,823,103 $2,364,621 $2,364,621 $2,364,621 $2,364,621 $2,364,621101 Block 27 Street 6 Valley Crossings Kirby Road Teston Road 2026 $8,731,151 $611,181 $611,181 $611,181 $611,181 $611,181 $611,181 $611,181 $611,181 $611,181 $611,181 $2,619,345102 Block 27 Street 7 Valley Crossing Street 6 Teston Road 2026 $1,504,852 $105,340 $105,340 $105,340 $105,340 $105,340 $105,340 $105,340 $105,340 $105,340 $105,340 $451,456103 Block 27 Street 8 Vista Gate Keele Street 2026 $13,693,662 $2,738,732 $2,738,732 $2,738,732 $2,738,732 $2,738,732104 Block 41 Street 2 Valley Crossings Teston Road Weston Road 2026 $14,085,414 $985,979 $985,979 $985,979 $985,979 $985,979 $985,979 $985,979 $985,979 $985,979 $985,979 $4,225,624105 Block 41 Street 3 Valley Crossing Street 2 Street 4 2026 $1,504,852 $105,340 $105,340 $105,340 $105,340 $105,340 $105,340 $105,340 $105,340 $105,340 $105,340 $451,456106 Block 41 Street 4 Valley Crossing Kirby Road Weston Road 2026 $1,504,852 $105,340 $105,340 $105,340 $105,340 $105,340 $105,340 $105,340 $105,340 $105,340 $105,340 $451,456107 Pine Valley Drive Kirby Road Teston Road 2026 $31,441,633 $3,144,163 $3,144,163 $3,144,163 $3,144,163 $3,144,163 $3,144,163 $3,144,163 $3,144,163 $3,144,163 $3,144,163108 Kirby Road Highway 27 Weston Road 2031 $96,625,507 $4,831,275 $4,831,275 $4,831,275 $4,831,275 $4,831,275 $4,831,275 $4,831,275 $4,831,275 $4,831,275 $4,831,275 $48,312,753109 Kirby Road Weston Road Jane Street 2026 $32,613,880 $32,613,880110 Kirby Road Jane Street Dufferin Street 2026 $64,591,392 $12,918,278 $12,918,278 $12,918,278 $12,918,278 $12,918,278111 Kirby Road Dufferin Street Bathurst Street 2021 $38,159,699 $3,815,970 $3,815,970 $3,815,970 $3,815,970 $3,815,970 $3,815,970 $3,815,970 $3,815,970 $3,815,970 $3,815,970112 Kirby Road 2026 $30,133,680 $6,026,736 $6,026,736 $6,026,736 $6,026,736 $6,026,736
P ‐ Additional Transportation Infrastructure Projects $83,548,646 $17,145,592 $12,645,592 $12,645,592 $5,381,627 $5,381,627 $5,381,627 $5,381,627 $5,381,627 $4,411,404 $4,411,404 $1,345,231 $1,345,231 $1,345,231 $1,345,231 $0
113 Weston Rd and Hwy 7 ‐Collector Road Winges Road Famous Avenue 2021 $922,641 $307,547 $307,547 $307,547114 McNaughton Road Major Mackenzie Drive Keele Street 2026 $10,009,497 $1,000,950 $1,000,950 $1,000,950 $1,000,950 $1,000,950 $1,000,950 $1,000,950 $1,000,950 $1,000,950 $1,000,950116 Ortona Court Rivermede Rd 340M south 2026 $794,875 $158,975 $158,975 $158,975 $158,975 $158,975117 Ortona Court 340M South Rivermede 490M South Rivermede 2026 $2,728,934 $545,787 $545,787 $545,787 $545,787 $545,787118 Ortona Court incl Storm Sewer Diversion 490M South Rivermede Hwy No. 7 2026 $4,527,806 $905,561 $905,561 $905,561 $905,561 $905,561119 Grand Trunk Avenue District Ave Maurier Blvd 2021 $4,170,369 $417,037 $417,037 $417,037 $417,037 $417,037 $417,037 $417,037 $417,037 $417,037 $417,037120 Promenade N‐S Collector Promenande Circle Promenande Circle 2031 $1,646,361 $274,393 $274,393 $274,393 $274,393 $274,393 $274,393121 Promenade East‐West Collector Promenande Circle Promenande Circle 2031 $2,194,242 $365,707 $365,707 $365,707 $365,707 $365,707 $365,707122 Highway 400 Midblock Crossing Block 33 2021 $5,620,017 $1,873,339 $1,873,339 $1,873,339123 Highway 400 NB Ramp Extension Major Mackenzie 2021 $18,080,208 $6,026,736 $6,026,736 $6,026,736124 Block 11 Valley Road Crossings 2021 $4,500,000 $4,500,000125 Vaughan Healthcare Precinct Related Roadworks 2021 $2,000,000 $666,667 $666,667 $666,667126 Carrville District Centre ‐ Dufferin St Streetscaping 2031 $1,403,990 $100,285 $100,285 $100,285 $100,285 $100,285 $100,285 $100,285 $100,285 $100,285 $100,285 $100,285 $100,285 $100,285 $100,285127 Carrville District Centre ‐ Rutherford Road Streetscaping 2031 $1,418,946 $101,353 $101,353 $101,353 $101,353 $101,353 $101,353 $101,353 $101,353 $101,353 $101,353 $101,353 $101,353 $101,353 $101,353128 Carrville District Centre ‐ Marc Santi Streetscaping 2031 $1,040,685 $74,335 $74,335 $74,335 $74,335 $74,335 $74,335 $74,335 $74,335 $74,335 $74,335 $74,335 $74,335 $74,335 $74,335129 Carrville District Centre ‐ Grand Trunk Streetscaping Standard 2031 $783,941 $55,996 $55,996 $55,996 $55,996 $55,996 $55,996 $55,996 $55,996 $55,996 $55,996 $55,996 $55,996 $55,996 $55,996130 Carrville District Centre ‐ Grand Trunk Enhanced Standard 2031 $231,593 $16,542 $16,542 $16,542 $16,542 $16,542 $16,542 $16,542 $16,542 $16,542 $16,542 $16,542 $16,542 $16,542 $16,542131 Carrville District Centre ‐ Crimson Forest Streetscaping 2031 $540,907 $38,636 $38,636 $38,636 $38,636 $38,636 $38,636 $38,636 $38,636 $38,636 $38,636 $38,636 $38,636 $38,636 $38,636132 Carrville District Centre ‐ Local A Standard Streetscaping 2031 $352,711 $25,194 $25,194 $25,194 $25,194 $25,194 $25,194 $25,194 $25,194 $25,194 $25,194 $25,194 $25,194 $25,194 $25,194133 Carrville District Centre ‐ Local A Premium Streetscaping 2031 $1,426,424 $101,887 $101,887 $101,887 $101,887 $101,887 $101,887 $101,887 $101,887 $101,887 $101,887 $101,887 $101,887 $101,887 $101,887134 Carrville District Centre ‐ Local E Premium Streetscaping 2031 $1,335,375 $95,384 $95,384 $95,384 $95,384 $95,384 $95,384 $95,384 $95,384 $95,384 $95,384 $95,384 $95,384 $95,384 $95,384135 Carrville District Centre ‐ Local E Enhanced Streetscaping 2031 $1,337,263 $95,519 $95,519 $95,519 $95,519 $95,519 $95,519 $95,519 $95,519 $95,519 $95,519 $95,519 $95,519 $95,519 $95,519136 Centre Street Enhanced Streetscaping 2028 $11,216,163 $1,121,616 $1,121,616 $1,121,616 $1,121,616 $1,121,616 $1,121,616 $1,121,616 $1,121,616 $1,121,616 $1,121,616137 Concord West ‐ Keele Street Streetscaping 2028 $971,491 $97,149 $97,149 $97,149 $97,149 $97,149 $97,149 $97,149 $97,149 $97,149 $97,149138 Concord West ‐ Highway 7 Standard Streetscaping 2028 $2,344,345 $234,434 $234,434 $234,434 $234,434 $234,434 $234,434 $234,434 $234,434 $234,434 $234,434139 Concord West ‐ Highway 7 Enhanced Streetscaping 2028 $1,949,864 $194,986 $194,986 $194,986 $194,986 $194,986 $194,986 $194,986 $194,986 $194,986 $194,986
Highway 400
HEMSON
HEMSON
240

APPENDIX GTABLE 3 ‐ PAGE 4
CITY‐WIDE ENGINEERING DEVELOPMENT‐RELATED CAPITAL PROGRAM
Item# Road From To Timing Total Cost** 2018 2019 2020 2021 2022 2023 2024 2025 2026 2027 2028 2029 2030 2031 Post 2031
Q ‐ Active Transportation Projects $57,002,517 $99,240 $99,240 $99,240 $11,340,959 $11,340,959 $11,340,959 $11,340,959 $11,340,959 $0 $0 $0 $0 $0 $0 $0
140 Langstaff Road Highway 27 Vaughan Mills Road 2026 $814,603 $162,921 $162,921 $162,921 $162,921 $162,921141 Langstaff Road Jane Street Creditstone Road 2026 $606,211 $121,242 $121,242 $121,242 $121,242 $121,242142 Autumn Hill Boulevard Confederation Parkway Bathurst Street 2026 $2,063,554 $412,711 $412,711 $412,711 $412,711 $412,711143 Woodbridge Avenue Marting Grove Road Islington Avenue 2026 $1,252,807 $250,561 $250,561 $250,561 $250,561 $250,561144 America Avenue / Drummond Drive Highway 400 Keele Street 2026 $3,231,656 $646,331 $646,331 $646,331 $646,331 $646,331145 Clark Avenue West Dufferin Street Yonge Street 2026 $2,045,831 $409,166 $409,166 $409,166 $409,166 $409,166146 Davos Road Pine Valley Drive Vellore Woods Boulevard 2026 $2,591,270 $518,254 $518,254 $518,254 $518,254 $518,254147 Embassy Drive / Blue Willow Drive Pine Valley Drive Weston Road 2026 $2,263,572 $452,714 $452,714 $452,714 $452,714 $452,714148 Centre Street Bathurst Street Yonge Street 2026 $1,174,060 $234,812 $234,812 $234,812 $234,812 $234,812149 Wycliffe Avenue / Kiloran Avenue Clarance Street Islington Avenue 2026 $1,628,716 $325,743 $325,743 $325,743 $325,743 $325,743150 Martin Grove Road Langstaff Road Highway 7 2026 $3,020,780 $604,156 $604,156 $604,156 $604,156 $604,156151 Martin Grove Road Highway 7 Steeles Avenue 2026 $2,758,103 $551,621 $551,621 $551,621 $551,621 $551,621152 Napa Valley Avenue Islington Avenue Rutherford Road 2026 $4,742,207 $948,441 $948,441 $948,441 $948,441 $948,441153 Kipling Avenue Langstaff Road Highway 7 2026 $10,403 $2,081 $2,081 $2,081 $2,081 $2,081154 Clarence Street Sonoma Boulevard / IslingtoModesto Gardens 2026 $2,294,730 $458,946 $458,946 $458,946 $458,946 $458,946155 Islintgon Avenue Teston Road Major Mackenzie Drive W 2026 $1,933,540 $386,708 $386,708 $386,708 $386,708 $386,708156 Vellore Avenue Major Mackenzie Drive Rutherford Road 2026 $53,866 $10,773 $10,773 $10,773 $10,773 $10,773157 Vellore Avenue Rutherford Road Ashley Grove Road 2026 $57,581 $11,516 $11,516 $11,516 $11,516 $11,516158 Ashley Grove Road Belview Avenue Highway 7 2026 $2,011,363 $402,273 $402,273 $402,273 $402,273 $402,273159 Vellore Woods Boulevard Major Mackenzie Drive Rutherford Road 2026 $2,461,291 $492,258 $492,258 $492,258 $492,258 $492,258160 Melville Avenue Brandon Gate Major Mackenzie Drive W 2026 $1,228,490 $245,698 $245,698 $245,698 $245,698 $245,698161 Melville Avenue Major Mackenzie Drive W Rutherford Road 2026 $2,021,625 $404,325 $404,325 $404,325 $404,325 $404,325162 Credistone Road Rutherford Road Highway 7 2026 $1,929,733 $385,947 $385,947 $385,947 $385,947 $385,947163 Via Romano Boulevard Teston Road Major Mackenzie Drive W 2026 $2,188,120 $437,624 $437,624 $437,624 $437,624 $437,624164 Ilan Ramon Boulevard Major Mackenzie Drive W Rutherford Road 2026 $1,997,849 $399,570 $399,570 $399,570 $399,570 $399,570165 Lebovic Campus Drive / Thomas Cooke Avenue Ilan Ramon Boulevard Rutherford Road 2026 $1,236,763 $247,353 $247,353 $247,353 $247,353 $247,353166 Thornhill Woods Drive Rutherford Road Highway 7 2026 $2,092,984 $418,597 $418,597 $418,597 $418,597 $418,597167 New Westminster Drive Bathurst Street Steeles Avenue 2026 $2,772,300 $554,460 $554,460 $554,460 $554,460 $554,460168 Atkinson Avenue Bathurst Street Clark Avenue 2026 $2,134,670 $426,934 $426,934 $426,934 $426,934 $426,934169 Huntington Road Hwy 7 Langstaff Road 2026 $2,086,119 $417,224 $417,224 $417,224 $417,224 $417,224170 Cityview Blvd Major Mackenzie Teston Road 2021 $297,721 $99,240 $99,240 $99,240
R ‐ Active Transportation Infrastructure $65,176,889 $9,487,722 $9,487,722 $9,487,722 $4,363,088 $4,363,088 $4,363,088 $4,363,088 $4,363,088 $1,857,677 $2,608,121 $2,608,121 $2,608,121 $2,608,121 $2,608,121 $0
171 Regional Road structure upgrades for City trail crossings Various locations (13) Varies $26,007,477 $1,857,677 $1,857,677 $1,857,677 $1,857,677 $1,857,677 $1,857,677 $1,857,677 $1,857,677 $1,857,677 $1,857,677 $1,857,677 $1,857,677 $1,857,677 $1,857,677172 TCPL Trail Crossing of Hwy 400 west of Hwy 400 East of Hwy 400 2026 $4,320,179 $864,036 $864,036 $864,036 $864,036 $864,036173 Active Transportation Crossing of Barrie GO Line Block 18 Ridgefield Crescent Lauderdale Drive 2021 $3,655,536 $1,218,512 $1,218,512 $1,218,512174 Active Transportation Crossing of Barrie GO Line‐Concord Area Concord GO Area At Hydro Corridor 2026 $3,655,536 $731,107 $731,107 $731,107 $731,107 $731,107175 Maple GO Bridge across Major Mack 2026 $1,054,679 $210,936 $210,936 $210,936 $210,936 $210,936176 Pine Valley North Block 40/47 2021 $19,234,600 $6,411,533 $6,411,533 $6,411,533177 CN Rail Pedestrian Connection / Overpass Yonge‐Steeles Area 2021 $3,752,221 $750,444 $750,444 $750,444 $750,444 $750,444178 Block 41 Street 1 Connection Street 4 Weston Road 2026 $2,275,670 $455,134 $455,134 $455,134 $455,134 $455,134179 Block 41 Street 6 Connection Pine Valley Drive Street 2 2026 $1,220,992 $244,198 $244,198 $244,198 $244,198 $244,198
HEMSON
HEMSON
241
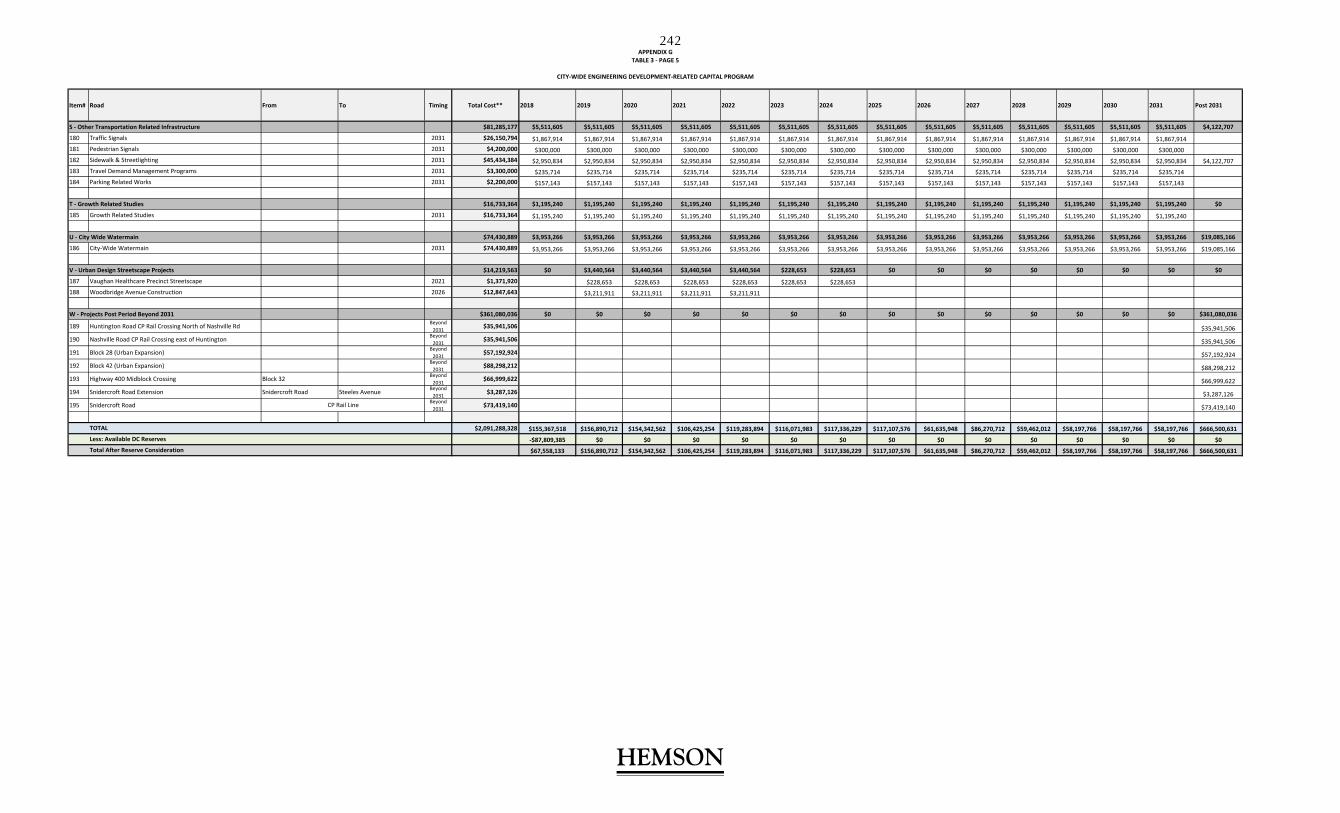
APPENDIX GTABLE 3 ‐ PAGE 5
CITY‐WIDE ENGINEERING DEVELOPMENT‐RELATED CAPITAL PROGRAM
Item# Road From To Timing Total Cost** 2018 2019 2020 2021 2022 2023 2024 2025 2026 2027 2028 2029 2030 2031 Post 2031
S ‐ Other Transportation Related Infrastructure $81,285,177 $5,511,605 $5,511,605 $5,511,605 $5,511,605 $5,511,605 $5,511,605 $5,511,605 $5,511,605 $5,511,605 $5,511,605 $5,511,605 $5,511,605 $5,511,605 $5,511,605 $4,122,707
180 Traffic Signals 2031 $26,150,794 $1,867,914 $1,867,914 $1,867,914 $1,867,914 $1,867,914 $1,867,914 $1,867,914 $1,867,914 $1,867,914 $1,867,914 $1,867,914 $1,867,914 $1,867,914 $1,867,914181 Pedestrian Signals 2031 $4,200,000 $300,000 $300,000 $300,000 $300,000 $300,000 $300,000 $300,000 $300,000 $300,000 $300,000 $300,000 $300,000 $300,000 $300,000182 Sidewalk & Streetlighting 2031 $45,434,384 $2,950,834 $2,950,834 $2,950,834 $2,950,834 $2,950,834 $2,950,834 $2,950,834 $2,950,834 $2,950,834 $2,950,834 $2,950,834 $2,950,834 $2,950,834 $2,950,834 $4,122,707183 Travel Demand Management Programs 2031 $3,300,000 $235,714 $235,714 $235,714 $235,714 $235,714 $235,714 $235,714 $235,714 $235,714 $235,714 $235,714 $235,714 $235,714 $235,714184 Parking Related Works 2031 $2,200,000 $157,143 $157,143 $157,143 $157,143 $157,143 $157,143 $157,143 $157,143 $157,143 $157,143 $157,143 $157,143 $157,143 $157,143
T ‐ Growth Related Studies $16,733,364 $1,195,240 $1,195,240 $1,195,240 $1,195,240 $1,195,240 $1,195,240 $1,195,240 $1,195,240 $1,195,240 $1,195,240 $1,195,240 $1,195,240 $1,195,240 $1,195,240 $0
185 Growth Related Studies 2031 $16,733,364 $1,195,240 $1,195,240 $1,195,240 $1,195,240 $1,195,240 $1,195,240 $1,195,240 $1,195,240 $1,195,240 $1,195,240 $1,195,240 $1,195,240 $1,195,240 $1,195,240
U ‐ City Wide Watermain $74,430,889 $3,953,266 $3,953,266 $3,953,266 $3,953,266 $3,953,266 $3,953,266 $3,953,266 $3,953,266 $3,953,266 $3,953,266 $3,953,266 $3,953,266 $3,953,266 $3,953,266 $19,085,166
186 City‐Wide Watermain 2031 $74,430,889 $3,953,266 $3,953,266 $3,953,266 $3,953,266 $3,953,266 $3,953,266 $3,953,266 $3,953,266 $3,953,266 $3,953,266 $3,953,266 $3,953,266 $3,953,266 $3,953,266 $19,085,166
V ‐ Urban Design Streetscape Projects $14,219,563 $0 $3,440,564 $3,440,564 $3,440,564 $3,440,564 $228,653 $228,653 $0 $0 $0 $0 $0 $0 $0 $0
187 Vaughan Healthcare Precinct Streetscape 2021 $1,371,920 $228,653 $228,653 $228,653 $228,653 $228,653 $228,653188 Woodbridge Avenue Construction 2026 $12,847,643 $3,211,911 $3,211,911 $3,211,911 $3,211,911
W ‐ Projects Post Period Beyond 2031 $361,080,036 $0 $0 $0 $0 $0 $0 $0 $0 $0 $0 $0 $0 $0 $0 $361,080,036
189 Huntington Road CP Rail Crossing North of Nashville Rd Beyond 2031 $35,941,506 $35,941,506
190 Nashville Road CP Rail Crossing east of Huntington Beyond 2031 $35,941,506 $35,941,506
191 Block 28 (Urban Expansion) Beyond 2031 $57,192,924 $57,192,924
192 Block 42 (Urban Expansion) Beyond 2031 $88,298,212 $88,298,212
193 Highway 400 Midblock Crossing Block 32 Beyond 2031 $66,999,622 $66,999,622
194 Snidercroft Road Extension Snidercroft Road Steeles Avenue Beyond 2031 $3,287,126 $3,287,126
195 Snidercroft Road Beyond 2031 $73,419,140 $73,419,140
$2,091,288,328 $155,367,518 $156,890,712 $154,342,562 $106,425,254 $119,283,894 $116,071,983 $117,336,229 $117,107,576 $61,635,948 $86,270,712 $59,462,012 $58,197,766 $58,197,766 $58,197,766 $666,500,631
‐$87,809,385 $0 $0 $0 $0 $0 $0 $0 $0 $0 $0 $0 $0 $0 $0
$67,558,133 $156,890,712 $154,342,562 $106,425,254 $119,283,894 $116,071,983 $117,336,229 $117,107,576 $61,635,948 $86,270,712 $59,462,012 $58,197,766 $58,197,766 $58,197,766 $666,500,631
TOTAL
Less: Available DC Reserves
Total After Reserve Consideration
CP Rail Line
HEMSON
HEMSON
242

APPENDIX GTABLE 4 ‐ PAGE 1
TRAFFIC SIGNAL INSTALLATION (PRIMARY TO PRIMARY INTERSECTION)
Units Item Description Units Unit Price Total Cost
Signalized Cross Intersection Block 10 - Apple Blossom Drive & Pleasant Ridge Avenue ea 1 $250,000.00 $200,000.00Block 10 - Apple Blossom Drive & Thornhill Woods Drive ea 1 $250,000.00 $250,000.00Block 10 - Autumn Hill Blvd & Pleasant Ridge Avenue ea 1 $250,000.00 $250,000.00Block 10 - Autumn Hill Blvd & Thornhill Woods Drive ea 1 $250,000.00 $250,000.00Block 10 - Autumn Hill Blvd. & Bathurst Glen Drive ea 1 $250,000.00 $250,000.00Block 10 - Summeridge Drive & Pleasant Ridge Avenue ea 1 $250,000.00 $250,000.00Block 10 - Summeridge Drive & Thornhill Woods Drive ea 1 $250,000.00 $250,000.00Block 11 - Valley Vista Drive & Thomas Cook Avenue ea 1 $250,000.00 $250,000.00Block 11 - Lebovic Campus Drive & Thomas Cook Avenue ea 1 $250,000.00 $250,000.00Block 11 - Lebovic Campus Drive & Ilan Roman Avenue ea 1 $250,000.00 $250,000.00Block 11 - Marc Santi Blvd & Thomas Cook Avenue ea 1 $250,000.00 $250,000.00Block 11 - Marc Santi Blvd & Ilan Roman Avenue ea 1 $250,000.00 $250,000.00Block 12 - Queen Filomena Avenue & Via Romano Blvd ea 1 $250,000.00 $250,000.00Block 17 - Forest Run Boulevard & Ten Oaks Boulevard ea 1 $250,000.00 $250,000.00Block 17 - Dufferin Hill Drive & Forest Run Boulevard ea 1 $250,000.00 $250,000.00Block 17 - Confederation Parkway & Dufferin Hill Drive ea 1 $250,000.00 $250,000.00Block 17 - Confederation Parkway & Staffern Drive ea 1 $250,000.00 $250,000.00Block 18 - District Avenue & Peter Rupert Avenue ea 1 $250,000.00 $250,000.00Block 2 - Flamingo Road & Atkinson Avenue ea 1 $250,000.00 $250,000.00Block 24 - Creditstone Road & Locke Street ea 1 $250,000.00 $250,000.00Block 24 - Caldari Road & Riverock Gate ea 1 $250,000.00 $250,000.00Block 26 - St. Joan of Arc Avenue & Drummond Drive ea 1 $250,000.00 $250,000.00Block 26 - Cranston Park Avenue & Cunningham Drive ea 1 $250,000.00 $250,000.00Block 26 - Cunningham Drive & Melville Avenue ea 1 $250,000.00 $250,000.00Block 26 - Melville Avenue & Roseheath Drive ea 1 $250,000.00 $250,000.00Block 27 - Street 2 & Street 5 ea 1 $250,000.00 $250,000.00Block 27 - Street 2 & Street 6 ea 1 $250,000.00 $250,000.00Block 27 - Street 1 & Street 5 ea 1 $250,000.00 $250,000.00Block 27 - Street 3 & Street 5 ea 1 $250,000.00 $250,000.00
VMCVMC - Block 22 - Interchange Way & Maplecrete Rd ea 1 $250,000.00 $250,000.00VMC - Block 22 - Interchange Way & Creditstone Road ea 1 $250,000.00 $250,000.00VMC - Block 22 - Doughton Road & Creditstone Road ea 1 $250,000.00 $250,000.00VMC - Block 23 - Portage Parkway & Maplecrete Rd ea 1 $250,000.00 $250,000.00VMC - Block 23 - Portage Parkway & Creditstone Road ea 1 $250,000.00 $250,000.00VMC - Block 29 - Peelar Rd & Millway Ave ea 1 $250,000.00 $250,000.00VMC - Block 29 - Peelar/Exchange & Edgeley Blvd ea 1 $250,000.00 $250,000.00VMC - Block 29 - Commerce Way & Interchange Way ea 1 $250,000.00 $250,000.00VMC - Block 29 - Edgeley Blvd & Interchange Way ea 1 $250,000.00 $250,000.00VMC - Block 29 - Millway Ave & Interchange Way ea 1 $250,000.00 $250,000.00VMC - Block 29 - Millway Ave & Doughton Rd ea 1 $250,000.00 $250,000.00VMC - Block 29 - Edgeley Ave & Doughton Rd ea 1 $250,000.00 $250,000.00VMC - Block 29 - Commerce Way & Doughton Rd ea 1 $250,000.00 $250,000.00VMC - Block 30 - Applewood Cres. & Applemill Rd ea 1 $250,000.00 $250,000.00VMC - Block 30 - Commerce Way & Applemill Rd ea 1 $250,000.00 $250,000.00VMC - Block 30 - Millway Ave & Applemill Rd ea 1 $250,000.00 $250,000.00VMC - Block 30 - Portage Parkway & Millway Rd ea 1 $250,000.00 $250,000.00
Item Quantity
HEMSON
243
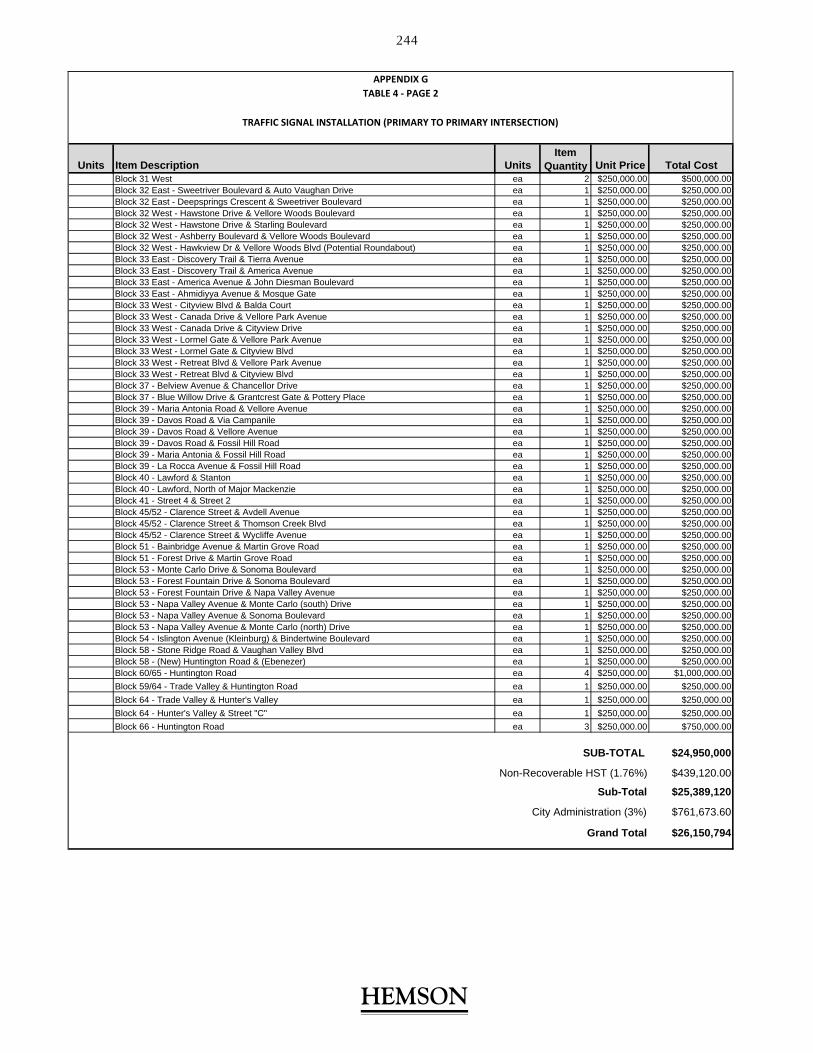
APPENDIX GTABLE 4 ‐ PAGE 2
TRAFFIC SIGNAL INSTALLATION (PRIMARY TO PRIMARY INTERSECTION)
Units Item Description Units Unit Price Total CostBlock 31 West ea 2 $250,000.00 $500,000.00Block 32 East - Sweetriver Boulevard & Auto Vaughan Drive ea 1 $250,000.00 $250,000.00Block 32 East - Deepsprings Crescent & Sweetriver Boulevard ea 1 $250,000.00 $250,000.00Block 32 West - Hawstone Drive & Vellore Woods Boulevard ea 1 $250,000.00 $250,000.00Block 32 West - Hawstone Drive & Starling Boulevard ea 1 $250,000.00 $250,000.00Block 32 West - Ashberry Boulevard & Vellore Woods Boulevard ea 1 $250,000.00 $250,000.00Block 32 West - Hawkview Dr & Vellore Woods Blvd (Potential Roundabout) ea 1 $250,000.00 $250,000.00Block 33 East - Discovery Trail & Tierra Avenue ea 1 $250,000.00 $250,000.00Block 33 East - Discovery Trail & America Avenue ea 1 $250,000.00 $250,000.00Block 33 East - America Avenue & John Diesman Boulevard ea 1 $250,000.00 $250,000.00Block 33 East - Ahmidiyya Avenue & Mosque Gate ea 1 $250,000.00 $250,000.00Block 33 West - Cityview Blvd & Balda Court ea 1 $250,000.00 $250,000.00Block 33 West - Canada Drive & Vellore Park Avenue ea 1 $250,000.00 $250,000.00Block 33 West - Canada Drive & Cityview Drive ea 1 $250,000.00 $250,000.00Block 33 West - Lormel Gate & Vellore Park Avenue ea 1 $250,000.00 $250,000.00Block 33 West - Lormel Gate & Cityview Blvd ea 1 $250,000.00 $250,000.00Block 33 West - Retreat Blvd & Vellore Park Avenue ea 1 $250,000.00 $250,000.00Block 33 West - Retreat Blvd & Cityview Blvd ea 1 $250,000.00 $250,000.00Block 37 - Belview Avenue & Chancellor Drive ea 1 $250,000.00 $250,000.00Block 37 - Blue Willow Drive & Grantcrest Gate & Pottery Place ea 1 $250,000.00 $250,000.00Block 39 - Maria Antonia Road & Vellore Avenue ea 1 $250,000.00 $250,000.00Block 39 - Davos Road & Via Campanile ea 1 $250,000.00 $250,000.00Block 39 - Davos Road & Vellore Avenue ea 1 $250,000.00 $250,000.00Block 39 - Davos Road & Fossil Hill Road ea 1 $250,000.00 $250,000.00Block 39 - Maria Antonia & Fossil Hill Road ea 1 $250,000.00 $250,000.00Block 39 - La Rocca Avenue & Fossil Hill Road ea 1 $250,000.00 $250,000.00Block 40 - Lawford & Stanton ea 1 $250,000.00 $250,000.00Block 40 - Lawford, North of Major Mackenzie ea 1 $250,000.00 $250,000.00Block 41 - Street 4 & Street 2 ea 1 $250,000.00 $250,000.00Block 45/52 - Clarence Street & Avdell Avenue ea 1 $250,000.00 $250,000.00Block 45/52 - Clarence Street & Thomson Creek Blvd ea 1 $250,000.00 $250,000.00Block 45/52 - Clarence Street & Wycliffe Avenue ea 1 $250,000.00 $250,000.00Block 51 - Bainbridge Avenue & Martin Grove Road ea 1 $250,000.00 $250,000.00Block 51 - Forest Drive & Martin Grove Road ea 1 $250,000.00 $250,000.00Block 53 - Monte Carlo Drive & Sonoma Boulevard ea 1 $250,000.00 $250,000.00Block 53 - Forest Fountain Drive & Sonoma Boulevard ea 1 $250,000.00 $250,000.00Block 53 - Forest Fountain Drive & Napa Valley Avenue ea 1 $250,000.00 $250,000.00Block 53 - Napa Valley Avenue & Monte Carlo (south) Drive ea 1 $250,000.00 $250,000.00Block 53 - Napa Valley Avenue & Sonoma Boulevard ea 1 $250,000.00 $250,000.00Block 53 - Napa Valley Avenue & Monte Carlo (north) Drive ea 1 $250,000.00 $250,000.00Block 54 - Islington Avenue (Kleinburg) & Bindertwine Boulevard ea 1 $250,000.00 $250,000.00Block 58 - Stone Ridge Road & Vaughan Valley Blvd ea 1 $250,000.00 $250,000.00Block 58 - (New) Huntington Road & (Ebenezer) ea 1 $250,000.00 $250,000.00Block 60/65 - Huntington Road ea 4 $250,000.00 $1,000,000.00
Block 59/64 - Trade Valley & Huntington Road ea 1 $250,000.00 $250,000.00
Block 64 - Trade Valley & Hunter's Valley ea 1 $250,000.00 $250,000.00
Block 64 - Hunter's Valley & Street "C" ea 1 $250,000.00 $250,000.00
Block 66 - Huntington Road ea 3 $250,000.00 $750,000.00
SUB-TOTAL $24,950,000
Non-Recoverable HST (1.76%) $439,120.00
Sub-Total $25,389,120
City Administration (3%) $761,673.60
Grand Total $26,150,794
Item Quantity
HEMSON
244
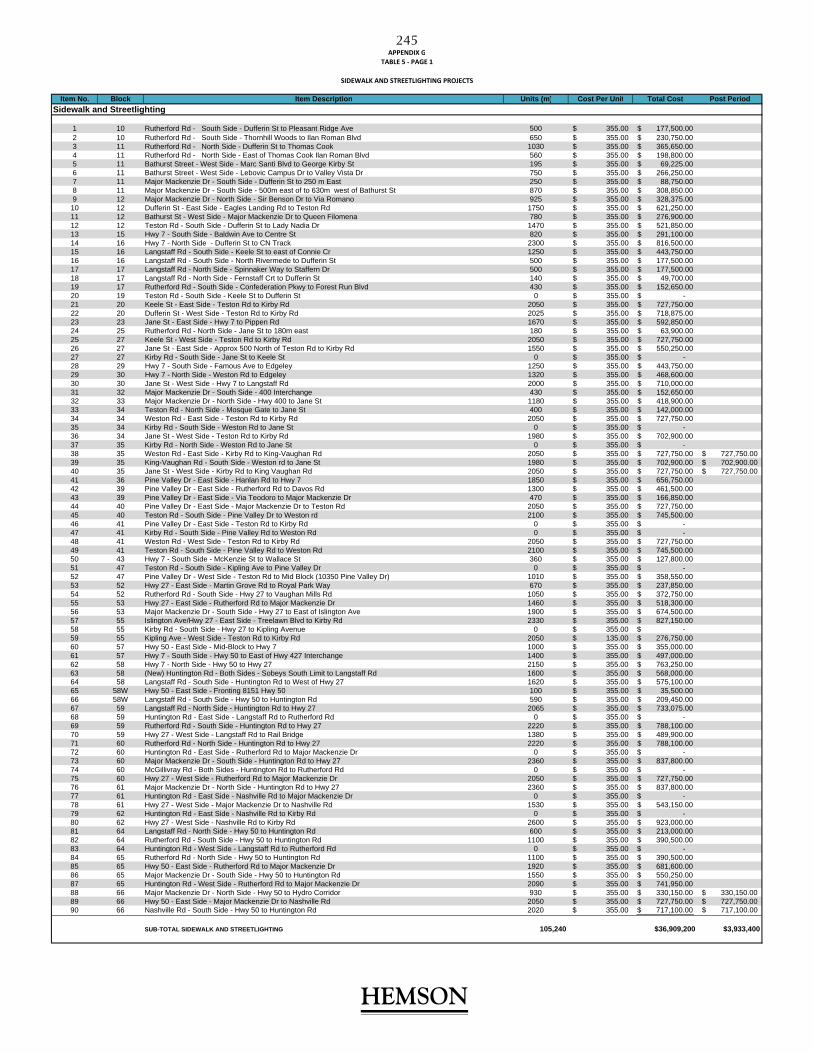
Item No. Block Item Description Units (m) Cost Per Unit Total Cost Post PeriodSidewalk and Streetlighting
1 10 Rutherford Rd - South Side - Dufferin St to Pleasant Ridge Ave 500 355.00$ 177,500.00$ 2 10 Rutherford Rd - South Side - Thornhill Woods to Ilan Roman Blvd 650 355.00$ 230,750.00$ 3 11 Rutherford Rd - North Side - Dufferin St to Thomas Cook 1030 355.00$ 365,650.00$ 4 11 Rutherford Rd - North Side - East of Thomas Cook Ilan Roman Blvd 560 355.00$ 198,800.00$ 5 11 Bathurst Street - West Side - Marc Santi Blvd to George Kirby St 195 355.00$ 69,225.00$ 6 11 Bathurst Street - West Side - Lebovic Campus Dr to Valley Vista Dr 750 355.00$ 266,250.00$ 7 11 Major Mackenzie Dr - South Side - Dufferin St to 250 m East 250 355.00$ 88,750.00$ 8 11 Major Mackenzie Dr - South Side - 500m east of to 630m west of Bathurst St 870 355.00$ 308,850.00$ 9 12 Major Mackenzie Dr - North Side - Sir Benson Dr to Via Romano 925 355.00$ 328,375.00$
10 12 Dufferin St - East Side - Eagles Landing Rd to Teston Rd 1750 355.00$ 621,250.00$ 11 12 Bathurst St - West Side - Major Mackenzie Dr to Queen Filomena 780 355.00$ 276,900.00$ 12 12 Teston Rd - South Side - Dufferin St to Lady Nadia Dr 1470 355.00$ 521,850.00$ 13 15 Hwy 7 - South Side - Baldwin Ave to Centre St 820 355.00$ 291,100.00$ 14 16 Hwy 7 - North Side - Dufferin St to CN Track 2300 355.00$ 816,500.00$ 15 16 Langstaff Rd - South Side - Keele St to east of Connie Cr 1250 355.00$ 443,750.00$ 16 16 Langstaff Rd - South Side - North Rivermede to Dufferin St 500 355.00$ 177,500.00$ 17 17 Langstaff Rd - North Side - Spinnaker Way to Staffern Dr 500 355.00$ 177,500.00$ 18 17 Langstaff Rd - North Side - Fernstaff Crt to Dufferin St 140 355.00$ 49,700.00$ 19 17 Rutherford Rd - South Side - Confederation Pkwy to Forest Run Blvd 430 355.00$ 152,650.00$ 20 19 Teston Rd - South Side - Keele St to Dufferin St 0 355.00$ -$ 21 20 Keele St - East Side - Teston Rd to Kirby Rd 2050 355.00$ 727,750.00$ 22 20 Dufferin St - West Side - Teston Rd to Kirby Rd 2025 355.00$ 718,875.00$ 23 23 Jane St - East Side - Hwy 7 to Pippen Rd 1670 355.00$ 592,850.00$ 24 25 Rutherford Rd - North Side - Jane St to 180m east 180 355.00$ 63,900.00$ 25 27 Keele St - West Side - Teston Rd to Kirby Rd 2050 355.00$ 727,750.00$ 26 27 Jane St - East Side - Approx 500 North of Teston Rd to Kirby Rd 1550 355.00$ 550,250.00$ 27 27 Kirby Rd - South Side - Jane St to Keele St 0 355.00$ -$ 28 29 Hwy 7 - South Side - Famous Ave to Edgeley 1250 355.00$ 443,750.00$ 29 30 Hwy 7 - North Side - Weston Rd to Edgeley 1320 355.00$ 468,600.00$ 30 30 Jane St - West Side - Hwy 7 to Langstaff Rd 2000 355.00$ 710,000.00$ 31 32 Major Mackenzie Dr - South Side - 400 Interchange 430 355.00$ 152,650.00$ 32 33 Major Mackenzie Dr - North Side - Hwy 400 to Jane St 1180 355.00$ 418,900.00$ 33 34 Teston Rd - North Side - Mosque Gate to Jane St 400 355.00$ 142,000.00$ 34 34 Weston Rd - East Side - Teston Rd to Kirby Rd 2050 355.00$ 727,750.00$ 35 34 Kirby Rd - South Side - Weston Rd to Jane St 0 355.00$ -$ 36 34 Jane St - West Side - Teston Rd to Kirby Rd 1980 355.00$ 702,900.00$ 37 35 Kirby Rd - North Side - Weston Rd to Jane St 0 355.00$ -$ 38 35 Weston Rd - East Side - Kirby Rd to King-Vaughan Rd 2050 355.00$ 727,750.00$ 727,750.00$ 39 35 King-Vaughan Rd - South Side - Weston rd to Jane St 1980 355.00$ 702,900.00$ 702,900.00$ 40 35 Jane St - West Side - Kirby Rd to King Vaughan Rd 2050 355.00$ 727,750.00$ 727,750.00$ 41 36 Pine Valley Dr - East Side - Hanlan Rd to Hwy 7 1850 355.00$ 656,750.00$ 42 39 Pine Valley Dr - East Side - Rutherford Rd to Davos Rd 1300 355.00$ 461,500.00$ 43 39 Pine Valley Dr - East Side - Via Teodoro to Major Mackenzie Dr 470 355.00$ 166,850.00$ 44 40 Pine Valley Dr - East Side - Major Mackenzie Dr to Teston Rd 2050 355.00$ 727,750.00$ 45 40 Teston Rd - South Side - Pine Valley Dr to Weston rd 2100 355.00$ 745,500.00$ 46 41 Pine Valley Dr - East Side - Teston Rd to Kirby Rd 0 355.00$ -$ 47 41 Kirby Rd - South Side - Pine Valley Rd to Weston Rd 0 355.00$ -$ 48 41 Weston Rd - West Side - Teston Rd to Kirby Rd 2050 355.00$ 727,750.00$ 49 41 Teston Rd - South Side - Pine Valley Rd to Weston Rd 2100 355.00$ 745,500.00$ 50 43 Hwy 7 - South Side - McKenzie St to Wallace St 360 355.00$ 127,800.00$ 51 47 Teston Rd - South Side - Kipling Ave to Pine Valley Dr 0 355.00$ -$ 52 47 Pine Valley Dr - West Side - Teston Rd to Mid Block (10350 Pine Valley Dr) 1010 355.00$ 358,550.00$ 53 52 Hwy 27 - East Side - Martin Grove Rd to Royal Park Way 670 355.00$ 237,850.00$ 54 52 Rutherford Rd - South Side - Hwy 27 to Vaughan Mills Rd 1050 355.00$ 372,750.00$ 55 53 Hwy 27 - East Side - Rutherford Rd to Major Mackenzie Dr 1460 355.00$ 518,300.00$ 56 53 Major Mackenzie Dr - South Side - Hwy 27 to East of Islington Ave 1900 355.00$ 674,500.00$ 57 55 Islington Ave/Hwy 27 - East Side - Treelawn Blvd to Kirby Rd 2330 355.00$ 827,150.00$ 58 55 Kirby Rd - South Side - Hwy 27 to Kipling Avenue 0 355.00$ -$ 59 55 Kipling Ave - West Side - Teston Rd to Kirby Rd 2050 135.00$ 276,750.00$ 60 57 Hwy 50 - East Side - Mid-Block to Hwy 7 1000 355.00$ 355,000.00$ 61 57 Hwy 7 - South Side - Hwy 50 to East of Hwy 427 Interchange 1400 355.00$ 497,000.00$ 62 58 Hwy 7 - North Side - Hwy 50 to Hwy 27 2150 355.00$ 763,250.00$ 63 58 (New) Huntington Rd - Both Sides - Sobeys South Limit to Langstaff Rd 1600 355.00$ 568,000.00$ 64 58 Langstaff Rd - South Side - Huntington Rd to West of Hwy 27 1620 355.00$ 575,100.00$ 65 58W Hwy 50 - East Side - Fronting 8151 Hwy 50 100 355.00$ 35,500.00$ 66 58W Langstaff Rd - South Side - Hwy 50 to Huntington Rd 590 355.00$ 209,450.00$ 67 59 Langstaff Rd - North Side - Huntington Rd to Hwy 27 2065 355.00$ 733,075.00$ 68 59 Huntington Rd - East Side - Langstaff Rd to Rutherford Rd 0 355.00$ -$ 69 59 Rutherford Rd - South Side - Huntington Rd to Hwy 27 2220 355.00$ 788,100.00$ 70 59 Hwy 27 - West Side - Langstaff Rd to Rail Bridge 1380 355.00$ 489,900.00$ 71 60 Rutherford Rd - North Side - Huntington Rd to Hwy 27 2220 355.00$ 788,100.00$ 72 60 Huntington Rd - East Side - Rutherford Rd to Major Mackenzie Dr 0 355.00$ -$ 73 60 Major Mackenzie Dr - South Side - Huntington Rd to Hwy 27 2360 355.00$ 837,800.00$ 74 60 McGillivray Rd - Both Sides - Huntington Rd to Rutherford Rd 0 355.00$ -$ 75 60 Hwy 27 - West Side - Rutherford Rd to Major Mackenzie Dr 2050 355.00$ 727,750.00$ 76 61 Major Mackenzie Dr - North Side - Huntington Rd to Hwy 27 2360 355.00$ 837,800.00$ 77 61 Huntington Rd - East Side - Nashville Rd to Major Mackenzie Dr 0 355.00$ -$ 78 61 Hwy 27 - West Side - Major Mackenzie Dr to Nashville Rd 1530 355.00$ 543,150.00$ 79 62 Huntington Rd - East Side - Nashville Rd to Kirby Rd 0 355.00$ -$ 80 62 Hwy 27 - West Side - Nashville Rd to Kirby Rd 2600 355.00$ 923,000.00$ 81 64 Langstaff Rd - North Side - Hwy 50 to Huntington Rd 600 355.00$ 213,000.00$ 82 64 Rutherford Rd - South Side - Hwy 50 to Huntington Rd 1100 355.00$ 390,500.00$ 83 64 Huntington Rd - West Side - Langstaff Rd to Rutherford Rd 0 355.00$ -$ 84 65 Rutherford Rd - North Side - Hwy 50 to Huntington Rd 1100 355.00$ 390,500.00$ 85 65 Hwy 50 - East Side - Rutherford Rd to Major Mackenzie Dr 1920 355.00$ 681,600.00$ 86 65 Major Mackenzie Dr - South Side - Hwy 50 to Huntington Rd 1550 355.00$ 550,250.00$ 87 65 Huntington Rd - West Side - Rutherford Rd to Major Mackenzie Dr 2090 355.00$ 741,950.00$ 88 66 Major Mackenzie Dr - North Side - Hwy 50 to Hydro Corridor 930 355.00$ 330,150.00$ 330,150.00$ 89 66 Hwy 50 - East Side - Major Mackenzie Dr to Nashville Rd 2050 355.00$ 727,750.00$ 727,750.00$ 90 66 Nashville Rd - South Side - Hwy 50 to Huntington Rd 2020 355.00$ 717,100.00$ 717,100.00$
SUB-TOTAL SIDEWALK AND STREETLIGHTING 105,240 $36,909,200 $3,933,400
APPENDIX GTABLE 5 ‐ PAGE 1
SIDEWALK AND STREETLIGHTING PROJECTS
HEMSON
245

HEMSON
Item No. Block Item Description Units (m) Cost Per Unit Total Cost Post PeriodSidewalk Only
91 2 Bathurst Street - East Side - Flamingo Rd to Wigston Pl 200 135.00$ 27,000.00$ 92 9 Bathurst Street - West Side - North Park Road to South of New Westminster Dr. 405 135.00$ 54,675.00$ 93 10 Hwy 7 - North Side - Dufferin St to Yellowwood Cir. St 370 135.00$ 49,950.00$ 94 10 Hwy 7 - North Side - Langstaff to Sassafras Dr 285 135.00$ 38,475.00$ 95 10 Hwy 7 - North Side - Thornhill Woods to Bathurst St 800 135.00$ 108,000.00$ 96 15 Keele St - East Side - Steeles Ave to Jardin Dr 1580 135.00$ 213,300.00$ 97 16 Dufferin St - West Side - Centre St to Langstaff Rd 2000 135.00$ 270,000.00$ 98 18 Rutherford Rd - North Side - Barhill Rd to Peter Rupert Ave 825 135.00$ 111,375.00$ 99 18 Rutherford Rd - North Side - Grand Trunk Ave to Dufferin St 290 135.00$ 39,150.00$
100 19 Keele St - East Side - McNaughton Rd to Teston Rd 1350 135.00$ 182,250.00$ 101 22 Steeles Ave - North Side - Keele St to Street "E" (2600 Steeles Ave W) 800 135.00$ 108,000.00$ 102 23 Keele St - West Side - South of Langstaff to 8400 Keele St 175 135.00$ 23,625.00$ 103 24 Keele St - West Side - 8672 Keele St to 8900 Keele St 580 135.00$ 78,300.00$ 104 27 Teston Rd - North Side - Jane St to Keele St 2000 135.00$ 270,000.00$ 105 29 Weston Rd - East Side - Colossus Dr to 407 Off Ramp 700 135.00$ 94,500.00$ 106 31 Langstaff Rd - North Side - east of Terecar Dr to Edgeley Blvd 650 135.00$ 87,750.00$ 107 31 Weston Rd - East Side - Valeria Blvd to Rutherford Rd 1250 135.00$ 168,750.00$ 108 34 Teston Rd - North Side - Weston Rd to Mosque Gate 1570 135.00$ 211,950.00$ 109 36 Pine Valley Dr - East Side - Hanlan to Hwy 7 1850 135.00$ 249,750.00$ 110 36 Hwy 7 - South Side - east of Marycroft to west of Whitmore Rd 590 135.00$ 79,650.00$ 111 37 Pine Valley Dr - East Side - Embassy Dr to Langstaff Rd 1550 135.00$ 209,250.00$ 112 38 Langstaff Rd - North Side - Pine Valley Dr to Balding Blvd 750 135.00$ 101,250.00$ 113 38 Pine Valley Dr - East Side - Langstaff Rd to Clubhouse Rd 1210 135.00$ 163,350.00$ 114 40 Weston Rd - West Side - Major Mackenzie Dr to Teston Rd 2015 135.00$ 272,025.00$ 115 43 Kipling Ave - East Side - Hawman Ave to Current South Limit of Kipling Ave 710 135.00$ 95,850.00$ 116 44 Kipling Ave - East Side - Powselland Cres to Vaughan Mills Rd 580 135.00$ 78,300.00$ 117 45 Langstaff - North Side - Islington to Pine Valley Drive 600 135.00$ 81,000.00$ 118 46 Rutherford Rd - North Side - Islington Ave to Pine Valley Dr 1500 135.00$ 202,500.00$ 119 59 Hwy 27 - West Side - Rutherford Rd to Rail Bridge 670 135.00$ 90,450.00$
SUB-TOTAL SIDEWALK ONLY 27,855 $3,760,425 $0
Streetlighting Only
120 1 Centre St - South Side - East of Atkinson Averica Rd to Yonge St 1400 220.00$ 308,000.00$ 121 10 Bathurst Street - West Side - Autumn Hill Blvd to Ner Israel Dr 300 220.00$ 66,000.00$ 122 11 Rutherford Rd - North Side - Ilan Roman Blvd to Bathurst St 240 220.00$ 52,800.00$ 123 11 Rutherford Rd - North Side - Thomas Cook 120M east 120 220.00$ 26,400.00$ 124 12 Major Mackenzie Dr - North Side - Dufferin St to Sir Benson Dr 360 220.00$ 79,200.00$ 125 17 Langstaff Rd - North Side - Staffern Dr to Fernstaff Court 340 220.00$ 74,800.00$ 126 17 Keele St - East Side - 8890 Keele St to Langstaff Rd 1400 220.00$ 308,000.00$ 127 18 Keele St - East Side - Kelly Pl to Major Mackenzie Dr 1250 220.00$ 275,000.00$ 128 19 Keele St - East Side - Major Mackenzie Dr to Masters Ave 400 220.00$ 88,000.00$ 129 26 Major Mackenzie Dr - North Side - Keele St to 352m west 325 220.00$ 71,500.00$ 130 26 Keele St - West Side - McNaughton Rd to Arco Circle 350 220.00$ 77,000.00$ 131 27 Jane St - West Side - Teston Rd to 500m North 500 220.00$ 110,000.00$ 132 30 Langstaff Rd - South Side - Edgeley Blvd to Jane St 730 220.00$ 160,600.00$ 133 31 Langstaff Rd - North Side - Weston Rd to Terecar Dr 230 220.00$ 50,600.00$ 134 33 Teston Rd - South Side - Mosque Gate to Jane St 600 220.00$ 132,000.00$ 135 51 Kipling Ave - West Side - Hwy 7 to Gordon Dr 1430 220.00$ 314,600.00$ 136 52 Hwy 27 - East Side - Martin Grove Rd to Langstaff 930 220.00$ 204,600.00$ 137 57 Hwy 27 - West Side - West Royal Gate Blvd to Hwy 7 350 220.00$ 77,000.00$ 138 61 Nashville Rd - South Side - Whisper Ave to Stevenson Ave 920 220.00$ 202,400.00$
SUB-TOTAL STREETLIGHTING ONLY 12,175 $2,678,500 $0
TOTAL 145,270 43,348,125 3,933,400
Non-Recoverable HST (1.76%) $762,927.00 $69,227.84Sub-Total $44,111,052 $4,002,628
City Administration (3%) $1,323,331.56 $120,078.84
Total $45,434,384 $4,122,707
SIDEWALK AND STREETLIGHTING PROJECTS
TABLE 5 ‐ PAGE 2APPENDIX G
HEMSON
246

Item No. Item Description Item Cost
1 Highway 7 and Weston Rd Secondary Plan Comprehensive Transportation Study $950,000
2 Promenade Mall Secondary Plan Comprehensive Transportation Study $508,000
3 VMC Collector Roads Functional Design Study $1,150,000
4 Creditstone Road Improvements Class EA $480,000
5 Hwy 400 Interchange Connections, OPA 637 Class EA Study $236,000
6 Kirby Road Improvements, Dufferin to Jane Street Class EA $690,000
7 Rivermede Road - Keele to Hwy 7 - EA $345,000
8 McNaughton Road - West Section - Keele to Major Mackenzie EA $345,000
9 Hill St/Troon Block 19 Critical Link - Major Mackenzie to Teston Road EA $345,000
10 McGillvary Road/Huntington Connector and Rail Grade Separation Class EA $575,000
11 Bass Pro Mills Extension to Weston Rd Class EA $173,000
12 Bass Pro Mills Extension to Weston Rd Class EA $173,000
13 Teston Road, Pine Valley Drive to Kipling Ave Class EA $345,000
14 Transportation Master Plan Update $800,000
15 VMC - Black Creek Channel Related Study $500,000
16 Flood Reduction Study EA (Rainbow Creek) $400,000
17 Erosion Assessment Studies $400,000
18 Flooding Related Studies $500,000
19 Storm Sewer Network Hydraulic Study $500,000
20 Water Loss Monitoring and Control System $2,500,000
21 Water / Wastewater Master Plan Update $600,000
22 Storm Drainage & Storm Water Management Master Plan Update $600,000
23 VMC - Hydrogeological Desktop Review & Borehole Analysis $150,000
24 Engineering DC Background Study $200,000
25 Miscellaneous Growth Related Engineering Studies $2,500,000
Total $15,965,000.00Non-Recoverable HST (1.76%) $280,984.00
Sub-Total $16,245,984
City Administration (3%) $487,379.52
Grand Total $16,733,364
OTHER ENGINEERING STUDIES
APPENDIX G
TABLE 6
GROWTH RELATED STUDIES
TRANSPORTATION RELATED STUDIES
SERVICING/STORMWATER RELATED STUDIES
HEMSON
247
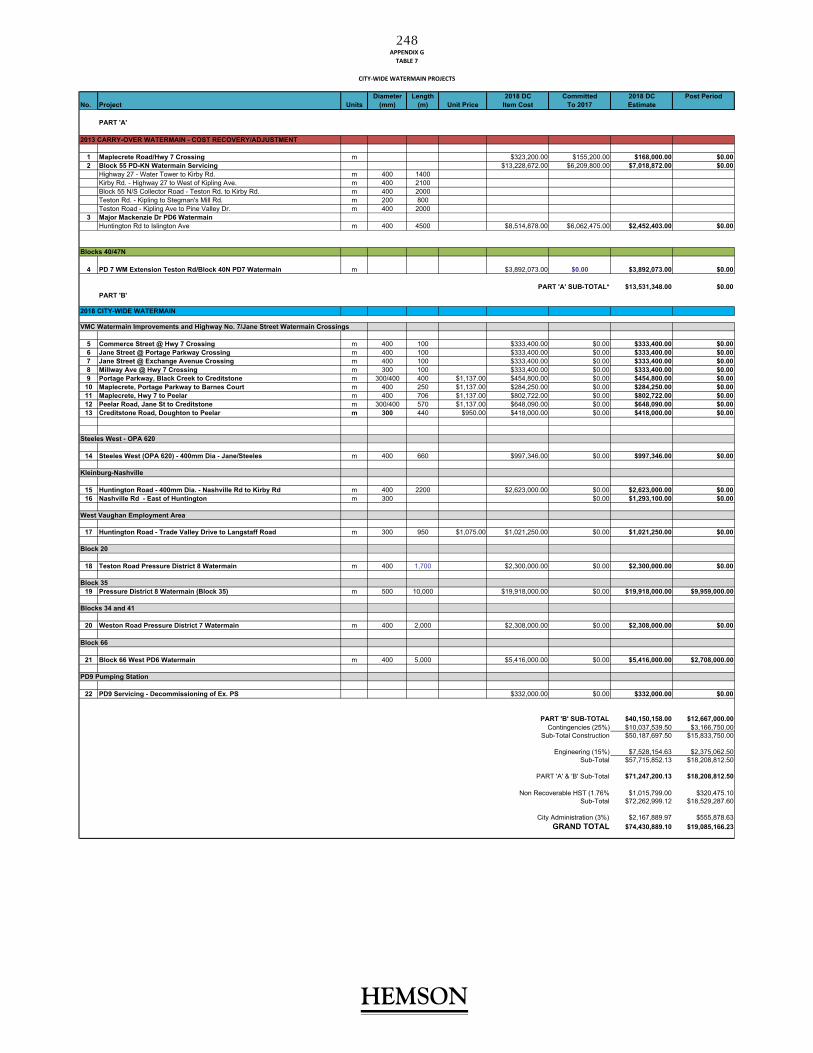
APPENDIX G
TABLE 7
CITY‐WIDE WATERMAIN PROJECTS
Diameter Length 2018 DC Committed 2018 DC Post PeriodNo. Project Units (mm) (m) Unit Price Item Cost To 2017 Estimate
PART 'A'
2013 CARRY-OVER WATERMAIN - COST RECOVERY/ADJUSTMENT
1 Maplecrete Road/Hwy 7 Crossing m $323,200.00 $155,200.00 $168,000.00 $0.002 Block 55 PD-KN Watermain Servicing $13,228,672.00 $6,209,800.00 $7,018,872.00 $0.00
Highway 27 - Water Tower to Kirby Rd. m 400 1400Kirby Rd. - Highway 27 to West of Kipling Ave. m 400 2100Block 55 N/S Collector Road - Teston Rd. to Kirby Rd. m 400 2000Teston Rd. - Kipling to Stegman's Mill Rd. m 200 800Teston Road - Kipling Ave to Pine Valley Dr. m 400 2000
3 Major Mackenzie Dr PD6 WatermainHuntington Rd to Islington Ave m 400 4500 $8,514,878.00 $6,062,475.00 $2,452,403.00 $0.00
Blocks 40/47N
4 PD 7 WM Extension Teston Rd/Block 40N PD7 Watermain m $3,892,073.00 $0.00 $3,892,073.00 $0.00
PART 'A' SUB-TOTAL* $13,531,348.00 $0.00PART 'B'
2018 CITY-WIDE WATERMAIN
VMC Watermain Improvements and Highway No. 7/Jane Street Watermain Crossings
5 Commerce Street @ Hwy 7 Crossing m 400 100 $333,400.00 $0.00 $333,400.00 $0.006 Jane Street @ Portage Parkway Crossing m 400 100 $333,400.00 $0.00 $333,400.00 $0.007 Jane Street @ Exchange Avenue Crossing m 400 100 $333,400.00 $0.00 $333,400.00 $0.008 Millway Ave @ Hwy 7 Crossing m 300 100 $333,400.00 $0.00 $333,400.00 $0.009 Portage Parkway, Black Creek to Creditstone m 300/400 400 $1,137.00 $454,800.00 $0.00 $454,800.00 $0.00
10 Maplecrete, Portage Parkway to Barnes Court m 400 250 $1,137.00 $284,250.00 $0.00 $284,250.00 $0.0011 Maplecrete, Hwy 7 to Peelar m 400 706 $1,137.00 $802,722.00 $0.00 $802,722.00 $0.0012 Peelar Road, Jane St to Creditstone m 300/400 570 $1,137.00 $648,090.00 $0.00 $648,090.00 $0.0013 Creditstone Road, Doughton to Peelar m 300 440 $950.00 $418,000.00 $0.00 $418,000.00 $0.00
Steeles West - OPA 620
14 Steeles West (OPA 620) - 400mm Dia - Jane/Steeles m 400 660 $997,346.00 $0.00 $997,346.00 $0.00
Kleinburg-Nashville
15 Huntington Road - 400mm Dia. - Nashville Rd to Kirby Rd m 400 2200 $2,623,000.00 $0.00 $2,623,000.00 $0.0016 Nashville Rd - East of Huntington m 300 $0.00 $1,293,100.00 $0.00
West Vaughan Employment Area
17 Huntington Road - Trade Valley Drive to Langstaff Road m 300 950 $1,075.00 $1,021,250.00 $0.00 $1,021,250.00 $0.00
Block 20
18 Teston Road Pressure District 8 Watermain m 400 1,700 $2,300,000.00 $0.00 $2,300,000.00 $0.00
Block 3519 Pressure District 8 Watermain (Block 35) m 500 10,000 $19,918,000.00 $0.00 $19,918,000.00 $9,959,000.00
Blocks 34 and 41
20 Weston Road Pressure District 7 Watermain m 400 2,000 $2,308,000.00 $0.00 $2,308,000.00 $0.00
Block 66
21 Block 66 West PD6 Watermain m 400 5,000 $5,416,000.00 $0.00 $5,416,000.00 $2,708,000.00
PD9 Pumping Station
22 PD9 Servicing - Decommissioning of Ex. PS $332,000.00 $0.00 $332,000.00 $0.00
PART 'B' SUB-TOTAL $40,150,158.00 $12,667,000.00Contingencies (25%) $10,037,539.50 $3,166,750.00
Sub-Total Construction $50,187,697.50 $15,833,750.00
Engineering (15%) $7,528,154.63 $2,375,062.50Sub-Total $57,715,852.13 $18,208,812.50
PART 'A' & 'B' Sub-Total $71,247,200.13 $18,208,812.50
Non Recoverable HST (1.76% $1,015,799.00 $320,475.10Sub-Total $72,262,999.12 $18,529,287.60
City Administration (3%) $2,167,889.97 $555,878.63
GRAND TOTAL $74,430,889.10 $19,085,166.23
HEMSON
248

HEMSON
TABLE 8 - PAGE 1
CITY WIDE ENGINEERING 2018 2019 2020 2021 2022 2023 2024 2025 2026 2027
OPENING CASH BALANCE $0.0 $25,080.0 ($14,257.9) ($53,698.8) ($70,656.8) ($97,652.0) ($122,970.6) ($149,700.5) ($176,384.1) ($161,303.7)
2018- 2031 RESIDENTIAL FUNDING REQUIREMENTS - City-Wide Engineering: Non Inflated $43,638.3 $101,341.5 $99,695.6 $68,744.0 $77,049.9 $74,975.2 $75,791.8 $75,644.1 $39,812.9 $55,725.4 - City-Wide Engineering: Inflated $43,638.3 $103,368.3 $103,723.3 $72,951.7 $83,401.3 $82,778.7 $85,353.9 $86,891.3 $46,647.2 $66,597.1
NEW RESIDENTIAL DEVELOPMENT - Population Growth in New Units 7,882 7,268 7,333 6,452 6,495 6,624 6,757 6,927 6,995 7,764
REVENUE - DC Receipts: Inflated $68,286.9 $64,228.9 $66,101.1 $59,321.9 $60,910.7 $63,364.8 $65,921.7 $68,935.0 $71,002.5 $80,382.3
INTEREST - Interest on Opening Balance $0.0 $877.8 ($784.2) ($2,953.4) ($3,886.1) ($5,370.9) ($6,763.4) ($8,233.5) ($9,701.1) ($8,871.7) - Interest on In-year Transactions $431.4 ($1,076.3) ($1,034.6) ($374.8) ($618.5) ($533.9) ($534.4) ($493.8) $426.2 $241.2
TOTAL REVENUE $68,718.3 $64,030.4 $64,282.3 $55,993.7 $56,406.1 $57,460.1 $58,624.0 $60,207.6 $61,727.6 $71,751.8
CLOSING CASH BALANCE $25,080.0 ($14,257.9) ($53,698.8) ($70,656.8) ($97,652.0) ($122,970.6) ($149,700.5) ($176,384.1) ($161,303.7) ($156,149.0)
CITY WIDE ENGINEERING 2028 2029 2030 2031 TOTAL
OPENING CASH BALANCE ($156,149.0) ($126,299.1) ($90,200.9) ($48,290.3)
2018- 2031 RESIDENTIAL FUNDING REQUIREMENTS - City-Wide Engineering: Non Inflated $38,408.7 $37,592.1 $37,592.1 $37,592.1 $863,603.6 - City-Wide Engineering: Inflated $46,820.0 $46,741.0 $47,675.9 $48,629.4 $965,217.1
NEW RESIDENTIAL DEVELOPMENT - Population Growth in New Units 8,010 8,266 8,532 8,807 104,113
REVENUE - DC Receipts: Inflated $84,596.9 $89,045.4 $93,741.4 $98,699.4 $1,034,539.0
INTEREST - Interest on Opening Balance ($8,588.2) ($6,946.5) ($4,961.0) ($2,656.0) ($68,838.2) - Interest on In-year Transactions $661.1 $740.3 $806.1 $876.2 ($483.7)
TOTAL REVENUE $76,669.8 $82,839.3 $89,586.5 $96,919.6 $965,217.1
CLOSING CASH BALANCE ($126,299.1) ($90,200.9) ($48,290.3) ($0.0)
2018 Adjusted Charge Per Capita $8,663.61 Allocation of Capital ProgramResidential Sector 64.6%Non-Residential Sector 35.4%
Rates for 2018Inflation Rate 2.0%Interest Rate on Positive Balances 3.5%Interest Rate on Negative Balances 5.5%
(in $000)
APPENDIX G
CITY OF VAUGHANCASHFLOW AND DETERMINATION OF DEVELOPMENT CHARGE
CITY WIDE ENGINEERINGRESIDENTIAL DEVELOPMENT CHARGE
HEMSON
HEMSON
249

TABLE 8 - PAGE 2
CITY WIDE ENGINEERING 2018 2019 2020 2021 2022 2023 2024 2025 2026 2027
OPENING CASH BALANCE $0.0 $24,178.9 $18,137.0 $14,140.6 $29,771.0 $14,417.4 ($91.3) ($15,492.8) ($31,503.0) ($24,669.3)
2018- 2031 NON-RESIDENTIAL FUNDING REQUIREMENTS - City-Wide Engineering: Non Inflated $23,919.8 $55,549.2 $54,647.0 $37,681.3 $42,234.0 $41,096.8 $41,544.4 $41,463.5 $21,823.0 $30,545.3 - City-Wide Engineering: Inflated $23,919.8 $56,660.2 $56,854.7 $39,987.7 $45,715.5 $45,374.2 $46,785.8 $47,628.5 $25,569.1 $36,504.4
NEW NON-RESIDENTIAL DEVELOPMENT - Sq. Metres in New Buildings 364,541 374,435 384,663 395,241 210,183 213,014 215,889 218,808 221,774 204,484
REVENUE - DC Receipts: Inflated $47,682.9 $49,956.5 $52,347.5 $54,862.8 $29,758.7 $30,762.7 $31,801.4 $32,876.1 $33,988.1 $31,965.2
INTEREST - Interest on Opening Balance $0.0 $846.3 $634.8 $494.9 $1,042.0 $504.6 ($5.0) ($852.1) ($1,732.7) ($1,356.8) - Interest on In-year Transactions $415.9 ($184.4) ($123.9) $260.3 ($438.8) ($401.8) ($412.1) ($405.7) $147.3 ($124.8)
TOTAL REVENUE $48,098.7 $50,618.4 $52,858.4 $55,618.1 $30,361.8 $30,865.5 $31,384.3 $31,618.3 $32,402.8 $30,483.5
CLOSING CASH BALANCE $24,178.9 $18,137.0 $14,140.6 $29,771.0 $14,417.4 ($91.3) ($15,492.8) ($31,503.0) ($24,669.3) ($30,690.3)
CITY WIDE ENGINEERING 2028 2029 2030 2031 TOTAL
OPENING CASH BALANCE ($30,690.3) ($24,900.3) ($17,645.6) ($9,373.5)
2018- 2031 NON-RESIDENTIAL FUNDING REQUIREMENTS - City-Wide Engineering: Non Inflated $21,053.3 $20,605.7 $20,605.7 $20,605.7 $473,374.7 - City-Wide Engineering: Inflated $25,663.9 $25,620.6 $26,133.0 $26,655.6 $529,073.0
NEW NON-RESIDENTIAL DEVELOPMENT - Sq. Metres in New Buildings 207,047 209,649 212,290 214,971 3,646,989
REVENUE - DC Receipts: Inflated $33,013.1 $34,096.5 $35,216.6 $36,374.6 $534,702.6
INTEREST - Interest on Opening Balance ($1,688.0) ($1,369.5) ($970.5) ($515.5) ($4,967.6) - Interest on In-year Transactions $128.6 $148.3 $159.0 $170.1 ($662.0)
TOTAL REVENUE $31,453.8 $32,875.3 $34,405.0 $36,029.1 $529,073.0
CLOSING CASH BALANCE ($24,900.3) ($17,645.6) ($9,373.5) ($0.0)
2018 Adjusted Charge Per SQ.M $130.80 Allocation of Capital ProgramResidential Sector 64.6%Non-Residential Sector 35.4%
Rates for 2018Inflation Rate 2.0%Interest Rate on Positive Balances 3.5%Interest Rate on Negative Balances 5.5%
(in $000)
APPENDIX G
CITY OF VAUGHANCASHFLOW AND DETERMINATION OF DEVELOPMENT CHARGE
CITY WIDE ENGINEERINGNON-RESIDENTIAL DEVELOPMENT CHARGE
HEMSON
HEMSON
250

APPENDIX H
AREA-SPECIFIC DEVELOPMENT CHARGES
HEMSON
251

APPENDIX H
AREA-SPECIFIC DEVELOPMENT CHARGES
The Development Engineering and Infrastructure Planning Department is responsible for the design, construction and maintenance of the City’s network of watermains, sanitary sewers and storm drainage facilities.
The following sections set out the calculation of the Area-Specific Development Charges (also referred to as SACs). The cost of the projects included in the various areas has been provided by the Development Engineering and Infrastructure Planning Department. Consistent with the DCA, s.5. (1)7, there is no legislated percentage reduction in the eligible development-related capital cost for the provision of water, wastewater and storm drainage services.
As shown in the reference table below, the ASDC related to land area based charges range from a low of $2,809 per net hectare to $944,982 per net hectare reflecting the differing relative servicing costs for the water, wastewater and storm drainage projects. It is noted also that some layering of charges may apply in various development areas. In addition to those ASDC levied on a per net hectare basis, two service areas have been calculated on a charge per unit basis for residential development and a charge per square metre for non-residential development. The per unit/GFA approach is utilized in areas where future development densities are generally known and where costs can be more equitably be distributed to the benefiting developments. Schematic representations of the different service areas are shown on the maps in this Appendix.
Six ASDCs have been carried forward from the City’s last development charges study and six new ASDCs are proposed at this time. It should be noted that the Edgeley Pond and Black Creek Channel Works ASDC established in 2016 are not being reviewed as part of this study.
HEMSON
252

Appendix H ASDC Reference Table – Based on Net Developable Hectare
City of Vaughan
Service Area Map Number
Table Number Net Cost
Net Developable
Area (Ha)
Charge Per Net Developable
Ha
Carry Forward ASDCsRainbow Creek Drainage Works Map 1 Table 1 $1,861,629 662.71 $2,809
Pressure District 5 West (Woodbridge Watermain) Map 2 Table 2 $1,245,243 155.01 $8,033
Pressure District 7 Watermain West Map 3 Table 3 $568,340 203.83 $2,788
Zenway/Huntington Road Sanitary Map 4 Table 4 $4,224,249 376.74 $11,213
Huntington Road Sewer (Trade Valley to Rutherford) Map 5 Table 5 $2,719,025 308.80 $8,805
Highway 27 South Servicing Map 6 Table 6 $881,929 5.11 $172,589
New ASDCsVMC - Interchange Storm Water Map 7 Table 7 $39,032,598 54.34 $718,253
Steeles West Sanitary Sewer Impovement Works Map 8 Table 8 $2,277,898 37.60 $60,583
Steeles West SWM Works Map 9 Table 9 $35,530,895 37.60 $944,982
Woodbridge Avenue Sanitary Sewer Improvements Map 10 Table 10 $322,732 26.12 $12,357
Total $88,664,537 1,867.85
HEMSON
253

Appendix H ASDC Reference Table –Charges based on Dwelling Unit and M2 of GFA
City of Vaughan
New ASDC
VMC SE DOUGHTON SANITARY
SEWER
VMC WEST - INTERCHANGE
SANITARY SEWER
Map Reference Map 11 Map 12
Net Hectares 12.07 46.85 People and Jobs per Hectare 249 278 Population+Employment 3,009 13,007 Population 2,049 5,723 Total Employment 960 7,284 Work at Home Employment 82 229 Residential Share 70% 45% Non-Residential Share 30% 55% Retail Employment 123 988 Institutional Employment 61 494 Employment Land Employment 0 0 Office Employment 694 5,573 DC Employment 878 7,055 Retail GFA m2 4,919 39,522
Institutional GFA m2 4,119 33,099
Employment Land GFA m2 0 0
Office GFA m2 15,952 128,169
Total DC GFA m2 24,990 200,790 Project Costs $615,480 $1,803,260 Residential Share $430,836 $807,699 Non-Residential Share $184,644 $995,561 Residential Charge Per Capita $210 $141
Charge Per Residential Unit:Singles & Semis $765 $514
Townhouses & Multiples $631 $424
Large Apartments (>= 700 sq.ft.) $467 $313
Small Apartments (< 700 sq.ft.) $336 $226
Charge Per m2 of Non-Res GFA $7.39 $4.96
HEMSON
254
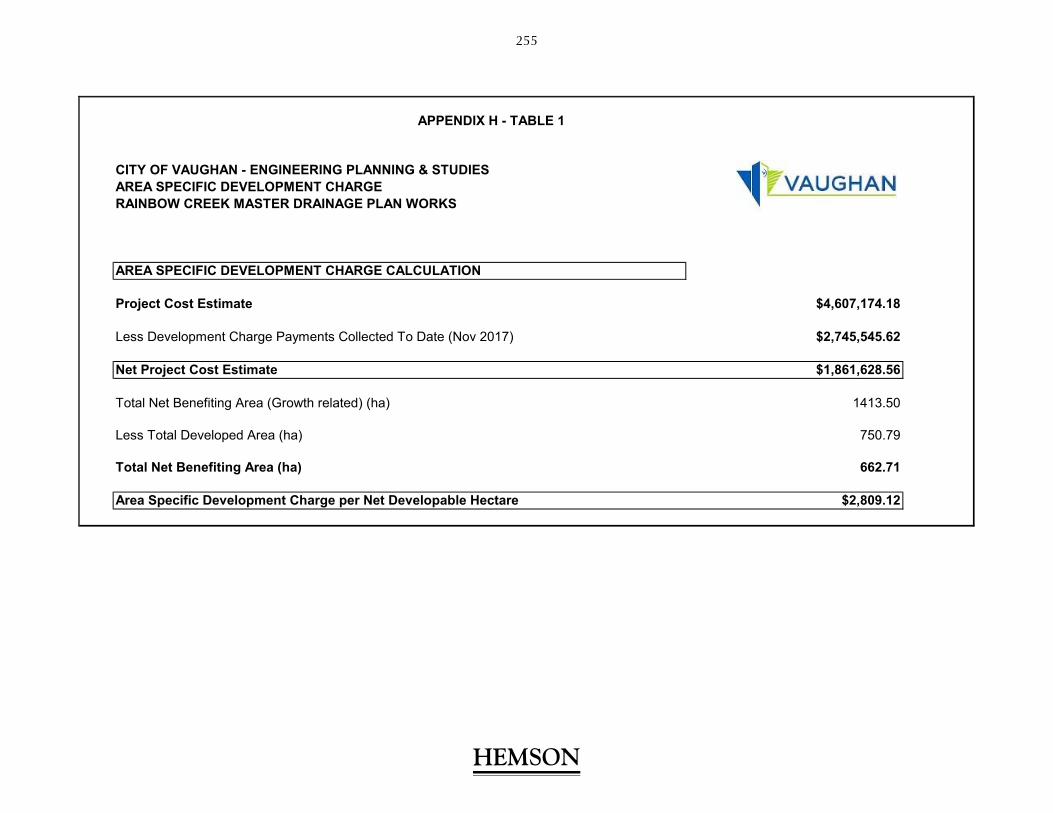
APPENDIX H - TABLE 1
CITY OF VAUGHAN - ENGINEERING PLANNING & STUDIESAREA SPECIFIC DEVELOPMENT CHARGERAINBOW CREEK MASTER DRAINAGE PLAN WORKS
AREA SPECIFIC DEVELOPMENT CHARGE CALCULATION
Project Cost Estimate $4,607,174.18
Less Development Charge Payments Collected To Date (Nov 2017) $2,745,545.62
Net Project Cost Estimate $1,861,628.56
Total Net Benefiting Area (Growth related) (ha) 1413.50
Less Total Developed Area (ha) 750.79
Total Net Benefiting Area (ha) 662.71
Area Specific Development Charge per Net Developable Hectare $2,809.12
HEMSON
255

Map 1256
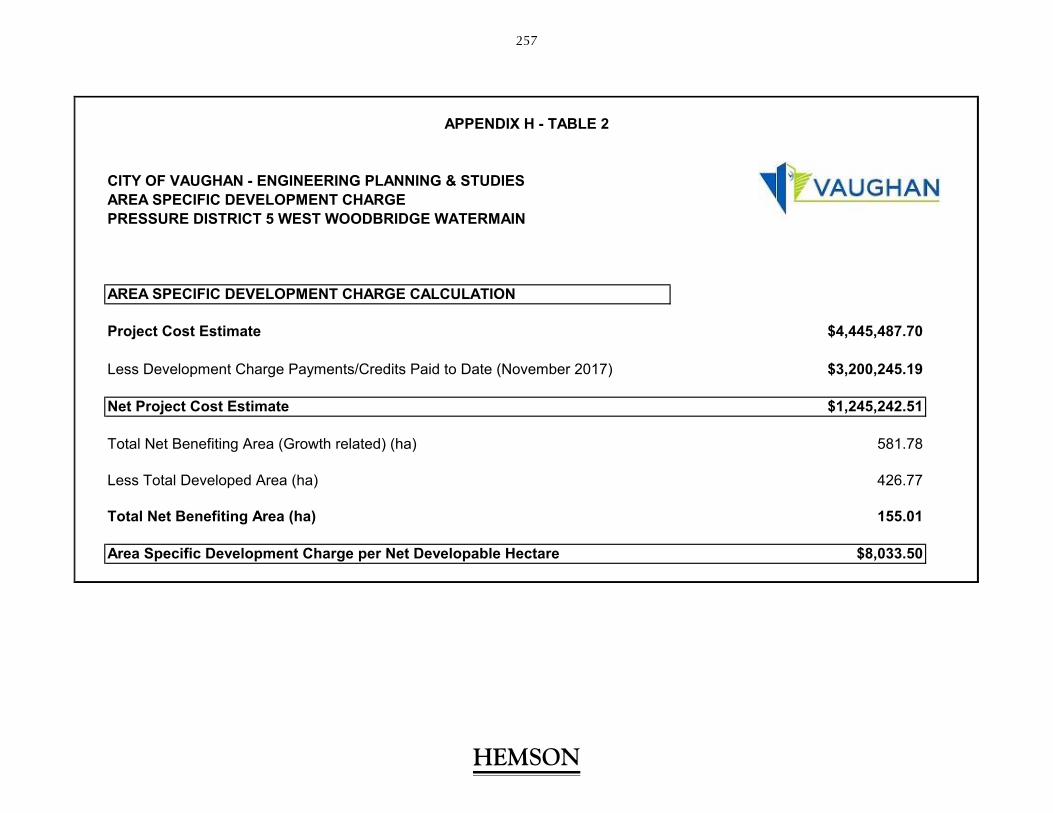
APPENDIX H - TABLE 2
CITY OF VAUGHAN - ENGINEERING PLANNING & STUDIESAREA SPECIFIC DEVELOPMENT CHARGEPRESSURE DISTRICT 5 WEST WOODBRIDGE WATERMAIN
AREA SPECIFIC DEVELOPMENT CHARGE CALCULATION
Project Cost Estimate $4,445,487.70
Less Development Charge Payments/Credits Paid to Date (November 2017) $3,200,245.19
Net Project Cost Estimate $1,245,242.51
Total Net Benefiting Area (Growth related) (ha) 581.78
Less Total Developed Area (ha) 426.77
Total Net Benefiting Area (ha) 155.01
Area Specific Development Charge per Net Developable Hectare $8,033.50
HEMSON
257

Map 2258

APPENDIX H - TABLE 3
CITY OF VAUGHAN - ENGINEERING PLANNING & STUDIESAREA SPECIFIC DEVELOPMENT CHARGEPRESSURE DISTRICT 7 WATERMAIN WEST
AREA SPECIFIC DEVELOPMENT CHARGE CALCULATION
Project Cost Estimate $7,170,346.84
Less Development Charge Credits to Date (Nov 2017) $1,717,415.37Less Development Charge Payments Paid to Date (Nov 2017) $4,884,591.45
Net Project Cost Estimate $568,340.02
Total Net Benefitting Area (Growth related) (ha) 808.05
Less Total Developed Area (ha) 604.22
Total Net Benefitting Area (ha) 203.83
Area Specific Development Charge per Net Developable Hectare $2,788.32
HEMSON
259

Map 3260

APPENDIX H - TABLE 4
CITY OF VAUGHAN ENGINEERING PLANNING & STUDIESAREA SPECIFIC DEVELOPMENT CHARGEZENWAY/HUNTINGTON SANITARY SUB-TRUNK EXTENSION
AREA SPECIFIC DEVELOPMENT CHARGE
Project Cost Estimate $6,042,343
Less Development Charge Payments Collected To Date (November 2017) $1,818,094.09
Net Project Cost Estimate $4,224,249
Total Net Residential Benefitting Area (Growth related) (ha) 628.95
Less Total Developed Area (ha) 252.22
Total Net Benefitting Area (ha) 376.74
Area Specific Development Charge per Net Developable Hectare $11,212.71
HEMSON
261

Map 4262

APPENDIX H - TABLE 5
CITY OF VAUGHAN ENGINEERING PLANNING & STUDIESAREA SPECIFIC DEVELOPMENT CHARGEHUNTINGTON SANITARY SUB-TRUNK - TRADE VALLEY TO RUTHERFORD
AREA SPECIFIC DEVELOPMENT CHARGE CALCULATION
Project Cost Estimate $4,511,458
Less Development Charge Payments Collected To Date (NOVEMBER 2017) $1,792,432.55
Net Project Cost Estimate $2,719,025
Total Net Residential Benefitting Area (Growth related) (ha) 477.34
Less Total Developed Area (ha) 168.54
Total Net Benefitting Area (ha) 308.80
Area Specific Development Charge per Net Developable Hectare $8,805.21
HEMSON
263
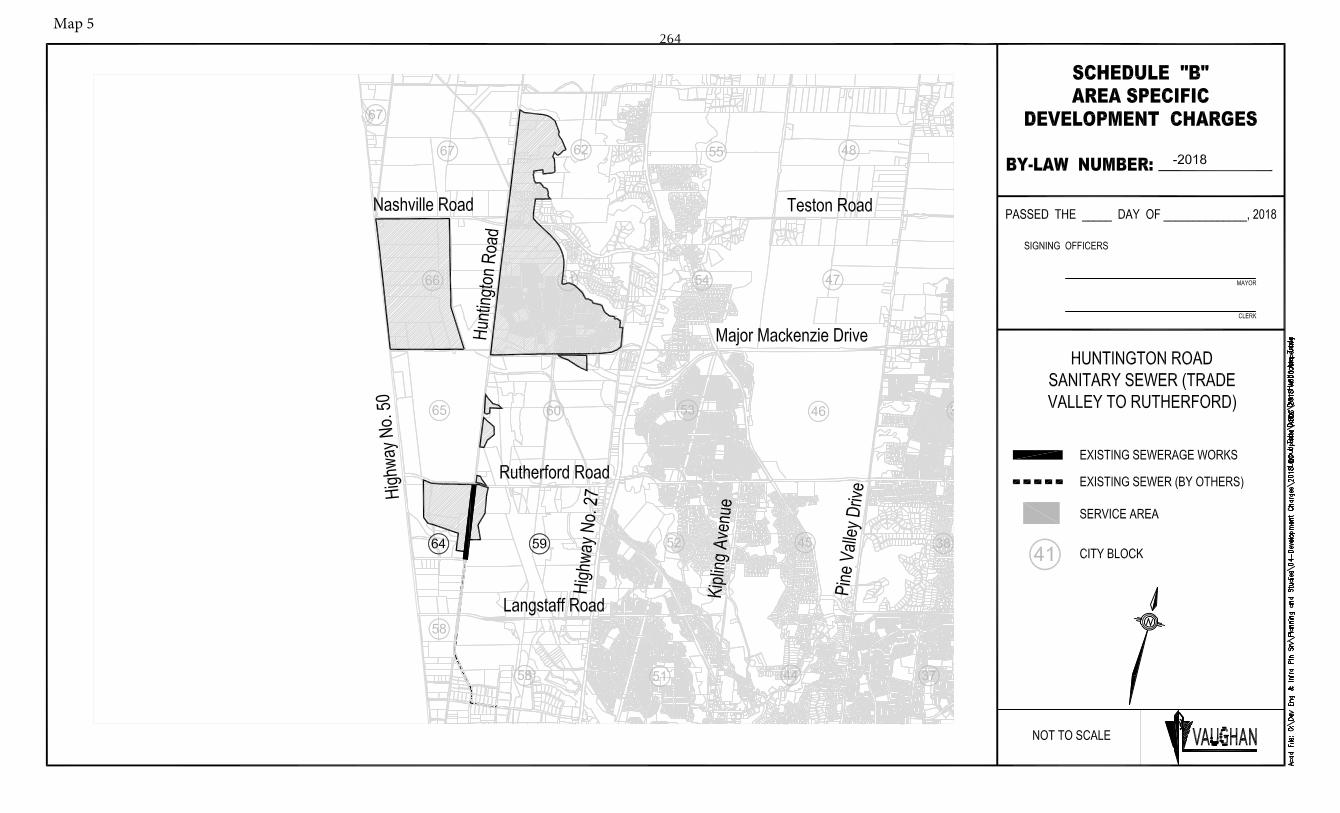
Map 5264

APPENDIX H - TABLE 6
CITY OF VAUGHAN - ENGINEERING PLANNING & STUDIESAREA SPECIFIC DEVELOPMENT CHARGEHIGHWAY 27 SOUTH SERVICING WORKS
AREA SPECIFIC DEVELOPMENT CHARGE CALCULATION
Project Cost Estimate $881,929
Less Development Charge Payments $0.00
Net Project Cost Estimate $881,929
Total Net Non-Residential Benefitting Area (Growth related) (ha) 5.11
Total Net Benefitting Area (Non-Growth related) (ha) 0.00
Total Net Benefitting Area (ha) 5.11
Area Specific Development Charge per Net Developable Hectare $172,588.90
HEMSON
265
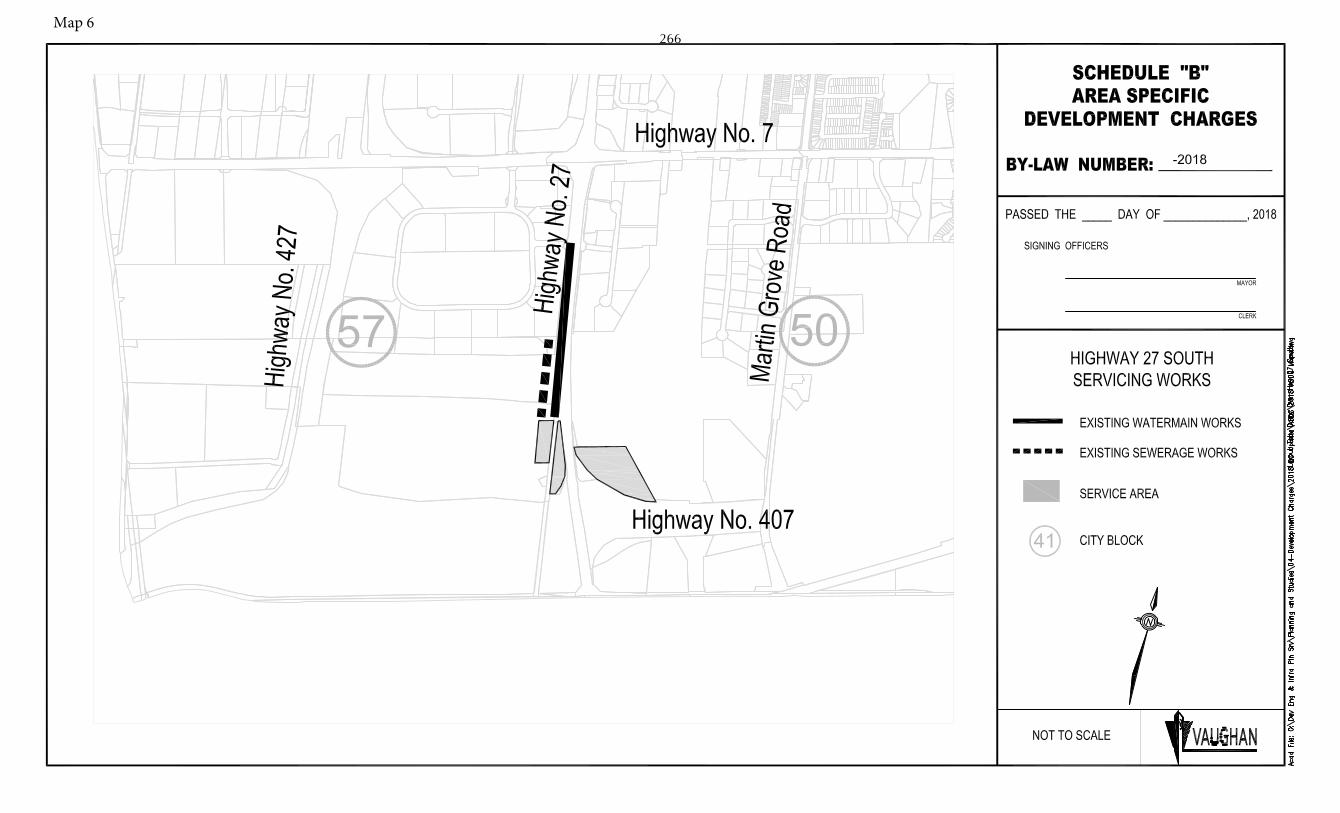
Map 6266

APPENDIX H - TABLE 7
CITY OF VAUGHAN - ENGINEERING PLANNING & STUDIESAREA SPECIFIC DEVELOPMENT CHARGEVMC INTERCHANGE STORM WATER MANAGEMENT WORKS
AREA SPECIFIC DEVELOPMENT CHARGE CALCULATION
Project Cost Estimate $39,032,598
Less Development Charge Payments $0.00
Net Project Cost Estimate $39,032,598
Total Net Benefitting Area (Growth related) (ha) 54.34
Developed Lands (ha) 0.00
Total Net Benefitting Area (ha) 54.34
Area Charge per Net Developable Hectare $718,253.01
HEMSON
267

Map 7268
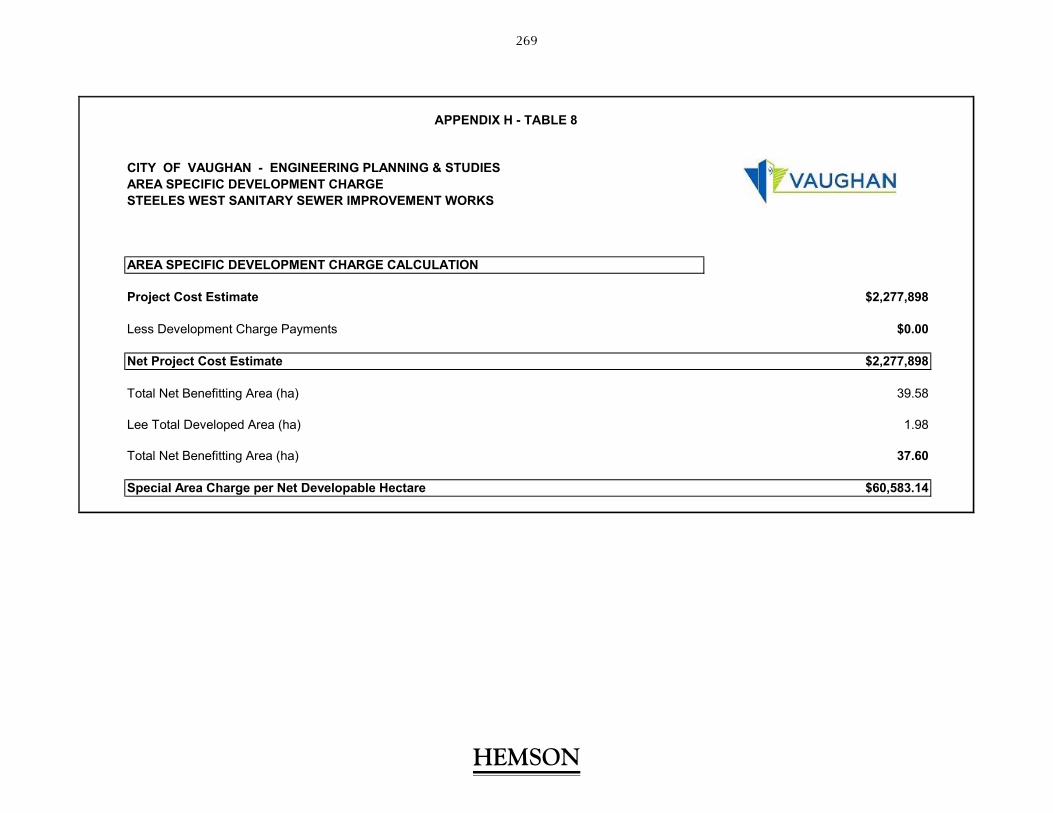
APPENDIX H - TABLE 8
CITY OF VAUGHAN - ENGINEERING PLANNING & STUDIESAREA SPECIFIC DEVELOPMENT CHARGESTEELES WEST SANITARY SEWER IMPROVEMENT WORKS
AREA SPECIFIC DEVELOPMENT CHARGE CALCULATION
Project Cost Estimate $2,277,898
Less Development Charge Payments $0.00
Net Project Cost Estimate $2,277,898
Total Net Benefitting Area (ha) 39.58
Lee Total Developed Area (ha) 1.98
Total Net Benefitting Area (ha) 37.60
Special Area Charge per Net Developable Hectare $60,583.14
HEMSON
269
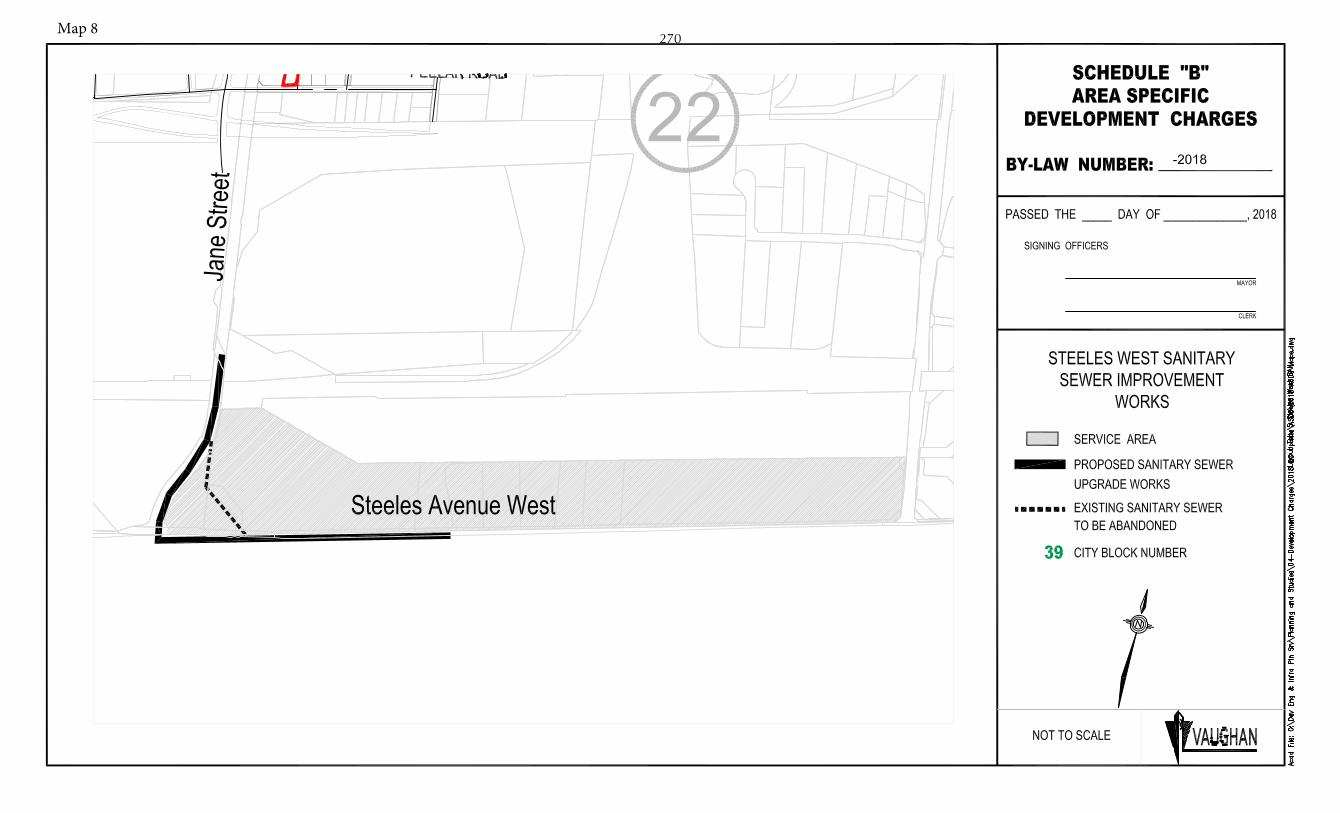
Map 8270

APPENDIX H - TABLE 9
CITY OF VAUGHAN - ENGINEERING PLANNING & STUDIESAREA SPECIFIC DEVELOPMENT CHARGESTEELES WEST STORM WATER MANAGEMENT WORKS
AREA SPECIFIC DEVELOPMENT CHARGE CALCULATION
Project Cost Estimate $35,530,895
Less Development Charge Payments $0.00
Net Project Cost Estimate $35,530,895
Total Net Benefitting Area (ha) 39.58
Less Total Developed Area (ha) 1.98
Total Net Benefitting Area (ha) 37.60
Area Specific Development Charge per Net Developable Hectare $944,982.22
HEMSON
271

Map 9272

APPENDIX H - TABLE 10
CITY OF VAUGHAN - ENGINEERING PLANNING & STUDIESAREA SPECIFIC DEVELOPMENT CHARGEWOODBRIDGE AVENUE SANITARY SEWER IMPROVEMENTS
AREA SPECIFIC DEVELOPMENT CHARGE CALCULATION
Project Cost Estimate $322,732
Less Development Charge Payments $0
Net Project Cost Estimate $322,732
Total Net Benefitting Area (ha) 33.60
Less Total Developed Area (ha) 7.48
Total Net Benefitting Area (ha) 26.12
Area Specific Development Charge per Net Developable Hectare $12,357.36
HEMSON
273

Map 10274

Map 11275

Map 12276

APPENDIX I
RESERVE FUNDS
HEMSON
277
APPENDIX I
DEVELOPMENT CHARGES RESERVE FUNDS
The Development Charges Act requires that a reserve fund be established for each service for which development charges are collected. Table 1 presents the uncommitted reserve fund balances that are available to help fund the growth-related net capital costs identified in this study. The opening balances of the development charges reserve funds as at December 31, 2017, have been adjusted to account for current commitments to projects. All of the available reserve fund balances are therefore accounted for in this study.
As shown on Table 1, the December 31, 2017, total reserve fund uncommitted balance was $166.9 million for all services, of which $79.1 million is related to general services and $87.8 million for City-wide Engineering.
The application of the available uncommitted balance in each of the reserve funds is discussed in the appendix section related to each service. These funds are assigned to projects in the initial years of the capital program for each service. This has the effect of reducing and deferring capital costs brought forward to the development charge calculation and the cash flow analysis.
HEMSON
278
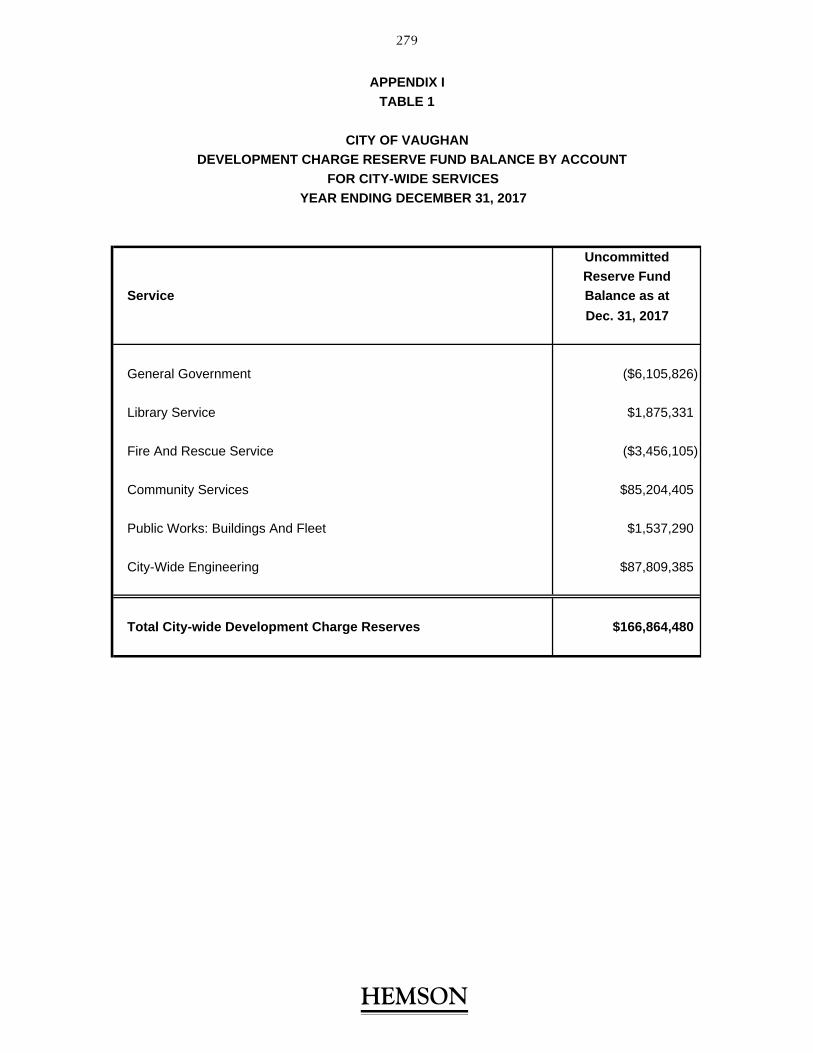
DEVELOPMENT CHARGE RESERVE FUND BALANCE BY ACCOUNT FOR CITY-WIDE SERVICES
YEAR ENDING DECEMBER 31, 2017
UncommittedReserve Fund
Service Balance as atDec. 31, 2017
General Government ($6,105,826)
Library Service $1,875,331
Fire And Rescue Service ($3,456,105)
Community Services $85,204,405
Public Works: Buildings And Fleet $1,537,290
City-Wide Engineering $87,809,385
Total City-wide Development Charge Reserves $166,864,480
APPENDIX ITABLE 1
CITY OF VAUGHAN
HEMSON
279

APPENDIX J
LONG-TERM CAPITAL AND OPERATING IMPACTS
HEMSON
280

APPENDIX JTABLE 1
CITY OF VAUGHANESTIMATED NET OPERATING COST OF THE PROPOSED
DEVELOPMENT-RELATED CAPITAL PROGRAM
Net Cost(in 2018$) 2018 2019 2020 2021 2022 2023 2024 2025 2026 2027
General Government - $0.0 $0.0 $0.0 $0.0 $0.0 $0.0 $0.0 $0.0 $0.0 $0.0
Library Services Costs from ATMP $0.0 $1,076.4 $1,489.9 $1,460.1 $2,374.3 $2,326.8 $3,639.5 $3,566.7 $4,477.7 $4,388.2
Fire and Rescue Services Costs from Fire Master Plan $1,150.0 $1,150.0 $1,150.0 $1,150.0 $1,150.0 $1,150.0 $3,450.0 $3,450.0 $5,750.0 $5,750.0
Community Services Costs from ATMP $1,154.9 $2,736.1 $4,414.0 $5,904.1 $10,534.9 $11,877.0 $14,392.3 $15,490.7 $20,315.6 $21,372.7
Public Works: Buildings and Fleet $20.00 per $1,000 of total $365.3 $370.73 $378.30 $389.55 $394.35 $512.27 $624.73 $874.10 $992.40 $1,386.62
infrastructure value
Subtotal General Services $2,670.2 $5,333.3 $7,432.2 $8,903.8 $14,453.6 $15,866.1 $22,106.5 $23,381.4 $31,535.7 $32,897.5
City-Wide Engineering 250.00$ per household $734.7 $1,401.31 $2,074.5 $2,626.9 $3,186.3 $3,759.9 $4,348.3 $4,954.9 $5,571.0 $6,294.2
TOTAL ESTIMATED OPERATING COSTS ($000) $3,404.8 $6,734.6 $9,506.7 $11,530.7 $17,639.9 $19,626.0 $26,454.8 $28,336.3 $37,106.7 $39,191.8
(in constant 2018 dollars)
Estimated Operating Costs ($000)
HEMSON
HEMSON
281
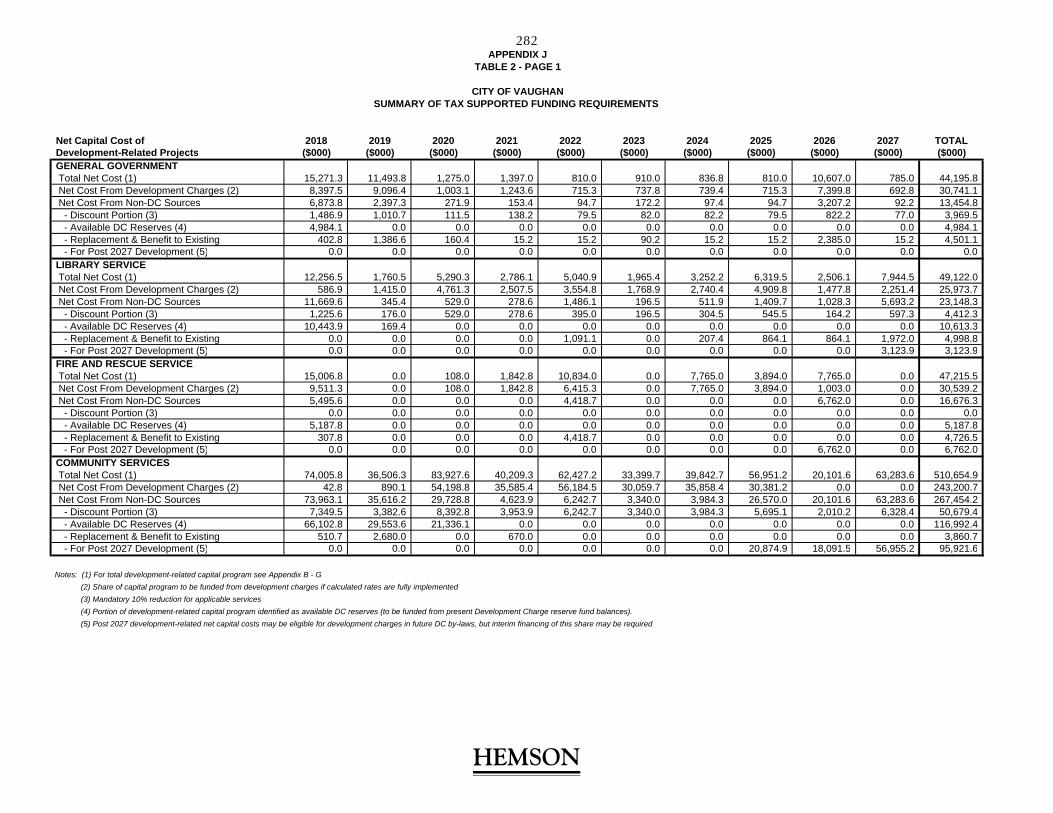
CITY OF VAUGHANSUMMARY OF TAX SUPPORTED FUNDING REQUIREMENTS
Net Capital Cost of 2018 2019 2020 2021 2022 2023 2024 2025 2026 2027 TOTALDevelopment-Related Projects ($000) ($000) ($000) ($000) ($000) ($000) ($000) ($000) ($000) ($000) ($000)GENERAL GOVERNMENT Total Net Cost (1) 15,271.3 11,493.8 1,275.0 1,397.0 810.0 910.0 836.8 810.0 10,607.0 785.0 44,195.8 Net Cost From Development Charges (2) 8,397.5 9,096.4 1,003.1 1,243.6 715.3 737.8 739.4 715.3 7,399.8 692.8 30,741.1 Net Cost From Non-DC Sources 6,873.8 2,397.3 271.9 153.4 94.7 172.2 97.4 94.7 3,207.2 92.2 13,454.8 - Discount Portion (3) 1,486.9 1,010.7 111.5 138.2 79.5 82.0 82.2 79.5 822.2 77.0 3,969.5 - Available DC Reserves (4) 4,984.1 0.0 0.0 0.0 0.0 0.0 0.0 0.0 0.0 0.0 4,984.1 - Replacement & Benefit to Existing 402.8 1,386.6 160.4 15.2 15.2 90.2 15.2 15.2 2,385.0 15.2 4,501.1 - For Post 2027 Development (5) 0.0 0.0 0.0 0.0 0.0 0.0 0.0 0.0 0.0 0.0 0.0LIBRARY SERVICE Total Net Cost (1) 12,256.5 1,760.5 5,290.3 2,786.1 5,040.9 1,965.4 3,252.2 6,319.5 2,506.1 7,944.5 49,122.0 Net Cost From Development Charges (2) 586.9 1,415.0 4,761.3 2,507.5 3,554.8 1,768.9 2,740.4 4,909.8 1,477.8 2,251.4 25,973.7 Net Cost From Non-DC Sources 11,669.6 345.4 529.0 278.6 1,486.1 196.5 511.9 1,409.7 1,028.3 5,693.2 23,148.3 - Discount Portion (3) 1,225.6 176.0 529.0 278.6 395.0 196.5 304.5 545.5 164.2 597.3 4,412.3 - Available DC Reserves (4) 10,443.9 169.4 0.0 0.0 0.0 0.0 0.0 0.0 0.0 0.0 10,613.3 - Replacement & Benefit to Existing 0.0 0.0 0.0 0.0 1,091.1 0.0 207.4 864.1 864.1 1,972.0 4,998.8 - For Post 2027 Development (5) 0.0 0.0 0.0 0.0 0.0 0.0 0.0 0.0 0.0 3,123.9 3,123.9FIRE AND RESCUE SERVICE Total Net Cost (1) 15,006.8 0.0 108.0 1,842.8 10,834.0 0.0 7,765.0 3,894.0 7,765.0 0.0 47,215.5 Net Cost From Development Charges (2) 9,511.3 0.0 108.0 1,842.8 6,415.3 0.0 7,765.0 3,894.0 1,003.0 0.0 30,539.2 Net Cost From Non-DC Sources 5,495.6 0.0 0.0 0.0 4,418.7 0.0 0.0 0.0 6,762.0 0.0 16,676.3 - Discount Portion (3) 0.0 0.0 0.0 0.0 0.0 0.0 0.0 0.0 0.0 0.0 0.0 - Available DC Reserves (4) 5,187.8 0.0 0.0 0.0 0.0 0.0 0.0 0.0 0.0 0.0 5,187.8 - Replacement & Benefit to Existing 307.8 0.0 0.0 0.0 4,418.7 0.0 0.0 0.0 0.0 0.0 4,726.5 - For Post 2027 Development (5) 0.0 0.0 0.0 0.0 0.0 0.0 0.0 0.0 6,762.0 0.0 6,762.0COMMUNITY SERVICES Total Net Cost (1) 74,005.8 36,506.3 83,927.6 40,209.3 62,427.2 33,399.7 39,842.7 56,951.2 20,101.6 63,283.6 510,654.9 Net Cost From Development Charges (2) 42.8 890.1 54,198.8 35,585.4 56,184.5 30,059.7 35,858.4 30,381.2 0.0 0.0 243,200.7 Net Cost From Non-DC Sources 73,963.1 35,616.2 29,728.8 4,623.9 6,242.7 3,340.0 3,984.3 26,570.0 20,101.6 63,283.6 267,454.2 - Discount Portion (3) 7,349.5 3,382.6 8,392.8 3,953.9 6,242.7 3,340.0 3,984.3 5,695.1 2,010.2 6,328.4 50,679.4 - Available DC Reserves (4) 66,102.8 29,553.6 21,336.1 0.0 0.0 0.0 0.0 0.0 0.0 0.0 116,992.4 - Replacement & Benefit to Existing 510.7 2,680.0 0.0 670.0 0.0 0.0 0.0 0.0 0.0 0.0 3,860.7 - For Post 2027 Development (5) 0.0 0.0 0.0 0.0 0.0 0.0 0.0 20,874.9 18,091.5 56,955.2 95,921.6
Notes: (1) For total development-related capital program see Appendix B - G
(2) Share of capital program to be funded from development charges if calculated rates are fully implemented
(3) Mandatory 10% reduction for applicable services
(4) Portion of development-related capital program identified as available DC reserves (to be funded from present Development Charge reserve fund balances).
(5) Post 2027 development-related net capital costs may be eligible for development charges in future DC by-laws, but interim financing of this share may be required
APPENDIX JTABLE 2 - PAGE 1
HEMSON
HEMSON
282
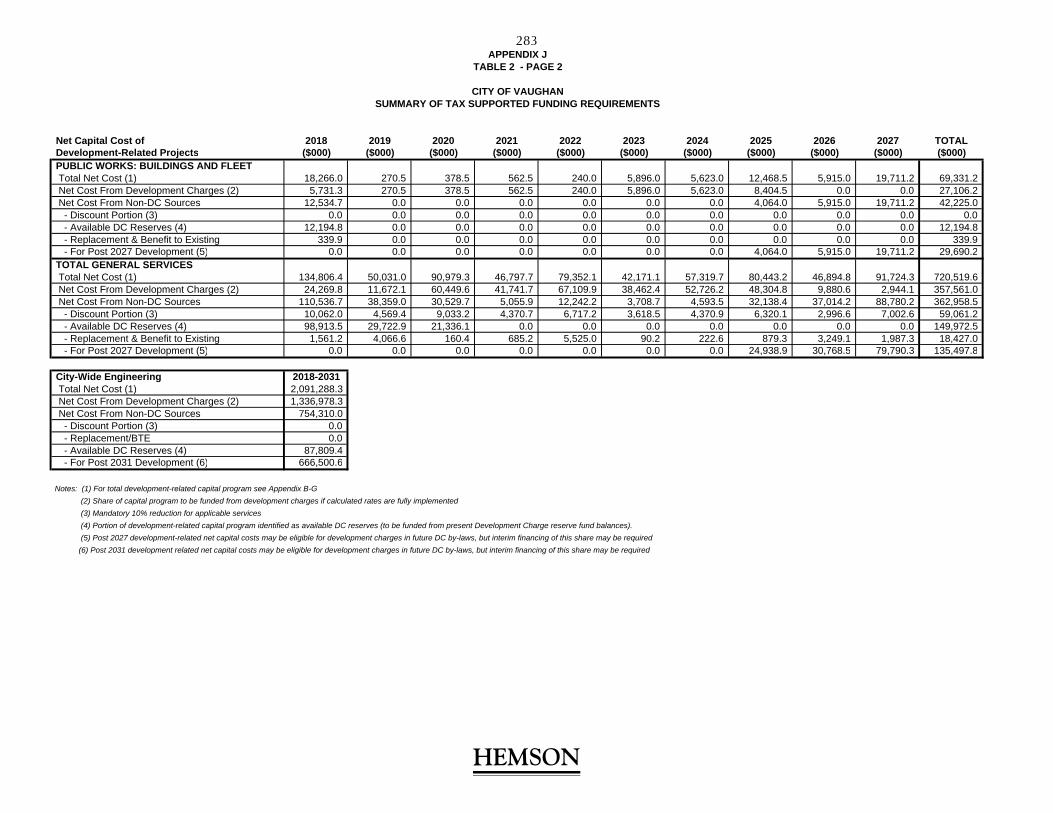
CITY OF VAUGHANSUMMARY OF TAX SUPPORTED FUNDING REQUIREMENTS
Net Capital Cost of 2018 2019 2020 2021 2022 2023 2024 2025 2026 2027 TOTALDevelopment-Related Projects ($000) ($000) ($000) ($000) ($000) ($000) ($000) ($000) ($000) ($000) ($000)PUBLIC WORKS: BUILDINGS AND FLEET Total Net Cost (1) 18,266.0 270.5 378.5 562.5 240.0 5,896.0 5,623.0 12,468.5 5,915.0 19,711.2 69,331.2 Net Cost From Development Charges (2) 5,731.3 270.5 378.5 562.5 240.0 5,896.0 5,623.0 8,404.5 0.0 0.0 27,106.2 Net Cost From Non-DC Sources 12,534.7 0.0 0.0 0.0 0.0 0.0 0.0 4,064.0 5,915.0 19,711.2 42,225.0 - Discount Portion (3) 0.0 0.0 0.0 0.0 0.0 0.0 0.0 0.0 0.0 0.0 0.0 - Available DC Reserves (4) 12,194.8 0.0 0.0 0.0 0.0 0.0 0.0 0.0 0.0 0.0 12,194.8 - Replacement & Benefit to Existing 339.9 0.0 0.0 0.0 0.0 0.0 0.0 0.0 0.0 0.0 339.9 - For Post 2027 Development (5) 0.0 0.0 0.0 0.0 0.0 0.0 0.0 4,064.0 5,915.0 19,711.2 29,690.2TOTAL GENERAL SERVICES Total Net Cost (1) 134,806.4 50,031.0 90,979.3 46,797.7 79,352.1 42,171.1 57,319.7 80,443.2 46,894.8 91,724.3 720,519.6 Net Cost From Development Charges (2) 24,269.8 11,672.1 60,449.6 41,741.7 67,109.9 38,462.4 52,726.2 48,304.8 9,880.6 2,944.1 357,561.0 Net Cost From Non-DC Sources 110,536.7 38,359.0 30,529.7 5,055.9 12,242.2 3,708.7 4,593.5 32,138.4 37,014.2 88,780.2 362,958.5 - Discount Portion (3) 10,062.0 4,569.4 9,033.2 4,370.7 6,717.2 3,618.5 4,370.9 6,320.1 2,996.6 7,002.6 59,061.2 - Available DC Reserves (4) 98,913.5 29,722.9 21,336.1 0.0 0.0 0.0 0.0 0.0 0.0 0.0 149,972.5 - Replacement & Benefit to Existing 1,561.2 4,066.6 160.4 685.2 5,525.0 90.2 222.6 879.3 3,249.1 1,987.3 18,427.0 - For Post 2027 Development (5) 0.0 0.0 0.0 0.0 0.0 0.0 0.0 24,938.9 30,768.5 79,790.3 135,497.8
City-Wide Engineering 2018-2031 Total Net Cost (1) 2,091,288.3 Net Cost From Development Charges (2) 1,336,978.3 Net Cost From Non-DC Sources 754,310.0 - Discount Portion (3) 0.0 - Replacement/BTE 0.0 - Available DC Reserves (4) 87,809.4 - For Post 2031 Development (6) 666,500.6
Notes: (1) For total development-related capital program see Appendix B-G
(2) Share of capital program to be funded from development charges if calculated rates are fully implemented
(3) Mandatory 10% reduction for applicable services
(4) Portion of development-related capital program identified as available DC reserves (to be funded from present Development Charge reserve fund balances).
(5) Post 2027 development-related net capital costs may be eligible for development charges in future DC by-laws, but interim financing of this share may be required
(6) Post 2031 development related net capital costs may be eligible for development charges in future DC by-laws, but interim financing of this share may be required
APPENDIX JTABLE 2 - PAGE 2
HEMSON
283

APPENDIX K
ASSET MANAGEMENT PLAN
HEMSON
284

APPENDIX K
ASSET MANAGEMENT PLAN
ASSET MANAGEMENT PLAN
The Development Charges Act now requires that municipalities complete an Asset Management Plan before passing a development charges by-law. A key function of the Asset Management Plan is to demonstrate that all assets proposed to be funded under the development charges by-law are financially sustainable over their full life-cycle.
Asset Types
A summary of the future municipal-owned assets and estimated useful life assumptions for eligible DC services considered as part of the study are outlined in Table 1 and Table 2. Although all capital assets considered in the study have been identified, not all assets necessitate future replacement or ongoing maintenance activities. The exception and the justification is as follows:
Some of the works identified may represent one-time expenditures and may be temporary in nature. Therefore, the assets would not be required to be replaced and no ongoing operation and maintenance costs exist. Such assets are identified as “not a long-term asset” in the table.
Some projects do not relate to the emplacement of a tangible capital asset– some examples include the acquisition of land or the undertaking of development-related studies. These projects/costs do not necessarily require future replacement or ongoing maintenance. Such projects are identified as “not infrastructure” in the table.
It should be noted that the capital cost estimates prepared for each of the projects identified in this section include grouped costs of various individual elements, which, as a stand-alone item, may have its own useful life (ex. New buildings include: HVAC, structural elements, roof, etc.). Accordingly, the average useful life assumptions noted below are applicable to all project components.
HEMSON
285

Table 1Summary of City-wide Municipal Assets for General Services
Service and Amenities Estimated Useful Life Library
Land Acquisition Studies and Design Buildings Resources, Furniture/equipment, Communications
Not Infrastructure Not Infrastructure 50 Years 7 Years
Fire and Protection Recovery of Negative Reserve Fund Land Acquisition Buildings Fire Equipment Fire Engine Prevention Vehicles
Not a Long-Term Asset Not Infrastructure 50 Years 10 Years 15 Years 12 Years
Community Services Land Acquisition Buildings Furniture and Equipment Park Facilities Non-Road Vehicles and Equipment
Not Infrastructure 50 Years 7 Years 15 - 20 Years 7 – 15 Years
Public Works: Buildings and Fleet Land Acquisition Facilities Road Vehicles and Equipment
Not Infrastructure 50 Years 7 – 15 Years
General Government Recovery of Negative DC Reserve Fund All studies
Not a Long-Term Asset Not infrastructure
Table 2Summary of City-wide Municipal Assets for Engineered Services
Capital Project Description Estimated Useful Life City-Wide Engineering
Traffic control and signalization, road infrastructure, rail grade separations, streetscaping, sidewalk, streetligting, watermains
Assets in this category have a 20-60 year useful life
Annual Provision
When assets require rehabilitation or are due for replacement, the source of funds is limited to reserves or contributions from operating. Capital expenditures to carry out the rehabilitation and replacement of aging infrastructure are not development-related and are therefore not eligible for funding through development charge revenues or other developer contributions.
HEMSON
286

Based on the information obtained from City staff regarding useful life assumptions and the capital cost of acquiring and/or emplacing each asset, a provision for infrastructure replacement has been calculated for both the general and engineered services. Provisions for infrastructure replacement are initially calculated for each asset based on their useful life and the anticipated cost of replacement. The aggregate of all individual provisions form the required annual capital provision. In calculating the annual provisions, a number of assumptions are made to account for inflation (2.0 per cent) and interest (3.5 per cent).
Consistent with the requirements of the Development Charge Act, assets that are proposed to be funded under the development charges by-law have been included in the analysis. As a result, the total calculated annual provision for development charge related infrastructure has been netted down to consider the replacement of existing infrastructure or benefit-to-existing development. For reference, the annual replacement provisions associated with the non-development charge funded portion include costs related to benefit-to-existing development, post-period benefit as well as a portion of the statutory ten percent discount that relates to those DC costs that will be considered for recovery in subsequent by-laws has also been calculated.
Tables 3 and 4 provides the calculated annual asset management contribution for 2018-2028 and 2018-2032 for both the gross capital expenditures and the share related to the 2018-2027 and 2018-2031 DC recoverable portion. The year 2028 and 2032 have been included to calculate the annual contribution for the 2018-2027 and 2018-2031 periods as the expenditures in 2027 and 2031 will not trigger asset management contributions until 2028 and 2032, respectively. As shown in Table 3, by 2028, the City will need to fund an additional $10.2 million per annum in order to properly fund the full life-cycle costs of the new assets related to the general services supported under the development charges by-law.
Table 4 provides a separate analysis of the annual provisions required for the City-wide engineered services capital program as the program extends to 2031. As shown in Table 4, the annual provision in 2032 amounts to $22.9 million. In addition to the City-wide engineering infrastructure, annual provisions related to the City’s rate related assets covered by the Area-Specific Development Charges amount to $1.3 million.
HEMSON
287

Financial Sustainability of the Program
Future Revenue Growth
The calculated annual funding provision should be considered within the context of the City’s projected growth. Over the next ten years (to 2027) the City is projected to increase by approximately 25,200 households, which represents a 26 per cent increase over the existing base. In addition, the City will also add nearly 42,200 new employees that will result in approximately 2.8 million square metres of additional non-residential building space.
By 2031, there will be an increase of nearly 37,900 new dwelling units and 3.6 million square metres of non-residential building space. This growth will have the effect of increasing the overall assessment base and additional user fee and charges revenues to offset the capital asset provisions required to replace the infrastructure proposed to be funded under the development charges by-law. The collection of these funds is intended to be allocated to the City’s reserves for the future replacement of these assets.
2018-2027Capital Program
Service DC Funded (In Period) Non-DC Funded
DC Related Non-DC Related
Library Services 40,652,000$ 8,470,000$ 1,515,000$ 481,000$ Fire and Rescue Services 35,727,000$ 11,489,000$ 488,000$ 326,000$ Community Services 400,215,000$ 110,440,000$ 7,204,000$ 1,652,000$ Public Works: Buildings and Fleet 39,301,000$ 30,030,000$ 949,000$ 783,000$
General Services Sub-total 515,895,000$ 160,429,000$ 10,156,000$ 3,242,000$
* Non-DC funding includes projects that are replacement shares, post-period shares and associated 10% discount etc.
2018-2031Capital Program
Service DC Funded (In Period) Non-DC Funded
DC Related Non-DC Related
City-Wide Engineering* 1,424,800,000$ 666,501,000$ 22,893,466$ 15,265,068$
Total 2032 Provision 22,893,466$ 15,265,068$
ASDC Assets 1,283,777$ -$
* Calculated Annual Provision has been adjusted to remove land acquisition costs
Calculated AMP Annual Provision by 2028
Table 4Calculated Annual Provision by 2031 Engineered Services
Calculated AMP Annual Provision by 2031
Table 3Calculated Annual Provision by 2028 General Services
HEMSON
288

Annual Budgetary Reviews
In order to maintain, protect and manage the City’s infrastructure and assets, staff monitor current levels of service and life cycle trends. These assessments are used to schedule appropriate activities, such as the pavement management program, bridge rehabilitation, road reconstruction, equipment/vehicle replacement and drainage improvement. Ongoing maintenance and repairs to community facilities will ensure that they continue to meet the needs of a growing population into the future.
Overall, the City will continue to invest, renew and manage infrastructure and assets by implementing an asset management program that is crucial to forecasting capital budgetary needs, both in the short term and long term. This will help to improve financial sustainability to maximize benefits, reduce risk and provide satisfactory levels of service to the community user in an environmentally and ecologically responsible manner.
The Program is Deemed Financially Sustainable
The calculated annual provisions identified in Tables 3 and 4 are considered to be financially sustainable as it is expected that the increased capital asset management requirements can be absorbed by the tax and user base over the long-term. Importantly, the City’s annual operating budget review will allow staff to continue to monitor and implement mitigating measures should the program become less sustainable.
HEMSON
289
APPENDIX L
DRAFT DC BY-LAWS
(AVAILABLE UNDER SEPARATE COVER)
HEMSON
290