Embed Size (px)
Citation preview

C I T Y O F
Cali fornia
Comprehensive Annual Financial Report For Fiscal Year Ended June 30, 2018

Hakone Japanese Gardens & Estate Located just outside Saratoga’s downtown village, on Big Basin Way

Saratoga, California
Comprehensive Annual Financial Report For the Fiscal Year Ended June 30, 2018
City Council
Mary-Lynne Bernald ................................................................................................... Mayor Manny Cappello ................................................................................................. Vice-Mayor Howard Miller ............................................................................................ Council Member Emily Lo .................................................................................................... Council Member Rishi Kumar ............................................................................................... Council Member
Presented under the direction of: James Lindsay, City Manager
Finance & Administrative Services Department

This page is intentionally blank.

CITY OF SARATOGA COMPREHENSIVE ANNUAL FINANCIAL REPORT FOR THE YEAR ENDED JUNE 30, 2018
5
TABLE OF CONTENTS INTRODUCTORY SECTION Letter of Transmittal ......................................................................................................... 9 GFOA Certificate of Achievement for Excellence in Financial Reporting ......................... 15 Principal Officers of the City .......................................................................................... 16 Organization Chart ......................................................................................................... 17 FINANCIAL SECTION Independent Auditors’ Report ........................................................................................... 20 Management’s Discussion and Analysis (Required Supplementary Information) ............. 22 Basic Financial Statements:
Government-Wide Financial Statements Statement of Net Position .......................................................................................... 38 Statement of Activities and Changes in Net Position .................................................. 39
Fund Financial Statements Governmental Funds: Balance Sheet ........................................................................................................... 40 Reconciliation of the Government Funds Balance Sheet to the Government-Wide Financial Statement of Net Position ............................... 41 Statement of Revenues, Expenditures and Changes in Fund Balances ......................... 42 Reconciliation of the Governmental Funds Statement of Revenues, Expenditures and Changes in Fund Balances to the Government-Wide Statement of Activities and Changes in Net Position ............................................. 43 Proprietary Funds: Statement of Net Position .......................................................................................... 44 Statement of Revenues, Expenses, and Changes in Fund Net Position ......................... 45 Statement of Cash Flows ........................................................................................... 46 Basic Financial Statement Notes: Notes to the Basic Financial Statements ..................................................................... 47 Required Supplementary Information Budgetary Information .............................................................................................. 78 Modified Approach for City Streets Infrastructure Capital Assets ............................... 80 Pension Information .................................................................................................. 82
CITY OF SARATOGA COMPREHENSIVE ANNUAL FINANCIAL REPORT FOR THE YEAR ENDED JUNE 30, 2018
6
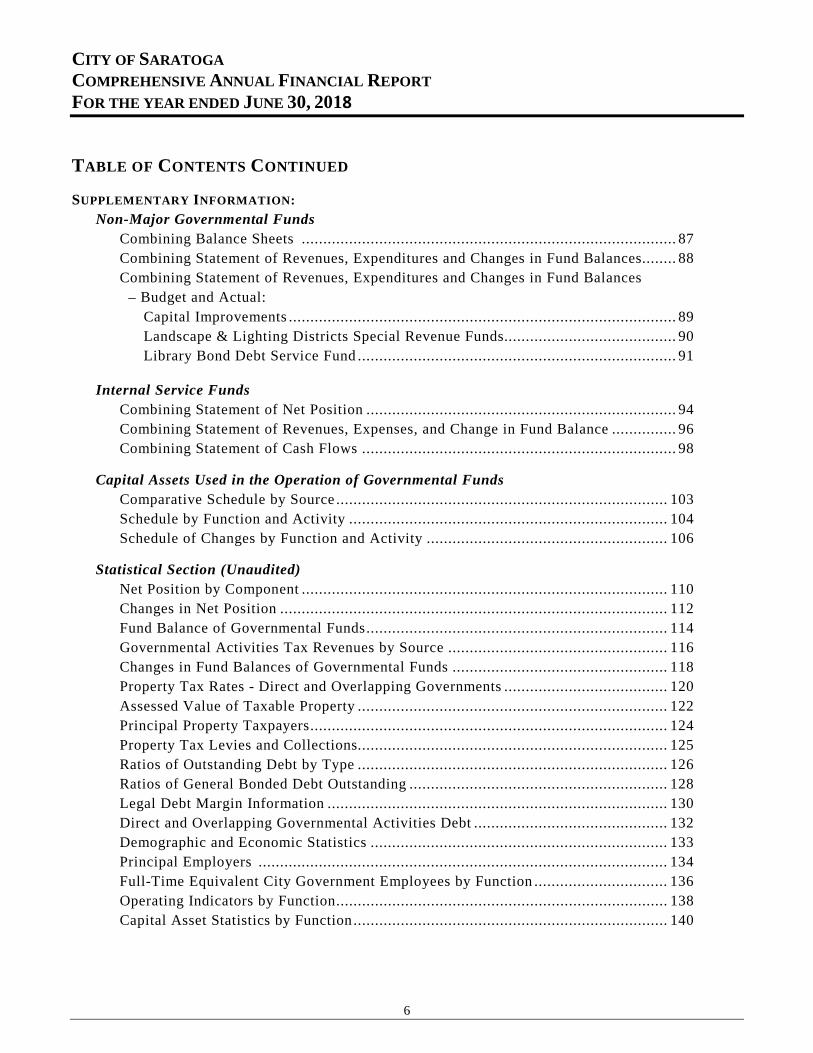
TABLE OF CONTENTS CONTINUED SUPPLEMENTARY INFORMATION: Non-Major Governmental Funds Combining Balance Sheets ....................................................................................... 87 Combining Statement of Revenues, Expenditures and Changes in Fund Balances ........ 88 Combining Statement of Revenues, Expenditures and Changes in Fund Balances – Budget and Actual: Capital Improvements .......................................................................................... 89 Landscape & Lighting Districts Special Revenue Funds........................................ 90 Library Bond Debt Service Fund .......................................................................... 91
Internal Service Funds Combining Statement of Net Position ........................................................................ 94 Combining Statement of Revenues, Expenses, and Change in Fund Balance ............... 96 Combining Statement of Cash Flows ......................................................................... 98
Capital Assets Used in the Operation of Governmental Funds Comparative Schedule by Source ............................................................................. 103 Schedule by Function and Activity .......................................................................... 104 Schedule of Changes by Function and Activity ........................................................ 106
Statistical Section (Unaudited) Net Position by Component ..................................................................................... 110 Changes in Net Position .......................................................................................... 112 Fund Balance of Governmental Funds ...................................................................... 114 Governmental Activities Tax Revenues by Source ................................................... 116 Changes in Fund Balances of Governmental Funds .................................................. 118 Property Tax Rates - Direct and Overlapping Governments ...................................... 120 Assessed Value of Taxable Property ........................................................................ 122 Principal Property Taxpayers ................................................................................... 124 Property Tax Levies and Collections........................................................................ 125 Ratios of Outstanding Debt by Type ........................................................................ 126 Ratios of General Bonded Debt Outstanding ............................................................ 128 Legal Debt Margin Information ............................................................................... 130 Direct and Overlapping Governmental Activities Debt ............................................. 132 Demographic and Economic Statistics ..................................................................... 133 Principal Employers ............................................................................................... 134 Full-Time Equivalent City Government Employees by Function ............................... 136 Operating Indicators by Function ............................................................................. 138 Capital Asset Statistics by Function ......................................................................... 140

7
INTRODUCTORY SECTION

8
This page is intentionally blank.

9
CITY OF SARATOGA
C I T Y H A L L 13 77 7 F R U I T V A L E A V E N U E
S A R A T O G A , C A L I F O R N I A 9 50 7 0 ( 40 8 ) 86 8- 12 00
December 5, 2018 Honorable Mayor, City Council, and Citizens of the City of Saratoga, California The Comprehensive Annual Financial Report (CAFR) of the City of Saratoga for the year ended June 30, 2018 is hereby submitted in accordance with mandated statutes. These statutes require that the City of Saratoga issue a report on its financial position and activity, and that an independent firm of certified public accountants audits the report. This annual report was prepared in accordance with accounting principles generally accepted in the United States of America. City Management is responsible for both the accuracy of the data and the completeness and fairness of the presentation, including all disclosures. To provide a reasonable basis for making these representations, the City has established internal controls to provide reasonable, rather than absolute, assurance that the financial statements will be free of material misstatement. To the best of our knowledge and belief, the enclosed data is accurate in all material respects and reported in a manner designed to present fairly the financial position and results of operations of the City’s various funds. This report intends to present the reader with a comprehensive view of the City’s financial position and the results of its operations for the fiscal year ending June 30, 2018, along with additional disclosures and financial information designed to enable the reader to gain an understanding of the City’s financial activities. The report was prepared as prescribed in Governmental Accounting Standards Board (GASB) Statement No. 34, Basic Financial Statements and Management’s Discussions and Analysis for State and Local Governments. To facilitate the public’s understanding and usefulness of the City of Saratoga’s financial statements, GASB Statement 34 requires that management provide a narrative introduction, overview, and analysis to accompany the basic financial statements in the form of Management’s Discussion and Analysis (MD&A). The design of this formal letter of transmittal is to complement the MD&A and should be read in conjunction with it. Unaudited sections of this document are presented to supplement the basic financial statements. While not audited, the supplemental information is required by the Governmental Accounting Standards Board, who considers it to be an essential part of financial reporting for operational, economic, and historical context.
THE REPORTING ENTITY AND ITS SERVICES The City of Saratoga (City), incorporated in 1956, is located 40 miles south of San Francisco in the Santa Clara Valley. The City currently covers a land area of approximately 12 square miles and contains a population of 31,435 as of January 1, 2018, as reported by the California Department of Finance. The City is a general law city of the State of California and operates under a council-manager form of government. Policymaking and legislative authority are vested in the City Council, which consists of a Mayor, Vice Mayor, and three additional Council members. City Council members are elected at-large for staggered four-

10
year terms. The Mayor is selected annually by the City Council. The City Council is responsible for, among other things, passing ordinances, adopting the budget, appointing members to the City’s six advisory commissions and hiring the City Manager and City Attorney. The City Manager is responsible for implementing the policies and ordinances of the City Council and overseeing the daily operations of the City. The City provides a range of services including public safety, development regulation, public works, community and recreation activities and events, and general administrative functions. As a minimal service city, operations are supplemented with service contracts. Contracted services include, but are not limited to: public safety; infrastructure maintenance; engineering services; legal services; and recreation activities. The City is also committed to citizen participation in the evaluation and enhancement of services. Saratoga residents who wish to assist the City Council in forming government policy may do so by serving on an advisory commission. The commissions act in an advisory capacity to the City Council, and are comprised of the Heritage Preservation Commission, Library Commission, Parks and Recreation Commission, Planning Commission, Traffic Safety Commission, and Youth Commission. The financial reporting entity (the City) includes all the fund activity of the primary government, as well as all of its component units. Component units are legally separated entities for which the City is fully accountable. The City does not currently report any Component Units. Blended component units, although legally separate entities, are in substance part of the City’s operations and data from these units are combined with data of the City. Accordingly, the operations of the Landscape and Lighting Districts are reported in the City’s financial statements.
ECONOMIC CONDITIONS AND OUTLOOK Saratoga is viewed as a desirable place to live in Silicon Valley due to its highly rated schools, beautiful neighborhoods nestled in the foothills at the western edge of the valley, and close proximity to many businesses associated with the high technology industry. Saratoga is predominantly a residential community with limited commercial or industrial activity within City boundaries. In general, the City is fiscally protected by the stability of its tax revenues. As is typical for California cities, the City of Saratoga’s largest funding sources are property tax, franchise fees, sales tax, and development fees and permits. It should be noted that while development fees are a significant funding source, expense related to the intake of this fee-based revenue more than offsets the revenue received. Property Tax Property tax assessments represent the largest source of revenue for the City. Historically, the City, along with the neighboring cities of Cupertino, Los Altos Hills, and Monte Sereno, received less than the minimum 7% allocation provided for under State law due to special legislation enacted 30 years ago. Throughout the years, the Cities have launched collaborative lobbying efforts to introduce and pass legislation that would treat the four Cities as equal to the other no/low tax Cities, and receive the minimum 7% of the property tax collected in the respective Cities. SB 107, enacted in September 2015, restored the final portion of the 7% minimum property tax allocation under a five-year phase-in plan; meaning the City will finally be fully funded in Fiscal Year 2019/20.
Franchise Fees Franchise Fees are assessments on a number of utility services including gas, electricity, water, cable, and solid waste. The assessments are determined by easement formulas or a percentage of service costs, and are a pass-through fee collected by the service companies and subsequently remitted to the City. With most of
11
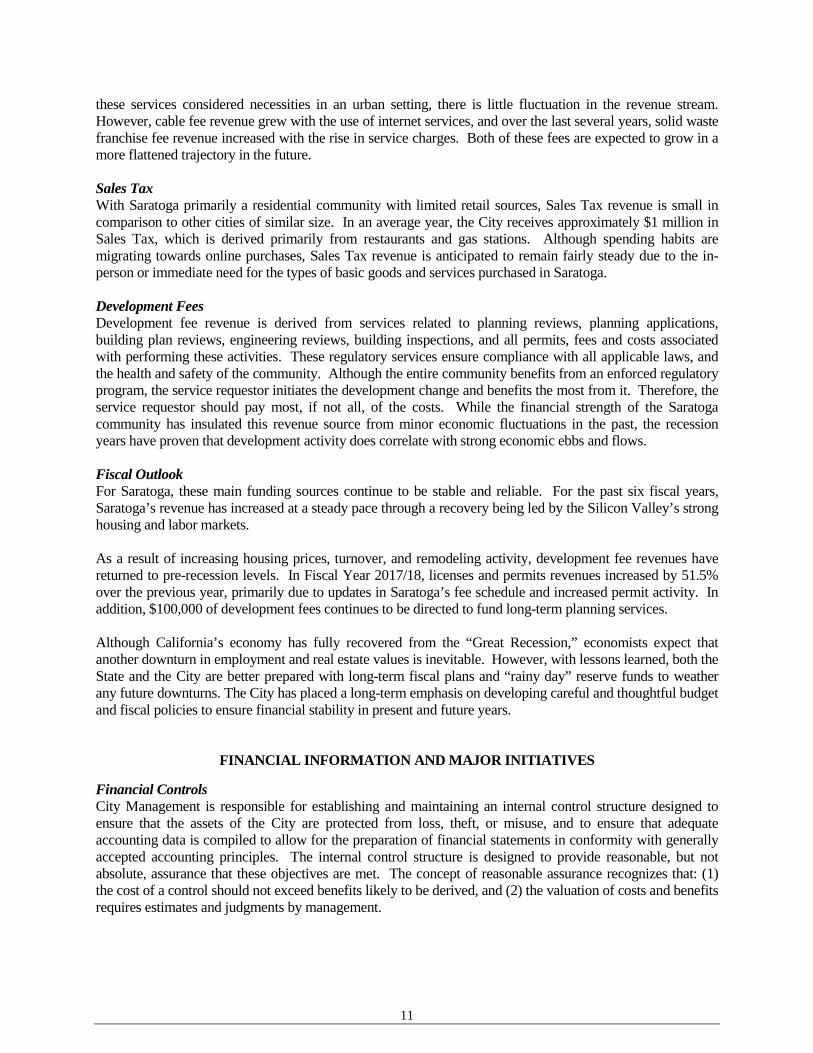
these services considered necessities in an urban setting, there is little fluctuation in the revenue stream. However, cable fee revenue grew with the use of internet services, and over the last several years, solid waste franchise fee revenue increased with the rise in service charges. Both of these fees are expected to grow in a more flattened trajectory in the future. Sales Tax With Saratoga primarily a residential community with limited retail sources, Sales Tax revenue is small in comparison to other cities of similar size. In an average year, the City receives approximately $1 million in Sales Tax, which is derived primarily from restaurants and gas stations. Although spending habits are migrating towards online purchases, Sales Tax revenue is anticipated to remain fairly steady due to the in-person or immediate need for the types of basic goods and services purchased in Saratoga. Development Fees Development fee revenue is derived from services related to planning reviews, planning applications, building plan reviews, engineering reviews, building inspections, and all permits, fees and costs associated with performing these activities. These regulatory services ensure compliance with all applicable laws, and the health and safety of the community. Although the entire community benefits from an enforced regulatory program, the service requestor initiates the development change and benefits the most from it. Therefore, the service requestor should pay most, if not all, of the costs. While the financial strength of the Saratoga community has insulated this revenue source from minor economic fluctuations in the past, the recession years have proven that development activity does correlate with strong economic ebbs and flows. Fiscal Outlook For Saratoga, these main funding sources continue to be stable and reliable. For the past six fiscal years, Saratoga’s revenue has increased at a steady pace through a recovery being led by the Silicon Valley’s strong housing and labor markets. As a result of increasing housing prices, turnover, and remodeling activity, development fee revenues have returned to pre-recession levels. In Fiscal Year 2017/18, licenses and permits revenues increased by 51.5% over the previous year, primarily due to updates in Saratoga’s fee schedule and increased permit activity. In addition, $100,000 of development fees continues to be directed to fund long-term planning services. Although California’s economy has fully recovered from the “Great Recession,” economists expect that another downturn in employment and real estate values is inevitable. However, with lessons learned, both the State and the City are better prepared with long-term fiscal plans and “rainy day” reserve funds to weather any future downturns. The City has placed a long-term emphasis on developing careful and thoughtful budget and fiscal policies to ensure financial stability in present and future years.
FINANCIAL INFORMATION AND MAJOR INITIATIVES
Financial Controls City Management is responsible for establishing and maintaining an internal control structure designed to ensure that the assets of the City are protected from loss, theft, or misuse, and to ensure that adequate accounting data is compiled to allow for the preparation of financial statements in conformity with generally accepted accounting principles. The internal control structure is designed to provide reasonable, but not absolute, assurance that these objectives are met. The concept of reasonable assurance recognizes that: (1) the cost of a control should not exceed benefits likely to be derived, and (2) the valuation of costs and benefits requires estimates and judgments by management.

12
As a recipient of federal, state and local financial assistance, the City is also responsible for guaranteeing that an adequate internal control structure is in place to ensure and document compliance with applicable laws and regulations related to these programs. This internal control structure is subject to periodic evaluation by City Management. For cash management, the City practices a passive approach to investments and maintains flexibility by managing a pooled cash system. Under the pooled cash concept, the City invests the cash of all funds with maturities planned to coincide with cash needs. Idle cash is invested in certain eligible securities as constrained by law and further limited by the City’s investment policy. The goals of the City’s investment policy are safety, liquidity, and yield. Cash management is tracked by fund and reconciled monthly. In addition, the City maintains extensive budgetary controls. The objective of these controls is to ensure compliance with legal provisions embodied in the annual appropriated budget approved by the City Council. Activities of the General Fund, Special Revenue Funds, Capital Projects Funds and Debt Service Funds are included in the annual appropriation. The level of budgetary control (i.e., the level at which expenditures cannot exceed the appropriated amount) is at the fund level. The City also maintains an encumbrance accounting system as complementary method of maintaining budgetary control. Encumbrances lapse at year-end with the exception of amounts reserved for multiple-year Capital Improvement Projects. At the end of each fiscal year, the departments review outstanding encumbrances of a material nature, and if deemed critical, make recommendations to the City Council to take action by Resolution to re-appropriate these funds into the following year’s budget. Major Initiatives The Fiscal Year 2017/18 budget was designed to enhance the quality of life for all Saratoga residents by focusing on the City Council’s priorities and enhancing community enrichment. The Budget continued to address the City’s Unfunded Accrued Liability (UAL) by making an additional $581,559 payment over the minimum required by CalPERS to reduce the outstanding liability even further. Streets are one of the most visible and fundamental services provided by the City as they are used daily by residents going to work, school, or completing everyday errands. Consequently, improving the conditions of our local roads has been a top budget priority with the City Council supporting $2 million for roadway resurfacing and restoration in Fiscal Year 2017/18. This is consistent with the Council’s strategic goal of maintaining the City’s infrastructure in a safe, sustainable, and cost-effective manner. Senior mobility is a growing challenge in Saratoga and throughout the County. A number of specific needs for seniors were identified through the Saratoga Senior Taxi Pilot Program that was funded and completed in Fiscal Year 2016/17. Two of the biggest needs identified were (1) a common information source or concierge service to assist seniors with existing transportation options and services, and (2) a reliable door-to-door transportation service that can accommodate the unique needs of seniors. The Council committed to a second pilot program for Fiscal Year 2017/18 to address these specific needs and is in discussion with Santa Clara County, the Valley Transportation Authority, neighboring West Valley cities, the Saratoga Area Senior Coordinating Council, and West Valley Community Services to identify collaborative solutions. The City Council has also emphasized continued priorities in public safety and communications, combined with additional priorities in public art and building strong neighborhood connections, which all are significant community enhancements. With an increasing number of initiatives and growing communication demands, staff levels in the City Manager’s Office was adjusted in Fiscal Year 2017/18 to include a new Deputy City Manager position. This administrative support is critical to the success of these initiatives.
13
INDEPENDENT AUDIT
The City engaged Chavan & Associates, LLP to express an opinion on the financial statements based on their audit. The audit includes examining, on a test basis, evidence supporting the amounts and disclosures in the financial statements, assessing the accounting principles used and significant estimates made by management, and evaluating the overall financial statement presentation. Generally accepted auditing standards set forth in the General Accounting Office’s Government Auditing Standards were used by the auditors in conducting the engagement. The City’s Annual Financial Report received an unmodified (clean) opinion from the auditors. The Independent Auditors’ Report is presented as the first component of the financial section of this report. In addition to meeting the requirements set forth in statutes, the audit was also designed to meet the requirements of the federal Single Audit Act of 1984, as amended, and the related U.S. Office of Management and Budget’s Circular A-133, Audits of States, Local Governments, and Non-Profit Organizations. The City’s federal financial assistance program also received an unqualified (clean) opinion from the auditors. Awards The Government Finance Officers Association (GFOA) of the United States and Canada awarded a Certificate of Achievement to the City for its Excellence in Financial Reporting on the CAFR for the fiscal year ended June 30, 2017. In order to be awarded a Certificate of Achievement, the City published an easily readable and efficiently organized financial report. This report satisfied both generally accepted accounting principles and applicable legal requirements. The Certificate of Achievement is valid for a period of one year. We believe our current CAFR continues to meet the Certificate of Achievement program’s requirements, and plan on submitting it to the GFOA to determine its eligibility for another certificate.
ACKNOWLEDGEMENTS This CAFR represents the culmination of numerous hours of hard work expended by many individuals in the Finance & Administrative Services Department. In particular, we would like to express our appreciation to Dennis Jaw, Finance Manager for his preparation of this annual financial report, and to our supporting staff members: Ann Xu, Accountant; Karen Caselli, Lead Accounting Technician; Julie Ingraham and Gina Scott, Accounting Technicians for their assistance with the audit and exemplary services throughout the year. Furthermore, we would like to thank Chavan & Associates, LLP Certified Public Accountants for their helpful assistance in the preparation of this report. Finally, we would like to give credit to the City Council for their ongoing interest and support in planning, conducting and advising on the operations of the City in a responsible and representative manner. Respectfully submitted, James Lindsay Mary Furey City Manager Finance and Administrative Services Director

14
This page is intentionally blank.

15
Government Finance Officers Association
Certificate of Achievement for
Excellence in Financial Reporting Presented to
City of Saratoga California
For its Comprehensive Annual Financial Report
For the Fiscal Year Ended
June 30, 2017
Executive Director/CEO
16
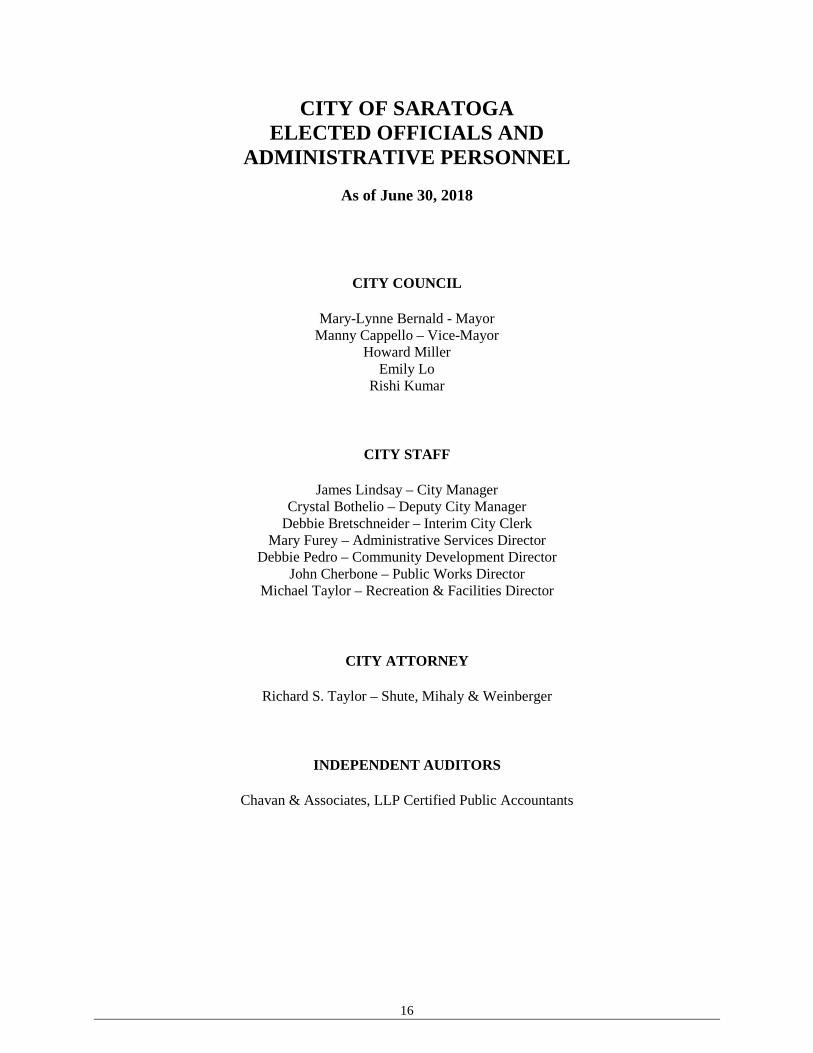
CITY OF SARATOGA ELECTED OFFICIALS AND
ADMINISTRATIVE PERSONNEL
As of June 30, 2018
CITY COUNCIL
Mary-Lynne Bernald - Mayor
Manny Cappello – Vice-Mayor Howard Miller
Emily Lo Rishi Kumar
CITY STAFF
James Lindsay – City Manager Crystal Bothelio – Deputy City Manager
Debbie Bretschneider – Interim City Clerk Mary Furey – Administrative Services Director
Debbie Pedro – Community Development Director John Cherbone – Public Works Director
Michael Taylor – Recreation & Facilities Director
CITY ATTORNEY
Richard S. Taylor – Shute, Mihaly & Weinberger
INDEPENDENT AUDITORS
Chavan & Associates, LLP Certified Public Accountants

17
City of Saratoga - Organization ChartFY 2017/18
City AttorneyCity Manager
Community Development Department
Community Development Director
Parks Division1 Manager - Parks2 Park Maint. Leadworker5 Park Maint. Workers .50 Office Specialist
Information Technology Division
1 IT Administrator1 IT Technician
Finance & Administrative Services Department
Finance & Administrative Services Director
Recreation & Facilities Department
Recreation & Facilities Director
Public Works Department
Public Works Director
Streets and Fleet Division1 Manager - Streets and Fleet2 Street Maint. Leadworker4 Street Maint. Workers.50 Office Specialist
Facilities Division 1 Facility Maint. Manager1 Facility Maint. Leadworker1 Facility Maint. Workers.60 Facility Coordinator
Building Division1 Sr. Building Inspector2 Building Inspectors1 Plan Check Engineer1 Permit Technician1 Office Specialist
Citizen Advisory Commissions & Committees
Citizens of Saratoga
Elected City Council
Human Resources Division1 HR Manager.75 HR Technician
City Manager's Department
City Manager
Planning Division2 Senior Planner1 Planners1 Arborist1 Office Specialist1 Code Complaince Officer
Engineering Division1 Sr. Civil Engineer1 Engineer.90 Administrative Analyst .75 Office Specialist
Finance Services Division1 Finance Manager.90 Accountant 3 Accounting Technicians
Recreation Services Division1.90 Recreation Supervisor
.85 Recreation Coordinators1 Office Specialist
City Manager's Office1 Deputy City Manager1 City Clerk1 Admin Anal;yst.90 Executive Assistanr

18
This page is intentionally blank.

19
FINANCIAL SECTION

20
INDEPENDENT AUDITORS’ REPORT
To the Honorable Mayor and Members of the City Council of the City of Saratoga Saratoga, California Report on the Financial Statements We have audited the accompanying financial statements of the governmental activities, each major fund, and the aggregate remaining fund information of the City of Saratoga (the “City"), as of and for the year ended June 30, 2018, and the related notes to the financial statements, which collectively comprise City’s basic financial statements as listed in the table of contents. Management’s Responsibility for the Financial Statements The City’s management is responsible for the preparation and fair presentation of these financial statements in accordance with accounting principles generally accepted in the United States of America; this includes the design, implementation, and maintenance of internal control relevant to the preparation and fair presentation of financial statements that are free from material misstatement, whether due to fraud or error. Auditor’s Responsibility Our responsibility is to express opinions on these financial statements based on our audit. We conducted our audit in accordance with auditing standards generally accepted in the United States of America, the standards applicable to financial audits contained in Government Auditing Standards, issued by the Comptroller General of the United States. Those standards require that we plan and perform the audit to obtain reasonable assurance about whether the financial statements are free from material misstatement. An audit involves performing procedures to obtain audit evidence about the amounts and disclosures in the financial statements. The procedures selected depend on the auditor’s judgment, including the assessment of the risks of material misstatement of the financial statements, whether due to fraud or error. In making those risk assessments, the auditor considers internal control relevant to the City’s preparation and fair presentation of the financial statements in order to design audit procedures that are appropriate in the circumstances, but not for the purpose of expressing an opinion on the effectiveness of the City’s internal control. Accordingly, we express no such opinion. An audit also includes evaluating the appropriateness of accounting policies used and the reasonableness of significant accounting estimates made by management, as well as evaluating the overall presentation of the financial statements. We believe that the audit evidence we have obtained is sufficient and appropriate to provide a basis for our audit opinions. Opinions In our opinion, the financial statements referred to above present fairly, in all material respects, the respective financial position of the governmental activities, each major fund, and the aggregate remaining fund information of the City of Saratoga, as of June 30, 2018, and the respective changes in financial position and, where applicable, cash flows thereof for the year then ended in accordance with accounting principles generally accepted in the United States of America.

21
Other Matters Required Supplementary Information Accounting principles generally accepted in the United States of America require that the management’s discussion and other required supplementary information, as listed in the table of contents, be presented to supplement the basic financial statements. Such information, although not a part of the basic financial statements, is required by the Governmental Accounting Standards Board who considers it to be an essential part of financial reporting for placing the basic financial statements in an appropriate operational, economic, or historical context. We have applied certain limited procedures to the required supplementary information in accordance with auditing standards generally accepted in the United States of America, which consisted of inquiries of management about the methods of preparing the information and comparing the information for consistency with management’s responses to our inquiries, the basic financial statements, and other knowledge we obtained during our audit of the basic financial statements. We do not express an opinion or provide any assurance on the information because the limited procedures do not provide us with sufficient evidence to express an opinion or provide any assurance. Supplementary Information Our audit was conducted for the purpose of forming opinions on the financial statements that collectively comprise the City’s financial statements as a whole. The introductory section, combining individual non-major fund statements and schedules, and statistical section, as listed in the table of contents, are presented for purposes of additional analysis and are not a required part of the financial statements. The combining individual non-major fund statements and schedules have been subjected to the auditing procedures applied in the audit of the basic financial statements and, in our opinion, are fairly stated in all material respects in relation to the basic financial statements taken as a whole. The introductory and statistical sections have not been subjected to the auditing procedures applied in the audit of the basic financial statements and, accordingly, we do not express an opinion or provide any assurance on them. Other Reporting Required by Government Auditing Standards In accordance with Government Auditing Standards, we have also issued our report dated November 18, 2018 on our consideration of the City’s internal control over financial reporting and on our tests of its compliance with certain provisions of laws, regulations, contracts, and grant agreements and other matters. The purpose of that report is to describe the scope of our testing of internal control over financial reporting and compliance and the results of that testing, and not to provide an opinion on internal control over financial reporting or on compliance. That report is an integral part of an audit performed in accordance with Government Auditing Standards in considering the City’s internal control over financial reporting and compliance.
November 12, 2018 San Jose, California

CITY OF SARATOGA MANAGEMENT’S DISCUSSION AND ANALYSIS FOR THE YEAR ENDED JUNE 30, 2018
22
INTRODUCTION The Management’s Discussion and Analysis (MD&A) is a required section of the City’s Comprehensive Annual Financial Report (CAFR), as shown in the overview below. The purpose of the MD&A is to present discussion and analysis of the City’s financial performance during the fiscal year that ended on June 30, 2018. This report will (1) focus on significant financial issues, (2) provide an overview of the City’s financial activity, (3) identify changes in the City’s financial position, (4) identify any individual fund issues or concerns, and (5) provide descriptions of significant asset and debt activity. This information, presented in conjunction with the annual Transmittal Letter and Basic Financial Statements is intended to provide a comprehensive understanding of the City’s operations and financial standing.
Required Components of the Annual Financial Report
FISCAL YEAR 2017/18 FINANCIAL HIGHLIGHTS
• Total net position, or the City's assets plus deferred outflow of resources ($153.1 million) less its liabilities plus deferred inflow of resources ($23.8 million), was $129.3 million as of June 30, 2018. This is an increase of $2.3 million over the prior fiscal year, which is primarily due to an increase in key revenues combined with a decrease in expenses.
• The City’s Net Pension Liability is $7.6 million. This is an increase of $1.2 million over the prior fiscal year, primarily due to a decrease in the assumed discount rate used to calculate pension assets.
• Net Position is comprised of $113.1 million for investment in capital assets, net of depreciation and related debt, $2.6 million restricted for specific purposes, and $13.7 million in Unrestricted Net Position (page 38).
• Total City-wide revenues of $26.2 million consists of $19.7 million in general revenue and $6.5 million in program revenue (page 39).
• City expenses total $23.9 million (page 39).
Management’s Discussion & Analysis
Government-Wide
Financial Statements
Fund
Financial Statements
Notes to the
Financial Statements
Basic Financial Statements

CITY OF SARATOGA MANAGEMENT’S DISCUSSION AND ANALYSIS FOR THE YEAR ENDED JUNE 30, 2018
23
• The Governmental Funds fund balances total $19.0 million, with $13.1 million in the General Fund, $3.5 million in the Capital Improvement Funds, and $2.4 million in the Other Governmental Funds. This represents an increase of $0.9 million from the prior year (page 40).
• General Fund revenues total $23.0 million, while General Fund expenditures total $19.4 million (page 42).
THE BASIC FINANCIAL STATEMENTS The Basic Financial Statements are comprised of 1) Government-Wide (City-wide) Financial Statements, and; 2) Fund Financial Statements. These two sets of financial statements provide the reader two different perspectives of the City's financial activities and financial position. Government-Wide Financial Statements provide a longer-term view of the City's activities as a whole and are comprised of the Statement of Net Position and the Statement of Activities. The Statement of Net Position provides summary level information about the financial position of the City, including all its capital assets and long-term liabilities on a full accrual basis, similar to that used by corporations. The Statement of Activities provides summary level information about the City's revenues and expenses, also on a full accrual basis, with the emphasis on measuring net revenues and/or expenses for each of the City's programs. The Statement of Activities illustrates the change in Net Position for the fiscal year. City financial activities are required to be grouped as either government activities or business-type activities. The amounts in the Statement of Net Position and the Statement of Activities are required to be separated into governmental activities or business-type activities in order to distinguish between the two types of activities. In the case of the City of Saratoga, there are no business-type activities as of June 30, 2018. Fund Financial Statements report the City's operations in more detail than Government-Wide statements and focus primarily on the short-term activities of the City's General Fund and other major funds. The Fund Financial Statements measure current revenues and expenditures and fund balances; they exclude capital assets, long-term debt, and other long-term amounts. Major funds account for the major financial activities of the City and are presented individually, while the activities of non-major funds are presented in summary with subordinate schedules presenting the detail for each of these other funds in the Supplementary Information section. Major funds are explained below. The Government-Wide Financial Statements Government-Wide financial statements are prepared on the accrual basis, which means they measure the flow of all economic resources of the City as a whole. The Statement of Net Position and the Statement of Activities present information about the following: Governmental Activities - All of the City's basic services are considered to be governmental activities, including general government, community development, public safety, transportation, and, culture and leisure. These services are supported by general City revenues such as taxes, and by specific program revenues such as development and recreation program fees. Business-Type Activities - This category includes enterprise activities such as water, sewer, and utilities. Unlike governmental services, these activities are meant to be fully supported by charges paid by users, based on the services used. The City of Saratoga currently does not have any business-type activities.

CITY OF SARATOGA MANAGEMENT’S DISCUSSION AND ANALYSIS FOR THE YEAR ENDED JUNE 30, 2018
24
Fund Financial Statements A fund represents a grouping of related accounts and is used to maintain control over resources that are segregated for specific activities or objectives. The City, like other local governments, uses fund accounting to ensure and demonstrate compliance with finance-related legal requirements. Fund financial statements provide detailed information about each of the City's most significant funds, called major funds. The concept of major funds, and the determination of which funds are classified as major funds, was established by GASB Statement 34 and replaces the concept of combining like funds and presenting them in total. Instead, each major fund is presented individually, with all non-major funds summarized and presented in a single column. Subordinate schedules present the detail of these non-major funds. Major funds present the major activities of the City for the fiscal year, and may change from year to year as a result of changes in the pattern of the City's activities. The City's funds are segregated into three types: governmental funds, proprietary funds, and fiduciary funds. Governmental Funds - The City's basic services are reported in governmental funds, which focus on how money flows into and out of those funds and the balances available at year-end. Financial statements are prepared on the modified accrual basis, which means they measure only current financial resources and uses. Carrying amounts for capital assets and other long-lived assets, along with long-term liabilities are not presented on the balance sheet in the governmental fund financial statements. Unlike the Government-Wide financial statements, Governmental Fund financial statements focus on near-term inflows and outflows of spendable resources, as well as on balances of spendable resources available at the end of the fiscal year. Such information may be useful in evaluating the City's near-term financing requirements. Proprietary Funds – Internal service funds are an accounting device used to accumulate and allocate costs internally among the City’s various functions. The City uses internal service funds to account for liability/risk management, worker’s compensation, office equipment support services, information technology services, vehicle and building maintenance, and vehicle and information technology equipment replacement. Because internal service funds primarily benefit governmental functions, they have been included with the governmental activities in the Government-Wide financial statements. Fiduciary Funds – These funds account for assets held by the City in a trustee capacity or as an agent for individuals, private organizations, other governmental units, and/or other funds. Fiduciary funds are not reflected in the government-wide financial statements because these resources are not available to support the City's programs. The City does not have any fiduciary funds as of June 30, 2018. NOTES TO THE FINANCIAL STATEMENTS Notes to the Financial Statements provide additional information that is essential to a full understanding of the data provided in the government-wide and fund financial statements. The notes can be found immediately following the fund financial statements.

CITY OF SARATOGA MANAGEMENT’S DISCUSSION AND ANALYSIS FOR THE YEAR ENDED JUNE 30, 2018
25
REQUIRED SUPPLEMENTARY INFORMATION Required supplementary information, other than presented in this MD&A, follows the Notes Section and includes a budgetary comparison for the General Fund as presented in the Governmental Fund Financial Statements, and information on the modified approach for city streets and infrastructure. SUPPLEMENTARY INFORMATION Combining and individual fund statements and schedules are included to provide additional information on non-major governmental funds including special revenue, debt service, and capital project funds, as well as proprietary internal service fund information and uses of capital assets. An un-audited statistical section provides historical and current data on financial trends, revenue and debt capacity, demographic and economic information, and operating information. GOVERNMENT-WIDE FINANCIAL ANALYSIS Net Position serves over time as an indicator of the City's financial position. The City's Total Net Position increased $2,287,798 from $127,054,194 in Fiscal Year 2016/17 to $129,341,992 in Fiscal Year 2017/18. The primary reason for the increase in net position is an increase in key revenues combined with an overall decrease in expenses. The net pension liability increased $1,221,142 as a result of CalPERS’ lowering of the assumed discount rate in determining plan assets. The most significant portion of the City's Net Position ($113,052,916 or 87.4%) accounts for its investment in capital assets, (e.g., land, buildings, general government infrastructure, equipment, etc.) less any related debt used to acquire those assets that are still outstanding. These capital assets represent infrastructure which provides services to the citizens, consequently, these assets are not available for future spending. Of the City’s Net position, $2,596,277 or 2.0% is subject to external restrictions on how the funding may be used. Within the restricted Net Position total, $1,385,339 is for Landscape & Lighting districts, $997,756 is for repayment of long-term debt, and $213,182 is for environmental services. The remaining balance of $13,692,799, or 10.6% of the City's Net Position, is unrestricted and may be used to meet the City's ongoing obligations to citizens and creditors.

CITY OF SARATOGA MANAGEMENT’S DISCUSSION AND ANALYSIS FOR THE YEAR ENDED JUNE 30, 2018
26
Governmental Activities2018 2017
AssetsCurrent assets 26,959,576$ 25,253,696$ Capital assets 122,459,410 121,154,015
Total Assets 149,418,986 146,407,711
Deferred Outflow of ResourcesDeferred Outflow 3,711,379 2,931,316
Total Deferred Outflow of Resources 3,711,379 2,931,316
LiabilitiesCurrent liabilities 5,608,315 4,977,344 Long-term liabilities 16,635,186 15,921,773
Total Liabilities 22,243,501 20,899,117
Deferred Inflow of ResourcesDeferred Inflow 1,544,871 1,385,717
Total Deferred Inflow of Resources 1,544,871 1,385,717
Net PositionNet investment in capital assets 113,052,916 111,240,629 Restricted for environmental services 213,182 263,182 Restricted for special assessment funds 1,385,339 1,152,869 Restricted for debt service 997,756 959,322 Unrestricted 13,692,799 13,438,191
Total Net Position 129,341,992$ 127,054,194$
Net Position

CITY OF SARATOGA MANAGEMENT’S DISCUSSION AND ANALYSIS FOR THE YEAR ENDED JUNE 30, 2018
27
Governmental Activities IncreaseFunctions/Programs 2018 2017 (Decrease)
Program RevenuesCharges for services 6,174,109$ 6,143,525$ 30,584$ Operating grants and contributions 90,257 223,319 (133,062) Capital grants and contributions 218,756 1,062,479 (843,723)
Total Program Revenues 6,483,122 7,429,323 (946,201)
General RevenuesProperty taxes 14,123,801 12,263,575 1,860,226 Sales taxes 1,124,647 1,185,035 (60,389) Local taxes 960,363 857,050 103,313 Franchise taxes 2,166,165 2,170,870 (4,705) Motor vehicle in-lieu 16,091 13,538 2,553 Intergovernmental revenues 801,748 588,719 213,029 Investment earnings 318,699 124,679 194,020 Other revenues 212,543 200,597 11,946
Total General Revenues 19,724,056 17,404,063 2,319,993
ExpensesGeneral and intergovernmental services 6,009,582 6,449,934 (440,352) Public safety 5,728,276 5,443,759 284,517 Public works 7,942,898 9,164,282 (1,221,384) Community services 1,594,469 1,557,673 36,796 Community development services 2,285,452 2,905,718 (620,266) Interest on long-term debt (unallocated) 358,703 366,948 (8,245)
Total Expenses 23,919,380 25,888,313 (1,968,933)$
Increase / (Decrease) in Net Position 2,287,798 (1,054,924) 3,342,722 Net Position, Beginning of Year 127,054,194 128,109,118 (1,054,924)
Net Position, End of Year 129,341,992$ 127,054,194$ 2,287,798$
Statement of Changes in Net Position
As shown in the above Statement of Changes in Net Position schedule, program revenues decreased by $946,201 from the prior fiscal year for governmental activities. General revenues increased by $2,319,993 from the prior year. This resulted in a total increase in revenues of $1,373,792. Expenses decreased by $1,968,933 from the prior year due to capital outlay activity along with an increase in capitalized infrastructure. With total program and general revenues for Fiscal Year 2017/18 at $26,207,178 and total expenses at $23,919,380, the net activity resulted in an increase in Net Position of $2,287,798. An analysis and graphical representation of the changes in revenues and expenditures by type of significant events follows:

CITY OF SARATOGA MANAGEMENT’S DISCUSSION AND ANALYSIS FOR THE YEAR ENDED JUNE 30, 2018
28
Revenues For Fiscal Year 2017/18, the growth in property tax revenues reflect the ongoing strength of the San Francisco Bay Area economy. The increase in Capital Grants revenue offset the decrease in Charges for Services revenue, as there was a significant increase in activity for grant-funded Public Works and Community Services capital projects.
Increase in Revenues
General Revenues increased by $2,319,853 from the prior year. The most significant changes include: • Property Tax revenue increased $1,860,226 over the prior year. Of this amount, $876,771 is due to a
correction in the categorization of bond assessments for the 2011 Library Bond, which was previously included as a Charge for Service. The remainder of the increase is due to the continuing demand for housing in the region, which has resulted in higher assessed valuations of property within the City upon turnover, plus the incremental TEA increase in the property tax allocation percentage.
• Intergovernmental revenue increased $213,029 primarily due to increased Gas Tax and Road Repair and Accountability Act of 2017 revenues.
Program Revenues decreased by $946,201 from the prior year. The most significant changes include: • Capital Grants & Contributions decreased $843,723 from the prior year due to a significant reduction
in grant reimbursed capital project activity. • Charges for Services increased by $30,584 from the prior year. However, the actual increase in this
category is $907,355, primarily due to fee adjustments related to Public Works and Community Development activities. This was mostly offset by the recategorization of bond assessments referenced above.

CITY OF SARATOGA MANAGEMENT’S DISCUSSION AND ANALYSIS FOR THE YEAR ENDED JUNE 30, 2018
29
Expenses Fiscal Year 2017/18 expenses decreased by $1,968,933. The balance of the decrease is primarily due to capital outlay activity along with an increase in capitalized infrastructure. Compared to the prior year, the GASB 68 pension expense adjustment decreased expenses by $848,196. This adjustment is broken down as follows:
Increase2018 2017 (Decrease)
General and intergovernmental services 394,051 633,993 (239,942) Public works 522,948 870,234 (347,286) Community services 111,074 228,113 (117,039) Community development services 193,068 336,999 (143,931)
Total Adjustment 1,221,141$ 2,069,339$ (848,198)$
Share of Net Pension Liability Adjustment
The following analysis includes the Net Pension Liability (NPL) adjustment decreases listed above: • Public Works decreased by $1,221,384 ($874,098 net of NPL adjustment, listed in above table)
primarily due to capital outlay activity along with an increase in capitalized infrastructure
• Public Safety increased by $284,517 due to increases in sheriff contract costs.
• General Services decreased by $440,352 ($200,410 net of NPL adjustment) primarily due to the absence of election costs, as well as a reduction of legal expenses and spending from the discretionary fund, which will be carried over to Fiscal Year 2018/19.

CITY OF SARATOGA MANAGEMENT’S DISCUSSION AND ANALYSIS FOR THE YEAR ENDED JUNE 30, 2018
30
• Community Services increased by $36,796 ($153,835 net of NPL adjustment) primarily due to cost of living adjustments in salaries and benefits and building maintenance costs.
• Community Development decreased by $620,266 ($476,335 net of NPL adjustment) primarily due to position vacancies and capital outlay activity.
MAJOR AND OTHER GOVERNMENTAL FUNDS: CHANGE IN FUND BALANCE A summary of the changes in fund balance of the Major Funds and Other Governmental Funds is presented below:
OtherCapital Governmental
General Improvement FundsTotal Revenues 22,970,108$ 1,768,383$ 1,642,114$ Total Expenditures 19,389,791 4,747,375 1,371,210 Revenues Over
(Under) Expenditures 3,580,317 (2,978,992) 270,904 Transfers in 442,198 2,954,909 - Transfers out (1,872,909) (1,524,198) -
Net change in fund balances 2,149,606 (1,548,281) 270,904 Beginning of year 10,984,311 5,085,307 2,112,191 End of year 13,133,917$ 3,537,026$ 2,383,095$
Major Funds
The General Fund and the Capital Improvement Funds are listed as Major Funds in Fiscal Year 2017/18. The Other Governmental Funds include thirty Landscape and Lighting Districts and Storm Drain funds (presented as one combined fund in the financials) and the Library Bond Debt Service Fund. The total net change from fiscal year transactions, including Major Funds and Other Governmental Funds, was an increase of $872,230. General Fund As shown in the Major Funds table above, the net change in the General Fund's ending fund balance is an increase of $2,149,606. This is a result of the net operating revenues exceeding net operating expenditures. General Fund revenue increased from the prior year for a net revenue gain of $1,857,696. This is primarily due to significant increases in property tax ($959,589) as a result of the strength of the housing market, and Licenses and Permits ($749,172), which was the effect of increases in certain Public Works and Community Development fees. General Fund revenue budgets are conservatively based upon prior year experience and revenue specific information. Expenses are budgeted at anticipated program needs at not-to-exceed projected funding levels. However, the City has opted to commit additional funding towards the Unfunded Accrued Liability, or UAL, related to pensions. In Fiscal Year 2017/18, the City Council directed staff to make a $750,000 payment towards the UAL. This payment is in excess of the required minimum contribution amount required, thereby reducing the actual liability. As of June 30, 2018, the Net Pension Liability, or NPL, is approximately

CITY OF SARATOGA MANAGEMENT’S DISCUSSION AND ANALYSIS FOR THE YEAR ENDED JUNE 30, 2018
31
$7.6 million. This is an increase of $1.2 million over the prior fiscal year, primarily due to a decrease in the assumed discount rate used to calculate pension assets. Capital Improvement Project Fund As shown in the table on the previous page, the net decrease of $1,548,281 in the Capital Improvement Funds occurred as additional progress was made on various capital projects, particularly for Annual Roadway Improvements and Prospect Road Improvements. Other Governmental Funds Of the net $270,904 increase in Other Governmental Funds, the collective 30 Landscaping & Lighting District and Storm Drain funds comprise $232,470 of the total. The Library Bond debt service fund accounts for the remaining $38,434 of the increase. Both net gains represent a small excess of revenue over operating expenditures in the normal course of operations. GENERAL FUND – BUDGETARY HIGHLIGHTS Changes from the City's General Fund original budget to the final budget are detailed in the Required Supplementary Information Section along with a comparison to actual activity for the fiscal year. Changes to the City's budget that increase or decrease appropriations in a fund must be approved by a resolution of the City Council. Modifications to the budget that are a realignment of fiscal activities with no impact to the fund's bottom line may be approved by the City Manager. Significant changes from the City’s original budget to the final budget are summarized as follows: Revenues and Transfers In The General Fund adopted and final revenue budget was $20,777,773 as shown in the schedule below:
Adopted to Final Budget Fiscal Year Ended June 30, 2018
+ =
Adopted Budget FinalBudget Adjustments Budget
Revenues 20,777,773$ - 20,777,773$ Transfers in -$ 32,000 32,000$
The Transfers in budget adjustment in the amount of $32,000 was due to the return of funds from the capital projects fund which was no longer required for the Magical Bridge Playground project. Actual transfers into the General Fund in Fiscal Year 2017/18 was $442,198. The excess is due to the City’s policy to return unused capital project funds to the General Fund when a project is deemed completed or cancelled.
CITY OF SARATOGA MANAGEMENT’S DISCUSSION AND ANALYSIS FOR THE YEAR ENDED JUNE 30, 2018
32
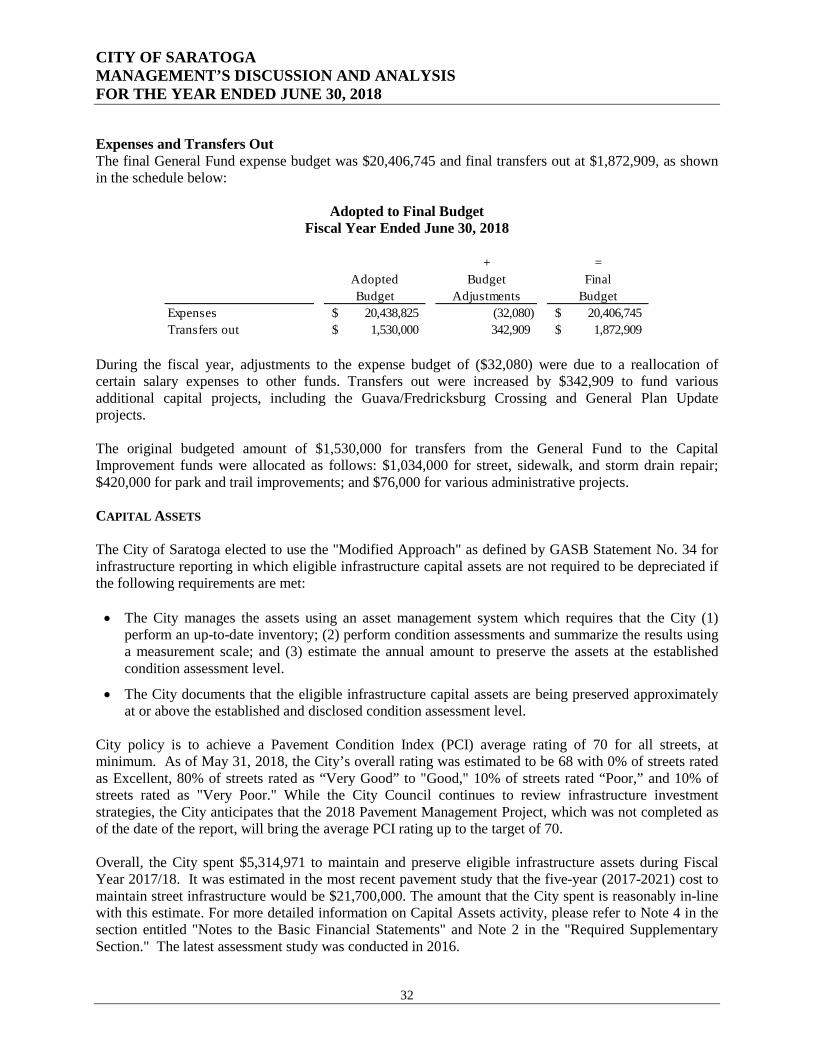
Expenses and Transfers Out The final General Fund expense budget was $20,406,745 and final transfers out at $1,872,909, as shown in the schedule below:
Adopted to Final Budget Fiscal Year Ended June 30, 2018
+ =
Adopted Budget FinalBudget Adjustments Budget
Expenses 20,438,825$ (32,080) 20,406,745$ Transfers out 1,530,000$ 342,909 1,872,909$
During the fiscal year, adjustments to the expense budget of ($32,080) were due to a reallocation of certain salary expenses to other funds. Transfers out were increased by $342,909 to fund various additional capital projects, including the Guava/Fredricksburg Crossing and General Plan Update projects. The original budgeted amount of $1,530,000 for transfers from the General Fund to the Capital Improvement funds were allocated as follows: $1,034,000 for street, sidewalk, and storm drain repair; $420,000 for park and trail improvements; and $76,000 for various administrative projects. CAPITAL ASSETS The City of Saratoga elected to use the "Modified Approach" as defined by GASB Statement No. 34 for infrastructure reporting in which eligible infrastructure capital assets are not required to be depreciated if the following requirements are met: • The City manages the assets using an asset management system which requires that the City (1)
perform an up-to-date inventory; (2) perform condition assessments and summarize the results using a measurement scale; and (3) estimate the annual amount to preserve the assets at the established condition assessment level.
• The City documents that the eligible infrastructure capital assets are being preserved approximately at or above the established and disclosed condition assessment level.
City policy is to achieve a Pavement Condition Index (PCI) average rating of 70 for all streets, at minimum. As of May 31, 2018, the City’s overall rating was estimated to be 68 with 0% of streets rated as Excellent, 80% of streets rated as “Very Good” to "Good," 10% of streets rated “Poor,” and 10% of streets rated as "Very Poor." While the City Council continues to review infrastructure investment strategies, the City anticipates that the 2018 Pavement Management Project, which was not completed as of the date of the report, will bring the average PCI rating up to the target of 70. Overall, the City spent $5,314,971 to maintain and preserve eligible infrastructure assets during Fiscal Year 2017/18. It was estimated in the most recent pavement study that the five-year (2017-2021) cost to maintain street infrastructure would be $21,700,000. The amount that the City spent is reasonably in-line with this estimate. For more detailed information on Capital Assets activity, please refer to Note 4 in the section entitled "Notes to the Basic Financial Statements" and Note 2 in the "Required Supplementary Section." The latest assessment study was conducted in 2016.

CITY OF SARATOGA MANAGEMENT’S DISCUSSION AND ANALYSIS FOR THE YEAR ENDED JUNE 30, 2018
33
As reflected in the following schedule, the City has $122,459,410 invested in a variety of capital assets as of June 30, 2018. This represents an increase of $1,305,395, or 1.08% from the prior year.
Governmental Activities2018 2017
Land 15,591,925$ 15,591,925$ Building and structures 15,695,317 15,919,233 Machinery and equipment 1,129,549 1,039,184 Infrastructure 83,067,805 80,453,463 Construction in progress 6,974,814 8,150,210
Total Capital Assets, Net of Depreciation 122,459,410$ 121,154,015$
Capital Assets at Year EndNet of Depreciation
The following reconciliation summarizes the changes in Capital Assets.
Balance BalanceJune 30, 2017 Additions Retirements Reclassification June 30, 2018
Land 15,591,925$ -$ -$ -$ 15,591,925$ Building and structures 25,986,754 493,441 - - 26,480,195 Machinery and equipment 3,174,008 331,879 - - 3,505,887 Infrastructure 107,491,011 3,879,008 - - 111,370,019 Construction in progress 8,150,211 3,326,801 - (4,502,198) 6,974,814 Depreciation (39,239,894) (2,223,536) - - (41,463,430) Total Capital Assets, Net of Depreciation 121,154,015$ 5,807,593$ -$ (4,502,198)$ 122,459,410$
Changes in Capital Assets
Major capital projects in progress during Fiscal Year 2017/18 included the following expenditures:
• Highway 9 Improvements - $152,788 • Prospect/Saratoga OBAG Improvements - $2,217,437 • Hakone Gardens Koi Pond Improvements - $224,980 • Village Sidewalk Improvements - $279,268 • Electric Vehicle (EV) Fast-Charge Station - $63,051
Additional information on Capital Assets is included in Note 4 to the financial statements.
CITY OF SARATOGA MANAGEMENT’S DISCUSSION AND ANALYSIS FOR THE YEAR ENDED JUNE 30, 2018
34
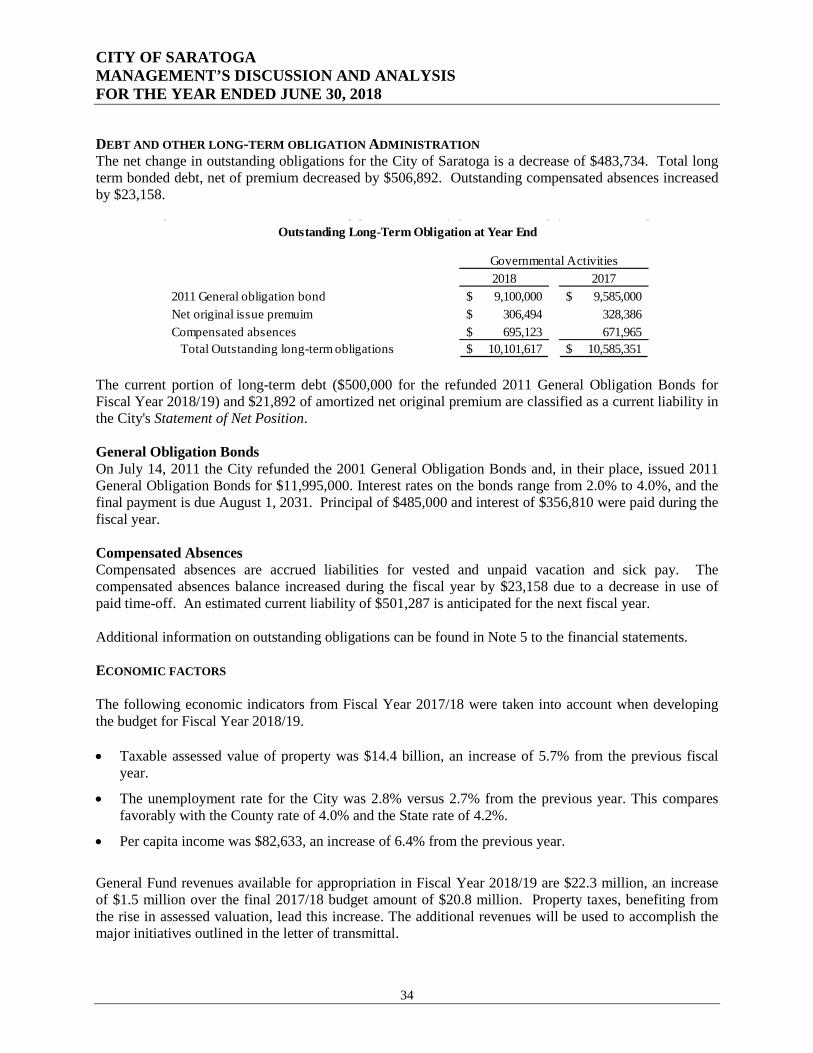
DEBT AND OTHER LONG-TERM OBLIGATION ADMINISTRATION The net change in outstanding obligations for the City of Saratoga is a decrease of $483,734. Total long term bonded debt, net of premium decreased by $506,892. Outstanding compensated absences increased by $23,158.
Governmental Activities2018 2017
2011 General obligation bond 9,100,000$ 9,585,000$ Net original issue premuim 306,494$ 328,386 Compensated absences 695,123$ 671,965
Total Outstanding long-term obligations 10,101,617$ 10,585,351$
Outstanding Long-Term Obligation at Year End
The current portion of long-term debt ($500,000 for the refunded 2011 General Obligation Bonds for Fiscal Year 2018/19) and $21,892 of amortized net original premium are classified as a current liability in the City's Statement of Net Position. General Obligation Bonds On July 14, 2011 the City refunded the 2001 General Obligation Bonds and, in their place, issued 2011 General Obligation Bonds for $11,995,000. Interest rates on the bonds range from 2.0% to 4.0%, and the final payment is due August 1, 2031. Principal of $485,000 and interest of $356,810 were paid during the fiscal year. Compensated Absences Compensated absences are accrued liabilities for vested and unpaid vacation and sick pay. The compensated absences balance increased during the fiscal year by $23,158 due to a decrease in use of paid time-off. An estimated current liability of $501,287 is anticipated for the next fiscal year. Additional information on outstanding obligations can be found in Note 5 to the financial statements. ECONOMIC FACTORS The following economic indicators from Fiscal Year 2017/18 were taken into account when developing the budget for Fiscal Year 2018/19. • Taxable assessed value of property was $14.4 billion, an increase of 5.7% from the previous fiscal
year.
• The unemployment rate for the City was 2.8% versus 2.7% from the previous year. This compares favorably with the County rate of 4.0% and the State rate of 4.2%.
• Per capita income was $82,633, an increase of 6.4% from the previous year.
General Fund revenues available for appropriation in Fiscal Year 2018/19 are $22.3 million, an increase of $1.5 million over the final 2017/18 budget amount of $20.8 million. Property taxes, benefiting from the rise in assessed valuation, lead this increase. The additional revenues will be used to accomplish the major initiatives outlined in the letter of transmittal.

CITY OF SARATOGA MANAGEMENT’S DISCUSSION AND ANALYSIS FOR THE YEAR ENDED JUNE 30, 2018
35
General Fund expenses available for appropriation in Fiscal Year 2018/19 are $22.0 million, an increase of $1.6 million over the final Fiscal Year 2017/18 budget amount of $20.4 million. Increases are anticipated in salaries and benefits due to cost-of-living adjustments. Increases will also be seen in contract services related to public safety. The budget will continue to address the City’s standing policy of reducing long-term liabilities related to pension obligations by increasing the UAL payment by an additional $250,000, up to a total of $1 million, and building reserves to weather future downturns in the economy. As for the City’s capital budget, the focus continues to be on improving local roads. A total of $1.8 million is allocated for street repair and resurfacing and sidewalks, curbs and storm drains. Additionally, $525,000 is allocated to improve the infrastructure of the City’s parks, trails, grounds, and medians. OUTLOOK The City maintains a strong financial position. Services have been restored to pre-recessionary levels. The lessons learned from the “Great Recession” have led to a focus on long-term financial planning that will help the City through the next economic downturn with hopefully little impact to service levels. In the meantime, the City will continue to address its liabilities, deferred maintenance on infrastructure and facilities, and explore ways in which the City can refine Saratoga and make it an even better place for the people who live, work, and visit the community. REQUEST FOR FINANCIAL INFORMATION This financial report is designed to provide a general overview of the City of Saratoga's finances for all of Saratoga's residents, taxpayers, customers, investors, and creditors. This financial report seeks to demonstrate the City's accountability for the money it receives. Questions concerning any of the information provided in this report or requests for additional information should be addressed to the Administrative Services Department, 13777 Fruitvale Avenue, Saratoga, California 95070.
CITY OF SARATOGA STATEMENT OF NET POSITION JUNE 30, 2018
36
This page is intentionally blank.

CITY OF SARATOGA STATEMENT OF NET POSITION JUNE 30, 2018
37
BASIC FINANCIAL STATEMENTS

CITY OF SARATOGA STATEMENT OF NET POSITION JUNE 30, 2018
38
Primary GovernmentGovernmental
ActivitiesASSETSCurrent Assets:
Cash and investments 23,773,159$ Restricted cash and investments 2,414,665 Receivables:
Accounts 771,752 Total Current Assets 26,959,576
Noncurrent Assets:Capital Assets:
Non-depreciable 75,230,409 Depreciable, net 47,229,001
Total Capital Assets 122,459,410 Total Noncurrent Assets 122,459,410
Total Assets 149,418,986
DEFERRED OUTFLOW OF RESOURCESContribution and adjustments related to pension liability 3,711,379
Total Deferred Outflow of Resources 3,711,379
LIABILITIESCurrent Liabilities:
Accounts payable 1,299,998$ Accrued payroll 166,464 Interest payable 148,671 Deposits payable 2,657,034 Claims payable 76,001 Long-term obligations - due within one year 1,023,179
Total Current Liabilities 5,608,315
Noncurrent Liabilities:Net pension liabilty 7,556,748 Long-term obligations - due in more than one year 9,078,438
Total Noncurrent Liabilities 16,635,186 Total Liabilities 22,243,502
DEFERRED INFLOW OF RESOURCESAdjustments related to pension liability 1,522,918 Unavailable revenue 21,953
Total Deferred Inflow of Resources 1,544,871
Net PositionNet investment in capital assets 113,052,916 Restricted for:
Environmental funds 213,182 Special assessment funds 1,385,339 Debt service 997,756
Total Restricted 2,596,277 Unrestricted 13,692,799
Total Net Position 129,341,992$
The accompanying notes are an integral part of these financial statements

CITY OF SARATOGA STATEMENT OF ACTIVITIES AND CHANGES IN NET POSITION FOR THE FISCAL YEAR ENDED JUNE 30, 2018
39
Net (Expense)Revenue andChanges in
Program Revenues Net PositionPrimary
Operating Capital GovernmentCharges for Grants and Grants and Governmental
Functions/Programs Expenses Services Contributions Contributions Total ActivitiesPrimary Government:
Governmental Activities:General and intergovtl services 6,009,582$ 152,287$ -$ -$ 152,287$ (5,857,296)$ Public safety 5,728,276 367,857 88,392 - 456,249 (5,272,027) Public works 7,942,898 2,396,644 1,865 179,291 2,577,800 (5,365,098) Community services 1,594,469 914,312 - 39,465 953,777 (640,692) Community development services 2,285,452 2,343,010 - - 2,343,010 57,557 Interest on long-term debt (unall.) 358,703 - - - - (358,703)
Total 23,919,380$ 6,174,109$ 90,257$ 218,756$ 6,483,122$ (17,436,258)$
General Revenues:Taxes
Property taxes 14,123,801$ Sales taxes 1,124,647 Local taxes 960,363 Franchise taxes 2,166,165 Motor vehicle-in-lieu 16,091
Total taxes 18,391,066 Intergovernmental 801,748 Investment earnings 318,699 Other revenues 212,543
Total General Revenues 19,724,056 Change in Net Position 2,287,798 Net Position - Beginning of Year 127,054,194 Net Position - End of Year 129,341,992$
The accompanying notes are an integral part of these financial statements
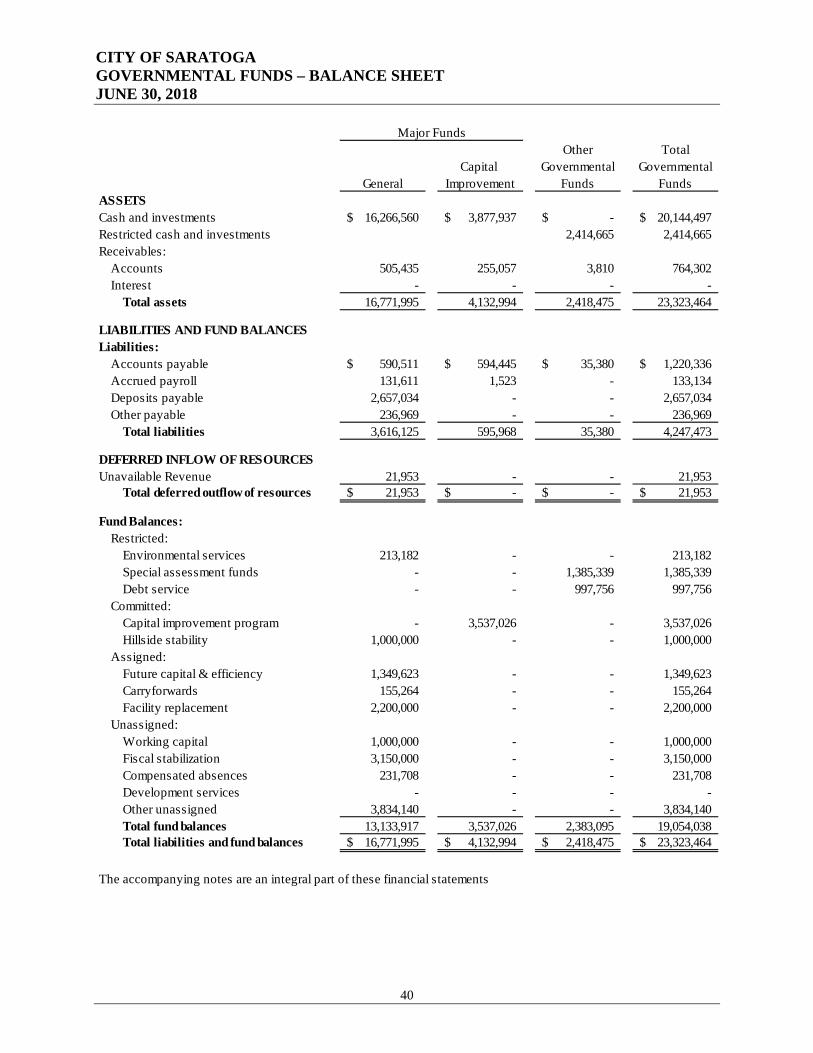
CITY OF SARATOGA GOVERNMENTAL FUNDS – BALANCE SHEET JUNE 30, 2018
40
Other TotalCapital Governmental Governmental
General Improvement Funds FundsASSETSCash and investments 16,266,560$ 3,877,937$ -$ 20,144,497$ Restricted cash and investments 2,414,665 2,414,665 Receivables:
Accounts 505,435 255,057 3,810 764,302 Interest - - - -
Total assets 16,771,995 4,132,994 2,418,475 23,323,464
LIABILITIES AND FUND BALANCESLiabilities:
Accounts payable 590,511$ 594,445$ 35,380$ 1,220,336$ Accrued payroll 131,611 1,523 - 133,134 Deposits payable 2,657,034 - - 2,657,034 Other payable 236,969 - - 236,969
Total liabilities 3,616,125 595,968 35,380 4,247,473
DEFERRED INFLOW OF RESOURCESUnavailable Revenue 21,953 - - 21,953
Total deferred outflow of resources 21,953$ -$ -$ 21,953$
Fund Balances:Restricted:
Environmental services 213,182 - - 213,182 Special assessment funds - - 1,385,339 1,385,339 Debt service - - 997,756 997,756
Committed:Capital improvement program - 3,537,026 - 3,537,026 Hillside stability 1,000,000 - - 1,000,000
Assigned:Future capital & efficiency 1,349,623 - - 1,349,623 Carryforwards 155,264 - - 155,264 Facility replacement 2,200,000 - - 2,200,000
Unassigned:Working capital 1,000,000 - - 1,000,000 Fiscal stabilization 3,150,000 - - 3,150,000 Compensated absences 231,708 - - 231,708 Development services - - - - Other unassigned 3,834,140 - - 3,834,140 Total fund balances 13,133,917 3,537,026 2,383,095 19,054,038 Total liabilities and fund balances 16,771,995$ 4,132,994$ 2,418,475$ 23,323,464$
The accompanying notes are an integral part of these financial statements
Major Funds

CITY OF SARATOGA RECONCILIATION OF THE GOVERNMENTAL FUNDS BALANCE SHEET TO THE STATEMENT OF NET POSITION JUNE 30, 2018
41
Total Fund Balances - Total Governmental Funds 19,054,038$ Amounts reported for governmental activities in the statement of net position weredifferent because:
Capital assets used in governmental activities were not current financial resources. Therefore,they were not reported in the Governmental Funds Balance Sheet. The capital assets wereadjusted as follows:
Non-depreciable capital assets 75,230,409 Depreciable capital assets, net 46,817,836
Total Capital Assets 122,048,245
Interest payable on long-term debt did not require current financial resources. Therefore,interest payable was not reported as a liability in Governmental Funds Balance Sheet. (148,671)
Internal service funds are used by management to charge the costs of office stores, vehicle and equipment maintenance and replacement, information services and replacement,building maintenance, risk management, and workers compensation. The assets andliabilities of the internal service funds are included in the governmental activities inthe statement of net position 3,858,284
Deferred outflow of resources are transactions that have already taken place but are not ready to be recognized on the financial statements as expenses
Changes of Assumptions 1,899,044 Differences between Projected and Actual Investment Earnings 464,937 Differences between employer's contributions and proportionate share 57,947 Pension Contributions Made Subsequent to Measurement Date 1,289,450
3,711,377
Long-term obligations were not due and payable in the current period. Therefore, they were notreported in the Governmental Funds Balance Sheet. The long-term liabilities were adjustedas follows:
General obligation bonds (9,100,000) Net Pension Liability (7,556,748) Compensated absences (695,123) Net original issue premium (306,494)
Total Long-Term Obligations (17,658,366)
Deferred inflow of resources are transactions that have already taken place but are not readyto be recognized on the financial statements as revenues
Differences between Expected and Actual Experience (220,810) Change in employer's proportion (1,302,108)
(1,522,918)
Net Position of Governmental Activities 129,341,992$
The accompanying notes are an integral part of these financial statements

CITY OF SARATOGA STATEMENT OF REVENUES, EXPENDITURES, AND CHANGES IN FUND BALANCE FOR THE YEAR ENDED JUNE 30, 2018
42
Other TotalCapital Governmental Governmental
General Improvement Funds FundsREVENUES:Property taxes 12,963,531$ -$ 283,499$ 13,247,030$ Special assessments - - 1,332,739 1,332,739 Sales taxes 1,124,647 - - 1,124,647 Other local taxes 960,363 - - 960,363 Licenses & permits 2,204,627 472,075 - 2,676,702 Fines & forfeiture 110,190 17,145 - 127,335 Intergovernmental - Federal 1,865 179,291 - 181,156 Intergovernmental - State 459,016 794,071 - 1,253,087 Intergovernmental - Other 96,144 39,465 - 135,609 Franchise fees 2,166,165 - - 2,166,165 Use of money and property 716,090 37,237 25,878 779,205 Other revenue 2,167,470 229,099 (2) 2,396,567
Total revenues 22,970,108 1,768,383 1,642,114 26,380,605
EXPENDITURES:Current:
General and intergovernmental services 4,585,147 - - 4,585,147 Public safety 5,705,157 - - 5,705,157 Public works 5,560,509 - 524,475 6,084,984 Community services 1,292,453 - - 1,292,453 Community development services 2,246,525 - - 2,246,525
Capital outlay - 4,747,375 - 4,747,375 Debt service:
Principal - - 485,000 485,000 Interest and fiscal charges - - 361,735 361,735
Total expenditures 19,389,791 4,747,375 1,371,210 25,508,376
REVENUES OVER(UNDER) EXPENDITURES 3,580,317 (2,978,992) 270,904 872,229
OTHER FINANCING SOURCES (USES):Transfers in 442,198 2,954,909 - 3,397,107 Transfers out (1,872,909) (1,524,198) - (3,397,107)
Total other financing sources (uses) (1,430,711) 1,430,711 - -
Net change in fund balances 2,149,606 (1,548,281) 270,904 872,229
FUND BALANCES:
Beginning of year 10,984,311 5,085,307 2,112,191 18,181,809 End of year 13,133,917$ 3,537,026$ 2,383,095 19,054,038$
The accompanying notes are an integral part of these financial statements.
Major Funds

CITY OF SARATOGA RECONCILIATION OF THE GOVERNMENTAL FUNDS STATEMENT OF REVENUES, EXPENDITURES AND CHANGES IN FUND BALANCE TO THE GOVERNMENT-WIDE STATEMENT OF ACTIVITIES AND CHANGES IN NET POSITION FOR THE FISCAL YEAR ENDED JUNE 30, 2018
43
Net Change in Fund Balances - Total Governmental Funds 872,229$ Amounts reported for governmental activities in the Statement of Activities and Changes
in Net Position were different because:
Governmental Funds report capital outlay as expenditures. However, in the Government-WideStatement of Activities and Changes in Net Position, the cost of those assets was allocated overtheir estimated useful lives as depreciation expense. This is the amount of capital assetsrecorded in the current period. 3,326,802
Depreciation expense on capital assets was reported in the Government-Wide Statementof Activities and Changes in Net Position, but it did not require the use of current financialresources. Therefore, depreciation expense was not reported as expenditures in theGovernmental Funds. (2,072,258)
Internal service funds are used by management to charge the costs of office stores, vehicle and equipment maintenance and replacement, information services and replacement,building maintenance, risk management, and workers' compensation. The net revenueor excess expenses of the internal service funds is reported with government activities. 250,395
GASB 68 Adjustments to pension expenseChange in net pension liability - current year (1,221,142) Amortization of changes in deferred outflows 782,209 Amortization of changes in deferred inflows (137,203)
Adjustments to pension expense as a result of GASB 68 (576,136)
Long-term compensated absences and claims payables were reported in the Government-WideStatement of Activities and Changes in Net Position, but they did not require the use of currentfinancial resources. Therefore, long-term compensated absences and claims payable were notreported as expenditures in governmental funds.
Compensated absences (23,158)
Repayment of bond principal was an expenditure in governmental funds, but the repaymentreduced long-term liabilities in the Government-Wide Statement of Net Position.
Long-term debt repayments 485,000
Revenues resulting from the refunding of outstanding debt are not available to paycurrent-period expenditures and therefore, are revenue in the funds.
Net original issue premium 21,892
Interest expense on long-term debt was reported in the Government-Wide Statement ofActivities and Changes in Net Position, but it did not require the use of current financialresources. Therefore, interest expense was not reported as expenditures in governmentalfunds. The following amount represented the change in accrued interest from prior year. 3,032
Change in Net Position of Governmental Activities 2,287,798$
The accompanying notes are an integral part of these financial statements

CITY OF SARATOGA STATEMENT OF NET POSITION PROPRIETARY FUNDS JUNE 30, 2018
44
Governmental
Activities -Internal
Service FundsASSETSCurrent assets:
Cash and investments 3,628,662$ Accounts receivable 7,450
Total current assets 3,636,112
Noncurrent assets:Capital assets:
Machinery and equipment 1,421,442 Less: accumulated depreciation (1,010,277)
Total capital assets (net ofaccumulated depreciation) 411,165
Total assets 4,047,277
LIABILITIESLiabilities:Current liabilities:
Accounts payable 79,662$ Accrued payroll 33,330 Other payables 76,001
Total current liabilities 188,993
NET POSITIONNet investment in capital assets 411,165 Unrestricted 3,447,119 Total net position 3,858,284$
The accompanying notes are an integral part of these financial statements

CITY OF SARATOGA STATEMENT OF REVENUES, EXPENSES, AND CHANGES IN FUND NET POSITION PROPRIETARY FUNDS FOR THE FISCAL YEAR ENDED JUNE 30, 2018
45
Governmental
Activities -Internal
Service FundsOperating revenues:
Charges for services 2,850,000$ Other operating revenues 75,592
Total operating revenues 2,925,592
Operating expenses:Cost of services 2,523,920 Depreciation 151,277
Total operating expenses 2,675,197 Operating income (loss) 250,395
Transfers in -
Change in net position 250,395
Total net position - beginning 3,607,889 Total net position - ending 3,858,284$
The accompanying notes are an integral part of these financial statements
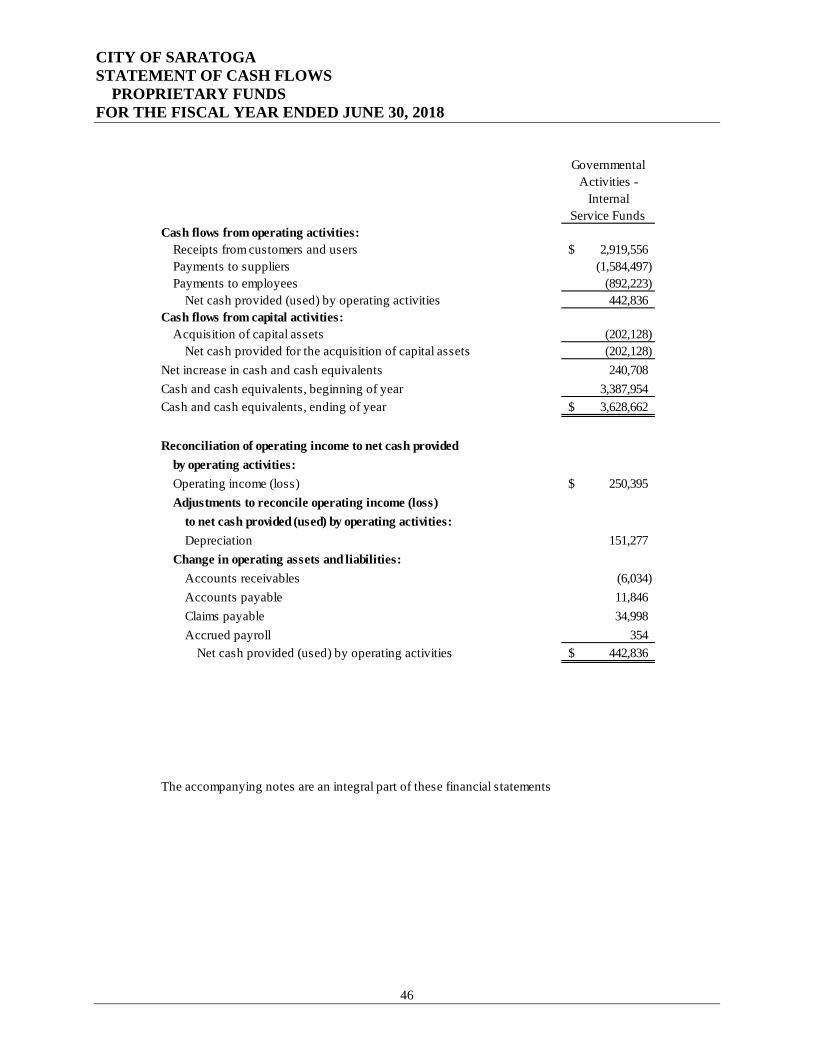
CITY OF SARATOGA STATEMENT OF CASH FLOWS PROPRIETARY FUNDS FOR THE FISCAL YEAR ENDED JUNE 30, 2018
46
Governmental
Activities -Internal
Service FundsCash flows from operating activities:
Receipts from customers and users 2,919,556$ Payments to suppliers (1,584,497) Payments to employees (892,223)
Net cash provided (used) by operating activities 442,836 Cash flows from capital activities:
Acquisition of capital assets (202,128) Net cash provided for the acquisition of capital assets (202,128)
Net increase in cash and cash equivalents 240,708 Cash and cash equivalents, beginning of year 3,387,954 Cash and cash equivalents, ending of year 3,628,662$
Reconciliation of operating income to net cash providedby operating activities:Operating income (loss) 250,395$ Adjustments to reconcile operating income (loss)
to net cash provided (used) by operating activities:Depreciation 151,277
Change in operating assets and liabilities:Accounts receivables (6,034) Accounts payable 11,846 Claims payable 34,998 Accrued payroll 354
Net cash provided (used) by operating activities 442,836$
The accompanying notes are an integral part of these financial statements

CITY OF SARATOGA NOTES TO FINANCIAL STATEMENTS JUNE 30, 2018
47
NOTE 1 - SUMMARY OF SIGNIFICANT ACCOUNTING POLICIES The basic financial statements of the City of Saratoga, California (the City) have been prepared in conformity with generally accepted accounting principles (GAAP) as applied to governmental agencies. The Governmental Accounting Standards Boards (GASB) is the accepted standard setting body for establishing governmental accounting and financial reporting principles. The more significant of the City's accounting policies are described below. A. Financial Reporting Entity The City was incorporated as a municipal corporation in 1956 under the general laws of the State of California, with a population of 31,435 at June 30, 2018. The City is a largely residential community located in the foothills of the Santa Cruz Mountains. The City operates under the Council-Manager form of government, with five-elected Council members served by a full-time City Manager and staff. At June 30, 2018, the City's staff was comprised of 59 full-time or part-time employees, and numerous part-time temporary and seasonal employees. Staff is responsible for the following City services: • Public Safety - The City provides around-the-clock police services under a contract with the Santa
Clara County Sheriff's offices. Emergency management and Fire services are provided by a special district. Code enforcement and inspection services are provided by City employees.
• Public Works/Maintenance - The City builds and maintains its parks, streets, curbs, gutters, and related public property with a force of 21 employees. Major projects may be contracted out to reduce costs.
• Community Development - Zoning administration, plan checking and advance planning services are provided by 12 employees.
• Culture, Recreation and Community Support services are provided by a total of 9 employees.
• General Government services are provided by a total of 15 employees. As required by GAAP, these basic financial statements present the City and its component units, entities for which the City is considered to be financially accountable. The City Council acts as the governing board. In addition, the City staff performs all administrative and accounting functions for these entities and these entities provide their services entirely to the City. Blended component units, although legally separate entities, are, in substance, part of the City's operations and data from these units are combined with data of the City. Discretely presented component units, on the other hand, are reported in a separate column in the government-wide financial statements to emphasize their legal separation from the City. Each blended component unit has a June 30 year-end. The City has no discretely presented component units. The following entity is reported as blended component unit: Landscape & Lighting District - The Landscape & Lighting District (the District) was established in 1980 for the levy and the collection of assessments upon the several lots or parcels of land in the District, and for the construction or installation of improvements and maintenance. The District is reported as a blended component unit of the City because it has the same Governing Board as the City. The activity for
CITY OF SARATOGA NOTES TO FINANCIAL STATEMENTS JUNE 30, 2018
48
the District has been included in the accompanying basic financial statements and no separate financial statements are issued. B. Basis of Accounting and Measurement Focus The accounts of the City are organized on the basis of funds, each of which is considered a separate accounting entity. The operations of each fund are accounted for with a separate set of self-balancing accounts that comprise of its assets, liabilities, fund equity, revenues, and expenditures or expenses, as appropriate. Governmental resources are allocated to and accounted for in individual funds based upon the purposes for which they are to be spent and the means by which spending activities are controlled. Government-Wide Financial Statements The City's government-wide financial statements include a Statement of Net Position and a Statement of Activities and Changes in Net Position. These statements present summaries of governmental activities for the City. Fiduciary activities of the City are not included in these statements. These statements are presented on an "economic resources" measurement focus and the accrual basis of accounting. Accordingly, all of the City's assets and liabilities, including capital assets, as well as infrastructure assets, long-term liabilities, and deferred inflows and outflows of resources are included in the accompanying Statement of Net Position. The Statement of Activities presents changes in net position. Under the accrual basis of accounting, revenues are recognized in the period in which they are earned while expenses are recognized in the period in which the liability is incurred. Certain types of transactions are reported as program revenues for the City in three categories:
• Charges for services • Operating grants and contributions • Capital grants and contributions
Certain eliminations have been made as prescribed by GASB Statement No. 34 in regards to inter-fund activities, payables, and receivables. All internal balances in the Statement of Net Position have been eliminated. The following inter-fund activities have been eliminated:
• Transfers in/Transfers out • Internal Service Fund charges • Landscape and Lighting District Service Fees
Deferred Outflow of Resources and Deferred Inflow of Resources Deferred outflow of resources is a consumption of net position by the City that is applicable to a future reporting period, such as deferred charges. Deferred inflow of resources is an acquisition of net position by the City that is applicable to a future reporting period, such as unavailable revenue and advance collections.
CITY OF SARATOGA NOTES TO FINANCIAL STATEMENTS JUNE 30, 2018
49
Governmental Fund Financial Statements Governmental fund financial statements include a Balance Sheet and a Statement of Revenues, Expenditures and Changes in Fund Balances for all major governmental funds and aggregated non-major funds. An accompanying schedule is presented to reconcile and explain the differences in net position as presented in these statements to the net position presented in the government-wide financial statements. The City has presented all major funds that met the applicable criteria. The following funds are major funds: General Fund The General Fund is used to account for all of the general resources of the City not specifically levied or collected for other City funds and the related expenditures. The General Fund accounts for all financial resources of the City which are not accounted for in another fund. Capital Improvement Capital Projects Fund This fund accounts for resources used for the major capital acquisition and construction activities. All governmental funds are accounted for on a spending or "current financial resources" measurement focus and the modified accrual basis of accounting. Accordingly, only current assets, deferred outflows of resources, current liabilities and deferred inflows of resources are included on the balance sheets. The Statement of Revenues, Expenditures and Changes in Fund Balances present increases (revenues and other financing sources) and decreases (expenditures and other financing uses) in net current assets. Under the modified accrual basis of accounting, revenues are recognized in the accounting period in which they become both measurable and available to finance expenditures of the current period. Accordingly, revenues are recorded when received in cash, except that revenues subject to accrual (up to 45 days after year-end) are recognized when due. The primary revenue sources, which have been treated as susceptible to accrual by the City, are property tax, sales tax, special assessments, intergovernmental revenues, other taxes, interest revenue, rental revenue and certain charges for services. Fines, forfeitures, licenses and permits and parking meter revenues are not susceptible to accrual because they are usually not measurable until received in cash. Expenditures are recorded in the accounting period in which the related fund liability is incurred. Unearned revenues arise when potential revenues do not meet both the "measurable" and "available" criteria for recognition in the current period. Unearned revenues also arise when the government receives resources before it has a legal claim to them, as when grant monies are received prior to incurring qualifying expenditures. In subsequent periods when both revenue recognition criteria are met or when the government has a legal claim to the resources, the unearned revenue is removed from the combined balance sheet and revenue is recognized. Reconciliation of the Fund Financial Statements to the Government-Wide Financial Statements is provided to explain the differences created by the integrated approach of GASB Statement No. 34. Proprietary Funds The City’s internal service funds are proprietary funds. In the fund financial statements, proprietary funds are presented using the accrual basis of accounting. Revenues are recognized when they are earned and expenses are recognized when the related goods or services are delivered. In the fund financial statements, proprietary funds are presented using the “economic resources measurement focus”. This means all assets and liabilities (whether current or noncurrent) associated with their activities are included

CITY OF SARATOGA NOTES TO FINANCIAL STATEMENTS JUNE 30, 2018
50
on their balance sheets. Proprietary fund type operating statements present increases (revenues) and decreases (expenses) in total net position. Proprietary fund operating revenues, such as charges for services, result from exchange transactions associated with principal activity of the fund. Exchange transactions are those in which each party receives and gives up essentially equal value. Non-operating revenues, such as subsidies, taxes, and investment earnings result from non-exchange transactions or ancillary activities. Amounts paid to acquire capital assets are capitalized as assets in the internal service funds financial statements. Internal service funds account for charges to City departments for services provided, on a cost reimbursement basis, in the following areas: general liability, workers’ compensation, office support, information technology services, vehicle maintenance, building maintenance, equipment replacement, and information technology replacement. Fiduciary Fund Financial Statements During Fiscal Year 2017/18 the City has no fiduciary responsibility as prior reported agency funds have been transferred to other outside government agencies. C. Cash, Cash Equivalents and Investments The City pools its available cash for investment purposes. The City's cash and cash equivalents are considered to be cash on hand, demand deposits, and short-term investments with original maturity of three months or less from the date of acquisition. Cash and cash equivalents are combined with investments and displayed as Cash and Investments. Deposit and Investment Risk Disclosures - In accordance with GASB Statement No. 40, Deposit and Investment Disclosures (Amendment of GASB Statement No. 3), certain disclosure requirements, if applicable, for Deposits and Investment Risks in the following areas:
• Interest Rate Risk • Credit Risk
▬ Overall ▬ Custodial Credit Risk ▬ Concentrations of Credit Risk
• Foreign Currency Risk
Other disclosures are specified including use of certain methods to present deposits and investments, highly sensitive investments, credit quality at year-end and other disclosures. The City participates in an investment pool managed by the State of California titled Local Agency Investment Fund (LAIF), which has invested a portion of the pool funds in Structured Notes and Asset Backed Securities. LAIF's investments are subject to credit risk with the full faith and credit of the State of California collateralizing these investments. In addition, these Structured Notes and Asset-Backed Securities are subject to market risk as to change in interest rates.

CITY OF SARATOGA NOTES TO FINANCIAL STATEMENTS JUNE 30, 2018
51
D. Inter-fund Transactions Inter-fund services provided and used are accounted for as revenue, expenditures or expenses, as appropriate. Transactions that constitute reimbursements to a fund for expenditures/expenses initially made from it that are properly applicable to another fund are recorded as expenditures/expenses in the reimbursed fund. All other inter-fund transfers are reported as transfers. E. Capital Assets Capital assets, including land, buildings, improvements, furniture, equipment and infrastructure assets (e.g., roads, bridges, sidewalks, and similar items), are reported in the applicable governmental activities in the government-wide financial statements. Capital assets were recorded at historical cost or estimated historical cost if actual cost was not available. Donated capital assets, donated works of art and similar items, and capital assets received in service concession agreement are reported at acquisition value. City policy has set the capitalization threshold for reporting capital assets at $10,000. The City has chosen the Modified Approach for reporting the streets subsystem of infrastructure capital assets. Depreciation is recorded on a straight-line basis over the useful lives of the assets as follows:
Buildings and structures 40 Years Machinery and equipment 5 to 10 Years Infrastructure 15 to 50 Years
In June 1999, GASB issued Statement No. 34 Basic Financial Statements – and Management’s Discussion and Analysis – for State and Local Governments which requires the inclusion of infrastructure capital assets in local governments' basic financial statements. In accordance with Statement No. 34, the City has included the value of all infrastructure assets in its basic financial statements. The City defines infrastructure as the basic physical assets that allow the City to function, which includes the street system, park and recreation lands and improvements system; storm water conveyance and drainage system, buildings combined with site amenities such as parking and landscaping areas used by the City in the conduct of its business. Each major infrastructure system can be divided into subsystems. For example, the street system can be subdivided into pavement, curb and gutters, sidewalks, medians, streetlights, traffic control devices (signs, signals and pavement markings), landscaping and land. These subsystems were not delineated in the basic financial statements. The appropriate operating department maintains information regarding the subsystems. The City elected to use the Modified Approach as defined by GASB Statement No. 34 for infrastructure reporting of its streets, concrete and asphalt pavements. The City commissioned a physical assessment of the streets condition as of June 30, 2016. This condition assessment was performed in 2017. A Pavement Condition Index (PCI) was assigned to each street segment. The index is expressed in a continuous scale from 0 to 100, where 0 is assigned to the least acceptable physical condition and 100 is assigned to segments of street that have the physical characteristics of a new street.
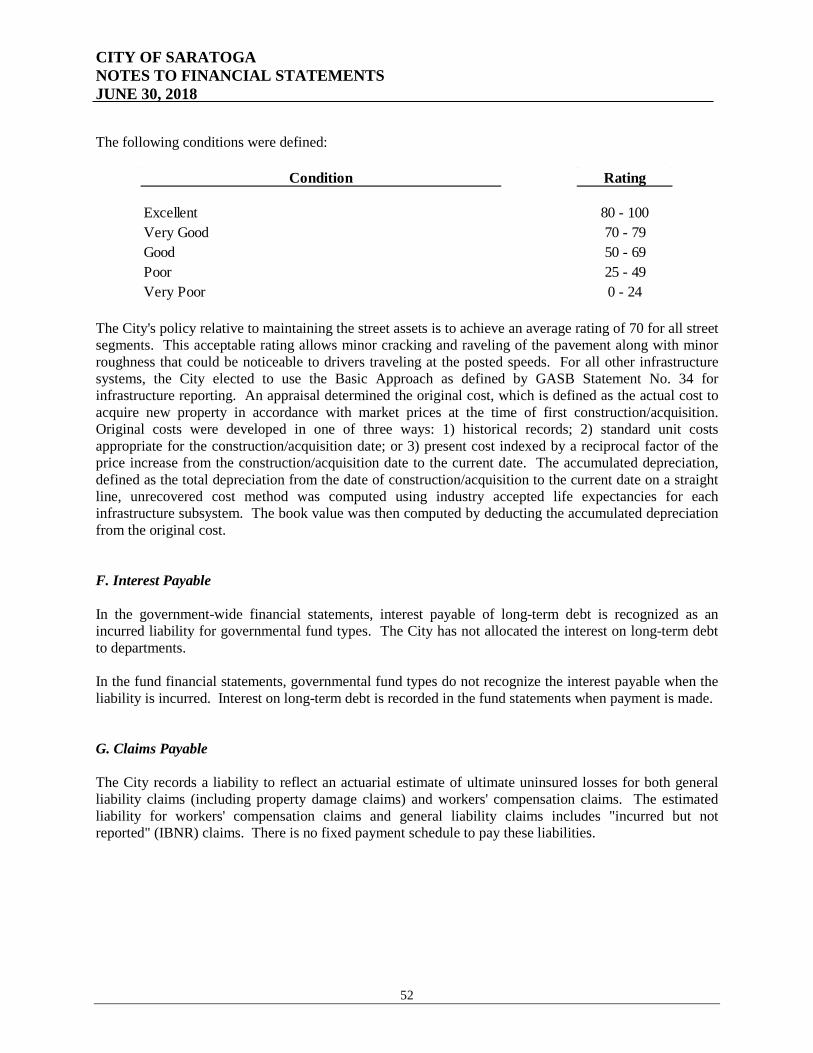
CITY OF SARATOGA NOTES TO FINANCIAL STATEMENTS JUNE 30, 2018
52
The following conditions were defined:
Condition Rating
Excellent 80 - 100Very Good 70 - 79Good 50 - 69Poor 25 - 49Very Poor 0 - 24
The City's policy relative to maintaining the street assets is to achieve an average rating of 70 for all street segments. This acceptable rating allows minor cracking and raveling of the pavement along with minor roughness that could be noticeable to drivers traveling at the posted speeds. For all other infrastructure systems, the City elected to use the Basic Approach as defined by GASB Statement No. 34 for infrastructure reporting. An appraisal determined the original cost, which is defined as the actual cost to acquire new property in accordance with market prices at the time of first construction/acquisition. Original costs were developed in one of three ways: 1) historical records; 2) standard unit costs appropriate for the construction/acquisition date; or 3) present cost indexed by a reciprocal factor of the price increase from the construction/acquisition date to the current date. The accumulated depreciation, defined as the total depreciation from the date of construction/acquisition to the current date on a straight line, unrecovered cost method was computed using industry accepted life expectancies for each infrastructure subsystem. The book value was then computed by deducting the accumulated depreciation from the original cost. F. Interest Payable In the government-wide financial statements, interest payable of long-term debt is recognized as an incurred liability for governmental fund types. The City has not allocated the interest on long-term debt to departments. In the fund financial statements, governmental fund types do not recognize the interest payable when the liability is incurred. Interest on long-term debt is recorded in the fund statements when payment is made. G. Claims Payable The City records a liability to reflect an actuarial estimate of ultimate uninsured losses for both general liability claims (including property damage claims) and workers' compensation claims. The estimated liability for workers' compensation claims and general liability claims includes "incurred but not reported" (IBNR) claims. There is no fixed payment schedule to pay these liabilities.

CITY OF SARATOGA NOTES TO FINANCIAL STATEMENTS JUNE 30, 2018
53
H. Compensated Absences In the government-wide financial statements, compensated absences are recorded as incurred and the related expenses and liabilities are reported. In the fund financial statements, compensated absences are recorded as expenditures in the years paid, as it is the City's policy to liquidate any unpaid compensated absences at June 30 from future resources, rather than currently available financial resources. Only the amounts which become due at June 30 are reported in the fund financial statements as a liability. I. Long- Term Obligations In the government-wide financial statements, long-term debt and other long-term obligations are reported as liabilities in the applicable governmental activities. Bond premiums and discounts, as well as issuance costs, are deferred and amortized over the life of the bonds using the effective interest method. Bonds payable are reported net of the applicable bond premium or discount. Bond issuance costs are reported as deferred charges and amortized over the term of the related debt. In the fund financial statements, governmental fund types recognize bond premiums and discounts, as well as bond issuance costs, during the current period. The face amount of debt issued is reported as other financial sources. Premiums received on debt issuance are reported as other financing sources while discounts on debt issuance reported as other financing uses. Issuance costs, whether or not withheld from the actual debt proceeds received, are reported as debt service expenditures. J. Fund Balances In February 2009, the Governmental Accounting Standards Board (GASB) issued Statement No. 54, Fund Balance Reporting and Governmental Fund Type Definitions. This standard left unchanged the total amount reported as fund balance, but substantially altered the categories and terminology used to describe its components. Rather than focus on financial resources available for appropriation, the new categories focus on “the extent for which the government is bound to honor constraints in the specific purposes for which amounts in the reserve can be spent”. The components of fund balance are now categorized as follows: “non-spendable fund balance”, resources that are inherently non-spendable from the vantage point of the current period; “restricted fund balance”, resources that are subject to enforceable legal restrictions; “committed fund balance”, resources whose specified use is constrained by limitations the government entity imposes upon itself through formal action at its highest level of decision making and remains binding unless removed in the same manner; “assigned fund balance”, resources that reflects a government’s intended general use of resources, such intent would have to be established at either the highest level of decision making, by a body, or an official designated for that purpose; and “unassigned fund balance”, net resources in excess of what can properly be classified in one of the other four categories. Currently, the City’s fund balance reserves fall into one of the four spendable categories; restricted, committed, assigned, or unassigned fund balance.
CITY OF SARATOGA NOTES TO FINANCIAL STATEMENTS JUNE 30, 2018
54
The City maintains three restricted fund balances constrained by external legal restrictions that can be spent only for the stipulated purposes. Restrictions may effectively be changed or lifted only with the consent of resource providers. These fund balances are:
• Special Assessments Fund Balance – collectively represents year-end fund balances of thirty Landscape & Lighting and Storm Drain districts which use is restricted to the individual district.
• Environmental Services Fund Balance – represents surcharges collected on solid waste bills for use as supplemental funding of Environmental Services program fees for household hazardous waste fees, storm drain, street sweeping, and other pollution mitigation expenses related to integrated waste programs and storm water management. These funds are used to supplement environmental expenditures by using $50,000 per year.
• Debt Service Fund Balance – represents funding collected for and use in the City’s general obligation bond debt.
The committed category, in which fund balance is constrained by limitations that the government imposes upon itself at its highest level of decision making by formal vote on a resolution of the City Council, and remains binding unless removed in the same manner, includes the following:
• Capital Improvement Program (CIP) Fund Balance – represents the collective balance of funding appropriated for specific capital improvement projects. Capital Projects are funded through direct revenues or budgeted transfers for improvement work within the following program funds: Streets, Park & Trail, Facility, or Administrative & Technology Improvements.
• Hillside Stability - funding set aside for use either in emergency repairs or high-cost and non-routine mitigation of hillside or landslide projects.
In the assigned category, fund balance reflects an intended use as established by Council that is neither restricted nor committed. Use of Assigned Fund Balance is approved by formal vote of the Council or official authorized to assign amounts to a specific purpose, either through specific action, fund balance policy, or through budget direction and approval. This category includes the following reserves:
• Future Capital & Efficiency Funding - represents General Fund funding set aside for capital and/or efficiency projects but not yet committed for a specific improvement project.
• Facility Replacement Reserve – represents accumulated funding for the future replacement, major rehabilitation, or new construction of City-owned facilities. This funding is to be used for funding the construction or provide for the services of related debt, but is not yet committed for a specific improvement project.
• Carryforward – represents either prior-year funds designated for one-time operational activities
not yet completed by year-end, or to carryforward prior-year funding for specific activities as directed by Council. Carryover funds are appropriated for use in the following fiscal year.
The Unassigned Fund Balance category represents funding which may be held for specific types of uses or stabilization purposes, but is not yet directed to be used for a specific purpose. Reserve amounts are
CITY OF SARATOGA NOTES TO FINANCIAL STATEMENTS JUNE 30, 2018
55
determined by, and align with, fund policy direction. The General Fund is the only fund that reports a positive unassigned fund balance.
• Working Capital Reserve – Council policy is to maintain $1,000,000 to meet cash flow requirements. As of June 30, 2018, the Working Capital Reserve balance is $1,000,000.
• Fiscal Stabilization Reserve – Council policy is to maintain $2,500,000 for use by Council
direction in case of disasters, emergencies, and economic downturns. As of June 30, 2018, the Fiscal Stabilization Reserve balance is $3,150,000.
• Development Services Reserve– represents reserve funds collected for development services to be used to support multi-year funding levels for zoning administration, inspection services, and development regulation programs during periods where expenditures exceed revenues. In Fiscal Year 2017/18, this reserve was integrated with the Fiscal Stabilization Reserve.
• Compensated Absences Reserve – represents reserve funding for employee payout compensation equal to one-third of the annual liability balance. This funding level is anticipated to be the maximum potential payout in excess of budgeted salary in a fiscal year.
• Other Unassigned Fund Balance – represents funding not yet appropriated or assigned for use.
Council policy is to maintain a minimum of $500,000 in unassigned funds as a buffer for unplanned expenditures or revenue shortfalls.
Flow Assumption / Spending Order Policy – When expenditures are incurred for purposes for which both restricted and unrestricted fund balance is available, the City considers restricted funds to be spent first. When expenditures are incurred for which committed, assigned, or unassigned fund balances are available, the City considers amounts to be spent first out of committed funds, then assigned funds, and finally unassigned funds, as needed, unless the City Council has directed otherwise. K. Net Position In the government-wide financial statements, net position is classified in the following categories:
• Net Investment in Capital Assets – This amount consists of capital assets net of accumulated depreciation and reduced by outstanding debt that attributed to the acquisition, construction, or improvement of the assets. In addition, deferred outflows of resources and deferred inflows of resources that are attributable to the acquisition, construction, or improvement of those assets or related debt also are included in the net investment in capital assets component of net position.
• Restricted Net Position – This amount is restricted by external creditors, grantors, contributors, or laws or regulations of other governments.
• Unrestricted Net Position – This amount is all net position that does not meet the definition of "invested in capital assets, net of related debt" or "restricted net position."
CITY OF SARATOGA NOTES TO FINANCIAL STATEMENTS JUNE 30, 2018
56
L. Use of Restricted/Unrestricted Net Position When an expense is incurred for purposes for which both restricted and unrestricted net positions are available, the City's policy is to apply restricted net position first. M. Property Tax and Special Assessments County tax assessments include secured and unsecured property taxes and special assessments. "Unsecured" refers to taxes on personal property. These tax assessments are secured by liens on the property being taxed. Revenue is recognized in the period for which the tax and assessment is levied. The County of Santa Clara levies, bills and collects property taxes for the City, the County remits the entire amount levied and handles all delinquencies, retaining interest and penalties. Secured and unsecured property taxes are levied on January 1. Secured property tax is due in two installments on November 1 and February 1, and becomes a lien on those dates. It becomes delinquent on December 10 and April 10, respectively. Unsecured property tax is due on July 1 and becomes delinquent on August 31. N. Use of Estimates The preparation of basic financial statements in conformity with generally accepted accounting principles requires management to make estimates and assumptions that affect certain reported amounts and disclosures. Accordingly, actual results could differ from those estimates. O. Subsequent Events Management has reviewed subsequent events and transactions that occurred after the date of the financial statements through the date of issuance. The financial statements include all events or transactions, including estimates, required to be recognized in accordance with generally accepted accounting principles. The following non-recognized events, which had no effect on the financial statements presented in this report, provide evidence about conditions that did not exist at June 30, 2018 but arose subsequent to that date:
a) West Valley Clean Water Program. The Cities of Campbell, Monte Sereno, Saratoga and the Town of Los Gatos, representing the West Valley Communities, joined together to create West Valley Clean Water Program (WVCWP) in 1994. Together they work to control discharge of polluted stormwater into local creeks and the San Francisco Bay. Their mission is to: • Reduce pollutants in stormwater and discharges from storm drains into creeks • Maximize the effectiveness of pollution prevention efforts and work toward repair of
impaired waters

CITY OF SARATOGA NOTES TO FINANCIAL STATEMENTS JUNE 30, 2018
57
• Help the four West Valley Communities meet State Water Resources Control Board & Federal Clean Water Act goals for clean and healthy local water bodies
In late 2017, after notification from West Valley Sanitation District that the District would no longer be involved in or provide fiscal agent services for WVCWP after June 30, 2018, the four agencies decided to establish the operation as a legal entity by entering into a Joint Powers Agreement, consistent with what the agencies had already set up for the West Valley Solid Waste Management oversight activities. With this action, the West Valley Clean Water Program is now overseen by the same Board that includes Council representation from each of the four municipalities. The Clean Water Program’s dedicated program staff and contractors carry out the day-to-day operations. The JPA also collaborates with Santa Clara Valley Urban Runoff Pollution Prevention Program, West Valley Sanitation District, and the Santa Clara County Fire District in their operational activities.
With the loss of West Valley Sanitation functioning as the fiscal agent for the group, the four cities determined one of the cities would take on this role. Effective July 1, 2018, the City of Saratoga began performing these duties, which are limited to payroll and vendor payment functions, in addition to financial reporting. The City does not oversee operational aspects of the WVCWP and is acting only in a fiduciary function
b) Arrowhead Bond. The Arrowhead Community Facilities District encompasses 39 homes located
along the hillside between Rolling Hills Road and Blue Hills Lane, off of Prospect Road. Since 1951, this neighborhood has operated its own private water company (Arrowhead Cooperative Company Inc., aka ACCI). Over the years the number of Arrowhead Cooperative residents and water service meters have increased, to the extent that the water system infrastructure is no longer sufficient for water and fire protection needs. The potential of the fire danger situation prompted the Arrowhead Board to ask the City for assistance to issue a bond for the purpose of financing improvements to the water system. On October 17, 2018, the City Council authorized the issuance of the Saratoga Community Facilities District 2016-1 (Arrowhead Project) Special Tax Bonds, Series 2018, with the issue date of November 1, 2018. Debt service on the Special Tax Bond is payable only from special taxes levied annually on taxable properties within the CFD in the manner set forth in the Rate and Method of Apportionment (RMA) approved by the Council in connection with the formation of the District. The 2018 Bonds will not have any impact on the City’s General Fund, and these special financing district bonds are not assets or liabilities of the City for financial statement purposes.
P. New GASB Pronouncements A. Implemented New Accounting Pronouncements
GASB Statement No. 75, Accounting and Financial Reporting for Postemployment Benefits Other Than Pensions. The provisions in Statement 75 are effective for the fiscal year ended June 30, 2018. The primary objective of this Statement is to improve accounting and financial reporting by state and local governments for postemployment benefits other than pensions (other postemployment benefits or OPEB). It also improves information provided by state and local governmental employers about financial support for OPEB that is provided by other entities. This Statement replaces the requirements of Statements No. 45, Accounting and Financial Reporting by Employers for Postemployment Benefits Other Than Pensions, as amended, and No. 57, OPEB Measurements by

CITY OF SARATOGA NOTES TO FINANCIAL STATEMENTS JUNE 30, 2018
58
Agent Employers and Agent Multiple-Employer Plans, for OPEB. Statement No. 74, Financial Reporting for Postemployment Benefit Plans Other Than Pension Plans, establishes new accounting and financial reporting requirements for OPEB plans. The scope of this Statement addresses accounting and financial reporting for OPEB that is provided to the employees of state and local government employers. This Statement establishes standards for recognizing and measuring liabilities, deferred outflows of resources, deferred inflows of resources, and expense/expenditures. For defined benefit OPEB, this Statement identifies the methods and assumptions that are required to be used to project benefit payments, discount projected benefit payments to their actuarial present value, and attribute that present value to periods of employee service. Note disclosure and required supplementary information requirements about defined benefit OPEB also are addressed. In addition, this Statement details the recognition and disclosure requirements for employers with payables to defined benefit OPEB plans that are administered through trusts that meet the specified criteria and for employers whose employees are provided with defined contribution OPEB. This Statement also addresses certain circumstances in which a non-employer entity provides financial support for OPEB of employees of another entity. In this Statement, distinctions are made regarding the particular requirements depending upon whether the OPEB plans through which the benefits are provided are administered through trusts that meet the following criteria: • Contributions from employers and non-employer contributing entities to the OPEB plan and
earnings on those contributions are irrevocable. • OPEB plan assets are dedicated to providing OPEB to plan members in accordance with the
benefit terms. • OPEB plan assets are legally protected from the creditors of employers, non-employer
contributing entities, the OPEB plan administrator, and the plan members. This statement did not have an impact on the City of Saratoga’s financial statements as the City does not offer other postemployment benefits to its employees. GASB Statement No. 86, Certain Debt Extinguishment Issues. The primary objective of this Statement is to improve consistency in accounting and financial reporting for in-substance defeasance of debt by providing guidance for transactions in which cash and other monetary assets acquired with only existing resources—resources other than the proceeds of refunding debt—are placed in an irrevocable trust for the sole purpose of extinguishing debt. This Statement also improves accounting and financial reporting for prepaid insurance on debt that is extinguished and notes to financial statements for debt that is defeased in substance. The requirements of this Statement are effective for financial statements for periods beginning after June 15, 2017. Earlier application is encouraged. This statement did not have an impact on the City’s financial statements.
B. Upcoming Accounting and Reporting Changes
GASB Statement No. 83, Certain Asset Retirement Obligations. Issue date: 11/16. Effective date: The requirements of this Statement will take effect for financial statements for periods beginning after December 15, 2018. Earlier application is encouraged. This Statement addresses accounting and financial reporting for certain asset retirement obligations (AROs). An ARO is a legally enforceable liability associated with the retirement of a tangible capital asset. A government that has legal
CITY OF SARATOGA NOTES TO FINANCIAL STATEMENTS JUNE 30, 2018
59
obligations to perform future asset retirement activities related to its tangible capital assets should recognize a liability based on the guidance in this Statement. Earlier application is encouraged. The City of Saratoga does not believe that this statement will have a significant impact on the City’s financial statements. GASB Statement No. 84, Fiduciary Activities Issue date: 01/16. Effective date: The requirements of this Statement will take effect for financial statements for periods beginning after December 15, 2018. Earlier application is encouraged. The objective of this Statement is to improve guidance regarding the identification of fiduciary activities for accounting and financial reporting purposes and how those activities should be reported. This Statement establishes criteria for identifying fiduciary activities of all state and local governments. The focus of the criteria generally is on (1) whether a government is controlling the assets of the fiduciary activity and (2) the beneficiaries with whom a fiduciary relationship exists. Separate criteria are included to identify fiduciary component units and postemployment benefit arrangements that are fiduciary activities. This statement does not impact the City of Saratoga’s Fiscal Year 2017/18 financial statements. However, future financial statements will be evaluated for impacts to ensure proper compliance. GASB Statement No. 87, Leases. Issue date: 06/17. Effective date: The requirements of this Statement will take effect for financial statements for periods beginning after December 15, 2019. The primary objective of this Statement is to increase the usefulness of governments’ financial statement by requiring recognition of certain lease assets and liabilities for leases that previously were classified as operating leases and recognized as inflows of resources or outflows of resources based on the payment provisions of the contract. It establishes a single model for lease accounting based on the foundational principle that leases are financings of the right to use an underlying asset. Under this Statement, a lessee is required to recognize a lease liability and an intangible right-to-use lease asset, and a lessor is required to recognize a lease receivable and a deferred inflow of resources, thereby enhancing the relevance and consistency of information about governments’ leasing activities. Earlier application is encouraged. The City of Saratoga is currently evaluating the impact of this Statement on the City of Saratoga’s financial statements and ensuring the required data will be available for disclosure.
GASB Statement No. 88, Certain Disclosures Related to Debt, Including Direct Borrowings and Direct Placements This Statement addresses additional information to be disclosed in the notes to the financial statements regarding debt, including unused lines of credit; assets pledged as collateral for the debt; and terms specified in debt agreements related to significant events of default with finance-related consequences, significant termination events with finance-related consequences, and significant subjective acceleration clauses. The requirements of this Statement are effective for financial statements for periods beginning after June 15, 2018. Earlier application is encouraged. The City of Saratoga does not believe this statement will have a significant impact on the City’s financial statements.
CITY OF SARATOGA NOTES TO FINANCIAL STATEMENTS JUNE 30, 2018
60
GASB Statement No. 89, Accounting for Interest Cost Incurred Before the End of the Construction Period This Statement addresses interest costs incurred before the end of a construction period be recognized as an expense in the period in which the cost is incurred for financial statements prepared using the economic resources measurement focus. As a result, interest cost incurred before the end of a construction period will not be included in the historical cost of a capital asset reported in a business-type activity or enterprise fund. The requirements of this Statement are effective for financial statements for periods beginning after December 15, 2019. Earlier application is encouraged. The City of Saratoga does not believe this statement will have a significant impact on the City’s financial statements.
Q. Pensions For purposes of measuring the net pension liability and deferred outflows/inflows of resources related to pensions, and pension expense, information about the fiduciary net position of the City of Saratoga’s California Public Employees’ Retirement System (CalPERS) plans (Plans) and additions to/deductions from the Plans’ fiduciary net position have been determined on the same basis as they are reported by CalPERS. For this purpose, benefit payments (including refunds of employee contributions) are recognized when due and payable in accordance with the benefit terms. Investments are reported at fair value.

CITY OF SARATOGA NOTES TO FINANCIAL STATEMENTS JUNE 30, 2018
61
NOTE 2 - CASH AND INVESTMENTS The City maintains a cash and investment pool, which includes cash balances and authorized investments of all funds, which the City Treasurer invests to enhance interest earnings. The pooled interest earned is allocated to the funds based on average month-end cash and investment balances in these funds. The City has the following cash and investments at June 30, 2018:
Statement ofNet Position
GovernmentalActivities
Cash and investments 26,187,824$
The City's Cash and Investments at June 30, 2018, in more detail:
Cash and cash equivalents:Petty cash 1,300$ Demand deposits 624,525
Total Cash and Cash Equivalents 625,825
Investments:Local Agency Investment Fund (LAIF) 25,561,999
Total Cash and Investments 26,187,824$
A. Cash Deposits The carrying amounts of the City's cash deposits were $624,525 at June 30, 2018. Bank balances before reconciling items were $759,997 at that date due to deposits in transit and outstanding checks. The total amount was collateralized or insured with securities held by the pledging financial institutions. The California Government Code requires California banks and savings and loan associations to secure the City's cash deposits by pledging securities as collateral. This Code states that collateral pledged in this manner shall have the effect of perfecting a security interest, and places the City ahead of general creditors of the institution. The market value of pledged securities must equal at least 110 percent of the City's cash deposits. California law also allows institutions to secure City deposits by pledging first trust deed mortgage notes that have a value of 150 percent of the City's total cash deposits. The City has waived the collateral requirements for cash deposits which are fully insured to $250,000 by the Federal Deposit Insurance Corporation (FDIC). Other accounts are insured up to $250,000 per custodian within agency. The City follows the practice of pooling cash and investments of all funds, except for funds required to be held by fiscal agents under the provisions of bond indentures. Interest income from cash and investments with fiscal agents is credited directly to the related fund.

CITY OF SARATOGA NOTES TO FINANCIAL STATEMENTS JUNE 30, 2018
62
B. Investments Under the provisions of the City's investment policy, and in accordance with California Government Code, the following investments are authorized:
• Securities of the U.S. Government or its agencies. • Certificates of Deposit (or Time Deposits) placed with commercial banks and/or savings
and loan companies. • Negotiable Certificates of Deposit. • California Local Agency Investment Fund. • Investment-grade obligations of State, local governments or public authorities. • Money market mutual funds. • Passbook savings account and demand deposits.
Investments are recorded at fair value in accordance with GASB Statement No. 72, Fair Value Measurement and Application. Accordingly, the change in fair value of investments is recognized as an increase or decrease to investment assets and investment income. This statement changed the definition of fair value and is effective for periods beginning after June 15, 2015. Fair value is defined as the price that would be received to sell an asset or paid to transfer a liability in an orderly transaction. In determining this amount, three valuation techniques are available:
• Market approach - This approach uses prices generated for identical or similar assets or liabilities. The most common example is an investment in a public security traded in an active exchange such as the NYSE.
• Cost approach - This technique determines the amount required to replace the current asset. This
approach may be ideal for valuing donations of capital assets or historical treasures.
• Income approach - This approach converts future amounts (such as cash flows) into a current discounted amount.
Each of these valuation techniques requires inputs to calculate a fair value. Observable inputs have been maximized in fair value measures, and unobservable inputs have been minimized. GASB 72 established a hierarchy of inputs to the valuation techniques above. This hierarchy has three levels:
• Level 1 inputs are quoted prices in active markets for identical assets or liabilities. • Level 2 inputs are quoted market prices for similar assets or liabilities, quoted prices for
identical or similar assets or liabilities in markets that are not active, or other than quoted prices that are not observable.
• Level 3 inputs are unobservable inputs, such as a property valuation or an appraisal.

CITY OF SARATOGA NOTES TO FINANCIAL STATEMENTS JUNE 30, 2018
63
C. External Investment Pool The City's investments with LAIF at June 30, 2018, include a portion of the pool funds invested in Structured Notes and Asset-Backed Securities. These investments include the following:
• Structured Notes - debt securities (other than asset-backed securities) whose cash flow characteristics (coupon rate, redemption amount, or stated maturity) depend upon one or more indices and/or that have embedded forwards or options.
• Asset-Backed Securities - the bulk of which are mortgage-backed securities, entitle their
purchasers to receive a share of the cash flows from a pool of assets such as principal and interest repayments from a pool of mortgages (such as CMO's) or credit card receivables.
LAIF is overseen by the Local Agency Investment Advisory Board, which consists of five members, in accordance with State statute. The approved investments policy is listed on the LAIF website, located at http://www.treasurer.ca.gov/pmia-laif/ . As of June 30, 2018, the City had $25,609,746 invested in LAIF. In accordance with GASB 72, a fair value factor of 0.998126869 was used to calculate the fair value of the investments in LAIF. GASB Statement No. 72, Fair Measure Value and Application requires investments held primarily for the purpose of income or profit and has a present service capacity based solely on its ability to generate cash or to be sold to generate cash to be measured at their fair value. D. Risk Disclosures Interest Rate Risk Interest rate risk is the risk that changes in market interest rates will adversely affect the fair value of an investment. Generally, the longer the term of an investment’s maturity, the greater the sensitivity to changes in market interest rates. Although the City’s investment policy allows for a broad range of investment instruments with varying terms of maturity, investments are limited to the Local Agency Investment Fund (LAIF) which is managed by the State Treasurer Office and overseen by the Pooled Money Investment Board, the State Treasurer investment committee, and a Local Agency Advisory Board. Included in LAIF’s investment portfolio are U.S. Treasuries, Federal Agency obligations, time deposits, negotiable certificates of deposits, commercial paper, corporate bonds, and security loans. Funds are available for withdrawal on demand and are recorded on an amortized cost basis. At June 30, 2018, these investments had a weighted average maturity of 194 days. The City had the following invested in LAIF:
InvestmentMaturities in Years
Fair Less ThanValue One Year
State of California - Local Agency Investment Fund (LAIF) 25,561,999$ 25,561,999$

CITY OF SARATOGA NOTES TO FINANCIAL STATEMENTS JUNE 30, 2018
64
Credit Risk As of June 30, 2018, the City's investments in external investment pools are unrated. The City only invests in LAIF, therefore has no other policy relating to the credit risk of investments. Custodial Credit Risk For an investment, custodial credit risk is the risk that, in the event of the failure of the counterparty, the City will not be able to recover the value of its investments or collateral securities that are in the possession of an outside party. The City did not hold any securities through investment counterparties at the year ended June 30, 2018. NOTE 3 - FUND FINANCIAL STATEMENTS INTERFUND TRANSACTIONS Transfers In/Out Transfers for the year ended June 30, 2018 were as follows:
Transfer in Transfer out AmountCapital Improvement Fund General Fund 1,872,909$
1,872,909
Capital Improvement Fund Capital Improvement Fund 1,082,000 General Fund Capital Improvement Fund 442,198
1,524,198
Total 3,397,107$
The Capital Improvement Funds received monies from the General Fund adopted in the Budget in the amount of $1,872,909. Of this amount, $1,194,000 was allocated for street, sidewalk, and storm drain repair, $545,000 for park and trail improvements, and $133,909 for various administrative projects. $1,082,942 was transferred between CIP projects and $442,198 was transferred to the General Fund from closed CIP projects during the fiscal year.

CITY OF SARATOGA NOTES TO FINANCIAL STATEMENTS JUNE 30, 2018
65
NOTE 4 - CAPITAL ASSETS
Capital asset activity for the year ended June 30, 2018 is illustrated in the following table:
Primary GovernmentBalance Balance
July 1, 2016 Additions Retirements Reclassifications June 30, 2017Governmental activities:Capital assets, not being depreciated:
Land and land improvements 15,591,925$ -$ -$ -$ 15,591,925 Construction in progress 8,150,210$ 3,326,801$ -$ (4,502,198)$ 6,974,814 Infrastructure:
Street pavement system 51,619,838$ 1,043,832$ -$ -$ 52,663,670 Total capital assets, not being depreciated 75,361,974$ 4,370,633$ -$ (4,502,198)$ 75,230,409
Capital assets, being depreciated:Buildings and structures 25,986,754$ 493,441$ -$ -$ 26,480,195 Machinery and equipment
Governmental funds 1,954,697$ 129,750$ -$ -$ 2,084,447 Internal service funds 1,219,313$ 202,129$ -$ -$ 1,421,441
Infrastructure:Bridges 1,563,654$ -$ -$ -$ 1,563,654 Signs and lights 1,835,143$ 628,533$ -$ -$ 2,463,676 Drainage system 40,100,053$ 40,000$ -$ -$ 40,140,053 Sidewalks 12,372,322$ 2,166,642$ -$ -$ 14,538,964 Total capital assets, being depreciated 85,031,936$ 3,660,495$ -$ -$ 88,692,431
Accumulated depreciation:Buildings and structures (10,067,521)$ (717,358)$ -$ -$ (10,784,879) Machinery and equipment
Governmental funds (1,275,827)$ (90,236)$ -$ -$ (1,366,063) Internal service funds (858,999)$ (151,278)$ -$ -$ (1,010,276)
Infrastructure:Bridges (1,139,760)$ (19,883)$ -$ -$ (1,159,643) Signs and lights (1,245,294)$ (76,297)$ -$ -$ (1,321,592) Drainage system (17,939,375)$ (802,401)$ -$ -$ (18,741,776) Sidewalks (6,713,118)$ (366,083)$ -$ -$ (7,079,201) Total accumulated depreciation (39,239,895)$ (2,223,536)$ -$ -$ (41,463,430) Total capital assets, being depreciated, net 45,792,041$ 1,436,960$ -$ -$ 47,229,001
Governmental activities capital assets, net 121,154,015$ 5,807,593$ -$ (4,502,198)$ 122,459,410 In accordance with GASB Statement No. 34, the City has reported all capital assets including infrastructure in the Government-Wide Statement of Net Position. The City elected to use the "Modified Approach" as defined by GASB Statement No. 34 for infrastructure reporting for its pavement system. As a result, no accumulated depreciation or depreciation expense has been recorded for this system. A more detailed discussion of the "Modified Approach" is presented in the Required Supplementary Information section of this report. All other capital assets including other infrastructure systems were reported using the Basic Approach whereby accumulated depreciation and depreciation expense have been recorded.

CITY OF SARATOGA NOTES TO FINANCIAL STATEMENTS JUNE 30, 2018
66
NOTE 5 – LONG-TERM OBLIGATIONS
A summary of the City's long-term obligations transactions for the year ended June 30, 2018, is presented below:
ClassificationBalance Balance Due Within Due In More
Description July 1, 2017 Additions Retirements June 30, 2018 One Year Than One YearGeneral Obligation Bonds:
2011 Library bonds 9,585,000 - (485,000) 9,100,000 500,000 8,600,000Net original issue premium 328,386 - (21,892) 306,494 21,892 284,602
Compensated absences 671,965 23,158 - 695,123 501,287 193,836 Total 10,585,351$ 23,158$ (506,892)$ 10,101,617$ 1,023,179$ 9,078,438$
General Obligation 2011 Library Bonds - Original Issue $11,995,000 On July 14, 2011, the City issued General Obligation Bonds Series 2011 in the amount of $11,995,000. The bonds were issued to fully refund the General Obligation 2001 Library Bonds. The bonds are payable from and secured by certain property taxes within the City. Interest on the bonds ranges from 2.0 percent to 4.0 percent and is payable on February 1 and August 1 of each year, commencing February 1, 2012. Principal is due annually beginning on August 1, 2012, in amounts ranging from $455,000 to $790,000, with a final payment on August 1, 2031 of $820,000. The bonds maturing on or before August 1, 2021 are not subject to redemption prior to their respective stated maturity dates. Bonds maturing on or after August 1, 2022 are subject to redemption prior to their respective stated maturity dates at the option of the city at the principal amount of the bonds called for redemption, together with interest accrued thereon to the date of redemption, without premium. The annual debt service requirements on these bonds are as follows:
Year Ended Principal Interest Total2019 500,000$ 339,535$ 839,535$ 2020 525,000 319,035 844,035 2021 545,000 297,635 842,635 2022 565,000 278,260 843,260 2023 580,000 258,185 838,185
2024-2028 3,285,000 928,608 4,213,608 2029-2032 3,100,000 254,000 3,354,000
Total 9,100,000$ 2,675,258$ 11,775,258$
Compensated Absences The City's liability for vested and unpaid compensated absences (accrued vacation and sick pay) has been accrued and amounts to $695,123 at June 30, 2018. The compensated absences liability will generally be liquidated through the General Fund.

CITY OF SARATOGA NOTES TO FINANCIAL STATEMENTS JUNE 30, 2018
67
NOTE 6 - RISK MANAGEMENT
The City participates in the following public entity risk pools: PLAN Joint Powers Authority - The City was a member of the Association of Bay Area Government (ABAG) Pooled Liability Assurance Network (PLAN), a self-insurance program pool since it was established in 1986. Following a merge with the Metropolitan Transportation Commission (MTC), ABAG eliminated the risk management pool oversight services to better align their charter of service. ABAG PLAN provided general liability, auto, property insurance, and risk management services to 28 cities within the Bay Area. Following the merger and elimination of ABAG PLAN, the 28 agency members joined together and formed a Joint Powers Authority (JPA) and contracted with Bickmore Risk Services for administrative support. Each member chooses a self-insured retention (SIR) ranging from $25,000 to $250,000, which is reflected in premium rates. The insurance pool pays claims up to a limit of $5 million. To extend this protection, the association purchases another $25 million of excess insurance coverage for a total of $30 million per occurrence limit. Coverage provides protection for Bodily Injury, Property Damage, Personal Injury, and Public Officials Errors and Omissions claims, and minimizes the City’s exposure to losses as a result of City policy or actions. The City’s annual premium allows for a self-coverage retention level of $25,000 per occurrence. The City continues to submit claim information to a third party administrator (TPA), York Insurance Services Group. York’s staff follows up with other parties and insurance firms, acting as the City’s insurance agent. In addition to insurance, PLAN JPA provides a variety of risk management services, including policy guidance to effectively identify, analyze, and minimize risks, guidance and training to promote best practices, and grant incentives for safety programs. PLAN Workers' Compensation Shared Agency Risk Pool (SHARP) – covers workers' compensation coverage up to $250,000 and excess coverage provides an employer liability limit of $5 million per occurrence, and workers’ compensation per occurrence limit to $100 million. The City has no deductible for these claims. During the fiscal year ended June 30, 2018, the City contributed $141,633 for current year coverage. The City's contribution equals the ratio of the City's payroll to the total payrolls of all entities participating in the same layer of each program, in each program year. Actual surpluses or losses are shared according to a formula developed from overall loss costs and spread to member entities on a percentage basis after a retrospective rating. There have been no significant reductions of insurance settlements that exceeded insurance coverage for the past three years.

CITY OF SARATOGA NOTES TO FINANCIAL STATEMENTS JUNE 30, 2018
68
The workers’ compensation and general liability claims payable of $76,001 reported at June 30, 2018, is based on the requirements of GASB Statement No. 10, which requires that a liability for claims be reported if information prior to the issuance of the basic financial statements indicates that it is probable that a liability has incurred at the date of the basic financial statements and the amount of the loss can be reasonably estimated. Changes in the claims payable amounts were as follows: The General Fund has been used in the prior years to liquidate the liability for claims and judgments.
Year Ended Year EndedJune 30, 2018 June 30, 2017
Claims payable, beginning of year 41,003$ 58,963$ Fiscal year claims and changes in estimates 34,998 (17,960) Claims payments - - Claims payable, end of year 76,001$ 41,003$
Each risk pool is governed by a board consisting of representatives from member municipalities. The board controls the operations of each risk pool, including selection of management and approval of operating budgets, independent of any influence by member municipalities beyond their representation on the Board. Audited financial information for each risk pool may be obtained from Bickmore at 1750 Creekside Oaks Dr., Ste. 200, Sacramento, California 95833. NOTE 7 - RETIREMENT PLANS Defined Benefit Pension Plan Plan Description – All CalPERS qualified employees are eligible to participate in the City’s Miscellaneous Employee Pension Plan (the Plan), a cost-sharing multiple-employer defined benefit pension plan administered by the California Public Employees’ Retirement System (CalPERS). CalPERS act as a common investment and administrative agent for participating public entities within the State of California. Benefit provisions and all other requirements are established by State statute and City ordinance. CalPERS issues publicly available reports that include a full description of the pension plans regarding benefit provisions, assumptions and membership information that can be found on the CalPERS website or copies of these reports may be obtained from their Executive Office located at 400 P Street, Sacramento, California 95811.

CITY OF SARATOGA NOTES TO FINANCIAL STATEMENTS JUNE 30, 2018
69
Benefits Provided – CalPERS provides service retirement and disability benefits, annual cost-of-living adjustments, and death benefits to plan members who must be public employees and beneficiaries. Benefits are based on years of credited service, equal to one year of full time employment. Members with five years of total service are eligible to retire at age 55. All members are eligible for non-duty disability benefits after 10 years of service. Death benefits include the 1959 Survivor Benefit and the Optional Settlement 2 Death Benefit. The cost of living adjustments for the Plan are applied as specified by the Public Employee’s Retirement Law. The Plan’s provisions and benefits in effect at June 30, 2018, are summarized as follows:
New EmployeesTier 1 Tier 2 PEPRA
Hire DateHired before May 12, 2012
Hired on or after May 12, 2012
Hired on or after January 1, 2013
Benefit formula 2% @ 55 2% @ 60 2% @ 62Benefit vesting schedule 5 Years 5 Years 5 YearsBenefit payments Monthly for Life Monthly for Life Monthly for LifeRetirement age 55 60 62Monthly benefits as a % of eligible compensation 2.0% 2.0% 2.0%Required employee contribution rates 8% 7% 6.5%Required employer contribution rates 9.60% 7.81% 6.93%
Classic Employees
Employees Covered – At June 30, 2018, the following employees were covered by the benefit terms for the Plan:
MiscellaneousActive 59 Transferred 42 Separated 35 Retired 118
Total 254 Contributions – Section 20814(c) of California Public Employees’ Retirement Law requires that the employer contribution rates for all public employers are determined on an annual basis by an actuary and shall be effective on the July 1 following notice of a change in the rate. Funding contributions for the Plan are determined annually on an actuarial basis as of June 30 by CalPERS. The actuarially determined rate is the estimated amount necessary to finance the costs of benefits earned by employees during the year, with an additional amount to finance any unfunded accrued liability. The City is required to contribute the difference between the actuarially determined rate and the contribution rate of employees. For the year ended June 30, 2018, the employer contributions, including the UAL payment of $750,000, recognized as part of pension expense for the Plan were as follows:
MiscellaneousContributions - employer $ 1,289,450

CITY OF SARATOGA NOTES TO FINANCIAL STATEMENTS JUNE 30, 2018
70
Pension Liabilities, Pension Expenses and Deferred Outflows/Inflows of Resources Related to Pensions -As of June 30, 2018, the City reported net pension liabilities for its proportionate share of the net pension liability of the Plan as follows:
Miscellaneous $ 7,556,748
Proportionate Share of Net Pension
Liability/(Asset)
The City’s net pension liability for the Plan is measured as the proportionate share of the Plan’s net pension liability. The net pension liability of the Plan is measured at June 30, 2018, and the total pension liability for the plan used to calculate the net pension liability was determined by an actuarial valuation as of June 30, 2017 rolled forward to June 30, 2018 using standard update procedures. The City’s proportion of the net pension liability was based on a projection of the City’s long-term share of the contributions to the pension plan relative to the projected contributions of all participating employers, actuarially determined. The City’s proportionate share of the net pension liability for the Plan as of June 30, 2017 and 2018 was as follows:
MiscellaneousProportion - June 30, 2017 0.18238%Proportion - June 30, 2018 0.19170%Change - Increase/(Decrease) 0.00932%
For the year ended June 30, 2018, the City recognized pension expense of $1,189,677. At June 30, 2018, the City reported deferred outflows of resources and deferred inflows of resources related to pensions from the following sources:
Deferred Outflows of Resources
Deferred Inflows of Resources
Changes of Assumptions 1,899,044$ -$ Differences between Expected and Actual Experience - 220,810 Differences between Projected and Actual Investment Earnings 464,937 - Differences between Employer's Contributions and Proportionate Share of Contributions 57,947 - Change in Employer's Proportion - 1,302,108 Pension Contributions Made Subsequent to Measurement Date 1,289,450 - Total 3,711,378$ 1,522,918$
The City reported $1,289,450 as deferred outflows of resources related to contributions subsequent to the measurement date that will be recognized as a reduction of the net pension liability in the year ended June 30, 2018.

CITY OF SARATOGA NOTES TO FINANCIAL STATEMENTS JUNE 30, 2018
71
Other amounts reported as deferred outflows and deferred inflows of resources related to pensions will be recognized as pension expense as follows:
(201,841)$ 879,023 497,871
(276,042) - -
899,011$ ThereafterTotal
Deferred Outflows/
(Inflows) of Resources
20192020202120222023
Fiscal Year Ending June 30:
Actuarial Assumptions – The total pension liabilities in the June 30, 2016 actuarial valuations were determined using the following actuarial assumptions:
Valuation Date June 30, 2016Measurement Date June 30, 2017Actuarial Cost Method Entry-Age Normal
Cost MethodActuarial Assumptions:Discount Rate 7.15%Inflation 2.75%Payroll Growth 3.00%Projected Salary Increase (1)Investment Rate of Return 7.5% (2)Mortality (3)
(1) Varies by age and service(2) Net of pension plan investment expenses, including inflation(3) Derived using CalPERS' membership data for all funds

CITY OF SARATOGA NOTES TO FINANCIAL STATEMENTS JUNE 30, 2018
72
The underlying mortality assumptions and all other actuarial assumptions used in the June 30, 2016 valuation were based on the results of a January 2014 Actuarial Experience Study for the period 1997 to 2011. Further details of the Experience Study can be found on the CalPERS website. Discount Rate – The discount rate used to measure the total pension liability was 7.15 percent for the Plan. To determine whether the municipal bond rate should be used in the calculation of a discount rate for the Plan, CalPERS stress tested plans that would most likely result in a discount rate that would be different from the actuarially assumed discount rate. Based on the testing, none of the tested plans ran out of assets. Therefore, the current 7.15 percent discount rate is adequate and the use of the municipal bond rate calculation is not necessary. The long term expected discount rate of 7.15 percent will be applied to all plan in the Public Employees’ Retirement Fund (PERF). The stress test results are presented in the detailed report called “GASB Crossover Testing Report” that can be obtained from the CalPERS website. According to Paragraph 30 of Statement 68, the long-term discount rate should be determined without reduction for pension plan administrative expense. The 7.15 percent investment return assumption used in this accounting valuation is net of administrative expenses. Administrative expenses are assumed to be 15 basis points. Using this lower discount rate has resulted in a slightly higher Total Pension Liability and Net Pension Liability. CalPERS checked the materiality threshold for the difference in calculation and did not find it to be a material difference. In determining the long-term expected rate of return, CalPERS took into account both short-term and long-term market return expectations as well as the expected pension fund cash flows. Using historical returns of all the funds’ asset classes, expected compound returns were calculated over the short-term (first 10 years) and the long-term (11-60 years) using a building-block approach. Using the expected nominal returns for both short-term and long-term, the present value of benefits was calculated for each fund. The expected rate of return was set by calculating the single equivalent expected return that arrived at the same present value of benefits for cash flows as the one calculated using both short-term and long-term returns. The expected rate of return was then set equivalent to the single equivalent rate calculated above and rounded down to the nearest one quarter of one percent.
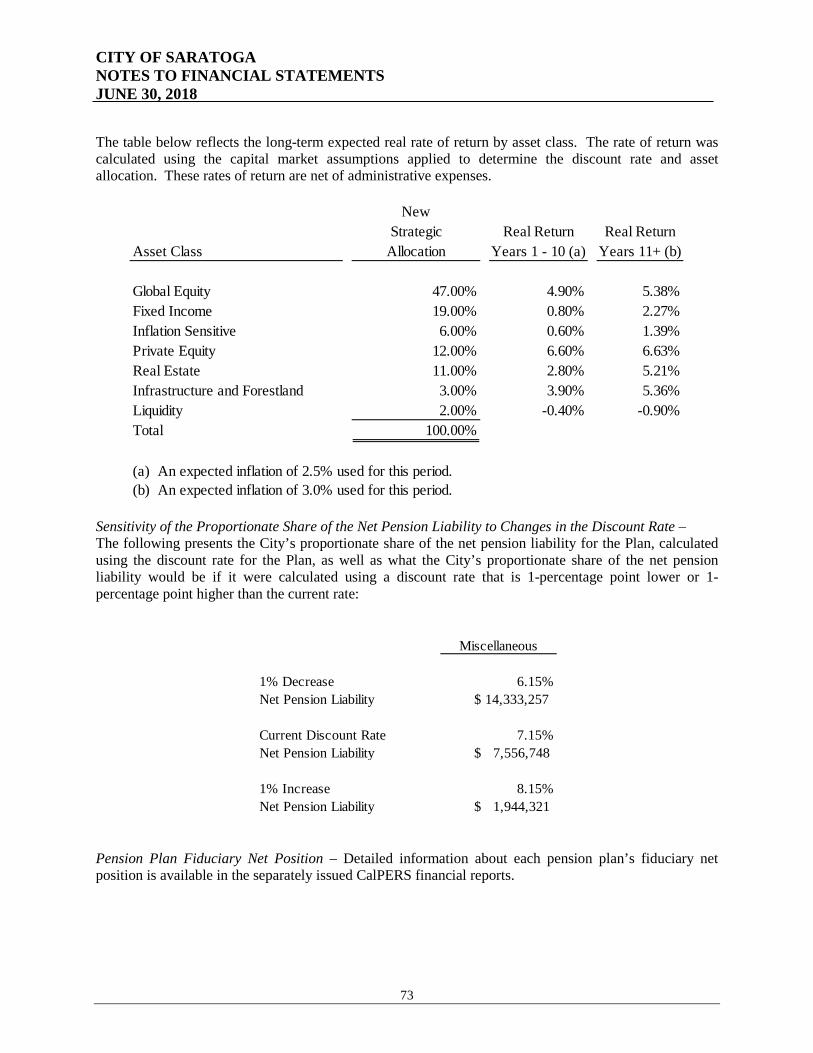
CITY OF SARATOGA NOTES TO FINANCIAL STATEMENTS JUNE 30, 2018
73
The table below reflects the long-term expected real rate of return by asset class. The rate of return was calculated using the capital market assumptions applied to determine the discount rate and asset allocation. These rates of return are net of administrative expenses.
NewStrategic Real Return Real Return
Asset Class Allocation Years 1 - 10 (a) Years 11+ (b)
Global Equity 47.00% 4.90% 5.38%Fixed Income 19.00% 0.80% 2.27%Inflation Sensitive 6.00% 0.60% 1.39%Private Equity 12.00% 6.60% 6.63%Real Estate 11.00% 2.80% 5.21%Infrastructure and Forestland 3.00% 3.90% 5.36%Liquidity 2.00% -0.40% -0.90%Total 100.00%
(a) An expected inflation of 2.5% used for this period.(b) An expected inflation of 3.0% used for this period.
Sensitivity of the Proportionate Share of the Net Pension Liability to Changes in the Discount Rate – The following presents the City’s proportionate share of the net pension liability for the Plan, calculated using the discount rate for the Plan, as well as what the City’s proportionate share of the net pension liability would be if it were calculated using a discount rate that is 1-percentage point lower or 1-percentage point higher than the current rate:
Miscellaneous
1% Decrease 6.15%Net Pension Liability $ 14,333,257
Current Discount Rate 7.15%Net Pension Liability $ 7,556,748
1% Increase 8.15%Net Pension Liability $ 1,944,321
Pension Plan Fiduciary Net Position – Detailed information about each pension plan’s fiduciary net position is available in the separately issued CalPERS financial reports.
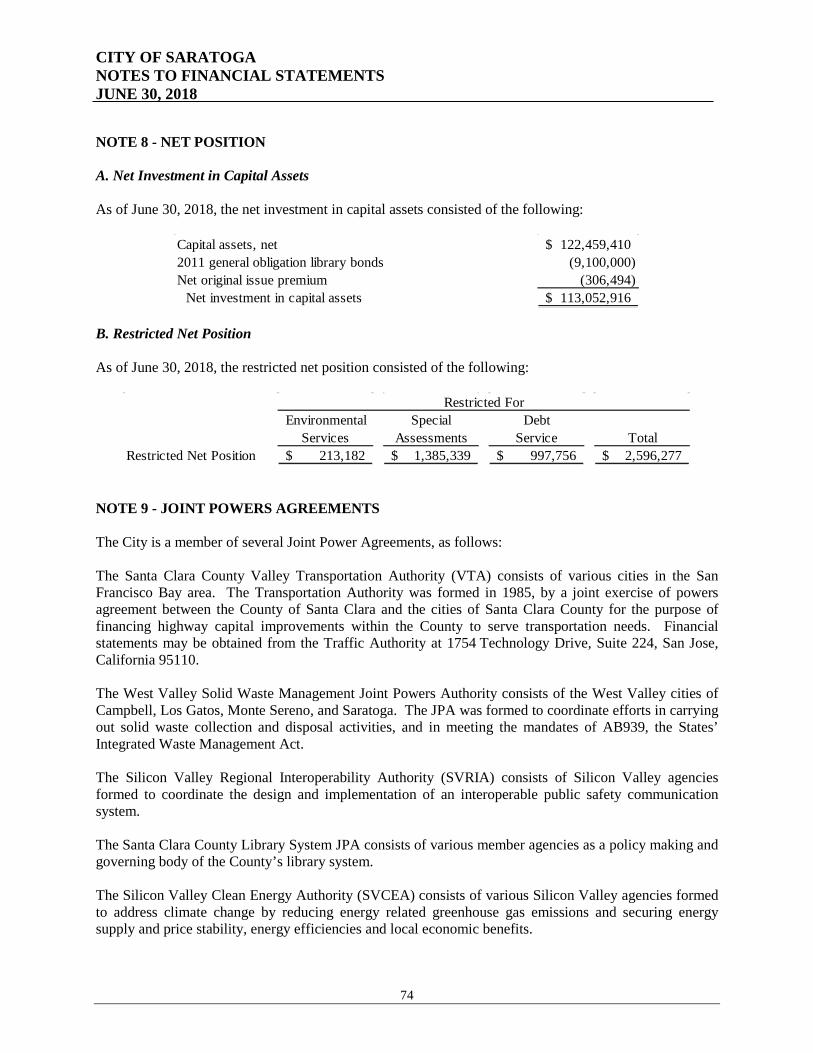
CITY OF SARATOGA NOTES TO FINANCIAL STATEMENTS JUNE 30, 2018
74
NOTE 8 - NET POSITION A. Net Investment in Capital Assets As of June 30, 2018, the net investment in capital assets consisted of the following:
Capital assets, net 122,459,410$ 2011 general obligation library bonds (9,100,000) Net original issue premium (306,494)
Net investment in capital assets 113,052,916$ B. Restricted Net Position As of June 30, 2018, the restricted net position consisted of the following:
Environmental Special DebtServices Assessments Service Total
Restricted Net Position 213,182$ 1,385,339$ 997,756$ 2,596,277$
Restricted For
NOTE 9 - JOINT POWERS AGREEMENTS The City is a member of several Joint Power Agreements, as follows: The Santa Clara County Valley Transportation Authority (VTA) consists of various cities in the San Francisco Bay area. The Transportation Authority was formed in 1985, by a joint exercise of powers agreement between the County of Santa Clara and the cities of Santa Clara County for the purpose of financing highway capital improvements within the County to serve transportation needs. Financial statements may be obtained from the Traffic Authority at 1754 Technology Drive, Suite 224, San Jose, California 95110. The West Valley Solid Waste Management Joint Powers Authority consists of the West Valley cities of Campbell, Los Gatos, Monte Sereno, and Saratoga. The JPA was formed to coordinate efforts in carrying out solid waste collection and disposal activities, and in meeting the mandates of AB939, the States’ Integrated Waste Management Act. The Silicon Valley Regional Interoperability Authority (SVRIA) consists of Silicon Valley agencies formed to coordinate the design and implementation of an interoperable public safety communication system. The Santa Clara County Library System JPA consists of various member agencies as a policy making and governing body of the County’s library system. The Silicon Valley Clean Energy Authority (SVCEA) consists of various Silicon Valley agencies formed to address climate change by reducing energy related greenhouse gas emissions and securing energy supply and price stability, energy efficiencies and local economic benefits.
CITY OF SARATOGA NOTES TO FINANCIAL STATEMENTS JUNE 30, 2018
75
These JPA's are governed by boards consisting of representatives from their members. The boards control the operations of each JPA, including selection of management and approval of operating budgets, independent of any influence by its members beyond their representation on the board. NOTE 10 - EXCESS EXPENDITURES OVER APPROPRIATIONS There was no excess of expenditures over appropriations in individual funds during Fiscal Year 2017/18. NOTE 11 - COMMITMENTS AND CONTINGENCIES A. Lawsuits The City is presently involved in certain matters of litigation that have arisen in the normal course of conducting City business. City management believes, based upon consultation with the City Attorney, that these cases, in the aggregate, are not expected to result in a material adverse financial impact on the City. Additionally, City management believes that the City's insurance programs are sufficient to cover any potential losses should an unfavorable outcome materialize. B. Federal and State Grant Programs The City participates in Federal and State grant programs. These programs are audited by the City's independent accountants in accordance with the provisions of the Federal Single Audit Act Amendments of 1996 and applicable State requirements. For Federal programs, the City reached the level of qualifying cost during the current fiscal year, so a single audit was required. Expenditures which may be disallowed, if any, by the granting agencies, cannot be determined at this time. The City expects such amounts, if any, to be immaterial. C. Commitments
The City had several outstanding contracts or planned construction projects as of June 30, 2018 totaling $4.6 million. Of this amount, $3.4 million was committed to Wattis Construction Company for the Prospect Road Improvement Project. In the opinion of City management, there were no additional outstanding matters that would have a significant effect on the financial position of the funds of the City as of June 30, 2018. NOTE 12 – TAX ABATEMENT DISCLOSURES A. Williamson Act and Mills Act The City enters into property tax abatement agreements with local property owners under the California Land Conservation Act of 1965, commonly referred to as the Williamson Act. Under the Act, local entities may lower property tax assessments on private parcels that have been restricted to agricultural or open space land use.
CITY OF SARATOGA NOTES TO FINANCIAL STATEMENTS JUNE 30, 2018
76
The Mills Act is a state law allowing cities to enter into contracts with the owners of historic structures. Such contracts require a reduction of property taxes in exchange for the continued preservation of the property. Property taxes are recalculated using a formula in the Mills Act and Revenue and Taxation Code.
For the fiscal year ended June 30, 2018, the City abated property taxes totaling $73,794 under these programs.

77
REQUIRED SUPPLEMENTARY INFORMATION

CITY OF SARATOGA REQUIRED SUPPLEMENTARY INFORMATION FOR THE YEAR ENDED JUNE 30, 2018
78
NOTE 1 - BUDGETARY INFORMATION The following is the budget comparison schedules for General Fund.
Variance withFinal Budget
Budgeted Amounts Actual PositiveOriginal Final Amounts (Negative)
REVENUES:Property taxes 12,110,800$ 12,110,800$ 12,963,531$ 852,731$ Sales taxes 1,150,000 1,150,000 1,124,647 (25,353) Other local taxes 820,000 820,000 960,363 140,363 Licenses & permits 1,389,700 1,389,700 2,204,627 814,927 Fines & forfeitures 138,750 138,750 110,190 (28,560) Intergovernmental - Fed - - 1,865 1,865 Intergovernmental - State 337,000 337,000 459,016 122,016 Intergovernmental - Other 35,000 35,000 96,144 61,144 Franchise fees 2,165,000 2,165,000 2,166,165 1,165 Use of money & property 611,302 611,302 716,090 104,788 Other revenue 2,020,221 2,020,221 2,167,470 147,249
Total revenues 20,777,773 20,777,773 22,970,108 2,192,335
EXPENDITURES:Current:
General and intergovernmental services 5,168,807 5,072,257 4,585,147 487,110 Public safety 5,666,241 5,671,061 5,705,157 (34,096) Public works 5,652,424 5,703,339 5,560,509 142,830 Community services 1,491,777 1,497,947 1,292,453 205,494 Community development services 2,459,577 2,462,142 2,246,525 215,617 Capital outlay - - - -
Total expenditures 20,438,825 20,406,745 19,389,791 1,016,954 REVENUES OVER
(UNDER) EXPENDITURES 338,948 371,028 3,580,317 3,209,289
OTHER FINANCING SOURCES (USES):Transfers in - 32,000 442,198 410,198 Transfers out (1,530,000) (1,872,909) (1,872,909) -
Total other financing sources (uses) (1,530,000) (1,840,909) (1,430,711) 410,198
Net change in fund balances (1,191,052)$ (1,469,881)$ 2,149,606 3,619,487$ FUND BALANCES:Beginning of year 10,984,311 End of year 13,133,917$

CITY OF SARATOGA REQUIRED SUPPLEMENTARY INFORMATION FOR THE YEAR ENDED JUNE 30, 2018
79
Through the budget, the City Council sets the direction of the City, allocates its resources and establishes its priorities. The Annual Operating and Capital Budgets assure the efficient and effective uses of the City's economic resources, as well as establishing that the highest priority objectives are accomplished. The annual budgets are adopted for the period of July 1 to June 30, and prepared to accurately and openly communicate service and infrastructure priorities to the community, businesses, vendors, employees, and other public agencies. The Annual Operating Budget is developed on a program basis for all funds with fund level authority. It establishes the foundation of effective financial planning by providing resource planning, performance measures and controls that permit the evaluation and adjustment of the City's performance. The City adopts an annual budget for the capital projects as part of adopting the five-year Capital Improvement Plan. The annual capital budget is adopted on a project-by-project basis. The City follows these procedures in establishing the budgetary data reflected in the basic financial statements:
a. The City Manager submits to the City Council a proposed operating budget for the fiscal year commencing the following July 1. The operating and capital budgets include proposed expenditures and the means of financing them.
b. Public hearings are conducted to obtain taxpayer comments.
c. The budgets are legally enacted through the passage of a resolution.
d. For the Operating Budget, the City Manager may authorize transfers of budget amounts within a
fund. However, any revisions that increase the total budgeted expenditures of any fund must be approved by the City Council. Expenditures may not legally exceed budgeted appropriations at the fund level without City Council approval.
e. As Capital Projects are adopted on a project basis, the City Council must approve increases or
decreases of budgeted amounts or changes in project scope. Upon project completion, immaterial amounts are transferred to ongoing maintenance projects within the capital program. If remaining project funds are material, the project balance is brought back to Council for approval to transfer.
f. Formal budgetary integration in the form of legally adopted budgets is employed as a management control device for all funds. Budgets are adopted on a basis consistent with generally accepted accounting principles. Budgeted expenditures reported are as amended by supplemental appropriations of the City Council.
Encumbrance accounting, under which purchase orders, contracts, and other commitments for the expenditure of monies are recorded in order to reserve that portion of the applicable appropriation, is employed as an extension of formal budgetary integration in the General, Special Revenue, Internal Service, and Capital funds. Unexpended and unencumbered appropriations automatically lapse at the end of the fiscal year.
CITY OF SARATOGA REQUIRED SUPPLEMENTARY INFORMATION FOR THE YEAR ENDED JUNE 30, 2018
80
NOTE 2 - MODIFIED APPROACH FOR CITY STREETS INFRASTRUCTURE CAPITAL ASSETS In accordance with GASB Statement No. 34, the City is required to account for and report infrastructure capital assets. The City defines infrastructure as the basic physical assets that allow the City to function and those resources utilized primarily by the public which provide future economic benefits for a minimum of two years. Infrastructure can be defined as assets that are immovable and of value only to the government. Major infrastructure includes the street system, park and recreation lands and improvements; storm water conveyance and drainage systems, and buildings combined with site amenities such as parking and landscaping areas used by the City in the conduct of its business. Each major infrastructure system can be divided into subsystems. For example, the street system can be divided into concrete and asphalt pavements, concrete curb and gutters, sidewalks, medians, streetlights, traffic control devices (signs, signals and pavement markings), landscaping and land. Subsystem detail is not presented in these basic financial statements; however, the City maintains detailed information on these subsystems. The City has elected to use the "Modified Approach" as defined by GASB Statement No. 34 for infrastructure reporting for its Streets Pavement System. Under GASB Statement No. 34, eligible infrastructure capital assets are not required to be depreciated under the following requirements:
• The City manages the eligible infrastructure capital assets using an asset management system with characteristics of (1) an up-to-date inventory; (2) perform condition assessments and summarize the results using a measurement scale; and (3) estimate annual amount to maintain and preserve at the established condition assessment level.
• The City documents that the eligible infrastructure capital assets are being preserved
approximately at or above the established and disclosed condition assessment level. The City commissioned a physical assessment of the streets conditions with the final report received April 15, 2017. The study assists the City by providing current inspection data used to evaluate current pavement condition. This helps to maintain a City-defined desirable level of pavement performance while optimizing the expenditure of limited fiscal resources. The entire pavement network within the City is composed of approximately 141.1 centerline miles of paved surfaces. The City’s road system can be grouped by function class and includes 24.2 centerline miles of arterial, 23.2 centerline miles of collector, and 93.7 miles as residential. To determine the City’s street condition, a visual survey of all pavement segments is conducted to assess the existing surface condition of each of the individual pavement segments. Upon completion of the study, a Pavement Condition Index (PCI) is calculated for each segment in the City's pavement network to reflect the overall pavement condition. Rating between 0 and 100, a PCI of 0 would correspond to a badly deteriorated pavement with virtually no remaining life. A PCI of 100 would correspond to a pavement with proper engineering design and construction at the beginning of its life cycle.

CITY OF SARATOGA REQUIRED SUPPLEMENTARY INFORMATION FOR THE YEAR ENDED JUNE 30, 2018
81
The following conditions were defined:
Condition RatingExcellent 80 - 100Very Good 70 - 79Good 50 - 69Poor 25 - 49Very Poor 0 - 24
The City's policy is to achieve an average rating of 70 for all streets, which is a very good rating. This rating allows minor cracking and raveling of the pavement along with minor roughness that could be noticeable to drivers traveling at the posted speeds. As of May 31, 2018, the City's street system was rated at an estimated PCI index of 68 on average with the detail condition as follows:
Percent ofCondition Streets
Very Good 59%Good 21%Poor 10%Very Poor 10%
The City expended $3,932,377 on street maintenance for the year ended June 30, 2018. These projects include resurfacing, safety improvements, sidewalks, curbs and gutters, storm drain improvements, beautification projects, and various other routine maintenance projects help to delay deterioration and beautify the City’s roadway system. Council has established a goal for a minimum of $2,000,000 be budgeted for the CIP Streets program on an annual basis. $12,795,856 is budgeted for various projects in the five-year CIP cycle beginning Fiscal Year 2018/19. A schedule of estimated annual amount calculated to maintain and preserve its streets at the current level compared to actual expenditures for street maintenance for the last ten years is presented below:
Funded ByFiscal Actual Other Gas Tax Total PCIYear Budget Expenditures Sources Fund Funded Index
2008/09 2,680,504 1,574,485 1,148,650 425,835 1,574,485 702009/10 1,811,130 771,386 575,710 195,676 771,386 702010/11 4,770,782 1,847,221 1,449,686 397,535 1,847,221 762011/12 4,683,078 2,856,603 1,622,401 1,234,202 2,856,603 762012/13 4,826,265 2,417,444 1,660,028 757,416 2,417,444 762013/14 11,191,684 2,079,413 1,651,156 428,256 2,079,413 692014/15 10,799,852 2,261,620 1,275,681 985,939 2,261,620 692015/16 11,176,888 1,397,415 1,001,104 396,311 1,397,415 692016/17 12,006,796 2,772,821 1,927,723 845,098 2,772,821 712017/18 12,732,676 3,932,377 3,767,550 164,828 3,932,377 68
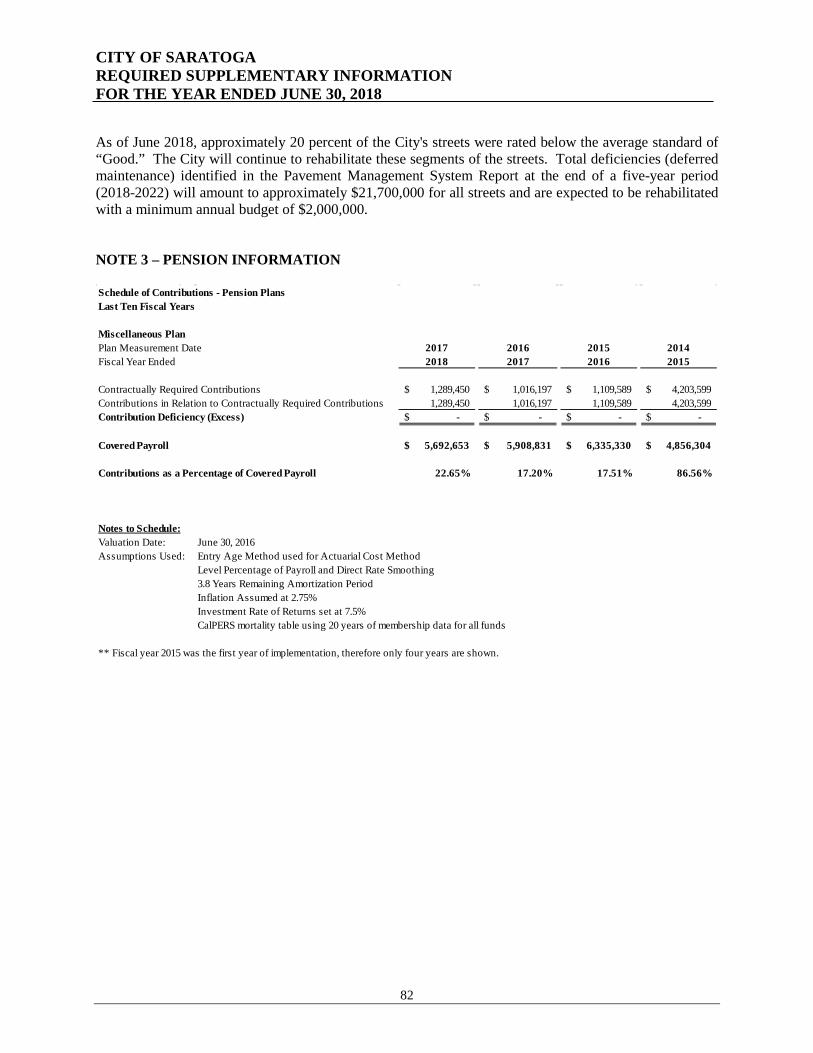
CITY OF SARATOGA REQUIRED SUPPLEMENTARY INFORMATION FOR THE YEAR ENDED JUNE 30, 2018
82
As of June 2018, approximately 20 percent of the City's streets were rated below the average standard of “Good.” The City will continue to rehabilitate these segments of the streets. Total deficiencies (deferred maintenance) identified in the Pavement Management System Report at the end of a five-year period (2018-2022) will amount to approximately $21,700,000 for all streets and are expected to be rehabilitated with a minimum annual budget of $2,000,000. NOTE 3 – PENSION INFORMATION Schedule of Contributions - Pension PlansLast Ten Fiscal Years
Miscellaneous PlanPlan Measurement Date 2017 2016 2015 2014Fiscal Year Ended 2018 2017 2016 2015 Contractually Required Contributions 1,289,450$ 1,016,197$ 1,109,589$ 4,203,599$ Contributions in Relation to Contractually Required Contributions 1,289,450 1,016,197 1,109,589 4,203,599 Contribution Deficiency (Excess) -$ -$ -$ -$
Covered Payroll 5,692,653$ 5,908,831$ 6,335,330$ 4,856,304$
Contributions as a Percentage of Covered Payroll 22.65% 17.20% 17.51% 86.56%
Notes to Schedule:Valuation Date: June 30, 2016Assumptions Used: Entry Age Method used for Actuarial Cost Method
Level Percentage of Payroll and Direct Rate Smoothing3.8 Years Remaining Amortization PeriodInflation Assumed at 2.75%Investment Rate of Returns set at 7.5%CalPERS mortality table using 20 years of membership data for all funds
** Fiscal year 2015 was the first year of implementation, therefore only four years are shown.

CITY OF SARATOGA REQUIRED SUPPLEMENTARY INFORMATION FOR THE YEAR ENDED JUNE 30, 2018
83
Schedule of Proportionate Share of Net Pension LiabilityLast 10 Fiscal Years
Miscellaneous PlanPlan Measurement Date 2017 2016 2015 2014Fiscal Year Ended 2018 2017 2016 2015 Proportion of Net Pension Liability 0.19170% 0.18238% 0.15551% 0.28104%Proportionate Share of Net Pension Liability 7,556,748$ 6,335,606$ 4,266,268$ 6,945,916$ Covered Payroll 5,908,831$ 6,335,330$ 4,856,304$ 4,714,858$
Proportionate Share of NPL as a % of Covered Payroll 127.89% 100.00% 87.85% 147.32%
Plan's Fiduciary Net Position as a % of the TPL 84.66% 85.60% 90.63% 572.20%
** Fiscal year 2015 was the first year of implementation, therefore only four years are shown.

84
This page is intentionally blank

85
SUPPLEMENTARY INFORMATION
86
NONMAJOR GOVERNMENTAL FUNDS Special Revenue Funds Landscape & Lighting District and Storm Drain Funds – These funds account for revenues and expenditures associated with maintaining the City’s 30 Landscape and Lighting and Storm Drain districts which were approved by consent of property owners living along or within the boundaries of the Districts. Debt Service Fund Library Bond - Santa Clara County general obligation bond tax revenues are accumulated in this fund to pay annual principal and interest payments on the refunded 2011 Library Improvement Bond.

CITY OF SARATOGA COMBINING BALANCE SHEETS NONMAJOR GOVERNMENTAL FUNDS JUNE 30, 2018
87
Special
Revenue Debt ServiceLighting and TotalLandscaping OtherAssessment Library Governmental
District Bond FundsASSETSCash and investments 1,419,963$ 994,702$ 2,414,665$ Receivables:
Accounts 756 3,054 3,810 Total assets 1,420,719$ 997,756$ 2,418,475$
LIABILITIES AND FUND BALANCESLiabilities:
Accounts payable 35,380$ -$ 35,380$ Total liabilities 35,380 - 35,380
Fund Balances:Restricted:
Special revenue funds 1,385,339 - 1,385,339 Debt service - 997,756 997,756 Total fund balances 1,385,339 997,756 2,383,095 Total liabilities and fund balances 1,420,719$ 997,756$ 2,418,475$

CITY OF SARATOGA COMBINING STATEMENT OF REVENUES, EXPENDITURES AND CHANGES IN FUND BALANCE NONMAJOR GOVERNMENTAL FUNDS FOR THE YEAR ENDED JUNE 30, 2018
88
Special DebtRevenue Service
Lighting and TotalLandscaping OtherAssessment Library Governmental
District Bond FundsREVENUES:Property taxes 283,499$ -$ 283,499$ Special assessment 455,968 876,771 1,332,739 Use of money and property 17,480 8,398 25,878 Other revenue (2) - (2)
Total revenues 756,945 885,169 1,642,114
EXPENDITURES:Current:General and ingov't services
Public works 524,475 - 524,475 Debt service:
Principal - 485,000 485,000 Interest and fiscal charges - 361,735 361,735
Total expenditures 524,475 846,735 1,371,210
REVENUES OVER(UNDER) EXPENDITURES 232,470 38,434 270,904
OTHER FINANCING SOURCES (USES):Transfers in - - - Transfers out - - -
Total other financing sources (uses) - - -
Net change in fund balances 232,470 38,434 270,904 FUND BALANCES:Beginning of year 1,152,870 959,322 2,112,191 End of year 1,385,339$ 997,756$ 2,383,095$

CITY OF SARATOGA COMBINING STATEMENT OF REVENUES, EXPENDITURES AND CHANGES IN FUND BALANCE - BUDGET AND ACTUAL CAPITAL IMPROVEMENT FOR THE YEAR ENDED JUNE 30, 2018
89
Variance withFinal Budget
Budgeted Amounts Actual PositiveOriginal Final Amounts (Negative)
REVENUES:Licenses & permits 451,300$ 451,300$ 472,075$ 20,775$ Fines & forfeitures - - 17,145 17,145 Intergovermental - Federal 5,863,169 5,863,169 179,291 (5,683,878) Intergovermental - State 893,308 893,308 794,071 (99,237) Intergovermental - Other 1,748,242 1,748,242 39,465 (1,708,777) Use of money and property 35,000 35,000 37,237 2,237 Other revenue 343,387 572,891 229,099 (343,792)
Total revenues 9,334,405 9,563,909 1,768,383 (7,795,526)
EXPENDITURES:Capital outlay 15,906,345 16,418,758 4,747,375 11,671,383
Total expenditures 15,906,345 16,418,758 4,747,375 11,671,383
REVENUES OVER(UNDER) EXPENDITURES (6,571,939) (6,854,848) (2,978,992) 3,875,856
OTHER FINANCING SOURCES (USES):Transfers in 1,530,000 2,954,909 2,954,909 - Transfers out - (1,114,000) (1,524,198) (410,198)
Total other financing sources (uses) 1,530,000 1,840,909 1,430,711 (410,198)
Net change in fund balances (5,041,939)$ (5,013,939)$ (1,548,281) 3,465,658$ FUND BALANCES:Beginning of year 5,085,307 End of year 3,537,026$

CITY OF SARATOGA COMBINING STATEMENT OF REVENUES, EXPENDITURES AND CHANGES IN FUND BALANCE - BUDGET AND ACTUAL LANDSCAPE & LIGHTING DISTRICT SPECIAL REVENUE FUND FOR THE YEAR ENDED JUNE 30, 2018
90
Variance withFinal Budget
Budgeted Amounts Actual PositiveOriginal Final Amounts (Negative)
REVENUES:Property taxes 231,007$ 231,007$ 283,499$ 52,492$ Special assessments 419,755 460,860 455,968 (4,893) Use of money and property 4,856 4,856 17,480 12,624 Other revenue - 25,000 (2) (25,002)
Total revenues 655,618 721,723 756,945 35,222
EXPENDITURES:Current:
Public works 732,855 798,960 524,475 274,485
Total expenditures 732,855 798,960 524,475 274,485
REVENUES OVER(UNDER) EXPENDITURES (77,237) (77,237) 232,470 309,707
OTHER FINANCING SOURCES (USES):Transfers in - - - - Transfers out - - - -
Total other financing sources (uses) - - - -
Net change in fund balances (77,237)$ (77,237)$ 232,470 309,707$ FUND BALANCES:Beginning of year 1,152,869 End of year 1,385,339$

CITY OF SARATOGA COMBINING STATEMENT OF REVENUES, EXPENDITURES AND CHANGES IN FUND BALANCE - BUDGET AND ACTUAL LIBRARY BOND DEBT SERVICE FUND FOR THE YEAR ENDED JUNE 30, 2018
91
Variance withFinal Budget
Budgeted Amounts Actual PositiveOriginal Final Amounts (Negative)
REVENUES:Special assessments 815,000$ 815,000$ 876,771$ 61,771$ Use of money and property 2,700 2,700 8,398 5,698
Total revenues 817,700 817,700 885,169 67,469
EXPENDITURES:Debt service:General and ingov't services
Principal 485,000 485,000 485,000 - Interest and fiscal charges 362,310 362,310 361,735 575
Total expenditures 847,310 847,310 846,735 575
REVENUES OVER(UNDER) EXPENDITURES (29,610) (29,610) 38,434 68,044
Net change in fund balances (29,610)$ (29,610)$ 38,434 68,044$ FUND BALANCES:Beginning of year 959,322 End of year 997,756$

92
This page is intentionally blank

93
INTERNAL SERVICE FUNDS Liability/Risk Management Insurance Fund – Accounts for insurance premiums, self-insurance portion of claims, and administrative cost associated with settling claims. Charges made to operating departments are based on liability risk and claim occurrence history. Worker’s Compensation Fund – Accounts for insurance premiums, self-insured portion of claims, and administrative costs associated with settling claims. Charges made to operating departments are based on liability risk and claim occurrence history. Office Support Fund - Photocopy equipment, postage and bulk mail meter expenses are controlled at one source point and expended to the departments as goods or services are utilized. Information Technology Services Fund – Supports the delivery of technology-based services and infrastructure, including desktop support, network systems, technology upgrades and initiatives, community systems, and associated information technology equipment. Vehicle & Equipment Maintenance Fund – Accounts for the cost of operating and maintaining automotive equipment used for service operations in various City departments. Building Maintenance Fund – Accounts for operating costs associated with building maintenance. Expenses include custodial supplies and services, maintenance and repair, utilities, and staffing costs. Vehicle & Equipment Replacement Fund – Established to accumulate funding for the replacement of vehicles and equipment. Replacement costs are charged to program over the asset’s life span, reflective of usage. Information Technology Equipment Replacement Fund – Established to accumulate funding for the replacement of information technology equipment. Replacement costs are charged to departments over the asset’s lifespan, reflective of usage. Facility Furniture, Fixtures & Equipment Replacement Fund – Established to accumulate funding for the replacement furniture, fixtures and equipment within city facilities. Replacement costs are charged to programs based on that program’s share of asset use over the asset’s lifespan, reflective of usage.

CITY OF SARATOGA INTERNAL SERVICE FUNDS COMBINING STATEMENT OF NET POSITION JUNE 30, 2018
94
Liability / InformationRisk Workers' Office Technology
Management Compensation Support ServicesASSETSCurrent assets:
Cash and investments 635,636$ 294,807$ 117,461$ 384,099$ Accounts receivable - 6,411 - 1,039
Total current assets 635,636 301,218 117,461 385,138
Noncurrent assets:Capital assets:
Machinery and equipment - - - - Less: accumulated depreciation - - - -
Total capital assets (net ofaccumulated depreciation) - - - -
Total assets 635,636 301,218 117,461 385,138
LIABILITIESLiabilities:Current liabilities:
Accounts payable 2,606 2,622 497 10,088 Accrued payroll 3,122 1,222 - 10,786 Claims payable 76,001 - - -
Total current liabilities 81,729 3,844 497 20,874
NET POSITIONInvestment in capital assets - - - - Unrestricted 553,907 297,374 116,964 364,264 Total net position 553,907$ 297,374$ 116,964$ 364,264$

95
Information Building Vehicle Vehicle Technology Furniture &
and Equipment Building and Equipment Equipment FixturesMaintenance Maintenance Replacement Replacement Replacement Total
246,738$ 560,963$ 521,478$ 446,666$ 420,814$ 3,628,662$ - - - - - 7,450
246,738 560,963 521,478 446,666 420,814 3,636,112
- - 1,310,977 110,465 - 1,421,442 - - (901,834) (108,442) - (1,010,277)
- - 409,142 2,023 - 411,165 246,738 560,963 930,620 448,689 420,814 4,047,277
6,988 30,394 3,530 22,937 - 79,662 3,417 14,783 - - - 33,330
- - - - - 76,001 10,405 45,177 3,530 22,937 - 188,993
- - 409,142 2,023 - 411,165 236,333 515,786 517,948 423,729 420,814 3,447,119 236,333$ 515,786$ 927,090$ 425,752$ 420,814$ 3,858,284$
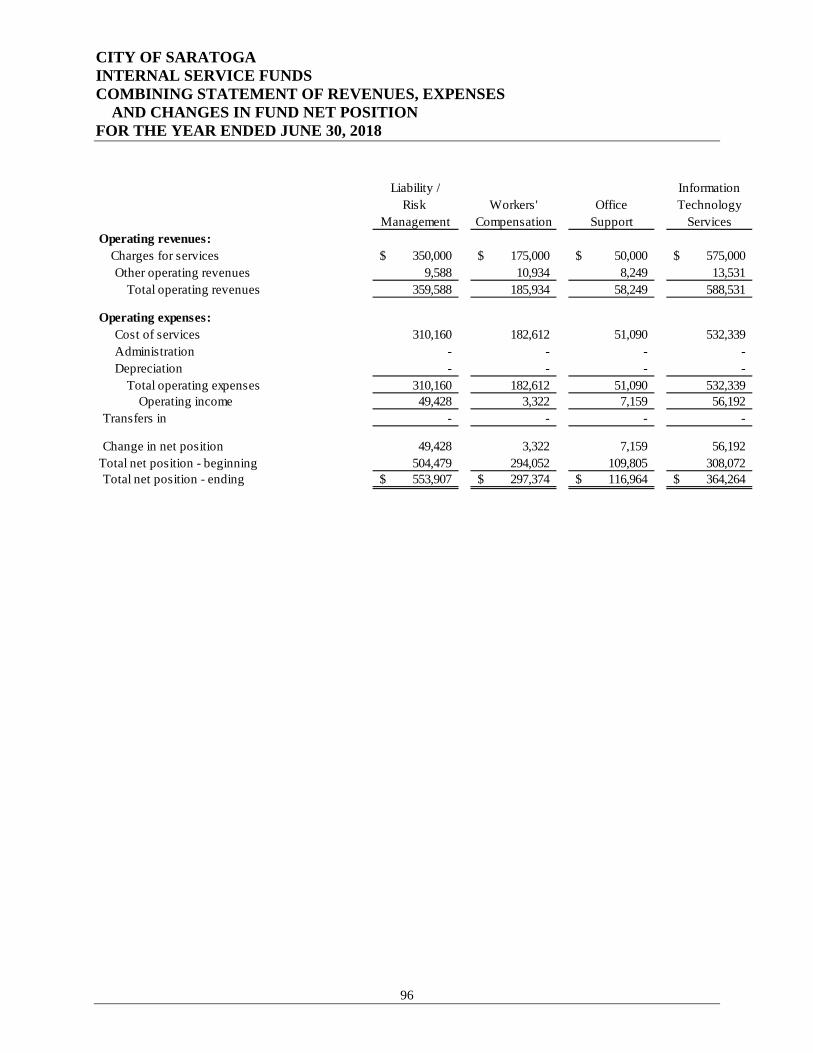
CITY OF SARATOGA INTERNAL SERVICE FUNDS COMBINING STATEMENT OF REVENUES, EXPENSES AND CHANGES IN FUND NET POSITION FOR THE YEAR ENDED JUNE 30, 2018
96
Liability / InformationRisk Workers' Office Technology
Management Compensation Support ServicesOperating revenues:
Charges for services 350,000$ 175,000$ 50,000$ 575,000$ Other operating revenues 9,588 10,934 8,249 13,531
Total operating revenues 359,588 185,934 58,249 588,531
Operating expenses:Cost of services 310,160 182,612 51,090 532,339 Administration - - - - Depreciation - - - -
Total operating expenses 310,160 182,612 51,090 532,339 Operating income 49,428 3,322 7,159 56,192
Transfers in - - - -
Change in net position 49,428 3,322 7,159 56,192 Total net position - beginning 504,479 294,052 109,805 308,072 Total net position - ending 553,907$ 297,374$ 116,964$ 364,264$
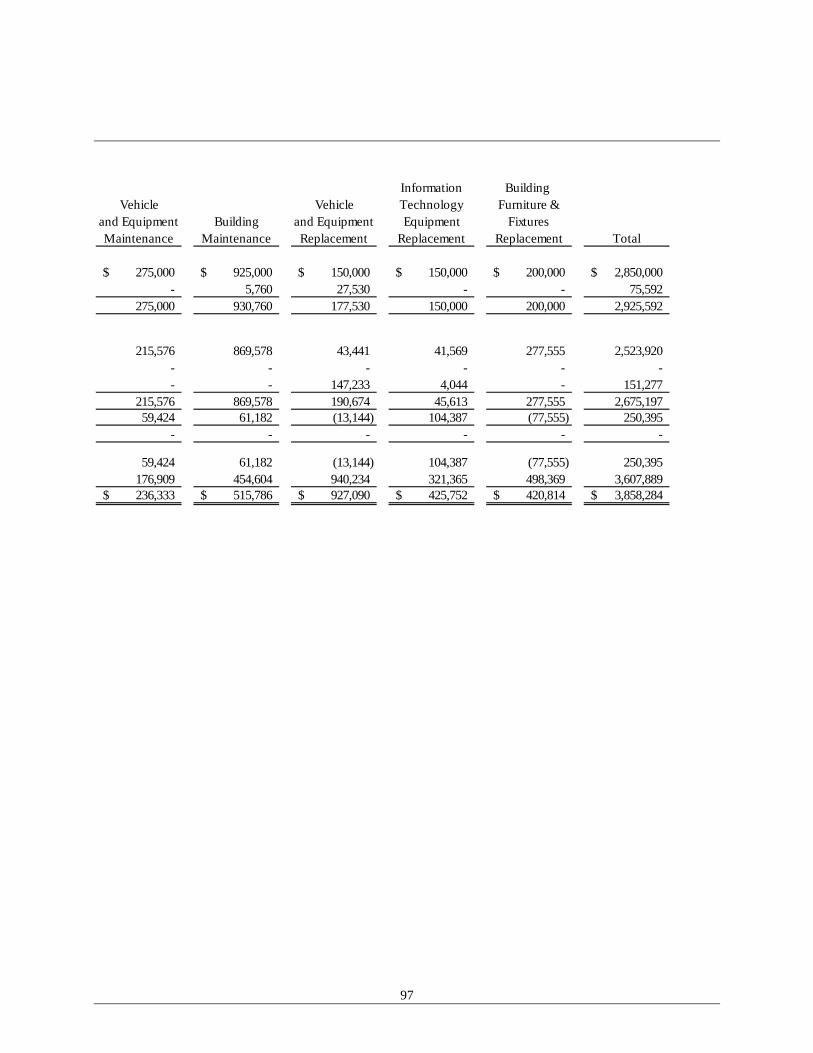
97
Information Building Vehicle Vehicle Technology Furniture &
and Equipment Building and Equipment Equipment FixturesMaintenance Maintenance Replacement Replacement Replacement Total
275,000$ 925,000$ 150,000$ 150,000$ 200,000$ 2,850,000$ - 5,760 27,530 - - 75,592
275,000 930,760 177,530 150,000 200,000 2,925,592
215,576 869,578 43,441 41,569 277,555 2,523,920 - - - - - - - - 147,233 4,044 - 151,277
215,576 869,578 190,674 45,613 277,555 2,675,197 59,424 61,182 (13,144) 104,387 (77,555) 250,395
- - - - - -
59,424 61,182 (13,144) 104,387 (77,555) 250,395 176,909 454,604 940,234 321,365 498,369 3,607,889 236,333$ 515,786$ 927,090$ 425,752$ 420,814$ 3,858,284$

CITY OF SARATOGA INTERNAL SERVICE FUNDS COMBINING STATEMENT OF CASH FLOWS FOR THE YEAR ENDED JUNE 30, 2018
98
Liability / InformationRisk Workers' Office Technology
Management Compensation Support ServicesCash flows from operating activities:
Receipts from customers and users 359,588$ 179,522$ 58,249$ 588,097$ Payments to suppliers (189,774) (149,094) (51,811) (234,620) Payments to employees (84,636) (31,446) - (289,979)
Net cash provided by operating activities 85,178 (1,018) 6,438 63,498 Cash flows from capital activities:
Acquisition of capital assets - - - - Net cash used for acquisition of capital assets - - - -
Net increase (decrease) in cash and cash equivalents 85,178 (1,018) 6,438 63,498 Cash and cash equivalents, beginning of year 550,458 295,825 111,023 320,601 Cash and cash equivalents, ending of year 635,636$ 294,807$ 117,461$ 384,099$
Reconciliation of operating income to net cash providedby operating activities:Operating income (loss) 49,428$ 3,322$ 7,159$ 56,192$ Adjustments to reconcile operating income (loss)
to net cash provided (used) by operating activities:Depreciation - - - -
Change in operating assets and liabilities:Accounts receivables - (6,411) - (434) Accounts payable 557 1,987 (721) 6,731 Claims payable 34,998 - - - Accrued payroll 195 84 - 1,009
Net cash provided (used) by operating activities 85,178$ (1,018)$ 6,438$ 63,498$
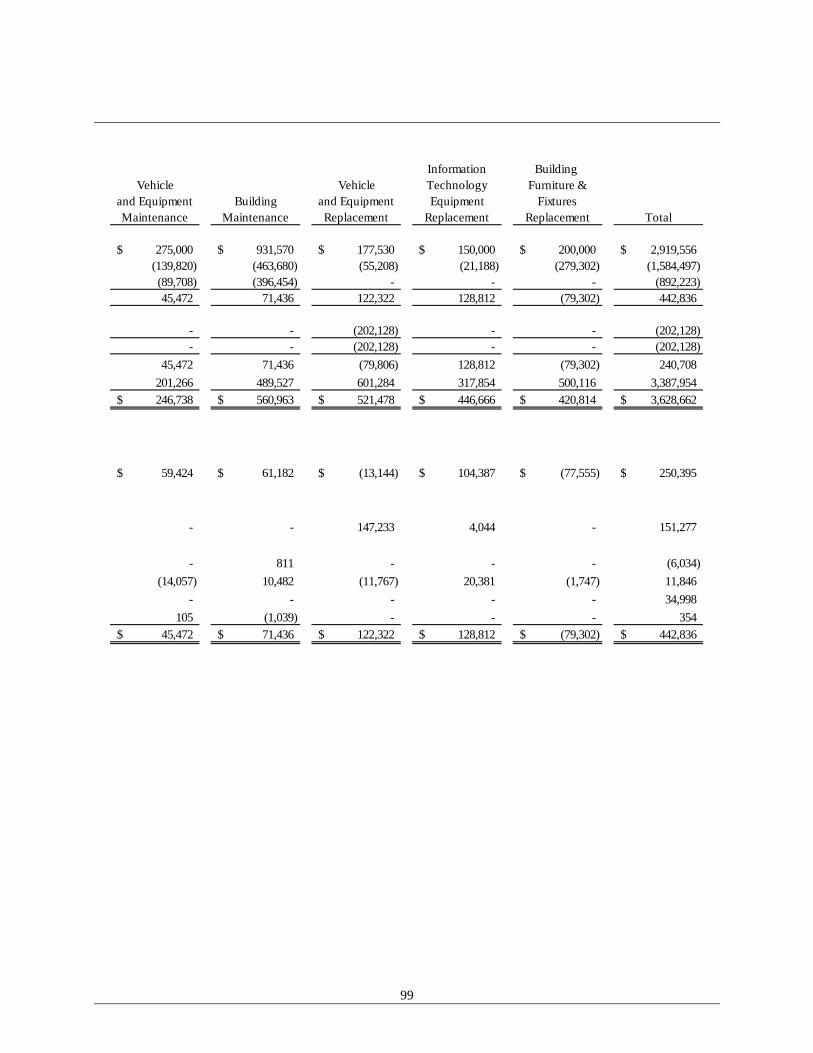
99
Information Building Vehicle Vehicle Technology Furniture &
and Equipment Building and Equipment Equipment FixturesMaintenance Maintenance Replacement Replacement Replacement Total
275,000$ 931,570$ 177,530$ 150,000$ 200,000$ 2,919,556$ (139,820) (463,680) (55,208) (21,188) (279,302) (1,584,497) (89,708) (396,454) - - - (892,223) 45,472 71,436 122,322 128,812 (79,302) 442,836
- - (202,128) - - (202,128) - - (202,128) - - (202,128)
45,472 71,436 (79,806) 128,812 (79,302) 240,708 201,266 489,527 601,284 317,854 500,116 3,387,954 246,738$ 560,963$ 521,478$ 446,666$ 420,814$ 3,628,662$
59,424$ 61,182$ (13,144)$ 104,387$ (77,555)$ 250,395$
- - 147,233 4,044 - 151,277
- 811 - - - (6,034) (14,057) 10,482 (11,767) 20,381 (1,747) 11,846
- - - - - 34,998 105 (1,039) - - - 354
45,472$ 71,436$ 122,322$ 128,812$ (79,302)$ 442,836$

100
This page is intentionally blank

101
CAPITAL ASSETS USED IN THE OPERATION OF GOVERNMENTAL FUNDS

102
This page is intentionally blank
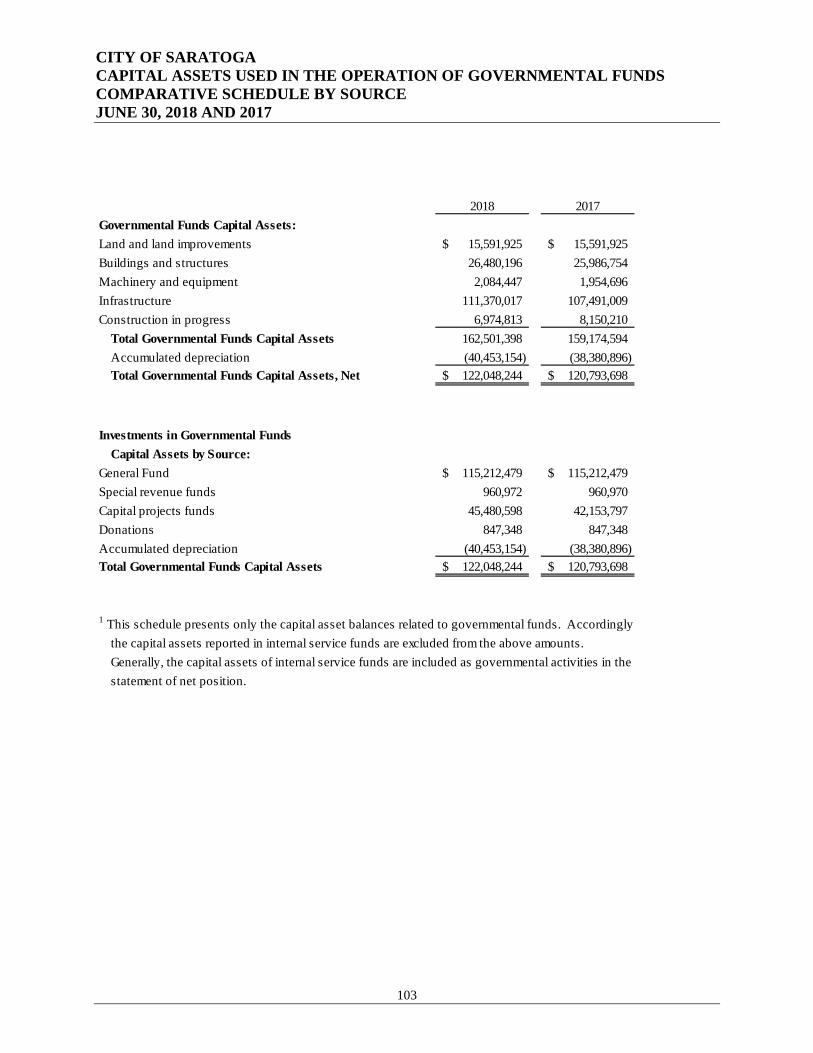
CITY OF SARATOGA CAPITAL ASSETS USED IN THE OPERATION OF GOVERNMENTAL FUNDS COMPARATIVE SCHEDULE BY SOURCE JUNE 30, 2018 AND 2017
103
2018 2017Governmental Funds Capital Assets:Land and land improvements 15,591,925$ 15,591,925$ Buildings and structures 26,480,196 25,986,754 Machinery and equipment 2,084,447 1,954,696 Infrastructure 111,370,017 107,491,009 Construction in progress 6,974,813 8,150,210
Total Governmental Funds Capital Assets 162,501,398 159,174,594 Accumulated depreciation (40,453,154) (38,380,896) Total Governmental Funds Capital Assets, Net 122,048,244$ 120,793,698$
Investments in Governmental FundsCapital Assets by Source:
General Fund 115,212,479$ 115,212,479$ Special revenue funds 960,972 960,970 Capital projects funds 45,480,598 42,153,797 Donations 847,348 847,348 Accumulated depreciation (40,453,154) (38,380,896) Total Governmental Funds Capital Assets 122,048,244$ 120,793,698$
1 This schedule presents only the capital asset balances related to governmental funds. Accordinglythe capital assets reported in internal service funds are excluded from the above amounts.Generally, the capital assets of internal service funds are included as governmental activities in thestatement of net position.

CITY OF SARATOGA CAPITAL ASSETS USED IN THE OPERATION OF GOVERNMENTAL FUNDS SCHEDULE BY FUNCTION AND ACTIVITY1 JUNE 30, 2018
104
Land Buildingsand Land and
Improvements StructuresFunction and Activity
General and intergovernmental services:Management services -$ 564,632$ Administrative services - 521,073 Intergovernmental services 118,184 3,138,641
Total General and Intergovernmental Services: 118,184 4,224,346
Public safety:Police services - - Code enforcement - -
Total Public Safety: - -
Public works:Streets and sidewalks 835,155 62,921 Parks/open space 4,718,585 3,275,380
Total Public Works: 5,553,740 3,338,301
Community services 8,177,538 4,602,650
Community development services 1,742,463 14,314,899 Total Governmental Funds Capital Assets 15,591,925 26,480,196
Accumulated depreciation - (10,784,879)
Total Governmental Funds Capital Assets, Net 15,591,925$ 15,695,317$
1 This schedule presents only the capital asset balances related to governmental funds. Accordinglythe capital assets reported in internal service funds are excluded form the above amounts.Generally, the capital assets of internal service funds are included as governmental activities in thestatement of net position.

105
Machinery Constructionand in
Equipment Infrastructure Progress Total
624,241$ -$ 73,051$ 1,261,924$ 140,332 - - 661,405 22,225 - - 3,279,050
786,798 - 73,051 5,202,379
15,434 - - 15,434 7,548 - - 7,548
22,982 - - 22,982
315,276 111,242,780 4,302,629 116,758,761 151,110 - 2,427,386 10,572,461 466,386 111,242,780 6,730,015 127,331,222
791,649 127,237 139,130 13,838,204
16,632 - 32,617 16,106,611 2,084,447 111,370,017 6,974,813 162,501,398
(1,366,063) (28,302,212) - (40,453,154)
718,384$ 83,067,805$ 6,974,813$ 122,048,244$

CITY OF SARATOGA CAPITAL ASSETS USED IN THE OPERATION OF GOVERNMENTAL FUNDS SCHEDULE OF CHANGE BY FUNCTION AND ACTIVITY JUNE 30, 2018
106
Governmental GovernmentalFunds Capital Funds Capital
Assets AssetsJuly 1, 2017 Additions Deletions June 30, 2018
Function and Activity
General and intergovernmental services:Management services 1,197,156$ 64,768$ -$ 1,261,924$ Administrative services 661,405 - - 661,405$ Intergovernmental services 3,279,050 - - 3,279,050$
Total General and Intergovernmental Services: 5,137,611 64,768 - 5,202,379$
Public safety:Police services 15,434 - - 15,434$ Code enforcement 7,548 - - 7,548$
Total Public Safety: 22,982 - - 22,982$
Public works:Streets and sidewalks 114,018,187 6,619,580 (3,879,007) 116,758,760$ Parks/open space 10,197,247 678,666 (303,452) 10,572,461$
Total Public Works: 124,215,434 7,298,246 (4,182,459) 127,331,221$
Community services 13,696,956 460,988 (319,739) 13,838,205$
Community development services 16,101,611 5,000 - 16,106,611$ Total Governmental Funds Capital Assets 159,174,594 7,829,002 (4,502,198) 162,501,398$
Accumulated depreciation (38,380,896) (2,072,258) - (40,453,154)$
Total Governmental Funds Capital Assets, Net 120,793,698$ 5,756,744$ (4,502,198)$ 122,048,244$
1 This schedule presents only the capital asset balances related to governmental funds. Accordinglythe capital assets reported in internal service funds are excluded form the above amounts.Generally, the capital assets of internal service funds are included as governmental activities in thestatement of net position.
107
STATISTICAL SECTION

108
This page is intentionally blank

109
This part of the City of Saratoga's comprehensive annual financial report presents detailed information as a context for understanding what the information in the financial statements, note disclosures and required supplementary information says about the government's overall financial health. Contents Page Financial Trends These schedules contain trend information to help the reader understand how the government's financial performance and well being have changed over time. 110-115 Revenue Capacity These schedules contain information to help the reader assess the government’s most significant local revenue source; property tax. 116-125 Debt Capacity These schedules present information to help the reader assess the affordability of the government's current levels of outstanding debt and the government's ability to issue additional debt in the future. 126-132 Demographic and Economic Information These schedules offer demographic and economic indicators to help the reader understand the environment within which the government's financial activities take place. 133-134 Operating Information These schedules contain service and infrastructure data to help the reader understand how the information in the government's financial report relates to the services the government provides and the activities it performs. 136-141 The City of Saratoga implemented GASB Statement No. 34 in Fiscal Year 2001/02; schedules presenting government-wide information include information beginning in that year. The City of Saratoga implemented GASB Statement No. 44 in Fiscal Year 2007/08; newly required schedules presenting information in the Statistical Section include the earliest available information.

CITY OF SARATOGA NET POSITION BY COMPONENT LAST TEN YEARS (ACCRUAL BASIS OF ACCOUNTING)
110
(amounts expressed in thousands)
2009 2010 2011 2012Primary government
Governmental activities Net investment in capital assets 108,818$ 108,966$ 110,016$ 111,201$ Restricted 5,281 5,519 5,830 1,938 Unrestricted 8,759 8,533 7,964 12,248
Total primary government 122,858$ 123,018$ 123,810$ 125,387$
Source: CAFR
Fiscal Year
$95,000 $100,000 $105,000 $110,000 $115,000 $120,000 $125,000 $130,000
2009 2010 2011 2012 2013 2014 2015 2016 2017 2018
Net Position by Component
Net investment in capital assets Restricted Unrestricted
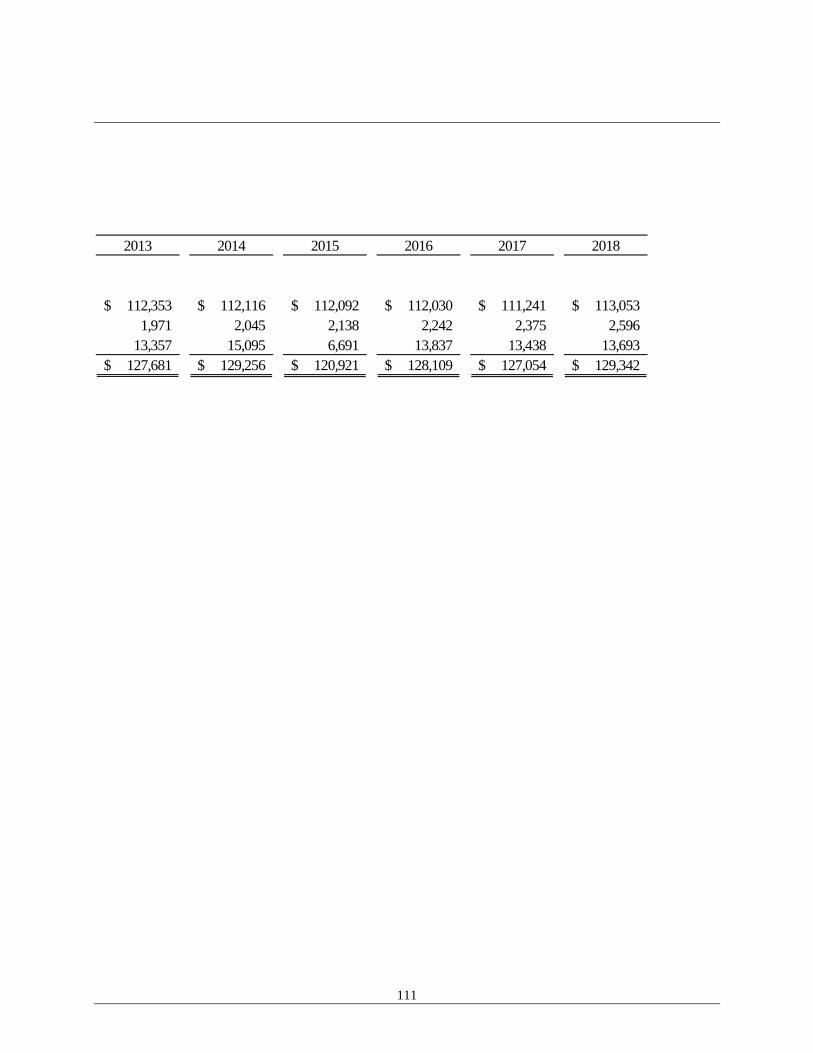
111
2013 2014 2015 2016 2017 2018
112,353$ 112,116$ 112,092$ 112,030$ 111,241$ 113,053$ 1,971 2,045 2,138 2,242 2,375 2,596
13,357 15,095 6,691 13,837 13,438 13,693 127,681$ 129,256$ 120,921$ 128,109$ 127,054$ 129,342$

CITY OF SARATOGA CHANGES IN NET POSITION LAST TEN YEARS (MODIFIED ACCRUAL BASIS OF ACCOUNTING)
112
(amounts expressed in thousands)
2009 2010 2011 2012Expenses:Governmental activities:
General and intergovernmental services 5,595$ 3,729$ 4,368$ 3,486$ Public safety 4,211 4,339 4,457 4,300 Public works 7,643 6,535 6,645 9,121 Community services 1,634 1,711 1,846 1,996 Community development services 2,000 1,751 1,839 1,553 Interest on long-term debt (unallocated) 697 677 656 453
Total governmental activities expenses 21,780 18,742 19,811 20,909
Program revenues:Charges for services:
General and intergovernmental services 133 125 171 140 Public safety 520 425 561 594 Public works 2,379 2,535 2,771 2,079 Community services 935 917 1,020 890 Community development services 1,802 1,586 1,734 1,923
Operating grants and contributions 228 275 401 1,319 Capital grants and contributions 339 674 1,221 2,337 Total governmental activates program revenues 6,336 6,537 7,879 9,282 Net (expense) revenue and change in net position (15,444) (12,205) (11,932) (11,627)
General revenue and other changes in net assetsTaxes:
Property taxes 8,336 8,371 8,199 8,457 Sales taxes 1,043 955 991 1,101 Local taxes 663 560 632 683 Franchise taxes 1,657 1,664 1,821 1,852 Motor vehicle in-lieu 116 101 146 16
Total Taxes 11,815 11,651 11,789 12,109 Intergovernmental 474 522 773 910 Investment earnings 397 101 65 67 Other revenues 148 91 97 118
Total general revenues 12,834 12,365 12,724 13,204 Change in net position (2,610) 160 792 1,577 Net position - beginning of year 125,468 122,858 123,018 123,810 GASB 68 adjustment - - - - Net position - beginning of year, as adjusted 125,468 122,858 123,018 123,810 Net position - end of year 122,858$ 123,018$ 123,810$ 125,387$
Source: CAFR
Fiscal Year

113
2013 2014 2015 2016 2017 2018
4,143$ 4,522$ 7,566$ 5,143$ 6,450$ 6,010$ 4,382 4,491 4,850 4,787 5,444 5,728 6,922 7,379 6,273 6,181 9,164 7,943 1,804 1,586 1,589 1,582 1,557 1,594 1,713 2,179 1,962 2,012 2,906 2,285
410 400 391 381 367 359 19,374 20,557 22,631 20,086 25,888 23,919
102 120 122 98 153 152 607 330 354 310 327 368
3,316 2,768 2,474 3,004 2,462 2,397 946 958 952 1,114 1,071 914
2,184 2,220 2,234 2,397 2,127 2,343 75 117 107 165 223 90
599 808 785 183 1,062 219 7,829 7,321 7,028 7,271 7,425 6,483
(11,545) (13,236) (15,603) (12,815) (18,463) (17,436)
9,153 9,737 10,669 11,549 12,264 14,124 1,051 941 1,224 1,189 1,185 1,125
769 822 866 898 857 960 1,920 1,949 2,070 2,069 2,171 2,166
16 14 13 12 13 16 12,909 13,463 14,842 15,717 16,490 18,391
766 981 1,023 718 589 802 51 62 67 101 124 319
113 305 237 273 205 212 13,839 14,811 16,169 16,809 17,408 19,724 2,294 1,575 566 3,994 (1,055) 2,288
125,387 127,681 129,256 120,921 128,109 127,054 - - (8,901) 3,193 - -
125,387 127,681 120,355 124,114 128,109 127,054 127,681$ 129,256$ 120,921$ 128,109$ 127,054$ 129,342$
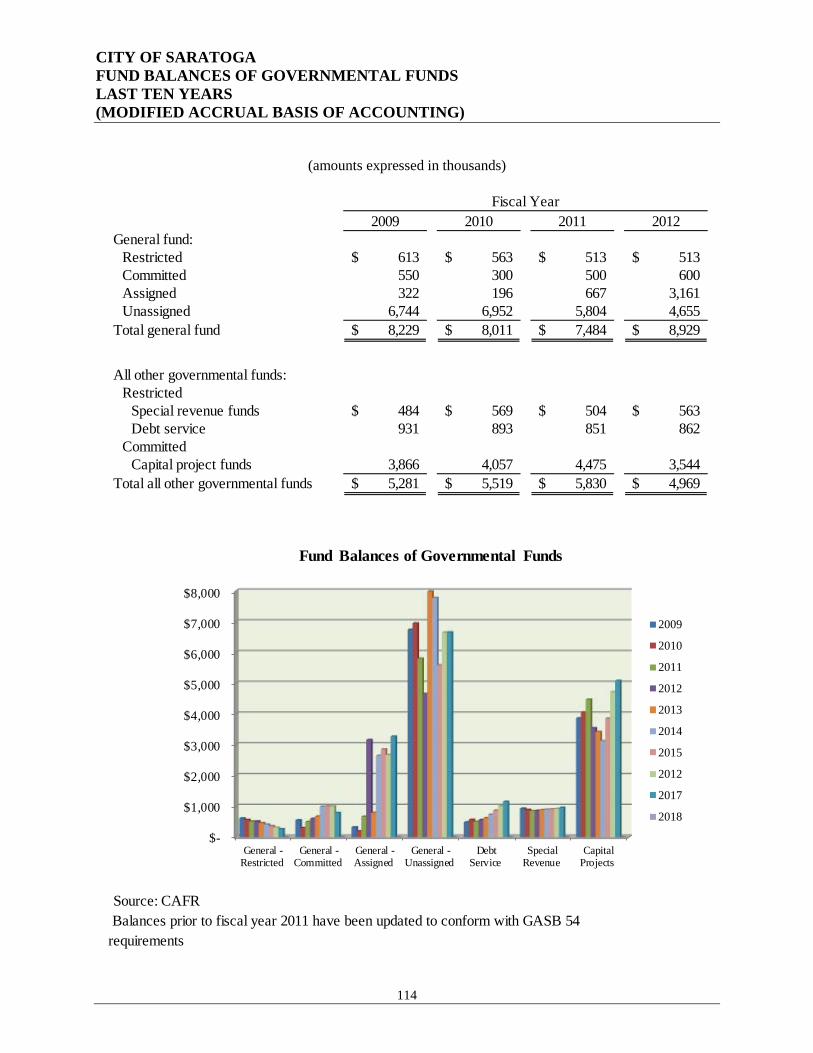
CITY OF SARATOGA FUND BALANCES OF GOVERNMENTAL FUNDS LAST TEN YEARS (MODIFIED ACCRUAL BASIS OF ACCOUNTING)
114
(amounts expressed in thousands)
2009 2010 2011 2012General fund:
Restricted 613$ 563$ 513$ 513$ Committed 550 300 500 600 Assigned 322 196 667 3,161 Unassigned 6,744 6,952 5,804 4,655
Total general fund 8,229$ 8,011$ 7,484$ 8,929$
All other governmental funds:Restricted
Special revenue funds 484$ 569$ 504$ 563$ Debt service 931 893 851 862
CommittedCapital project funds 3,866 4,057 4,475 3,544
Total all other governmental funds 5,281$ 5,519$ 5,830$ 4,969$
Source: CAFR
Fiscal Year
Balances prior to fiscal year 2011 have been updated to conform with GASB 54 requirements
$-
$1,000
$2,000
$3,000
$4,000
$5,000
$6,000
$7,000
$8,000
General -Restricted
General -Committed
General -Assigned
General -Unassigned
DebtService
SpecialRevenue
CapitalProjects
Fund Balances of Governmental Funds
2009
2010
2011
2012
2013
2014
2015
2012
2017
2018

115
2013 2014 2015 2016 2017 2018
463$ 413$ 363$ 313$ 263$ 213$ 675 993 1,000 1,000 790 1,000 792 2,648 2,854 2,672 3,272 3,705
7,989 7,782 5,589 6,655 6,659 8,216 9,919$ 11,836$ 9,806$ 10,640$ 10,984$ 13,134$
622$ 734$ 868$ 1,006$ 1,153$ 1,385$ 886 898 907 923 959 998
3,420 3,126 3,859 4,716 5,085 3,537 4,928$ 4,758$ 5,634$ 6,645$ 7,197$ 5,920$

CITY OF SARATOGA GOVERNMENTAL ACTIVITIES TAX REVENUES BY SOURCE LAST TEN YEARS (ACCRUAL BASIS OF ACCOUNTING)
116
(amounts expressed in thousands)
2009 2010 2011 2012Tax revenues:
Property taxes 8,336$ 8,371$ 8,199$ 8,457$ Special assessments 1,368 1,247 1,255 1,243 Sales taxes 1,043 955 991 1,101 Local taxes 663 560 632 683 Franchise taxes 1,657 1,664 1,821 1,852 Motor vehicle in-lieu 116 101 146 16
Total tax revenues 13,183$ 12,898$ 13,044$ 13,352$
Source: CAFR
Fiscal Year
$-
$2,000
$4,000
$6,000
$8,000
$10,000
$12,000
$14,000
Propertytaxes
Specialassessments
Sales taxes Local taxes Franchisetaxes
Motorvehicle in-
lieu
Tax Revenues by Source
2009
2010
2011
2012
2013
2014
2015
2012
2017
2018

117
2013 2014 2015 2016 2017 2018
9,153$ 9,737$ 10,669$ 11,549$ 12,264$ 13,247$ 1,185 1,207 1,220 1,222 1,270 1,333 1,051 941 1,224 1,189 1,185 1,125
769 822 866 898 857 960 1,920 2,024 2,069 2,068 2,171 2,166
16 14 13 12 14 16 14,094$ 14,745$ 16,061$ 16,938$ 17,761$ 18,847$

CITY OF SARATOGA CHANGES IN FUND BALANCES OF GOVERNMENTAL FUNDS LAST TEN YEARS (MODIFIED ACCRUAL BASIS OF ACCOUNTING)
118
(amounts expressed in thousands)
2009 2010 2011 2012Revenues:
Property taxes 8,335$ 8,371$ 8,199$ 8,457$ Special assessments 1,368 1,247 1,255 1,243 Sales taxes 1,043 954 991 1,101 Other local taxes 663 560 632 683 Licenses and permits 1,460 1,489 1,950 1,728 Fines and forfeitures 360 359 285 234 Intergovernmental - federal - 430 1,033 1,915 Intergovernmental - state 1,283 1,258 1,480 1,728 Intergovernmental - other 290 258 337 73 Franchise fees 1,657 1,664 1,821 1,852 Use of money any property 794 595 550 589 Other revenues 1,966 1,794 2,169 2,199
Total tax revenues 19,219 18,979 20,702 21,802
Expenditures:Current:
General and intergovernmental services 3,330 3,102 3,524 3,145 Public safety 4,206 4,349 4,467 4,310 Public works 4,700 4,730 4,717 4,751 Community services 1,424 1,223 1,322 1,269 Community development services 2,450 2,111 2,193 1,888
Capital outlay 4,060 2,584 3,704 5,179 Debt service:
Principal 310 330 350 370 Interest and fiscal charges 705 685 665 551
Total expenditures 21,185 19,114 20,942 21,463 Excess of revenues (1,966) (135) (240) 339
Other financing sources (uses):Transfers in 2,043 1,172 1,725 510 Transfers out (2,043) (1,017) (1,700) (485) Total other financing sources (uses) - 155 25 25 Net change in fund balances (1,966)$ 19$ (215)$ 364$ Debt as a percentage of noncapital expenditures 4.89% 5.80% 5.56% 4.68%
Fiscal Year
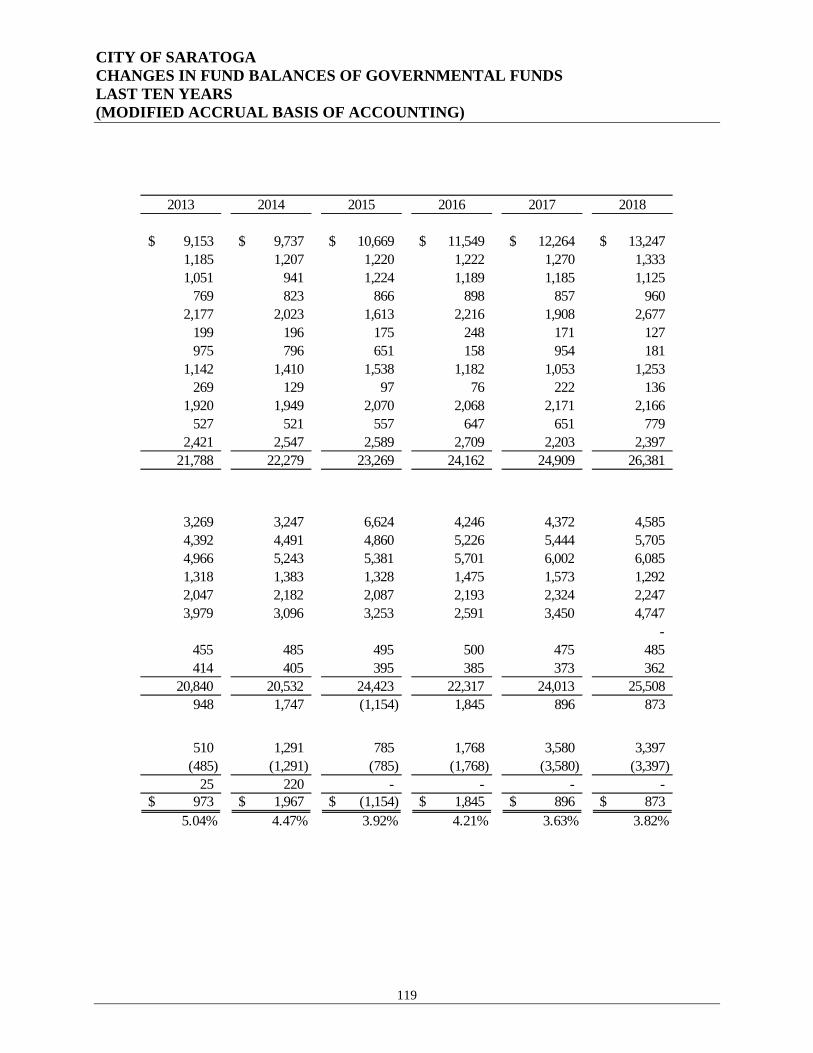
CITY OF SARATOGA CHANGES IN FUND BALANCES OF GOVERNMENTAL FUNDS LAST TEN YEARS (MODIFIED ACCRUAL BASIS OF ACCOUNTING)
119
2013 2014 2015 2016 2017 2018
9,153$ 9,737$ 10,669$ 11,549$ 12,264$ 13,247$ 1,185 1,207 1,220 1,222 1,270 1,333 1,051 941 1,224 1,189 1,185 1,125
769 823 866 898 857 960 2,177 2,023 1,613 2,216 1,908 2,677
199 196 175 248 171 127 975 796 651 158 954 181
1,142 1,410 1,538 1,182 1,053 1,253 269 129 97 76 222 136
1,920 1,949 2,070 2,068 2,171 2,166 527 521 557 647 651 779
2,421 2,547 2,589 2,709 2,203 2,397 21,788 22,279 23,269 24,162 24,909 26,381
3,269 3,247 6,624 4,246 4,372 4,585 4,392 4,491 4,860 5,226 5,444 5,705 4,966 5,243 5,381 5,701 6,002 6,085 1,318 1,383 1,328 1,475 1,573 1,292 2,047 2,182 2,087 2,193 2,324 2,247 3,979 3,096 3,253 2,591 3,450 4,747
- 455 485 495 500 475 485 414 405 395 385 373 362
20,840 20,532 24,423 22,317 24,013 25,508 948 1,747 (1,154) 1,845 896 873
510 1,291 785 1,768 3,580 3,397 (485) (1,291) (785) (1,768) (3,580) (3,397)
25 220 - - - - 973$ 1,967$ (1,154)$ 1,845$ 896$ 873$
5.04% 4.47% 3.92% 4.21% 3.63% 3.82%

CITY OF SARATOGA PROPERTY TAX RATES – DIRECT AND OVERLAPPING GOVERNMENTS LAST TEN YEARS
120
(Property Tax Rates per $100 of Assessed Value)
2009 2010 2011 2012
General 1.0000 1.0000 1.0000 1.0000 County Retirement Levy 0.0388 0.0388 0.0388 0.0388 County Library 0.0024 0.0024 0.0024 0.0024 City of Saratoga 0.0104 0.0094 0.0094 0.0088
1.0516 1.0506 1.0506 1.0500
Campbell School District 0.0524 0.0285 0.0249 0.0283 County Bond 2008 Hospital - 0.0122 0.0095 0.0047 Co. Housing Bond 2016 - - - - Campbell Elementary 2002 - 0.0267 0.0298 0.0266 Campbell Elementary 2010 - - 0.0005 0.0003 Campbell Elementary 2016 - - - - Campbell Union High 1999 0.0299 0.0183 0.0196 0.0186 Campbell Union High 2006 - 0.0131 0.0131 0.0156 Campbell Union High 2016 - - - - West Valley Community College District 2004 0.0032 0.0140 0.0139 0.0137 West Valley Community College District 2012 - - - - Cupertino Elementary School District 0.0306 - - - Moreland Elementary School District 0.0565 - - - Saratoga School District 0.0363 - - - Campbell Union High School District 0.0299 - - - Fremont Union High School District 0.0339 - - - Los Gatos-Saratoga Joint Union High School District 0.0330 - - - Foothill-DeAnza Community College District 0.0123 - - - Saratoga Fire District 0.0053 - - - Santa Clara Valley Water District - State Water Project 0.0059 0.0071 0.0070 0.0063 Santa Clara Valley Water District - Zone W-1 0.0002 0.0003 0.0002 0.0001 Mid Peninsula Open Space 2014 - - - -
0.3294 0.1202 0.1185 0.1142
Total Tax Rate 1.3810 1.1708 1.1691 1.1642
Source: Muniservices, LLC
Fiscal Year
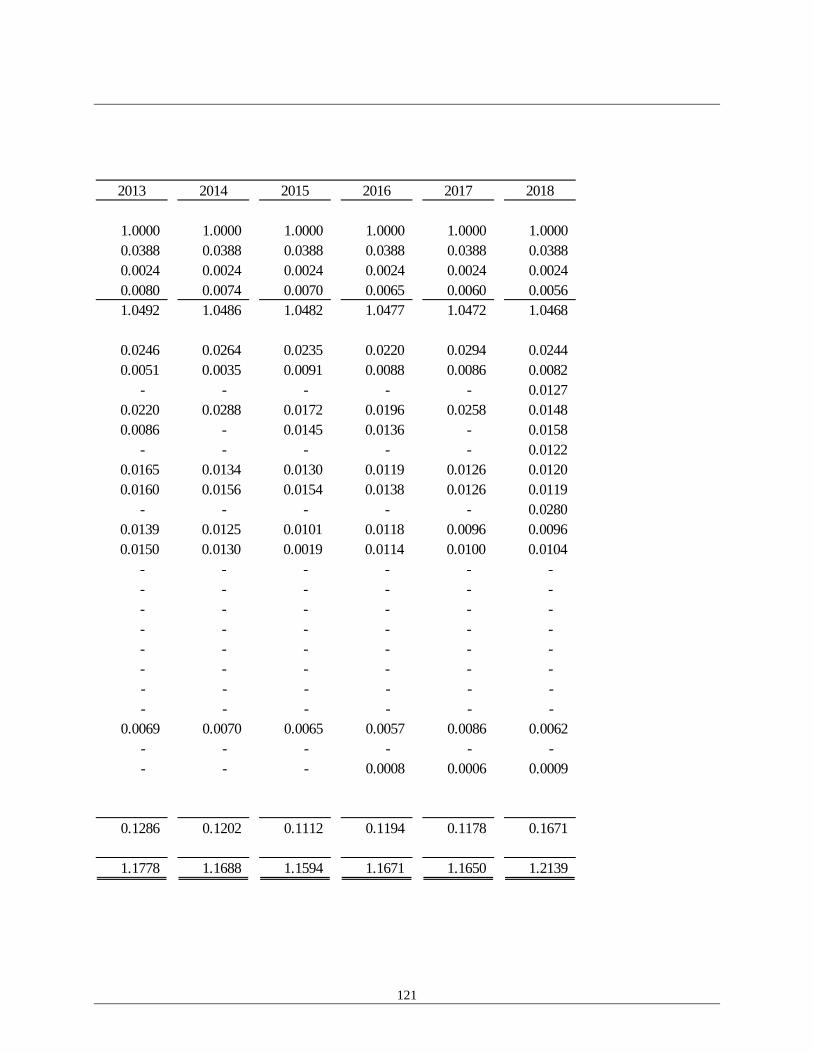
121
2013 2014 2015 2016 2017 2018
1.0000 1.0000 1.0000 1.0000 1.0000 1.0000 0.0388 0.0388 0.0388 0.0388 0.0388 0.0388 0.0024 0.0024 0.0024 0.0024 0.0024 0.0024 0.0080 0.0074 0.0070 0.0065 0.0060 0.0056 1.0492 1.0486 1.0482 1.0477 1.0472 1.0468
0.0246 0.0264 0.0235 0.0220 0.0294 0.0244 0.0051 0.0035 0.0091 0.0088 0.0086 0.0082
- - - - - 0.0127 0.0220 0.0288 0.0172 0.0196 0.0258 0.0148 0.0086 - 0.0145 0.0136 - 0.0158
- - - - - 0.0122 0.0165 0.0134 0.0130 0.0119 0.0126 0.0120 0.0160 0.0156 0.0154 0.0138 0.0126 0.0119
- - - - - 0.0280 0.0139 0.0125 0.0101 0.0118 0.0096 0.0096 0.0150 0.0130 0.0019 0.0114 0.0100 0.0104
- - - - - - - - - - - - - - - - - - - - - - - - - - - - - - - - - - - - - - - - - - - - - - - -
0.0069 0.0070 0.0065 0.0057 0.0086 0.0062 - - - - - - - - - 0.0008 0.0006 0.0009
0.1286 0.1202 0.1112 0.1194 0.1178 0.1671
1.1778 1.1688 1.1594 1.1671 1.1650 1.2139
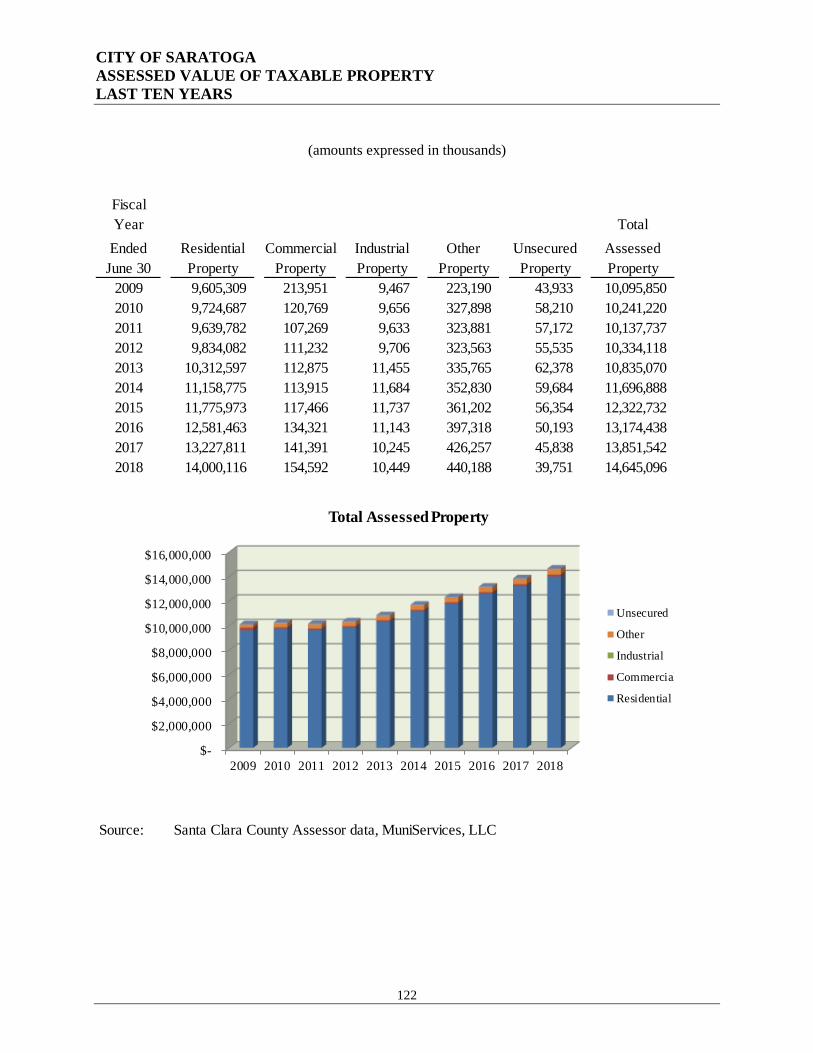
CITY OF SARATOGA ASSESSED VALUE OF TAXABLE PROPERTY LAST TEN YEARS
122
(amounts expressed in thousands)
FiscalYear Total
Ended Residential Commercial Industrial Other Unsecured AssessedJune 30 Property Property Property Property Property Property
2009 9,605,309 213,951 9,467 223,190 43,933 10,095,850 2010 9,724,687 120,769 9,656 327,898 58,210 10,241,220 2011 9,639,782 107,269 9,633 323,881 57,172 10,137,737 2012 9,834,082 111,232 9,706 323,563 55,535 10,334,118 2013 10,312,597 112,875 11,455 335,765 62,378 10,835,070 2014 11,158,775 113,915 11,684 352,830 59,684 11,696,888 2015 11,775,973 117,466 11,737 361,202 56,354 12,322,732 2016 12,581,463 134,321 11,143 397,318 50,193 13,174,438 2017 13,227,811 141,391 10,245 426,257 45,838 13,851,542 2018 14,000,116 154,592 10,449 440,188 39,751 14,645,096
Source: Santa Clara County Assessor data, MuniServices, LLC
$-
$2,000,000
$4,000,000
$6,000,000
$8,000,000
$10,000,000
$12,000,000
$14,000,000
$16,000,000
2009 2010 2011 2012 2013 2014 2015 2016 2017 2018
Total Assessed Property
Unsecured
Other
Industrial
Commercial
Residential
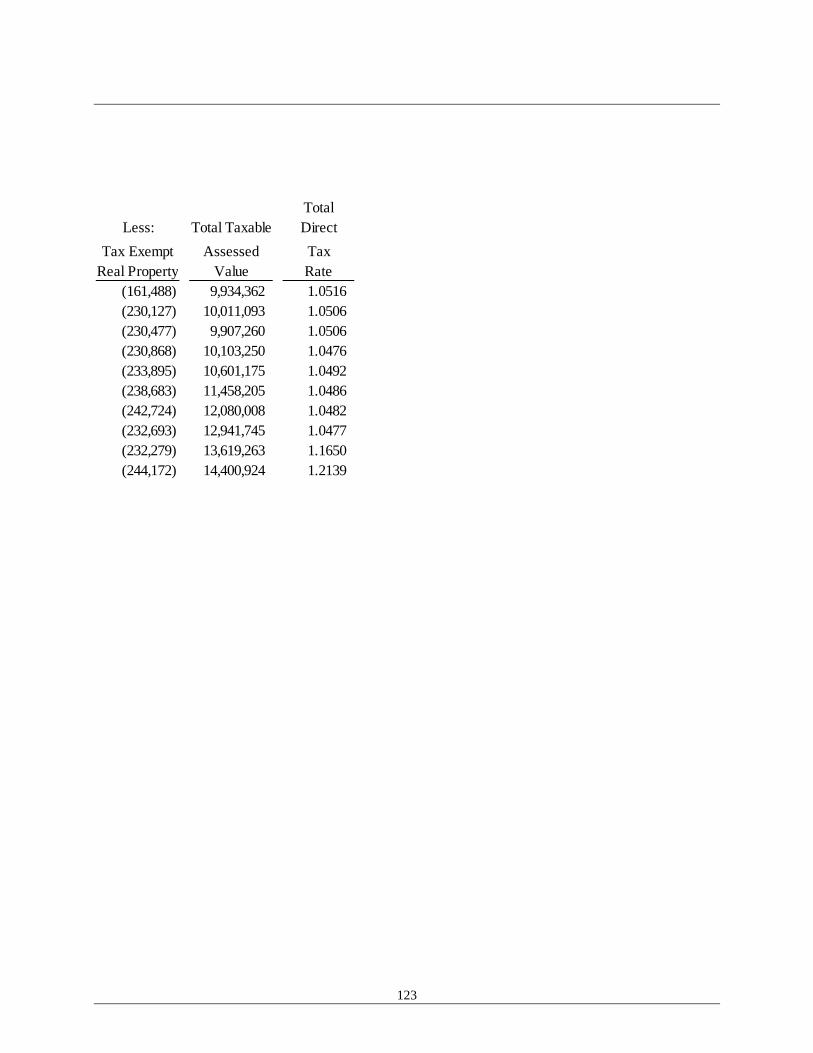
123
TotalLess: Total Taxable Direct
Tax Exempt Assessed TaxReal Property Value Rate
(161,488) 9,934,362 1.0516 (230,127) 10,011,093 1.0506 (230,477) 9,907,260 1.0506 (230,868) 10,103,250 1.0476 (233,895) 10,601,175 1.0492 (238,683) 11,458,205 1.0486 (242,724) 12,080,008 1.0482 (232,693) 12,941,745 1.0477 (232,279) 13,619,263 1.1650 (244,172) 14,400,924 1.2139

CITY OF SARATOGA PRINCIPAL PROPERTY TAXPAYERS CURRENT YEAR AND NINE YEARS AGO JUNE 30, 2018
124
(amounts expressed in thousands)
% of Total % of TotalTaxable Taxable Taxable Taxable
Assessed Assessed Assessed AssessedTaxpayer Value Rank Value Value Rank ValueHumboldt Fields LLC 45,000$ 1 0.31%SHP Quito Village LLC 34,519 2 0.24%San Jose Water Works 23,844 3 0.17% 13,190 6 0.13%Keller Trustee 16,801 4 0.12%House Trustee 15,865 5 0.11% 14,346 5 0.15%Osheanic Capital LLC 13,659 6 0.09%Stormin Norman, LLC 13,369 7 0.09%HJJ, LLC 13,127 8 0.09%Summerhill Saratoga Front LLC 12,364 9 0.09%Paramount Venture LLC 12,240 10 0.08%Cupertino Village Ass LLC 34,205 1 0.35%Quito Village Associates LLC 18,012 2 0.18%Gregpenn Properties, LLC 16,970 3 0.17%Sobrato Trustee 15,040 4 0.15%Luczo Trustee 10,608 7 0.11%Argonaut Assoc LLC 10,304 8 0.10%Krishnamurthi Ashok 10,234 9 0.10%Coyote Properties IV LLC 10,043 10 0.10%Top Ten Total Assessed Value 200,788$ 1.4% 152,952$ 1.5%
City Total Assessed Value 14,400,924$ 9,877,380$
Source: Santa Clara County Assessor data, MuniServices, LLC
2018 2009

CITY OF SARATOGA PROPERTY TAX LEVIES AND COLLECTIONS LAST TEN YEARS
125
Fiscal Year Total Tax Collections inEnded Levy for Subsequent
June 30 Fiscal Year Amount Percentage Years Amount Percentage2009 8,332,184 8,332,184 100.0% - 8,332,184 100.0%2010 8,371,396 8,371,396 100.0% - 8,371,396 100.0%2011 8,199,341 8,199,341 100.0% - 8,199,341 100.0%2012 8,456,687 8,456,687 100.0% - 8,456,687 100.0%2013 9,152,865 9,152,865 100.0% - 9,152,865 100.0%2014 9,737,144 9,737,144 100.0% - 9,737,144 100.0%2015 10,669,281 10,669,281 100.0% - 10,669,281 100.0%2016 11,549,213 11,549,213 100.0% - 11,549,213 100.0%2017 12,263,575 12,263,575 100.0% - 12,263,575 100.0%2018 13,247,030 13,247,030 100.0% - 13,247,030 100.0%
Source: City of Saratoga
Collected within theFiscal Year of the Levy Total Collections to Date

CITY OF SARATOGA RATIOS OF OUTSTANDING DEBT BY TYPE LAST TEN YEARS
126
(amounts expressed in thousands, except per capita amounts)
2009 2010 2011 2012Governmental activities
General obligation bonds 13,285$ 12,955$ 12,605$ 11,995$ Net original issue premium - - - 438
Total primary government 13,285$ 12,955$ 12,605$ 12,433$
Percentage of Personal Income1 0.76% 0.54% 0.57% 0.57%
Per capita2 419 405 417 409
Source: CAFR
1US Census Bureau, adjusted for inflation, MuniServices LLC2Population information from California State Controller's Office
Fiscal Year

127
2013 2014 2015 2016 2017 2018
11,540$ 11,055$ 10,560$ 10,060$ 9,585$ 9,100$ 416 394 372 350 328 306
11,956$ 11,449$ 10,932$ 10,410$ 9,913$ 9,406$
0.53% 0.49% 0.47% 0.45% 0.40% 0.35%
389 371 355 344 324 299
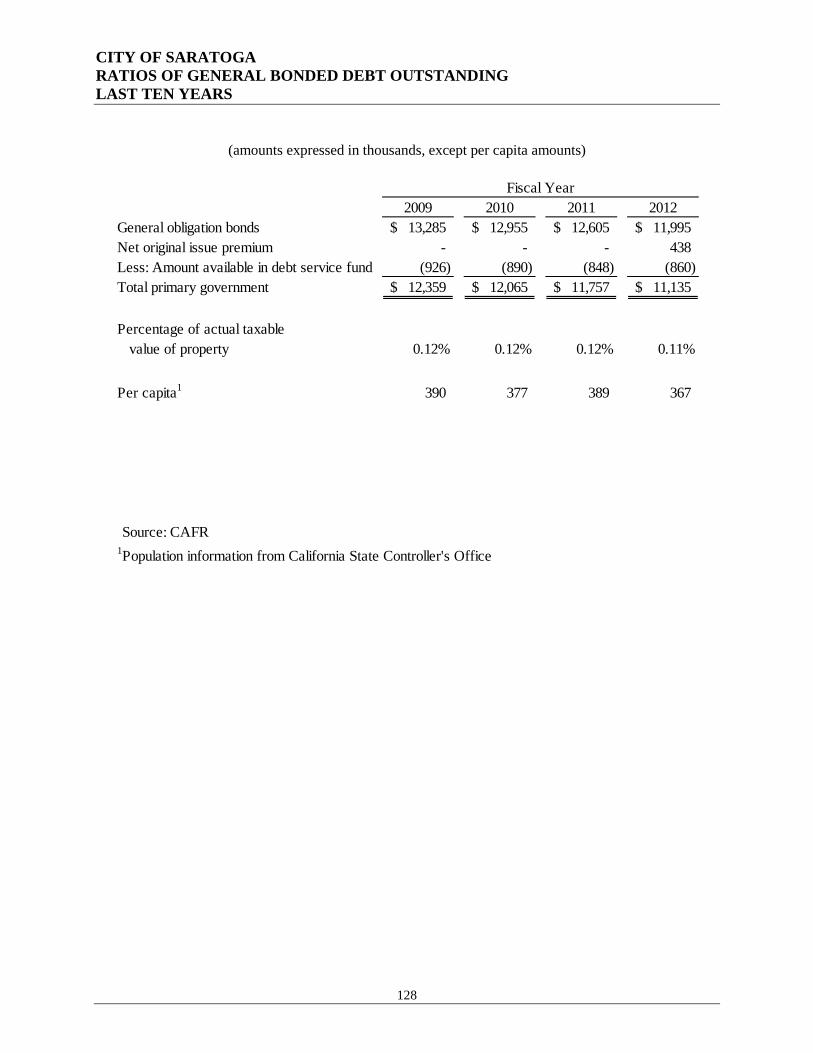
CITY OF SARATOGA RATIOS OF GENERAL BONDED DEBT OUTSTANDING LAST TEN YEARS
128
(amounts expressed in thousands, except per capita amounts)
2009 2010 2011 2012General obligation bonds 13,285$ 12,955$ 12,605$ 11,995$ Net original issue premium - - - 438 Less: Amount available in debt service fund (926) (890) (848) (860) Total primary government 12,359$ 12,065$ 11,757$ 11,135$
Percentage of actual taxable value of property 0.12% 0.12% 0.12% 0.11%
Per capita1 390 377 389 367
Source: CAFR1Population information from California State Controller's Office
Fiscal Year

129
2013 2014 2015 2016 2017 201811,540$ 11,055$ 10,560$ 10,060$ 9,585$ 9,100$
416 394 372 350 328 306$ (885) (898) (906) (923) (959) (998)
11,071$ 10,551$ 10,026$ 9,487$ 8,954$ 8,408$
0.10% 0.09% 0.08% 0.07% 0.07% 0.06%
361 342 326 314 293 267

CITY OF SARATOGA LEGAL DEBT MARGIN INFORMATION LAST TEN YEARS
130
(amounts expressed in thousands)
2009 2010 2011 2012Debt Limit 1,514,378$ 1,536,183$ 1,520,660$ 1,550,118$ Total net debt applicable to limit 12,359 12,065 11,757 11,135 Legal debt margin 1,502,019$ 1,524,118$ 1,508,903$ 1,538,983$
Total net debt applicable to the limit as a percentage of debt limit 0.82% 0.79% 0.77% 0.72%
Legal debt margin calculationAssessed value 9,934,362$ 10,011,093$ 9,907,259$ 10,103,250$ Add back: exempt real property 161,488 230,127 230,477 230,868
Total assessed value 10,095,850$ 10,241,220$ 10,137,736$ 10,334,118$
Debt limit (15% of total assessed value) 1,514,378$ 1,536,183$ 1,520,660$ 1,550,118$
Debt applicable to limit:General obligation bonds 13,285$ 12,955$ 12,605$ 11,995$ Net original issue premium - - - 438 Less: Amount available in debt service fund (926) (890) (848) (860)
Total net debt applicable to limit 12,359$ 12,065$ 11,757$ 11,135$
Legal debt margin 1,502,019$ 1,524,118$ 1,508,903$ 1,538,983$
Source: CAFR
Fiscal Year

131
2013 2014 2015 2016 2017 20181,625,261$ 1,754,233$ 1,848,410$ 1,976,166$ 2,077,731$ 2,196,764$
10,655 10,157 9,654 9,137 8,626 8,102 1,614,606$ 1,744,076$ 1,838,756$ 1,967,029$ 2,069,105$ 2,188,662$
0.66% 0.58% 0.52% 0.46% 0.42% 0.37%
10,601,175$ 11,458,205$ 12,080,008$ 12,941,745$ 13,619,263$ 14,400,924$ 233,895 236,683 242,724 232,693 232,279 244,172
10,835,070$ 11,694,888$ 12,322,732$ 13,174,438$ 13,851,542$ 14,645,096$
1,625,261$ 1,754,233$ 1,848,410$ 1,976,166$ 2,077,731$ 2,196,764$
11,540$ 11,055$ 10,560$ 10,060$ 9,585$ 9,100$ 416 394 372 350 328 306$
(885) (898) (906) (923) (959) (998)$ 10,655$ 10,157$ 9,654$ 9,137$ 8,626$ 8,102$
1,614,606$ 1,744,076$ 1,838,756$ 1,967,029$ 2,069,105$ 2,188,662$
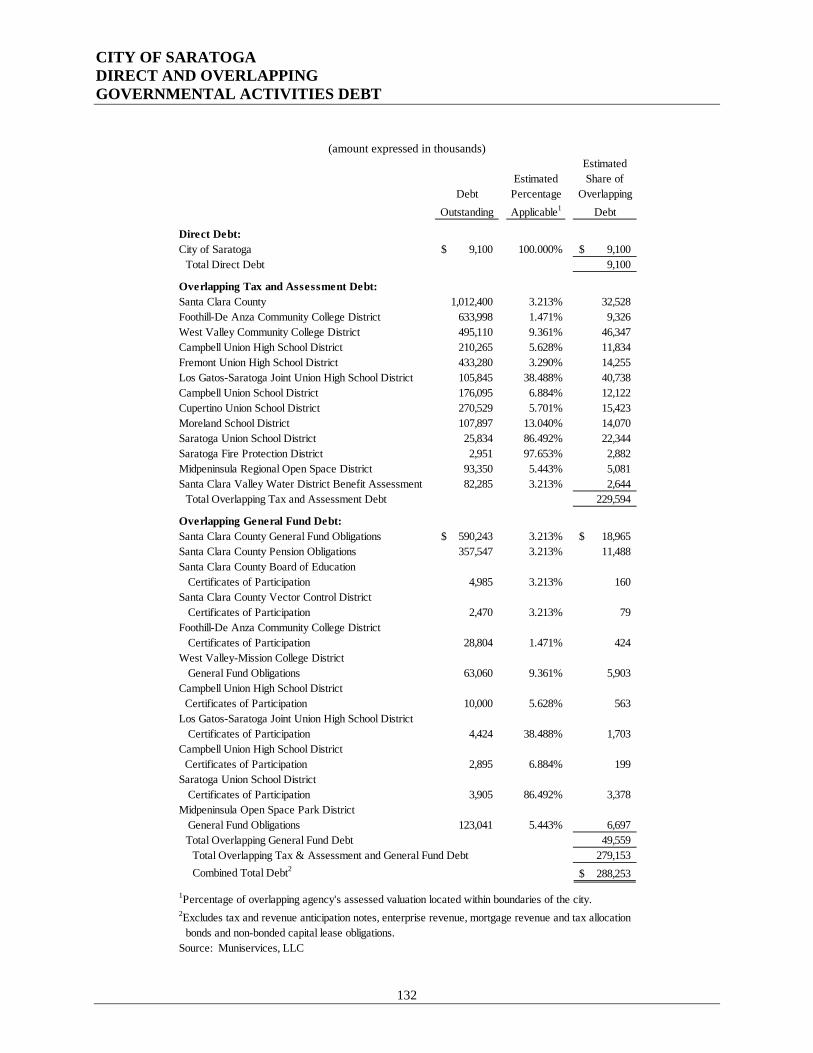
CITY OF SARATOGA DIRECT AND OVERLAPPING GOVERNMENTAL ACTIVITIES DEBT
132
(amount expressed in thousands) Estimated
Estimated Share ofDebt Percentage Overlapping
Outstanding Applicable1 Debt
Direct Debt:City of Saratoga 9,100$ 100.000% 9,100$
Total Direct Debt 9,100
Overlapping Tax and Assessment Debt:Santa Clara County 1,012,400 3.213% 32,528 Foothill-De Anza Community College District 633,998 1.471% 9,326 West Valley Community College District 495,110 9.361% 46,347 Campbell Union High School District 210,265 5.628% 11,834 Fremont Union High School District 433,280 3.290% 14,255 Los Gatos-Saratoga Joint Union High School District 105,845 38.488% 40,738 Campbell Union School District 176,095 6.884% 12,122 Cupertino Union School District 270,529 5.701% 15,423 Moreland School District 107,897 13.040% 14,070 Saratoga Union School District 25,834 86.492% 22,344 Saratoga Fire Protection District 2,951 97.653% 2,882 Midpeninsula Regional Open Space District 93,350 5.443% 5,081 Santa Clara Valley Water District Benefit Assessment 82,285 3.213% 2,644
Total Overlapping Tax and Assessment Debt 229,594
Overlapping General Fund Debt:Santa Clara County General Fund Obligations 590,243$ 3.213% 18,965$ Santa Clara County Pension Obligations 357,547 3.213% 11,488 Santa Clara County Board of Education Certificates of Participation 4,985 3.213% 160 Santa Clara County Vector Control District Certificates of Participation 2,470 3.213% 79 Foothill-De Anza Community College District Certificates of Participation 28,804 1.471% 424 West Valley-Mission College District General Fund Obligations 63,060 9.361% 5,903 Campbell Union High School District Certificates of Participation 10,000 5.628% 563 Los Gatos-Saratoga Joint Union High School District Certificates of Participation 4,424 38.488% 1,703 Campbell Union High School District Certificates of Participation 2,895 6.884% 199 Saratoga Union School District Certificates of Participation 3,905 86.492% 3,378 Midpeninsula Open Space Park District General Fund Obligations 123,041 5.443% 6,697
Total Overlapping General Fund Debt 49,559 Total Overlapping Tax & Assessment and General Fund Debt 279,153 Combined Total Debt2 288,253$
1Percentage of overlapping agency's assessed valuation located within boundaries of the city.2Excludes tax and revenue anticipation notes, enterprise revenue, mortgage revenue and tax allocation
bonds and non-bonded capital lease obligations.Source: Muniservices, LLC

CITY OF SARATOGA DEMOGRAPHIC AND ECONOMIC STATISTICS LAST TEN YEARS
133
Personal Per CapitaFiscal City Income Personal Labor UnemploymentYear Population1 (in thousands)2 Income2 Force3 Rate3
2009 31,679 1,747,699 55,169 13,300 6.0%2010 31,997 2,401,151 75,043 13,200 5.6%2011 30,195 2,211,963 73,256 13,400 5.0%2012 30,363 2,119,463 69,804 14,000 4.4%2013 30,706 2,179,904 70,993 13,900 4.2%2014 30,887 2,243,458 72,634 14,200 3.4%2015 30,799 2,248,481 73,005 15,100 2.7%2016 30,219 2,239,926 74,123 14,700 2.9%2017 30,569 2,374,919 77,690 14,600 2.7%2018 31,435 2,597,561 82,633 15,000 2.8%
Source: 1Popluaton information from California State Controller's Office2US Census Data, adjusted for inflation, MuniServices LLC3EDD Labor Market Information Division, MuniServices LLC
10,000
15,000
20,000
25,000
30,000
35,000
2009 2010 2011 2012 2013 2014 2015 2016 2017 2018
Labor Force vs. Population
Population
Labor Forc
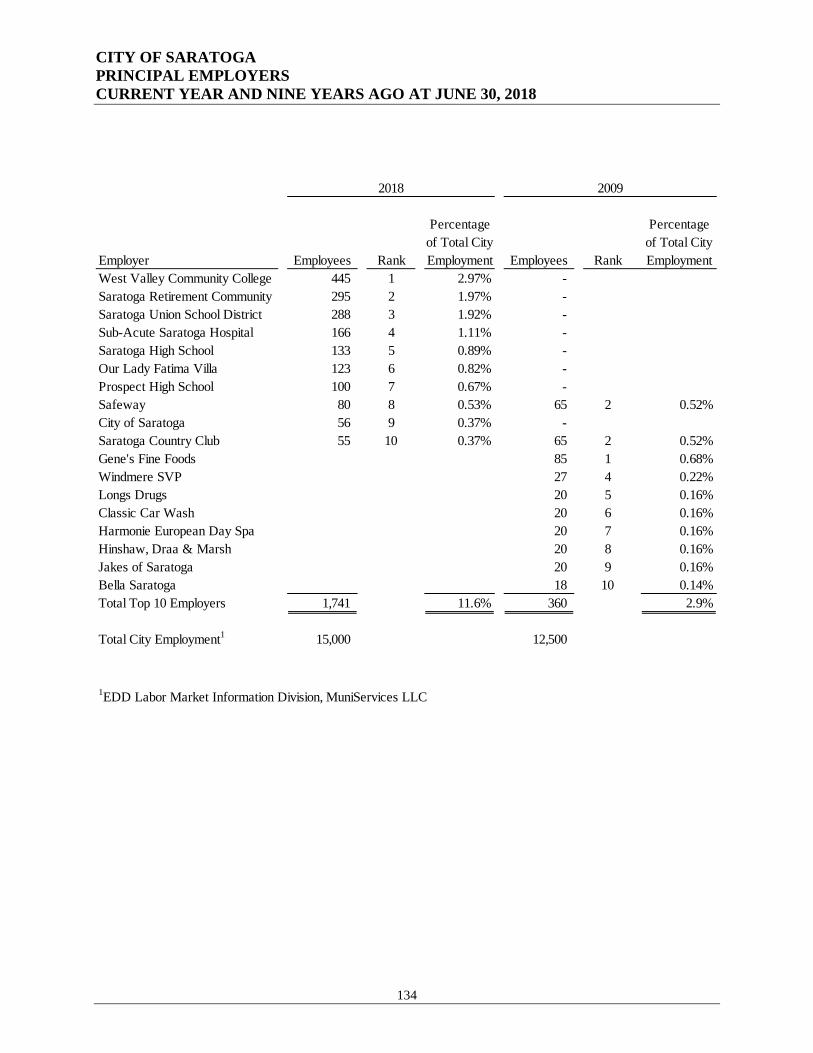
CITY OF SARATOGA PRINCIPAL EMPLOYERS CURRENT YEAR AND NINE YEARS AGO AT JUNE 30, 2018
134
Percentage Percentageof Total City of Total City
Employer Employees Rank Employment Employees Rank EmploymentWest Valley Community College 445 1 2.97% - Saratoga Retirement Community 295 2 1.97% - Saratoga Union School District 288 3 1.92% - Sub-Acute Saratoga Hospital 166 4 1.11% - Saratoga High School 133 5 0.89% - Our Lady Fatima Villa 123 6 0.82% - Prospect High School 100 7 0.67% - Safeway 80 8 0.53% 65 2 0.52%City of Saratoga 56 9 0.37% - Saratoga Country Club 55 10 0.37% 65 2 0.52%Gene's Fine Foods 85 1 0.68%Windmere SVP 27 4 0.22%Longs Drugs 20 5 0.16%Classic Car Wash 20 6 0.16%Harmonie European Day Spa 20 7 0.16%Hinshaw, Draa & Marsh 20 8 0.16%Jakes of Saratoga 20 9 0.16%Bella Saratoga 18 10 0.14%Total Top 10 Employers 1,741 11.6% 360 2.9%
Total City Employment1 15,000 12,500
1EDD Labor Market Information Division, MuniServices LLC
2018 2009

135
This page is intentionally blank

CITY OF SARATOGA FULL-TIME EQUIVALENT CITY GOVERNMENT EMPLOYEES BY FUNCTION LAST TEN FISCAL YEARS
136
2009 2010 2011 2012FunctionGeneral government 12.00 11.75 11.45 10.80 Public works 21.75 21.75 21.65 21.55 Community development 14.00 12.00 12.00 12.00 Parks and recreation 10.60 9.35 9.50 9.50
Total 58.35 54.85 54.60 53.85
Source: City of Saratoga Budget Document
Fiscal Year
-
10
20
30
40
50
60
2009 2010 2011 2012 2013 2014 2015 2016 2017 2018
Full-Time Equivalents
Parks & Rec
Comm Deve
Public works
General gov'

137
2013 2014 2015 2016 2017 2018
10.90 13.65 13.70 13.70 13.65 14.55 20.65 20.75 20.65 20.65 20.65 21.15 11.00 12.00 12.00 12.00 12.00 12.50 9.60 9.60 9.55 9.55 8.35 8.30
52.15 56.00 55.90 55.90 54.65 56.50

CITY OF SARATOGA OPERATING INDICATORS BY FUNCTION LAST TEN FISCAL YEARS
138
2009 2010 2011 2012Function
Part 1 crimes1 282 173 373 287 Total incidents 41,384 39,942 41,642 35,664 Police reports 1,949 1,273 1,549 1,329
Public WorksStreet resurfacing (miles) 6 3 - 6 Street lights repaired 25 24 25 41 Potholes filled (sq. ft.) 10,000 10,000 11,000 10,000
Community DevelopmentTotal permit valuation ($000) 61,117 44,658 50,936 59,675
Parks and RecreationClasses, trips (enrollment) community events 4,698 4,366 6,135 5,479 Adult Exercise (e.g. JS Dance. Jazzerxcise) 515 545 661 647 Sports programs (e.g. Adult basketball, softball) 459 423 - - Preschool programs (enrollment) 171 161 142 132 Staffed Day/summer camps (enrollment) 225 331 326 - Teen/youth council (enrollment) 419 2,110 1,323 787
1Part 1 Crimes are the following as reported to DOJ: homicide, rape, robbery, burglary, assault, theft,auto theft, and arson.
Source: City of Saratoga various records
Fiscal Year

139
2013 2014 2015 2016 2017 2018
277 408 315 463 301 190 40,141 41,228 40,695 39,213 38,893 32,222 1,106 978 917 1,334 1,295 927
6.2 4.3 2.5 15.2 0 - 29 34 39 33 37 15
12,060 11,000 10,500 21,010 13,000 9,000
79,896 79,702 89,929 75,599 106,631 128,062
5,365 6,235 8,390 5,898 5,081 5,769 1,663 2,173 1,650 2,099 2,824 2,082
- - - - - - 188 274 186 180 221 224 45 160 90 172 71 129
605 673 747 848 1,049 927

CITY OF SARATOGA CAPITAL ASSET STATISTICS BY FUNCTION LAST TEN FISCAL YEARS
140
2009 2010 2011 2012Function
Public safetyPolice Station - - - - Fire Station Saratoga Fire District 1 1 1 1 Central Fire District 1 1 1 1
Public WorksStreet Miles - Private 14 14 14 14 Street Miles - Public 140 140 140 140 West Valley Sanitation District Number of Connections 8,683 8,687 8,664 8,679 Length of Sewer Lines 127 127 127 127 Cupertino Valley Sanitation District Number of Connections 2,938 2,949 2,954 2,959 Length of Sewer Lines 37 37 37 37
Parks and RecreationParks Acreage 84 84 84 84 Parks 15 15 15 15
Source: City of Saratoga various records
Fiscal Year

141
2013 2014 2015 2016 2017 2018
- - - - - -
1 1 1 1 1 1 1 1 1 1 1 1
14 14.5 14.5 14.5 14.5 14.5141 142 142 142 142 142
8,821 8,919 8,402 8,488 8,563 8,602 127 127 128 129 126 126
2,961 2,963 2,963 2,999 3,000 3,000 37 37 37 37 37 37
84 84 84 148 148 148 15 15 15 16 16 16