Embed Size (px)
Citation preview

1California Infrastructure Report Card: A Citizen’s Guide - 2012
Table of ContentsMessage from ASCE California . . . . . . . . . . . . . . . . . . . . . . . . . . . . . . . . . . 3
Introduction . . . . . . . . . . . . . . . . . . . . . . . . . . . . . . . . . . . . . . . . . . . . . . . . . 5
Who Pays for Infrastructure? . . . . . . . . . . . . . . . . . . . . . . . . . . . . . . . . . . . 6
Renewing California . . . . . . . . . . . . . . . . . . . . . . . . . . . . . . . . . . . . . . . . . . 7
Grading Our Public Works . . . . . . . . . . . . . . . . . . . . . . . . . . . . . . . . . . . . . 7
Report Card . . . . . . . . . . . . . . . . . . . . . . . . . . . . . . . . . . . . . . . . . . . . . . . . . 8
Understanding Infrastructure Issues . . . . . . . . . . . . . . . . . . . . . . . . . . . . . 10
Aviation . . . . . . . . . . . . . . . . . . . . . . . . . . . . . . . . . . . . . . . . . . . . . . . . . . . 12
Levees / Flood Control Systems . . . . . . . . . . . . . . . . . . . . . . . . . . . . . . . . 22
Ports . . . . . . . . . . . . . . . . . . . . . . . . . . . . . . . . . . . . . . . . . . . . . . . . . . . . . . 30
Solid Waste . . . . . . . . . . . . . . . . . . . . . . . . . . . . . . . . . . . . . . . . . . . . . . . . . 36
Transportation . . . . . . . . . . . . . . . . . . . . . . . . . . . . . . . . . . . . . . . . . . . . . . 44
Urban Runoff . . . . . . . . . . . . . . . . . . . . . . . . . . . . . . . . . . . . . . . . . . . . . . 52
Wastewater . . . . . . . . . . . . . . . . . . . . . . . . . . . . . . . . . . . . . . . . . . . . . . . . 59
Water . . . . . . . . . . . . . . . . . . . . . . . . . . . . . . . . . . . . . . . . . . . . . . . . . . . . . 70
What You Can Do . . . . . . . . . . . . . . . . . . . . . . . . . . . . . . . . . . . . . . . . . . . 76
Methodology . . . . . . . . . . . . . . . . . . . . . . . . . . . . . . . . . . . . . . . . . . . . . . . 77
Glossary . . . . . . . . . . . . . . . . . . . . . . . . . . . . . . . . . . . . . . . . . . . . . . . . . . 79
Committee Memberships . . . . . . . . . . . . . . . . . . . . . . . . . . . . . . . . . . . . . 81
Executive Committee . . . . . . . . . . . . . . . . . . . . . . . . . . . . . . . . . . . . . . . . 81
Infrastructure Working Committees . . . . . . . . . . . . . . . . . . . . . . . . . . . . . 81
References . . . . . . . . . . . . . . . . . . . . . . . . . . . . . . . . . . . . . . . . . . . . . . . . . 89
ASCE . . . . . . . . . . . . . . . . . . . . . . . . . . . . . . . . . . . . . . . . . . . . . . . . . . . . . 91
APWA . . . . . . . . . . . . . . . . . . . . . . . . . . . . . . . . . . . . . . . . . . . . . . . . . . . . 92
ACEC . . . . . . . . . . . . . . . . . . . . . . . . . . . . . . . . . . . . . . . . . . . . . . . . . . . . 93
UCI Civil & Environmental Engineering Affiliates . . . . . . . . . . . . . . . . . 94

2 American Society of Civil Engineers

3California Infrastructure Report Card: A Citizen’s Guide - 2012
Message from ASCE CaliforniaDear Friend:This California Infrastructure Report Card (“CAIRC” or “Report Card”) has been prepared by American Society of Civil Engineers (ASCE) in California . ASCE has over 18,000 members in both the public and private sectors throughout the state . The support for this Report Card is founded in the engineering profession represented by not only ASCE, but organizations such as American Public Works Association (APWA), UC Irvine Civil & Environmental Engineering Affiliates (UCI CEE), American Council of Consulting Engineers (ACEC), and others, to name a few . As the stewards of our infrastructure, we have a moral duty to pass on infrastructure capable of enhancing the health of the people and their economic livelihood to future generations . We owe our economic prosperity, public safety, and quality of life to the infrastructure that serves us everyday, according to the ASCE National Report Card . Infrastructure maintenance and renewal is critical for sustaining the economic engine of California . However, funding limitations continue to severely restrict the improvements that are absolutely necessary for the continued upkeep of our infrastructure . This Report Card rates eight infrastructure categories and recommends public policy options and funding needed to rehabilitate and revitalize our infrastructure and to continue California’s economic growth and overall quality of life that the state’s residents enjoy . California is one of the few states in the country that has developed regional Infrastructure Report Cards . The California Infrastructure Report Card was updated using these Regional Infrastructure Report Cards as background material, as well as other data sources, and the expertise of over 100 volunteers from both the public and the private sector . The grades in this Report Card are mixed . Grades for Aviation, Levees/Flood Control, Ports, and Transportation improved slightly . Solid Waste, Urban Runoff, and Wastewater grades did not change, and the grade for Water actually decreased . California’s overall GPA has improved slightly from a “C-” in 2006 to a “C” in 2012 . In 2006, the Report Card forecasted $370 billion over 10 years in unfunded investment needs which could bring up the grades to a “B” . In 2012, the 10-year total unfunded infrastructure investment required has increased to $650 billion . In 2006, California voters passed almost $42 billion worth of infrastructure measures on the ballots, and although that was a good start and it has certainly helped at least maintain or in some cases improve the grades, the 2006 ballot measures represent only a drop in the bucket compared to the $650 billion needed to move California in the right direction .Much work needs to be done on the local and state level to improve the grades . Updating the Report Card was the first step in highlighting the state of our infrastructure. In the mean time our task is to educate our public on the importance of infrastructure maintenance, encourage our colleagues in the public sector to continue to advocate for infrastructure funding, and to actively communicate to our elected officials the important role that infrastructure plays in our everyday lives . We ask you to join this campaign and get involved an infrastructure champion. Talk to your friends, neighbors, state officials, and national legislators about importance of infrastructure investment and the fact that now is exactly the time to increase, not cut, spending on our infrastructure . We have a long road ahead of us, but as Lao-Tzu said over 3,000 years ago, “Journey of a thousand miles begins with a single step.” To remain a strong and prosperous state we must maintain and continue to improve infrastructure that makes California’s quality of life second to none .
Yazdan (Yaz) Emrani, P.E. Mike Kincaid, P.E.Co-Chair Co-ChairCalifornia Infrastructure Report Card California Infrastructure Report CardPast President, ASCE Orange County Branch Past President, ASCE San Francisco Section

4 American Society of Civil Engineers

5California Infrastructure Report Card: A Citizen’s Guide - 2012
IntroductionAmerica’s and California’s Infrastructure -A Legacy in PerilThe magnificent Golden Gate and San Diego–Coronado bridges; the Hoover, the Grand Coulee and other great dams and water systems of the west; our transcontinental railroads and unparalleled network of modern interstates; the airports, seaports, tunnels and transit systems that serve our cities—all of these are part of California’s infrastructure .
California in some respects is a microcosm of our nation . We are a culturally diverse and rapidly growing state . As such, our infrastructure is beginning to show its age . With 38 million residents, California is the most populated state in the country and its economy ranks as the world’s eighth largest economy . This trend is expected to continue into the foreseeable future . Over the next 20 years, California is expected to grow at a rapid pace . Based on some estimates our state will add an additional 10 million residents over the next 20 years, putting California’s population at a staggering 48 million people .
A well-designed and maintained infrastructure anchors our economy and secures our quality of life . Investment in infrastructure is vital to our state’s productivity, competitiveness and economic well-being . Congestion on our highways alone costs the United States an estimated $100 billion a year . Communities with efficient road systems, good schools and sewers can better attract residents and businesses . With updated water treatment plants, we can trust our tap water is safe. When traffic flows, goods and services move to market faster and more efficiently, lowering the cost to consumers. Modern school buildings provide a secure and healthy environment where our children can concentrate on learning. Efficient waste management programs reduce waste volume, and dispose of and contain waste effectively .
California’s grades are slightly better than the nation as a whole . The 2009 National grade is a “D .” California received an overall grade of “C .” This grade is understandable since up until 36 years ago infrastructure investment made up 20 percent of the state’s annual budget . Even so, we see elements of our infrastructure in the older parts of the state that are operating well past the design life and need upgrading or replacement . In other parts of the state, infrastructure is 46 plus years old and will soon need significant upgrading. It is essential that we respond now to prevent a California infrastructure meltdown .

6 American Society of Civil Engineers
Who Pays for Infrastructure?Our public works are public assets . We all have a stake in their upkeep and operation, and we all share in the expense of construction and maintenance . Sometimes, infrastructure is paid for by those who actually use it most, through tolls, utility bills or special taxes on gas, airline tickets and other items . However, because infrastructure improvements affect us all by supporting our economy and providing fundamental community services, a portion of the cost is usually borne by the public through general tax revenues .
For years, the federal government has played a large role in collecting and distributing funds for infrastructure improvements . Increasingly, however, this responsibility is being turned over to state and local governments, who may finance infrastructure projects through bonds, sales taxes or general tax revenues . This places responsibility for infrastructure renewal and development squarely with individual voters, who must approve bond issues and elect political leaders who will make addressing our infrastructure needs a priority .
In the past five decades, our capital investment has plummeted precipitously. In the 1950s and 60s, California spent 20 cents of every dollar on capital projects . By the 1980s, that figure dropped to less than five cents on the dollar. Current estimates put infrastructure investment at around a penny on the dollar . This is despite ever-increasing demands presented by population growth and economic development . Much of the state’s public infrastructure was designed and built to serve a population half the size of California’s 38 million residents today, and we face an ever growing population in years to come .
It is the old adage of “Pay me now or pay me later .” The needed infrastructure investment in California has increased from $37 billion annually in the 2006 Infrastructure Report Card to $65 billion annually in this year’s Infrastructure Report Card in just six years . Even with state-of-the-art materials and technology, infrastructure naturally deteriorates over time with wear-and-tear, so as engineers we are always playing a catch-up game even to maintain the infrastructure we have . As Californians, we have to look at a variety of options including “Pay as you go,” bonds or special assessments to be able to keep pace with infrastructure investment demands facing us .

7California Infrastructure Report Card: A Citizen’s Guide - 2012
Renewing CaliforniaIn January 1848, gold was discovered at Sutter’s Mill in the Sierra Nevada foothills about 40 miles east of Sacramento beginning the California Gold Rush, which had the most extensive impact on population growth in the state from any era . The Gold Rush brought the world to California . California was given official statehood by Congress on September 9, 1850, as part of the Compromise of 1850 . By 1855, some 300,000 “Forty-Niners” had arrived from every continent . California has continued to grow and thrive into the 21st Century making it the most populous state in the Union . California’s infrastructure like the state itself is showing its age .
Over 38 million people rely upon these systems every day and their dependability and quality are silent, but significant contributors to our economic prosperity and quality of life. The Citizen’s Guide is designed first to engage California’s leaders and then the citizenry at large in a call to action for continued, strong investment in our state’s infrastructure . Never in our state’s history has this been more important: California stands poised on the brink of tremendous growth . Now is the time to protect our past investments and to plan for our infrastructure future . This guide will help us identify the most pressing needs facing our state’s infrastructure systems . We invite you to join a growing list of concerned citizens making the case for renewing California .
Grading Our Public Works The CAIRC working groups and their Expert Advisory Groups (EAG) assigned letter grades to the eight main categories of California public infrastructure reviewed this year . The average grade is “C .” The Report Card, on pages 8 and 9, shows how California’s roads, bridges, water and sewer systems measure up .
ASCE California Infrastructure Report Card 2012
www.ascecareportcard.org
2006 2012
Aviation C- C+
Levees/Flood Control F D
Ports C+ B-
Solid Waste B B
Transportation D+ C-
Urban Runoff D+ D+
Wastewater C+ C+
Water C+ C
California’s Infrastructure GPA
C- C
Annual Investment Needs (Billions)
$37 $65

8 American Society of Civil Engineers
AviationThe State of California is experiencing massive growth with a projected population in excess of 54,000,000 by the year 2040. Significant actions must be taken to meet the anticipated population demand requirements for air transportation, particularly commercial, foreign and domestic travel, and air cargo and to maintain the significant economic development provided by this industry . This demand is a result of consistent growth within the state as well as limited capacity and increasing restrictions on aviation infrastructure growth within regions. California must ensure efficient air travel and cargo transport by expanding airports and building regional airports to distribute the influx of passengers and cargo or risk losing its competitive edge. Estimated annual capital investment needed to move to a “B” grade is $300 million per year over the next ten years .
Levees/Flood ControlThe backbone flood control and drainage systems serving California cities including channels, levees, retarding basins, dams and pump stations vary widely in condition and capacity to prevent flooding from major storms. In California’s Central Valley, there is a real potential for catastrophic disaster to life and property from the failure of fragile levee systems . These levees protect thousands of homes, businesses and critical community infrastructure. Current flood control funding shortfalls across the state, based upon available budget estimates for regional flood control facilities alone are in excess, of $2 .8 billion per year over the next 10 years .
PortsThe California sea ports provide a vital link for goods movement from ship to shore, and connection to the National Highway System and the transcontinental railroad network . With the cooperation of city, county, state, and federal agencies, the California sea ports own and operate an extensive infrastructure system that facilitates the movement of cargo from ship to shore and vice-versa . The California sea ports consist of eleven large to moderate-sized maritime facilities . There are more than 20 other smaller craft harbors and navigable landings, but they are not included in this assessment . . The report card includes an infrastructure assessment using existing records and documents . The overall grade for the California sea ports based on a weighted factor is “B-“ with total investments of $1 .7 billion per year for the next 10 years for a total investment of $10 .7 billion .
Solid WasteSolid waste management systems in California are operated by a combination of private and public facilities, which include collection, processing, and sanitary landfills. Nearly 65 percent of solid waste generated is diverted from landfills due to recycling and diversion programs. Current statewide landfill capacity is 25 years, giving California sufficient capacity through the year 2037. The California Solid Waste Management infrastructure is assigned a “B” grade based on a thorough review of its facilities’ condition, capacity, operations and security . Solid waste management systems require continued current annual funding levels of $8 billion per year for the next 10 years to maintain the current grade .
C+
D
B-
B

9California Infrastructure Report Card: A Citizen’s Guide - 2012
TransportationCalifornia’s transportation infrastructure, consisting of streets, highways, bridges, rail systems and transit operations, is suffering from a lack of sufficient investment for the operations and maintenance of existing facilities and dedicated funding sources for new improvements to the system . The economy and growth of California have long been associated with an advanced transportation system, and continued public investment is needed . The overall grade for transportation infrastructure in California has been determined to be a low “C-“ due to existing conditions and the lack of adequate funding . There is a need for $10 billion per year more to be spent for ongoing maintenance of existing facilities and an investment of $36 .5 billion in order to raise Transportation to a “B” grade .
Urban RunoffFunding for urban stormwater infrastructure has failed to keep pace with the requirements of state and federal regulation for surface water, and surface water pollution persists over 20 years after regulation has been in force . Improvements to urban runoff programs and infrastructure have been substantial over the past decade, but these improvements have been overshadowed and outpaced by additional regulatory requirements in NPDES permits and by obligations placed on permit holders under the total maximum daily loads (TMDL) program . Simply put, urban runoff stormwater programs are underfunded . Improving the urban runoff infrastructure grade from “D+” will take a substantial new investment, estimated at $6 .7 billion per year for the next 10 years . Investment in key program areas include infrastructure, regulation, and the control of sources of pollutants in our environment .
WastewaterSignificant wastewater infrastructure investments are needed to address renewal and replacement, maintenance, security and reliability funding . These investments would increase the reliability and sustainability of infrastructure and protect our coastal and inland water resources into the future . The annual investment needed to raise our Wastewater infrastructure grade from a “C+” to a “B” is $4 .5 billion annually for the next 10 years . California’s 100,000 miles of sewers and over 900 wastewater treatment plants generally perform adequately to protect the water resources of the state by managing the approximately 4 billion gallons of wastewater generated every day by California’s citizens and businesses . Nevertheless, the condition and performance of California wastewater infrastructure (sewers, treatment plants and effluent disposal) vary significantly across the state and from agency to agency. The wastewater collection systems continue to require significant investments to be in compliance with the state-wide Waste Discharge Requirements adopted in 2006 .
WaterCalifornia’s water infrastructure is vital to the economic well-being, environmental integrity, and overall quality of life of all Californians . Water received a grade of “C”, which is a reduction from the 2006 grade of “C+” . The ability to meet the water needs of existing and future Californians is not only dependent on our available supplies, but also on the condition of the numerous facilities required to collect, store, treat, and deliver that water to customers. Significant investments are still needed to address renewal and replacement, maintenance, security and reliability for the State’s water infrastructure . These investments will move water supply and related infrastructure closer to a path of sustainability . The annual investment needed for the next 10 years is estimated to be $4 .6 billion .
C-
D+
C+
C

10 American Society of Civil Engineers
Understanding Infrastructure IssuesNow that you have seen California’s infrastructure report card, you may be asking how you can help improve our state’s infrastructure . Our suggestions are the same as given in the ASCE National Report Card:
Infrastructure is a complex network of public works, which includes roads, bridges, airports, dams, school facilities, and utilities . The rules governing its planning, financing, construction, and upkeep are equally complex. Whether your goal is to shorten your daily commute, attract new business to your community, or protect the environment for your children, gaining a better understanding of these issues is the first step toward becoming an advocate for infrastructure renewal in your community .
As you read through this Citizen’s Guide, think about the following:
Be an informed citizen.In order to educate public officials about infrastructure needs in your community, you must understand what those needs are through this Infrastructure Report Card . How does your community measure up? Demand increased federal and state leadership to address areas where your community’s infrastructure is not making the grade .
Demand continuous and timely maintenance.If transportation, water, and other infrastructure facilities are not kept in sound condition, they cannot support the level of service they are designed to handle . Regular maintenance prolongs use and minimizes the need for costly repairs . The money saved can be used to fund other community priorities . Unfortunately, policies often encourage new construction at the expense of maintenance . Demand that lifecycle and ongoing maintenance costs are taken into account to meet the needs of current and future users .
Think long-term.Renewing America’s infrastructure is an ambitious goal . It cannot be achieved overnight . Furthermore, the roads, bridges, water treatment plants and other facilities built today must serve for decades to come . Comprehensive planning and long-term investment are key to sound decisions about infrastructure . Demand that national, state and regional infrastructure plans be developed that complement a national and local vision and focus on system-wide results . Demand increased and improved infrastructure investment from all stakeholders .

11California Infrastructure Report Card: A Citizen’s Guide - 2012
Consider all the factors influencing infrastructure decisions. Building a new highway has implications beyond the immediate highway corridor . For example, concern that a new highway may displace wetlands must be balanced against the reduction in air pollution that will result from decreased traffic congestion.
Do more with less.Clearly, money alone will not solve our infrastructure problems . Solutions to urban problems such as traffic congestion and contaminated water require new technologies and approaches. Research can help identify more efficient designs and longer lasting, maintenance-free materials . And, we can change our behavior-through recycling, telecommuting, or using mass transit, for example-to reduce the demand on our infrastructure .
Preserve the environment.To use the nation’s resources most effectively, we must balance environmental and economic goals . Land use and transportation patterns designed to foster economic growth and personal mobility can be developed in harmony with environmental benefits. Promote sustainability and resilience in infrastructure to protect the natural environment and withstand natural and man-made hazards .
Look at the big picture.Remember that beyond the immediate, individual benefits you gain from infrastructure improvements, there are broader community benefits. For example, even though you may not use the new mass transit system, its construction will reduce traffic congestion on local roads and increase nearby property values .

12 American Society of Civil Engineers
Aviation2006 2012
C- C+
SummaryThe state of California is experiencing massive growth with a projected population in excess of 54,000,000 by the year 2040. Significant actions must be taken to meet the anticipated demand requirements for air transportation, particularly commercial, foreign and domestic travel, and air cargo and to maintain the significant economic development provided by this industry. This demand is a result of consistent growth within the state as well as limited capacity and increasing restrictions on aviation infrastructure growth within regions. California must ensure efficient air travel and cargo transport by expanding airports and building regional airports to distribute the influx of passengers and cargo or risk losing its competitive edge . Estimated annual capital investment needed to move to a B grade is $0 .3 billion per year, over the next 10 years .
IntroductionCommercial aviation facilities in California are continuing to face significant challenges in meeting future capacity needs tied to future passenger and cargo demands over the next 25 years . With the population of California expected to approach 54 million persons by 2040, aviation facilities, comprised of major international and regional airports serving the State, must be upgraded . This evaluation reviewed ten (10) of the Primary / Commercial Service airports in the State which together serve over 167 million annual passengers .

13California Infrastructure Report Card: A Citizen’s Guide - 2012
These are:
Northern California Southern CaliforniaSan Francisco International - SFO Los Angeles International – LAXOakland International – OAK Bob Hope Burbank - BURMineta San Jose International – SJO Long Beach Municipal – LGBSacramento International – SMF Orange County John Wayne – SNA Ontario International – ONT San Diego International – SAN
A variety of measures were used to evaluate current infrastructure of these airports . The infrastructure grades for the ASCE 2010 Orange County, 2010 Inland Empire and 2011 Bay Area Infrastructure Report Cards were taken into consideration . The Los Angeles and San Diego Regional Report Cards did not include the Aviation category in their 2005 Infrastructure Report Cards . The Sacramento Regional Report Card did not evaluate Aviation in their 2006 Report Card . The 2009 ASCE National Infrastructure Report Card was also referenced .
In establishing the grade for California’s Primary Commercial Airports the main factors taken into consideration for each facility were: Condition, Capacity, Operations and Security . The assessment of condition considered the facility’s age and the serviceability of runways and terminals as well as the age and serviceability of highway and local roadway access to the airport . The capacity assessment includes an evaluation of the adequacy of each of the following elements for each airport: Terminals ground transportation, runway capability, manor highways and transit systems serving the airport, and bottlenecks that require upgrades at the airport . Operations considered the status of renewal, replacement, and maintenance projects that have been deferred and backlogged due lack to adequate capital improvement program (CIP) as well as maintenance and repair (M&R) funding . Security assessments were made based upon both national and regional requirements, focusing upon compliance with terminal security guidelines relative to protection against terrorists acts and protection of local access roads, airport facilities, access points, baggage screening as well a passenger screening respectively . The 2012 Aviation Grade has been determined to be “C+,” an increase from the 2006 California Aviation Grade of “C-.” The following are brief overviews of operations at five commercial airports in Northern California and seven in Southern California .
Northern California The Northern California Region consists of thirteen (13) primary airports, of which four (4) are major operating commercial airports which impact the Nation’s aviation infrastructure the most . All four major airports have undergone extensive capital improvements over the last decade . This has increased each terminal’s capacity considerably, and has also improved their

14 American Society of Civil Engineers
groundside transportation capacities . Because of these recent upgrades, the existing capacity and condition receive an overall grade of “C+ .”
However, San Francisco International Airport encounters excessive delays during low visibility conditions, which impacts flight schedules across the country . Resolution of this problem is heavily dependent upon implementation of “NextGen” technology by the Federal Aviation Administration (FAA), which would allow closer separation of aircraft landing under Instrument Flight Rules (IFR) conditions . It is estimated that it would require a nation-wide investment of over $6 billion to install the new equipment and train personnel to implement the “ NextGen” systems . SFO and many other primary airports in the country would benefit from this investment.
In the long range, there are critical restraints on further growth at the San Francisco, Oakland, and San Jose airports . In the case of San Francisco and Oakland, growth is restrained by their being prevented from filling in San Francisco Bay . In the case of Norman Y . Mineta (San Jose) International Airport, the City of San Jose has an ordinance in place limiting the number of terminal gates to 40 .
Although Sacramento International Airport’s excess capacity could theoretically alleviate some of the traffic from the Bay Area, it is 90 miles from the Bay Area is impractical . The following table denotes for each of the four facilities their legal constraints, the number of passengers served in 2010, and the maximum capacity for each in millions of annual passengers (MAP) .
AIRPORT CONSTRAINTS2010 PASSENGERS
SERVED (MAP)MAXIMUM CAPACITY
San Francisco International
Legally Constrained 38 45
Oakland International
Legally Constrained 9 .6 12
Norman J . Mineta (San Jose)
International
Legally and Physically
Constrained12 .2 14 .4
Sacramento International No Constraints 10 17
TOTALS 69.8 88.4
Following is a brief discussion of factors affecting each of the airports analyzed .

15California Infrastructure Report Card: A Citizen’s Guide - 2012
SAN FRANCISCO INTERNATIONAL AIRPORT (SFO)SFO’s recent highly successful remodeling of Terminal Two has increased SFO’s terminal capacity to 45 MAP . Present forecasts estimate the terminal capacity will be exceeded near the Year 2020, at which time six more gates will be needed to carry SFO beyond the Year 2020 demands .
SFO’s runway capacity is severely restricted under IFR conditions, when the airport is encountering low visibility conditions . It is estimated that without improvements, delays at SFO could reach critical levels after the Year 2020 . (Reference: 2011 Regional Airport Study by SH&E of ICF International for the Association of Bay Area Governments, Metropolitan Transportation Commission, and Bay Conservation and Development Commission) .
The FAA is presently developing new air traffic control technologies that will alleviate the present “bottleneck” in air traffic under IFR conditions. Implementation of this technology at SFO would extend the date of when the runways capacity beyond the Year 2035 . Although the FAA has successfully perfected the “NextGen” systems, it is estimated that as much as $6 billion would be required nation-wide for the airlines to equip their aircraft and train their crews to take on the “Next Gen” systems .
OAKLAND INTERNATIONAL AIRPORT (OAK)OAK completed a major Terminal Improvement Program in 2008, which increased the airport’s terminal capacity at an estimated 12 MAP . Although they have plans for a new North Terminal, OAK is adopting a “wait and see” approach of scrutinizing passenger traffic trends. The new terminal is estimated to bring the airport’s terminal capacity to 30 MAP, which would give OAK sufficient capacity through the Year 2035. OAK’s airfield is in need of improvements to its taxiway-runway connections and construction of a new North-South cross airport taxiway . Once these improvements have been completed, the runways’ total capacity should exceed 425,000 operations a year which should give OAK sufficient capacity through the Year 2035.
NORMAN Y. MINETA (SAN JOSE) INTERNATIONAL AIRPORT (SJC)San Jose’s International Airport has undergone major expansions over the last decade . Latest forecasts predict that the present terminals’ capacity of 28 gates will “max out” around the Year 2019 . The City of San Jose has an ordinance in place restricting future growth to 12 additional gates - 40 gates in total . This would give the airport sufficient capacity through the Year 2035 but could prevent San Jose from relieving other Bay Area airports of excessive passenger traffic.
The airport’s runways have a capacity of 500,000 operations a year, which is sufficient capacity for beyond the Year 2035.

16 American Society of Civil Engineers
SACRAMENTO INTERNATIONAL AIRPORT (SMF)SMF has recently completed a multi-billion dollar new terminal complex, which provides enough capacity for the foreseeable future; however, there remains a great deal of work on the airside in order to accommodate future passenger projections .
The more critical projects include an extension to Runway 2/20 and adding two cross-field taxiways. These improvements have region-wide implications, in that they would enable SMF to take on A330-sized aircraft and could thereby alleviate some of the Bay Area airports’ air traffic congestion.
Northern California’s Aviation FutureFor Northern California, San Francisco International Airport will most likely remain the primary airport, but will see both its terminals’ capacities and runways’ capacities reach their maximum within the next fifteen (15) years. Once SFO reaches its maximum capacity, the other airports can pick up some of the extra traffic, but they, too, will reach their respective maximum capacities soon thereafter. The legal restrictions from filling the Bay will be tested and perhaps space tradeoffs could be negotiated . Such space tradeoffs would take the form of airports’ purchasing land remote from the airport but still adjacent to the Bay, and then converting that land into Bay marsh land in exchange for permission to fill in the Bay at the airport’s location to accommodate additional runways . Another scenario would have the small regional airports expand their facilities to accommodate the increased air traffic. This, of course, will run into opposition by the communities affected .
Southern CaliforniaSouthern California continues to face significant challenges as growing air passenger and cargo volumes will be approaching the capacity limits at San Diego, Orange and Los Angeles County commercial airports . Most of these airports currently have legal and/or physical constraints that severely limit or completely restrict significant service and capacity expansion. San Diego International Airport is physically restricted and voters turned down an initiative in 2006 to build a second airport at Miramar Marine Corps Air Station (MCAS) . In the past ten years, community opposition has blocked three major airport projects: the conversion of El Toro MCAS into a new commercial airport for Orange County, expansion of Los Angeles International Airport, and expansion of Burbank Airport . Legal constraints limit passenger and cargo operations at both Orange County and Long Beach Airports . Grandfathered under the Airport Noise and Capacity Act (ANCA), both airports are exempt from federal law that now prohibits curfews and capacity constraints .

17California Infrastructure Report Card: A Citizen’s Guide - 2012
AIRPORT CONSTRAINTS2010 PASSENGERS
SERVED (MAP)MAXIMUM CAPACITY
Orange County John Wayne
Legally Constrained 8 .6 10 .5
Long Beach Legally Constrained 3 .0 4 .2
Burbank Physically Constrained 4 .5 9 .0
Los Angeles International
Legally Constrained (using
gate constraints) 59 .1 78 .9
Ontario International No Constraints 4 .8 12 .0
San Diego International
Physically Constrained 17 .4 28 .0
TOTALS 97.4 142.6
Viewed as an interlocking mega-region, the six county areas that include Los Angeles and San Diego are currently modernizing and upgrading their infrastructure, but by 2025 will be facing serious air transportation challenges that will block economic growth and create transportation gridlock unless a viable solution is identified and implemented. The current total capacity of all commercial airports in the greater Los Angeles area is 142 .6 MAP . Aviation forecasts for the Southern California area including San Diego predict a range of air passenger growth to between 166 MAP and 201 MAP by the year 2030 . The future air passenger capacity deficit for the region ranges from 23.4 to 58.4 MAP and under the current legal or physical constraints; it is infeasible for existing Southern California commercial airports to meet the regional forecasted passenger growth .
Due to the fact of major improvements occurring at the Orange County, Ontario, and Long Beach airports since the last Statewide Infrastructure Report Card in 2006; and considering delays in the improvements at LAX, this analysis has resulted in a Southern California Grade of C+ .
LOS ANGELES INTERNATIONAL AIRPORT (LAX)LAX currently operates under a court-ordered Stipulated Settlement Agreement which permits Los Angeles World Airports (LAWA) the operator of LAX and Ontario, to modernize and newly construct a number of projects, designated as “green light” projects . In exchange, a number of Master Plan projects were put on hold (red light projects) or require further study and negotiation
18 American Society of Civil Engineers
(yellow lights projects) . The Settlement Agreement permits LAWA to address significant safety and modernization issues. However, total passenger capacity is limited to 78 .9 MAP and is controlled by gate constraints . Excess Capacity in 2010 was 19 .8 MAP . Major projects that have been implemented since the 2006 aviation infrastructure report card are the Tom Bradley International Terminal Modernization Project including new gate and concourse area, new in-line baggage screening system will automate and improve the safety and security of baggage at all LAX terminals. Airfield improvements include new taxiways and taxi lanes, Runway Status Light Project to reduce the possibility of runway incursions, and the South Airfield Improvement Project.
SAN DIEGO INTERNATIONAL AIRPORT (SAN)In November, 2006 San Diego voters rejected Proposition A, an advisory ballot measure that would have designated Miramar MCAS as the County’s preferred replacement airport for SAN, the busiest single-runway commercial airport in the nation .
One of the nation’s smallest airports, occupying only 661 acres, SAN has the highest runway use factor of any California airport . Surrounded by San Diego Bay, military facilities, and residential areas, any expansion of SDIA is limited by the physical constraints of the surrounding area . Currently serving 17 .4 MAP through forty-five (45) gates, San Diego County’s air passenger growth is forecast to nearly double to 27 - 33 MAP by 2025 . Meanwhile SDIA is expected to reach operational capacity by 2022 . Excess Capacity in 2010 was 10 .6 MAP . Political constraints have prevented locating a replacement site and physical constraints will prevent further extensive expansion of the current site . The San Diego County Regional Airport Authority and the San Diego Association of Governments just completed a multimodal planning process that evaluated integrated air and rail connections to address future aviation growth . The result of this process is the Regional Aviation Strategic Plan which was released in December 2011 .
BURBANK AIRPORT (BUR)Bob Hope Burbank Airport (BUR) is owned and governed by the Burbank-Glendale-Pasadena Airport Authority, a joint powers authority governed by the three cities in its name . Situated on 730 acres, BUR has fourteen gates and two runways that served 4 .5 MAP in 2010 . Excess Capacity in 2010 was 4 .5 MAP . A 2004 FAA report cited the need for Burbank Airport’s expansion and modernization . According to current safety standards the existing passenger terminal is too close to the runways, but expansion space is virtually non-existent due to encroachment of the surrounding community . Numerous attempts to expand airport facilities have drawn significant opposition from the airport’s closest neighbors . In 2002, the existing terminal was renovated

19California Infrastructure Report Card: A Citizen’s Guide - 2012
and expanded . While plans have existed for years to construct a new passenger terminal north of the existing one, opposition from the City of Burbank resulted in a ten-year moratorium approved in early 2005 on all major airport development or expansion of runways and terminals . Improvements over the next decade will be limited to repaving projects and terminal and baggage system upgrades .
LONG BEACH AIRPORT (LBG)Long Beach Airport operates under one of the strictest noise ordinances in the United States . Adopted in 1995, the Long Beach Noise Ordinance was grandfathered under the federal Airport Noise and Capacity Act (ANCA) and is therefore not subject to ANCA’s operating regulations . The current noise levels permit 41 daily commercial flights. Additional flights are prohibited unless the City determines that new operations will not exceed the approved noise limits . Excess Capacity in 2010 was 1 .2 MAP . Construction began in December 2010 on the $136-million terminal improvement project designed to modernize the facility . The new terminal, new 1,989-space parking structure, ramp improvements, concourse with central garden, and 11 gates will replace temporary trailers where travelers now wait for flights. About $2 million will be spent to refurbish the old terminal, which was built in 1941 and has been declared a historic landmark .
ORANGE COUNTY JOHN WAYNE AIRPORT (SNA)SNA is one of the few airports in the nation that has noise and operational restrictions . Grandfathered under the federal Airport Noise and Capacity Act (ANCA), the initial 1985 Settlement Agreement established curfews, special departure procedures, and other operational restrictions that are now prohibited without federal approval . The Settlement Agreement was amended in 2002, extending the operational and noise restrictions to 2015 . The amendment also permits increases in capacity from 8 .5 to 10 .8 MAP and allows for six (6) new gates and additional aircraft storage . Excess Capacity in 2010 was 1 .9 MAP .
SNA’s terminal opened in 1990 and was designed to accommodate 8 .4 MAP, but over the past few years, has served nearly nine million passengers . SNA recently opened a new multi-level terminal expansion, adding 282,000 square feet to its existing terminal, six (6) new bridged aircraft gates (for a total of 20 bridged gates), dedicated facilities for six (6) commuter aircraft at ground level. The first phase of a new parking structure was also completed, adding more than 2,000 spaces . Phase 2 (1,000+ spaces) will be constructed as the need arises. A reconfigured over-night aircraft parking area addresses aircraft noise after the curfew and an additional right-turn lane on Campus Drive to Bristol Street addresses anticipated ground traffic increases in coming years.

20 American Society of Civil Engineers
ONTARIO INTERNATIONAL AIRPORT (ONT)Ontario International Airport (ONT) is the only Inland Empire airport providing commercial passenger service . With two terminals, twenty-six (26) gates, two (2) major runways, and more than 350,000 sq . ft . of existing hangar space, ONT is capable of serving 12 million passengers annually . Though ONT has experienced a considerable drop in passenger service, from 6 .9 MAP in 2007 to 4 .8 MAP in 2010, Excess Capacity in 2010 was 7 .2 MAP . ONT’s modern terminals, baggage handling system, and surrounding land area are available to accommodate future passenger growth and eventually new terminals and other facilities . The anticipated passenger volume at full land build-out is 30 MAP . No additional runway construction is required to serve the maximum build-out level for aircraft operation .
Southern California’s Aviation FutureIn the past ten years . Southern California has seen the demise of two major airport projects; namely the reuse of El Toro MCAS as a commercial airport and the expansion of LAX to address future growth in aviation demand. Both began the airport master planning process, as required by Federal law, only to be stopped by community opposition fearing more flight operations, more environmental impacts and effects to their quality of life . And while many opponents of these projects pointed to other outlying airports to capture the burgeoning aviation market, until recently very little was done to develop a system that would move the aviation market from the airports located in the coastal counties to the inland airports .
In early 2006, Los Angeles Mayor Antonio Villaraigosa negotiated a settlement agreement on the modernization of LAX, committing to resolve the aviation challenges the Los Angeles basin . Under this agreement the City of Los Angeles has initiated a formal process to move the aviation market from airports in the coastal counties to inland airports that have excess capacity . As a result a process was initiated to implement a shuttle service between downtown Los Angeles to LAX addressing the increasing ground traffic congestion in communities around LAX. He also called for the reactivation of the Southern California Regional Airport Authority, a joint powers authority created to implement a regional aviation system for Southern California . Comprised of the counties of Los Angeles County, San Bernardino County, Riverside County, Orange county and the City of Los Angeles it was tasked to implement a decentralized aviation system

21California Infrastructure Report Card: A Citizen’s Guide - 2012
Public Policy Considerations 1 . Continue annual operational and capital investment at
current levels or higher
2 . Seek full funding for the California Airport Improvement Program (AIP)
3 . Continue to fund security upgrades at all facilities
4 . Develop strategies to integrate high speed rail linkage to international and regional airports
5 . Implement environmental streamlining
6. Modernize air traffic control systems
SecurityCalifornia’s airports continue to work in concert with the Department of Homeland Security (DHS) and the Transportation Security Administration (TSA) and have been found to be in compliance with federal security requirements . As an example, TSA Standardized Security Screening Procedures are applied across the board to all airports . Additional improvements were found to be in place in several airports . For example, Explosive Detection Systems, such as those recently installed at John Wayne Airport in Orange County, enhance airport security and allow passengers to move through the airport and board aircraft with virtually no delays .
Infrastructure FundingTotal capital investment needs for Commercial Service Primary and Commercial Service Non-Primary facilities as documented in the “California Capital Improvement Plan – California Aviation System Plan, 2012 – 2021,” (Caltrans, September 2011) are projected at $3 billion or 0 .3 billion per year for the next 10 years . Funding through FAA, state, regional, and local sources as well as passenger and cargo based fees, are the primary sources of revenue . Other potential funding sources include: Airport Bonds, Airport Improvement Program (AIP) Grants, Passenger Facility Charges, and Airport Revenues .

22 American Society of Civil Engineers
Levees/Flood Control Systems2006 2012
F DSummaryThe backbone flood control and drainage systems serving California cities, including channels, levees, retarding basins, dams and pump stations vary widely in condition and capacity to prevent flooding from major storms. In California’s Central Valley there is a real potential for catastrophic disaster to life and property from failure of fragile levee systems . These levees protect thousands of homes, businesses and critical community infrastructures . Current flood control funding short falls across the state, based upon available budget estimates for regional flood control facilities alone are in excess of $2.8 billion per year over the next 10 years .
IntroductionLevees/Flood Control Systems’ grade was compiled based on an overall assessment of infrastructure condition, capacity, maintenance and operation, and security and safety for flood control facilities across California. There is much to be done to bring this element of the state’s infrastructure to a level that citizens expect and experts agree would be minimally adequate . Flood control channels and levees reduce risk but can create, (especially in cases where there is an inadequate level of protection for large urban areas) a significant and potentially catastrophic residual risk that may increase as conditions in a region change . In December 2011, California Department of Water Resources (DWR)

23California Infrastructure Report Card: A Citizen’s Guide - 2012
issued the Flood Control System Status Report . In this report DWR reported that approximately half of the 470 miles of urban levees and approximately three fifths of the 1,530 miles of non-urban levees within the state Plan of Flood Control do not meet design criteria at the design water surface elevation .
To determine the current Levees/Flood Control Systems Report Card Grade, nine regional and county Report Cards prepared by experienced professionals representing various ASCE Sections and Branches in California were evaluated . With the exception of one Report Card, the reports were all prepared within the last 18-months and, in total, incorporated nearly 80% of the state’s population . These regional Report Cards and expert judgments of changes and trends up to December 2011 were used as the basis for developing the overall grade for Levees/Flood Control Systems in California . The grades obtained from the analysis of regional and county Report Cards were then weighted by 2011 population and flood insurance premium data and finally aggregated to represent the average grade for flood control infrastructure in the entire state . This result was compared with independent reports (publically available reference documents) covering the condition of channels, levees, retarding basins and dams, pump stations, and critical storm drain structures, to assure a thorough and objective Report Card Grade .
BackgroundIn 2005, at the request of Governor Schwarzenegger, California Department of Water Resources issued a white paper entitled Flood Warnings: Responding to California’s Flood Crisis . In 2006, ASCE gave a grade of F to the overall status of governance with respect to managing the state’s flood threat and losses, and a grade of “D’ to the levee infrastructure . This is because California’s levee systems have the very real probability for a catastrophic flood disaster to life and property in the Bay-Delta and associated Central and Northern California area watersheds . A catastrophic failure of any one of the levee systems in the Sacramento - San Joaquin Delta carries with it the very real potential to be a mega-disaster greater than Hurricane Katrina caused in New Orleans. Leading experts agree that the levee systems in California are fragile and subject to failure from a number of failure modes . These fragile levee systems protect thousands of homes and billions of dollars in critical infrastructure, which was not built in consideration of the residual flood risk. A failure of any one of the urban levee systems carries with it the probability for loss of life and at a minimum would cost hundreds of millions of dollars to repair damages .
In response to the increased awareness of the potential flood crisis, California voters took the unprecedented step of funding Propositions 1E and 84 . These two propositions provided almost $5 billion in flood risk reduction funding. With this funding, in 2007, DWR formulated a comprehensive initiative called “FloodSAFE California” to address the state’s flood management challenges.

24 American Society of Civil Engineers
After addressing the immediate needs of the flood system, FloodSAFE California was expanded to include initiating projects to improve core flood management programs, evaluating and prioritizing system-wide investments, and funding and supporting regional projects .
In 2011 the DWR Statewide Flood Management Planning Program, with the cooperation of local agencies, began to deliver current project specific information to benefit flood improvement plans, including establishment of a comprehensive data base on levee systems condition, capacity and improvement needs . The documentation of existing facilities, and knowledge of associated engineering and environmental conditions gained over the past 5 years, has brought added confidence to public flood agency policy decisions and enabled clearer paths for governance to solve system deficiencies and prioritize projects to reduce the state’s most urgent flood threats. Subsequently, ASCE’s 2012 Report Card criteria for assessing regional and local flood control infrastructure across California was treated more uniformly, with less weight given to governance as a criteria of special concern .
Declining Resources & Increasing DeficienciesThe condition of local levees and flood control systems has not been improved at a rate to meet the needs of a growing state . Although the overall grade has improved over the past five years, the “D” grade reflects the daunting task faced by the state and local jurisdictions to continuously upgrade, repair, and maintain the systems which provide public safety . The local levees and flood control systems are aging and in some areas do not meet the current standards. These deficient infrastructures are increasingly impacting the abilities of jurisdictions to keep pace with maintenance efforts . The problem is further compounded by increasingly more stringent environmental regulations including additional mitigation for ongoing maintenance of flood control facilities . These requirements are driving the up costs and forcing jurisdictions to limit the extent of systems that can be maintained, which in turn puts more citizens at risk .
Since 2005, the amount of funding available for improvement projects and maintenance for existing facilities has dwindled . The downturn in the economy has reduced the amount of state and federal funding available for critical infrastructure projects some of which are large scale improvements . In addition, resources normally allocated for ongoing maintenance have been redirected to other critical needs, which in some cases have greatly contributed to the system failures . As resources diminish and environmental restrictions increase, the ability of public agencies to maintain existing facilities becomes more difficult every year.

25California Infrastructure Report Card: A Citizen’s Guide - 2012
Earthquake HazardsA major earthquake of magnitude 6 .7 or greater in the vicinity of the Delta Region has a 62 percent probability of occurring sometime between 2003 and 2032 . An earthquake of this magnitude would cause a catastrophic levee failure that would allow saltwater from San Francisco Bay to stream into the Delta jeopardizing the drinking water for more than 20 million people in the state and contamination irrigation water sources for over three million acres of our most productive agricultural land . Levee failure would halt transportation and farm activities for months . The estimated short-term agricultural economic damage is projected to include the loss of 30,000 jobs and $30 billion to $40 billion in revenue and assets . In the long term, some of the levees would never be repaired, their protected areas reverting to inland lakes .
Loss of Critical Infrastructure SystemsThe Sacramento-San Joaquin River systems in the Central Valley are threaded with a fragile network of earthen levees . These earthen levees, originally built from dredged river material by farmers working without engineering designs or supervision, now form a system that protects the water supply of 23 million Californians, the homes and businesses of more than 500,000 people, the irrigation systems of more than three million acres of productive agricultural land, and lifeline transportation and utility corridors . These levees are subject to subsidence, seepage, erosion, and encroachment from old and new development . When major levee failures occur, homes, farms, roads, rail, energy pipelines and power lines will be flooded and water supplies and farmland will be contaminated by saltwater .
Similar failures can occur to aging flood control systems under roadways and railroads, thereby eliminating the use of critical transportation corridors . Sinkholes as a result of failed flood protection systems are occurring throughout the state and the frequency of such failures will increase as infrastructure exceeds its design life .
Regulatory IssuesAs a result of the painful lessons learned from Hurricane Katrina, the U.S. Army Corps of Engineers (USACE or “Corps”) revised some of their policies and procedures and elevated enforcement of standards in an attempt to reduce flood risks. These new policies present new challenges for levee owners. The levee vegetation management guidelines (April 2009) can cause extensive environmental impact . California has the additional regulatory requirements of the California Endangered Species Act, which creates further conflict with regulatory compliance issues . Balancing public safety with the needs of endangered species will continue to be an increasing management challenge .

26 American Society of Civil Engineers
In addition, USACE revised the levee design standard for freeboard requirements (August 2010) . Projects completed in the past may have used only the simple deterministic Federal Emergency Management Agency (FEMA) freeboard criteria or the Corps’ risk and uncertainty analysis . The revised Corps policy is a combination of the two, but the more stringent than either .
2011 also saw the Corps adopt a System Wide Improvement policy to allow levee owners to prioritize levee work based on flood risks. This effort on the Corps’ part to soften the impact of the new policies was welcome by all . It provides a means for levee owners to stay in the Rehabilitation and Inspection Program to be eligible for federal disaster assistance .
Cities, Including the Capital, at RiskLike many American cities, Sacramento lies at the confluence of two major rivers . Old Sacramento, where the town began, is a tourist area that lies in the shadow of the Sacramento River levee, but ironically at higher ground than neighboring development . Today, the City of Sacramento has about a100-year level of protection, much lower than New Orleans proper before hurricane Katrina.
The Sacramento Area Flood Control Agency (SAFCA) is working hard to improve the levees that protect Sacramento and to their credit, the Sacramento Citizens within the Natomas Basin have assessed themselves for a second time to raise an additional $40 .6 million to cover the increased cost of levee construction. According to the SAFCA, a major flood in Sacramento would spread for miles and run as deep as rooflines in some places. Although drainage of these areas would be quicker than was the case in New Orleans, the damage would be similar . More than 300,000 people and 140,000 structures are in the direct path of a serious flood in Sacramento.
In nearby West Sacramento, the levee flood risk is almost as great. Surrounded by levees on all sides, the City is working hard to improve the levees that protect its 47,000 residents and $4 .2 billion in protected property . In addition to Sacramento and West Sacramento, levees in Yuba City, Marysville, Davis/Woodland, Lathrop, Redding, San Diego, Los Angeles County, Ventura County, and Santa Barbara County do not meet current levee design criteria .
The City of San Jose, in partnership with the Santa Clara Valley Water District and the Corps of Engineers, celebrated the completion of a $251 million flood control project that now protects downtown San Jose from the 1% annual chance flood event. It was designed in conjunction with San Jose’s signature downtown urban park, which was completed in September 2005 . Although the project was completed more than 30 years after it was first proposed, the unofficial capital of Silicon Valley, and the third largest City in California, has at least the minimum level of protection typical for significant metropolitan areas.

27California Infrastructure Report Card: A Citizen’s Guide - 2012
Funding is desperately needed to fix the extensive deficiencies in our overall flood control system. However, money alone will not fix the crisis. Flood management in California needs an approach that will achieve both short term and long-term sustainable solutions . This approach should address the underlying issues that led to the emergency we now face and must involve environmental policy and legislative changes, program reforms and funding proposals to better protect Californians from the devastating consequences and economic impacts caused by floods.
Time, gravity, normal erosion, and watershed changes gradually diminish the level of protection channels and levees were designed to provide . FEMA and other emergency preparedness agencies and, most importantly, the public must be notified promptly when the protection of the levee systems is found to be below acceptable safety levels . Levees that are recognized as providing protection from major flood events should be recertified regularly to confirm that they provide that protection .
Planning ProgressOver the past five years there has been significant progress made in building the state’s information database on flood control channels, levees and other structures to enable more precise assessments of the condition of flood control systems infrastructure across California . Funding for the Central Valley levee evaluation efforts has been provided through two large flood control bonds approved by California voters in November, 2006; Propositions 84 and 1E . Legislation passed in 2007 directed the California Department of Water Resources (DWR) to develop three important documents to guide improvements for integrated flood management, including:
1 . State Plan of Flood Control (SPFC) to inventory and describe the flood management facilities, land programs, conditions and operation and maintenance of state and federal flood protection systems.
2 . Flood Control System Status Report (FCSSR) which has assessed the status of the facilities included in the SPFC and identified deficiencies and recommended programs to arrive at project solutions . The FCSSR was issued in December 2011 . This plan represents the most comprehensive flood evaluations of the Central Valley ever performed. In this report DWR reported that approximately half of the 470 miles of urban levees and approximately three fifths of the 1,530 miles of non-urban design water surface elevation .
3 . Central Valley Flood Protection Plan (CVFPP) is the state-wide integrated flood management plan. The draft plan was released in December 2011, is set to be finalized and adopted July 1, 2012 and is scheduled to be updated every 5 years thereafter . The CVFPP is a

28 American Society of Civil Engineers
critical document to guide California’s participation in managing flood risk along the Sacramento and San Joaquin River systems . The CVFPP proposes a system wide investment approach for sustainable, integrated flood management in areas currently protected by facilities of the State Plan of Flood Control .
Public Policy ConsiderationsFlood Risk is defined as the probability of an event occurring times the consequences of the event . This means that even as we work to reduce the probability of
failure by strengthening or improving the levees and channels, when we build new subdivisions or urban centers on adjacent land, we may be increasing the overall flood risk. Furthermore, no matter how large or how strong you build the flood control facilities, there will always be residual flood risk. One of the key questions we must continue ask ourselves is; “What are the ongoing actions we can take to buy down the residual risk?”
One way is through regional, watershed-based integrated planning and funding efforts . Although much has been done, the state, counties, cities and other local special districts must continue to make this a top priority .
An adequate, equitable and dedicated funding source for watershed-based programs is needed; funding not only capital programs but also operations and maintenance. Currently, channels, levees and flood structures modification efforts are not directly funded throughout the state . A dedicated funding source would provide a higher-level autonomy while promoting a more regional cross-jurisdictional approach. The following are some specific options and recommendations for achieving a coherent and comprehensive Levee/Flood Control System:
1 . Develop and implement multiple objective management approach for flood control systems that includes increased flood protection, ecosystem restoration, and water quality objectives .
2. Develop and implement watershed-based flood control /levee programs that can integrate the multiple objectives above .
3 . Develop an adequate, equitable, and dedicated funding source for these watershed-based programs that would fund both capital construction projects and operations and maintenance .
4 . Develop a framework agreement with resource protection agencies to allow critical maintenance, to implement reasonable agreed-upon mitigation measures and to provide a process for developing long-term maintenance solutions that accommodate environmental values that are compatible with flood control system functionality.

29California Infrastructure Report Card: A Citizen’s Guide - 2012
5 . Develop a plan to recover subventions (contributions from the state of California that amount to 70 percent of the local match for Federal projects) . This funding shortfall from the state is critically hampering all local flood control agencies from having sufficient revenue to implement infrastructure improvement .
SecurityFlood control facilities need to be protected . These components of the state’s infrastructure are located on government owned land as well as privately owned land . Currently the typical security measures utilized are fences without controlled access . Other major infrastructure facilities are already receiving heightened security measures but many channels, levees, dams and control structures at critical locations are lacking any security measures .
Infrastructure FundingDuring the height of the recession, and in response to the threat of new FEMA Flood Insurance Rate Maps, tens of thousands of Californians assessed themselves to the tune of hundreds of millions of dollars for levee improvements . But it is not enough . Outside of special assessment districts limited funding for on-going maintenance and capital improvement projects makes for a bleak outlook for flood protection.
Here are some examples of funding needs around California for which current trends in funding for levees and flood control facilities are not keeping pace and improvement projects are losing priority . San Diego could face a deficiency in excess of $1 billion over the next 20 years in the ongoing efforts to manage all existing public infrastructure in the region . In the Central Valley, the Central Valley Flood Protection plan anticipates the need to invest $17 billion in plans and levee improvement projects between 2011 and 2021 . In Sacramento, the Natomas Levee improvement project is expected to cost an additional $366 million . In West Sacramento, the levee improvement cost is $400 million . In Ventura County the regional facilities needs estimate is $132 million. Current flood control funding shortfalls in Orange County, based on budget estimates for regional flood control facilities alone, are in excess of $2 .5 billion (construction costs) . Based on current revenue, it will take over 90 years to achieve replacement goals for deficient facilities. These examples do not cover the entire state including Los Angeles Region .
Therefore, it is our estimate that to bring Levees/Flood Control System up to a “B” Grade from the current “D” Grade, an estimated $28 billion must be spent over the next 10 years to improve/replace California levees/flood control facilities statewide . This translates to an annual investment of more than $2 .8 billion .

30 American Society of Civil Engineers
Ports2006 2012
C+ B-
SummaryThe California sea ports provide a vital link for goods movement from ship to shore, and connection to the National Highway System and the transcontinental railroad network . With the cooperation of city, county, state, and federal agencies, the California sea ports own and operate an extensive infrastructure system that facilitates the movement of cargo from ship to shore and vice-versa . The California sea ports consist of eleven large- to moderate-sized maritime facilities . There are more than 20 other smaller craft harbors and navigable landings, but they are not included in this report due to their size . The report card includes an infrastructure assessment using existing records and documents . The overall grade for the California sea ports based on a weighted factor is B- with total investments of $1 .7 billion per year for the next 10 years for a total investment of $10 .7 billion .

31California Infrastructure Report Card: A Citizen’s Guide - 2012
IntroductionThe objective of this report is to evaluate and develop an infrastructure assessment for the large California sea ports . The infrastructure assessment includes the overall condition, capacity, and operations analysis within the California sea ports utilizing the best information available . Additionally, our goal was to utilize available data from the most recently released Report Cards that had performed infrastructure assessments for sea ports in their region .
The infrastructure assessment provides an estimate of the overall infrastructure network . Each California sea ports’ infrastructure assessment consists of evaluating the following components: wharves, railroads, roadways, utilities, channels and berths, container terminals, other marine terminals, gantry cranes, capacity and reliability of goods movement . Together they provide the basis for the efficient operation of the California sea ports’ system.
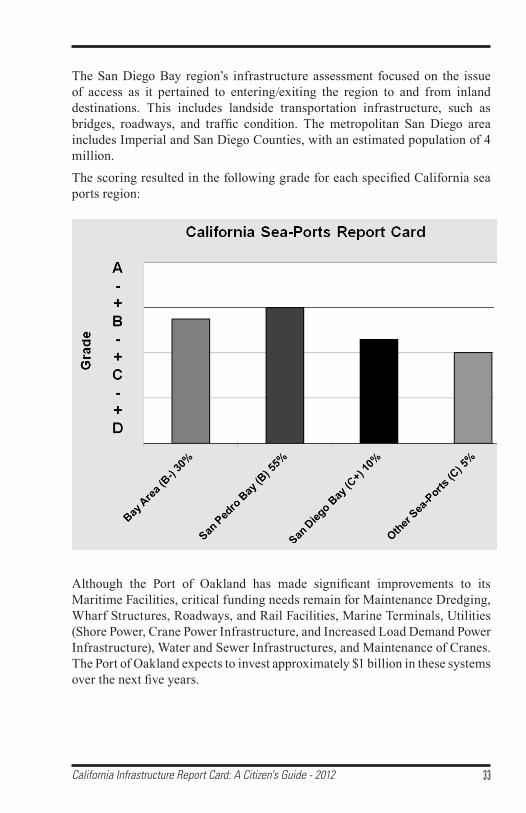
The California sea ports infrastructure assessment is divided by region, as evaluated in recently released Report Cards by ASCE sections and regions throughout California . The three regional Report Cards evaluating major sea ports were the Bay Area (Port of Oakland), Los Angeles (Port of Los Angeles, Port of Long Beach - collectively, “San Pedro Bay Region”), and San Diego (Unified Port of San Diego). The fourth region is the “Other California sea ports (seven total),” which includes the moderately-sized California sea ports . Furthermore, a weight factor was used for the infrastructure assessment based on the percentage of goods entering each region .
The weight factors for the California sea ports regions are as follows:
California sea ports Region: Weight Factor:1 . San Pedro Bay Region . . . . . . . . . . . . . . . . . . . . . . . . . . . . . . . . . . . . . . 55% (Port of Los Angeles, Port of Long Beach)
2 . Bay Area (Port of Oakland) . . . . . . . . . . . . . . . . . . . . . . . . . . . . . . . . . .30%
3. San Diego Bay (Unified Port of San Diego) . . . . . . . . . . . . . . . . . . . . . 10%
4 . Other California sea ports (seven total) . . . . . . . . . . . . . . . . . . . . . . . . . .5% (Includes the Ports of Stockton, West Sacramento, Hueneme, Humboldt, Redwood City, San Francisco, and Richmond)
Fundamental components of infrastructure were considered in the development of the California sea ports’ infrastructure assessment . Infrastructure facilities were identified and rated from A to F (with A being the best) and assigned a weight factor . The infrastructure assessment does not include security of the Ports nor federally owned infrastructure such as Navy or Coast Guard facilities .
32 American Society of Civil Engineers
Data gathered from the fourth region or “Other California sea ports” that did not have a Report Card, was obtained from each facility’s website . The information concluded that each of the California sea ports is in satisfactory condition, though upgrades in infrastructure are needed .
The assessment of the San Pedro Bay Region ports infrastructure focused on their condition, capacity, and operations, which are described as follows:
• Condition – What is the age of the existing structure and/or facility?
• Capacity – Is the current infrastructure able to sustain growth in the next 10 years?
• Operations – Is the infrastructure system complying with existing rules and regulatory requirements, and does it have the ability to provide for safe goods movement, reliability, efficiency, and Level of Service?
The scoring system was generally based on the age of facilities in the region as compared to its useful life or physical condition. Useful life was defined as follows: container wharves, 50 years; other wharves, 75 years; railroad trackage, 50 years; utilities, 50 years; and cranes, 30 years. Roadway conditions are based on vehicular levels of service . The railroad network includes the Alameda Corridor, which connects the San Pedro Bay region to the major rail yards in downtown Los Angeles and transcontinental railroad system .
The San Pedro Bay handles approximately 40% of all international shipments to the United States . The Los Angeles metropolitan area (Counties of Los Angeles, Orange, Riverside, San Bernardino, and Ventura) which is home to 18 million people is the nation’s largest international trade attractor and consumer .
The Bay Area region’s assessment of the Port of Oakland infrastructure focused on its condition, capacity, and operations, which are described as follows:
• Condition, divided into subcategories: waterside and terminal activities; and landside access, including highways and railroads .
• Capacity, which includes the capability of the following components to handle projected cargo and/or vehicular movements: marine terminals (both waterside and terminal activities), local landside access, major local highways, and regional rail systems .
• Operations, which includes the ability to provide safe and reliable goods movement, system reliability, and efficiency.
The metropolitan area that surrounds the Bay Area region in northern California includes nine counties (Alameda, Contra Costa, Marin, Napa, San Francisco, San Mateo, Santa Clara, Solano, and Sonoma) with a total population of approximately 7 million .
33California Infrastructure Report Card: A Citizen’s Guide - 2012
The San Diego Bay region’s infrastructure assessment focused on the issue of access as it pertained to entering/exiting the region to and from inland destinations . This includes landside transportation infrastructure, such as bridges, roadways, and traffic condition. The metropolitan San Diego area includes Imperial and San Diego Counties, with an estimated population of 4 million .
The scoring resulted in the following grade for each specified California sea ports region:
Although the Port of Oakland has made significant improvements to its Maritime Facilities, critical funding needs remain for Maintenance Dredging, Wharf Structures, Roadways, and Rail Facilities, Marine Terminals, Utilities (Shore Power, Crane Power Infrastructure, and Increased Load Demand Power Infrastructure), Water and Sewer Infrastructures, and Maintenance of Cranes . The Port of Oakland expects to invest approximately $1 billion in these systems over the next five years.

34 American Society of Civil Engineers
Public Policy Considerations The California sea ports and their infrastructure have an important role in the movement and supply of our nation’s goods and materials . The overall infrastructure is in good condition today . To maintain current levels, the regular assessment and upgrade of the infrastructure is vital to facilitate the cargo exchange from water to land via rail or truck and vice versa . It is equally vital to ensure an on-going maintenance program and continued redevelopment for the reliable movement of cargo . This extends beyond the districts through connecting infrastructure such as roadway and rail corridors . Improving the movement of goods in California is among the highest priorities for the state . A major facility for the movement of goods in California is its sea ports . The state’s economy and quality of life depends upon the efficient, safe delivery of goods to and from the sea ports .
The California sea ports have been built over the course of several decades and now encompass large complexes that facilitate the movement of goods from ship to shore . These gateways annually move millions of containers, autos, construction materials, liquids, tourists, and food products to their ultimate destination . Handling more than 50% of the nation’s waterborne cargo, the California sea ports have experienced an average of 7% increase in cargo each year since the mid-1980’s. In 2008 and 2009, the recession significantly reduced the amount of cargo movement through the Ports by as much as 33% . Since 2009, cargo growth has returned to pre-recession levels . The California sea ports require funding for the following infrastructure: roadways, bridges, security, waterways, wharfs, rail networks, landfills, container yards, waterfronts, and environmental stewardship programs . Additional costs are included to address the California sea ports’ green policies to reduce impacts from maritime operations on the environment and the communities that surround them .
SecurityCalifornia’s ports continue to work in concert with the Department of Homeland Security (DHS) and the Transportation Security Administration (TSA) and have been found to be in compliance with federal security requirements .

35California Infrastructure Report Card: A Citizen’s Guide - 2012
Infrastructure FundingThe California sea ports continue to program major improvements, with total investments of $1 .7 billion per year for the next 10 years for a total investment of $10 .7 billion . A major portion of these investments is for marine terminal and related transportation developments . Although a large portion of the funding for these improvements comes from revenue generated by the shipping companies, there is a need for state and federal assistance for a portion of the infrastructure-related improvement funding, and particularly for assistance with roadway, rail, bridge, and security projects . It is equally important that the roadways, freeways, bridges, and railways in the surrounding areas receive improvements to maintain the efficient movement of goods through these global gateways . Many of the improvements are pending, awaiting the completion of environmental assessments and funding .
The breakdown in funding for the following California sea ports regions over the next 10 years is shown in the table below . The regions have received partial funding in the past, but will need significant additional state and federal funding for maintenance and expansion of marine facilities to accommodate project growth in cargo volumes .
California sea ports Region Total ($ billion)San Pedro Bay . . . . . . . . . . . . . . . . . . . . . . . . . . . . . . . . . . . . . . . . . . . . . . . 7 .3
Bay Area . . . . . . . . . . . . . . . . . . . . . . . . . . . . . . . . . . . . . . . . . . . . . . . . . . 1 .4
San Diego . . . . . . . . . . . . . . . . . . . . . . . . . . . . . . . . . . . . . . . . . . . . . . . . . . . 1 .5
Other California sea ports . . . . . . . . . . . . . . . . . . . . . . . . . . . . . . . . . . . . . 0 .5
Total: . . . . . . . . . . . . . . . . . . . . . . . . . . . . . . . . . . . . . . . . . . . . . $ 10.7 billion
The California sea ports do not have the funding to carry out the required maintenance and capital improvements . All of the California sea ports are looking at alternative methods for funding their investment needs .

36 American Society of Civil Engineers
Solid Waste2006 2012
B BSummarySolid waste management systems in California are operated by a combination of private and public facilities, which include collection, processing, and sanitary landfills. Nearly 65% of solid waste generated is diverted from landfills due to recycling and diversion programs. Current statewide landfill capacity is 25 years, giving California sufficient capacity through the year 2037. The California Solid Waste Management infrastructure is assigned a “B” grade based on a thorough review of its facilities’ condition, capacity, operations, and security . No increase in annual investment is required as long as current funding levels of $8 billion per year for the next 10 years, are maintained .
IntroductionThe solid waste management system infrastructure provides an essential public service to the citizens of California . There are three basic components in the solid waste management system: collection; processing to remove recyclable and compostable materials; and disposal of waste that cannot be recycled. These three components, coupled with the implementation of waste reduction and recycled material market development programs, ensure that the integrity of the solid waste management system is well maintained for the citizens of California .
The cornerstone of California’s solid waste infrastructure was the enactment of the Integrated Waste Management Act of 1989 (AB 939) by the California Legislature. This landmark legislation shifted the focus from landfilling of solid waste to an effective and coordinated approach to manage solid waste generated within the state . AB 939 required each jurisdiction to divert away from landfills 50% of its waste generated by the year 2000 through a hierarchy of preferred waste management practices based on the following priorities: (1) source reduction, (2) recycling and composting, and (3) environmentally safe transformation (waste-to-energy) and land disposal . Since the implementation of AB 939, California’s diversion rate has continued to steadily increase, leading the nation in recycling and development of new waste reduction initiatives . In 2010, Californians generated approximately 87 million tons of waste and disposed of 30 million tons of waste in landfills for a statewide diversion rate of 65%, an increase from the 48% diversion rate reported in the 2006 California Infrastructure Report Card . While California has surpassed the 50% diversion mandate of AB 939, the state is now faced with a new set of challenges with the recent enactment of AB 341 . This legislation establishes a statewide diversion goal of 75% by 2020 and requires businesses, multi-family residential complexes, and public entities to participate in a mandatory

37California Infrastructure Report Card: A Citizen’s Guide - 2012
commercial recycling program . These same entities must also participate in greenhouse gas (GHG) reduction programs under AB 32, which result in better environmental controls on landfills and increased recycling.
In addition to the regulations designed to increase diversion and reduce waste disposal, the California Integrated Waste Management Board (renamed CalRecycle) ratified the state’s Strategic Plan in 2001. This Plan establishes a goal that the public, industry, and government will work to promote a “Zero-Waste California” and “to reduce, reuse or recycle all municipal solid waste materials back into nature or the marketplace in a manner that protects human health and the environment.” California is the first state in the nation to adopt a zero-waste policy on a statewide level . While it is unlikely that all waste can be eliminated from landfilling, at least in the foreseeable future, attaining a Zero-Waste California will certainly require significant changes to the solid waste management infrastructure as discussed in this report .
FindingsThis evaluation indicates that a strong and sound solid waste management system exists in California through the partnership of local government and private industry . The long-range visions of policy makers, solid waste facility operators, manufacturing companies, and citizens have been and will continue to be key elements to a properly managed solid waste management system . A synopsis of the solid waste infrastructure is described below:
Collection FacilitiesTimely and adequate collection of solid waste protects public health and safety, and the environment . An effective collection system prevents unsightly,

38 American Society of Civil Engineers
vector-propagating, and odorous waste accumulation outside residences and businesses . This also results in minimizing illegal disposal, discharge of waste to surface water bodies, and impacts to ecologically sensitive habitats .
Most collection vehicle fleets are modern with an average age of less than eight years, less than the average age of a typical commercial truck (ten to fourteen years). A number of waste haulers have already converted their fleets to “green” vehicles using alternative fuels to meet local air emission requirements . A majority of these vehicles are automated which reduces reliance on manpower and improves safety . In addition, most hauling companies have scheduled vehicle preventive maintenance programs and backup vehicles to minimize breakdown and loss of collection services . The effectiveness of California’s recycling efforts begins at the source of generation, at the households and businesses, where many collection companies provide multiple bins that allow source separation of recyclables and green waste from the waste stream . Public education and outreach programs are essential elements of the solid waste management system, which brings awareness to the public in their recycling efforts and the positive outcomes achieved . Source separation of recyclables will continue to play a significant role as businesses and multi-family residential complexes will now be required to participate in mandatory commercial recycling programs to comply with AB 341 . Some jurisdictions offer services for bulky item pickups and collect recyclables in a single stream (i .e . not separated by type) which further increases recycling . Furthermore, most communities operate Household Hazardous Waste (HHW) Collection Facilities which accept and collect HHW and regulated waste such as electronic wastes and household chemicals, thereby reducing the quantity of HHW disposed in the municipal waste stream and increasing recycling of such products .
Materials Recovery, Composting, And Processing FacilitiesProcessing of waste involves the systematic separation and recovery of valuable recyclable materials and removal of illegally disposed hazardous waste from the waste stream at Materials Recovery Facilities (MRFs), composting facilities, and conventional recycling centers prior to landfilling of residual waste . Processing also includes recovery of energy from the waste streams using waste-to-energy and a variety of conversion technologies, such as anaerobic digestion, gasification, and other technologies. Although there are many initiatives and pilot programs aimed at increasing the number of waste conversion to energy/fuel system projects in California, several roadblocks have appeared making the continued development of waste-derived energy projects much more difficult. These include the high cost and public/regulatory resistance of siting, permitting and building such facilities, the relatively low disposal fees of other types of waste management alternatives, the relatively

39California Infrastructure Report Card: A Citizen’s Guide - 2012
low cost of fossil fuels, especially natural gas, and concerns over pollution from high-temperature processes . Furthermore, legislative and regulatory policies in California have been unfavorable to the development of additional waste-to-energy facilities and enabling conversion technologies .
Waste processing facilities have played a critical role in helping jurisdictions meet and exceed the diversion mandates of AB 939 and the goals of AB 341 . Although current levels of capacity are sufficient, new facilities or upgrades to existing facilities will be necessary to meet the 75% statewide diversion goal and to reduce long distance transportation costs and GHG emissions . Continued development and expansion of high-value recyclable markets (including construction and demolition waste), capturing a broader array of organic materials, and improvements in processing technologies will further expand the state’s diversion capabilities and increase processing efficiency. In addition, the Building Code, through recently incorporated “Green Building” practices, now promotes environmentally responsible construction that produce less waste, leading to “greener industries and processes .”
Disposal FacilitiesCalifornia’s landfills are considered among the best in the nation with respect to innovation, technology, and effectiveness in protecting the environment . As shown in Figure 1, Californians collectively disposed of 30 million tons of waste in landfills in 2010, which equates to a per capita disposal rate of just under 5 .0 pounds/day . While the state as a whole has long term disposal capacity to the meet the demands of the population beyond 2037, siting new landfills and expanding existing landfills to meet regional needs has become a challenge . As a result, some municipalities are already transporting their residual waste over long distances to access available disposal facilities . Policy makers need to consider that disposal facilities are valuable assets and that maintaining disposal capacity for future generations needs to be a priority .
Due to potential environmental impacts of landfills, the state’s disposal system is heavily regulated by a multitude of regulatory agencies. As a result, landfill operators are required to implement best management practices and abide by permit conditions that ensure environmentally safe and sound operation of their landfills now and into the future. Landfill operators are now required to maintain financial assurance to manage the landfills beyond 30 years after their closure, a requirement that exceeds current federal standards . In addition, the majority of landfills have upgraded their landfill gas collection, control, and monitoring systems to minimize landfill gas migration and surface emissions. Responding to the mandates of AB 32, landfills have actually reduced their carbon footprint and are recognized as a contributor towards combating global warming by converting methane to electricity and natural fuels, thereby reducing California’s dependency on fossil fuels .

40 American Society of Civil Engineers
Figure 1: Historical Statewide Disposal Amounts for California since 1989
(per Resident, per Employee, and Total)
Figure 2: Historical Statewide Diversion Rates for California from 1989 - 2010

41California Infrastructure Report Card: A Citizen’s Guide - 2012
Policies and ProgramsFor over a decade, local governments have been the leaders in implementing recycling, waste reduction, and pollution prevention programs in the state . As shown in Figure 2, the public’s increasing sensitivity to the environment has resulted in waste reduction from 10 percent in 1989 to 65 percent in 2010 . Many California landfills, composting facilities, MRFs, businesses, and non-profit organizations have garnered recognition and won awards from various organizations and regulatory agencies for their state-of-the-art designs and operations, and for effective waste reduction programs .
User fees have been the primary funding source for development of California’s solid waste management system infrastructure, for implementation of waste reduction programs, and educational campaigns . The sluggish economy, however, has significantly reduced waste disposal volumes over the last five years, thereby reducing revenues. Lowered revenues, in turn, limits the ability of many local governments and solid waste facility owners to expand operations and implement new recycling programs, and in some cases, has made maintaining existing operations difficult. Moreover, volatile worldwide recycling markets will continue to contribute to financial uncertainty and operational difficulty in local recycling programs. In addition, the solid waste infrastructure continues to be challenged with new regulations and mandates, making it even more costly and difficult to see positive growth. These fiscal constraints, coupled with reduced public acceptance of new solid waste management facilities, will require decision makers to continue finding creative solutions to meet solid waste management needs . To address these challenges, future regulations must support efforts by the solid waste industry and by society to conserve more, recycle more, and waste less rather than becoming a hindrance .
With a focus on renewable energy sources and reducing GHG emissions, the next few years will see opportunities to streamline regulations in ways that promote and incentivize development of renewable energy projects . Manufacturing companies are also being asked to partner with the state to develop “Take Back” programs, otherwise known as Extended Producer Responsibility, that would allow consumers to return a product to the manufacturer or retail store once it has reached the end of its service life . California is currently in the process of developing take back programs for used paint and carpets . While the success of these take back programs remains to be seen, they have the potential to open new doors to managing hard to handle waste, such as home pharmaceutical waste and mercury containing lamps .
California continues to provide a solid waste management infrastructure that is safe, environmentally sound and protective of human health .

42 American Society of Civil Engineers
Public Policy ConsiderationsThere are a number of challenges that must be addressed to ensure high levels of service expected by the citizens of California while maintaining the robust solid waste infrastructure developed over the past 20 years . These challenges include:
1 . Developing conversion technologies found to be environmentally, technically, and economically feasible . These will optimize waste diversion systems and extract energy from materials that cannot be easily recycled .
2 . Continuing innovation in waste reduction and diversion strategies to minimize environmental impacts associated with mining of materials and product manufacturing .
3 . Continuing incentives and expansion of domestic markets for recycled materials, specifically construction and demolition debris and organic materials .
4 . Establishing new and/or expanding existing capacity at MRFs, recycling centers, and composting facilities to capture additional types of materials from the waste stream, processing greater volume of recyclable materials and ensuring California’s infrastructure serves the entire population .
5 . Providing recycling credits for new diversions of the waste stream from conversion technologies .
6 . Developing more streamlined and coherent regulations between all authorities to further renewable energy production from landfill gas, bio-gas, and directly from waste, thereby reducing dependency on foreign fossil fuels .
7 . Establishing collection centers in remote rural communities to minimize illegal disposal of tires, household hazardous waste, electronic waste, and many other recyclable materials .
8 . Establishing policies and programs which encourage energy and material recovery from solid waste as a renewable energy source and to minimize production of GHG emissions .
9 . Replacing command-and-control policies with more market incentive policies, which will encourage further industry innovation .
10 . Continuing to establish science-based enforcement regulations .
11 . Developing legislation and regulations that support solid waste infrastructure without burdensome and costly requirements .

43California Infrastructure Report Card: A Citizen’s Guide - 2012
SecurityOverall, the solid waste management system is adequately secure . Many of the facilities are surrounded by man-made barriers or natural barriers that deter acts of crime and property damage . As urban sprawl continues and encroaches upon these facilities, operators will need to reevaluate their existing security systems and make improvements as needed .
Infrastructure FundingThe cost to maintain the current B grade of the solid waste infrastructure (i .e ., collection, processing, landfilling, policy and programs) is estimated at $8 billion per year or $80 billion over the next 10 years . In addition to maintaining current structures and operations, these funds will also be used to meet the many federal, state, and local regulations under which the solid waste industry (particularly landfills) operates, and to meet the requirements of recently enacted mandates such as AB 32 and AB 341 . Funding is also needed to close landfills as they reach capacity, and to create new infrastructure needed to meet future waste management needs . The current funding levels meet the short-term needs . Because recycling and changes in consumer behavior have resulted in declining waste volumes, funding mechanisms based on disposal volumes may no longer be effective . Communities need to develop more sustainable revenue models to support their municipal solid waste infrastructure .

44 American Society of Civil Engineers
Transportation2006 2012
D+ C-
SummaryCalifornia’s Transportation Infrastructure, consisting of streets, highways, bridges, rail systems and transit operations, is suffering from a lack of sufficient investment for the operations and maintenance of existing facilities and dedicated funding sources for new improvements to the system . The economy and growth of California have long been associated with an advanced transportation system and continued public investment is needed . The overall grade for Transportation Infrastructure in California has been determined to be a “low” C- due to existing conditions and the lack of adequate funding . There is a need for $10 billion per year more to be spent for ongoing maintenance of existing facilities and an investment of $36 .5 billion in order to raise Transportation to a B grade .
IntroductionCalifornia’s Transportation Infrastructure, consisting of streets, highways, bridges, rail systems and transit operations, is suffering from a lack of sufficient investment for the operations and maintenance of existing facilities and dedicated funding sources for new improvements to the system . Some condition improvements related to California’s Transportation Infrastructure have been made since the last preparation of the California Report Card in

45California Infrastructure Report Card: A Citizen’s Guide - 2012
2006, some of this is due to special local sales taxes levied within the “Self-Help Counties.” Additionally, on a statewide basis and for specific transportation niches, the electorate has approved bond funding, such as Proposition 1B, for limited Transportation Infrastructure improvements . Gas tax funds continue to provide the majority of funding to the state for the expansion and operation of the highway transportation network the lack of a reauthorization of the current highway bill SAFETEA- Lu has meant that funding levels have not continued to increase to keep pace with construction costs . SAFETEA-Lu to date has been the subject of short term extensions eight times and is currently scheduled to expire on March 31, 2012 .
For the preparation of this California Transportation Report Card Grade, seven regional Report Cards prepared by various California ASCE Sections and Branches were evaluated . ASCE Sections in California include the areas designated as Sacramento, San Francisco, Los Angeles and San Diego covering all Counties in the state . With the exception of one Report Card, the regional Report Cards were all prepared in the last 18-months and, in total, cover areas incorporating nearly 80% of the state’s population . The grades obtained from these regional Report Cards were equally weighted by population and centerline roadway miles for the areas they represented and then extrapolated to cover the entire state . This result was then compared with independent reports covering the conditions of bridges, pavements, transit operations, goods movement and funding throughout the state in order to establish a comprehensive California Transportation Infrastructure Report Card grade .
FindingsAll of the regional Report Cards had one thing in common; they all show continued Transportation Infrastructure deficits and the need to make improvements to the state’s transportation infrastructure . The overall grade for Transportation Infrastructure in California has been determined to be a “low” C- . This grade is a slight improvement from the D+ grade issued in 2006 . It is estimated that additional expenditures over existing funding of $36 .5 billion are needed to raise the grade of Transportation Infrastructure to a B level .
Streets, Highways & BridgesCalifornia roads and highways consist of some 141,000 centerline miles of streets and 25,000 bridges throughout the 58 Counties in the state and represent a major public investment in infrastructure . The economy and growth of California have long been associated with an advanced highway system .The condition of the street pavements were recently evaluated in a statewide effort, “California Streets and Roads Needs Assessment,” February 2011, which determined an overall Pavement Condition Index (PCI) to be 66 on a 100-point scale . This rating value is considered to be in the preventative maintenance

46 American Society of Civil Engineers
range for pavements and would be considered to be a low C grade . The data also reveals noticeable differences in pavement conditions throughout the state . The Sacramento, San Francisco, Los Angeles and San Diego Sections had average PCI values of 62 .8, 62 .6, 68 .6 and 69 .9, respectively . Pavement Management Systems are an excellent tool through which to view the health of roadways. Such systems reveal a significant acceleration in the cost of pavement maintenance for each minor level of additional decay of the pavement condition . Hence, the statewide average PCI of 66 should be viewed as a warning sign of increased costs ahead if adequate pavement maintenance efforts are not soon implemented . The Streets and Roads Needs Assessment Report concludes, “The results [of this study] show that California’s local streets and roads are moving ever closer to the edge of a cliff…If current funding remains the same, the statewide condition is projected to deteriorate to a PCI of 54 by 2020… Given existing funding levels, California’s local streets and roads can be expected to deteriorate rapidly within the next 10 years . In addition, costs of any deferred maintenance will only continue to grow… Even more critical, the unfunded backlog will almost double from $39 .1 billion to $63 .6 billion .”For bridges, the California State Department of Transportation, Caltrans, is responsible for periodic inspections of all bridges and issues a Sufficiency Rating (SR) as a quantitative measure of bridge adequacy. Bridges are also flagged for being Structurally Deficient (SD) or Functionally Obsolete (FO). An SR of less than 80 indicates a bridge is eligible for maintenance and/or rehabilitation and an SR of 50 or less indicates a bridge is eligible for reconstruction . For the purpose of the Report Card, bridges with an SR < 80 were defined as being in need of maintenance . The Caltrans data indicates approximately 40% of the bridges throughout the state are in need of some level of maintenance . On its face, this would suggest bridges would be graded at a D level, however, much like the Pavement Condition Index, most bridges are in a preventative maintenance rating range and not in a reconstruction needed condition, suggesting the overall grade of the state’s bridges is a C- .The state’s Transportation Infrastructure overall condition is well documented in an October 2011 California Transportation Commission report entitled, “Statewide Transportation System Needs Assessment .” The report notes that “Much of the state highway system was built between 1950 and the early 1970s to serve the growing population and economy of the state . Many of these assets are reaching the end of their service lives, and most are at an age where they are deteriorating at an accelerating rate . This deterioration comes at a time when demands on the state highway system are steadily increasing . Between 1955 and 2008, the number of vehicle miles traveled (VMT) annually increased by 475 percent .” This increase in

47California Infrastructure Report Card: A Citizen’s Guide - 2012
usage of the Transportation System is universal and clearly apparent . However, as further noted in the report, “Investments to preserve transportation systems simply have not kept pace with the demands on them, and this underfunding - decade after decade - has led to the decay of one of the state’s greatest assets . Failing to adequately invest in the restoration of California’s roads, highways, bridges, airports, seaports, railways, border crossings, and public transit infrastructure will lead to further decay and a deterioration of service from which it may take many years to recover . The future of the state’s economy and our quality of life depend on a transportation system that is safe and reliable, and which moves people and goods efficiently.”
TransitTransit services are an important part of the overall Transportation Infrastructure as these services reduce congestion and move more people per vehicle than passenger vehicles . As is the case with highways, however, investments in Transit Infrastructure have not kept pace with population growth and needs . With limited resources, policy makers must strike a balance between allocating resources to maintain the existing Transit Infrastructure and expanding public transportation to meet demand . The Texas Transportation Institute, in the 2011 Urban Mobility Report, documents the amount of delay that would be added to the transportation network nationwide if public transportation were not an option and the displaced transit riders were forced to drive on the highway network . Regular public transportation service on buses and trains provides a significant amount of peak period travel in the most congested corridors and urban areas in the U .S . There were approximately 55 billion passenger-miles of travel on public transportation systems in 2010 . If public transportation service was discontinued and the riders traveled in private vehicles, “the 439 urban areas would have suffered an additional 796 million hours of delay and consumed 300 million more gallons of fuel .”
A statewide effort to analyze the next ten years of Transit needs in California was sponsored by the California Transit Association in cooperation with Caltrans and others and determined that Transit Operations will only be 80% funded as compared to the need for existing and expanded services and Transit Capital spending will only be funded at 42% of need for the same services and timeframe . The January 2011“California Unmet Transportation Funding Needs, FY2011 - FY2020” report demonstrates Transit Infrastructure funding is not keeping pace with the need .
Three of the ASCE regional Report Cards considered Transit Infrastructure for a separate grade value . The other regional Report Cards incorporated Transit into a blended Transportation Infrastructure grade . The San Francisco Bay Area and Los Angeles County Report Cards each issued a grade of C
48 American Society of Civil Engineers
for transit and the Kern County Report Card issued a grade of C- for transit. With the major metropolitan areas covered by these Report Cards, and in consideration of the statewide data represented by the above-mentioned report, Transit Infrastructure is assessed a grade of C- .
Goods MovementGoods movement is a vital component of California’s economic vitality and consists of a combination of transportation systems including those discussed herein plus seaports and airports covered elsewhere in this document . A measure of the status of the state’s goods movement capabilities can be represented by the information contained in the Texas Transportation Institute’s November 2011 report entitled, “Congested Corridors Report .” In this report, on page 8, the Texas Transportation Institute makes the following findings about the Top 40 sites across the United States for truck congestion. “The northbound Harbor Freeway in Los Angeles between I-10 and Stadium Way has the most truck delay per mile at just under 100,000 hours per mile in 2010 . The US-101 southbound in Los Angeles between Ventura Boulevard and Vignes Street ranked first for wasted diesel by trucks with over 1.5 million gallons . The Riverside Freeway (CA-91) eastbound in Los Angeles between CA 55 and McKinley Street ranked number one for truck congestion cost at over $67 million in 2010 . The Los Angeles area had 16 corridors ranked in the top 40 for truck delay .” Elsewhere in the Congested corridors Report, the I-710 in Los Angeles County is also noted as suffering from significant truck congestion .
In analyzing the data provided in the Congested Corridors Report, the truck congestion in California’s major urban areas has highly significant impacts to the state’s economy. The findings show a truck operations congestion cost of over $3 billion but a commodity cost of over $883 billion . The cost of the congestion is greatest in Los Angeles, followed by Riverside-San Bernardino and then San Francisco-Oakland . On a statewide average basis, the Goods Movement grade, as evaluated by truck congestion, is assessed as a grade of C- . It is clear, however, that the greatest congestion areas are well below this grade . Goods movement was explicitly considered in one only regional Report Card, the San Francisco Bay Area, and issued a grade of D+ .
Rail service is also a significant part of goods movement. While there are passenger services, these services represent a very small portion of the overall rail traffic. Rail is significant in California as it ties together the seaports with inland destinations throughout the Country . Two of the regional Report Cards specifically considered rail service, Sacramento County and Kern County, and each issued a C+ grade for rail service .

49California Infrastructure Report Card: A Citizen’s Guide - 2012
SecurityThe Department of Homeland Security, including efforts by the Transportation Security Administration (TSA) and Federal Transit Administration (FTA), has undertaken a series of major steps to help prepare the highway system and transit systems to counter terrorism threats . Direct assistance to transit agencies through on-site readiness assessments, access to technical assistance teams, regional forums for emergency responders, grants for drills, training, and accelerating technology and research projects have and are being provided . Many new security requirements, however, have been unfunded or under-funded . Critical facilities are protected but the level of protection is an evolving effort at many facilities .
Public Policy ConsiderationsThe state’s economy and good quality of life for all Californians strongly depends upon safe, reliable and accessible Transportation Infrastructure that serves the needs of all residents, businesses, visitors and goods movement . ASCE Region 9 (which covers the entire State of California) supports and advocates the following policies regarding the improvement, operation and maintenance of Transportation Infrastructure in the State of California .
1 . An additional long-term public funding program for Transportation Infrastructure should be established to deliver consistent, reliable and adjusted for inflation funding needed to maintain and improve the Transportation Infrastructure . Transportation funding should also be coordinated with all available Local, state and Federal sources to leverage total funding and investments .
2 . An increase in the state and federal gas tax paid by all Californian’s to restore funding levels for all state roadways is needed . All Local Governments (Counties, Cities and Transportation Agencies) should be encouraged to consider the “Self-Help” model establishing locally committed and expanded funding sources for Transportation Infrastructure .
3 . The California Congressional Caucus should collectively work together to increase the percentage of Federal tax dollars returned to the state for use on Transportation Infrastructure and to increase California’s share of competitive Federal funding programs .
4 . Transportation Infrastructure development should be matched with long-term state objectives for balancing the Transportation Systems with environmental objectives, population growth and housing and should be resilient and sustainable throughout its life cycle .

50 American Society of Civil Engineers
5 . All formats of accelerating project delivery should be available, on a case-by-case basis as suitable for a particular project, for all Agencies to use on all Transportation Infrastructure projects .
6 . Access to and use of Federal funding for Transportation Infrastructure should be streamlined and simplified to accelerate project delivery. Duplications of Federal and state environmental review for transportation projects should be eliminated . Federal regulatory and resource agencies should be required to complete their reviews and permit projects within a specified short time interval.
Infrastructure FundingState budget conditions in California remain precarious with funding cuts being the norm . Under these circumstances, very little investment is being made into Transportation Infrastructure from general proceeds of taxes . The electorate in California, however, has demonstrated their desire to increase investment in Transportation Infrastructure by the approval of a variety of measures increasing taxes to fund certain Transportation Improvements .
The California Transportation Commission has evaluated the funding of Transportation Infrastructure in the state and makes the point that revenue sources have failed to keep pace with demand and need . The Commission reports that while vehicle miles travelled have significantly increased and population has also increased over the last 40 years, the funding of Transportation Improvements through proceeds of gas taxes has remained essentially flat. The revenue streams have not kept pace with the needs. The inability of the state to increase transportation taxes and other revenue sources in line with use of, and demand on, Transportation Infrastructure is one of the causes of the shortages of Transportation funding .
In the face of declining state revenues for Transportation funding, a growing number of California Counties have established local sales taxes dedicated for transportation projects and programs . These Counties, generally referred to as Self-Help Counties, have raised billions of dollars for Transportation Improvements the state has not been able to provide . The funding has been generated through the support of the local electorate that has shown they are willing to vote to tax themselves in return for promised Local Transportation Improvements . The funds raised by Self-Help Counties are used by the respective Transportation Authorities to fund improvements to state Highways, local streets and transit systems within their jurisdictions .

51California Infrastructure Report Card: A Citizen’s Guide - 2012
In 2011, the California Transportation Commission (CTC) reported, in the “Statewide Transportation System Needs Analysis,” a ten-year transportation funding need of $536 .2 billion . The report covers highways, local roads, public transit, intercity rail, freight rail, seaports, airports, land ports, intermodal facilities, and bicycle and pedestrian facilities . The funding need includes about $341 billion for system preservation, defined as rehabilitation and maintenance, and about $195 billion in system expansion . The total funding revenue for this same ten-year period was forecast to be only about $242 .4 billion . The CTC recognizes a Transportation Infrastructure funding shortfall of $293 .8 billion consisting of about $99 billion for system preservation (about $10 billion per year) and $195 billion for system expansion (about $20 billion per year) . If funding levels remain constant, there is an annual funding shortfall over existing revenues of $10 billion to maintain existing Transportation Infrastructure plus $20 billion to make desired improvements .
Separate and apart from the CTC report, ASCE Regional Infrastructure Report Cards across California evaluated local Transportation Infrastructure funding needs in order to raise the condition grade to a B level . The Regional Infrastructure Report Cards concluded on a statewide basis that $36 .5 billion per year for 10 years, above existing funding levels, are needed for that purpose . Note that “seaports, airports, land ports and intermodal facilities” included in the CTC report are addressed in other chapters of the 2012 ASCE California Report Card and are not reflected in the above values. Both the CTC and ASCE evaluations, however, conclude that multiple billions of dollars of new investment are needed in order to improve Transportation Infrastructure to an acceptable level .

52 American Society of Civil Engineers
Urban Runoff2006 2012
D+ D+
SummaryFunding for urban stormwater infrastructure has failed to keep pace with the requirements of state and federal regulation for surface water, and surface water pollution persists over 20 years after regulation has been in force . Improvements to urban runoff programs and infrastructure have been substantial over the past decade, but these improvements have been overshadowed and outpaced by additional regulatory requirements in NPDES permits and by obligations placed on permit holders under the total maximum daily loads (TMDL) program . Simply put, urban runoff stormwater programs are underfunded . Improving the urban runoff infrastructure grade from “D+” will take a substantial new investment, estimated at $6 .7 billion per year for the next 10 years . Investment in key program areas include infrastructure, regulation, and the control of sources of pollutants in our environment .
IntroductionUrban runoff is defined as stormwater that runs off of the land surface during rainfall events in urbanized (developed) areas . The quality of urban runoff (pollutants that it can contain) is regulated by state (Porter Cologne) and federal (Clean Water Act, 1987 amendments) laws . The ability of the urban runoff drainage system, including urban surfaces, swales, streets, storm drains, concrete and natural channels, to meet the requirements of state and federal laws for water pollution is the subject of this section of the report card . A comparison of the current performance of the urban runoff drainage system to the standards set by state and federal law was performed in order to assess a grade for this portion of the infrastructure .
Funding for urban stormwater infrastructure has failed to keep pace with the requirements of state and federal regulation for surface water, and surface water pollution persists over 20 years after regulation has been in force . Improvements to urban runoff programs and infrastructure have been substantial over the past decade, but these improvements have been overshadowed and outpaced by additional regulatory requirements in NPDES permits and by obligations placed on permit holders under the total maximum daily loads (TMDL) program . Simply put, urban runoff stormwater programs are underfunded . Improving the urban runoff infrastructure grade from “D+” will take a substantial new investment, estimated at $6 .7 billion per year, in key program areas: infrastructure, regulation, and the control of sources of pollutants in our environment .

53California Infrastructure Report Card: A Citizen’s Guide - 2012
Our water resources are vital for continued economic prosperity and preserving diverse and valuable natural aquatic and riparian (creek and riverside) environments . Stormwater runoff and its associated pollutants has typically been viewed as a liability by the agencies responsible for cleaning up the problem; however, because water is so integral to the California economy, eliminating pollutants from urban runoff must be viewed as a vital part of providing a water source to support wildlife and human needs. Treated stormwater runoff (treated by infiltration into aquifers) is a source of groundwater recharge, reclaimed water for irrigation and agriculture among other uses . Expanding the use of this resource to help solve our water quality and supply needs in California will require significant funding and investment in stormwater drainage infrastructure .
Defining Urban RunoffUrban runoff and its impact on California’s surface water resources, lakes, rivers, streams, wetlands and the ocean is a critical issue for the state . Pollution, increased runoff, poor sanitary conditions, and trash are some of the problems that limit the enjoyment of our surface water resources . To minimize the impact of urban runoff and protect our water resources, California needs to improve infrastructure, integrate water resource programs for water supply, stormwater and flood management, clean and restore creeks, storm drains and waterways, and change community awareness of the problems associated with urban runoff. All of this requires significant investment of time and

54 American Society of Civil Engineers
money, increased public education and the willingness to improve focus on surface water resources and the environment . Emphasis should be placed on watershed-based, multi-purpose and multi-agency solutions that address urban runoff problems and come with a dedicated funding source .
“Urban runoff” includes both the wet-weather runoff and dry-weather runoff from urban areas . Wet weather runoff, also referred to as “stormwater,” is any runoff that does not soak into the ground, but instead collects on the land surface, and is then conveyed overland and by the storm drain system to a surface water such as a creek, river or lake . Dry weather runoff, comes from various sources such as over-watering of lawns and washing cars . Herein we will refer to all surface runoff (associated with a rain event or over-watering) that runs off urban drainage areas and reaches a stream or other body of water or a flood control channel as “urban runoff .”California’s urban environment includes storm drain systems that are separate from the sanitary sewer systems (with the exception of some older urbanized areas including a large portion of the City of San Francisco, which operates a combined stormwater and sewer system) . The storm drain systems were designed to prevent local flooding by quickly collecting and efficiently transporting stormwater away from the built environment and into nearby bodies of water . Unlike sewer systems that transport sewage to a treatment facility before it is discharged into a river or the ocean, storm drain systems were not originally designed and built to remove pollution . Urban runoff carries pollutants picked up from the surfaces it comes in contact with such as trash and yard waste, dirt, motor oil, brake pad dust, grease, fertilizers, pesticides, and animal waste, as it flows off of streets, roof-tops, parking lots, and yards, and into rivers, lakes, bays, beaches and ultimately the Pacific Ocean .Stormwater flows, which can be particularly daunting to manage, can include runoff from urban and agricultural areas as well as from natural and open spaces . Each resident of California is a potential source of pollution due to activities they undertake at their home or job site . Improper fertilizer application, failing to pick up pet waste, and over applying pesticides are all examples of potential causes of stormwater pollution . Owning and operating a car can even cause stormwater pollution due runoff from streets that can pick up oil from leaks, copper dust from break pad wear and lead and zinc from broken tire weights . Improper management of construction and industrial sites can also contribute to urban runoff pollution .

55California Infrastructure Report Card: A Citizen’s Guide - 2012
Impact on Water QualityStormwater runoff is believed to be a significant contributor to water quality impairments of our receiving waters (rivers, bays, creeks, lakes, ocean) . state and Federal regulatory agencies determined that 685 water bodies (including beaches) in California were impaired (polluted) in 2010 . The US Environmental Protection Agency (EPA) reports that of the total 3 million acres of lakes, bays, estuaries and wetlands in California, 1 .6 million acres are not meeting water quality goals and of these, 1.4 million acres still need a clean–up plan. Of the total 215,000 miles of rivers, streams and shoreline, 30,000 miles are not meeting water quality goals and of these 20,000 miles still need a clean-up plan (Total Maximum Daily Load, or TMDL) . While more than 50% of the lakes, bays, estuaries and wetlands acres have been scientifically assessed, less than 20% of the coastline, rivers and stream miles have been assessed . In all, the state has listed 3,467 pollutant and waterbody, (or portions of a waterbody), combinations that are not meeting water quality goals .
The State Water Resources Control Board (SWRCB) and the United States Environmental Protection Agency (EPA), along with the Regional Water Quality Control Boards (RWQCB), are charged with protecting California’s waters and have adopted increasingly strict runoff pollutant standards to improve water quality. Significant improvements have been made to surface water quality since 1990, when the EPA first promulgated stormwater quality regulations under the National Pollutant Discharge Elimination System (NPDES) program, as required by the 1987 amendments to the Clean Water Act . The state of California has legislation similar to the Clean Water Act to protect the state’s waters . This legislation is known as the California Water Code, or more commonly as ‘Porter Cologne’ for the lawmakers that introduced it . NPDES programs have resulted in measurable improvements in dry weather water quality . Several pollutants commonly associated with urban runoff including oil and grease, are rarely detected in receiving waters, except in the case of uncontrolled spills from automotive and industrial accidents . Efforts to identify and eliminate hazardous products impairing beneficial uses (cause pollution) such as the pesticides diazinon and chloropyfiros have also significantly reduced pollution in the state’s surface waters.
Wet-weather stormwater management, however, remains a daunting and wholly underfunded liability due to the substantial volume of runoff that is generated by even the smallest rain events . As an example, stormwater runoff from merely a half-inch of rainfall would overwhelm the treatment capacity of sewage treatment plants by a factor of 10 . This is why storm drain and sanitary sewer systems are separated in most cities . Wet-weather runoff picks up pollutants that build up on land surfaces, including pollutants associated with human activities, which are ubiquitous in the environment . Nutrients and

56 American Society of Civil Engineers
pathogens associated with pet waste, fertilizers and other urban activities are regularly washed into receiving waters and remain some of the most pervasive sources of pollution . Metals and pesticides associated with legal product uses (e .g . pesticides, brake pads and tire weights) also impair receiving water quality due to wash off during storm events . Without dedicated funding to implement NPDES programs and attendant regulatory reform, additional progress to the Clean Water Act goal of swimmable and fishable waterways will not be made.
In summary, funding programs and infrastructure necessary to make the state’s waters fishable and swimmable are not currently in place, and significant regulatory reform is necessary to address legal uses of products that become pollutants that directly contribute to beneficial use impairment. The public needs to better understand the measures they can take to improve urban runoff water quality . There is very little federal funding available to mitigate discharges of pollutants in stormwater runoff . Funding for stormwater runoff programs to date have come almost entirely from local revenue sources – sales and property taxes and fees .
FindingsAs a part of the California Statewide Infrastructure Report Card development in 2006, over 500 surveys were sent to government agencies responsible for the management of urban runoff including cities, counties, water districts, sewer districts, flood control districts, etc., as part of the development of five major regional ASCE Report Card efforts throughout the state . These surveys supported regional studies that carefully analyzed data gathered regarding the quality of urban runoff and receiving waters of local regional jurisdictions . This resulted in the determination of ‘grades’ for urban runoff by investigating various system attributes by region, including condition, capacity, and deferred maintenance . The statewide urban runoff committee then took these regional grades and developed an “average” grade weighted by population . This data and process has been reviewed and updated for 2012 . The “weighted average” statewide urban runoff grade remains a “D+” for urban runoff, clearly an unacceptable grade and reflective of the chronic underfunding of urban runoff programs .

57California Infrastructure Report Card: A Citizen’s Guide - 2012
Public Policy ConsiderationsThe following are needed to formulate public policy toward addressing and solving urban runoff water quality issues:
1 . Macro-level, watershed-based, solutions that integrate urban runoff treatment projects with water resource and ecosystem management efforts such as flood management, water reuse and habitat restoration, are preferred . Water quality issues cross jurisdictional boundaries . Solutions will involve partnerships between local, state and federal governments .
2 . Dedicated funding sources for urban runoff educational programs, capital projects and operation and maintenance, and monitoring programs .
3 . Cost-effective technologies emphasizing source control of pollutants . Cleaning stormwater as it enters a creek, river or lake is technologically challenging and expensive . Proportionally more emphasis must be placed on controlling pollutants at their source, including integration of water quality impact assessment into the environmental review of commercial and consumer products authorized for use and sale within the state .
4 . Re-evaluation of stormwater regulatory requirements, including water quality standards, to ensure that resources are being properly allocated to significant and controllable man-made sources of water quality impairments as a first priority.
5 . Total Maximum Daily Loads (TMDLs) are a regulatory tool that is used to clean up a polluted water body . TMDLs are developed for a lake, river, or stream when the water body does not meet the goals of the clean water act of use (called ‘beneficial uses’ of the water body). TMDLs are developed by the state or Federal government, and have a defined timeline to clean up the listed water body . TMDLs are costly to develop and implement . There is currently no dedicated funding source for them .
Infrastructure FundingA survey of the amount of money spent on urban runoff programs by cities and counties was conducted by the State Water Resources Control Board in 2005 (Currier, et al ., 2005) . This survey found that cities and counties were typically spending from $29 to $46/household/year for programs to comply with their storm drain NPDES permits (urban runoff programs) to improve urban runoff water quality. This level of funding is not sufficient to make substantial progress towards meeting the goal of making our state’s waters fishable and swimmable given the current extent of EPA designated polluted water bodies and the grade assigned in this report . Few studies have been completed to estimate the expected annual state-wide cost for ultimate

58 American Society of Civil Engineers
compliance with the Clean Water Act (the goal of an urban runoff program), but it is certainly many times greater than the current funding level .
The cost to treat most stormwater runoff would be very high. Two area-specific studies were conducted to estimate the costs and economic impacts of treating or managing stormwater runoff to the point where the state’s waters become fishable and swimmable and beneficial use impairments eliminated. One study conducted by a team at the University of Southern California (Gordon, et al ., 2002) assumed that all urban runoff and 70 and 97 percent of all stormwater (which would include runoff from agriculture and other ‘undeveloped’ areas) would need to be captured and treated with advanced water treatment systems to achieve the water quality necessary to eliminate impairments . The costs of such infrastructure were estimated to be $6,670 to $42,000 per household per year depending on the level of treatment implemented .
The second study conducted by a team including both the University of Southern California (USC) and University of California Los Angeles (UCLA) (Devinny, et . al ., 2004) assumed that a combination of source control, low-impact development requirements for new and re-development, substantially increased use of water capture and infiltration systems, diversion to the sanitary sewer for dry weather runoff, and a few advanced treatment systems for specific areas would eliminate impairments to the state’s surface waters. Using these assumptions, the USC-UCLA team estimated urban runoff management costs would range from approximately $414 to $1,094 per household per year. While the wide range in the estimates reflects differences in potential approaches, both studies clearly indicate the need for significant additional funding compared to current levels (at most $46/year, or about $51 .80 in 2012 dollars assuming a 2% annual escalation) .
The cost to meet federal and state stormwater regulatory obligations will be high . Dedicated funding sources to improve stormwater runoff quality are required to meet these goals . Increases in funding on the order of 2 to 10 times current levels, are needed . The goals of the Clean Water Act will not be achieved by investment in storm water treatment facilities alone . We must begin now to materially change the way we value water in the urban environment, and how we use consumer products that can pollute the environment . This means conserving water, viewing all water sources as a resource, and switching to products that are non-toxic and will not persist in the environment . Based on an assumed current need of $500 per household (and 2 .8 persons per household) to meet federal and state urban runoff requirements, about $6 .7 billion is needed annually, for the next 10 years, to raise the grade to a “B” .

59California Infrastructure Report Card: A Citizen’s Guide - 2012
Wastewater2006 2012
C+ C+
SummarySignificant investments are needed to address renewal and replacement, maintenance, security and reliability funding for the state’s Wastewater infrastructure . These investments will increase the reliability and sustainability of infrastructure and protect our coastal and inland water resources into the future . The annual investment needed to raise our Wastewater infrastructure grade from a “C+” to a “B” is $4 .5 billion annually, for the next 10 years . California’s 100,000 miles of sewers and over 900 wastewater treatment plants generally perform adequately to protect the water resources of the state by managing the approximately 4 billion gallons of wastewater generated every day by California’s citizens and businesses . Nevertheless, the condition and performance of California wastewater infrastructure (sewers, treatment plants and effluent disposal) are quite variable ranging across the state and from agency to agency . The wastewater collection systems continue to require significant investments to be in compliance with the State-wide Waste Discharge Requirements adopted in 2006 .

60 American Society of Civil Engineers
IntroductionCalifornia is the most populous state in the US at 38 .6 million residents . It consists of 58 counties that include 100,000 miles of sanitary sewers and over 900 wastewater treatment and reclamation plants . From the most sparsely populated Alpine County with 1,189 residents to the most populous Los Angeles County with 10 .44 million residents, this engineered wastewater infrastructure serves their ratepayers and customers and visitors very well in their mission to protect public health and the environment . The state is also one of the most heavily regulated in the nation .
In May 2006, The State Water Resources Control Board adopted statewide general Waste Discharge Requirements (WDRs) for sanitary sewer systems as Water Quality Order No . 2006-0003-DWQ . Almost 1,000 facility owners are now “enrolled” in this permit process . Each owner is required to report sewer spills to the California Integrated Water Quality System (CIWQS) as well as provide general information on their system . This approach by the state is unique nationally and provides more public disclosure on system performance, financial and staffing issues, and also drives the need for appropriate funding.
The engineered infrastructure for collection, transport, and treatment of wastewater are essential public facilities for California’s residents, employers, workers, and visitors . They help ensure that public health and the environment are protected and regulatory requirements are met .
California’s 38 .6 million residents and thousands of businesses and visitors flush over 4 billion gallons of wastewater into our public sewer systems every day . The infrastructure serves communities from the most sparsely populated Alpine County with 1,189 residents to the most populous Los Angeles County with 10 .44 million residents . Nearly 100,000 miles of sewers and over 900 wastewater treatment and reclamation plants process this waste and then discharge most of it in the streams, rivers, bays, estuaries and ocean of California . Nearly 500 million gallons are transformed into reclaimed water that is used for a number of purposes including landscape irrigation, industrial cooling water, agricultural irrigation and groundwater recharge . The competent operation of these systems is vital to protecting public health and the environment . These systems perform adequately and for this reason the majority of California’s surface waters and coastline are generally protected from impacts from these discharges. Overflows from the sewer systems or upsets of the treatment plants occur from time to time . Newer statewide regulations affecting sanitary sewer facilities adopted in 2006 are helping to improve their operations, maintenance, management and needed capital improvements .
Statistical data shows that 99 .998% of the 4 billion gallons of wastewater generated daily is conveyed and treated; however, the 0.002% that spill

61California Infrastructure Report Card: A Citizen’s Guide - 2012
statewide and are not contained can reach inland and coastal waterways of the state . These events have been better tracked since 2006 in the statewide CIWQS database for public awareness. Sanitary Sewer Overflows (SSO’s) which reach waterways can cause beach closures . These closures make the waters unavailable for public use and recreation .
The challenge is to plan, adequately finance and fund, construct, operate and maintain, renew, and replace these locally owned engineered systems in a way that will improve overall system performance . This will help to minimize these SSO events and their impacts to the greatest extent possible . Added challenges the treatment facilities are facing, include complying with the state’s mandated requirements to reduce climate change (AB-32) which exceed federal clean air requirements .
General FindingsThe most visible and accessible wastewater infrastructure are the above-ground facilities such as sewer system pump stations and wastewater treatment plants and office and support facilities. These facilities are also more accessible for staff and service providers and are more easily and frequently inspected and maintained . This accounts for the treatment facilities generally scoring much better than the underground sewer facilities statewide . Treatment plant process areas have also been uniformly regulated since the Clean Water Act was adopted at the federal level in 1972 . Ongoing regulatory mandates driven by sometimes competing requirements in water, air, and land regulations cause almost continuous facility improvements in treatment facilities . Not addressed in this edition of the report card, however, are issues beyond wastewater treatment and disposal . These are other California regulations designed to improve workplace safety and health and engineered upgrades needed to address ADA compliance needs, which require additional funding . However, an estimated 80% of the replacement value of the engineered wastewater infrastructure is in the below-ground sanitary sewer gravity and pressure pipelines .
Since the statewide WDR Order was adopted in 2006 there have been numerous statewide efforts by facility owners to improve performance by developing and following Sewer System Management Plans as required by the Order . The result of these efforts have provided a common set of regulations for operating, inspecting, maintaining, funding, and implementing necessary renewal and replacements in this underground infrastructure .
Following is specific findings by local ASCE regions in California on their wastewater system . This information was used by California Infrastructure Report Card’s Wastewater Committee to develop the overall state-wide grade in wastewater: The San Francisco Bay Area wastewater agencies in a nine county area report that Wastewater System Infrastructure is a “C+” for 2011 .

62 American Society of Civil Engineers
This shows a degradation in the grade from an “A-“ in 2005 . With shrinking dollars, some agencies have found that although their treatment has improved, their collection systems have declined, or vice versa .
In the past five years, the Bay Area wastewater agencies have performed more Closed Circuit Television Inspection (CCTV) to assess the condition of their existing collection systems . In the coming years, agencies face impending stricter Federal and state regulations regarding SSO reductions, greenhouse gas emissions, ammonia removal, nutrient removal, and incinerator emission limits . At the same time, agencies have noted disconnects between the environmental regulations and what is feasible in this economy . The biggest challenge is securing the political will to support increased wastewater rates to fund needed infrastructure improvements and to identify new funding sources elsewhere . The estimated need to improve the wastewater infrastructure just in the Bay Area is $80 million per year over the next several years .
Los Angeles County The wastewater collection and treatment systems in the county consist of numerous separate systems ranging in size from very small to very large . The City of Los Angeles operates and maintains 6,531 miles of primary and secondary sewers, 52 pump stations, and 4 major wastewater treatment plants . The Los Angeles County Department of Public Works, on behalf of the County Consolidated Sewer Maintenance District, operates and maintains 4,600 miles of secondary sewers, 153 pump stations, and 4 wastewater treatment plants . The County Sanitation Districts of Los Angeles County operates and maintains 1,320 miles of primary and secondary sewers, 51 pump stations, and 12 major wastewater treatment plants . Included in this year’s survey is assessment information from 18 smaller municipal systems encompassing 2,622 miles of primary and secondary sewers and 52 pump stations . Wastewater Committee has assigned an overall grade of a “B” for Los Angeles County’s wastewater collection and treatment systems, based on a review of available information .There are treatment plants in LA County that have capacity for only dry weather flows and have struggled to consistently meet all permit requirements. These facilities have required extensive maintenance and will need capital improvements . However, ever changing regulatory requirements, such as greenhouse gas emissions, will require additional modifications to the existing wastewater treatment plants . Support of more funding for an accelerated capital improvement program to protect public health and safety is needed . Funding for more closed circuit television inspection of the collection systems to determine the structural integrity is also needed. The estimated five-year Operation & Maintenance budget for the wastewater system is $1 .9 billion . The necessary capital improvement costs, which include added security measures, to consistently meet permit requirements and changing regulations over the next five years are estimated to be $2.8 billion or 0.56 billion per year.

63California Infrastructure Report Card: A Citizen’s Guide - 2012
Orange CountyThe sewer and wastewater treatment systems are generally well run and comply with state and federal requirements . They received an overall grade of “B .” There are approximately 7000 miles of sewers, 220 pump stations and 11 wastewater treatment plants in the county used for transport, treat and dispose of more than 250 million gallons per day . Since the completion of the 2005 Orange County Infrastructure Report Card, sewage spills have continued to decline and beaches remain among the cleanest in California . Wastewater treatment plants throughout the County have faced ongoing rehabilitation and upgrades to improve their condition and to meet increasingly stringent effluent quality standards .
In spite of lower flows and a lack of wet-weather-related problems seen in prior decades, the condition of the collection system continues to be a lingering concern . Many sanitary sewers built in the late 1940s and early 1950s have reached their original design service life . Aging portions of the sewer infrastructure system must be replaced, and the funding and planning necessary to do so are being provided . Funding and reserves are generally adequate throughout the County . User rates must be raised annually to meet future funding demands . It is estimated that over $3 billion is needed during the next 10 years in Orange County to fund the various local and regional rehabilitation projects to bring systems from current levels up to a good or “B+” grade .
Kern County This County was graded a “B-” by its local review team in 2009 . The twelve major cities reviewed have treatment plants that generally perform well, with a total rated treatment capacity of 97 MGD . They serve about 80% of county residents, handling some 59 MGD of existing wastewater flow. However, the majority of the plants are “organically overloaded,” receiving waste of higher strength than assumed in their original design . New groundwater limits on nitrogen content being implemented by the Regional Water Quality Control Board may require Kern’s municipalities to convert to nitrification and denitrification treatment processes. While the City of Bakersfield is planning to meet such requirements through plant expansion, not all local communities have been able to address them . In addition to the issues associated with impending new permit requirements, the majority of wastewater treatment plants in Kern County are now receiving waste flows with organic concentrations exceeding their original design standards . Such a migration to higher waste strength is a recognized phenomenon that occurs when the plant begins to service an increasing proportion of newer developments . The assumption is that organic overload issues will be addressed as part of the future investment in denitrification technology.

64 American Society of Civil Engineers
Wastewater treatment facilities supporting Kern County residents are currently providing generally satisfactory services . However, a large investment in added plant infrastructure will be required over the next decade to address denitrification mandates and rectify growing organic overloads . In addition, further expenditures for new capacity to service incremental population growth will be needed, and the county’s growth rate is among the highest in the state . Local governments must take cognizance of these essential requirements in their physical and financial planning, despite the pressures of a recessionary economy . Although collection systems were not included in Kern County’s review, the 2006 WDR Order for sewers are requiring many municipalities to assess deficiencies in those systems and develop and implement and fund plans to correct any deficiencies. Wastewater Committee has reviewed sewer system performance data available in the state’s CIWQS database and recommends downgrading the “B-“ to an overall grade of “C+” for both sewer collection system and treatment plants combined . Current estimates indicate that an investment of approximately $500 million over the next 10 years will be required for only the treatment plants in Kern County to address needs . Improvements to wastewater collection systems will likely require significant additional funding.
Inland Empire This region consisting of Riverside, San Bernardino and Imperial Counties were rated a “B+” . Wastewater collection and treatment systems in the area generally well run and comply with state and federal requirements . The regulatory requirements for wastewater treatment are anticipated to increase significantly over the next several years. The regional brine pipeline is a critical component necessary to meet regulatory requirements related to salinity control and its use should be fully maximized . Brines are collected and transported in a pipeline which drains to a regional wastewater sewer in Orange County . Treatment of the wastewater and brines are done at the Orange County Sanitation District in Huntington Beach prior to ocean discharge .
Total investment needs are estimated at $4 billion in the Inland Empire over 10 years for collection and treatment facilities improvements and expansions for compliance with current regulations to achieve a grade of “B .”
San Diego County This County’s combined grade for all Wastewater Collection and Treatment Systems in their 2005 report card was a “B-” . The safe and reliable collection of wastewater is an essential element of the county’s ongoing commitment to protect public health and the environment . Within San Diego County, 47 agencies own, operate, and maintain more than 7,000 miles of sewer pipeline, hundreds of pump stations and approximately 50 wastewater treatment plants that collect, treat and dispose of over 231 million gallons per day (MGD) of

65California Infrastructure Report Card: A Citizen’s Guide - 2012
wastewater . In 2011, 23 of these agencies responded to the report card surveys representing over 6,200 miles of pipelines and 206 pump stations . This represents 90% of the wastewater systems within the county .
Overall, the condition of the wastewater collection systems in the San Diego region showed a marked improvement from their previous Infrastructure Report Card effort in 2005 . The collection systems are generally in good condition, however, portions of the systems remain in fair condition . Recent history has shown that routinely maintaining and replacing wastewater collection system infrastructure is significantly more cost-effective than waiting for infrastructure to fail . The San Diego County WWTPs are typically well managed and consistently meet or exceed state and federal regulations . Long-term asset management plans are in place, regional cooperation is high, and infrastructure investment over the past decade is paying dividends in the form of fewer wastewater spills, cleaner beaches, increased production and consumption of recycled water, and acceptance of wastewater as a valuable commodity .
With lower flows, the agencies that derive revenues from flow volume are experiencing lower revenues . Consequently, certain wastewater agencies are developing plans to account for the projected budget shortfalls for operational and planned capital improvements . The annual capital needs for San Diego are estimated at approximately $150 to 200 million annually to fund the various local and regional rehabilitation projects to maintain systems .
For regions that had not produced an infrastructure Report Card, CIWQS for sanitary sewer data, provided by SWRCB, was reviewed and analyzed with respect to the number of spills reported per mile of collection system . This collection system performance data was compared across the counties and grades were assigned to reflect the performance relative to those with report card grades . By county, failure cause codes related to why each SSO occurred were grouped into three areas of 1) caused by facility condition such as a pipe structural problem or pump facility component mechanical failure, 2) caused by a capacity issue such as a dry weather or wet weather related pipe or equipment constraint, or 3) caused by an operational issue such as a pipe blockage due to grease, roots, debris, operator error, power outage or related causes . This provided the evaluators with a sense of both the frequency and severity of the problems .
As for the treatment facilities not mentioned in the reports above, a separate database from SWRCB of reported problems for each permitted facility was reviewed for each of the over 900 plants in the state’s registry of Permitted Wastewater Treatment Plants (WWTP) or Wastewater Reclamation Plant (WWRP) Facilities on a county by county basis and factored into the overall grade .

66 American Society of Civil Engineers
Regions Not Covered by Regional Report Cards
Recommended Grade Per
State CIWQS Database’s
Information Condition /Assessment
Central Coast Region
C+ Wastewater collection and treatment systems in the area are generally well run and comply with state and federal requirements . The CIWQS database SSO-related information was relied upon heavily in assessing the Central Coast region wastewater infrastructure .
Sacramento Region
C Wastewater collection and treatment systems in the area are generally well run and comply with state and federal requirements . The CIWQS database SSO-related information was relied upon heavily in assessing the Sacramento region wastewater collection infrastructure . While this region’s CIWQS SSO-related data compared favorably with other regions, it did show elevated level of spills for agencies that own and operate a portion of the lower private sewer lateral, which is the portion of the system that connects individual customers to the sewer main .
Sierra Foothills Region
B- Wastewater collection and treatment systems in the area are generally well run and comply with state and federal requirements . The CIWQS database SSO-related information was relied upon heavily in assessing the region wastewater infrastructure . One of the factors that affects the overall grade for this region, is the relationship of the population and the high cost of conveyance and treatment of wastewater . Due to the topography, a high percentage of wastewater has to be pumped to its destination for treatment . Many of the Cities, Special Districts, and Agencies are isolated from their neighbors, and Regional treatment is not achievable; this places the rate-payers at a disadvantage to similar population bases that are centralized . Also, many of the participating counties in this region have infrastructure that is reaching, or has out-lived it’s useful life cycle .
Northern California Region
C+ Wastewater collection and treatment systems in the area are generally well run and comply with state and federal requirements . The CIWQS database SSO-related information was relied upon heavily in assessing the region wastewater infrastructure . This part of California has significantly higher precipitation than other climate zones, leading to issues with inflow which can lead to SSOs. Significant mileage of sewer lines are installed in high groundwater areas, which, combined with the condition of many of the sewer pipelines, leads to high infiltration rates. These challenges are taken on by small, underfunded sewer agencies challenged to provide service in some of the poorest parts of the state .

67California Infrastructure Report Card: A Citizen’s Guide - 2012
Based on the review of Wastewater Committee, the methodology described above was used to establish a recommended grade for the areas not yet covered by a regional report card . This information was used for the purposes of supporting the statewide assessment .
ConclusionsThe report card grades cited above are based on regional report card grading representing 83% of the population and supplemented by the Wastewater Committee analysis of the statewide CWIQS database for infrastructure performance . The supplemental analysis and assignment of grades was applied to counties and regions whom do not have an infrastructure Report Card . This included using the CWIQS database for wastewater collection system performance and a review of available data for wastewater treatment/reclamation performance . Overall, the wastewater infrastructure in California earns a grade of C+ .
Throughout California, there is significant diversity of the population, population density and state of the economy which poses a significant challenge to assess an ”average” or “representative” grade . As an example, Lake County’s infrastructure is known to be very stressed due to aging WWTP assets and has identified the need to complete major rehabilitation activities or investigate regionalizing their treatment needs . Stressors on our infrastructure vary from county to county and agency to agency . Furthermore, very limited data is available .

68 American Society of Civil Engineers
Public Policy ConsiderationsNearly all planning, funding, design and construction activities which support wastewater infrastructure are the responsibility of the cities or local wastewater treatment agencies that own and operate these facilities for their ratepayers . They are regulated by the California Regional Water Quality Control Boards and the US Environmental Protection Agency which issue permits to discharge containing very specific terms and conditions. Nevertheless, the cities and local agencies have considerable discretionary authority regarding how the permit conditions are to be achieved . Their decision-making bodies are the city councils or elected boards that meet and deliberate about these important matters . All are obligated to conduct their meetings in a public forum and all of the documents, reports and contracts that are the basis for their decisions are available to the public . Citizen involvement is helpful to provide decision-makers with an understanding about the public’s expectations on adequate wastewater infrastructure, willingness to pay and support for higher fees for the substantial operating and capital expenditures needed to sustain a competently performing system . In summary we recommend the following Best Management Practices:
1 . Cities, counties, and special districts responsible for wastewater system collection, conveyance, and or treatment have to be willing to review their rate system and revise it upward, if needed, to pay for much needed capital expenditures and facilities’ O&M
2. Reduce costs through effective management, efficient operations, and innovative use of technology such as GIS and Computerized Maintenance Management Systems or CMMS
3 . Do more with less . Develop optimized decision making processes by applying the principles of effective asset management for delivering desired service levels at lowest life-cycle costs

69California Infrastructure Report Card: A Citizen’s Guide - 2012
Infrastructure FundingMany public wastewater management agencies have detailed capital expenditure master plans that are expressed in either five-year or ten-year planning horizons . Other public wastewater management agencies develop annual plans, often influenced by the funding decisions that emerge from local, state or federal funding and lending authorities . Because of the variation in approach that public agencies use in long-term fiscal planning, it is a challenge to establish a statewide estimate . Using data reported by each local ASCE Report Card effort, their known service populations and extrapolating their costs to the total population of the state, a reasonable estimate can be established . Based on this approach, the annual statewide capital expenditure for sewer systems, pump stations and wastewater treatment plants is estimated to be $4 .5 billion per year for the next 10 years for a total of $40 .5 billion . This does not include daily operating costs for these systems . If statewide capital and operating expenditures are sustained at needed levels, then reliable operation of public wastewater infrastructure should be assured . Access to low cost capital through the state revolving fund and other private or public grants and loan mechanisms will assist in closing this gap .
SecurityProviding security for all of our wastewater assets became a national focus in 2001 . In 2012, we recognize that some WWTPs have improved security due to early efforts in and awareness of the need to protect the physical integrity and security of facilities . Some collection systems have increased security, but few stressors are indicated at this time . As more detailed vulnerability assessments are done at each facility in the future they should continue to be evaluated in future report card surveys . No estimate on dollars needed is included in the estimate above as related to capital improvements for security if they exist .

70 American Society of Civil Engineers
Water2006 2012
C+ CSummary California’s water infrastructure is vital to the economic well-being, environmental California’s water infrastructure is vital to the economic well-being, environmental integrity, and overall quality of life of all Californians . Water received a grade of “C”, which is a reduction in grade from the 2006 Infrastructure Report Card . The ability to meet the water needs of existing and future Californians is not only dependent on our available supplies, but also on the condition of the numerous facilities required to collect, store, treat, and deliver that water to customers. Significant investments are still needed to address renewal and replacement, maintenance, security and reliability for the state’s water infrastructure . These investments will move water supply and related infrastructure closer to a path of sustainability . The annual investment needed to bring this grade up to a “B”, over the next 10 years is estimated to be $4 .6 billion .
A water main break created a sinkhole big enough to swallow up half of a fire truck in Valley Village on Tuesday. The street was flooded when firefighters arrived at the scene. The firefighters were attempting to back the 21-ton engine when they suddenly felt the ground collapse underneath them.
IntroductionCalifornia’s water infrastructure is vital to the economic well-being, environmental integrity, and overall quality of life of all Californians . Our water infrastructure serves all sectors of our state, from our vast agricultural and commercial interests to the daily needs of the nearly 38 million people
71California Infrastructure Report Card: A Citizen’s Guide - 2012
who reside here . That infrastructure is composed of many elements, including supply sources (e .g ., groundwater, the Sacramento-San Joaquin Delta, rivers, and lakes and reservoirs for capturing snow and rainfall), regional and local treatment facilities, pumping plants, transmission and distribution systems, and other related appurtenances .
The ability to meet the water needs of existing and future Californians is not only dependent on our available supplies, but also on the condition of the numerous facilities required to collect, store, treat, and deliver that water to customers . Just as important as the maintenance and periodic replacement of our production, storage and conveyance facilities are those additional system improvements and security enhancements required to vigilantly protect the quality of our drinking water, withstand natural catastrophes, and adapt to global climate change .
Many components of California’s water systems are nearing the end of their design (or useful) life . The need for ongoing maintenance and replacement is demonstrated by infrastructure failures like the following incident reported by television station KABC Los Angeles in September of 2009.
“We have something like 7,200 miles of pipe in the Los Angeles Department of Water and Power (DWP) system. That’s enough pipe to go all the way to New York and back, so this is the size of this infrastructure, and it requires constant maintenance, constant upgrading,” said David Nahai, DWP general manager. Mayor Antonio Villaraigosa said the city has a five-year plan to repair and replace old pipes, but the city would need more money from the federal government to make the upgrades. “L.A. is not alone in grappling with infrastructure challenges, whether they’re sewers, whether the electric grid, whether it’s our roads, highways, our bridges. They are in disrepair,” said Villaraigosa .
As noted by the Department of Water Resources (DWR) in the 2009 California Water Plan Update (the state’s strategic plan for water), “Aging facilities risk public safety, water supply reliability, and water quality . The State Water Project is more than 35 years old; the Federal Central Valley Project is more than 50 years old . Some local facilities were constructed nearly 100 years ago . Current infrastructure disrepair, outages, and failures and the degradation of local water delivery systems are in part the result of years of underinvestment in preventive maintenance, repair, and rehabilitation .
Of the nine major recommendations made by DWR in the 2009 California Water Plan Update, one directly addresses the needs of California’s water infrastructure . “California should renovate and improve its aging water, wastewater, and flood infrastructure.” The Water Plan also states that “Conditions today are much different than when most of California’s water system was constructed; and upgrades have not kept pace with changing conditions, especially considering growing population; changing societal

72 American Society of Civil Engineers
values, regulations, and operational criteria; and the future challenges accompanying climate change .”
The Sacramento-San Joaquin Delta is a vital link in protecting California’s economic well-being and quality of life . The Delta acts as a conveyance system for water supplies to millions of Californians and a significant portion of the State’s agriculture and industry . From a systems perspective, infrastructure reliability is more important than ever, because it provides the flexibility to move water when it is available from the Delta, where environmental regulatory restrictions often limit the times when pumping is allowed . Aging levees built on peat soils, land subsidence, seismic and flood threats, and sea level rise all contribute to an unacceptable risk profile today. Enhancing the Delta’s water delivery capabilities, while repairing its fragile levees (addressed elsewhere in this report card), and protecting its environmental resources can be accomplished in a way that can benefit all Californians.
One key to California’s future water picture is better management of our limited resources. Management tools can include water use efficiency strategies (such as recycled water), groundwater recharge and storage (“conjunctive use”), watershed management, and efforts geared toward achieving and sustaining behavioral and cultural changes to reduce water consumption .
California’s complex water system is actually comprised of many separate systems ranging in size from very large statewide or regional storage and delivery to small local public and private water systems that may serve only a few people. This Report Card draws on the recent findings of seven water infrastructure Report Cards covering the nine-county San Francisco Bay Area, the two-county Inland Empire region, Kern County, Los Angeles County, Orange County, Sacramento County and San Diego County . Together, these seven regions are home to approximately 30 million people or roughly 80 percent of California’s total population .
These regional Report Cards considered a number of parameters including reliability of supply, storage and distribution capacity, seismic vulnerability, security and safety, and water quality . The respective ages of the tens of thousands of miles of transmission and distribution pipelines and thousands of pumping stations and storage facilities were also considered . Age of facilities is an especially important factor given that many were constructed in the first part of the last century, and a large portion of them have exceeded their useful lives; however, it is important to note that older facilities can still provide good service beyond their useful lives, though sometimes at lower levels of efficiency and/or reliability, if properly maintained.
FindingsThe seven regional water Report Card grades were used from the following areas: Bay Area, Inland Empire, Kern County, Los Angeles County, Orange

73California Infrastructure Report Card: A Citizen’s Guide - 2012
County, Sacramento County, and San Diego County . In addition to these seven grades, this Report Card also considers the condition and capacity of regional facilities operated by the US Bureau of Reclamation, the Metropolitan Water District of Southern California, and the California Department of Water Resources (DWR) .
The overall un-weighted as well as the population weighted average of all seven grades is a C+ . While some of the regions are more populated than others, applying representative weighting factors to the analysis does not result in any significant changes in the overall grade. When other factors were considered--reflecting the large funding required to address Sacramento-San Joaquin Delta solutions, the continued aging of the water infrastructure, increased strains on existing water infrastructure systems to address continued population growth, the ever-present seismic threat to water and wastewater utilities, and the special needs of small water systems--the overall statewide final grade for water infrastructure was lowered to a ‘C’, dropping a half grade from the previous, 2006 CAIRC grade of a ‘C+’ .
Public Policy ConsiderationsThe number one water supply challenge in California today is the long term sustainability of the Sacramento-San Joaquin Delta. A key to addressing this challenge is assure that fixes to the Delta, while reflecting public values, must be grounded in science and be wise investments of public funds . So much of the state’s water supply is dependent on this source that any further delays in addressing these much needed improvements could potentially result in a major catastrophe in California .
Since the last ASCE California Infrastructure Report Card release in 2006, some state legislative progress has been made with the passage of Senate Bills 1, 6, 7 & 8 – California Comprehensive Water Package of 2009. This water package of legislation establishes the framework to achieve the state’s co-equal goals of providing a more reliable water supply to California and restoring and enhancing the Delta ecosystem . This was accomplished by establishing the Delta Stewardship Council to develop a Delta Plan, the Delta Conservancy to implement ecosystem restoration activities within the Delta, a new statewide groundwater monitoring program, a new statewide water conservation program, new water diversion and use requirements and a proposal for a general obligation water bond measure for consideration by California’s voters under a possible future statewide ballot measure . Since the bills’ passage, Delta planning has commenced but funding to support future implementation still remains uncertain .
With increasing budget shortfalls and cutbacks, the public can expect that the necessary revenue to support water infrastructure repair and maintenance for the future will be increasingly limited from government sources . More reliance

74 American Society of Civil Engineers
on local fees can be anticipated with increasing pressure to raise rates on water users . Though great value from past water infrastructure investments have been realized and paid for by ratepayers over time, today’s rate payers will need to recognize their responsibility to themselves and future generations for gradual and steady increases in rates appropriate to assuring a reliable water supply to meet demands .
While significant funding will still be needed, the total cost can be reduced by identifying innovative and cost-effective strategies to addressing our water needs . Many of these resource management strategies are discussed in further detail in the recently released California Water Plan Update 2009 (www .waterplan .water .ca .gov/cwpu2009/index .cfm) .
Several key action items to address these needs are highlighted as follows:1 . Support funding for and implement those projects throughout the state
required to address the local and regional infrastructure needs identified in this report .
2 . Improve the reliability of California’s water supply by a . Reversing both the short- and long-term threats to the Delta water
conveyance system . b . Developing additional groundwater and surface water storage
projects . c . Developing seawater and brackish water desalination projects . d. Developing water use efficiency projects, such as recycled water
systems and other pertinent improvements . e . Promoting and supporting integrated regional water management
planning and implementation of multi-benefit, multi-jurisdictional solutions .
3 . Aggressively support public education, technical assistance, and economic incentives aimed at creating and sustaining behavioral changes to wisely use our limited water resources .
4 . Implement appropriate security measures to protect our infrastructure and drinking water quality from the potential impacts of natural disasters and/or terrorists attacks .
SecurityImproving the security of our nation’s drinking water infrastructures has become a top priority since the events of 9/11. Significant actions are underway to assess and reduce vulnerabilities to potential terrorist attacks; to plan for and practice response to emergencies and incidents; and to develop new security technologies to detect and monitor contaminants and prevent security breaches . As required under the Bioterrorism Preparedness and Response Act,

75California Infrastructure Report Card: A Citizen’s Guide - 2012
each drinking water utility serving more than 3,300 persons must conduct a vulnerability assessment and develop an emergency response plan outlining response measures if an incident occurs . Though assessments by water utilities in California are ongoing, continued funding to support infrastructure response measures, as needed, is important to assure proper security of our state’s critical water infrastructure .
Infrastructure FundingAs indicated in the 2011 ASCE report entitled “Failure to Act: The Economic Impact of Current Investment Trends in Water and Wastewater Infrastructure” wherein a nationwide analysis was conducted to determine the economic implications of continued underinvestment in our nation’s water infrastructure,
“Water infrastructure in the United States is clearly aging, and investment is not able to keep up with the need. This study’s findings indicate that investment needs will continue to escalate . If current trends persist, the investment required will amount to $126 billion by 2020, and the anticipated capital funding gap will be $84 billion . Moreover, by 2040, the needs for capital investment will amount to $195 billion and the funding gap will have escalated to $144 billion, unless strategies to address the gap are implemented in the intervening years to alter these trends .
Because capital spending has not been keeping pace with needs, the resulting gap will only widen through 2040 . As a result, pipes will leak, the construction of the new facilities required to meet stringent environmental standards will be delayed, addressing the gap will become increasingly more expensive, and waters will be polluted .”
In California, DWR projects a $1 .0 billion capital improvement need through 2020 . Recent planning estimates from the California Resources Agency places a price tag on Delta improvements at approximately $16 billion with about $11 billion needed over the next 10 years . Compilations of the seven regional infrastructure report cards and their water needs augmented by regional urban water management plan funding projections for regions without investment projections indicate an additional $32 .0 billion is needed over the next decade . Further, a need of $2 .0 billion has been conservatively estimated to represent the portion of California’s water infrastructure which serves the remaining 20 percent of California’s population not covered in the regional Report Cards. Combined, the total 10 year investment needed to reflect the cost of maintenance and capital improvements needed to address new growth, replace deteriorating and aging facilities is $46 .0 billion . This represents an annualized cost of approximately $4 .6 billion, an increase over the 2006 CAIRC water need projection of $4 billion/year .

76 American Society of Civil Engineers
What You Can DoThis Guide offers continuing evidence that California’s public works challenges are enormous and complex, and will not solve themselves . It is now up to you, the concerned citizen, who understands the economic and environmental benefits of a healthy infrastructure, to push for action .We have reviewed what has happened and is happening in California . Here are some steps you can take to do your part in renewing California’s infrastructure:1 . Learn all you can about California’s infrastructure problems and become an
Infrastructure Champion .2. When you see a problem, find out what level of government has jurisdiction over
it . Sometimes various levels of government deal with different aspects of the same problem .
3 . Search the Internet . Agencies at all levels of government now have Web sites that list laws and regulations that pertain to your problem . Your mayor and state representatives probably have sites too, which may be your link to other government and advocacy group resources . If you know of an interest group that deals with the area you’re interested in, visit its site .
4 . Contact the California Department of Transportation, your city, and/or county government and other sources to learn about plans for ensuring adequate roads, schools, parks and water systems .
5 . Ask business groups, such as your Chamber of Commerce, to examine the infrastructure in your community and its affect on local businesses, employment and the economy .
6 . Regularly attend meetings held in your community about pressing infrastructure problems .
7. Express your concern to public officials such as your mayor and school board. Ask them how they plan to solve infrastructure problems . Urge your neighbors to support your cause .
8 . Volunteer for--or organize--citizen advisory committees dealing with your community’s infrastructure issues .
9. Support local, State and Federal officials who understand and are committed to infrastructure renewal . Ask them to make infrastructure an election issue, just as they would education, crime or health care .
10 . Work to help pass local bond issues to repair, replace and expand your roads, parks, water systems and schools .
11 . Write letters to the editor of your newspaper, your state representatives and members of Congress, expressing your concerns and opinions on infrastructure .
12 . Talk to Civil Engineers, and Urban Planners in your area about solutions and needs .

77California Infrastructure Report Card: A Citizen’s Guide - 2012
MethodologyOverall California Infrastructure Report Card ObjectiveTo build widespread support and understanding regarding the importance of public infrastructure facilities, systems, and their impact on the quality of life and economic vitality in California .
Organizational StructureThe Report Card was developed through the efforts of three committee levels . The committee members are listed in a separate section of this guide .
The Infrastructure Working Committees consisted of technical experts in the field – including both public and private sector participants. Each committee developed the detailed methodology for its specific category, collected and evaluated the data, prepared its section of the “2012 Report on California’s Infrastructure”, and assigned the initial grade .
The Expert Advisory Groups were comprised of leaders in the public sector, consultant/private industry, academia, and the environmental community . Their responsibilities were to review and evaluate the findings of the Working Committees, and to establish public policy considerations for each infrastructure category .
The Executive Committee was responsible for organizing and guiding the overall Report Card effort .
Development of Report Card GradesIn the development of Report Card Grades, four fundamental components of the infrastructure were considered:
ConditionWhat is the existing or near future condition of the infrastructure facility? In assessing the condition of the infrastructure, the immediate future conditions (up to three years) included improvements funded or in design .
CapacityAre the current facilities able to support the current population? Will the existing and planned (funded) facilities be able to support the community in ten years? The existence of Master Plans, Funding Plans, and Capital Improvement Programs were key factors in the capacity assessment .
OperationsThe Working Committees each developed parameters applicable to their areas . Key issues were: Is the specific infrastructure system complying with existing regulatory requirements? Do the organizations have sufficient funding for facility maintenance .

78 American Society of Civil Engineers
SecurityDoes the infrastructure element provide adequately for preparing for, or responding to, natural or manmade, (e .g . terrorism) disasters?
Weighting Factors and Grading CriteriaThe weighting factors applied by each working committee are described in their report, using the four categories listed above . The California Report Card effort follows the ASCE National Report Card’s approach based on the following scale:
A = 90-100%
B = 80-89%
C = 70-79%
D = 51-69%
F = 50% or lower

79California Infrastructure Report Card: A Citizen’s Guide - 2012
GlossaryBest Management Practice(BMP) an engineered structure or management activity, or combination of these, that eliminates or reduces and adverse environmental effect of a pollutant .
Flood Control ChannelOpen waterway that is designed to carry large amounts of rain water . These structures are often lined with concrete to help control flood waters.
GutterArea formed by the curb and the street to prevent flooding by channeling runoff to storm drains .
NPDES - National Pollutant Discharge Elimination SystemThe US EPA regulation and permit process defined in the Clean Water Act that regulates the treatment and discharge of pollutants .
Point Source PollutionPollution from a single identifiable source such as a smoke stack or a sewage-treatment plant .
PollutantsMaterials can include, but are not limited to, trash, paper, plastics, cleaning chemicals, animal waste, yard wastes, used oil, fertilizers, pesticides, sediment, metals, fuels, solvents, detergents and fecal coliform .
PollutionA human or naturally caused change in physical, chemical, or biological conditions that result in an undesirable effect on the environment .
RWQCB - Regional Water Quality Control BoardA regional unit of the State Water Resources Control Board . They regulate the quality of water resources and discharges in its defined watershed boundary.
Receiving WaterOf a watercourse or waterbody that receives runoff or wastewater .
RunoffWater that flow over land surfaces and does not percolate into the ground.
Runoff Pollution (also stormwater, urban runoff, and storm drain pollution) Rain and water from irrigation, garden hoses, or other activities that washes pollutants off of streets, parking lots, yards, and landscapes and into the storm drain system .

80 American Society of Civil Engineers
Sanitary Sewer SystemEngineered infrastructure systems such as gravity and pressure pipes, manholes, and pumping facilities . These systems collect the liquid waste streams from homes, businesses, and industries and transport the wastes to downstream EPA and SWRCB Permitted facilities for treatment . Also known as the upstream portion of the Publicly Owned Treatment Works (POTW)as defined in the Clean Water Act.
Source ControlAction to prevent pollution at its origin .
Storm Drain SystemA system which includes grates, gutters, underground pipes, creeks or open channels designed to transport rain from developed areas to a receiving body of water .
WWTP and/or WWRP (new for 2012)A wastewater treatment plant or a wastewater reclamation plant . The Permitted downstream portion on the publicly owned treatment works as defined in the Clean Water Act where sanitary sewers deliver the wastes for processing and added reclamation at some plants so the treated effluent can be re-used. The facilities can be inland dischargers or ocean dischargers .
WatershedGeographic area of land from which all runoff drains into a single waterway .
Watershed Management ApproachThe watershed management approach is the specific method by which the Regional Board implements watershed management . Features include the targeting of priority problems, stakeholder involvement, developing integrated solutions, and evaluating measures of success . The entire watershed, including the land mass draining into the receiving water, is considered .
Watershed Management Areas(WMAs) are the geographically-defined watershed areas where the Regional Board will implement the watershed approach . These generally involve a single large watershed within which exists smaller subwatersheds but in some cases may be an area that does not meet the strict hydrologic definition of a watershed.
WDRAfter a public comment period the State Water Resources Control Board (SWRCB) adopted statewide general Waste Discharge Requirements (WDRs) for sanitary sewer systems in May 2006 as Water Quality Order No . 2006-0003-DWQ . In January 2012 almost 1,000 facility owners have now “enrolled” in this permit process .

81California Infrastructure Report Card: A Citizen’s Guide - 2012
EXECUTIVE COMMITTEE Yazdan (Yaz) Emrani, M .S ., P .E ., Co-Chair Senior Vice President & Principal Hall & Foreman, Inc . (714) 665-4500 [email protected]
Mike Kincaid, P.E., Co-Chair Senior Project Manager, GHD 415-283-4970 mike .kincaid@ghd .com
Members Robert Bein, P .E . Chairman Emeritus, RBF/Michael Baker, Jr .
Nick Arhontes, P .E . Director of Facilities Support Services Orange County Sanitation Districts
Harvey Gobas, P .E . Vice President, Psomas
Terry Hartman, P .E . Vice President Irvine Company Community Development
AVIATION Steve Bucknam, P .E ., Co-Chair Bucknam & Associates, Inc .
Ed Curran, Co-Chair Independent Consultant
Members Khashayar Hadipour, P.E. National Aviation Lead Kleinfelder
Peggy Ducey Independent Consultant
Pierre Auza Graduate Student, UC Irvine
Expert Advisory Group Rich Macias Director of Planning Southern California Association of Governments
CALIFORNIA INFRASTRUCTURE REPORT CARD COMMITTEE MEMBERSHIPS

82 American Society of Civil Engineers
LEVEES AND FLOOD CONTROL SYSTEMS Terry J . Hartman, P .E ., Chair Vice President, Community Infrastructure Irvine Company
Members Kevin Onuma Manager, Flood Control Section County of Orange John McCarthy RBF Consulting Zully Smith Chief of Operations & Maintenance Division Riverside County Flood Control and Water Conservation District Martin Araiza Civil Engineer, Department of Public Works County of Los Angeles Cid Tesoro Flood Control District Manager San Diego County Flood Control District Liang Lee Deputy Operating Officer Santa Clara Valley Water District
Peter Sheydayi Deputy Director Design & Construction Division County of Ventura/Watershed Protection District
Expert Advisory Group Kathleen Schaefer Region 9 Engineer FEMA
PORTS Carlo Luzzi, Chair Port of Long Beach
Members Robert Riffenburgh, Deputy Chief Harbor Engineer (retired), Port of Long Beach
Sue Lai, Senior Transportation Engineer Port of Los Angeles

83California Infrastructure Report Card: A Citizen’s Guide - 2012
Steve Low Supervising Civil Engineer Port of Oakland
Expert Advisory Group A . J . Moro Chief Harbor Engineer Port of Long Beach
Antonio V . Gioiello Chief Harbor Engineer Port of Los Angeles
Chris Chan Director of Engineering Port of Oakland SOLID WASTE Kevin Kondru, P.E. Co-Chair Deputy Director, OC Waste & Recycling
Chuck White, P .E . Co-Chair Director of Regulatory Affairs West, Waste Management
Members Mary Pitto Regulatory Affairs Advocate, Regional Council of Rural Counties
Christina Hanson Senior Planner, Placer County
Bill Prinz Program Manager, City of San Diego LEA
Nancy Ewert P .E . Engineering Manager, County of Kern
Pat Sullivan R .E .A ., C .P .P . Sr . Vice President, SCS Engineers
Theresa Dodge, P .E . Senior Engineer, Los Angeles County Sanitation Districts
Tony Pelletier, P .E . Director, Engineering and Environmental Management Republic Services, Inc . - West Region

84 American Society of Civil Engineers
Mike Yacyshyn, P .E . Division Manager, Shaw Environmental & Infrastructure Group
Expert Advisory Group Bertrand Palmer P .E . Principal, Geosyntec Consultants
William M . Merry, P .E ., DEE General Manager, Monterey Regional Waste Management District
Laith Ezzet, CMC Senior Vice President, HF&H Consultants, LLC
TRANSPORTATION Kenneth Rosenfield, P.E., Chair Director of Public Services City of Laguna Hills
Members Alan Bosch Senior Rail Engineer, STV Incorporated
Peter Bucknam President, Bucknam Infrastructure Group
Craig Copelan Senior Transportation Engineer CA Department of Transportation Tapas Dutta Engineering Manager, STV Incorporated
Elias Karam Civil Engineer, Jacobs
Rob Kilpatrick Associate, Hall & Foreman Steven King Programming Engineer CA Department of Transportation Brandon Knechtle Graduate Civil Engineer, Arup Gordon Lutes Regional Manager, Dokken Engineering
Expert Review Panel Hamid Bahadori Manager, Public Policy and Programs, Automobile Club of Southern California

85California Infrastructure Report Card: A Citizen’s Guide - 2012
Les Card President, LSA Associates Gary Johnson Retired, City of Anaheim Director of Public Works Principal of Johnson & VerCliff, LLC
Will Kempton Former Director of Caltrans Chief Executive Officer of OCTA
URBAN RUNOFF Scott Taylor, P .E ., Co-Chair Sr . Vice President, RBF Consulting
John Bliss John Bliss, Co-Chair SCI Consulting Group
Members Richard Boon Supervisor, Stormwater Section County of Orange
Jason Uhley Manager, County of Riverside
Gene Matter Storm Water Department, City of San Diego
A . J . Holmon III Environmental/Streets Manager Public Works Department City of Garden Grove
Matthew Fabry, P .E . Program Coordinator, San Mateo County Water Pollution Prevention Program
Karen Ashby Larry Walker Associates, Inc .
Tom Dalziel Manager, Contra Costa County Clean Water Program
Jason Drew, CPESC Associate, Nichols Consulting Engineers
Expert Advisory Group Chris Crompton, Expert Reviewer/Editor County of Orange
Larry McKenney, Expert Reviewer/Editor Santa Ana Watershed Project Authority

86 American Society of Civil Engineers
WASTEWATER Dan Bunce, P .E ., PMP, Co-Chair Vice President, Brown and Caldwell
Jody Allen, Co-Chair Superintendent South Placer Municipal Utility District (SPMUD)
Members Nick J . Arhontes, P .E . Director of Facilities, Support Services Dept . Orange County Sanitation District (OCSD)
Julia Green Engineer, Brown and Caldwell
Chris Toth Wastewater System Manager, City of Santa Barbara
Jim Fisher, P .E . Office of Enforcement / Special Investigations Unit CA State Water Resources Control Board
Victor Lopez Water Resources Control Engineer CA State Water Resources Control Board
Mike Fisher, P .E . Office Manager, Water Works Engineers
Sami Kadir, P.E. Principal, Water Works Engineers
Rebecca Crow, P .E . Project Manager, GHD
Craig Parker, P .E . Manager of Engineering Inland Empire Utilities Agency
Expert Advisory Group Christoph Dobson Director of Operations Sacramento Area Sewer District
Mark Briggs, P .E . Vice-President, Brown and Caldwell Charles W . Clark, P .E . General Manager, South Placer Municipal Utility District (SPMUD)

87California Infrastructure Report Card: A Citizen’s Guide - 2012
WATER Mark Norton, Co-Chair Water Resources & Planning Manager Santa Ana Watershed Project Authority
Xavier Irias, Co-Chair Director of Engineering and Construction East Bay Municipal Utilities District
Members Robert Roscoe General Manager Sacramento Suburban Water District
Frank Belock Deputy General Manager San Diego County Water Authority
Joe Reichenberger Professor and Consulting Engineer Loyola Marymount University
Michael Thornton Owner & Principal, TKE Engineering
Cindy Miller Vice President RBF / Michael Baker, Jr .
John Andrew Assistant Deputy Director CA Dept of Water Resources
Robert Harding System Analysis Unit Manager Metropolitan Water District of Southern California
Expert Advisory Group Ron Gastelum, Retired CEO Metropolitan Water District of Southern California
Terry Erlewine General Manager, California State Water Contractors
PUBLIC RELATIONS Kelly Teenor, APR, Chair Director of Marketing Hall & Foreman, Inc .
Members Daisy G . Covarrubias, MPA Senior Staff Analyst / Construction Community Liaison Orange County Sanitation District

88 American Society of Civil Engineers
Tim Gallen Gallen .Neilly & Associates
Debbie Kroner Manager, Public Information & Communications County of Orange / OC Public Works
Ron Moreno, PE, PLS Project Manager, RBF Consulting Rebecca Nicholas Public Affairs Manager, URS Corporation
Tresa Oliveri Outreach Project Manager, OC Bridges Program Orange County Transportation Authority
Lee Peterson Media Relations Specialist, Port of Long Beach
Mark Smith Director of Government Relations, ACEC California
Scott Starkey Vice President, Laer Pearce & Associates
EDITORIAL COMMITTEE Yazdan (Yaz) Emrani, M .S ., P .E ., Chair Senior Vice President & Principal Hall & Foreman, Inc .
Members Mike Kincaid, P.E. Senior Project Manager, GHD
Robert Bein, P .E . Chairman Emeritus, RBF/Michael Baker, Jr .
Nick Arhontes, P .E . Director of Facilities Support Services Orange County Sanitation Districts
Harvey Gobas, P .E . Vice President, Psomas
Terry J . Hartman, P .E . Vice President, Community Infrastructure Irvine Company
Tim Smith Principal, engutopia

89California Infrastructure Report Card: A Citizen’s Guide - 2012
ReferencesOnly the main references are listed here. The detailed comprehensive references for each individual area are listed in the relevant section of the “2012 Report on California’s Infrastructure – Issue Briefs”
2009 Report Card For America’s Infrastructure American Society Of Civil Engineers
Renewing America’s Infrastructure – A Citizen’s Guide American Society of Civil Engineers101 Constitution Ave, Suite 375 EastWashington, DC 20001
Regional Report Cards: A Guide To Baking Your Community’s Infrastructure, Revised August 2003
2011 ASCE report entitled “Failure to Act: The Economic Impact of Current Investment Trends in Water and Wastewater Infrastructure” Available at www .asce .org/failuretoact
The above four reports are available from ASCE at 101 Constitution Ave., Suite 375 East, Washington, DC 20001, or on the WEB site : www.asce.org/reportcard Booz Allen Hamilton, “California Unmet Transportation Funding Needs, FY 2011 – FY 2020,” January 31, 2011
California Integrated Water Quality System (CIWQS) data as reported by The California State Water Resources Control Board Waste Discharge Requirements (WDRs) for sanitary sewer systems per Water Quality Order No . 2006-0003-DWQ .
California Legislative Analyst’s Office, “A 10-Year Perspective: California Infrastructure Spending,” August 2011
California Legislative Analyst’s Office, “Transportation Funding Overview,” February 28, 2011
California Transportation Commission, “Statewide Transportation System Needs Assessment,” October 2011
2012 Central Valley Flood Management Plan, Public Draft December 2011, California State Department of Water Resources

90 American Society of Civil Engineers
Needs Assessment and Cost Estimate for the Water Quality Enhancement Element, San Diego Region, April 2011 .
Nichols Consulting Engineers, Chtd ., “California Streets and Roads Needs Assessment,” February 2011
Texas Transportation Institute, “Congested Corridors Report,” November 2011
Texas Transportation Institute, “Urban Mobility Report,” September 2011
Report Card 2011 for Bay Area Infrastructure – Citizen’s Advisory, April 2011, American Society of Civil Engineers San Francisco Section and available at www .asce-sf .org
Los Angeles County Infrastructure 2010 Report Card American Society of Civil Engineers, Los Angeles Section and available at www .ascelasection .org
The State of Orange County’s Infrastructure 2010, A Citizen’s Guide, Civil and Environmental Engineering Affiliates, UC Irvine and American Society of Civil Engineers, Orange County Branch
2010 Report Card for Riverside and San Bernardino Counties, American Society of Civil Engineers, Inland Empire Branch available at www .ascelasection .org
2006 Report Card for Northern California Infrastructure – Levees / Flood Protection, American Society of Civil Engineers, Sacramento Section and available at www .asce-sacto .org
American Society of Civil Engineers, San Diego County Infrastructure Report Card, 2012 (Draft) and soon to be available at available at www .asce-sd .org
San Diego Association of Governments, Regional Comprehensive Plan, 2004
2011 San Pedro Bay Port Report Card .
Web sites from each California Sea-Ports .
ASCE local branches and sections .

91California Infrastructure Report Card: A Citizen’s Guide - 2012
The American Society of Civil Engineers enhances the welfare of humanity by advancing the science and profession of engineering .
The Society offers continuing education courses and technical specialty conferences; develops technical codes and standards for safer buildings, water systems, and other civil engineering works; publishes technical and professional journals, manuals, and a variety of books; works closely with Congress, the White House, and federal agencies to build sound national policy on infrastructure and engineering issues; and supports research of new civil engineering technology and materials .
Founded in 1852, ASCE has more than 140,000 members worldwide and is America’s oldest national engineering society . The Society is currently celebrating its 150th anniversary .
ASCE Region 9 consists of State of California and has over 18,000 members . Information on activities is available at: www .asce .org
The Executive Committee also wishes to acknowledge the help and support of the following ASCE Section/Branches:
Region 9
Los Angeles Section
San Francisco Section
Orange County Branch
San Diego Section

92 American Society of Civil Engineers
The American Public Works Association is an international educational and professional association of public agencies, private sector companies, and individuals dedicated to providing high quality public works goods and services .
Originally chartered in 1937, APWA is the largest and oldest organization of its kind in the world, with headquarters in Kansas City, Missouri, an office in Washington, D .C ., and 67 chapters throughout North America . APWA provides a forum in which public works professionals can exchange ideas, improve professional competency, increase the performance of their agencies and companies, and bring important public works-related topics to public attention in local, state and federal arenas .
The association is a highly participatory organization, with hundreds of opportunities for leadership and service, and a network of several dozen national committees in every area of public works . Governed by a 17-member board of directors, elected at both the regional and national levels, APWA is an open, flexible association with a diversified membership of 26,000 and a reputation for quality services and products .
The Executive Committee also wishes to acknowledge the help and support of the Southern California Chapter of APWA .

93California Infrastructure Report Card: A Citizen’s Guide - 2012
The American Council of Engineering Companies (ACEC) statewide organization dedicated to enhancing the consulting engineering, land surveying, and construction related service professions . ACEC advocates for promoting the private enterprise system and protecting the general public . ACEC comprises 23 local chapters with over 1,100 member firms. Member firms range from sole proprietorships to multi-million dollar corporations and engage in all phases of engineering and surveying, including civil, structural, geotechnical, electrical, mechanical, inspection and materials testing . Each member is also automatically a member of ACEC national .
ACEC promotes cooperation among member firms for the public interest and the general advancement of the professions . ACEC’s goals are accomplished primarily through the work of its statewide committees . Twenty-four regular committees function during the year, with tasks that vary from administrative and liaison assignments, to professional objectives, to responsibility for improving business practices . ACEC has also created several special interest Academies which focus on special areas of practice .
ACEC in California was first formed as CELSOC in 1992 through the merger of two associations . Both predecessor organizations represented the interests of engineers and surveyors in California since the early 1950s .
The Executive Committee also wishes to acknowledge the help and support of the ACEC California .

94 American Society of Civil Engineers
The purpose of the UCI Civil and Environmental Engineering (CEE) Affiliates is to provide an effective means to offer support and guidance to the Department, its programs and students, and to act as an interface between the professional civil and environmental engineering community in Southern California, particularly in Orange County, and the University. The CEE Affiliates include senior executives representing leading civil and environmental engineering firms (both large and small) and public agencies, as well as individual members.
Benefits include the creation of numerous opportunities for members:
• affiliation with Orange County’s only major research university
• maintenance of strong industry/university relations
• distinction of “making a difference” in the development of Civil and Environmental Engineering at UCI
• affiliate quarterly seminars and social/student functions
• technical interaction and collaboration with faculty and students
• Student recruitment through early contact with top students
• guidance to student projects
• guest speaking in classes and at students society meetings
• student scholarships
Member annual dues are used to support laboratory and equipment needs, program enhancements in the Department (e .g ., support of ASCE, ITE, and Chi Epsilon student chapters), student scholarships, and CEE Affiliate meetings and functions .
For more information, contact the Department of Civil and Environmental Engineering, at (949) 824-5333, fax (949) 824-2117, or www .eng .uci .edu/ civil