Embed Size (px)
Citation preview
The Frequency ResponseThe Frequency Response of a Systemof a System
• Some terminology• Damped driven spring exampleA lit d d Ph f th t f f ti•Amplitude and Phase of the transfer function
1
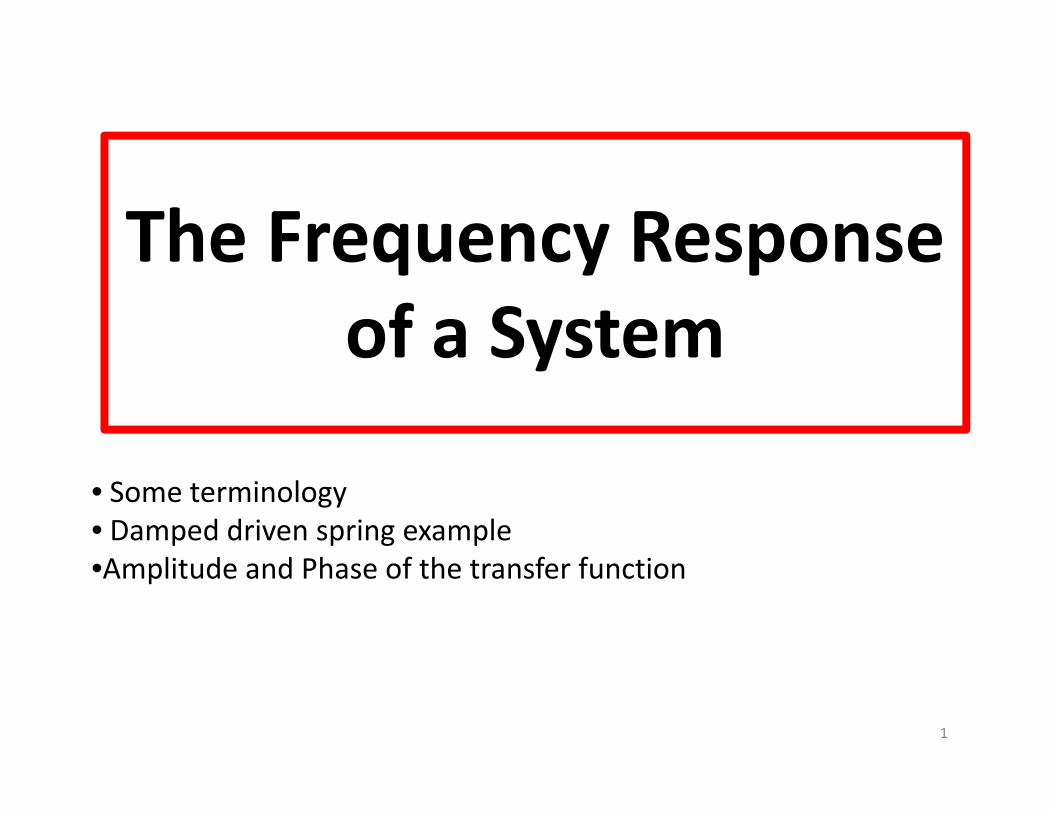
Some terminology:
Control Input = X
Load Input = L
System output = YSystem output = Y
Transfer function = ratio of the system output versus the control input y p p= H = Y / X
Sometimes written as a function of t, or a function of s:
h (t) = y(t) / x(t), H(s) = Y(s) / X(s)
•For this course, think of “s” as the variable representing the frequency of the system . •Elec engineers use “j“ or “2πf i” instead of “ s “, and call it the Fourier Transform instead of the Laplace Transform. Some subtle details we’ll discuss later. 2
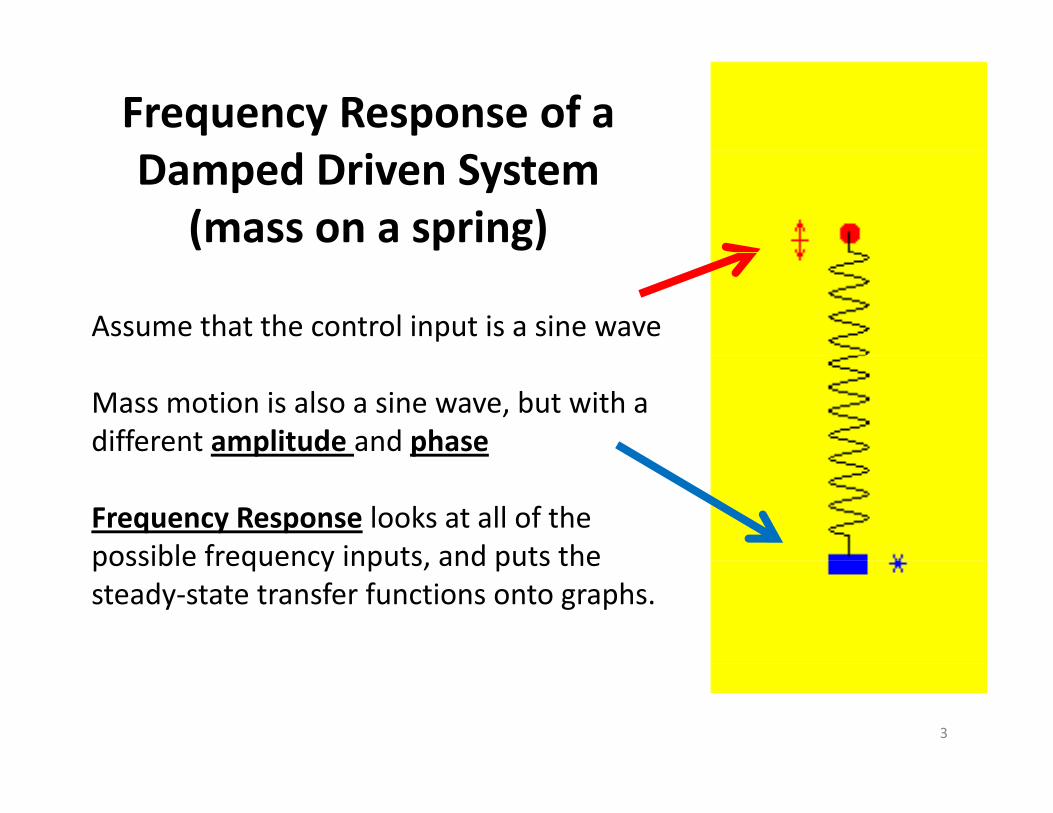
Frequency Response of a Damped Driven System
(mass on a spring)
Assume that the control input is a sine wave
Mass motion is also a sine wave, but with a different amplitude and phase
Frequency Response looks at all of the possible frequency inputs and puts thepossible frequency inputs, and puts the steady‐state transfer functions onto graphs.
3
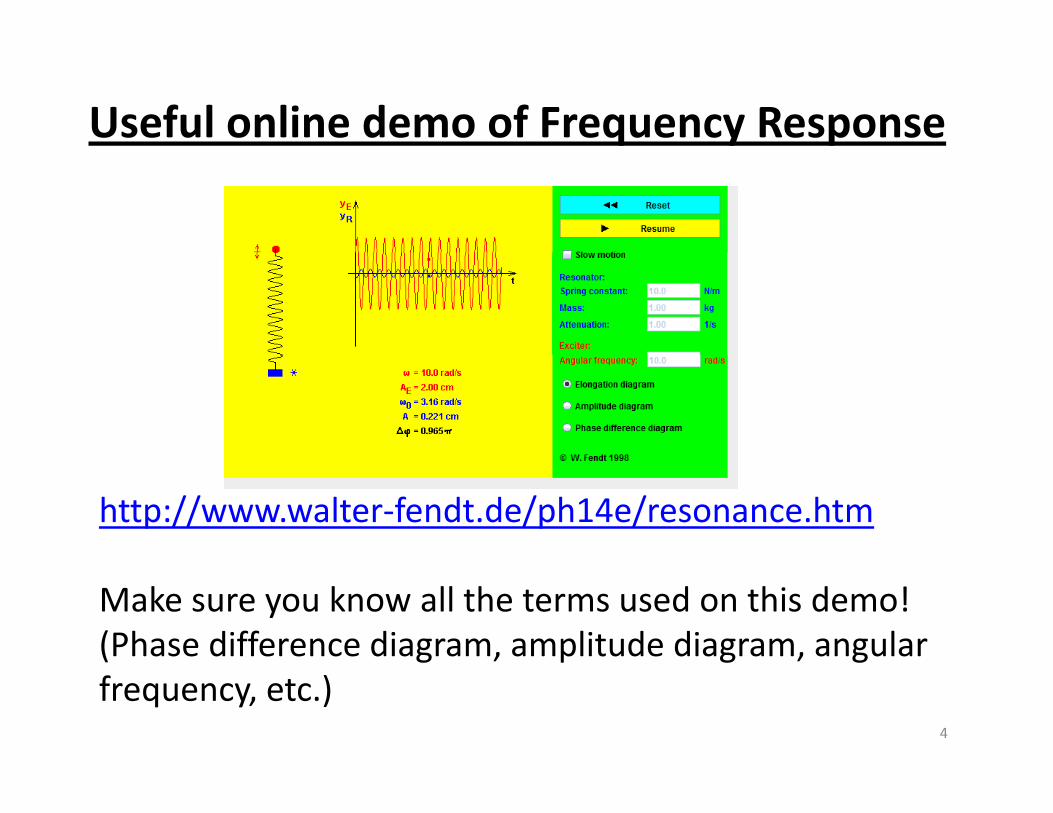
Useful online demo of Frequency Response
http://www.walter‐fendt.de/ph14e/resonance.htm
Make sure you know all the terms used on this demo!(Phase difference diagram, amplitude diagram, angular frequency, etc.)
4
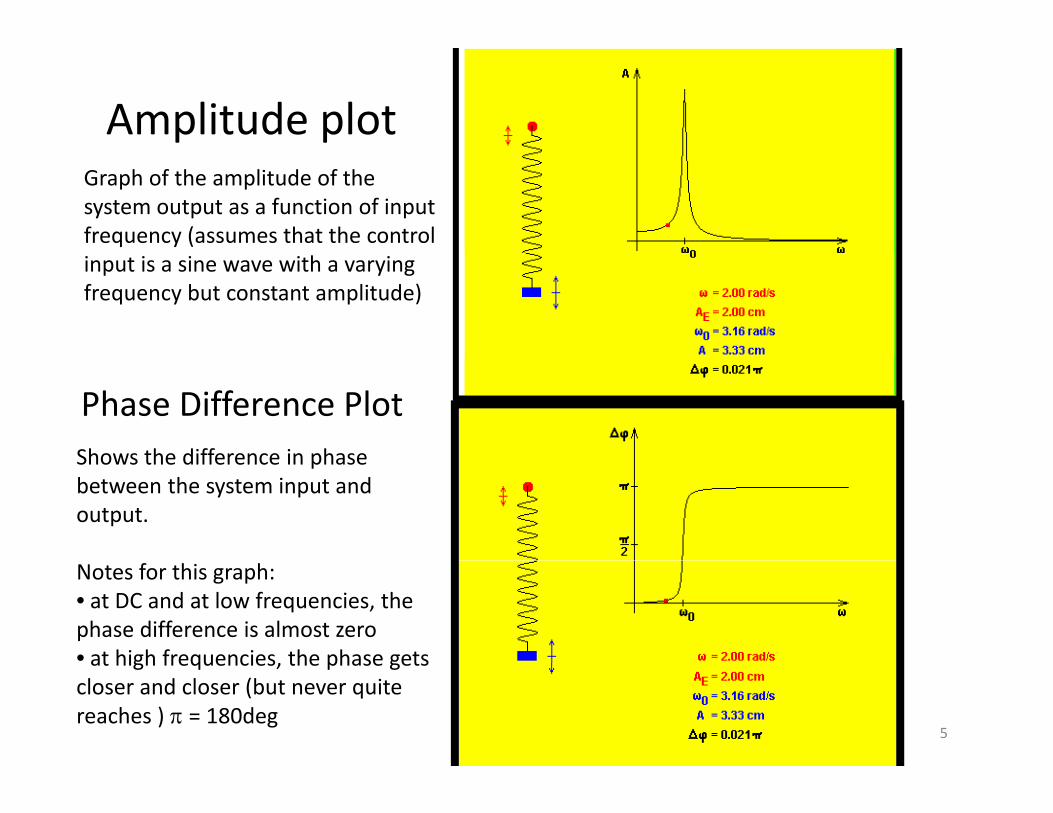
Amplitude plotGraph of the amplitude of the system output as a function of input frequency (assumes that the control input is a sine wave with a varying frequency but constant amplitude)
Phase Difference PlotShows the difference in phaseShows the difference in phase between the system input and output.
Notes for this graph: • at DC and at low frequencies, the phase difference is almost zero• at high frequencies, the phase getsat high frequencies, the phase gets closer and closer (but never quite reaches ) = 180deg
5
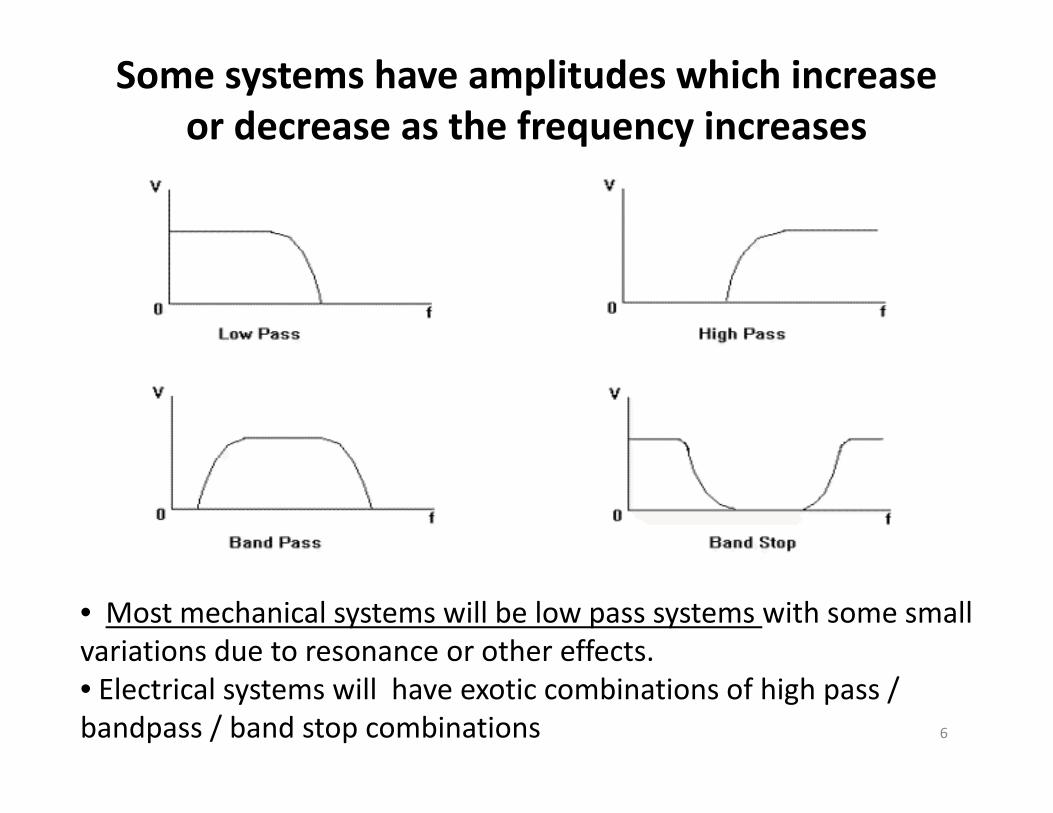
Some systems have amplitudes which increase or decrease as the frequency increases
• Most mechanical systems will be low pass systems with some small variations due to resonance or other effects.• Electrical systems will have exotic combinations of high pass / bandpass / band stop combinations 6
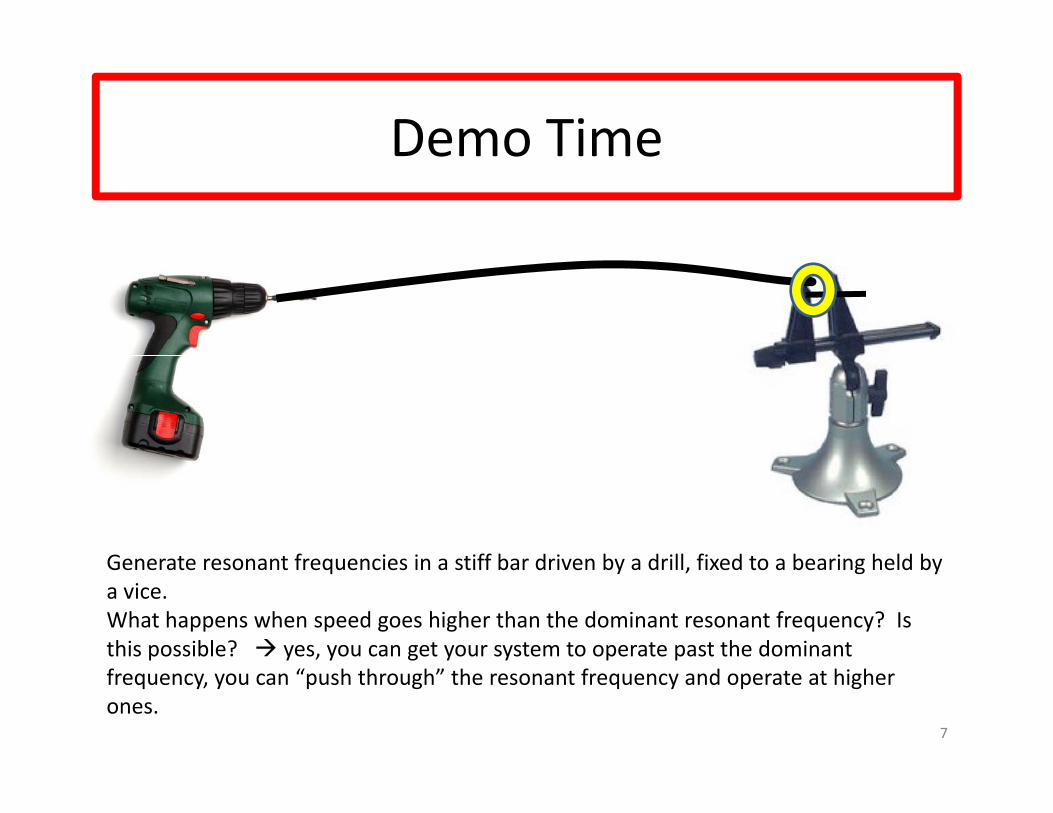
Demo TimeDemo Time
Generate resonant frequencies in a stiff bar driven by a drill fixed to a bearing held byGenerate resonant frequencies in a stiff bar driven by a drill, fixed to a bearing held by a vice.What happens when speed goes higher than the dominant resonant frequency? Is this possible? yes, you can get your system to operate past the dominant
7
frequency, you can “push through” the resonant frequency and operate at higher ones.
What can you do with the frequency f ?response of a system?
Y ll h ill d h i i i• You can tell how a system will respond when it is given a sine‐wave input
• You can tell how a system will respond when it is given anYou can tell how a system will respond when it is given an impulse input (e.g. a rapid “spike” to the control input)
• You can identify what input frequencies to avoid (so that the system doesn’t go into resonance)
• You can tell how fast the system will respond to a changing inputinput.
• You can identify which system components you can be made cheaper/slower without sacrificing performance.p / g p
8
A few examples of systems with yfrequencyfrequency dependencedependence
9
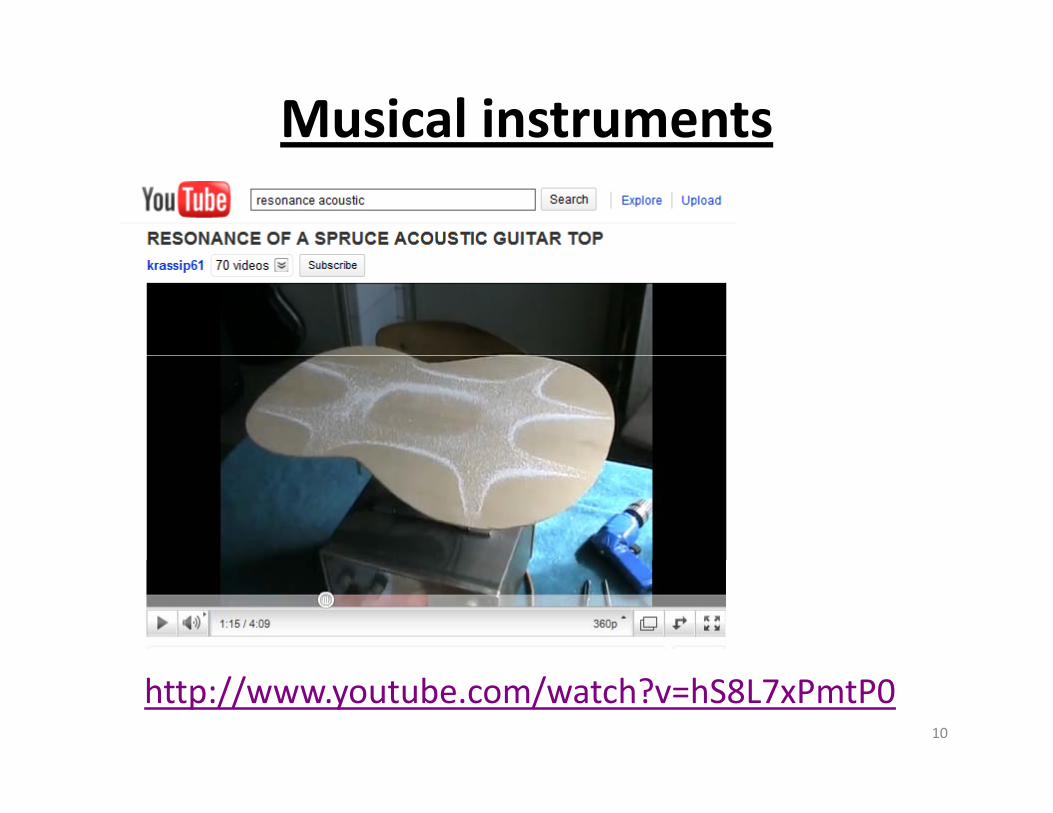
Musical instruments
10
http://www.youtube.com/watch?v=hS8L7xPmtP0
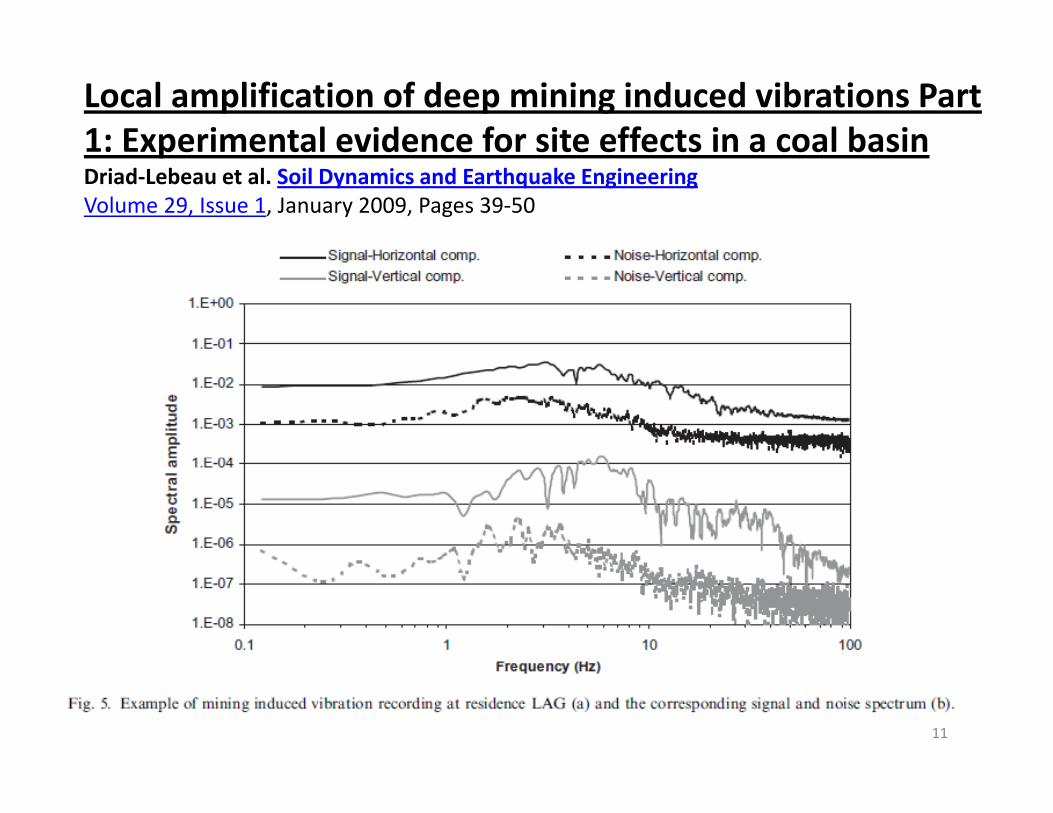
Local amplification of deep mining induced vibrations Part 1: Experimental evidence for site effects in a coal basin1: Experimental evidence for site effects in a coal basin Driad‐Lebeau et al. Soil Dynamics and Earthquake EngineeringVolume 29, Issue 1, January 2009, Pages 39‐50
11
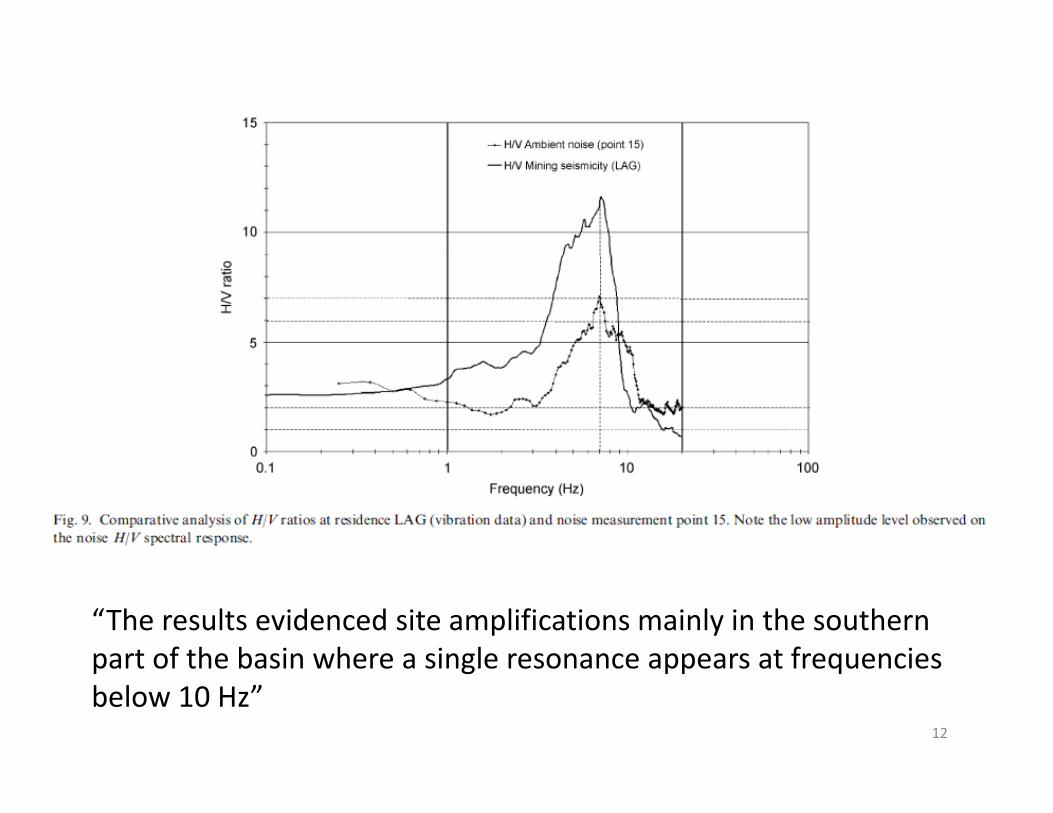
“The results evidenced site amplifications mainly in the southern part of the basin where a single resonance appears at frequenciespart of the basin where a single resonance appears at frequencies below 10 Hz”
12

Tripper Assisted Belt Conveyor lTension Regulation
• http://www.apicsllc.com/apics/Aise 97/Aise 97.htmhttp://www.apicsllc.com/apics/Aise_97/Aise_97.htm
13
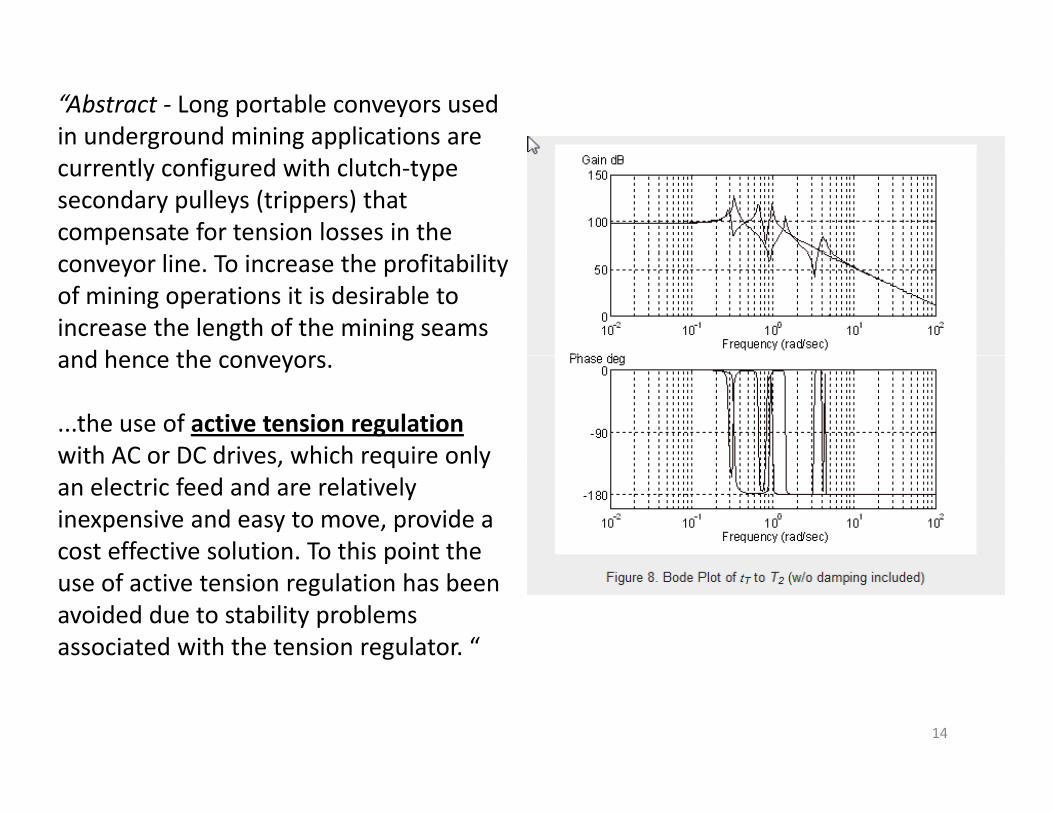
“Abstract ‐ Long portable conveyors used in underground mining applications are currently configured with clutch‐type secondary pulleys (trippers) that compensate for tension losses in the conveyor line. To increase the profitability of mining operations it is desirable to increase the length of the mining seams and hence the conveyorsand hence the conveyors.
...the use of active tension regulation with AC or DC drives which require onlywith AC or DC drives, which require only an electric feed and are relatively inexpensive and easy to move, provide a cost effective solution. To this point the puse of active tension regulation has been avoided due to stability problems associated with the tension regulator. “
14

d lBode PlotsB d l t l ith i l tBode plots are logarithmic plotsLogarithms vs. DecibelsWhy use a Bode Plot?Why use a Bode Plot?How to sketch a Bode Plot
15

Bode Plots – same as the amplitude and phase plots for the transfer function from before, except now on a log‐log scale, p g g
Bode Plots (using log axis for frequency, transfer function uses log scale as well)
Standard amplitude and phase plots using linear axes
Graphs from:http://virtual.cvut.cz/dynlabmodules/ihtml/dynlabmodules/syscontrol/node23.html 16
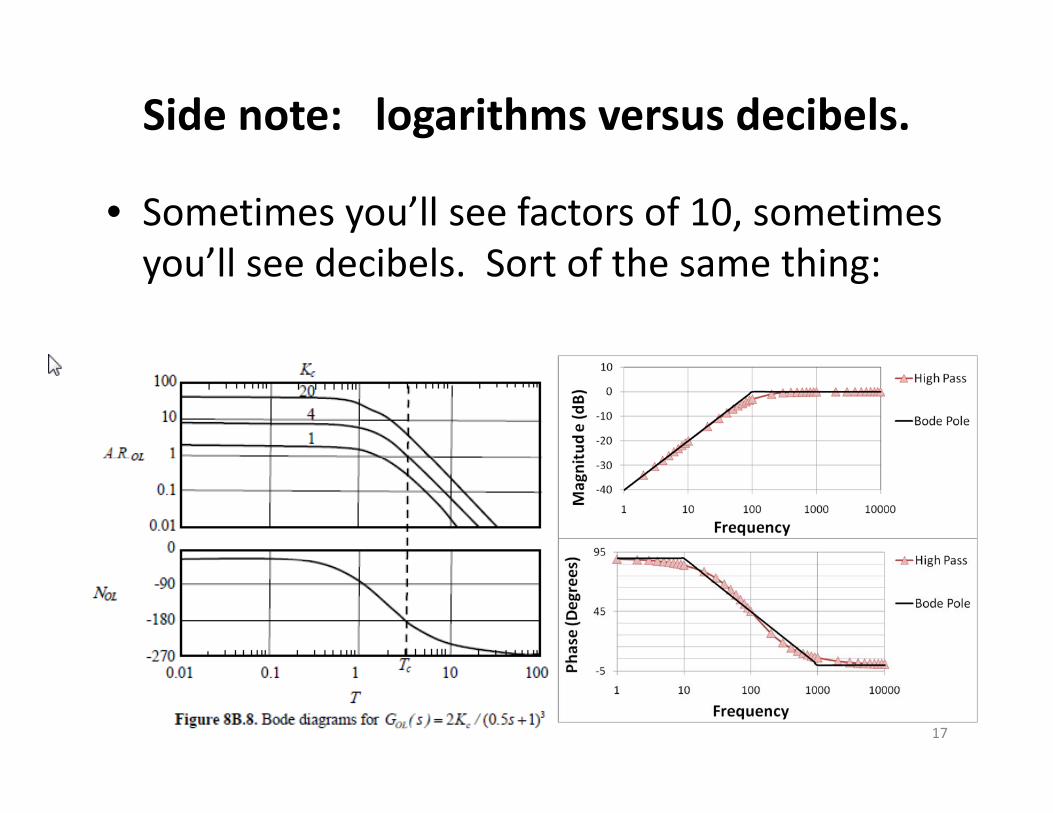
Side note: logarithms versus decibels.
• Sometimes you’ll see factors of 10, sometimes ’ll d ib l S t f th thiyou’ll see decibels. Sort of the same thing:
17

To convert units to decibels:To convert units to decibels:
X in decibels = 20 * log(x) (Sometimes use 20 as the constant, ti 10 W ’ll di l t )
g( )
E.g.
sometimes use 10. We’ll discuss later)
1000 = 20 * log (1000) = 60 dB100 = 20 * log (100) = 40 dB10 20 * l (10) 20 dB10 = 20 * log(10) = 20 dB 1 = 20 * log(1) = 0 dB
0 01= 20 * log (0 01) = ‐40 dB0.01= 20 log (0.01) = ‐40 dB
Every increase of a factor of 10 results in a 20 dB change.y g
18

Why is a Bode plot more useful than a linear plot?• Can generally sketch out the Bode
plot directly from the Laplace transform of the transfer function. No other calculations necessaryNo other calculations necessary.
• There is often an straightl inerelationship between amplituderelationship between amplitude and frequency (e.g. Above 1 Hz, for every factor of 10 increase in frequency, the amplitude drops by 40dB)‐40dB)
• Can approximate the Bode plot with straight lines on the graphwith straight lines on the graph (with a few curves depending on the constants in the equation)
• Can use it to easily see if the system is stable or not (or whether it will oscillate uncontrollably) 19
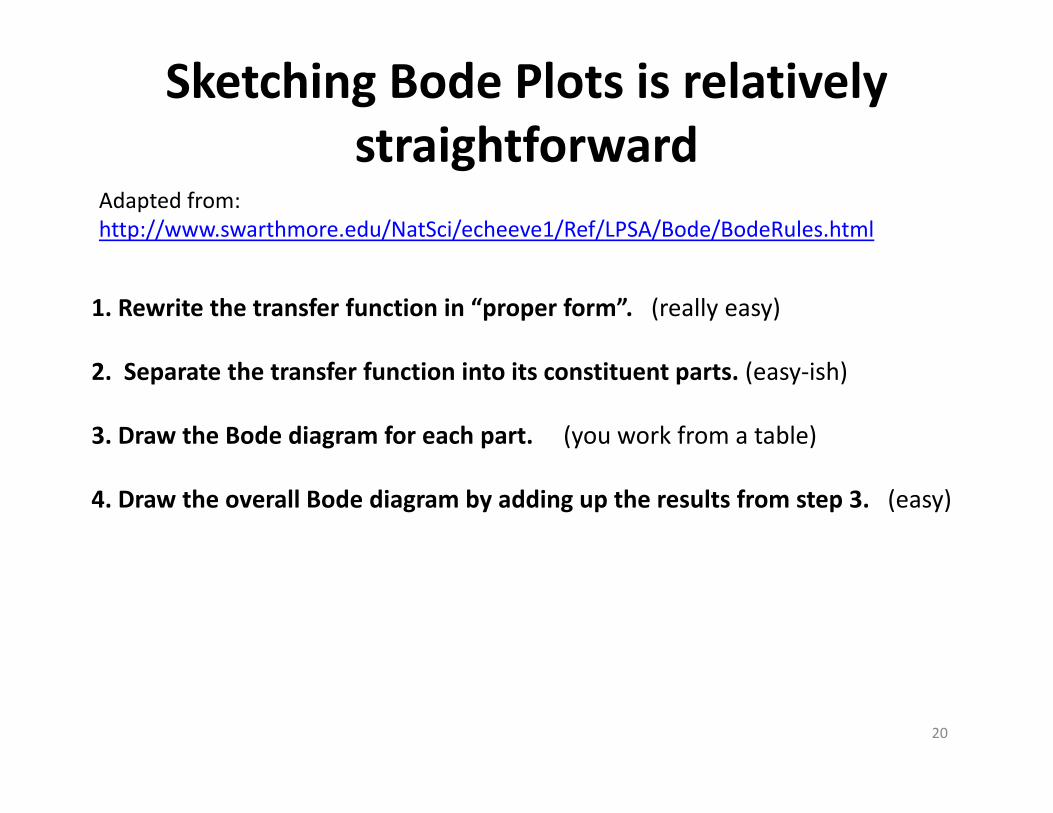
Sketching Bode Plots is relatively straightforwardstraightforward
Adapted from:http://www.swarthmore.edu/NatSci/echeeve1/Ref/LPSA/Bode/BodeRules.html
1. Rewrite the transfer function in “proper form”. (really easy)
2. Separate the transfer function into its constituent parts. (easy‐ish)
3. Draw the Bode diagram for each part. (you work from a table)
4. Draw the overall Bode diagram by adding up the results from step 3. (easy)
20
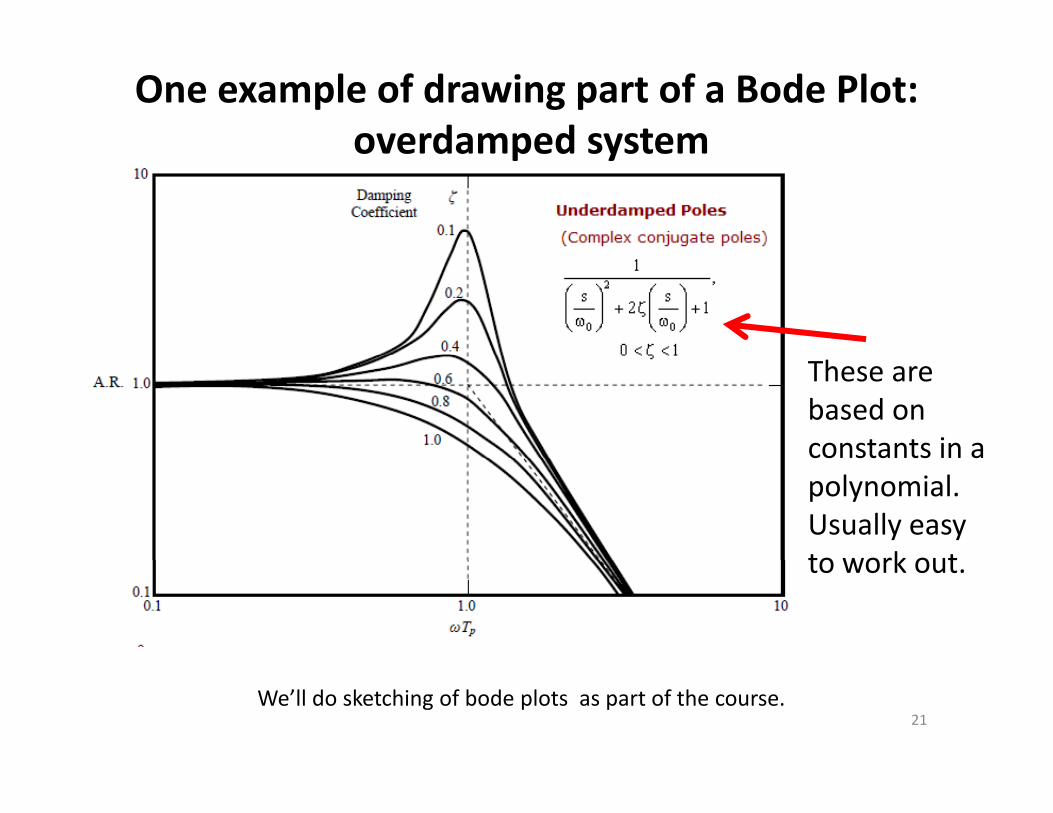
One example of drawing part of a Bode Plot:overdamped systemoverdamped system
These are based on constants in a co sta ts apolynomial. Usually easy to work outto work out.
21We’ll do sketching of bode plots as part of the course.
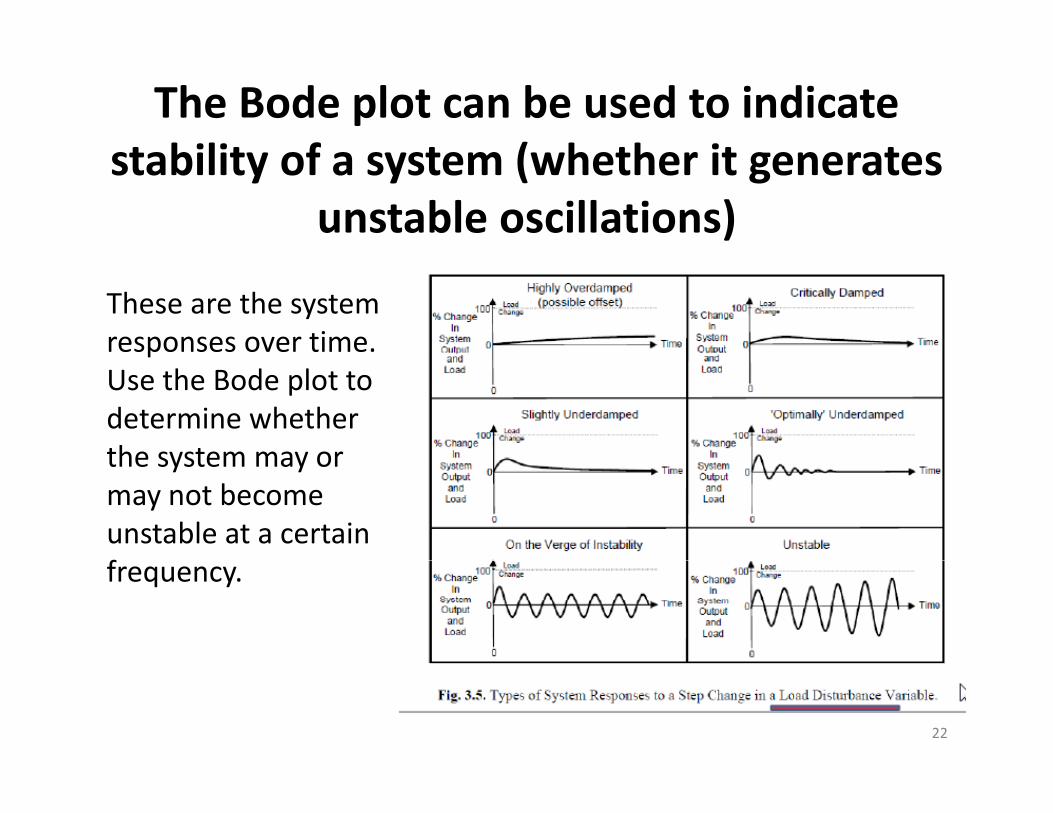
The Bode plot can be used to indicate t bilit f t ( h th it tstability of a system (whether it generates
unstable oscillations)
These are the system responses over time. pUse the Bode plot to determine whether the system may orthe system may or may not become unstable at a certain ffrequency.
22
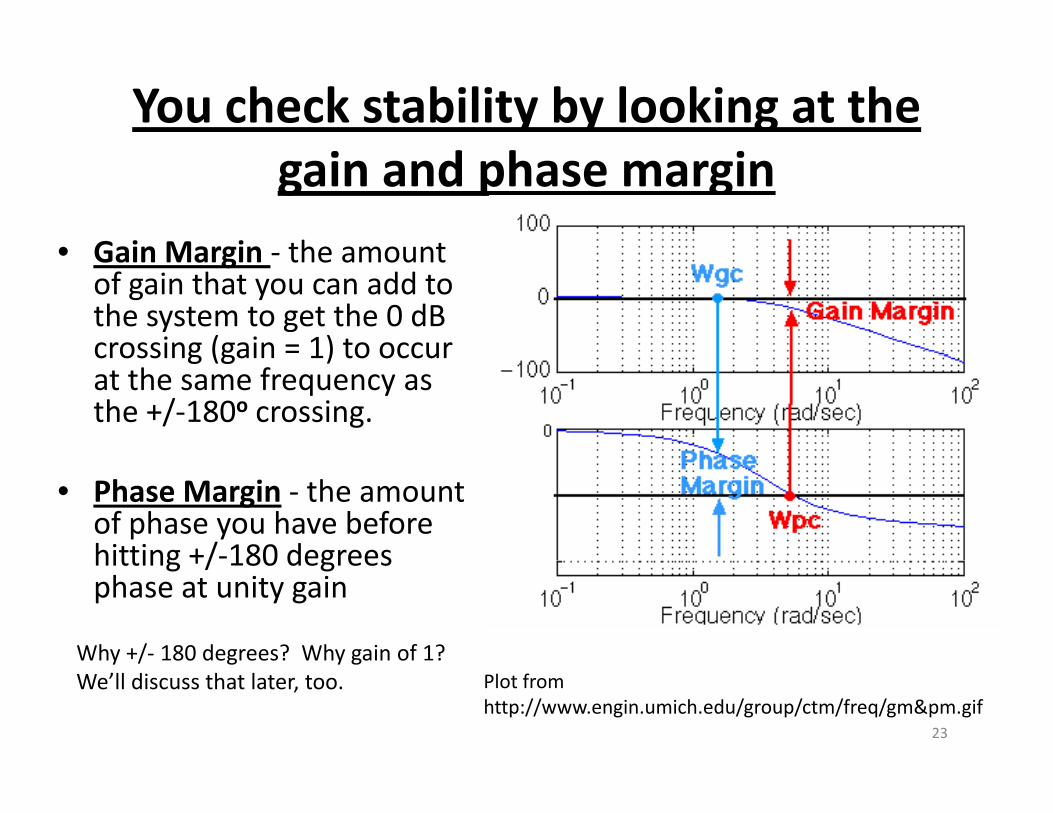
You check stability by looking at the d hgain and phase margin
• Gain Margin the amount• Gain Margin ‐ the amount of gain that you can add to the system to get the 0 dB crossing (gain = 1) to occurcrossing (gain 1) to occur at the same frequency as the +/‐180o crossing.
• Phase Margin ‐ the amount of phase you have before hitting +/‐180 degreeshitting +/ 180 degrees phase at unity gain
Why +/‐ 180 degrees? Why gain of 1?
23
Plot from http://www.engin.umich.edu/group/ctm/freq/gm&pm.gif
y / g y gWe’ll discuss that later, too.
End of the overview.End of the overview.
You’ve now had an overview of ~75% of the “controls” part of the course.
N t d t t th “d t il ” f th t l tNext day starts the “details” of the controls part –hopefully the overview puts things into perspective.
24