Embed Size (px)
Citation preview

IC)I
fELECTE
OF 15 DEC 19190U
DEPARTMENT OF THE AIR FORCE
AIR UNIVERSITY
AIR FORCE INSTITUTE OF TECHNOLOGY
Wright-Patterson Air Force Base, Ohio
90 12 19 04 9

AFIT/GEM/LSM/90S-7
a -~- --
A PERFORMANCE MANAGEMENT FRAMEWORKFOR CIVIL ENGINEERING
THES I S
Robert Michael Gill
AFIT/GEM/LSM/9OS-7
Approved for public release; distribution unlimited

The opinions and conclusions in this paper are those of theauthor and are not intended to represent the officialposition of the DOD, USAF, or any other government agency.
RA' :
K1i ;.. .

AFIT/GEM/LSM/90S-7
A PERFORMANCE MANAGEMENT FRAMEWORK
FOR CIVIL ENGINEERING
THESIS
Presented to the faculty of the
School of Systems and Logistics
of the Air Force Institute of Technology
Air University
In Partial Fulfillment of the
Requirements for the Degree of
Master of Science in Engineering Management
Robert Michael Gill
September 1990
Approved fc'r public rele=p; iqtribitJon unlimited

Acknowledgements
I wish to credit the staff of the Engineering Branch
and the Industrial Engineering Branch of the 2750 Civil
Engineering Squadron at Wright-Patterson Air Force Base.
Their commitment to performance management and willingness
to allow me to enter their domain and observe their activity
made this research effort possible. I further credit and
thank my thesis advisor, Major Hal Rumsey, for his
invaluable input and direction in completing this work.
IIV

Table of Contents
Page
Acknowledgements ..................................... ii
List of Figures ...................................... vii
List of Tables ....................................... ix
Abstract ............................................. xi
I. Introduction .................................... 1
General Issue .............................. 1Background ................................. 2Specific Problem ........................... 6Justificaltion and Purpose ..................... 8Scope and Limitations ...................... 10Investigative Questions .................... 11Organization of Presentation .................. 12Summary .................................... 12
II. Review of Literature ............................ 14
Overview ................................... 14Engineering Environment Distinctives/Difficulties ............................... 14Target of Improvement ...................... 16
Focus of Improvement ..................... 16Method of Improvement .................... 18
Measurement ................................ 19Establishing Meaningful Measures ...... 19Role of Measurement ...................... 21
Degree of Employee Involvement ............... 22Extent and Nature of Training ................ 24
Extent ................................ 24Nature ................................ 24
Management Commitment ...................... 25Process Improvement ........................ 28
Identification of Process forImprovement ........................... 28Scope of Process ...................... 28Strategy for Improvement ................ 29
Implementation ............................. 30Facilitators .......................... 30Methodology ........................... 3 1
Summary .................................... 33
iii

Page
III. Research Method ................................. 35
Overview ................................... 35Literature Review .......................... 36Case Analysis .............................. 37
Justification for Case Analysis Design 37Description of Case Analysis ............ 40
Quasi-Experiment ........................... 41Justification for Quasi-Experiment .... 41Description of Quasi-Experiment ....... 42Validity of the Quasi-Experiment ...... 44
Training Course Development ................... 45Summary .................................... 46
IV. Results and Discussion .......................... 48
Overview ................................... 48Case Analysis .............................. 48
Description of Case ...................... 48Results of Case ....................... 52Observations from Case Analysis ....... 60
Observation Procedure .............. 60Discussion of Observations ....... 62
Quality Survey ............................. 68Results ............................... 68Discussion ............................ 72
Summary .................................... 76
V. Conclusions and Recommendations .................... 77
Overview ................................... 77Recommendations ............................ 77
Name of Improvement Effort .............. 77Use of Training Course .................. 78Performance Improvement Teams ........... 82Scope of Pilot Project ................... 83Hypotheses for Further Research ....... 84
Answers to Investigative Questions ........... 87How has TQM been utilized in othersimilar organizations? What benefitshave been achieved? What changesneed to be made to adapt TQM to theContract Engineering Branch? ............ 87What opportunities and needs existwithin the Engineering Branch forimprovement? .......................... 88What training of personnel is usedprior to or during implementation ofTQM ................................... 89
iv

Page
What obstacles are encountered duringthe initial implementation of TQM? .... 89What short range benefits can bemeasured after implementation of TQM?. 89What outside resources (i.e. privatecontractors or procured training) areneeded to facilitate the performancemanagement effort? .................... 90How do attitudes toward quality ofwork change among employees involvedin performance management? .............. 90How is a performance managementframework used to guide improvementefforts in the particular situationof an Engineering Branch? .............. 90What guidance do Engineering Branchmanagers need to design and implementa performance management frameworkin their organizations? ................. 91
Conclusion ................................. 9 2
Appendix A: Plan of Instruction ...................... 94
Appendix B: Student's Handbook ....................... 115
Appendix C: Leader's Guide ........................ 177
Appendix D: Meeting Summaries and Notes ............. 89
Appendix E: Process Flow Diagrams .................... 304
Appendix F: Design Review Process Problems,Solutions, Actions, and Measures ...... 308
Appendix G: Quality Questionnaire .................... 321
Appendix H: Survey Data ........................... 326
Appendix I: Comparison of Group Pre-Test Results.. 334
Appendix J: Comparison of Group Pre-Test Variance. 336
Appendix K: Comparison of Group Change Results .... 338
Appendix L: Comparison of Group Change Variance... 340
Appendix M: Statistical Analysis ..................... 342
v

page
Bibliography............................................. 349
Vita...................................................... 353
vi

List of Figures
Figure Page
1. Philosophy Change for Performance Management ..... 3
2. The Viewpoint of Performance Management ............ 5
3. The Contract Project Process ..................... 7
4. Civil Engineering Organizational Chart ............. 10
5. Roadblocks to Performance Management ............... 15
6. The Performance Management Equation ................ 16
7. Civil Engineering Customers ...................... 17
8. Two Types of Teams ............................... 24
9. Two Different Training Objectives ................... 25
10. Roles of Management .............................. 26
11. Process Improvement Potential .................... 27
12. Phases of the Engineering Process ................... 28
13. The Deming Wheel ................................. 29
14. The Facilitator is the Key ....................... 31
15. Improvement Theme Methodology ....................... 33
16. Research Method .................................. 35
17. Qualitative Versus Quantitative Research ......... 38
18. Experimental Design .............................. 42
19. The Survey's Likert Scale ........................ 43
20. The Problem Solving Routine ...................... 50
21. Selection Committee Solution ..................... 54
22. Plan Room Solution ............................... 55
23. Review Distribution List Solution .................. 56
24. User Checklist Solution .......................... 57
vil

Figure Page
25. Shops' Design Review Solution ....................... 58
26. Environmental Management Review Solution ........... 59
27. Engineers and Quality ............................ 64
28. Management Selection of Process and Team ......... 67
29. Group Pre-Test Comparison ........................ 71
30. Survey Results ................................... 73
31. A Name for the Engineering Improvement Effort .... 78
32. Training Course Hypothesis ....................... 85
33. Management Support Hypothesis .................... 86
34. Performance Management Framework .................... 91
35. Corps of Engineers Design Review Process ......... 304
36. 0 & M Architect/Engineer Design Review Process... 305
37. 0 & M In-house Design Review Process .............. 306
38. ASD Architect/Engineer Design Review Process ..... 307
viii

List of Tables
Table Page
1. Research Goals ................................... 9
2. Components of Performance ........................ 17
3. Measurement ...................................... 21
4. Roles of Measurement ............................. 22
5. Employee Involvement Possibilities .................. 23
6. Case Analysis Charicteristics .................... 39
7. Validity of Quasi-Experiment ..................... 45
8. The Five Team Members ........................ ... 49
9. The Design Review Processes ...................... 51
10. Corps of Engineers Review Process Steps ............ 51
11. Solutions Resulting from Case ....................... 53
12. Case Analysis Observation Synthesis Procedure .... 61
13. Case Observation Subjects ........................ 61
14. Implementation Principles ........................ 63
15. Facilitator Duties and Needs ..................... 66
16. Contents of Record of Achievements ................. 68
17. Quality Questionnaire Categories .................... 59
18. Statistical Tests Performed ...................... 69
19. Possible Reasons for Lack of Difference ............ 74
20. Results of Performance Management Team ............. 76
21. Performance Management Framework Objectives ...... 79
22. Training Course Objectives ....................... 79
23. Advantages of This Training Course ................. 82
ix

Table Page
24. Engineering Branch Processes....................... 88
25. Guidance Needed by Engineering Branch Managers .. 92
x

AFIT/GEM/LSM/90S-7
Abstract
A performance management team.Was implemented at the
Engineering Branch of the 2750 Civil Engineering Squadron at
Wright-Patterson Air Force Base. The teamifocused on the
process of reviewing projects designed by architect-
engineers and the Corps of Engineers. As a result of this
team effort, Kimprovements to the process were madeA. More
timely and better comments were being provided to the
designers. after the improvement actions.
From the experiences gained in the analysis of this
case,iva three day training course was developed. This
course was created to provide the tools and attitudes needed
to begin performance management efforts In other Engineering
Branches. The course was designed to provide a starting
point, and as a guide to the performance management effort.-- i-
The course,-was structured to be presented at the
squadron location, in order to teach people in their own
environment. Topics included were the distinctives of
the engineering environment, understanding the process
framework, the use of measurement in evaluating work
processes, and employee participation." The use of'the
course was recommended for the base level Engineering
Branch. - • /" 1 6r '', ', , 'i,' ,
CC- - ,, .' -
xi

A PERFORMANCE MANAGEMENT FRAMEWORKFOR CIVIL ENGINEERING
I. Introduction
General Issue
The Department of Defense has recognized the potential
for benefits from the implementation of Total Quality
Management (TQM) concepts in military organizations. To
achieve these benefits the Secretary of Defense has
instructed military organizations to implement TQM
(Department, 1989b:2). Air Force Civil Engineering
Squadrons are among the organizations affected by this
instruction. Direction is needed regarding how to
accomplish this implementation in a Civil Engineering
Squadron, as well as guidance in the type of benefits to be
sought.
TQM is gaining great publicity in organizations
throughout the country. Most of this exposure, however, is
in manufacturing. Service organizations, such as a Civil
Engineering Squadron, have needs and goals which differ from
their manufacturing counterparts. Likewise, application of
TQM in military and government organizations will encounter
different obstacles than in private organizations where
profit is the goal. To be used successfully, the TQM
concepts need to be adapted to the unique nature of an Air
1

Force Civil Engineering Squadron. To differentiate the
management philosophy needed for civil engineering from TQM,
the term performance management will be used to describe the
attitudes, tools, and framework needed to direct improvement
efforts in this setting.
Background
Government and industry have come to understandthat previously acceptable norms of goods andservices are no longer acceptable. Customersatisfaction, reliability, productivity, costs, andfor industry, market share, profitability, and evensurvival are directly affected by the quality of anorganization's products and performance.Therefore, it becomes essential to developattitudes and systems -- at all levels of anorganization -- that promote and implementcontinuous improvement of procedures, processes,products, and services. Those attitudes and systemsare the focus of Total Quality Management (TQM).(Department, 1989a:2)
The drive for performance management can be summed up
in the old adage, 'an ounce of prevention is worth a pound
of cure.* For too long managers both within and outside of
government have been content to let well enough alone and
only act when problems became apparent. A performance
management framework must emphasize the importance of
analyzing the status of performance today and seeking to
improve it for tomorrow (Department, 1989a:8).
The kind of perspective management needs is one which
is future oriented. Quality provides Just such a
perspective. Quality is an important ingredient in overall
performance. When managers make the quality of their
2

products and processes the target of their efforts, they are
looking toward being competitive in the future as well as
today (Townsend and Gebhardt, 1989:20). Quality products
are products which endure, ensuring that there will be
demand for such products long after other competitors have
disappeared.
The Old Philosophy
If it ain't broke, don't fix it.
The New Philosophy
An ounce of prevention is worth apound of cure.
Figure 1. Philosophy Change for Performance Management
Performance improvement is an ongoing process. There
is never a point where the concerned manager can
realistically say *this is as good as it can get." At any
given time, there will always be improvements which can yet
be made. Managers need to make a commitment to scrutinize
the activity of organizations continuously to determine
where additional improvements might be made. When one of
these improvements is implemented, attention needs to be
given to other aspects of performance which can also be made
better. (Roth, 1989:26)
3

Among profit-making companies, it has been declared
that quality is the proposal which affects the profits of a
company most. In fact, it has been estimated that the cost
to American companies due to inferior quality is in excess
of thirty percent of their gross sales (Townsend and
Gebhardt, 1989:18). This alarming figure is a direct
challenge to improve quality. The government organization
should not consider itself an exception. While not having
profit as a measure for quality of performance, untold
resources are squandered due to poor quality. This waste
results from rework after poor initial work, and from
inefficiency of operation.
Performance management has three principal orientations
by which organizations are encouraged to pursue quality:
l)customer orientation; 2)process orientation;
3)participation orientation. First, the customer
orientation forces identification of the internal and
external customers of the organization. Satisfaction of
these customers then becomes the measure of quality in this
orientation (Department, 1989a:6-7). Internal customers are
those within the organization who receive output from the
particular unit. For example, when the engineering
department prepares a drawing showing the maintenance
department how to install a new component, the maintenance
personnel are internal customers of the engineering
department. External customers are those outside the
4

organization which receive output or products. The
organization then sets better service to these customers as
a goal (Kacker, 1988:40). For an engineering company in
particular, the degree to which it meets obligations and
promises to clients (customers) is indicative of commitment
to quality (Armentrout, 1986:144).
Process ParticipationOrientation Orientation
PerformanceManagement
CustomerOrientation1) Internal2) External
Figure 2. The Viewpoint of Performance Management
Secondly, performance management stresses a process
orientation. The processes which comprise the business of
the organization are the emphasis for improvement This
requires identifying these processes, and determining who is
respcnsible for their successful completion (Kacker,
1988:41). Opportunities for improving the way these
processes are done are identified, no matter how small. It
is the combination of these small improvements which will
5

eventually produce significant results (Department,
1989a:1O-1l). For example, the engineering branch may
identify the review of design drawings for new buildings as
one process for which the Chief of Design is the person in
charge. This design review process would then be examined
for potential improvements.
Finally, performance management needs to be
participation oriented. The basis for this is that no
manager has all the best ideas. The input of the workers
involved, those closest to the action, must be included to
truly achieve the performance improvements desired. When
employees become aware that their ideas are being listened
to, they will want to contribute. Listening to what they
have to say will be beneficial (Department, 1989a:14).
Using such a participative approach with engineers is
especially productive, due to the training and talents that
these individuals typically have (Stewart and Calloway,
1982:113). Engineers are familiar with the problem solving
process used in their design work. The management skills
engineers gain in leading design teams is also an advantage.
gpcific Problem
Previous research has examined the initial
implementation of TQM in the Operations and Maintenance
Branch of a Civil Engineering Squadron (Wertz, 1989). This
research will pursue a subject suggested by this previous
research: Development of a training course and handbook
• p6

detailing a method to implement a performance management
framework in the Contract Engineering Branch. The design
and steps to implement such a framework in the Engineering
Branch at Wright-Patterson AFB, Ohio will be documented.
The change in attitude toward quality accompanying this
implementation will be measured using a quality survey.
This will help evaluate the degree to which a transformation
of viewpoint is needed before performance management can be
effective.
The Contract Planning and Engineering Branch of an Air
Force Civil Engineering Squadron (Engineering Branch) is
responsible for planning, designing, and supervising the
contractual performance of projects which maintain or
improve the physical plant of an Air Force base. This
Progra 4. MaaeConstructo
Project ProJect of Project
Duties:1) Cost Eat. 1) Design Dwgs. 1) Inspection2) Fiscal Yr. 2) Specifications 2) Change Orders3) Requiremts. 3) Detailed Cost
Estimate
Figure 3. The Contract Project Process
physical plant includes the roads, utilities, facilities,
and grounds. A significant difference between the
Engineering Branch and the Operations and Maintenance Branch
7

previously studied is that the Engineering Branch employs
more professional and technical personnel, whereas the
Operations Branch employs more craftsmen and administrative
people. While both have a service orientation, this
difference in personnel may lead to differences in use of
the performance management concepts. This research will not
repeat the efforts of the previous research. Rather, a
framework for the implementation of performance management
specifically tailored to the Engineering Branch of Air Force
Civil Engineering will be developed.
Justification and Pur2 ose
The Department of Defense (DoD) has been instructed to
implement TQM across all organizations in the armed forces
(Department, 189b:2). This approach to management has been
found to produce significant improvement of job satisfaction
among workers, productivity levels, cost reductions, and
customer satisfaction. The Japanese were the first to adopt
TQM on a large scale and to demonstrate its potential
(Walton, 1986:25-32,122-123). The United States Government,
recognizing the benefits to be gained for its own military,
decided to have federal organizations initiate such
management programs. Air Force Civil Engineering is thus
responsible to accomplish this transformation within its own
ranks. The TQM concepts must be adapted into a framework
for performance management tailored to the civil engineering
environment.
8

This research will closely examine the actual
implementation of a performance management framework in an
Air Force Civil Engineering environment. It will document
the steps taken, the difficulties encountered, and the
results obtained. A training course and handbook will be
developed specifically designed for the Engineering Branch
to aid in the implementation of performance management.
This research will further measure the extent, if any, to
which the attitudes of the personnel associated with this
implementation in the squadron are altered toward their role
in performing well. The extent of any improvements in the
processes underlying the work of the squadron will also be
documented.
Table 1. Research Goals
1) Document and analyze theimplementation of performancemanagement.
2) Develop a training course andhandbook to aid in efforts to implementperformance management in otherengineering branches.
3) Measure any change in attitude towardquality accompanying implementation of aperformance management framework.
This information should prove valuable to Air Force
Civil Engineering managers preparing to implement
performance management in their own organizations. In
9

addition, a statement can be made of how effective the
implementation is in the target Civil Engineering Squadron.
To the extent allowed by the research method adopted, this
information may be extended to the potential effectiveness
of performance management in other squadrons. This
information will be the foundation for a training course and
a handbook, recommending methods and options for
implementing a performance management framework. This
training course and handbook will facilitate the use of the
lessons learned in this research.
Scope and Limitations
The target for research is the Engineering and Contract
Planning Branch of an Air Force Civil Engineering Squadron.
Air ForceCivil Engineering Sgqudron
I I I I I
Operations & Engineering FireMaintenance Prevention
Previous ThisResearch Research
Figure 4. Civil Engineering Organizational Chart
10

Research regarding implementation of TQM in the Operations
and Maintenance Branch was previously performed (Wertz,
1989). Housing, Industrial Engineering, and other branches
will not be addressed. The Engineering and Contract
Planning Branch is the largest of the branches not included
in the previous research, and has therefore been chosen as
the next branch to be concentrated on. In addition, the
researcher is familiar with the working of this branch,
facilitating this research.
Investigative Questions
In order to accomplish the purpose for this research,
the following specific questions will need to be answered:
1. How has TQM been utilized in other similarorganizations? What benefits have beenachieved? What changes need to be made toadapt TQM to the Contract Engineering Branch?
2. What opportunities and needs exist within theEngineering Branch for improvement?
3. What training of personnel is used prior to orduring implementation of TQM?
4. What obstacles are encountered during theinitial implementation of TQM?
5. What short range benefits can be measured afterimplementation of TQM?
6. What outside resources (i.e. privatecontractors or procured training) are neededto facilitate the performance managementeffort?
7. How do attitudes toward quality of work changeamong employees involved in performancemanagement?
8. How is a performance management framework usedto guide improvement efforts in theparticular situation of an EngineeringBranch?
9. What guidance do Engineering Branch managersneed to design and implement a performancemanagement framework in their organizations?
11

Organization of Presentation
Chapter I presents the introduction to the subject for
research and a description of the problem and investigative
questions. The purpose and scope are given.
Chapter II presents a review of the literature
pertinent to the subject of research. The chapter is
divided into topics relevant to performance management
and its implementation in an engineering environment.
Chapter III describes the methodology used to answer
the investigative questions. Reasons for selecting the
particular methodology are also given.
Chapter IV summarizes the data obtained through the
research. Tables are included to consolidate the results.
Chapter V explains the results and draws appropriate
conclusions from the data, and makes recommendations for
further research.
S ummar
Performance management is a framework of attitudes and
tools for managers to use to increase the performance of
their organizations. It stresses customer satisfaction,
process improvement, and employee participation. Air Force
Civil Engineering Squadrons have been instructed to
implement TQM to make better use of the scarce resources
available and to better accomplish their mission of facility
support. This research will examine and document the
12

implementation of the TQM concepts in a Civil Engineering
Squadron environment, record the associated results, and
propose a training course and handbook to assist managers in
implementing a framework for performance management in
their squadrons.
13

II. Review of Literature
Overview
This chapter will discuss current published information
on the subject of implementing a system for performance
analysis, improvement and management. Much of this
literature focuses on Total Quality Management (TQM) and its
use in organizations similar to civil engineering. TQM is a
management philosophy which stresses continuous improvement
of the processes which make up any organization's work.
Several issues must be resolved in order for
performance management to be successfully implemented in an
organization. Information will be presented pertaining to
these issues, which are
1. Engineering Environment Distinctives/Difficulties2. Target of Improvement3. Measurement4. Degree of Employee Involvement5. Extent and Nature of Training6. Management Commitment7. Process Improvement8. Implementation
En ineering Environment Distinctives/Difficulties
Improvement in the engineering design of construction
projects has not received the attention that improvement in
manufacturing production techniques has. Total Quality
Management principles have the potential for astounding
increases in productivity, quality, and labor motivation in
the manufacturing environment. One estimate suggests that
no less than 65% of a service industry's production is lost
14

to extra steps in the work processes needed to correct
errors (Kacker, 1988:40). Yet the potential exists to
use TQM for greatly increasing productivity and decreasing
cost through better designs.
r'drroject Orientation
equremntsChane
rarIdeas Hard to Mease
Figure 5. Roadblocks to Performance Management
The literature reveals many obstacles preventing wider
use of TQM. Construction and design are oriented toward
individual projects, inhibiting improvements from being
shared from one project to another. The frequency with
which owners or users change their minds about what they
want makes it difficult to accurately evaluate the
effectiveness of the design itself (Gilly and others,
1987:428,430-1). Another impediment is that engineering
design initially provides information. When the output of
15

the work is a physical object which can be counted and
inspected, evaluation of the output is simplified. It is
much more difficult to objectively evaluate a conceptual
design: against what standard should it be measured
(McGeorge, 1988:360)?
Target of Improvement
Focus of Improvement. By its very name, one would
surmise that the focus for improvement of total quality
management is quality. But what is quality? And is that
indeed the focus? The Department of Defense, when mandating
TQM, defined quality as the degree to which the customer is
satisfied (Department, 1989a:7). Quality in the civil
engineering environment is further defined as meeting the
declared requirements of the owner, designer, constructor,
and regulating bodies (ASCE, 1988:1). Above all others,
Improved + Customer = QualityPerformance Satisfaction Management
Figure 6. The Performance Management Equation
quality is the greatest single factor which affects the
profitability of a concern (Townsend and Gebhardt, 1989:18).
While improving the quantity of production is important, the
quality produced in engineering work is most important
(Takei, 1981b:24).
16

Productivity, being the ratio of output produced to the
corresponding input used, is proposed as an alternate focus
of improvement (Stewart and Calloway, 1982:110, Sumanth and
Yavuz, 1983:260). In his work to improve engineering
productivity in the Tennessee Valley Authority, Daryl
Armentrout suggests the broader index of performance is
another possible focus for improvement. Performance
includes efficiency, effectiveness, profit, innovation, and
working conditions in addition to quality and productivity.
These seven components of performance are equally applicable
to not for profit public agencies. Profitability must be
changed to budgetability, defined as the degree to which the
organization accomplishes its goals and objectives and keeps
its budget (Sink and Tuttle, 1989:185). The measure of
effectiveness is given as how well commitments to the
customer are satisfied (Armentrout, 1986:142,144). This
then comes back to customer satisfaction as suggested by
DoD.
Table 2. Components of Performance
EffectivenessQualityEfficiencyProductivity
Quality of Work LifeInnovationBudgetability orProfitability
17

Lieutenant General John M. Loh, as Commander of the Air
Force Aeronautical Systems Division, lists *delighting the
customer' as one of the guiding principles of that
organization. He includes the contractors retained by the
Air Force among those customers. The engineering designs
and documents prepared by the government are the product
that needs to be improved to satisfy that customer (Loh,
1989). Another customer for the engineering organization is
the field worker (Takei, 1981b:23). It is imperative that
the needs of these customers, as well as those of the
ultimate users of the facilities, be identified and goals
set to satisfy these needs (Kacker, 1988:40).
Customers65rof Engineering
Field Workers ContractorsUsers
Figure 7. Civil Engineering Customers
Method of Impr ovement. The obstacles to performance
management implementation in the engineering environment
discussed above need to be overcome for the effort to be
effective. The engineers themselves are the most effective
resource in overcoming these obstacles. One suggestion is
to establish a team of engineers to develop quality and
productivity improvements. The team determines the critical
18

factors affecting the work, and establishes a theme or goal
for improvement. A measurement formula must then be devised
to provide data for planning the improvement method. Once
appropriate and meaningful measures are established, methods
are attempted to improve the system until success is
achieved. Then a new theme for improvement is decided upon
and the steps repeated (Takei, 1986:93).
Measurement
Establishing Meaningful Measures. Measuring the
productivity or quality of an engineering concern is
difficult. The output of engineering is often one of ideas,
a product not easily quantified. An ideal product measure
would be to relate total output to all associated input
(Sumanth and Yavuz, 1983:261). This total factor ratio
should be applied where costs permit. However, attaining
this kind of total measure may not only be expensive, it may
be impossible due to the inability to assign the engineer's
input (time) to a particular output. Two other levels of
measurement are partial factor and single factor ratios. A
single factor ratio is developed by selecting some lone
factor believed to accurately represent the total input or
output. This single factor is then used in place of the
overall total in computing productivity. Partial factor
models use more than one factor, but fall short of being
total factor evaluations.
19

Surrogate measures, which link productivity to more
easily observed characteristics, such as utilization of
equipment capacity, have been proposed as an alternative to
the preceding actual product measures (Stewart, 1978:34,
Armentrout, 1986:142). Process measures are another
alternative, where the method used to achieve the end
product is evaluated. The measurement formula devised must
correspond to the effectiveness of the actual product, be it
design or facility, not just activity related to it
(McGeorge, 1988:352). The points in the processes where
evaluations are to be made is likewise important.
Convenient points of assessment are the interfaces between
separate subprocesses which make up the whole (Kacker,
1988:41). In some cases, surrogate or process measures are
much more easily attained than the product measures, due to
the previously mentioned difficulties in quantifying product
attributes.
Absolute measurement systems evaluate performance
compared to some externally defined standard. The
Engineered Performance Standards (EPS) used in evaluating
craftsmen's work are of this type. Such absolute scales are
difficult to develop for engineering design. Another
measure of interest would be comparing how well the promises
and commitments to clients were kept (Armentrout, 1986:143).
20

Table 3. Measurement
Levels of Measures
Total FactorPartial FactorSingle Factor
Types 2 Measures
ProductProcessSurrogate
Classes of Measures
RelativeAbsolute
Comparative measures have also been proposed as a
solution to the problem of establishing absolute scales for
evaluating the productivity and quality of engineering
organizations. Evaluation might be made on the basis of
volume of output supported against the most competitive
engineering firms (Takei, 1981a:13) and against government
engineering departments. Alternatively, performance trends
of the subject organization might be tracked over time to
assess progress and improvement (Stewart and Calloway,
1982:115).
Role of Measurement. Measurement is a fundamental tool
to be used in the performance management framework. A
measurement and feedback system must be created which allows
the processes of interest to be monitored and improved
(Dingus and Hrivnak, 1988:30). A system to measure
21

performance is essential in order to understand the causes
of variation in work processes which lead to job breakdowns
(Hacquebord and Scholtes, 1988a:29). Measurement of
productivity is a necessary ingredient in any effort to
improve productivity (White and Austin, 1989:371). Accurate
measurement of performance is useful for other purposes as
well. Once improvement actions have been implemented,
measuring the impact of those actions can permit errors in
the improvement actions to be fixed before proceeding
(Edosomwan, 1987:67). These modifications generated from
the feedback from improvement efforts can result in even
greater performance improvements. The measurement of
improved performance can be a record to show to management
to convince them of the value of the performance management
effort (Gilly and others, 1987:436). If performance
management is competing with other opportunities for scarce
resources, this evidence of success can be important in
ensuring the continuance of the effort.
Table 4. Roles of Measurement
1) Evaluate Processes2) Improvement Feedback3) Sell Management
2L P!2M Involvement
Performance management stresses the employees'
involvement in management. Individuals from all levels of
22

the organization, including the line workers, share in
decision making. This employee involvement can be used in
first identifying the processes to be improved (Hacquebord
and Scholtes, 1988b:46). The employees affected can then be
included in brainstorming possible solutions to problems and
strategies for improvement (Department, 1989a:ll). Group
interaction can also be used effectively in establishing the
measures to be used in evaluating quality and productivity
(Stewart and Calloway, 1982:114).
Table 5. Employee Involvement Possibilities
1) Identify processes for improvement2) Brainstorm problems and solutions3) Establish measures
Two formats for employee participation are the work
group and the quality circle. Quality circles are comprised
of workers from a single work setting within the
organization, and often include their immediate supervisors
(Steel and Lloyd, 1988:3). Work groups are temporary teams
assembled from members of the several work settings which
comprise a process within the organization. A particular
team will continue to meet until the improvement desired to
a process has been accomplished, and will then be dissolved
(Department, 1989a:15).
23

Functional Area Quality Circles
Multi-FunctionProcessActionTeam
Figure 8. Two Types of Teams
Extent and Nature of Training
Extent. Training of the employees and managers
involved in TQM is important. One approach to assure
training does not miss anyone is to train everyone at the
outset (HQ AFLC, 1989a:10). A major risk of doing this is
that by the time the last people are being trained the first
ones will be losing their enthusiasm for the program (Roth,
1989:28). A better approach is to get started into the
quality transformation and then provide the training
required at the time needed (Hacquebord and Scholtes,
1988b:48).
Nature. A cultural transformation needs to take place
in an organization for a performance management framework to
be effective. Training is an important vehicle for
accomplishing this change in culture. The new attitude
needed is one where every member of the workplace thinks
improvement, and brings a pride and enthusiastic approach to
24

their improvement efforts (Ryan and Sebastanelli, 1987:
331-2). A problem with many training programs is that not
enough attention is paid to this cultural change; too much
emphasis is placed on teaching the tools of performance
management (Warmington, 1988:36). The team leader and
facilitator should be the only ones to receive training in
the use of these technical tools at the outset; the team
members can pick up what they need in the actual on-the-job
problem solving (Gilly and others, 1987:429). The tools of
particular use in performance management are measurement,
control, planning and cause/effect improvement techniques
(Edosomwan, 1987:67).
Cultural Change Orientation
Leaders E v e y o n e Facilitators
Specific SpecificTools Tools
Figure 9. Two Different Training Objectives
Managemnent Commitment
The success of the performance management effort lives
or dies on the support and direction provided by management.
The improvement program must begin with management
commitment and end with management rewarding the
25

participants (Edosomwan, 1987:67-8). Management cannot
delegate responsibility for performance management to a
staff group or quality coordinator and then forget about it;
this communicates that it was not important to begin with
(Warmington, 1988:26). Continued management commitment is
__ 0
IMPROVEMENT
One of management's important roles is to direct theimprovement effort. The other is to support it.
Figure 10. Roles of Management
needed. When the inittal momentum has worn off, only
management can jump in to keep the hope alive (HQ AFLC,
1989b:7). The challenge to management is to spur the
organization on to improvement, and to provide creative
ways to get there (Dingus and Hrivnak, 1988:29).
Management's input is critical in deciding which aspects of
the workplace are most important in directing the
improvement program (Stewart, 1978:37). The potential for
the greatest improvements is at the early conception and
development phases of the work process; these are
26

management's domain, and need their attention to achieve all
the improvements possible (McGeorge, 1988:358).
The conception anddevelopment phases holdthe most potential
Potentialfor
improvement
Begin CompletePhase in Process
Figure 11. Process Improvement Potential
When the performance improvement team has developed its
proposed solutions, attention must be returned to
management. A management presentation is an ideal way to
make this transition. The team prepares their solutions in
the form of a fifteen to twenty minute presentation. Top
management and the department heads affected are invited.
The presentation should include a specific request for
action by management. This high visibility presentation
serves not only to inform management of the results of the
team's effort, but it also allows the team members to
conclude their activities on an exciting note. (Todd, 1990)
27

Process Improvement
Identification of Process for Improvement. Before the
processes which make up the way an organization does
business can be improved, those processes need to be made
visible and mapped out (Kacker, 1988:41). Asking workers
whom within the organization they depend on can provide
clues to internal provider relationships. Discovering whom
they provide service to can help to uncover the customers in
these processes. Determining these providers and customers
helps establish the interfaces between subprocesses
(Hacquebord and Scholtes, 1.88a:29). In an engineering
environment the overall process is made up of three distinct
phases: planning, analyzing, and coordination (Stewart and
Calloway, 1982,110).
SP L A N N IN I 1 ................. 4 A N A L Y S IS I I C O O R D IN A T IO N1
Figure 12. Phases of the Engineering Process
Sco2e of Process. Improvement of engineering design
will be most effective when the improvement efforts are
aimed at the entire design and construction process, from
conception to delivery of the completed project to the
customer. Quality, an important component in design, is
dependent on the quality with which each individual step in
the design process is completed, from initial surveys and
28

information gathering through design to production and
testing (Takei, 1986:92). Much attention has been given to
improving the technical design and drafting steps in the
process, through innovations such as standardization of
details and CAD. However, vast improvements at minimal
costs can best be made in the early concept stages of
project design (McGeorge, 1988:353,357). Having started
with design, improvement efforts must continue, through
construction, until the facility is delivered to the user to
be effective (Gilly and others, 1987:428).
S!EgY 1for Improvement. Once the process is
identified a strategy for improvement needs to be developed.
Figure 13. The Deming Wheel
An effective model to use for this strategy is the Deming
Wheel, which consists of planning ways to improve, doing
29
what is needed to get started, checking the effectiveness of
the activity, then acting to complete the planned
improvement, and starting all over again with planning a new
improvement (Hacquebord and Scholtes, 1988b:46). An
alternate to the Deming Wheel is the productivity cycle,
defined as measuring current productivity, evaluating the
results, planning how to improve the level of productivity,
then implementing the improvements, and beginning again with
measuring productivity (Sumanth and Yavuz, 1983:261).
Imlementation
Facilitators. The facilitator is an important part of
the performance management team. The Job of the facilitator
is to observe the participation of the members of the team,
and to direct them in the problem solving process. Toward
this end, the person selected to facilitate the team should
attend a three or four day training course to learn what to
look for and the tools to suggest (Gilly and others,
1987:429). The facilitator can have a profound impact on
the team's effectiveness; "... an effective facilitator can
unlock the energy and intelligence of the group to solve
problems* (Fishman, 1989:22). The person facilitating the
team may not be the boss of anyone on the team, or
participation will suffer (Roth, 1989:30).
The duties of the facilitator start with planning each
meeting. Drafting and posting an agenda to outline the
30

goals and schedule of the meeting can help keep the group
time focused. This motivates the team members to apply
themselves to the subject and goals, by being aware of what
needs to be accomplished. Further duties of the facilitator
are to get the other group members involved in the work.
Tasks need to be delegated to others as much as possible.
These tasks might include keeping minutes, recording
important thoughts on an easel pad or overhead for the group
to refer to, or developing charts and graphs to illustrate
information. (Todd, 1990)
Figure 14. The Facilitator is the Key
Methodology. en TQM is first implemented in an
organization, an awkward start is to be expected.
Management needs to get the ball rolling and establish some
momentum in order to get through this start-up (Hacquebord
and Scholtes, 1988a:28,31-32). One suggestion is to try a
high visibility and easily understood process for the first
improvements (Townsend and Gebhardt, 1989:20). Another
possibility is distributing articles trumpeting the
31

successes of performance management prior to kicking-off the
effort itself (Ryan and Sebastanelli, 1987:328).
Planning for the improvement effort Is essential before
diving in. One of the main reasons performance management
fails is due to a lack of strategic planning for the change
(Vogt and Hunt, 1988:96). Caution is in order to make sure
a framework is well thought out before starting any kind of
team improvement efforts (Roth, 1989:29). Use of a steering
group is recommended to list the key processes in the
workplace and assign facilitators and improvement teams to
tackle them (Department, 1989a:35). Part of this initial
planning is to identify who the informal leaders in the
organization are, and develop a strategy to use their help
in implementing the performance management framework
(Hacquebord and Scholtes, 1988a:31).
Small problems are a good place to start on a brand new
performance management framework (Gilly and others,
1987:435). This way some early small successes can help
bolster enthusiasm for later larger projects. Follow a
process of identifying a theme for improvement, determining
the important factors affecting that theme, and then seeking
to measure and improve those factors. The theme may be
reducing customer complaints, shortening turn-around time,
or similar goals (Takei, 1986:93). The factors must be well
understood, and the problems correctly diagnosed, before
applying solutions, or lasting improvements may be missed
32

(Warmington, 1988:40). Management must act on the
recommended actions for implementation from the team, or the
team will give up due to the perceived futility of their
work (Vogt and Hunt, 1988:96).
Identify Determine Measure andImprovement c > Important > Improve
Theme Factors Factors
< (= Repeat <= 4r
Figure 15. Improvement Theme Methodology
Summary
TQM is a management philosophy which has been used by
both manufacturing and service organizations to improve the
way they do business. The United States Department of
Defense has mandated that all military organizations adopt
TQM techniques in order to cut costs, improve productivity
and job satisfaction, and provide better customer
satisfaction. Air Force Engineering Branches are among
those affected. Because engineering generally deals with
ideas instead of tangible products, the way a performance
management framework will be implemented and its success
measured needs to be carefully considered.
The literature reviewed in this paper summarized the
current thought on how to accomplish this. Managers need to
determine whether to stress quality, productivity, customer
33

satisfaction, or some aggregate of these. The processes for
which they are responsible must be identified and strategies
prepared to improve them. It is important to establish
meaningful measures for productivity, directly or through a
surrogate measure. Managers must determine where to make
these measurements and how to judge the results obtained. A
plan for the degree and nature of involvement for employees
needs to be decided upon, as well as how and when to train
those employees. Managers must also be sensitive to
creating the initial enthusiasm required to get their
programs off the ground.
34

III. Research Method
Overview
A case analysis of the 2750 Civil Engineering Squadron
Engineering Branch located at Wright-Patterson Air Force
Base, Ohio, was the primary method used to address the
specific problem and investigative questions previously
described. One reason this Engineering Branch was chosen
was because of its proximity to the researcher, providing
for ease of making the required observations for a case
study. A second reason i because its Major Command, Air
Force Logistics Command (AFLC) , has been emphasizing TQM,
so that the Branch was already interested in performance
management, though no steps had been taken to implement any
framework for improvement prior to this research.
Case Literature QualityAnalysis Re iew Survey
Synthesis
Training Course Conclusions, Hypothesesand Handbook and Recommendations
Figure 16. Research Method
In addition, a survey instrument called the Quality
Questionnaire was used to determine any shift in attitude
35

toward quality that accompanied the implementation of
performance management. Statistical tests were utilized to
determine if any significant change occurred.
The insights gathered from the careful observations of
the case analysis were combined with knowledge obtained from
a thorough review of the literature to develop a training
course and handbook for engineering managers interested in
implementing a framework for performance management.
Hypotheses and recommendations regarding the implementation
of performance management in Engineering and Contract
Planning Branches of Air Force Civil Engineering Squadrons
were generated.
Literature Review
A comprehensive review of the literature published on a
subject is a crucial element to any research. It is in the
literature that researchers find the current state of
knowledge on a topic and thereby can assure that they are
not going over the same ground which has already been
covered.
Concurrent with the case analysis described below, a
representative review of published literature on the subject
of performance management implementation was accomplished.
Particular emphasis was placed on recent papers and articles
in professional journals. The search for such articles
began with a search of defense oriented literature and a
search of industry and ttade Journals. Both searches were
36

assisted by the Air Force Institute of Technology library
staff using on-line computer aids at the researcher's
request. Beginning from the references identified by these
searches, and continuing with references cited in the
bibliographies of these articles, the literature was
reviewed. Notes of important information were taken and
organized by topic for use in comparing to insights from the
case analysis. (Selltiz and others, 1964:53)
Case Analysis
Justification for Case Analsis Design. The state of
knowledge regarding performance management implementation is
still in its infancy. Very little has been published
focusing on performance management in American government or
the engineering environment. Therefore, an exploratory
qualitative research design is desirable, to increase this
state of knowledge. Exploratory research should be seen as
the important first step in an ongoing research process.
This process culminates in the quantitative research
analysis of hypotheses and/or descriptive and causal
studies. However, proceeding to such quantitative research
prematurely, before qualitative research has allowed the
formulation of appropriate hypotheses and research
questions, can decrease the effectiveness of such
quantitative research. (Selltiz and others, 1964:52)
37

Four options are most appropriate for such exploratory
research: historical, case analysis, delphi technique, and
meta-analysis. The meta-analysis was rejected because of
the scarcity of published literature applicable to the
little muh
State of Knowledge on Subject /
Qualitative Methods Quantitative Methods
Historical Analysis Hypothesis TestingCase Analysis Causal AnalysisDelphi Technique Descriptive Studies
Figure 17. Qualitative Versus Quantitative Research
research problem. The historical method was rejected
because most of the track record on performance management
is from Japan. The extreme cultural differences between
Japan and America would make lessons learned from the first
difficult to apply to the second. The delphi technique
would be a powerful tool to use in this situation when more
experience has been gained by people in America using
performance management. At the present time, however, use
of an in-depth case analysis to observe and report on
performance management implementation first hand was
selected.
38

The case analysis is useful to discover knowledge on a
subject with the end of establishing a definite hypothesis
or research problem for further study (Selltiz and others,
1964:50). A strength of the case analysis is its ability to
provide an intensive examination of a single unit. From
this examination not only the broad picture but the fine
details can be recorded and analyzed. Another strength is
that the end result is not just a snapshot in time of the
condition of the subject. A record of the steps taken,
problems encountered, and corrections made is preserved.
A principal weakness of the case analysis is that it is
not easily replicated. The results obtained are in
some ways peculiar to the subject of the study; ability to
generalize the results are reduced. Another weakness is the
potential for the researchers/observers to include their
personal bias in the reporting. They must be ever alert
to remain objective (Selltiz and others, 1964:60).
Table 6. Case Analysis Characteristics
Strengths of Case Analysis
1) Create knowledge on subject2) Provide broad understanding of subject3) Preserve record of case development
Weaknesses of Case Analysis
1) Hard to replicate results2) Generalization of conclusions limited3) Subject to bias of researcher
39

Description of Case Anallsis. The Chief of the
Engineering and Contract Planning Branch was contacted in
August 1989. Arrangements were made to establish a team to
evaluate and improve the process of design revie:w. This
process was chosen by the Chief as needing improvement.
Design review is a process whereby the affected
organizations on the Air Force installation review the plans
and specifications for proposed construction work.
Five individuals were assigned by the Chief to
participate on the team. Each member was a representative
of a particular function within the Engineering Branch
contributing to the process. The individuals chosen were
not perceived to have any distinctive aptitude for the task
over other members within the same function.
The team met once a week for one hour from November
1989 through summer 1990. The team followed the scientific
method for problem solving. They identified the steps in
the process, developed a list of problems they were aware
of, proposed solutions to these problems, and formulated
programs to implement these solutions.
The researcher attended these meetings as a facilitator
and observer. The team was assisted in following the
scientific method. A member of the Industrial Engineering
Branch of the Civil Engineering Squadron, experienced in
facilitating such a team endeavor, assisted. Important
information was noted as it surfaced about implementation of
40

the framework for performance management. The ingredients
essential to successful case analysis research were
considered: l)open-minded and careful scrutiny; 2)accurate
synthesis of the data (Selltiz and others, 1964:60). To
this end, notes and minutes of the meeting were kept and
organized into topics. These topics were compared to those
developed from the review of the literature described above.
In this way consistent trends were established from both
published and observed characteristics.
Quasi-Expe riment
Justification for Quasi -ExperLment. An important
consideration in implen'enting performance management is the
cultural change, or adjustment in attitude, which first
must occur for tae effort to be successful (Warmington,
1988:36). Observing the change in individuals' attitude
toward quality issues such as leadership, planning, and
customer satisfaction associated with the case analysis may
reveal insight into this cultural change.
A non-equivalent control group design was chosen to
augment the case analysis. Figure 3.18 shows the form of
the quasi-experiment. The goal was to measure whether
attitudes changed toward quality among those participating
on the quality improvement team. Because the treatment
group was selected in a non-random fashion, a true
experiment was impossible. The researcher had the ability
41

to test the treatment group before and after the treatment,
and a control group at the same times, so the quasi-
experimental design was chosen as the most powerful
available. (Campbell and Stanley, 1963:34)
o x 01 2
o 0
3 4
where: X is the treatment
0 is the treatment group pretest1
0 is the treatment group post-test2
0 is the control group pretest3
0 is the control group post-test4
Figure 18. Experimental Design
Description of 2uasi-Experiment. A survey instrument
called the Quality Questionnaire was used to measure
attitudes (Hayman and Schneider, 1989). The instrument
consists of fifty-four statements which allow a response on
a seven point Likert scale ranging from strongly disagree to
strongly agree. Because the presentation of the scale
includes the integers one through seven, the data obtained
are assumed to be of interval level. The survey yields
results that allow the use of T-tests and other parametric
42

statistical tests (Hayman and Schneider, 1989:23). The
population characteristics of the sample data are assumed
to be normally distributed from a population of infinite
size.
1 2 3 4 5 a 7
Strongly Disagree Strongly Agree
Figure 19. The Survey's Likert Scale
The control group was selected to match experience and
authority levels with the treatment group as closely as
possible. Due to difficulty in selecting members in similar
positions for the control group, the pretest was
administered to the control group two months after the
treatment group was tested. The affect of this delay will
be discussed below. The pretest results from each group
were compared to verify that in fact no significant
difference in scores on the questionnaire existed. The
quasi-experimental design used is most effective when the
control and treatment groups are equal (Campbell and
Stanley, 1963:48). This was done using a two sample t-test
with the null hypothesis being no difference and the
alternate hypothesis being any difference positive or
negative. The results obtained confirm the null hypothesis;
the groups are declared to be equal.
43

The change in scores on each statement were then
compared between the treatment and control groups using a
two-sample paired t-test. The null hypothesis was that no
difference in change in scores existed between the groups.
The alternate hypothesis was that the treatment group had a
significantly different change in scores than the control
group.
Valdit of the Quasi-Exeriment. The non-equivalent
control group design controls the following obstacles to
internal validity: history, maturation, testing, and
instrumentation. The control of maturation and
instrumentation was compromised to some unknown degree due
to the delayed administration of the pretest to the control
group noted earlier. The researcher is unaware of any
significant events during the two month period the test was
delayed, so maturation may not have been significantly
affected. Both the treatment and control groups had a
period of from five to seven months between their pretest
and post-test, so the difference in instrumentation may not
be important. However, this weakness in the administration
of the experimental design is noted, with its corresponding
potential affect on the experimental results.
The obstacle of regression is controlled if the
treatment and control groups are equal. A test of
equivalency was performed. The obstacle of selection-
maturation interaction is reduced when the members of the
44

groups are assigned, rather than volunteers. The obstacle
of mortality was controlled by assuring that no members of
the groups dropped out between the pretest and post-test.
(Campbell and Stanley, 1963:48,50)
Table 7. Validity of Quasi-Experiment
The non-equivalent control groupexperimental design controls thefollowing obstacles to internalvalidity.
1) History2) Maturation3) Testing4) Instrumentation5) Regression6) Selection-Maturation7) Mortality
The quasi-experiment is intended to augment the case
analysis. Its external validity, or ability to be
generalized beyond the tested Wroups, is not a critical
issue. The case analysis itself will be the controlling
factor on the external validity of the results.
Training Course Devel ome nt
From the information gathered in the literature review
and the case analysis, a training course was developed to
implement a Performance Management Framework in the
Engineering Branch of Air Force Civil Engineering at the
base level. This training course is a synthesis of the
information drawn from the case analysis with the
45

theoretical information collected from the literature
review. The method used to develop this training course
consisted of the following nine steps.
1. Identify overall goal and target audience.2. Identify subject areas that contribute to goal.3. Identify educational objectives within each
subject.4. Structure subjects into integrated program. Set
time allotment for each subject.5. Select educational tools/approach to communicate
educational objectives for each subject.6. Design techniques for communicating objectives.7. Prepare lesson plans for each technique.8. Create student handbook for use during training.9. Create leaders guide book.
Following the procedure outlined above, a Plan of
Instruction, Student's Handbook and Leader's Guide were
created for a three day training course. The course is
specifically tailored to the engineering environment,
considering the unique needs and opportunities observed in
the case analysis and the literature review. The course is
to be presented at the squadron location to the engineers,
supervisors, and other individuals involved in the
preparation of contract projects in the Engineering Branch.
This training course is further described in Chapter V.
Summary
A case analysis, supplemented by a quasi-experiment and
a literature review, were chosen to answer the investigative
questions. The case analysis provides an intensive
examination of a particular subject, and therefore adds to
the knowledge of the subject. The information gained from
46

the case analysis was compared to that gathered in the
literature review. Comprehensive statements of trends and
characteristics observed were then made, along with
appropriate hypotheses and recommendations for further
research. A training course and handbook to guide
implementation of performance management in other
engineering organizations were developed. The course is
unique in that it focuses on the particular needs of the Air
Force engineering environment. This training course and
handbook, along with the above mentioned conclusions,
recommendations, and hypotheses, are presented in Chapter V.
47

IV. Results and Discussion
Overview
A performance management team was formed in the
Engineering Branch to evaluate and improve the design review
process. The team worked through a problem solving routine
for the Corps of Engineers design review. This Poutine
actually improved the process. From watching this team in
action, the researcher observed principles of performance
management in an Engineering Branch environment. A rigorous
approach was used to record, sort, and analyze these
observations.
The Quality Questionnaire survey was administered to
the performance management team and a control group. The
change in attitude toward quality was compared between the
two groups. Recommendations will be made and conclusions
drawn from these results in Chapter V.
Case Analysis
Decr.6,ui, of Cie. The Chief of the Engineering
Branch of the 2750 Civil Engineering Squadron at Wright-
Patterson Air Force Base, Ohio was approached during August
1989. The possibility of implementing Total Quality
Management (TQM) in the branch was discussed. A team was
proposed to evaluate the performance of a work process in
the Engineering Branch.
48

The branch Chief was skeptical of the usefulness of TQM
in an engineering environment. Previous efforts to use TQM
in the Engineering Branch had been resisted for this reason,
though other branches in the squadron had used TQM Process
Action Teams (PATs) and Quality Circles. However, th,. Chief
agreed to support the formation of a team. The design
review process was suggested as a focus. The branch had
been having difficulty making consistent and thorough
comments on projects. The process was in need of an
overhaul. The Chief felt that this would be an ideal
opportunity to give TQM a try. A plan was made to begin the
effort after the start of the fiscal year, 01 October 1989.
The Engineering Branch Chief hand-picked a PAT to
include one member each from programming, design, design
support, and construction management. The supervisor of all
these members was included as well. Each member was chosen
Table 8. The Five Team Members
1. Programming Section Representative2. Design Section Representative3. Design Support Representative4. Construction Management Representative5. Engineering Branch Supervisor
only on the basis of their familiarity with the function of
their particular sections in the design review process.
None were perceived to have any predisposition toward
quality improvement over others in the same sections.
49

The researcher coordinated the preparation for the PAT
with a member of the Industrial Engineering Branch (DEI).
This individual had experience with PATs and Quality Circles
in other branches of the squadron. A plan was developed to
implement the PAT in the Engineering Branch. The researcher
would function as the facilitator for the team, leading the
team through the problem solving routine. The DEI member
would provide initial training and attend the meetings as an
observer and resource person as needed.
The initial team meeting was held 02 Nov 89. Training
was provided to introduce the problem solving routine the
team would follow. This routine is shown in Figure 20.
Write Flow Chartfor Process
Identify Problem Causes
Develop olutions
Implemnt andEvaluate Solutions
Figure 20. The Problem Solving Routine
The problem solving routine followed was based on the
scientific method. Some group problem solv~iig techniques
the team might find useful were introduced as well. These
included brainstorming, cause and effect analysis, and
50

pareto analysis. Details of how to use these tools were
withheld until the team might actually have need for them.
After the training, and throughout the following
meetings, the team followed the problem solving routine to
evaluate and improve the design review processes. Four
separate processes of design review were identified,
distinguished by the different design agents acting.
Table 9. The Design Review Processes
1. Corps of Engineers2. Operations and Maintenance
Architect/Engineer3. Operations and Maintenance
In-House4. Aeronautical Systems Division
The process flow charts for each of these four processes
were the first thing the team accomplished. These flow
charts are displayed in Appendix E.
Table 10. Corps of Engineers Review Process Steps
1. Designer Selected2. Submittal Arrives3. Distribute for Review4. Collect and Filter Comments5. Send to Headquarters6. Repeat from Step 2 until 90%7. End
51

The team selected the Corps of Engineers process as the
first one to study. They decided to follow the rest of the
steps in the problem solving routine, on this process before
beginning on the next process. This was accomplished in
one-hour weekly meetings, and was completed 01 Mar 90. A
summary of each of these meetings is included in Appendix D.
An integrated list of the problems identified, solutions
proposed, and actions recommended for implementation for
each step of the Corps of Engineers design review process is
given in Appendix F.
The team continued to meet after 01 Mar 90. The
Operations and Maintenance design review process was
selected for attention next. The researcher continued to
meet with the team as facilitator through 29 May 90. The
study of the second process was not completed by the team in
time to be included in this research. The team's intention
was to continue meeting until all four processes were
completed and improvements implemented and evaluated.
Results of Case. As a consequence of their evaluation
of the Corps of Engineers design review process, the team
recommended actions which were implemented to improve the
process. Measures were established to track the effect of
the implementations and determine if in fact improvements
were realized. In the short amount of time available after
the actions were taken, no significant data from these
measures were obtained to document the effectiveness of the
52

improvements. The actiohs taken as solutions to specific
problems can be reported, however, and statements made of
how they seemed to be working. These actions are listed in
Table 11.
Table 11. Solutions Resulting from Case
Provide Base Input to Selection CommitteeCreate a Plan Review RoomCombine and Update Review Distribution ListsDevelop a User Review ChecklistMake Sure CE Shops are Included in ReviewDevelop Procedure for Environmental Review
One problem identified was that the Architect/Engineer
design firms selected by the Corps of Engineers were
consistently giving a poor response to projects at Wright-
Patterson Air Force Base. This problem was traced to the
selection of the designer in the process. The cause was
determined to be that no base input was used by the Corps in
selecting designers. Consequently, the design firms were
often located in Louisville, KY, where the Corps office was.
Some firms whose performance was consistently bad seemed to
keep being selected, when the base would have ruled them out
of contention long ago. The solution proposed was to
provide feedback from the base about the firms in contention
for new projects, or better yet to get a base representative
to the committee meeting in which the designers were
selected. The team discovered that the Corps had an open
53

invitation for'an Air Force representative to sit on the
committee as a voting member, but no one had been attendingl
Problem
Poor designers selectedfor base projects
Solution
Provide base inputto selection committee
Action
Budget funds andsend member to
selection committee
Figure 2. Selection Committee Solution
The solution was for the Engineering Branch to budget funds
to send a representative to each selection committee
meeting. Better communication with the Corps waa
established, too, in order to be aware of when a meeting is
scheduled. The team is confident that this input to the
selection process will improve the calibre of designers
selected.
Another problem identified was that some of the
reviewing agencies on base were not returning comments in
time to forware to the Corps. This problem was traced to
the Distribute for Review step in the process. The cause
was determined to be that the limited number of copies of
54

the submittal available had to be passed around between the
various agencies. Those who received the package last did
not have enough time to perform a thorough review. The
solution was to create a plan room at the Engineering Branch
location. The action taken was to set aside an area where
plans could be laid out for review, and send a letter to
each agency for each submittal to come, review and comment.
The response was good. The agencies were sending
representatives to review the submittals in the time frame
allowed. More and better comments were being received,
because the Engineering Branch representatives were right
there to answer any questions the reviewers might have. The
branch was able to keep a record and keep better control of
who was reviewing projects as a result.
Problem
Comments beingreturned late
Solution
Create a
plan room
Action
Invite reviewers tobranch location
Figure 22. Plan Room Solution
55

Problem
Duplication in listsfor design review
Solution
Combine andupdate lists
Action
Single point ofcontact and list for
all design review
Figure 23. Review Distribution List Solution
Conflicting distribution lists for review was another
problem. The two sections responsible for different levels
of the design review had different lists of who should
review the project. Further, the Chief of Design and Chief
of the Engineering Branch were on neither list. This
problem fell under the Distribute for Review step of the
process. The cause was lack of coordination and not
updating the lists. The solution was to make one list for
everyone's use. The action taken was to make one person in
the Design section responsible for all design review. This
person would keep the master distribution list and update it
at least yearly. All letters to agencies inviting them to
review submittals, and their comments, would be handled by
this one person. The team is confident that the other
agencies will appreciate the single point of contact for the
56

branch, and the elimination of duplicate efforts of review.
Another problem found was poor comments often made by
the users. This problem was identified in the Distribute
for Review step of the process. The cause was that the
users often did not understand the construction drawings in
the submittals, and did not know what to look for. The
Problem
Poor commentsfrom using agencies
Solution
Develop a userreview checklist
Action
Assign member toresearch and prepare
user checklist
Figure 24. User Checklist Solution
solution proposed was the creation of a checklist to prompt
the users with items they should look for in their review.
The action taken was to assign a member of the team to find
out what kind of checklists city and state governments or
other Air Force organizations used, and adapt these as
needed to the requirements at Wright-Patterson. The team is
hopeful that given this guidance, users will be better
57

equipped to review the submittals intelligently and make
comments about the project scope and special requirements
that are needed to satisfy these users.
The next problem was identified in the Collect,
Compile, and Filter step of the process. Comments from the
Operations and Maintenance Branch (DEM) , responsible for
maintenance of completed construction, were often
incomplete. Its cause was a breakdown within DEM in getting
all the various disciplines of maintenance to review the
Problem
DEM commentsincomplete
Solution
Make sure shops areincluded in review
Action
Offer a review meetingwith all the shops
Figure 25. Shops' Design Review Solution
project. Just one shop, for example the plumbing shop,
would review the submittal, but comments from the
electrical, HVAC, and carpentry shops would be missing. The
solution was to make sure the projects were being
coordinated with all the shops. The action taken was to
58

suggest to DEM that a review meeting be held for each
submittal. A representative from each shop would gather at
one location with the project engineer and all comments
would be discussed. The team anticipates that this offer
will result in better communication with DEM and more
thorough comments.
A growing problem was found to be coordination with the
Environmental Management (EM) office. With the increasing
emphasis on environmental concerns, many of EM's functions
were new and unknown to the Engineering Branch. Their
comments were often vague and general in nature. This
problem was traced to the Collect, Compile, and Filter step
Problem
Lack of communicationwith EM organization
Solution
Develop workableprocedure for review
Action
Set up meeting withEM to discuss review
Figure 26. Environmental Management Review Solution
of the process. The solution was to open communication with
EM and gain an understanding of their organization and
59

purpose. The action implemented was setting up a session
between the EM Branch chiefs and the Engineering Branch
chiefs to get acquainted. Further action would be pursued
from there. The team felt that opening this communication
was critical, and would result in better cooperation between
the organizations.
These actions illustrate the kind of improvements the
team was able to develop during their study of the Corps of
Engineers design review process. None of these are
revolutionary or remarkably creative in and of themselves.
What is remarkable is that these were definite actions taken
to solve specific problems the branch experienced. In some
cases the problems had existed for years. It took the
formation of the performance management team and their
mandate to evaluate and improve the process to see these
problems corrected.
Observations from Case Analgsis. The goal of the case
observation was to add to the body of knowledge on the
subject of performance management in the engineering
environment. The results the team achieved were
commendable, but were not the goal of this research. The
experiences of the team, as it worked through the problem
solving routine, were recorded in order to reveal principles
of performance management.
Observation Procedure. The procedure followed to
withdraw principles from the case analysis was to record and
60

synthesize the observations. Appendix D contains records
summarizing each meeting the team held in studying the Corps
of Engineers design review process. In addition, each
record contains notes made by the researcher of observations
Table 12. Case Analysis Observation Synthesis Procedure
1. Attend and observe meeting2. Make notes of observations3. Assign notes to subjects4. Synthesize principles from subjects
pertaining to performance management. These notes are the
researcher's evaluations and Judgments of the experiences of
the team. After these notes, each entry lists several
subjects to which the researcher believed the contents of
the notes applied. This is how the observations were
grouped into principles of performance management. These
principles are discussed under the next heading.
Table 13. Case Observation Subjects
1. Training2. Implementation3. Process Technique4. Goal of Improvement5. Participation6. Culture Change7. Facilitator8. Management Commitment9. Management Direction10. Measurement
61

Discussion of Observations. The subjects
identified in the observations of the case are listed in
Table 11. These subjects each appeared in notes from one or
more of the meetings summarized in Appendix D. Each subject
is discussed briefly below in light of the observations made
of the performance management team.
Training needs to be appropriate to the experience
level of the people on the team. Adequate training is
important. Skimping on training at the start may result in
the team getting stuck later on. For example, if the team
is not adequately trained in the group technique of
brainstorming, one or two members may tend to dominate
discussion. This would tend to remove important
contributions from other members from the group's attention.
The problem solving routine followed (diagram process
flow, identify problems, propose solutions, recommend
actions for implementation, establish measures of success)
proved to be easy to use. It provided the framework needed
to direct the team's attention in evaluating the process.
The biggest shortcoming in its use was an inadequate amount
of time spent identifying problems. The team needs to be
challenged to think more deeply and trace the surface
problems they recall to the underlying causes. In addition,
the process might be easier to follow if the goal or
objective of the team is decided upon at the outset as
something more specific than Just *improve this process.'
62

Table 14. Implementation Principles
1. Follow problem solving routine2. Establish goal at outset3. Dig for root cause of problems4. Invite other affected organizations5. Implement a simple action early
Another area that needs emphasis is inviting the other
organizations affected by the process interfaces to attend
and participate in a meeting. This increases the awareness,
understanding, and communication needed to institute
effective improvements. Taking immediate action to
implement one or some of the simpler improvements is
recommended. This permits the team to see the fruit of
their labors.
The process technique was Instrumental in permitting an
understanding of the work the team was studying. Getting
the steps of the process mapped out right off the bat
contributed to the team's ability to move right through the
problem and solution phases. The process steps can be
modified later as they are better understood. It is
important that the team not set the boundaries of their
process too narrowly. The process can be better understood
by reaching across the interfaces into the supplier and user
steps of the process. 'How does it get to us?' and *Where
does it go from here?' are two good questions to ask.
The unique characteristics of the engineering
environment affect performance management. Engineers are
63

trained problem solvers. They may not need training as
detailed as some other functions. Engineers as
professionals are typically proud of the quality of their
work. Suggestions that their work lacks quality or needs
more quality will likely be met with resistance.
Engineers Work * Quality
Engineers are Committedto Work for Quality
Figure 27. Engineers and Quality
The goal of improvement may be set by management or
determined by the team. In either case, the goal needs to
be clearly stated at the outset of the team's effort. The
goal must be definite and verifiable. For example, rather
than say 'Improve the design review process" say 'Reduce all
change orders by 50%.'
Participation is a fundamental concept in team problem
solving. Protocol must be followed to assure that all
members are given a chance to contribute. In addition,
tangents of interest to part of the team but of no interest
to others must be controlled, or some members will lose
interest. Progress toward the goal must also be maintained,
again discouraging tangents. The reigns must not be held
64

too tightly, though. When the team is animated and
discussion is active, provide some leeway to see if the
discussion will turn into something fruitful and directed to
the task before curtailing the interaction to get back on
track.
A change in culture is making the adjustment in attitude
needed to view the organization's work in terms of its
processes and seek to improve those work processes. This
culture change can be accomplished *on the Job" by getting
the team involved in the process oriented problem solving
routine. Their perspectives will change as their enthusiasm
increases for improving their work. Encourage the team to
share with their co-workers what they are doing on the team.
Have them invite guests to meetings. Spread the news.
Use of a facilitator to aid the team in following the
problem solving routine and keeping on track is encouraged.
The facilitator must be careful not to dominate the
meetings. In fact, this person might even be almost
invisible when the team is working well together. But when
the team has a problem and needs help or gets sidetracked,
the facilitator can bring an objective voice to bear and
assist the team. This person must be ready to refresh the
team's memory of where they were and what they were doing
after any recess in their regular meetings. He/she must
also assure that the materials and room needed for the
meetings are in order. The person facilitating the meetings
65

needs to receive training in group dynamics and problem
solving techniques prior to stepping into the role. This
small investment will be well repaid in improved meetings
(Todd, 1990). The facilitator must be ready to be strong
and step in as peacemaker when the team starts battling over
opposing views.
Table 15. Facilitator Duties and Needs
1. Be invisible (exceptwhen needed)
2. Be ready to help3. Prepare for team meetings4. Receive training in team
dynamics and problem solvingS. Keep the peace
Management must be committed to the efforts of the
performance management team. However, management must not
crowd the team. Their interest in how things are
progressing needs to be satisfied by reports from the team
leader or facilitator. The temptation to crash in on a
meeting must be avoided, for their presence will curtail
team participation. The first line supervisor of the
members of the team is an exception. This person may be
very beneficial to the team. Implementation actions and
delegation are more easily accomplished when such a person
is a team member. Management needs to make arrangements for
whatever resources the team requires, and to invite
66

representatives from other organizations interfacing with
the team's process to attend meetings if needed.
Management has two important selection roles to periopm
for the performance management effort. The process for the
team to focus on must be chosen. Care must be taken not to
overload the team on their first attempt. Pick a simple
process as a team's pilot project. Let them cut their teeth
on it. More detailed processes can follow. The members of
the team must be carefully selected. They must know their
jobs well and be able to bring that knowledge to the group.
InvolvedManagement
Select Process Select Processfor Improvement Action Team
Figure 28. Management Selection of Process and Team
A first line supervisor can be a useful member, bringing
lots of related information. The members do not all have to
be peers. Further management direction is needed if there
is some environmental or organizational change which affects
or alters the process the team is working on. The team must
be kept up to date on any new information which may affect
their effort.
67

Measurement of success of the actions implemented is a
step that must not be overlooked. It is this measurement
which will provide the clearest indication ot the value of
the improvements made. Management will be interested
ultimately in seeing a report of each problem identified,
solution proposed, action taken, and measured results -f
that action. The achievements of the team need to be
organized in this manner.
Table 16. Contents of Record of Achievements
1. The problem identified2. The cause of the problem3 The solution proposed4. The action taken5. The measured results
Results. All fivu of the members of the treatment
group returned both the pretest and the post-test survey.
Only four of the five members of the control group returned
both. This affects the experiment by reducing the already
small sample size, which will increase the magnitude of
difference which will be found significant. In addition,
some members of the control group left responses blank.
This has the same effect for individual questions. The data
collected from these surveys is presented in Appendix G.
The Quality Questionnaire survey is divided into aix major
categories, with questions in each to measure attitudes
68

specific to that category. The responses shown in
Appendices H through M are divided into these six
categories, which are listed in Table 17.
Table 17. Quality Questionnaire Categories
I. LeadershipII. Strategic Quality PlanningIII. Human Resource ManagementIV. Quality Assurance of
Products and ServicesV. Quality ResultsVI. Customer Satisfaction
The stat'stical tests of the data are contained in
Appendix M. The assumptions, hypotheses tested, and
procedure used for testing are recorded. Four separate
tests were performed. These are listed in Table 18 The
Table 18. Statistical Tests Performed
1. Comparison of Groups' PreTest Results2. Comparison of Groups PreTest Variance3. Comparison of Groups' Change Results4. Comparison of Groups' Change Variance
first test was for the equivalence of the control and
treatment groups at the time of the pretest. This
equivalence is a condition of deolaring the obstacle of
regression controlled in the experiment. The results of
this test are contained in Appendix I. For each question,
69

the average response of the treatment group was compared to
the average response of the control group. For all but one
question, the two samples were found to be the same, at the
precision level alpha of 0.05. The treatment and control
group were then declared equal for the purposes of this
experiment, and the obstacle of regression controlled.
Figure 29 illustrates the comparison of average responses in
each major category between the control and treatment
groups.
The second test was for the equivalence of variance
between the control and treatment groups at the time of the
pretest. This equivalence is a condition of the first
test, allowing the parametric statistical test to be used.
The results of this test are contained in Appendix J. For
each question, the variance of the responses of the
treatment group was compared to the variance of the
responses of the control group. For all but four questions,
the two samples were found to be the same, at the precision
level alpha of 0.05. The treatment and control group were
then declared to have equal variance for the purposes of
this experiment, supporting the assumption of the first test.
The third test was for the degree of change between the
control and treatment groups from the pretest to the post-
test. Measuring this degree of change was the objective of
the experiment. The results of this test are contained in
Appendix K. For each question, the average change in
70

Por Each Survey Categoryl
6-
Treamtent Group5-
Control Group
12
L ILI IV. V.VL Overall
Figure 29. Group Pre-Test Comparison
71

response of the treatment group was compared to the average
change in response of the control group. For all but two
questions, the two samples were found to be the same, at the
precision level alpha of 0.05. The treatment and control
group were then declared equal for the purposes of this
experiment. No difference in change in attitude toward the
six quality categories was found over the course of this
case analysis and experiment. Figure 30 illustrates the
comparison of average change in responses in each major
category between the control and treatment groups.
The forth test was for the equivalence of variance
between the control and treatment groups' change in
responses associated with the third test. This equivalence
is a condition of the third test, allowing the parametric
statistical test to be used. The results of this test are
contained in Appendix L. For each question, the variance of
the responses of the treatment group was compared to the
variance of the responses of the control group. For all but
eleven questions, the two samples were found to be the same,
at the precision level alpha of 0.05. The treatment and
control groups could not be declared to have equal variance
based on this test. However, the matter was not pursued to
the extent of performing non-parametric tests.
Discussion. No difference was found in change of
attitude toward quality between the treatment and control
groups. The treatment group was exposed to initial training
72

Por Each Survey Catry
1.2
1 - Treatment Group
0.8-Control Group0.6-
0.4
0.2
0-
S-0.2-
U -0.4
-0.6
-0.8
L IL M IV. V. VL Overall
Figure 30. Survey Results
73

in process improvement techniques. They participated in
seven months of meetings using these techniques to improve
the dosign revisw process. The ccntrol group was not
exposed to any unordinary training or techniques. And yet
when given the post-test, the control group showed a change
in attitude toward the quality categories little different
than the treatment group. Several reasons are possible for
this lack of difference.
Table 19. Possible Reasons for Lack of Difference
1. Time between pretest and post-test2. Inadequate culture change training3. Participation does not change attitude
The period of time between the pretest and post-test
may not have been long enough to observe significant
attitude changes In the treatment group. Performance
management has been described earlier as needing a long term
commitment. Short term results are not to be expected. The
seven months between the pretest and the post-test may have
been insufficient for the culture change that accompanies
process improvement efforts to be seen. Culture change is
defined as a transformation of viewpoint from *business as
usual* to 'continuous improvements.* If more time had been
available between the two tests, perhaps a significant
difference between the two groups would have been observed.
74

This possibility could be tested for by administering
another post-test at some later date.
Another possible reason is that the initial training
provided to the treatment group did not include adequate
emphasis on culture change. The training provided was
completed in twenty minutes at the first team meeting. An
introduction to process flow-charting and brainstorming
techniques was all that was included. Perhaps more of an
emphasis needed to be made on change of attitude to one that
is most conducive to performance management. Without this
emphasis, the treatment group may not have had sufficient
exposure to the broad spectrum of quality issues to result
in changed attitudes. This could be tested for by testing a
similar implementation of performance management in another
organization where initial training includes culture change
training.
An additional potential reason for the lack of
difference in attitude change is that the performance
management framework followed does not need or produce
attitude change. Engineers by profession are trained in
problem solving. The subjects of this case analysis and
experiment have, as engineers, been taught to seek quality
and better ways to solve problems. It may be that the need
for a cultural change prior to successful performance
management in an engineering environment is not critical.
However, a generalization of this nature cannot be made on
75

the basis of the results of this experiment alone.
Significant additional testing of other engineering
applications of performance management would be required.
Summary
A performance management team was used to evaluate
and improve the Corps of Engineers design review process.
Improvements that resulted from this team effort are
summarized in Table 20. The observations of the experiences
of the team were catalogued and assigned to subjects.
Principles were then synthesized from these observations.
Table 20. Results of Performance Management Team
1. Representation on Selection Committee2. Creation of Plan Room for Review3. Consolidate the Branch Design Review
Point of Contact4. Prepare User Review Checklist5. Suggest Review Meeting with DEM Shops6. Open Communications with Environmental
Management
These principles were compared to the information gathered
in the review of literature. From this comparison,
recommendations will be made in the next chapter.
76

V. Conclusions and Recommendaations
Overview
This chapter presents recommendations drawn from the
research reported in Chapters II and IV. These
recommendations include suggestions for more effective
implementation of performance management. In addition,
hypotheses to be tested in future research are proposed.
Finally, the conclusion of this research is stated and
supported.
Recommendations
Name of Imr2ovement Effort. Much of the activity in
the area of performance evaluation and improvement has gone
under the name of Total Quality Management (TQM) . The
Department of Defense used this name in directing the
Services to adopt a framework for the management of
performance (Department, 1989b). The name used in this
thesis has been 'Performance Management Framework.' While a
name does not a program make, it is important to note the
reaction of personnel in Air Force Civil Engineering to the
name TQM. Statistical process control and X-bar charts
often come to the minds of people familiar with TQM when
they hear the name. These statistical tools are important to
TQM in the manufacturing environment. The usefulness of
these tools in the design environment has not been as well
established. To give the performance management effort a
77

chance to get off the ground, a name without negative
preconceptions to engineers needs to be selected.
The Air Force Civil Engineering and Services community
has decided to use the name "Engineering and Services
Quality Management Program" (Ahearn, 1990). This identifies
the effort with the engineering community. It also
distinguishes the effort from stock TQM. Maintaining this
distinction is recommended.
ENGINEERING AND SERVICES
QUALITY MANAGEMENT PROGRAM
Figure 31. A Name for the Engineering Improvement Effort
Use of Trainine Course. The Performance Management
Framework Training Course developed in this research and
presented in Appendices A, B, and C is uniquely suited for
use in the base level Engineering Branch environment. While
dozens of guides for TQM exist, and even several aimed at
service organizations, none are tailored to Air Force Civil
Engineering as this one is.
This training course is designed to assist Engineering
Branch managers, engineers, and others who contribute to the
preparation and execution of projects for real property
construction, maintenance, and repair. These individuals
78

are challenged with providing and maintaining quality
facilities for Air Force organizations to perform their
missions. Evaluation, management and improvement of the
performance of Engineering Branch personnel is central to
continuing to fulfill this mandaLe.
Table 21. Performance Management Framework Objectives
Foster a management perspective conducive toperformance improvement
Create an organizational environment promotingperformance improvement
Continually encourage the quest to discover andimplement ways to improve performance
The objectives for use of a framework for performance
management are listed in Table 21. The objectives of the
training course which presents such a framework are listed
in Table 22.
Table 22. Training Course Objectives
To equip civil engineering personnel to manage the
Performance Management Framework
To create momentum for performance improvement
To promote within civil engineering personnel aperspective for improvement
To provide the essential tools and techniques toestablish and maintain a Performance ManagementFramework
79

The goal of this training and the handbook which
accompanies it is to acquaint Engineering Branch members
with a framework for managing performance and to provide the
tools needed to use this framework. It was designed to be
taught by a member of the Engineering Branch. This person
does not need an extensive background in performance
management nor experience in teaching. A few hours time in
advance to become familiar with the contents of the course
are all that are required. However, a course leader with
background or experience in either of these would likely be
more effective than a novice.
The training course is designed to be three days in
length, eight hours each day with an hour for lunch. The
material is presented through a mixture of group interaction
and exercises that encourage experiencing the principles as
they are discovered. The course is to be hosted at the
squadron location, to allow the Engineering Branch members
to learn in their own environment, and to minimize
disruption to their routine.
This course was developed based on experiences and
lessons learned in the implementation and use of a framework
for perfo-m~nce management in an actual Engineering Branch
environment. Air Force engineering organizations may use
this course in conjuction with other training available from
the Air Force Civil Engineering and Services Center to begin
a squadron-wide performance management effort. Contact Ray
80

Hatch, AFESC/DEMG, Tyndall AFB, Florida, AV 523-6401 for
further information on other training materials.
The course presented in this research is available at
little cost to the interested organization. No teams of
consultants are needed. The course may be taught with
materials and personnel already present in the Engineering
Branch. It provides the tools, place to get started and
attitude for improvement that are needed to begin improving
the way work is accomplished in the Engineering Branch at
base level.
Several characteristics distinguish the training
provided by this course from other training available.
These are the reasons this training course might be chosen
over other alternative ways to implement a performance
management framework in civil engineering. First, this
course recognizes the unique nature of the engineering
environment. The fact that the engineer's product is ideas
and designs is accounted for. Second, the crucial
importance of management commitment and direction is
emphasized. Management involvement from the outset is
critical to assuring that lasting improvements are made
(Edosomwan, 1987:67-8). Third, the course stresses creative
ways of measuring the output of engineering which is often
difficult to quantify. For performance management to be
effective, a system of measurement is essential for
monitoring the work processes before and during the
81

improvement efforts (Dingus and Hrivnak, 1988:30). Fourth,
the target of improvement is defined as more than just the
quality issues which are stressed in other training. The
broader goal of performance, including quality but also
productivity, effectiveness and efficiency needs to be the
target in civil engineering (Armentrout, 1986:142-144).
Fifth, the course develops the issue of training, to provide
individuals the tools and attitude needed to participate with
others in improving their work. Training is an element of
performance management which cannot be neglected, for both
the team members and the leaders and facilitators (Todd,
1990). Finally, the innovative process viewpoint on work
allows the activities of the workplace to be understood, and
consequently improvement proposed that get to the root of
the problem (Kacker, 1988:41).
Table 23. Advantages of This Training Course
1. Recognizes the unique nature of civil engineering2. Emphasizes management support and direction3. Stresses ways to measure engineering performance4. Defines broad goal of improvement beyond quality5. Develops training objectives for tools and attitude6. Presents process viewpoint of work activities
Performance Improvement Teams. A fundamental concept
of performance management is participation. This means
getting the workers involved in evaluating and improving
their Jobs. These people are the ones most familiar with
82

their work and the problems they face, and so are often more
aware of what improvements are possible than management is.
Using a team approach also encourages more creative
solutions to problems, as the group can bounce thoughts
around to come up with new ideas (Todd, 1990).
A team can formed all from the same functional area, or
represent a functional cross-section, as appropriate for the
work process being addressed. From five to eight members
are ideal. These members might be volunteers or hand-picked
by management to bring the needed experience and knowledge
to the team. The team will meet together over a period of
time, usually once a week, to collectively study and propose
solutions to a work process or problem the organization has
identified. When their recommendations are complete, their
proposals are presented to management. Management must then
demonstrate their support and commitment to the effort by
implementing actions recommended by the team, and
recognizing the team's efforts through awards and publicity.
The team is then disbanded, their Job complete, or assigned
a new process or problem (Todd, 1990).
S2te of Pilot Protel. The basic pattern for
performance management is to establish a performance
improvement team to propose and implement improvements in a
work process. A temptation will be to start on the most
problem-plagued, complex work process the organization has.
This can lead to discouragement of the team and failure of
83

the improvement effort. The newly formed performance
improvement team should be allowed to focus on a less
complicated but still important process to begin with. This
is often called a pilot project. With this experience under
their belt, the team, or even another team, is better able
to proceed on to more difficult challenges.
Hyotheses for Further Research. This research effort
was qualitative in nature. As such, it sought to increase
the body of knowledge in existence on the subject of
performance management in civil engineering. A stated goal
of this research was to develop hypotheses for further
research. The nature of this subject was not well enough
understood to propose any reasonable hypotheses to be tested
in this research. Having developed the subject through this
research, several hypotheses can now be proposed.
Hypothesis: Using the training course presented
herein will result in saving more resources than are
expended in the first year. This would be tested by
selecting a sample population of base level Engineering
Branches and using the course. The manpower and material
resources needed for training and implementation would be
recorded. The resources saved due to improved performance
would be determined by the measurement systems created as a
result of the performance management framework itself. The
resources expended would be compared to those saved to test
whether the hypothesis is supported.
84

Performance Management Framework
First Year
Figure 32. Training Course Hypothesis
Hypothesis: The name Total Quality Management carries
an unfavorable impression to engineering managers. Related
hypothesis: The extent of the unfavorable impression
created by the name TQM is inversely proportional to the
individual's degree of knowledge of TQM. These could be
tested using a survey instrument. The survey might ask for
responses to statements of the usefulness of various
principles of performance management. Some of the
statements would include the name TQM while others would
not. The difference in response between those with the name
and those without could be measured. The survey could also
include some questions to determine the individuals
knowledge and exposure to TQM. These results could be
correlated with any difference in response to the previous
statements.
Hypothesis: The degree of perceived management support
among the performance management team members will correlate
to the team's effectiveness. This could be tested by using
85

a short survey instrument to measure the team members
impression of how well management supported their efforts.
The resources saved resulting from the team's improvement
recommendations could then be determined using the measures
proposed by the team in the performance management
framework. A correlational statistical study could be
oerformed to determine if in fact the hypothesis is
supported. Regression could be used to develop the
relationship between management support and effectiveness,
as illustrated in Figure 33.
S/
Saved
Degree of Management Support
Figure 33. Management Support Hypothesis
Hypothesis: Engineers have a higher initial
appreciation and understanding of quality, and commitment to
quality work, than other career fields. This results in
less cultural change training being required with engineers
than with others. One goal of cultural change training is
86

to alter individuals attitudes toward quality and convince
them of the importance of quality improvements. This could
be tested by comparing the effectiveness of performance
management in an engineering environment with its
effectiveness in other settings. Various degrees of
cultural change training could be provided in each case.
Measures would need to be established for quantifying the
effectiveness of performance management.
Hypothesis: Change in attitude toward quality will
accompany successful implementation of performance
management in an organization. This change in attitude will
become more pronounced as time progresses from the date of
the implementation. This could be tested by continuing to
administer the Quality Questionnaire (Hayman and Schneider,
1989) to a treat aent and control group at regular intervals
after implementation in the treatment group. Regression
analysis could be used to measure the trend, if any, in
attitude change for each group and compare the trends.
Answers to Investigative Questions
In the training course developed and the
recommendations listed above, the investigative questions
have been answered. Following is a brief summary.
How has TQM been utilized in other similar
oranizations? What benefits have been achieved? What
changes need to be made to adapt TM to the Contract
Engineering Branch? TQM has been used extensively in the
87

manufacturing environment, especially in Japan. Attention
is now being paid to using the same principles in the service
or government environment. The TQM tools and attitude need
to be adapted to civil engineering by accounting for the
unique nature of civil engineering, emphasizing management
support and direction, and stressing ways to measure
engineering performance. The broad goal of improvement
needs to be defined as performance, which encompasses more
than just quality. Training objectives for the tools and
attitude required must be developed, and the process
viewpoint of work activities presented.
What o2 2 ortunities and needs exist within the
Engineering Branch for improvement? The work activities of
an Engineering Branch can be assigned to the processes to
which they contribute. Any of these processes can be
evaluated and improved using performance management. The
design review process is Just one example analyzed in this
case. Some potential processes for improvement using a
performance improvement framework are listed in Table 24.
Table 24. Engineering Branch Processes
Design ReviewContract ManagementProject ProgrammingChange Order ManagementAccomplishment of
In-house Design
88

What training of 2ersonnel is used 2rior to or
during !M!t me ntation of TqML Training must include
emphasis on both tools and attitude. Cultural change
training seeks to alter the viewpoint of the employees and
prepare them to seek improvements. Training in specific
group problem solving tools is needed to allow the group to
participate as a team in evaluating and improving their work
processes. This training needs to be targeted at the people
most likely to use it, and not just given to all
indiscriminately.
What obstacles are encountered during the initial
implementation of TQM? An obstacle encountered in the
engineering environment are the project rather than product
orientation of engineering. Another is the frequently
changing requirements that users place on the Engineering
Branch. A third is the difficulty in measuring the output
of an engineering organization. Inadequate management
commitment and people's prejudices against change are other
potential obstacles.
What short range benefits can be measured after
i plementation of TQM? Short range benefits include gaining
a better understanding of the work activities in
organizations. Some obvious improvements can be made
immediately upon discovering them in the evaluation process
as well. These benefits can be measured in decreased time
spent in wasted energy.
89

What outside resources (i.e. prlvate contractors or
procured traininj) are needed to facilitate the rformance
_a naement effort? No outside resources are required for
training or facilitation. The training course developed in
this effort can be used at little cost and with none other
than the personnel available to the squadron.How do attitudes toward gual tY of work chang among
eRo1n2Yot involved in per for mance management? In the short
term, six months, no change in attitude was measured in the
case analyzed in this work. Over a longer time interval
such changes might become apparent.
How is a 2erformance management framework used to guide
irnRovement eiforts in the particular situation of an
gngjn2e2ing Branch? Performance management can be used
quite effectively in an Engineering Branch. First, top
management must be committed to support and direct the
effort. They must provide training to the people who will
be involved. Management must further pick a work process to
be evaluated and improved and choose a team to look at it.
This team must follow a structured procedure for problem
solving. They must understand the work process involved,
and the steps it contains. The team then identifies
problems which plague this process, and proposes solutions
to theze problems. Finally, the team recommends actions for
implementation to management. The cycle is then completed
when management approves improvement changes be made. The
90

participants in the effort are rewarded, and the
organization is ready to begin again with a new team and
process. As performance management becomes more familiar,
several of these cycles might be going on simultaneously.
Management Initiates andDirects Improvement Effort
Participative EmployeePerformance Improvement Team
Evaluates Work Process
Actions for Improvementsare Recommended to Management
4Management Approves Changes
and Rewards Participants
Figure o-*. Performance Management Framework
What guidance do Enfine ering B ranch managersa need to
deaS11 and irn21ement a perfo rmance management framework in
their or ganizations? Managers need specific guidance in how
to implement performance management. This guidance includes
who and how to train, the importance of management support
and direction, and a way to get an improvement effort
started. The guidance for an Engineering Branch manager
needs to consider the particular characteristics of the Air
Force engineering environment. If guidance is used that was
91

designed for operational organizations on the Air Force
base, the effort may not be successful. The training course
presented here is tailored specifically to the engineering
environment, provided the guidance the Engineering Branch
manager needs.
Table 25. Guidance Needed by Engineering Branch Managers
1. Who and how to train2. Importance of management
direction and support3. Starting point for the
improvement effort
Conclusion
Performance management is a powerful concept which
promises substantial increases in the quality and
effectiveness of an organization's work, together with
decreases in costs. These gains are accomplished by using
employee work teams to evaluate work processes and eliminate
waste and errors. The concept has proven successful in a
number of work situations, both manufacturing and service,
public and private.
The Engineering Branch in a base level Civil
Engineering Squadron can benefit from performance
management. The work processes which make up the activity
of the Engineering Branch are suited for analysis using the
process improvement techniques. The engineers themselves
are already trained problem solvers. They Just need to have
92

their talents directed toward improving the way they work.
This direction is provided by the performance management
framework.
A need for a framework for performance management for
the base level Engineering Branch motivated this research.
The opportunities and desire existed to improve the
organization's work processes. Lacking were the attitude,
tools, and starting point needed to create a successful
improvement effort. This research followed and documented
the use of performance management in an Engineering Branch
environment.
A performance management team was implemented at the
Engineering Branch of the 2750 CES at Wright-Patterson Air
Force Base. The team focused on the process of reviewing
projects designed by Architect-Engineers and the Corps of
Engineers. As a result of this team effort, improvements to
the process were made. More timely and better comments were
being provided to the designers after the improvement
actions.
From the experiences gained in the analysis of this
case, a three day training course was developed. This
course was created to provide the tools and attitude needed
to begin performance management efforts in other Engineering
Branches. The course was designed to provide a starting
point, and is a guide to the performance management effort.
93

A22endix A. Plan of Instruction
This appendix contains the Plan of Instruction for a
three day training course in performance management. The
Student's Handbook and Leader's Guide for the course are
given in Appendix B and Appendix C respectively.
The objectives, schedule and scope are presented here.
A generai lesson plan is given for each of the eighteen
lessons. Each lesson plan includes objectives and an
outline of the subjects discussed in that lesson.
94

PLAN OF INSTRUCTION
Course Title: Civil Engineering Performance ManagementFramework Training
Objectiv-: To motivate and equip supervisors and projectmanagement and support personnel in theEngineering Branch of Air Force CivilEngineering Squadrons to implement thePerformance Management Framework.
Audience: This course is designed to be presented tothe Chief of Engineering, Chief of Design,Chief of Construction management, Chief ofProgramming, Chief of Drafting, andengineers, secretaries, technicians and othermembers of the Engineering Branch as desired.Group size of seven to fifteen members isrecommended.
Scope: The course is designed to last three days,with seven hours of training each day. Eachhour should include a five to ten minutebreak. The leader's guide provides enoughinformation for a member of the EngineeringBranch to conduct the training with nominalpreparation. No formal leader training isrequired.
Materials: One leader's guide and sufficient student'sguides for all the members of the traininggroup are required. Additionally, anoverhead projector and clean transparencyfilm, or a flip chart with clean pad ofpaper, along with colored pens are needed.Additional material requirements are noted inspecific lessons.
95

Contents: Lesson Description Time
---------Day 1
01 Introduction/Distinctives 1 hour02 Benefits Available 1 hour03 Management Commitment 1 hour04 Management Support 1 hour
Lunch I hour
05 Team Participation 1 hour06 Participation Exercise 2 hours
Day 2
07 Training Objectives 1 hour08 Training Techniques 1 hour09 Process Improvement 1 hour10 Process Flow Exercise 1 hour
Lunch 1 hour
11 Process Flow-charting 1 hour12 Performance Definition 1 hour13 Performance Components 1 hour
Day 3
14 Implementation Details 1 hour15 Implementation Exercise 3 hours
Lunch 1 hour
16 Measurement Exercise 1 hour17 Cause and Effect Discussion 1 hour18 Objectives Matrix 1 hour
96

Lesson 01 Introduction/Engineering Environment
Distinctives
Time: 1 hour
Objectives: Distinguish the Performance ManagementFramework from other management fads andgimmicks which have come and gone.
Communicate that this program is one whichcivil engineering personnel design themselvesto fit their own particular situations.
Technique: Group brainstorming - Have group generate anddiscuss features of other management schemesand what problems plagued them. Continue bydescribing how the Performance ManagementFramework can overcome these problems.
Lesson Plan: Introduction 5 min
Ice Breaker/ Stage Setter- Management Techniques 10-15 min
Components of aSuccessful Management System 5-10 min
Roadblocks toSuccessful Management Systems 5 min
Course Overview
Framework Objectives 2 min
Course Objectives 2 min
Engineering EnvironmentDistinctives 5 min
Role of ManagementEmployee ParticipationTrainingTarget of Improvement 5 min
Process FrameworkFramework ImplementationMeasurement 5 min
Review Framework Objectives 1 min
97

Lesson 02 Potential Benefits from Performance
Improvement
Time: 1 hour
Objectives: Detail what benefits can be gained.
Demonstrate why improvement action is needed.
Understand benefits experienced in anotherworkplace environment. Discuss differencesin the civil engineering environment that mayrequire adaptation or changes of approachfrom that used successfully in othersituations.
Technique: Small team case analysis - Criticalevaluation and discussion of cases by smallteams with presentation of conclusions tocomplete group.
Lesson Plan: Introduction 2 min
Case Evaluations (3 cases) 23 min
Reports (5-8 min each) 20 min
Application (Time permitting) 5 min- Needs for improvement in
this organization
98

Lesson" 03 Importance of Commitment by Top Management
Time: 1 hour
Objectives: Demonstrate that management commitment iscrucial.
Identify ways that management commitment canbe increased.
Technique: Paired individuals case analysis - Studycases and determine the nature and extent ofmanagement commitment. Suggest how and whytop management could be convinced to supportthe Performance Management Framework morefully.
Lesson Plan: Introduction 5 min
Case Evaluations (5 cases) 20 min
Reports (3-5 min each) 20 min
Application 5 min- Commitment of top management
for this organization
99

Lesson 04 Management Support and Cultural Change
Time: 1 hour
Objectives: Identify the support roles of management inimplementing and maintaining a PerformanceManagement Framework.
Define the concept of *Cultural Change' andcommunicate the essential role of topmanagement in creating the change in culturefrom the top down.
Technique: Structured group discussion - Lead the groupthrough an outlined format presenting theimportant features of management support andcultural change, allowing the group tocontribute insights and ideas.
Lesson Plan: Review and Introduction 3 min
Management Support Roles
Provide Example 5 min
Provide Resources 3 min
Coordinate Organization-WideEfforts 5 min
Reward Results 2 min
Cultural Change
Your Organization's Culture- Man from MarsPerspective 20 min
Change 3 min
Formal Channels 3 min
Informal Channels 4 min
Conclusion and Summary 2 min
100

Lesson 05 Teamwork and Participation Concepts
Time: 1 hour
Objectives: Establish the ability of a team to do morethan the individual can in the subjectivearea of performance improvement planning.
Identify the types of groups: work areateams or multi-functional cross disciplinaryteams. Discuss the effect of group size ongroup dynamics.
Present common problems plaguing groups.Teach team members to expect them, identifythem, and correct them.
Technique: Group brainstorming - Allow the group togenerate and discuss ideas about groupeffectiveness and difficulties. Provideguidance as needed to direct group incovering the principal concepts listed.
Lesson Plan: Introduction 3 min
Group Decision Making
Compared to Individual 12 min
Group Structure
Composition 8 min
Size 7 min
Group Roles 12 min
Conflict 8 min
101

Lesson 06 Team Participation Exercise
Time: 2 hours
Objectives: Allow the group members to work as a team tosolve an assigned task. Give the individualsan opportunity to observe group interactiontechniques and problems.
Discuss the dynamics of the group exercise.Identify specific roles that people adopt ina group environment to facilitateperformance.
Technique: Group exercise - Lead the group through theFarmer Exercise. Discuss the results.Prompt the discussion by asking aboutspecific roles team members were observed toadopt.
Lesson Plan: Farmer Exercise 50 min
Break 10 min
Evaluation
Review Objectives 2 min
Importance of Individual'sContribution 5 min
Understanding and IdentifyingRoles 28 min
Facilitators
Introduction 5 min
Response to Roles 10 min
102

Lesson 07 Training Objectives and Pitfalls
Time: 1 hour
Objectives: Establish the broad training goal of creatingthe cultural change needed for a successfulprogram. Define the more specific traininggoals of imparting tools for use in thePerformance Management Framework.
Introduce some of the most common problemsand errors encountered in training programs.
Technique: Group brainstorming - Encourage the group tosuggest objectives and problems of training.Provide guidance as needed to direct thesession through the important conceptslisted.
Lesson Plan: Introduction 10 min
Cultural Change Training 15 min
Specific Tools Training 10 min
Problems 15 min
103

Lesson 08 Training Techniques and Strategies
Time: 1 hour
Objectives: Identify which individuals in the EngineeringBranch should receive training. Suggest whatfactors are pertinent to choosing thesepeople.
Determine the most opportune time to providevarious degrees of training. List importantcriteria in selecting this correct time indifferent situations.
List the essential ingredients to be includedin the training curriculum. What situationalfactors might require revising theseingredients?
Technique: Small team presentations - Provide each ofthree teams with a list of questions andobjectives. The team will generaterecommendations and present them to thegroup.
Lesson Plan: Introduction 3 min
Team Project 32 min
Presentations 15 min
104

Lesson 09 Process Improvement
Time: 1 hour
Objectives: Present the concepts associated with viewingorganizational activity from a processperspective.
Understand the five principal features ofprocess improvement plans.
Define cross-functional processes. Establishhow to determine input and output which flowsbetween these producers and consumers.
Discuss ownership of processes. Show theimportance of assigning responsibility for aprocess to a single individual.
Communicate the necessity of extending theprocess to its origin and conclusion. Thegreatest improvements for the least expensecan often be made by thorough planning at thestart of the process.
Technique: Structured group discussion - Follow theformat provided, encouraging the group toexpand upon and define terms and conceptsessential to understanding the processperspective.
Lesson Plan: Introduction 3 min
Process Perspective 7 min
Process Improvement Plans 15 min
Cross-functional Processes 10 min
Process Ownership 5 min
Process Extension 10 min
105

Lesson 10 Process Flow Exercise
Time: 1 hour
Objectives: To allow the group to identify a process in amulti-functional environment. The processinterfaces will be determined, along with theinput and output passed between thesefunctions.
Technique: Group brainstorming - Suggest a situation themembers of the group will be familiar with,perhaps getting up in the morning, gettingready and getting to work. Have the groupflow the process. Ask the group to extendthe process to its extreme beginning andconclusion. Discuss how actions taken at thebeginning can dramatically affect theoutcome.
Lesson Plan: Introduction 3 min
Process Excercise
Introduction 2 min
Process Flow Diagraming 15 min
Cross-functional aspects
Function Identification 6 min
Input Identification 6 min
Output Identification 6 min
Ownership 2 min
Extension 10 min
106

Lesson 11 Process Flow-charting
Time: 1 hour
Objectives: To provide further experience in describingthe underlying processes comprising theworkplace.
Technique: Panel Discussion - Assign one of four casestudies to each individual. After allowingtime for reading and considering the case,call panels of individuals who had the samecase to identify the central process(es)described. Emphasize the cross-functionalnature of the processes. Describe the inputand output at each interface.
Lesson Plan: Introduction 5 min
Read Cases 5 min
Panel Discussion 36 min
Conclusion 4 min
107

Lesson 12 Definition of Performance & Customer
Satisfaction
Time: 1 hour
Objectives: List and define the seven components ofperformance. Discuss which are mostappropriate for the Engineering Branch.
Understand the important role of customer oruser satisfaction in improving performance.Identify who customers are of the EngineeringBranch.
Technique: Group brainstorming - Present the sevencomponents of performance. Allow the groupto suggest the value of each in theirenvironment. Permit the group to generate alist of customers and how the EngineeringBranch serves these customers.
Lesson Plan: Introduction 5 min
Performance Component Definition
Effectiveness 4 min
Efficiency 4 min
Productivity 4 min
Quality 4 min
Innovation 4 min
Quality of Work Life 4 min
Budgetability 4 min
Component Importance 2 min
Customer Satisfaction
Importance of Customers 5 min
Identification of Customers 10 min
108

Lesson 13 Application of Performance Components
Time: 1 hour
Objectives: Apply the components of performance to theEngineering Branch environment. Suggestelements of performance which could betargeted for evaluation and improvement underthe Performance Management Framework.
Technique: Paired individuals analysis and presentation- Direct each pair to critically evaluatetheir organization in regard to one of thecomponents of performance. Their conclusionswill then be briefed to the group.
Lesson Plan: Introduction 5 min
Paired application analysis 25 min
Presentations 20 min
109

Lesson 14 Implementation Details
Time: 1 hour
Objectives: Outline the steps involved in a top-downimplementation of a Performance ManagementFramework.
Illustrate the technique of using a pilotproject to initiate the program.
Describe the importance of the facilitator tothe operation of the team function.
Technique: Paired individuals' reports - Assign one ofthe objectives to each pair. Provideguidance from which they can preparerecommendations. Have each pair presenttheir findings to the entire group.
Lesson Plan: Introduction 3 min
Paired individual analysis 25 min
Presentations 20 min
Conclusion 2 min
110

Lesson 15 Implementation Exercise
Time: 3 hours
Objectives: Provide a situation in which members canexperience implementation of the PerformanceManagement Framework.
Discuss the lessons learned and how theymight be applied to the programimplementation in the Engineering BranchEnvironment.
Technique: Direct the group in participation in theProject Workshop. Lead the group indiscussing their experience.
Materials: Several dozen 8-1/2 x 11 sheets card stock orother heavy construction paper (buff color isfine), masking tape, unsharpened pencils,typing paper, scissors, 12 inch scales,drafting triangles.
Lesson Plan: Introduction 5 min
Exercise
Situation 30 min
Management Initiation 15 min
Break 10 min
Team Time 1 25 min
Team Time 2 25 min
Break 10 min
Team Time 3 25 min
Management Implementation 10 min
Debrief 15 min
111

Lesson 16 Measurement Exercise
Time: 1 hour
Objectives: Understand the importance of measurement inevaluating and improving performance.
List reasons for measuring.
Define what to measure as the products whichpass between steps in the process, frominternal suppliers to internal customers.
Examine a method for analyzing variancebetween these steps.
Technique: Ham and Cheese Sandwich exercise - Guide thegroup in the exercise and discussion ofapplications.
Lesson Plan: Introduction 3 min
Measurement
Importance 3 min
Reasons for 6 min
Variance
External 3 min
Internal 5 min
Variance Matrix 30 min
112

Lesson 17 Cause ard Effect of Measurement
Time: 1 hour
Objectives: Understand the importance of measurement, andthe components of an effective measurementsystem.
Technique: Group brainstorming - Have the group developa cause and effect diagram for an effectivemeasurement system.
Lesson Plan: Introduction 3 min
Cause and Effect Technique 17 min
Cause and Effect of Measurement 30 min
113

Lesson 18 Objectives Matrix
Time: 1 hour
Objectives: Demonstrate a technique to summarize non-related measures into a composite score.
Describe the distinction between product,process and surrogate measures, and theadvantages of each.
Technique: Individual Module and discussion - Have eachindividual complete the worksheet moduleillustrating the objectives matrix. Allowthe members to discuss its use andapplication.
Lesson Plan: Introduction 7 min
Types of Measures 8 min
Objectives Matrix Worksheet 25 min
Discussion 10 min
114

A 2 _nx B. Student's Handbook
This appendix contains the Student's Handbook for a
three day training course in performance management. It
follows the Plan of Instruction given in Appendix A.
Detailed instructions for how to lead a class through the
training course are contained in the Leader's Guide in
Appendix C.
An introduction and schedule of instruction are given.
Objectives for the course and each lesson are given. Where
appropriate, outlines for the lessons are given with room
provided for note taking. The Student's Handbook is
intended to be provided to each student at the beginning of
the course. The student would then be allowed to take the
handbook with him or her at the conclusion of the course as
a reference.
In preparing this handbook, material was adapted from
other sources as appropriate. This material is referenced
below:
Session 2 Case Descriptions (Hayes, 1990:19-24).Session 3 Management Cases (Wertz, 1989;
Warmington, 1988; Simmons, 1990:74-76;Barra, 1989:46-50)
Session 5 Group roles (HQ AFLC, 1989d:120-121).Conflict responses (Gray and Smeltzer,1989:412-413).
Session 9 Process improvement plans (Jennings andothers, 1989:12-89).
Session 12 Performance components (Sink and Tuttle,1989:171-186).
Session 16 Variance matrix (Jennings and others,1989:50-57).
Session 17 Cause and Effect (Department, 1989a:51).Session 18 Objectives matrix (Riggs, 1987:648-660).
115

PERFORMANCE MANAGEMENT FRAMEWORK HANDBOOK
A handbook for the evaluation and
improvement of performance in the Engineering Branch of
Air Force Civil Engineering Squadrons
FOREWARD
This handbook is designed to assist Engineering Branch
managers, engineers, and others who contribute to the
preparation and execution of projects for real property
construction, maintenance, and repair. These individuals
are challenged with providing and maintaining quality
facilities, allowing Air Force organizations to perform
their missions. Evaluation, management and improvement of
the performance of Engineering Branch personnel is central
to continuing to fulfill this mandate.
The goal of this handbook and the training which accompanies
it is to acquaint Engineering Branch members with a
framework for managing performance and to provide the tools
needed to use this framework.
116

Performance Management Framework Objectives:
Foster a management perspective conducive toperformance improvement
Create an organizational environment promotingperformance improvement
Continually encourage the quest to discover andimplement ways to improve performance
Course Objectives:
To equip civil engineering personnel to manage a
performance management framework
To create momentum for performance improvement
To promote within civil engineering personnel aperspective for improvement
To provide the essential tools and techniques toestablish and maintain a performance managementframework
117

CLASS SCHEDULE
First Day Time Page
Morning
Topic: Introduction/EngineeringEnvironment Distinctives
Session 1 Introduction/Distinctives 1 hour 120
Session 2 Benefits Available 1 hour 121
Topic: Role of Management
Session 3 Management Commitment 1 hour 126Session 4 Management Support 1 hour 134
Lunch 1 hour
Afternoon
Topic: Employee Participation
Session 5 Team Participation 1 hour 136Session 6 Participation Exercise 2 hours 140
118

Second Day Time Page
Morning
Topic: Training
Session 7 Training Objectives 1 hour 143Session 8 Training Techniques 1 hour 145
Topic: Process Framework
Session 9 Process Improvement 1 hour 146Session 10 Process Flow Exercise 1 hour 149
Lunch 1 hour
Afternoon
Session 11 Process Flow-charting 1 hour 150
Topic: Target of Improvement
Session 12 Performance Definition 1 hour 151Session 13 Performance Components 1 hour 157
Third Day
Morning
Topic: Framework Implementation
Session 14 Implementation Details 1 hour 158Session 15 Implementation Exercise 3 hours 160
Lunch 1 hour
Afternoon
Topic: Measurement
Session 16 Measurement Exercise 1 hour 162Session 17 Cause and Effect
Discussion 1 hour 168Session 18 Objectives Matrix 1 hour 170
119

Session 1 Introduction/Engineering EnvironmentDistinctives
Objectives: Distinguish a performance managementframework from other management fads andgimmicks which have come and gone.
Establish that this framework is one whichcivil engineering personnel design themselvesto fit their own particular situations.
List management techniques which the Air Force or yourorganization have tried. How well have they worked?
What are some essential aspects of a successful managementframework?
What are some aspects of management techniques which have notworked or have hampered the effectiveness of the technique?
120

Session 2 Potential Benefits from PerformanceImprovement
Objectives: Detail what benefits can be gained.
Demonstrate why improvement action is needed.
Understand benefits experienced in otherworkplace environments. Discuss differencesin the civil engineering environment that mayrequire adaptation or changes of approachfrom that used successfully in othersituations.
Reference: The three case descriptions - *Three Views ofTQM," by Glenn E. Hayes, Qua ity, Volume 29,April 1990, pp 19 - 24.
Questions for Case Evaluations:
What need did this organization identify which theysought to improve?
What action did they take to make improvements? Whattools were used? What resources did they tap?
What benefits did they achieve? What improvements wererealized?
How did this environment differ from the Air ForceEngineering Branch environment you are in? In whatways was it similar?
Would the approach used work in your organization? Whyor why not? What would need to be done differently tomake improvements to some area of need in your branch?What could be done in a similar fashion?
121

Case 1. General Dynamics Space Systems Div. , San Diego, CA
In 1985, senior managers at General Dynamics decided touse performance management principles to make their divisionprosper. A quality team was created to examine theorganization. Work processes were found which were stuckin the trap of always doing things the same withoutquestioning whether there was a better way. An atmospherewas created to encourage making changes without workersfearing reprisals.
The success of the performance improvement effort wasattributed to a large degree to the support and directionprovided by the top management. This group showedleadership, not Just management, in making sure the employeeimprovement teams had all they needed to tackle naggingproblems and bring misunderstood work processes to light.
Decisions were made about training, including who,what, when and how. Senior management sought training inhow to provide a more favorable environment in which theworkers could proceed with the performance improvementefforts. Management's commitment was shown further bymaking sure everyone else also received the training theyneeded in order to begin. Then management stood back andlet teams of workers dive into evaluating and improvingtheir work processes using performance managementtechniques.
As a result, the team's departments are now workingtogether in better harmony. The material procurement,manufacturing, production and quality departments arefunctioning more as a single unit. They communicate morefrequently and effectively. Costs have been reduced by asmuch as 30% as well. Improvements were made not only on thefactory floor, but in the administrative processes. Priorto using performance management, their work to producelaunch vehicles and to provide launch services wasunderstood only from an engineering viewpoint. However, ittook the new techniques and mindset of performancemanagement to understand the work from a process viewpoint.This allowed the process to be charted and areas needingimprovement to be exposed.
The improvements with the largest potential impactswere those focused not on production floor but on theadministrative functions. Paperwork processes were found tohave the longest cycle times. Shortening these turnaroundtimes proved more important than the more direct productionwork processes.
122

Case 2. TRW Space & Defense Sector, Redondo Beach, CA
In mid-1989, TRW set goals for the sector into the newdecade and chose performance management as a way to helpreach these goals. One reason given was to meet theircustomers' expectations. A growing commitment toperformance management principles exists in government, withwhom much of their work is done. They did not want to fallbehind their competitors, many of whom have begun suchefforts. A second reason given was the bureaucratic natureof their business. Work processes needed to be improved toreduce the time and cost associated with this businessbureaucracy. Wasted steps were to be cut out of theprocesses, promising savings of up to 30%. Workermotivation would be increased as individual responsibilitywas restored and waste eliminated.
Top management supported performance management bypromoting the mindset needed to look for improvement, notjust to get by. Involvement by every manager was expected.Each was to be receptive to improvement ideas and encouragethe efforts of their people. Further support was providedin the form of resources needed to implement improvementteams and their ideas.
Performance management was formally begun when allsenior managers attended training in how to lead the effort.Process action teams were formed and training provided fortheir members. These teams were directed to evaluate andpropose improvements in the work processes of theorganization. A goal of 30% cost reduction over severalyears was set. Each department was made responsible for aportion of that goal each year.
Accomplishments were made in both production orientedand idea oriented processes. Six processes that wereinitially attacked were: 1)travel expense reports; 2) Timecard processing; 3) New hires and transfers; 4) Facilitiesrequests; 5) Performance measurement systems; and6) Administrative support requests. Each was marked bybureaucracy, and improvements were made by streamlining theprocesses and removing areas prone to mistakes.
The sector made sure that improvements in schedule,performance or cost were not made at the expense of quality.A focus was maintained of improving the work processes, andnot just trying to dress up the products that result. Astrong customer involvement was developed, making sure thework was in harmony with customer expectations.
123

Case 3. M/A-COM Government Systems Div., San Diego,-CA
M/A-COM expanded its performance management effortsin March, 1989 as a result of observing improvementspreviously achieved in a limited use of the principles inits production area. Products were completed .with lesslabor, fewer defects, and lower inspection costs. Anadditional motivation, as a government supplier, was thegovernment's requirement that all its suppliers use suchperformance management principles.
Decision making authority was spread to lower levels inthe organization. Workers were recognized for theircontributions in performance management, setting the examplethat management was behind such efforts. Top management'sactive involvement in the improvement efforts was furtherdemonstrated by including the topic and efforts in theexecutive council agenda for their monthly meetings.Initially, critical work processes to be evaluated andimproved were defined by this council. Since then, otherprocesses have been added as a result of suggestions fromthe employees.
Top management has been involved in activities relatedto performance management to show their support. Funds havebeen budgeted for training, which has been provided to allperformance improvement teams. The efforts were givenpublicity through the organization's publications, whereteams were credited for their accomplishments.
A consultant was hired to train the employees in thetools, mindset, and concepts of performance management. Theplan was publicized to all personnel. Teams have alreadyimproved the data-handling process, and the employeesuggestion policy is being evaluated. Perhaps one of themost significant accomplishments has been getting employeesto work together in teams. Barriers are breaking down andcommunication improving as they understand their workprocesses and why others involved in them do the things theydo. Not all improvements were large ones, but as long asthey are aimed in the right direction they have beenwelcomed.
A critical element in the team problem solving was tofirst properly identify the process. This was done using theorganization's mission statement and process flow-charting.The urge to jump the gun needed to be controlled. Onlyafter adequate training and thorough process definitioncould successful efforts be pursued. Using the employeesin an interactive, participative team setting has unlockedmuch potential for success.
124

What areas in need of improvement can you identify in yourorganization?
125

Session 3 Importance of Commitment by Top Management
Objectives: Demonstrate that management commitment iscrucial.
Identify ways that management commitment canbe increased.
References: Case Descriptions - Design and Implementationof Total Quality ManaXement in a CivilEnginering Sguadron, by lst Lt Robert M.Wertz, 1989.
-Lsoins Leairned t ram the 1 e M2D1A119 2Total Qpualiy Mnagement at the NavalAviation Dep2 1 . North Island CA, by JefferyAllen Warmington, 1988.- "FPL Wins the Deming Prize," by JohnSimmons, The Journal for Q11 1 andParticipation, March 1990, pp 74 - 76.- *Motorola's Approach to Quality,' by RalphBarra, The Journal for Quaity andParticipation, Volume 12, Number 1, March1989, pp 46 - 50.- A Performance Management Framework forCivil Engineering, by Robert M. Gill, 1990.
Who is the top management for your organization?
How critical to your work is their support?
How does your management show what they support?
126

Questions for Case Evaluations:
How committed was top management in this case to thetask the organization was working on? How didmanagement show their level of commitment?
What would you suppose management was committed to?
How could management's commitment have been increased?Suggest some specific ways.
Who could have the possible impact on top management toincrease their commitment? Who could convince them tomore fully support the task of the organization?
127

Case 1. 2750 CES/DEM, Wright-Patterson AFB, OH
Early in fiscal year 1989, the Operations andMaintenance Branch of the 2750 Civil Engineering Squadronbegan a formal performance management effort. The squadronis a part of Air Force Logistics Command, which at thedirection of its Commander, was implementing Total QualityManagement principles command wide. The squadron hadestablished a quality committee, compriaed of many of thetop officers and supervisors. This council was chaired bythe Deputy Base Civil Engineer, and oversaw the qualityefforts of the squadron. The Industrial Engineering Branchof the squadron had several enthusiastic and capable memberswho were eager to begin performance management effortssquadron wide.
The quality committee's job was to promote improvementwithin the organization and to determine when to formprocess action teams and which processes should be assignedfor analysis. Committee members attended team meetings onoccasion to show support and observe the activity. Thecommittee designated a large conference room for teammeetings. They further allowed team members time to meet,usually an hour per week. When a team arrived at proposedsolutions for improvements, the committee was briefed by theteam. The committee then took action on theserecommendations.
As the effort progressed, and teams which were formedhad been meeting for some time, the quality committee wasfound to provide inadequate direction to the processimprovement efforts. One employee expressed a feeling thatwere it not for the AFLC commander's personally showinginterest and involvement, the input from the CivilEngineering Squadron's top management would be almostnothing. It was only because the Industrial EngineeringBranch advisors' efforts, covering up for lack of topsquadron support, that any successful results were obtained.
128

Case 2. Naval Aviation Depot, North Island, CA.
In 1984, management at the Naval Aviation Depot decidedto begin using performance management principles to improvetheir work processes. Initial training was slated for onlythe upper and middle m-nagement personyel. No training wasprovided for the workers and their immediate supervisors.The only training these employees received was that which waspassed down by upper management.
The top management at the depot delegated the controlof the performance management effort to a staff group, whilethe attention of top management was then diverted elsewhere.This sent the signal to the rest of the organization thatthe new improvement plans were not a top priority, and thattop management was not supporting the performance managementeffort.
Process action teams were formed throughout theorganization. In fact, the explosion in the number of newteams being formed grew too fast for upper management tosupport them effectively. Not enough planning or controlhad been established to direct the performance improvementmomentum once it had been established. In spite of theorganizational time and resources going into performancemanagement, pressure was still being applied from users ofthe depot for all the existing quotas to be met. Topmanagement was not supporting the teams by coordinating newschedules of delivery with these users, allowing the teamstime to get established.
The employees' performance appraisals were not changedto reflect the new responsibilities of the processimprovement teams. Soon the effectiveness of the effortbegan to decrease. Without support from top management fora change in emphasis for the organization, interest inworking for improvements trailed off.
129

Case 3. Florida Power and Light
In 1981, Florida Power and Light began using qualityteams to improve their delivery of electrical power to itscustomers. They achieved impressive results, being honoredinternationally by winning the Deming Prize, awarded to theorganization using performance management techniques best.The transformation at Florida Power and Light was led allthe way by its top management. The senior management team,led by the company's chairman, showed their commitment tonew ways of managing by their behavior and their decisions.
The senior management team journeyed to Tokyo, Japan,to discuss performance improvement issues with a team ofcounselors there. Most any week of the year one of theseJapanese counselors was likely to be found in Floridaworking with some unit of the organization. They worked toinstall a management system similar to what utilitycompanies in Japan had found successful. The systememphasized getting ideas for improvements from the workersto management and the other way around, too.
Each senior manager is assigned objectives forimprovement across several departments, to substitutecooperation for conflict. These managers made customersatisfaction their goal, and pushed this goal down throughthe levels of management in the organization.
Management decided to enter the competition for theDeming Prize as an incentive for their company to work foreven greater improvements. The organization already hadseveral years experience in performance management by thistime. Their efforts accelerated as each member, alreadyfamiliar with the performance management principles,multiplied their involvement toward this end. As a result,they accomplished in one year what it might have taken threeor four to accomplish otherwise.
Senior management was committed throughout, going toclasses, and refusing to delegate the reviews of progress,but rather performed these themselves. They had thepatience not the abandon the plan when quick results did notmaterialize. They remained dedicated to providing thetremendous investment needed to train all employees.
130

Case 4. Motorola, Inc.
Motorola began their performance management effort in1980. They have emphasized a top-down plan and a bottom-updedication of employees to that plan. Their first step wasto form a top-managemeait council of quality executives.This council considered how to employ their most valuableresource for performance improvement, their people.
An ambitious training program was instituted to speedup the improvement process. This included not onlyanalytical tools but quality awareness training as well. Inaddition, hiring criteria was changed to bring in morequality conscious people.
Motorola's twice-a-quarter policy and operatingcommittee meetings focusing on performance management werechaired by no less than the Chief Executive Officer of theorganization. Progress in improvement initiatives wasreviewed, and reports made by each manager of a major unitregarding the quality efforts of that unit. Successes aswell as failures are briefed. In addition, each businessunit has its own individual performance meeting, againtwice-a quarter, and again chaired by the CEO, to look inmore detail at that unit's efforts.
Performance management planning is not limited to thetop officers of the company. A program for participativemanagement encourages every employee to contributesuggestions to teams, which then make recommendations forimprovements. This fosters management support andcommunication. Managers share information, problems andopportunities with the employees, and ask for their ideas.
Management arranged for financial savings from theimprovement efforts to be shared with the employees as partof an incentive plan. In addition, CEO awards are areissued to recognize large achievements.
131

Case 5. 2750 CES/DEE, Wright-Patterson AFB, OH
At the beginning of the 1990 fiscal year, the chief ofthe Engineering Branch of the 2750 Civil EngineeringSquadron decided to use performance management in theorganization to solve a persistent problem with the designreview process. Performance management principles werechosen because of growing pressure from the Air ForceLogistics Command to see organizations turn to thesetechniques, and to process action teams, to improve workprocesses. Support was provided by an individual in theIndustrial Engineering Branch. Initial training wasprovided to all team members by this individual.
The Engineering Branch chief personally picked a teamof individuals from the branch to participate in the teamimprovement effort. The chief decided to personally be amember of the team as well. The chief's office was used formeetings, and the team members were directed to take timeout of their schedules to attend and contribute. The chiefdemonstrated by personal attendance, interest andinvolvement in the discussions of the process, thatmanagement commitment was present. Willingness toimmediately implement the recommendations of the teamfurther showed this commitment.
The chief's influence was used as needed to bring inputor attendance from representatives of other organizations tomeetings. This allowed the team to get at the root of theproblems they encountered. Memos were drafted and meetingsset up to communicate the results of the team'sinvestigation. The team members seemed to put even moreenergy into evaluating and improving the design reviewprocess after seeing their chief take such an enthusiasticinterest in the whole business.
When the team had reached their conclusions, anopportunity was arranged to brief the squadron qualitycommittee on the results. This committee was made up ofmany of the senior officers and supervisors from thesquadron. However, at the appointed time, most all themembers of the committee were tied up elsewhere, and thepresentation of results to management was of little impact.Nevertheless, the Engineering Branch chief continued to doall possible to see that the team's efforts wereimplemented.
132

How committed is your top management to a performancemanagement framework?
How will this level of support impact your ability to usea performance management framework?
How can commitment by management be increased, if needed, ormaintained if already adequate? Who can best convince yourtop management in this regard?
133

Session 4 Management Support and Cultural Change
Objectives: Identify the support roles of management inimplementing and maintaining a performancemanagement framework.
Define the concept of 'Cultural Change* andcommunicate the essential role of topmanagement in creating the change in culturefrom the top down.
Management Support Roles
Provide Example
Show interest
Get involved
Encourage individual applications
Apply the framework at the top
Make visible changes
Provide Resources
Time
Space-
Funds
Computer Resources
Support from consultants/DEI
Coordinate Organization-Wide Efforts
Multi-discipline applications
Planning
Assure efforts are being made
Select processes for improvement
134

Reward Results
Recognition
Awards
Access to resources
Cultural Change
Culture
Your Organization's Culture - Man from Mars Perspective
Unneeded cultural attributes
Change
Formal Channels
Make new policy
Counter old culture
Informal Channels
Identify informal group leaders
Solicit their assistance
Conclusion and Summary
135
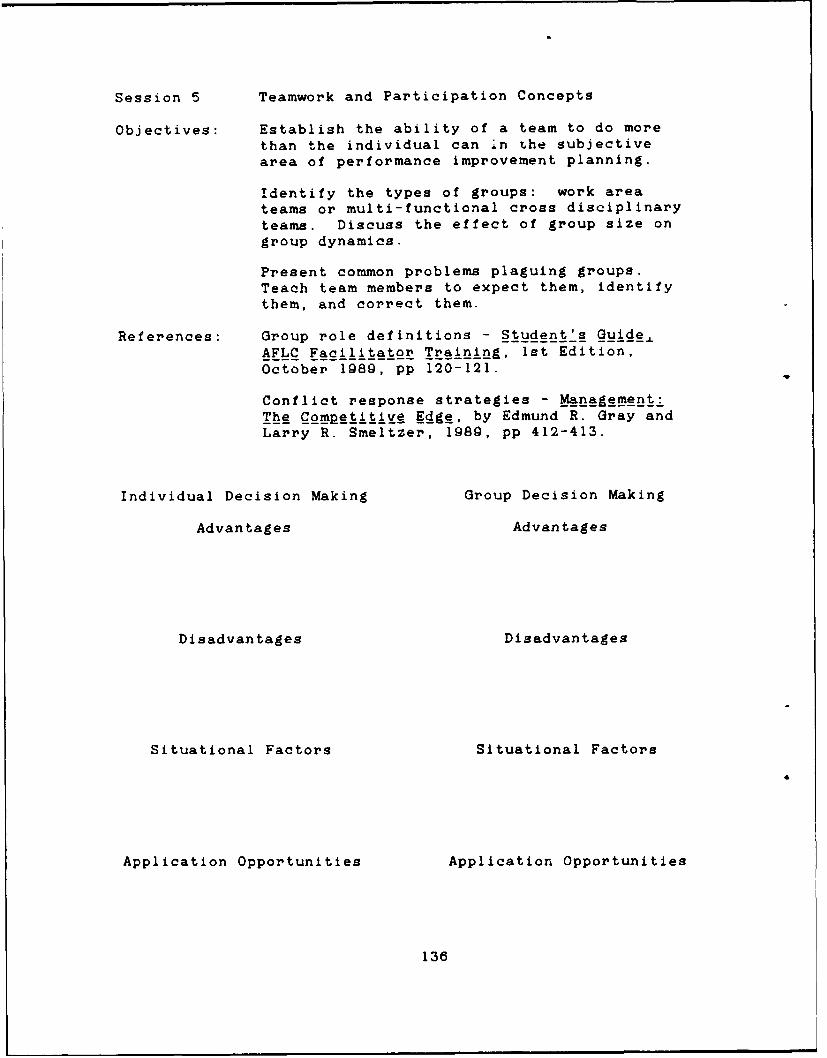
Session 5 Teamwork and Participation Concepts
Objectives: Establish the ability of a team to do morethan the individual can in the subjectivearea of performance improvement planning.
Identify the types of groups: work areateams or multi-functional cross disciplinaryteams. Discuss the effect of group size ongroup dynamics.
Present common problems plaguing groups.Teach team members to expect them, identifythem, and correct them.
References: Group role definitions - Student's QuideAFLC Facilitator Training, 1st Edition,October 1989, pp 120-121.
Conflict response strategies - Management:The Competi tiye Edge, by Edmund R. Gray andLarry R. Smeltzer, 1989, pp 412-413.
Individual Decision Making Group Decision Making
Advantages Advantages
Disadvantages Disadvantages
Situational Factors Situational Factors
Application Opportunities Application Opportunities
136

When might a functional-area group be appropriate?
When might a cross-functional group be preferred?
How does group size affect group effectiveness?
Common Group Roles:
Task Related:
Initiator - Proposes tasks or goals; defines a groupproblem; suggests a procedure or idea for solvinga problem
Seeker - Requests facts; seeks relevant informationabout group concern; asks for expressions offeelings; requests a statement or estimate;solicits expressions of value; seeks suggestionsand ideas
Giver - Offers facts; provides relevant informationabout group concern; states a belief about amatter before the group, giving suggestions andideas
Summarizer - Interprets ideas or suggestions; clears upconfusion; defines terms; indicates alternativesand issues before the group; pulls togetherrelated ideas; restates suggestions after thegroup has discussed them, offering a decision orconclusion for the group to accept or reject; asksto see if group is nearing a decision
137

Maintenance Related:
Harmonizer - Attempts to reconcile disagreements;reduces tension; gets people to exploredifferences
Gate Keeper - Helps keep communication channels open;facilitates the participatioii of others; suggestsprocedures that permit sharing remarks
Encourager - Acts friendly, warm, and responsive toothers; indicates acceptance of others'contributions
Compromiser - Offers a compromise; admits error;modifies own ideas in interest of group cohesionor growth
Standard Tester - Tests whether group is satisfied withits procedures; points out explicit or implicitnorms which have been set to make them availablefor testing
Self Related:
Aggressor - Deflates the status of others; disapprovesvalues, attacks the group problem; jokesaggressively; seeks recognition
Blocker - Tends to be negativistic and stubbornlyresistant; disagrees and opposes beyond reason;attempts to bring back issue after group hasrejected it; refuses to or ceases to participate
Dominator - Tries to assert authority in manipulatingthe group or certain members: flatters; asserts asuperior right to attention
Playboy - Makes a display of his/her lack of abilityand involvement in the group process; cynical ornonchalant; engages in horseplay
138

What are the merits and/or problems with each of thefollowing ways of dealing with conflict?
Separate the conflicting parties
Impose rules or regulations to reduce the conflict
Bring the parties together to confront the issues andwork out solutions
139

Session 6 Team Participation Exercise
Objectives: Allow the group members to work as a team.Give the individuals an opportunity toobserve group interaction techniques andproblems.
Discuss the dynamics of the group exercise.
Identify specific roles that people adopt ina group environment to facilitateperformance.
Discover the role of a facilitator for thegroup.
How was this exercise similar to team decision making youmight encounter on the Job?
Role Who? How?
Initiator
Seeker
Giver
Summarizer
140

Role Who? How?
Harmonizer
Gate Keeper
Encourager
Compromiser
Standard Tester
Aggressor
Blocker
Dominator
Playboy
What is a facilitator?
What actions might a facilitator take in a group decisionmaking session?
141

How might a facilitator respond to each of these roles?
Initiator
Seeker
Giver
Summarizer
Harmonizer
Gate Keeper
Encourager
Compromiser
Standard Tester
Aggressor
Blocker
Dominator
Playboy
142

Session 7 Training Objectives and Pitfalls
Objectives: Establish the broad training goal of creatingthe cultural change needed for a successfulprogram.
Define the more specific training goals ofimparting tools for use in a performancemanagement framework.
Introduce some of the most common problemsand errors encountered in training programs.
What is cultural change?
How can training be used to begin this change?
Where should this training be accomplished?
How might training for use of specific performancemanagement framework tools differ from the cultural changetraining?
Who would you recommend to lead this training? Where mightthis training be accomplished?
143

What problems might arise from training everyone right away?
What problems do you foresee from training people tooextensively, or in too much detail for their needs?
What problems would be associated with having no training?
144

Session 8 Training Techniques and Strategies
Objectives: Identify which individuals in the EngineeringBranch should receive training. Suggest whatfactors are pertinent to choosing thesepeople.
Determine the most opportune time to providevarious degrees of training. List importantcriteria in selecting this correct time indifferent situations.
List the essential ingredients to be includedin the training curriculum. What situationalfactors might require revising theseingredients?
145

Session 9 Process Improvement
Objectives: Present the concepts associated with viewingorganizational activity from a processperspective.
Understand the five principal features ofprocess improvement plans.
Define cross-functional processes. Establishhow to determine the input and output whichflow between these producers and consumers.
Discuss ownership of processes. Show theimportance of assigning responsibility for aprocess to a single individual.
Communicate the necessity of extending theprocess to its origin and conclusion. Thegreatest improvements for the least expensecan often be made by thorough planning at thestart of the process.
Reference: Process improvement plans - Total QualtyiAssurance Through Process _anagemnt, byKenneth R. Jennings and others, 1989, 12-89.
Process Perspective
Definition
Repeatable
Universal
Relate to big picture
Building blocks of performance
Key to improvement
146

Process Improvement Plans
Definition
Suppliers Activity Steps Users
Input ------ > Transformation --- > Output
Simplification
Measurement
Control
Improvement
Identify Opportunities
Cause and Effect Planning
Action
147

Cross-functional Processes
Functional interdependence
Input
Output
Coordination
Process Ownership
Responsibility
Authority
Pride
Process Extension
Downstream
Upstream
Difficulties
148

Session 10 Process Flow Exercise
Objectives: To allow the group to identify a process in amulti-functional environment. The processinterfaces will be determined, along with theinput and output passed between thesefunctions.
149

Session 11 Process Flow-charting
Objectives: To provide further experience in describingthe underlying processes comprising theworkplace.
Summarize the case.
Describe the processes evident in the case. List the stepswhich comprise these processes.
Which separate functional units are interfaced with in eachprocess?
Who is the process owner? Over which steps in the processdoes the owner have personal authority?
What are elements of input and output evident in theseprocesses?
How can defining the process in work situations assist inmanaging and improving the organization's performance?
150

Session 12 Definition of Performance & CustomerSatisfaction
Objectives: List and define the seven components ofperformance. Discuss which are mostappropriate for the Engineering Branch.
Understand the important role of customer oruser satisfaction in improving performance.Identify who customers are of the EngineeringBranch.
Reference: Planning and Measurement in Your Organizationof the Future, by D. Scott Sink and ThomasC. Tuttle, 1989, pp1 7 1 -18 6 .
Performance Components
Effectiveness
Operational Definition -
The ratio of actual output to expectedoutput. This is an output side component.
Possible applications -
How important is this as a component ofperformance?
Efficiency
Operational Definition -
The ratio of expected input to actual input.This is an input side component.
Possible applications -
How important is this as a component of
performance?
151

Productivity
Operational Definition -
The ratio of output to input in the sameunits.
Possible applications -
How important is this as a component ofperformance?
Quality
Operational Definition -
The degree to which each step of the process,and the process as a whole, operatescorrectly.
Possible applications -
How important is this as a component ofperformance?
152

Innovation
Operational Definition -
An index of the creative process of changingto respond to new pressures, opportunities,and threats.
Possible applications -
How important is this as a component ofperformance?
Quality of Work Life
Operational Definition -
The reaction of the organization's personnelto the work environment, including factorssuch as pay, leadership, autonomy,involvement, and relationships.
Possible applications -
How important is this as a component ofperformance?
153

Budgetability
Operational Definition -
The relationship of budgets and goals withactual costs and accomplishments. Thiscomponent is analogous to profitability in aprivate organization.
Possible applications -
How important is this as a component ofperformance?
Effectiveness and quality have been suggested as the twocomponents most critical to the performance of a civilengineering organization. The other components depend onthese two. Do you agree? Why might you think this to bethe case?
154

Why is customer satisfaction important to the EngineeringBranch?
Who are customers of the Engineering Branch?
How does the Engineering Branch serve each of thesecustomers? How can they be better served?
155

PERFORMANCE COMPONENT DIAGRAM
---------------Budgetability------------
------ Productivity--------
Innovation
USER ---- INPUT -- TRANSFORMATION -- OUTPUT --- USERNEED SATISFACTION
Quality ofWork Life
Efficiency Effectiveness
Quality
156

Session 13 Application of Performance Components
Objectives: Apply the components of performance to theEngineering Branch environment. Suggestelements of performance which could betargeted for evaluation and improvement undera performance management framework.
Critically analyze one of the components of performance inits application in your organization.
What is a reasonable operational definition of this aspectof performance? How can it be measured or evaluated in yourorganization?
Suggest how this would allow managers to track performanceand determine where improvement is possible. How would theimprovement be recognized and reported?
157

Session 14 Implementation Details
Objectives: Outline the steps involved in a top-downimplementation of a Performance ManagementFramework.
Illustrate the technique of using a pilotproject to initiate the program.
Describe the importance of the facilitator tothe operation of the team.
Describe how the following need to be addressed within thecontext of a performance management framework in order topromote successful improvement efforts.
Management direction
Strategic planning
Identification of principal processes comprising work
Selection of process as pilot project for firstimprovement effort
Selection of process for next team improvement effort
Management support
Assignment of members to the team
Training decisions
Selection of a facilitator to assist team
158

Team process definition
Identify process steps
Determine input and output
Establish ownership
Define interfaces with otfser functions
Team improvement efforts
Identify problemA
Propose solutions
Recommend actions
Who responsible
Schedule and milestones
How to measure for success
Management implementation
Screen implementation actions
Support implementation actions selected
Reward efforts
159

Session 15 Implementation Exercise
Objectives: Provide a situation in which members canexperience implementation of a performancemanagement framework.
Discuss the lessons learned and how theymight be applied to the implementation in theEngineering Branch Environment.
You are an engineering branch comprised of three sections,programming, design, and construction management. Due tothe limited scope of this exercise, construction managementwill actually do the construction called for in theexercise. Your task is to program, design and build theitems identified.
Part of this task requires costing of labor and materials tobe used. Costs are:
Line Item Cost
Whole sheets of construction paper 810 / sheet
Unsharpened pencils 8 5 / each
Tape S 1 / inch
Labor by builder $ 2 / minute
Note that sheets of paper are charged as whole sheets, evenif only a portion is used. The left over cannot be used onanother project. Tape cannot be used in shorter than oneinch pieces. Pencils cannot be broken.
160

What was the hardest part of the performance management
framework exercise? Why?
What was the easiest part? Why?
What surprised you the most in working through aperformance management franework?
Where do you see the greatest hindrance in doing this inyour actual work? How can this hindrance be overcome?
What advantages and benefits do you think can be achieved byusing a performance management framework in yourorganization?
161

Session 16 Measurement Exercise
Objectives: Understand the importance of measurement inevaluating and improving performance.
List reasons for measuring.
Define what to measure as the products whichpass between steps in the process, frominternal suppliers to internal customers.
Examine a method for analyzing variancebetween these steps.
References: Variance matrix - Total Quality AssuranceThrough Process Management, Kenneth R.Jennings and others, AFIT, 1989, pp 50-57.
Why is measurement important in evaluating and improvingperformance in your organization?
What uses can you see for measurement of your performance?How can it help managers understand, control and improve thework of the organization?
What is variance? What is the relationship of variance andmeasurement?
What are some measures of end product variance that might beused in the Engineering Branch?
162

Where is variance located within the work process?
How might variances at earlier steps in the process affectvariances at later steps in the same process?
How can measuring and controlling variance at early stepsin a complex process help control the end result?
How effective might improvement efforts be at this eanlypoint in the process?
Variance Matrix
The variance matrix analysis is a tool that helps identifythe key variances which affect subsequent steps in the sameprocess. The steps in a variance matrix analysis are listedbelow. The steps are then illustrated in an example on thefollowing pages.
Step 1: Begin with the list of steps which make up thework process being evaluated. This includes every actionneeded to transform the input to output.
Step 2: Group sets of individual steps together intoclusters. Each cluster should accomplish an identifiablechange in the product in its transformation from input tooutput. This simplifies the analysis by concentrating afewer number of main steps.
Step 3: Identify all possible sources of variance in eachstep. These cause the work to miss conforming to thestandard or norm set for it.
Step 4: List variances chronologically in order of how theymight occur in the process, matching each to thecorresponding major step in the process.
163

Step 5: Identify upstream variances Ahat impact orinterfere with the control of downstream variances. Avariance matrix is used for this purpose. Check eachvariance against all downstream variances listed beneath it.If a variance impedes control of a downstream variance, amark is made.
Step 6: Locate key variances, those which impede controlover several downstream variances. The degree of impact thevariance has directly on cost and quality is alsoconsidered.
Step 7: Establish the factors which are important incontrolling these key variances.
164

Example analysis using the variance matrix.
The process is the operation of a machine which assemblesham and cheese sandwiches.
Steps 1 and 2 in the Variance Matrix analysis areillustrated below. The detailed steps in the process arelisted on the right, and are grouped into major steps asshown on the left.
Clustered MaLor Steps Actual Steps
Prepare Bread Replenish bread and mustardFill machinesSort bread onto assembly tray
Add ham Get container of hamSlice hamPosition ham on bread
Add cheese Get container of cheeseSlice cheesePosition cheese on ham
insert luttuce Cut lettuceRemove lumpy lettucePosition lettuce on cheese
Finish sandwich Obtain bread for topPosition bread on lettuceCut sandwich
Package sandwich Insert sandwich in machineInsert cardboard slipPrepare labels
165

Steps 3 and 4 in the Variance Matrix analysis areillustrated below. Individual variances were determined andthen listed, clustered with the major step they correspondto, which are listed across the top. Refer, for example, tothe major step *insert lettuce'. The variances 14 and 15can be seen listed under this step. Similarly, thevariances for each step are listed beginning under theappropriate step, and in order of potential occurrence.
The Variance Matrix
Prepare Add Add Insert Finish PackageBread Ham Cheese Lettuce Sandwich Sandwich
1 Bread soggyx2 Edges curledxx3 Bread crooked
4 Bottleneck5 Ham too warm6 Slices too thick7 Ham shredded8 Ham spoiled
x 9 Ham crooked10 Cheese Moldy11 Cheese unwrapped
x 12 Slices stuck togetherx 13 Cheese crooked
14 Lettuce lumpy15 Lettuce wet
16 Run out of top slices17 Slices wrong size
x x x 18 Top not levelxx x x x x19 Cut quality
x xx x x 20 Package qualxx x x x x x xxx x21 Too bigx x x x x xx xxx xx22 Not sealed
23 Bad label
X X X X XX X X Key Var.
Steps 5 and 6 in the Variance Matrix analysis are alsoillustrated above. For each variance, beginning with number1, the list below that variance was scanned for anyvariances which might be affected by the preceding variance.Such relationships were marked with an "x. For example,note that variance 15 was determined to possibly affectvariances 20 and 22, while variance 16 had no effect onsubsequent variances. The key variances were then selected,and noted with a "X" at the bottom row. These were selectedbecause of their multiplied effect on other variances orbecause on their own they were important enough to be calleda key variance.
166

Step 7, not illustrated above, would then be to determinefactors which control the behavior of the key variances.
167

Session 17 Cause and Effect of Measurement
Objectives: Understand the importance of measurement, andthe components of an effective measurementsystem.
Reference: The cause and effect technique - DOD 5000.51-G, Total Quality Manajement A Guide forILnpeentatio2n, dated 15 Feb 89, p 51.
Major Cause Major Cause> : ;< -- - - -
Minor MinorCauses Causes
> : !< - - - - -
-------------------------------------- > Result
Minor MinorCauses Causes
>-------------
Major Cause Major Cause
What: Represents the relationship between an effect(problem or result) and its potential causes.
Why: The diagram is drawn to sort and relate theinteractions among the factors affecting the result.
How: 1. Name the problem
2. Decide the major categories of causes. Majorcauses may include: data and information systems,dollars, environment, hardware and equipment,materials, measurements, methods, people, andtraining. Frequently, the four catagories usedare people, machines, methods, materials.
3. Brainstorm for more detailed causes.
4. Eliminate causes that do not apply.
5. Discuss the remaining causes and decide which aremost important.
6. Work on most important causes.
7. Eliminate or control causes.
168

Cause and Effect Analysis for an Effective MeasurementSystem
Effective---- ------------------------------------- >Measurement
System

Session 18 Objectives Matrix
Objectives: Demonstrate a technique to summarize non-related measures into a compoelte score.
Describe the distinction between product,process and surrogate measures, and theadvantages of each.
Reference: Objectives matrix - Production Systems:Planning_ Analsg and Control, by James L.Riggs, 1987, pp 848-660.
Product Measures - Actual attributes of item ready for user
Process Measures - How product was attained
Surrogate Measures - Reflect actual attributes
What are the advantages and disadvantages of each?
What precautions are needed when using process and surrogatemeasures? How can you check their validity?
170

Objectives Matrix Worksheet
The following steps make up the objectives matrix analysis.
1. Establish Key Performance Areas (KPAs)2. Determine Key Performance Indicators (KPIs)3. Generate transformation curves4. Assign relative weights5. Compute performance index
1. Establish KPAs
KPAs are those performance components that are consideredimportant to the organization's success. Usually these aredetermined by management or reflect the policies andobjectives set by management. For example, the designbranch may have the following as its KPAs.
Quality of the transformation processEfficiency of manpower useEffectiveness in the form of timelinessQuality perceived by the userQuality of the drawings and specificationsProductivity
2. Determine KPIs
Next a measurable characteristic must be found for each ofthese KPAs. These must be accurate, quantifiable, andrepresentative of the performance component being measured.For example, KPIs for the KPAs above might be:
Efficiency Direct Productive Manhours/Total Manhours
Effectiveness 8 Value Late Projects x Days LateQuality of product * Errors found by design chief at
100% completeQuality to user User Survey Response, scaled 1 - 10
Post-DesignQuality to user User Survey Response, scaled 1 - 10
Post-ConstructionQuality of process Total 0 Change Orders/Total 9
ContractsProductivity 0 Value Designed/Manhours Used
3. Generate transformation curves
This is the principal distinctive of the objectives matrixanalysis. The dissimilar performance indicator measures areconverted into similar ten point index scores. These scorescan then be combined as a weighted average into an overallperformance index. The transformation curve is created
171

individually for each KPI by first determining the anchorvalues, and then filling in the intermediate values. Theanchor values include the zero and ten values on the index.Additionally, the value for three or five is fixed tofurther anchor the index. For example, the KPI for qualityof process, the ratio of change orders, would be anchored asfollows.
Index Value of KPI measureValue
Zero .5 (If change orders total half of theproject cost, award no points)
Five .12 (Anchor the midpoint at the historicalmean of 12%)
Ten 0.0 (The best possible is no change orders,award full points)
Then fill in the rest of the scale. This can be done in anycombination of linear or curved relationships as seemsappropriate for the measure. Graph the relationship ifdesired to make the function more understandable.
Quality of Process Index KPI
10 10 0.09 .028 .04
* 7 .065* 6 .09
5 5 .124 .16
* 3 .212 .281 .37
0 0 .5
0 .1 .2 .3 .4 .5
172

Now, fill in the values for the rest of the KPItransformation curves. Anchor values have been provided.Graph the values if desired. Use any curved or linearrelationships desired to fill in the values.
Index Effic. Effect. Quality Quality Prod.to user product
10 >.75 0 10 0 298765 .4 3200 5 5 143210 0 >100000 0 10 <.5
4. Assign weights
The next step is to weight each of the KPIs so they can becombined into a weighted average. The sum of the weightsmust be one. Give more weight to the KPIs which arebelieved to be most important, and which are believed to bemost valid. For instance, in the list above, the value ofchange orders is an important measure of how accurate thedesign is. It is also a highly valid measure because thecost of change orders can be accurately determined. ThisKPI should be weighted more heavily. On the other hand, thepost-design user survey is not as important. The users oftencannot judge accurately the quality of the design; they donot have the expertise. This KPI should not be weighted asheavily. You be the judge on the others. Fill in theweights below.
173

HP I Wtight
Total S Change Orders/Total SContracts
Direct Productive Manhours/Total Manhours
S Value Late Projects x Days LateUser Survey Response, scaled 1 - 10
Post-DesignUser Survey Response, scaled 1 - 10
Post-Construction# Errors found by design chief at
100% completeS Value Designed/Manhours Used
Sum 1.00
5. Compute Performance Index
Finally, the performance index can be calculated. This isdone be measuring the performance for each KPI. The measureis converted into an integer score between zero and tenusing the transformation curve. These scores are thenaveraged into the performance index using the weights. Thisprocedure is made easy using a table, below.KPA Proc Effec Userl Prody
Effic Prodt User2 Score
Raw Value .17
Transformation 0 >.75 0 10 10 0 2 10Curves .02 9
.04 8
.085 7
.09 6
.12 .4 3200 5 5 5 1 516 4
.21 3
.28 2
.37 1
.5 0 >100000 0 0 10 <.5 0
Score 4
Weight
Weighted
Score
Performance Index
174

Compute the performance index for the following measuredKPIs.
quality of PROCess .17EFFICiency .66EFFECtiveness 5000quality to USER1
post-design 6quality to USER2
post-construction 3quality of PRODucT 8PRODuctivitY 1.25
Fill in your transformation curve values from earlier in theworksheet. Use the same values for USER1 and USER2. Fillin your weights for the KPIs in the appropriate place in thetable. Enter each raw value on the appropriate line nearthe top of the table. Find the value on your transformationcurve which most closely matches that value. Record thisvalue on the line given. Multiply each score by its weightto obtain the weighted score. Sum these weighted scores andrecord the result at the bottom of the table as yourperformance index. This number should be between zero andten. The closer to ten, the better overall performance foryour organization.
Conclusion
This objectives matrix can be used with any measuresappropriate for your organization. It allows you to quicklydetermine an overall ranking for your organization for thetime period studied. This can allow management to track theorganizations performance over time and make recommendationsfor improvements as needed.
175

What type was each measure, process, product or surrogate?
Why?
How might a manager use such a combined index?
How would such an index be useful specifically forimprovement?
176

A22endix C. Leader's Guide
This appendix contains the Leader's Guide for a three
day training course in performance management. It follows
the Plan of Instruction given in Appendix A. It is intended
for use by the course leader/instructor to guide the
discussion and activities planned to communicate the
material. Each student in the course needs to be provided
with a copy of the Student's Handbook in Appendix B. This
handbook follows the same plan and provides the students
with the outlines and information needed for the course to
be successful.
An introduction and course schedule are given.
Objectives are given for the course and each session.
Detailed instructions are given for leading each session.
These instructions are superimposed over a copy of the
Student's Handbook. The format for this is explained in the
Leader's Guide. The instructions are intended to allow a
member of the base level Civil Engineering Squadron to lead
the course, even if this individual has no previous
experience in performance ma agement or leading courses.
In preparing this handbook, material was adapted from
other sources as appropriate. This material is referenced
below:
Session 2 Case Descriptions (Hayes, 1990:19-24).Session 3 Management Cases (Wertz, 1989;
Warmington, 1988; Simmons, 1990:74-76;Barra, 1989:46-50)
177

Session 5 Group roles (HQ AFLC, 1989d:120-121).Conflict responses (Gray and Smeltzer,1989:412-413).
Session 6 Participation exercise (HQ AFLC,1989c:11-12 to 11-16).
Session 9 Process improvement plans (Jennings andothers, 1989:12-89).
Session 12 Performance components (Sink and Tuttle,1989:171-186).
Session 16 Variance matrix (Jennings and others,1989:50-57).
Session 17 Cause and Effect (Department, 1989a:51).Session 18 Objectives matrix (Riggs, 1987:648-660).
178

LEADER'S GUIDE
PERFORMANCE MANAGEMENT FRAMEWORK HANDBOOK
A handbook for the evaluation and
improvement of performance in the Engineering Branch of
Air Firce Civil Engineering Squadrons
FOREWARD
This handbook is designed to assist Engineering Branch
managers, engineers, and others who contribute to the
preparation and execution of projects for real property
construction, maintenance, and repair. These individuals
are challenged with providing and maintaining quality
facilities, allowing for Air Force organizations to perform
their missions. Evaluation, management and improvement of
the performance of Engineering Branch personnel is central
to continuing to fulfill this mandate.
if
The goal of this handbook and the training which accompanies
it is to acquaint Engineering Branch members with a
framework for managing performance and to provide the tools
needed to use this framework.
17g

This leader's guide provides the guidance needed to allow a
member of the Engineering Branch to lead a group of his/her
peers through the training course included. This person
need not be experienced in performance management or leading
courses. The leader's guide provides adequate instructions
to direct the leader through each session. A short amount
of time spent becoming familiar with the lesson contents
before each day's lessons will equip the leader for the
role.
180

Performance Management Framework Objectives:
Foster a management perspective conducive toperformance improvement
Create an organizational environment promotingperformance improvement
Continually encourage the quest to discover andimplement ways to improve performance
Course Objectives:
To equip civil engineering personnel to manage a
performance management framework
To create mcmentum for performance improvement
To promote within civil engineering personnel aperspective for improvement
To provide the essential tools and techniques toestablish and maintain a performance managementframework
Explanation of Format:
The lesson plan outline is included in each lesson.The lesson headings and sub-headings, together with therecommended time for each, are underlined. These donot appear in the student handbook.
Notes for leading the lesson are preceded by "*.and are indented. These notes do not appear in thestudent handbook.
All other text appears in the student handbook asshown.
General Instructions:
Prior to each day's training, the leader should readthrough the Leader's Guide for all the lessons in theday. Become sufficiently acquainted with the materialand schedule of time allotted to move the class groupthrough each lesson smoothly. Get a feel for how eachlesson or subject transitiong into the next. Theleader should make notes in the guide to help keeporganized.
181

The leader should use a clean paper flip pad and easelor overhead projector with plenty of clean transparencyfilm and colored pens. The leader may either assign orask for a group member to be the scribe for the groupon the pad or overhead each session, or do ithimself/herself. Such visible recording is animportant team technique; make liberal use of it.
182

CLASS SCHEDULE
First Day Time Page
Morning
Topic: Introduction/EngineeringEnvironment Distinctives
Session 1 Introduction/Distinctives 1 hour 185
Session 2 Benefits Available 1 hour 193
Topic: Role of Management
Session 3 Management Commitment 1 hour 199Session 4 Management Support 1 hour 207
Lunch 1 hour
Afternoon
Topic: Employee Participation
Session 5 Team Participation 1 hour 212Session 6 Participation Exercise 2 hours 218
183

Second Day Time Page
Morning
Topic: Training
Session 7 Training Objectives 1 hour 226Session 8 Training Techniques I hour 229
Topic: Process Framework
Session 9 Process Improvement 1 hour 234Session 10 Process Flow Exercise 1 hour 241
Lunch 1 hour
Afternoon
Session 11 Process Flow-charting 1 hour 243
Topic: Target of Improvement
Session 12 Performance Definition 1 hour 245Session 13 Performance Components 1 hour 252
Third Day
Morning
Topic: Framework Implementation
Session 14 Implementation Details 1 hour 253Session 15 Implementation Exercise 3 hours 255
Lunch 1 hour
Afternoon
Topic: Measurement
Session 16 Measurement Exercise 1 hour 270Session 17 Cause and Effect
Discussion 1 hour 276Session 18 Objectives Matrix 1 hour 280
184

Session 1 Introduction/Engineering EnvironmentDistinntives
Objectives: Distinguish the Performance Managementframework from other management fads andgimmicks which have come and gone.
Establish that this framework is one whichcivil engineering personnel design themselvesto fit their own particular situations.
Lesson Plan: Introduction 5 min
*****Introduce self and briefly describe the course goalslisted on the Forward page. Refer students to theForeward page of their handbooks.
*****Read over the lesson objectives above with the group.Comment that attempts to improve management are nothingnew in the Air Force, but that the framework formanagement presented here is different. Point out thatseveral elements of this framework are likely to bethings already being practiced in the management ofthis organization. Hopefully this course will expandon these and present some new useful ways to viewmanagement of performance.
Ice Breaker/ Stage Setter- Management Techniques 10-15 min
List management techniques which the Air Force or yourorganization have tried. How well have they worked?
*****Ask the group to list and evaluate other managementtechniques they have experienced. This question servesas an icebreaker for the group. Encourage interactionand contribution by all members. As a managementtechnique is mentioned, ask if everyone is familiarwith it or remembers it. If not, ask someone who doesto explain it. Urge as many members will to to givetheir opinions of the techniques.
*****If the group gets stuck, prompt with *management byobjectives,' and *zero defects.'
**** Ask the group to describe the management techniquesthey use now, and how well they work.
185

qaonefnts of aSuccessful -anaemen t Stem 5-10 min
What are some essential aspects of a successful managementframework?
*****Ask what aspects of these techniques have beenworthwhile? What have you seen in these techniques ofvalue?
*****Ask what the group believes should be in a successfulmanagement program.
Roadblocks toSuccessful Management Sst ems 5 min
What are some aspects of management techniques which havenot worked or have hampered the effectiveness of thetechnique?
***Ask the group to identify the harmful aspects ofmanagement techniques they are familiar with. Startwith techniques they have tried in the past. Move onto what they are using now.
*****Have the group define the destructive elements of theaspects identified.
Course Overview
Framework Obectilves 2 min
*****Present the course to the group. Where possible, pointout where the course and/or performance managementframework considers the essential components justlisted by the group. Likewise emphasize where thecourse and/or framework avoids problems identified.Refer the group to the objectives page at the beginningof the handbook. Review the framework objectiveslisted there.
Course Objectiyes 2 min
***Review the course objectives listed on the same page.
186

Engineering EnvironmentDistinctives 5 min
*****Refer to the course schedule outlined at the front ofthe handbook. If desired, make overhead slides of theschedule to direct the group's attention to the leader.Note that this lesson and the one following dwell onthe subject of the distinctives of the engineeringenvironment. Present and discuss the informationoutlined on the slides attached to this lesson. Theslides do not appear in the student handbook. Thefirst slide is an introduction. Each of the followingthree slides have a question to be discussed. Use theoverhead or easel pad to record the discussion. Notein closing this section that a performance managementframework is not a "cookbook* approach to performanceimprovement. It merely provides tools and perspectivesuseful for personnel to design their own plan.
Role of Manage mentEmnl2yee Partici2ationTrainingProcess Framework 5 min
*****Continue with the course schedule. Note that theremaining sessions today deal with the role andresponsibilities of the personnel in the organization,both supervisors and employees. Note that tomorrowmorning's sessions concentrate first on the extent andtiming of training. Secondly the sessions key on thetopic of understanding work through a processperspective, and the facility this perspective providesfor improvement. Elaborate on these short descriptions.The leader will need to have become familiar with theindividual session objectives to clearly explain these.
187

Target of ImprovementFramework ImpleetationMeasurement 5 min
****Continue with the course schedule. Explain thattomorrow afternoon's sessions focus on the target ofimprovement. The important concept of usersatisfaction will be considered. In addition,performance and its attributes will be discussed.Note that the next morning's sessions include anopportunity to work through an implementation exercise,which will bring together the points previouslystudied. Finally, the last afternoon will examine theimportant subject of measurement. The use ofmeasurement in planning and evaluating improvementefforts will be considered. Again, the leader needs tobe familiar with the individual lesson objectives andelaborate on these short descriptions.
Review Framework Ob~ectlves 1 min
*****Refer again to the objectives page. Review theframework objectives. Explain that as a result of thiscourse, the members of the group will be prepared touse the framework.
*****The following four pages are slides to be used indiscussing the Engineering Environment Distinctivesabove.
188

ENGINEERING ENVIRONMENT DISTINCTIVES
Project Orientationi
Product of Ideas
People are Professionals
189

PROJECT ORIENTATION
Engineering projects are often one-time unique solutions toproblems.
What difficulties does this present for managing a programto evaluate and improve performance?
190

PRODUCT IS IDEAS
Ideas are hard to quantify or evaluate.
What is the measure of a good project?
191

PEOPLE ARE PROFESSIONALS
Professionals are skeptical about a cookbook approach toperformance improvement.
How can professionals be motivated to participate in aperformance improvement plan?
192

Session 2 Potential Benefits from PerformanceImprovement
Objectives: Detail what benefits can be gained.
Demonstrate why improvement action is needed.
Understand benefits experienced in anotherworkplace environment. Discuss differencesin the civil engineering environment that mayrequire adaptation or changes of approachfrom that used successfully in othersituations.
Reference: The three case descriptions - "Three Views ofTQM," by Glenn E. Hayes, Quality, Volume 29,April 1990, pp 19 - 24.
Lesson Plan: Introduction 2 min
*****Go over the session objectives above.
*****Explain that a good way to understand a performancemanagement framework is to look at examples of its use.
Case Evaluations (3 cases) 23 min
*****Divide the group into three teams. Assign one of thecases on the following pages to each team. Instructthe teams to read, evaluate, and draw conclusions fromthe cases. The following questions are to be used informing their evaluations. Inform them that each teamis to present a 5-8 minute summary to the entiregroup. Tell them they have 20 minutes to make theirpreparation.
193

Questions for Case Evaluations:
What need did this organization identify which theysought to improve?
What action did they take to make improvements? Whattools were used? What resources did they tap?
What benefits did they achieve? What improvements wererealized?
How did this environment differ from the Air ForceEngineering Branch environment you are in? In whatways was it similar?
Would the approach used work in your organization? Whyor why not? What would need to be done differently tomake improvements to some area of need in your branch?What could be done in a similar fashion?
194

Case 1. General Dynamics Space Systems Div., San Diego, CA
In 1985, senior managers at General Dynamics decided touse performance management principles to make their divisionprosper. A quality team was created to examine theorganization. Work processes were found which were stuckin the trap of always doing things the same withoutquestioning whether there was a better way. An atmospherewas created to encourage making changes without workersfearing reprisals.
The success of the performance improvement effort wasattributed to a large degree to the support and directionprovided by the top management. This group showedleadership, not Just management, in making sure the employeeimprovement teams had all they needed to tackle naggingproblems and bring misunderstood work processes to light.
Decisions were made about training, including who,what, when and how. Senior management sought training inhow to provide a more favorable environment in which theworkers could proceed with the performance improvementefforts. Management's commitment was shown further bymaking sure everyone else also received the training theyneeded in order to begin. Then management stood back andlet teams of workers dive into evaluating and improvingtheir work processes using performance managementtechniques.
As a result, the team's departments are now workingtogether in better harmony. The material procurement,manufacturing, production and quality departments arefunctioning more as a single unit. They communicate morefrequently and effectively. Costs have been reduced by asmuch as 30% as well. Improvements were made not only on thefactory floor, but in the administrative processes. Priorto using performance management, their work to producelaunch vehicles and to provide launch services wasunderstood only from an engineering viewpoint. However, ittook the new techniques and mindset of performancemanagement to understand the work from a process viewpoint.This allowed the process to be charted and areas needingimprovement to be exposed.
The improvements with the largest potential impactswere those focused not on production floor but on theadministrative functions. Paperwork processes were found tohave the longest cycle times. Shortening these turnaroundtimes proved more important than the more direct productionwork processes.
195

Case 2. TRW Space & Defense Sector, Redondo Beach, CA
In mid-1989, TRW set goals for the sector into the newdecade and chose performance management as a way to helpreach these goals. One reason given was to meet theircustomers' expectations. A growing commitment toperformance management principles exists in government, withwhom much of their work is done. They did not want to fallbehind their competitors, many of whom have begun suchefforts. A second reason given was the bureaucratic natureof their business. Work processes needed to be improved toreduce the time and cost associated with this businessbureaucracy. Wasted steps were to be cut out of theprocesses, promising savings of up to 30%. Workermotivation would be increased as individual responsibilitywas restored and waste eliminated.
Top management supported performance management bypromoting the mindset needed to look for improvement, notjust to get by. Involvement by every manager was expected.Each was to be receptive to improvement ideas and encouragethe efforts of their people. Further support was providedin the form of resources needed to implement improvementteams and their ideas.
Performance management was formally begun when allsenior managers attended training in how to lead the effort.Process action teams were formed and training provided fortheir members. These teams were directed to evaluate andpropose improvements in the work processes of theorganization. A goal of 30% cost reduction over severalyears was set. Each department was made responsible for aportion of that goal each year.
Accomplishments were made in both production orientedand idea oriented processes. Six processes that wereinitially attacked were: 1)travel expense reports; 2) Timecard processing; 3) New hires and transfers; 4) Facilitiesrequests; 5) Performance measurement systems; and6) Administrative support requests. Each was marked bybureaucracy, and improvements were made by streamlining theprocesses and removing areas prone to mistakes.
The sector made sure that improvements in schedule,performance or cost were not made at the expense of quality.A focus was maintained of improving the work processes, andnot just trying to dress up the products that result. Astrong customer involvement was developed, making sure thework was in harmony with customer expectations.
196

Case 3. M/A-COM Government Systems Div., San Diego, CA
M/A-COM expanded its performance management effortsin March, 1989 as a result of observing improvementspreviously achieved in a limited use of the principles in
its production area. Products were completed with lesslabor, fewer defects, and lower inspection costs. Anadditional motivation, as a government supplier, was thegovernment's requirement that all its suppliers use suchperformance management principles.
Decision making authority was spread to lower levels inthe organization. Workers were recognized for theircontributions in performance management, setting the examplethat management was behind such efforts. Top management'sactive involvement in the improvement efforts was furtherdemonstrated by including the topic and efforts in theexecutive council agenda for their monthly meetings.Initially, critical work processes to be evaluated andimproved were defined by this council. Since then, otherprocesses have been added as a result of suggestions fromthe employees.
Top management has been involved in activities relatedto performance management to show their support. Funds havebeen budgeted for training, which has been provided to allperformance improvement teams. The efforts were givenpublicity through the organization's publications, whereteams were credited for their accomplishments.
A consultant was hired to train the employees in thetools, mindset, and concepts of performance management. Theplan was publicized to all personnel. Teams have alreadyimproved the data-handling process, and the employeesuggestion policy is being evaluated. Perhaps one of themost significant accomplishments has been getting employeesto work together in teams. Barriers are breaking down andcommunication improving as they understand their workprocesses and why others involved in them do the things theydo. Not all improvements were large ones, but as long asthey are aimed in the right direction they have beenwelcomed.
A critical element in the team problem solving was tofirst properly identify the process. This was done using theorganization's mission statement and process flow-charting.The urge to Jump the gun needed to be controlled. Onlyafter adequate training and thorough process definitioncould successful efforts be pursued. Using the employeesin an interactive, participative team setting has unlockedmuch potential for success.
197

Reoprts (5-8 min each) 20 min
*****Have the groups present their findings.
ApplIcation (Time permitting) 5 min- Needs for improvement in
this oroanization
What areas in need of improvement can you identify in yourorganization?
*****Ask the question above. If the group is slow torespond, prod with 'What obstacles prevent you fromfinishing all projects on time, in budget?* and 'Whatprevents your being able to satisfy the users all thetime in all projects?'
*****Comment when a list has been generated that thesethings may seem to be beyond their control, but thatthat is what a performance management framework seeksto assist in, is finding where control can be gained.
*****If time does not permit this discussion, ask the groupmembers to consider the question during the day.
198

Session 3 Importance of Commitment by Top Management
Objectives: Demonstrate that management commitment iscrucial.
Identify ways that management commitment canbe increased.
References: Case Descriptions - Design and Impl ementationof Total QuaIty _anaggment in a Civil9ngineplng 9g9dAon, by lst Lt Robert M.Wertz, 1989.- Lessons Learned from the Implementation ofTotal ua1Y Mangement at the NavalAviation DeR2t, North island, C, by JefferyAllen Warmington, 1988.- "FPL Wins the Deming Prize,* by JohnSimmons, The Journal for gpality andParticiRation, March 1990, pp 74 - 76.- *Motorola's Approach to Quality,' by RalphBarra, The Journal for Quaigty andParticipation, Volume 12, Number 1, March1989, pp 46 - 50.- A Performance Management Framework forCivil Engineering, by Robert M. Gill, 1990.
Lesson Plan: Introduction 5 min
*****Review the session objectives listed above.
*****Ask the following questions.
Who is the top management for your organization?
How critical to your work is their support?
*****If the group has trouble with this one, ask 'What arethe things that get done: what management is pushing,or what you believe to be highest priority?"
How does your management show what things they support?
*****Ask *How do they treat things they do not hold to beimportant?*
199

Case Evaluations (5 cases) 20 min
*****Announce that cases will be evaluated to observeexamples of management commitment. Divide the groupinto pairs. If there is an odd number of persons, haveone group of three. Assign one case to each team. Ifthere are less than 5 teams, do not use all the cases.If there are more than 5, assign some cases more thanonce. Instruct them to read, evaluate, and drawconclusions about the cases. Tell them to use thefollowing questions as a guide. Inform them they willgive 3-5 minute briefings of their evaluation to theentire group. Tell them they have 20 minutes to maketheir evaluations.
Questions for Case Evaluations:
How committed was top management in this case to thetask the organization was working on? How didmanagement show their level of commitment?
What would you suppose management was committed to?
How could management's commitment have been increased?Suggest some specific ways.
Who could have the possible impact cn top management toincrease their commitment? Who could convince them tomore fully support the task of the organization?
200

Case 1. 2750 CES/DEM, Wright-Patterson AFB, OH
Early in fiscal year 1989, the-Operations andMaintenance Branch of the 2750 Civil Engineering Squadronbegan a formal performance management effort. The squadronis a part of Air Force Logistics Command, which at thedirection of its Commander, was implementing Total QualityManagement principles command wide. The squadron hadestablished a quality committee, comprised of many of thetop officers and supervisors. This council was chaired bythe Deputy Base Civil Engineer, and oversaw the qualityefforts of the squadron. The Industrial Engineering Branchof the squadron had several enthusiastic and capable memberswho were eager to begin performance management effortssquadron wide.
The quality committee's job was to promote improvementwithin the organization and to determine when to formprocess action teams and which processes should be assignedfor analysis. Committee members attended team meetings onoccasion to show support and observe the activity. Thecommittee designated a large conference room for teammeetings. They further allowed team members time to meet,usually an hour per week. When a team arrived at proposedsolutions for improvements, the committee was briefed by theteam. The committee then took action on theserecommendations.
As the effort progressed, and teams which were formedhad been meeting for some time, the quality committee wasfound to provide inadequate direction to the-processimprovement efforts. One employee expressed a feeling thatwere it not for the AFLC commander's personally showinginterest and involvement, the input from the CivilEngineering Squadron's top management would be almostnothing. It was only because the Industrial EngineeringBranch advisors' efforts, covering up for lack of topsquadron support, that any successful results were obtained.
201

Case 2. Naval Aviation Depot, North Island, CA.
In 1984, management at the Naval Aviation Depot decidedto begin using performance management principles to improvetheir work processes. Initial training was slated for onlythe upper and middle management personnel. No training wasprovided for the workers and their immediate supervisors.The only training these employees received was that which waspassed down by upper management.
The top management at the depot delegated the controlof the performance management effort to a staff group, whilethe attention of top management was then diverted elsewhere.This sent the signal to the rest of the organization thatthe new improvement plans were not a top priority, and thattop management was not supporting the performance managementeffort.
Process action teams were formed throughout theorganization. In fact, the explosion in the number of newteams being formed grew too fast for upper management tosupport them effectively. Not enough planning or controlhad been established to direct the performance improvementmomentum once it had been established. In spite of theorganizational time and resources going into performancemanagement, pressure was still being applied from users ofthe depot for all the existing quotas to be met. Topmanagement was not supporting the teams by coordinating newschedules of delivery with these users, allowing the teamstime to get established.
The employees' performance appraisals were not changedto reflect the new responsibilities of the processimprovement teams. Soon the effectiveness of the effortbegan to decrease. Without support from top management fora change in emphasis for the organization, interest inworking for improvements trailed off.
202

Case 3. Florida Power and Light
In 1981, Florida Power and Light began using qualityteams to improve their delivery of electrical power to itscustomers. They achieved impressive results, being honoredinternationally by winning the Deming Prize, awarded to theorganization using performance management techniques best.The transformation at Florida Power and Light was led allthe way by its top management. The senior management team,led by the company's chairman, showed their commitment tonew ways of managing by their behavior and their decisions.
The senior management team journeyed to Tokyo, Japan,to discuss performance improvement issues with a team ofcounselors there. Most any week of the year one of theseJapanese ccunselors was likely to be found in Floridaworking with some unit of the organization. They worked toinstall a management system similar to what utilitycompanies in Japan had found successful. The systememphasized getting ideas for improvements from the workersto management and the other way around, too.
Each senior manager is assigned objectives forimprovement across several departments, to substitutecooperation for conflict. These managers made customersatisfaction their goal, and pushed this goal down throughthe levels of management in the organization.
Management decided to enter the competition for theDeming Prize as an incentive for their company to work foreven greater improvements. The organization already hadseveral years experience in performance management by thistime. Their efforts accelerated as each member, alreadyfamiliar with the performance management principles,multiplied their involvement toward this end. As a result,they accomplished in one year what it might have taken threeor four to accomplish otherwise.
Senior management was committed throughout, going toclasses, and refusing to delegate the reviews of progress,but rather performed these themselves. They had thepatience not the abandon the plan when quick results did notmaterialize. They remained dedicated to providing thetremendous investment needed to train all employees.
203

Caze 4. Motorola, Inc.
Motorola began their performance management effort in1980. They have emphasized a top-down plan and a bottom-updedication of employees to that plan. Their first step wasto form a top-management council of quality executives.This council considered how to employ their most valuableresource for performance improvement, their people.
An ambitious training program was instituted to speedup the improvement process. This included not onlyanalytical tools but quality awareness training as well. Inaddition, hiring criteria was changed to bring in morequality conscious people.
Motorola's twice-a-quarter policy and operatingcommittee meetings focusing on performance management werechaired by no less than the Chief Executive Officer of theorganization. Progress in improvement initiatives wasreviewed, and reports made by each manager of a major unitregarding the quality efforts of that unit. Successes aswell as failures are briefed. In addition, each businessunit has its own individual performance meeting, againtwice-a quarter, and again chaired by the CEO, to look inmore detail at that unit's efforts.
Performance management planning is not limited to thetop officers of the company. A program for participativemanagement encourages every employee to contributesuggestions to teams, which then make recommendations forimprovements. This fosters management support andcommunication. Managers share information, problems andopportunities with the employees, and ask for their ideas.
Management arranged for financial savings from theimprovement efforts to be shared with the employees as partof an incentive plan. In addition, CEO awards are areissued to recognize large achievements.
204

Case 5. 2750 CES/DEE, Wright-Patterson AFB, OH
At the beginning of the 1990 fiscal year, the chief ofthe Engineering Branch of the 2750 Civil EngineeringSquadron decided to use performance management in theorganization to solve a persistent problem with the designreview process. Performance management principles werechosen because of growing pressure from the Air ForceLogistics Command to see organizations turn to thesetechniques, and to process action teams, to improve workprocesses. Support was provided by an individual in theIndustrial Engineering Branch. Initial training wasprovided to all team members by this individual.
The Engineering Branch chief personally picked a teamof individuals from the branch to participate in the teamimprovement effort. The chief decided to personally be amember of the team as well. The chief's office was used formeetings, and the team members were directed to take timeout of their schedules to attend and contribute. The chiefdemonstrated by personal attendance, interest andinvolvement in the discussions of the process, thatmanagement commitment was present. Willingness toimmediately implement the recommendations of the teamfurther showed this commitment.
The chief's influence was used as needed to bring inputor attendance from representatives of other organizations tomeetings. This allowed the team to get at the root of theproblems they encountered. Memos were drafted and meetingsset up to communicate the results of the team'sinvestigation. The team members seemed to put even moreenergy into evaluating and improving the design reviewprocess after seeing their chief take such an enthusiasticinterest in the whole business.
When the team had reached their conclusions, anopportunity was arranged to brief the squadron qualitycommittee on the results. This committee was made up ofmany of the senior officers and supervisors from thesquadron. However, at the appointed time, most all themembers of the committee were tied up elsewhere, and thepresentation of results to management was of little impact.Nevertheless, the Engineering Branch chief continued to doall possible to see that the team's efforts wereimplemented.
205

Re2orts (3-5 min each) 20 min
*****Have groups present their findings.
Application 5 min- Commitment of top management
for this organization
*****Have the group discuss the following questions.
How committed is your top management to a performancemanagement framework?
How will this level of support impact your ability to usea performance management framework?
How can commitment by management be increased, if needed, ormaintained if already adequate? Who can best convince yourtop management in this regard?
208

Session 4 Management Support and Cultural Change
Objectives: Identify the support roles of management inimplementing and maintaining a PerformanceManagement Framework.
Define the concept of 'Cultural Change" andcommunicate the essential role of topmanagement in creating the change in culturefrom the top down.
Lesson Plan: Review and Introduction 3 min
*****Comment that last hour we looked at the importance ofmanagement support and ways to increase that support.Explain that this hour we will build on this basis.Review the session objectives above.
*****Work through the following structured discussion withthe group. Suggested times for each sub-heading areunderlined. Ask for practical applications, insightsand ideas of ways each point is important. Makeoverhead slides out of the student's handbook or copythe outline onto an easel pad if desired. Pause at theend of each major heading to allow response/reaction.
Management Support Roles
Provide Example 5 min
Show interest
*****Genuine interest, not just lip service.
Get involved
Encourage individual applications
*****Management by walking around is amanagement style where the boss goes tothe workplace and, without meddling,sees what his/her people are doing. Wouldthis help?
Apply the framework at the top
****Like the White House not having arecycling program while preachingenvironmental issues, often it is notwhat we say, but what we do.
207

Make visible changes
*****Show it is not business as usual.
Provide Resources 3 min
Time
*****People need to be free for training andevaluation of performance.
Space
*****For meetings.
Funds
*****To implement improvements needed.
Computer Resources
*****For tracking performance.
Support from consultants/DEI
*****For guidance and help in using the tools ofa performance management framework.
Coordinate Organization-Wide Efforts 5 min
Multi-discipline applications
*****Many improvement efforts will cut acrossfunctional and section or branch lines.Upper management coordination is needed toassure cooperation.
Planning
*****Lack of resources may constrain applications.Planning is needed to give the most promisingprojects first cut at the resources.
Assure efforts are being made
*****Upper management can track the progress ofthe improvement efforts across theorganization. If one area is not makingprogress, attention can be given to see ifadditional training or resources are needed.
208

Select processes for improvement efforts
****Management must determine which workprocesses to focus on first, and select teammembers to work each process.
Reward Results 2 min
Recognition
*****Letters, presentations, or a bulletin boardspecifically set up to bring attention tooutstanding performance management frameworkachievements.
Awards
****Any form of individual incentive awards.
Access to resources
*****Reward high achievement sections with somekind of desirable improvement project, or newsystem of some type they can use.
Cultural Change
Culture
*****Define culture as the actual guidelines which anorganization follows in doing its work. Remarkthat this will become clearer through an exercise.
Your Organization's Culture - Man from MarsPerspective 20 min
*****If a man from Mars were to invade thisorganization, and observe it, what would heconclude is the actual rules of play that arefollowed. List as many as come to mind.This is not the official organizational goalsor charter. What would this alien outsiderconclude is the real motivators of the workplace.
****If stuck, prompt with 'the squeaky wheel getsthe grease,* "put out fires," *micro-management from the top," 'short termresults.'
*****Note that this is the culture of thisorganization.
209

Unneeded cultural attributes
*****Have the group identify any of the above listwhich are not productive, or which could bechanged to be more productive. Ask how thiswould help.
Change 3 min
*****Note that in order to create a cultural change,one must first understand the present culture.Only then can one take control of the culture, andalter aspects to a more favorable environment forimprovement. Comment that there are two channelsthrough which the cultural changes must be made.
Formal Channels 3 min
*****This is the official management making andcommunicating decisions through the officialchain of command.
Make new policy
Counter old culture
*****Show that the old cultural anchors areno longer attached, that now you aremarching to the beat of a differentdrummer.
Informal Channels 4 min
*****The informal group structure can often carrymore influence with individuals than theofficial chain of command. This influence iscommunicated through group norms andapproval.
Identify informal group leaders
*****Those people who are respected and whompeople take their cues from.
Solicit their assistance
*****If brought into your camp from thebeginning, these people can be powerfulallies. If alienated or excluded fromthe beginning, these people can blockeverything you try to do.
210

Conclusion and Summary 2 min
*****Summarize the management roles.
Provide ExampleProvide ResourcesCoordinate Organization-Wide
EffortsReward Results
*****Summarize Cultural Change.
Know your organizations culture.Harness both formal and informalchannels to change this culture tobetter support the performanceimprovement effort.
211

Session 5 Teamwork and Participation Concepts
Objectives: Establish the ability of a team to do morethan the individual can in the subjectivearea of performance improvement planning.
Identify the types of groups: work areateams or multi-functional cross disciplinaryteams. Discuss the effect of group size ongroup dynamics.
Present common problems plaguing groups.Teach team members to expect them, identifythem, and correct them.
References: Group role definitions - Student's GuideAFLC Facilitator Training, 1st Edition,October I989, pp 120-121.
Conflict response strategies - Management:The Competitiye Edge, by Edmund R. Gray andLarry R. Smeltzer, 1989, pp 412-413.
Lesson Plan: Introduction 3 min
*****Remind the group that this morning, elements of theengineering environment which make it distinctive forperformance management were presented. Management'simportant role in initiating and sustaining theimprovement effort were discussed. This afternoon, thetopic will shift to the part employees and middlemanagers play in performance management framework.
*****Review the session objectives above.
Group Decision Making
Compared to Individual 12 min
****Instruct the group to identify and list some advantagesand disadvantages associated with individual and groupdecision making.
* ***When adequate advantages and disadvantages have beenlisted, ask for situational factors which would favorone approach over the other. Many of these will besuggested from the advantages and disadvantages. Someexamples are: speed, accuracy, acceptance of decisionby the organization, risk taking, and innovation.
212

*****When some situational factors have been listed, ask for
specific application opportunities in theirorganization. What are some decision opportunitieswhere factors favor one or the other, and why?
*****If the group is stuck here, suggest some decisionopportunities and ask which approach would be favoredand why? Examples are: determining which projectsshould be designed by A-E or in-house, decidingarchitectural treatment for a building, selectingperformance period for a project, determining if acontractor's question is covered by the specifications.
*****Finally, ask which method would be appropriate forperformance improvement planning. Evaluating yourorganization for areas to be improved and planningthose improvements are decisions to be made. Whatadvantages and disadvantages for team or individualdecision making can the group suggest. Summarize afterdiscussion that the complexity and importance of thedecisions indicates a team approach shows most promise.
Individual Decision Making Group Decision Making
Advantages Advantages
Disadvantages Disadvantages
Situational Factors Situational Factors
Application Opportunities Application Opportunities
Group Structure
Composition 8 min
****Explain that a functional-area group is one composedfrom members of the same job shop or work area. Themembers are the workers and their immediate supervisor.
213

When might a functional-area group be appropriate?
*****Suggest to the group that a functional-area groupshould include everyone the the shop or area. Ask thegroup why this might be important.
*****Ask the group what type of goals such a group wouldhave.
*****Ask what length of time would they meet over. Relatethis to the group goals.
*****Explain that a cross-functional group, by contrast, ismade up of representatives of each function that isinvolved in the task concerned.
When might a cross-functional group be preferred?
*****Ask the group to describe the type of individuals whoshould make up this group. Would they be the mostcapable from each section or the least? Why might youwant the best people?
*****Note that these type groups are most often formed toaddress specific problems in the way things are done.Ask what length of time they might continue mtingfor.
*****Ask the group to contrast the two groups, notingdifferences in their style and purpose.
Size 7 min
How does group size affect group effectiveness?
*****Comment that another important aspect of group decisionmaking is the group size. Ask the group to discuss theimpact of having too largea group. Too small.
****Ask the group what they think of the size of this classfor group decision making.
*****Note that organizational behaviorists suggest 6 to 12as a good range. Ask if any one can think of a classicexample of group decision making with groups this size.Prompt with Jury trial only if needed. Ask why it iscritical in that situation to get a good decision.Relate this to the importance in your organization toget good improvement effort decisions.
214

Grou2 Roles 12 min
Common Group Roles:
*****Read through the following group role descriptions.
Task Related:
Initiator - Proposes tasks or goals; defines a groupproblem; suggests a procedure or idea for solvinga problem
Seeker - Requests facts; seeks relevant informationabout group concern; asks for expressions offeelings; requests a statement or estimate;solicits expressions of value; seeks suggestionsand ideas
Giver - Offers facts; provides relevant informationabout group concern; states a belief about amatter before the group, giving suggestions andideas
Summarizer - Interprets ideas or suggestions; clears upconfusion; defines terms; indicates alternativesand issues before the group; pulls togetherrelated ideas; restates suggestions after thegroup has discussed them, offering a decision orconclusion for the group to accept or reject; asksto see if group is nearing a decision
Maintenance Related:
Harmonizer - Attempts to reconcile disagreements;reduces tension; gets people to exploredifferences
Gate Keeper - Helps keep communication channels open;facilitates the participatioi of others; suggestsprocedures that permit sha ,ing remarks
Encourager - Acts friendly, warm, and responsive toothers; indicates acceptance of others'contributions
Compromiser - Offers a compromise; admits error;modifies own ideas in interest of group cohesionor growth
215

Standard Tester - Tests whether group is satisfied withits procedures; points out explicit or implicitnorms which have been set to make them availablefor testing
Self Related:
Aggressor - Deflates the status of others; disapprovesvalues, attacks the group problem; Jokesaggressively; seeks recognition
Blocker - Tends to be negative and stubbornlyresistant; disagrees and opposes beyond reason;attempts to bring back issue after group hasrejected it; refuses to or ceases to participate
Dominator - Tries to assert authority in manipulatingthe group or certain members; flatters; asserts asuperior right to attention
Playboy - Makes a display of his/her lack of abilityand involvement in the group process; cynical ornonchalant; engages in horseplay
*****Ask the group if they think all these roles are usefulin group dynamics. Why or why not?
*****Note that these roles are not necessarily exclusive toone person, nor are persons limited to only one role.People may adopt various roles as the need arises.However, some roles begin to be expected of thecertain people
216

Conflict 8 min
*****Lead the group through the following discussion.
What are the merits and/or problems with each of thefollowing ways of dealing with conflict?
Separate the conflicting parties
Impose rules or regulations to reduce the conflict
Bring the parties together to confront the issues andwork out solutions
217

Session 6 Team Participation Exercise
Objectives: Allow the group members to work as a team.Give the individuals an opportunity toobserve group interaction techniques andproblems.
Discuss the dynamics of the group exercise.
Identify specific roles that people adopt ina group environment to facilitateperformance.
Discover the role of a facilitator for thegroup.
Reference: Participation Excercise - instructor Guide-AFLC Facilitator Training, 1st Edition,October 1989, 11-12 to 11-16.
Lesson Plan: Participation Exercise 50 min
***Have the members of the group put away their handbooksand other materials for this group exercise. Dividethe group into at least two teams, preferably with sixstuden; in each team. If there are less than six on ateam some members will need to receive more than oneclue card described below.
*****Say: Each member of your team will receive written bitsof information. These are not to be shown to others.What will bL- required of you, and how to go about it,will become clear to you as you share information witheach other through verbal communication only. When ateam feels that the required tasks have been completed,call the judge (leader) to check your results. If yourtasks have been only partially completed, or if youhave done more than required, the judge will considerthe tasks as oeing totally incomplete. The judge willnot share with you what, if anything, has beencompleted correctly.
*****Continue: The following rules will be observedthroughout this activity:
a. From the moment the team begins work, membersmay speak only to other members of their team.b. You may not show others the content of yourwritten bits of information.c. You may not write anything.d. You must obey the Judge's instru,'tions.
You will have the rest of this hour to finish the task.
218

*****Separate the teams as much as possible. Pass out thefollowing bits of information. Ask for any questions.Have them begin.
*****When a team presents their solution, compare it to theanswer. If not entirely correct, only say 'incorrect'.If correct, inform the team when to be back for thenext session.
FARMERS BITS OF INFORMATION SHEET (A)
The dog's owner lives next door to the house with the plumorchard
Hull raises albino ratsThe farmer who lives next to Pavlov drives a station wagonOnly one of the village houses is located on the east side
FARMERS BITS OF INFORMATION SHEET (B)
Pavlov's neighbor raises chimpanzeesSkinner lives next to the red brick houseThe farmer who raises dogs also grows cherriesOne of your group's tasks is to decide who drives a truckThe houses of the village are standing in a semicircle,
beside each other
FARMERS BITS OF INFORMATION SHEET (C)
Kohler grows pearsThere is a limousine in the garage of the ranch houseEach farmer raises a different kind of animalFarmer Thorndike lives next to farmer SkinnerA motorcyle stands in the back yard of the log cabin
219

FARMERS BITS OF INFORMATION SHEET (D)
The person who raises cats lives next door, to the east, ofthe house with almond trees
Your group has less than three tasksEvery week, boxes of dog food are placed at the gate of the
log cabinOnly one of the village houses is located on the West sideEach of the five farmers living in the village drives a
different kind of vehicle
FARMERS BITS OF INFORMATION SHEET (E)
The log cabin is in the most northern position of thevillage
Each farmer grows a different kind of fruitThe ranch house stands next to the cottageFarmer Thorndike drives a sports carFarmer Skinner raises pigeons
FARMERS BITS OF INFORMATION SHEET (F)
Only Skinner lives at the west end of the villageThere are albino rats in the yard of the ranch houseOne of the groups tasks is to decide who grows the applesPavlov lives in the log cabinEach farmer lives in a different typoof houseThorndike lives between the bungalow and log cabin
220

Ans wer:
Skinner drives a truck
Hull raises apples
Anything else in the solution is incorrect.
Break 10 min
Evaluation
Review Objectives 2 min
****Review the objectives at the beginning of this session
Importance of Individual'sContribution 5 min
How was this exercise similar to team decision making youmight encounter on the job?
*****Discuss this question.
*****Note that in the excercise each individual hadessential information. What if one person's input hadbeen left out?
***wAsk whose responsibility it is to see that everyonegives input.
221

Understandin& and IdentifnaRoles 28 min
*****Go through the list of roles and discuss who in eachgroup was observed to behave similarly to that role.List specific things they did.
Role Who? How?
Initiator
Seeker
Giver
Summarizer
Harmonizer
Gate Keeper
Encourager
Compromiser
Standard Tester
222

Role Who? How?
Aggressor
Blocker
Dominator
Playboy
Facilitators
Introduction 5 min
What is a facilitator?
*****Define a facilitator as an asset to the group assignedresponsibility for group dynamics, and for keeping thegrup on track and functioning effectively.
****.Ask the following question.
What actions might a facilitator take in a group decisionmaking session?
223

Resaonse to Roles 10 min
How might a facilitator respond to each of these roles?
*****Discuss how a facilitator might respond to these rolespeople adopt in a group setting. Encourage the groupto look back at the individual members of their team inthe excercise, and think how a facilitator mightrespond to improve the group effectiveness.
Initiator
Seeker
Giver
Summarizer
Harmonizer
Gate Keeper
Encourager
Compromiser
Standard Tester
224

Aggressor
Blocker
Dominator
Playboy
225

Session 7 Training Objectives and Pitfalls
Objectives: Establish the broad training goal of creatingthe cultural change needed for a successfulprogram.
Define the more specific training goals ofimparting tools for use in a performancemanagement framework.
Introduce some of the most common problemsand errors encountered in training programs.
Lesson Plan: Introduction 10 min
*****Ask what kinds of training individuals have beenthrough before in association with their jobs. Listsome.
*****Ask how useful the training was. In what ways was ituseful? What parts were not worth the effort?
*****Ask what are some elements training should include.Where should the line be drawn where further trainingis not worth the effort?
*****Review the session objectives above.
Cultural Change Training A win
What is cultural change?
*****Note that this subject was mentioned in the morning'slessons about management's role. Ask the group toreview the meaning of cultural change. Ask how it isaccomplished. Ask why is it necessary.
228

How can training be used to begin this change?
*****Ask if a Man from Mars exercise is valuable? Why orwhy not?
*****Ask if having the informal leaders give testimonialswould be effective. Why or why not?
*****Would having the squadron commander come and challengethe trainees work? Why or why not?
*****Would having someone whom everyone would think to bethe last to support such an improvement effort, in factto resist it, come and give support be a help? Why orwhy not?
*****Ask for other suggestions.
*****Ask where this training should be accomplished, and bywhom.
Where should this training be accomplished?
Specific Tools Training 10 min
*****Comment that in addition to training for culturalchange objectives, there are particular tools andspecific techniques to be understood by variousindividuals involved in a performance managementframework, such as measurement methods, evaluationtechniques. Ask:
How might training for use of specific performancemanagement framework tools differ from the cultural changetraining?
*****Ask what the objectives of this training would be. Howdetailed does this training need to be compared to thecultural change training.
*****Ask:
Who would you recommend to lead this training? Where mightthis training be accomplished?
227

Problems 15 min
*****Inform the group that now we will turn our attention tosome common problems that arise in training programs.The first is going *training happy" and steamrollingeveryone through training right away. Ask:
What problems might arise from training everyone right away?
*****Do you see any advantages to such a plan. Do you thinkthe benefits outweigh the costs. If they seem stuck,ask them to think about training they have beenthrough, and if any conclusions can be drawn.
*****Note that a related symptom is seeing the interestbecome nothing more than a slogan program. People needto be able to see real changes and commitment alongwith the talk.
What problems do you foresee from training people tooextensively, or in too much detail for their needs?
*****Describe another problem as the shotgun approach totraining. Give them everything, whether they need itor not. Ask what harm they see in this. Is itpossible to lose sight of the forest for the trees?
*****Ask if the group sees any advantages in this approach.Do they think the benefits outweigh the costs?
What problems would be associated with having no training?
*****Comment that another problem is just the opposite ofwhat we have been discussing, and that is the sink orswim method. No training is given. Ask what harm thegroup can see in this.
*****Ask for any benefits the group can think of. Ask ifthe benefits outweigh the costs.
*****Summarize and wrap up.
228

Session 8 Training Techniques and Strategies
Objectives: Identify which individuals in the EngineeringBranch should receive training. Suggest whatfactors are pertinent to choosing thesepeople.
Determine the most opportune time to providevarious degrees of training. List importantcriteria in selecting this correct time indifferent situations.
List the essential ingredients to be includedin the training curriculum. What situationalfactors might require revising theseingredients?
Lesson Plan: Introduction 3 min
*****Remind the group that last hour they looked at some ofthe objectives and problems of training. Inform themthat this hour they will have an opportunity to look inmore detail at overcoming these problems by examiningwho, what, and when to train.
****Review the lesson objectives above.
Team Project 32 min
*****Divide the group into three teams. Give a list ofquestions to be discussed to a representative from eachteam. Instruct them to generate a training plan oranswers to the questions given. Note that each teamwill have a five minute opportunity to brief theirconclusions to the group. Tell them they have 30minutes to prepare.
*****Following are the lists of questions for each team.
229

Team 1: Topic - Who to train?
Assignment - Develop a list of whom within theorganization you would train. What type oftraining (cultural change, specific tools,other) should they receive? It is notnecessary to detail the content of thetraining, just identify the overall themeproposed.
Questions to consider -
What are the criteria you use to select thepeople for each type of training?
Where there are several individuals withinthe same work area having the same jobdescription, what factors affect who you pickfor training? Or do you train them allalike? Why?
Who would you have provide the training?Why?
What specific objectives would you set foreach type of training?
230

Team 2: Topic - When to train
Assignment - Develop guidelines for when you would providetraining within your organization fordiffering types of training (cultural change,specific tools, other).
Questions to consider -
Do you want to have all the training anindividual receives provided at one time, orgive different levels of training atdifferent times? Why?
What kind of schedule of getting people eachtype of training would you follow?
What situational factors would affect yourtraining schedule guidelines? What are yourcriteria for deciding when to train?
How often, if ever, would you have refreshercourses?
What objectives would you set for each typeof training?
231

Team 3: Topic - What to train
Assignment - Develop the components that you would putinto the contents of each type (culturalchange, specific tools, other) of trainingcourse?
Questions to consider -
What things are essential for the trainees tocome away with?
Should the content be the same for everyone?Why or why not9
What important ingredients would need to beincluded in the training?
What objectives would you set for each typeof training?
232

Presentations 15 min
*****Provide each team five minutes to present their planand answer questions.
233

Session 9 Process Improvement
Objectives: Present the concepts associated with viewingorganizational activity from a processperspective.
Understand the five principal features ofprocess improvement plans.
Define cross-functional processes. Establishhow to determine the input and output whichflow between these producers and consumers.
Discuss ownership of processes. Show theimportance of assigning responsibility for aprocess to a single individual.
Communicate the necessity of extending theprocess to its origin and conclusion. Thegreatest improvements for the least expensecan often be made by thorough planning at thestart of the process.
Reference: Process improvement plans - Total QualitAssurance Through Process Management, byKenneth R. Jennings and others, 1989, 12-89.
Lesson Plan: Introduction 3 min
*****Review the lesson objectives above.
Process Perspective 7 min
Definition
** I*Define process as all activities which areperformed to accomplish a recurring organizationalobjective.
Repeatable
*****Note that to qualify as a process the proceduremust be repeatable, something that theorganization does many times.
234

Universal
*****State that all workplace activities fall into someprocess. Ask the group if they can think of anythings they do which do not fall within a process.If they suggest work on individual uniqueprojects, reply that even though the project isunlike others, the procedure followed to definethe project and solve it is a repeatable process.
Relate to big picture
*****Note that viewing the individual tasks each workerdoes as a part of a larger process helps createthe process perspective.
Building blocks of performance
**** Ask the group to what degree organizationalperformance depends on how well each of theirprocesses are accomplished? If they do well oneach of the processes, will they necessarily dowell overall? Why or why not?
Key to improvement
*****Ask the group to describe the usefulness of aprocess perspective on the work they do withregard to identifying opportunities forimprovement.
*****Note that many opportunities for improvement existat the communication interfaces between steps inthese processes.
235

Process Improvement Plans 15 min
Definition
****Explain that the first step in process improvementis understanding the structure and steps of theprocess. Explain the diagram below by pointingout the the process begins at the point someexternal supplier provides input. It continuesuntil some output is provided to a user. Alongthe way are all the individual steps of theprocess which must be accomplished to transformthe input to output.
*****Ask the group if this kind of model would apply tothe processes that make up their work. Do theyhave suppliers and users or customers? Why or whynot?
Suppliers Activity Steps Users
Input ------ > Transformation --- > Output
*****Ask the group how they would go about identifyingthe activity steps that they perform in thisprocess.
Simplification
*****To simplify the process, see if any of theactivity steps are repetitive or can beeliminated. Ask the group how this step alonemight improve their work processes. What wouldthe results be?
Measurement
**** Explain that specifications are used formeasurement. The input and output crossingboundaries between processes or steps within thesame process are compared to a standard or averagespecification. Ask the group to describe howthese variations from specifications might beused to better understand the process and theopportunities for improvement within the process.
*****What kinds of things might be measured in theorganization's work processes? Point out thatthese are the factors which can be improved.
236

Control
*****Explain that the control step is to determinewhere and what controls the factors measured ineach step of the process. How might these controlpoints be found? What tools could be used to aidthis task?
Improvement
Identify Opportunities
*****Note that once the process is defined andsimplified, and the variable factors withinit are measured and their points of controlidentified, the opportunities for improvement
* can be determined. List these opportunitiesfor each step of the process.
Cause and Effect Planning
*****Remark that a useful tool in establishing thecauses and potential solutions for problemsis the cause and effect technique. The useof this tool will be discussed in more detaillater. Its use results in discovering themost likely causes for problems in theprocess.
Action
**Once the caus ! for problems have been listedfor the improvement opportunity, actions toimplement a solution need to be arrived at.Ask the group to list important things toconsider when proposing an action?
*****If these questions are not answered in thediscussion, bring them up: How is the bestof the solution alternatives selected? Whois responsible to see the action through?How should this responsibility be delegated?How might essential resources be secured?Should a deadline be set? Who can approvethe action?
237

Cross-functional Processes 10 min
*****Note that the subject of multi-functional issues inorganizations has been discussed before in this course.Now we will look specifically at the issue of multi- orcross-functional processes.
Functional interdependence
*****Ask the group to describe considerations whicharise when one independent functional group withinan organization depends on another in its work.
Input
*****Define input in this context as the product orinformation that one function requires for itswork. Ask the group to discuss difficulties thatfunctional areas sometimes have in obtaining theinput they need.
Output
*****Define output as the product or information thatone function issues as a result of its work. Askthe group to list some of the impacts the functioncan have on other functions through its deliveryof this output.
Coordination
*****Comment that you think the group will agree thatcoordination between functions with input-outputrelationships is essential to the performance ofthe organization. Ask the group to suggestreasons why this coordination is often sodifficult and in many cases does not get done.
*****If the group has not suggested this after somediscussion, note that often this coordinationbetween functions is lost because the functionsare not in the same chain of command.
*****Ask the group what the result of breakdown incoordination of this type might be.
*****Ask if this means no one is responsible for seeingthat the process proceeds. Note that the fact oflife is that someone is always responsible.
238

Process Ownership 5 min
Responsibility
*****Ask the group who it is who is usually heldresponsible.
*****Comment that the person most knowledgable aboutthe process, or who controls the largest portionof the process, will naturally be the person tomake responsible for the process. This person iscalled the process *owner. (If discussiondevelops that someone in a higher supervisory roleis responsible, just note that carried to theextreme the organization chief is ultimatelyresponsible for all the processes, but thatresponsibility is delegated to the person whoactually does the work as being mostknowledgable.)
Authority
*****Note that the owner will often not have authorityover some of the other functional areas which workon the process. Ask the group to discuss problemsthis presents.
Pride
*****Ask the group how 'pride of ownership" cancontribute to owners efforts to see that theprocesses for which they are responsible runsmoothly, and are improved.
239

Process Extension 10 min
Downstream
*****Downstream extension is pushing the processdescription to include steps further toward theend user or conclusion of the process. Ask thegroup to suggest why this might increaseunderstanding of the process. How would thisassist in determining the impacts of steps takenearlier in the process?
Upstream
*****Define upstream extension as pushing the processdefinition to include steps further toward theconception and development of the needs whichrequire the process. Ask the group to suggest whythis might offer potential for improvements inorganizational performance.
*****Note that often the greatest improvements for theleast cost can be made at early stages in theprocess. Relatively few resources have beencommitted and small improvements will bemultiplied many times over when carried throughthe whole process. Ask the group who it is whomakes the decisions regarding conception anddevelopment of needa at these early stages in theprocess. Ask the group how these decision makersmight make better decisions in the long run.
Difficulties
*****Ask the group if it seems futile to extend the.7c.c3s upqtpre-7. to consider these criticaldevelopmental decisions, when often thesedecisions are out of control of the process owner.
*****Note that often it is difficult because no onereally knows how these decisions are made, and ittakes a lot of digging to find out. Ask the groupif this digging would be worthwhile. Why or whynot?
240

Session 10 Process Flow Exercise
Objectives: To allow the group to identify a process in amulti-functional environment. The processinterfaces will be determined, along with theinput and output passed between thesefunctions.
Lesson Plan: Introduction 3 min
*****Review that last hour we looked at the processperspective, how to view work activities as they fitinto the bigger picture of processes.
*****This hour we will take a familiar example from everydayexperience and see how to detail the process.
*****Review the lesson objectives above.
Process Excercise
Introduction 2 min
*****Announce that the process to be considered is gettingyour body out of bed in the morning and getting it towork. Elaborate that this is a typical day, there iswork to be done, no sneaking off to the golf course orthe tennis courts, it's out of bed and to work.
g Flow Di agraming 1min
*****Have the group list the steps in getting to work.Write them down with plenty of room to fit stepssuggested later in between earlier ones. Take yourtime. Get all the details. Show some enthusiasm asneeded to get the group rolling.
Cross-functional aspects
Function Identification 6 min
*****Ask the group to identify functional areas within thisprocess. Note that even though for the most part alloperations are performed by yourself, consider yourselfto be performing different functions as makes sense.
.****Have the group describe the interfaces between thesefunctional areas. What is the input-output passingfrom one to another?
241

Input Identification 6 min
*****Ask the group to consider the process they haveidentified and note where input is needed from outsidethe process. What is this input and who provides it?
Output Identification 6 min
*****Have the group consider the process they haveidentified and note where output is issued out of theprocess. What is this output? Who is it provided to?How does it impact the process?
Ownership 2 min
*****Ask who is the owner of this process? What does thismean?
Extension 10 min
*****Ask the group to extend the process even further up anddownstream, if possible. Ask what decisions, factors,or occurances impact the process from the lead orupstream end.
*****Ask the group to describe the effect on overallperformance that a small change made at the upstreamend could produce.
242

Session 11 Process Flow-charting
Objectives: To provide further experience in describingthe underlying processes comprising theworkplace.
Materials: Standard job descriptions or occupationalinstructions for a programmer, a designengineer, and an construction inspector atyour base.
Lesson Plan: Introduction 5 min
*****Tell the group that this hour they will have anopportunity to apply the process identification toolswe have learned to situations they are familiar with,but are a bit more realistic for a work situation.
*****Review the lesson objectives above.
*****Assign and distribute the three Job descriptions ascases, one to each person, so there are an equivalentnumber of people for each case. Explain they shouldread the case and pay attention to the processes theycan identify. They will have a chance to discuss thedetails shortly. Tell them they have five minutes toacquaint themselves with their cases.
Read Cases 5 min
Panel Discussion 36 min
*****Have a team of members who all read the same caseassemble at the front of the room. Inform them thatthis is a panel discussion type forum. They are torespond to the questions given. Interaction andalternate opinions by other panel members areencouraged. Ask for a volunteer from the panel tovolunteer to summarize the case. Move through thequestions as the panel is ready, or as time requires.Each panel has twelve minutes. Suggested times foreach question are given. When one team is done,repeat the panel procedure with each of the otherteams.
243

Summarize the case. 2 min
Describe the processes evident in the case. List the stepswhich comprise these processes.
3 min
Which separate functional units are interfaced with in eachprocess?
2 min
Who is the process owner? Over which steps in the processdoes the owner have personal authority?
2 Mi n
What are elements of input and output evident in theseprocesses?
3 min
Conclusion 4 min
*****Ask and discuss:
How can defining the process in work situations assist inmanaging and improving the organization's performance?
*****Tell the group that the rest of the afternoon we willlook at the definition of performance and how tomeasure various aspects of performance.
244

Session 12 Definition of Performance & CustomerSatisfaction
Objectives: List and define the seven components ofperformance. Discuss which are mostappropriate for the Engineering Branch.
Understand the important role of customer oruser satisfaction in improving performance.Identify who customers are of the EngineeringBranch.
Reference: Planning and Measurement in Your Organizationof the Future, by D. Scott Sink and ThomasC. Tuttle, 1989, ppl7l-186.
Lesson Plan: Introduction 5 min
*****Review the lesson objectives above.
*****List and briefly define the seven components ofperformance. Tell the group these are the componentsof performance we will be discussing.
Effectiveness - How well you get the job doneEfficiency - How well you utilize your resourcesProductivity - The ratio of output to inputQuality - The degree to which your processes are
accomplished wellInnovation - Your creative improvement ideasQuality of Work Life - The attractiveness of the
workplaceBudgetability - How well you meet your resource
constraints
Performance Component Definition
*****For each comj7onent, give the operational definition.
*****Ask the group for applications within theirorganization. When several have been suggested, askthe group if they agree that each is a correctapplication of the component. Why or why not?
*****Ask in what ways the group feels that component isimportant in defining their performance.
*****Have the group members refer to the performancecomponent diagram at the end of the lesson as neededwith each component to assure an understanding of themeanings.
245

Performance Components
Effectiveness 4 min
Operational Definition -
*****The ratio of actual output to expectedoutput. This is an cutput side component.
Possible applications -
How important is this as a component ofperformance?
Efficiency 4 min
Operational Definition -
*****The ratio of expected input to actual input.1his is an input side component.
Possible applications -
How important is this as a component ofperformance?
246

Productivity 4 min
Operational Definition -
*****The ratio of output to input in the sameunits.
Possible applications -
How important is this as a component ofperformance?
Quality 4 min
Operational Definition -
*****The degree to which each step of the process,and the process as a whole, operatescorrectly.
Possible applications -
How important is this as a component ofperformance?
247

Innovation 4 min
Operational Definition -
*****An index of the creative process of changingto respond to new pressures, opportunities,and threats.
Possible applications -
How important is this as a component ofperformance?
Quality of Work Life 4 min
Operational Definition -
**w**The reaction of the organization's personnelto the work environment, including factorssuch as pay, leadership, autonomy,involvement, and relationships.
Possible applications -
How important is this as a component ofperformance?
248

Budgetability 4 min
Operational Definition -
*****The relationship of budgets and goals withactual costs and accomplishments. Thiscomponent is comparable to profitability in aprivate organization.
Possible applications -
How important is this as a component ofperformance?
*****Note that there is a diagram at the end of the lessonshowing the process model and its relation to theseseven performance components. Have the students flipto the diagram and ask if there are any questions.
Component Importance 2 min
*****Ask:
Effectiveness and quality have been suggested as the twocompone:its most critical to the performance of a civilengineering organization. The other components depend onthese two. Do you agree? Why might you think this to bethe case9
Customer Satisfaction
*****Note that several of the above components ofperformance are concerned with the user's attitudetoward the organization's output. To borrow a term fromthe commercial world, customer satisfaction is animportant perspective for any organization.
249

Importance of Customers 5 min
*****Ask:
Why is customer satisfaction important to the EngineeringBranch?
*****Why should you care what they think?
*****If you have designed a good air conditioning system orparking lot, what concern should you have with theuser's satisfaction?
Identification of Customers 10 min
*****Ask:
Who are customers of the Engineering Branch?
*****Elaborate that we are not interested just in otherorganizations C.E. builds and maintains facilities for.Who are the organizations that use the products theEngineering Branch produces?
*****If base contracting and contractors themselves have notbeen mentioned after some discussion, ask: Can youconsider contracting a customer? Can you consider thecontractors who bid and build your projects ascustomers?
*****Ask:
How does the Engineering Branch serve each of thesecustome,s? How can they be better served?
250

PERFORMANCE COMPONENT DIAGRAM
--------------- Budgetability------------
------- Productivity--------
Innovation
USER ---- INPUT -- TRANSFORMATION -- OUTPUT --- USERNEED * SATISFACTION
Quality of
* Work Life
Efficiency Effectiveness
----------- Quality
Note: The definitions and diagram for the performancecomponents presented in this lesson are based onthose proposed by D. Scott Sink and Thomas C.Tuttle in their book Planning and Measurement iny mr Qrganiz411n t 1bg Eul- , Norcross,Georgia: Industrial Engineering and ManagementPress, 1989.
251

Session 13 Application of Performance Components
Objectives: Apply the components of performance to theEngineering Branch environment. Suggestelements of performance which could betargeted for evaluation and improvement undera performance management framework.
Lesson Plan: Introduction 5 min
*****Recap the performance components from last lesson.Remind the group that customer satisfaction is animportant perspective for engineers.
*****Review the lesson objectives above.
Paired aRR!ication analysis 25 min
*****Divide the group into pairs, making a team of three ifthere is an odd number. Remind the group that in lasthour's discussion potential applications for each ofthe components of performance were briefly discussed.Now your task will be to consider Just one of these inmore detail. Assign the components to teams, one perteam, in the following order: effectiveness, quality,efficiency, productivity, budgetability, innovation,and quality of work life. Tell them their assignmentis in their handbook. They have 25 minutes. Then eachpair will present their conclusions to the group.
Critically analyze one of the components of performance inits application in your organization.
k.4t is a reasonable operational definition of this aspectof performance? How can it be measured or evaluated in yourorganization?
Suggest how this would allow managers to track performanceV and determine where improvement is possible. How would the
improvement be recognized and reported?
Presentations 20 min
*****Have each pair present their conclusions, 3 - 5 minutesper pair.
252

Session 14 Implementation Details
Objectives: Outline the steps involved in a top-downimplementation of a Performance ManagementFramework.
Illustrate the technique of using a pilotproject to initiate the program.
Describe the importance of the facilitator tothe operation of the team function.
Lesson Plan: Introduction 3 min
*****Review the objectives.
*****Announce that now that we have spent the last two daysdiscussing the tools and outlook needed to use thePerformance Management Framework, it is time to pullthese ideas together and see how they are used toimprove the work in an organization.
Paired individual analys s 25 min
*****Divide the group into teams of two. Assign one of the
five main topics to each group. Have them consider theindividual issues under each topic, and prepare tobrief the class according to the following instruction.Tell them they have 20 - 25 minutes to prepare theirpresentations, and then each team will have 3 - 5minutes to present. If there are insufficient teams tocover all five topics, combine first Managementdirection with Management support, second Team processdefinition with Team improvement efforts.
Describe how the following need to be addressed within thecontext of the Performance Management Framework in order topromota successful improvement efforts.
Management direction
Strategic planning
Identification of principal processes comprising work
Selection of process as pilot project for firstimprovement effort
Selection of process for next team improvement effort
253

Management support
Assignment of members to the team
Training decisions
Selection of a facilitator to assist team
Team process definition
Steps
Input and output
Ownership
Interfaces
Team improvement efforts
Identify problems
Propose solutions
Recommend actions
Who responsible
Schedule and milestones
How to measure for success
Management implementation
Screen implementation actions
Support implementation actions selected
Reward efforts
Presentations 20 min
*****Have teams take turns presenting their conclusions,allowing 3 - 5 minutes per team.
Conclusion 2 min
*****Inform the group that they should now have a completepicture of how to go about conducting the PerformanceManagement Framework in an organization. Announce thatfor the rest of the morning they will have a chance togo through these steps in an exercise environment.
254

Session 15 Implementation Exercise
Objectives: Provide a situation in which members canexperience implementation of the PerformanceManagement Framework.
Discuss the lessons learned and how theymight be applied to the programimplementation in the Engineering BranchEnvironment.
Materials: Several dozen 8-1/2 x 11 sheets card stock orother heavy construction paper (buff color isfine), masking tape, unsharpened pencils,typing paper, scisss,,, 12 inch scales,drafting triangles.
Lesson Plan: Introduction 5 min
*****Tell the group that the rest of the morning will be aworkshop exercise to practice the principles of thePerformance Management Framework. They will have achance to look at a situation from both a managementand worker perspective.
Exercise
Situation 30 min
*****Read the following description of the situation.
You are an engineering branch comprised of three sections,programming, design, and construction management. Due tothe limited scope of this exercise, construction managementwill actually do the construction called for in theexercise. Your task is to program, design and build theitems identified.
255

Part of this task requires costing of labor and materials to
be used. Costs are:
Line Item Cost
Whole sheets of construction paper $10 / sheet
Unsharpened pencils 8 5 / each
Tape S 1 / inch
Labor by builder $ 2 / minute
Note that sheets of paper are charged as whole sheets, evenif only a portion is used. The left over cannot be used onanother project. Tape cannot be used in shorter than oneinch pieces. Pencils cannot be broken.
*****Divide the group into teams of 3 - 6 people. Withineach team, 1 or 2 people will become programmers, 1 or2 will be designers, and 1 or 2 will be constructionmanagement. Each set will perform the same exercisebelow. Inform all members that one project is designcomplete and has been on the shelf, but Just gotfunded. Give a copy of this to all the constructionmanagement people. One project is programmed, awaitingdesign. Give a copy of this to the designers. Thereis a pile of projects waiting to be programmed. Give acopy of these to the programmers.
**** Give a copy of the following written instructions tothe programmers, designers, and construction managers.Only give the appropriate instructions to each member.For instance, the designers would get the designerinstructions but not the programmer or constructionmanager instructions.
*****Ask for questions. Tell them to begin.
256

*****As programming submits cost estimates for approval,compare to the following list. If the cost is equal to
or less than the list, simply reply *approved.* If it
exceeds the list, simply reply "too much, disapproved.*Do not tell them how close they came in either case.
Item Ceiling Cost
Block $ 44Pyramid 55Container 85Airplane 30Birdhouse 75Box 90Buggy 60
*****At the 5 minute mark, go to the programmers and say, 'Ihave a change in the container, it needs to have 2compartments with 15 square inches in each, and stillhave 4 compartments with 4 square inches in each.* Donot tell the programmer, but this will raise theceiling cost above to 8 105.
*****At the 10 minute mark, go the the designer, ask how thebox is coming. If they have not seen it yet, complainthat you needed it yesterday for the Wing Commander.Remind the designer that it is high priority, and whyis he/she working on anything else. Also tell thedesigner that you have a change in the pyramid. Youneed a square hole just big enough for a pencil to fitthrough half way up in the center of 2 opposite sides.This may require reprogramming.
*****At the 15 minute mark, go to the programmer and saythere is a change on the birdhouse. It now needs aweathervane on top, mounted on a pencil. Ask for a newcost including this change. If under 0 85, approve.
*****At the 20 minute mark, go to design and ask about thebox again. Remind of its importance. Go to theprogrammer and say that the airplane just got hot andis now high priority. Expedite.
*****At 25 minutes, go to design and say that the airplaneneeds to be able to carry three 2 inch square piecesof paper, otherwise the same requirements as before.
257

Instructions for Programmers
You have been given a stack of user requests. Your Job isto determine a cost estimate for the project, line by lineand total, per the unit costs provided in your handbook.You must then get this cost approved by the class leader,who will compare the cost to the limits of availablefunding.
Then pass the sheet describing the user request,along with this cost estimate, which becomes the programmedamount, to design. If you are two people working togetheras programmers, work together on one project at a time.
From time to time, design may come to you asking for achange in programmed amount. You may do this by submittinga new cost estimate to the class leader for approval.
Instructions for design
You are to prepare written instructions with sketches anddrawings as needed to describe to construction how to makethe item. Prepare a detailed cost estimate corresponding toyour design. Deep within the cost set by programming+/- 10%. If this is not possible, go to programming and askfor a change in programmed amount. You do not have tofollow their line items, just compare to the total.
Pass the design instructions, sketches, drawings on toconstruction, but not the users list of requirements. Giveconstruction a lump sum cost estimate. Construction willquit work when they reach this cost.
From time to time construction may come to you needing achange order. You must provide direction as needed andapprove the extra cost or savings for the change, based onthe change in materials and labor. The constructionmanagement persons time continues to run during this time,and must be included in the total cost. There is also a $Icharge for each change to cover administrative overhead.The resulting total cost must still be within the programmedamount tolerance as above.
Try to keep construction busy all the time, but recognizethat once they have started a project, they cannot stopuntil it is done or cancelled due to no funds to continue.This is your call. You may cancel a project if you see nofeasible way to continue. But then it can not be restarted.
258

Instructions for construction management
Use the materials to construct the items according to thedesign provided. Keep track of your time and materials oneach project. Quit work when you reach this cost. if thishappens, or if the design is too vague, or contradictsitself, or does not work, go back to design for aclarification change order. Your time continues to runagainst the project during this time. Assist design inunderstanding the problem even suggesting a solution if itis apparent.
Once you have started a project, you may not quit until itis finished or design informs you that the project iscancelled.
259

This project is design complete. Give to construction.
Item: Block
Lump Sum Cost: 37
Design
2 2"
3 : 2: 1 :23"
2
4" 2" 4" 2"
Cut the shape shown out of an 8-1/2 x 11 sheet ofconstruction paper. Fold on the four dotted lines betweenthe rectangle marked 1 and the rectangles marked 2. Make 90degree folds so that the four rectangles marked 2 come up tobe the sides of a box while the rectangle marked 1 rests onthe table. Now tape the corn- joints together where therectangles marked 2 now touch each other. Use 2' pieces oftape positioned to completely seal the joint. Now fold onthe dotted line between the one rectangle marked 2 and there.ztangle marked 3. Make a 90 degree fold so that therectangle marked 3 becomes the top of the box. Completelyseal the three joints created between the rectangle marked 3and the other rectangles marked 2 with tape. For thispurpose, two pieces of tape will be 4 in length and 1 piecewill be 3" in length. Position the tape so the entire jointis sealed.
260

This is the cost estimate for the block, which is designcomplete. Give this to design. Construction has the design.
Paper I sheet 0 10 = S 10Tape 21 inch 0 1 = 21Labor 3 minutes 0 2 = 6
Total S 37
This is the user request and programmer's cost estimate forthe block.
Item: Block
Need: A block of six sides, two of which have at least 6square inches, two have 8 square inches or more,and two have at least 12 square inches. All seamsare to be completely sealed.
Priority: moderate
Programmer's Estimate:
Paper 1 sheet 0 10 = S 10Tape 18 inch 0 1 = 18Labor 3 minutes 0 2 6
Programmed Amount 8 36
261

This is the user request and programmer's estimate for thepyramid, which is programmed awaiting design. Give this todesign.
Item: Pyramid
Need: A pyramid with a square base of 64 square inchesand 4 triangular sides sloping in toward a point.The point shall be at least 5 inch tall. A singlepencil is to project through the point vertically,with one end resting on the base of the pyramid.The joints do not need to be completely sealed.
Priority: High
Programmer's Cost estimate:
Paper 2 sheets * 10 = $ 20Tape 12 inches 0 1 = 12Pencil 1 each 0 5 5Labor 5 minutes 0 2 = 10
Programmed Amount $ 47
262

Item: Container
Need: One tray with 5 compartments, open on top but withcompartments otherwise completely separated, withthe joints sealed, from the others. Onecompartment shall have a minimum of a I' squareinch bottom. The other four compartments shallhave a minimum of a 2 square inch bottom. Eachcompartment's sides will be as tall as the longestside dimension of that compartment. The outersides of the tray will be no shorter than thetallest sides to any one compartment.
Priority: Moderate
263

Item: Airplane
Need: A paper airplane which will fly at least ten feetwhen thrown. It must be able to carry cargo ofthree 2" x 1" squares of paper. These pieces ofcargo must fit entirely within a cargo area inthe airplane so that they are completely out ofview, without touching each other. When the planeimpacts after its flight, the cargo must not beejected or exposed to view. They may not be tapedin directly.
Priority: Low
264

Item: Birdhouse
Need: A birdhouse with four vertical sides, each seveninches high, minimum. A sloped roof and a floor,minimum 16 square inches, are required. Each sidewill have a hole big enough fop a bird the size ofyour thumb to go in and out. Just under the holewill be a perch extending at least two inches outfrom the side.
Priority: High
265

Item: Box
Need: A box with a lid. When the lid is in place., thebox must contain 250 cubic inches. The lid of thebox is to have handles to lift it off. Thehand.Es are to be penctl6. The pencil3 are tostick out at each of the four corners of the lidat least 1' at each corner. Joints do not need tobe completely sealed.
Priority: High
266

Item: Buggy
Need: An enclosed cabin with 60 cubic inches space. Atwo inch square door in each side with a one inchsquare window elsewhere on each of the two sides.Four wheels, mounted on two axles, supporting thecabin to a height at least two inches off theground. Axles must not penetrate the cabin.
Priority: Low
267

Management Initiation 15 min
*****Stop the situation exercise. Settle the group down alltogether again. Tell them they are now a managementteam. They want to use this Performance ManagementFramework. Tell them they have 15 minutes as a groupto accomplish the steps needed for management toinitiate the framework. They need to select who willbe on the team (hypothetically, in actuality they willall participate on the team.). They need to choose aprocess for the team to work on. They need to select afacilitator for the team. They need to decide whattraining is needed: who, what, when, where and how.Ask for questions and get them started.
Break 10 min
*****Stop the group for a break.
Team Time ' 25 min
*****Inform the group that they are now the team selected bymanagement to study the process selected in the lastmeeting. They have received the training decided upon.Ask who was selected to be the facilitator. Tell thegroup that the facilitator will now lead a team meetingthrough defining the process, extending it, determiningits owner, listing input and output, and to beginidentifying problems at each stage of the process. Usebrainstorming techniques. Tell them they have 25minutes, and to structure their time to be getting toproblem listing by then. Invite the facilitator tocome to the front and lead the meeting. Ask for anyquestions and let them start.
Team Time 2 25 min
*****Stop the previous meeting. Determine their progress.Tell them to pick up the pace or slow down for moredetail, depending if they are behind or ahead ofstarting to list problems. Ask the facilitator to picka new facilitator. Tell them they again have 25minutes, and should finish the problem listing andcontinue into solution generation. Invite the newfacilitator to come to the front and lead the meeting.Ask for any questions and let them start.
Break 10 min
*****Interrupt and give them a 10 minute break.
268

Team Time 3 25 min
*****Have the facilitator pick a new facilitator. Tell them
this is the last 25 minute team time. They need to
finish proposing solutions and make specific actionrecommendations. Who would be responsible? How wouldthe effect be measured to see if improvement resulted?Invite the new facilitator to the front of the room.Ask for any questions and let them begin.
Man~geenjt Imn lmentation 10 min
*****Tell the group they have now gone through the stepsneeded in their organizational setting to arrive atactions to improve problems in their work processes.Tell them they are now management again. You have theactions recommended. You can only pick two because offunding constraints. Choose them. Decide how toreward the team for their efforts.
Debrief 15 mmn
*****Lead the group through a discussion of the followingquestions.
What was the hardest part of the Performance ManagementFramework exercise? Why?
What was the easiest part? Why?
What surprised you the most in working through thePerformance Management Framework?
Where do you see the greatest hindrance in doing this inyour actual work? How can this hindrance by overcome?
What advantages and benefits do you think can be achieved byusing the Performance Management Framework in yourorganization?
269

Session 16 Measurement Exercise
Objectives: Understand the importance of measurement inevaluating and improving performance.
List reasons for measuring.
Define what to measure as the products whichpass between steps in the process, frominternal suppliers to internal customers.
Examine a method for analyzing variancebetween these steps.
Lesson Plan: Introduction 3 min
***.*Review the objectives.
*****Note that the topic of measurement is not given muchemphasis in the engineering community because it is sodifficult to measure what is done. We will look atsome tools to make this Job easier.
Measurement
Importance 3 min
Why is measurement important in evaluating and improvingperformance in your organization?
*****Note that experts on measurement systems claim that youcannot manage what you do not measure. Why might thisbe true?
Reasons for 4 min
What uses can you see for measurement of your performance?How can it help managers understand, control and improve thework of the organization?
*****Ask the questions above. Get several peoples Ideas.
Variance 2 min
What is variance? What is the relationship of variance andmeasurement?
*****Define variance as the difference to a standard oraverage for some factor of a process. Ask the secondquestion above.
270
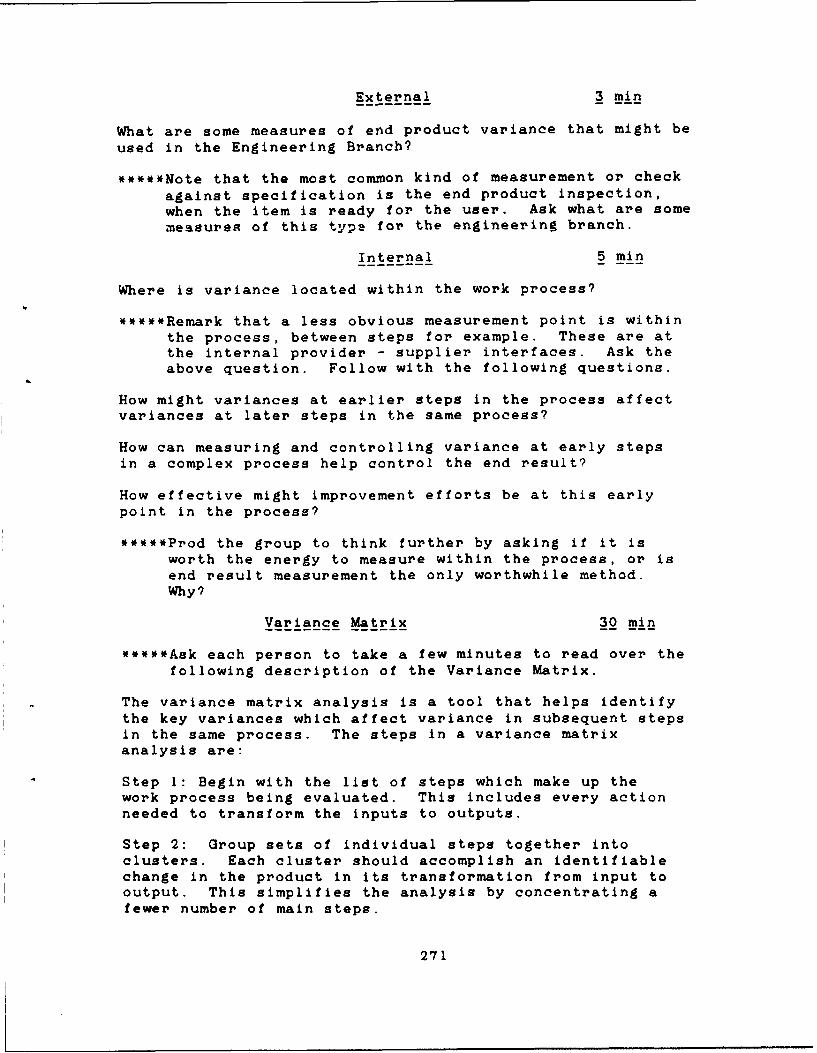
External 3 min
What are some measures of end product variance that might be
used in the Engineering Branch?
*****Note that the most common kind of measurement or checkagainst specification is the end product inspection,when the item is ready for the user. Ask what are somemeasures of this typs for the engineering branch.
Internal 5 min
Where is variance located within the work process?
*****Remark that a less obvious measurement point is withinthe process, between steps for example. These are atthe internal provider - supplier interfaces. Ask theabove question. Follow with the following questions.
How might variances at earlier steps in the process affectvariances at later steps in the same process?
How can measuring and controlling variance at early stepsin a complex process help control the end result?
How effective might improvement efforts be at this earlypoint in the process?
*****Prod the group to think further by asking if it isworth the energy to measure within the process, or isend result measurement the only worthwhile method.Why?
Variance Matrix 30 min
***W*Ask each person to take a few minutes to read over thefollowing description of the Variance Matrix.
The variance matrix analysis is a tool that helps identifythe key variances which affect variance in subsequent stepsin the same process. The steps in a variance matrixanalysis are:
Step 1: Begin with the list of steps which make up thework process being evaluated. This includes every actionneeded to transform the inputs to outputs.
Step 2: Group sets of individual steps together intoclusters. Each cluster should accomplish an identifiablechange in the product in its transformation from input tooutput. This simplifies the analysis by concentrating afewer number of main steps.
271

Step 3: Identify all possible sources of variance in eachstep. These are the causes of the work not conforming tothe standard or norm set for it.
Step 4: List variances in order of how they might occur inthe process, matching each to the corresponding major stepin the process.
Step 5: Identify upstream variances that impact orinterfere with the control of downstream variances. Avariance matrix is used for this purpose. Check eachvariance against all downstream variances listed beneath it.If a variance impedes control of a downstream variance, amark is made.
Step 6: Locate key variances, those which impede controlover several downstream variances. The degree of impact thevariance has directly on cost and quality is alsoconsidered.
Step 7: Establish the factors which are important incontrolling these key variances.
*****Note that there are likely to be questions about whatwas just read, but to hold them because now we willwork through ai. example that should clear a lot up.Questions will be answered after that.
Example analysis using the variance matrix.
The process is the operation of a machine which assemblesham and cheese sandwiches.
N*****This simple process is making ham sandwiches. Steps 1and 2 in the Variance Matrix analysis are illustratedbelow. The d'etailed steps in the process are listed onthe right, and are grouped into major steps as shown onthe left.
Clustered Major Ste 2 s Actual Ste2s
Prepare Bread Replenish bread and mustardFill machinesSort bread onto assembly tray
Add ham Get container of hamSlice hamPosition ham on bread
272

Add cheese Get container of cheeseSlice cheesePosition cheese on ham
Insert lettuce Cut lettuceRemove lumpy lettucePosition Lettuce on cheese
Finish sandwich Obtain bread for topPosition bread on lettuceCut sandwich
Package sandwich Insert sandwich in machineInsert cardboard slipPrepare labels
273

*****Steps 3 and 4 in the Variance Matrix analysis areillustrated below. Individual variances weredetermined and then listed, clustered with the majorstep they correspond to, which are listed across thetop. Refer, for example, to the major step *insertlettuce". The variances 14 and 15 can be seen listedunder this step. Similarly, the variances for eachstep are listed beginning under the appropriate step,and in order of potential occurrence.
The Variance Matrix
Prepare Add Add Insert Finish PackageBread Ham Cheese Lettuce Sandwich Sandwich
1 Bread soggyx2 Edges curledxx3 Bread crooked
4 Bottleneck5 Ham too warm6 Slices too thick7 Ham shredded8 Ham spoiled
x 9 Ham crooked10 Cheese Moldy11 Cheese unwrapped
x 12 Slices stuck togetherx 13 Cheese crooked
14 Lettuce lumpy15 Lettuce wet
16 Run out of top slices17 Slices wrong size
x x x 18 Top not levelxx x x x x19 Cut quality
x xx x x 20 Package qualxx x x x x x xxx x21 Too bigx x x x x xx xxx xx22 Not sealed
23 Bad label
X X X X XX X X Key Var.
*****Steps 5 and 6 in the Variance Matrix analysis are alsoillustrated above. For each variance, beginning withnumber 1, the list below that variance was scanned forany variances which might be affected by the precedingvariance. Such relationships were marked with an "x'.For example, note that variance 15 was determined topossibly affect variances 20 and 22, while variance 16had no effect on subsequent variances. The keyvariances were then selected, and noted with a "X" atthe bottom row. These were selected because of theirmultiplied effect on other variances or because on
274

their own they were important enough to be called a keyvariance.
*****Step 7, not illustrated above, would then be todetermine factors which control the behavior of the keyvariances.
*****Ask for any questions.
*****Note that this information would then be used to helpdetermine which opportunities in the process are mostsuited to improvement efforts.
n Cz

Session 17 Cause and Effect of Measurement
Objectives: Understand the importance of measurement, andthe components of an effective measurementsystem.
Reference: The cause and effect technique is adaptedfrom DOD 5000.51-0, Total Quality ManaemntA Guide for Imlementation, dated 15 Feb 89.
Lesson Plan: Introduction 3 min
*****Read session objectives above.
*****Explain that the cause and effect technique is avaluable tool not only for measurement, but to takeapart any situation and analyze the components andrelationships, to understand them better.
Cause and Effect Technigue 17 min
*****Ask the group to take a few minutes to read over thefollowing description.
Major Cause Major Cause> : -- -- --
Minor MinorCauses Causes
- ------------------------------------- >Result
> ResultMinor * Minor
Causes i Causes
Major Cause Major Cause
What: Represents the relationship between an effect(problem or result) and its potential causes.
Why: The diagram is drawn to sort and relate theinteractions among the factors affecting the result.
273

How: 1. Name the problem
2. Decide the major categories of causes. majorcauses may include: data and information systems,dollars, environment, hardware and equipment,materials, measurements, methods, people, andtraining.
****Note that the four most common major causesused are machines, methods, people issues,and materials. These four, in manysituations, provide the guidance andstructure needed to determine the causes.
3. Brainstorm for more detailed causes.
4. Eliminate causes that do not apply.
5. Discuss the remaining causes and decide which aremost important.
6. Work on most important causes.
7. Eliminate or control causes.
*****Note that each branch can have as many levels ofsub-branches as desired. For instance, for the effectof being late to work, a factor on the machine majorcause branch might be the alarm clock did not sound. Afurther sub-branch might be that the power went off. Afurther sub-branch might be that the power bill had notbeen paid.
*****Ask for questions. Refer questions to the group to seeif someone else present can answer them. If there areno questions, challenge the group by asking them howthey would start such an exercise. What kind of effectmight they choose to look for causes of?
277

Cause and Effect of Measurement 30 min
Cause and Effect Analysis for an Effective MeasurementSystem
*****Note that this analysis will be a variation on thecustomary cause and effect technique. Usually theeffect examined is a problem the organization is tryingto improve by discovering the causes. Here we willassign the effect to be a desirable outcome.
*****Ask for a volunteer to come and record the causeqbrainstormed by the group on a pad or overhead. Tellthe group to come up with major causes and factorsrelated to these causes for the given effect. What isneeded for an organization to have an effectivemeasurement system. Ask for any questions. Have thembegin.
Effective- ------------------------------------->Measurement
System
*****If the group seems stuck, prompt specific nauses suchas 'what factors do we need in our people, what must
278

be true of our people to have an effective measurementsystem.* Use similar questions for other major causes,o- questions to prompt sub-branching from causes theyhave already listed, to flesh out the causes.
279

Session 18 Objectives Matrix
Objectives: Demonstrate a technique to summarize non-related measures into a composite score.
Describe the distinction between product,process and surrogate measures, and theadvantages of each.
Introduction 7 min
*****Review the objectives listed above.
*****Ask - How many of you have ever bought or sold a usedcar? What factors do you look at to determine a fairprice?
*****After some factors have been listed, ask - Whichfactors are the most important?
*****Tell them what they have done in these cases isaggregate different factors into one index - price.You had to decide which factors were most important andwhat they were worth. This same method can be usedto evaluate the work you do in your organizationthrough a tool called an objectives matrix. Before welook at how to use the objectives matrix, we will lookat some of the different types of measures that areuseful in evaluating performance and aggregating intoan objectives matrix.
Types of Measures 8 min
*****Read through the following definitions. Then read theexample that follows the definitions.
Product Measures - Actual attributes of item ready for user
Process Measures - How product was attained
Surrogate Measures - Reflect actual attributes
*****Relate this example. Suppose the factor we want tomeasure is completeness of a design submittal from anA-E. What you would like to measure is the number ofmistakes and the number of missing elements in thedesign and specifications. This would be a product
280

measure. However, to measure this is virtuallyimpossible. The number of mistakes often cannot bedetermined until the project gets into construction andsome contractor is actually trying to build what iscalled for. Some other measure is needed.
*****Continue. Another possibility is to measure the timespent checking the drawings for errors and omissions.This is a process measure. It does not measure thecompleteness of the design itself, but the effort theorganization uses to complete the design. The thoughtis that the more time spent checking the drawings, themore errors will be caught. Clearly, the time spentchecking drawings is easier to measure than the actualnumber of errors and omissions. But as a processmeasure, it is not as trustworthy as the productmeasure.
*****Continue. Another alternative is to have the chief ofdesign check the submittal and count the comments he orshe comes up with. This is a surrogate measure. Theidea is that the chief will spot gome percentage of theactual errors and omissions, which will give anestimate of how complete the design actually is. Thismeasure is much easier to achieve than the productmeasure. However, the surrogate measure is not astrustworthy as the product measure, becausnot all theerrors are caught, just the ones the chief sees.
*****Ask for questions. Then proceed to the followingquestions.
What are the advantages and disadvantages of each9
What precautions are needed when using process and surrogatemeasures? How can you check their validity?
281

Objectives Matrix Worksheet 25 min
*****Inform the group that now we will examine theobjectives matrix as a way to combine various measuresinto a single index of performance. Instruct the groupto work through the worksheet in their handbooks. Askthem to consider the measures listed and think aboutwhat type the measures are: product, process, orsurrogate. Tell them that they can work individuallyor in twos or threes if desired. Tell them they have25 minutes.
282

Objectives Matrix Worksheet
The following steps make up the objectives matrix analysis.
1. Establish Key Performance Areas (KPAs)2. Determine Key Performance Indicators (KPIs)3. Generate transformation curves4. Assign relative weights5. Compute performance index
1. Establish KPAs
KPAs are those performance components that are consideredimportant to the organization's success. Usually these aredetermined by management or reflect the policies andobjectives set by management. For example, the designbranch may have the following as its KPAs.
Quality of the transformation processEfficiency of manpower useEffectiveness in the form of timelinessQuality perceived by the userQuality of the drawings and specificationsProductivity
2. Determine KPIs
Next a measurable characteristic must be found for each of theseKPAs. These must be accurate, quantifiable, andrepresentative of the performance component being measured.For example, UPIs for Lhe KPAs above might be:
Efficiency Direct Productive Manhours/Total Manhours
Effectiveness 0 Value Late Projects x Days LateQuality of product * Errors found by design chief at
100% completeQuality to user User Survey Response, scaled 1 - 10
Post-DesignQuality to user User Survey Response, scaled 1 - 10
Post-ConstructionQuality of process Total S Change Orders/Total $
ContractsProductivity 0 Value Designed/Manhours Used
3. Generate transformation curves
This is the principal distinctive of the objectives matrixanalysis. The dissimilar performance indicator measures areconverted into similar ten point index scores. These scorescan then be combined as a weighted average into an overallperformance index. The transformation curve is created
283

individually for each KPI by first determining the anchorvalues, and then filling in the intermediate values. Theanchor values include the zero and ten values on the index.Additionally, the value for three or five is fixed tofurther anchor the index. For example, the KPI for qualityof process, the ratio of change orders, would be anchored asfollows.
Index Value of KPI measureValue
Zero .5 (If change orders total half of theproject cost, award no points)
Five .12 (Anchor the midpoint at the historicalmean of 12%)
Ten 0.0 (The best possible is no change orders,award full points)
Then fill in the rest of the scale. This can be done in anycombination of linear or curved relationships as seemsappropriate for the measure. Graph the relationship ifdesired to make the function more understandable.
Quality of Process Index KPI
10 10 0.09 .028 .04
* 7 .065* 6 .09
5* 5 .12* 4 .16
* 3 .212 .281 .37
00 5
0 .1 .2 .3 .4 .5
284

Now, fil in the values for the rest of the KPItransformation curves. Anchor values have been provided.Graph the values if desired. Use any curved or linearrelationships desired to fill in the values.
Index Effic. Effect. Quality Quality Prod.to user product
10 >.75 0 10 0 298765 .4 3200 5 5 143210 0 >100000 0 10 <.5
4. Assign weights
The next step is to weight each of the KPIs so they can becombined into a weighted average. The sum of the weightsmust be one. Give more weight to the KPIs which arebelieved to be most important, and which are believed to bemost valid. For instance, in the list above, the value ofchange orders is an important measure of how accurate thedesign is. It is also a highly valid measure because thecost of change orders can be accurately determined. ThisKPI should be weighted more heavily. On the other hand, thepost-design user survey is not as important. The users oftencannot Judge accurately the quality of the design; they donot have the expertise. This XPI should not be weighted asheavily. You be the Judge on the others. Fill in theweights below.
285

KPI Weight
Total $ Change Orders/Total SContracts
Direct Productive Manhours/Total Manhours
S Value Late Projects x Days LateUser Survey Response, scaled 1 - 10
Post-DesignUser Survey Response, scaled 1 - 10
Post-Construction# Errors found by design chief at
100% complete$ Value Designed/Manhours Used
Sum 1.00
5. Compute Performance Index
Finally, the performance index can be calculated. This isdone be measuring the performance for each KPI. The measureis converted into an integer score between zero and tenusing the transformation curve. These scores are thenaveraged into the performance index using the weights. Thisprocedure is made easy using a table, below.
KPA Proc Effec Userl ProdyEffic Prodt User2 Score
Raw Value .17
Transformation 0 >.75 0 10 10 0 2 10Curves .02 9
.04 8
.065 7
.09 6
.12 .4 3200 5 5 5 1 5
.16 4
.21 3
.28 2
.37 1
.5 0 >100000 0 0 10 <.5 0
Score 4
Weight
WeightedScore
Performance Index
286

Compute the performance index for the following measuredKPIs.
quality of PROCess .17EFFICiency .66EFFECtiveness 5000quality to USER1
post-design 6quality to USER2
post-construction 3quality of PRODucT 8PRODuctivitY 1.25
Fill in your transformation curve values from earlier in theworksheet. Use the same values for USER1 and USER2. Fillin your weights for the KPIs in the appropriate place in thetable. Enter each raw value on the appropriate line nearthe top of the table. Find the value on your transformationcurve which most closely matches that value. Record thisvalue on the line given. Multiply each score by its weightto obtain the weighted score. Sum these weighted scores andrecord the result at the bottom of the table as yourperformance index. This number should be between zero andten. The closer to ten, the better overall performance foryour organization.
Conclusion
This objectives matrix can be used with any measuresappropriate for your organization. It allows you to quicklydetermine an overall ranking for your organization for thetime period studied. This can allow management to track theorganizations performance over time and make recommendationsfor improvements as needed.
287

Discussion 1Q min
*****Ask the following questions. Encourage as many membersof the group to contribute as possible. Let themdiscuss the issues and arrive at an understanding ofthese measures.
What type was each measure, process, product or surrogate?Why?
How might a manager use such a combined index?
How would such an index be useful specifically forimprovement?
*****Tell them the course is over now. Thank them for theirattendance and contributions. Express your hope thatthey have found it seful.
288

Appendix D. Meeting Summaries and Notes
This appendix contains the weekly meeting summaries and
notes applicable to the case analysis. Each entry has the
date of the meeting and a summary of what was accomplished.
Each entry then contains the notes of observations made by
the researcher of any phenomenon occurring in that meeting of
interest to the subject of a performance management
framework.
At the conclusion of each entry are some suggestions of
subjects that the observations pertain to. These subject
suggestions were made as a help to subsequent efforts by the
researcher to assimilate the information into a usable
framework. The common thoughts from this framework were
then compared to the subjects generated in the literature
review to obtain consistent conclusions.
These entries follow the meetings required to work
through the problem solving routine (process diagram,
problem identification, solution proposals, implementation
actions, method of measurement) for the Corps of Engineers
Design Review process. The team then proceeded to the other
processes, but the experiences gained on this first process
attacked are sufficient grounds for analysis and conclusions
in this case.
289

Date: 02 Nov 89
Summary of meeting:
This was the initial meeting of the process action team.Training was provided for the group in problem solvingtechniques and a strategy for generating ideas forimprovements. This training was comprised of a rapidsynopsis of the Quality & Producti vit Team Process Manual(QMT-082), prepared by Professor Virgil Rehg and publishedby AFIT/LSQ (Rehg, 1988). The training was administered bya representative of the industrial engineering branch of thesquadron. This individual explained that in most cases moredetailed training is offered to groups, consuming an hour ormore of group time before beginning any actual work. Inthis case the training was limited to twenty minutes. Therational given by the trainer was that the group consistedof scientifically trained and capable people, who couldproceed with the tasks with this minimal training.
The team decided on the goal of their efforts in the comingweeks, and set their direction. The team then brainstormedto list the steps in three design review processes: Corps ofEngineers, O&M A/E, and O&M In-house.
Notes:
My observation is that the training was too rushed. Theprocedure and techniques presented were not explained insufficient detail to be of much use to the group. The groupcould have benefited from additional time spent in trainingand orientation.
The team proceeded without difficulty through the processidentification. Major steps in the processes were listed.The team was not sidetracked to any degree by discussing thesteps. The resulting process flow diagrams will provide auseful framework for problem solving. See Appendix E forthese flow diagrams.
Subjects:
TrainingImplementationProcess TechniqueEngineering DistinctivesGoal of Improvement
290

Date: 09 Nov 89
Summary of meeting:
The processes diagramed in the previous meeting werereviewed. A forth process, the ASD design, was added anddiagramed.
The problems in the Corps of Engineers (COE) Design Reviewprocess were brainstormed from the beginning step, designerselected, to the distribute design step.
Notes:
The team identified a number of problems in these steps.Discussion was held to an acceptable minimum. At timespotential solutions were obvious and were mentioned alongwith the problems. The solutions were not discussed indetail, just noted for future reference during the solutionphase of the teams work.
Subjects:
ParticipationProcess Techniques
291

Date: 30 Nov 89
Summary of meeting:
The team identified problems in the COE process from thecollect step through the end 90% review step. The teamagreed to go back through the COE process to begin proposingsolutions to the problems previously identified from thedesigner selected through submittal arrives steps. Itemswere combined as appropriate and prioritized.
Notes:
The team proceeded rapidly through the process. Problemstatements were kept short and to the point. Tangentialdiscussions did not occur to detract from the business athand. Enthusiasm is high, the team is really getting intoit. A thorough understanding of the COE process is beingobtained through examining the problems.
The work area supervisorho is a member of the team and theboss of all the other members was not present at thismeeting. There seemed to be some hesitancy among themembers present about which way to proceed or how far to gowithout the boss present. Encouragement and direction wereneeded from the facilitator to keep focused.
Subjects:
ParticipationCulture changeFacilitator
292

Date: 07 Dec 89
Summary of meeting:
Discussed the submittal arrives and submittal levels issues.A team member took the action item to check with someone tobetter understand the MCP timing requirements (driven bywhen items are required in congress). The team found moreproblems coming to mind as solutions were discussed. Littleheadway was made.
A representative of the Air Base Wing Quality Councilattended the meeting as an observer.
Notes:
The team found that they did not understand this step in theprocess. The list of problems brainstormed at an earliermeeting did not begin to cover the scope of difficulties.It was somewhat discouraging to the team to make so littleprogress, especially after the previous meeting had seen somuch accomplished. It seems not enough time was spentwrestling with the problems and encouraging the members toexplore them in detail at the earlier meeting. While it wasgood that the problems came out here, it derailed thesolution generation effort.
The team was proud but also seemed to be somewhatintimidated by the Quality Council guest's presence. Theyshowed the guest a lively meeting.
Subjects:
ImplementationParticipationManagement Commitment
293

Date: 04 Jan 90
Summary of meeting:
The team discussed the final problem areas of when thesubmittal arrives. More involvement in the review process bythe COE area office was suggested. The discussion moved tothe distribution procedures. Solutions were proposed tothe problems previously identified in this step. At thispoint the discussion got off subject and onto the O&MIn-house procedures.
Notes:
The team continued to struggle with an incomplete list ofproblems from the earlier meetings. Perhaps it is just thatat the earlier time the team was not warmed up and was notthinking analytically enough. Time was spent again in thismeeting discovering new problems, when the team hadpreviously decided that the problem list was complete andmoved onto solutions. Perhaps the scope of this firstprocess for the team was too large and complex. The teamperhaps was not prepared for the need to examine their workin detail unlike they were used to.
This was the first meeting back after a four week layoff dueto the holidays. The effect of this layoff was that theteam was slow to recall where they had gotten to before.They were somewhat slow too in regaining their momentum andanalytical thinking. But by the second half of the meetingthey were in full swing again. A better review of pastaccomplishments and an agenda for the current session by thefacilitator might have speeded this recovery.
Subjects:
Management Direction - Selection of processImplementationFacilitatorParticipation
294

Date: 11 Jan 90
Summary of meeting:
The 2750 Air Base Wing quality day was announced as 29 Jan.The team was invited to a photo session in preparation forthat event.
The team brainstormed solutions to the COE problems. Thesteps addressed were the collect step through the send to HQstep.
A plan to invite a 2750 ABW/COMM representative to the nextmeeting to discuss "How to Justify/request the assignment ofa communications engineer to WPAFB" was made.
Notes:
The supervisor of the engineering branch has been directlyinvolved in the process action team meetings, where theremaining participants are all subordinate to thissupervisor. The supervisor has been open-minded and non-judgmental. This has seemed to encourage the otherparticipants to speak out freely about problems they faceand difficulties they have in solving them. They appeareager to tell the supervisor things he does not know abouthow bad the situation often is. He in turn frequentlyexpresses disbelief at what his people have had to put upwith. This encourages the other participants to speak outeven more frankly, seeing that their comments are notfalling on deaf ears.
My observation is that the supervisors participationregularly in the team's work has been positive. Informationhas been brought out in the group meetings which may neverhave been revealed had not the atmosphere of interest, andwillingness to make the changes proposed, been establishedby the supervisor.
Subjects:
Management Direction - Selection of team
295

Date: 18 Jan 90
Summary of meeting:
The team arranged for two representatives of the area Corpsof Engineers office to attend. Questions were allowed bothways to better understand each others work. Problems thatthe team had previously identified which dealt with theinterface with COE were referred to and discussed.
Notes:
The COE representatives were visibly impressed with theteams work and open-minded attitude. They were put on thespot to answer pointed questions. They too were unsure howthe base used some of their input. The result was that agreater understanding of each others problems and reasonsfor doing things was gained. In addition, mutual respectwas increased by seeing the competence of 'the other guys.Several agreements were reached to establish bettercommunication and to make changes within the authority levelof those present to improve the interface.
This was an important expansion of the process framework byincluding the agency who is the upstream provider of thedesign submittals as well as the downstream customer for thebase's output of comments. A new appreciation of the scopeof the process was attained. It could not have been donewithout management inviting the representatives.
Subjects:
Process ExtensionImplementationManagement Support
296

Date: 25 Jan 90
Summary of meeting:
Solutions were proposed to problems identified earlier inthe 90% complete step of the COE process. The solutionphase was completed with this step.
The team agreed to proceed now into the actions to implementthe solutions, and who would be responsible for each action.Since management was present in the meeting (one member wasthe supervisor for the COE process) no further approval bymanagement was needed. Actions were detailed for thesolutions in the first step of the process, designerselected.
Some of the implementation actions took the simple form of aletter to an outside agency describing the position of theEngineering Branch on the issues.
Notes:
The team was relieved and encouraged to reach this milestonein the problem solving routine. They had been nearly twomonths on the solution phase. Finally it was starting tocome together. The team chose not to address themeasurement techniques for the actions at this time.Getting the actions detailed and assigned was enough.Measurement would follow.
The sometimes fuzzy ideas which had been the solutions beganto make much more sense when converted into actions forimplementation.
Subjects:
Management Support - ImplementationMeasurementImplementationParticipation
297

Date: 01 Feb 90
Summary of meeting:
The contents of the letters to the COE describing theEngineering Branch's position on issues were reviewed.Implementation plans for the submittal arrives step werebegun. A member of the team was assigned the task ofestablishing a plan room for review. This was anaction considered to be worthy of immediate implementation.
Notes:
The team was thrilled to recommend the plan room forimmediate implementation. It was a concrete example thattheir efforts did make a difference.
The primary facilitator for the process action team observedin this research had no formal training as a facilitator. Atrained facilitator, a member of the industrial engineeringbranch, attended most of the meetings in an advisorycapacity. This person answered questions which were raisedabout techniques and procedures for the team's operations.However, the conduct of the team meetings themselves wereleft to the untrained primary facilitator. The purpose ofthis assignment was to afford experience for this individualto *learn on the job" how to facilitate a group.
My observation is that this did not seriously injure theability of the group to operate effectively. The groupconsisted of technically and scientifically trained people,aware of problem solving techniques. They did not appear toneed much guidance.
On the other hand, the format of the meetings was quitepredictable and routine. Could a trained facilitator haveprovided variety and innovative methods for generatinginteraction and information? Would such methods have led tobetter performance by the group? Or, were the resultsaccomplished as good as any which may have been achievedthrough other techniques?
Subjects:
FacilitatorsImplementationParticipation
298

Date: 08 Feb 90
Summary of meeting:
The subject of the plan room location was discussed. Theteam decided to put the decision on hold until management ofthe Engineering Branch can gather more information.
The team was informed of a memo from a staff engineer fromthe Operations and Maintenance Branch regarding their reviewprocess.
Actions to implement solutions from the submittal arrives
step were determined and assigned.
Notes:
The team is not afraid to assign implementation actions toother responsible individuals within the organization.While many of the actions are accepted by team members,others are assigned out. Having the management supervisorpresent assures that these items will not be forgotten.
Another important milestone was realized by furtherextending the process to the Operations and Maintenancecustomer interface. By receiving the memo, the team came toa greater understanding of their process. This also showedthat the team's work was having an effect throughout theorganization; others were feeling inclined to become a part.The team recognized the time had come to start publicizingsome of their accomplishments.
Subjects:
Management Support - ImplementationCulture ChangeImplementation
299

Date: 15 Feb 90
Summary of meeting:
Actions to implement solutions for the distribute step inthe COE process were detailed. In particular, a newprocedure for managing COE designs was beginning to emerge.The team detailed these new steps and realized they werecreating a new position description for a person to manageCorps of Engineers projects.
A guest attended the team meeting for the third week in arow. The guest was a member of one of the sections in theEngineering Branch.
Notes-
The maturity and flexibility of the team was demonstrated atthis point by their acceptance of a new attendee at theirmeetings. No one appeared to feel threatened, and theguest's input was listened to and accepted.
This guest came uninvited, apparently hearing of theaccomplishments of the team and wanting to be a part. Thisis testimony of the interest the team was beginning todevelop by this time.
Many of the actions detailed for implementation covered avariety of the solution ideas which were brainstormedearlier in the problem solving routine. The linkage ofthese actions with the solutions they implemented was kept,so that a statement could be made to management regardingwhat actions implemented which solutions and ultimatelywhich problems were the cause.
Subjects:
ParticipationCulture ChangeMeasurement - Sell Management
300

Date: 22 Feb 90
Summary of meeting:
The detailing of actions to implement solutions to problemsin the COE process was completed, with the steps of collectthrough 90% review being discussed.
Notes:
At times the feathers started flying as implementationactions proposed hit close to home and the members presenttried to justify their past way of doing things and began towonder what the actions proposed might require and how wellthey might work. A peacekeeping role by the facilitator wasrequired to soothe these worries and get the meeting back ontrack and off the arguments.
Everyone breathed a sigh of relief as the implementationaction phase of the problem solving routine was completed.And with it was an appreciation for all that had beenaccomplished.
Subjects:
ParticipationFacilitator
301

Date: 01 Mar 90
Summary of meeting:
A summary list of the processes, problems, solutions, andimplementation actions was distributed. The list wasreviewed. The list was evaluated in light of a recentannouncement that with the breakup of the AFRCE function, anew COE Milcon Execution Plan will be developed. This meanssome of the exact implementation actions are no longeruseful because they were designed to change the old system.However, it was pointed out that the work of the team willmake a fine foundation to the preparation of the newExecution plan.
Notes:
Instead of changing the old system, the work of the teamcould now be used to build a new system. This was somethingof a mixed blessing. Having just created theirimplementation actions, the team would have been encouragedto see them put into effect and make the changes. So therewas some disappointment. However, as the weight of theopportunity to build the new system from scratch sunk in,the team could recognize the significant steps already takento make sure the new plan worked better than the old.
Subjects:
Management DirectionParticipation
302

Date: 08 Mar 90
Summary of meeting:
The team brainstormed measures of success for the actionsthey had previously proposed. Individual action measureswere determined, and how to gather the informationdiscussed. In addition, an overall goal measure of reducingchange orders was proposed as the bottom line gauge ofsuccess.
Notes:
The overall goal and measure of success came up here, at theend of the problem solving routine. It might have been moreeffective to have been established from the beginning, sothat the team would have been constantly aiming at it.
With the measures established, and the responsibility forimplementations assigned in the previous phase, the problemsolving routine was complete for the Corps of Engineersdesign review process.
Subjects:
MeasurementImplementationGoal of Improvement
303

Appendix E. Process Flow Diagrams
Corps of Engineers
Designer SelectedContract Set
Submittal Arrives(10%) ,30%, (60%) ,90%
Distribute Per List
Collect, Compile, Filter Comments
Send to HeadquartersDesign Review Meeting
Repeat from "Submittal Arrives' Until90% Submittal Level Is Reached
End
Figure 35. Corps of Engineers Design Review Process
304

O & M Architect/Engineer
Designer SelectedContract Set
Assign Task
Submittal Arrives10%,35%,90%,100%
Distribute Per List
Collect, Compile, Filter Comments
Send to Architect/EngineerDesign Review Meeting
Repeat from 'Submittal Arrives* Until100% Submittal Level Is Reached
90% Pre-final Review Distribution by DEEE
End
Figure 36. 0 & M Architect/Engineer Design Review Process
305

0 & M In-House
Designer or Team Selected
Prepare 35% Cost EstimateCompare to Programmed Amount
If Cost Unacceptable, Reprogram
90% Pre-final Review Distribution by DEEE
Compile Comments
Forward to Engineer to Use or Respond To
End
Figure 37. 0 & M In-house Design Review Process
306

ASD Architect/Engineer
Submittal Arrives
Distribute Per List
Collect, Compile, Filter Comments
Send to ASD
Repeat from 'Submittal Arrives* Until95% Submittal Level Is Reached
Receive AFLC 95% Comments
Receive Complete Documents for Contracting
End
Figure 38. ASD Architect/Engineer Design Review Process
307

A2fendix F. Design Review ProcessProblems, Solutions, Agtigng and MgAgjr
This appendix contains a summary of the brainstorming
sessions of the performance improvement team as they studied
the design review process. The team first identified the
problems in each step of the Corps of Engineers design
review process. They then proposed solutions to these
problems. Finally, actions were recommended to implement
these solutions and measures of success proposed.
The steps in the Corps of Engineers design review process,
together with three other processes the team identified, are
outlined in Appendix E. For ease of reference, the
problems, solutions, actions, and measures are consolidated
for each step of the process. This allows the reader to see
how the problems in a step were solved. However, the
procedure the team followed to generate this information was
not as shown. Rather, the team first identified problems in
all of the Corps of Engineers process steps together. Next
solutions were proposed to all the problems in the entire
process. Actions were then detailed to implement the
solutions. Finally, measures were proposed to track the
actions.
308

As of: 14 Mar 90
DESIGN REVIEW PROCESS "PAT"
Corp-of-Engineer (COE) Design Review
I. Designer Selection Step
A. Problem Areas
1. Since no input requested from base, get stuckwith A-E (sometimes bad).
2. AE selected from Cincinnati/Kentucky, too far.
B. 3olutions
1. Input from base
a. Get someone on committee (TDY).b. Get to review candidates or makerecommendations.
c. Provide comments from previous AE designs.d.. Learn the COE selections process.e. If COE selection procedure includes locationfactor, use WPAFB as optimal location, notLouisville. If not, have them include it.f. Contract requires ample site visits by A-Efor predesign verification.
C. Implementation Actions
1. In letter 1 to HQ AFLC with a copy to COE:a. Request support for a base representative toattend final selection committee and participateas a voting member. Member will communicatebase evaluation of A-E's to selection committee.
b. Request that COE be instructed to notifybase of top candidates from A-E pre selectioncommittee when known.
2. Include in 01 for DEEED project mgrs.:
a. To bring base evaluation of A-E's to finalselection committee for briefing.
309

b. When design instruction is issued, projectmanager will send letter 3 to COE and allreviewing agencies, informing of base CE POC.
NOTE: Above actions superceded by the MILCONProject Management Plan (MPMP). WPAFB will correctthis problem area by participating in thedevelopment and implementation of the MPMP.
OPR: DEEP ECD: Set by MAJCOM
3. Budget funds for project managers to attend
final selection committee.
OPR: DEE ECD: Each 01 Oct
D. Measuring Progress/Success.
1. Percent of Final Selection Committee meetingsattended each FY with a goal of 100%.
OPR: DEEED for tracking goal percent ECD: Ongoing
II. Submittal Arrives Process Step:
A. Problem Areas
1. Routed through COE, time is lost.
2. Not enough copies.
3. Don't see project after 95% comments.
4. Submittal levels may not be appropriate (ie: 10%for scope, 90% for tech review, are 30% and 60%needed)
5. Too many separate voices giving direction to AE.
6. AE relies on us for QC and to catch mistakeswhich slows down submittal timing requirements.
7. COE const. representative on-base is not activeenough in design review.
B. Solutions
1. Include survey notes in early submittal, andother predesign investigation info (soil logs,utilities)
310

2. In lieu of current 35% submittal, request a 10%submittal to include such as structural, electrical,mechanical systems, suggested floor plan, and siteplan, and site investigation results.
3. Changed to 20%, not at 50%. Clearly outlinewhat's required to get uniformity. 10% could bepresentation with alternatives.
4. Get more dollars released for 1st submittal.
5. 60% added by COE as needed for large projects.
6. 10, 35, 90% submittals are needed and need to bewell defined (checklist).
7. 100% needed before contracting starts to makelast check of comments.
8. Number of copies/route through COE.
9. Decide how many needed and get into DI (5).
10. Establish consistent distribution channel.
11. Locate plan review room that is a consistentplace, that can be reserved for 1-2 days. Everyonehas their own place now.
12. Be informed of overall design schedule. Have itincluded in submittal from A-E.
13. For 100% submittal, get on distribution listwith time to comment before contract start.
14. Have drawing control log on cover sheet ofdrawings showing-who should get review sets.
15. Since too many voices, minimize list of peoplewho see submittals to review. All comments shouldgo through COE project manager as lone voice to A-E.
18. Need opportunity to discuss and defend comments,prior to project manager and deleting.
17. Instruct A-E to go back and arbitrate deletedcomments.
18. Have mandatory design review meeting wheredeleted comments are identified and discussed.
311

19. A-E using AF for QC
a. Get tough with A-E.Hold responsible for their mistakes.
b. Return inferior submittals without review anddemand reworked submittal.
c. Withhold payment for inferior submittals.
d. Make sure A-E is given adequate time to
design, so they have time to do Job right.
20. COE design rep on base.
a. COE develop position (deputy?) to beresponsible for design review on base.
b. Have COE design engineer assigned to basefor project duration during construction(especially when AFRCE dissolved).
C. Implementations Actions
1. Send letter 2 to COE, copy to AFRCE
a. Detail what base wants to see in submittals,particularly evidence of site investigation(survey notes, etc.) in early submittals. Sendsubmittal requirement description from O&Mprojects.
b. Emphasize to COE nppd -,e' exterzivr earlydesign work.
a. Inform COE of new procedure for base to sendletter 3.
d. Ask that COE have design schedule included infirst submittal by A-E.
e. Ask that COE have A-E include distributionlist for review sets on cover sheet.
f. Ask that COE send copy of 100% submittal tobase immediately upon receipt from A-E for baseto check critical items.
2. In letter 3, base project mgr will detail whatsubmittals are desired for the project. Includethis in 0.1.
312

3. Submit work requests for plan room.
OPR: DEE ECD: 01 Mar 90
4. Letter 3 is to include an invitation toreviewing agencies such as user, EM, Comm, DEF, DEM,Safety, DEEC, etc., to comment to DEEED PM. Includethis in 0.1.
OPR: ECD:
S. Inform COE in letter 2 that base needs designreview meeting on each project for chance to defendbase comment which HQ AFLC or AFRCE have deleted, at60% or 90% as a minimum as appropriate
OIR: ECD:
6. Include in DEEED Project Mgr 0.1.:
a. PM to keep track of comments made from base,and resolve conflicts or elevate to higherauthority as needed to get results.
b. PM to Inspect each newly received submittalfor completeness against requirements forsubmittal level. If deficient, a letter will besent to HQ AFLC complaining, and suggestingpayment be withheld.
NOTE: Except for action 3, all of the above actionswill be satisfied through the development andimplementation of the MPMP. Item l.f. can bedeleted.
OPR: ECD!
7. In letter 2, request COE assign design rep tobase.
NOTE: Delete, since this will be addressed when theAFRCE is disbanded.
III. Distribute Design Documents/Drawings Step
A. Problem Areas
1. Are the right people on the list? (ie: makesure COE const. staff included).
2. User gets design package last.
313

3. Personnel changes at user, changes scope.
4. Local COE office comments only at 90%.
B. Solutions
1. Create design review position in DEEC (Rightpeople on list?)
2. Have yearly review by mgt of who is on list andupdate accordingly.
3. Have design review room and send letters toreview if interested.
4. Include DEE and DEEE for comments.
5. Develop user design checklist to make sureconsideration is given (CID, disruption, equipmentby user, scope, get copies from A-E's).
6. Add checklist to user review letter.
7. To compensate for user personnel changes andscope change, establish consistent POC at otheragencies for review.
8. Insure programming/1391 is complete and up-to-date.
C. Implementation Actions
1. Add DEE and DEEE to distribution list forreview. Combine current DEEE and DEEED distribution1istl. Submit revised list to the PAT for review.
OPR: DEEE ECD: 01 Apr 90
2. Add to DEEE 0.1. and DEEED 0.1.:
a. All project review to be distributed from andmonitored by DEEE. DEEED will pass submittalsto DEEE to place in plan room and send lettersto reviewing agencies. DEEE to add user reviewchecklist to letter going to user.
OPR: DEEED ECD: 15 Apr 90
314

3. Develop user review checklist, to prompt themwhat to look for, scope, phasing, operations and.maintenance, C.I.D. For at least, the initial go-around, request that users provide checklistevaluation/improvement comments.
OPR: DEEED ECD: 15 Apr 90
4. In letter 3, ask all reviewing agencies toidentify their POC and alternate. Attach Form 1391for project to letter to alert reviewers to scope ofproject. Add this to 0.1. for DEEED PM.
NOTE: Incorporate implementation action 4 above inMPMP.
D. Measuring Progress
1. For implementation actions C.2 and C.3 above,evaluate checklist comments provided by users.Incorporate improvements as feasible.
IV. Collect, Compile, Filter Step
A. Problem Areas
1. Sometimes send comments after suspense.
2. Some base comments deleted by HQ with nofeedback or explanation.
3. No DEEC reviewer assigned; inspectbr notassigned until contract start.
4. COMM organization comments normally late.
5. COMM engineering at Griffis (485 EIG) not givingadequate support, so wiring/splicing not gettinginto contract.
6. DEM review of elec, HVAC, etc. not getting tostaff engineers (focal point).
B. Solutions
1. Since base comments deleted at HQ, make a rulingthat comments cannot be rejected w/o contactingcommentor.
2. Ensure that every COE review has review meetingwhere deleted comments can be defended.
315

3. Since COMM design occurs at Griffiss AFB, - needto get Griffiss involved in timely manner.
4. Get COMM engineer assigned to base COMM. or getCOMM engineer in DEE to preclude lateactions/comments.
5. Since comments sent after suspense, need adesign review meeting and review room/area.
6. To get DEEC inspector/reviewer involved from thestart, send design to DEEC for review of each step.
7. Assign DEEC person to project for review andfollow on construction at start of the project.
8. For DEM review, send directly to staffengineers.
9. Make sure staff engineers are coordinating withshops for comments (suggest they have review meetingwith shop personnel).
10. For EM review - understand and communicate theirorganization and develop workable procedure to getreview.
C. Implementations Actions
1. Send letter 4 to 2046 Comm: Current system isn'tworking. Suggest getting, Comm design engineerassigned to base. Alternate-plan to get Comm engr.in base DE for design.
NOTE: Include in letter that the 2046 needs torespond to decentralization resulting from theimplementation of the MPMP. Now the base has aneven greater responsibility.
OPR: DEEC ECD: Subject to FY92 MCP
2. Make sure review letters to DEM are routed toStaff Engineer Office.
OPR: DEEE ECD: 01 Apr 90
3. Send memo to DEM, informing them that all futurereviews will come to staff engineers. Suggest thatthey have review meeting with shops. They mayinvite DEEED representative to attend if desired.
OPR: DEEED ECD: 01 Mar 90
316

4. Obtain new wing and base CE organizationalcharts, including EM under DE, and phone lists forEM.
OPR: DEEE ECD: Done
5. Set up session between all EM branch chiefs andDEE section chiefs to formalize processes forpermitting, etc. Show them flow chart of reviewprocesses developed in PAT.
OPR: DEE ECD: 15 Mar 90
D. Measuring Progress
1. For implementation action C.2 above, evaluateprocess at the end of FY 90 to determine if reviewof the design package by the Staff Engineer's Officehas improved and that shop comments are included inthe final review. Also, conduct a random survey ofthe shops to determine if they has an opportunity toreview the design package and provide comments.
OPR: Project Manager for the random ECD: Depends onsurvey and DEEED for adding FY92 MCPto the Design Process 0.1.
2. For C.5 above, success will be a measure ofhaving a productive meeting with EMO.
V. Design Review Meeting
A. Problem Areas
1. HQ filters comments without meeting with basebefore HQs sends comments to COE/AFRCE.
2. Do not have design review meetings on everyproject.
3. Do not conduct scope focused review meetings at10% or 30%.
4. COMM representatives are only good for technicalquestions. Have no authority.
5. DEEC not notified.
6. Design rep. and construction rep not identifiedin MCP report.
317

B. Solutions
1. Have HQ instruct COE to include in contractprovision for all meetings at WPAFB.
C. Implementation Actions
1. In letter 1 to HQ AFLC, request all design
review meetings be conducted at WPAFB.
OPR: ECD:
NOTE: Include in MPMP development andimplementation.
VI. Scope Review at 90%
A. Problem Areas
1. Never see 100% for checking comments.
2. Since no continuity in review among user & COMM,different folks looking at each submittal, orcommand/personnel changes.
B. Solutions
1. Make sure user, AFRCE, A-E, DEEP are involved at10% or 30%.
2. Identify DEEC rep on MCP Report from outset.
3. Discussed 100% design review with COE during18 Jan 1990 meeting at Wright-Patterson AFB. Theydo not send out for new review, unless the projectsits on the shelf; then sent to the AFRCE.Therefore, have the COE send the 100% for a Basecheck for each project.
4. Need Base Comm./user continuity when conductingdesign review.
a. Assign a single point of contact (POC) withinthese organizations. Have POC attend designreview meetings.
b. When the Design Instruction is issued, theproject manager should establish the POCs.
c. Make certain that each organization has analternate/backup; someone who can continue theprocess if the primary is unavailable.
318

C. Implementation Actions
1. Include DEEC rep and DEEED rep for each COEproject on MCP report, all reports.
OPR: DEEP ECD: 20 Mar 90
2. In letter I to HQ AFLC, request that COE not bepermitted to send projects out to bid if theyhaven't been reviewed by the base in the last 6months.
3. In letter 4 to 2046 Comm, inform them of the newreview procedure adopted, and that at the outset ofeach project they will be asked for a primary andalternate P.O.C.
NOTE: Include actions 2 and 3 in the development of
the MPMP.
OPR: ECD: Contingent on FY92 MCP
D. Measuring Progress
1. For C.1 above, action will be consideredsuccessful when the next MCP Report is issued.
E. Overall Measure of Progress/Success
1. Minimize Change Orders
a. Establish a baseline for the last five (5)years, FY85-89 to include by project changeorders required by (1) design errors (2) designomissions (3) mission/user changes and (4)latent conditions.
b. Measure change orders as a percentage of thecontract price.
c. Goal is to reduce change orders caused by(1) and (2) to zero (0) and reduce (4) byimproved site investigation.
319

Items From Visit By Corp-of-Engineers (COE) Reps
1) Vehicle exists to include base input in selection, nowevidently just getting to AFRCE.
2) COE to BCE communication gets lost at AFRCE. Basedoesn't hear about selection/pre-design meetings. Have COEcontact base directly.
3) Add discussion of upcoming project status to monthly COEmeeting at base. Have base design rep. attend.
4) Establish procedure design support unit and COE forearly coordination on D.I.'s, selection and pre-design.
5) Get copy of COE book detailing what each submittal iscomposed of.
6) AF can choose what submittals it wants (10%, 60% areextra).
7) Can't change 35% requirements, except maybe on aspecific item.
8) A-E only held responsible for design errors if: 1) Nodamage to gov't 2) Gov't didn't mislead A-E with incorrectdwgs. A-E is responsible for damages and to redesign thesolution. Performance reflects on ACASS evaluation rating.
9) A-E not payed for extra submittals when caused by A-E'spoor work.
10) Base COE members have various design duties, but nospecific member assigned exclusively for design problems.
11) 100% is checked internally and constructability reviewmade before RTA and put on street.
12) COE issues amendments during bidding to answerquestions, so BASE can get final comments to COE forinclusion in amendment.
13) See if base can tie into ACASS network.
320

Appendix G. Quality Questionnaire
The following sections will ask for information from youabout your organization. Please answer each question to the bestof your abilities on a separate sheet of paper. For example, theprimary intention for the following section on leadership is todetermine if your organization's leadership emphasizes qualityas part of the company's value system, through both personalaction and through demands on employees. Use the following scaleto rate all questions.
1 - Strongly disagree 5 - Slightly agree2 - Moderately disagee 6 - Moderately agree3 - Slightly disagree 7 - Strongly agree4 - Neither agree nor disagree
PREFACE: The intent of this questionnaire is to queryindividuals who have been intimately involved with the CEPATs and those who have not, then to note significant differences.Please indicate on your separate answer sheet if you have orhave not been intimately involved with the PATs in CivilEngineering. Any information regarding your experiences inyour organization's quality movement, if any. would beappreciated.
I. LEADERSHIP
A. Supervisory Communication
1. Your supervisor encourages you to let him/her know whenthings go wrong on the job.
2. The communication between you and your supervisor is good.
3. You are free to tell your supervisor that you disagreewith him/her.
4. Work center problems are often discussed as a group, withsupervisors and workers openly and honestly discussingthe issues.
5. Your supervisor is fully aware of work center problems.
B. Participative Decision Making
1. This organization is always moving toward the develop-ment of new answers.
321

2. In your organization, people are allowed to try to solve
the same problem in different ways.
3. Creativity is encouraged in your organization.
4. People in your organization are always searching forfesh. new ways of looking at problems.
5. The leadership acts as if people in your organizationare creative.
C. Commitment to Quality
1. Quality is more than just the latest fashionable "buzzword".
2. Your boss is sincerely interested in giving you time todo the job right.
3. Product defects are an unwanted, but inevitable by-product of deadlines and schedules.
4. Your supervisor tries hard to remove restrictions thatlimit performance.
D. Shared Vision
I. Continually improving work results are a realisticgoal.
2. Our organization continually works to improve overall endresults.
3. When we work to increase quality, we don't necessarilydecrease productivity.
II. STRATEGIC QUALITY PLANNING
A. Goal Clarity
1. You know exactly what is expected of you in performingyour job.
2. You understand the priorities associated with what youare expected to accomplish on the job.
3. Your supervisor clearly indentifies those work processesthat need improvement.
322

B. Goal Congruence
1. Your organization's goals make a lot of sense.
2. You have a personal stake in your organization'seffectiveness.
III. HUMAN RESOURCE MANAGEMENT
A. Training Adequacy
1. You have all the skills you need in order to do yourjob.
2. You have been provided enough training to .acqurs. the necessary
skills to do your job well.
B. Involvement
1. You feel personally responsible for the work you doon your job.
2. You often make suggestions for improving work conditionsand processes.
3. Management encourages, and often discusses with the work
force new ideas for improving how jobs are done.
C. Empowerment
1. Rules and regulations of your organization are not meant tohinder your performance.
2. Your ideas for improving work conditions and processesare often implemented.
3. You are given opportunities to provide your own ideasto try to improve "the way things are done" in yourorganization.
D. Expectancy
1. Your supervisor consistently rewards top performers.
2. The people who most deserve recognition receive thatrecognition.
323

E. Role Clarity
1. You know exactly what is expected prior to undertakingany specific task.
2. You know who makes the decisions in your organizationand hVw the dc'-15o ax- reachea.
F. Recognition/Feedback
1. Your least frequent feedback is criticism.
2. Your supervisor provides immediate feedback when workresults are good.
3. You usually know whether or not your work issatisfactory.
IV. QUALITY ASSURANCE OF PRODUCTS AND SERVICES
A. Quality system
1. You have no problem obtaining the tools, equipment andsupplies necessary to do your job.
2. You are held accountable for your mistakes and arerequired to take action to prevent their recurrence.
3. This organization attempts to solve its problems as best
it can.
V. QUALITY RESULTS
A. External Measures
1. Your organization is as good as any other similarorganization.
2. Complaints are rarely ever received about the workof your organization.
3. The results of work in your organization meet yourcustomers standards.
B. Internal Measures
1. Your organization is the best it has ever been.
2. In your organization everyone knows how importantit is to do things right
324

VI. CUSTOMER SATISFACTION
A. Responsiveness
1. Your customers have the right to call and talk to theperson who did the work if they are unhappy about it.
2. If a customer complains about something, immediateaction is taken to identify theproblem.
3. Customer satisfaction is the whole reason we work for-the phrase "satisfying our customers" receives more thanjust "lip service" in our organization.
4. Customers are given the fastest possible feedback totheir questions.
5. It is easy for the customer to get in contact with theexperts.
6. Customers receive courteous treatment from your
organization.
B. Feedback
1. The most important measures of your performance areobtained through customer feedback.
2. You always receive information on our customersreactions when it involves your work.
3. In this organization. you often make changes based oninputs from your customers.
Thank you for your help in this endeavor.
If you have any constructive comments regarding improvement ofyour quality program, please indicate these for considerationby your organization.
325
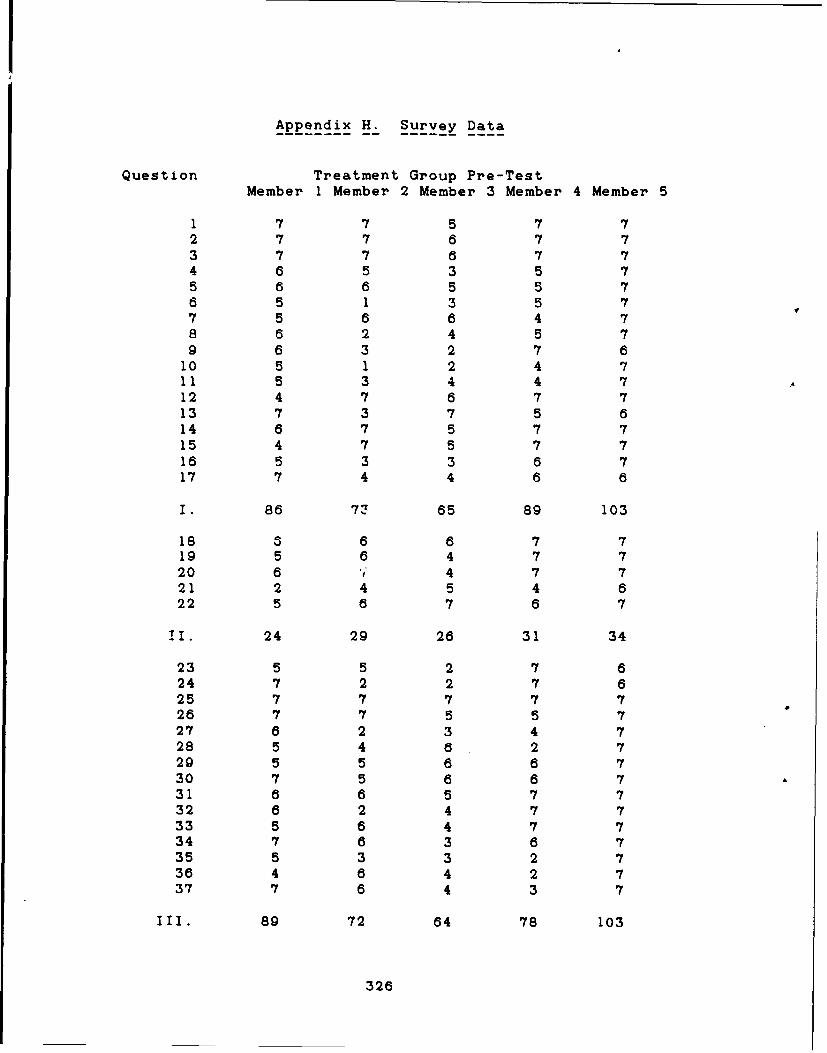
Appendix H. Survey Data
Question Treatment Group Pre-TestMember 1 Member 2 Member 3 Member 4 Member 5
1 7 7 5 7 72 7 7 6 7 73 7 7 6 7 74 6 5 3 5 75 6 6 5 5 76 5 1 3 5 77 5 6 6 4 78 6 2 4 5 79 6 3 2 7 6
10 5 1 2 4 711 5 3 4 4 712 4 7 6 7 713 7 3 7 5 614 6 7 5 7 715 4 7 5 7 716 5 3 3 6 717 7 4 4 6 6
I. 86 7: 65 89 103
18 3 6 6 7 719 5 6 4 7 720 6 , 4 7 721 2 4 5 4 622 5 6 7 6 7
1I. 24 29 26 31 34
23 5 5 2 7 624 7 2 2 7 625 7 7 7 7 726 7 7 5 5 727 6 2 3 4 728 5 4 6 2 729 5 5 6 6 730 7 5 6 6 731 6 6 5 7 732 6 2 4 7 733 5 6 4 7 734 7 6 3 6 735 5 3 3 2 736 4 6 4 2 737 7 6 4 3 7
IIl. 89 72 64 78 103
326

Question Member 1 Member 2 Member 3 Member 4 Member 5
38 2 1 2 3 639 4 4 4 7 740 4 3 6 7 7
IV. 10 8 12 17 20
41 7 4 4 4 742 3 2 1 4 643 3 3 3 4 744 4 5 1 6 745 3 3 6 6 7
V. 16 12 14 18 27
46 3 4 7 4 747 3 3 4 4 648 3 3 4 3 749 3 3 2 5 750 2 5 2 5 751 3 4 5 4 752 3 7 5 1 653 4 1 4 1 654 5 2 7 4 6
VI. 29 32 %40 31 59
Total 254 226 221 264 346
327

Question Treatment Group Post-TestMember I Member 2 Member 3 Member 4 Member 5
1 7 7 5 4 72 7 7 6 4 73 7 7 6 2 64 5 5 4 3 55 5 6 5 5 66 5 3 4 5 67 6 3 4 5 68 6 1 4 6 69 5 2 3 6 5
10 5 1 4 3 611 5 3 4 2 6
12 5 6 6 6 7
13 b 7 7 6 5
14 7 6 5 6 6
15 7 3 5 5 7
16 7 3 3 4 6
17 7 5 4 3 6
I. 91 65 68 67 92
18 6 6 5 3 7
19 7 5 3 4 7
20 6 7 4 3 7
21 5 % 2 4 2 5
22 5 6 7 2 7
II. 29 26 23 14 33
23 5 3 3 6 5
24 5 1 2 6 5
25 7 7 7 6 7
26 7 7 5 2 627 7 5 3 3 5
28 5 4 4 1 5
29 5 6 4 4 630 6 6 4 4 6
31 6 6 4 4 7
32 6 3 5 3 6
33 7 6 5 6 6
34 6 7 4 3 7
35 5 6 3 5 636 6 6 4 5 7
37 7 6 5 6 7
III. 90 79 62 64 91
328

Question Treatment Group Post-TestMember 1 Member 2 Member 3 Member 4 Member 5
38 5 5 2 1 6
39 5 5 6 5 740 6 2 3 7 7
IV. 16 12 11 13 20
41 7 6 4 4 742 5 2 2 3 643 5 3 4 4 644 7 5 4 6 645 5 3 5 6 6
V. 22 14 15 17 25
46 7 5 6 7 6
47 6 5 6 7 6
48 5 3 5 6 6
49 5 3 5 6 650 6 6 6 7 651 5 6 6 7 652 4 2 7 2 5
53 4 1 6 2 554 5 6 7 5 5
VI. 47 37 54 49 51
Total ?ID5 233 233 224 312
329

Question Control Group Pre-TestMember 1 Member 2 Member 3 Member 4
1 7 4 7 72 7 5 7 73 7 5 7 74 6 2 6 65 7 5 6 66 7 3 6 67 6 5 6 58 7 5 6 69 6 4 6 5
10 5 3 6 511 2 6 512 a 5 6 613 7 1 414 6 4 6 615 7 5 6 516 6 2 6 617 7 4 7 6
I. 97 61 94 89
18 7 6 7 619 7 6 7 620 7 4 6 621 6 2 6 422 7 5 6 5
II. 34 23 32 27
23 6 6 7 324 3 3 7 325 7 5 7 726 7 5 5 527 7 2 6 528 7 5 7 629 6 6 5 5
30 7 5 6 631 7 5 5 632 7 6 5 633 6 5 7 534 6 6 5 635 6 5 6 536 5 3 6 637 7 4 6 5
III. 94 71 90 79
330

Question Member 1 Member 2 Member 3 Member 4
38 4 1 5 5
39 6 5 7 6
40 5 5 6 6
IV. 15 11 18 17
41 6 6 6 642 7 4 6 443 6 3 7 544 5 3 445 7 3 7 4
V. 26 16 26 19
46 7 2 7 647 7 5 6 548 7 1 6 5
49 6 5 7 550 7 3 6 5
51 7 5 7 5
52 6 6 7 553 5 5 6 454 4 5 6 4
VI. 56 37 58 44
Total 322 219 318 275
331

Question Control Group Post-TestMember I Member 2 Member 3 Member 4
1 7 6 7 72 5 7 7 73 7 6 7 74 6 5 7 65 5 5 6 86 6 4 4 57 7 5 6 68 7 3 8 89 7 5 8 510 6 3 6 511 7 2 6 4
12 7 5 7 6
13 5 7 1 4
14 6 4 6 6
15 7 5 7 5
16 6 6 7 617 6 3 7 6
I. 95 72 96 89
18 7 5 7 6
19 6 6 7 620 5 4 7 6
21 6 5 7 422 7 5 6 6
II. 31 25 34 28
23 1 4 7 324 1 3 7 4
25 7 6 7 7
26 5 5 6 6
27 4 4 7 628 7 5 7 6
29 5 5 7 630 6 5 7 6
31 7 5 4 632 7 6 4 6
33 5 6 7 634 4 5 7 5
35 5 5 7 5
36 5 6 7 6
37 7 6 7 6
III. 76 76 98 84
332

Question Member 1 Member 2 Member 3 Member 4
38 5 2 6 239 7 5 7 640 7 4 7 5
IV. 19 11 20 13
41 7 7 7 642 5 5 7 343 4 5 7 444 4 5 4 6
4 ,5 6 7 5
V. 21 23 28 18
46 7 6 7 647 7 5 7 448 6 5 7 349 7 4 7 350 7 4 7 551 7 5 7 652 5 3 6 353 6 4 6 354 6 3 6 3
VI. 58% 39 60 36
Total 300 246 336 268
333

Appendix I. Comparison of Group Pre-Test Results
Question Treatment ControlAverage Average t tcrit Result
1 6.6 6.25 0.499991 2.36 same2 6.8 6.5 0.696009 2.36 same3 6.8 6.5 0.696009 2.36 same
4 5.2 5 0.196957 2.36 same5 5.8 6 -0.40788 2.36 same6 4.2 5.5 -1.06016 2.36 same7 5.6 5.5 0.177993 2.36 same8 4.8 6 -1.29582 2.36 same9 4.8 5.25 -0.42917 2.36 same10 3.8 4.75 -0.80244 2.36 same11 4.6 4.333333 0.246765 2.45 same12 6.2 5.75 0.724418 2.36 same13 5.6 4 1.172197 2.45 same14 6.4 5.5 1.6185 2.36 same15 6 5.75 0.338948 2.36 same16 4.8 5 -0.17983 2.36 same17 5.4 6 -0.73879 2.36 same
I. 83.2 85.25 -0.22359 2.36 same
18 6.4 6.5 -0.30161 2.36 same19 5.8 6.5 -1.10967 2.36 same20 6.2 5.75 0.591526 2.36 same21 4.2 4.5 -0.30259 2.36 same22 6.2 5.75 0.855647 2.36 same
II. 28.8 29 -0.07671 2.36 same
23 5 5.5 -0.46546 2.36 same24 4.8 4 0.571887 2.36 same25 7 6.5 1.314684 2.36 same26 6.2 5.5 1.118748 2.36 same27 4.4 5 -0.48045 2.36 same28 4.8 6.25 -1.53378 2.36 same29 5.8 5.5 0.684271 2.36 same30 6.2 6 0.407884 2.36 same31 6.2 5.75 0.855647 2.36 same32 5.2 6 -0.77583 2.36 same33 5.8 5.75 0.071996 2.36 same34 5.8 5.75 0.065007 2.36 same35 4 5.5 -1.60718 2.36 same36 4.6 5 -0.38651 2.36 same37 5.4 5.5 -0.10426 2.36 same
III. 81.2 83.5 -0.28857 2.36 same
334

Question Treatment ControlAverage Average t tcrit Result
38 2.8 3.75 -0.83987 2.36 same39 5.2 6 -0.99086 2.36 same40 5.4 5.5 -0.11728 2.36 same
IV. 13.4 15.25 -0.72631 2.36 same
41 5.2 6 -1.07344 2.36 same42 3.2 5.25 -1.96662 2.36 same43 4 5.25 -1.22631 2.36 same44 4.6 4 0.470523 2.45 same45 5 5.25 -0.21639 2.36 same
V. 17.4 21.75 -1.33273 2.36 same
46 5 5.5 -0.40296 2.36 same47 4 5.75 -2.63475 2.36 changed48 4 4.75 -0.58969 2.36 same49 4 5.75 -1.79034 2.36 same50 4.2 5.25 -0.891 2.36 same51 4.6 6 -1.7155 2.36 same52 4.4 6 -1.40896 2.36 same53 3.2 5 -1.74561 2.36 same54 4.8 4.75 0.052889 2.36 same
VI. 38.2 48.75 -1.55862 2.36 same
Total 262.2 283.5 -0.72956 2.36 same
335

Appendix J. Comparison of Group Pre-Test Variance
Question Treatment Control PooledVariance Variance Variance f fCritResult
1 0.64 1.6875 1.088929 2.636719 6.59 same2 0.16 0.75 0.412857 4.6875 6.59 same3 0.16 0.75 0.412857 4.6875 6.59 same4 1.76 3 2.291429 1.704545 6.59 same5 0.56 0.5 0.534286 1.12 9.12 same6 4.16 2.25 3.341429 1.848889 9.12 same7 1.04 0.25 0.701429 4.16 9.12 same8 2.96 0.5 1.905714 5.92 9.12 same9 3.76 0.6875 2.443214 5.469091 9.12 same10 4.56 1.1875 3.114643 3.84 9.12 same11 1.84 2.888889 2.18963 1.570048 6.94 same12 1.36 0.1875 0.8575 7.253333 9.12 same13 2.24 6 3.493333 2.678571 6.94 same14 0.64 0.75 0.687143 1.171875 6.59 same15 1.6 0.6875 1.208929 2.327273 9.12 same16 2.56 3 2.748571 1.171875 6.59 same17 1.44 1.5 1.465714 1.041667 6.59 same
I. 173.76 204.1875 186.8004 1.175112 6.59 same
18 0.24 0.25 0.244286 1.041667 6.59 same19 1.36 0.25 0.884286 5.44 9.12 same20 1.36 1.1875 1.286071 1.145263 9.12 same21 1.76 2.75 2.184286 1.5625 6.59 same22 0.56 0.6875 0.614643 1.227679 6.59 same
ERR 6.59 ERRII. 12.56 18.5 15.10571 1.47293 6.59 same
23 2.8 2.25 2.564286 1.244444 9.12 same24 5.36 3 4.348571 1.786667 9.12 same25 0 0.75 0.321429 ERR 6.59 ERR26 0.96 0.75 0.87 1.28 9.12 same27 3.44 3.5 3.465714 1.017442 6.59 same28 2.96 0.6875 1.986071 4.305455 9.12 same29 0.56 0.25 0.427143 2.24 9.12 same30 0.56 0.5 0.534286 1.12 9.12 same31 0.56 0.6875 0.614643 1.227679 6.59 same32 3.76 0.5 2.362857 7.52 9.12 same33 1.36 0.6875 1.071786 1.978182 9.12 same34 2.16 0.1875 1.314643 11.52 9.12 changed35 3.2 0.25 1.935714 12.8 9.12 changed36 3.04 1.5 2.38 2.026667 9.12 same37 2.64 1.25 2.044286 2.112 9.12 same
III. 185.36 82.25 141.17 2.253617 9.12 same
336

Question Variance Variance Variance f fCritResult
38 2.96 2.6875 2.843214 1.101395 9.12 same39 2.16 0.5 1.448571 4.32 9.12 same40 2.64 0.25 1.615714 10.56 9.12 changed
IV. 19.84 7.1875 14.4175 2.760348 9.12 same
41 2.16 0 1.234286 ERR 9.12 ERR42 2.96 1.6875 2.414643 1.754074 9.12 same43 2.4 2.1875 2.308929 1.097143 9.12 same44 4.24 0.666667 3.048889 6.36 19.3 same45 2.8 3.1875 2.966071 1.138393 6.59 same
V. 27.04 19.1875 23.67464 1.409251 9.12 same
46 2.8 4.25 3.421429 1.517857 6.59 same47 1.2 0.6875 0.980357 1.745455 9.12 same48 2.4 5.1875 3.594643 2.161458 6.59 same49 3.2 0.6875 2.123214 4.654545 9.12 same50 3.76 2.1875 3.086071 1.718857 9.12 same51 1.84 1 1.48 1.84 9.12 same52 4.64 0.5 2.865714 9.28 9.12 changed53 3.76 0.5 2.362857 7.52 9.12 same54 2.96 0.6875 1.986071 4.305455 9.12 same
VI. 122.1 5 4.6875 101.8146 1.635615 9.12 same
Total 2020.16 1726.25 1894.199 1.170259 9.12 same
337

Appendix K. Comparison of Group Change Results
Question Treatment ControlAverage Average t tcrit Result
1 -0.6 0.5 -1.53292 2.36 same2 -0.6 0 -0.69007 2.36 same3 -1.2 0.25 -1.44782 2.36 same4 -0.8 1 -2.25176 2.36 same5 -0.4 -0.5 0.220136 2.36 same6 0.4 -0.75 1.632156 2.36 same7 -0.8 0.5 -1.54663 2.36 same8 -0.2 -0.5 0.558394 2.36 same9 -0.6 0.5 -2.38463 2.36 changed
10 0 0.25 -0.42579 2.36 same11 -0.6 -0.33333 -0.51602 2.45 same12 -0.2 0.5 -1.59663 2.36 same13 0.4 0 0.325779 2.45 same14 -0.4 0 -0.98601 2.36 same15 -0.6 0.25 -0.70956 2.36 same16 -0.2 1.25 -1.47159 2.36 same17 -0.4 -0.5 0.138494 2.36 same
I. -6.6 2.75 -1.71526 2.36 same
18 -1 -0.25 -0.92791 2.36 same19 -0.6 -0.25 -0.41391 2.36 same20 -0.8 -0.25 -0.58388 2.36 same21 -0.6 1 -1.47677 2.36 same22 -0.8 0.25 -1.26 2.36 same
II. -3.8 0.5 -1.13981 2.36 same
23 -0.6 -1.75 1.109149 2.36 same24 -1 -0.25 -1.30189 2.36 same25 -0.2 0.25 -1.6185 2.36 same26 -0.8 0 -1.00078 2.36 same27 0.2 0.25 -0.04121 2.36 same28 -1 0 -2.20479 2.36 same29 -0.8 0.25 -1.27787 2.36 same30 -1 0 -1.57135 2.36 same31 -0.8 -0.25 -0.8854 2.36 same32 -0.6 -0.25 -0.36476 2.1' same33 0.2 0.25 -0.072 2. : same34 -0.4 -0.5 0.099507 2.36 same35 1 0 1.106728 2.36 same36 1 1 0 2.36 same37 0.8 1 -0.29943 2.36 same
III. -4 0 -0.65524 2.36 same
338

Question Average Average t tcrit Result
38 1 0 0.742708 2.36 same39 0.4 0.25 0.210186 2.36 same40 -0.4 0.25 -0.64881 2.36 same
IV. 1 0.5 0.224079 2.36 same
41 0.4 0.75 -0.7812 2.36 same42 0.4 -0.25 0.844174 2.36 same43 0.4 -0.25 0.782903 2.36 same44 1 1 0 2.45 same45 0 0.5 -0.51699 2.36 same
V. 1.2 0.75 0.188552 2.36 same
46 1.2 1 0.155781 2.36 same47 2 0 3.142697 2.36 changed48 1 0.5 0.404651 2.36 same49 1 -0.5 1.725898 2.36 same50 2 0.5 1.519944 2.36 same51 1.4 0.25 1.611423 2.36 same52 -0.4 -1.75 1.024268 2.36 same53 0.4 -0.25 1.027717 2.36 same54 0.8 -0.25 0.96537 2.36 same
VI. 9.4 -0.5 1.84227 2.36 same
Total -2.8 4 -0.38654 2.36 same
339

Appendix L. Comparison of Group Change Variance
Question Treatment Control PooledVariance Variance Variance f fCritResult
1 1.44 0.75 1.144286 1.92 9.12 same2 1.44 2 1.68 1.388889 6.59 same3 3.76 0.1875 2.228929 20.05333 9.12 changed4 1.36 1.5 1.42 1.102941 6.59 same5 0.24 0.75 0.458571 3.125 6.59 same6 1.04 1.1875 1.103214 1.141827 6.59 same7 2.56 0.25 1.57 10.24 9.12 changed8 0.56 0.75 0.641429 1.339286 6.59 same9 0.64 0.25 0.472857 2.56 9.12 same
10 1.2 0.1875 0.766071 6.4 9.12 same11 0.64 0.222222 0.500741 2.88 19.3 same12 0.56 0.25 0.427143 2.24 9.12 same13 4.24 0 2.826667 ERR 19.3 ERR14 0.64 0 0.365714 ERR 9.12 ERR15 5.44 0.1875 3.188929 29.01333 9.12 changed16 1.76 2.6875 2.1575 1.526989 6.59 same17 1.84 0.25 1.158571 7.36 9.12 same
I. 97.04 24.6875 66.03179 3.930734 9.12 same
18 2.4 0.1875 1.451786 12.8 9.12 changed19 2.64 0.1875 1.588929 14.08 9.12 changed20 2.56 1.1875 1.971786 2.155789 9.12 same21 3.44 1.5 2.608571 2.293333 9.12 same22 2.56 0.1875 1.543214 13.65333 9.12 changed
II. 52.16 4.25 31.62714 12.27294 9.12 changed
23 1.04 4.1875 2.388929 4.026442 6.59 same24 0.4 1.1875 0.7375 2.96875 6.59 same25 0.16 0.1875 0.171786 1.171875 6.59 same26 1.36 1.5 1.42 1.102941 6.59 same27 2.96 3.6875 3.271786 1.245777 6.59 same28 0.8 0 0.457143 ERR 9.12 ERR29 1.36 1.6875 1.500357 1.240809 6.59 same30 1.2 0.5 0.9 2.4 9.12 same31 1.36 0.1875 0.8575 7.253333 9.12 same32 3.44 0.1875 2.046071 18.34667 9.12 changed33 1.36 0.6875 1.071786 1.978182 9.12 same34 2.24 2.25 2.244286 1.004464 6.59 same35 2.8 0.5 1.814286 5.6 9.12 same36 1.6 1.5 1.557143 1.066667 9.12 same37 1.36 0.5 0.991429 2.72 9.12 same
III. 62.8 109.5 82.81429 1.743631 6.59 same
340

Question Treatment Control PooledVariance Variance Variance f fCritResult
38 4.8 3 4.028571 1.6 9.12 same39 1.84 0.1875 1.131786 9.813333 9.12 changed40 2.64 1.6875 2.231786 1.564444 9.12 same
IV. 12.8 8.75 11.06429 1.462857 9.12 same
41 0.64 0.1875 0.446071 3.413333 9.12 same42 1.04 1.6875 1.3175 1.622596 6.59 same43 1.04 2.1875 1.531786 2.103365 6.59 same44 2.8 2 2.533333 1.4 19.3 same45 1.2 3.25 2.078571 2.708333 6.59 same
V. 7.76 19.1875 12.6575 2.472616 6.59 same
46 4.16 3 3.662857 1.386667 9.12 same
47 1.2 0.5 0.9 2.4 9.12 same48 2 5.25 3.392857 2.625 6.59 same49 2 1.25 1.678571 1.6 9.12 same50 3.6 0.25 2.164286 14.4 9.12 changed51 1.84 0.1875 1.131786 9.813333 9.12 changed52 6.24 0.6875 3.860357 9.076364 9.12 same53 1.04 0.6875 0.888929 1.512727 9.12 same54 2.96 2.1875 2.628929 1.353143 9.12 same
VI. 98.24 18.75 64.17286 5.239467 9.12 same
Total 918.16 380.5 687.7343 2.413035 9.12 same
341

22 4 M. Statistical Analysis
Test I - Equivalency of treatment and control groups
Focus Question: Are the treatment and control groups equalin their responses to the 54 questions on the QualityQuestionnaire, with 95% confidence.
Assumptions: 1) The population distributions for theresponses are normally distributed. This will result in themean of the treatment group responses (xbar) and the mean ofthe control group responses (ybar) to also be declarednormally distributed for each question.2) The sampling statistic xbar - ybar is normallydistributed as a linear combination of random variables,with its expected value being the true difference in means.3) The standard deviation of xbar equals the standarddeviation of ybar, and is unknown. This equality will betested in test 2, following. The pooled standard deviationwill be estimated, and its difference from the true standarddeviation accounted for using the T-test.
Symbols: xbar - treatment group sample meanybar - control group sample meanSx - treatment group sample standard deviationSy - control group sample standard deviationm - treatment group sample sizen - control group sample sizeSp - pooled standard deviation of sample
Sp = ((m - 1) * Sx * Sx + (n - 1) * Sy * Sy) / (m + n - 2)
Test Statistic:
t = (xbar - ybar) / (sqrt(l / m + 1 / n) * Sp) , with
m + n - 1 degrees of freedom.
Null Hypothesis: Treatment mean equals the control mean
Alternate Hypothesis: The two means are different
The test: Compare t to t critical using a two-tailed testwhich accounts for a difference in either direction. If theabsolute value of t is greater than t critical for alpha / 2= .025 and m + n - 1 degrees of freedom, reject the nulland conclude that the means are different. If not, acceptthe null and conclude that the means are equivalent.
342

This statistical test was performed for each of the 54questions. The t statistic was compared to t critical of2.36 for m + n - I = 8 degrees of freedom atalpha / 2 = .025. The means were then declared to be the"same' or "changed". The results of this test for eachquestion are tabulated in Appendix I. Of the 54 questions,all but one were found the same. This one exception can beattributed to the fact that at the alpha level of .05, evenequal populations would be expected to yield unequal samplesfive percent of the time.
The conclusion of this test is that the treatment andcontrol groups are declared to be equal. This is importantin controlling the regression obstacle to internal validity.
343

Test 2 - Equivalency of treatment and control group variancefor Test 1.
Focus Question: Are the population variances of thetreatment and control groups equal in their responses to the54 questions on the Quality Questionnaire, with 95%confidence.
Assumptions: 1) The sampling statistic Sx * Sx / (Sy * Sy)has an F distribution, with its expected value being one ifthe populations have equal variance.
Symbols: Sx - treatment group sample standard deviationSy - control group sample standard deviationm - treatment group sample sizen - control group sample size
Test Statistic:
f = (Sx * Sx) / (Sy * Sy) , or the inverse so that the
ratio is greater than one.
Null Hypothesis: Treatment group and control group responsevariances are equal.
Alternate Hypothesis: The two variances are different
The test: Compare f to f critical. If the valueof f is greater than f critical for alpha = .05, with m andn according to the test statistic, reject the null and concludethat the variances are different. If not, accept the null andconclude that the variances are equivalent. This willsupport the assumption made in Test 1.
This statistical test was performed for each of the 54questions. The f statistic was compared to 1 critical of9.12 for m = 5 and n = 4 and Sx larger than Sy or f criticalof 6.59 for Sy larger than Sx at alpha = .05. Thevariances were then declared to be the 'same" or *changed'.The results of this test for each question are tabulated inAppendix J. Of the 54 questions, all but four were found thesame. These four exceptions can be attributed to the factthat at the alpha level of .05, even equal populations wouldbe expected to yield unequal samples five percent of thetime. On two of the questions an ERRor message resulted.This was because one of the variances was zero, resulting inan undefined ratio.
The conclusion of this test is that the treatment andcontrol group variances are declared to be equal. This isimportant in confirming the assumptions made in Test 1.
344

Test 3 - Significance of change of treatment group withrespect to the control group
Focus Question: Are the treatment and control groups equalin the change of their responses over a 6 month period tothe 54 questions on the Quality Questionnaire, with 95%confidence.
Assumptions: 1) The population distributions for theresponses are normally distributed. The change in responsefor the control group, being a linear combination of thepre-test and post-test responses, will then also be normallydistributed. This will result in the mean of the treatment
0 group response changes (xbar) and the mean of the controlgroup response changes (ybar) also being declared normallydistributed for each question.2) The sampling statistic xbar - ybar is normallydistributed as a linear combination of random variables,with its expected value being the true difference in means.3) The standard deviation of xbar equals the standarddeviation of ybar, and is unknown. This equality will betested in test 2, following. The pooled standard deviationwill be estimated, and its difference from the true standarddeviation accounted for using the T-test.
A two sample paired T-test will be used. This is possiblebecause the pre-test can be matched to the post-test foreach individual who participated in the quasi-experiment.
Symbols: xbar - treatment group sample change meanybar - control group sample change meanSx - treatment group sample change standard
deviationSy - control group sample change standard
deviationm - treatment group sample sizen - control group sample sizeSp - pooled standard deviation of sample change
xbar = xbar(post-test) - xbar(pre-test)ybar = ybar(post-test) - ybar(pre-test)Sp = ((m - 1) * Sx * Sx + (n - 1) * Sy * Sy) / (m + n - 2)
Test Statistic:
t = (xbar - ybar) / (sqrt(l / m + 1 / n) * Sp) , with
m + n - 1 degrees of freedom.
Null Hypothesis: Treatment mean change equals the controlmean change
345

Alternate Hypothesis: The two means are different
The test: Compare t to t critical using a two-tailed testwhich accounts for a change in either direction. If theabsolute value of t is greater than t critical for alpha / 2= .025 and m + n - 1 degrees of freedom, reject the null andconclude that the means are different. If not, accept thenull and conclude that the means are equivalent.
This statistical test was performed for each of the 54questions. The t statistic was compared to t critical of2.36 for m + n - 1 = 8 degrees of freedom or t critical of2.45 for m + n - 1 = 7 degrees of freedom as appropriate atalpha / 2 = .025. The mean changes were then declared to bethe *same* or 'changed*. The results of this test for eachquestion are tabulated in Appendix K. Of the 54 questions,all but two were found the same. These two exceptions canbe attributed to the fact that at the alpha level of .05,even equal populations would be expected to yield unequalsamples five percent of the time.
The conclusion of this test is that the treatment andcontrol groups' changes in attitude toward quality aredeclared to be equal. No significantly different change wasobserved in the treatment group than in the control group.
346

Test 4 - Equivalency of treatment and control group variancefor Test 3.
Focus Question: Are the population variances of thetreatment and control groups equal in the change in theirresponses to the 54 questions on the Quality Questionnaire,with 95% confidence.
Assumptions: 1) The sampling statistic Sx * Sx / (Sy * Sy)has an F distribution, with its expected value being one ifthe populations have equal variance.
Symbols: Sx - treatment group sample standard deviationSy - control group sample standard deviationm - treatment group sample sizen - control group sample size
Test Statistic:
f = (Sx * Sx) / (Sy * Sy) , or the inverse so that the
ratio is greater than one.
Null Hypothesis: Treatment group and control group changein response variances are equal.
Alternate Hypothesis: The two variances are different
The test: Compare f to f critical. If the valueof f is greater than f critical for alpha = .05, with m andn according to the test statistic, reject the null and concludethat the variances are different. If not, accept the null andconclude that the variances are equivalent. This willsupport the assumption made in Test 3.
This statistical test was performed for each of the 54questions. The f statistic was compared to f critical of9.12 for m = 5 and n = 4 and Sx larger than Sy, f criticalof 6.59 for Sy larger than Sx, or f critical of 19.3 for m =5 and n = 3 and Sx larger than Sy at alpha = .05. Thevariances were then declared to be the *same" or "changed*.The results of this test for each question are tabulated inAppendix L. Of the 54 questions, all but eleven were foundthe same. These eleven exceptions are more than can beattributed to the fact that at the alpha level of .05, evenequal populations would be expected to yield unequal samplesfive percent of the time. However, this inconsistency istrivialized by the fact that no significant differences werefound in the means. Had there been significant findings,the difference in variances may have prompted non-parametrictesting of the means, which do not require the assumption of
347

equal variances. On three of the questions an ERRor messageresulted. This was because one of the variances was zero,resulting in an undefined ratio.
The conclusion of this test is that the treatment andcontrol group variances may or may not be equal. This isimportant in confirming the assumptions made in Test 3.However, since Test 3 produced no significant differences inmeans, the question of equality of variances will not bepursued further.
348

Bibliog!1h
Ahearn, Joseph A. , Major General USAF, Director, Engineeringand Services, summary delivered to the Program ReviewCommittee Meeting at the School of Civil Engineeringand Services, Air Force Institute of Technology,Wright-Patterson AFB OH, 08 Jun 90.
American Society of Civil Engineers (ASCE) . Quialiy inthConstructed Pro1 tL, A LU~glngIg Qbwnr_&. aligana4an C~arcaa IfL1ume 1. New York: 1988.
Armentrout, Daryl R. 'Engineering Productivity Managementand Performance Measurement,* Journal of Management inEng10fttr1g_.,. 2111: 141-147 (July 1986).
Barra, Ralph. 'Motorola's Approach to Quality,' The~ JQjrfor Qgg1:ty and Participationa 1 2j1)1: 46-50 (March1989).
Campbell, Donald T. and Stanley, Julian C. ExperimntDal and9L144Z9LcpErimntal§ Designs for Research. Chicago: RandMcNally College Publishing Company, 1963.
Department of Defense. Total quiIll Mainagement - A Guidet2 I2lementationL DOD 2200.51-G. Washington: Officeof the Deputy Assistant Secretary of Defense for TQM,OASD(P&L)TQM, February 1989a.
----- Total Quali ty Manag2eent± DOD 5000.51. Washington:Offi1ce ofthEe Deputy Assistant-Secretary of Defense forTQM, OASD(P&L)TQM, February 1989b.
Ding-us, Victor R. and Hrivnak, Dave. "Tennessee EastmanDepartment Raises Quality, Customer Service ThroughEmployee Teamwork, Industrial Enginlering_. 2O..a8j28-35 (August 1988).
Fishman, Nina. "But What if I Flop,* 4gurna Lzr Quity± andEalc~ain 22-24 (June !.989).
Gilly, Bruno A. and others. "Quality Control Circles inConstruction, JgjurnalJ Q1 CQaluc±li~ Engineering and
M~n49mft0 jj. 1312: 427-439 (September 1987).
Gray, Edmund R. and Smeltzer, Larry R. Maaeet The92nft1Y gdft New York: Macmillan PublishingCompany, 1989.
349

Hacquebord, Heero and Scholtes, Peter R. 'Beginning theQuality Transformation, Part I,* Quality Progress,21(7): 28-33 (July 1988a).
"Beginning the Quality Transformation, Part II,'Quality Er2ojSrs, 21(8): 44-48 (August 1988b).
Hayes, Glenn E. 'Three Views of TQM," Quality, 29: 19-24(April 1990)
Hayman, Edward J., Captain, USAF, and Schneider, Ruth E. TheQuality Quotient: A Tool for Measuring Oranjizationa!--Quality Performance. Thesis, AFIT/GLM/LSR/89S-31,Wright-Patterson Air Force Base OH, 1989.
HQ AFLC. Total Quality Management Training Development Plan.Wright-Patterson AFB OH: March 1989a.
A----- *Strategic Implementation Plan, AFLC Strategy 88-3-1
(Draft). Wright-Patterson AFB OH: April 1989b.
----- *Instructor Guide, AFLC Facilitator Training, (1stEditiony. Wright-Patterson AFB OH: October 1989c.
----- *Student's Guide, AFLC Facilitator Training, (IstEdition). Wright-Patterson AFB OH: October 1989d.
Jennings, Kenneth R. , Major USAF and others. Total QualityAssurance Through Process Management. School ofSystems and Logistics, Air Force Institute ofTechnology, Wright-Patterson AFB OH: 1989.
Kacker, Raghu N. 'Quality Planning for Service Industries,*QuaIity EEr2SE g, 21(8): 39-42 (August 1988).
Loh, John M., Lt. General, USAF, Commander AeronauticalSystems Division, United States Air Force. Speech toAFIT students, Wright-Patterson AFB OH,31 August 1989.
McGeorge, John F. 'Design Productivity: A Quality Problem.Journal of Management in Engineerinl, 4(4): 350-362(October 1988).
Riggs, James L. Production Systems: Planningt A6n:xaisa andControl. New York: John Wiley and Sons, 1987.
Roth. Bill *Five Phases to Success," Journal for Quality andParticipation: 26-32 (June 1989).
350

Ryan, Michael M. and Sebastanelli, Sam R. "Team GoalSetting - Key to Successful Productivity Effort,'Journal of Management in Engineering, 3(4): 325-334(October 1987).
Selltiz, Claire and others. Research Methods in SocialRelations. New York: Holt, Rinehart and Winston, Inc.,1964.
Simmons, John. *FPL Wins the Deming Prize," The Journal forQuality and Participation: 74-76 (March 1990)
Sink, D. Scott and Tuttle, Thomas C Planning andMeasurement in Your Organization of the Future.Norcross GA: Institute of Industrial Engineering, 1989.
Steel, Robert P. and Lloyd, Russell F. *Cognitive,Affective, and Behavioral Outcomes of Participation inQuality Circles: Conceptual and Empirical Findings,Journal of Applied Behavioral Science, 24(1): 1-17(1988).
Stewart, W. T. "A 'Yardstick' for Measuring Productivity,Industrial Engineering, 10(2): 34-37 (February 1978).
- and Calloway, Ronald J. 'Engineering Productivity:The Management of Improvement, Engineering ManagementInternational, 1(2): 109-116 (MayT -8 .
Sumanth, David J. and Yavuz, Filiz P. 'A Formalized Approachto Select Productivity Improvement Techniques inOrganizations,* Engineering Management International,1(4): 259-271 (July 1983).
Takei, Fumio. 'Evaluation Method for Engineering Activity -One Example in Japan,' IEEE Transactions on Engineeringana n M8(1) : 1-16 (February 1981a).
--- "Productivity Improvement in Engineering Work - The'EPOC' Campaign in a Japanese Company,' EngineeringManagemnent International, 1(1): 23-28 (July 1981b).
"Engineering Quality Improvement Through TQCActivity,' IEEE Transactions on Engineering Management,EM-33(2): 92-95 (May 1986).
Todd, Nancy. *Leader Training.* Three-day training coursepresented by the Association for Quality andParticipation, Cincinnati OH, 11 - 13 June 1990.
351

Townsend, Patrick L. and Gebhardt, Joan E. 'Try ContinuousInvolvement Improvement," Journal for Quality andParticipation: 18-21 (June 1989).
Vogt, Judith F. and Hunt, Bradley D. "What Really Goes Wrongwith Participative Work Groups, Training andDevelopment Journal, 42(5): 96-100 (May 1988).
Walton, Mary. The Demin Manafemen t Method. New York: PutnamPublishing Co., 1986.
Warmington, Jeffery Allen. Lessons Learned from theImplementation of Total Quality Management at the NavalAviation Depot, North Island, California. MS Thesis, t
December 1988 (AD-A206442).
Wertz, Robert M., First Lieutenant, USAF. Design andImplementation of Total Quality Management in a CivilEn~i neer n Squadron, Thesis, AFIT/GEM/LSM/89S-19,Wright-Patterson Air Force Base OH, 1989.
White, Charles R. and Austin, Jeffery S. *ProductivityMeasurement, Untangling the White-Collar Web, Journalof Management in Engineering, 5(4): 371-378(October 1989).
352

Vi ta
Robert M. Gill .... __. _
. He graduated from Roy J. Wasson
High School in Colorado Springs, Colorado in 1977. He
attended Colorado State University, graduating with
distinction with a Bachelor of Science in Civil Engineering
in 1981. He worked in private civil consulting engineering
firms in Colorado Springs and Phoenix, Arizona until 1987.
He obtained registration as a Professional Engineer,
specialty in Civil Engineering., from the State of Arizona
that same year.
He began employment with the United States Air Force at
F. E. Warren Air Force Base, Wyoming, in August 1987. He
worked in the Civil Engineering Squadron, Engineering Branch,
Design Section as a civil engineer with responsibility for
the base pavements 'androofs programs. He entered the
School of Systems and Logistics, Air Force Institute of
Technology, in May 1989.-
353

REPORT DOCUMENTATION PAGE Form Approved____________________________________________________ I O MB No 0704-0188
9 c ceoon.no :wroeh ~cr th%vn jo td of nOf Om't~Of .$ elt'mat !o &.eta.'-e r oeC' *soCse PC -3- te e qr re-- ' rr .dlOhs. $earC-9n e. %Ung data 'eqathn,.nq An" -&is-~nng the ata. nefeed and c~roD.tl.hq "d re 7 <:.emcrt 3?o t - 10Ocrre~ .8Ofgt. ud~ ~.aeO fI~ $et3collecton of lf.n.tIOf'. ftclwon9 uggeston, for recu(ing -% ourceh to -vas-gi~on' -eoc"-', sa ces. G.rec-.ofate fr r fofrmaiof Ooeltions and Reocn, 1215 jeticrsonoa..s hfqh .&. S.-te I 2, 4o 4~ ton . A 22232-4 30; and tc l'* Of-c of %.i jna ''#'f arcd 5- a -on cr. Rted~.c ,n 'f.:,ed (o704-a is$ Noinnqton Z'c ;osoj
11. AGENCY USE ONLY (Leave bianc) 2.REPORT DATE 3. REPORT TYPE AND DATES COVERED
reptember 1990 1Master's Thesis
4. TITLE AND SUBTITLE S. FUNDING NUMBERS
A PERFORMANCE MANAGEMENT FRAMETWORK FOR CIVIL ENGINEERING
6. AUTHOR(S)
ROBERT MICHAEL GILL, B.S., CIVILIAN, USAF
7. PERFORMING ORGANIZATION NAME(S) AND ADDRESS(ES) 8. PERFORMING ORGANIZATIONREPORT NUMBER
SCHOOL OF SYSTEMS AND LOGISTICS AFIT/GEM/LSM/90S-7AIR FORCE INSTITUTE OF TECHNOLOGY
WRIGHT PATTERSON AFB, OV~ 45433
9. SPONSORINGMONITORING AGENCY NAME(S) AND ADDRESS(ES) 10. SPONSORING/ MONITORINGAGENCY REPORT NUMBER
11. SUPPLEMENTARY NOTES
12a. DISTRIBUTION/I AVAILABILITY STATEMENT 12b. DISTRIBUTION CODE
APPROVED FOR PUBLIC RELEASE;DISTRIBUTION UNLIMITED
13. ABSTRACT (Maximum 200 words)A performance management team was implemented at the Engzineering Branch of
the 2750 Civil Engineering Squadron at TWriaht Patterson Air Force Base. The teamfocused on the process of reviewing projects designed by architect-engineer firmsand by the Corps of Engineers. As a result of this team effort, improvements tothe process were made. More timely and better comments were being provided to thedesigners after the improvement actions.
From the experiences gained~in the analysis of this case, a three daytrainino course was developied. This course was created to provide the tools andmindset needed to begin performance management efforts in other EngineeringBranches. The course was designed to provide a starting point, and as a gulide tothe performance management effort.
The course was structured to be presented at the squadron location, in orderto teach people in their own environment. Tonics included wore thedistinctives of the ena,-ineerina environment, understandina the process frarmework,the use of measurement in evaluatinay work -rccesses, and emniovee oarticiration.The use o4f the course wvaS eccurac-ec- for t-e base lev7el Encineerina: Rrancn.
14 SUBJECT TERMS 15 NUMBER OF PAGES367
u~i:Assuirance Erhc..1r:_ ncineeranc 16 PRICE CODE
17 SECURITY CLASStFICATICS 18 SECURITY CLASS~iiCATION 1; SEC.,RiTY CLASCATION 20 LIMITATION GF ABSTRACTOF REPORT OF THIS PAGE OF ABSTRACT
..........................................................