Embed Size (px)
Citation preview
MAINTENANCE OPERATIONS DEGRADATION OF
AIRFIELD PAVEMENT MARKINGS
John C. Jaszkowiak, Capt
AFIT/GEM/ENV/12-M09
DEPARTMENT OF THE AIR FORCE AIR UNIVERSITY
AIR FORCE INSTITUTE OF TECHNOLOGY
Wright-Patterson Air Force Base, Ohio
DISTRIBUTION STATEMENT A.
APPROVED FOR PUBLIC RELEASE; DISTRIBUTION UNLIMITED
The views expressed in this article are those of the author and do not reflect the official
policy or position of the United States Air Force, Department of Defense, or the United
States Government. This material is declared a work of the United States Government
and is not subject to copyright protection in the United States.
AFIT/GEM/ENV/12-M09
MAINTENANCE OPERATIONS DEGRADATION OF
AIRFIELD PAVEMENT MARKINGS
THESIS
Presented to the Faculty
Department of Systems and Engineering Management
Graduates School of Engineering and Management
Air Force Institute of Technology
Air University
Air Education and Training Command
In Partial Fulfillment of the Requirements for the
Degree of Master of Science in Engineering Management
John C. Jaszkowiak, BS
Captain, USAF
March 2012
DISTRIBUTION STATEMENT A.
APPROVED FOR PUBLIC RELEASE; DISTRIBUTION UNLIMITED
AFIT/GEM/ENV/12-M09
MAINTENANCE OPERATIONS DEGRADATION OF
AIRFIELD PAVEMENT MARKINGS
John C. Jaszkowiak, BS
Captain, USAF
Approved:
_________________//signed// _________________________ ___9 Mar 12__
Lieutenant Colonel William E. Sitzabee, PhD, P.E. (Chairman) Date
_________________//signed// _________________________ ___24 Feb 12__
Lieutenant Colonel Tay W. Johannes, PhD, P.E. Date
_________________//signed// _________________________ ___24 Feb 12__
Edward D. White III, PhD Date
iv
AFIT/GEM/ENV/12-M09
Abstract
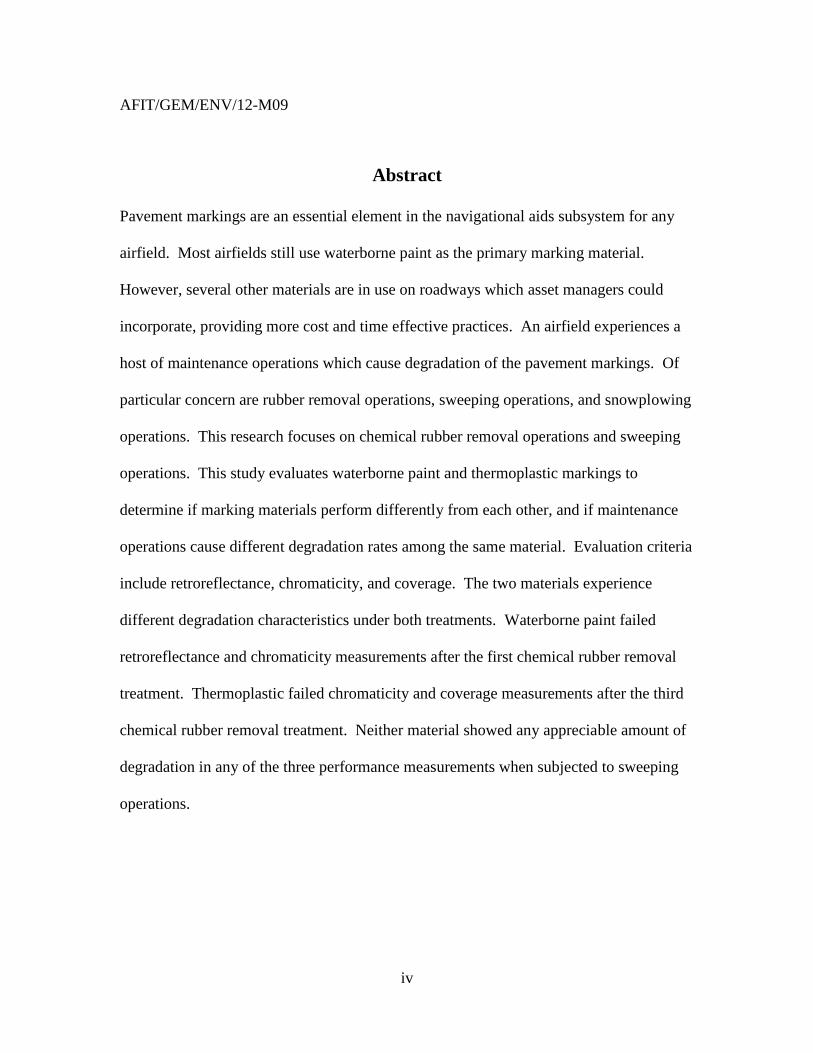
Pavement markings are an essential element in the navigational aids subsystem for any
airfield. Most airfields still use waterborne paint as the primary marking material.
However, several other materials are in use on roadways which asset managers could
incorporate, providing more cost and time effective practices. An airfield experiences a
host of maintenance operations which cause degradation of the pavement markings. Of
particular concern are rubber removal operations, sweeping operations, and snowplowing
operations. This research focuses on chemical rubber removal operations and sweeping
operations. This study evaluates waterborne paint and thermoplastic markings to
determine if marking materials perform differently from each other, and if maintenance
operations cause different degradation rates among the same material. Evaluation criteria
include retroreflectance, chromaticity, and coverage. The two materials experience
different degradation characteristics under both treatments. Waterborne paint failed
retroreflectance and chromaticity measurements after the first chemical rubber removal
treatment. Thermoplastic failed chromaticity and coverage measurements after the third
chemical rubber removal treatment. Neither material showed any appreciable amount of
degradation in any of the three performance measurements when subjected to sweeping
operations.

v
AFIT/GEM/ENV/12-M09
This work is first and foremost dedicated to my beloved wife
vi
Acknowledgements
I would like to express my appreciation to my research advisor, Lt Col William
Sitzabee for his support throughout this thesis effort. I would also like to thank the Air
Force Research Laboratory’s Airbase Technologies Directorate and the 88th
Air Base
Wing Civil Engineer Directorate for their sponsorship and generous provision of the
experiment set-up and execution used in this research, without which this research would
have not been possible.
I am also indebted to Dr. Edward White for his professionalism and willingness to
repeatedly explain the statistical process as well as Lt Col Tay Johannes for his
professionalism and assistance in the finalizing this research effort.
John C. Jaszkowiak
vi
Table of Contents
Page
Abstract .............................................................................................................................. iv
Acknowledgements ............................................................................................................ vi
List of Figures ......................................................................................................................x
List of Tables ..................................................................................................................... xi
List of Acronyms .............................................................................................................. xii
Chapter 1: Problem Statement .............................................................................................1
1.1 Introduction ................................................................................................................1
1.2 Background ................................................................................................................2
1.3 Problem Statement .....................................................................................................4
1.4 Research Questions ....................................................................................................5
1.5 Research Approach ....................................................................................................5
1.6 Scope ..........................................................................................................................5
1.7 Significance of Study .................................................................................................6
1.8 Definition of Terms ...................................................................................................6
1.8.1 Retro-reflectivity .................................................................................................7
1.8.2 Chromaticity .......................................................................................................8
1.8.3 Coverage ...........................................................................................................10
1.9 Organization/Purpose of Remaining Chapters ........................................................11
vii
Page
Chapter 2: Summary of Literature .....................................................................................12
2.1 Literature Review ....................................................................................................12
2.2 Pavement Marking Materials ...................................................................................12
2.2.1 Bagot (1995) .....................................................................................................14
2.2.2 Cyrus and Frierson (2006) ................................................................................14
2.2.3 Cyrus and Previti (2008) ...................................................................................15
2.3 Pavement Marking Material Additives ....................................................................16
2.3.1 Ates (1995) .......................................................................................................17
2.3.2 Previti, Cyrus, Gallagher (2010) .......................................................................18
2.4 Pavement Marking Layout ......................................................................................19
2.4.1 USAF ETL 04-2 (2004) ....................................................................................19
2.4.2 Spit Plot Design ................................................................................................19
2.5 Treatments ...............................................................................................................20
2.6 Evaluation Criteria ...................................................................................................21
2.7 Statistical Analysis ...................................................................................................21
2.8 Review .....................................................................................................................22
Chapter 3: Methodology ....................................................................................................23
3.1 Introduction ..............................................................................................................23
viii
Page
3.2 Experiment 1 ............................................................................................................23
3.2.1 Marking Material ..............................................................................................24
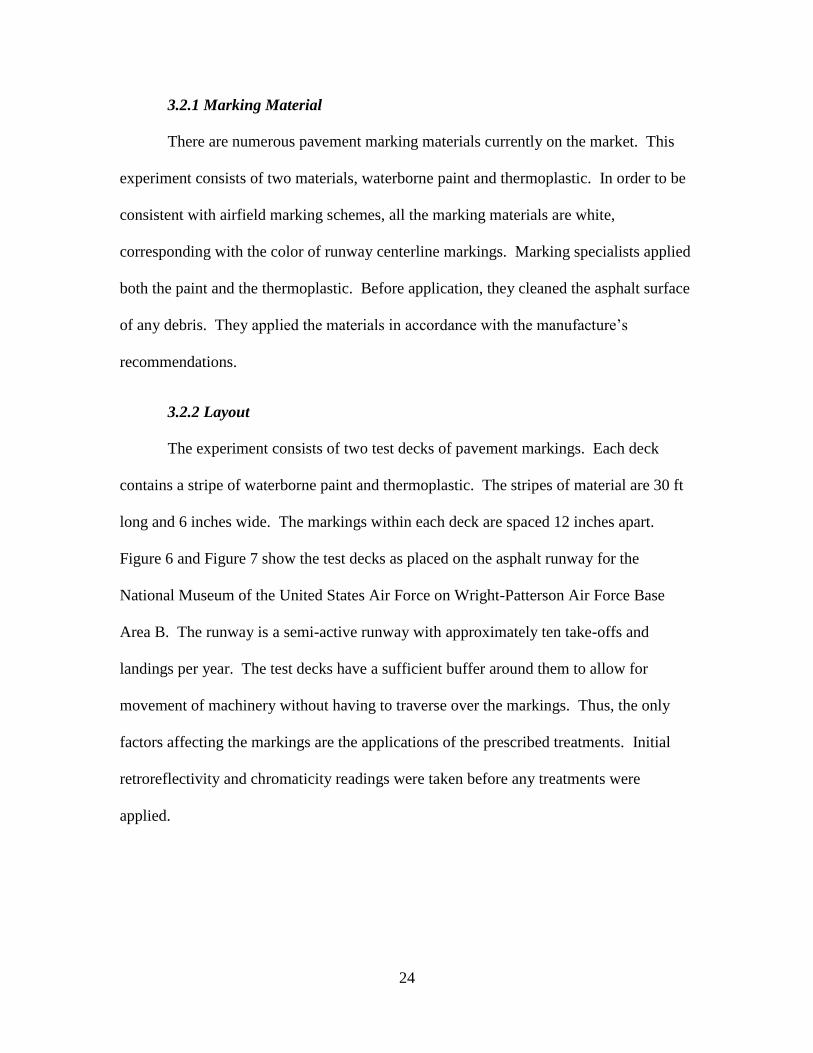
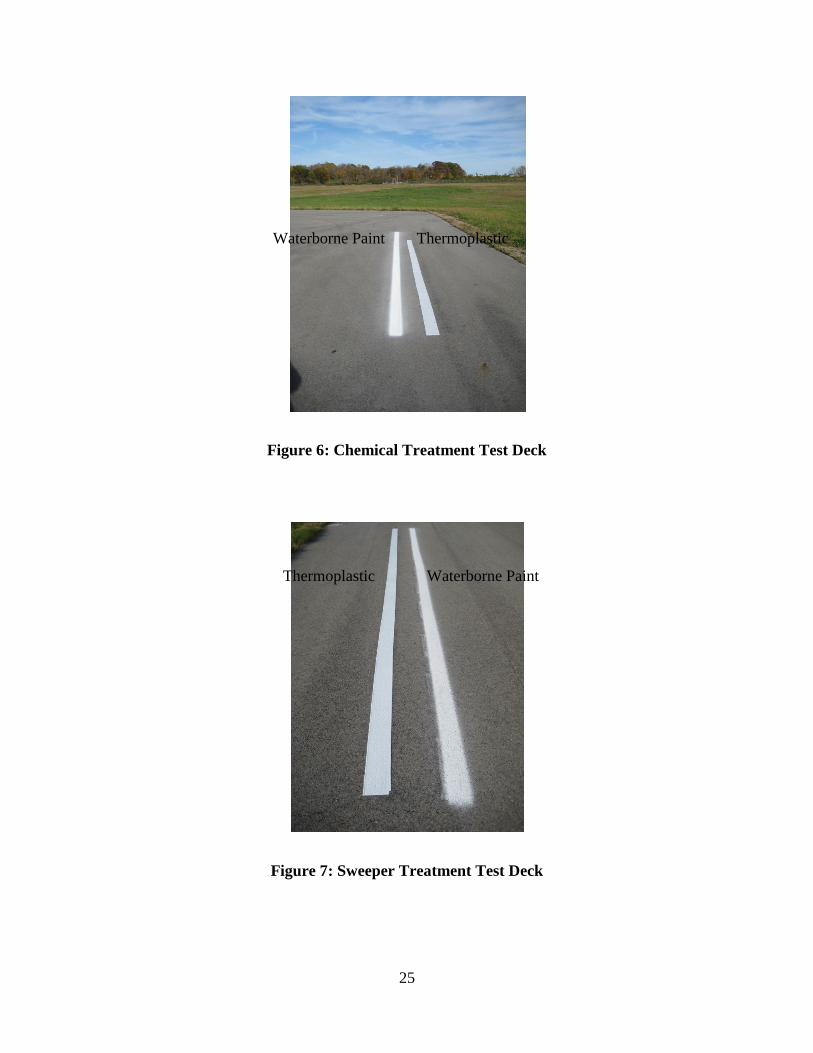
3.2.2 Layout ...............................................................................................................24
3.2.3 Glass Beads .......................................................................................................26
3.2.4 Pavement Type .................................................................................................26
3.2.5 Treatments ........................................................................................................26
3.2.6 Evaluation Criteria ............................................................................................29
3.3 Experiment 2 ............................................................................................................32
3.3.1 High Pressure Water .........................................................................................33
3.3.2 Ultra-High Pressure Water ...............................................................................33
3.4 Matched Pair Analysis .............................................................................................34
Chapter 4: Results & Analysis ...........................................................................................36
4.1 Introduction ..............................................................................................................36
4.2 Chemical Treatment Visual analysis .......................................................................37
4.3 Sweeper Treatment Visual Analysis ........................................................................43
4.4 Matched Pair Analysis .............................................................................................45
4.4.1 Chemical Treatment Test Deck Analysis .........................................................47
4.4.2 Sweeper Treatment Test Deck Analysis ...........................................................49
ix
Page
4.4.3 Paint vs. Paint Analysis Between Treatment Test Decks .................................52
4.4.4 Thermoplastic vs. Thermoplastic Analysis Between Treatment Test Decks ...54
4.5 Conclusion ...............................................................................................................55
Chapter 5: Conclusions ......................................................................................................56
5.1 Key Findings ............................................................................................................58
5.2 Future research .........................................................................................................59
Bibliography ......................................................................................................................60
Appendix A: Toolcat Training Certificate .........................................................................64
Appendix B: Chemical Rubber Removal Process .............................................................65
Appendix C: Toolcat Set-up and Specifications ................................................................66
Appendix D: Experiment 2 Design Layout .......................................................................67
Appendix E: Experiment Data ...........................................................................................68
Appendix F: t-statistic Test Results ...................................................................................84
x
List of Figures
Page
Figure 1 : Illustration of Retro-reflectivity ......................................................................... 8
Figure 2: CIE 1931 D65 Color Space Chromaticity Diagram ............................................. 9
Figure 3: FAA Standard Illuminant D65 Color Chart ........................................................ 10
Figure 4: Type I Bead Retroreflectance Characteristics ................................................... 18
Figure 5: Type III Bead Retroreflectance Characteristics ................................................ 18
Figure 6: Chemical Treatment Test Deck ......................................................................... 25
Figure 7: Sweeper Treatment Test Deck .......................................................................... 25
Figure 8: Toolcat Sweeper and Sprayer ............................................................................ 28
Figure 9: Transparent Grid Used for Measuring Coverage .............................................. 32
Figure 10: Chemical Treatment Test Deck Waterborne Paint Chromaticity Measurements
(nominal units) .................................................................................................................. 38
Figure 11: Catastrophic Failure of Thermoplastic ............................................................ 39
Figure 12: Thermoplastic Repositioned After Failure ...................................................... 40
Figure 13: Chemical Treatment Retroreflectance (mcd/m2/lux) ...................................... 40
Figure 14: Chemical Treatment Chromaticity x ............................................................... 41
Figure 15: Chemical Treatment Chromaticity y ............................................................... 41
Figure 16: Chemical Treatment Test Deck Thermoplastic Chromaticity Measurements 42
Figure 17: Sweeper Treatment Test Deck Waterborne Paint Chromaticity Measurements
........................................................................................................................................... 44
Figure 18: Sweeper Treatment Test Deck Thermoplastic Chromaticity Measurements .. 44
P
age
xi
List of Tables
Page
Table 1: FAA Studies of Possible Pavement Marking Materials ..................................... 13
Table 2: Retroreflective Bead Studies .............................................................................. 16
Table 3: Results for Chemical Treatment Test Deck ........................................................ 36
Table 4: Results for Sweeper Treatment Test Deck ......................................................... 37
Table 5: Initial Values Matched Pair Analysis ................................................................. 46
Table 6: Within Paint Comparison for the Chemical Treatment ...................................... 47
Table 7: Within Thermoplastic Comparison for the Chemical Treatment ....................... 48
Table 8: Between Paint and Thermoplastic for the Chemical Treatment ......................... 49
Table 9: Within Paint Comparison for the Sweeper Treatment ........................................ 50
Table 10: Within Thermoplastic Comparison for the Sweeper Treatment ....................... 51
Table 11: Between Paint and Thermoplastic for the Sweeper Treatment ........................ 52
Table 12: Paint Analysis Between Chemical and Sweeper Treatments ........................... 53
Table 13: Thermoplastic Analysis Between Chemical and Sweeper Treatments ............ 55
P
age
xii
List of Acronyms
ACC Asphalt Cement Concrete
AFI Air Force Instruction
ASTM American Society for Testing and Materials
CIE International Commission on Illumination
ETL Engineering Technical Letter
FAA Federal Aviation Administration
FOD Foreign Object Damage
ICAO International Civil Aviation Organization
PCC Portland Cement Concrete
USAF United States Air Force
USN United States Navy
1
MAINTENANCE OPERATIONS DEGRADATION OF
AIRFIELD PAVEMENT MARKINGS
Chapter 1: Problem Statement
1.1 Introduction
An airport is a relatively small area of land, but it receives an inordinately high
amount of attention in both time and resources. A working airport has an almost limitless
list of assets. Trying to manage all of these assets proves to be a monumental task. Each
asset behaves in its own unique way, affecting how it interacts with itself, and how it
interacts with other assets. One overarching asset is the pavement infrastructure. Within
this asset, there are subsystems which when incorporated constitute the pavement
infrastructure. This research effort focuses on the pavement markings subsystem.
In order to help focus this research on the pavement markings, a brief history of
different materials used for pavement markings is discussed in terms of which is best for
airfields when exposed to maintenance operations. One of the current problems of how
to best manage this asset will be addressed as well as some research questions to help
focus the effort. To answer these research questions, an outline of the experiment and
proposed methodology will be discussed. This discussion will also include assumptions
and limitations associated with the chosen research method. It will conclude with a
discussion of the proposed significance of the research, some definitions of terms used,
and what future research might focus on.
2
1.2 Background
Airfields use visual aids to include lights, signs, and pavement markings
throughout the pavement infrastructure to direct pilots and all other operators on the
airfield on where to park, where to taxi, where to drive, where to take off, and where to
land. The visual aids constitute a necessary system for safe and efficient operations on an
airfield; and the pavement markings are an integral subsystem of the overall visual aids
system.
Pavement markings degrade over time and require maintenance to sustain
effectiveness. Studies have shown that for roadway markings, depending on the marking
material, the marking is replaced anywhere from every 6 months to 10 years (Migletz &
Graham, 2002). Each time an airfield marking is replaced, that section of the airfield
must be shut down for an extended period of time (USAF 1997). The shutdown of the
airfield for a period of time is of great concern at airports which experience high volumes
of traffic, such as Al Udied Air Base in Qatar or O’Hare International Airport in Chicago.
For instance, one of the busier airfields in the military, Al Udied Air Base has an aircraft
taking-off or landing every ten minutes (AFCESA, 2007). In contrast O’Hare has three
aircraft landing or taking off every two minutes (Airports Council International, 2010).
The potential operational and economic impacts of having to shut down a section of
pavement for maintenance are quite high, especially if that section is on the runway.
Airfield managers need to select pavement marking materials which will coordinate well
with other planned maintenance on the airfield, to limit disruptions to the mission, pilots,
and passengers.
3
Normal airfield operations and maintenance activities have a damaging effect on
the airfield pavement system. Effective asset management of the pavement system will
help to keep operations running in the most cost effective way possible. Federal airport
marking standards describe what the markings placement, color, and style (Federal
Aviation Adminstration (FAA), 2010). However, regulations and standards do not make
good asset management plans on their own. Asset managers need to develop plans to
meet the standards while effectively and efficiently using money.
Airfields are subjected to constant maintenance activities to include rubber
removal, snow removal operations, and sweeping operations. Due to the build-up of
rubber in the touchdown and braking areas of runways, rubber removal operations are
necessary to maintain proper friction characteristics. The interval of rubber removal
operations depends on how many aircraft and of what type land on the runway each day.
Some airfields have such low traffic volume that they only need rubber removal once
every two years, while others have such high traffic volume, they need rubber removal
three times per year (Watkins, Boudreau, & Hansen, 2010). The current Air Force
practice is to restripe the runway after every rubber removal operation.
Snow removal operations also assist in maintaining proper friction characteristics
on the airfield surfaces. Each airfield has different standards on when to implement snow
removal operations. According to the Air Force Instruction (AFI) 32-1002, bases which
have an annual snowfall of six inches or more need to maintain a snow and ice removal
plan (Force, Air Force Instruction 32-1002: Snow and Ice Control, 1999). Mull
demonstrated that snow effects the life of a painted pavement marking(Mull & Sitzabee,
4
2011). Sweepers are employed on an as-needed basis from once per day, to several times
per day to make sure foreign object damage (FOD) is kept to a minimum (Patterson,
2011). These recurring maintenance operations have been shown to have a detrimental
effect on the life of a pavement marking.
According to the pavement marking synthesis accomplished by Migletz, et al.
there are nine different pavement marking materials in common use on roadways
(Migletz & Graham, 2002). Paint, by far is the most widely used material, followed by
thermoplastics. Each material has its own advantages and disadvantages to include life
cycle costs, expected life span, and ease of application.
1.3 Problem Statement
The question then becomes, which marking material is best suited for a particular
purpose on an airfield? There are two different areas of an airfield which this research
will focus on: the touchdown areas of the runway which experience rubber removal
operations and taxiways which experience sweeping operations. Each area experiences
different aircraft movements, maintenance operations, and marking needs.
Of the nine commonly used marking material types, this study focuses on only
two due to funding limitations: waterborne paint, an FAA approved marking material,
and thermoplastic, a material under development for use on runways (Federal Aviation
Adminstration (FAA), 2009). Each of these materials has different life cycles,
degradation characteristics, profiles, adherence properties, as well as many other
distinguishing characteristics. Solvent-based paint and methacrylate are other FAA
5
approved materials. However, these two materials are being phased out of use by
epoxies, thermoplastics, and polyurea.
1.4 Research Questions
To answer the problem presented, several questions need to be addressed. The
first is whether or not rubber removal operations have a significant effect on material
performance. Another related question is whether or not sweeping operations have a
significant effect on material performance. This research does not include the effects of
snow removal operations. If either, or both, of these factors do contribute significantly,
can that effect be quantified? Based on the answers to those questions, what then, is the
most efficient pavement marking material to use on each section of an airfield?
1.5 Research Approach
To answer the research questions, an extensive literature review was performed to
understand material performance and the current asset management practices in use. In
addition, data were obtained through empirical methods in a controlled experiment. The
experiment subjected the two marking materials to chemical rubber removal operations
and sweeping operations. During the course of the experiment retroreflectivity,
chromaticity, and coverage were evaluated on a regular basis. The data were then
analyzed using matched pair statistical methods.
1.6 Scope
This research effort will have some limitations, namely that not all the possible
material types will be tested. Not testing all the material types limits the asset

6
management plan to just the two, when in fact a different material could prove to be a
better fit for a particular application. Also, the controlled experiment will not be
conducted on an active airfield, thus not subjecting the markings to the normal wear and
tear they would have experienced. It is also not possible to determine ahead of time if the
markings will be taken to failure. If the markings do not fail, then an accurate service life
cannot be obtained.
1.7 Significance of Study
The resulting asset management plan from this study can be used by airfield
managers as a new baseline for determining which pavement marking material types are
best suited for different areas of their airfield. This will also help them to manage
projects and other maintenance activities more efficiently by knowing which material to
install based on service life, location, and planned construction. In the end, the asset
management plan developed here will help airfield managers to operate more efficiently,
resulting in fewer delays which means more time the airfield is open for operations and
missions, as well as decreasing the overall cost of maintaining the airfield. The Civil
Engineer Commodity Council (CECC) will be able to use the results to help strategically
source markings for the Air Force, with a projected savings of $21 million over the next
five years (Council, 2011).
1.8 Definition of Terms
Several terms are used throughout this study which require specific attention to
define. Retro-reflectivity, chromaticity, and coverage are three measures of a pavement
marking’s effectiveness as defined by the FAA (Cyrus H. M., 2003).
7
1.8.1 Retro-reflectivity
Retro-reflectivity is one of the key measures of an airfield pavement marker’s
performance. As defined by the American Society for Testing and Materials (ASTM), it
is the amount of light, which after emitted from a headlight is reflected from the
pavement marker back to the driver (ASTM, 2005). Pavement markings contain glass
beads protruding from the surface, allowing light to pass through. The light refracts off
the back of the bead, picking up the marking color, and then reflects back to the driver.
The value of the reflection (RL) is measured in millicandelas per meter squared of
luminance (mcd/m2/lux) and is known as the retro-reflectivity value.
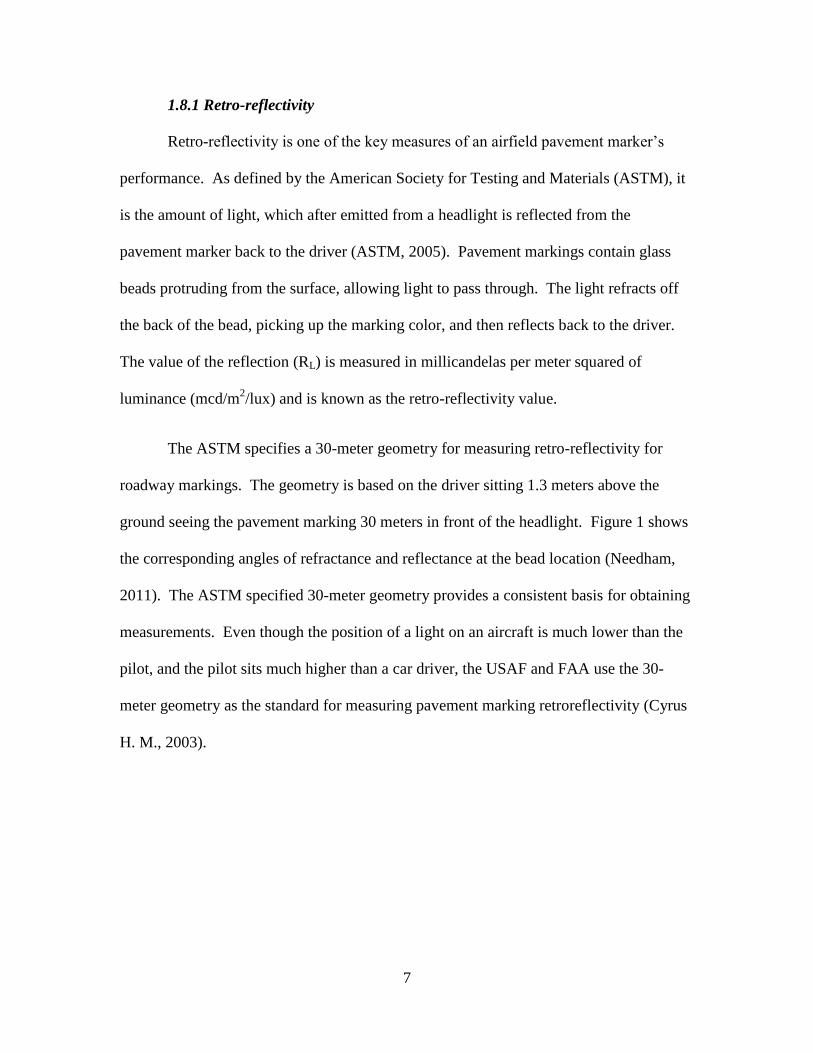
The ASTM specifies a 30-meter geometry for measuring retro-reflectivity for
roadway markings. The geometry is based on the driver sitting 1.3 meters above the
ground seeing the pavement marking 30 meters in front of the headlight. Figure 1 shows
the corresponding angles of refractance and reflectance at the bead location (Needham,
2011). The ASTM specified 30-meter geometry provides a consistent basis for obtaining
measurements. Even though the position of a light on an aircraft is much lower than the
pilot, and the pilot sits much higher than a car driver, the USAF and FAA use the 30-
meter geometry as the standard for measuring pavement marking retroreflectivity (Cyrus
H. M., 2003).
8
Figure 1 : Illustration of Retro-reflectivity
1.8.2 Chromaticity
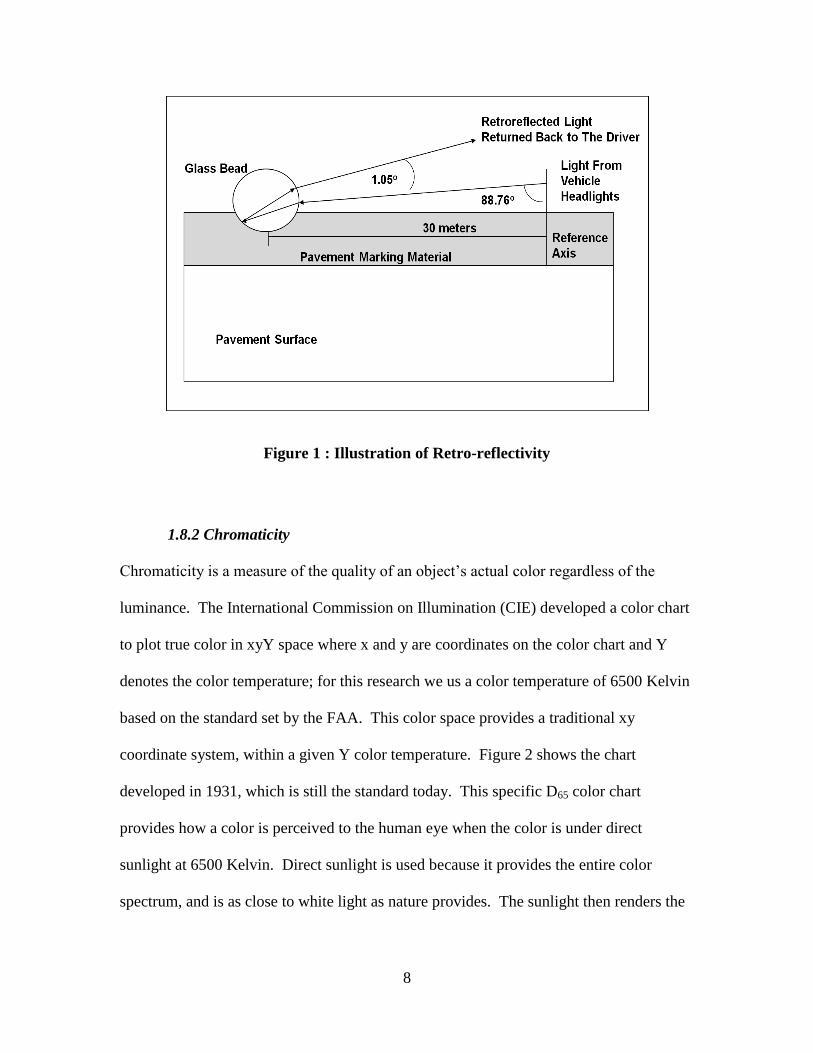
Chromaticity is a measure of the quality of an object’s actual color regardless of the
luminance. The International Commission on Illumination (CIE) developed a color chart
to plot true color in xyY space where x and y are coordinates on the color chart and Y
denotes the color temperature; for this research we us a color temperature of 6500 Kelvin
based on the standard set by the FAA. This color space provides a traditional xy
coordinate system, within a given Y color temperature. Figure 2 shows the chart
developed in 1931, which is still the standard today. This specific D65 color chart
provides how a color is perceived to the human eye when the color is under direct
sunlight at 6500 Kelvin. Direct sunlight is used because it provides the entire color
spectrum, and is as close to white light as nature provides. The sunlight then renders the
9
colors as close to their true color as the eye can distinguish. The researchers used a
spectrophotometer to measure the values of chromaticity. The device reads the color of
the sample, adjusting for the ambient light to produce an xy coordinate on the D65 color
chart. This xy coordinate shows what the true color of the sample is when under white
light.
Figure 2: CIE 1931 D65 Color Space Chromaticity Diagram
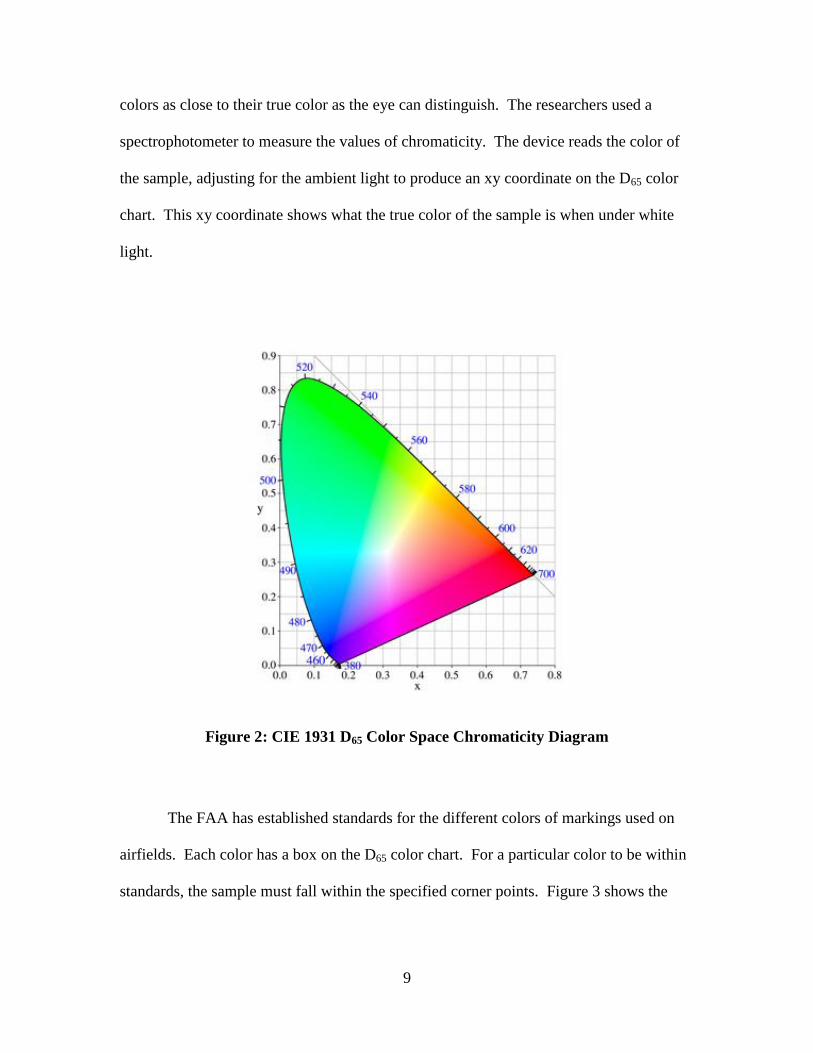
The FAA has established standards for the different colors of markings used on
airfields. Each color has a box on the D65 color chart. For a particular color to be within
standards, the sample must fall within the specified corner points. Figure 3 shows the
10
FAA standard D65 color chart used for evaluating a pavement marking’s failure. This
research effort focuses on just the white color region.
Figure 3: FAA Standard Illuminant D65 Color Chart
1.8.3 Coverage
Coverage is a measure of the amount of marking material which still remains on
the surface. The evaluation uses a 100 square inch transparent grid of 100 equal squares
of either 10x10 or 5x20. The number of squares which have material removed are
counted and subtracted from 100, thus giving a percent of material still left on the
11
pavement surface. Typically, several places along the pavement marking are chosen at
random for evaluation(Cyrus H. M., 2003).
1.9 Organization/Purpose of Remaining Chapters
The next section of this document will consist of a review of literature associated
with pavement markings and maintenance practices. Following that, a detailed
explanation of the experiment and analysis practices will be discussed. Then the data
results will be presented. After that, the results will be analyzed and recommendations
made for asset management practices and future research efforts.
12
Chapter 2: Summary of Literature
2.1 Literature Review
This chapter discusses the current practices and body of knowledge on how
different marking materials impact airfield operations. It also discusses specifications set
forth by the United States Air Force (USAF) and the Federal Aviation Administration
(FAA) for material selection, allowable maintenance operations, and dimensions of
pavement markings.
2.2 Pavement Marking Materials
There are many pavement marking materials in use today on the roadways of
America. A synthesis study conducted by Migletz et al. in 2002 showed there are four
materials which constitute over 90% of the roadway pavement markings currently in use.
However, only a small fraction of these are in use on America’s runways.
Table 1 provides a quick synopsis of the studies conducted by the FAA of current
and proposed pavement marking materials, the results obtained, and the resulting
recommendations.
13
Table 1: FAA Studies of Possible Pavement Marking Materials
Author Year Material Key Findings Recommendations
Bagot 1995 Water-borne
paint, epoxy, and
methacrylic resin
All materials showed
acceptable
characteristics for use
on airfields.
Epoxy demonstrated
high durability,
especially in
snowplow locations.
Epoxy demonstrated
yellowing after
extensive ultraviolet
exposure.
Materials are
suitable for use on
airfields.
Further research is
required.
Cyrus
and
Frierson
2006 Polyurea The material showed
poor performance in
high traffic areas.
Further research is
required.
Cyrus
and
Frierson
2006 Polyester The material
disintegrated after a
very short time and
should not be used on
airfields.
Do not use on any
section of an
airfield.
Cyrus
and
Previti
2008 Thermoplastic Material can be
applied to ACC as is
but needs an
additional binder
before placing on
PCC.
Material flakes
causing FOD and is
recommended for
only taxiway
applications.
Due to FOD
potential, limit use
to taxilanes.
Further research is
required.
Previti,
Cyrus,
and
Gallagher
2010 Retro-Reflective
Beads
Pilots could not
detect a difference
between Type I beads
and Type III beads
while on approach.
Pilots involved in the
study stated that they
do not use runway
markings while on
approach at night.
They use runway
lights for guidance
instead.
Either Type I or
Type III beads are
acceptable for use
on airfields.
14
2.2.1 Bagot (1995)
The scope of this study was to evaluate new marking materials for acceptable use
on airfields, as well as to conduct a cost-benefit analysis. This study evaluated five
different marking materials including: two water-borne paints, two epoxies, and one
methacrylic. The study was conducted at three different airports to take advantage of
differing climate conditions. The airports chosen were Atlantic City, Greater Pittsburgh,
and Phoenix Sky Harbor International Airports.
Each of the materials was evaluated over a one year time period, with monthly
evaluations for conspicuity, durability, rubber resistance, color retention, and friction.
The researcher concluded that all the materials are acceptable for use on airfields based
on the evaluation criteria, but recommended that additional research be conducted to
determine if a different catalyst for the epoxy would reduce the yellowing effect. He also
concluded that the epoxies and resin materials were more durable when subjected to
snowplow operations.
2.2.2 Cyrus and Frierson (2006)
In 2006, Cyrus and Frierson conducted two separate studies, one evaluating
polyurea and one evaluating polyester. Both studies were undertaken to evaluate the
effectiveness of polyurea or polyester as a potential pavement markings to be used on
airfields. The polyurea study showed that it was not effective in high traffic areas for
either ACC or PCC surfaces when using Type III beads. However, when using Type I
beads on PCC, the marking was still effective after six months. One of the significant
findings was that if polyurea is to be used, the surface must first be cleared of seal coats.

15
The report lacks clarification or discussion on why polyurea was not effective in
high traffic areas. Polyurea is a high durability marking material specifically designed
for high traffic applications on roadways. We believe additional research must be
accomplished to explain what specific conditions degrade polyurea to such a degree that
it is not usable in high traffic areas on an airfield, while remaining well suited for high
traffic areas on roadways.
The polyester study revealed that when used in simulated high traffic areas, the
material disintegrated after a single day. The recommendation therefore is not to use this
material for airfield markings.
2.2.3 Cyrus and Previti (2008)
This study evaluated the characteristics of thermoplastic marking materials at two
different airports. The study was conducted at the FAA test center in New Jersey as well
as Phoenix International Airport. The study had two significant findings. First,
thermoplastic material can be applied and used on asphalt cement concrete (ACC)
pavement as is, but must have an additional binder added when placed on Portland
cement concrete (PCC) pavement. The other finding was that because of the thickness of
the material, its tendency to flake off, and its low friction characteristics, it is suitable
only for taxiways. The material showed acceptable retroreflectivity, chromaticity, and
friction characteristics. “Currently, the FAA has no standard for retro-reflectivity limits.
A previous paint marking study conducted by the FAA Airport Safety Technology
Research and Development Section determined that the recommended minimum was 100
mcd/m2/lx for white and 70 mcd/m2/lx for yellow.” The FAA uses the same D65 Color
16
Chart as developed by the International Civil Aviation Organization (ICAO) as shown in
Figure 3 from section 1.8.2.
2.3 Pavement Marking Material Additives
Pavement markings on their own are not visible enough at night. Retroreflective
beads are added to the material either during the application or during the manufacturing
stage of the material. These beads come in either round beads of various sizes, or angular
pieces as highly reflective elements. Two studies, one by the FAA and one by AFCESA
evaluated the effect of different retroreflective additives to airfield pavement markings.
Table 2 summarizes the results from these studies.
Table 2: Retroreflective Bead Studies
Author Year Material Key Findings Recommendations
Ates 1995 Type I Beads vs
Type III Beads Despite large
retroreflectance
differences, pilots
could not detect a
difference between the
two bead types.
Recommend use
Type I beads instead
of the much more
expensive Type III
beads.
Previti,
Cyrus,
and
Gallagher
2010 Retro-Reflective
Beads
Pilots could not detect
a difference between
Type I beads and Type
III beads while on
approach.
Pilots involved in the
study stated that they
do not use runway
markings while on
approach at night.
They use runway
lights for guidance
instead.
Either Type I or
Type III beads are
acceptable for use on
airfields.
17
2.3.1 Ates (1995)
From 1991 until 1995, AFCESA conducted a series of two tests evaluating Type I
beads versus Type III beads on active Air Force airfields. The first test consisted of two
taxiway markings separated by six inches reflectorized using Type I beads on one
marking and Type III beads on the other marking. Surveys of pilots demonstrated that
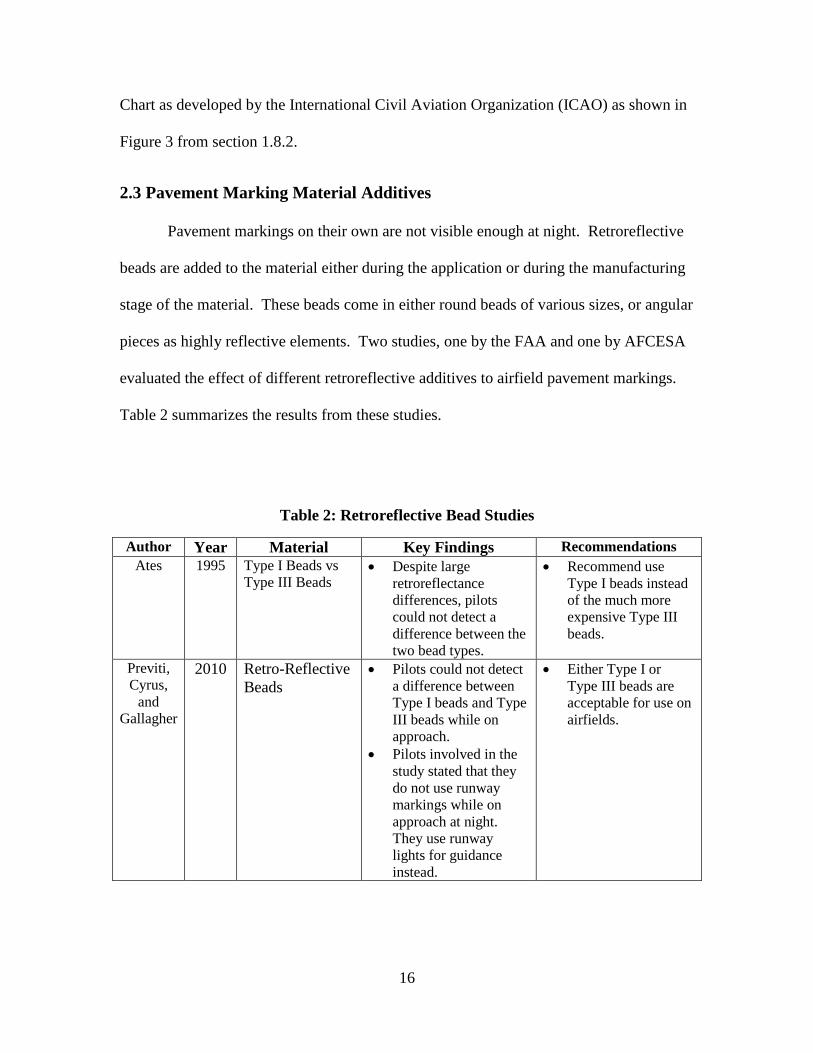
Type I beads are suitable for taxiway marking purposes. After approximately seven
months, both stripes had acceptable retroreflectance characteristics.
The second test compared the two bead types, but this time on opposite ends of a
runway. Again, after months of wear and tear, both markings demonstrated acceptable
retroreflectance characteristics. And, once again, the pilots surveyed were content with
the Type I bead performance.
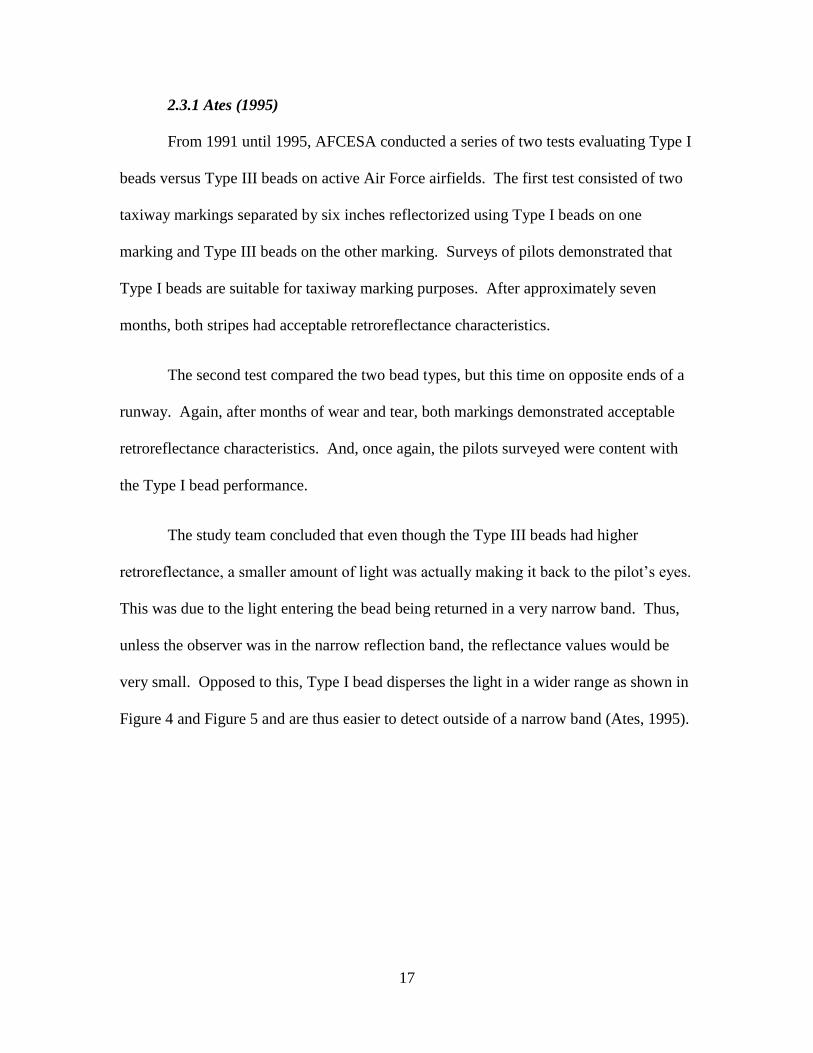
The study team concluded that even though the Type III beads had higher
retroreflectance, a smaller amount of light was actually making it back to the pilot’s eyes.
This was due to the light entering the bead being returned in a very narrow band. Thus,
unless the observer was in the narrow reflection band, the reflectance values would be
very small. Opposed to this, Type I bead disperses the light in a wider range as shown in
Figure 4 and Figure 5 and are thus easier to detect outside of a narrow band (Ates, 1995).
18
Figure 4: Type I Bead Retroreflectance Characteristics
Figure 5: Type III Bead Retroreflectance Characteristics
2.3.2 Previti, Cyrus, Gallagher (2010)
The FAA conducted a study evaluating the performance of standard Type I beads
and highly reflective Type III beads. The purpose of the study was to evaluate whether
there is an appreciable difference detectable by people between the two different bead
types. Despite Type III beads having a much higher initial retroreflectivity value, after
eight months, both the Type I sample and the Type III sample were effectively the same
in regards to retro-reflectivity readings. In addition to the measured readings, pilots were
19
asked to discern between the two different types. While on approach pilots reported at
distances ranging from 0.9 to 6.0 miles from the runway threshold no visual differences
between low-index Type I and high-index Type III installations. For nine out of ten
pilots, there was no difference at any time.
2.4 Pavement Marking Layout
2.4.1 USAF ETL 04-2 (2004)
This Engineering Technical Letter (ETL) designates the size, position, and shape
of all markings used on an airfield. All U.S. military services abide by this ETL for
marking surfaces. Of particular note are the runway markings and the taxiway markings.
Runway centerline markings vary in widths from 18 to 36 inches. Taxiway markings are
a standard six inches wide. These measurements provide the basis for the stripe sizes
used in the experiment for this thesis.
2.4.2 Spit Plot Design
Factorial experiments where one or more factors are difficult to change and the
others easier, utilize a split plot experiment design. The split plot design allows the
researcher to conduct treatments on a set, leaving one variable constant for that block.
For instance, if a researcher conducted an experiment with three temperature levels and
four stirring rates the factorial design calls for 24 runs. If the temperature is difficult to
change, the researcher is allowed to run all the tests at one temperature before moving
onto the next temperature. If this were to be a completely randomized design, all the
variables would have to be changed between runs, including temperature. The slit plot
20
essentially saves time and money by grouping treatments together, realizing that there
might be small effects within that block (Morris, 2011).
2.5 Treatments
Air Force Instructions (AFI) and Engineering Technical Letters (ETL) provide
instructions and recommendations for how a specific function on an Air Force Base will
operate. AFI 32-1002, Snow and Ice Control, provides instructions for the proper snow
and ice control so that the airfield will continue to operate in any of the given conditions.
The AFI states that the center of the runway must remain clear of snow throughout a
snowfall event. This includes using snowplows, sweepers, and snow blowers as
necessary to ensure a clear runway.
ETL 97-17 is a guide specification for rubber removal operations. The ETL
allows for several different rubber removal methods to include: high pressure water,
chemical detergent, high velocity abrasion, and grinding. High pressure water rubber
removal consists of using jets of water up to 15,000 psi to cut through and lift rubber off
of the runway. This process, if done well, will lift the rubber, but retain the pavement
markings and the integrity of the pavement surface. If done poorly, the pavement surface
and the pavement markings could suffer severe damage. Chemical rubber removal relies
on very high pH chemicals to eat away the rubber, while a sweeper and water wash the
solution off of the runway surface. High velocity abrasion uses the same principle as
high pressure water, but uses sand or metal pellets as the abrasive medium instead of
water. This process has the added complication of possibly leaving the medium on the
runway, needing extra attention for complete clean-up to prevent FOD. Grinding as a
21
rubber removal method removes the rubber as well as a thin layer of the top of the
pavement surface.
2.6 Evaluation Criteria
A study conducted by Cyrus was undertaken in order to establish a more uniform
and repeatable inspection process for pavement marking evaluation for the FAA. The
researcher, who is the head of the FAA’s pavement marking branch, determined that
retro-reflectivity, chromaticity, and coverage are the three evaluation criteria to be used in
order to determine if a pavement marking is failed or not. The research concluded that
“the retro-reflective threshold limit for yellow paint is 70 mcd/m²/lx and for white paint
100 mcd/m²/lx. The coverage threshold pass/fail limit is 50%(Cyrus H. M., 2003).” The
limits for chromaticity are the same as identified on the D65 Color Chart.
A retro-reflectometer set to the ASTM 30 meter geometry standard is used to
evaluate retro-reflectivity. The reto-reflectometer can be either handheld or vehicle
mounted. A spectrophotometer producing an xyY plot is used to evaluate chromaticity
levels. And, a 100 square inch transparent grid is used to determine the percent coverage
of the material.
2.7 Statistical Analysis
Experiments which are difficult to change one or more of the parameters rely on a
split plot design. Split plot experiment design allows for the experiment combinations to
be evaluated in batches instead of one at a time. A repeated measures experiment design
is a subset of split plot experiment designs. Repeated measures allows several
measurements to be taken on the same sample over time. The experiment used in this
22
research effort utilizes a repeated measures experiment design. In order to analyze the
repeated measures, the researchers used Matched Pair analysis. Matched Pair analysis
compares corresponding samples to each other and averages the differences in a set to
determine if there is a significant difference from one set to another.
2.8 Review
As this section shows, there are a number of pavement marking materials
currently on the market, but not being fully implemented on airfields due to a lack of
research and understanding of their performance in that environment. Additional
research needs to be conducted on epoxy, thermoplastic, and polyurea pavement
markings, as well as glass beads in order to understand the degradation characteristics
and potential safety concerns associated with each. The rest of this research effort
focuses on these materials as a starting point for developing degradation models for each
material. The research uses a split plot experiment layout to isolate and evaluate how
different treatments affect the various materials.
23
Chapter 3: Methodology
3.1 Introduction
The previous discussion has shown that there are several pavement marking
materials available for use, but few if any have actually made it to an active airfield. The
current asset management practices rely on incomplete information, and thus need
updating. A repeated measures split plot experiment was developed in order to help
identify suitable materials for airfield use, and degradation rates for those materials. This
chapter discusses two experiments. The first experiment, Experiment 1, is a small scale
experiment of two materials, two treatments, and one pavement type which will validate
the design of a much larger experiment. The second experiment, Experiment 2, is a large
scale experiment incorporating four marking materials, two bead types, four treatments,
and two pavement types. This research effort will not conduct Experiment 2, but will
confirm the design by using Experiment 1. For the sake of completeness, each
experiment is discussed in detail.
3.2 Experiment 1
The purpose of Experiment 1 is to evaluate the performance of different materials
against treatments seen on an airfield. The evaluations will provide degradation rates for
the materials in the given situations. Airfield managers may then use those degradation
rates to further develop asset management plans for airfields. This experiment will also
validate a larger scale experiment with more materials and treatments.
24
3.2.1 Marking Material
There are numerous pavement marking materials currently on the market. This
experiment consists of two materials, waterborne paint and thermoplastic. In order to be
consistent with airfield marking schemes, all the marking materials are white,
corresponding with the color of runway centerline markings. Marking specialists applied
both the paint and the thermoplastic. Before application, they cleaned the asphalt surface
of any debris. They applied the materials in accordance with the manufacture’s
recommendations.
3.2.2 Layout
The experiment consists of two test decks of pavement markings. Each deck
contains a stripe of waterborne paint and thermoplastic. The stripes of material are 30 ft
long and 6 inches wide. The markings within each deck are spaced 12 inches apart.
Figure 6 and Figure 7 show the test decks as placed on the asphalt runway for the
National Museum of the United States Air Force on Wright-Patterson Air Force Base
Area B. The runway is a semi-active runway with approximately ten take-offs and
landings per year. The test decks have a sufficient buffer around them to allow for
movement of machinery without having to traverse over the markings. Thus, the only
factors affecting the markings are the applications of the prescribed treatments. Initial
retroreflectivity and chromaticity readings were taken before any treatments were
applied.
25
Figure 6: Chemical Treatment Test Deck
Figure 7: Sweeper Treatment Test Deck
Waterborne Paint Thermoplastic
Thermoplastic Waterborne Paint
26
3.2.3 Glass Beads
Overall, there are four sizes and shapes of beads on the market. These include
Type I highway or standard, Type III airport, Type IV large, and highly reflective
elements. Of the four bead types, this experiment calls for just one, the smaller Type I
highway bead. As Needham noticed, bead type effects the degradation characteristics of
a polyurea pavement marking; markings with Type I beads degrading differently than
markings with highly reflective elements (Needham, 2011). The FAA has not authorized
highly reflective elements to be used on airfields as of yet (Speidel, 2008). This study
will use Type I beads because of availability and the use on Air Force runways (Force,
2010).
3.2.4 Pavement Type
There are typically two types of pavement currently is use on airfields, Portland
Cement Concrete (PCC) and Asphalt Cement Concrete (ACC). The experiment uses
only ACC pavement. The test location is at one end of a semi-active airfield. The
airfield experiences approximately ten landings a year. Additionally, a recent
construction project provided a new wearing course for the runway. Although the test is
not on an active airfield, the surface is the same as would be found on an active airfield.
3.2.5 Treatments
This experiment consists of two treatments, sweeping and chemical rubber
removal. Both operations are allowed under current Air Force practices (United States
Air Force (USAF), 1997). The results for that analysis are discussed at length in the next
chapter.
27
3.2.5.1 Sweeping
A Tymco model 500x sweeper was used to apply the sweeping treatments to the
pavement markings. An operator trained on this particular sweeper, and familiar with
airfield sweeping operated the equipment for all treatment applications. The overall
sweeping width was wide enough to facilitate a single pass to cover the entire test deck
and thus obtaining a uniform treatment application across all the markings in that test
deck. The first treatment consisted of 25 passes of the sweeper over the test deck; the
second and third treatments consisted of 30 and 150 passes respectively. The number of
passes used for the first treatment roughly corresponds to the number of passes a sample
location on an airfield would experience in a six month period.
3.2.5.2 Chemical Rubber Removal
The researchers were trained and used the Air Force approved chemical rubber
removal process for application of the treatments. A copy of the training certificate is
found in Appendix A and a detailed description of the process is found in Appendix B:
Chemical Rubber Removal Process. The Air Force Research Lab’s Airbase
Technologies Directorate currently uses Avion50 as the preferred chemical in airfield
rubber removal. With a pH of 14, Avion50 is a highly basic substance which deteriorates
the rubber. To aid in the deterioration of the rubber, the chemical is agitated with a wire
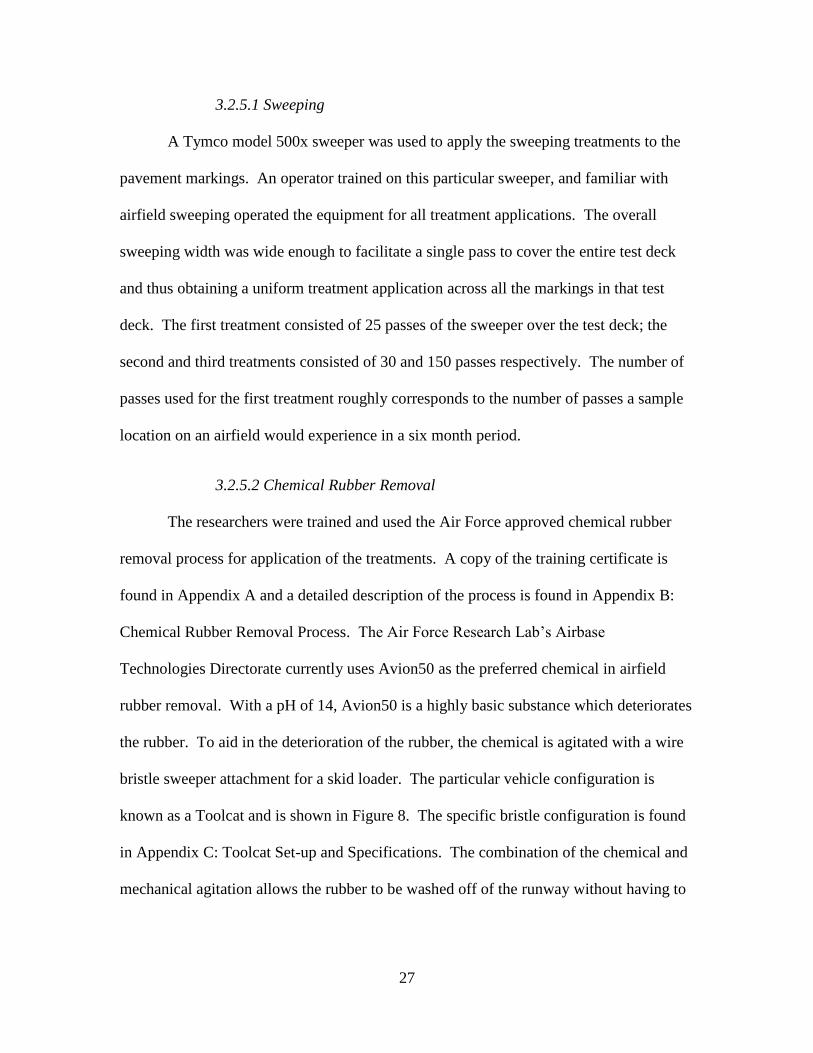
bristle sweeper attachment for a skid loader. The particular vehicle configuration is
known as a Toolcat and is shown in Figure 8. The specific bristle configuration is found
in Appendix C: Toolcat Set-up and Specifications. The combination of the chemical and
mechanical agitation allows the rubber to be washed off of the runway without having to
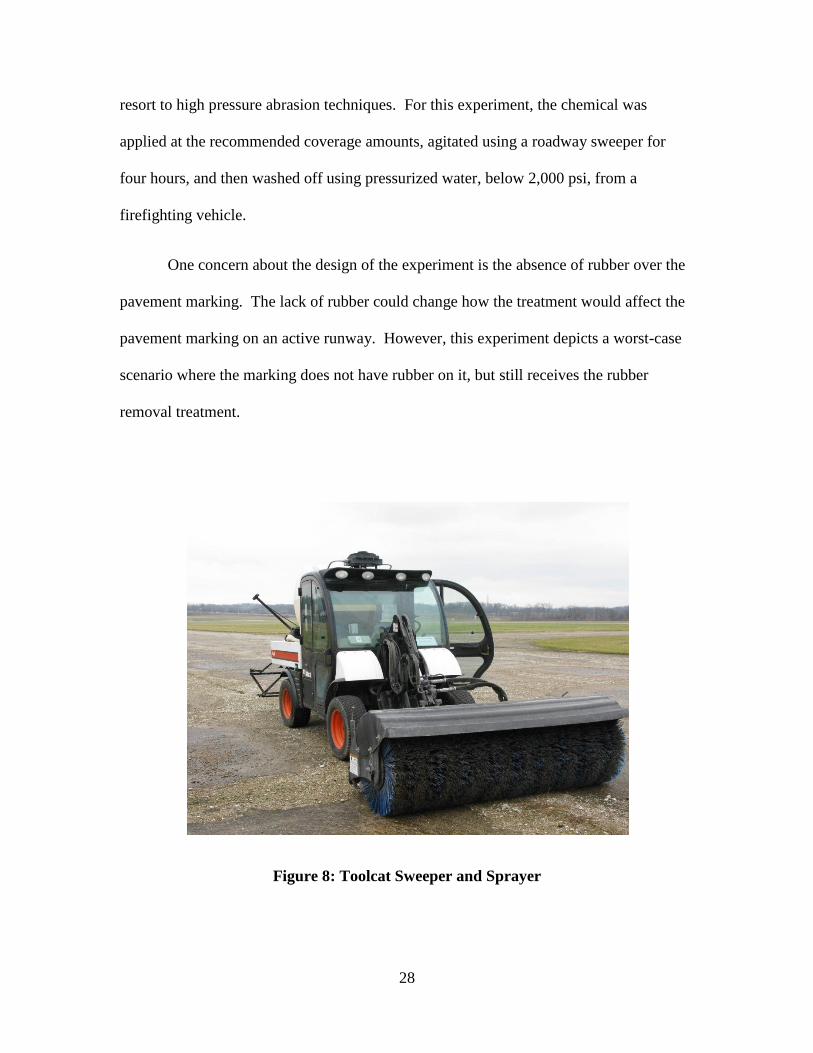
28
resort to high pressure abrasion techniques. For this experiment, the chemical was
applied at the recommended coverage amounts, agitated using a roadway sweeper for
four hours, and then washed off using pressurized water, below 2,000 psi, from a
firefighting vehicle.
One concern about the design of the experiment is the absence of rubber over the
pavement marking. The lack of rubber could change how the treatment would affect the
pavement marking on an active runway. However, this experiment depicts a worst-case
scenario where the marking does not have rubber on it, but still receives the rubber
removal treatment.
Figure 8: Toolcat Sweeper and Sprayer
29
3.2.6 Evaluation Criteria
A sample of material consists of one linear foot of marking. Thus, a single 30
foot marking accounts for 30 different samples of that material. The researchers
evaluated each sample on the three failure criteria designated by the FAA:
retroreflectivity, chromaticity, and coverage(Cyrus H. M., 2003). Measurements for each
criterion were taken before the first treatment and after each subsequent application of the
treatments.
3.2.6.1 Retroreflectivity
Retroreflectivity, one of the main indicators of a pavement marker’s effectiveness,
is the measure of how much light from a headlight reflects off of the marking and is
directed back to the driver’s eye (ASTM 2005). Roadway markings use the 30-meter
geometry, as set forth by ASTM. The FAA uses the same geometry to measure markings
on airfields (Cyrus & Previti, 2008). This study measures retroreflectivity with the same
set-up. The FAA has established for white pavement markings, the minimum value for
retroreflectivity is 100 mcd/m2/lux.
A portable LTL-X retro-reflectometer was used to measure the retro-reflectance
values for the pavement markings. The retro-reflectometer measures retro-reflectance
using the ASTM 30-meter geometry. The researchers calibrated the device with the
manufacturer supplied office calibration block before taking any measurements. Also, at
the start of each day of taking measurements, we calibrated the device in the field using
the manufacturer supplied field block, and again anytime there was a drastic shift in
weather conditions.
30
3.2.6.2 Chromaticity
Chromaticity is the measure of the color of the marking. The FAA and the USAF
have standard color values for each color. Within the standard, there is also a range that
the color is allowed to deviate from. Chromaticity measures the color to determine if the
marking is still within the specified range. The researchers used a Spectro-Duo
spectrophotometer to measure the sample’s chromaticity. The spectrophotometer
measures the sample and displays the corresponding xy coordinate for the D65 color chart.
The sample coordinate is then compared to the coordinates given by the FAA for an
acceptable white color marking.
The Spectro-Duo needed no calibration. Two methods were discussed for
obtaining chromaticity measurements. The first, using a white calibration puck to
measure ambient conditions. The second, using an enclosed white box with an
independent light source. The measurements would be taken inside the box, providing
consistent lighting conditions with no need for later translations. Since the markings
need to appear white to operators on the airfield under a variety of environmental
conditions this research effort chose to use the ambient light conditions. In an effort to
measure ambient conditions, the researchers first measured a white puck before
measuring a test stripe. The white puck is pure white, with no other colors present.
Thus, the puck measurement gives the chart position for what pure white looks like for
that specific environmental condition. If the puck measurements fall within the
acceptable white range on the D65 color chart, then the markings should also fall within
the acceptable range if they are still white. If the puck measurements do not fall within
31
the acceptable white range, then the measurement for the puck and the measurements for
the test stripe need to be translated to an acceptable range. As Chapter 4 shows, all the
puck measurements fall within the specified range, and therefore the process for
translating the measurements need not be discussed here.
3.2.6.3 Coverage
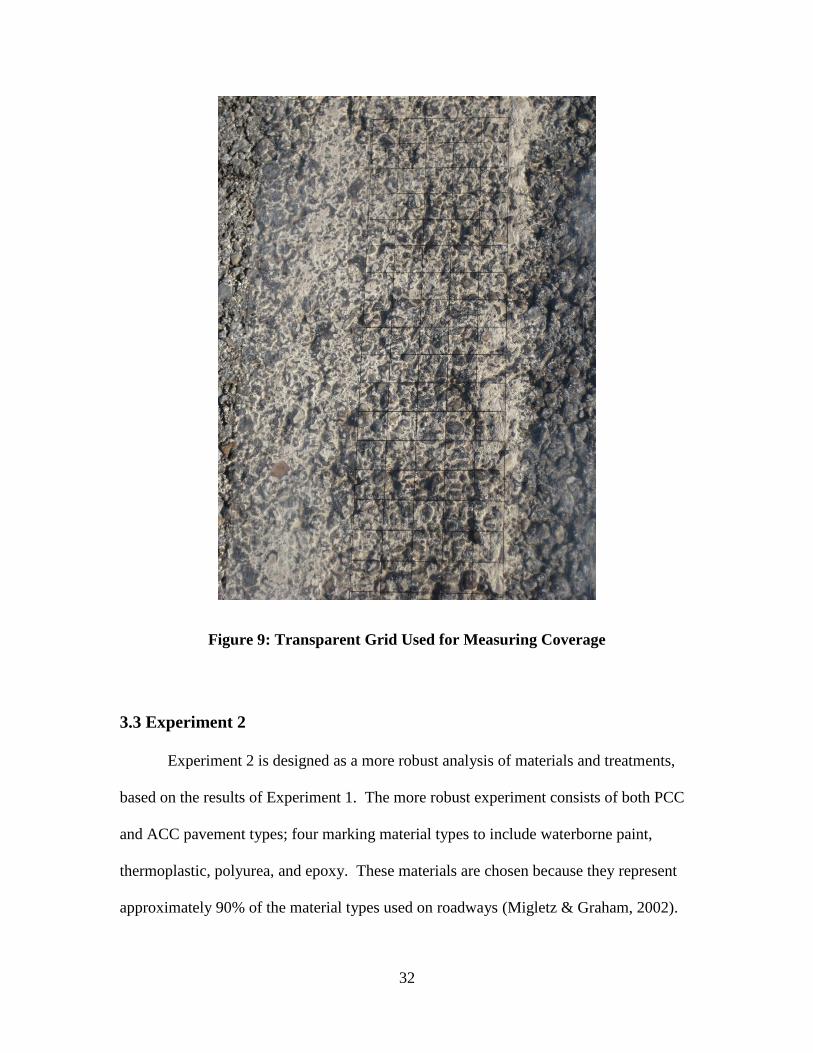
Coverage is evaluated using a 25 square inch transparent sheet. The sheet is
divided into 100 blocks, each 0.25 inches square, with 20 rows and 5 columns. The
researchers placed the sheet on the sample marking and counted the number of squares
which showed pavement instead of just marking material as demonstrated in Figure 9.
The number of squares showing more than 50 percent pavement was subtracted from 100
to give the percent coverage remaining. If the overall coverage is less than 50%, the
marking fails.
32
Figure 9: Transparent Grid Used for Measuring Coverage
3.3 Experiment 2
Experiment 2 is designed as a more robust analysis of materials and treatments,
based on the results of Experiment 1. The more robust experiment consists of both PCC
and ACC pavement types; four marking material types to include waterborne paint,
thermoplastic, polyurea, and epoxy. These materials are chosen because they represent
approximately 90% of the material types used on roadways (Migletz & Graham, 2002).
33
Additionally, the design guides produced by the Federal Aviation Administration (FAA),
the United States Air Force (USAF), and the United States Navy (USN) all agree on these
materials as potential materials to be used on airfields. At least three treatments to
include high pressure water rubber removal, ultra-high pressure water rubber removal,
and chemical rubber removal. Appendix D demonstrates a notional layout of the
materials and treatments.
3.3.1 High Pressure Water
The high pressure water treatment truck needs to meet Air Force specified
standards. To be considered high pressure, the truck must be able to eject water between
4,000 psi and 15,000 psi. In order for the truck to be considered sufficient, it needs to
demonstrate proper water pressure and rubber removal capabilities on a test strip. The
Contracting Officer oversees the test strip and, in conjunction with the Civil Engineer,
approves or disapproves the truck (Force, 2010). The effective width of the treatment is
20 inches, thus each pavement marking is treated separately. The jet head is powered up
and runs until reaching a consistent state before beginning the application of the
treatment for each marking. Or, the machine powers up to a constant velocity before
beginning the application. Once application of the treatment starts, the operator does not
turn the machine off until all the markings have received the treatment for that specific
run.
3.3.2 Ultra-High Pressure Water
Although not currently approved, ultra-high pressure water rubber removal is
being considered for inclusion in the Air Force’s Rubber Removal ETL. Ultra-high

34
pressure water operates under the same basic principle as high pressure water rubber
removal. The difference is that ultra-high pressure water rubber removal requires a
nozzle pressure of over 40,000 psi. The same specifications hold for this treatment as for
high pressure water rubber removal. The truck will reach a constant operating condition
before application to the pavement markings. Once the truck has started application, it
will not be shut down until all markings are complete.
3.4 Matched Pair Analysis
Repeated measures designs can be described in terms of the between-subjects
design and the within-subjects design. The between-subjects design refers to the
treatment design and the experiment design used for the experimental units. The within-
subjects design refers to the repeated measures on each experimental unit. This
experiment has two “treatments” (materials) for the between-subjects design. The
within-subjects design consists of repeated measures on each sample section.
The researchers used Matched Pair analysis to determine if samples from the
repeated measures experiment are statistically different from each other. The overall
research αe=0.05. Using the Bonferroni approach for determining each t-test significance
level, the αc=0.004 for each individual test. When conducting analysis within a test
stripe, the matched pair consisted of the values obtained after a treatment compared
against the immediate previous value. So, treatment one is compared against initial,
treatment two is compared against treatment one, and treatment three is compared against
treatment two. When conducting analysis between test stripes, the matched pair consists
of the differences between the treatments. Thus, the difference from the initial value and
35
the first treatment of one stripe is compared against the corresponding difference from the
other test stripe. The following chapters discuss the analysis and results from visual
inspections of the materials as well as the matched pair results. Recommendations for
asset managers and future research options follow the analysis and results.
36
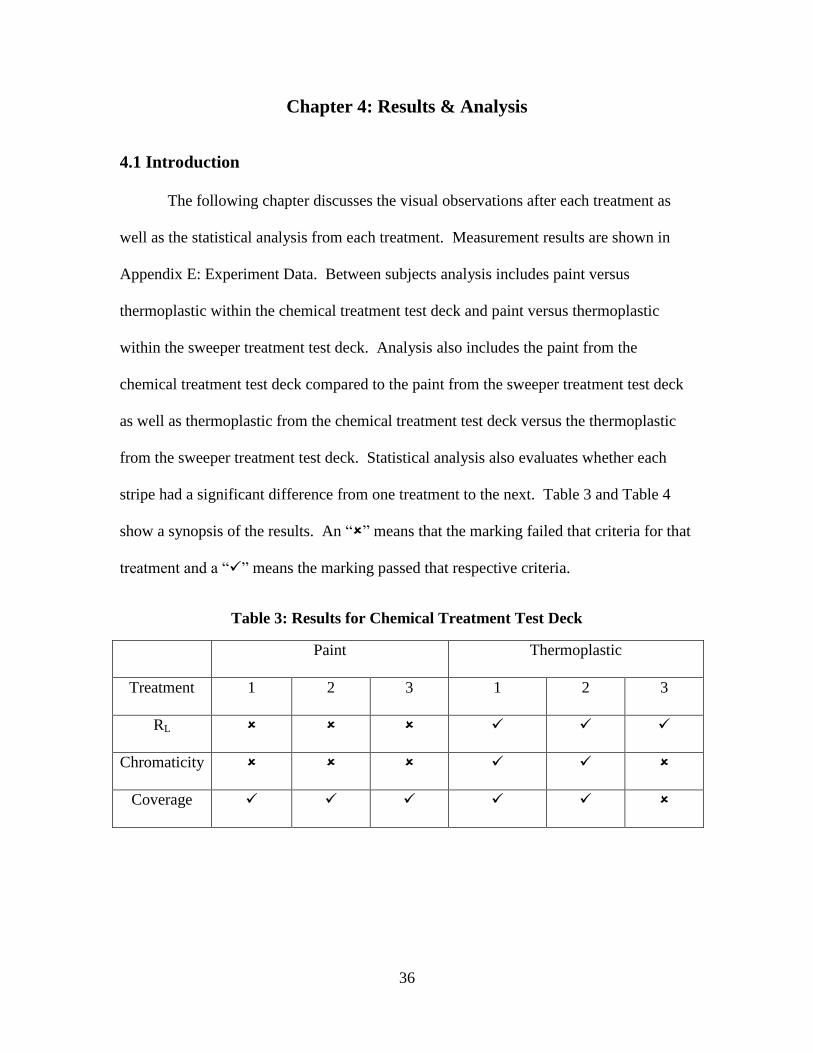
Chapter 4: Results & Analysis
4.1 Introduction
The following chapter discusses the visual observations after each treatment as
well as the statistical analysis from each treatment. Measurement results are shown in
Appendix E: Experiment Data. Between subjects analysis includes paint versus
thermoplastic within the chemical treatment test deck and paint versus thermoplastic
within the sweeper treatment test deck. Analysis also includes the paint from the
chemical treatment test deck compared to the paint from the sweeper treatment test deck
as well as thermoplastic from the chemical treatment test deck versus the thermoplastic
from the sweeper treatment test deck. Statistical analysis also evaluates whether each
stripe had a significant difference from one treatment to the next. Table 3 and Table 4
show a synopsis of the results. An “” means that the marking failed that criteria for that
treatment and a “” means the marking passed that respective criteria.
Table 3: Results for Chemical Treatment Test Deck
Paint Thermoplastic
Treatment 1 2 3 1 2 3
RL
Chromaticity
Coverage
37
Table 4: Results for Sweeper Treatment Test Deck
Paint Thermoplastic
Treatment 1 2 3 1 2 3
RL
Chromaticity
Coverage
4.2 Chemical Treatment Visual analysis
The paint which experienced the chemical treatment failed after the first treatment
application. The retroreflectivity started with a mean above 200 mcd/m2/lux, but after the
first treatment the mean had dropped below 90 mcd/m2/lux; a failing level according to
both the USAF and the FAA. Additionally, the chromaticity levels which had started
within the specified range had moved outside the range after every treatment application.
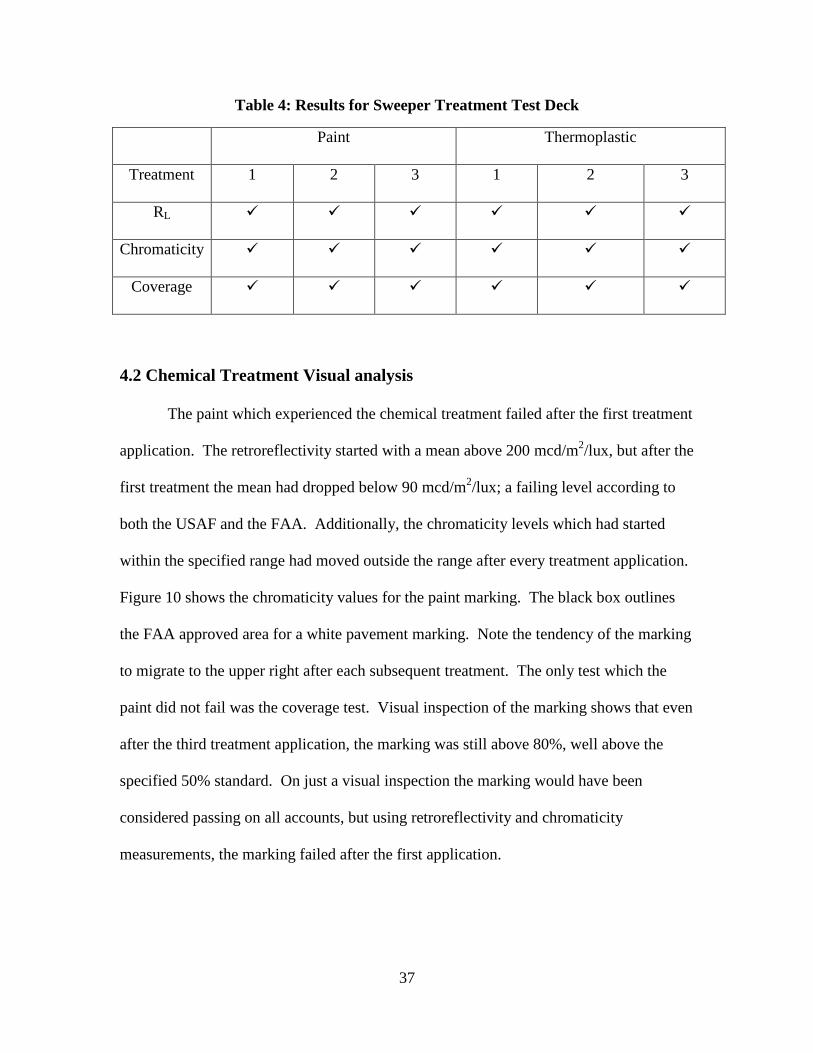
Figure 10 shows the chromaticity values for the paint marking. The black box outlines
the FAA approved area for a white pavement marking. Note the tendency of the marking
to migrate to the upper right after each subsequent treatment. The only test which the
paint did not fail was the coverage test. Visual inspection of the marking shows that even
after the third treatment application, the marking was still above 80%, well above the
specified 50% standard. On just a visual inspection the marking would have been
considered passing on all accounts, but using retroreflectivity and chromaticity
measurements, the marking failed after the first application.
38
Figure 10: Chemical Treatment Test Deck Waterborne Paint Chromaticity
Measurements (nominal units)
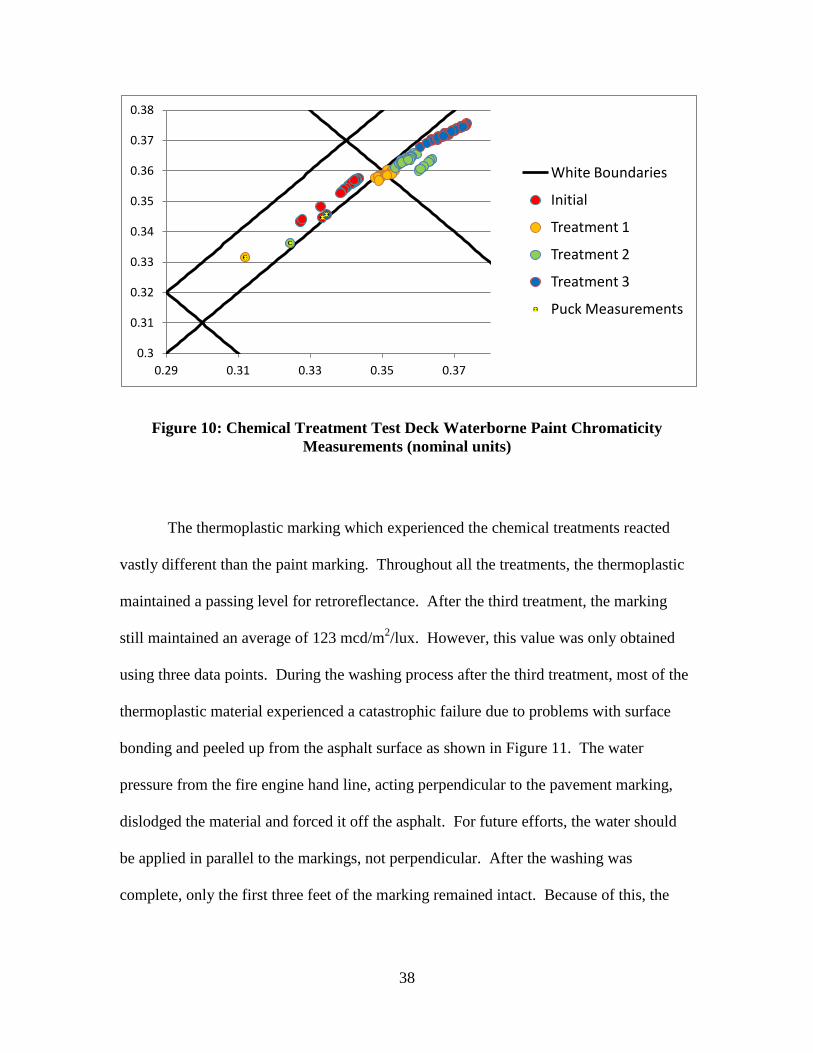
The thermoplastic marking which experienced the chemical treatments reacted
vastly different than the paint marking. Throughout all the treatments, the thermoplastic
maintained a passing level for retroreflectance. After the third treatment, the marking
still maintained an average of 123 mcd/m2/lux. However, this value was only obtained
using three data points. During the washing process after the third treatment, most of the
thermoplastic material experienced a catastrophic failure due to problems with surface
bonding and peeled up from the asphalt surface as shown in Figure 11. The water
pressure from the fire engine hand line, acting perpendicular to the pavement marking,
dislodged the material and forced it off the asphalt. For future efforts, the water should
be applied in parallel to the markings, not perpendicular. After the washing was
complete, only the first three feet of the marking remained intact. Because of this, the
0.3
0.31
0.32
0.33
0.34
0.35
0.36
0.37
0.38
0.29 0.31 0.33 0.35 0.37
White Boundaries
Initial
Treatment 1
Treatment 2
Treatment 3
Puck Measurements

39
researchers could not obtain retroreflectance readings on anything but the first three feet.
However, we were still able to collect chromaticity readings for the material which had
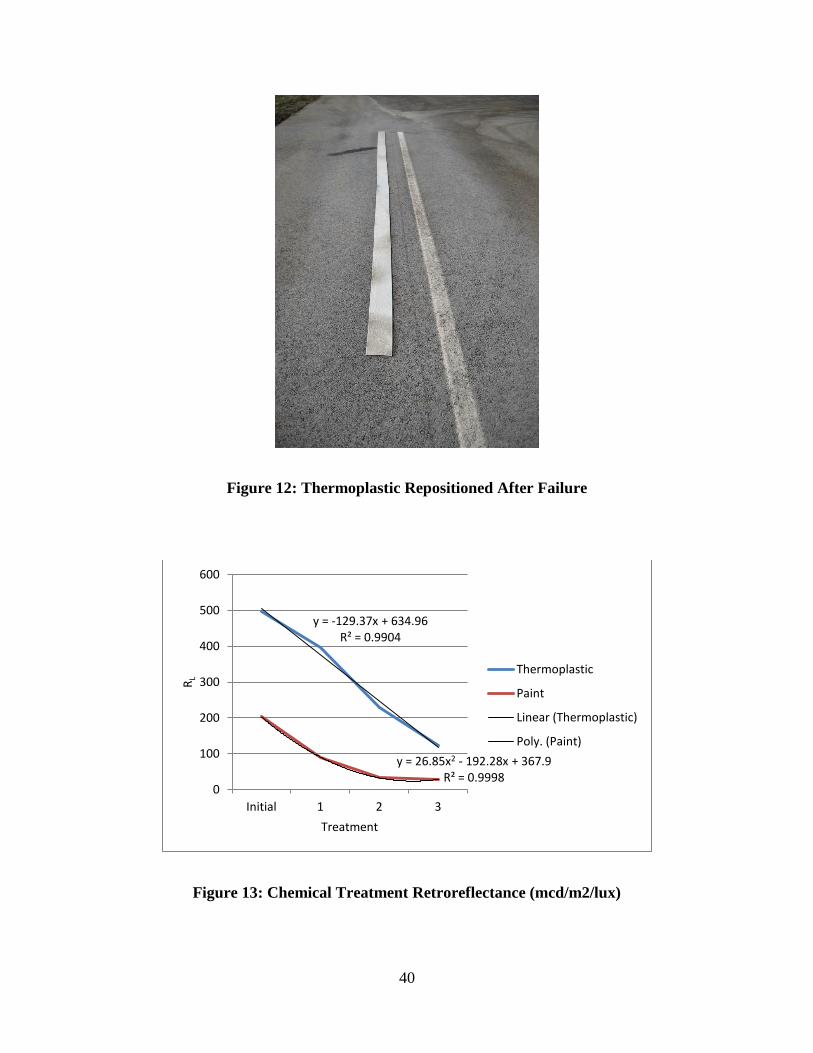
peeled up. Figure 12 shows the material laid down in order to obtain the chromaticity
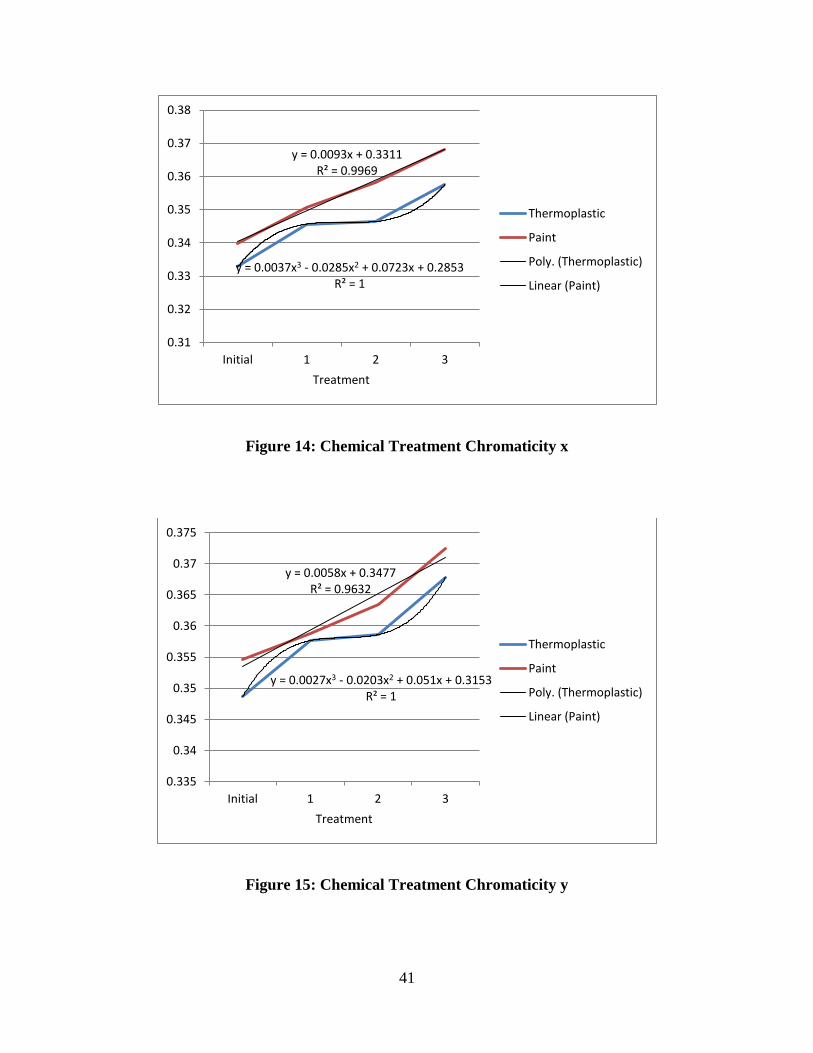
readings. The researchers graphed the degradations for retroreflectance, and chromaticity
in the x and y directions for both the waterborne paint and thermoplastic. The graphs and
corresponding best fit regression lines with R2 values are show in Figure 13, Figure 14,
and Figure 15.
Figure 11: Catastrophic Failure of Thermoplastic
40
Figure 12: Thermoplastic Repositioned After Failure
Figure 13: Chemical Treatment Retroreflectance (mcd/m2/lux)
y = -129.37x + 634.96 R² = 0.9904
y = 26.85x2 - 192.28x + 367.9 R² = 0.9998
0
100
200
300
400
500
600
Initial 1 2 3
RL
Treatment
Thermoplastic
Paint
Linear (Thermoplastic)
Poly. (Paint)
41
Figure 14: Chemical Treatment Chromaticity x
Figure 15: Chemical Treatment Chromaticity y
y = 0.0037x3 - 0.0285x2 + 0.0723x + 0.2853 R² = 1
y = 0.0093x + 0.3311 R² = 0.9969
0.31
0.32
0.33
0.34
0.35
0.36
0.37
0.38
Initial 1 2 3
Treatment
Thermoplastic
Paint
Poly. (Thermoplastic)
Linear (Paint)
y = 0.0027x3 - 0.0203x2 + 0.051x + 0.3153 R² = 1
y = 0.0058x + 0.3477 R² = 0.9632
0.335
0.34
0.345
0.35
0.355
0.36
0.365
0.37
0.375
Initial 1 2 3
Treatment
Thermoplastic
Paint
Poly. (Thermoplastic)
Linear (Paint)
42
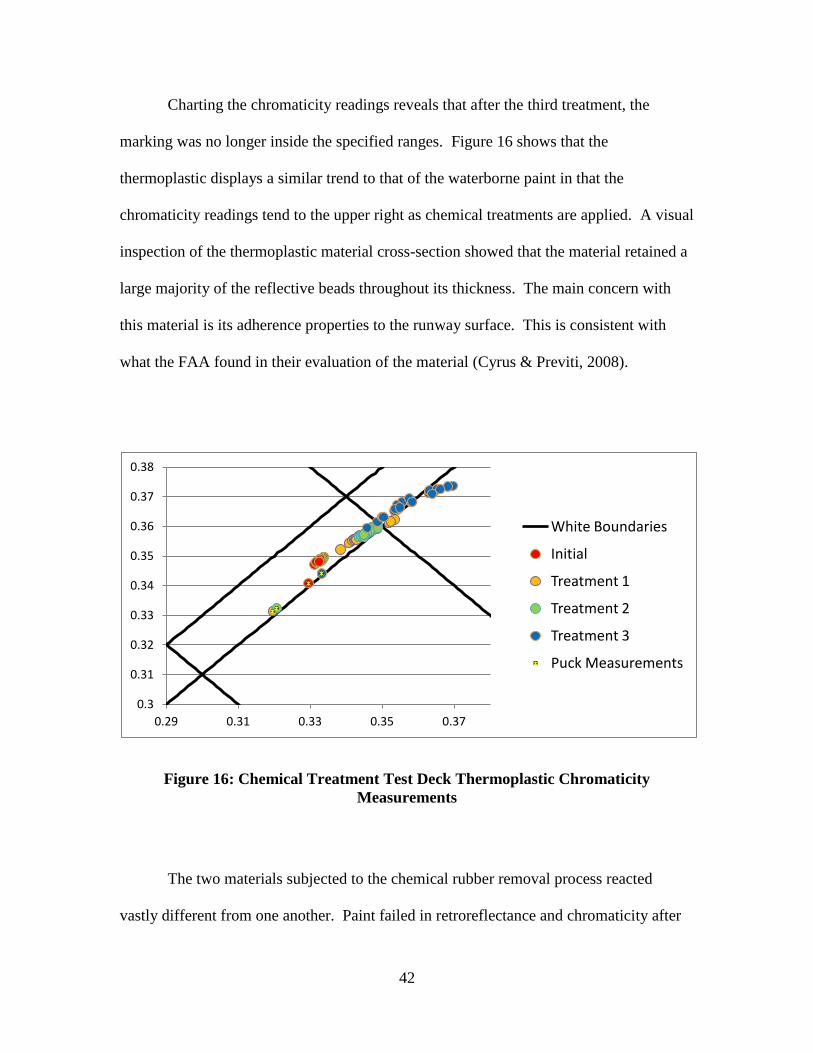
Charting the chromaticity readings reveals that after the third treatment, the
marking was no longer inside the specified ranges. Figure 16 shows that the
thermoplastic displays a similar trend to that of the waterborne paint in that the
chromaticity readings tend to the upper right as chemical treatments are applied. A visual
inspection of the thermoplastic material cross-section showed that the material retained a
large majority of the reflective beads throughout its thickness. The main concern with
this material is its adherence properties to the runway surface. This is consistent with
what the FAA found in their evaluation of the material (Cyrus & Previti, 2008).
Figure 16: Chemical Treatment Test Deck Thermoplastic Chromaticity
Measurements
The two materials subjected to the chemical rubber removal process reacted
vastly different from one another. Paint failed in retroreflectance and chromaticity after
0.3
0.31
0.32
0.33
0.34
0.35
0.36
0.37
0.38
0.29 0.31 0.33 0.35 0.37
White Boundaries
Initial
Treatment 1
Treatment 2
Treatment 3
Puck Measurements
43
the first treatment application, where thermoplastic failed in coverage and chromaticity
after the third treatment. Based on a runway rubber removal schedule of twice per year,
the thermoplastic would last one year longer than the paint. Thermoplastic’s advantage
comes with requiring fewer applications and thus less time the runway is down for
maintenance.
4.3 Sweeper Treatment Visual Analysis
Upon a visual analysis of the marking materials, both the waterborne paint and the
thermoplastic performed well. After the last application of the treatment, both materials
still retained most of their coverage. However, the thermoplastic did chip up a bit, losing
approximately 16 inches from one end. Due to the lack of debris in the area, we assume
the sweeper broke the material into small pieces and ingested those pieces. Both
materials still appeared white after the third treatment, and both appeared to have
acceptable amounts of retroreflectance. Figure 17 and Figure 18 show that the markings’
color did not deviate much from the initial values, and all stayed within the acceptable
white range.

44
Figure 17: Sweeper Treatment Test Deck Waterborne Paint Chromaticity
Measurements
Figure 18: Sweeper Treatment Test Deck Thermoplastic Chromaticity
Measurements
0.3
0.31
0.32
0.33
0.34
0.35
0.36
0.37
0.38
0.29 0.31 0.33 0.35 0.37
White Boundaries
Initial
Treatment 1
Treatment 2
Treatment 3
Puck Measurements
0.3
0.31
0.32
0.33
0.34
0.35
0.36
0.37
0.38
0.29 0.31 0.33 0.35 0.37
White Boundaries
Initial
Treatment 1
Treatment 2
Treatment 3
Puck Measurements
45
4.4 Matched Pair Analysis
The researchers ran several tests to determine statistical significance. This section
deals mostly with those tests where the t-statistic determined a statistical difference.
Using the Bonferroni method, in order for a test to be statistically significant at the 95%
confidence level, each individual t-statistic p-value needs to be less than 0.0004. Any
values above that cannot be considered significant without changing the overall
confidence level. Appendix F: t-statistic Test Results shows all the test results.
Observations other than what would be expected are highlighted in this section.
To determine the consistency of the materials used in the experiment, the
researchers compared the initial values for each material against each other. Table 5
shows all the matched pair analysis results for the initial values. Within the chemical
treatment test deck, the waterborne paint was statistically different from the thermoplastic
in retroreflectance, chromaticity in both the x and y directions, but statistically no
different in coverage. These results are not surprising as thermoplastic demonstrates
higher initial retroreflectance reading over that of waterborne paint. Despite having
different chromaticity readings, both materials fall within the FAA approved area for
white pavement markings. Also, as was expected, both materials start with 100%
coverage and therefore had no statistical difference.
Starting values for the sweeper treatment test deck had no statistical difference
between the waterborne paint and thermoplastic materials, with the exception of the
initial retroreflectance values. The thermoplastic material had a statistically higher initial
value than the waterborne paint. When the waterborne paint stripes from the two test
46
decks were compared against each other, there was no statistical difference in the initial
retroreflectivity values or the coverage. However, both the chromaticity measurements
showed statistical differences. The thermoplastic test stripes between the two test decks
showed no statistical difference in the chromaticity x measurement and coverage.
However, the two stripes showed a difference in initial retroreflectivity values as well as
in the chromaticity y measurement.
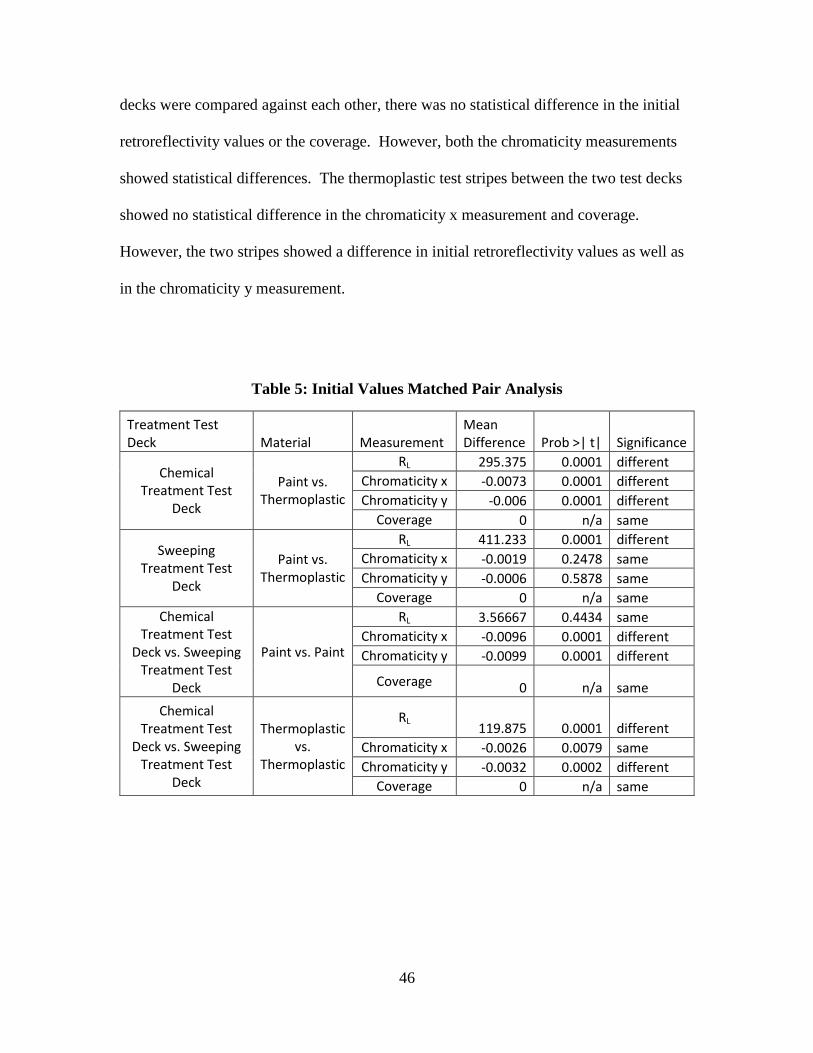
Table 5: Initial Values Matched Pair Analysis
Treatment Test Deck Material Measurement
Mean Difference Prob >| t| Significance
Chemical Treatment Test
Deck
Paint vs. Thermoplastic
RL 295.375 0.0001 different Chromaticity x -0.0073 0.0001 different Chromaticity y -0.006 0.0001 different
Coverage 0 n/a same
Sweeping Treatment Test
Deck
Paint vs. Thermoplastic
RL 411.233 0.0001 different Chromaticity x -0.0019 0.2478 same Chromaticity y -0.0006 0.5878 same
Coverage 0 n/a same Chemical
Treatment Test Deck vs. Sweeping
Treatment Test Deck
Paint vs. Paint
RL 3.56667 0.4434 same Chromaticity x -0.0096 0.0001 different Chromaticity y -0.0099 0.0001 different
Coverage 0 n/a same
Chemical Treatment Test
Deck vs. Sweeping Treatment Test
Deck
Thermoplastic vs.
Thermoplastic
RL 119.875 0.0001 different
Chromaticity x -0.0026 0.0079 same Chromaticity y -0.0032 0.0002 different
Coverage 0 n/a same
47
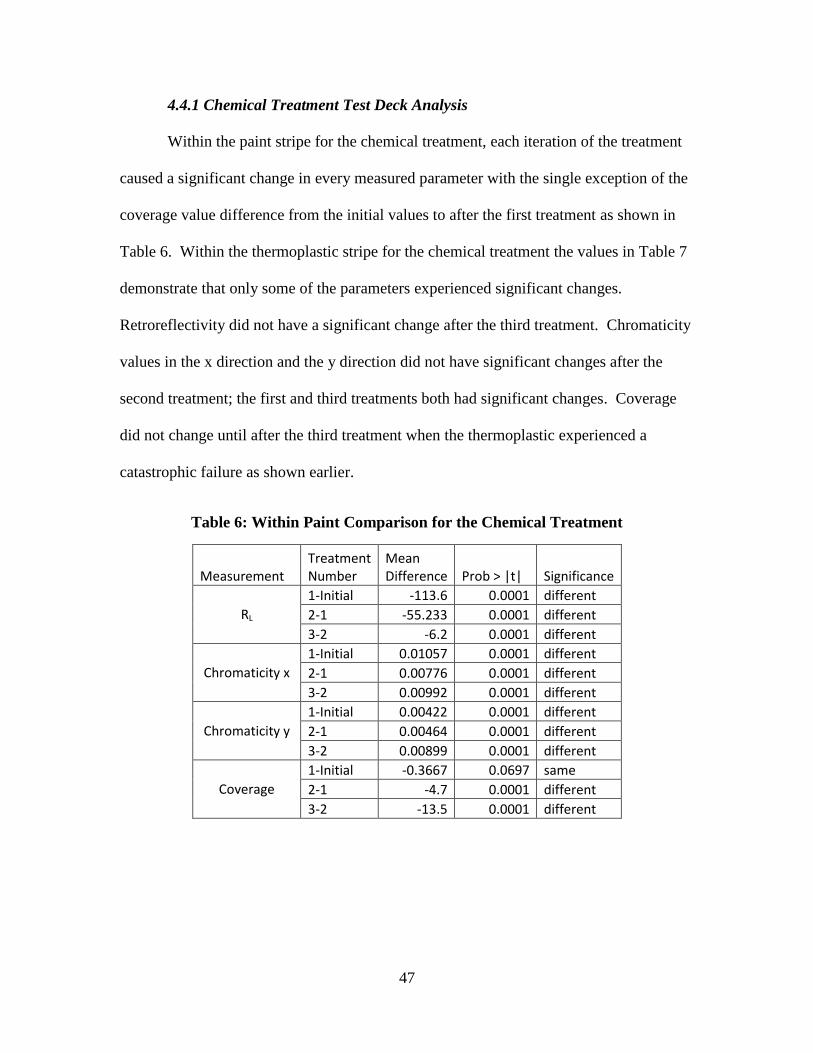
4.4.1 Chemical Treatment Test Deck Analysis
Within the paint stripe for the chemical treatment, each iteration of the treatment
caused a significant change in every measured parameter with the single exception of the
coverage value difference from the initial values to after the first treatment as shown in
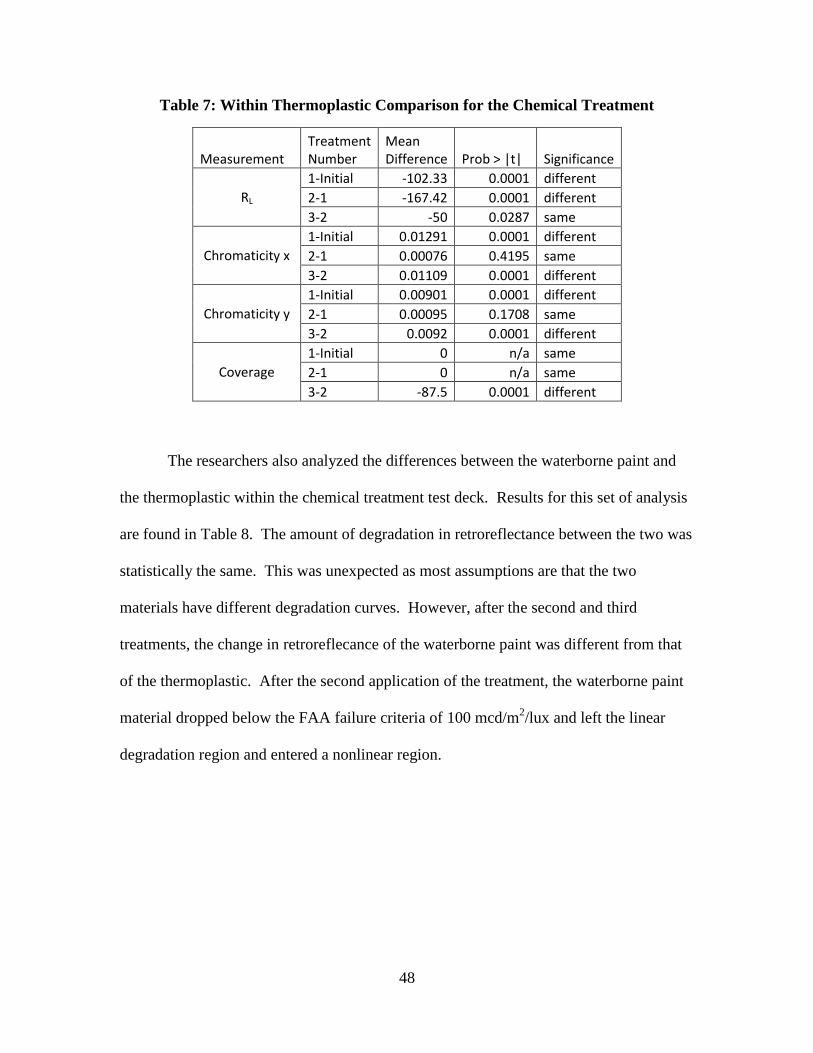
Table 6. Within the thermoplastic stripe for the chemical treatment the values in Table 7
demonstrate that only some of the parameters experienced significant changes.
Retroreflectivity did not have a significant change after the third treatment. Chromaticity
values in the x direction and the y direction did not have significant changes after the
second treatment; the first and third treatments both had significant changes. Coverage
did not change until after the third treatment when the thermoplastic experienced a
catastrophic failure as shown earlier.
Table 6: Within Paint Comparison for the Chemical Treatment
Measurement Treatment Number
Mean Difference Prob > |t| Significance
RL 1-Initial -113.6 0.0001 different 2-1 -55.233 0.0001 different 3-2 -6.2 0.0001 different
Chromaticity x 1-Initial 0.01057 0.0001 different 2-1 0.00776 0.0001 different 3-2 0.00992 0.0001 different
Chromaticity y 1-Initial 0.00422 0.0001 different 2-1 0.00464 0.0001 different 3-2 0.00899 0.0001 different
Coverage 1-Initial -0.3667 0.0697 same 2-1 -4.7 0.0001 different 3-2 -13.5 0.0001 different
48
Table 7: Within Thermoplastic Comparison for the Chemical Treatment
Measurement Treatment Number
Mean Difference Prob > |t| Significance
RL 1-Initial -102.33 0.0001 different 2-1 -167.42 0.0001 different 3-2 -50 0.0287 same
Chromaticity x 1-Initial 0.01291 0.0001 different 2-1 0.00076 0.4195 same 3-2 0.01109 0.0001 different
Chromaticity y 1-Initial 0.00901 0.0001 different 2-1 0.00095 0.1708 same 3-2 0.0092 0.0001 different
Coverage 1-Initial 0 n/a same 2-1 0 n/a same 3-2 -87.5 0.0001 different
The researchers also analyzed the differences between the waterborne paint and
the thermoplastic within the chemical treatment test deck. Results for this set of analysis
are found in Table 8. The amount of degradation in retroreflectance between the two was
statistically the same. This was unexpected as most assumptions are that the two
materials have different degradation curves. However, after the second and third
treatments, the change in retroreflecance of the waterborne paint was different from that
of the thermoplastic. After the second application of the treatment, the waterborne paint
material dropped below the FAA failure criteria of 100 mcd/m2/lux and left the linear
degradation region and entered a nonlinear region.

49
Table 8: Between Paint and Thermoplastic for the Chemical Treatment
Measurement Treatment Number
Mean Difference Prob > |t| Significance
RL 1-Initial 12.2917 0.4452 same 2-1 -113.83 0.0001 different 3-2 -207.33 0.0001 different
Chromaticity x 1-Initial 0.0027 0.0721 same 2-1 -0.0066 0.0001 different 3-2 0.0021 0.9104 same
Chromaticity y 1-Initial 0.00489 0.0004 different 2-1 -0.0042 0.0001 different 3-2 0.00059 0.5578 same
Coverage 1-Initial 0.36667 0.0697 same 2-1 4.7 0.0001 different 3-2 -63.444 0.0001 different
After the first treatment and after the third treatment the waterborne paint and
thermoplastic experienced statistically non-significant changes in the chromaticity x
measurements. However, the changes after the second treatment were statistically
significant. The material appears to follow a cubic trend, helping to explain why the
changes would be the same between materials for the first and third treatments, but not
the same for the second treatment. For chromaticity in the y direction, the waterborne
paint and thermoplastic experienced statistically significant changes from each other after
both the first and the second treatment, but statistically non-significant changes from each
other after the third treatment.
4.4.2 Sweeper Treatment Test Deck Analysis
Matched Pair analysis, shown in Table 9, reveals that only one of the three
sweeper treatments resulted in a significant change in retroreflectance values for the
waterborne paint test stripe. Only the second treatment had a significant difference. This
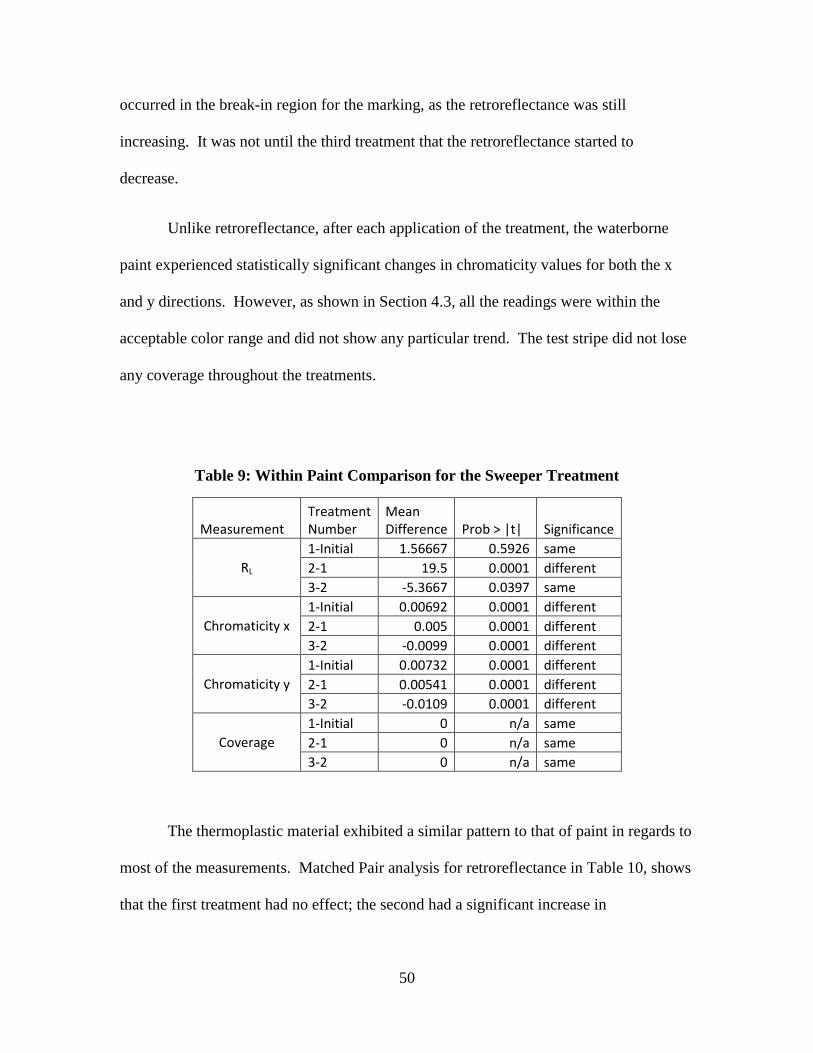
50
occurred in the break-in region for the marking, as the retroreflectance was still
increasing. It was not until the third treatment that the retroreflectance started to
decrease.
Unlike retroreflectance, after each application of the treatment, the waterborne
paint experienced statistically significant changes in chromaticity values for both the x
and y directions. However, as shown in Section 4.3, all the readings were within the
acceptable color range and did not show any particular trend. The test stripe did not lose
any coverage throughout the treatments.
Table 9: Within Paint Comparison for the Sweeper Treatment
Measurement Treatment Number
Mean Difference Prob > |t| Significance
RL 1-Initial 1.56667 0.5926 same 2-1 19.5 0.0001 different 3-2 -5.3667 0.0397 same
Chromaticity x 1-Initial 0.00692 0.0001 different 2-1 0.005 0.0001 different 3-2 -0.0099 0.0001 different
Chromaticity y 1-Initial 0.00732 0.0001 different 2-1 0.00541 0.0001 different 3-2 -0.0109 0.0001 different
Coverage 1-Initial 0 n/a same 2-1 0 n/a same 3-2 0 n/a same
The thermoplastic material exhibited a similar pattern to that of paint in regards to
most of the measurements. Matched Pair analysis for retroreflectance in Table 10, shows
that the first treatment had no effect; the second had a significant increase in
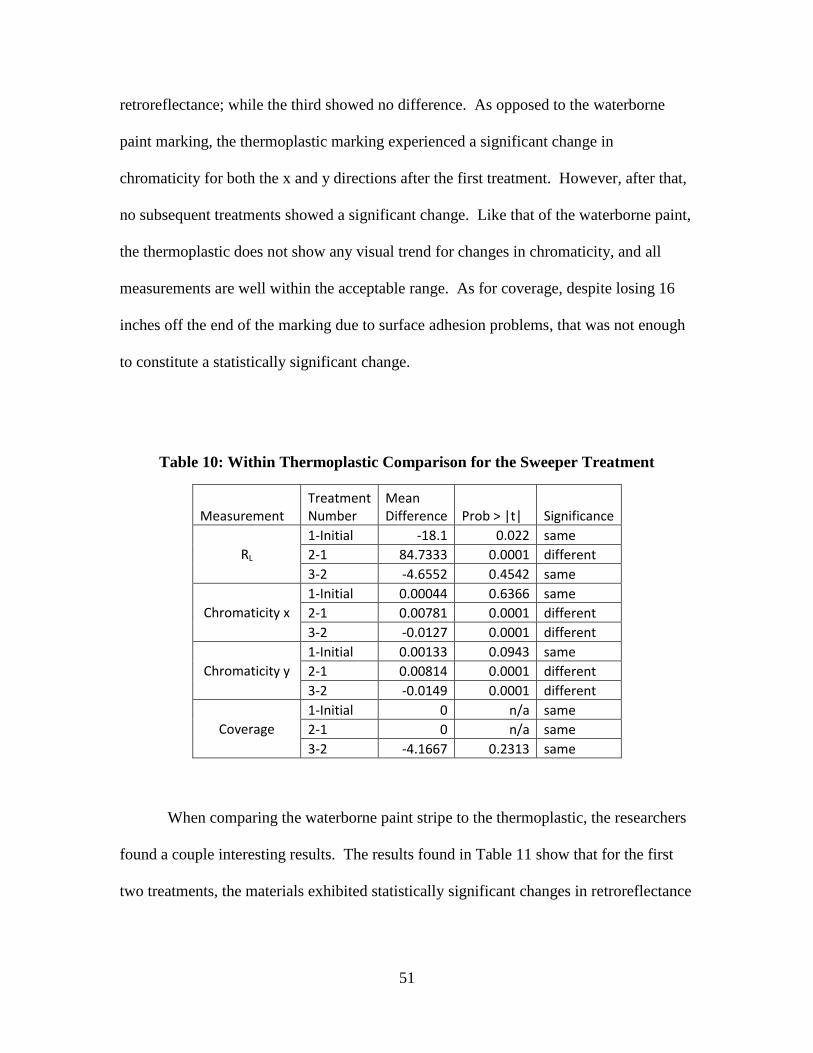
51
retroreflectance; while the third showed no difference. As opposed to the waterborne
paint marking, the thermoplastic marking experienced a significant change in
chromaticity for both the x and y directions after the first treatment. However, after that,
no subsequent treatments showed a significant change. Like that of the waterborne paint,
the thermoplastic does not show any visual trend for changes in chromaticity, and all
measurements are well within the acceptable range. As for coverage, despite losing 16
inches off the end of the marking due to surface adhesion problems, that was not enough
to constitute a statistically significant change.
Table 10: Within Thermoplastic Comparison for the Sweeper Treatment
Measurement Treatment Number
Mean Difference Prob > |t| Significance
RL 1-Initial -18.1 0.022 same 2-1 84.7333 0.0001 different 3-2 -4.6552 0.4542 same
Chromaticity x 1-Initial 0.00044 0.6366 same 2-1 0.00781 0.0001 different 3-2 -0.0127 0.0001 different
Chromaticity y 1-Initial 0.00133 0.0943 same 2-1 0.00814 0.0001 different 3-2 -0.0149 0.0001 different
Coverage 1-Initial 0 n/a same 2-1 0 n/a same 3-2 -4.1667 0.2313 same
When comparing the waterborne paint stripe to the thermoplastic, the researchers
found a couple interesting results. The results found in Table 11 show that for the first
two treatments, the materials exhibited statistically significant changes in retroreflectance
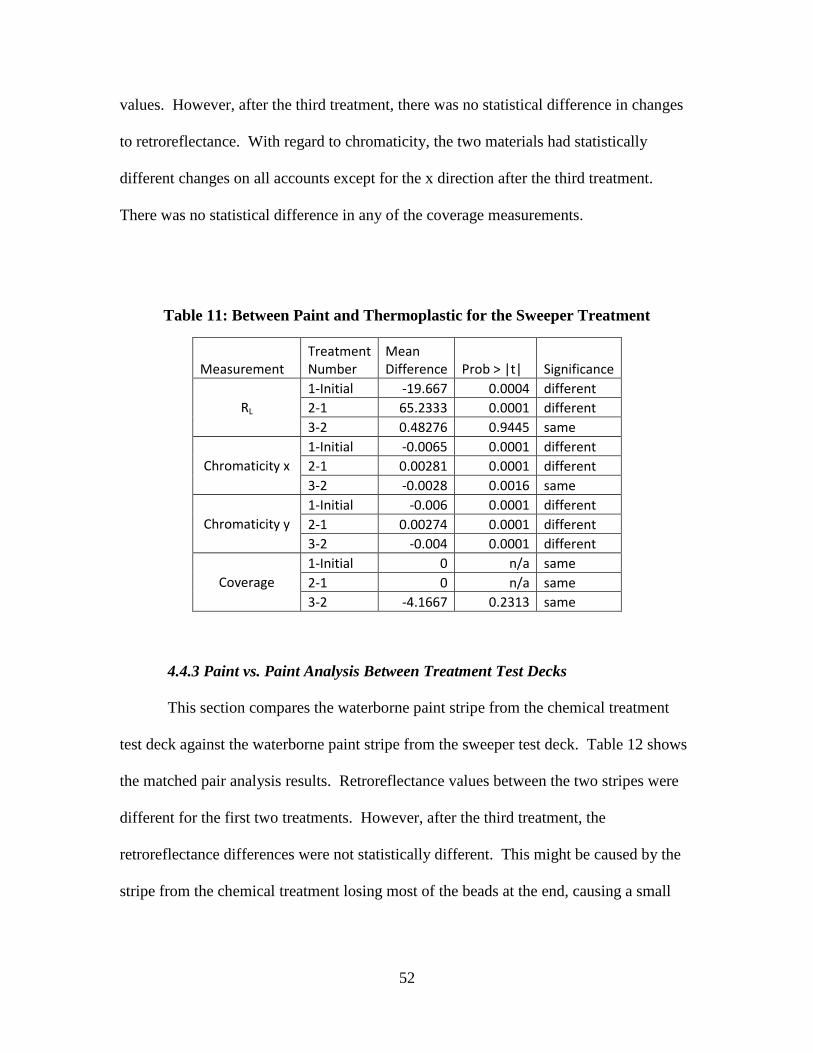
52
values. However, after the third treatment, there was no statistical difference in changes
to retroreflectance. With regard to chromaticity, the two materials had statistically
different changes on all accounts except for the x direction after the third treatment.
There was no statistical difference in any of the coverage measurements.
Table 11: Between Paint and Thermoplastic for the Sweeper Treatment
Measurement Treatment Number
Mean Difference Prob > |t| Significance
RL 1-Initial -19.667 0.0004 different 2-1 65.2333 0.0001 different 3-2 0.48276 0.9445 same
Chromaticity x 1-Initial -0.0065 0.0001 different 2-1 0.00281 0.0001 different 3-2 -0.0028 0.0016 same
Chromaticity y 1-Initial -0.006 0.0001 different 2-1 0.00274 0.0001 different 3-2 -0.004 0.0001 different
Coverage 1-Initial 0 n/a same 2-1 0 n/a same 3-2 -4.1667 0.2313 same
4.4.3 Paint vs. Paint Analysis Between Treatment Test Decks
This section compares the waterborne paint stripe from the chemical treatment
test deck against the waterborne paint stripe from the sweeper test deck. Table 12 shows
the matched pair analysis results. Retroreflectance values between the two stripes were
different for the first two treatments. However, after the third treatment, the
retroreflectance differences were not statistically different. This might be caused by the
stripe from the chemical treatment losing most of the beads at the end, causing a small
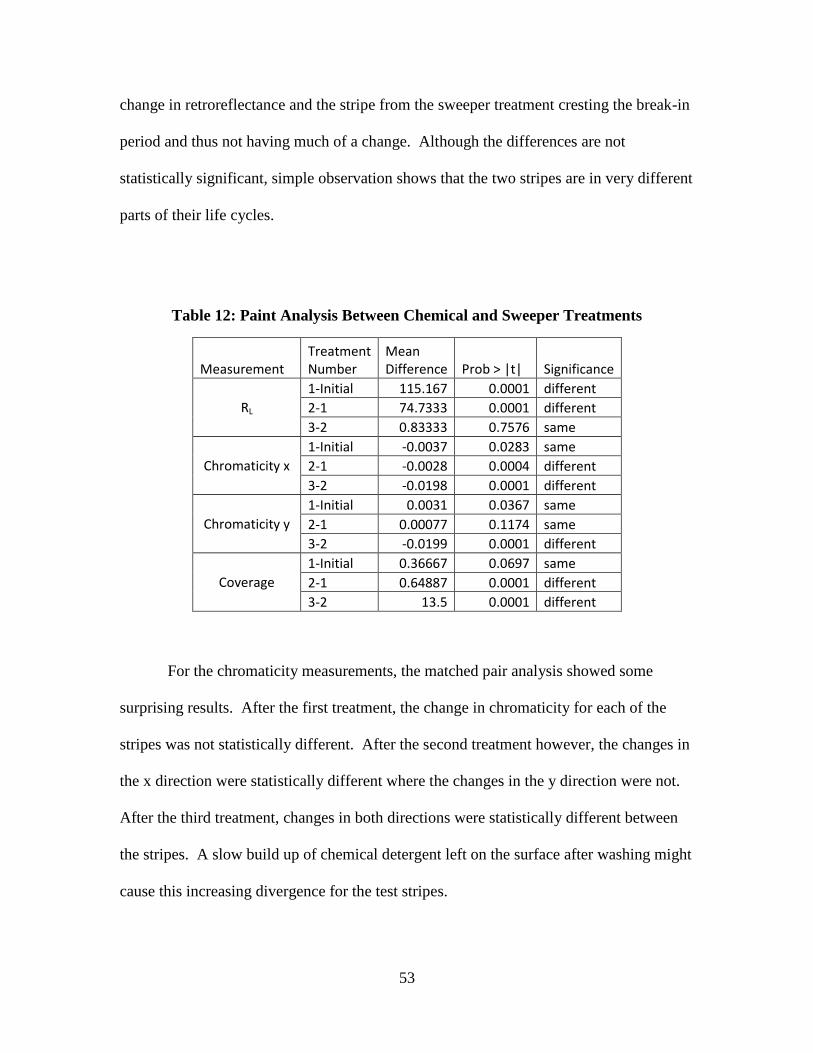
53
change in retroreflectance and the stripe from the sweeper treatment cresting the break-in
period and thus not having much of a change. Although the differences are not
statistically significant, simple observation shows that the two stripes are in very different
parts of their life cycles.
Table 12: Paint Analysis Between Chemical and Sweeper Treatments
Measurement Treatment Number
Mean Difference Prob > |t| Significance
RL 1-Initial 115.167 0.0001 different 2-1 74.7333 0.0001 different 3-2 0.83333 0.7576 same
Chromaticity x 1-Initial -0.0037 0.0283 same 2-1 -0.0028 0.0004 different 3-2 -0.0198 0.0001 different
Chromaticity y 1-Initial 0.0031 0.0367 same 2-1 0.00077 0.1174 same 3-2 -0.0199 0.0001 different
Coverage 1-Initial 0.36667 0.0697 same 2-1 0.64887 0.0001 different 3-2 13.5 0.0001 different
For the chromaticity measurements, the matched pair analysis showed some
surprising results. After the first treatment, the change in chromaticity for each of the
stripes was not statistically different. After the second treatment however, the changes in
the x direction were statistically different where the changes in the y direction were not.
After the third treatment, changes in both directions were statistically different between
the stripes. A slow build up of chemical detergent left on the surface after washing might
cause this increasing divergence for the test stripes.
54
For the coverage measurements, the two stripes showed significant differences in
changes after the second and third treatments, but not after the first. The first chemical
treatment only removed a very small amount of paint. However, the data shows that after
each subsequent treatment, the chemical removed a greater amount of paint than the time
before. This divergence caused the statistically different results for treatments two and
three between test stripes.
4.4.4 Thermoplastic vs. Thermoplastic Analysis Between Treatment Test Decks
The matched pair analysis for the two thermoplastic test stripes as shown in Table
13 has very different results than those shown for the paint stripes. The changes between
the two test stripes were all statistically significant with the two exceptions of the changes
in coverage after the first and second treatments. The similarities in changes for
coverage, in that they neither test stripe lost any coverage after the first or second
treatment, is indicative of the nature of the material. Thermoplastic tends to fail
catastrophically. Thus, the third chemical treatment almost entirely destroyed the test
stripe and thus showed statistically different results from the test stripe in the sweeper
treatment.
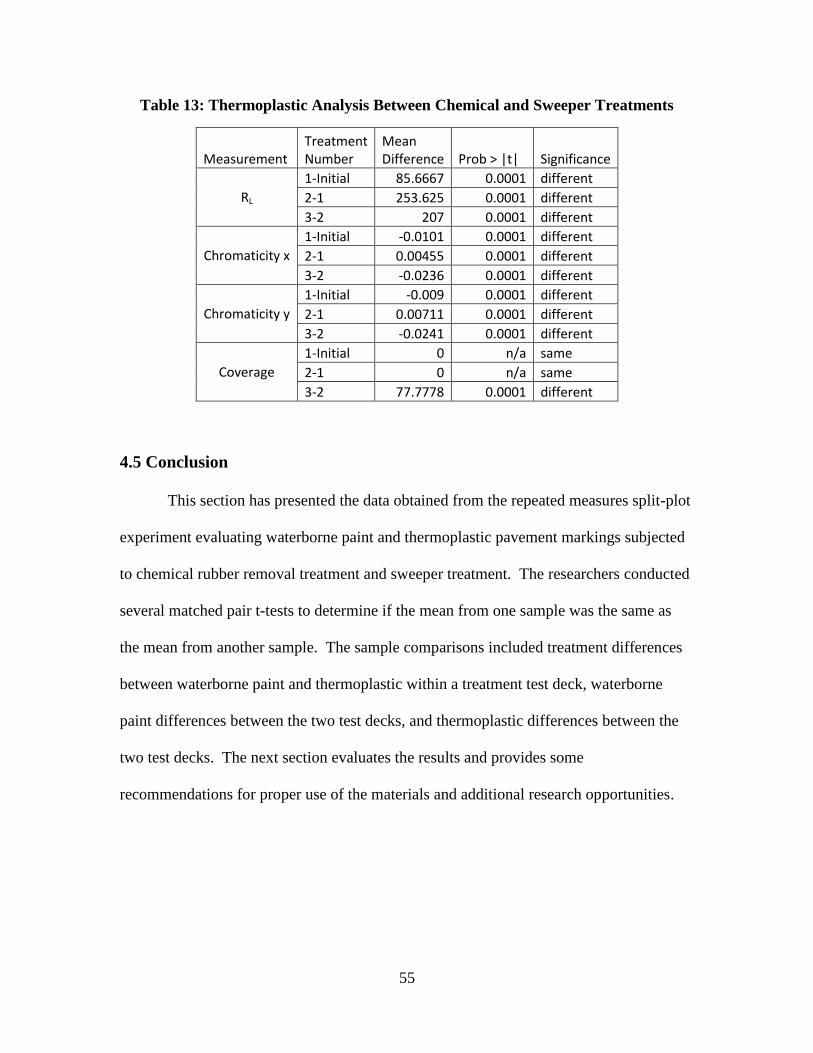
55
Table 13: Thermoplastic Analysis Between Chemical and Sweeper Treatments
Measurement Treatment Number
Mean Difference Prob > |t| Significance
RL 1-Initial 85.6667 0.0001 different 2-1 253.625 0.0001 different 3-2 207 0.0001 different
Chromaticity x 1-Initial -0.0101 0.0001 different 2-1 0.00455 0.0001 different 3-2 -0.0236 0.0001 different
Chromaticity y 1-Initial -0.009 0.0001 different 2-1 0.00711 0.0001 different 3-2 -0.0241 0.0001 different
Coverage 1-Initial 0 n/a same 2-1 0 n/a same 3-2 77.7778 0.0001 different
4.5 Conclusion
This section has presented the data obtained from the repeated measures split-plot
experiment evaluating waterborne paint and thermoplastic pavement markings subjected
to chemical rubber removal treatment and sweeper treatment. The researchers conducted
several matched pair t-tests to determine if the mean from one sample was the same as
the mean from another sample. The sample comparisons included treatment differences
between waterborne paint and thermoplastic within a treatment test deck, waterborne
paint differences between the two test decks, and thermoplastic differences between the
two test decks. The next section evaluates the results and provides some
recommendations for proper use of the materials and additional research opportunities.
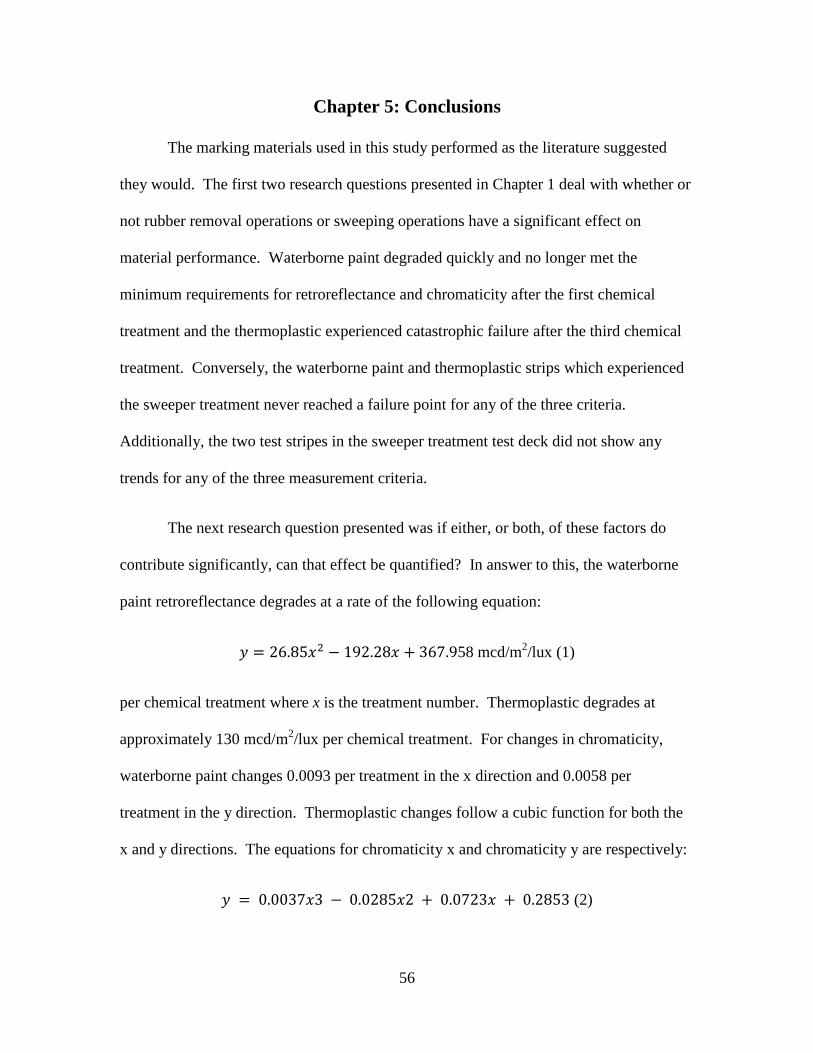
56
Chapter 5: Conclusions
The marking materials used in this study performed as the literature suggested
they would. The first two research questions presented in Chapter 1 deal with whether or
not rubber removal operations or sweeping operations have a significant effect on
material performance. Waterborne paint degraded quickly and no longer met the
minimum requirements for retroreflectance and chromaticity after the first chemical
treatment and the thermoplastic experienced catastrophic failure after the third chemical
treatment. Conversely, the waterborne paint and thermoplastic strips which experienced
the sweeper treatment never reached a failure point for any of the three criteria.
Additionally, the two test stripes in the sweeper treatment test deck did not show any
trends for any of the three measurement criteria.
The next research question presented was if either, or both, of these factors do
contribute significantly, can that effect be quantified? In answer to this, the waterborne
paint retroreflectance degrades at a rate of the following equation:
58 mcd/m2/lux (1)
per chemical treatment where x is the treatment number. Thermoplastic degrades at
approximately 130 mcd/m2/lux per chemical treatment. For changes in chromaticity,
waterborne paint changes 0.0093 per treatment in the x direction and 0.0058 per
treatment in the y direction. Thermoplastic changes follow a cubic function for both the
x and y directions. The equations for chromaticity x and chromaticity y are respectively:
(2)
57
(3)
where x is the treatment number.
The last question presented was, based on the answers to the previous questions,
what then, is the most efficient pavement marking material to use on each section of an
airfield? Since thermoplastic demonstrates adhesion problems and catastrophic failure
resulting in FOD, the material should not be used for runways, therefore paint is the
better of the two choices. However, if thermoplastic receives approval for runway use, it
would be a good alternative to paint for runways.
Based on the analysis presented throughout Chapter 4, no material acted like the
other material throughout even one treatment application. There were isolated occasions
when materials would act similar to each other, but on the whole, no two materials
reacted the same. These results validate the assumptions that a particular material will
react differently under various airfield maintenance operations, and that differing
materials will react differently under the same airfield operations.
Due to the limitations of this research effort, the best type of rubber removal
operation for pavement marking service life needs to be addressed in future research. In
addition, other airfield maintenance operations need to be considered. Other maintenance
operations to research could include high pressure and ultra-high pressure water rubber
removal and snow plowing.
Another key finding from the research is that a visual inspection of the pavement
marking is not sufficient if we want to mandate a certain retroreflectance, color range, or
58
coverage. The first two measurements take specialized equipment, and the third is a
painstaking slow approach and open to subjectivity. A visual inspection of
retroreflectance and chromaticity does not provide an accurate assessment. Material
might appear to be acceptable. But, when measured with specialized equipment, the
material is well outside the acceptable range.
5.1 Key Findings
This research effort accomplished its main goal of conducting a pilot study
evaluating the effects of different airfield maintenance operations on different pavement
marking materials. The pilot study shows that materials behave differently from each
other under the same and under different maintenance operations. Waterborne paint was
shown to significantly degrade after just one chemical rubber removal treatment. This
finding validates current Air Force practices of restriping after each chemical rubber
removal operation. The key findings from this research are summarized as followed:
Waterborne paint and thermoplastic demonstrate differing degradations in
retroreflectivity, chromaticity, and coverage when subjected to the same
treatment.
Waterborne paint demonstrates differing degradations in retroreflectivity,
chromaticity, and coverage when subjected to different treatments.
Thermoplastic demonstrates differing degradations in retroreflectivity,
chromaticity, and coverage when subjected to different treatments.
Thermoplastic could experience catastrophic failure due to adhesion
problems to the pavement surface.
59
Retroreflectivity and chromaticity could be difficult to accurately measure
without the use of specialized equipment.
Additional research needs to look at additional materials and treatments in
order to develop more robust asset management principles.
5.2 Future research
Future research needs to look at more pavement marking materials such as
polyurea and epoxy, other bead types including Type IV large beads and highly reflective
elements, other treatment types to include snowplowing and pressurized water rubber
removal, as well as PCC pavement as was outlined for Experiment 2 in Chapter 3. Asset
managers would then be able to use the results from these additional combinations to
maximize pavement marking potential and thus save money and airfield downtime.
Additional studies could look at a side by side comparison of two or more marking
materials on the same runway. To gain the most benefit from these studies, the markings
should be taken to failure.
60
Bibliography
Air Force Civil Engineer Support Agency (AFCESA). (2011). Air Force Civil
Engineer Support Agency Pavement Evaluations. Retrieved May 19, 2011, from
http://wwwmil.afcesa.af.mil/Directorate/CES/Civil/Pavements/pav_app/Pav_main.asp
Airports Council International. (2010). Traffic Movements 2009 Final. Retrieved
December 19, 2010, from
http://www.airports.org/cda/aci_common/display/main/aci_content07_c.jsp?zn=aci&cp=
1-5-54-57_666_2__
American Society of Testing and Materials (ASTM). (2005). Standard test
method for measurement of retroreflective pavement marking materials with CEN-
prescribed geometry using a portable retroreflectometer (ASTM E 1710-05 ed.). West
Conshohoken, PA.
Ates, M. D. (1995). Evaluation of Retroreflective Airfield Pavement Markings.
Tyndall AFB, FL: Air Force Civil Engineer Support Agency.
Bagot, K. W. (1995). Evaluation of Alternative Pavement Marking Materials.
Atlantic City International Airport: Federal Aviation Administration.
Bahar, G., Masiliah, M., Erwin, T., & Tan, E. (2004). Pavement Marking
Materials and Markers: Testing the Relationship Between Retroreflectivity and Safety.
Washington D.C.: Transportation Research Board.
61
Council, C. E. (2011, June 6). Overview AFIT Discussion. (J. Jaszkowiak,
Interviewer)
Cyrus, H. M. (2003). Development of Methods for Determining Airport Pavement
Marking Effectiveness. Atlantic City International Airport: FAA report DOT/FAA/AR-
TN03/22.
Cyrus, H. M., & Frierson, R. (2006). Polyester Marking Material Study. Atlantic
City International Airport: Federal Aviation Administration.
Cyrus, H. M., & Frierson, R. (2006). Polyurea Paint Marking Material Study.
Atlantic City International Airport: Federal Aviation Administration.
Cyrus, H., & Previti, A. J. (2008). Evaluation of Thermoplastic Marking
Materials. Atlantic City International Airport: Federal Aviation Administration.
Federal Aviation Adminstration (FAA). (2009). Runway and Taxiway Painting.
FAA Advisory Circular AC 150/5370-10E.
Federal Aviation Adminstration (FAA). (2010). Standards for Airport Markings.
FAA Advisory Circular AC 150/5340-1K.
Force, U. S. (1999). Air Force Instruction 32-1002: Snow and Ice Control.
Force, U. S. (2010). Consolidated Description of Requirement/Performance Work
Statement )PWS) for Airfield Maintenance Services at Al Udeid AB, Qatar and Lajes
Airfield, Azores (Portugal).
62
Migletz, J., & Graham, J. (2002). NCHRP Synthesis 306 Long-Term Pavement
Marking Practices. Washington D.C.: Transporation Research Board.
Morris, M. D. (2011). Design of Experiments: An Introduction Based on Linear
Models. Ames, IA: CRC Press.
Mull, D., & Sitzabee, W. E. (2011). Snow Removal Impact on Paint Pavement
Marking Degradation. Wright-Patterson Air Force Base: Air Force Institute of
Technology.
Needham, J. (2011). Degradation Modeling of Polyurea Pavement Markings.
Wright-Patterson AFB, OH: Air Force Institute of Technology.
Patterson, M. (2011, November 4). Typical Civil Engineer Squadron Airfield
Operations. (J. Jaszkowiak, Interviewer)
Previti, A. J., Cyrus, H., & Gallagher, D. W. (2010). Airborn Evaluation of Retro-
Reflective Beads. Atlantic City International Airport: Federal Aviation Administration.
Sitzabee, W. E., Hummer, J. E., & Rasdorf, W. (2009). Pavement Marking
Degradation Modeling and Analysis. American Society of Civil Engineers , 15 (3).
Speidel, D. J. (2008). Airfield Marking Handbook. Skokie, IL: Innovative
Pavement Research Foundation.
United States Air Force (USAF). (1997). Engineering Technical Letter (ETL) 97-
17 (Change 1): Guide Specification – Paint and Rubber Removal from Roadway and
Airfield Pavements.

63
Watkins, Q., Boudreau, R. L., & Hansen, R. P. (2010). Rubber Tire Buildup
Removal at Hartsfield-Jackson Atlanta International Airport. 2010 FAA Worldwide
Technology Transfer Conference. Atlantic City, New Jersey.

64
Appendix A: Toolcat Training Certificate
REQUEST FOR DRIVER'S ~lNG AND ADDITION TO U.S. GOVERNMENT DRIVERS UCENSE
Tllla~-.., ... ~ .... ,.,...... ~ I'RrVACYACT by the Privacy Act of 1974 --1» ~~ . """"'the FO/A ~ 5 U.S. C. S22{b)(G) _,.. Til Prlnc~p~e,_,r,.,....,.,.. __ ,. ..,. ~ ~E.O.ll307 a. ,.._,_,. __
RoutiM Uw(s}: This 1o1m Is _ _,~:.::;:"-~.,._-~ ....... or.....,_, .,e.dllltlv ........ _,AFForm22P3-AF FormllH. --~-,g.~ . tr .
DISCLOSURE IS VOWNTARY· ~ ~ ~ .._Ulg, -document nec.JU<ychot>ge$ . olyour---.,~ SECTION 1- TRAINEE INFOftMIITtON • '--; W.... "''*- il may t»!ey -Ulnfl olyour eppllcoi/On. 1. NAME(Laot, Fht. Mldditt lnlliW)
2. GRAOE
las2.lcowiak, John c 3. I:JoFt.OviE• (OR&L ... _)
4 UNIT 0-3
5. DtlTY PHONE (DSH) 6. Do\ 'IE OF 8IRTli AFITIENV
185-3636 7. DAFSC I: sex 8. EYE <XlUlR 10. -<XllOR 11. tEIClttT liZ. WEIGHT
13. CIVIU.\N LICEHSE NO. 14. STAn: OF ISSUE
Inches 1 lbs 14a. STAll: EXP. DT. 15. RESTRICTIONS
16. TRAFFIC SAFElY COURsE llo\TE 17. WE 3 YEAR CERTlACATION Do\ 'IE 18. Clll. VERIFICA7ION.a.ASSIEXP. DT
19. CAC EXPIRAllON DATE 20. OF 345 REVIEW Do\ 'IE
---21. VEHICAE(S)EQIJIPioiEHT ,_ --._-codelOIIe~
0630 Bobcat Toolcat
.
SE:CnON I · TRMIIIG CBmRCATIOH (Sa..ECT oeE STATEIIENT OM.Yl
0 I CER1"FY niE AeovE TRAINEE HAS BEEH FUU Y 1RAIIED ON lME va«::.E(S)IEClUIPaoEHT lJSTB) IN ITEM 21 1/SlNG AN APf'ROVED LESSON P1.AN.
0 I CERllFY 1ME ABOVE TRAINEE HAS BEEN PROVIDED FAAIIUARIZA TION TRAINING ON lME VEHICLE(S)£CIUFMENT USTEO IN ITBI 21 FOR "CCNTTNGEHCY USC ON.. Y" OPERATION.
22 lYPI:JmiNT NAME OF TRAINER jl.aot l'hl. - ..... 23. GRADE OF TRAINER 2~ .f.(}L..---Chapman, Micba<:l L. Contractor
SECTION Ill· RECEIPT OF TRAINNG STATQIENT
I CER'IlFY lMAT I HAVE RECEJVS) TRAINING AS INiliCATED If SECTION I NfO NOW CONSIOER MYSa.F TO BE OUI\UFIED TO OPERATE THE VEHIClE(S~PMENT IN ITEM 21 TO THE IOENTlFIED LEVEL OF COIIIPETENCE.
25 1YPl:JmiNT NAME OF lR.UEE 11Mt. l'hl. - ln&f 25. GRADE OF TRAINEE 27.{/J'_:. ~~ (
Jankowiak, John C ()..)
SECTION IV- camFICATlONOFTIWNEE ~
I CER'IlFYlMAT THE ABOVE TRAINEE HilS BEEN TRAJNED BY A OI.W.FIEDTRAINER FORVEHICI.E(S)IEQIJIPIENT IN ITEM 21 FOR 1ME PIJRP06E IDENTIFIED IN SECTION II.
28 TYPE/PRHT NAME OF SOUADRON CC/VCOIICNCO 28. GRADE OF~ 1221 fJ :;t_L A5;J~~~ ILntFht.- lnlliioof CCIVCXWCNCO
Fowler, Caudace R. ConiTactor AF FORM 171, 20110315 PREVIOUS EDITIOH lolA Y NO LONGER BE USED.
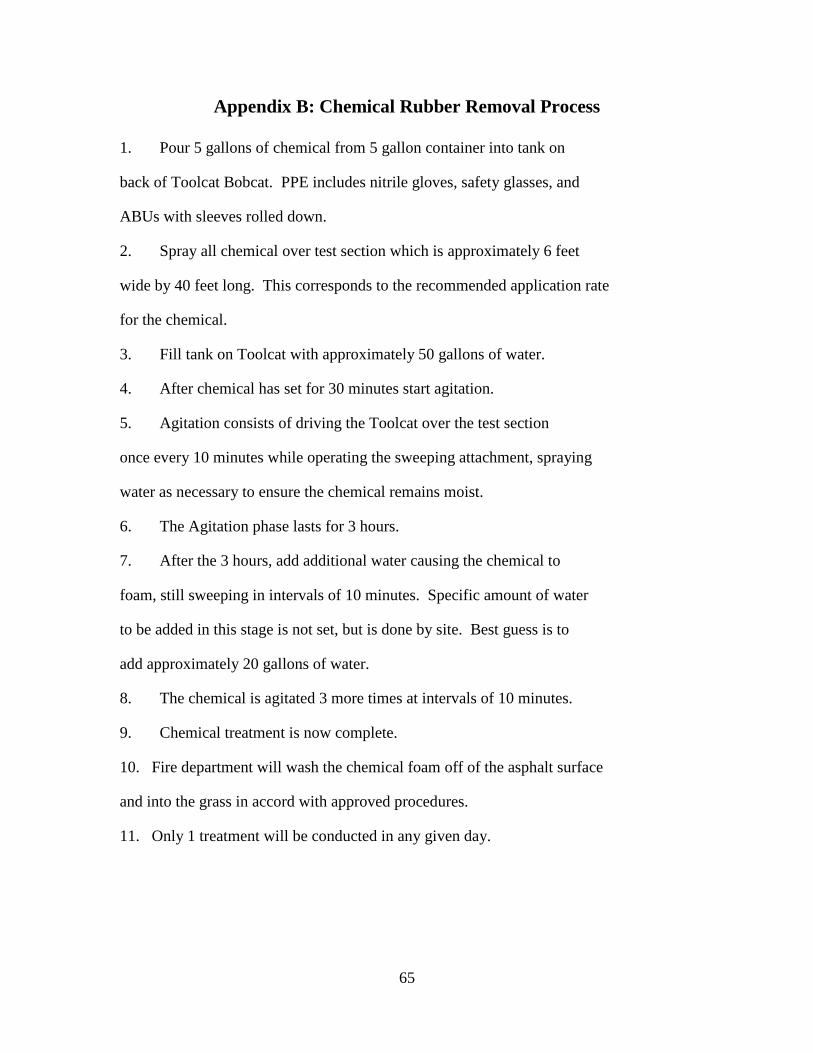
65
Appendix B: Chemical Rubber Removal Process
1. Pour 5 gallons of chemical from 5 gallon container into tank on
back of Toolcat Bobcat. PPE includes nitrile gloves, safety glasses, and
ABUs with sleeves rolled down.
2. Spray all chemical over test section which is approximately 6 feet
wide by 40 feet long. This corresponds to the recommended application rate
for the chemical.
3. Fill tank on Toolcat with approximately 50 gallons of water.
4. After chemical has set for 30 minutes start agitation.
5. Agitation consists of driving the Toolcat over the test section
once every 10 minutes while operating the sweeping attachment, spraying
water as necessary to ensure the chemical remains moist.
6. The Agitation phase lasts for 3 hours.
7. After the 3 hours, add additional water causing the chemical to
foam, still sweeping in intervals of 10 minutes. Specific amount of water
to be added in this stage is not set, but is done by site. Best guess is to
add approximately 20 gallons of water.
8. The chemical is agitated 3 more times at intervals of 10 minutes.
9. Chemical treatment is now complete.
10. Fire department will wash the chemical foam off of the asphalt surface
and into the grass in accord with approved procedures.
11. Only 1 treatment will be conducted in any given day.
66
Appendix C: Toolcat Set-up and Specifications
Re-pack broom with 75 convoluted steel and 19 flat polypropylene for a total of 94
wafers.
The following bristle wafer sequence will be used instead of the pattern provided from
the Bobcat Manufacturer.
To maintain the intended usage and life span of the bristles, never “Bulldoze” or “Mop”
with the broom. When operating properly, the broom should have a consistent “Flicking”
action. When adjusted correctly, the broom should only be sweeping a continuous six
inch width across the brooms length. Bristle wafers should be replaced when they no
longer have a “Flicking” action (approximately three to five inches of remaining bristle
length).
Start with…1 Poly (P), 7 Steel (S), 1(P), 1(S), 1(P), 7(S), 1(P), 1(S), 1(P), 7(S), 1(P),1(S),
1(P), 7(S), 1(P), 1(S), 1(P), 7(S), 1(P), 1(S), 1(P), 7(S), 1(P), 1(S), 1(P), 7(S),1(P), 1(S),
1(P), 7(S), 1(P), 1(S), 1(P), 7(S), 1(P), 4(S), 1(P)…Completed set.
67
Appendix D: Experiment 2 Design Layout
Thermoplastic
Polyurea
Epoxy
Waterborne Paint
Type I Beads Type IV Beads Type I Beads Type IV Beads
PCC ACCC
he
mic
al R
ub
be
r R
em
ov
al
Ult
ra H
igh
Pre
ssu
re W
ate
r
Ru
bb
er
Re
mo
va
l
Hig
h P
ress
ure
Wa
ter
Ru
bb
er
Re
mo
va
lS
we
ep
ing
Op
era
tio
ns
68
Appendix E: Experiment Data
Chemical Treatment Test Deck
Paint Retroreflectivity (mcd/m2/lux)
Sample Initial Treatment 1 Treatment 2 Treatment 3
1 128 156 56 48
2 241 130 49 41
3 228 146 61 49
4 166 133 42 39
5 163 103 38 32
6 175 98 33 35
7 215 76 33 32
8 188 82 30 27
9 212 82 34 23
10 223 73 34 24
11 210 87 36 24
12 215 75 30 21
13 183 100 30 23
14 195 83 33 29
15 208 69 30 24
16 201 49 28 24
17 198 25 24 20
18 209 32 25 20
19 223 66 28 22
20 232 83 32 31
21 201 87 35 27
22 189 98 33 27
23 209 103 32 27
24 261 86 30 24
25 233 78 23 24
26 204 79 30 22
27 189 88 33 26
28 185 82 29 25
29 196 101 31 21
30 208 130 41 26
69
Chemical Treatment Test Deck
Paint Chromaticity x
Sample Initial Treatment 1 Treatment 2 Treatment 3
Puck 0.3333 0.3119 0.3244 0.3346
1 0.3429 0.3495 0.3536 0.3636
2 0.3434 0.3483 0.3564 0.3606
3 0.3272 0.3491 0.3553 0.3637
4 0.3406 0.3491 0.3581 0.3624
5 0.3273 0.3499 0.3587 0.3657
6 0.342 0.3487 0.3564 0.3644
7 0.3424 0.35 0.359 0.3735
8 0.3435 0.3502 0.3577 0.3732
9 0.3428 0.3488 0.3575 0.368
10 0.3329 0.3487 0.3596 0.3674
11 0.3427 0.3485 0.3583 0.3719
12 0.3412 0.3481 0.3574 0.3728
13 0.3278 0.3495 0.3547 0.3707
14 0.3426 0.3495 0.3558 0.3681
15 0.3425 0.3511 0.3566 0.3706
16 0.3425 0.3488 0.3552 0.3695
17 0.3426 0.3515 0.3582 0.3727
18 0.3422 0.3546 0.358 0.3719
19 0.3415 0.3534 0.3555 0.3701
20 0.3418 0.3528 0.3575 0.3655
21 0.3429 0.3534 0.3578 0.3671
22 0.3428 0.3508 0.3572 0.3703
23 0.342 0.3508 0.3639 0.3724
24 0.3413 0.3512 0.3634 0.3668
25 0.3422 0.3526 0.3629 0.3685
26 0.34 0.3521 0.3613 0.3681
27 0.3392 0.3522 0.3615 0.3654
28 0.3394 0.3526 0.3606 0.3655
29 0.3385 0.3514 0.3602 0.3692
30 0.3384 0.3491 0.3607 0.3671
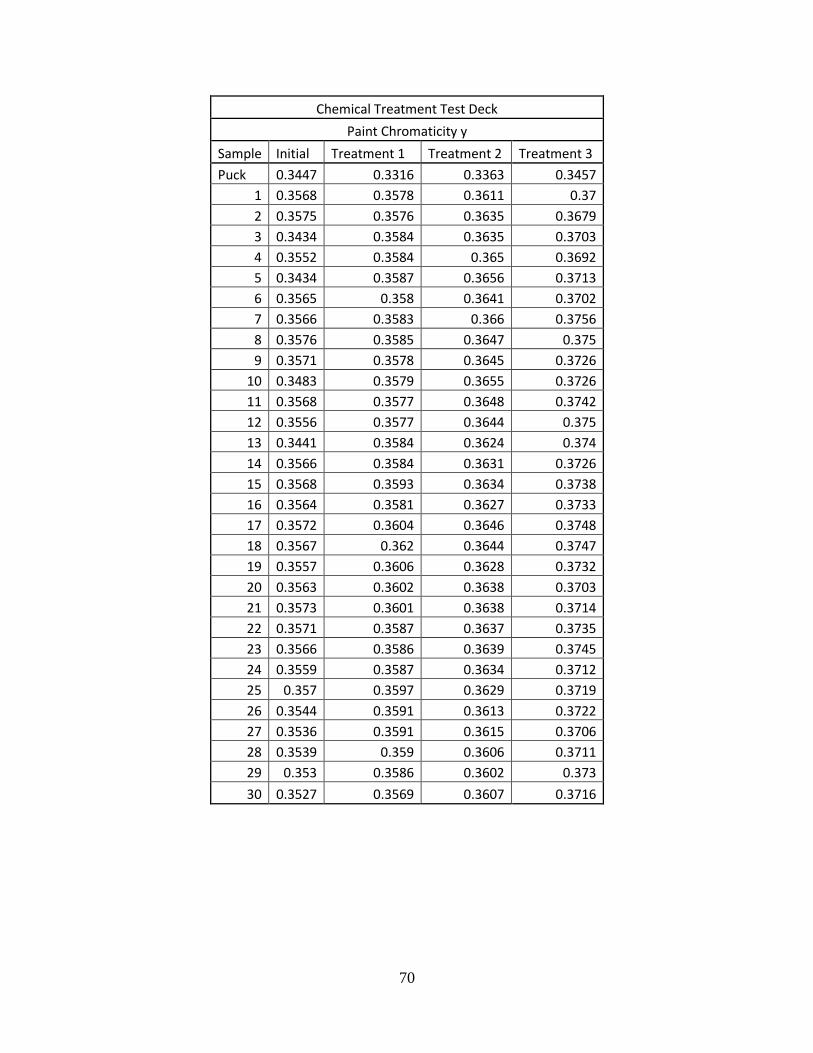
70
Chemical Treatment Test Deck
Paint Chromaticity y
Sample Initial Treatment 1 Treatment 2 Treatment 3
Puck 0.3447 0.3316 0.3363 0.3457
1 0.3568 0.3578 0.3611 0.37
2 0.3575 0.3576 0.3635 0.3679
3 0.3434 0.3584 0.3635 0.3703
4 0.3552 0.3584 0.365 0.3692
5 0.3434 0.3587 0.3656 0.3713
6 0.3565 0.358 0.3641 0.3702
7 0.3566 0.3583 0.366 0.3756
8 0.3576 0.3585 0.3647 0.375
9 0.3571 0.3578 0.3645 0.3726
10 0.3483 0.3579 0.3655 0.3726
11 0.3568 0.3577 0.3648 0.3742
12 0.3556 0.3577 0.3644 0.375
13 0.3441 0.3584 0.3624 0.374
14 0.3566 0.3584 0.3631 0.3726
15 0.3568 0.3593 0.3634 0.3738
16 0.3564 0.3581 0.3627 0.3733
17 0.3572 0.3604 0.3646 0.3748
18 0.3567 0.362 0.3644 0.3747
19 0.3557 0.3606 0.3628 0.3732
20 0.3563 0.3602 0.3638 0.3703
21 0.3573 0.3601 0.3638 0.3714
22 0.3571 0.3587 0.3637 0.3735
23 0.3566 0.3586 0.3639 0.3745
24 0.3559 0.3587 0.3634 0.3712
25 0.357 0.3597 0.3629 0.3719
26 0.3544 0.3591 0.3613 0.3722
27 0.3536 0.3591 0.3615 0.3706
28 0.3539 0.359 0.3606 0.3711
29 0.353 0.3586 0.3602 0.373
30 0.3527 0.3569 0.3607 0.3716
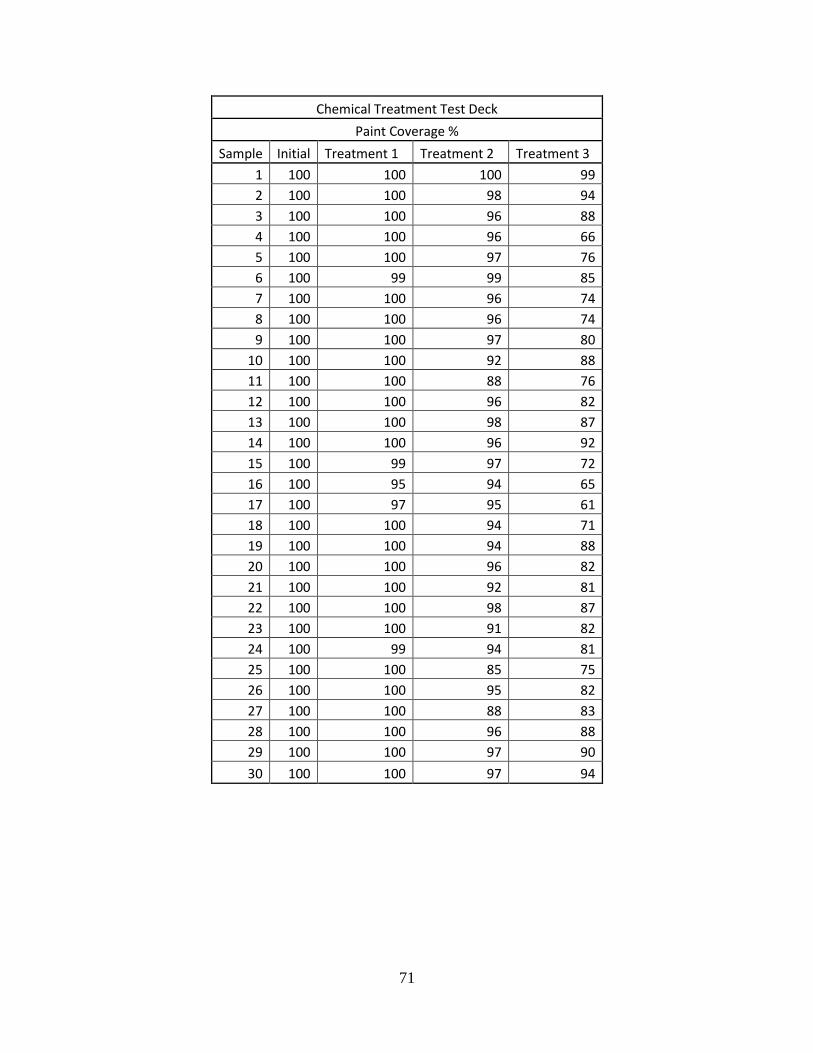
71
Chemical Treatment Test Deck
Paint Coverage %
Sample Initial Treatment 1 Treatment 2 Treatment 3
1 100 100 100 99
2 100 100 98 94
3 100 100 96 88
4 100 100 96 66
5 100 100 97 76
6 100 99 99 85
7 100 100 96 74
8 100 100 96 74
9 100 100 97 80
10 100 100 92 88
11 100 100 88 76
12 100 100 96 82
13 100 100 98 87
14 100 100 96 92
15 100 99 97 72
16 100 95 94 65
17 100 97 95 61
18 100 100 94 71
19 100 100 94 88
20 100 100 96 82
21 100 100 92 81
22 100 100 98 87
23 100 100 91 82
24 100 99 94 81
25 100 100 85 75
26 100 100 95 82
27 100 100 88 83
28 100 100 96 88
29 100 100 97 90
30 100 100 97 94
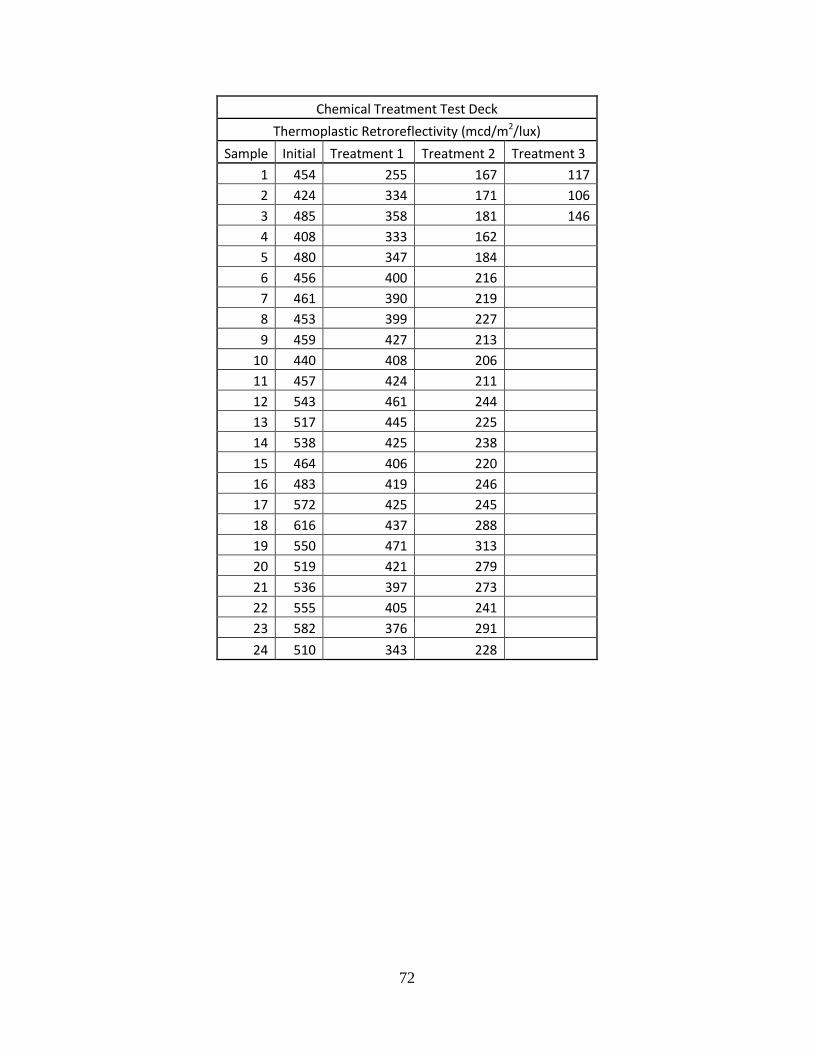
72
Chemical Treatment Test Deck
Thermoplastic Retroreflectivity (mcd/m2/lux)
Sample Initial Treatment 1 Treatment 2 Treatment 3
1 454 255 167 117
2 424 334 171 106
3 485 358 181 146
4 408 333 162
5 480 347 184
6 456 400 216
7 461 390 219
8 453 399 227
9 459 427 213
10 440 408 206
11 457 424 211
12 543 461 244
13 517 445 225
14 538 425 238
15 464 406 220
16 483 419 246
17 572 425 245
18 616 437 288
19 550 471 313
20 519 421 279
21 536 397 273
22 555 405 241
23 582 376 291
24 510 343 228

73
Chemical Treatment Test Deck
Thermoplastic Chromaticity x
Sample Initial Treatment 1 Treatment 2 Treatment 3
Puck 0.3295 0.3196 0.3207 0.3332
1 0.3331 0.346 0.3485 0.3697
2 0.3332 0.3407 0.3484 0.3645
3 0.3332 0.3384 0.3487 0.363
4 0.3322 0.3434 0.3471 0.3581
5 0.333 0.3433 0.347 0.3583
6 0.3326 0.344 0.347 0.3501
7 0.3337 0.3478 0.3473 0.3546
8 0.3338 0.3458 0.3472 0.3537
9 0.3329 0.3417 0.3463 0.3632
10 0.3336 0.3421 0.3465 0.3555
11 0.3333 0.3439 0.3477 0.3541
12 0.3331 0.3426 0.3471 0.3487
13 0.3328 0.3469 0.3464 0.35
14 0.3321 0.3448 0.347 0.3458
15 0.3329 0.3429 0.3467 0.3534
16 0.3312 0.3479 0.3443 0.3575
17 0.3318 0.3471 0.3435 0.3537
18 0.3329 0.3484 0.3441 0.3549
19 0.3331 0.3467 0.3447 0.3652
20 0.333 0.3519 0.3457 0.3584
21 0.3328 0.3482 0.345 0.3639
22 0.3324 0.3464 0.3451 0.3504
23 0.3317 0.3534 0.3449 0.3683
24 0.3325 0.3524 0.3488 0.3661
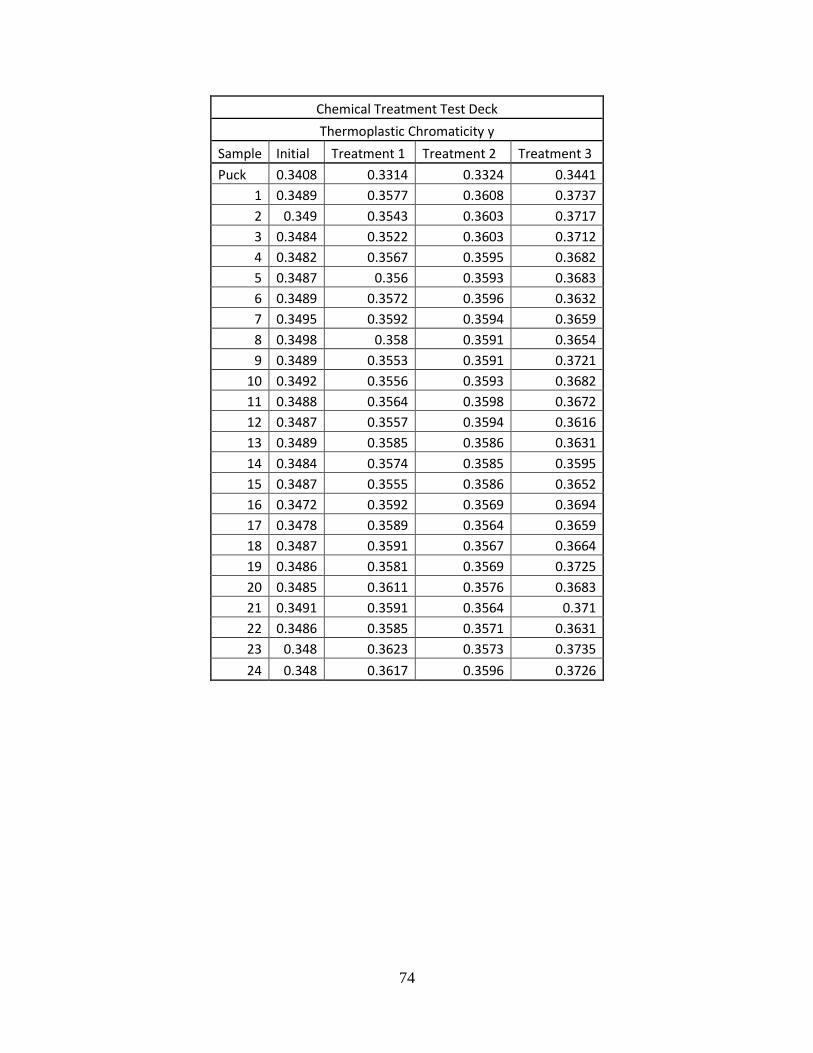
74
Chemical Treatment Test Deck
Thermoplastic Chromaticity y
Sample Initial Treatment 1 Treatment 2 Treatment 3
Puck 0.3408 0.3314 0.3324 0.3441
1 0.3489 0.3577 0.3608 0.3737
2 0.349 0.3543 0.3603 0.3717
3 0.3484 0.3522 0.3603 0.3712
4 0.3482 0.3567 0.3595 0.3682
5 0.3487 0.356 0.3593 0.3683
6 0.3489 0.3572 0.3596 0.3632
7 0.3495 0.3592 0.3594 0.3659
8 0.3498 0.358 0.3591 0.3654
9 0.3489 0.3553 0.3591 0.3721
10 0.3492 0.3556 0.3593 0.3682
11 0.3488 0.3564 0.3598 0.3672
12 0.3487 0.3557 0.3594 0.3616
13 0.3489 0.3585 0.3586 0.3631
14 0.3484 0.3574 0.3585 0.3595
15 0.3487 0.3555 0.3586 0.3652
16 0.3472 0.3592 0.3569 0.3694
17 0.3478 0.3589 0.3564 0.3659
18 0.3487 0.3591 0.3567 0.3664
19 0.3486 0.3581 0.3569 0.3725
20 0.3485 0.3611 0.3576 0.3683
21 0.3491 0.3591 0.3564 0.371
22 0.3486 0.3585 0.3571 0.3631
23 0.348 0.3623 0.3573 0.3735
24 0.348 0.3617 0.3596 0.3726
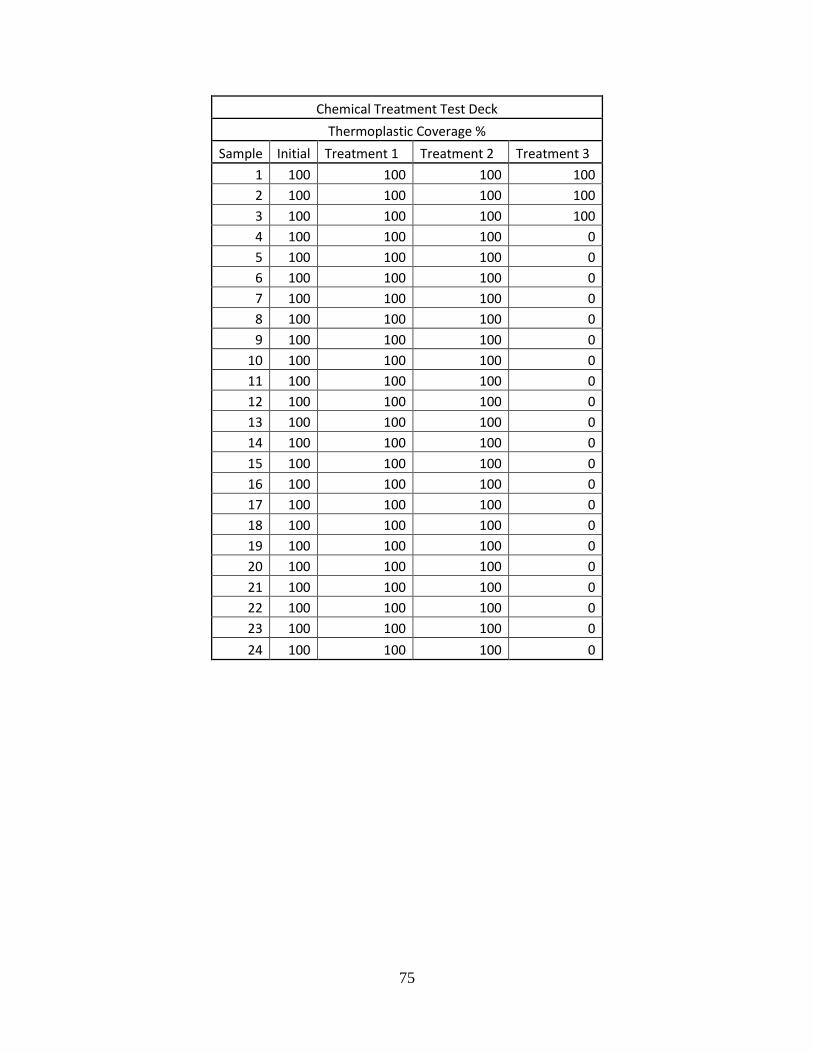
75
Chemical Treatment Test Deck
Thermoplastic Coverage %
Sample Initial Treatment 1 Treatment 2 Treatment 3
1 100 100 100 100
2 100 100 100 100
3 100 100 100 100
4 100 100 100 0
5 100 100 100 0
6 100 100 100 0
7 100 100 100 0
8 100 100 100 0
9 100 100 100 0
10 100 100 100 0
11 100 100 100 0
12 100 100 100 0
13 100 100 100 0
14 100 100 100 0
15 100 100 100 0
16 100 100 100 0
17 100 100 100 0
18 100 100 100 0
19 100 100 100 0
20 100 100 100 0
21 100 100 100 0
22 100 100 100 0
23 100 100 100 0
24 100 100 100 0
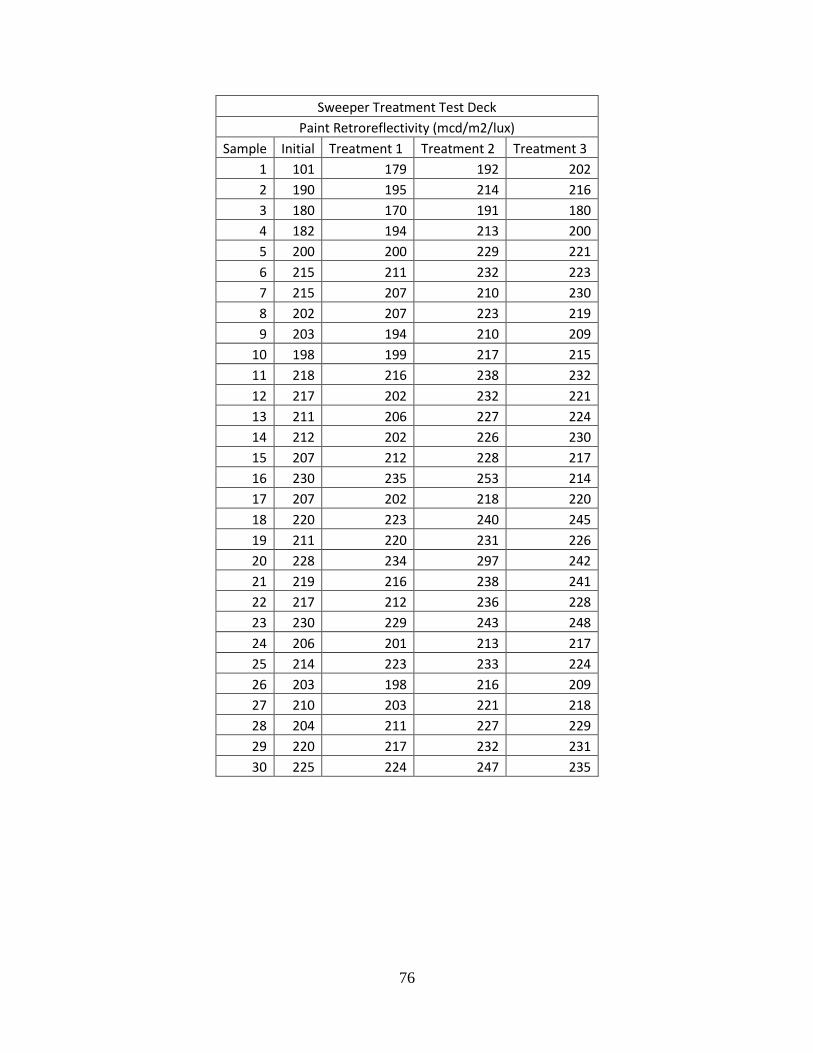
76
Sweeper Treatment Test Deck
Paint Retroreflectivity (mcd/m2/lux)
Sample Initial Treatment 1 Treatment 2 Treatment 3
1 101 179 192 202
2 190 195 214 216
3 180 170 191 180
4 182 194 213 200
5 200 200 229 221
6 215 211 232 223
7 215 207 210 230
8 202 207 223 219
9 203 194 210 209
10 198 199 217 215
11 218 216 238 232
12 217 202 232 221
13 211 206 227 224
14 212 202 226 230
15 207 212 228 217
16 230 235 253 214
17 207 202 218 220
18 220 223 240 245
19 211 220 231 226
20 228 234 297 242
21 219 216 238 241
22 217 212 236 228
23 230 229 243 248
24 206 201 213 217
25 214 223 233 224
26 203 198 216 209
27 210 203 221 218
28 204 211 227 229
29 220 217 232 231
30 225 224 247 235
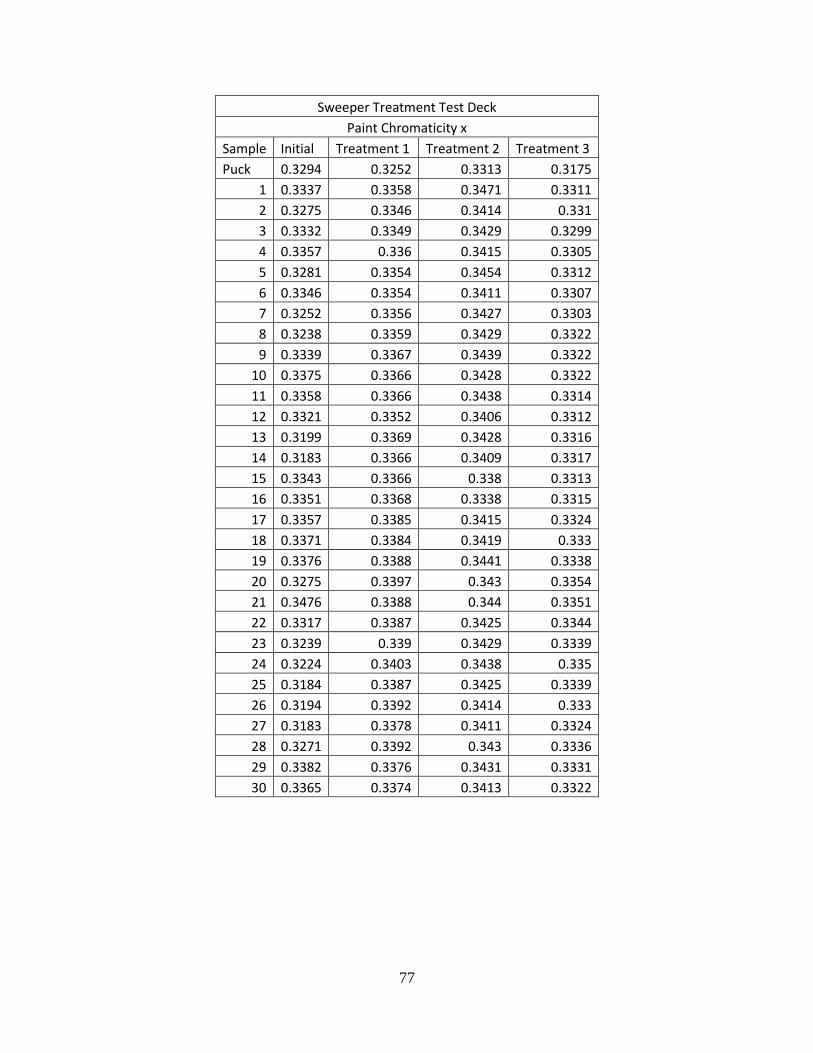
77
Sweeper Treatment Test Deck
Paint Chromaticity x
Sample Initial Treatment 1 Treatment 2 Treatment 3
Puck 0.3294 0.3252 0.3313 0.3175
1 0.3337 0.3358 0.3471 0.3311
2 0.3275 0.3346 0.3414 0.331
3 0.3332 0.3349 0.3429 0.3299
4 0.3357 0.336 0.3415 0.3305
5 0.3281 0.3354 0.3454 0.3312
6 0.3346 0.3354 0.3411 0.3307
7 0.3252 0.3356 0.3427 0.3303
8 0.3238 0.3359 0.3429 0.3322
9 0.3339 0.3367 0.3439 0.3322
10 0.3375 0.3366 0.3428 0.3322
11 0.3358 0.3366 0.3438 0.3314
12 0.3321 0.3352 0.3406 0.3312
13 0.3199 0.3369 0.3428 0.3316
14 0.3183 0.3366 0.3409 0.3317
15 0.3343 0.3366 0.338 0.3313
16 0.3351 0.3368 0.3338 0.3315
17 0.3357 0.3385 0.3415 0.3324
18 0.3371 0.3384 0.3419 0.333
19 0.3376 0.3388 0.3441 0.3338
20 0.3275 0.3397 0.343 0.3354
21 0.3476 0.3388 0.344 0.3351
22 0.3317 0.3387 0.3425 0.3344
23 0.3239 0.339 0.3429 0.3339
24 0.3224 0.3403 0.3438 0.335
25 0.3184 0.3387 0.3425 0.3339
26 0.3194 0.3392 0.3414 0.333
27 0.3183 0.3378 0.3411 0.3324
28 0.3271 0.3392 0.343 0.3336
29 0.3382 0.3376 0.3431 0.3331
30 0.3365 0.3374 0.3413 0.3322
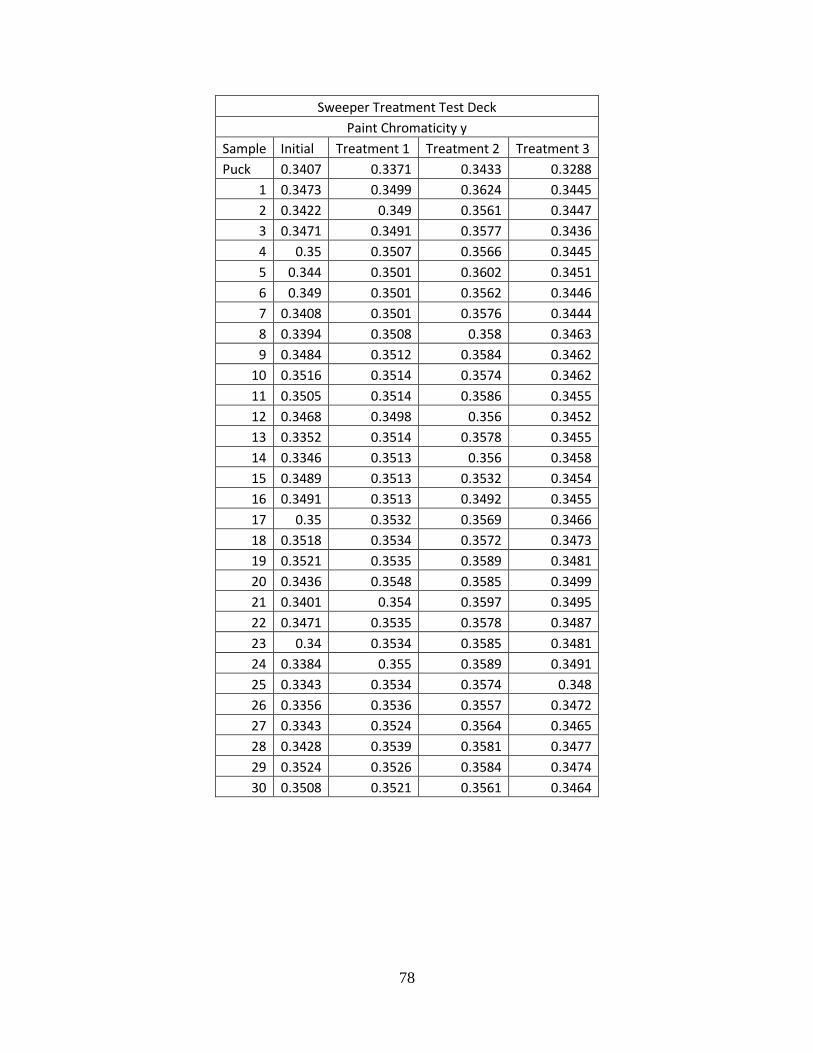
78
Sweeper Treatment Test Deck
Paint Chromaticity y
Sample Initial Treatment 1 Treatment 2 Treatment 3
Puck 0.3407 0.3371 0.3433 0.3288
1 0.3473 0.3499 0.3624 0.3445
2 0.3422 0.349 0.3561 0.3447
3 0.3471 0.3491 0.3577 0.3436
4 0.35 0.3507 0.3566 0.3445
5 0.344 0.3501 0.3602 0.3451
6 0.349 0.3501 0.3562 0.3446
7 0.3408 0.3501 0.3576 0.3444
8 0.3394 0.3508 0.358 0.3463
9 0.3484 0.3512 0.3584 0.3462
10 0.3516 0.3514 0.3574 0.3462
11 0.3505 0.3514 0.3586 0.3455
12 0.3468 0.3498 0.356 0.3452
13 0.3352 0.3514 0.3578 0.3455
14 0.3346 0.3513 0.356 0.3458
15 0.3489 0.3513 0.3532 0.3454
16 0.3491 0.3513 0.3492 0.3455
17 0.35 0.3532 0.3569 0.3466
18 0.3518 0.3534 0.3572 0.3473
19 0.3521 0.3535 0.3589 0.3481
20 0.3436 0.3548 0.3585 0.3499
21 0.3401 0.354 0.3597 0.3495
22 0.3471 0.3535 0.3578 0.3487
23 0.34 0.3534 0.3585 0.3481
24 0.3384 0.355 0.3589 0.3491
25 0.3343 0.3534 0.3574 0.348
26 0.3356 0.3536 0.3557 0.3472
27 0.3343 0.3524 0.3564 0.3465
28 0.3428 0.3539 0.3581 0.3477
29 0.3524 0.3526 0.3584 0.3474
30 0.3508 0.3521 0.3561 0.3464
79
Sweeper Treatment Test Deck
Paint Coverage %
Sample Initial Treatment 1 Treatment 2 Treatment 3
1 100 100 100 100
2 100 100 100 100
3 100 100 100 100
4 100 100 100 100
5 100 100 100 100
6 100 100 100 100
7 100 100 100 100
8 100 100 100 100
9 100 100 100 100
10 100 100 100 100
11 100 100 100 100
12 100 100 100 100
13 100 100 100 100
14 100 100 100 100
15 100 100 100 100
16 100 100 100 100
17 100 100 100 100
18 100 100 100 100
19 100 100 100 100
20 100 100 100 100
21 100 100 100 100
22 100 100 100 100
23 100 100 100 100
24 100 100 100 100
25 100 100 100 100
26 100 100 100 100
27 100 100 100 100
28 100 100 100 100
29 100 100 100 100
30 100 100 100 100
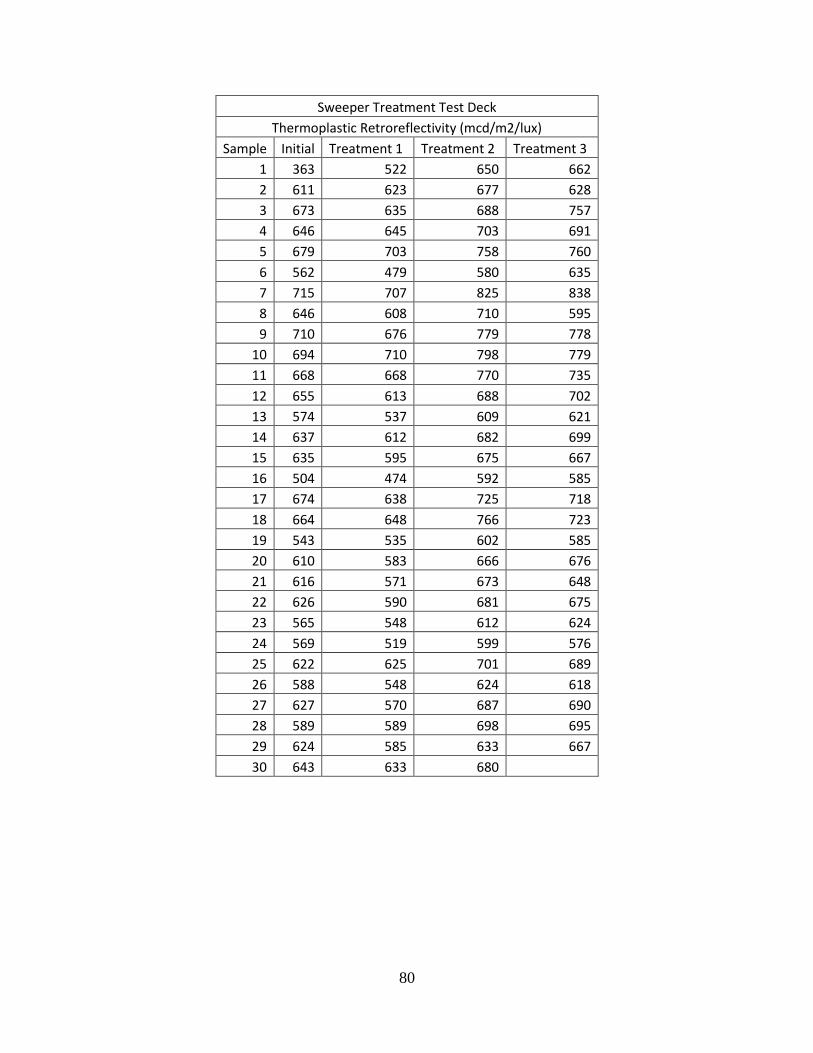
80
Sweeper Treatment Test Deck
Thermoplastic Retroreflectivity (mcd/m2/lux)
Sample Initial Treatment 1 Treatment 2 Treatment 3
1 363 522 650 662
2 611 623 677 628
3 673 635 688 757
4 646 645 703 691
5 679 703 758 760
6 562 479 580 635
7 715 707 825 838
8 646 608 710 595
9 710 676 779 778
10 694 710 798 779
11 668 668 770 735
12 655 613 688 702
13 574 537 609 621
14 637 612 682 699
15 635 595 675 667
16 504 474 592 585
17 674 638 725 718
18 664 648 766 723
19 543 535 602 585
20 610 583 666 676
21 616 571 673 648
22 626 590 681 675
23 565 548 612 624
24 569 519 599 576
25 622 625 701 689
26 588 548 624 618
27 627 570 687 690
28 589 589 698 695
29 624 585 633 667
30 643 633 680
81
Sweeper Treatment Test Deck
Thermoplastic Chromaticity x
Sample Initial Treatment 1 Treatment 2 Treatment 3
Puck 0.3305 0.326 0.3305 0.3183
1 0.3331 0.3311 0.3399 0.3251
2 0.333 0.3298 0.3347 0.324
3 0.3316 0.3286 0.336 0.3234
4 0.3323 0.3296 0.3351 0.3228
5 0.3318 0.3289 0.3381 0.3248
6 0.3316 0.3294 0.3347 0.324
7 0.3311 0.3281 0.3365 0.3236
8 0.332 0.3309 0.3384 0.3258
9 0.3306 0.3278 0.3352 0.323
10 0.329 0.3271 0.3333 0.3218
11 0.331 0.3286 0.3379 0.3243
12 0.3304 0.3287 0.3356 0.3233
13 0.341 0.3292 0.3386 0.3245
14 0.3312 0.3291 0.3355 0.3222
15 0.3312 0.3283 0.3378 0.323
16 0.3313 0.33 0.3377 0.3249
17 0.3322 0.329 0.3376 0.3216
18 0.3309 0.3297 0.3374 0.3246
19 0.3314 0.3282 0.3365 0.3395
20 0.3316 0.3296 0.3372 0.3234
21 0.3229 0.3282 0.3368 0.3219
22 0.3212 0.3289 0.3352 0.3219
23 0.3205 0.3282 0.3383 0.3225
24 0.3209 0.3296 0.3374 0.3241
25 0.3207 0.3295 0.3346 0.3242
26 0.3209 0.3281 0.3346 0.3228
27 0.3225 0.3286 0.3398 0.3232
28 0.3215 0.3281 0.3347 0.3214
29 0.3224 0.3282 0.3377 0.3232
30 0.3227 0.3287 0.3394
82
Sweeper Treatment Test Deck
Thermoplastic Chromaticity y
Sample Initial Treatment 1 Treatment 2 Treatment 3
Puck 0.3419 0.338 0.3427 0.3295
1 0.3488 0.3474 0.3586 0.3407
2 0.3483 0.3459 0.3515 0.3395
3 0.3475 0.3452 0.3528 0.3392
4 0.3471 0.3457 0.3515 0.3384
5 0.3476 0.3448 0.3542 0.3406
6 0.3473 0.3458 0.351 0.3397
7 0.3464 0.3444 0.3538 0.3395
8 0.3474 0.3474 0.3548 0.3417
9 0.3467 0.3442 0.3527 0.3391
10 0.3453 0.3439 0.3507 0.3379
11 0.3462 0.3447 0.354 0.3396
12 0.346 0.3451 0.3524 0.3389
13 0.3469 0.3455 0.355 0.3402
14 0.3468 0.3451 0.3516 0.3375
15 0.3463 0.3446 0.3547 0.3385
16 0.3467 0.3466 0.3545 0.3408
17 0.3477 0.3458 0.3545 0.3375
18 0.3466 0.3466 0.3543 0.3404
19 0.3469 0.3445 0.3534 0.3239
20 0.3469 0.3457 0.3532 0.3387
21 0.3393 0.3446 0.3532 0.3372
22 0.3373 0.345 0.3514 0.337
23 0.3368 0.3445 0.3548 0.3379
24 0.3375 0.3464 0.3543 0.34
25 0.3379 0.3465 0.3517 0.3401
26 0.3372 0.3445 0.3515 0.3382
27 0.339 0.3449 0.3564 0.3387
28 0.3379 0.3447 0.3514 0.3366
29 0.3385 0.3445 0.3543 0.3385
30 0.3391 0.3453 0.3559
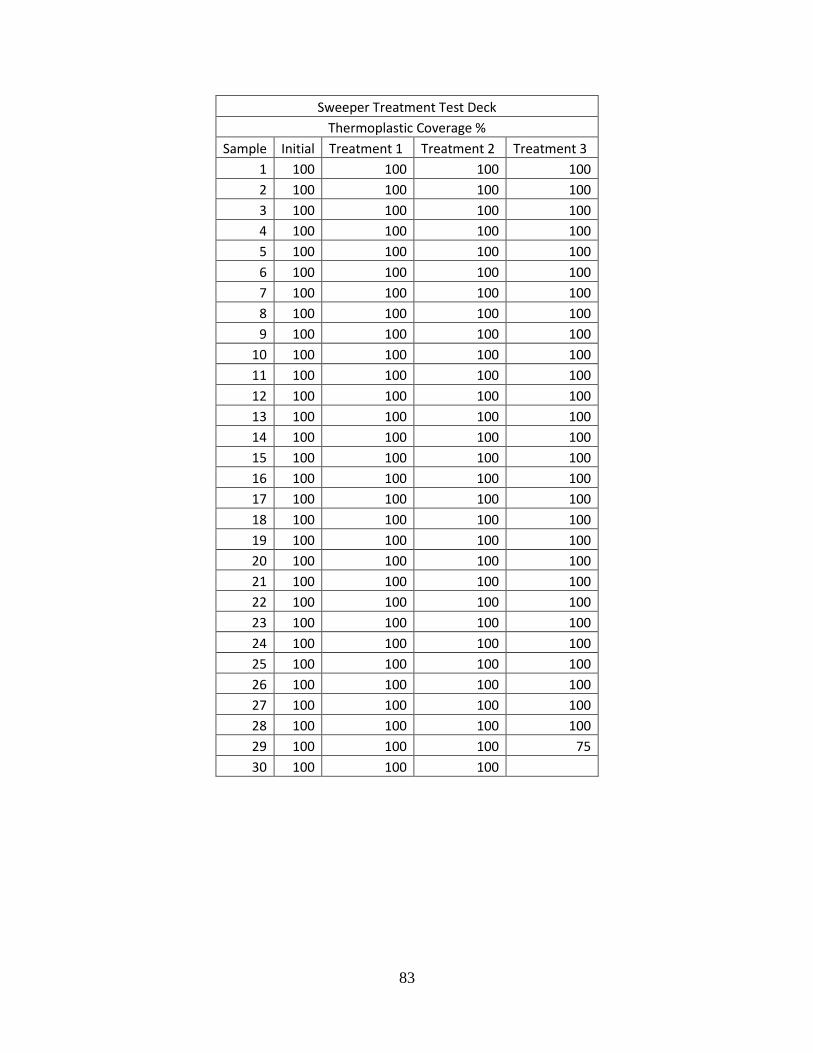
83
Sweeper Treatment Test Deck
Thermoplastic Coverage %
Sample Initial Treatment 1 Treatment 2 Treatment 3
1 100 100 100 100
2 100 100 100 100
3 100 100 100 100
4 100 100 100 100
5 100 100 100 100
6 100 100 100 100
7 100 100 100 100
8 100 100 100 100
9 100 100 100 100
10 100 100 100 100
11 100 100 100 100
12 100 100 100 100
13 100 100 100 100
14 100 100 100 100
15 100 100 100 100
16 100 100 100 100
17 100 100 100 100
18 100 100 100 100
19 100 100 100 100
20 100 100 100 100
21 100 100 100 100
22 100 100 100 100
23 100 100 100 100
24 100 100 100 100
25 100 100 100 100
26 100 100 100 100
27 100 100 100 100
28 100 100 100 100
29 100 100 100 75
30 100 100 100
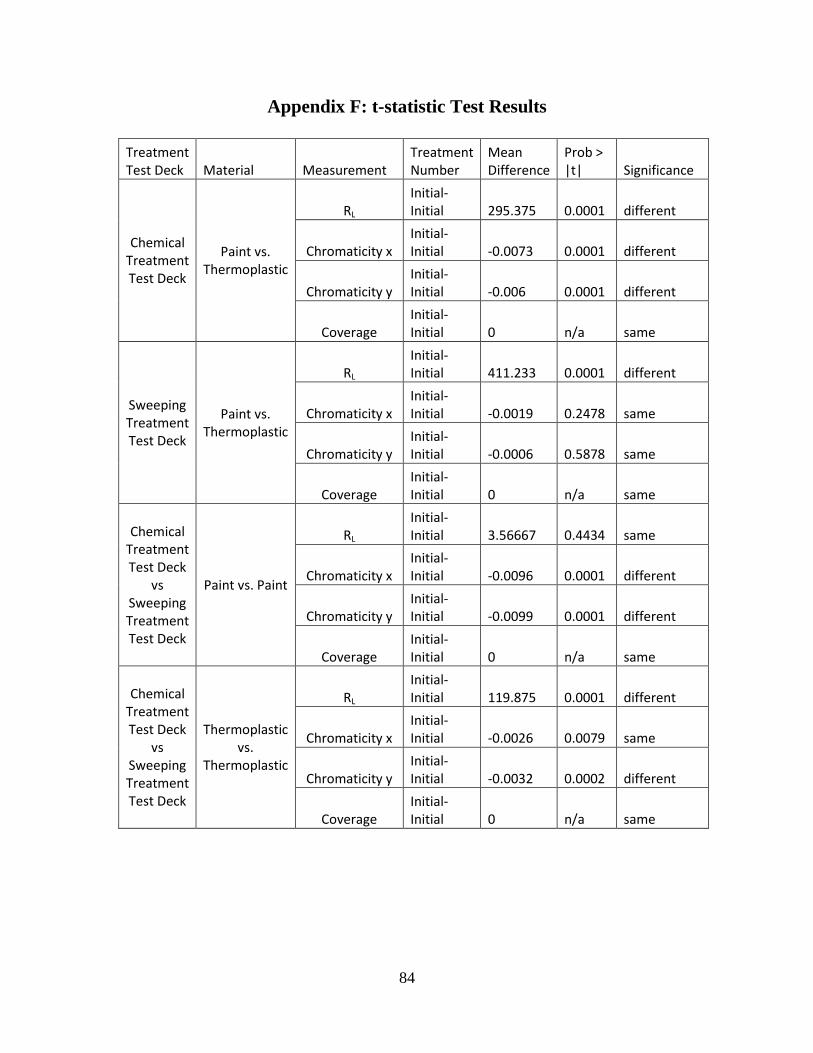
84
Appendix F: t-statistic Test Results
Treatment Test Deck Material Measurement
Treatment Number
Mean Difference
Prob > |t| Significance
Chemical Treatment Test Deck
Paint vs. Thermoplastic
RL Initial-Initial 295.375 0.0001 different
Chromaticity x Initial-Initial -0.0073 0.0001 different
Chromaticity y Initial-Initial -0.006 0.0001 different
Coverage Initial-Initial 0 n/a same
Sweeping Treatment Test Deck
Paint vs. Thermoplastic
RL Initial-Initial 411.233 0.0001 different
Chromaticity x Initial-Initial -0.0019 0.2478 same
Chromaticity y Initial-Initial -0.0006 0.5878 same
Coverage Initial-Initial 0 n/a same
Chemical Treatment Test Deck
vs Sweeping Treatment Test Deck
Paint vs. Paint
RL Initial-Initial 3.56667 0.4434 same
Chromaticity x Initial-Initial -0.0096 0.0001 different
Chromaticity y Initial-Initial -0.0099 0.0001 different
Coverage Initial-Initial 0 n/a same
Chemical Treatment Test Deck
vs Sweeping Treatment Test Deck
Thermoplastic vs.
Thermoplastic
RL Initial-Initial 119.875 0.0001 different
Chromaticity x Initial-Initial -0.0026 0.0079 same
Chromaticity y Initial-Initial -0.0032 0.0002 different
Coverage Initial-Initial 0 n/a same
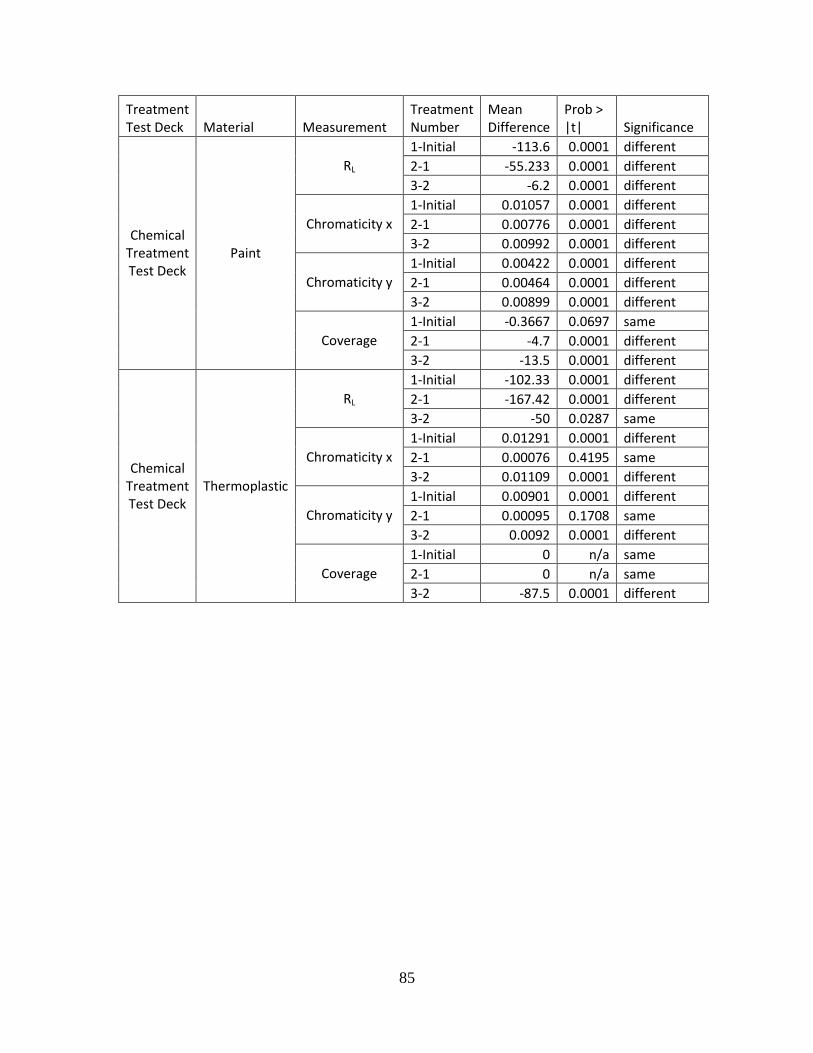
85
Treatment Test Deck Material Measurement
Treatment Number
Mean Difference
Prob > |t| Significance
Chemical Treatment Test Deck
Paint
RL 1-Initial -113.6 0.0001 different 2-1 -55.233 0.0001 different 3-2 -6.2 0.0001 different
Chromaticity x 1-Initial 0.01057 0.0001 different 2-1 0.00776 0.0001 different 3-2 0.00992 0.0001 different
Chromaticity y 1-Initial 0.00422 0.0001 different 2-1 0.00464 0.0001 different 3-2 0.00899 0.0001 different
Coverage 1-Initial -0.3667 0.0697 same 2-1 -4.7 0.0001 different 3-2 -13.5 0.0001 different
Chemical Treatment Test Deck
Thermoplastic
RL 1-Initial -102.33 0.0001 different 2-1 -167.42 0.0001 different 3-2 -50 0.0287 same
Chromaticity x 1-Initial 0.01291 0.0001 different 2-1 0.00076 0.4195 same 3-2 0.01109 0.0001 different
Chromaticity y 1-Initial 0.00901 0.0001 different 2-1 0.00095 0.1708 same 3-2 0.0092 0.0001 different
Coverage 1-Initial 0 n/a same 2-1 0 n/a same 3-2 -87.5 0.0001 different
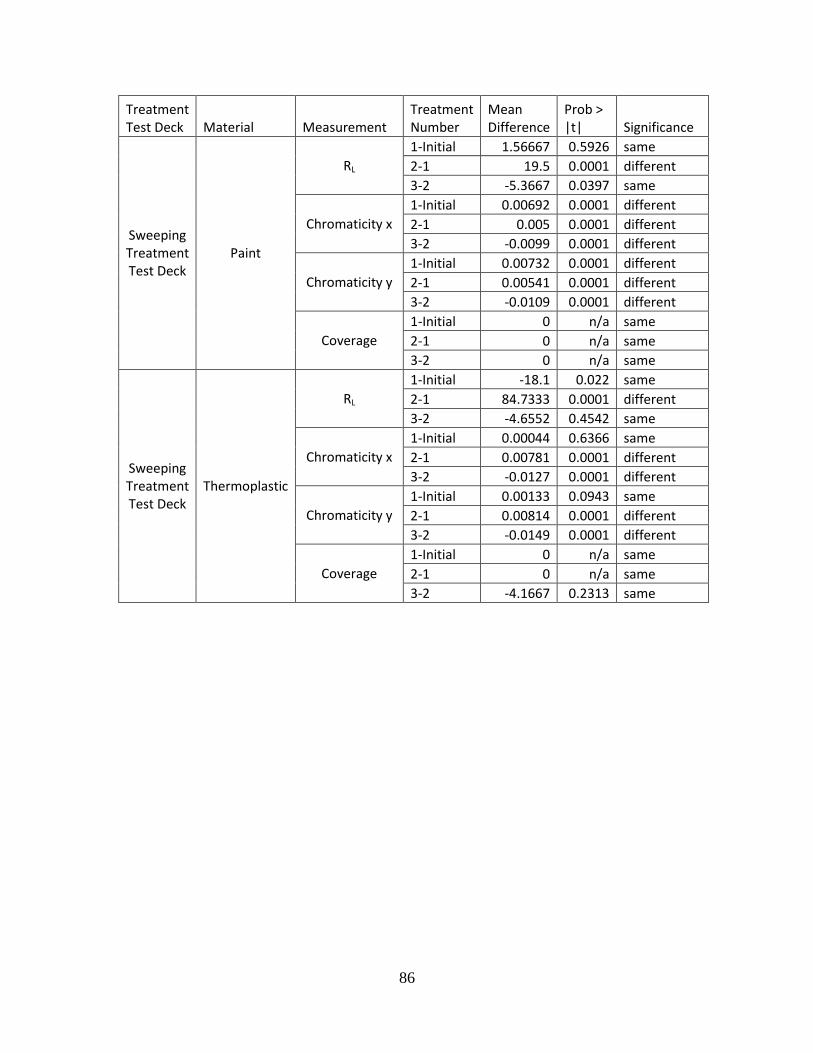
86
Treatment Test Deck Material Measurement
Treatment Number
Mean Difference
Prob > |t| Significance
Sweeping Treatment Test Deck
Paint
RL 1-Initial 1.56667 0.5926 same 2-1 19.5 0.0001 different 3-2 -5.3667 0.0397 same
Chromaticity x 1-Initial 0.00692 0.0001 different 2-1 0.005 0.0001 different 3-2 -0.0099 0.0001 different
Chromaticity y 1-Initial 0.00732 0.0001 different 2-1 0.00541 0.0001 different 3-2 -0.0109 0.0001 different
Coverage 1-Initial 0 n/a same 2-1 0 n/a same 3-2 0 n/a same
Sweeping Treatment Test Deck
Thermoplastic
RL 1-Initial -18.1 0.022 same 2-1 84.7333 0.0001 different 3-2 -4.6552 0.4542 same
Chromaticity x 1-Initial 0.00044 0.6366 same 2-1 0.00781 0.0001 different 3-2 -0.0127 0.0001 different
Chromaticity y 1-Initial 0.00133 0.0943 same 2-1 0.00814 0.0001 different 3-2 -0.0149 0.0001 different
Coverage 1-Initial 0 n/a same 2-1 0 n/a same 3-2 -4.1667 0.2313 same
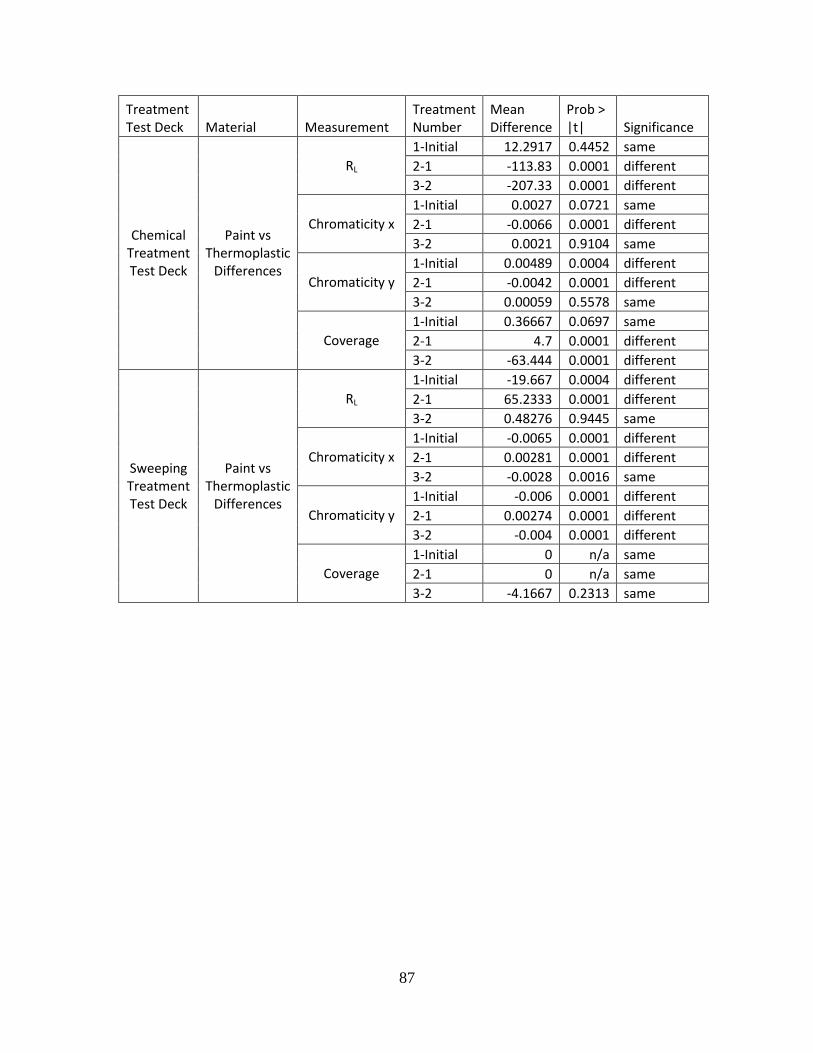
87
Treatment Test Deck Material Measurement
Treatment Number
Mean Difference
Prob > |t| Significance
Chemical Treatment Test Deck
Paint vs Thermoplastic
Differences
RL 1-Initial 12.2917 0.4452 same 2-1 -113.83 0.0001 different 3-2 -207.33 0.0001 different
Chromaticity x 1-Initial 0.0027 0.0721 same 2-1 -0.0066 0.0001 different 3-2 0.0021 0.9104 same
Chromaticity y 1-Initial 0.00489 0.0004 different 2-1 -0.0042 0.0001 different 3-2 0.00059 0.5578 same
Coverage 1-Initial 0.36667 0.0697 same 2-1 4.7 0.0001 different 3-2 -63.444 0.0001 different
Sweeping Treatment Test Deck
Paint vs Thermoplastic
Differences
RL 1-Initial -19.667 0.0004 different 2-1 65.2333 0.0001 different 3-2 0.48276 0.9445 same
Chromaticity x 1-Initial -0.0065 0.0001 different 2-1 0.00281 0.0001 different 3-2 -0.0028 0.0016 same
Chromaticity y 1-Initial -0.006 0.0001 different 2-1 0.00274 0.0001 different 3-2 -0.004 0.0001 different
Coverage 1-Initial 0 n/a same 2-1 0 n/a same 3-2 -4.1667 0.2313 same
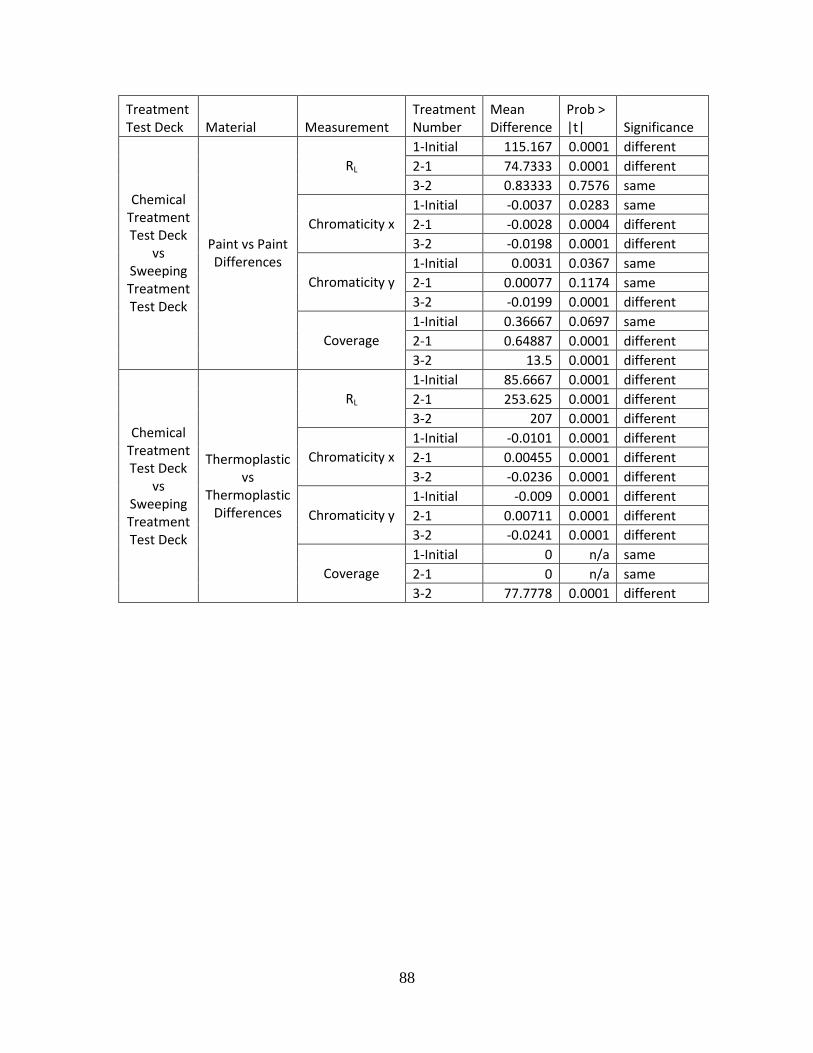
88
Treatment Test Deck Material Measurement
Treatment Number
Mean Difference
Prob > |t| Significance
Chemical Treatment Test Deck
vs Sweeping Treatment Test Deck
Paint vs Paint Differences
RL 1-Initial 115.167 0.0001 different 2-1 74.7333 0.0001 different 3-2 0.83333 0.7576 same
Chromaticity x 1-Initial -0.0037 0.0283 same 2-1 -0.0028 0.0004 different 3-2 -0.0198 0.0001 different
Chromaticity y 1-Initial 0.0031 0.0367 same 2-1 0.00077 0.1174 same 3-2 -0.0199 0.0001 different
Coverage 1-Initial 0.36667 0.0697 same 2-1 0.64887 0.0001 different 3-2 13.5 0.0001 different
Chemical Treatment Test Deck
vs Sweeping Treatment Test Deck
Thermoplastic vs
Thermoplastic Differences
RL 1-Initial 85.6667 0.0001 different 2-1 253.625 0.0001 different 3-2 207 0.0001 different
Chromaticity x 1-Initial -0.0101 0.0001 different 2-1 0.00455 0.0001 different 3-2 -0.0236 0.0001 different
Chromaticity y 1-Initial -0.009 0.0001 different 2-1 0.00711 0.0001 different 3-2 -0.0241 0.0001 different
Coverage 1-Initial 0 n/a same 2-1 0 n/a same 3-2 77.7778 0.0001 different
89
REPORT DOCUMENTATION PAGE Form Approved OMB No. 074-0188
The public reporting burden for this collection of information is estimated to average 1 hour per response, including the time for reviewing instructions, searching existing data sources, gathering and maintaining the data needed, and completing and reviewing the collection of information. Send comments regarding this burden estimate or any other aspect of the collection of information, including suggestions for reducing this burden to Department of Defense, Washington Headquarters Services, Directorate for Information Operations and Reports (0704-0188), 1215 Jefferson Davis Highway, Suite 1204, Arlington, VA 22202-4302. Respondents should be aware that notwithstanding any other provision of law, no person shall be subject to an penalty for failing to comply with a collection of information if it does not display a currently valid OMB control number.
PLEASE DO NOT RETURN YOUR FORM TO THE ABOVE ADDRESS.
1. REPORT DATE (DD-MM-YYYY) 22-03-2012
2. REPORT TYPE Master’s Thesis
3. DATES COVERED (From – To) August 2010-March 2012
4. TITLE AND SUBTITLE Maintenance Operations of Airfield Pavement Markings
5a. CONTRACT NUMBER
5b. GRANT NUMBER
5c. PROGRAM ELEMENT NUMBER
6. AUTHOR(S) Jaszkowiak, John, C Captain, United States Air Force
5d. PROJECT NUMBER N/A
5e. TASK NUMBER
5f. WORK UNIT NUMBER
7. PERFORMING ORGANIZATION NAMES(S) AND ADDRESS(S)
Air Force Institute of Technology Graduate School of Engineering and Management (AFIT/EN) 2950 Hobson Way WPAFB OH 45433-7765
8. PERFORMING ORGANIZATION REPORT NUMBER AFIT/GEM/ENV/12-M09
9. SPONSORING/MONITORING AGENCY NAME(S) AND ADDRESS(ES) Intentionally left blank
10. SPONSOR/MONITOR’S ACRONYM(S)
11. SPONSOR/MONITOR’S REPORT NUMBER(S)
12. DISTRIBUTION/AVAILABILITY STATEMENT Distribution Statement A APPROVED FOR PUBLIC RELEASE; DISTRIBUTION IS UNLIMITED
13. SUPPLEMENTARY NOTES
14. ABSTRACT Pavement markings are an essential element in the navigational aids subsystem for any airfield. Most airfields still use waterborne paint as the primary marking material. However, several other materials are in use on roadways which asset managers could incorporate, providing more cost and time effective practices. An airfield experiences a host of maintenance operations which cause degradation of the pavement markings. Of particular concern are rubber removal operations, sweeping operations, and snowplowing operations. This research focuses on chemical rubber removal operations and sweeping operations. This study evaluates waterborne paint and thermoplastic markings to determine if marking materials perform differently from each other, and if maintenance operations cause different degradation rates among the same material. Evaluation criteria include retroreflectance, chromaticity, and coverage. The two materials experience different degradation characteristics under both treatments. Waterborne paint failed retroreflectance and chromaticity measurements after the first chemical rubber removal treatment. Thermoplastic failed chromaticity and coverage measurements after the third chemical rubber removal treatment. Neither material showed any appreciable amount of degradation in any of the three performance measurements when subjected to sweeping operations.
15. SUBJECT TERMS
rubber removal, pavement markings, airfield maintenance operations, thermoplastic
16. SECURITY CLASSIFICATION OF: 17. LIMITATION OF ABSTRACT uu
18. NUMBER OF PAGES 103
19a. NAME OF RESPONSIBLE PERSON William E. Sitzabee, Lt Col, USAF
a. REPORT
U
b. ABSTRACT
U
c. THIS PAGE
U
19b. TELEPHONE NUMBER (Include area code) 937-255-3636 Ext. 7395
Standard Form 298 (Rev. 8-98) Prescribed by ANSI Std. Z39-18
Form Approved OMB No. 074-0188