Embed Size (px)
Citation preview

Assessment of Pre-Service Teachers’ Misconceptions in Geometrical Optics via a Three-Tier Misconception
Erdal TASLIDERE, Asst. Prof. Dr., Mehmet Akif Ersoy Üniversity,Faculty of Education, [email protected]
Ali ERYILMAZ, Assoc. Prof. Dr., Middle East Technical University, Faculty of Education, [email protected]
Abstract: This study was conducted to identify pre-service teachers’ misconceptions about various aspects of light, shadow and mirror images before they learn the geometrical optics at the university level. The participants of the study were 317 junior and sophomore level students studying at the departments of science and computer education. Students’ misconceptions were assessed via a revised three-tier geometrical optics misconception test. Its’ validity and reliability evidences were rechecked. The findings denoted that the revised test is a valid and reliable measuring tool for assessing pre-service teachers' misconceptions of light, shadow and plane mirror. The internal consistency of the test was measured via Cronbach alpha and its’ value was found as 0.65. The results revealed that most of the pre-service teachers have limited conceptual understanding and they hold 12 prevalent misconceptions about light, shadow and plane mirror image before their compulsory geometric optics lessons. It is thought that the findings of current study would be helpful for the instructors, who are teaching geometrical optics, in developing teaching plans for the pre-service science and computer teachers.
Key Words: Misconception, Geometrical optics, Three-tier diagnostics test, Conceptual understanding, Pre-service teacher
Öğretmen Adaylarının Geometrik Optik Konusundaki Kavram
Yanılgılarının Üç-Aşamalı Kavram Yanılgısı Testi ile
Değerlendirilmesi
Öz: Bu çalışma öğretmen adaylarının üniversitede geometrik optik konularını işlemeden önce ışık, gölge ve ayna görüntüleri ile ilgili kavram yanılgılarını tespit etmek amacı ile gerçekleştirilmiştir. Fen Bilgisi Öğretmenliği ve Bilgisayar ve Öğretim Teknolojileri Eğitimi bölümü birinci ve ikinci sınıflarında öğrenim gören 317 öğretmen adayı çalışmanın katılımcılarını oluşturmuştur. Adayların kavram yanılgıları, revize edilmiş üç-aşamalı geometrik optik kavram yanılgısı testi ile ölçülmüş ve testin geçerlilik ve güvenilirlik analizleri tekrar yapılmıştır. Sonuçlar, revize edilen testin öğretmen adaylarının ışık, gölge ve düzlem ayna konularındaki kavram yanılgılarını tespit etmek için geçerli ve güvenilir bir ölçüm aracı olduğunu göstermiştir. Testin iç güvenilirlik katsayısı olan Croanbach alfa değeri 0,65 olarak bulunmuştur. Elde edilen sonuçlar, öğretmen adaylarının çoğunun geometrik optik dersleri öncesinde ışık, gölge ve düzlem ayna görüntüleri ile ilgili kavramsal anlama düzeylerinin oldukça zayıf ve 12 yaygın kavram yanılgısına sahip olduklarını göstermiştir. Bu çalışmanın sonuçlarının; geometrik optik konularını anlatan öğreticilerin, fen bilgisi ve bilgisayar öğretmenliği lisans programlarındaki öğrenciler için öğretim planlarını hazırlamalarında yararlı olacağı düşünülmektedir.
Anahtar Kelimeler: Kavram yanılgısı, Geometrik optik, Üç-aşamalı kavram testi, Kavramsal
anlama, Öğretmen adayı
Bartın Üniversitesi
Eğitim Fakültesi Dergisi
Cilt 4, Sayı 1, s. 269 - 289, Haziran 2015
BARTIN – TÜRKİYE ISSN: 1308-7177
BartinUniversity
Journal of Faculty of Education
Volume 4, Issue1, p. 269 - 289, June 2015
BARTIN – TURKEY
Doi: 10.14686/BUEFAD.2015111057
Assessment of Pre-Service Teachers’ Misconceptions in Geometrical Optics via a Three-Tier Misconception Test Erdal TAŞLIDERE - Ali ERYILMAZ
270
1. GİRİŞ
Geometrical optics deals with optical phenomena involving light propagation through optical systems and the creation of illumination pattern (Langley et al., 1997). It has significant contributions to science, technology and other disciplines (Blizak et al., 2013). Hence, it has been included in national teaching programmes as the preferential concept to be learned. Unfortunately, research studies denoted that most of the students from primary school to university level have low level of conceptual understanding in various aspects of light, vision, shadow and mirror images, and their conceptions are generally different from those accepted by scientific communities (Galili et al., 1993; Galili & Hazan, 2000).
In the literature, the conceptions leading conflict with scientific view are labelled with different terms such as “preconceptions” (Clement, 1982), “misconceptions” (Engelhardt & Beichner, 2004; Hammer, 1996), “alternative conceptions” (Caleon & Subramaniam, 2010a; 2010b) or “common sense concepts” (Halloun & Hesteness, 1985). For this particular study, we will use “misconception” for the conceptions leading to conflict with scientific ones. Misconceptions are defined as the stable cognitive structures to change; they create a barrier to knowledge restructuring and affect learners’ scientific understanding (Hammer, 1996). Therefore, identifying the scopes of misconceptions and assessing them is mandatory for efficient science instruction (Odom & Barrow, 1995; Peşman & Eryılmaz, 2010).
Students’ misconceptions about geometrical optics have been studied in the past three decades from primary school to university level. Some investigated them via interviews (Bendall et al., 1993; Feher & Rice, 1988; Goldberg & McDermott, 1986), some investigated via questionnaires (Blizak et al., 2009, 2013; Favale & Bondani, 2013; Langley et al., 1997) and the remaining investigated via multiple choice diagnostics tests (Aydın, 2007; Chen et al., 2002; Fetherstonhaugh & Treagust, 1992; Kutluay, 2005; Kaltakci & Eryilmaz, 2010). In the last decades, investigating misconceptions via multiple choice diagnostics tests have become more preferable. Because, applications of them are easy, economical, not time consuming and allow greater generalizability of research findings (Wuttiprom et al., 2009). The primitive form of them was one-tier multiple choice diagnostics test. But it has major limitations; even the student, holding misconception, would select correct alternatives (Cohen et al., 1983) or any selected wrong response would be accepted as misconception although it is not (Peşman & Eryılmaz, 2010). These encouraged researchers develop first two-tier (Treagust, 1988) and then three-tier misconception tests (Hasan et al., 1999). Two-tier test has both content (first-tier) and reason tier (second-tier). The content tier is a conventional multiple-choice item and the reason tier is the follow-up question that presents potential conceptions for the first-tier (Odom & Barrow, 1995). The advantage of two-tier test is that it enables researchers determine whether a wrong answer resulted from a misconception or the correct answer resulted from scientific conception. Although two-tier tests are more efficient than one-tier tests, they do not enable researchers differentiate whether the wrong answer resulted from a misconception or lack of knowledge due to presence of guessing (Arslan et al., 2012; Caleon & Subramaniam, 2010a, 2010b; Hasan et al., 1999). Even the wrong answer resulted from lack of knowledge would be accepted as misconception although it is not. Hence, Hasan et al. proposed developing three-tier tests by adding a response certainty index. A three-tier test is simply a two-tier test with a certainty of response index which asks student whether s/he is sure or unsure about ideas presented in the content and reason tiers (Caleon & Subramaniam, 2010a; Peşman & Eryılmaz, 2010). It is claimed that in order to accept any conception as a misconception, student must first select the misconception alternatives in both of the content and reason tiers and then advocate them (Hasan et al., 1999; Peşman & Eryılmaz, 2010). The addition of certainty of response index enabled researchers differentiates whether the wrong

Bartın Üniversitesi Eğitim Fakültesi Dergisi 4(1), s. 269 – 289, Haziran 2015 BartinUniversityJournal of Faculty of Education 4(1) p. 269 – 289, June 2015
271
answer resulted from misconception or lack of knowledge (Arslan et al., 2012; Hasan et al., 1999).
In the literature, students' lack of knowledge was primitively defined as the situation of being unsure at the third-tier regardless of having correct or incorrect responses to the content and/or reason tiers (Hasan et al., 1999). But, Odom and Barrow (2007) reported that uncertainty would possibly result from guessing or low understanding. Hence, there was a need to explain the source of low certainty index; whether it results from lack of knowledge or guessing. Then, Arslan et al. (2012) reinterpreted the lack of knowledge as the situation of being uncertain at the third-tier and having wrong responses for either of content and/or reason tier (correct/wrong/unsure, wrong/correct/unsure, wrong/wrong/unsure). They also treated the situation of having correct responses given to both first and second-tier and denoting uncertainty at the third-tier (correct/correct/uncertain) as lack of confidence (or the lucky guess). These enabled researchers differentiate any lack of knowledge from lack of confidence and develop effective instructional activities to remedy them. Because remedying any misconception requires different instructional methods than remedying lack of knowledge (Hasan et al., 1999).
1.1. Students’ Misconceptions of Geometrical Optics
There are a number of researches investigating students’ conceptual understanding and misconceptions in geometrical optics at the elementary schools (Feher & Rice, 1988), high schools (Chen et al., 2002; Favale & Bondani, 2013; Goldberg & McDermott, 1986; Langley et al., 1997) and university (Aydın, 2007; Bendall et al., 1993; Blizak et al., 2009, 2013; Kaltaki & Eryilmaz, 2010) levels. Their findings were summarized briefly in Appendix. They generally reported that students’ misconceptions in geometrical optics persisted through schooling years although they encountered it several times. Even the pre-service teachers who will conduct teaching activities in their schools denote misconceptions in the concerning concept (Aydın, 2007; Bendall et al., 1993; Blizak et al., 2009, 2013; Kaltakci & Eryilmaz, 2010). Hence, the main focus of this study was to investigate pre-service teachers’ conceptual understandings and their misconception in geometrical optics before they learn the concept at the university level. Identifying their misconceptions by differentiating them from lack of knowledge and investigating how prevalent are the misconceptions would be valuable. By doing so, the required precautions would be taken to overcome the lack of knowledge or remedy misconceptions in the concerning topics before instructions. Hence, the current study will make contribution to physics education literature by exposing Turkish pre-service teachers' common misconceptions about various aspects of light, vision, shadow, and mirror images in the geometrical optics before they study the related concepts at the university level. The findings of current study would be helpful for the instructors, who are teaching geometrical optics, in developing teaching plans for the pre-service science and computer teachers.
2. METHOD
The research method and participants, measuring tool and its validity and reliability evidences were defined in the following sections.
2.1. Research method and Participants
A cross-sectional survey method was used to collect information about pre-service teachers’ misconceptions in geometrical optics. Participants were 317 junior and sophomore level pre-service teachers (male=117, female=200) studying in Science Teaching and Computer
Assessment of Pre-Service Teachers’ Misconceptions in Geometrical Optics via a Three-Tier Misconception Test Erdal TAŞLIDERE - Ali ERYILMAZ
272
Teaching programs in a Government University. Students’ ages range from 18 to 24 years. The number of participants according to grade-level and gender were given in Table 1.
Table 1: Number of Students According to Grade Level and Gender
Programs Junior-level Sophomore-level
Total Male Female Male Female
Science Teaching 30 97 48 74 249
Computer Teaching 19 17 20 12 68
Total 49 114 68 86 317
These students previously studied the concepts of geometrical optics in their high schools. They will study the same topics in the context of compulsory General Physics Courses at the university level.
2.2. Measuring Tool
A Three-Tier Geometrical Optics Misconception Test (GOMT), developed by Kutluay (2005), was revised and used to measure pre-service teachers’ misconceptions in geometrical optics. It was originally developed with 16 items. Its’ validity and reliability evidences were established and the internal reliability coefficient of Croanbach alpha was reported as .55 by Kutluay.
In their study, Chen et al. (2002) developed a two-tier test like Kutluay (2005) about geometrical optics. They noted that although some items identified misconceptions in open-ended questionnaire, some of them were less effective in the final form of the test. Hence, they suggested revising the next versions by omitting some alternatives functioning poorly. In the same way, close investigation of the GOMT denoted that some alternatives of the items do not have any compensation in misconception list reported by Kutluay. Hence, we omitted them and added three more items in case of increasing the overall reliability as suggested by Crocker and Algina (2008). Then, the test was checked by one expert at the university to re-establish the content and face validities. The expert investigated the test in terms of appropriateness of items, representativeness of content and the suitability of the format. The suggested revisions were conducted and the final form of Revised Geometrical Optics Misconception Test (RGOMT) was obtained.
2.3. Data Collection
The RGOMT was administered in 2010-2011 academic years by the researchers. The students were informed that the results of the test would not affect their physics grades and be honest while responding the items. They completed the RGOMT as individuals and were not required to write their names to assure anonymity. The students completed the tests in 35-40 minutes.
Upon gathering data, item analysis was conducted, and then the validity and reliability evidences were re-established. Finally, pre-service teachers’ understanding of geometrical optics and their misconceptions were investigated in terms of tiers with frequency analyses.
2.4. Item Analyses
Students' responses for each item were translated into dichotomous variables by considering all three-tiers. In other words, if students’ responses to both first and second-tiers are correct and s/he denoted confidence at the third-tier, then the item was coded as 1,

Bartın Üniversitesi Eğitim Fakültesi Dergisi 4(1), s. 269 – 289, Haziran 2015 BartinUniversityJournal of Faculty of Education 4(1) p. 269 – 289, June 2015
273
otherwise it was coded as 0. Both the item difficulty index and item discrimination index were calculated for each item and test in general. The related values were given in Table 2.
Table 2: Item Analysis Results
Statistics related to item difficulty
Mean .14 number of items (range .00-.09) 7 number of items (range .10-.19) 7 number of items (range .20-.29) 4 number of items (range .30-.33) 1
Statistics related to item discrimination (point biserial correlation coefficient)
Mean .37 number of items (range .00-.19) 4 number of items (range .20-.29) 2 number of items (range .30-.39) 1 number of items (range .40-.49) 9 number of items (range .50-.59) 1 number of items (range .60-.62) 2
As seen from Table 2, item difficulty indices, denoting the proportion of examinees answering the item correctly, range between .00 and .33. Conventionally, an index value >.90 is accepted as too easy item, and a value<.30 is accepted as too difficult item (Wuttiprom et al., 2009). As seen, the index values for 18 of the 19 items are below the threshold value of .30. The overall mean of the test (.14) indicates that the RGOMT was considerably difficult for the pre-service teachers.
Item discrimination index denotes how effectively the item discriminates between examinees those are relatively high on the criterion of interest and those who are relatively low (Crocker & Algina, 2008). Any item with index value (represented by the point biserial correlation coefficient) >.20 is considered as acceptable (Wuttiprom et al., 2009). As seen from Table 2, 15 items have greater indices than .20. Only four items; 4, 5, 8 and 11 had smaller indices of .11, .05, .14 and .18 respectively. In these situations, Crocker and Algina (2008) suggest checking the item for the possible presence of ambiguity, clues and others technical defects. If none is found and the item really measures the learning outcome, than it could be retained for future use (Linn & Gronlund, 1995). Hence the foregoing items were closely examined and no serious problem was detected. Most probably, the low index values of them have resulted from the higher difficulty levels. Because difficulty indices were calculates as.22, .01, .02 and .02 respectively. This means that above four items were difficult for this group of students. On the other hand, the mean value of the point biserial coefficient (.37) indicates that the RGOMT is satisfactorily discriminatory. Hence, since the difficulty and discrimination indices of overall test are in acceptable regions, no items were omitted from the RGOMT and all analyses were conducted over the obtained data.
2.5. Validity and Reliability Evidences
For the construct validity, the correlation between students' scores obtained from first two tiers (when responses given to both first and second tiers are correct then item was coded with “1”, otherwise it was coded wit “0”) and that of obtained from only the Confidence level (each item was coded with “1” for confident student and “0” for the uncertain student) was investigated based on the suggestion of Cataloglu (2002). Because, he claimed that the students with high scores were expected to be more confident than were the ones with low scores. The result yielded a positive and significant correlation (r=.252, p<.01). In addition, an exploratory factor analysis was conducted over the scores obtained from all three-tiers. The

Assessment of Pre-Service Teachers’ Misconceptions in Geometrical Optics via a Three-Tier Misconception Test Erdal TAŞLIDERE - Ali ERYILMAZ
274
results denoted that, the items were collected under five factors as in the study of Kutluay (2005). The reliabilities of the factors were .6, .3, .5, .5 and .3. It is seen that the reliabilities of the factors are a bit low. The cumulative percent of variance explained by all factors was 54%.
The content validity was checked via the proportions of false positive and false negative. Hesteness and Halloun (1995) defined students’ correct response with wrong conception as the false positive and wrong response with correct conception as the false negative. They noted that lowering the percentage of false positive is too difficult because of the nature of concept tests but the proportion of false negative should be smaller than 10%. In this study, the item was accepted as false positive for the correct/incorrect/certain response set and the false negative for the incorrect/correct/certain response set as Arslan et al. (2012) suggested. The findings denoted that the mean of the false positive was 16% and that of false negative was 2%. These values were in acceptable regions according to Hesteness and Halloun. The reliability coefficient of Cronbach alpha was calculated as .65, suggesting that 65% of the observed score variance is attributable to true score variance.
3. FINDINGS AND DISCUSSIONS
In this section, first the descriptive results were presented and then the pre-service teachers' conceptual understanding and misconceptions were investigated. The findings were compared with those of previous researches.
3.1. Descriptive statistics of the RGOMT
The overall descriptive statistics were conducted on the scores obtained from all three-tiers as given in Table 3. The maximum score is 11 and the minimum score is 0 out of 19. The mean value of the scores is 2.24, which indicates that pre-service teachers’ conceptual understanding level in geometrical optics is considerably low.
Table 3: Overall Descriptive Statistics of the RGOMT
Statistics Values
Number of items 19 Number of participants 317 Mean 2.24 Standard Deviation 2.24 Minimum 0.00 Maximum 11.00 Cronbach alpha 0.65
3.2. Pre-service Teachers’ Understanding of Geometrical Optics
Proportions of students having correct answers according to only the first-tier, first two-tier and all three-tiers and those of lack of knowledge and lack of confidence were calculated as suggested by Arslan et al. (2012). All calculated values were given in Table 4.
Table 4: Percentage of Correct Answers, Lack of Knowledge and Lack of Confidence
% Correct responses
Items Only First tiers
First two tiers
All three tiers
% Lack of Knowledge
% Lack of Confidence
1 30 20 16 32 4 2 35 29 19 44 10 3 51 14 10 25 4 4 33 29 22 19 8 5 6 3 1 40 2 6 62 31 22 26 9

Bartın Üniversitesi Eğitim Fakültesi Dergisi 4(1), s. 269 – 289, Haziran 2015 BartinUniversityJournal of Faculty of Education 4(1) p. 269 – 289, June 2015
275
7 56 36 26 25 10 8 29 4 2 50 2 9 40 12 5 46 7
10 38 24 12 46 11 11 88 4 2 34 3 12 58 41 27 26 13 13 27 11 7 27 4 14 44 40 32 28 0 15 74 18 12 39 6 16 26 5 3 40 3 17 39 27 17 34 10 18 30 21 12 51 8 19 70 13 9 50 4
Mean 44 20 13 36 6
As seen from Table 4, increase of the number of tiers led to decrease of the proportions of correct responses. When only the first tiers of items are considered, the mean percentage of correct responses was 44. This means that, average 44% of the students selected the correct alternatives of items in whole test. The concerning values are found as 20% and 13% when both and all three-tiers are taken into account, respectively. This outcome reveals that three-tier tests are more effective for finding the real proportion of students having scientific conceptual understanding than conventional one-tier and two-tier multiple choice tests (Peşman & Eryılmaz, 2010).
Table 4 indicates that the percentages of lack of knowledge for each item range between 19 and 51. Higher mean percentage value for lack of knowledge (36%) than that of correct responses (13%) indicates that the pre-service teachers could not grasp scientific understanding satisfactorily and couldn't achieve scientific conceptualization of geometrical optics in their previous geometrical optics instructions during their high schools. Table 4 also shows that the percentage of lack of confidence ranges between 2 and 13 with a mean value of 6. This implies that in average 6% of students selected the correct answers for both of the first and second-tiers, but they showed uncertainty at the third-tier. In other words, they reached the correct answers of first and second tiers by chance.
3.3. Pre-service Teachers’ Misconceptions in Geometrical Optics
To see how prevalent the misconceptions are, the proportions of misconceptions according to only the first-tier (M-first), both first and second-tiers (M-both) and all three-tiers (M-all) were calculated based on the choice selections indicating misconceptions. The calculation process for misconception 6 (M6) was explained briefly to make it more clear. M6 is measured by item-3 and item-4 (3.1b, 3.2a, 3.3a; 4.1a, 4.2b, 4.3a). In calculating M-first, only the first tiers of concerning items were considered. If student selected 3.1b and 4.1a, then s/he was accepted as having M6 for both items. Then, number and percentage of students holding M6 for both items were calculated individually and finally the mean percentage value was obtained by taking the average of both. The same procedure was followed in obtaining the M-both and M-all. In these cases, first two and all three-tiers were taken into account respectively. The findings were given in Table 5.

Assessment of Pre-Service Teachers’ Misconceptions in Geometrical Optics via a Three-Tier Misconception Test Erdal TAŞLIDERE - Ali ERYILMAZ
276
Table 5: Percentages of the Misconceptions According to the First, Both and All Three-Tiers
Misconceptions M-first M-both M-all
M1 Light colored objects can be seen in total darkness since they emit light.
26 9 4
M2 There will be black rays in the total darkness. 35 4 3 M3 Eyes can get used to seeing in total darkness. 33 10 6 M4 Light travels a different distance depending upon whether it is
day or night. 32 7 3
M5 Light is emanating in only one direction from each source, like flash light beams.
38 23 15
M6 Shadow of the object is clearer when the bigger bulb is used as a light source.
41 26 20
M7 Shadow belongs only to the non-luminous object and always looks like the object.
80 23 15
M8 There will be no shadow even if a light source and a non-transparent object exist together.
8 6 5
M9 In the region of geometrical overlap there would be either lightness (full illumination) or darkness (shadow). They did not consider semi darkness and treated the shadow as the presence of something.
31 24 16
M10 Shadow is black color and light is white color. When they overlap, they mix and form the grey color.
62 16 11
M11 To see the image of an object, it should be inside the front region straight ahead of the mirror.
17 10 4
M12 Students think that an image in a plane mirror lies on or behind the mirror along the line of sight between a viewer and the object.
47 22 14
M13 An observer can see the object because s/he directs sight lines toward it, with light possibly emitted from the eyes.
72 33 19
M14 In the presence on an illuminant, the position and size of the image of an illuminated object depend on the location of illuminant.
59 40 20
M15 The position and size of the image of any object depend on the location of the observer. When the observer retreats, then location of the image also changes.
57 35 14
M16 Image of a black object on the mirror was due to black rays bouncing off the black object.
88 22 15
M17 Creating images are an inherent attribute of the silvery mirror material, rather than the product of the reflection process.
40 13 8
M18 The position of the image shifts as the observer view it from different perspectives.
63 47 29
M19 Image of any object is located right ahead of the observer. 41 9 5 M20 To see her/him in a plane mirror within a dark room, s/he
should illuminate the mirror rather than herself/himself. 23 21 15
Mean 45 20 12
As seen from Table 5, increase of tiers led to decrease of the percentage of students having misconceptions. To make it more clear let's consider M1. Table 5 shows that 26% of the students seem to have M1 according to only the first-tier of the related items. When both and all three-tiers are considered, 9% and 4% of students seem to have M1 correspondingly. These values indicate that 17% of the students (26% - 9%), who selected misconception alternatives in the first tiers, did not select the supporting misconception explanations in the second tiers. In the same way 5% of the students, who previously selected misconception alternatives at the first and second tiers, denoted uncertainty at the third tier (9% - 4%). The same trend is

Bartın Üniversitesi Eğitim Fakültesi Dergisi 4(1), s. 269 – 289, Haziran 2015 BartinUniversityJournal of Faculty of Education 4(1) p. 269 – 289, June 2015
277
observed for all misconception categories as seen in Table 5. As Hasan et al. (1999) and Peşman and Eryilmaz (2010) claimed, the real percentage of M1 is 4% according to all three-tiers.
In classifying whether the misconception is prevalent or not, we referenced to Caleon and Subramaniam (2010a) and considered the misconception, owned by more than 10% of students, as prevalent one. As seen from Table 5, 12 misconceptions (M18, M14, M6, M13, M9, M5, M7, M16, M20, M12, M15, and M10) seem to be prevalent. Among the above, M18 was the most prevalent one. The analysis indicated that according to 29% of the students, location of the image of an object in the plane mirror shifts as the observer change his/her position. These students didn’t realize that the absolute position of the image remains same as the observer moves. For example, item-13 is one of the items assessing this misconception as shown in Figure 1.
Figure 1: The Related Figure for Item-13
It presents a pencil and a plane mirror, placed on top of a table. A student sits in front of the table and looking into the mirror to see the image of pencil placed in front of it. The question asks whether the location of the image change if the student changes his position by sitting on nearby chair placed left side. The frequency analysis of the responses denoted that according to 72% of the students, the location of the image changes. Among them, 53% reasoned that since the line of sight change, the student sees the image on the right side of the mirror and 39% of them approved their ideas at the third-tier. The other 13% denoted the same reasoning but they defined the location of image behind the right side of mirror and 8% approved their ideas at the third-tier. In their interviews with college students, Goldberg and McDermott (1986) used the same setup and asked participants put their fingers above the image when they move left side. Researchers reported that 50% of the pre-instruction and 30% of the post-instruction groups indicated that the location of the image shifts right side as they move towards left side. The similar finding was also reported by Blizak et al. (2009). They stated that according to 41% of the university students, the image would move to the right side if the observer moves towards left side.
The second prevalent misconceptions were M14 and M6. M14 reveals the confusion between image and shadow. The findings denoted that according to 20% of the students, the position and size of the image of an illuminated object depend on the position of illuminant. For example item-8 presents that an experiment is conducted in a darkened room in which a plane mirror and a pencil are placed on a table and an observer is looking into the mirror to observe the image of the pencil. The lamp is the only the illuminating source placed above the observer as given in Figure 2.

Assessment of Pre-Service Teachers’ Misconceptions in Geometrical Optics via a Three-Tier Misconception Test Erdal TAŞLIDERE - Ali ERYILMAZ
278
Figure 2: The Related Figure for Item-8
The question asks what will happen to the location of the image of the pencil seen by the observer if the lamp is raised a little higher. The findings denoted that according to 61% of the students, the location of the image moves down. Among them, 48% selected the supporting figures denoting that the image shifted downward in the second-tier and 26% approved their ideas at the third-tier. Likewise, 48.6% of pre-service science teachers in Aydın (2007), 17.2% of high school students in Chen et al. (2002) and 30% of high school students in Favale and Bondani’s (2013) studies denoted the same misconception. The other one, M6, is related with the formation of shadow. The analysis yielded that according to 20% of the students, the bigger light source produces a clearer shadow on the screen. For instance, item-4 presents a bulb, opaque card and a screen which are placed along the same straight line as in Figure 3.
Figure 3: The Related Figure for Item-4
It asks in which direction, towards the card or away from the card, the bulb should be moved to obtain clearer shadow on the screen. The analysis showed that according to 54% of the students, the bulb should be moved towards the card. 42% of them reasoned that, as the bulb approaches the card, then more powerful light reaches to it and 33% of them approved their ideas at the third-tier. A similar finding was found by Galili and Hazan (2000).They reported that most of high school and college students believed that the stronger light source produces a bigger shadow.
The third prevalent misconception was M13, which is related with the nature of seeing. 19% of the students believed that an observer can see the object when s/he directs lines of sight towards it; with light possibly emitted from the eyes. Close investigation of the responses given to item-15 supported this claim. The item presents that a girl is standing on one side of mirror and looking into it to see the flower which is placed at the other side of mirror as given in Figure 4.

Bartın Üniversitesi Eğitim Fakültesi Dergisi 4(1), s. 269 – 289, Haziran 2015 BartinUniversityJournal of Faculty of Education 4(1) p. 269 – 289, June 2015
279
Figure 4: The Related Figure for Item-15
The question asks whether the girl can see the flower in the mirror or not. According to the findings, 74% of the students indicated that the girl can see the flower at the first-tier. 54% of them selected supporting figures, denoting the light rays emerging from eyes of the girl towards the mirror as in Figure 4.1.
a
b
Figure 4.1: The Related Alternatives Selected by the Students for Item-15
Among them, 17% reasoned that the light rays emerging from the eyes reflect from mirror towards the flower (Figure 4.1a) and 12% of them approved their ideas. Remaining 37% (54-17) reasoned that light rays reflecting from the flower produce image in the mirror and the light rays emerging from the eyes reach the mirror to see the image (Figure 4.1b) and 20% of them approved their ideas at the third-tier. The similar finding was reported by Blizak et al. (2009). They reported that 26% of their university students believed that light rays emerge from eyes toward the object.
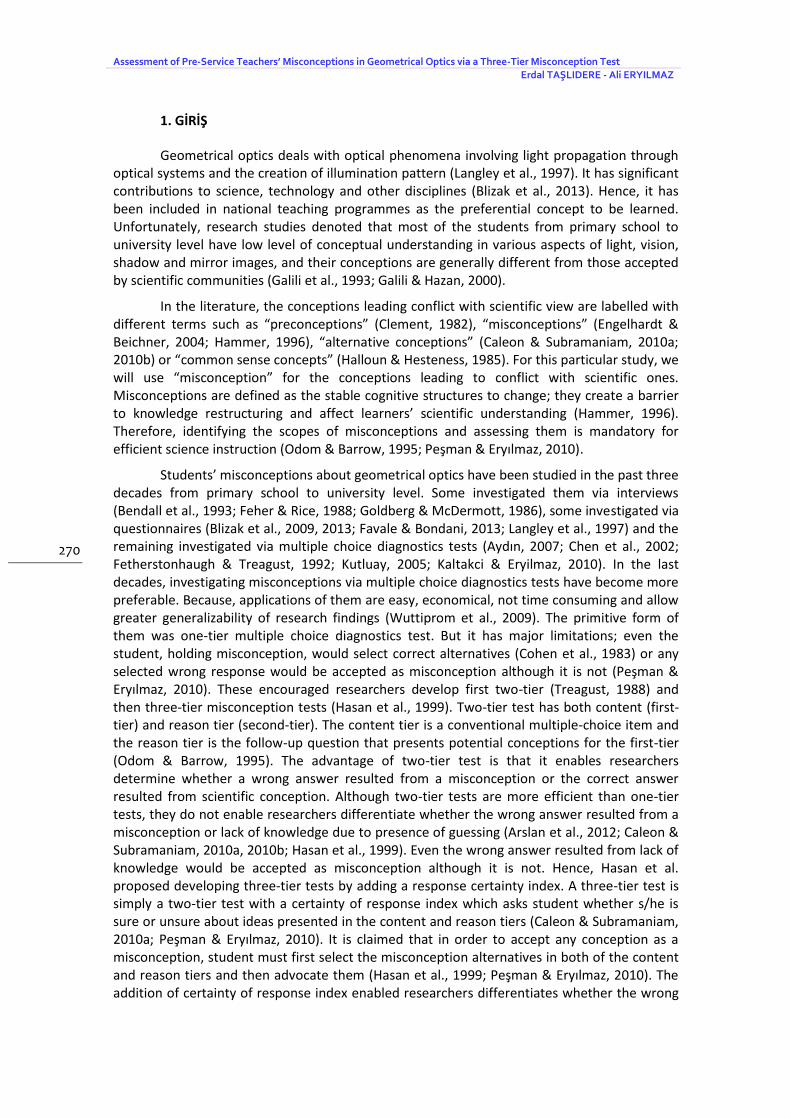
The fourth prevalent misconception was M9 that is related with the formation of umbra and penumbra. According to M9, 16% of the students considered that in the region of geometrical overlap there would be either lightness (full illumination) or darkness (shadow). They didn’t consider semi darkness and treated the shadow as the presence of something. For example, item-6 is assessing M9. The item presents two figures; each consists of two tabular light sources (placed side-by-side), one opaque object and a screen as in given Figure 5.
Figure 5. The Related Figure for Item-6
The figures show also the appearances of screens when the source located right-side and the one located left-side are open respectively. The question asks how the screen appears when both sources are open concurrently. The results showed that 31% of the students selected one of the two alternatives indicating only a dark shadow over the region as given in Figure 5.1.
Assessment of Pre-Service Teachers’ Misconceptions in Geometrical Optics via a Three-Tier Misconception Test Erdal TAŞLIDERE - Ali ERYILMAZ
280
Figure 5.1: The Related Alternatives Selected by the Students for Item-6
Among them, 26% reasoned that light rays emerging from both sources are prevented by the opaque card and the dark region appears as a deep shadow, and 17% of them approved their ideas. Same misconception was also reported by the previous studies (Bendall et al., 1993; Feher & Rice, 1988). As Bendall et al. reported students failed to think of the situation in terms of whether light from each source would reach each part of the screen or not.
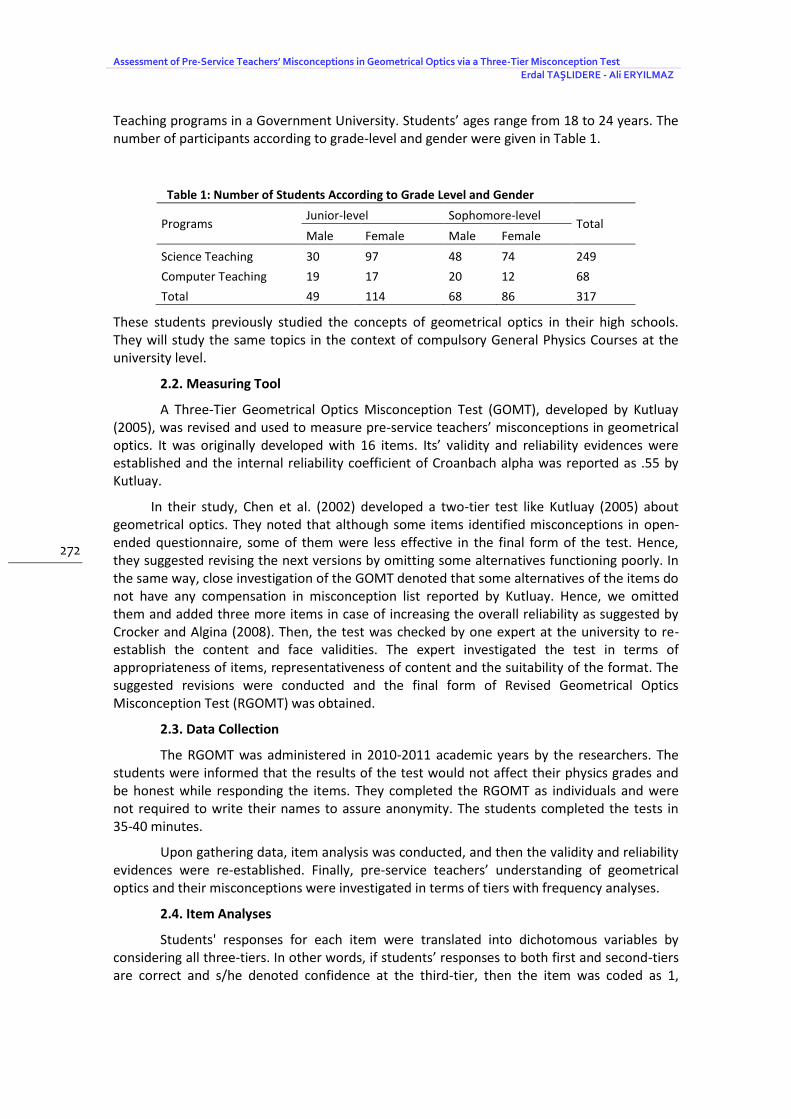
M5, M7, M16 and M20 were the fifth prevalent misconceptions. M5 exposes students’ ideas about the emission of light from a light source. According to 15% of the students the light leaves the bulb in a roughly radial direction rather than going outward from a single point on the bulb. In the test, this misconception was measured by item-5 as given in Figure 6.
Figure 6: The Related Figure for Item-5
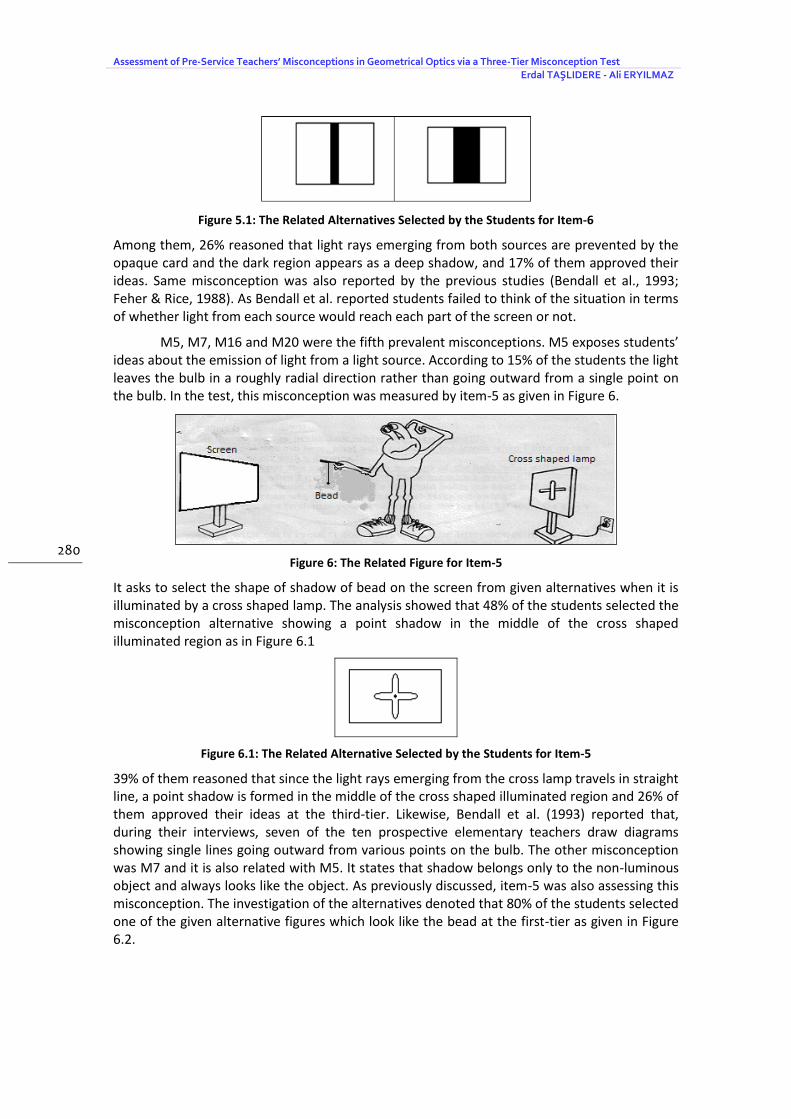
It asks to select the shape of shadow of bead on the screen from given alternatives when it is illuminated by a cross shaped lamp. The analysis showed that 48% of the students selected the misconception alternative showing a point shadow in the middle of the cross shaped illuminated region as in Figure 6.1
Figure 6.1: The Related Alternative Selected by the Students for Item-5
39% of them reasoned that since the light rays emerging from the cross lamp travels in straight line, a point shadow is formed in the middle of the cross shaped illuminated region and 26% of them approved their ideas at the third-tier. Likewise, Bendall et al. (1993) reported that, during their interviews, seven of the ten prospective elementary teachers draw diagrams showing single lines going outward from various points on the bulb. The other misconception was M7 and it is also related with M5. It states that shadow belongs only to the non-luminous object and always looks like the object. As previously discussed, item-5 was also assessing this misconception. The investigation of the alternatives denoted that 80% of the students selected one of the given alternative figures which look like the bead at the first-tier as given in Figure 6.2.

Bartın Üniversitesi Eğitim Fakültesi Dergisi 4(1), s. 269 – 289, Haziran 2015 BartinUniversityJournal of Faculty of Education 4(1) p. 269 – 289, June 2015
281
Figure 6.2: The Related Alternative Selected by the Students for Item-5
23% of them reasoned that shape of the source does not affect the formation of shadow, the important thing is the shape of object and 15% of them approved their ideas at the third-tier. In their study, Feher and Rice (1988) constructed the same setup as in Figure 6, and interviewed with 40 middle school students. Their results showed that 78% of the interviewee predicted a circle-shaped shadow. Some of them reasoned that the light is blocked or deflected by the bead. After their prediction, the researchers conducted the experiment and showed the real appearance of cross-shaped shadow on the screen. Even after their observations, half the three-quarter students insisted that the shadow of the bead was also in the centre of the cross-shaped shadow.
The other misconception, M16, is related with the formation of image of black object in the mirror. The findings denoted that according to 15% of the students, the image of a black object on the mirror was due to black rays bouncing off the black object. For instance, item-11 presents a white ball placed in front of a plane mirror and an observer is looking into the mirror to see the image of the ball as given in Figure 7.
Figure 7: The Related Figure for Item-11
The question asks whether the observer can see the ball if it is replaced with the black one. The results indicated that according to 88% of the students, the observer can see the image of black ball. But, 22% of them reasoned that the black ball scatters external light, some of which heads towards and reflect from the mirror and the reflected rays reach the eyes of the observer and 15% of them approved their ideas. The similar finding was reported by Chen et al. (2002). Chen et al. administered item-11 to both in their open-ended questionnaire and two-tier test. Their results denoted that 60% of the students in open-ended questionnaire and 58.3% of the students in two-tier test showed the same misconception. The other misconception, M20, exposes students’ ideas about the path of light to obtain clear image in the mirror. For instance, item-14 presents that at midnight a boy is awakened by mosquito bites on his chin. He takes a flashlight and faces a mirror to see his chin. It asks what he should aim the flash light at to see the bite more clearly in the mirror. Findings denoted that, according to 23% of the students, the boy should aim the flash light towards the mirror at the first-tier. 21% of them selected either one of the two supporting alternatives, illuminating mirror rather than his chin, as in Figure 8 and 15% approved their ideas at the third-tier.

Assessment of Pre-Service Teachers’ Misconceptions in Geometrical Optics via a Three-Tier Misconception Test Erdal TAŞLIDERE - Ali ERYILMAZ
282
Figure 8: The Related Alternatives Selected by the Students for Item-14
12.9% of high school students in the study of Chen et al. (2002) and 40% and 34.4% of pre-service science teachers in control and experimental groups in the study of Aydın (2007) denoted the same misconception.
The sixth prevalent misconceptions were M12 and M15. M12 exposes students’ ideas about the location of the image in the mirror for different observers. Findings denoted that according to 14% of the students, the image in a plane mirror lies on or behind the mirror along the line of sight between a viewer and the object. The analysis of item-16 supported this claim. In the question, a boy and a girl seated in front of the mirror side-by-side and looking into the mirror to see the image of pencil placed in front of the mirror as in Figure 9.
Figure 9: The Related Figure for Item-16
The question asks whether both students see the image of the pencil at the same location or not? The frequency analysis of the alternatives denoted that according to 71% of the students, both see the images at different locations. Among them, 33% reasoned that since the line of sight of both students are different, the boy sees the image at the right side behind the mirror and the girl sees it at the left side behind the mirror and 20% of them approved their ideas at the third-tier. The other 20% selected the same reasoning but they defined the locations of image on the surface of the mirror and 11% of them approved their ideas at the third-tier. The finding is consistent with the previous study reports (Aydın, 2007; Blizak et al., 2009; Kaltakci & Eryilmaz, 2010; Chen et al., 2002; Goldberg & McDermott, 1986). In the study of Chen et al., 29.6% of high school students showed the same misconception, but 23.3% of them defined the location of the image behind the mirror and remaining 6.3% defined the location of it on the surface of the mirror. Likewise, 43% of their pre-service science teachers in the study of Blizak et al., showed the same reasoning as in the current study, but they defined the location of image on the surface of the mirror. In the same way, 20% of control group and 22.9% of experimental group students in the study of Aydın (2007) stated that both students see the image along the line of sights.

Bartın Üniversitesi Eğitim Fakültesi Dergisi 4(1), s. 269 – 289, Haziran 2015 BartinUniversityJournal of Faculty of Education 4(1) p. 269 – 289, June 2015
283
The next misconception was M15 which states that according to some of students, the position and size of the image of any object in the mirror depend on the location of the observer. Analysis denoted that 14% of the pre-service teachers hold this misconception. For instance, item-10 presents that a student is looking into the mirror to see the image of pencil placed in front of it as given in Figure 10.
Figure 10: The Related Figure for Item-10
It asks what will happen to the location of the image of pencil, if the student moves a little farther away from the mirror. Close investigation of the selected alternatives denoted that according to 40% of the students, the image moves also away from the mirror at the first-tier. 29% of them selected the supporting figures denoting that the image moved away at the second-tier and 11% of them approved their ideas at the third-tier. Likewise, 37.1% of control and 34.3% of experimental group pre-service science teachers in the study of Aydın (2007) and 34% of high school students in the study of Chen et al. (2002) denoted the same misconception.
The final prevalent misconception was M10. It is related with the formation of pen-umbra and measured by item-6, as given in Figure 6. Analyses denoted that, according to 11% of the students, shadow is black color and light is white color. When they overlap, they mix and form a grey color. Close investigation of the responses indicated that although 62% of the students selected correct alternative (a dark central and lighter shadow regions to either side) at the first-tier, 16% of them explained the phenomena with misconception idea (A dark shadow is formed at the center where no light reach from both sources. At each side a dark shadow formed by one source and a luminousness formed by the other mix to form a bright shadow) at the second-tier. 11% of them approved their ideas at the third-tier. This misconception was reported by Bendall et al. (1993). They interviewed with 20 prospective elementary teachers by constructing the same setup as given in item-6. They reported that two prospective elementary teachers initially predicted the shadow accurately. After they saw the real appearance of screen when both bulbs are open, many of the 12 prospective teachers explained complex shadow in terms of mixing lightness and darkness, or light and shadow.
4. CONCLUSION
This study was conducted to describe pre-service science and computer teachers’ conceptual understanding and their misconceptions about various aspects of light, shadow, and plane mirror images in geometrical optics via the RGOMT before they learn the concept at the university level. Reliability and validity evidences of the revised test were re-established. The findings were reported and compared with those of similar studies.
The results denoted that the RGOMT is a valid and reliable tool for assessing pre-service science and computer teachers’ conceptual understanding and their misconceptions in geometrical optics. The analyses of the data revealed that majority of the pre-service teachers have limited conceptual understanding about light, shadow and plane mirror images before they study the compulsory geometrical optics concepts at the university level and they almost

Assessment of Pre-Service Teachers’ Misconceptions in Geometrical Optics via a Three-Tier Misconception Test Erdal TAŞLIDERE - Ali ERYILMAZ
284
have similar misconceptions as reported by the previous studies (Bendall et al., 1993; Blizak et al., 2009; Chen et al., 2002; Feher & Rice, 1988; Galili & Hazan, 2000; Goldberg & McDermott, 1986; Kaltakci & Eryılmaz, 2010; Kutluay, 2005; Langley et al., 1997). Although the participants studied the concerning concepts in their high schools, they still hold some prevalent misconceptions. This finding supported that misconceptions are really stable cognitive structures (Hammer, 1996) and carried to students’ future academic life (Aydoğan et al., 2003).
Findings of the current study indicated that some of the pre-service teachers had certain misconceptions about the absolute position of the image of an object in the plane mirror, nature of seeing and shadows. First, they mainly considered that the size and position of the image depends on the location of the observer and that of illuminating sources rather than the absolute position of the object. The underlying idea of this conception is that the line of sight affects the observed position and size of the image in the plane mirror. This outcome supported the findings of previous studies (Aydın, 2007; Blizak et al., 2009; Chen et al., 2002; Goldberg & McDermott, 1986; Kaltakci & Eryilmaz, 2010). Second, some of the pre-service teachers were not aware of the nature of seeing. They considered that an object can be seen when the observer directs sight of lines towards it, with light possibly emitted from the eyes. They also believed that in order to see the image of an object clearly in the plane mirror within a dark room, the light should be oriented towards the mirror rather than the object. Similar findings were also reported by Blizak et al. (2009) and Chen et al. (2002). Third, the pre-service teachers had certain misconceptions about the formation of shadow. Some of them believed that shadow is black colour and light is white colour, when they overlap both mix and form grey colour. The students also considered that shadow belongs only to the non-luminous object and always looks like the object. Some of them thought that in the region of geometrical overlap, there would be either lightness or darkness. These students did not consider the shadow as the presence of something. The above misconceptions were reported by Bendall et al. (1993), Feher and Rice (1988). Beside the above, the findings revealed that the pre-service teachers tend to confuse the sharpness of shadow with the size of shadow; they believed that the bigger bulb produces a clearer shadow as in the study of Galili and Hazan (2000). Another point was that the students believed that that the light emanates in only one direction rather than all direction from each source. Most probably, this idea leads students relate the size of shadow to the sharpness of shadow.
This study enabled researchers differentiate pre-service teachers’ lack of knowledge as well as misconceptions in geometrical optics. In the literature, it is emphasized that differentiating any misconception from the lack of knowledge is crucial for effective science instruction (Peşman & Eryılmaz, 2010). Because, remediating any misconception requires different instructional implementations rather than compensating any lack of knowledge (Hasan et al., 1999). The results indicated that the pre-service teachers had significant amount of lack of knowledge as well as misconceptions. Their former physics instructions did not challenge their geometrical optics conceptions. Hence, it is hoped that developing further instructions based on the findings of current study would be effective for pre-service teachers in remediating their misconceptions or compensating their lack of knowledge respectively.
5. IMPLICATIONS
As a valid and reliable test, the RGOMT would be used to diagnose pre-service teachers’ misconceptions about various aspects of light, shadow, and plane mirror images in geometrical optics. It can be used as pre-and-post-test to investigate the effect of any instruction on remedying students’ geometrical optics misconceptions for the further researches. The instructors who are teaching geometrical optics for pre-service science and

Bartın Üniversitesi Eğitim Fakültesi Dergisi 4(1), s. 269 – 289, Haziran 2015 BartinUniversityJournal of Faculty of Education 4(1) p. 269 – 289, June 2015
285
computer teachers can consider the findings of current study while making their teaching plans.
REFERENCES
Arslan, H. O., Cigdemoglu, C. et al. (2012). A three-tier diagnostic test to assess pre-service teachers’ misconceptions about global warming, greenhouse effect, ozone layer depletion, and acid rain. International Journal of Science Education. 34(11), 1667–1686. doi:10.1080/09500693.2012.680618.
Aydın, S. (2007). Eliminating the misconceptions about geometric optics by conceptual change texts. Unpublished dissertation. Atatürk University, Erzurum.
Aydoğan, S., Güneş, B. et al. (2003). Isı ve sıcaklık konusunda kavram yanılgıları. G.Ü. Gazi Eğitim Fakültesi Eğitim Dergisi. 23(2), 111-124.
Bendall, S., Goldberg, F. et al. (1993). Prospective elementary teachers’ prior knowledge about light. Journal of Research in Science Teaching. 30(9), 1169-1187. doi:10.1002/tea.3660300912.
Blizak, D., Chafiqi, F. et al. (2009). Students misconceptions about light in Algeria. Optical Society of America Technical Digest Series.
Blizak, D., Chafiqi, F. et al. (2013). What thinks the university’s students about propagation of light in the vacuum? European Scientific Journal. 9(24), 197-213.
Caleon, I. & Subramaniam, R. (2010a). Development and application of a three-tier diagnostic test to assess secondary students’ understanding of waves. International Journal of Science Education. 32(7), 939-961. doi:10.1080/09500690902890130.
Caleon, I. & Subramaniam, R. (2010b). Do students know what they know and what they don’t know? Using a four-tier diagnostic test to assess the nature of students’ alternative conceptions. Research Science Education. 40, 313-337. doi:10.1007/s11165-009-9122-4.
Cataloglu, E. (2002). Development and validation of an achievement test in introductory quantum mechanics: The Quantum Mechanics Visualization Instrument (QMVI). Unpublished PhD Thesis. The Pennsylvania State University.
Clement, J. (1982). Students’ preconceptions in introductory mechanics. American Journal of Physics. 50(1), 66-71. doi:10.1119/1.12989.
Chen, C.C., Lin, H-S. et al. (2002). Developing a two-tier diagnostic instrument to assess high school students’ understanding-the formation of images by a plane mirror. Proceedings of the National Science Council. 12(3), 106-121.
Cohen, R., Eylon, B. et al. (1983). Potential difference and current in simple electric circuits: A study of students’ concepts. American Journal of Physics. 51(5), 407–412. doi:10.1119/1.13226.
Crocker, L. & Algina, J. (2008). Introduction to classical and modern test theory. Ohio: Cengage Learning.
Engelhardt, P. V. & Beichner, R. J. (2004). Students’ understanding of direct current resistive electrical circuits. American Journal of Physics. 72(1), 98–115. doi:10.1119/1.1614813.
Favale, F. & Bondani, M. (2013). Misconceptions about optics: an effect of misleading explanations? Optics InfoBase Conference Paper. Retrieved from

Assessment of Pre-Service Teachers’ Misconceptions in Geometrical Optics via a Three-Tier Misconception Test Erdal TAŞLIDERE - Ali ERYILMAZ
286
http://spie.org/Documents/ETOP/2013/4_Conceptual%20Understanding%20Assessment/ETOP2013_4-4.pdf.
Feher, E. & Rice, K. (1988). Shadows and anti-images: childrens’ conception of light and vision. II. Science Education. 72(5), 637-649. doi:10.1002/sce.3730720509.
Fetherstonhaugh, T. & Treagust, F. D. (1992). Students’ understanding of light and its properties: teaching to engender conceptual change. Science Education. 76(6), 653-672. doi:10.1002/sce.3730760606.
Galili, I. & Hazan, A. (2000). Learners’ knowledge in optics: interpretation, structure and analysis. International Journal of Science Education. 22(1), 57-88. doi:10.1080/095006900290000.
Galili, I., Bendall, S. & Goldberg, F. (1993). The effects of prior knowledge and interaction on understanding image formation. Journal of Research in Science Teaching. 30(3), 271-301. doi:10.1002/tea.3660300305.
Goldberg, F. M. & McDermott, L. (1986). Student difficulties in understanding image formation by a plane mirror. Physics Teacher. 24(8), 472-480.doi:10.1119/1.2342096.
Halloun, I. A. & Hestenes, D. (1985). The initial knowledge state of college physics students. American Journal of Physics. 53(11), 1043-1055. doi:10.1119/1.14030.
Hammer, D. (1996). More than misconceptions: Multiple perspectives on student knowledge and reasoning, and an appropriate role for education research. American Journal of Physics. 64(10), 1316-1325. doi:10.1119/1.18376.
Hasan, S., Bagayoko, D. et al. (1999). Misconceptions and the certainty of response index (CRI). Physics Education. 34, 294-299.
Hestenes, D. & Halloun, I. (1995). Interpreting the force concept inventory. Physics Teacher. 33, 502–506.
Kaltakci, D. & Eryilmaz, A. (2010). Identifying Pre-service Physics Teachers’ Misconceptions with Three-tier Tests. GIREP-ICPE-MPTL Conference: Teaching and Learning Physics today: Challenges? Benefits? August 22-27, Reims, France, p.140.
Kutluay, Y. (2005). Diagnosis of Eleventh Grade Students’ Misconceptions About Geometric Optics By a Three-Tier Test. Unpublished Master Thesis. Middle East Technical University, Ankara.
Langley, D., Ronen, M. et al.(1997). Light propagation and visual patterns: preinstruction learners’ conceptions. Journal of Research in Science Teaching. 34(4), 399-424.
Linn, R. L. & Gronlund, N. E. (1995). Measurement and assessment in teaching (7th edition). Ohio: Prentice Hall.
Odom, A. L. & Barrow, L. H. (1995). Development and application of a two-tier diagnostic test measuring college biology students’ understanding of diffusion and osmosis after a course of instruction. Journal of Research in Science Teaching. 32(1), 45–61. doi:10.1002/tea.3660320106.
Odom, A. L. & Barrow, L. H. (2007).High school biology students’knowledge and certainty about diffusion and osmosis concepts. School Science Mathematics. 107, 94-101.

Bartın Üniversitesi Eğitim Fakültesi Dergisi 4(1), s. 269 – 289, Haziran 2015 BartinUniversityJournal of Faculty of Education 4(1) p. 269 – 289, June 2015
287
Peşman, H. & Eryılmaz, A. (2010). Development of a three-tier test to assess misconceptions about simple electric circuits. The journal of Educational Research. 103(3), 208-222. doi:10.1080/00220670903383002.
Treagust, D. F. (1988). Development and use of diagnostic tests to evaluate students’ misconceptions in science. International Journal of Science Education. 10(2), 159–169. doi:10.1080/0950069880100204.
Wuttiprom, S., Sharma, M. D. et al. (2009). Development and use of a conceptual survey in introductory quantum physics, International Journal of Science Education. 31(5), 631-654. doi:10.1080/09500690701747226.
Assessment of Pre-Service Teachers’ Misconceptions in Geometrical Optics via a Three-Tier Misconception Test Erdal TAŞLIDERE - Ali ERYILMAZ
288
GENİŞ ÖZET
Geometrik optik ışığın madde ve ortam ile etkileşimini, çeşitli optik sistemlerden geçişini ve görüntü oluşumunu inceleyen fiziğin bir alt alanıdır. Fen, teknoloji ve diğer bilim alanlarına önemli katkılar sunmaktadır. Dolayısıyla ülkelerin ulusal eğitim programlarında öğretilmesi gereken önemli konular arasında yer almaktadır. Ancak ilköğretimden yükseköğretime kadar optik ile ilgili yürütülen çalışmalar öğrencilerin geometrik optik konularını yeterince özümseyemediklerini, kavramsal anlama seviyelerinin oldukça düşük ve çok çeşitli kavram yanılgılarına sahip olduklarını göstermiştir.
Kavram Yanılgısı herhangi bir kavramın bilimsel tanımından farklı bir anlam yüklenerek zihinlere yerleşmesi olarak tanımlanmaktadır. Bugüne kadar gerek diğer alanlarda gerekse geometrik optik alanında kavram yanılgılarını tespit etmeye yönelik bir takım çalışmalar gerçekleştirilmiştir. Son zamanlarda uygulama kolaylığı, sonuçların daha geniş kitlelere genellenilebilmesi, ekonomiklik, sonuçların sağlıklı analiz edilebilmesi gibi nedenlerden dolayı üç aşamalı kavram yanılgısı testleri daha çok tercih edilmeye başlanmıştır. Söz konusu testler öğrencilerin gerçek anlamda kavramsal anlama düzeylerinin ve kavram yanılgılarının tespit edilmesine ve söz konusu yanılgıların bilgi eksikliği ve güven eksikliği gibi diğer kavramlardan ayırt edilebilmesine imkan vermektedir.
Alan yazında geometrik optik konusu ile ilgili kavram yanılgılarını tespit etmeye yönelik çeşitli çalışmaların bulunduğu görülmektedir. Ancak bu çalışmalar genellikle öğretimler sonrasında veya öğretimler öncesinden sonrasına yanılgılarda ve kavramsal anlama düzeylerindeki değişimleri tespit etmeye yönelik gerçekleştirilmiştir. Öğretmen adaylarının liseden yüksek öğretime hangi yanılgılar ile geldikleri, özellikle üniversitede geometrik optik dersleri öncesinde hangi yaygın kavram yanılgılarına sahip olduklarını tespit etmeye yönelik yeterince çalışmaya rastlanılamamıştır. Dolayısıyla bu çalışmanın amacı bir üniversitenin eğitim fakültesinde öğrenim görmekte olan öğretmen adaylarının geometrik optik dersleri öncesinde ışık, gölge ve düzlem aynalarda görüntü oluşumu konularında sahip oldukları kavram yanılgılarını tespit etmektir.
Araştırmada kesitsel tarama modeli kullanılmıştır. Bir devlet üniversitesinin eğitim fakültesi Fen Bilgisi Öğretmenliği ve Bilgisayar ve Öğretim Teknolojileri Eğitimi programlarında öğrenim görmekte olan 317 (Kız=200, Erkek=117) birinci ve ikinci sınıf öğretmen adayları çalışmanın katılımcılarını oluşturmaktadır. Bu öğrenciler geometrik optik konularını lise eğitimleri esnasında almış olup, çalışmanın gerçekleştirildiği dönemde henüz ilgili konuları görmemişlerdir.
Araştırmada öğretmen adaylarının ışık, gölge ve düzlem ayna görüntüleri ile ilgili kavram yanılgılarını tespit etmek için başka bir çalışma kapsamında geliştirilmiş Üç-Aşamalı Geometrik Optik Kavram Yanılgısı testi yeniden revize edilerek kullanılmıştır. Orijinal teste üç soru daha eklenmiş ve yeni testin geçerlilik ve güvenilirlik analizleri tekrar yapılmıştır. Analiz sonuçları revize edilen testin öğretmen adaylarının ışık, gölge ve düzlem ayna görüntüleri ile ilgili konulardaki kavramsal anlama ve kavram yanılgılarını ölçmek için geçerli ve güvenilir bir ölçek olduğunu göstermiştir. Testin iç güvenilirlik katsayısı olan Croanbach alfa değeri 0,65 olarak bulunmuştur. Soruların her üç aşaması dikkate alınarak elde edilen puanlar üzerinden önce betimsel istatistik analizi yapılmış, daha sonrada soruların ilk, ilk iki ve üç aşaması dikkate alınarak öğrencilerin ortalama kavramsal anlama düzeyleri ile kavram yanılgılarına düşme yüzdelikleri tespit edilmiştir. Ayrıca öğrencilerdeki bilgi eksikliği ve güven eksikliğine sahip olma düzeyleri tespit edilmiştir.
Betimsel istatistik sonuçları, soruların üç aşaması dikkate alındığında testin başarı ortalamasının 19 puan üzerinden 2,24 olduğunu ortaya çıkarmıştır. Ayrıca testteki soruların ilk, ilk iki ve her üç aşamasına göre doğru cevaba sahip öğrenci yüzdelikleri incelendiğinde, ilk aşamaya göre ortalama doğru cevap verme oranının %44, ilk iki aşamaya göre %20 ve her üç aşamaya göre ise % 13 olduğu görülmüştür. Bu sonuç testteki aşama sayısı arttıkça doğru cevaba sahip ortalama öğrenci yüzdeliklerinin azaldığını göstermektedir. Öğrencilerdeki ortalama bilgi eksikliği %36 ve güven eksikliği ise %6 olarak bulunmuştur. Bilgi eksiklik yüzdeliğinin doğru cevaba sahip öğrenci yüzdeliğinden yüksek olması, öğretmen adaylarının lise öğrenimlerinde ışık, gölge ve düzlem ayna görüntüleri konularını kavramsal olarak yeterince özümseyemediklerini göstermektedir. Ayrıca testteki aşamalar bazında ortalama kavram yanılgılarına sahip olma oranlarına bakıldığında, bu oranların ilk aşamaya göre %45, ilk iki aşama göre %20 ve tüm aşamalara göre %12 olduğu bulunmuştur. Sonuçlar, sorulardaki aşama sayısı arttıkça

Bartın Üniversitesi Eğitim Fakültesi Dergisi 4(1), s. 269 – 289, Haziran 2015 BartinUniversityJournal of Faculty of Education 4(1) p. 269 – 289, June 2015
289
ortalama kavram yanılgısına düşme oranlarının azaldığını göstermektedir. Bu durum ise alan yazında belirtildiği gibi, gerçek anlamda kavram yanılgısına düşen öğrenci yüzdeliklerinin elde edilmesinde her üç aşamanın de göz önünde bulundurulmasının gerekliliğini bir kez daha ortaya çıkarmıştır. Alan yazında %10 ve üzerindeki öğrencilerde tespit edilen kavram yanılgılarının yaygın ve ciddiye alınması gerektiği vurgulanmaktadır. Bu çalışma kapsamında da aynı kritik değer dikkate alındığında, öğretmen adaylarının 12 kavram yanılgısına sahip oldukları görülmüştür.
Bu araştırmanın sonuçları, üniversitede geometrik optik konularını henüz işlememiş Fen Bilgisi ve Bilgisayar ve Öğretim Teknolojileri öğretmen adaylarının ışık, gölge ve düzlem ayna görüntüleri konularındaki kavramsal anlama düzeylerinin oldukça düşük ve bazı yaygın kavram yanılgılarına sahip olduklarını göstermiştir. Adayların, cisimlerin ayna arkasındaki görüntü yerleri, ışığın görme olayındaki rolü ve gölge oluşumu gibi önemli konularda farklı bilimsel olmayan fikirlere sahip oldukları tespit edilmiştir. Söyle ki; adaylar cisimlerin düzlem aynadaki görüntü boyutlarının ve konumlarının cismin konumundan ziyade gözlemcinin ve ışık kaynağının konumuna bağlı olduğunu düşünmektedirler. Bazılarına göre görme olayının gerçekleşmesi için nesnelerin gözlemcinin bakış doğrultusunda olması ve ışık ışınlarının gözlemcinin gözünden nesnelere doğru gitmesi gerekmektedir. Öğrencilerin bir kısmı tamamen karanlık bir ortamdaki bir noktayı ya da nesneyi net görebilmek için, ışık kaynağının nesneden ziyade göze gelecek şekilde tutulması gerektiğine inanmaktadırlar. Bazı adaylar ise gölgenin siyah, ışığın ise beyaz renk olduğunu ve her ikisinin karışımı ile gri rengi oluşturduklarına inanmaktadırlar. Öğrenciler aynı zamanda sadece kendi ışığını kendisi üretmeyen cisimlerin gölgelerinin oluşacağına ve daima bu cisimlerin gölgelerinin de kendilerine benzeyeceğine inanmaktadırlar. Ayrıca adaylar yarı gölgenin oluşumunu tam açıklayamamakla birlikte, gölgenin netliği ile gölgenin büyüklüğü kavramlarını birbirlerine karıştırmaktadırlar. Diğer bir nokta ise adaylar ampul yüzeyindeki her bir noktadan yalnızca bir ışık ışınının yarıçap doğrultusunda dağıldığını düşünmekteler. Halbuki yüzeydeki bir noktadan her yöne doğru dağılan bir sürü ışık ışını bulunmaktadır. Muhtemelen öğrencilerdeki gölgenin netliği ile büyüklüğünü karıştırmalarına neden olan düşünceninde bu yanılgı olduğu tahmin edilmektedir.
Bu araştırma sonuçlarının alan yazına Türkiye de bir devlet üniversitesindeki Fen Bilgisi ve Bilgisayar ve Öğretim Teknolojileri Öğretmen adaylarının geometrik optik dersleri öncesinde ışık, gölge ve düzlem ayna görüntüleri konularında hangi yaygın kavram yanılgılarına sahip oldukları konusunda katkılar sağladığı düşünülmektedir. Fen bilgisi ve bilgisayar öğretmenliği lisans programlarında geometrik optik konularını anlatan öğreticiler söz konusu çalışmanın sonuçlarını dikkate alarak öğretim planlarını zenginleştirebilirler. Diğer araştırmacılar farklı gruplar ile geçerli ve güvenilir olan aynı ölçüm aracını kullanarak benzer araştırma yapabilir ve elde ettikleri sonuçları bu çalışma sonuçları ile karşılaştırabilirler.