Embed Size (px)
Citation preview

OECD DEVELOPMENT CENTRE
FISCAL POLICY IN LATIN AMERICA: COUNTERCYCLICAL
AND SUSTAINABLE AT LAST?by
Christian Daude, Ángel Melguizo and Alejandro Neut
Research area:Latin American Economic Outlook
July 2010
CENTRE DEDÉVELOPPEMENT CENTRE
DEVELOPMENT
Working Paper No. 291

Fiscal Policy in Latin America: Countercyclical and Sustainable at Last?
DEV/DOC(2010)8
2 © OECD 2010
DEVELOPMENT CENTRE
WORKING PAPERS
This series of working papers is intended to disseminate the Development Centre’s
research findings rapidly among specialists in the field concerned. These papers are generally
available in the original English or French, with a summary in the other language.
Comments on this paper would be welcome and should be sent to the OECD
Development Centre, 2 rue André Pascal, 75775 PARIS CEDEX 16, France; or to
[email protected]. Documents may be downloaded from: http://www.oecd.org/dev/wp or
obtained via e-mail ([email protected]).
THE OPINIONS EXPRESSED AND ARGUMENTS EMPLOYED IN THIS DOCUMENT ARE THE SOLE RESPONSIBILITY OF THE AUTHORS
AND DO NOT NECESSARILY REFLECT THOSE OF THE OECD OR OF THE GOVERNMENTS OF ITS MEMBER COUNTRIES
©OECD (2010)
Applications for permission to reproduce or translate all or part of this document should be sent to
CENTRE DE DÉVELOPPEMENT
DOCUMENTS DE TRAVAIL
Cette série de documents de travail a pour but de diffuser rapidement auprès des
spécialistes dans les domaines concernés les résultats des travaux de recherche du Centre de
développement. Ces documents ne sont disponibles que dans leur langue originale, anglais ou
français ; un résumé du document est rédigé dans l’autre langue.
Tout commentaire relatif à ce document peut être adressé au Centre de développement
de l’OCDE, 2 rue André Pascal, 75775 PARIS CEDEX 16, France; ou à [email protected]. Les
documents peuvent être téléchargés à partir de: http://www.oecd.org/dev/wp ou obtenus via le
mél ([email protected]).
LES IDÉES EXPRIMÉES ET LES ARGUMENTS AVANCÉS DANS CE DOCUMENT SONT CEUX DES AUTEURS ET NE REFLÈTENT PAS
NÉCESSAIREMENT CEUX DE L’OCDE OU DES GOUVERNEMENTS DE SES PAYS MEMBRES
©OCDE (2010)
Les demandes d'autorisation de reproduction ou de traduction de tout ou partie de ce document devront
être envoyées à [email protected]

OECD Development Centre Working Paper No. 291
DEV/DOC(2010)8
© OECD 2010 3
TABLE OF CONTENTS
ACKNOWLEDGEMENTS .......................................................................................................................... 4
PREFACE ....................................................................................................................................................... 5
RÉSUMÉ ........................................................................................................................................................ 6
ABSTRACT .................................................................................................................................................... 7
I. INTRODUCTION ..................................................................................................................................... 8
II. CYCLICALLY ADJUSTED BUDGET BALANCES IN LATIN AMERICA ................................... 10
III. ESTIMATION OF OUTPUT GAP ...................................................................................................... 31
IV. CONCLUSIONS AND POLICY IMPLICATIONS .......................................................................... 36
APPENDIX .................................................................................................................................................. 37
REFERENCES ............................................................................................................................................. 45
OTHER TITLES IN THE SERIES/ AUTRES TITRES DANS LA SÉRIE .............................................. 47
Fiscal Policy in Latin America: Countercyclical and Sustainable at Last?
DEV/DOC(2010)8
4 © OECD 2010
ACKNOWLEDGEMENTS
This paper was prepared for the 12th Banca d’Italia Workshop on Fiscal Policy: Lessons from
the Crisis, Perugia 25-27 March 2010. We would like to thank the comments by participants, as
well as participants at the ECLAC XXII Seminario regional de política fiscal, Santiago de Chile 26-29
January 2010, the IDB Meeting of Budget Officials in Lima, 5-7 May 2010, and the IDB’s seminar
on Preconditions for Establishing Fiscal Rules Based on Structural Balances in Washington DC, 28-29
June 2010.
Comments and discussion by Eduardo Fernández-Arias, Davide Furceri, Gustavo García,
Martin Larch, Mario Marcel, Ricardo Martner, Teresa Ter-Minassian, and Helmut Reisen were
particularly helpful. We would like to thank Christophe André, Alberto Barreix, Bert Brys,
Barbara Castelletti, Hamlet Gutierrez and Ricardo Martner, as well as officials from the
Ministries of Finance of Chile and Uruguay for providing some of the data. Gwenn Parent
provided excellent research assistance.
Financial support from the Fundación Internacional y para Iberoamérica de
Administración y Políticas Públicas (FIIAPP) and the Spanish Agency for International
Development Cooperation (AECID) are gratefully acknowledged. The views expressed herein
are the sole responsibility of the authors and do not necessarily reflect the opinions of their
institution.

OECD Development Centre Working Paper No. 291
DEV/DOC(2010)8
© OECD 2010 5
PREFACE
Many indicators suggested that Latin America has faced the crisis in a much better
macroeconomic position that in the past. Budgets balances were positive, debt-to-GDP ratios
were low, and monetary policy was more credible thanks to low inflation and well-anchored
expectations. Moreover, in contrast with the past, some of the countries in the region were able to
enact fiscal stimulus packages comparable to those of OECD countries. Is Latin America’s new
resilience a permanent change? Some questions may require time to be responded, such as the
effectiveness of counter-cyclical fiscal impulses. But some may be responded right now. In
particular, the cyclical or structural nature of recent fiscal improvements.
This paper by Christian Daude, Ángel Melguizo and Alejandro Neut, economists of the
OECD Development Centre, contributes to this relevant debate. The paper analyses fiscal policy
in the main economies in Latin America during the last two decades. It uses the OECD
methodology to measure structural balances, but it also takes into account the central role that
commodities play in several countries in the region. All in all, underneath the observed positive
indicators, the analysis of cyclically-adjusted balances and debt sustainability confirms that most
countries were in better position before the crisis. This is a remarkable point and recognizes
efforts of the past years, but much remains to be done. Tax automatic stabilisers in Latin America
are still small, around half the OECD average. Discretionary fiscal impulses continue to be
broadly pro-cyclical. There is a great degree of uncertainty concerning output gap estimates in
Latin America which – combined with wide commodity cycles – add an extra layer of complexity
for policy makers in the region.
This paper is elaborated within the Fiscal pillar of the LAC-OECD Initiative ‚Fiscal
Policy: Improving Taxation and Public Expenditure‛, a joint project of the Centre for Tax Policy
and Administration and the Development Centre, supported by Spain, Chile and Mexico. We
hope that this working paper will contribute to a better informed debate on fiscal policy, helping
ultimately to improve the wellbeing of the people in Latin America.
Mario Pezzini
Director
OECD Development Centre
July 2010

Fiscal Policy in Latin America: Countercyclical and Sustainable at Last?
DEV/DOC(2010)8
6 © OECD 2010
RÉSUMÉ
Cette étude analyse la politique budgétaire dans huit économies d’Amérique
Latine, à partir du début des années 1990 et jusqu’à 2009. Nous étudions les estimations
des composantes structurelles et cyclique des recettes publiques en l’Argentine, le Brésil,
le Chili, la Colombie, le Costa Rica, le Méxique, le Pérou et l’Uruguay, en utilisant la
méthodologie de l’OCDE, et en ajoutant l’effet des prix des matières premières, qui ont
un impact significatif sur le solde budgétaire en Amérique Latine. A partir de ces
résultats, l’étude évalue l'ampleur des stabilisateurs automatiques, et l’stabilisation de la
politique budgétaire discrétionnaire. Finalement, nous soulignons l’incertitude de
l’estimation de l’écart de production en raison des larges chocs cycliques, temporaires et
permanents dans plusieurs économies d’Amérique Latine.
Classification JEL: E62; H30; H60
Mots clé: Politique budgétaire, cycle économique, finances publiques

OECD Development Centre Working Paper No. 291
DEV/DOC(2010)8
© OECD 2010 7
ABSTRACT
This paper analyses fiscal policy for several economies in Latin America, from the
early nineties to the 2009 crisis. We present original estimates of cyclically-adjusted
public revenues for Argentina, Brazil, Chile, Colombia, Costa Rica, Mexico, Peru and
Uruguay implementing the standardised OECD methodology and extending it to
include commodity cycles, which have a direct and significant effect on the fiscal balance
of several Latin American countries. Based on these estimates, we evaluate the size of
automatic tax stabilisers and the cyclicality of discretionary fiscal policy. Additionally,
we highlight the uncertainty stemming from the estimation of the output gap, due to
large and simultaneous cyclical, temporary and permanent shocks in several Latin
American economies.
JEL Classification: E62; H30; H60
Keywords: fiscal policy, business cycle, public finances

Fiscal Policy in Latin America: Countercyclical and Sustainable at Last?
DEV/DOC(2010)8
8 © OECD 2010
I. INTRODUCTION
In reaction to the 2009 global financial crisis, most industrialised and several emerging
economies enacted Keynesian-type fiscal packages (from personal income tax cuts and indirect
taxes reductions, to higher infrastructure spending and transfers to local governments, families,
and firms) to mitigate the collapse of domestic demand.
Several Latin American economies faced the international crisis on relatively solid
domestic macroeconomic grounds, both monetary and fiscal. On the fiscal front, most countries
in the region displayed higher budget surpluses and lower debt-to-GDP levels, giving them
apparently unprecedented fiscal margins to pursue sustainable counter-cyclical fiscal policies, of
a similar size of those in OECD countries (see OECD, 2009b)1.
But, is Latin America’s resilience in 2009 a permanent change in paradigm? The success of
these counter-cyclical fiscal policy responses in Latin American economies is still unclear, and
will largely depend on both the size of the programmes actually implemented (generally smaller
and with greater lags than announced) and their effective impact (opening, once again, the
debate on multipliers). Besides, at the wake of the international financial crisis there was no
consensus on the cyclical or structural nature of still recent fiscal improvements2.
Our paper joins the latter debate. In section two we present updated original estimates of
cyclically-adjusted fiscal balances for a number of Latin American countries: Argentina, Brazil,
Chile, Colombia, Costa Rica, Mexico, Peru and Uruguay. We track these balances since the early
nineties to 2009, implementing the standardised OECD methodology (Girouard and André, 2005,
and Van den Noord, 2000), but adding the fiscal impact of commodity prices (following basically
the IMF approach in Vladkova and Zettelmeyer, 2008). With these estimates, we can then
measure the size of automatic stabilisation tax policies and the size and cyclicality of discretional
fiscal policy. These measures are compared with those in OECD countries and used to discuss
1 This strength was in stark contrast with previous episodes. See Gavin and Perotti (1997) and Gavin and
Hausmann (1008) for Latin America, and Talvi and Vegh (2005), Kaminsky et al. (2006), and Ilzetzki
and Vegh (2008) for emerging markets in general. 2 Izquierdo and Talvi (2008), from the Inter-American Development Bank, argued that if revenues from the
seven largest economies in Latin America countries were adjusted using the implicit Hodrick-Prescott
filter parameter for Chile (i.e. the smoothing coefficient on revenues that would render a structural
surplus of one per cent of GDP since 2001), structural fiscal balances in the region, with the exception of
Chile, did not differ significantly from their situation at the onset of the 1998 Russian crisis. Using a
different methodological approach, Vladkova-Hollar and Zettelmeyer (2008), from the International
Monetary Fund, observed an improvement in structural balances in most countries, although they
point out that commodity prices added a significant layer of uncertainty.

OECD Development Centre Working Paper No. 291
DEV/DOC(2010)8
© OECD 2010 9
the cyclicality of discretionary fiscal policy in the region, differentiating countries and periods.
Additionally, based on these numbers we perform standard debt sustainability exercises. The
third section explains the methodology used to estimate the output gap. We opt for an
unobserved components model to decompose shocks into permanent, cyclical and transitory.
Section four concludes, underlining the importance of output gap estimates, the inclusion of
commodity prices and the consideration of automatic fiscal responses in the design of
sustainable fiscal policies over the business cycle in the region.
Fiscal Policy in Latin America: Countercyclical and Sustainable at Last?
DEV/DOC(2010)8
10 © OECD 2010
II. CYCLICALLY ADJUSTED BUDGET BALANCES IN LATIN AMERICA
II.1. OECD approach to estimation of cyclically-adjusted fiscal revenues
As a starting point, we apply the OECD approach to account for the automatic impact of
the business cycle on public accounts, as presented in detail by Girouard and Andre (2005) for
OECD countries, and De Mello and Moccero (2006) for Brazil. This method computes separately
the cyclical component of unemployment-related transfers and of public receipts from four types
of taxes: personal income tax (PIT), social security contributions (SSC), and corporate income tax
(CIT), and indirect taxes (IT), and of unemployment-related transfers.
Focusing on public revenues, the cyclical response of tax i to the business cycle (labelled
ti,,y) is calculated as the product of two elasticities: the elasticity of tax receipts to the tax base
(labelled ti,,tbi) and the elasticity of the tax base to the economic cycle (labelled tbi,,y):
ti,,y = ti,,tbi × tbi,,y (1)
where i covers the four taxes mentioned above (PIT, SSC, CIT or IT) or their respective tax bases
(wage bill for the first two, corporate profits and consumption).
On the expenditure side, the adjustment is usually made at the level of total primary
spending as time-series data on unemployment-related expenditure are not available across
countries. Girouard and Andre (2005) use several OECD instruments, publications and
databases, especially the Annual National Accounts, the Economic Outlook database, national Labour
Force Surveys, the Taxing Wages model, and Revenue Statistics. Next, we describe the methodology
more in depth while explaining the approach we follow for Latin American economies.
Personal income tax and social security contributions
To calculate the elasticity of income tax and social security contributions with respect
to the tax base, the marginal and the average tax rates of a representative household are
calculated for several points in the earnings distribution: from 0.5 to 3.0 times the average
production worker in each OECD country. A representative household is defined as a full-time,
two-earner married couple with two children, with the secondary earner receiving 50 per cent of
the wage of the principal earner. Effective tax rates are computed using the OECD Taxing Wages
simulator, while the distribution of tax payers across income levels in each country are based on
labour market statistics (based on median, first and ninth deciles incomes taken from Labour

OECD Development Centre Working Paper No. 291
DEV/DOC(2010)8
© OECD 2010 11
Force Surveys). The overall elasticities of both PIT and SSC with respect to the tax base ( ti,,tbi) are
calculated as the weighted ratios of marginal and average tax rates:
n
i
ii
n
i
iiitbt AVMAi
11
(2)
where γi is the share of earners i in the income distribution, MAi is the marginal income tax rate
or social security contribution rate at earning level i, and AVi stands for the corresponding
average rate.
Due to the lack of comparable databases and instruments, this procedure poses
significant challenges when applying them to Latin America. We proxy the distribution of
potential tax payers using the latest available National Household Surveys3 in Argentina
(referred to 2006), Brazil (2006)4, Chile (2006), Colombia (2008), Costa Rica (2006), Mexico (2006),
Peru (2006), and Uruguay (2005). In particular, we calculate the ‘adjusted first earner income’
distribution taking into account household composition (if two earners exist, the first earner is
assigned two thirds of household income while second earner is assigned the rest). We restrict
our analysis to labour income (dependent and self-employed workers)5, and limit the sample to
households with at least some labour income6. Given the high levels of informality and income
inequality in the region, we analyze an extended income interval, covering from 0.05 times
average income (i.e. almost from the first peso/sol/real of labour income) to more than six times
average income.
Figure 1 represents the average adjusted income level and those corresponding to the first
and ninth deciles, corrected by purchasing power parities. Average annual labour income level
ranges from 7.700 $ PPP in Peru, to nearly 14.600 $ PPP in Chile. Workers in the ninth decile earn
more than twice the average in all countries, while low earners vary significantly (in Peru, those
3 Encuesta Permanente de Hogares in Argentina, Pesquisa Nacional por Amostra de Domicilios in Brazil, Encuesta de
Caracterización Socioeconómica Nacional in Chile, Gran Encuesta Integrada de Hogares in Colombia, Encuesta
de Hogares y Propósitos Múltiples in Costa Rica, Encuesta Nacional de Ocupación y Empleo in Mexico,
Encuesta Nacional de Hogares in Peru and Encuesta Continua de Hogares in Uruguay. We are aware of the
potential limitations from using survey data, in contrast to administrative records, but, on the other
hand, household surveys are more generally available. As a future extension of this research, we will
test the robustness of the results using alternative income distribution sources.
4 Brazil is included to establish a link between previous OECD research and our regional analysis. In the
following sections we will report analysis based on elasticities calculated by De Mello and Moccero
(2006). 5
As already established in the OECD method, this does not represent a significant bias for Latin America,
since capital income is usually not taxed by the personal income tax. 6 According to our calculations based on the National Household Surveys, between 8 and 26 per cent of
households in the selected Latin American countries do report no labour income (26.1 in Argentina,
15.6 in Brazil, 11.4 in Chile, 11.5 in Colombia, 15.0 in Costa Rica, 7.7 in Mexico, 9.2 in Peru, and 22.0 in
Uruguay).

Fiscal Policy in Latin America: Countercyclical and Sustainable at Last?
DEV/DOC(2010)8
12 © OECD 2010
in the first decile earn 20 times less than the average income, while only five times less in Costa
Rica).
Focusing on the distribution of labour income earners, the analysis shows a high
concentration of workers below the average labour income: between 60 and 70 per cent of labour
income earners earn less than the national average (Figure 2). The Peruvian income distribution
represents an outlier, given the concentration of income earners at lower levels. This fact has a
very significant impact on the number of effective tax payers and fiscal revenues.
Figure 1. Adjusted first earner annual labour income
(PPP dollars)
0.0
3,000.0
6,000.0
9,000.0
12,000.0
15,000.0
18,000.0
21,000.0
24,000.0
27,000.0
30,000.0
ARG 2006 BRA 2006 CHL 2006 COL 2008 CRI 2006 MEX 2006 PER 2006 URU 2005
Decile 1 Average Decile 9
Source: Authors’ calculations based on National Household Surveys
Figure 2. Labour income distribution in Latin American countries
(Percentage)
0.00
1.00
2.00
3.00
4.00
5.00
6.00
7.00
8.00
9.00
0.05 0.55 1.05 1.55 2.05 2.55 3.05 3.55 4.05 4.55 5.05 5.55 Over 6
ARG BRA CHL COL CRI MEX PER URU
Note: Percentage of people by household labour income level. 1 represents the national average
Source: Authors’ calculations based on National Household Surveys

OECD Development Centre Working Paper No. 291
DEV/DOC(2010)8
© OECD 2010 13
These national labour income distributions provide the weighs (i) to compute the overall
average and marginal personal income and social security tax rates. We calculate the effective tax
burden for representative households, assuming they only differ in their income level (from 0.05
to more than 6 times the national average)7. Chilean and Uruguayan figures were provided by
the respective Ministries of Finance, while Mexican rates were calculating using the OECD
Taxing Wages simulator. For other countries, we calculated the fiscal figures based on the
legislation in place during the corresponding fiscal year.
Calculations are referred to 2006, because several of the household surveys available are
from that year, and as it corresponds to a relatively neutral year in cyclical terms (in the case of
Colombia, we deflated the data referred to 2008 with the national CPI). The only exception is
Uruguay, in which we updated survey figures with observed CPI up to 2009 to incorporate the
new personal income tax established in 2008. In those cases where fiscal legislation allows
individual and household declaration, we chose the one more beneficial to tax payers, including
allowances for both espouse and children, if existing8. Figures 3 and 4 show the effective
marginal and average personal income tax rates by income levels.
Figure 3. Marginal personal income tax by income levels
(Percentage)
0.00
5.00
10.00
15.00
20.00
25.00
30.00
35.00
40.00
45.00
0.1 0.6 1.1 1.6 2.1 2.6 3.1 3.6 4.1 4.6 5.1 5.6
ARG CHL COL CRI MEX PER URU
Note: Marginal tax rate by household labour income level. 1 represents the national average
Source: Authors’ calculations based on OECD Taxing Wages (Mexico), Ministries of Finance (Chile and
Uruguay) and own elaboration (Argentina, Colombia, Costa Rica and Peru)
7 To be precise, we liquidate these two taxes for 121 levels of income (so i =1<121). We grouped all
households that earn more than six times the national average (this last bracket earns between eight
times the average in Uruguay, to 11 times in Chile). 8 Tax declarations are at the individual level in Chile, Colombia, Peru and Uruguay, and by households in
Argentina, Costa Rica and Mexico. Argentina and Mexico figures incorporate spouse and children
allowances. Brazilian figures, taken from De Mello and Moccero (2006), are on an individual basis.
Therefore, we fix both income distribution and tax legislation, as stated in the OECD methodology. As a
future extension, we plan to test the effects on tax elasticities of changes in the tax code, and of
variations of income distribution.

Fiscal Policy in Latin America: Countercyclical and Sustainable at Last?
DEV/DOC(2010)8
14 © OECD 2010
As shown in Figure 4, the personal income tax in all these Latin American countries is
formally progressive, since average tax rates increase with income levels. Second, with the
exception of Mexico (due to the interaction of exempted income, individual declarations and tax
credits), labour income earners are net payers of the PIT starting at levels ranging from the
average income in Chile to three times the average income in Colombia. Together with
informality, these high levels imply that only a small share of households with labour income is a
net PIT payer.
Figure 4. Average personal income tax by income levels
(Percentage)
0.00
5.00
10.00
15.00
20.00
25.00
30.00
0.1 0.6 1.1 1.6 2.1 2.6 3.1 3.6 4.1 4.6 5.1 5.6
ARG CHL COL CRI MEX PER URU
Note: Average tax rate by household labour income level. 1 represents the national average
Source: Authors’ calculations based on OECD Taxing Wages (Mexico), Ministries of Finance (Chile and
Uruguay) and own elaboration (Argentina, Colombia, Costa Rica and Peru)
By contrast, as shown in Figure 5, social security contributions tend to be flat taxes, or
even slightly regressive given the existence of minimum contributions in Mexico. Chile and
Mexico are the only two countries with a fully privatized pension system, where social
contributions mainly finance health benefits9.
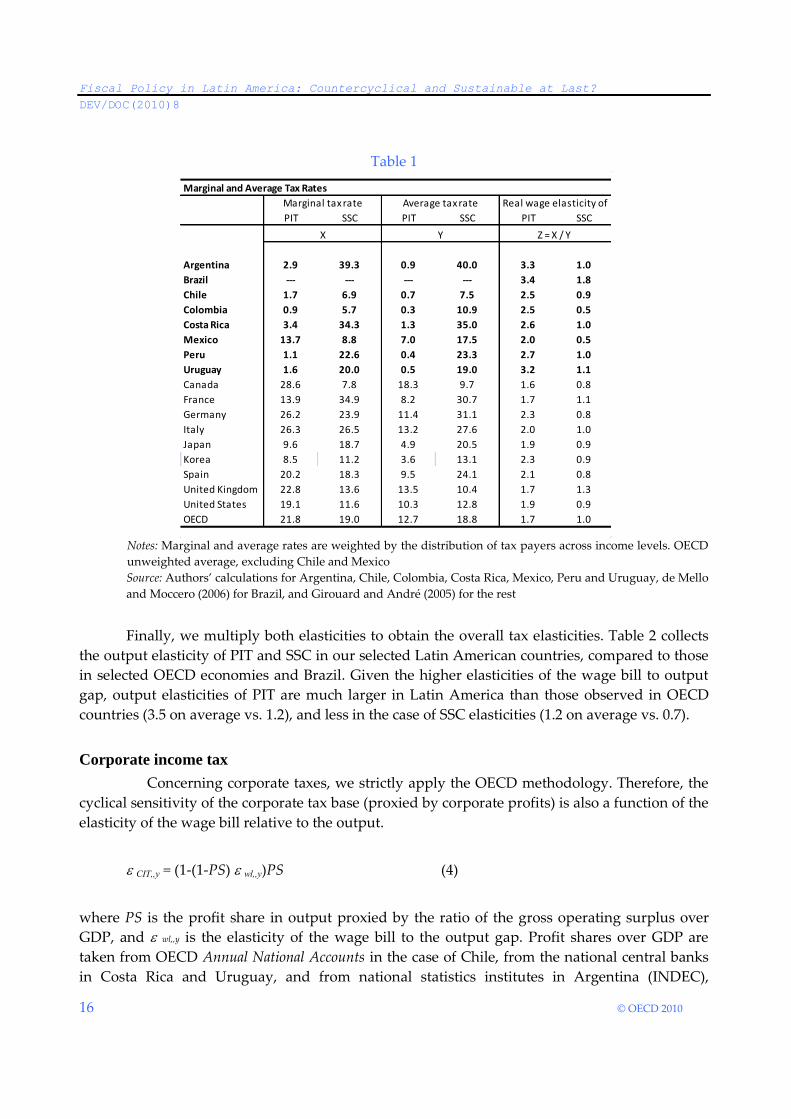
As defined in equation (2), the wage elasticity of PIT and SSC is calculated as the ratio
between the weighted marginal tax rate, and the weighted average tax rate (included in fifth and
sixth columns in Table 1). With the exception of Mexico, PIT elasticities are between 2.5 and 3.3.
These levels are higher than those observed in OECD countries, and slightly lower than the 3.4
found for Brazil in De Mello and Moccero (2006). In other words, formal progressivity of the PIT
9 Mexican contributions cover sickness, disability and nursery, while Chilean rates cover health and
unemployment. In the other cases contributions finance both health and pensions. In the case of parallel
public-private compulsory pension systems (Argentina, Colombia, Peru and Uruguay), we assumed
that the worker is affiliated to the public scheme.

OECD Development Centre Working Paper No. 291
DEV/DOC(2010)8
© OECD 2010 15
is higher in Latin America. On the other hand, SSC elasticities are very much in line with OECD
estimates, except Mexico and Colombia, where they are significantly lower.
Figure 5. Average social security contributions by income levels
(Percentage)
0.00
5.00
10.00
15.00
20.00
25.00
30.00
35.00
40.00
45.00
0.1 0.6 1.1 1.6 2.1 2.6 3.1 3.6 4.1 4.6 5.1 5.6
ARG CHL COL CRI MEX PER URU
Note: Average tax rate by household labour income level. 1 represents the national average
Source: Authors’ calculations based on OECD Taxing Wages (Mexico), Ministries of Finance (Chile and
Uruguay) and own elaboration (Argentina, Colombia, Costa Rica and Peru)
To calculate the overall elasticities, the second step involves the econometric estimation of
the sensitivity of the relevant tax bases with respect to the output gap ( tbi,,y). As in Girouard and
André (2005), the cyclical sensitivity of the wage base (PIT and SSC tax base) has been estimated
using an equation that links directly the cyclical component of the wage bill to the output gap.
We regress the share of the real wage bill in potential GDP (constructed with active population
from the Penn World tables, and unemployment and urban workers wages from ECLAC) on the
output gap (estimated using unobserved components model on real chained GDP series from
Penn World tables as described in section III) and a constant, in logs with annual data from 1981
to 2007 (see details in Annex).
tttytwlttt YYYLWtt
)/ln()/ln( *
,
* (3)
The estimated responsiveness of the wage bill for Uruguay, Colombia (taken from
Lozano and Toro, 2007) and Argentina (around 1.0) are slightly above the OECD average (0.7
according to Girouard and Andre, 2005), and Brazil (0.8 reported by De Mello and Moccero,
2006), while elasticities for the rest are significantly above previous estimates (up to 2.0 in Peru).
Details on the estimations are also included in the Annex.
Fiscal Policy in Latin America: Countercyclical and Sustainable at Last?
DEV/DOC(2010)8
16 © OECD 2010
Table 1
Marginal and Average Tax Rates
PIT SSC PIT SSC PIT SSC
Argentina 2.9 39.3 0.9 40.0 3.3 1.0
Brazil --- --- --- --- 3.4 1.8
Chile 1.7 6.9 0.7 7.5 2.5 0.9
Colombia 0.9 5.7 0.3 10.9 2.5 0.5
Costa Rica 3.4 34.3 1.3 35.0 2.6 1.0
Mexico 13.7 8.8 7.0 17.5 2.0 0.5
Peru 1.1 22.6 0.4 23.3 2.7 1.0
Uruguay 1.6 20.0 0.5 19.0 3.2 1.1
Canada 28.6 7.8 18.3 9.7 1.6 0.8
France 13.9 34.9 8.2 30.7 1.7 1.1
Germany 26.2 23.9 11.4 31.1 2.3 0.8
Italy 26.3 26.5 13.2 27.6 2.0 1.0
Japan 9.6 18.7 4.9 20.5 1.9 0.9
Korea 8.5 11.2 3.6 13.1 2.3 0.9
Spain 20.2 18.3 9.5 24.1 2.1 0.8
United Kingdom 22.8 13.6 13.5 10.4 1.7 1.3
United States 19.1 11.6 10.3 12.8 1.9 0.9
OECD 21.8 19.0 12.7 18.8 1.7 1.0
Marginal tax rate Real wage elasticity of
X Z = X / Y
Average tax rate
Y
Notes: Marginal and average rates are weighted by the distribution of tax payers across income levels. OECD
unweighted average, excluding Chile and Mexico
Source: Authors’ calculations for Argentina, Chile, Colombia, Costa Rica, Mexico, Peru and Uruguay, de Mello
and Moccero (2006) for Brazil, and Girouard and André (2005) for the rest
Finally, we multiply both elasticities to obtain the overall tax elasticities. Table 2 collects
the output elasticity of PIT and SSC in our selected Latin American countries, compared to those
in selected OECD economies and Brazil. Given the higher elasticities of the wage bill to output
gap, output elasticities of PIT are much larger in Latin America than those observed in OECD
countries (3.5 on average vs. 1.2), and less in the case of SSC elasticities (1.2 on average vs. 0.7).
Corporate income tax
Concerning corporate taxes, we strictly apply the OECD methodology. Therefore, the
cyclical sensitivity of the corporate tax base (proxied by corporate profits) is also a function of the
elasticity of the wage bill relative to the output.
CIT,,y = (1-(1-PS) wl,,y)PS (4)
where PS is the profit share in output proxied by the ratio of the gross operating surplus over
GDP, and wl,,y is the elasticity of the wage bill to the output gap. Profit shares over GDP are
taken from OECD Annual National Accounts in the case of Chile, from the national central banks
in Costa Rica and Uruguay, and from national statistics institutes in Argentina (INDEC),

OECD Development Centre Working Paper No. 291
DEV/DOC(2010)8
© OECD 2010 17
Colombia (DANE), Mexico (INEGI) and Peru (INEI). As shown in Table 3, output elasticities of
CIT vary from 0.3 in Costa Rica to 1.2 in Uruguay, therefore lower than in OECD countries.
Table 2
Elasticities of Personal Income Tax and Social Security Contributions
Output elasticity
PIT SSC of wages PIT SSC
B
Argentina 3.3 1.0 1.1 3.6 1.1
Brazil 3.4 1.8 0.8 2.7 1.4
Chile 2.5 0.9 1.4 3.5 1.3
Colombia 2.5 0.5 1.1 2.6 0.6
Costa Rica 2.6 1.0 1.7 4.5 1.7
Mexico 2.0 0.5 1.5 3.0 0.8
Peru 2.7 1.0 2.0 5.3 1.9
Uruguay 3.2 1.1 0.9 2.8 0.9
Canada 1.6 0.8 0.7 1.1 0.6
France 1.7 1.1 0.7 1.2 0.8
Germany 2.3 0.8 0.7 1.6 0.6
Italy 2.0 1.0 0.9 1.8 0.9
Japan 1.9 0.9 0.6 1.2 0.5
Korea 2.3 0.9 0.6 1.4 0.5
Spain 2.1 0.8 0.9 1.9 0.7
United Kingdom 1.7 1.3 0.7 1.2 0.9
United States 1.9 0.9 0.7 1.3 0.6
OECD 1.7 1.0 0.7 1.2 0.7
Output elasticity ofReal wage elasticity of
A C = A X B
Notes: Change in tax revenues as a per cent of GDP for a 1 percentage-point change in the output gap. Based
on weights for 2003 for OECD, and 2005-2006 in Latin America. OECD unweighted average, excluding Chile
and Mexico
Source: Authors’ calculations for Argentina, Chile, Costa Rica, Mexico, Peru and Uruguay, de Mello and
Moccero (2006) for Brazil, and Girouard and André (2005) for the rest. Output elasticity of wages in Colombia
is taken from Lozano and Toro (2007)

Fiscal Policy in Latin America: Countercyclical and Sustainable at Last?
DEV/DOC(2010)8
18 © OECD 2010
Table 3
Elasticities of Corporate Income Tax
Profits elasticity Profit share Output elasticity Output elasticity Output elasticity of
of CIT in GDP of wages of profits of CIT
A B C E = (1 - (1 - B) C) / B F = A x E
Argentina 1.0 0.38 1.1 0.8 0.8
Brazil 1.0 0.54 0.8 1.2 1.2
Chile 1.0 0.54 1.4 0.7 0.7
Colombia 1.0 0.59 1.1 1.0 1.0
Costa Rica 1.0 0.49 1.7 0.3 0.3
Mexico 1.0 0.62 1.5 0.7 0.7
Peru 1.0 0.62 2.0 0.4 0.4
Uruguay 1.0 0.36 0.9 1.2 1.2
Canada 1.0 0.35 0.7 1.5 1.5
France 1.0 0.34 0.7 1.6 1.6
Germany 1.0 0.36 0.7 1.5 1.5
Italy 1.0 0.45 0.9 1.1 1.1
Japan 1.0 0.38 0.6 1.6 1.6
Korea 1.0 0.43 0.6 1.5 1.5
Spain 1.0 0.40 0.9 1.2 1.2
United Kingdom 1.0 0.31 0.7 1.7 1.7
United States 1.0 0.36 0.7 1.5 1.5
OECD 1.0 0.39 0.7 1.5 1.5
Notes: Change in tax revenues as a per cent of GDP for a 1 percentage-point change in the output gap. Based
on weights for 2003 for OECD, and 2005-2006 in Latin America. OECD unweighted average, excluding Chile
and Mexico
Source: Authors’ calculations for Argentina, Chile, Costa Rica, Mexico, Peru and Uruguay, de Mello and
Moccero (2006) for Brazil, and Girouard and André (2005) for the rest. Output elasticity of wages in Colombia
is taken from Lozano and Toro (2007)
Other revenues, expenditures and overall balance
The output elasticity of the indirect tax base with respect to the economic cycle is set to
unity for all countries, as in Girouard and André (2005). Finally, due to the lack of data and given
the absence of unemployment benefits in many countries in the region, we suppose that current
expenditures do not respond automatically to the cycle at all.
The cyclical budget response, as a share of GDP, can be expressed as the weighted sum of
the four different tax revenues elasticities (based on the tax structure in 2006; see Table A.1 in the
Annex). According to our calculations, the sensitivity (semi elasticity in GDP percentage points)
of government budget balances to a 1 percentage point change in the output gap is 0.21
(unweighted average of the six Latin American economies), ranging from 0.12 in Mexico and 0.14
in Colombia, to 0.24 in Argentina and Uruguay, 0.25 in Brazil (De Mello and Moccero, 2006), and
0.26 in Costa Rica. This regional average is almost half the OECD average, and is explained by
significantly lower automatic stabilization from PIT (Figure 6).

OECD Development Centre Working Paper No. 291
DEV/DOC(2010)8
© OECD 2010 19
Figure 6. Tax semi-elasticities to output
(Percentage points of GDP)
0.0
0.1
0.2
0.3
0.4
0.5
CRI ARG BRA URU PER CHL COL MEX SPA US KOR OECD
Indirect taxes Corporate Income Tax Social Security Contributions Personal Income Tax
Note: OECD unweighted average, excluding Chile and Mexico
Source: Authors’ calculations for Argentina, Chile, Colombia, Costa Rica, Mexico, Peru and Uruguay, de
Mello and Moccero (2006) for Brazil, and Girouard and André (2005) for the rest
These estimates of the cyclical response of budget balance are positively correlated with
the size of the government, as stated in the literature on fiscal macroeconomic stability in
industrialized economies (see for instance Gali, 1994 and Fatas and Mihov, 2001). Nonetheless, as
shown in Figure 7, some of the biggest economies in Latin America (notably Brazil, Colombia
and Mexico) deviate significantly from their ‚expected‛ trends as automatic stabilisers are
significantly lower than the government size (in part due to the high non-tax revenues).
Figure 7. Government size and tax automatic stabilisers in OECD and Latin America
(Percentage points of GDP)
0.00
0.10
0.20
0.30
0.40
0.50
0.60
0.10 0.15 0.20 0.25 0.30 0.35 0.40 0.45 0.50 0.55 0.60
Tax
ela
stic
ity
to o
utp
ut
Expenditure over GDP
MEX
COL
PER
CHL
CRIARG BRAURY
Source: Authors’ calculations for Argentina, Chile, Colombia, Costa Rica, Mexico, Peru and Uruguay, de
Mello and Moccero (2006) for Brazil, and Girouard and André (2005) for the rest.

Fiscal Policy in Latin America: Countercyclical and Sustainable at Last?
DEV/DOC(2010)8
20 © OECD 2010
II.2. Adjustment of tax and non-tax revenues for commodity prices
A special feature of several Latin American countries is the importance of commodity
prices for its fiscal accounts, whether it is due to a significant share of taxation linked to rents in
natural resource extraction, or the utilities of state-owned enterprises in these sectors. Not only
are commodity-linked revenues important as a source of revenue, but they also tend to be very
volatile, primarily due to large fluctuations in prices. Therefore, they are also relevant for fiscal
sustainability and macroeconomic stability (Avendaño et al., 2008)10.
Figure 8 shows copper revenues as a share of GDP in Chile from 1990 to 2009. Copper
revenues during this period have risen from less than 0.5 per cent of GDP in 1999 up to more
than 12 per cent of GDP in 2006. Compared with total revenues, these revenues are more than
five times more volatile (copper revenues have a coefficient of variation of 1.01 versus 0.18 for
total revenues). Thus, it is necessary to separate this source of income in countries where
commodities are important for fiscal revenues and perform a special adjustment for commodity
price fluctuations.
Figure 8. Copper revenues as share of GDP and the price of copper
(US dollars cents/pound)
0%
2%
4%
6%
8%
10%
12%
14%
0
50
100
150
200
250
300
350
1990 1991 1992 1993 1994 1995 1996 1997 1998 1999 2000 2001 2002 2003 2004 2005 2006 2007 2008 2009
US$ cents per pound (lhs) Copper-related Revenues/GDP (rhs)
Source: Authors’ calculations based on DIPRES and COCHILCO data
10
These authors show that the macroeconomic response to the latest Asian-driven commodity boom of
exporting countries in Africa and Latin America has been fairly positive. In contrast to the nineties,
during 2000-2005 African commodity-exporters have shown a more counter-cyclical fiscal stance,
displaying various positive macroeconomic developments (notably, reserves accumulation, exports
diversification, and improved credit profile). Results are more modest in Latin America.
OECD Development Centre Working Paper No. 291
DEV/DOC(2010)8
© OECD 2010 21
Unfortunately, the OECD methodology is silent regarding this issue.11 Therefore, we
follow a similar methodology to the Chilean fiscal rule (see Marcel et al., 2001 and Rodríguez et
al., 2007) and recent IMF work on this topic in Latin America and the Caribbean (e.g. Vladkova-
Hollar and Zettelmeyer, 2008). The adjustment is made for Argentina, Chile, Mexico and Peru.12
In Argentina, we consider export taxes on agricultural goods introduced in 2002. For Chile, we
consider revenues transferred to the central government from the public copper company
(CODELCO) and revenues from specific taxes on private mining firms.13 In the case of Mexico,
we use international oil price data to adjust the value of transfers from the public oil firm
(PEMEX) to the federal government, royalties and revenues of specific taxes on oil and petrol
derivatives. It is important to point out that there are differences – due to data availability
restrictions – between how we treat public enterprises in the commodity sector for Chile and
Mexico. While for Chile we consider the general government, which implies that we do consider
only the transfers and income taxes paid by CODELCO, for Mexico we used the non-financial
public sector. Finally, in the case of Peru, we consider royalties and income taxes of the mining
and fishing industries, adjusted by a weighted average (according to their share in revenues) of
international copper, gold and fishmeal prices. In Annex A.3 we present more details on the
series and data sources.
In terms of the adjustment, we first separate revenues (tax and non-tax) into revenues
related to commodities and non-commodity revenues. The latter are adjusted as indicated in the
section II.1 by the business cycle. For commodity-related revenues, we proceed as follows.
Considering a spot price of p and a long-run price of the relevant commodity price p*, structural
commodity-linked revenues at time t are given by:
t
tc
t
c
tsp
pRR
*
, . (5)
As Marcel et al. (2001) and Vladkova-Hollar and Zettelmeyer (2008), we consider a
unitary elasticity, such that γ = 1. For p*, we considered four different options, depending on
available information: future prices, five-year-ahead forecasts, a 10-year moving average or a
reference price set by a panel of experts (the case of copper in Chile). As shown in Figure 9 for
the case of copper, a 10-year moving average coincides roughly with the forecasts of the experts’
panel, with the exception of 2009. For the latest year, it seems that experts consider a larger
11
For Norway, OECD exercises are carried out using Norway-mainland fiscal and national accounts that
exclude the oil and natural gas sector in a consistent way. There is no such information available for
Mexico or Chile. 12
Commodity prices are also important in the other countries studied here, but their impact on the fiscal
accounts is mainly through the business cycle rather than an autonomous effect for these economies.
For the case of Colombia, it is important to point out that energy and mining related revenues represent
close to 1 per cent of GDP, but are expected to play an important role in the near future (see Comité
Técnico Interinstitucional, 2010). 13
Although other metals like molybdenum, gold and silver are also produced in Chile, copper remains by far
the most important source of revenues.

Fiscal Policy in Latin America: Countercyclical and Sustainable at Last?
DEV/DOC(2010)8
22 © OECD 2010
fraction of the recent rise in copper prices to be persistent. We discard future markets, as they
prove to be relatively small and shallow (probably with the exception of oil futures), and prices
tend to be very volatile. In what follows, we report our results based on the 10-year moving
average price. Commodity revenues are not separately adjusted by the output gap, given that
commodity prices are already significantly linked to the business cycle.
Figure 9. Copper prices (US dollars cents/pound)
0
50
100
150
200
250
300
350
1998 1999 2000 2001 2002 2003 2004 2005 2006 2007 2008 2009
Spot Price Ten Years Moving Average Experts Panel Reference Price
Source: Authors’ calculations based on data from Cochilco and London Metal Exchange
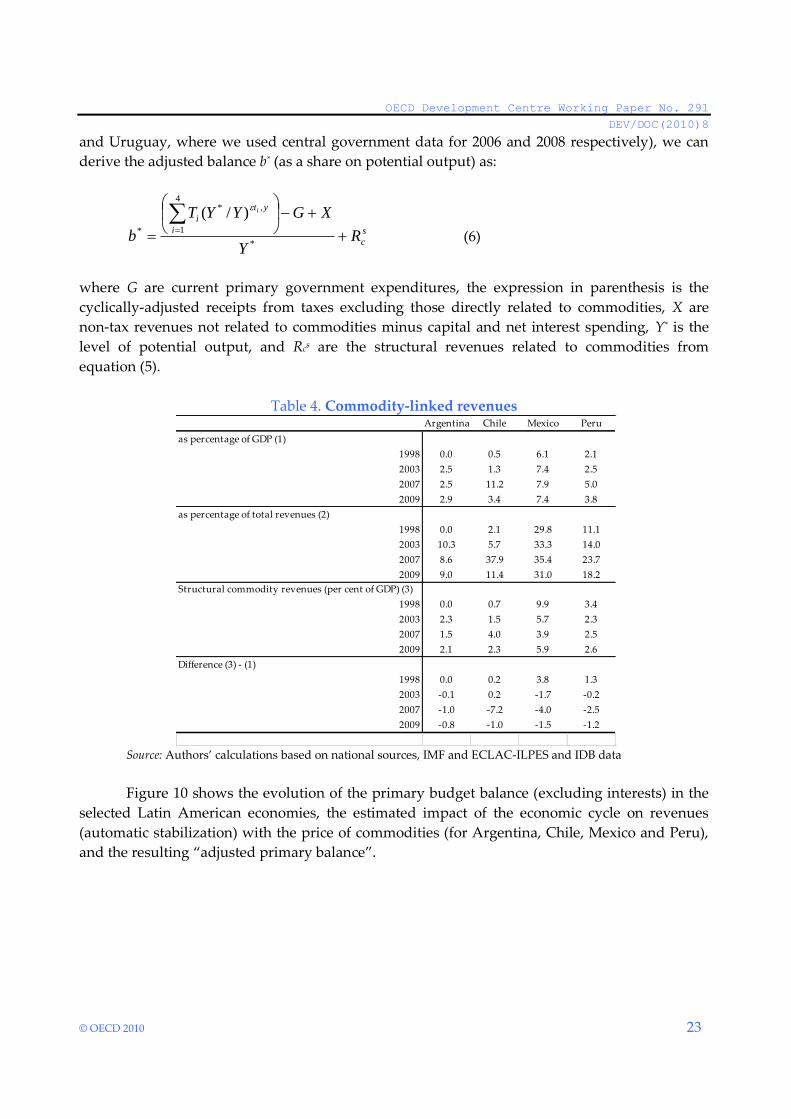
As shown in of Table 4, as of 2007 a large fraction of observed revenues linked to
commodities were likely to be transitory. For Chile, around two thirds of the 11.2 percentage
points of GDP linked to copper revenues were due to copper prices above its long-run price. The
results for Argentina and Peru indicate that around half of commodity revenues could be
considered transitory in 2007, although the absolute magnitudes are smaller than for Chile or
Mexico. For the case of Mexico, it would be around one third of the oil revenues that are linked
to the oil price cycle (almost 4 percentage points of GDP). This table also shows that the global
economic crisis, and the consequent decline in commodity prices due to the collapse of global
demand, had an important effect on some of the commodity-linked revenues in the region, but
the effect is not homogenous. In fact, while in 2009 commodity revenues in Chile declined
significantly, in the other three countries the effect was considerably milder.
II.3. Main results
Including all these elements and using the share of each tax on GDP for general
governments from ELAC-ILPES and IDB public sector databases of 2006 (except for Colombia
OECD Development Centre Working Paper No. 291
DEV/DOC(2010)8
© OECD 2010 23
and Uruguay, where we used central government data for 2006 and 2008 respectively), we can
derive the adjusted balance b* (as a share on potential output) as:
s
c
i
yt
i
RY
XGYYT
b
i
*
4
1
,*
*
)/(
(6)
where G are current primary government expenditures, the expression in parenthesis is the
cyclically-adjusted receipts from taxes excluding those directly related to commodities, X are
non-tax revenues not related to commodities minus capital and net interest spending, Y* is the
level of potential output, and Rcs are the structural revenues related to commodities from
equation (5).
Table 4. Commodity-linked revenues
Argentina Chile Mexico Peru
as percentage of GDP (1)
1998 0.0 0.5 6.1 2.1
2003 2.5 1.3 7.4 2.5
2007 2.5 11.2 7.9 5.0
2009 2.9 3.4 7.4 3.8
as percentage of total revenues (2)
1998 0.0 2.1 29.8 11.1
2003 10.3 5.7 33.3 14.0
2007 8.6 37.9 35.4 23.7
2009 9.0 11.4 31.0 18.2
Structural commodity revenues (per cent of GDP) (3)
1998 0.0 0.7 9.9 3.4
2003 2.3 1.5 5.7 2.3
2007 1.5 4.0 3.9 2.5
2009 2.1 2.3 5.9 2.6
Difference (3) - (1)
1998 0.0 0.2 3.8 1.3
2003 -0.1 0.2 -1.7 -0.2
2007 -1.0 -7.2 -4.0 -2.5
2009 -0.8 -1.0 -1.5 -1.2
Source: Authors’ calculations based on national sources, IMF and ECLAC-ILPES and IDB data
Figure 10 shows the evolution of the primary budget balance (excluding interests) in the
selected Latin American economies, the estimated impact of the economic cycle on revenues
(automatic stabilization) with the price of commodities (for Argentina, Chile, Mexico and Peru),
and the resulting ‚adjusted primary balance‛.

Fiscal Policy in Latin America: Countercyclical and Sustainable at Last?
DEV/DOC(2010)8
24 © OECD 2010
Figure 10. Adjusted primary budget balance
(Percentage points of GDP)
Argentina Brazil
Chile Colombia
Costa Rica Mexico
Peru Uruguay
-6.00
-4.00
-2.00
0.00
2.00
4.00
6.00
8.00
10.00
12.00
19
90
19
91
19
92
19
93
19
94
19
95
19
96
19
97
19
98
19
99
20
00
20
01
20
02
20
03
20
04
20
05
20
06
20
07
20
08
20
09
Cyclical Commodity related Observed Adjusted
-6.00
-4.00
-2.00
0.00
2.00
4.00
6.00
8.00
10.00
12.00
19
90
19
91
19
92
19
93
19
94
19
95
19
96
19
97
19
98
19
99
20
00
20
01
20
02
20
03
20
04
20
05
20
06
20
07
20
08
20
09
Cyclical Commodity related Observed Adjusted
-6.00
-4.00
-2.00
0.00
2.00
4.00
6.00
8.00
10.00
19
90
19
91
19
92
19
93
19
94
19
95
19
96
19
97
19
98
19
99
20
00
20
01
20
02
20
03
20
04
20
05
20
06
20
07
20
08
20
09
Cyclical Observed Adjusted
-3.00
-2.00
-1.00
0.00
1.00
2.00
3.00
4.00
5.00
6.00
19
90
19
91
19
92
19
93
19
94
19
95
19
96
19
97
19
98
19
99
20
00
20
01
20
02
20
03
20
04
20
05
20
06
20
07
20
08
20
09
Cyclical Commodity related Observed Adjusted
-6.00
-4.00
-2.00
0.00
2.00
4.00
6.00
8.00
10.00
19
90
19
91
19
92
19
93
19
94
19
95
19
96
19
97
19
98
19
99
20
00
20
01
20
02
20
03
20
04
20
05
20
06
20
07
20
08
20
09
Cyclical Commodity related Observed Adjusted
-2.00
-1.00
0.00
1.00
2.00
3.00
4.00
5.00
19
90
19
91
19
92
19
93
19
94
19
95
19
96
19
97
19
98
19
99
20
00
20
01
20
02
20
03
20
04
20
05
20
06
20
07
20
08
20
09
Cyclical Observed Adjusted
-2.00
-1.00
0.00
1.00
2.00
3.00
4.00
5.00
19
90
19
91
19
92
19
93
19
94
19
95
19
96
19
97
19
98
19
99
20
00
20
01
20
02
20
03
20
04
20
05
20
06
20
07
20
08
20
09
Cyclical Observed Adjusted
-3.00
-2.00
-1.00
0.00
1.00
2.00
3.00
4.00
5.00
6.00
19
90
19
91
19
92
19
93
19
94
19
95
19
96
19
97
19
98
19
99
20
00
20
01
20
02
20
03
20
04
20
05
20
06
20
07
20
08
20
09
Cyclical Observed Adjusted
Notes: Primary budget balance is adjusted for deviations of GDP and commodity prices (for Argentina, Chile,
Mexico and Peru) around their trends, as explained in sections II.1 and II.2. Non-financial public sector
figures in Argentina, Colombia, Mexico and Uruguay, and general government figures for Brazil, Chile, Costa
Rica and Peru, from ECLAC-ILPES and IDB databases
Source: Authors’ calculations

OECD Development Centre Working Paper No. 291
DEV/DOC(2010)8
© OECD 2010 25
According to our estimates, at the onset of the crisis, adjusted primary balances were
in equilibrium or surplus in a majority of countries (1 p.p of GDP in Peru, 2 p.p. in Uruguay, 2.5
p.p. in Brazil, almost 3 p.p. in Chile and Colombia, and 5 p.p. in Costa Rica; -1.0 p.p. in Argentina
and -3.6 p.p. in Mexico). So, even taking into account the positive economic and commodity price
cycles, these figures confirm that the region faced the crisis in relatively good shape. The figure
also highlights the significant impact of the economic cycle; especially in Argentina and Uruguay
(automatic stabilizers via revenue contributed more than 4 p.p. of GDP to sustain aggregate
demand). Finally, commodity prices (copper, gold and oil) contributed significantly to improve
fiscal positions in latest years (around 1 p.p. in Argentina, 2 p.p. in Mexico, 3 p.p. in Peru and
over 6 p.p. in Chile). Obviously, 2009 figures reflect a generalized deterioration, driven by
cyclical, commodity related and discretionary factors14.
Next, we explore the pro-cyclicality of discretionary fiscal policy in the standard way,
comparing the variation of the adjusted primary balance and the output gap level. Fiscal policy is
defined as counter-cyclical if the surplus increases (deficit decreases) in a year with positive
output gap, or if the deficit increases (surplus decreases) when the output gap is negative. As
represented in Figure 11, in the last two decades discretionary fiscal policy in Latin America has
tended to be pro-cyclical (the correlation coefficient is –0.37 and in more than 60 per cent of cases,
53 out of the 144 cases, discretionary fiscal policy was not stabilizing).
Figure 11. Output gap and change in adjusted budget balance
(Percentage points of GDP)
URU02
URU03
ARG02
-0.06
-0.04
-0.02
0.00
0.02
0.04
0.06
0.08
-0.25 -0.20 -0.15 -0.10 -0.05 0.00 0.05 0.10 0.15
Var
iati
on
of
cycl
ical
ly a
dju
ste
d p
rim
ary
bal
ance
Output gap
Source: Authors’ calculations
14
2009 budget figures are preliminary for many economies. Data for Argentina, Costa Rica, Colombia and
Peru where taken from the respective Central Bank databases, for Mexico and Uruguay from Ministry
of Finance databases, and Brazil and Chile from OECD Economic Outlook projections (May 2010). Access
to stable funding (both internal and external) determined the size of announced fiscal packages in the
region. Chile and Peru were the top performers in the ‚fiscal resilience index‛constructed by the OECD
(2009b); an index that takes into account the external debt to exports ratio (a standard fiscal solvency
indicator), the financing cost of fiscal expansions (proxied by the JP Morgan’s EMBI Global spreads),
and the government’s pre-crisis budget balance with respect to GDP. Not coincidentally, these two
countries announced and implemented the biggest fiscal stimuli for 2009.
Fiscal Policy in Latin America: Countercyclical and Sustainable at Last?
DEV/DOC(2010)8
26 © OECD 2010
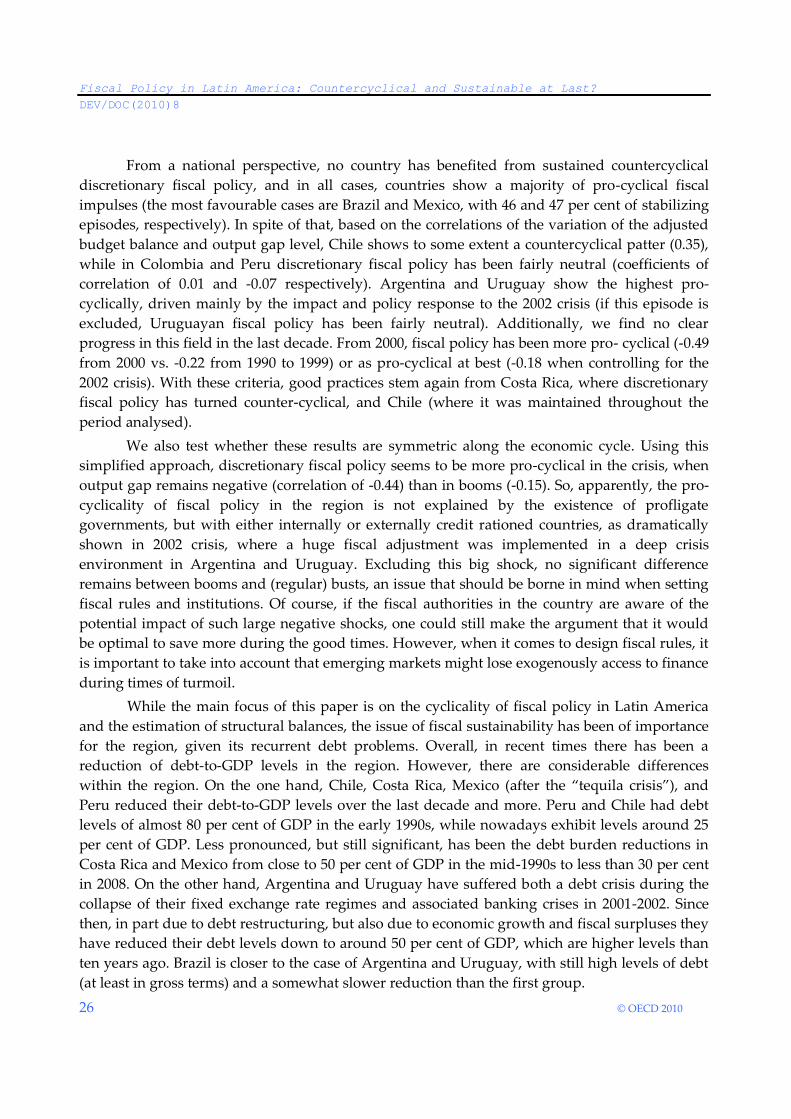
From a national perspective, no country has benefited from sustained countercyclical
discretionary fiscal policy, and in all cases, countries show a majority of pro-cyclical fiscal
impulses (the most favourable cases are Brazil and Mexico, with 46 and 47 per cent of stabilizing
episodes, respectively). In spite of that, based on the correlations of the variation of the adjusted
budget balance and output gap level, Chile shows to some extent a countercyclical patter (0.35),
while in Colombia and Peru discretionary fiscal policy has been fairly neutral (coefficients of
correlation of 0.01 and -0.07 respectively). Argentina and Uruguay show the highest pro-
cyclically, driven mainly by the impact and policy response to the 2002 crisis (if this episode is
excluded, Uruguayan fiscal policy has been fairly neutral). Additionally, we find no clear
progress in this field in the last decade. From 2000, fiscal policy has been more pro- cyclical (-0.49
from 2000 vs. -0.22 from 1990 to 1999) or as pro-cyclical at best (-0.18 when controlling for the
2002 crisis). With these criteria, good practices stem again from Costa Rica, where discretionary
fiscal policy has turned counter-cyclical, and Chile (where it was maintained throughout the
period analysed).
We also test whether these results are symmetric along the economic cycle. Using this
simplified approach, discretionary fiscal policy seems to be more pro-cyclical in the crisis, when
output gap remains negative (correlation of -0.44) than in booms (-0.15). So, apparently, the pro-
cyclicality of fiscal policy in the region is not explained by the existence of profligate
governments, but with either internally or externally credit rationed countries, as dramatically
shown in 2002 crisis, where a huge fiscal adjustment was implemented in a deep crisis
environment in Argentina and Uruguay. Excluding this big shock, no significant difference
remains between booms and (regular) busts, an issue that should be borne in mind when setting
fiscal rules and institutions. Of course, if the fiscal authorities in the country are aware of the
potential impact of such large negative shocks, one could still make the argument that it would
be optimal to save more during the good times. However, when it comes to design fiscal rules, it
is important to take into account that emerging markets might lose exogenously access to finance
during times of turmoil.
While the main focus of this paper is on the cyclicality of fiscal policy in Latin America
and the estimation of structural balances, the issue of fiscal sustainability has been of importance
for the region, given its recurrent debt problems. Overall, in recent times there has been a
reduction of debt-to-GDP levels in the region. However, there are considerable differences
within the region. On the one hand, Chile, Costa Rica, Mexico (after the ‚tequila crisis‛), and
Peru reduced their debt-to-GDP levels over the last decade and more. Peru and Chile had debt
levels of almost 80 per cent of GDP in the early 1990s, while nowadays exhibit levels around 25
per cent of GDP. Less pronounced, but still significant, has been the debt burden reductions in
Costa Rica and Mexico from close to 50 per cent of GDP in the mid-1990s to less than 30 per cent
in 2008. On the other hand, Argentina and Uruguay have suffered both a debt crisis during the
collapse of their fixed exchange rate regimes and associated banking crises in 2001-2002. Since
then, in part due to debt restructuring, but also due to economic growth and fiscal surpluses they
have reduced their debt levels down to around 50 per cent of GDP, which are higher levels than
ten years ago. Brazil is closer to the case of Argentina and Uruguay, with still high levels of debt
(at least in gross terms) and a somewhat slower reduction than the first group.

OECD Development Centre Working Paper No. 291
DEV/DOC(2010)8
© OECD 2010 27
Debt sustainability depends on a series of factors such as long-term economic growth
perspectives, the cost of funds (interest rate), and the composition of debt; but also things much
harder to measure such as expectations (Calvo, 1988) and institutional/political characteristics
affecting a country’s ability and willingness to service its sovereign debt. Furthermore,
exogenous shocks to each of these variables are hard to identify, making debt sustainability
analysis a challenging topic. Therefore, in this section we explore some aspects of debt dynamics
in the region using standard techniques in the literature, rather than making a precise judgement
regarding the need and size of fiscal adjustment in each country.
Although it is not obvious how to establish a benchmark for safe debt levels, one way to
approach this issue is to compute the primary surplus required to stabilize debt to GDP ratios at
their current level, and compare this required surplus with both actual and structural balances.
Given the government budget dynamics in equation (7), fiscal policy is considered
sustainable if the primary surplus (S) is greater than the primary surplus required to stabilize the
debt level (D) relative to GDP (Y):
111 )1( tttt SDrD , (7)
where debt levels are end-of-period and rt+1 is the average real interest rate during period t+1.
Assuming that GDP (Y) grows at a rate gt , dividing equation (7) by Yt+1 yields:
1
1
11
1
1
tt
t
tt sd
g
rd , (8)
where all lower case variables refer now to GDP ratios.
Thus, for a given interest rate and GDP growth rate (assuming that they are constant over
time), the primary surplus that stabilizes the current debt-to-GDP level is given by:
dr
grs
1. (9)
It should be recognised that this definition has some limitations. First, it does not say
anything regarding the initial debt-to-GDP ratio, which might be too high and therefore an
additional fiscal effort to reduce it to a safe level would be required. Second, this ‘accounting
approach’ does not consider underlying correlations and endogeneity of variables. For instance,
in the presence of default risk, interest rates would increase with the debt burden and with net
financing needs if liquidity risks are also present. Growth could in turn depend negatively on the
cost of funding (r) and the debt burden (if there is a debt overhang problem, where private
investment is lower because economic agents incorporate the prospects of higher future taxes to
service the debt).
In addition, valuation effects can have very important quantitative effects, as most
countries in the region have painfully learnt during the 1980s and 1990s (debt dollarization). In
particular, swings in the real exchange rate often imply large fluctuations in the debt-to-GDP

Fiscal Policy in Latin America: Countercyclical and Sustainable at Last?
DEV/DOC(2010)8
28 © OECD 2010
ratio, if the fraction of dollarized debt is different from the share of tradable goods in GDP.15
Observe that the steady-state debt-to-GDP ratio can be written as:
Y
eDBd
* , (10)
where e is the relative price of tradable goods in terms of one unit of output, D* is debt
denominated in tradables (dollars) and B in output units. The right-hand-side of equation (10)
can be written as:
Y
D
Y
B , (11)
with D
eD*
representing the share of foreign-currency denominated debt.
The valuation-corrected debt-to-GDP ratio for a given equilibrium exchange rate e~ is:
dY
Bd
~~ , (12)
where D
De *~~ .
Thus, under an appreciated real exchange rate ( ee ~ ), the valuation-corrected debt ratio
will be greater than the observed ratio. This implies that the required primary surplus, shown in
equation (13), will also be higher, given that a depreciation of the currency vis-à-vis the dollar
would be expected in the transition to the steady state. Vice versa, if the currency is depreciated
(above the equilibrium exchange rate), the adjusted debt level will be less than the observed one.
dr
grs
~
1
~
. (13)
In practical terms, we measure the equilibrium real exchange rate to be measured by the
average bilateral real exchange rate vis-à-vis the US dollar, considering CPI prices over the
period 1990 – 2008. Furthermore, as proxy for the share of foreign currency debt in total debt, we
use data on the markets where debt was issued, assuming that all external debt is in US dollars
and all domestic debt is indexed to the domestic price level (which we assume to equal the GDP
deflator; this is the implicit assumption in equations 11 – 13).
15
In addition, the remaining fraction of debt in general is often not nominal debt, but indexed to CPI
inflation or short-term interest rates, which move often in tandem with the exchange rate.

OECD Development Centre Working Paper No. 291
DEV/DOC(2010)8
© OECD 2010 29
A final adjustment refers to point in the cycle at which GDP stands, given that the debt-
to-GDP ratio would be lower during a boom (holding constant the stock of debt), such that our
preferred measure of sustainability is given by:
*
~
1 Y
Yd
r
grs
, (14)
where Y* is potential output. In practical terms, we compute potential output jointly with the
business cycle using the structural time series approach described below.
Before computing the required fiscal surpluses, it is useful to explore the relevance of
these adjustments. Figure 12 shows the potential importance of these adjustments from a
quantitative point of view for the case of Uruguay. Debt levels as a ratio of GDP in the late 1990s
were slightly below 30 per cent of GDP. However, when taking into account the appreciation of
the real exchange rate with respect to its long-term average, debt levels would have been ten
percentage points of GDP higher. The opposite is true for 2002, where the observed debt-to-GDP
ratio shot up to over 100 per cent of GDP, while it would have been around 76 per cent of GDP if
debt was valued at the long-term real exchange rate, and almost 16 p. p. of GDP less if it were
taken into account that the Uruguayan economy was in a deep crisis with GDP far below its
potential (almost 20 per cent, according to our estimates). Finally, regarding the large reduction
in the debt-to-GDP ratio after the crisis of more than 50 percentage points of GDP between 2002
and 2009, our structural measure of debt was reduced by 7.7 percentage points until 2008, but
increased in 2009 to reach similar levels as in 2002. Thus, most of the reduction in the debt-to-
GDP ratio could be attributed to the rebound in economic growth and the appreciation of the
real exchange rate in the aftermath of the devaluation of the currency.
Figure 12. Debt dynamics and the real exchange rate in Uruguay
(Percentage points of GDP)
20
40
60
80
100
19
92
19
93
19
94
19
95
19
96
19
97
19
98
19
99
20
00
20
01
20
02
20
03
20
04
20
05
20
06
20
07
20
08
20
09
Debt/GDPDebt/GDP adjusted for real exchange rateDebt/GDP adj. for real exchange rate and cycle
Source: Authors’ calculations based on ECLAC-ILPES database

Fiscal Policy in Latin America: Countercyclical and Sustainable at Last?
DEV/DOC(2010)8
30 © OECD 2010
The main results for the eight countries for 2009 are reported in Table 5.16 As discussed
above, in 2009, most countries present a considerably lower structural balance in 2009 than in
previous years, given the automatic and discretionary fiscal expansion in response to the
economic crisis. However, all countries (except Argentina) have been able during the last decade
to exhibit fiscal balances above those required to sustain their current debt levels, such that they
could be expected to reverse expansionary policies without major difficulties. In terms of the
difference between the adjusted balance and the required balance to keep debt levels at their
current values, while Brazil is the only country with a structural balance above the required
surplus, for several countries the difference is below two percent (Costa Rica, Uruguay,
Colombia, Mexico and Peru).
Table 5. Debt sustainability analysis
Country
Adjusted primary
balance (2009)
Observed primary
balance (2000 - 2009)
Required surplus
(baseline)
Required surplus
(IMF forecasts)
Argentina -0.8 2.1 3.1 3.5
Brazil 2.0 3.0 1.3 1.0
Chile -3.7 2.8 0.1 0.0
Colombia -1.1 1.6 0.5 0.3
Costa Rica -0.2 2.3 0.8 0.4
Mexico -0.7 1.5 1.2 0.4
Peru -1.9 1.2 -0.1 -0.1
Uruguay -0.2 1.6 0.9 1.2 Notes: Required surplus corresponds to equation (14) with debt-to-GDP ratios adjusted by the real exchange
rate and the business cycle. Observed primary balance is the average of observed fiscal balances as
percentage of GDP over the last ten years. IMF forecasts refer to the WEO April 2010 forecast of real GDP
growth in 2015
Source: Authors’ calculations
Argentina and Chile are the exceptions, with a difference of 3.9 and 3.7 p. p. of GDP,
respectively. However, Argentina and Chile are in very different situations. First, Chile took
discretionary measures with a fiscal impulse of around 5.6 p. p. of GDP (comparing 2007 with
2009), while the impulse in Argentina was much smaller (1.3 p. p. of GDP). Thus, countercyclical
fiscal policy was much stronger in Chile than Argentina. This impulse was taken from a very
strong position (debt-to-GDP of only around 6 per cent of GDP) in Chile, which is also reflected
in the low fiscal surplus required to balance debt levels at their current value; meanwhile
Argentina requires a much higher fiscal primary surplus (and has higher levels of debt, 47.1 per
cent of GDP, adjusting for the real exchange rate and the business cycle). In more general terms,
the level of the structural balances (as well as the fiscal impulse during 2007 – 2009) is highly
correlated with the initial debt position. Countries with higher levels of debt were in a more solid
position to have higher structural deficits and larger fiscal impulses (the correlation coefficients
with the debt levels are 0.90 and 0.48, respectively).
16
For each country we considered the current yields (average 2010) on sovereign debt bonds (JP Morgan’s
EMBIG) as the relevant interest rate. Observed and trend growth rates in 2009 are estimated according
to the methodology explained in section III.

OECD Development Centre Working Paper No. 291
DEV/DOC(2010)8
© OECD 2010 31
III. ESTIMATION OF OUTPUT GAP
Many researchers have recognised and analysed aggregate cycles in production without
reaching consensus on its causes.17 Lack of consensus regarding the theory is accompanied by an
empirical problem; measurement of economic cycles depends on the estimation of potential
output, which is unobservable. OECD methodology decomposes production through classical
Solow factor decomposition of capital constructed though perpetual inventory methods, labour
(hours worked) and multifactor productivity (MFP). Potential output is then constructed as the
counter-factual production arising from full capital utilization18, unemployment rate equal to the
NAIRU, and MFP given by its long-run trend.
Although we follow the above criteria to construct potential output in the Latin American
countries, we could not follow OECD methodology by further disaggregating factors by their
specific types, by the sectors of the economy where they are being used, or by their rate of
utilization. In particular, restrictions on data availability for several Latin American countries
forced us to construct capital from aggregate investment figures, using the perpetual inventory
method with infinite lifespan and a constant depreciation rate of eight percent. Real investment,
real GDP and active population data are chained series19 built from series in Penn World tables,
which cover a span of nearly six decades, from 1950 to 2007. The series are extended up to 2013
using IMF’s World Economic Outlook estimates and forecast as of April 2010.20 The treatment of
net exports, in real terms (volume) or in terms of its purchasing power (dollars), merits also some
attention. While the first measure better reflects production dynamics, the latter better reflects
change on income. We opt for the former measure of volume on two grounds: we keep
consistency when we later decompose GDP using a production function, and we analyze the
effect of terms of trade on fiscal balance separately from the effect of the business cycle. Initial
capital stock in 1950 is assumed to be on a balanced growth path, thus approximated by
17This has lead economist to declare such aggregate behaviour dead in more than one occasion. The latest
notable quote came in 2003 from Robert Lucas, who in his presidential address to the American Economic
Association declared that ‘the central problem of depression-prevention has been solved, for all practical
purposes, and has in fact been solved for many decades’. 18
OECD latest revision to potential output uses total capital rather than a filtered series of such series
(OECD, 2008). 19
See OECD (2001) for the benefit of chained indices with respect to other bases of conversion, especially
when looking at higher frequency data and avoiding level comparison across countries. 20
Potential output is estimated up to 2009. But forecasts for years 2010 onwards are used as a way to
circumvent well-known end point filter problems when estimating trends. GDP forecasts are provided
by the IMF, while investment forecasts are estimated from those GDP forecasts, using simple regression
of investment growth on GDP growth between 1990 and 2009.

Fiscal Policy in Latin America: Countercyclical and Sustainable at Last?
DEV/DOC(2010)8
32 © OECD 2010
K1950 = I1950 / [(1 + g)(1 + n) − (1 − δ)] (15)
where I1950 is initial investment expenditure (filtered by a linear interpolation of the log
investment throughout the 1950s), g is the average rate of technological progress on that same
decade, and n is the corresponding average growth rate of active population.
For the implicit Cobb-Douglas production function we assume a capital share of 0.5 for
all countries. This is significantly different from the standard approximation of one third, but
closer to the average obtained in the literature that covers emerging markets (see for example
Gollin, 2002 for country–specific measures of this parameter for a wide range of countries).
Given the broad level of aggregation, cyclical action will be centred in MFP. Several
statistical studies have questioned the usual Hodrick-Prescott methodology to de-trend economic
series, arguing that it is tailor-made for the output cycles in the US, but not necessarily optimal
for any other type of economic series (see Harvey et al., 2008). Furthermore, there is ample
evidence that emerging markets have a very different cyclical behaviour than industrialized
economies, with some authors putting into question even the existence of cyclical shocks (e.g.
Aguiar and Gopinath, 2007).
To address some of these challenges posed in the literature, we de-trend the resulting
MFP series using the unobserved components model suggested by Harvey (1998). We use this
state-space estimation method to estimate unexpected shocks to the MFP series, decomposing
these shocks into three components: shocks that have a permanent effect on MFP, cyclical shocks
with an estimated frequency, and time decay, and transitory ‘white noise’ shocks. Permanent
shocks determine the trend while the two latter shocks determine the gap to potential output.
Harvey (1989) shows that the Hodrick-Prescott filter can be obtained as a particular case of this
method, by imposing two additional restrictions: no cyclical component and a predetermined
ratio between the variance of transitory and permanent shocks (a ratio that coincides with the
parameter lambda of HP filters).
We define the logarithm of multifactor productivity a, and use the state-space domain to
decompose the series into three unobserved components: a trend t, a cycle c, and a transitory
shock :
a t + c + (16)
The trend component accounts for permanent changes in the growth rate of (log) MFP,
and is thus interpreted as the ‘long run trend for multi factor productivity’ in potential output. It
is specified as growing with a stochastic drift :
t t1 crisis (17)
where t1 is the trend in the previous period and crisis is a year dummy that account for large
permanent MFP losses at the beginning of the 1980s debt crisis. The drift rate is assumed to
follow a random walk:
1 crisis (18)

OECD Development Centre Working Paper No. 291
DEV/DOC(2010)8
© OECD 2010 33
where the same 1980s dummy crisis is used to account for any large permanent reduction in
MFP's growth rates after the debt crisis. Thus, MFP trend grows at a rate that varies, but that at
any time t, is best forecasted as remaining constant and equal to current rate . The large
recession in the early 1980s and the prolonged low growth that resulted call for adding the crisis
dummy, which proves to be significantly negative for both the level and rate of MFP trend. As
countries felt the 1980s recession in different years (between 1981 and 1982), for each country we
select the year dummy which maximizes the log likelihood (following the AIC criteria).
The cycle component c follows the autoregressive process:
c cos(c1 sin(c*1 (19)
c* sin(c1 cos(c*1 (20)
where and are disturbances with equal variance. The period of the cycle is 2/. The
damping factor with 0 < < 1 ensures that c is a stationary ARMA (2, 1) process with complex
roots in the autoregressive part. It is assumed that all disturbances are normally distributed and
are independent of each other (usual assumption to assure the identification of the parameters).
Initial values for the stationary cycle components are given by the unconditional distribution and
for the non-stationary trend and drift components by a diffuse prior. The filtered and smoothed
values of the unobserved components are generated by the Kalman filter.
Estimated parameters for the temporary, cyclical and trend components vary significantly
across countries. Figure 13 shows the variance decomposition of unexpected shocks in each
period ( +). While Uruguay has the largest estimated total variance, its shocks are mostly
cyclical. The figure also shows that long term estimated shocks to the trend in Chile, Costa Rica,
Peru and Uruguay have a statistically significant variance. As expected, even for these countries,
this variance is significantly smaller than the estimated variance of the two stationary shocks; a
fact that translates into a relatively smooth long-term trend. Though smaller in size than the
stationary shocks, trend shocks follow a random walk. Thus their effect is cumulative and large
after several periods.
Figure 13. Estimated variance decomposition of shocks to log MFP
0.0000
0.0002
0.0004
0.0006
0.0008
0.0010
0.0012
0.0014
Uruguay Peru Chile Argentina Costa Rica Mexico Brazil Colombia
Trend Cyclical Transitory
Source: Author’s calculations

Fiscal Policy in Latin America: Countercyclical and Sustainable at Last?
DEV/DOC(2010)8
34 © OECD 2010
For this reason, while estimated trends in Argentina, Brazil and Uruguay are close to (but
different than) zero, growth rate of MFP, together with changes in capital formation, may
accumulate and cause significant changes on long run GDP (as observed in Figure 14).
Figure 14. Evolution of estimated trend and cycles for Argentina, Chile, Colombia and Peru
18.5
19
19.5
20
20.5
21
21.5
19
50
19
53
19
56
19
59
19
62
19
65
19
68
19
71
19
74
19
77
19
80
19
83
19
86
19
89
19
92
19
95
19
98
20
01
20
04
20
07
Argentina
GDP Potential GDP
-0.2
-0.15
-0.1
-0.05
0
0.05
0.1
0.15
0.2
19
50
19
53
19
56
19
59
19
62
19
65
19
68
19
71
19
74
19
77
19
80
19
83
19
86
19
89
19
92
19
95
19
98
20
01
20
04
20
07
Argentina
GDP Gap Stochastic Cycle
17
17.5
18
18.5
19
19.5
20
19
51
19
54
19
57
19
60
19
63
19
66
19
69
19
72
19
75
19
78
19
81
19
84
19
87
19
90
19
93
19
96
19
99
20
02
20
05
20
08
Chile
GDP Potential GDP
-0.2
-0.15
-0.1
-0.05
0
0.05
0.1
0.15
0.2
19
51
19
54
19
57
19
60
19
63
19
66
19
69
19
72
19
75
19
78
19
81
19
84
19
87
19
90
19
93
19
96
19
99
20
02
20
05
20
08
Chile
GDP Gap Stochastic Cycle
17
17.5
18
18.5
19
19.5
20
19
50
19
53
19
56
19
59
19
62
19
65
19
68
19
71
19
74
19
77
19
80
19
83
19
86
19
89
19
92
19
95
19
98
20
01
20
04
20
07
Colombia
GDP Potential GDP
-0.2
-0.15
-0.1
-0.05
0
0.05
0.1
0.15
0.2
19
50
19
53
19
56
19
59
19
62
19
65
19
68
19
71
19
74
19
77
19
80
19
83
19
86
19
89
19
92
19
95
19
98
20
01
20
04
20
07
Colombia
GDP Gap Stochastic Cycle
16.5
17
17.5
18
18.5
19
19.5
19
50
19
53
19
56
19
59
19
62
19
65
19
68
19
71
19
74
19
77
19
80
19
83
19
86
19
89
19
92
19
95
19
98
20
01
20
04
20
07
Peru
GDP Potential GDP
-0.2
-0.15
-0.1
-0.05
0
0.05
0.1
0.15
0.2
19
50
19
53
19
56
19
59
19
62
19
65
19
68
19
71
19
74
19
77
19
80
19
83
19
86
19
89
19
92
19
95
19
98
20
01
20
04
20
07
Peru
GDP Gap Stochastic Cycle
Source: Author’s calculation

OECD Development Centre Working Paper No. 291
DEV/DOC(2010)8
© OECD 2010 35
Table 6 shows the estimated damping factor and the estimated period 2/ for the
stochastic cycle component Uruguay shows the longest stochastic cycles (averaging 15 years)
while Mexico and Peru show the shortest cycles (averaging 9 years). Brazil's estimated cycles are
the closest to the ‘biblical cycle’ of 14 years. The damping factor for Costa Rica is the strongest
with equal to 0.24 (i.e., the cyclical shock is dampened to a fourth of its size by the following
year), while Mexico exhibits the weakest dampening effect with an estimated equal to 0.93 (i.e.,
it takes 19 years for the cyclical shock to be dampened to a fourth of its size). In Mexico, the high
estimated value of , combined with the low estimated variance of cyclical shocks, implies a very
stable ‘almost non-stochastic’ cycle.
Table 6. Estimated parameters for cyclical shocks
Period
Argentina 11.4 0.84
Brazil 14.1 0.66
Chile 11.6 0.77
Colombia 14.3 0.74
Costa Rica 12.8 0.24
Mexico 8.6 0.93
Uruguay 15.3 0.72
Peru 8.9 0.67
Source: Author’s calculations

Fiscal Policy in Latin America: Countercyclical and Sustainable at Last?
DEV/DOC(2010)8
36 © OECD 2010
IV. CONCLUSIONS AND POLICY IMPLICATIONS
This paper aims to contribute to the debate on fiscal policy in Latin America by
measuring cyclicality of fiscal balances using a common methodology. At the onset of the
international financial crisis in 2008-2009, many indicators suggested that Latin American
economies were facing the crisis in a much better macroeconomic position that in the past; with
positive budget surpluses, lower debt-to-GDP levels and a more credible monetary policy thanks
to inflation targeting regimes. Solid macro balances were the new reality in a region where fiscal
fragility had been at the root of past protracted crises, such as the dramatic debt crisis of the
1980s.
We track fiscal balances since the early nineties for a set of Latin American economies,
implementing both standardised cyclical-adjustment OECD methodology and regional specific
adjustments for the impact of commodity prices. These estimations allow measuring the size of
automatic stabilisers embedded in tax policies, and the cyclicality of discretionary fiscal policy in
the region as a whole. Additionally, we perform debt sustainability exercises to analyse how far
from a potential benchmark current fiscal balances are.
Our main messages can be summarized as follow. First, there is a great degree of
uncertainty concerning output gap estimates in Latin America. Compounded with highly
volatile cyclical shocks, there is evidence of highly volatile trends for potential output. Second,
commodity cycles may be as relevant to countercyclical policy as economic cycles, because of the
former’s significance in total fiscal revenues. Third, tax automatic stabilizers are significant,
although fairly small. Primary budget balances respond automatically around 0.2 p.p. for each
percentage point of output gap in the region, half the OECD average (although with significant
regional differences). Forth, since the early nineties, discretionary fiscal policy has been pro-
cyclical in Argentina, Brazil, Costa Rica, Mexico and Uruguay, while neutral in Chile, Colombia
and Peru. Fifth, pro-cyclicality of discretionary fiscal policy is probably explained by lack of
access to credit during deep crises, rather than by profligate spending. And sixth, from a
structural perspective, both cyclically-adjusted balances and debt sustainability analysis confirm
the better position enjoyed by most countries in the region before the crisis.
Venues for continuing research include lifting restrictions and understanding the
implications of distinguishing cyclical and trend volatility. In a first stage, some hard
assumptions we made to apply the OECD methodology may be relaxed, in particular the unitary
elasticity of consumption taxes to the cycle, and the consideration of automatic stabilization via
expenditure. Additionally, alternative data sources of the distribution of tax payers
(administrative data) may be used as a robustness check of the results. Finally, it would be
interesting to identify in the tax revenues series the effects of tax and social security reforms
implemented since 1990, and to estimate their impact on elasticities.
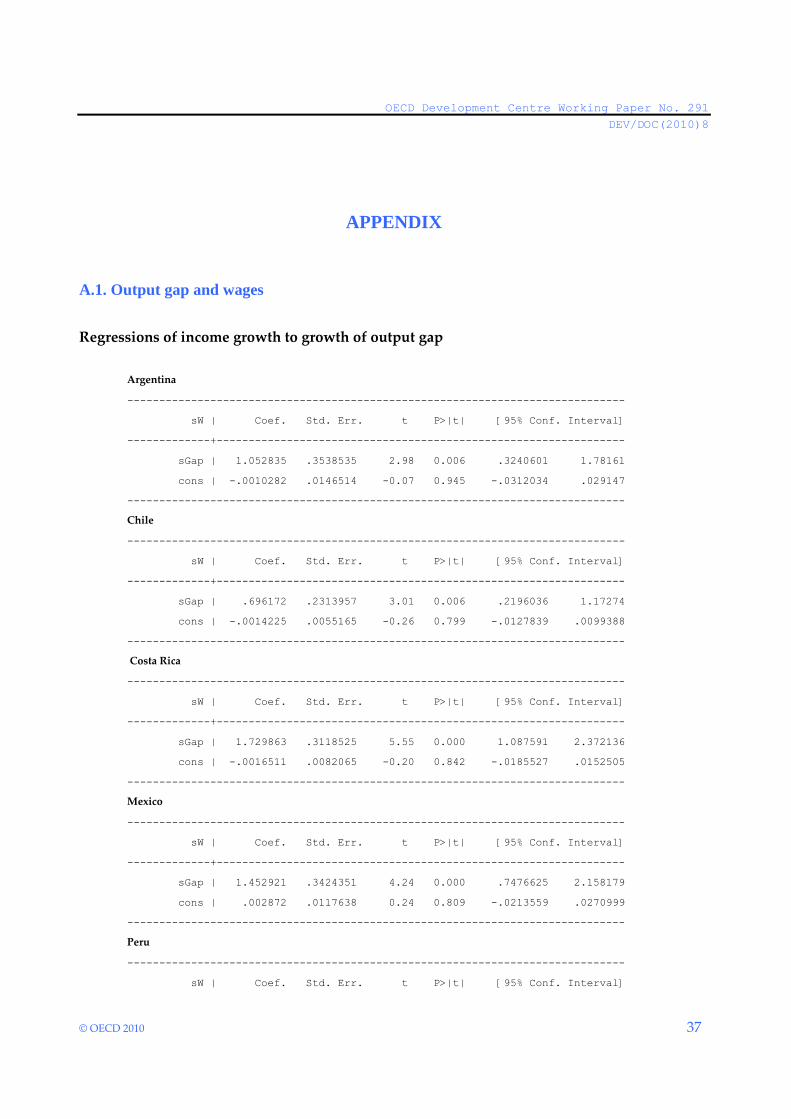
OECD Development Centre Working Paper No. 291
DEV/DOC(2010)8
© OECD 2010 37
APPENDIX
A.1. Output gap and wages
Regressions of income growth to growth of output gap
Argentina
------------------------------------------------------------------------------
sW | Coef. Std. Err. t P>|t| [95% Conf. Interval]
-------------+----------------------------------------------------------------
sGap | 1.052835 .3538535 2.98 0.006 .3240601 1.78161
cons | -.0010282 .0146514 -0.07 0.945 -.0312034 .029147
------------------------------------------------------------------------------
Chile
------------------------------------------------------------------------------
sW | Coef. Std. Err. t P>|t| [95% Conf. Interval]
-------------+----------------------------------------------------------------
sGap | .696172 .2313957 3.01 0.006 .2196036 1.17274
cons | -.0014225 .0055165 -0.26 0.799 -.0127839 .0099388
------------------------------------------------------------------------------
Costa Rica
------------------------------------------------------------------------------
sW | Coef. Std. Err. t P>|t| [95% Conf. Interval]
-------------+----------------------------------------------------------------
sGap | 1.729863 .3118525 5.55 0.000 1.087591 2.372136
cons | -.0016511 .0082065 -0.20 0.842 -.0185527 .0152505
------------------------------------------------------------------------------
Mexico
------------------------------------------------------------------------------
sW | Coef. Std. Err. t P>|t| [95% Conf. Interval]
-------------+----------------------------------------------------------------
sGap | 1.452921 .3424351 4.24 0.000 .7476625 2.158179
cons | .002872 .0117638 0.24 0.809 -.0213559 .0270999
------------------------------------------------------------------------------
Peru
------------------------------------------------------------------------------
sW | Coef. Std. Err. t P>|t| [95% Conf. Interval]
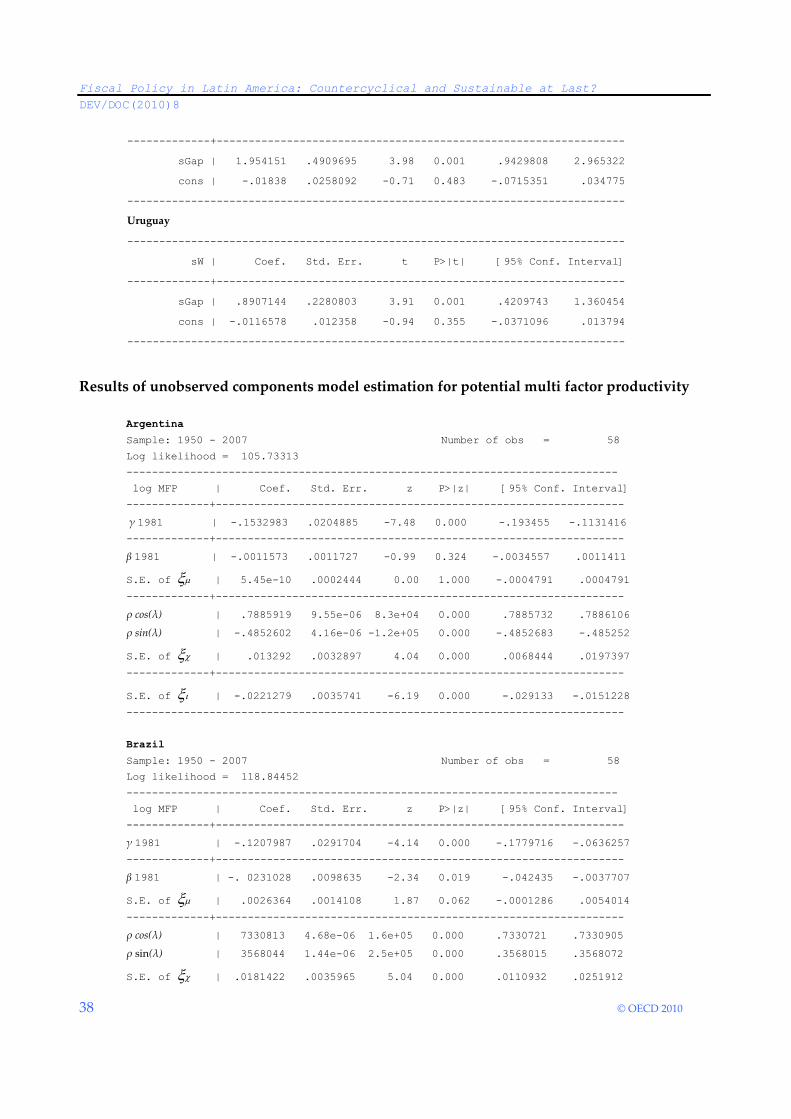
Fiscal Policy in Latin America: Countercyclical and Sustainable at Last?
DEV/DOC(2010)8
38 © OECD 2010
-------------+----------------------------------------------------------------
sGap | 1.954151 .4909695 3.98 0.001 .9429808 2.965322
cons | -.01838 .0258092 -0.71 0.483 -.0715351 .034775
------------------------------------------------------------------------------
Uruguay
------------------------------------------------------------------------------
sW | Coef. Std. Err. t P>|t| [95% Conf. Interval]
-------------+----------------------------------------------------------------
sGap | .8907144 .2280803 3.91 0.001 .4209743 1.360454
cons | -.0116578 .012358 -0.94 0.355 -.0371096 .013794
------------------------------------------------------------------------------
Results of unobserved components model estimation for potential multi factor productivity
Argentina
Sample: 1950 - 2007 Number of obs = 58
Log likelihood = 105.73313
-----------------------------------------------------------------------------
log MFP | Coef. Std. Err. z P>|z| [95% Conf. Interval]
-------------+----------------------------------------------------------------
γ 1981 | -.1532983 .0204885 -7.48 0.000 -.193455 -.1131416
-------------+----------------------------------------------------------------
β 1981 | -.0011573 .0011727 -0.99 0.324 -.0034557 .0011411
S.E. of | 5.45e-10 .0002444 0.00 1.000 -.0004791 .0004791
-------------+----------------------------------------------------------------
ρ cos(λ) | .7885919 9.55e-06 8.3e+04 0.000 .7885732 .7886106
ρ sin(λ) | -.4852602 4.16e-06 -1.2e+05 0.000 -.4852683 -.485252
S.E. of | .013292 .0032897 4.04 0.000 .0068444 .0197397
-------------+----------------------------------------------------------------
S.E. of | -.0221279 .0035741 -6.19 0.000 -.029133 -.0151228 ------------------------------------------------------------------------------
Brazil
Sample: 1950 - 2007 Number of obs = 58
Log likelihood = 118.84452
-----------------------------------------------------------------------------
log MFP | Coef. Std. Err. z P>|z| [95% Conf. Interval]
-------------+----------------------------------------------------------------
γ 1981 | -.1207987 .0291704 -4.14 0.000 -.1779716 -.0636257
-------------+----------------------------------------------------------------
β 1981 | -. 0231028 .0098635 -2.34 0.019 -.042435 -.0037707
S.E. of | .0026364 .0014108 1.87 0.062 -.0001286 .0054014 -------------+----------------------------------------------------------------
ρ cos(λ) | 7330813 4.68e-06 1.6e+05 0.000 .7330721 .7330905
ρ sin(λ) | 3568044 1.44e-06 2.5e+05 0.000 .3568015 .3568072
S.E. of | .0181422 .0035965 5.04 0.000 .0110932 .0251912
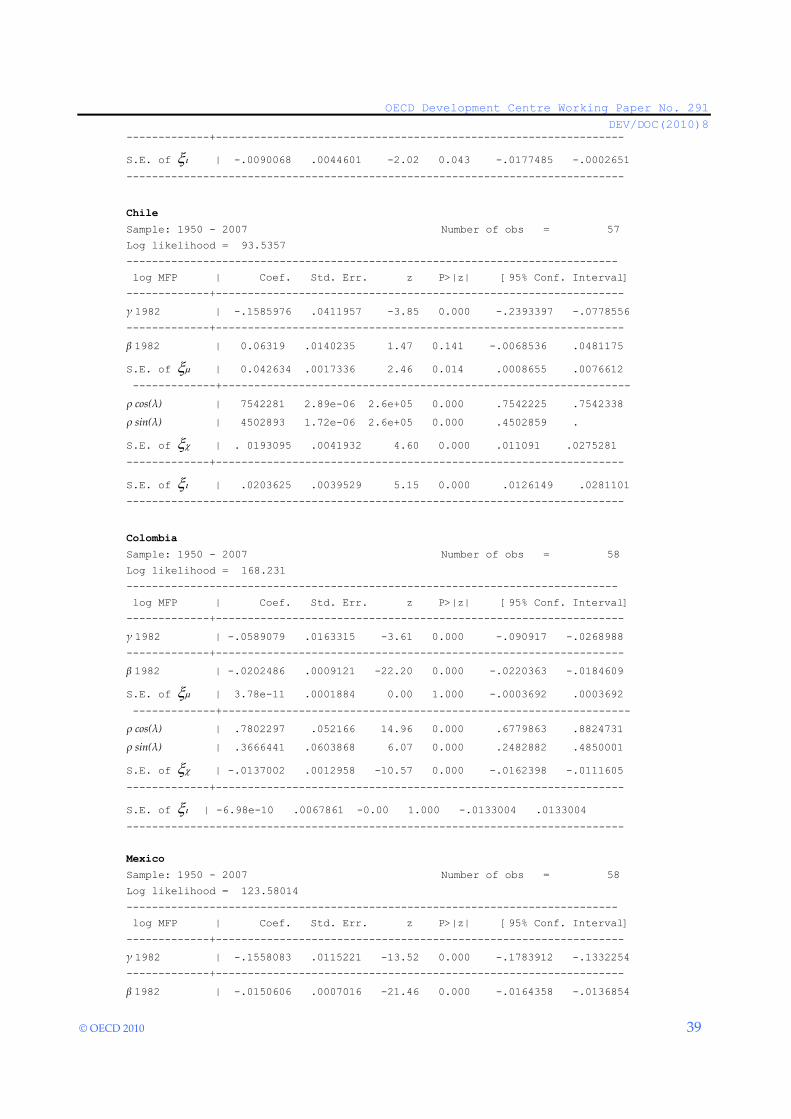
OECD Development Centre Working Paper No. 291
DEV/DOC(2010)8
© OECD 2010 39
-------------+----------------------------------------------------------------
S.E. of | -.0090068 .0044601 -2.02 0.043 -.0177485 -.0002651 ------------------------------------------------------------------------------
Chile
Sample: 1950 - 2007 Number of obs = 57
Log likelihood = 93.5357
-----------------------------------------------------------------------------
log MFP | Coef. Std. Err. z P>|z| [95% Conf. Interval]
-------------+----------------------------------------------------------------
γ 1982 | -.1585976 .0411957 -3.85 0.000 -.2393397 -.0778556
-------------+----------------------------------------------------------------
β 1982 | 0.06319 .0140235 1.47 0.141 -.0068536 .0481175
S.E. of | 0.042634 .0017336 2.46 0.014 .0008655 .0076612 -------------+----------------------------------------------------------------
ρ cos(λ) | 7542281 2.89e-06 2.6e+05 0.000 .7542225 .7542338
ρ sin(λ) | 4502893 1.72e-06 2.6e+05 0.000 .4502859 .
S.E. of | . 0193095 .0041932 4.60 0.000 .011091 .0275281
-------------+----------------------------------------------------------------
S.E. of | .0203625 .0039529 5.15 0.000 .0126149 .0281101 ------------------------------------------------------------------------------
Colombia
Sample: 1950 - 2007 Number of obs = 58
Log likelihood = 168.231
-----------------------------------------------------------------------------
log MFP | Coef. Std. Err. z P>|z| [95% Conf. Interval]
-------------+----------------------------------------------------------------
γ 1982 | -.0589079 .0163315 -3.61 0.000 -.090917 -.0268988
-------------+----------------------------------------------------------------
β 1982 | -.0202486 .0009121 -22.20 0.000 -.0220363 -.0184609
S.E. of | 3.78e-11 .0001884 0.00 1.000 -.0003692 .0003692 -------------+----------------------------------------------------------------
ρ cos(λ) | .7802297 .052166 14.96 0.000 .6779863 .8824731
ρ sin(λ) | .3666441 .0603868 6.07 0.000 .2482882 .4850001
S.E. of | -.0137002 .0012958 -10.57 0.000 -.0162398 -.0111605
-------------+----------------------------------------------------------------
S.E. of | -6.98e-10 .0067861 -0.00 1.000 -.0133004 .0133004 ------------------------------------------------------------------------------
Mexico
Sample: 1950 - 2007 Number of obs = 58
Log likelihood = 123.58014
-----------------------------------------------------------------------------
log MFP | Coef. Std. Err. z P>|z| [95% Conf. Interval]
-------------+----------------------------------------------------------------
γ 1982 | -.1558083 .0115221 -13.52 0.000 -.1783912 -.1332254
-------------+----------------------------------------------------------------
β 1982 | -.0150606 .0007016 -21.46 0.000 -.0164358 -.0136854

Fiscal Policy in Latin America: Countercyclical and Sustainable at Last?
DEV/DOC(2010)8
40 © OECD 2010
S.E. of | 9.95e-12 .0001558 0.00 1.000 -.0003054 .0003054 -------------+----------------------------------------------------------------
ρ cos(λ) | .7152843 2.40e-06 3.0e+05 0.000 .7152796 .715289
ρ sin(λ) | .6461949 4.06e-06 1.6e+05 0.000 .6462028 .6461869
S.E. of | .0047896 .0015288 3.13 0.002 .0077859 .0017933
-------------+----------------------------------------------------------------
S.E. of | -.019532 .002262 -8.63 0.000 -.0239654 -.0150986
------------------------------------------------------------------------------
Peru
Sample: 1950 - 2007 Number of obs = 58
Log likelihood = 89.85937
-----------------------------------------------------------------------------
log MFP | Coef. Std. Err. z P>|z| [95% Conf. Interval]
-------------+----------------------------------------------------------------
γ 1982 | -.0245013 .0455782 -0.54 0.591 -.1138329 .0648302
-------------+----------------------------------------------------------------
β 1982 | -.0336053 .0225792 -1.49 0.137 -.0778597 .0106492
S.E. of | .0076486 .002554 2.99 0.003 .0026427 .0126544 -------------+----------------------------------------------------------------
ρ cos(λ) | .6275314 2.78e-06 2.3e+05 0.000 .6275259 .6275368
ρ sin(λ) | .5331292 2.36e-06 2.3e+05 0.000 .5331246 .5331338.
S.E. of | .0298896 .0030726 9.73 0.000 .0359118 .0238673
-------------+----------------------------------------------------------------
S.E. of | 2.89e-32 .0116013 0.00 1.000 -.0227381 .0227381 -----------------------------------------------------------------------------
Uruguay
Sample: 1950 - 2007 Number of obs = 58
Log likelihood = 89.822777
-----------------------------------------------------------------------------
log MFP | Coef. Std. Err. z P>|z| [95% Conf. Interval]
-------------+----------------------------------------------------------------
γ 1982 | -.0956271 .0450603 -2.12 0.034 -.1839436 -.0073105
-------------+----------------------------------------------------------------
β 1982 | .0032569 .0192269 0.17 0.865 -.0344272 .040941
S.E. of | .0052465 .0025954 2.02 0.043 .0001596 .0103334 -------------+----------------------------------------------------------------
ρ cos(λ) | .7841392 3.36e-06 2.3e+05 0.000 .7841326 .7841458
ρ sin(λ) | .3442606 2.25e-06 1.5e+05 0.000 .3442562 .344265
S.E. of | .0352872 .0035362 9.98 0.000 .0283563 .0422181
-------------+----------------------------------------------------------------
S.E. of | 2.72e-07 .0103452 0.00 1.000 -.020276 .0202765 ------------------------------------------------------------------------------

OECD Development Centre Working Paper No. 291
DEV/DOC(2010)8
© OECD 2010 41
A.2. Tax rates
Figure A.1. Marginal personal income tax by income levels
(Percentage)
0.00
5.00
10.00
15.00
20.00
25.00
30.00
35.00
40.00
45.00
0.5 1 1.5 2 2.5 3
ARG CHL COL CRI MEX
PER URU SPA OECD
Note: Marginal tax rate by household labour income level. 1 represents the national average. OECD unweighted average,
excluding Chile and Mexico
Source: Authors’ calculations based on OECD Taxing Wages (Mexico), Ministries of Finance (Chile and Uruguay) and own
elaboration (Argentina, Colombia, Costa Rica and Peru)
Figure A.2. Average personal income tax by income levels
(Percentage)
0.00
5.00
10.00
15.00
20.00
25.00
30.00
0.25 0.75 1.25 1.75 2.25 2.75
ARG CHL COL CRI MEX
PER SPA URU OECD
Note: Average tax rate by household labour income level. 1 represents the national average. OECD unweighted average,
excluding Chile and Mexico
Source: Authors’ calculations based on OECD Taxing Wages (Mexico), Ministries of Finance (Chile and Uruguay) and own
elaboration (Argentina, Colombia, Costa Rica and Peru)

Fiscal Policy in Latin America: Countercyclical and Sustainable at Last?
DEV/DOC(2010)8
42 © OECD 2010
Figure A.3. Marginal social contribution tax by income levels
(Percentage)
0.00
5.00
10.00
15.00
20.00
25.00
30.00
35.00
40.00
45.00
0.1 0.6 1.1 1.6 2.1 2.6 3.1 3.6 4.1 4.6 5.1 5.6
ARG CHL COL CRI MEX PER URU
Note: Marginal tax rate by household labour income level. 1 represents the national average
Source: Authors’ calculations based on OECD Taxing Wages (Mexico), Ministries of Finance (Chile and Uruguay) and
own elaboration (Argentina, Colombia, Costa Rica and Peru)
Figure A.4. Average social contribution tax by income levels
(Percentage)
0.00
5.00
10.00
15.00
20.00
25.00
30.00
35.00
40.00
45.00
0.5 1 1.5 2 2.5 3
ARG COL CHL CRI MEX
PER URU SPA OECD
Note: Average tax rate by household labour income level. 1 represents the national average. OECD unweighted average,
excluding Chile and Mexico
Source: Authors’ calculations based on OECD Taxing Wages (Mexico), Ministries of Finance (Chile and Uruguay) and own
elaboration (Argentina, Colombia, Costa Rica and Peru)

OECD Development Centre Working Paper No. 291
DEV/DOC(2010)8
© OECD 2010 43
Table A.1. General government revenues (Percentage points of GDP)
Corporate Personal Indirect
Social
security Total
Non-tax
revenue Total
Argentina 3.5 1.5 11.6 3.8 20.4 2.8 23.2
Brazil 3.4 0.3 14.2 8.1 26.1 4.8 30.9
Chile 5.5 1.0 9.4 1.4 17.2 8.1 25.3
Colombia 5.7 0.2 5.6 2.2 15.6 12.6 28.2
Costa Rica 3.2 1.3 8.9 6.4 19.8 2.7 22.5
Mexico 2.3 2.0 3.7 1.3 9.3 13.3 22.6
Peru 5.2 1.4 7.0 1.6 15.1 3.1 18.2
Uruguay 2.6 1.9 10.1 6.2 20.8 6.2 27.0
France 2.2 9.0 15.1 18.5 44.7 4.6 49.4
Germany 0.8 9.8 12.0 18.6 41.1 3.1 44.2
Italy 2.5 11.2 14.5 13.1 41.3 2.6 44.0
Japan 2.9 4.6 8.3 10.6 26.3 1.5 27.8
Korea 3.1 4.0 12.8 4.7 24.5 3.1 27.7
Spain 3.4 7.2 12.0 13.7 36.2 2.7 38.9
United Kingdom 2.9 12.5 13.3 7.8 36.4 3.0 39.4
United States 2.1 9.1 7.3 7.0 25.4 4.9 30.4
Tax Current primary revenue
Note: Data is referred to 2003 for the OECD excluding Chile and Mexico, 2008 for Uruguay and 2006 for Latin America
Source: ECLAC-ILPES and IDB databases, and Girouard and André (2005)
Table A.2. Tax elasticities
Corporate Personal Indirect Social Security Total Total
Income Tax Income Tax Taxes Contributions over cyc-adj taxes over GDP
Argentina 0.83 3.61 1.00 1.08 1.16 0.27
Brazil 1.17 2.72 1.00 1.44 0.95 0.25
Chile 0.66 3.51 1.00 1.30 1.30 0.14
Colombia 0.96 2.65 1.00 0.55 0.94 0.14
Costa Rica 0.27 4.49 1.00 1.67 1.31 0.27
Mexico 0.69 2.95 1.00 0.76 1.29 0.13
Peru 0.38 5.33 1.00 1.94 1.54 0.18
Uruguay 1.18 2.85 1.00 0.95 1.17 0.25
LAC 0.69 3.61 1.00 1.28 1.22 0.19
Canada 1.55 1.10 1.00 0.56 1.03 0.34
France 1.59 1.18 1.00 0.79 0.98 0.49
Germany 1.53 1.61 1.00 0.57 0.96 0.44
Italy 1.12 1.79 1.00 0.86 1.18 0.40
Japan 1.65 1.17 1.00 0.55 0.92 0.39
Korea 1.52 1.40 1.00 0.51 1.04 0.25
Spain 1.15 1.92 1.00 0.68 1.08 0.39
United Kingdom 1.66 1.18 1.00 0.91 1.10 0.34
United States 1.53 1.30 1.00 0.64 1.05 0.24
OECD 1.47 1.21 1.00 0.71 1.02 0.40
Note: LAC unweighted average. OECD unweighted average, excluding Chile and Mexico
Source: Authors’ calculations for Argentina, Chile, Colombia, Costa Rica, Mexico and Uruguay, de Mello and Moccero
(2006) for Brazil, and Girouard and André (2005) for the rest

Fiscal Policy in Latin America: Countercyclical and Sustainable at Last?
DEV/DOC(2010)8
44 © OECD 2010
A.3. Commodity series
Argentina
We consider export taxes introduced in 2002 (‚Derechos de exportaciones‛). All data are
available at: http://www.mecon.gov.ar/sip/basehome/rectrib.htm
Prices come from the IMF commodity price database (food and energy indices) and are weighted
according to their importance in exports.
Chile
Corporate income tax paid by CODELCO
Transfers from CODELCO to the central government
Royalties paid by private mining firms
All these data come from DIPRES (www.dipres.cl). The price adjustment is based on a 10-year
rolling window average of copper prices from COCHILO (refined copper prices BML/LME in
US$).
Mexico
PEMEX net income
Royalties paid by private firms in the petrol sector to the federal government
Special tax on petrol related income
Specific net excise tax (IEPS)
All data come from the SHCP (www.apartados.hacienda.gob.mx). The price adjustment is based
on a 10-year rolling window oil prices from the IMF commodity price database.
Peru
Royalties paid by mining sector
Corporate income tax paid by mining and hydrocarbon sector, petrol refinery, fishing
sector, non-metal minerals
General Internal Sales Tax of same sectors
Prices are taken from the IMF commodity prices database (copper, fishmeal, oil and gold),
weighted by importance of sectors in revenues.

OECD Development Centre Working Paper No. 291
DEV/DOC(2010)8
© OECD 2010 45
REFERENCES
AGUIAR, M. AND G. GOPINATH (2007), ‚Emerging market business cycles: the cycle is the trend‛, Journal of
Political Economy 115 (1), pp. 69-102.
AVENDAÑO, R., H. REISEN AND J. SANTISO (2008), ‚The macro management of commodity booms: Africa and
Latin America’s response to Asian demand‛, OECD Development Centre Working Paper 270. OECD.
Paris.
CALVO, G.A. (1988), ‚Servicing the public debt: the role of expectations‛, American Economic Review 78(4), pp.
647-661.
COMITÉ TÉCNICO INTERINSTITUCIONAL (2010), Regla fiscal para Colombia. Banco de la República Ministerio de
Hacienda y Crédito Público y Departamento Nacional de Planeación. Bogotá.
DE MELLO, L. AND D. MOCCERO (2006), ‚Brazil fiscal stance during 1995-2005: The effect of indebtedness on
fiscal policy over the business cycle‛, OECD Economic Department Working Papers 485. OECD.
Paris.
FATAS, A. AND I. MIHOV (2001), ‚Government size and automatic stabilizers: international and intranational
evidence‛, Journal of International Economics 55(1), pp. 3-28.
GALI, J. (1994), ‚Government size and macroeconomic stability‛, European Economic Review 38(1), pp.117-132.
GAVIN, M. AND R. HAUSMANN (1998), ‚Fiscal performance in Latin America: what needs to be explained?‛. In
R. HAUSMANN AND K. FUKASAKU (eds.), Democracy, decentralisation and deficits in Latin America, pp.33-
64. Inter-American Development Bank and OECD Development Centre. Paris.
GAVIN, M. AND R. PEROTTI (1997), ‚Fiscal policy in Latin America‛, NBER Macroeconomics Annual 12, pp. 11-72
National Bureau of Economic Research.
GIROUARD, N. AND C. ANDRÉ (2005), ‚Measuring cyclically-adjusted budget balances for OECD countries‛,
OECD Economic Department Working Papers 434. OECD. Paris.
GOLLIN, D. (2002), ‚Getting income shares right‛, Journal of Political Economy 110(2), pp. 458-474.
HARVEY, A. C. (1989), Forecasting structural time series models and the Kalman filter, Cambridge University Press,
Cambridge.
HARVEY, A. AND A. JAEGER (1993), ‚Detrending, stylized facts, and the business cycle‛, Journal of Applied
Econometrics 8(3), pp. 231-247.
HARVEY, A. AND T. TRIMBUR (2008), ‚Trend estimation and the Hodrick-Prescott Filter‛, Journal of Japan
Statistical Society 38(1), pp 41-49.
HORTON, M., M. KUMAR AND P. MAURO (2009), ‚The state of public finances: a cross-country fiscal monitor‛.
IMF Staff Position Note SPN/09/21. International Monetary Fund. Washington DC.
ILZETZKI, E. AND C.A. VEGH (2008), ‚Procyclical fiscal policy in developing countries: Truth or fiction?," NBER
Working Papers 14191, National Bureau of Economic Research.
IMF (2009): Companion paper – The state of public finances: outlook and medium-term policies after the 2008 crisis.
March. International Monetary Fund. Washington DC.

Fiscal Policy in Latin America: Countercyclical and Sustainable at Last?
DEV/DOC(2010)8
46 © OECD 2010
IZQUIERDO, A. AND E. TALVI (2008), All that glitters may not be gold: assessing Latin America’s recent macroeconomic
performance. Inter-American Development Bank, Washington, DC.
KAMINSKY, G.L., C. M. REINHART AND C.A. VEGH (2004), ‚When it rains it pours: procyclical capital flows and
macroeconomic policies‛ NBER Macroeconomics Annual 19, pp.11-82. National Bureau of Economic
Research.
LOZANO, I. AND J. TORO (2007), ‚Fiscal policy throughout the business cycle: the Colombian experience‛,
Ensayos sobre Política Económica 25(55), pp. 12-39.
MARCEL, M., M. TOKMAN, R. VALDÉS AND P. BENAVIDES (2001), ‚Balance estructural del gobierno central.
Metodología y estimaciones para Chile: 1987 – 2000‛, Estudios de Finanza Públicas, Ministerio de
Hacienda, Gobierno de Chile, Santiago.
MARTNER, R. (2006), ‚Cyclical indicators of fiscal policy in Latin American Countries (with special reference to
Chile)‛. In D. Franco (ed.): Fiscal Indicators, pp.165-180. Banca d’Italia, Rome.
OECD (2001), Measuring Productivity - OECD Manual: Measurement of Aggregate and Industry-level Productivity
Growth. OECD, Paris.
OECD (2008), ‚The implications of supply-side uncertainties for economic policy‛, OECD Economic Outlook 83,
pp.209-230. OECD. Paris.
OECD (2009A), OECD Economic Outlook 85. OECD. Paris.
OECD (2009B), Latin American Economic Outlook 2010. OECD Development Centre. Paris.
RODRÍGUEZ, J., C. TOKMAN AND A. VEGA (2007), ‚Structural balance policy in Chile‛, OECD Journal on
Budgeting 7(2), pp.59-92.
SPILIMBERGO, A., S. SYMANSKY, O. BLANCHARD, AND C. COTARELLI (2008), ‚Fiscal policy for the crisis‛, IMF Staff
Position Note SPN/08/01. International Monetary Fund. Washington DC.
TALVI, E. AND C.A. VEGH (2005), ‚Tax base variability and pro-cyclical fiscal policy in developing countries,‛
Journal of Development Economics 78(1), pp.156-190.
VAN DEN NOORD, P. (2000), ‚The size and role of automatic fiscal stabilizers in the 1990s and beyond‛, OECD
Economic Department Working Papers 230, OECD, Paris.
VLADKOVA-HOLLAR, I. AND J. ZETTELMEYER (2008), ‚Fiscal positions in Latin America: have they really
improved?‛, IMF Working Paper WP/08/137. International Monetary Fund. Washington DC.

OECD Development Centre Working Paper No. 291
DEV/DOC(2010)8
© OECD 2010 47
OTHER TITLES IN THE SERIES/
AUTRES TITRES DANS LA SÉRIE
The former series known as ‚Technical Papers‛ and ‚Webdocs‛ merged in November 2003
into ‚Development Centre Working Papers‛. In the new series, former Webdocs 1-17 follow
former Technical Papers 1-212 as Working Papers 213-229.
All these documents may be downloaded from:
http://www.oecd.org/dev/wp or obtained via e-mail ([email protected]).
Working Paper No.1, Macroeconomic Adjustment and Income Distribution: A Macro-Micro Simulation Model, by François Bourguignon,
William H. Branson and Jaime de Melo, March 1989.
Working Paper No. 2, International Interactions in Food and Agricultural Policies: The Effect of Alternative Policies, by Joachim Zietz and
Alberto Valdés, April, 1989.
Working Paper No. 3, The Impact of Budget Retrenchment on Income Distribution in Indonesia: A Social Accounting Matrix Application, by
Steven Keuning and Erik Thorbecke, June 1989.
Working Paper No. 3a, Statistical Annex: The Impact of Budget Retrenchment, June 1989.
Document de travail No. 4, Le Rééquilibrage entre le secteur public et le secteur privé : le cas du Mexique, par C.-A. Michalet, juin 1989.
Working Paper No. 5, Rebalancing the Public and Private Sectors: The Case of Malaysia, by R. Leeds, July 1989.
Working Paper No. 6, Efficiency, Welfare Effects and Political Feasibility of Alternative Antipoverty and Adjustment Programs, by Alain de
Janvry and Elisabeth Sadoulet, December 1989.
Document de travail No. 7, Ajustement et distribution des revenus : application d’un modèle macro-micro au Maroc, par Christian Morrisson,
avec la collabouration de Sylvie Lambert et Akiko Suwa, décembre 1989.
Working Paper No. 8, Emerging Maize Biotechnologies and their Potential Impact, by W. Burt Sundquist, December 1989.
Document de travail No. 9, Analyse des variables socio-culturelles et de l’ajustement en Côte d’Ivoire, par W. Weekes-Vagliani, janvier 1990.
Working Paper No. 10, A Financial CompuTable General Equilibrium Model for the Analysis of Ecuador’s Stabilization Programs, by André
Fargeix and Elisabeth Sadoulet, February 1990.
Working Paper No. 11, Macroeconomic Aspects, Foreign Flows and Domestic Savings Performance in Developing Countries: A ”State of The
Art” Report, by Anand Chandavarkar, February 1990.
Working Paper No. 12, Tax Revenue Implications of the Real Exchange Rate: Econometric Evidence from Korea and Mexico, by Viriginia
Fierro and Helmut Reisen, February 1990.
Working Paper No. 13, Agricultural Growth and Economic Development: The Case of Pakistan, by Naved Hamid and Wouter Tims,
April 1990.
Working Paper No. 14, Rebalancing the Public and Private Sectors in Developing Countries: The Case of Ghana, by H. Akuoko-Frimpong,
June 1990.
Working Paper No. 15, Agriculture and the Economic Cycle: An Economic and Econometric Analysis with Special Reference to Brazil, by
Florence Contré and Ian Goldin, June 1990.
Working Paper No. 16, Comparative Advantage: Theory and Application to Developing Country Agriculture, by Ian Goldin, June 1990.
Working Paper No. 17, Biotechnology and Developing Country Agriculture: Maize in Brazil, by Bernardo Sorj and John Wilkinson,
June 1990.
Working Paper No. 18, Economic Policies and Sectoral Growth: Argentina 1913-1984, by Yair Mundlak, Domingo Cavallo, Roberto
Domenech, June 1990.
Working Paper No. 19, Biotechnology and Developing Country Agriculture: Maize In Mexico, by Jaime A. Matus Gardea, Arturo Puente
Gonzalez and Cristina Lopez Peralta, June 1990.
Working Paper No. 20, Biotechnology and Developing Country Agriculture: Maize in Thailand, by Suthad Setboonsarng, July 1990.

Fiscal Policy in Latin America: Countercyclical and Sustainable at Last?
DEV/DOC(2010)8
48 © OECD 2010
Working Paper No. 21, International Comparisons of Efficiency in Agricultural Production, by Guillermo Flichmann, July 1990.
Working Paper No. 22, Unemployment in Developing Countries: New Light on an Old Problem, by David Turnham and Denizhan Eröcal,
July 1990.
Working Paper No. 23, Optimal Currency Composition of Foreign Debt: the Case of Five Developing Countries, by Pier Giorgio Gawronski,
August 1990.
Working Paper No. 24, From Globalization to Regionalization: the Mexican Case, by Wilson Peres Núñez, August 1990.
Working Paper No. 25, Electronics and Development in Venezuela: A User-Oriented Strategy and its Policy Implications, by Carlota Perez,
October 1990.
Working Paper No. 26, The Legal Protection of Software: Implications for Latecomer Strategies in Newly Industrialising Economies (NIEs) and
Middle-Income Economies (MIEs), by Carlos Maria Correa, October 1990.
Working Paper No. 27, Specialization, Technical Change and Competitiveness in the Brazilian Electronics Industry, by Claudio R. Frischtak,
October 1990.
Working Paper No. 28, Internationalization Strategies of Japanese Electronics Companies: Implications for Asian Newly Industrializing
Economies (NIEs), by Bundo Yamada, October 1990.
Working Paper No. 29, The Status and an Evaluation of the Electronics Industry in Taiwan, by Gee San, October 1990.
Working Paper No. 30, The Indian Electronics Industry: Current Status, Perspectives and Policy Options, by Ghayur Alam, October 1990.
Working Paper No. 31, Comparative Advantage in Agriculture in Ghana, by James Pickett and E. Shaeeldin, October 1990.
Working Paper No. 32, Debt Overhang, Liquidity Constraints and Adjustment Incentives, by Bert Hofman and Helmut Reisen,
October 1990.
Working Paper No. 34, Biotechnology and Developing Country Agriculture: Maize in Indonesia, by Hidjat Nataatmadja et al., January 1991.
Working Paper No. 35, Changing Comparative Advantage in Thai Agriculture, by Ammar Siamwalla, Suthad Setboonsarng and Prasong
Werakarnjanapongs, March 1991.
Working Paper No. 36, Capital Flows and the External Financing of Turkey’s Imports, by Ziya Önis and Süleyman Özmucur, July 1991.
Working Paper No. 37, The External Financing of Indonesia’s Imports, by Glenn P. Jenkins and Henry B.F. Lim, July 1991.
Working Paper No. 38, Long-term Capital Reflow under Macroeconomic Stabilization in Latin America, by Beatriz Armendariz de Aghion,
July 1991.
Working Paper No. 39, Buybacks of LDC Debt and the Scope for Forgiveness, by Beatriz Armendariz de Aghion, July 1991.
Working Paper No. 40, Measuring and Modelling Non-Tariff Distortions with Special Reference to Trade in Agricultural Commodities, by
Peter J. Lloyd, July 1991.
Working Paper No. 41, The Changing Nature of IMF Conditionality, by Jacques J. Polak, August 1991.
Working Paper No. 42, Time-Varying Estimates on the Openness of the Capital Account in Korea and Taiwan, by Helmut Reisen and Hélène
Yèches, August 1991.
Working Paper No. 43, Toward a Concept of Development Agreements, by F. Gerard Adams, August 1991.
Document de travail No. 44, Le Partage du fardeau entre les créanciers de pays débiteurs défaillants, par Jean-Claude Berthélemy et Ann
Vourc’h, septembre 1991.
Working Paper No. 45, The External Financing of Thailand’s Imports, by Supote Chunanunthathum, October 1991.
Working Paper No. 46, The External Financing of Brazilian Imports, by Enrico Colombatto, with Elisa Luciano, Luca Gargiulo, Pietro
Garibaldi and Giuseppe Russo, October 1991.
Working Paper No. 47, Scenarios for the World Trading System and their Implications for Developing Countries, by Robert Z. Lawrence,
November 1991.
Working Paper No. 48, Trade Policies in a Global Context: Technical Specifications of the Rural/Urban-North/South (RUNS) Applied General
Equilibrium Model, by Jean-Marc Burniaux and Dominique van der Mensbrugghe, November 1991.
Working Paper No. 49, Macro-Micro Linkages: Structural Adjustment and Fertilizer Policy in Sub-Saharan Africa, by Jean-Marc Fontaine
with the collabouration of Alice Sindzingre, December 1991.
Working Paper No. 50, Aggregation by Industry in General Equilibrium Models with International Trade, by Peter J. Lloyd, December 1991.
Working Paper No. 51, Policy and Entrepreneurial Responses to the Montreal Protocol: Some Evidence from the Dynamic Asian Economies, by
David C. O’Connor, December 1991.
Working Paper No. 52, On the Pricing of LDC Debt: an Analysis Based on Historical Evidence from Latin America, by Beatriz Armendariz
de Aghion, February 1992.
Working Paper No. 53, Economic Regionalisation and Intra-Industry Trade: Pacific-Asian Perspectives, by Kiichiro Fukasaku,
February 1992.
Working Paper No. 54, Debt Conversions in Yugoslavia, by Mojmir Mrak, February 1992.
Working Paper No. 55, Evaluation of Nigeria’s Debt-Relief Experience (1985-1990), by N.E. Ogbe, March 1992.
Document de travail No. 56, L’Expérience de l’allégement de la dette du Mali, par Jean-Claude Berthélemy, février 1992.
Working Paper No. 57, Conflict or Indifference: US Multinationals in a World of Regional Trading Blocs, by Louis T. Wells, Jr., March 1992.
Working Paper No. 58, Japan’s Rapidly Emerging Strategy Toward Asia, by Edward J. Lincoln, April 1992.
Working Paper No. 59, The Political Economy of Stabilization Programmes in Developing Countries, by Bruno S. Frey and Reiner
Eichenberger, April 1992.

OECD Development Centre Working Paper No. 291
DEV/DOC(2010)8
© OECD 2010 49
Working Paper No. 60, Some Implications of Europe 1992 for Developing Countries, by Sheila Page, April 1992.
Working Paper No. 61, Taiwanese Corporations in Globalisation and Regionalisation, by Gee San, April 1992.
Working Paper No. 62, Lessons from the Family Planning Experience for Community-Based Environmental Education, by Winifred
Weekes-Vagliani, April 1992.
Working Paper No. 63, Mexican Agriculture in the Free Trade Agreement: Transition Problems in Economic Reform, by Santiago Levy and
Sweder van Wijnbergen, May 1992.
Working Paper No. 64, Offensive and Defensive Responses by European Multinationals to a World of Trade Blocs, by John M. Stopford,
May 1992.
Working Paper No. 65, Economic Integration in the Pacific Region, by Richard Drobnick, May 1992.
Working Paper No. 66, Latin America in a Changing Global Environment, by Winston Fritsch, May 1992.
Working Paper No. 67, An Assessment of the Brady Plan Agreements, by Jean-Claude Berthélemy and Robert Lensink, May 1992.
Working Paper No. 68, The Impact of Economic Reform on the Performance of the Seed Sector in Eastern and Southern Africa, by Elizabeth
Cromwell, June 1992.
Working Paper No. 69, Impact of Structural Adjustment and Adoption of Technology on Competitiveness of Major Cocoa Producing Countries,
by Emily M. Bloomfield and R. Antony Lass, June 1992.
Working Paper No. 70, Structural Adjustment and Moroccan Agriculture: an Assessment of the Reforms in the Sugar and Cereal Sectors, by
Jonathan Kydd and Sophie Thoyer, June 1992.
Document de travail No. 71, L’Allégement de la dette au Club de Paris : les évolutions récentes en perspective, par Ann Vourc’h, juin 1992.
Working Paper No. 72, Biotechnology and the Changing Public/Private Sector Balance: Developments in Rice and Cocoa, by Carliene Brenner,
July 1992.
Working Paper No. 73, Namibian Agriculture: Policies and Prospects, by Walter Elkan, Peter Amutenya, Jochbeth Andima, Robin
Sherbourne and Eline van der Linden, July 1992.
Working Paper No. 74, Agriculture and the Policy Environment: Zambia and Zimbabwe, by Doris J. Jansen and Andrew Rukovo,
July 1992.
Working Paper No. 75, Agricultural Productivity and Economic Policies: Concepts and Measurements, by Yair Mundlak, August 1992.
Working Paper No. 76, Structural Adjustment and the Institutional Dimensions of Agricultural Research and Development in Brazil: Soybeans,
Wheat and Sugar Cane, by John Wilkinson and Bernardo Sorj, August 1992.
Working Paper No. 77, The Impact of Laws and Regulations on Micro and Small Enterprises in Niger and Swaziland, by Isabelle Joumard,
Carl Liedholm and Donald Mead, September 1992.
Working Paper No. 78, Co-Financing Transactions between Multilateral Institutions and International Banks, by Michel Bouchet and Amit
Ghose, October 1992.
Document de travail No. 79, Allégement de la dette et croissance : le cas mexicain, par Jean-Claude Berthélemy et Ann Vourc’h,
octobre 1992.
Document de travail No. 80, Le Secteur informel en Tunisie : cadre réglementaire et pratique courante, par Abderrahman Ben Zakour et
Farouk Kria, novembre 1992.
Working Paper No. 81, Small-Scale Industries and Institutional Framework in Thailand, by Naruemol Bunjongjit and Xavier Oudin,
November 1992.
Working Paper No. 81a, Statistical Annex: Small-Scale Industries and Institutional Framework in Thailand, by Naruemol Bunjongjit and
Xavier Oudin, November 1992.
Document de travail No. 82, L’Expérience de l’allégement de la dette du Niger, par Ann Vourc’h et Maina Boukar Moussa, novembre 1992.
Working Paper No. 83, Stabilization and Structural Adjustment in Indonesia: an Intertemporal General Equilibrium Analysis, by David
Roland-Holst, November 1992.
Working Paper No. 84, Striving for International Competitiveness: Lessons from Electronics for Developing Countries, by Jan Maarten de Vet,
March 1993.
Document de travail No. 85, Micro-entreprises et cadre institutionnel en Algérie, par Hocine Benissad, mars 1993.
Working Paper No. 86, Informal Sector and Regulations in Ecuador and Jamaica, by Emilio Klein and Victor E. Tokman, August 1993.
Working Paper No. 87, Alternative Explanations of the Trade-Output Correlation in the East Asian Economies, by Colin I. Bradford Jr. and
Naomi Chakwin, August 1993.
Document de travail No. 88, La Faisabilité politique de l’ajustement dans les pays africains, par Christian Morrisson, Jean-Dominique Lafay
et Sébastien Dessus, novembre 1993.
Working Paper No. 89, China as a Leading Pacific Economy, by Kiichiro Fukasaku and Mingyuan Wu, November 1993.
Working Paper No. 90, A Detailed Input-Output Table for Morocco, 1990, by Maurizio Bussolo and David Roland-Holst November 1993.
Working Paper No. 91, International Trade and the Transfer of Environmental Costs and Benefits, by Hiro Lee and David Roland-Holst,
December 1993.
Working Paper No. 92, Economic Instruments in Environmental Policy: Lessons from the OECD Experience and their Relevance to Developing
Economies, by Jean-Philippe Barde, January 1994.
Working Paper No. 93, What Can Developing Countries Learn from OECD Labour Market Programmes and Policies?, by Åsa Sohlman with
David Turnham, January 1994.

Fiscal Policy in Latin America: Countercyclical and Sustainable at Last?
DEV/DOC(2010)8
50 © OECD 2010
Working Paper No. 94, Trade Liberalization and Employment Linkages in the Pacific Basin, by Hiro Lee and David Roland-Holst,
February 1994.
Working Paper No. 95, Participatory Development and Gender: Articulating Concepts and Cases, by Winifred Weekes-Vagliani,
February 1994.
Document de travail No. 96, Promouvoir la maîtrise locale et régionale du développement : une démarche participative à Madagascar, par
Philippe de Rham et Bernard Lecomte, juin 1994.
Working Paper No. 97, The OECD Green Model: an Updated Overview, by Hiro Lee, Joaquim Oliveira-Martins and Dominique van der
Mensbrugghe, August 1994.
Working Paper No. 98, Pension Funds, Capital Controls and Macroeconomic Stability, by Helmut Reisen and John Williamson,
August 1994.
Working Paper No. 99, Trade and Pollution Linkages: Piecemeal Reform and Optimal Intervention, by John Beghin, David Roland-Holst
and Dominique van der Mensbrugghe, October 1994.
Working Paper No. 100, International Initiatives in Biotechnology for Developing Country Agriculture: Promises and Problems, by Carliene
Brenner and John Komen, October 1994.
Working Paper No. 101, Input-based Pollution Estimates for Environmental Assessment in Developing Countries, by Sébastien Dessus,
David Roland-Holst and Dominique van der Mensbrugghe, October 1994.
Working Paper No. 102, Transitional Problems from Reform to Growth: Safety Nets and Financial Efficiency in the Adjusting Egyptian
Economy, by Mahmoud Abdel-Fadil, December 1994.
Working Paper No. 103, Biotechnology and Sustainable Agriculture: Lessons from India, by Ghayur Alam, December 1994.
Working Paper No. 104, Crop Biotechnology and Sustainability: a Case Study of Colombia, by Luis R. Sanint, January 1995.
Working Paper No. 105, Biotechnology and Sustainable Agriculture: the Case of Mexico, by José Luis Solleiro Rebolledo, January 1995.
Working Paper No. 106, Empirical Specifications for a General Equilibrium Analysis of Labour Market Policies and Adjustments, by Andréa
Maechler and David Roland-Holst, May 1995.
Document de travail No. 107, Les Migrants, partenaires de la coopération internationale : le cas des Maliens de France, par Christophe Daum,
juillet 1995.
Document de travail No. 108, Ouverture et croissance industrielle en Chine : étude empirique sur un échantillon de villes, par Sylvie
Démurger, septembre 1995.
Working Paper No. 109, Biotechnology and Sustainable Crop Production in Zimbabwe, by John J. Woodend, December 1995.
Document de travail No. 110, Politiques de l’environnement et libéralisation des échanges au Costa Rica : une vue d’ensemble, par Sébastien
Dessus et Maurizio Bussolo, février 1996.
Working Paper No. 111, Grow Now/Clean Later, or the Pursuit of Sustainable Development?, by David O’Connor, March 1996.
Working Paper No. 112, Economic Transition and Trade-Policy Reform: Lessons from China, by Kiichiro Fukasaku and Henri-Bernard
Solignac Lecomte, July 1996.
Working Paper No. 113, Chinese Outward Investment in Hong Kong: Trends, Prospects and Policy Implications, by Yun-Wing Sung,
July 1996.
Working Paper No. 114, Vertical Intra-industry Trade between China and OECD Countries, by Lisbeth Hellvin, July 1996.
Document de travail No. 115, Le Rôle du capital public dans la croissance des pays en développement au cours des années 80, par Sébastien
Dessus et Rémy Herrera, juillet 1996.
Working Paper No. 116, General Equilibrium Modelling of Trade and the Environment, by John Beghin, Sébastien Dessus, David Roland-
Holst and Dominique van der Mensbrugghe, September 1996.
Working Paper No. 117, Labour Market Aspects of State Enterprise Reform in Viet Nam, by David O’Connor, September 1996.
Document de travail No. 118, Croissance et compétitivité de l’industrie manufacturière au Sénégal, par Thierry Latreille et Aristomène
Varoudakis, octobre 1996.
Working Paper No. 119, Evidence on Trade and Wages in the Developing World, by Donald J. Robbins, December 1996.
Working Paper No. 120, Liberalising Foreign Investments by Pension Funds: Positive and Normative Aspects, by Helmut Reisen,
January 1997.
Document de travail No. 121, Capital Humain, ouverture extérieure et croissance : estimation sur données de panel d’un modèle à coefficients
variables, par Jean-Claude Berthélemy, Sébastien Dessus et Aristomène Varoudakis, janvier 1997.
Working Paper No. 122, Corruption: The Issues, by Andrew W. Goudie and David Stasavage, January 1997.
Working Paper No. 123, Outflows of Capital from China, by David Wall, March 1997.
Working Paper No. 124, Emerging Market Risk and Sovereign Credit Ratings, by Guillermo Larraín, Helmut Reisen and Julia von
Maltzan, April 1997.
Working Paper No. 125, Urban Credit Co-operatives in China, by Eric Girardin and Xie Ping, August 1997.
Working Paper No. 126, Fiscal Alternatives of Moving from Unfunded to Funded Pensions, by Robert Holzmann, August 1997.
Working Paper No. 127, Trade Strategies for the Southern Mediterranean, by Peter A. Petri, December 1997.
Working Paper No. 128, The Case of Missing Foreign Investment in the Southern Mediterranean, by Peter A. Petri, December 1997.
Working Paper No. 129, Economic Reform in Egypt in a Changing Global Economy, by Joseph Licari, December 1997.
OECD Development Centre Working Paper No. 291
DEV/DOC(2010)8
© OECD 2010 51
Working Paper No. 130, Do Funded Pensions Contribute to Higher Aggregate Savings? A Cross-Country Analysis, by Jeanine Bailliu and
Helmut Reisen, December 1997.
Working Paper No. 131, Long-run Growth Trends and Convergence Across Indian States, by Rayaprolu Nagaraj, Aristomène Varoudakis
and Marie-Ange Véganzonès, January 1998.
Working Paper No. 132, Sustainable and Excessive Current Account Deficits, by Helmut Reisen, February 1998.
Working Paper No. 133, Intellectual Property Rights and Technology Transfer in Developing Country Agriculture: Rhetoric and Reality, by
Carliene Brenner, March 1998.
Working Paper No. 134, Exchange-rate Management and Manufactured Exports in Sub-Saharan Africa, by Khalid Sekkat and Aristomène
Varoudakis, March 1998.
Working Paper No. 135, Trade Integration with Europe, Export Diversification and Economic Growth in Egypt, by Sébastien Dessus and
Akiko Suwa-Eisenmann, June 1998.
Working Paper No. 136, Domestic Causes of Currency Crises: Policy Lessons for Crisis Avoidance, by Helmut Reisen, June 1998.
Working Paper No. 137, A Simulation Model of Global Pension Investment, by Landis MacKellar and Helmut Reisen, August 1998.
Working Paper No. 138, Determinants of Customs Fraud and Corruption: Evidence from Two African Countries, by David Stasavage and
Cécile Daubrée, August 1998.
Working Paper No. 139, State Infrastructure and Productive Performance in Indian Manufacturing, by Arup Mitra, Aristomène Varoudakis
and Marie-Ange Véganzonès, August 1998.
Working Paper No. 140, Rural Industrial Development in Viet Nam and China: A Study in Contrasts, by David O’Connor, September 1998.
Working Paper No. 141,Labour Market Aspects of State Enterprise Reform in China, by Fan Gang,Maria Rosa Lunati and David
O’Connor, October 1998.
Working Paper No. 142, Fighting Extreme Poverty in Brazil: The Influence of Citizens’ Action on Government Policies, by Fernanda Lopes
de Carvalho, November 1998.
Working Paper No. 143, How Bad Governance Impedes Poverty Alleviation in Bangladesh, by Rehman Sobhan, November 1998.
Document de travail No. 144, La libéralisation de l’agriculture tunisienne et l’Union européenne: une vue prospective, par Mohamed
Abdelbasset Chemingui et Sébastien Dessus, février 1999.
Working Paper No. 145, Economic Policy Reform and Growth Prospects in Emerging African Economies, by Patrick Guillaumont, Sylviane
Guillaumont Jeanneney and Aristomène Varoudakis, March 1999.
Working Paper No. 146, Structural Policies for International Competitiveness in Manufacturing: The Case of Cameroon, by Ludvig Söderling,
March 1999.
Working Paper No. 147, China’s Unfinished Open-Economy Reforms: Liberalisation of Services, by Kiichiro Fukasaku, Yu Ma and Qiumei
Yang, April 1999.
Working Paper No. 148, Boom and Bust and Sovereign Ratings, by Helmut Reisen and Julia von Maltzan, June 1999.
Working Paper No. 149, Economic Opening and the Demand for Skills in Developing Countries: A Review of Theory and Evidence, by David
O’Connor and Maria Rosa Lunati, June 1999.
Working Paper No. 150, The Role of Capital Accumulation, Adjustment and Structural Change for Economic Take-off: Empirical Evidence from
African Growth Episodes, by Jean-Claude Berthélemy and Ludvig Söderling, July 1999.
Working Paper No. 151, Gender, Human Capital and Growth: Evidence from Six Latin American Countries, by Donald J. Robbins,
September 1999.
Working Paper No. 152, The Politics and Economics of Transition to an Open Market Economy in Viet Nam, by James Riedel and William
S. Turley, September 1999.
Working Paper No. 153, The Economics and Politics of Transition to an Open Market Economy: China, by Wing Thye Woo, October 1999.
Working Paper No. 154, Infrastructure Development and Regulatory Reform in Sub-Saharan Africa: The Case of Air Transport, by Andrea
E. Goldstein, October 1999.
Working Paper No. 155, The Economics and Politics of Transition to an Open Market Economy: India, by Ashok V. Desai, October 1999.
Working Paper No. 156, Climate Policy Without Tears: CGE-Based Ancillary Benefits Estimates for Chile, by Sébastien Dessus and David
O’Connor, November 1999.
Document de travail No. 157, Dépenses d’éducation, qualité de l’éducation et pauvreté : l’exemple de cinq pays d’Afrique francophone, par
Katharina Michaelowa, avril 2000.
Document de travail No. 158, Une estimation de la pauvreté en Afrique subsaharienne d’après les données anthropométriques, par Christian
Morrisson, Hélène Guilmeau et Charles Linskens, mai 2000.
Working Paper No. 159, Converging European Transitions, by Jorge Braga de Macedo, July 2000.
Working Paper No. 160, Capital Flows and Growth in Developing Countries: Recent Empirical Evidence, by Marcelo Soto, July 2000.
Working Paper No. 161, Global Capital Flows and the Environment in the 21st Century, by David O’Connor, July 2000.
Working Paper No. 162, Financial Crises and International Architecture: A “Eurocentric” Perspective, by Jorge Braga de Macedo,
August 2000.
Document de travail No. 163, Résoudre le problème de la dette : de l’initiative PPTE à Cologne, par Anne Joseph, août 2000.
Working Paper No. 164, E-Commerce for Development: Prospects and Policy Issues, by Andrea Goldstein and David O’Connor,
September 2000.

Fiscal Policy in Latin America: Countercyclical and Sustainable at Last?
DEV/DOC(2010)8
52 © OECD 2010
Working Paper No. 165, Negative Alchemy? Corruption and Composition of Capital Flows, by Shang-Jin Wei, October 2000.
Working Paper No. 166, The HIPC Initiative: True and False Promises, by Daniel Cohen, October 2000.
Document de travail No. 167, Les facteurs explicatifs de la malnutrition en Afrique subsaharienne, par Christian Morrisson et Charles
Linskens, octobre 2000.
Working Paper No. 168, Human Capital and Growth: A Synthesis Report, by Christopher A. Pissarides, November 2000.
Working Paper No. 169, Obstacles to Expanding Intra-African Trade, by Roberto Longo and Khalid Sekkat, March 2001.
Working Paper No. 170, Regional Integration In West Africa, by Ernest Aryeetey, March 2001.
Working Paper No. 171, Regional Integration Experience in the Eastern African Region, by Andrea Goldstein and Njuguna S. Ndung’u,
March 2001.
Working Paper No. 172, Integration and Co-operation in Southern Africa, by Carolyn Jenkins, March 2001.
Working Paper No. 173, FDI in Sub-Saharan Africa, by Ludger Odenthal, March 2001
Document de travail No. 174, La réforme des télécommunications en Afrique subsaharienne, par Patrick Plane, mars 2001.
Working Paper No. 175, Fighting Corruption in Customs Administration: What Can We Learn from Recent Experiences?, by Irène Hors;
April 2001.
Working Paper No. 176, Globalisation and Transformation: Illusions and Reality, by Grzegorz W. Kolodko, May 2001.
Working Paper No. 177, External Solvency, Dollarisation and Investment Grade: Towards a Virtuous Circle?, by Martin Grandes, June 2001.
Document de travail No. 178, Congo 1965-1999: Les espoirs déçus du « Brésil africain », par Joseph Maton avec Henri-Bernard Solignac
Lecomte, septembre 2001.
Working Paper No. 179, Growth and Human Capital: Good Data, Good Results, by Daniel Cohen and Marcelo Soto, September 2001.
Working Paper No. 180, Corporate Governance and National Development, by Charles P. Oman, October 2001.
Working Paper No. 181, How Globalisation Improves Governance, by Federico Bonaglia, Jorge Braga de Macedo and Maurizio Bussolo,
November 2001.
Working Paper No. 182, Clearing the Air in India: The Economics of Climate Policy with Ancillary Benefits, by Maurizio Bussolo and David
O’Connor, November 2001.
Working Paper No. 183, Globalisation, Poverty and Inequality in sub-Saharan Africa: A Political Economy Appraisal, by Yvonne M. Tsikata,
December 2001.
Working Paper No. 184, Distribution and Growth in Latin America in an Era of Structural Reform: The Impact of Globalisation, by Samuel
A. Morley, December 2001.
Working Paper No. 185, Globalisation, Liberalisation, Poverty and Income Inequality in Southeast Asia, by K.S. Jomo, December 2001.
Working Paper No. 186, Globalisation, Growth and Income Inequality: The African Experience, by Steve Kayizzi-Mugerwa, December 2001.
Working Paper No. 187, The Social Impact of Globalisation in Southeast Asia, by Mari Pangestu, December 2001.
Working Paper No. 188, Where Does Inequality Come From? Ideas and Implications for Latin America, by James A. Robinson,
December 2001.
Working Paper No. 189, Policies and Institutions for E-Commerce Readiness: What Can Developing Countries Learn from OECD Experience?,
by Paulo Bastos Tigre and David O’Connor, April 2002.
Document de travail No. 190, La réforme du secteur financier en Afrique, par Anne Joseph, juillet 2002.
Working Paper No. 191, Virtuous Circles? Human Capital Formation, Economic Development and the Multinational Enterprise, by Ethan
B. Kapstein, August 2002.
Working Paper No. 192, Skill Upgrading in Developing Countries: Has Inward Foreign Direct Investment Played a Role?, by Matthew
J. Slaughter, August 2002.
Working Paper No. 193, Government Policies for Inward Foreign Direct Investment in Developing Countries: Implications for Human Capital
Formation and Income Inequality, by Dirk Willem te Velde, August 2002.
Working Paper No. 194, Foreign Direct Investment and Intellectual Capital Formation in Southeast Asia, by Bryan K. Ritchie, August 2002.
Working Paper No. 195, FDI and Human Capital: A Research Agenda, by Magnus Blomström and Ari Kokko, August 2002.
Working Paper No. 196, Knowledge Diffusion from Multinational Enterprises: The Role of Domestic and Foreign Knowledge-Enhancing
Activities, by Yasuyuki Todo and Koji Miyamoto, August 2002.
Working Paper No. 197, Why Are Some Countries So Poor? Another Look at the Evidence and a Message of Hope, by Daniel Cohen and
Marcelo Soto, October 2002.
Working Paper No. 198, Choice of an Exchange-Rate Arrangement, Institutional Setting and Inflation: Empirical Evidence from Latin America,
by Andreas Freytag, October 2002.
Working Paper No. 199, Will Basel II Affect International Capital Flows to Emerging Markets?, by Beatrice Weder and Michael Wedow,
October 2002.
Working Paper No. 200, Convergence and Divergence of Sovereign Bond Spreads: Lessons from Latin America, by Martin Grandes,
October 2002.
Working Paper No. 201, Prospects for Emerging-Market Flows amid Investor Concerns about Corporate Governance, by Helmut Reisen,
November 2002.
Working Paper No. 202, Rediscovering Education in Growth Regressions, by Marcelo Soto, November 2002.
OECD Development Centre Working Paper No. 291
DEV/DOC(2010)8
© OECD 2010 53
Working Paper No. 203, Incentive Bidding for Mobile Investment: Economic Consequences and Potential Responses, by Andrew Charlton,
January 2003.
Working Paper No. 204, Health Insurance for the Poor? Determinants of participation Community-Based Health Insurance Schemes in Rural
Senegal, by Johannes Jütting, January 2003.
Working Paper No. 205, China’s Software Industry and its Implications for India, by Ted Tschang, February 2003.
Working Paper No. 206, Agricultural and Human Health Impacts of Climate Policy in China: A General Equilibrium Analysis with Special
Reference to Guangdong, by David O’Connor, Fan Zhai, Kristin Aunan, Terje Berntsen and Haakon Vennemo, March 2003.
Working Paper No. 207, India’s Information Technology Sector: What Contribution to Broader Economic Development?, by Nirvikar Singh,
March 2003.
Working Paper No. 208, Public Procurement: Lessons from Kenya, Tanzania and Uganda, by Walter Odhiambo and Paul Kamau,
March 2003.
Working Paper No. 209, Export Diversification in Low-Income Countries: An International Challenge after Doha, by Federico Bonaglia and
Kiichiro Fukasaku, June 2003.
Working Paper No. 210, Institutions and Development: A Critical Review, by Johannes Jütting, July 2003.
Working Paper No. 211, Human Capital Formation and Foreign Direct Investment in Developing Countries, by Koji Miyamoto, July 2003.
Working Paper No. 212, Central Asia since 1991: The Experience of the New Independent States, by Richard Pomfret, July 2003.
Working Paper No. 213, A Multi-Region Social Accounting Matrix (1995) and Regional Environmental General Equilibrium Model for India
(REGEMI), by Maurizio Bussolo, Mohamed Chemingui and David O’Connor, November 2003.
Working Paper No. 214, Ratings Since the Asian Crisis, by Helmut Reisen, November 2003.
Working Paper No. 215, Development Redux: Reflections for a New Paradigm, by Jorge Braga de Macedo, November 2003.
Working Paper No. 216, The Political Economy of Regulatory Reform: Telecoms in the Southern Mediterranean, by Andrea Goldstein,
November 2003.
Working Paper No. 217, The Impact of Education on Fertility and Child Mortality: Do Fathers Really Matter Less than Mothers?, by Lucia
Breierova and Esther Duflo, November 2003.
Working Paper No. 218, Float in Order to Fix? Lessons from Emerging Markets for EU Accession Countries, by Jorge Braga de Macedo and
Helmut Reisen, November 2003.
Working Paper No. 219, Globalisation in Developing Countries: The Role of Transaction Costs in Explaining Economic Performance in India,
by Maurizio Bussolo and John Whalley, November 2003.
Working Paper No. 220, Poverty Reduction Strategies in a Budget-Constrained Economy: The Case of Ghana, by Maurizio Bussolo and
Jeffery I. Round, November 2003.
Working Paper No. 221, Public-Private Partnerships in Development: Three Applications in Timor Leste, by José Braz, November 2003.
Working Paper No. 222, Public Opinion Research, Global Education and Development Co-operation Reform: In Search of a Virtuous Circle, by Ida
Mc Donnell, Henri-Bernard Solignac Lecomte and Liam Wegimont, November 2003.
Working Paper No. 223, Building Capacity to Trade: What Are the Priorities?, by Henry-Bernard Solignac Lecomte, November 2003.
Working Paper No. 224, Of Flying Geeks and O-Rings: Locating Software and IT Services in India’s Economic Development, by David
O’Connor, November 2003.
Document de travail No. 225, Cap Vert: Gouvernance et Développement, par Jaime Lourenço and Colm Foy, novembre 2003.
Working Paper No. 226, Globalisation and Poverty Changes in Colombia, by Maurizio Bussolo and Jann Lay, November 2003.
Working Paper No. 227, The Composite Indicator of Economic Activity in Mozambique (ICAE): Filling in the Knowledge Gaps to Enhance
Public-Private Partnership (PPP), by Roberto J. Tibana, November 2003.
Working Paper No. 228, Economic-Reconstruction in Post-Conflict Transitions: Lessons for the Democratic Republic of Congo (DRC), by
Graciana del Castillo, November 2003.
Working Paper No. 229, Providing Low-Cost Information Technology Access to Rural Communities In Developing Countries: What Works?
What Pays? by Georg Caspary and David O’Connor, November 2003.
Working Paper No. 230, The Currency Premium and Local-Currency Denominated Debt Costs in South Africa, by Martin Grandes, Marcel
Peter and Nicolas Pinaud, December 2003.
Working Paper No. 231, Macroeconomic Convergence in Southern Africa: The Rand Zone Experience, by Martin Grandes, December 2003.
Working Paper No. 232, Financing Global and Regional Public Goods through ODA: Analysis and Evidence from the OECD Creditor
Reporting System, by Helmut Reisen, Marcelo Soto and Thomas Weithöner, January 2004.
Working Paper No. 233, Land, Violent Conflict and Development, by Nicolas Pons-Vignon and Henri-Bernard Solignac Lecomte,
February 2004.
Working Paper No. 234, The Impact of Social Institutions on the Economic Role of Women in Developing Countries, by Christian Morrisson
and Johannes Jütting, May 2004.
Document de travail No. 235, La condition desfemmes en Inde, Kenya, Soudan et Tunisie, par Christian Morrisson, août 2004.
Working Paper No. 236, Decentralisation and Poverty in Developing Countries: Exploring the Impact, by Johannes Jütting,
Céline Kauffmann, Ida Mc Donnell, Holger Osterrieder, Nicolas Pinaud and Lucia Wegner, August 2004.
Working Paper No. 237, Natural Disasters and Adaptive Capacity, by Jeff Dayton-Johnson, August 2004.
Fiscal Policy in Latin America: Countercyclical and Sustainable at Last?
DEV/DOC(2010)8
54 © OECD 2010
Working Paper No. 238, Public Opinion Polling and the Millennium Development Goals, by Jude Fransman, Alphonse L. MacDonnald,
Ida Mc Donnell and Nicolas Pons-Vignon, October 2004.
Working Paper No. 239, Overcoming Barriers to Competitiveness, by Orsetta Causa and Daniel Cohen, December 2004.
Working Paper No. 240, Extending Insurance? Funeral Associations in Ethiopia and Tanzania, by Stefan Dercon, Tessa Bold, Joachim
De Weerdt and Alula Pankhurst, December 2004.
Working Paper No. 241, Macroeconomic Policies: New Issues of Interdependence, by Helmut Reisen, Martin Grandes and Nicolas Pinaud,
January 2005.
Working Paper No. 242, Institutional Change and its Impact on the Poor and Excluded: The Indian Decentralisation Experience, by
D. Narayana, January 2005.
Working Paper No. 243, Impact of Changes in Social Institutions on Income Inequality in China, by Hiroko Uchimura, May 2005.
Working Paper No. 244, Priorities in Global Assistance for Health, AIDS and Population (HAP), by Landis MacKellar, June 2005.
Working Paper No. 245, Trade and Structural Adjustment Policies in Selected Developing Countries, by Jens Andersson, Federico Bonaglia,
Kiichiro Fukasaku and Caroline Lesser, July 2005.
Working Paper No. 246, Economic Growth and Poverty Reduction: Measurement and Policy Issues, by Stephan Klasen, (September 2005).
Working Paper No. 247, Measuring Gender (In)Equality: Introducing the Gender, Institutions and Development Data Base (GID),
by Johannes P. Jütting, Christian Morrisson, Jeff Dayton-Johnson and Denis Drechsler (March 2006).
Working Paper No. 248, Institutional Bottlenecks for Agricultural Development: A Stock-Taking Exercise Based on Evidence from Sub-Saharan
Africa by Juan R. de Laiglesia, March 2006.
Working Paper No. 249, Migration Policy and its Interactions with Aid, Trade and Foreign Direct Investment Policies: A Background Paper, by
Theodora Xenogiani, June 2006.
Working Paper No. 250, Effects of Migration on Sending Countries: What Do We Know? by Louka T. Katseli, Robert E.B. Lucas and
Theodora Xenogiani, June 2006.
Document de travail No. 251, L’aide au développement et les autres flux nord-sud : complémentarité ou substitution ?, par Denis Cogneau et
Sylvie Lambert, juin 2006.
Working Paper No. 252, Angel or Devil? China’s Trade Impact on Latin American Emerging Markets, by Jorge Blázquez-Lidoy, Javier
Rodríguez and Javier Santiso, June 2006.
Working Paper No. 253, Policy Coherence for Development: A Background Paper on Foreign Direct Investment, by Thierry Mayer, July 2006.
Working Paper No. 254, The Coherence of Trade Flows and Trade Policies with Aid and Investment Flows, by Akiko Suwa-Eisenmann and
Thierry Verdier, August 2006.
Document de travail No. 255, Structures familiales, transferts et épargne : examen, par Christian Morrisson, août 2006.
Working Paper No. 256, Ulysses, the Sirens and the Art of Navigation: Political and Technical Rationality in Latin America, by Javier Santiso
and Laurence Whitehead, September 2006.
Working Paper No. 257, Developing Country Multinationals: South-South Investment Comes of Age, by Dilek Aykut and Andrea
Goldstein, November 2006.
Working Paper No. 258, The Usual Suspects: A Primer on Investment Banks’ Recommendations and Emerging Markets, by Sebastián Nieto-
Parra and Javier Santiso, January 2007.
Working Paper No. 259, Banking on Democracy: The Political Economy of International Private Bank Lending in Emerging Markets, by Javier
Rodríguez and Javier Santiso, March 2007.
Working Paper No. 260, New Strategies for Emerging Domestic Sovereign Bond Markets, by Hans Blommestein and Javier Santiso, April
2007.
Working Paper No. 261, Privatisation in the MEDA region. Where do we stand?, by Céline Kauffmann and Lucia Wegner, July 2007.
Working Paper No. 262, Strengthening Productive Capacities in Emerging Economies through Internationalisation: Evidence from the
Appliance Industry, by Federico Bonaglia and Andrea Goldstein, July 2007.
Working Paper No. 263, Banking on Development: Private Banks and Aid Donors in Developing Countries, by Javier Rodríguez and Javier
Santiso, November 2007.
Working Paper No. 264, Fiscal Decentralisation, Chinese Style: Good for Health Outcomes?, by Hiroko Uchimura and Johannes Jütting,
November 2007.
Working Paper No. 265, Private Sector Participation and Regulatory Reform in Water supply: the Southern Mediterranean Experience, by
Edouard Pérard, January 2008.
Working Paper No. 266, Informal Employment Re-loaded, by Johannes Jütting, Jante Parlevliet and Theodora Xenogiani, January 2008.
Working Paper No. 267, Household Structures and Savings: Evidence from Household Surveys, by Juan R. de Laiglesia and Christian
Morrisson, January 2008.
Working Paper No. 268, Prudent versus Imprudent Lending to Africa: From Debt Relief to Emerging Lenders, by Helmut Reisen and Sokhna
Ndoye, February 2008.
Working Paper No. 269, Lending to the Poorest Countries: A New Counter-Cyclical Debt Instrument, by Daniel Cohen, Hélène Djoufelkit-
Cottenet, Pierre Jacquet and Cécile Valadier, April 2008.
Working Paper No.270, The Macro Management of Commodity Booms: Africa and Latin America’s Response to Asian Demand, by Rolando
Avendaño, Helmut Reisen and Javier Santiso, August 2008.
OECD Development Centre Working Paper No. 291
DEV/DOC(2010)8
© OECD 2010 55
Working Paper No. 271, Report on Informal Employment in Romania, by Jante Parlevliet and Theodora Xenogiani, July 2008.
Working Paper No. 272, Wall Street and Elections in Latin American Emerging Democracies, by Sebastián Nieto-Parra and Javier Santiso,
October 2008. Working Paper No. 273, Aid Volatility and Macro Risks in LICs, by Eduardo Borensztein, Julia Cage, Daniel Cohen and Cécile Valadier,
November 2008.
Working Paper No. 274, Who Saw Sovereign Debt Crises Coming?, by Sebastián Nieto-Parra, November 2008.
Working Paper No. 275, Development Aid and Portfolio Funds: Trends, Volatility and Fragmentation, by Emmanuel Frot and Javier Santiso,
December 2008.
Working Paper No. 276, Extracting the Maximum from EITI, by Dilan Ölcer, February 2009.
Working Paper No. 277, Taking Stock of the Credit Crunch: Implications for Development Finance and Global Governance, by Andrew Mold,
Sebastian Paulo and Annalisa Prizzon, March 2009.
Working Paper No. 278, Are All Migrants Really Worse Off in Urban Labour Markets? New Empirical Evidence from China, by Jason
Gagnon, Theodora Xenogiani and Chunbing Xing, June 2009.
Working Paper No. 279, Herding in Aid Allocation, by Emmanuel Frot and Javier Santiso, June 2009.
Working Paper No. 280, Coherence of Development Policies: Ecuador’s Economic Ties with Spain and their Development Impact, by Iliana
Olivié, July 2009.
Working Paper No. 281, Revisiting Political Budget Cycles in Latin America, by Sebastián Nieto-Parra and Javier Santiso, August 2009.
Working Paper No. 282, Are Workers’ Remittances Relevant for Credit Rating Agencies?, by Rolando Avendaño, Norbert Gaillard and
Sebastián Nieto-Parra, October 2009.
Working Paper No. 283, Are SWF Investments Politically Biased? A Comparison with Mutual Funds, by Rolando Avendaño and Ja vier
Santiso, December 2009.
Working Paper No. 284, Crushed Aid: Fragmentation in Sectoral Aid, by Emmanuel Frot and Javier Santiso, January 2010.
Working Paper No. 285, The Emerging Middle Class in Developing Countries, by Homi Kharas, January 2010.
Working Paper No. 286, Does Trade Stimulate Innovation? Evidence from Firm-Product Data, by Ana Margarida Fernandes and Caroline
Paunov, January 2010.
Working Paper No. 287, Why Do So Many Women End Up in Bad Jobs? A Cross-Country Assessment, by Johannes Jütting, Angela Luci
and Christian Morrisson, January 2010.
Working Paper No. 288, Innovation, Productivity and Economic Development in Latin America and the Caribbean, by Christian Daude,
February 2010.
Working Paper No. 289, South America for the Chinese? A Trade-Based Analysis, by Eliana Cardoso and Márcio Holland, April 2010.
Working Paper No. 290, On the Role of Productivity and Factor Accumulation in Economic Development in Latin America and the Caribbean,
by Christian Daude and Eduardo Fernández-Arias, April 2010.