Embed Size (px)
Citation preview

Monthly Labor Review November 2001 57
Occupational employmentprojections to 2010
Occupations requiring a postsecondary vocationalaward or an academic degree, which accounted for 29percent of all jobs in 2000, will account for 42 percentof total job growth from 2000 to 2010
Daniel E. Hecker
Daniel E. Hecker is aneconomist in theOffice of Occupa-tional Statistics andEmployment Projec-tions, Bureau of LaborStatistics.E-mail:[email protected]
Total employment is projected to increaseby 22.2 million jobs over the 2000–10period, rising to 167.8 million, according
to the latest projections of the Bureau of LaborStatistics. This increase represents about a mil-lion more jobs than were added over the previ-ous 10-year period (1990–2000). The projected15.2-percent increase, however, is less than the17.1-percent increase of the previous 10-yearperiod.1 Self employed is projected to grow from11.5 to 11.7 million, or 1.7 percent.
The economy will continue generating jobsfor workers at all levels of education and train-ing, although growth rates are projected to befaster, on average, for occupations generally re-quiring a postsecondary award (a vocational cer-tificate or other award or an associate or higherdegree), than for occupations requiring lesseducation or training. Most new jobs, however,will arise in occupations that require only work-related training (on-the-job training or workexperience in a related occupation), even thoughthese occupations are projected to grow moreslowly, on average. This reflects the fact that theseoccupations accounted for about 7 out of 10 jobsin 2000.
This article discusses a number of aspects ofthe 2000–2010 projections along with relatedinformation:
• changes in the structure of employment atthe major occupational group level;
• the detailed occupations that are projectedto grow fastest as well as those with thelargest numerical increases and decreases,along with their current educational ortraining requirements and earnings;
• the total job openings projected to occurdue to growth in the economy and the netreplacement needs resulting from workerswho leave the labor force or transfer toother occupations; and
• the distribution of employment in 2000 andprojected 2000–10 job openings by levelof education or training.
In this article, projected employment is ana-lyzed from two perspectives—percent changeand numerical change—because one can be largeand the other small, depending on the size ofemployment in the base year. The followingexample, using data for two occupations gen-erally requiring the same level of education—a bachelor’s degree—serves to illustrate the im-portance of viewing job outlook from both per-spectives. Employment of physician assistantsnumbered only 58,000 in 2000, and despite rapidprojected growth over the 2000–10 period (53.5percent), this occupation will add only 31,000
Occupational Employment
Employment outlook: 2000–10

58 Monthly Labor Review November 2001
Occupational Employment
jobs. In contrast, employment of elementary school teach-ers, except special education, was 1,532,000 in 2000; whileemployment is expected to grow by only 13 percent, the num-ber of new jobs over the 2000–10 period will total 202,000—nearly 7 times as many as for physician assistants.
Major occupational groups
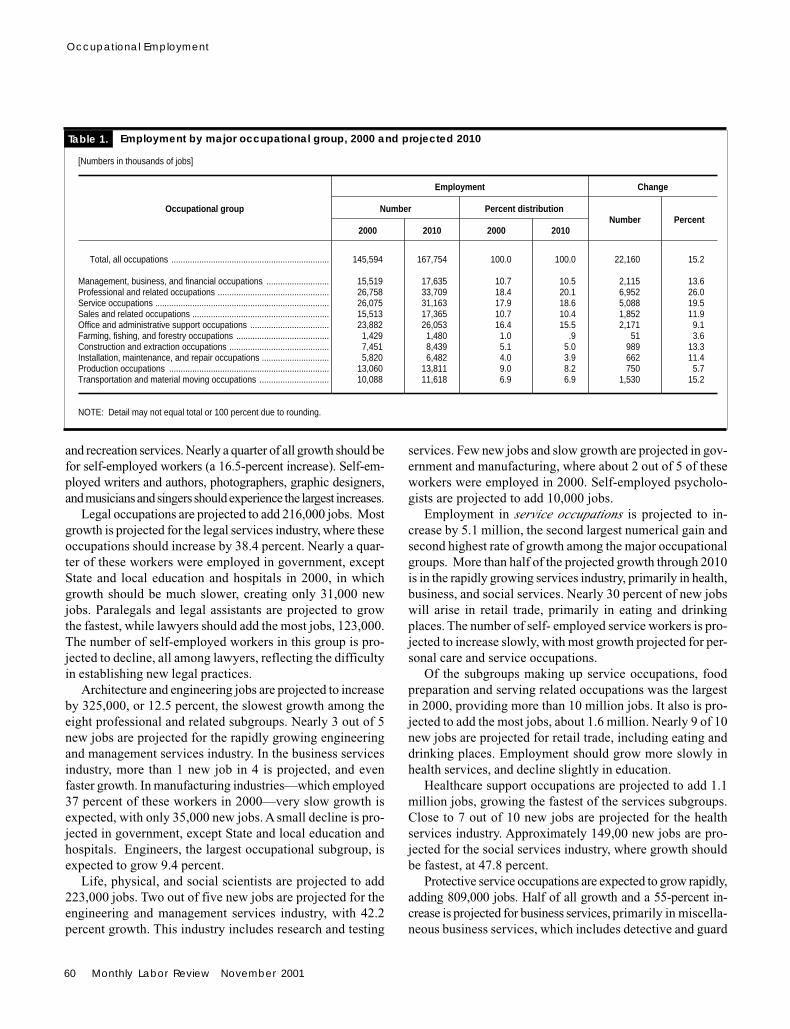
Among the major occupational groups, employment in thetwo largest in 2000—professional and related occupationsand service occupations—will increase the fastest and addthe most jobs from 2000 to 2010. (See table 1.) These ma-jor groups, which are on opposite ends of the educationalattainment and earnings spectrum, are expected to providemore than half of the total job growth from 2000 to 2010.Employment in transportation and material moving occupa-tions is projected to grow as fast as overall employment; man-agement, business, and financial occupations; constructionand extraction occupations; sales and related occupations;and installation, maintenance, and repair occupations willgrow somewhat more slowly. The three slowest growinggroups, all under 10 percent, are office and administrativesupport occupations; production occupations; and farming,fishing, and forestry occupations.
As a result of the different growth rates among the majoroccupational groups, the occupational distribution of totalemployment will change somewhat by the year 2010, but therelative ranking of the groups by employment size is not ex-pected to change. Professional and related occupations willcontinue to rank first, while farming, fishing, and forestryoccupations will continue to rank last. Only two groups willincrease their relative share of employment—professional andrelated occupations and service occupations. (See table 1.)
The growth of occupational groups (and occupations) isdetermined, in large part, by growth in the industries in whichthey are concentrated. For example, professional occupationsare projected to grow the fastest, in large part because theyare concentrated in some fast-growing services industries,while production occupations are projected to grow moreslowly than overall employment, largely because nearly 3out of 4 are in the slow growing manufacturing sector.2
The number of management, business, and financial work-ers is projected to grow by 2.1 million from 2000 to 2010.Nearly a quarter of all job growth will be in business ser-vices industries, where these occupations should grow thefastest. About 354,000 new jobs are projected for rapidlygrowing engineering and management services and 238,000for finance, insurance, and real estate. Slow growth is pro-jected for government, except State and local education andhospitals, and for manufacturing, with relatively few new jobsin each—60,000 and 104,000, respectively.3 Overall pro-
jected growth among management, business, and financialworkers also is affected by the decline of farmers and ranch-ers by 328,000. (See table 2.) Almost all farmers andranchers are self-employed, causing self-employment in thismajor occupational group to decline. However, because ofgrowing self-employment in other management, business,and financial occupations, the overall decline in self-em-ployed is expected to be only 97,000. Excluding farmers andranchers, management, business, and financial occupationsare projected to increase 17.2 percent; the self-employed,excluding farmers and ranchers, is projected to increase 14.6percent.
Employment in professional and related occupations isprojected to grow faster and add more workers (7 million)than any other major group. In terms of employment share,professional and related occupations are expected to experi-ence the largest increase, rising from 18.4 percent of totalemployment in 2000 to 20.1 percent in 2010. Three industrygroups—business services; education, public and private; andhealth services—each will account for about a fifth of allgrowth. Another fifth is projected for the rest of services,including engineering and management, social, and legal ser-vices. Relatively slow growth is projected for government,except State and local education and hospitals, and for manu-facturing, with 235,000 and 176,000 new jobs, respectively.Nearly three-quarters of the job growth for professional andrelated is projected for three subgroups—computer and math-ematical occupations; health care practitioners and technicaloccupations; and education, training, and library occupations.A 10.3-percent increase is projected for self-employed pro-fessional and related occupations. Most growth among self-employed is projected for two subgroups—arts, design, en-tertainment, sports, and media occupations; and computerand mathematical occupations.
Computer and mathematical occupations are projected toadd the most jobs, 2 million, and grow the fastest among theeight professional and related occupations subgroups. (See table2.) The demand for computer-related occupations will con-tinue to increase as a result of the rapid advances in com-puter technology and the continuing demand for new com-puter applications, including those for the Internet andintranets. Three out of five new jobs will be in the rapidlygrowing business services industries—primarily in computerand data processing services, where employment of com-puter and mathematical occupations is projected to morethan double. In addition, in almost all industries, employ-ment of these workers is projected to grow significantly fasterthan the average for all occupations. Self-employed workersare expected to increase 51.2 percent.
Health care practitioners and technical occupations areprojected to add 1.6 million jobs, as the demand for health

Monthly Labor Review November 2001 59
These projections reflect the 2000 Standard OccupationalClassification system. The titles and content of majoroccupational groups and many detailed occupations inthis article are substantially different than those used inthe 1998–2008 projections presented in the November1999 issue of the Review. Some major groups have beenrenamed, combined, or reorganized. For example, ex-ecutive, administrative, and managerial occupations hasbeen renamed management, business, and financial oc-cupations. Technicians have become part of professionaland related occupations, while two major groups—pre-cision production, craft, and repair; and operators, fab-ricators, and laborers—have been reorganized into fourgroups—construction and extraction; installation, main-tenance, and repair; production; and transportation andmaterial moving occupations.
Some individual occupations also have been renamedor classified within different major groups. For example,farmers and farm managers, formerly in agriculture, for-estry, fishing, and related occupations, now are classifiedas agricultural managers within management, business,and financial occupations. Aircraft pilots and flight en-gineers, and air traffic controllers, both formerly intechnicians and related support occupations, are classifiedunder transportation and material moving occupations.Teacher assistants, formerly in administrative support,including clerical occupations, now fall under educa-tion, training, and library occupations. Landscape,
Occupational classification and title changes
care services continues to grow rapidly. Nearly 3 out of 4new jobs for workers in these occupations should be in thehealth services industry. Growth will be slower in govern-ment, except State and local education and hospitals. Regis-tered nurses, by far the largest occupation in this group, shouldaccount for more than a third of all new jobs. The number ofself-employed workers in this group is projected to declinesomewhat. Self-employed physicians, dentists, and optometristsare expected to decline, mainly due to the shift of employ-ment into incorporated group practices, while self-employedchiropractors, registered nurses, and therapists are projectedto grow.
Education, training, and library occupations are projectedto add 1.6 million jobs. This group is projected to grow,as the school-age population increases, a greater propor-tion of students are provided with special education, andclasses become smaller. Four out of five new jobs are pro-jected for public and private educational services. The fast-
est growth (35.6 percent) and 1 new job in 10 is projectedfor social services industries.
Community and social services occupations are projectedto add 529,000 jobs and have the second fastest growth amongprofessional and related occupations. Continued rapid growthshould result, as the elderly population increases rapidly andas greater efforts are made to provide services for the dis-abled, the sick, and individuals and families in crisis. Morethan 2 out of 5 new jobs should be in the social servicesindustry. About 93,000 new jobs will be in health services.Relatively slow growth is projected for government, exceptState and local education and hospitals; and in religious or-ganizations, with 85,000 and 58,000 new jobs, respectively.
Arts, design, entertainment, sports, and media occupationsare projected to add 493,000 jobs. About one-fifth of newjobs are projected for very rapidly growing business services,which includes advertising and computer and data process-ing services. One job in eight is projected for amusement
groundskeeping, nursery, greenhouse, and lawn serviceoccupations, formerly within agriculture, forestry, fishing,and related occupations, now are classified as landscapingand groundskeeping workers within services occupa-tions, under building and grounds cleaning and mainte-nance occupations.
Many occupations were added to the 2000 SOC. Table 2includes nearly 700 detailed occupations, compared withmore than 500 in the previous projections. Some occu-pations—such as network and computer systems admin-istrators, and meeting and convention planners, are new.Other occupations have been split into more detailedcomponents. For example, engineering, natural science,and computer and information systems managers, in the1998–2008 projections, comprise three separate man-agement occupations in the 2000–10 projections. Simi-larly, special education teachers have been split into threecomponents, according to the level of school in whichthey teach—secondary school; middle school; and pre-school, kindergarten, and elementary school.
Because of these changes, occupations and occupa-tional groups are not comparable to those in earlier analy-ses. The 1998–2008 projections were accompanied bydata for the previous 10-year period, 1988–98, showingemployment changes for comparable major occupationalgroups. For these 2000–10 projections, it is not possibleto calculate comparable occupational employmentchanges for the 1990–2000 period.
60 Monthly Labor Review November 2001
Occupational Employment
and recreation services. Nearly a quarter of all growth should befor self-employed workers (a 16.5-percent increase). Self-em-ployed writers and authors, photographers, graphic designers,and musicians and singers should experience the largest increases.
Legal occupations are projected to add 216,000 jobs. Mostgrowth is projected for the legal services industry, where theseoccupations should increase by 38.4 percent. Nearly a quar-ter of these workers were employed in government, exceptState and local education and hospitals in 2000, in whichgrowth should be much slower, creating only 31,000 newjobs. Paralegals and legal assistants are projected to growthe fastest, while lawyers should add the most jobs, 123,000.The number of self-employed workers in this group is pro-jected to decline, all among lawyers, reflecting the difficultyin establishing new legal practices.
Architecture and engineering jobs are projected to increaseby 325,000, or 12.5 percent, the slowest growth among theeight professional and related subgroups. Nearly 3 out of 5new jobs are projected for the rapidly growing engineeringand management services industry. In the business servicesindustry, more than 1 new job in 4 is projected, and evenfaster growth. In manufacturing industries—which employed37 percent of these workers in 2000—very slow growth isexpected, with only 35,000 new jobs. A small decline is pro-jected in government, except State and local education andhospitals. Engineers, the largest occupational subgroup, isexpected to grow 9.4 percent.
Life, physical, and social scientists are projected to add223,000 jobs. Two out of five new jobs are projected for theengineering and management services industry, with 42.2percent growth. This industry includes research and testing
services. Few new jobs and slow growth are projected in gov-ernment and manufacturing, where about 2 out of 5 of theseworkers were employed in 2000. Self-employed psycholo-gists are projected to add 10,000 jobs.
Employment in service occupations is projected to in-crease by 5.1 million, the second largest numerical gain andsecond highest rate of growth among the major occupationalgroups. More than half of the projected growth through 2010is in the rapidly growing services industry, primarily in health,business, and social services. Nearly 30 percent of new jobswill arise in retail trade, primarily in eating and drinkingplaces. The number of self- employed service workers is pro-jected to increase slowly, with most growth projected for per-sonal care and service occupations.
Of the subgroups making up service occupations, foodpreparation and serving related occupations was the largestin 2000, providing more than 10 million jobs. It also is pro-jected to add the most jobs, about 1.6 million. Nearly 9 of 10new jobs are projected for retail trade, including eating anddrinking places. Employment should grow more slowly inhealth services, and decline slightly in education.
Healthcare support occupations are projected to add 1.1million jobs, growing the fastest of the services subgroups.Close to 7 out of 10 new jobs are projected for the healthservices industry. Approximately 149,00 new jobs are pro-jected for the social services industry, where growth shouldbe fastest, at 47.8 percent.
Protective service occupations are expected to grow rapidly,adding 809,000 jobs. Half of all growth and a 55-percent in-crease is projected for business services, primarily in miscella-neous business services, which includes detective and guard
[Numbers in thousands of jobs]
Occupational group
Employment Change
Number Percent distributionNumber Percent
2000 2010 2000 2010
Total, all occupations .................................................................... 145,594 167,754 100.0 100.0 22,160 15.2
Management, business, and financial occupations ........................... 15,519 17,635 10.7 10.5 2,115 13.6Professional and related occupations ................................................ 26,758 33,709 18.4 20.1 6,952 26.0Service occupations ........................................................................... 26,075 31,163 17.9 18.6 5,088 19.5Sales and related occupations ........................................................... 15,513 17,365 10.7 10.4 1,852 11.9Office and administrative support occupations .................................. 23,882 26,053 16.4 15.5 2,171 9.1Farming, fishing, and forestry occupations ........................................ 1,429 1,480 1.0 .9 51 3.6Construction and extraction occupations ........................................... 7,451 8,439 5.1 5.0 989 13.3Installation, maintenance, and repair occupations ............................. 5,820 6,482 4.0 3.9 662 11.4Production occupations ..................................................................... 13,060 13,811 9.0 8.2 750 5.7Transportation and material moving occupations .............................. 10,088 11,618 6.9 6.9 1,530 15.2
NOTE: Detail may not equal total or 100 percent due to rounding.
Table 1. Employment by major occupational group, 2000 and projected 2010

Monthly Labor Review November 2001 61
services. Two out of 5 new jobs should be in government,but here growth should be much slower.
Personal care and service occupations are projected to add856,000 jobs. One-third of the new jobs for workers in thesejobs, and the fastest growth (55.9 percent) are projected in so-cial services. Fourteen percent of new jobs, and very fast growthare projected for health services. Overall growth is retarded bya 25-percent decline in the private household sector, where 7percent of these workers were employed in 2000 and by slowgrowth among the self-employed, who made up a quarter ofall workers in this group in 2000. Of the 75,000 projected newjobs among the self-employed, most should be for hairdressers,hairstylists, and cosmetologists and child care workers.
Building and grounds cleaning and maintenance occupa-tions are projected to add 779,000 jobs with the slowestgrowth of the services occupation subgroups. Almost a quar-ter of new jobs and 42.5-percent growth is projected for theagriculture, forestry, and fishing services industry, which in-cludes landscape and horticultural services. Another quarterof new jobs is projected for business services (including build-ing cleaning and maintenance services and personnel supplyservices). Slow growth and relatively few new jobs are pro-jected for education and manufacturing, and little or no growthis projected for the self-employed, who made up 8 percent ofthis group in 2000. A 25-percent decline is projected in theprivate household sector, where 10 percent of these workerswere employed in 2000. Self-employed first-line supervisors/managers of landscaping, lawn service, and groundskeepingworkers are projected to increase 32.3 percent, while self-employed maids and housekeeping cleaners and janitors andcleaners should decline.
Employment in sales and related occupations is projectedto increase by 1.9 million workers from 2000 to 2010. Thebelow-average job growth for sales workers is attributable,in part, to the increased use of automated sales systems, in-cluding those related to electronic business, which decreasethe overall demand for labor.4 More than half of new salesjobs are projected for the retail trade industry. One of sixnew jobs is projected for business services, where employ-ment is projected to grow rapidly (42.1 percent). Much slowergrowth, but 147,000 new jobs for sales workers, is expectedin wholesale trade. The number of self-employed sales andrelated workers, who made up 13 percent of the group in2000, is projected to drop slightly. Self-employed securities,commodities, and services sales agents; retail estate salesagents; and insurance sales agents are projected to increase,while retail salespersons; door-to-door sales workers, newsand street vendors, and related workers; and telemarketersare projected to decline.
Employment in office and administrative support occu-pations is projected to increase by 2.2 million, but grow
slowly. Business services should have close to half of all jobgrowth, with a 39.2-percent increase. This sector includespersonnel supply services, , , , , which provides temporary employ-ees to other industries on a contract or fee basis, , , , , and com-puter and data processing services. Another 40 percent ofnew jobs are projected for the rest of the services industries,primarily health, engineering and management, and legal ser-vices. In almost all industries, however, employment of theseworkers is projected to grow more slowly than overall em-ployment, due to continued office automation, including thatrelated to electronic business; and as organizations makegreater use of temporary workers employed by the personnelsupply industry, raising employment in that sector.5 In gov-ernment, except State and local education and hospitals;manufacturing; and education, which together employed one-quarter of office and administrative support workers in 2000,employment is projected to decline. Many occupations withthe largest projected job declines, including tellers and wordprocessors and typists, are in this group. (See table 4.) How-ever, a number of occupations that involve a great deal ofcontact with people, such as hotel, motel, and resort deskclerks and customer service representatives, are less affectedby changing technology, and are projected to grow rapidly.
Farming, fishing, and forestry occupations are projectedto grow by 51,000 jobs. The self-employed are projected todecline 9.1 percent. Self-employed first-line supervisors/man-agers/contractors of farming, fishing, and forestry workersare projected to increase, but fishers and related fishing work-ers and farm workers are projected to decline.
The construction and extraction occupations major groupis projected to add 989,000 jobs, a 13.3-percent increase.More than 3 out of 5 new jobs are projected for the construc-tion industry. The fastest growth (58.4 percent) is projected forbusiness services, which should account for almost 10 percentof new jobs. Most of these jobs are in personnel supply ser-vices. A decline of 18,000 is projected for the mining indus-try—mostly for extraction workers. Self-employed construc-tion and extraction workers are projected to increase 9.4 per-cent. Most new jobs among the self-employed are for first-line supervisors/managers of construction trades and extrac-tion workers and for painters, construction and maintenance.
Installation, maintenance, and repair occupations areprojected to add 662,000 jobs. A 25.3-percent growth rate,or approximately 1 new job in 5, is projected for the automotiverepair, services, and parking industry. Most growth, however, isprojected to occur in a wide range of other industries. Self-employed workers in this group are projected to declineslightly. Self-employed heating, air conditioning, and refrig-eration mechanics and installers are projected to increase,but self-employed automotive body repairers and industrialmachinery mechanics are projected to decline.

62 Monthly Labor Review November 2001
Occupational Employment
Production occupations are expected to add about 750,000jobs, a small increase. In 2000, nearly 3 out of 4 productionworkers were employed in manufacturing, but only about aquarter of new jobs and very slow growth are projected forthis industry. More than half of new jobs are projected forthe business services industry (most in personnel supply ser-vices), with growth at 43.5 percent expected. Self-employedproduction occupations are projected to decline 13.3 percent.Tailors, dressmakers, and sewers; welders, cutters, solder-ers, and brazers; and cabinetmakers and bench carpentersshould experience the largest declines.
Transportation and material moving occupations are pro-jected to add 1.5 million jobs. More than 1 out of 3 new jobsshould be in transportation and public utilities, and nearly 3out of 10 new jobs, and growth of 50.1 percent, should occurin business services (primarily personnel supply services).Slower growth is projected for wholesale trade and retail trade,166,000 and 95,000 jobs, respectively. Little change in em-ployment is projected for these workers in manufacturing,where 1 out of 6 were employed in 2000. Water transporta-tion occupations are projected to grow slowly, while railroadoccupations will continue their long-term decline. Nearly 2out of 5 new jobs should be for truck drivers and driver/salesworkers. A small increase in self-employed jobs is projected;mostly for taxi drivers and chauffeurs and driver/salesworkers.
Detailed occupations
This section focuses in occupations that are the fastest grow-ing, have the largest numeric increases, and have the largestnumeric declines. Data on numeric and percent growth fornearly 700 detailed occupations are presented in table 2.
The growth rates for detailed occupations range from anincrease of 100 percent for computer software engineers,applications, to a decline of 61 percent for railroad brake,signal, and switch operators. Numeric growth ranges from673,000 additional jobs for combined food preparation andservice occupations, including fast food, to a decline of328,000 farmers and ranchers. The 30 occupations with thelargest numeric increases account for nearly half of the 22.2million total increase over the 2000–10 period. (See table 4.)The 30 occupations that are projected as the fastest grow-ing have growth rates of 36 percent or greater, more thantwice the average for all occupations or faster. (See table 3.)Eight occupations (five computer-related and three health-related) are included in both groups—computer softwareengineers, application; computer software engineers, sys-tems software; computer support specialists; network andcomputer systems administrators; computer systems ana-lysts; personal and home care aides; medical assistants; andhome health aides. (See table 4.)
Fastest growing occupations. Of the 30 fastest growing oc-cupations, 17 are health-related and 10 are computer-relatedoccupations. (See table 3.) The others are special educationteachers, preschool, kindergarten, and elementary school;fitness trainers and aerobics instructors; and social and hu-man services assistants.
The increasing demand for computer-related occupationsreflects the rapid advances in computer technology and thecontinuing development of new computer applications, in-cluding the Internet and intranets. Overall, computer special-ists, a component of computer and mathematical occupations,is projected to grow 68.6 percent, and computer and infor-mation systems managers, classified within management,business, and financial occupations, is projected to grow 47.9percent. (See table 2.) Five computer-related occupations alsoare among the occupations with the largest projected numeri-cal job growth.
The two healthcare groups discussed in the previous sec-tion—healthcare practitioners and technical occupations, andhealthcare support occupations—————have a combined growthrate of 27.9 percent. Rapid growth among health-related oc-cupations reflects an aging population that requires morehealth care, a wealthier population that can afford better healthcare, and advances in medical technology that permit anincreasing number of health problems to be treated more ag-gressively. However, job growth among health-related occu-pations will be limited by efforts to stem the rapid growth ofspending on health care, both by private medical insurersand by government—to restrict the growth of medicare andmedicaid reimbursements. Even so, continued efforts to con-trol health care costs should stimulate some health-relatedoccupations on this list (mostly technicians, aides and assis-tants) to grow even more rapidly than overall health em-ployment. They will assume some duties formerly done bymore highly paid healthcare workers, such as dentists, phar-macists, physicians, and therapists. These occupations includephysician assistants, physical therapist assistants and aides,occupational therapist assistants and aides, dental assistants,dental hygienists, and pharmacy technicians. Some healthcareoccupations also will grow more rapidly than overallhealthcare employment, because they are more likely to pro-vide services to the rapidly growing older population. Theseinclude some listed above, such as physical and occupationaltherapist assistants and aides and pharmacy technicians, aswell as audiologists and speech-language pathologists. Em-ployment of medical assistants should grow rapidly, becausethey are concentrated in rapidly growing outpatient care fa-cilities.
The number of medical records and health informationtechnicians employed also is expected to grow rapidly dueto the need to maintain records for an increasing number of

Monthly Labor Review November 2001 63
medical tests, treatments, and procedures that will undergoincreasing scrutiny by third-party payers, courts, and con-sumers. Employment of home health aides and of personaland home care aides (included in this discussion of health-related occupations but classified as a personal serviceoccupation in table 2) also should be stimulated, as the olderpopulation grows and as efforts to contain healthcare costscontinue. The older population is more likely to need in-home health care, as well as personal care and housekeepingservices that these workers provide. In addition, patients ofall ages are being discharged from hospitals and nursingfacilities as early as possible. These aides also providecare to this rapidly growing group of patients. Employ-ment of mental health and substance abuse social workers(classified as a community and social services occupation intable 2) is projected to grow rapidly because of greaterefforts to treat drug abusers and people with mental healthproblems. Employment of veterinary technologists andtechnicians and veterinary assistants and laboratory ani-mal caretakers, also classified as healthcare occupations,are projected to grow rapidly as pet owners spend moreon animal care services, including day and overnight board-ing, surgery, and intensive care.
Three other occupations also should be among the fastestgrowing. Fitness trainers and aerobics instructors are pro-jected to grow rapidly, due to rising interest in personal train-ing and other fitness activities. Special education teachers,preschool, kindergarten, and elementary school are projectedto grow rapidly due to the growing number of students re-quiring special education and due to legislation emphasizingtraining and employment for individuals with disabilities.Social and human service assistants also are projected to growrapidly as employers attempt to control costs. Social serviceagencies are restructuring services and hiring more lower-paid social and human service assistants instead of socialworkers, making these assistants the fastest growing com-munity and social services occupation.
Occupations with the largest job growth. Very large occu-pations with average or even below-average growth ratesprovide many job openings, as do very fast growing oneswith smaller base-year employment. These 30 occupationsare from a much broader range of occupational groups thanare the 30 fastest growing. Five are computer-related andfive are health-related. Four each are in education, training,and library and in transportation and material moving majoroccupation groups, three fall under the category of office andadministrative support, and two each in sales and related,and in management, business, and financial occupations. Fiveare service occupations other than those related to health,including two in building and grounds cleaning and mainte-
nance occupations and two in food service.Twenty on the list had employment of at least 1 million in
2000. Of the 10 that had employment of less than a million,all except accountants and landscaping and groundskeepingworkers have projected growth at least three times as fast asthe 15.2-percent average for all occupations. Five are com-puter-related occupations; the largest is computer support spe-cialists, with 2000 employment of 505,000. (Computer pro-grammers, the largest computer occupation in 2000, but withonly 16 percent growth, is not on the list.) Six occupationson the list, all with employment of 1.5 million or more, areprojected to grow more slowly than 15.2 percent.
Registered nurses and nursing aides, orderlies, and atten-dants, by far the two largest health-related occupations in2000, also are projected to have more numerical growth thanany other health-related occupations. Home health aides,medical assistants, and personal and home care aides, allamong the 30 fastest growing, are also on this list. The fourlargest education, training, and library occupations in 2000—postsecondary teachers; teacher assistants; elementary schoolteachers, except special education; and secondary schoolteachers, except special and vocational education—are pro-jected to have large numbers of job openings. Elementaryteachers, except special education is the only one with belowaverage employment growth.
Of the four transportation and material moving occupa-tions, laborers and freight, stock, and material movers, handis the only one with below average employment growth.Packers and packagers; truck drivers, heavy and tractor trailer;and truck drivers, light and delivery services are projected togrow approximately 20 percent. Both sales and related occu-pations—retail salespersons and cashiers, except gaming—are projected to have below average growth, but in 2000,each one had employment of more than 3 million. The twofood service occupations—combined food preparation andserving workers, including fast food and waiters and wait-resses—have large base-year employment and faster thanaverage growth rates.
General and operations managers should grow at aboutthe same rate as the total for all occupations, while securityguards is projected to grow 35.2 percent, making it thefastest growing occupation of the 30 on this list that is notcomputer or health related. Among building and groundscleaning and maintenance occupations, janitors and cleanersis projected to have more openings than landscaping andgroundskeeping workers, although growth of janitors is muchslower than landscaping and groundskeeping workers, be-cause employment in 2000 was much larger. Of the threeoffice and administrative support occupations on the list,customer service representatives and receptionists and in-formation clerks are projected to grow rapidly, while office
Text continues on page 78.

64 Monthly Labor Review November 2001
Occupational Employment
Table 2. Employment by occupation, 2000 and projected 2010
[Numbers in thousands of jobs]
Occupation
Employment Change Total jobopenings
due to growthand net
replacements,2000-101
Number Percent distribution
Number Percent2000 2010 2000 2010
Total, all occupations ..................................................................... 145,594 167,754 100.0 100.0 22,160 15.2 57,932
Management, business, and financial occupations ........................... 15,519 17,635 10.7 10.5 2,115 13.6 5,109
Management occupations ................................................................ 10,564 11,834 7.3 7.1 1,270 12.0 3,330 Administrative services managers ................................................. 362 436 .2 .3 74 20.4 133 Advertising, marketing, promotions, public relations, and sales
managers ............................................................................... 707 936 .5 .6 229 32.4 331 Advertising and promotions managers ........................................ 100 135 .1 .1 34 34.3 49 Marketing and sales managers .................................................... 533 701 .4 .4 168 31.5 244 Marketing managers .................................................................. 190 246 .1 .1 55 29.1 83 Sales managers ......................................................................... 343 455 .2 .3 112 32.8 162 Public relations managers ........................................................... 74 101 .1 .1 27 36.3 38 Agricultural managers .................................................................... 1,462 1,144 1.0 .7 -318 -21.7 103 Farm, ranch, and other agricultural managers ............................. 169 179 .1 .1 10 6.0 30 Farmers and ranchers ................................................................. 1,294 965 .9 .6 -328 -25.4 74 Chief executives ............................................................................ 547 641 .4 .4 94 17.2 266 Computer and information systems managers .............................. 313 463 .2 .3 150 47.9 203 Construction managers .................................................................. 308 358 .2 .2 50 16.3 100 Education administrators ............................................................... 453 513 .3 .3 61 13.4 178 Engineering managers ................................................................... 282 305 .2 .2 23 8.0 69 Financial managers ....................................................................... 658 780 .5 .5 122 18.5 223 Food service managers ................................................................. 465 535 .3 .3 70 15.0 125 Funeral directors ............................................................................ 32 32 .0 .0 1 3.0 6 Gaming managers ......................................................................... 4 5 .0 .0 1 30.0 2 General and operations managers ................................................ 2,398 2,761 1.6 1.6 363 15.2 767 Human resources managers ......................................................... 219 246 .2 .1 28 12.7 66 Industrial production managers ..................................................... 255 271 .2 .2 16 6.2 57 Legislators ..................................................................................... 54 61 .0 .0 7 12.7 24 Lodging managers ......................................................................... 68 75 .0 .0 6 9.3 14 Medical and health services managers ......................................... 250 330 .2 .2 81 32.3 123 Natural sciences managers ........................................................... 42 45 .0 .0 3 7.6 11 Postmasters and mail superintendents .......................................... 25 26 .0 .0 1 2.5 5 Property, real estate, and community association managers ........ 270 331 .2 .2 61 22.7 105 Purchasing managers .................................................................... 132 125 .1 .1 -7 -5.5 41 Social and community service managers ...................................... 128 160 .1 .1 32 24.8 56 Transportation, storage, and distribution managers ...................... 149 179 .1 .1 30 20.2 55 All other managers ......................................................................... 981 1,074 .7 .6 93 9.5 267 Business and financial operations occupations ............................... 4,956 5,801 3.4 3.5 845 17.1 1,779 Business operations specialists ..................................................... 2,841 3,320 2.0 2.0 479 16.8 1,053 Agents and business managers of artists, performers, and
athletes .................................................................................. 17 22 .0 .0 5 27.9 8 Buyers and purchasing agents .................................................... 404 424 .3 .3 20 4.8 128 Purchasing agents and buyers, farm products .......................... 20 23 .0 .0 3 16.8 7 Purchasing agents, except wholesale, retail, and farm products 237 266 .2 .2 29 12.3 76 Wholesale and retail buyers, except farm products ................... 148 135 .1 .1 -13 -8.7 45 Claims adjusters, appraisers, examiners, and investigators ........ 207 238 .1 .1 31 15.0 54 Claims adjusters, examiners, and investigators ........................ 194 223 .1 .1 29 15.1 51 Insurance appraisers, auto damage .......................................... 13 15 .0 .0 2 14.3 3 Compliance officers, except agriculture, construction, health and
safety, and transportation ...................................................... 140 152 .1 .1 12 8.9 48 Cost estimators ............................................................................ 211 246 .1 .1 35 16.5 81 Emergency management specialists ........................................... 10 12 .0 .0 2 18.1 5 Human resources, training, and labor relations specialists ......... 490 578 .3 .3 88 18.0 183 Compensation, benefits, and job analysis specialists ................ 87 100 .1 .1 14 15.7 30 Employment, recruitment, and placement specialists ................ 199 234 .1 .1 35 17.6 73 Training and development specialists ........................................ 204 244 .1 .1 40 19.4 79 Management analysts .................................................................. 501 646 .3 .4 145 28.9 189 Meeting and convention planners ................................................ 34 42 .0 .0 8 23.3 14 All other business operations specialists ..................................... 827 960 .6 .6 133 16.1 343 Financial specialists ....................................................................... 2,115 2,481 1.5 1.5 367 17.3 726 Accountants and auditors ............................................................ 976 1,157 .7 .7 181 18.5 326 Appraisers and assessors of real estate ...................................... 57 67 .0 .0 10 18.0 26 Budget analysts ........................................................................... 70 80 .0 .0 10 14.6 24 Credit analysts ............................................................................. 60 70 .0 .0 10 16.0 22 Financial analysts ........................................................................ 145 182 .1 .1 37 25.5 57 Financial examiners ..................................................................... 25 27 .0 .0 3 10.2 7 Insurance underwriters ................................................................ 107 109 .1 .1 2 2.0 18 Loan counselors and officers ....................................................... 265 281 .2 .2 16 6.1 69 Loan counselors ........................................................................ 29 33 .0 .0 5 16.0 10

Monthly Labor Review November 2001 65
Table 2. Continued—Employment by occupation, 2000 and projected 2010
[Numbers in thousands of jobs]
Occupation
Employment Change Total jobopenings
due to growthand net
replacements,2000-101
Number Percent distribution
Number Percent2000 2010 2000 2010
Loan officers .............................................................................. 236 248 0.2 0.1 12 4.9 59 Personal financial advisors .......................................................... 94 126 .1 .1 32 34.0 43 Tax examiners, collectors, and revenue agents .......................... 79 86 .1 .1 7 8.3 28 Tax preparers .............................................................................. 69 81 .0 .0 12 17.4 26 All other financial specialists ........................................................ 169 216 .1 .1 47 28.0 81
Professional and related occupations ................................................ 26,758 33,709 18.4 20.1 6,952 26.0 12,160
Computer and mathematical occupations ....................................... 2,993 4,988 2.1 3.0 1,996 66.7 2,285 Computer specialists ..................................................................... 2,903 4,894 2.0 2.9 1,991 68.6 2,259 Computer programmers ............................................................... 585 680 .4 .4 95 16.2 217 Computer scientists and systems analysts .................................. 459 729 .3 .4 269 58.6 309 Computer and information scientists, research ......................... 28 39 .0 .0 11 40.3 14 Computer systems analysts ....................................................... 431 689 .3 .4 258 59.7 296 Computer software engineers ...................................................... 697 1,361 .5 .8 664 95.4 711 Computer software engineers, applications ............................... 380 760 .3 .5 380 100.0 406 Computer software engineers, systems software ...................... 317 601 .2 .4 284 89.7 306 Computer support specialists ...................................................... 506 996 .3 .6 490 97.0 512 Database administrators .............................................................. 106 176 .1 .1 70 65.9 74 Network and computer systems administrators ........................... 229 416 .2 .2 187 81.9 197 Network systems and data communications analysts ................. 119 211 .1 .1 92 77.5 97 All other computer specialists ...................................................... 203 326 .1 .2 123 60.7 141 Mathematical science occupations ................................................ 89 95 .1 .1 5 5.7 26 Mathematical scientists and technicians ...................................... 85 90 .1 .1 5 5.9 25 Actuaries .................................................................................... 14 15 .0 .0 1 5.4 3 Mathematicians .......................................................................... 4 4 .0 .0 0 -1.9 0 Operations research analysts .................................................... 47 51 .0 .0 4 8.0 19 Statisticians ................................................................................ 19 20 .0 .0 0 2.3 3 Miscellaneous mathematical science occupations ...................... 5 5 .0 .0 0 2.7 1 Architecture and engineering occupations ....................................... 2,605 2,930 1.8 1.7 325 12.5 868 Architects, surveyors, and cartographers ...................................... 196 229 .1 .1 33 17.1 61 Architects, except naval ............................................................... 124 150 .1 .1 26 20.7 33 Architects, except landscape and naval .................................... 102 121 .1 .1 19 18.5 25 Landscape architects ................................................................. 22 29 .0 .0 7 31.1 8 Surveyors, cartographers, and photogrammetrists ...................... 65 71 .0 .0 6 9.2 26 Cartographers and photogrammetrists ...................................... 7 8 .0 .0 1 18.5 3 Surveyors ................................................................................... 58 63 .0 .0 5 8.1 22 All other architects, surveyors, and cartographers ...................... 6 8 .0 .0 2 28.5 2 Engineers ....................................................................................... 1,465 1,603 1.0 1.0 138 9.4 432 Aerospace engineers ................................................................... 50 57 .0 .0 7 13.9 22 Agricultural engineers .................................................................. 2 3 .0 .0 0 14.8 1 Biomedical engineers .................................................................. 7 9 .0 .0 2 31.4 4 Chemical engineers ..................................................................... 33 34 .0 .0 1 4.1 7 Civil engineers ............................................................................. 232 256 .2 .2 24 10.2 60 Computer hardware engineers .................................................... 60 75 .0 .0 15 24.9 23 Electrical and electronics engineers ............................................ 288 319 .2 .2 31 10.9 84 Electrical engineers ................................................................... 157 175 .1 .1 18 11.3 47 Electronics engineers, except computer .................................... 130 144 .1 .1 14 10.4 37 Environmental engineers ............................................................. 52 66 .0 .0 14 26.0 24 Industrial engineers, including health and safety ......................... 198 210 .1 .1 12 5.9 45 Health and safety engineers, except mining safety engineers
and inspectors ....................................................................... 44 49 .0 .0 5 10.9 12 Industrial engineers ................................................................... 154 161 .1 .1 7 4.5 33 Marine engineers and naval architects ........................................ 5 5 .0 .0 0 2.1 1 Materials engineers ..................................................................... 33 35 .0 .0 2 5.3 9 Mechanical engineers .................................................................. 221 251 .2 .1 29 13.1 94 Mining and geological engineers, including mining safety
engineers ............................................................................... 6 6 .0 .0 0 -1.3 1 Nuclear engineers ........................................................................ 14 14 .0 .0 0 1.8 3 Petroleum engineers .................................................................... 9 8 .0 .0 -1 -7.2 2 All other engineers ....................................................................... 253 254 .2 .2 1 .4 51 Drafters, engineering, and mapping technicians ........................... 944 1,098 .6 .7 154 16.3 375 Drafters ........................................................................................ 213 255 .1 .2 42 19.5 106 Architectural and civil drafters .................................................... 102 123 .1 .1 21 20.8 52 Electrical and electronics drafters .............................................. 41 51 .0 .0 10 23.3 22 Mechanical drafters ................................................................... 70 81 .0 .0 11 15.4 32 Engineering technicians, except drafters ..................................... 519 582 .4 .3 62 12.0 167 Aerospace engineering and operations technicians .................. 21 22 .0 .0 1 5.6 5 Civil engineering technicians ..................................................... 94 105 .1 .1 11 11.9 30 Electrical and electronic engineering technicians ...................... 233 258 .2 .2 25 10.8 72

66 Monthly Labor Review November 2001
Occupational Employment
Table 2. Continued—Employment by occupation, 2000 and projected 2010
[Numbers in thousands of jobs]
Occupation
Employment Change Total jobopenings
due to growthand net
replacements,2000-101
Number Percent distribution
Number Percent2000 2010 2000 2010
Electro-mechanical technicians ................................................. 43 50 0.0 0.0 6 14.5 15 Environmental engineering technicians ..................................... 18 24 .0 .0 5 29.1 9 Industrial engineering technicians ............................................. 52 57 .0 .0 5 10.1 16 Mechanical engineering technicians .......................................... 58 66 .0 .0 8 13.9 20 Surveying and mapping technicians ............................................ 55 70 .0 .0 14 25.3 32 All other drafters, engineering, and mapping technicians ............ 156 192 .1 .1 36 23.2 70 Life, physical, and social science occupations ................................ 1,164 1,386 .8 .8 223 19.1 559 Life scientists ................................................................................. 184 218 .1 .1 33 18.1 93 Agricultural and food scientists .................................................... 17 19 .0 .0 2 8.8 7 Biological scientists ...................................................................... 73 88 .1 .1 15 21.0 42 Conservation scientists and foresters .......................................... 29 31 .0 .0 2 7.7 12 Conservation scientists .............................................................. 16 18 .0 .0 1 8.3 7 Foresters .................................................................................... 12 13 .0 .0 1 7.0 5 Medical scientists ......................................................................... 37 47 .0 .0 10 26.5 18 All other life scientists .................................................................. 28 33 .0 .0 4 15.9 15 Physical scientists .......................................................................... 239 283 .2 .2 44 18.3 124 Astronomers and physicists ......................................................... 10 11 .0 .0 1 10.5 4 Atmospheric and space scientists ............................................... 7 8 .0 .0 1 17.1 3 Chemists and materials scientists ............................................... 92 110 .1 .1 18 19.2 47 Chemists .................................................................................... 84 100 .1 .1 16 19.1 43 Materials scientists .................................................................... 8 9 .0 .0 2 19.8 4 Environmental scientists and geoscientists ................................. 97 118 .1 .1 21 21.5 52 Environmental scientists and specialists, including health ........ 64 78 .0 .0 14 22.3 35 Geoscientists, except hydrologists and geographers ................ 25 30 .0 .0 5 18.1 13 Hydrologists ............................................................................... 8 10 .0 .0 2 25.7 5 All other physical scientists .......................................................... 33 36 .0 .0 3 9.4 17 Social scientists and related occupations ...................................... 410 492 .3 .3 82 20.1 178 Economists .................................................................................. 22 26 .0 .0 4 18.5 9 Market and survey researchers ................................................... 113 142 .1 .1 30 26.4 55 Market research analysts ........................................................... 90 112 .1 .1 22 24.4 42 Survey researchers .................................................................... 23 30 .0 .0 8 34.5 13 Psychologists ............................................................................... 182 214 .1 .1 33 18.1 75 Social scientists, other ................................................................. 15 17 .0 .0 3 17.2 6 Urban and regional planners ....................................................... 30 35 .0 .0 5 16.4 12 All other social scientists and related workers ............................. 49 58 .0 .0 8 17.1 20 Life, physical, and social science technicians ................................ 330 393 .2 .2 63 19.0 164 Agricultural and food science technicians .................................... 18 20 .0 .0 3 15.2 7 Biological technicians .................................................................. 41 52 .0 .0 11 26.4 21 Chemical technicians ................................................................... 73 84 .1 .1 11 15.0 28 Geological and petroleum technicians ......................................... 10 11 .0 .0 1 6.5 3 Nuclear technicians ..................................................................... 3 4 .0 .0 1 20.7 2 Other life, physical, and social science technicians ..................... 184 221 .1 .1 37 20.0 104 Environmental science and protection technicians, including
health ..................................................................................... 27 34 .0 .0 7 24.5 17 Forensic science technicians ..................................................... 6 7 .0 .0 1 13.0 3 Forest and conservation technicians ......................................... 18 19 .0 .0 1 3.2 7 All other life, physical, and social science technicians ............... 133 161 .1 .1 29 21.7 77 Community and social services occupations ................................... 1,869 2,398 1.3 1.4 529 28.3 846 Counselors ..................................................................................... 465 585 .3 .3 120 25.8 215 Educational, vocational, and school counselors .......................... 205 257 .1 .2 52 25.3 94 Marriage and family therapists ..................................................... 21 27 .0 .0 6 29.9 11 Mental health counselors ............................................................. 67 82 .0 .0 15 21.7 28 Rehabilitation counselors ............................................................. 110 136 .1 .1 26 23.6 49 Substance abuse and behavioral disorder counselors ................ 61 82 .0 .0 21 35.0 34 Miscellaneous community and social service specialists .............. 398 575 .3 .3 177 44.5 236 Health educators .......................................................................... 43 53 .0 .0 10 23.5 17 Probation officers and correctional treatment specialists ............ 84 105 .1 .1 20 23.8 33 Social and human service assistants ........................................... 271 418 .2 .2 147 54.2 187 Religious workers .......................................................................... 293 338 .2 .2 45 15.4 112 Clergy .......................................................................................... 171 197 .1 .1 26 15.0 73 Directors, religious activities and education ................................. 121 141 .1 .1 19 15.9 40 Social workers ............................................................................... 468 609 .3 .4 141 30.1 193 Child, family, and school social workers ...................................... 281 357 .2 .2 76 26.9 107 Medical and public health social workers .................................... 104 136 .1 .1 33 31.6 44 Mental health and substance abuse social workers .................... 83 116 .1 .1 33 39.1 42 All other counselors, social, and religious workers ........................ 244 290 .2 .2 46 18.8 89 Legal occupations ............................................................................ 1,119 1,335 .8 .8 216 19.3 304 Judges, magistrates, and other judicial workers ............................ 43 44 .0 .0 2 3.8 14 Administrative law judges, adjudicators, and hearing officers ..... 14 14 .0 .0 0 1.1 4 Arbitrators, mediators, and conciliators ....................................... 4 6 .0 .0 1 27.2 2

Monthly Labor Review November 2001 67
Table 2. Continued—Employment by occupation, 2000 and projected 2010
[Numbers in thousands of jobs]
Occupation
Employment Change Total jobopenings
due to growthand net
replacements,2000-101
Number Percent distribution
Number Percent2000 2010 2000 2010
Judges, magistrate judges, and magistrates ............................... 24 24 0.0 0.0 0 1.1 7 Lawyers ......................................................................................... 681 803 .5 .5 123 18.0 168 Paralegals and legal assistants ..................................................... 188 251 .1 .1 62 33.2 74 Miscellaneous legal support workers ............................................. 98 106 .1 .1 8 7.7 17 Court reporters ............................................................................. 18 21 .0 .0 3 16.2 5 Law clerks .................................................................................... 31 35 .0 .0 4 13.2 7 Title examiners, abstractors, and searchers ................................ 48 49 .0 .0 0 1.0 5 All other legal and related workers ................................................ 109 131 .1 .1 22 20.2 32 Education, training, and library occupations .................................... 8,260 9,831 5.7 5.9 1,571 19.0 3,356 Postsecondary teachers ................................................................ 1,344 1,659 .9 1.0 315 23.5 682 Primary, secondary, and special education teachers .................... 4,284 4,995 2.9 3.0 711 16.6 1,663 Preschool and kindergarten teachers .......................................... 597 707 .4 .4 110 18.4 184 Preschool teachers, except special education ........................... 423 507 .3 .3 85 20.0 137 Kindergarten teachers, except special education ...................... 175 200 .1 .1 25 14.5 47 Elementary and middle school teachers ...................................... 2,122 2,381 1.5 1.4 260 12.2 742 Elementary school teachers, except special education ............. 1,532 1,734 1.1 1.0 202 13.2 551 Middle school teachers, except special and vocational
education ............................................................................... 570 625 .4 .4 55 9.6 184 Vocational education teachers, middle school ........................... 20 22 .0 .0 3 13.1 7 Secondary school teachers ......................................................... 1,113 1,314 .8 .8 201 18.1 540 Secondary school teachers, except special and vocational
education ............................................................................... 1,004 1,190 .7 .7 187 18.6 492 Vocational education teachers, secondary school ..................... 109 123 .1 .1 15 13.4 48 Special education teachers .......................................................... 453 592 .3 .4 140 30.9 197 Special education teachers, preschool, kindergarten, and
elementary school .................................................................. 234 320 .2 .2 86 36.8 116 Special education teachers, middle school ................................ 96 119 .1 .1 23 24.4 35 Special education teachers, secondary school .......................... 123 153 .1 .1 30 24.6 46 Other teachers and instructors ...................................................... 901 1,076 .6 .6 175 19.4 266 Adult literacy, remedial education, and GED teachers and
instructors .............................................................................. 67 80 .0 .0 13 19.4 20 Self-enrichment education teachers ............................................ 186 220 .1 .1 34 18.5 53 All other teachers, primary, secondary, and adult ....................... 648 776 .4 .5 128 19.7 193 Library, museum, training, and other education occupations ........ 1,731 2,101 1.2 1.3 370 21.4 745 Archivists, curators, and museum technicians ............................. 21 24 .0 .0 3 11.9 7 Librarians ..................................................................................... 149 160 .1 .1 10 7.0 41 Library technicians ....................................................................... 109 130 .1 .1 21 19.5 70 Teacher assistants ....................................................................... 1,262 1,562 .9 .9 301 23.9 565 Other education, training, library, and museum workers ............. 190 225 .1 .1 35 18.2 62 Audio-visual collections specialists ............................................ 11 13 .0 .0 2 13.6 3 Farm and home management advisors ..................................... 11 11 .0 .0 1 6.1 2 Instructional coordinators ........................................................... 81 101 .1 .1 20 25.0 32 All other library, museum, training, and other education
workers .................................................................................. 87 99 .1 .1 12 14.0 25 Arts, design, entertainment, sports, and media occupations ........... 2,371 2,864 1.6 1.7 493 20.8 947 Art and design occupations ........................................................... 750 903 .5 .5 153 20.3 251 Artists and related workers .......................................................... 147 176 .1 .1 29 20.0 60 Art directors ............................................................................... 47 56 .0 .0 10 21.1 19 Fine artists, including painters, sculptors, and illustrators ......... 31 35 .0 .0 4 13.4 10 Multi-media artists and animators .............................................. 69 85 .0 .1 15 22.2 30 Designers ..................................................................................... 492 596 .3 .4 104 21.2 154 Commercial and industrial designers ......................................... 50 62 .0 .0 12 23.8 17 Fashion designers ..................................................................... 16 19 .0 .0 3 20.3 5 Floral designers ......................................................................... 102 118 .1 .1 15 14.9 26 Graphic designers ...................................................................... 190 241 .1 .1 51 26.7 70 Interior designers ....................................................................... 46 54 .0 .0 8 17.4 13 Merchandise displayers and window trimmers .......................... 76 88 .1 .1 12 15.9 20 Set and exhibit designers .......................................................... 12 15 .0 .0 3 27.0 4 All other art and design workers .................................................. 112 130 .1 .1 19 16.8 37 Entertainers and performers, sports and related occupations ....... 626 763 .4 .5 136 21.8 257 Actors, producers, and directors .................................................. 158 200 .1 .1 42 26.9 73 Actors ......................................................................................... 99 126 .1 .1 26 26.7 46 Producers and directors ............................................................. 58 74 .0 .0 16 27.1 27 Athletes, coaches, umpires, and related workers ........................ 129 153 .1 .1 24 18.7 50 Athletes and sports competitors ................................................ 18 22 .0 .0 4 22.5 7 Coaches and scouts .................................................................. 99 117 .1 .1 17 17.6 37 Umpires, referees, and other sports officials ............................. 11 14 .0 .0 3 22.7 5 Dancers and choreographers ...................................................... 26 30 .0 .0 4 16.3 9 Dancers ..................................................................................... 15 18 .0 .0 3 17.3 6 Choreographers ......................................................................... 11 12 .0 .0 2 14.9 4

68 Monthly Labor Review November 2001
Occupational Employment
Table 2. Continued—Employment by occupation, 2000 and projected 2010
[Numbers in thousands of jobs]
Occupation
Employment Change Total jobopenings
due to growthand net
replacements,2000-101
Number Percent distribution
Number Percent2000 2010 2000 2010
Musicians, singers, and related workers ...................................... 240 285 0.2 0.2 45 18.7 90 Music directors and composers ................................................. 50 56 .0 .0 6 13.1 16 Musicians and singers ............................................................... 191 229 .1 .1 38 20.1 74 All other entertainers and performers, sports and related
workers .................................................................................. 74 95 .1 .1 21 28.3 35 Media and communication occupations ......................................... 703 856 .5 .5 153 21.8 315 Announcers .................................................................................. 71 68 .0 .0 -4 -5.5 11 News analysts, reporters and correspondents ............................ 78 80 .1 .0 2 2.8 27 Public relations specialists ........................................................... 137 186 .1 .1 49 36.1 73 Writers and editors ....................................................................... 305 385 .2 .2 80 26.3 158 Editors ........................................................................................ 122 149 .1 .1 27 22.6 67 Technical writers ........................................................................ 57 74 .0 .0 17 29.6 34 Writers and authors ................................................................... 126 162 .1 .1 36 28.4 57 Miscellaneous media and communications workers .................... 112 137 .1 .1 25 22.4 47 Interpreters and translators ........................................................ 22 27 .0 .0 5 23.8 9 All other media and communication workers ............................. 90 110 .1 .1 20 22.1 37 Media and communication equipment occupations ....................... 291 342 .2 .2 51 17.5 124 Broadcast and sound engineering technicians and radio
operators ................................................................................ 87 99 .1 .1 12 14.0 38 Audio and video equipment technicians .................................... 37 43 .0 .0 6 16.8 17 Broadcast technicians ................................................................ 36 40 .0 .0 4 10.2 14 Radio operators ......................................................................... 3 3 .0 .0 0 6.2 1 Sound engineering technicians .................................................. 11 13 .0 .0 2 19.0 5 Photographers ............................................................................. 131 153 .1 .1 22 17.0 48 Television, video, and motion picture camera operators and
editors .................................................................................... 43 53 .0 .0 11 25.8 19 Camera operators, television, video, and motion picture ........... 27 33 .0 .0 7 25.8 12 Film and video editors ................................................................ 16 20 .0 .0 4 25.8 7 All other media and communication equipment workers ............. 31 36 .0 .0 6 18.1 19 Healthcare practitioners and technical occupations ........................ 6,379 7,978 4.4 4.8 1,599 25.1 2,995 Health diagnosing and treating practitioners ................................. 3,921 4,888 2.7 2.9 966 24.6 1,773 Chiropractors ............................................................................... 50 62 .0 .0 12 23.4 21 Dentists ........................................................................................ 152 161 .1 .1 9 5.7 43 Dietitians and nutritionists ............................................................ 49 56 .0 .0 7 15.2 21 Optometrists ................................................................................ 31 37 .0 .0 6 18.7 12 Pharmacists ................................................................................. 217 270 .1 .2 53 24.3 118 Physicians and surgeons ............................................................. 598 705 .4 .4 107 17.9 196 Physician assistants .................................................................... 58 89 .0 .1 31 53.5 43 Podiatrists .................................................................................... 18 20 .0 .0 3 14.2 6 Registered nurses ........................................................................ 2,194 2,755 1.5 1.6 561 25.6 1,004 Therapists .................................................................................... 439 584 .3 .3 145 33.2 255 Audiologists ............................................................................... 13 19 .0 .0 6 44.7 9 Occupational therapists ............................................................. 78 105 .1 .1 27 33.9 46 Physical therapists ..................................................................... 132 176 .1 .1 44 33.3 77 Radiation therapists ................................................................... 16 19 .0 .0 4 22.8 7 Recreational therapists .............................................................. 29 32 .0 .0 2 8.6 10 Respiratory therapists ................................................................ 83 112 .1 .1 29 34.8 50 Speech-language pathologists .................................................. 88 122 .1 .1 34 39.2 57 Veterinarians ................................................................................ 59 77 .0 .0 19 31.8 29 All other health diagnosing and treating practitioners .................. 57 71 .0 .0 14 24.8 26 Other health professionals and technicians ................................... 2,457 3,090 1.7 1.8 633 25.7 1,222 Clinical laboratory technologists and technicians ........................ 295 348 .2 .2 53 18.0 122 Medical and clinical laboratory technologists ............................. 148 174 .1 .1 25 17.0 60 Medical and clinical laboratory technicians ................................ 147 175 .1 .1 28 19.0 62 Dental hygienists ......................................................................... 147 201 .1 .1 54 37.1 76 Diagnostic related technologists and technicians ........................ 257 322 .2 .2 65 25.2 121 Cardiovascular technologists and technicians ........................... 39 52 .0 .0 14 34.9 22 Diagnostic medical sonographers .............................................. 33 41 .0 .0 9 26.1 16 Nuclear medicine technologists ................................................. 18 22 .0 .0 4 22.4 8 Radiologic technologists and technicians .................................. 167 206 .1 .1 39 23.1 75 Emergency medical technicians and paramedics ........................ 172 226 .1 .1 54 31.3 97 Health diagnosing and treating practitioner support technicians 417 551 .3 .3 134 32.2 242 Dietetic technicians .................................................................... 26 33 .0 .0 7 27.6 14 Pharmacy technicians ................................................................ 190 259 .1 .2 69 36.4 118 Psychiatric technicians .............................................................. 54 59 .0 .0 5 8.5 19 Respiratory therapy technicians ................................................ 27 36 .0 .0 9 34.6 16 Surgical technologists ................................................................ 71 96 .0 .1 25 34.7 43 Veterinary technologists and technicians .................................. 49 69 .0 .0 19 39.3 32 Licensed practical and licensed vocational nurses ...................... 700 842 .5 .5 142 20.3 322 Medical records and health information technicians .................... 136 202 .1 .1 66 49.0 97

Monthly Labor Review November 2001 69
Table 2. Continued—Employment by occupation, 2000 and projected 2010
[Numbers in thousands of jobs]
Occupation
Employment Change Total jobopenings
due to growthand net
replacements,2000-101
Number Percent distribution
Number Percent2000 2010 2000 2010
Opticians, dispensing ................................................................... 68 81 0.0 0.0 13 19.0 25 Other health practitioners and technical workers ......................... 266 317 .2 .2 50 19.0 119 Athletic trainers .......................................................................... 15 17 .0 .0 3 18.5 6 Occupational health and safety specialists and technicians ...... 35 40 .0 .0 5 15.0 14 Orthotists and prosthetists ......................................................... 5 6 .0 .0 1 17.3 2 All other health practitioners and technical workers .................. 212 253 .1 .2 42 19.7 96
Service occupations ........................................................................... 26,075 31,163 17.9 18.6 5,088 19.5 13,505
Healthcare support occupations ...................................................... 3,196 4,264 2.2 2.5 1,067 33.4 1,612 Dental assistants ........................................................................... 247 339 .2 .2 92 37.2 136 Massage therapists ........................................................................ 34 45 .0 .0 10 30.4 18 Nursing, psychiatric, and home health aides ................................. 2,053 2,676 1.4 1.6 623 30.4 885 Home health aides ....................................................................... 615 907 .4 .5 291 47.3 370 Nursing aides, orderlies, and attendants ..................................... 1,373 1,697 .9 1.0 323 23.5 498 Psychiatric aides .......................................................................... 65 73 .0 .0 9 13.2 17 Occupational therapist assistants and aides ................................. 25 35 .0 .0 10 41.5 18 Occupational therapist assistants ................................................ 17 23 .0 .0 7 39.7 11 Occupational therapist aides ....................................................... 9 12 .0 .0 4 45.2 6 Physical therapist assistants and aides ......................................... 80 116 .1 .1 36 45.5 60 Physical therapist assistants ........................................................ 44 64 .0 .0 20 44.8 33 Physical therapist aides ............................................................... 36 53 .0 .0 17 46.3 27 Medical assistants and other healthcare support occupations ...... 757 1,052 .5 .6 295 39.0 496 Medical assistants ....................................................................... 329 516 .2 .3 187 57.0 274 Medical equipment preparers ...................................................... 33 39 .0 .0 6 18.2 15 Medical transcriptionists .............................................................. 102 132 .1 .1 30 29.8 57 Pharmacy aides ........................................................................... 57 68 .0 .0 11 19.5 26 Veterinary assistants and laboratory animal caretakers .............. 55 77 .0 .0 22 39.8 37 All other healthcare support workers ........................................... 181 219 .1 .1 38 21.1 86 Protective service occupations ........................................................ 3,087 3,896 2.1 2.3 809 26.2 1,677 First-line supervisors/managers, protective service workers ......... 273 319 .2 .2 46 16.7 122 First-line supervisors/managers of correctional officers .............. 30 38 .0 .0 9 29.6 14 First-line supervisors/managers of fire fighting and prevention
workers .................................................................................. 62 66 .0 .0 4 7.2 24 First-line supervisors/managers of police and detectives ............ 121 136 .1 .1 16 13.1 48 First-line supervisors/managers of protective service workers,
except police, fire and corrections ......................................... 61 78 .0 .0 17 27.1 35 Fire fighters .................................................................................... 258 280 .2 .2 23 8.9 90 Fire inspectors ............................................................................... 13 15 .0 .0 2 15.1 5 Law enforcement workers .............................................................. 1,150 1,445 .8 .9 295 25.6 551 Bailiffs, correctional officers, and jailers ....................................... 427 563 .3 .3 136 31.8 240 Bailiffs ........................................................................................ 14 15 .0 .0 2 12.5 5 Correctional officers and jailers ................................................. 414 548 .3 .3 134 32.4 235 Detectives and criminal investigators .......................................... 93 108 .1 .1 15 16.4 36 Fish and game wardens .............................................................. 8 9 .0 .0 1 11.4 2 Parking enforcement workers ...................................................... 9 10 .0 .0 1 13.2 2 Police and sheriff"s patrol officers ............................................... 607 748 .4 .4 141 23.2 269 Transit and railroad police ........................................................... 6 7 .0 .0 1 16.5 2 Other protective service workers ................................................... 1,394 1,837 1.0 1.1 443 31.8 910 Animal control workers ................................................................ 9 10 .0 .0 1 12.8 8 Crossing guards ........................................................................... 74 81 .1 .0 6 8.7 32 Private detectives and investigators ............................................ 39 48 .0 .0 9 23.5 20 Security guards and gaming surveillance officers ....................... 1,117 1,509 .8 .9 393 35.2 698 Gaming surveillance officers and gaming investigators ............. 11 13 .0 .0 2 16.8 5 Security guards .......................................................................... 1,106 1,497 .8 .9 391 35.4 693 All other protective service workers ............................................. 156 190 .1 .1 34 21.7 153 Food preparation and serving related occupations .......................... 10,140 11,717 7.0 7.0 1,577 15.6 6,256 Supervisors, food preparation and serving workers ...................... 788 882 .5 .5 95 12.1 301 Chefs and head cooks ................................................................. 139 151 .1 .1 12 9.0 55 First-line supervisors/managers of food preparation and serving
workers .................................................................................. 649 731 .4 .4 83 12.7 246 Cooks and food preparation workers ............................................. 2,709 3,041 1.9 1.8 333 12.3 1,193 Cooks ........................................................................................... 1,864 2,054 1.3 1.2 190 10.2 725 Cooks, fast food ......................................................................... 522 518 .4 .3 -4 -.7 148 Cooks, institution and cafeteria .................................................. 465 500 .3 .3 35 7.6 167 Cooks, private household .......................................................... 5 4 .0 .0 -1 -18.0 1 Cooks, restaurant ...................................................................... 668 813 .5 .5 145 21.7 335 Cooks, short order ..................................................................... 205 219 .1 .1 14 6.8 72 Food preparation workers ............................................................ 844 988 .6 .6 143 16.9 469 Food and beverage serving workers ............................................. 5,201 6,384 3.6 3.8 1,182 22.7 4,218

70 Monthly Labor Review November 2001
Occupational Employment
Table 2. Continued—Employment by occupation, 2000 and projected 2010
[Numbers in thousands of jobs]
Occupation
Employment Change Total jobopenings
due to growthand net
replacements,2000-101
Number Percent distribution
Number Percent2000 2010 2000 2010
Bartenders ................................................................................... 387 439 0.3 0.3 52 13.4 204 Combined food preparation and serving workers, including fast
food ........................................................................................ 2,206 2,879 1.5 1.7 673 30.5 2,023 Counter attendants, cafeteria, food concession, and coffee shop 421 482 .3 .3 61 14.4 387 Food servers, nonrestaurant ........................................................ 205 238 .1 .1 34 16.4 124 Waiters and waitresses ................................................................ 1,983 2,347 1.4 1.4 364 18.3 1,479 Other food preparation and serving related workers ..................... 1,442 1,410 1.0 .8 -33 -2.3 543 Dining room and cafeteria attendants and bartender helpers ...... 431 402 .3 .2 -29 -6.7 145 Dishwashers ................................................................................ 525 483 .4 .3 -42 -8.0 197 Hosts and hostesses, restaurant, lounge, and coffee shop ......... 343 388 .2 .2 45 13.0 147 All other food preparation and serving related workers ............... 143 137 .1 .1 -7 -4.6 54 Building and grounds cleaning and maintenance occupations ........ 5,549 6,328 3.8 3.8 779 14.0 1,912 Supervisors, building and grounds cleaning and maintenance
workers .................................................................................. 378 441 .3 .3 63 16.7 131 First-line supervisors/managers of housekeeping and janitorial
workers .................................................................................. 219 250 .2 .1 31 14.2 91 First-line supervisors/managers of landscaping, lawn service,
and groundskeeping workers ................................................. 159 191 .1 .1 32 20.1 41 Building cleaning workers .............................................................. 3,981 4,381 2.7 2.6 400 10.1 1,179 Janitors and cleaners, except maids and housekeeping
cleaners ................................................................................. 2,348 2,665 1.6 1.6 317 13.5 741 Maids and housekeeping cleaners .............................................. 1,633 1,716 1.1 1.0 83 5.1 438 Grounds maintenance workers ...................................................... 973 1,245 .7 .7 272 27.9 516 Landscaping and groundskeeping workers ................................. 894 1,154 .6 .7 260 29.0 484 Pesticide handlers, sprayers, and applicators, vegetation ........... 27 30 .0 .0 4 13.6 10 Tree trimmers and pruners .......................................................... 52 61 .0 .0 8 16.3 22 Pest control workers ...................................................................... 58 71 .0 .0 13 22.1 24 All other building and grounds cleaning and maintenance workers 159 190 .1 .1 31 19.6 63 Personal care and service occupations ........................................... 4,103 4,959 2.8 3.0 856 20.9 2,047 First-line supervisors/managers of personal service workers ........ 125 144 .1 .1 19 15.1 53 Animal care and service workers ................................................... 145 176 .1 .1 31 21.2 61 Animal trainers ............................................................................. 15 17 .0 .0 3 18.4 5 Nonfarm animal caretakers .......................................................... 131 159 .1 .1 28 21.6 56 Child care workers ......................................................................... 1,193 1,319 .8 .8 127 10.6 531 Entertainment attendants and related workers ............................. 344 421 .2 .3 77 22.5 247 Motion picture projectionists ........................................................ 11 8 .0 .0 -3 -27.0 3 Ushers, lobby attendants, and ticket takers ................................. 112 124 .1 .1 12 11.0 102 Miscellaneous entertainment attendants and related workers ..... 221 289 .2 .2 68 30.9 142 Amusement and recreation attendants ...................................... 197 260 .1 .2 64 32.4 130 Costume, locker room and other attendants .............................. 24 28 .0 .0 5 19.1 13 Funeral service workers ................................................................. 33 38 .0 .0 5 13.8 12 Embalmers ................................................................................... 7 7 .0 .0 0 -.6 2 Funeral attendants ....................................................................... 26 31 .0 .0 5 17.8 11 Gaming occupations ...................................................................... 167 211 .1 .1 44 26.5 98 First-line supervisors/managers, gaming workers ....................... 46 55 .0 .0 9 20.0 22 Gaming supervisors ................................................................... 31 37 .0 .0 6 18.4 15 Slot key persons ........................................................................ 14 18 .0 .0 3 23.3 7 Gaming services workers ............................................................ 100 131 .1 .1 31 31.1 65 Gaming and sports book writers and runners ............................ 12 15 .0 .0 3 21.6 7 Gaming dealers ......................................................................... 88 116 .1 .1 28 32.4 59 All other gaming service workers ................................................. 21 25 .0 .0 4 18.7 11 Personal appearance workers ....................................................... 790 880 .5 .5 90 11.4 294 Barbers ........................................................................................ 73 64 .0 .0 -8 -11.5 21 Hairdressers, hairstylists, and cosmetologists ............................. 636 718 .4 .4 82 13.0 238 Miscellaneous personal appearance workers .............................. 81 97 .1 .1 16 19.8 36 Manicurists and pedicurists ....................................................... 40 51 .0 .0 11 26.5 21 Shampooers .............................................................................. 20 22 .0 .0 3 13.2 7 Skin care specialists .................................................................. 21 24 .0 .0 3 13.3 8 Personal and home care aides ...................................................... 414 672 .3 .4 258 62.5 322 Recreation and fitness workers ..................................................... 427 545 .3 .3 118 27.6 206 Fitness trainers and aerobics instructors ..................................... 158 222 .1 .1 64 40.3 97 Recreation workers ...................................................................... 269 323 .2 .2 54 20.1 110 Residential advisors ....................................................................... 44 55 .0 .0 11 24.0 21 Transportation, tourism, and lodging attendants ........................... 259 300 .2 .2 41 15.7 128 Baggage porters, bellhops, and concierges ................................ 68 78 .0 .0 9 13.4 33 Baggage porters and bellhops ................................................... 51 57 .0 .0 6 12.6 24 Concierges ................................................................................. 18 20 .0 .0 3 15.7 9 Tour and travel guides ................................................................. 44 48 .0 .0 4 9.5 18 Transportation attendants ............................................................ 147 174 .1 .1 27 18.6 78 Flight attendants ........................................................................ 124 147 .1 .1 23 18.4 65

Monthly Labor Review November 2001 71
Table 2. Continued—Employment by occupation, 2000 and projected 2010
[Numbers in thousands of jobs]
Occupation
Employment Change Total jobopenings
due to growthand net
replacements,2000-101
Number Percent distribution
Number Percent2000 2010 2000 2010
Transportation attendants, except flight attendants andbaggage porters ..................................................................... 23 27 0.0 0.0 5 20.0 12
All other personal care and service workers .................................. 163 198 .1 .1 35 21.7 72
Sales and related occupations ........................................................... 15,513 17,365 10.7 10.4 1,852 11.9 6,712
Advertising sales agents .................................................................. 155 196 .1 .1 41 26.3 72 Cashiers ........................................................................................... 3,363 3,851 2.3 2.3 488 14.5 2,013 Cashiers, except gaming ............................................................... 3,325 3,799 2.3 2.3 474 14.2 1,982 Gaming change persons and booth cashiers ................................ 38 52 .0 .0 14 36.1 31 Counter and rental clerks ................................................................. 423 506 .3 .3 82 19.4 274 Door-to-door sales workers, news and street vendors, and related
workers .................................................................................. 166 156 .1 .1 -10 -6.2 42 Insurance sales agents .................................................................... 378 390 .3 .2 13 3.3 109 Models, demonstrators, and product promoters .............................. 121 152 .1 .1 30 24.9 70 Demonstrators and product promoters .......................................... 118 147 .1 .1 29 24.9 68 Models ........................................................................................... 4 5 .0 .0 1 26.0 2 Parts salespersons .......................................................................... 260 248 .2 .1 -12 -4.4 77 Real estate brokers and sales agents ............................................. 432 473 .3 .3 41 9.5 116 Real estate brokers ........................................................................ 93 102 .1 .1 9 9.6 25 Real estate sales agents ............................................................... 339 371 .2 .2 32 9.5 91 Retail salespersons ......................................................................... 4,109 4,619 2.8 2.8 510 12.4 2,073 Sales engineers ............................................................................... 85 100 .1 .1 15 17.7 37 Sales representatives, wholesale and manufacturing ..................... 1,821 1,932 1.3 1.2 111 6.1 606 Sales representatives, wholesale and manufacturing, technical
and scientific products ........................................................... 396 426 .3 .3 30 7.5 137 Sales representatives, wholesale and manufacturing, except
technical and scientific products ............................................ 1,425 1,507 1.0 .9 82 5.7 469 Securities, commodities, and financial services sales agents ......... 367 449 .3 .3 82 22.3 112 Supervisors, sales workers .............................................................. 2,504 2,697 1.7 1.6 193 7.7 556 First-line supervisors/managers of retail sales workers ................. 2,072 2,240 1.4 1.3 168 8.1 467 First-line supervisors/managers of non-retail sales workers .......... 432 457 .3 .3 25 5.8 89 Telemarketers .................................................................................. 572 699 .4 .4 127 22.2 244 Travel agents ................................................................................... 135 139 .1 .1 4 3.2 37 All other sales and related workers .................................................. 621 758 .4 .5 137 22.0 273
Office and administrative support occupations .................................. 23,882 26,053 16.4 15.5 2,171 9.1 7,667
First-line supervisors/managers of office and administrativesupport workers ..................................................................... 1,392 1,522 1.0 .9 130 9.4 399
Communications equipment operators ............................................ 339 273 .2 .2 -65 -19.3 101 Switchboard operators, including answering service ..................... 259 218 .2 .1 -41 -15.7 77 Telephone operators ...................................................................... 54 35 .0 .0 -19 -35.3 16 All other communications equipment operators ............................. 26 20 .0 .0 -6 -21.8 9 Financial, information, and record clerks ......................................... 9,006 10,178 6.2 6.1 1,172 13.0 3,237 Financial clerks .............................................................................. 3,696 3,821 2.5 2.3 126 3.4 1,121 Bill and account collectors ........................................................... 400 502 .3 .3 101 25.3 201 Billing and posting clerks and machine operators ....................... 506 549 .3 .3 43 8.5 167 Bookkeeping, accounting, and auditing clerks ............................. 1,991 2,030 1.4 1.2 39 2.0 417 Gaming cage workers .................................................................. 22 27 .0 .0 6 25.2 15 Payroll and timekeeping clerks .................................................... 201 206 .1 .1 5 2.3 63 Procurement clerks ...................................................................... 76 67 .1 .0 -9 -12.2 17 Tellers .......................................................................................... 499 440 .3 .3 -59 -11.8 240 Information and record clerks ........................................................ 5,099 6,105 3.5 3.6 1,006 19.7 2,047 Brokerage clerks .......................................................................... 70 69 .0 .0 -1 -1.4 9 Correspondence clerks ................................................................ 38 42 .0 .0 3 9.1 15 Court, municipal, and license clerks ............................................ 105 117 .1 .1 13 12.0 29 Credit authorizers, checkers, and clerks ...................................... 86 90 .1 .1 4 4.1 11 Customer service representatives ............................................... 1,946 2,577 1.3 1.5 631 32.4 796 Eligibility interviewers, government programs ............................. 117 106 .1 .1 -11 -9.3 34 File clerks ..................................................................................... 288 314 .2 .2 26 9.1 118 Hotel, motel, and resort desk clerks ............................................ 177 236 .1 .1 59 33.4 136 Human resources assistants, except payroll and timekeeping .... 177 211 .1 .1 34 19.3 74 Interviewers, except eligibility and loan ....................................... 154 205 .1 .1 51 33.4 84 Library assistants, clerical ............................................................ 98 118 .1 .1 19 19.7 63 Loan interviewers and clerks ....................................................... 139 101 .1 .1 -38 -27.6 9 New accounts clerks .................................................................... 87 89 .1 .1 2 2.7 21 Order clerks ................................................................................. 348 277 .2 .2 -71 -20.4 74 Receptionists and information clerks ........................................... 1,078 1,334 .7 .8 256 23.7 493 Reservation and transportation ticket agents and travel clerks ... 191 219 .1 .1 28 14.5 79

72 Monthly Labor Review November 2001
Occupational Employment
Table 2. Continued—Employment by occupation, 2000 and projected 2010
[Numbers in thousands of jobs]
Occupation
Employment Change Total jobopenings
due to growthand net
replacements,2000-101
Number Percent distribution
Number Percent2000 2010 2000 2010
All other financial, information, and record clerks .......................... 211 252 0.1 0.2 41 19.3 69 Material recording, scheduling, dispatching, and distributing
occupations ............................................................................ 4,238 4,579 2.9 2.7 341 8.1 1,530 Cargo and freight agents ............................................................... 60 65 .0 .0 5 8.3 17 Couriers and Messengers .............................................................. 141 135 .1 .1 -5 -3.9 38 Dispatchers .................................................................................... 254 304 .2 .2 50 19.6 92 Dispatchers, except police, fire, and ambulance ......................... 168 206 .1 .1 37 22.2 65 Police, fire, and ambulance dispatchers ...................................... 86 98 .1 .1 12 14.5 27 Meter readers, utilities ................................................................... 49 36 .0 .0 -13 -26.0 12 Postal service workers ................................................................... 688 683 .5 .4 -5 -.7 187 Postal service clerks .................................................................... 74 76 .1 .0 2 2.4 18 Postal service mail carriers .......................................................... 324 332 .2 .2 8 2.4 106 Postal service mail sorters, processors, and processing
machine operators ................................................................. 289 275 .2 .2 -14 -4.9 63 Production, planning, and expediting clerks .................................. 332 391 .2 .2 60 17.9 115 Shipping, receiving, and traffic clerks ............................................ 890 973 .6 .6 83 9.3 262 Stock clerks and order fillers .......................................................... 1,679 1,821 1.2 1.1 142 8.5 740 Weighers, measurers, checkers, and samplers, recordkeeping .... 83 98 .1 .1 15 17.9 35 All other material recording, scheduling, dispatching, and
distributing workers ................................................................ 63 73 .0 .0 10 15.5 32 Secretaries, administrative assistants, and other office support
occupations ............................................................................ 8,908 9,500 6.1 5.7 592 6.6 2,400 Computer operators ....................................................................... 194 161 .1 .1 -33 -17.1 35 Data entry and information processing workers ............................ 806 774 .6 .5 -32 -3.9 165 Data entry keyers ......................................................................... 509 534 .3 .3 25 4.9 106 Word processors and typists ....................................................... 297 240 .2 .1 -57 -19.1 60 Desktop publishers ........................................................................ 38 63 .0 .0 25 66.7 32 Insurance claims and policy processing clerks .............................. 289 231 .2 .1 -58 -20.2 50 Mail clerks and mail machine operators, except postal service ..... 188 207 .1 .1 19 9.9 74 Office clerks, general ..................................................................... 2,705 3,135 1.9 1.9 430 15.9 949 Office machine operators, except computer .................................. 84 68 .1 .0 -16 -18.8 29 Proofreaders and copy markers .................................................... 35 33 .0 .0 -2 -5.5 13 Secretaries and administrative assistants ..................................... 3,902 4,167 2.7 2.5 265 6.8 946 Executive secretaries and administrative assistants ................... 1,445 1,612 1.0 1.0 167 11.5 412 Legal secretaries ......................................................................... 279 336 .2 .2 57 20.3 104 Medical secretaries ...................................................................... 314 373 .2 .2 60 19.0 113 Secretaries, except legal, medical, and executive ....................... 1,864 1,846 1.3 1.1 -18 -1.0 317 Statistical assistants ...................................................................... 21 22 .0 .0 0 2.1 2 All other secretaries, administrative assistants, and other office
support workers ..................................................................... 645 639 .4 .4 -6 -.9 104
Farming, fishing, and forestry occupations ........................................ 1,429 1,480 1.0 .9 51 3.6 485
First-line supervisors/managers/contractors of farming, fishing,and forestry workers .............................................................. 100 113 .1 .1 13 13.0 21
Agricultural workers ......................................................................... 987 1,024 .7 .6 37 3.7 359 Agricultural inspectors ................................................................... 15 16 .0 .0 1 6.6 5 Farmworkers .................................................................................. 909 939 .6 .6 30 3.3 334 Graders and sorters, agricultural products .................................... 63 69 .0 .0 6 9.1 20 Fishers and fishing vessel operators ............................................... 53 46 .0 .0 -6 -12.2 17 Forest, conservation, and logging workers ...................................... 90 88 .1 .1 -2 -1.8 19 Forest and conservation workers ................................................... 21 22 .0 .0 1 3.9 6 Logging workers ............................................................................ 69 66 .0 .0 -2 -3.5 13 Fallers .......................................................................................... 13 12 .0 .0 -1 -8.7 3 Logging equipment operators ...................................................... 47 46 .0 .0 -1 -2.0 9 Log graders and scalers .............................................................. 8 8 .0 .0 0 -4.0 2 All other farming, fishing, and forestry workers ................................ 199 209 .1 .1 10 4.9 70
Construction and extraction occupations ........................................... 7,451 8,439 5.1 5.0 989 13.3 2,469
First-line supervisors/managers of construction trades andextraction workers .................................................................. 792 923 .5 .6 131 16.5 311
Construction trades and related workers ......................................... 6,466 7,328 4.4 4.4 862 13.3 2,086 Boilermakers .................................................................................. 27 28 .0 .0 1 2.1 8 Brickmasons, blockmasons, and stonemasons ............................. 158 179 .1 .1 21 13.2 50 Brickmasons and blockmasons ................................................... 144 162 .1 .1 18 12.5 45 Stonemasons ............................................................................... 14 17 .0 .0 3 20.8 5 Carpenters ..................................................................................... 1,204 1,302 .8 .8 98 8.2 302 Carpet, floor, and tile installers and finishers ................................. 167 189 .1 .1 22 13.2 50 Carpet installers ........................................................................... 76 84 .1 .1 8 10.5 21

Monthly Labor Review November 2001 73
Table 2. Continued—Employment by occupation, 2000 and projected 2010
[Numbers in thousands of jobs]
Occupation
Employment Change Total jobopenings
due to growthand net
replacements,2000-101
Number Percent distribution
Number Percent2000 2010 2000 2010
Floor layers, except carpet, wood, and hard tiles ........................ 23 27 0.0 0.0 4 15.8 8 Floor sanders and finishers ......................................................... 14 16 .0 .0 2 14.7 4 Tile and marble setters ................................................................ 54 62 .0 .0 8 15.6 17 Cement masons, concrete finishers, and terrazzo workers ........... 166 171 .1 .1 5 3.0 19 Cement masons and concrete finishers ...................................... 162 167 .1 .1 5 3.0 19 Terrazzo workers and finishers .................................................... 3 4 .0 .0 0 2.0 0 Construction laborers ..................................................................... 791 926 .5 .6 135 17.0 207 Construction equipment operators ................................................. 416 450 .3 .3 34 8.1 123 Operating engineers and other construction equipment
operators ................................................................................ 357 382 .2 .2 25 6.9 103 Paving, surfacing, and tamping equipment operators ................. 55 63 .0 .0 8 15.5 19 Pile-driver operators .................................................................... 4 5 .0 .0 1 14.0 1 Drywall installers, ceiling tile installers, and tapers ........................ 188 205 .1 .1 17 9.1 35 Drywall and ceiling tile installers .................................................. 143 157 .1 .1 13 9.4 27 Tapers .......................................................................................... 44 48 .0 .0 4 8.3 8 Electricians .................................................................................... 698 819 .5 .5 120 17.3 251 Glaziers .......................................................................................... 49 56 .0 .0 7 14.8 16 Insulation workers .......................................................................... 53 60 .0 .0 7 13.6 23 Painters, construction and maintenance ........................................ 491 585 .3 .3 94 19.1 180 Paperhangers ................................................................................ 27 32 .0 .0 5 20.2 10 Pipelayers, plumbers, pipefitters, and steamfitters ........................ 568 627 .4 .4 59 10.4 153 Pipelayers .................................................................................... 65 73 .0 .0 8 11.9 19 Plumbers, pipefitters, and steamfitters ........................................ 503 554 .3 .3 51 10.2 134 Plasterers and stucco masons ....................................................... 54 61 .0 .0 6 11.9 16 Reinforcing iron and rebar workers ................................................ 27 32 .0 .0 5 17.5 8 Roofers .......................................................................................... 158 188 .1 .1 31 19.4 67 Sheet metal workers ...................................................................... 224 275 .2 .2 51 23.0 98 Structural iron and steel workers ................................................... 84 99 .1 .1 15 18.4 24 Helpers, construction trades .......................................................... 450 510 .3 .3 60 13.3 283 Helpers-Brickmasons, blockmasons, stonemasons, and tile and
marble setters ........................................................................ 58 66 .0 .0 8 14.1 37 Helpers-Carpenters ..................................................................... 101 108 .1 .1 7 6.6 57 Helpers-Electricians ..................................................................... 114 129 .1 .1 15 13.3 72 Helpers-Painters, paperhangers, plasterers, and stucco masons 27 30 .0 .0 3 12.9 17 Helpers-Pipelayers, plumbers, pipefitters, and steamfitters ........ 86 96 .1 .1 10 11.5 53 Helpers-Roofers ........................................................................... 23 28 .0 .0 5 19.3 16 All other helpers, construction trades .......................................... 41 53 .0 .0 12 29.1 32 Other construction and related workers ......................................... 465 534 .3 .3 69 14.8 162 Construction and building inspectors ........................................... 75 86 .1 .1 11 15.0 28 Elevator installers and repairers .................................................. 23 27 .0 .0 4 17.2 11 Fence erectors ............................................................................. 29 30 .0 .0 1 4.6 6 Hazardous materials removal workers ........................................ 37 49 .0 .0 12 32.8 23 Highway maintenance workers .................................................... 151 159 .1 .1 8 5.2 31 Rail-track laying and maintenance equipment operators ............. 12 9 .0 .0 -3 -26.1 3 Septic tank servicers and sewer pipe cleaners ............................ 15 18 .0 .0 3 16.5 6 All other construction and related workers ................................... 123 156 .1 .1 33 26.7 54 Extraction workers ........................................................................... 193 189 .1 .1 -4 -2.1 72 Derrick, rotary drill, and service unit operators, oil, gas, and
mining .................................................................................... 45 44 .0 .0 -2 -3.5 16 Derrick operators, oil and gas ...................................................... 16 16 .0 .0 0 .1 6 Rotary drill operators, oil and gas ................................................ 18 17 .0 .0 -1 -8.0 6 Service unit operators, oil, gas, and mining ................................. 11 11 .0 .0 0 -1.2 4 Earth drillers, except oil and gas .................................................... 24 27 .0 .0 3 12.6 8 Explosives workers, ordnance handling experts, and blasters ...... 5 5 .0 .0 0 1.9 2 Helpers-Extraction workers ............................................................ 37 38 .0 .0 1 2.4 18 Mining machine operators ............................................................. 22 19 .0 .0 -3 -12.9 8 Continuous mining machine operators ........................................ 10 8 .0 .0 -1 -13.4 3 Miscellaneous mining machine operators .................................... 12 11 .0 .0 -2 -12.5 4 Roustabouts, oil and gas ............................................................... 41 40 .0 .0 -2 -4.2 14 All other extraction workers ........................................................... 19 17 .0 .0 -2 -10.7 7
Installation, maintenance, and repair occupations ............................. 5,820 6,482 4.0 3.9 662 11.4 1,944
First-line supervisors/managers of mechanics, installers, andrepairers ................................................................................. 442 513 .3 .3 71 16.0 186
Electrical and electronic equipment mechanics, installers, andrepairers ................................................................................. 683 726 .5 .4 43 6.3 178
Avionics technicians ...................................................................... 16 17 .0 .0 2 9.8 5 Computer, automated teller, and office machine repairers ............ 172 197 .1 .1 24 14.2 43 Electric motor, power tool, and related repairers ........................... 37 40 .0 .0 3 7.9 11

74 Monthly Labor Review November 2001
Occupational Employment
Table 2. Continued—Employment by occupation, 2000 and projected 2010
[Numbers in thousands of jobs]
Occupation
Employment Change Total jobopenings
due to growthand net
replacements,2000-101
Number Percent distribution
Number Percent2000 2010 2000 2010
Electrical and electronics installers and repairers, transportationequipment .............................................................................. 14 15 0.0 0.0 2 13.6 4
Electrical and electronics repairers, industrial and utility ............... 108 116 .1 .1 8 7.3 30 Electrical and electronics repairers, commercial and industrial
equipment .............................................................................. 90 98 .1 .1 8 9.2 26 Electrical and electronics repairers, powerhouse, substation,
and relay ................................................................................ 18 18 .0 .0 0 -2.3 4 Electronic equipment installers and repairers, motor vehicles ....... 13 15 .0 .0 2 15.6 5 Electronic home entertainment equipment installers and repairers 37 30 .0 .0 -7 -17.9 7 Radio and telecommunications equipment installers and
repairers ................................................................................. 196 188 .1 .1 -7 -3.8 37 Radio mechanics ......................................................................... 7 5 .0 .0 -2 -24.2 1 Telecommunications equipment installers and repairers, except
line installers .......................................................................... 189 183 .1 .1 -6 -3.1 36 Security and fire alarm systems installers ..................................... 44 54 .0 .0 10 23.4 18 All other electrical and electronic equipment mechanics,
installers, and repairers ......................................................... 48 54 .0 .0 6 13.4 17 Vehicle and mobile equipment mechanics, installers, and repairers 1,931 2,218 1.3 1.3 286 14.8 778 Aircraft mechanics and service technicians ................................... 158 184 .1 .1 26 16.7 60 Automotive body and related repairers .......................................... 199 219 .1 .1 20 10.2 69 Automotive glass installers and repairers ...................................... 22 24 .0 .0 2 10.5 8 Automotive service technicians and mechanics ............................ 840 991 .6 .6 151 18.0 349 Bus and truck mechanics and diesel engine specialists ................ 285 326 .2 .2 40 14.2 114 Heavy vehicle and mobile equipment service technicians and
mechanics .............................................................................. 185 203 .1 .1 17 9.4 66 Farm equipment mechanics ........................................................ 41 42 .0 .0 0 .9 11 Mobile heavy equipment mechanics, except engines ................. 130 148 .1 .1 18 14.0 52 Rail car repairers ......................................................................... 14 13 .0 .0 -1 -7.6 4 Small engine mechanics ................................................................ 73 79 .0 .0 6 8.6 24 Motorboat mechanics .................................................................. 25 27 .0 .0 2 9.0 9 Motorcycle mechanics ................................................................. 14 16 .0 .0 1 8.6 5 Outdoor power equipment and other small engine mechanics .... 33 36 .0 .0 3 8.2 11 Miscellaneous vehicle and mobile equipment mechanics,
installers, and repairers ......................................................... 170 192 .1 .1 22 13.2 87 Bicycle repairers .......................................................................... 9 10 .0 .0 2 17.7 5 Recreational vehicle service technicians ..................................... 12 15 .0 .0 3 25.4 8 Tire repairers and changers ......................................................... 89 95 .1 .1 6 6.8 40 All other vehicle and mobile equipment mechanics, installers,
and repairers .......................................................................... 60 72 .0 .0 12 19.6 35 Other installation, maintenance, and repair occupations ................. 2,764 3,026 1.9 1.8 262 9.5 802 Coin, vending, and amusement machine servicers and repairers 37 44 .0 .0 7 18.5 15 Control and valve installers and repairers ..................................... 46 48 .0 .0 2 5.2 17 Control and valve installers and repairers, except mechanical
door ........................................................................................ 34 35 .0 .0 1 2.7 12 Mechanical door repairers ........................................................... 11 13 .0 .0 1 12.7 5 Heating, air conditioning, and refrigeration mechanics and
installers ................................................................................. 243 297 .2 .2 54 22.3 79 Helpers-Installation, maintenance, and repair workers .................. 145 172 .1 .1 27 18.5 101 Home appliance repairers .............................................................. 43 46 .0 .0 3 6.2 11 Industrial machinery mechanics .................................................... 198 205 .1 .1 7 3.4 60 Line installers and repairers ........................................................... 263 317 .2 .2 54 20.7 118 Electrical power-line installers and repairers ............................... 99 108 .1 .1 9 9.3 41 Telecommunications line installers and repairers ........................ 164 209 .1 .1 45 27.6 76 Locksmiths and safe repairers ....................................................... 23 25 .0 .0 2 8.7 10 Maintenance and repair workers, general ..................................... 1,251 1,310 .9 .8 59 4.7 221 Maintenance workers, machinery .................................................. 114 120 .1 .1 7 5.8 37 Manufactured building and mobile home installers ........................ 17 20 .0 .0 3 19.1 7 Millwrights ...................................................................................... 72 75 .0 .0 3 3.9 25 Precision instrument and equipment repairers .............................. 63 69 .0 .0 6 9.7 22 Camera and photographic equipment repairers .......................... 7 7 .0 .0 0 -2.1 2 Medical equipment repairers ....................................................... 28 33 .0 .0 4 14.9 11 Musical instrument repairers and tuners ...................................... 7 8 .0 .0 1 9.4 2 Watch repairers ........................................................................... 5 6 .0 .0 0 6.2 2 All other precision instrument and equipment repairers .............. 15 16 .0 .0 1 6.8 5 Riggers .......................................................................................... 20 22 .0 .0 2 10.1 6 All other installation, maintenance, and repair workers ................. 228 254 .2 .2 26 11.5 73
Production occupations ..................................................................... 13,060 13,811 9.0 8.2 750 5.7 3,932

Monthly Labor Review November 2001 75
Table 2. Continued—Employment by occupation, 2000 and projected 2010
[Numbers in thousands of jobs]
Occupation
Employment Change Total jobopenings
due to growthand net
replacements,2000-101
Number Percent distribution
Number Percent2000 2010 2000 2010
First-line supervisors/managers of production and operatingworkers .................................................................................. 819 827 0.6 0.5 9 1.0 224
Assemblers and fabricators ............................................................. 2,653 2,824 1.8 1.7 171 6.5 702 Aircraft structure, surfaces, rigging, and systems assemblers ...... 20 23 .0 .0 3 14.2 8 Electrical, electronics, and electromechanical assemblers ............ 508 492 .3 .3 -16 -3.1 138 Coil winders, tapers, and finishers ............................................... 56 61 .0 .0 5 8.2 19 Electrical and electronic equipment assemblers .......................... 379 355 .3 .2 -24 -6.3 97 Electromechanical equipment assemblers .................................. 73 76 .1 .0 3 4.5 22 Engine and other machine assemblers ......................................... 67 72 .0 .0 5 7.1 18 Structural metal fabricators and fitters ........................................... 101 120 .1 .1 20 19.5 35 Miscellaneous assemblers and fabricators .................................... 1,957 2,117 1.3 1.3 160 8.2 503 Fiberglass laminators and fabricators .......................................... 48 53 .0 .0 5 11.4 14 Team assemblers ........................................................................ 1,458 1,545 1.0 .9 87 5.9 342 Timing device assemblers, adjusters, and calibrators ................. 12 12 .0 .0 0 2.5 2 All other assemblers and fabricators ........................................... 439 507 .3 .3 68 15.4 144 Food processing occupations .......................................................... 760 783 .5 .5 23 3.0 214 Bakers ............................................................................................ 160 187 .1 .1 27 16.8 52 Butchers and other meat, poultry, and fish processing workers .... 411 415 .3 .2 5 1.2 117 Butchers and meat cutters ........................................................... 141 128 .1 .1 -13 -8.9 34 Meat, poultry, and fish cutters and trimmers ................................ 148 162 .1 .1 14 9.5 50 Slaughterers and meat packers ................................................... 122 125 .1 .1 3 2.6 33 Food and tobacco roasting, baking, and drying machine
operators and tenders ............................................................ 18 17 .0 .0 -2 -9.0 4 Food batchmakers ......................................................................... 66 67 .0 .0 1 1.4 17 Food cooking machine operators and tenders .............................. 37 37 .0 .0 0 .6 7 All other food processing workers .................................................. 69 61 .0 .0 -8 -11.6 17 Metal workers and plastic workers ................................................... 2,907 3,156 2.0 1.9 249 8.6 994 Computer control programmers and operators .............................. 186 222 .1 .1 36 19.3 102 Computer-controlled machine tool operators, metal and plastic .. 162 194 .1 .1 32 19.7 89 Numerical tool and process control programmers ....................... 24 28 .0 .0 4 16.6 12 Cutting, punching, and press machine setters, operators, and
tenders, metal and plastic ...................................................... 372 357 .3 .2 -15 -4.0 73 Drilling and boring machine tool setters, operators, and tenders,
metal and plastic .................................................................... 71 68 .0 .0 -3 -4.5 23 Extruding and drawing machine setters, operators, and tenders,
metal and plastic .................................................................... 126 143 .1 .1 17 13.5 45 Forging machine setters, operators, and tenders, metal and
plastic ..................................................................................... 54 59 .0 .0 5 9.1 22 Grinding, lapping, polishing, and buffing machine tool setters,
operators, and tenders, metal and plastic .............................. 145 156 .1 .1 11 7.3 46 Heat treating equipment setters, operators, and tenders, metal
and plastic .............................................................................. 43 49 .0 .0 6 13.4 14 Lathe and turning machine tool setters, operators, and tenders,
metal and plastic .................................................................... 84 78 .1 .0 -6 -7.4 33 Lay-out workers, metal and plastic ................................................ 18 17 .0 .0 -1 -6.0 5 Machinists ...................................................................................... 430 469 .3 .3 39 9.1 127 Metal furnace and kiln operators and tenders ............................... 40 43 .0 .0 3 7.2 14 Metal-refining furnace operators and tenders .............................. 24 26 .0 .0 2 7.4 8 Pourers and casters, metal .......................................................... 16 18 .0 .0 1 6.9 6 Milling and planing machine setters, operators, and tenders,
metal and plastic .................................................................... 34 32 .0 .0 -2 -6.7 11 Model makers and patternmakers, metal and plastic .................... 19 18 .0 .0 -1 -5.6 5 Model makers, metal and plastic ................................................. 11 10 .0 .0 0 -3.2 3 Patternmakers, metal and plastic ................................................ 9 8 .0 .0 -1 -8.4 2 Molders and molding machine setters, operators, and tenders,
metal and plastic .................................................................... 235 252 .2 .2 17 7.0 65 Foundry mold and coremakers .................................................... 59 59 .0 .0 -1 -1.2 12 Molding, coremaking, and casting machine setters, operators,
and tenders, metal and plastic ............................................... 176 193 .1 .1 17 9.8 53 Multiple machine tool setters, operators, and tenders, metal and
plastic ..................................................................................... 105 121 .1 .1 15 14.7 32 Plating and coating machine setters, operators, and tenders,
metal and plastic .................................................................... 65 72 .0 .0 7 10.2 20 Rolling machine setters, operators, and tenders, metal and
plastic ..................................................................................... 49 50 .0 .0 1 1.4 17 Tool and die makers ...................................................................... 130 132 .1 .1 3 2.2 35 Tool grinders, filers, and sharpeners ............................................. 29 27 .0 .0 -2 -7.7 8 Welding, soldering, and brazing workers ....................................... 521 618 .4 .4 97 18.7 244 Welders, cutters, solderers, and brazers ..................................... 446 532 .3 .3 86 19.3 211

76 Monthly Labor Review November 2001
Occupational Employment
Table 2. Continued—Employment by occupation, 2000 and projected 2010
[Numbers in thousands of jobs]
Occupation
Employment Change Total jobopenings
due to growthand net
replacements,2000-101
Number Percent distribution
Number Percent2000 2010 2000 2010
Welding, soldering, and brazing machine setters, operators, andtenders ................................................................................... 74 86 0.1 0.1 11 15.1 32
All other metal workers and plastic workers .................................. 150 174 .1 .1 25 16.4 54 Plant and system operators ............................................................. 368 384 .3 .2 16 4.4 133 Power plant operators, distributors, and dispatchers ..................... 55 55 .0 .0 0 -.4 17 Nuclear power reactor operators ................................................. 4 4 .0 .0 0 -3.4 1 Power distributors and dispatchers .............................................. 15 14 .0 .0 -1 -5.1 4 Power plant operators .................................................................. 36 37 .0 .0 1 1.8 11 Stationary engineers and boiler operators ..................................... 57 56 .0 .0 -1 -1.3 16 Water and liquid waste treatment plant and system operators ...... 88 104 .1 .1 16 18.1 44 Miscellaneous plant and system operators .................................... 167 168 .1 .1 1 .6 56 Chemical plant and system operators ......................................... 71 69 .0 .0 -2 -3.3 22 Gas plant operators ..................................................................... 12 11 .0 .0 -1 -6.3 4 Petroleum pump system operators, refinery operators, and
gaugers .................................................................................. 35 34 .0 .0 -1 -4.1 11 All other plant and system operators ........................................... 49 54 .0 .0 6 11.4 20 Printing occupations ........................................................................ 534 543 .4 .3 8 1.6 160 Bookbinders and bindery workers ................................................. 115 124 .1 .1 9 7.4 39 Bindery workers ........................................................................... 105 113 .1 .1 8 7.3 36 Bookbinders ................................................................................. 10 10 .0 .0 1 8.2 3 Job printers .................................................................................... 56 59 .0 .0 4 6.4 18 Prepress technicians and workers ................................................. 107 90 .1 .1 -17 -15.6 26 Printing machine operators ............................................................ 222 234 .2 .1 12 5.5 68 All other printing workers ............................................................... 34 35 .0 .0 1 2.0 9 Textile, apparel, and furnishings occupations .................................. 1,317 1,285 .9 .8 -32 -2.4 301 Extruding and forming machine setters, operators, and tenders,
synthetic and glass fibers ...................................................... 41 44 .0 .0 2 5.7 13 Fabric and apparel patternmakers ................................................. 15 14 .0 .0 -1 -5.4 5 Laundry and dry-cleaning workers ................................................. 236 263 .2 .2 27 11.4 89 Pressers, textile, garment, and related materials .......................... 110 112 .1 .1 2 1.7 17 Sewing machine operators ............................................................ 399 348 .3 .2 -51 -12.9 42 Shoe and leather workers and repairers ........................................ 19 15 .0 .0 -4 -21.4 7 Shoe machine operators and tenders ............................................ 9 4 .0 .0 -5 -53.6 1 Tailors, dressmakers, and sewers ................................................. 101 91 .1 .1 -9 -9.3 22 Sewers, hand ............................................................................... 43 40 .0 .0 -3 -6.6 9 Tailors, dressmakers, and custom sewers .................................. 58 51 .0 .0 -7 -11.4 13 Textile bleaching and dyeing machine operators and tenders ...... 37 41 .0 .0 4 10.8 11 Textile cutting machine setters, operators, and tenders ................ 38 35 .0 .0 -2 -6.5 6 Textile knitting and weaving machine setters, operators, and
tenders ................................................................................... 70 68 .0 .0 -2 -2.4 11 Textile winding, twisting, and drawing out machine setters,
operators, and tenders ........................................................... 90 86 .1 .1 -4 -4.4 19 Upholsterers .................................................................................. 58 53 .0 .0 -6 -9.5 19 All other textile, apparel, and furnishings workers ......................... 95 112 .1 .1 17 18.0 36 Woodworkers ................................................................................... 409 446 .3 .3 37 9.0 187 Cabinetmakers and bench carpenters ........................................... 159 175 .1 .1 16 9.8 66 Furniture finishers .......................................................................... 45 49 .0 .0 4 8.4 22 Model makers and patternmakers, wood ....................................... 10 12 .0 .0 2 16.0 6 Sawing machine setters, operators, and tenders, wood ................ 57 64 .0 .0 7 11.7 29 Woodworking machine setters, operators, and tenders, except
sawing .................................................................................... 103 108 .1 .1 5 5.3 47 All other woodworkers ................................................................... 35 38 .0 .0 4 10.6 18 Other production occupations .......................................................... 3,293 3,563 2.3 2.1 269 8.2 1,017 Cementing and gluing machine operators and tenders ................. 36 38 .0 .0 2 6.7 11 Chemical processing machine setters, operators, and tenders ..... 100 110 .1 .1 10 9.9 33 Chemical equipment operators and tenders ................................ 61 70 .0 .0 9 14.9 23 Separating, filtering, clarifying, precipitating, and still machine
setters, operators, and tenders .............................................. 39 40 .0 .0 1 2.2 10 Cleaning, washing, and metal pickling equipment operators and
tenders ................................................................................... 20 17 .0 .0 -3 -14.2 5 Cooling and freezing equipment operators and tenders ................ 7 7 .0 .0 0 -1.3 1 Crushing, grinding, polishing, mixing, and blending workers ......... 202 222 .1 .1 21 10.3 65 Crushing, grinding, and polishing machine setters, operators,
and tenders ............................................................................ 44 49 .0 .0 4 9.8 14 Grinding and polishing workers, hand ......................................... 49 55 .0 .0 7 13.7 17 Mixing and blending machine setters, operators, and tenders .... 109 118 .1 .1 10 9.0 33 Cutting workers .............................................................................. 115 117 .1 .1 2 1.8 23 Cutters and trimmers, hand ......................................................... 32 33 .0 .0 1 2.2 6 Cutting and slicing machine setters, operators, and tenders ....... 83 84 .1 .1 1 1.7 16 Etchers and engravers ................................................................... 15 16 .0 .0 2 11.1 5

Monthly Labor Review November 2001 77
Table 2. Continued—Employment by occupation, 2000 and projected 2010
[Numbers in thousands of jobs]
Occupation
Employment Change Total jobopenings
due to growthand net
replacements,2000-101
Number Percent distribution
Number Percent2000 2010 2000 2010
Extruding, forming, pressing, and compacting machine setters,operators, and tenders ........................................................... 73 80 0.1 0.0 7 9.0 24
Furnace, kiln, oven, drier, and kettle operators and tenders ......... 33 34 .0 .0 1 3.2 10 Helpers-Production workers .......................................................... 525 587 .4 .3 62 11.9 194 Inspectors, testers, sorters, samplers, and weighers .................... 602 591 .4 .4 -11 -1.9 133 Jewelers and precious stone and metal workers ........................... 43 44 .0 .0 1 1.3 12 Medical, dental, and ophthalmic laboratory workers ...................... 88 95 .1 .1 7 7.9 31 Dental laboratory technicians ...................................................... 43 46 .0 .0 3 6.3 14 Medical appliance technicians ..................................................... 13 15 .0 .0 2 19.0 6 Ophthalmic laboratory technicians ............................................... 32 34 .0 .0 2 5.7 11 Molders, shapers, and casters, except metal and plastic .............. 42 45 .0 .0 3 7.4 14 Packaging and filling machine operators and tenders ................... 379 433 .3 .3 54 14.4 138 Painting workers ............................................................................ 195 223 .1 .1 28 14.5 72 Coating, painting, and spraying machine setters, operators, and
tenders ................................................................................... 108 121 .1 .1 13 11.9 37 Painters, transportation equipment .............................................. 49 57 .0 .0 9 17.5 19 Painting, coating, and decorating workers ................................... 38 45 .0 .0 7 17.9 15 Paper goods machine setters, operators, and tenders .................. 123 116 .1 .1 -7 -5.4 24 Photographic process workers and processing machine
operators ................................................................................ 76 77 .1 .0 2 2.2 23 Photographic process workers .................................................... 26 24 .0 .0 -2 -8.2 7 Photographic processing machine operators .............................. 50 53 .0 .0 4 7.6 17 Semiconductor processors ............................................................ 52 69 .0 .0 17 32.4 26 Tire builders ................................................................................... 18 20 .0 .0 2 8.6 5 All other production workers .......................................................... 549 619 .4 .4 70 12.7 168
Transportation and material moving occupations .............................. 10,088 11,618 6.9 6.9 1,530 15.2 3,949
Supervisors, transportation and material moving workers ............... 357 427 .2 .3 70 19.7 147 Aircraft cargo handling supervisors ............................................... 10 13 .0 .0 3 27.7 5 First-line supervisors/managers of helpers, laborers, and material
movers, hand ......................................................................... 153 182 .1 .1 29 18.9 62 First-line supervisors/managers of transportation and
material-moving machine and vehicle operators ................... 194 233 .1 .1 39 19.9 80 Air transportation occupations ......................................................... 166 186 .1 .1 20 12.2 68 Aircraft pilots and flight engineers .................................................. 117 129 .1 .1 11 9.8 38 Airline pilots, copilots, and flight engineers .................................. 98 104 .1 .1 6 6.4 29 Commercial pilots ........................................................................ 19 24 .0 .0 5 26.9 10 Air traffic controllers and airfield operations specialists ................. 31 35 .0 .0 3 10.2 17 Air traffic controllers ..................................................................... 27 29 .0 .0 2 7.2 13 Airfield operations specialists ...................................................... 5 6 .0 .0 1 27.1 3 All other air transportation workers ................................................ 17 22 .0 .0 5 32.2 13 Motor vehicle operators ................................................................... 4,237 4,982 2.9 3.0 745 17.6 1,398 Ambulance drivers and attendants, except emergency medical
technicians ............................................................................. 15 20 .0 .0 5 33.7 6 Bus drivers ..................................................................................... 666 754 .5 .4 88 13.2 257 Bus drivers, school ...................................................................... 481 537 .3 .3 56 11.6 178 Bus drivers, transit and intercity ................................................... 185 217 .1 .1 32 17.4 79 Driver/sales workers and truck drivers ........................................... 3,268 3,857 2.2 2.3 589 18.0 1,038 Driver/sales workers .................................................................... 402 430 .3 .3 29 7.1 84 Truck drivers, heavy and tractor-trailer ........................................ 1,749 2,095 1.2 1.2 346 19.8 586 Truck drivers, light or delivery services ........................................ 1,117 1,331 .8 .8 215 19.2 368 Taxi drivers and chauffeurs ........................................................... 176 219 .1 .1 43 24.4 57 All other motor vehicle operators ................................................... 112 132 .1 .1 20 18.2 39 Rail transportation occupations ....................................................... 115 94 .1 .1 -21 -18.5 52 Locomotive engineers and firers .................................................... 37 38 .0 .0 1 2.3 18 Railroad brake, signal, and switch operators ................................. 22 9 .0 .0 -13 -60.8 10 Railroad conductors and yardmasters ........................................... 45 36 .0 .0 -8 -18.9 20 Rail yard engineers, dinkey operators, and hostlers ...................... 4 4 .0 .0 0 -4.5 2 All other rail transportation workers ............................................... 7 7 .0 .0 0 -4.1 3 Water transportation occupations .................................................... 70 74 .0 .0 3 4.4 27 Sailors and marine oilers ............................................................... 32 33 .0 .0 2 4.9 12 Ship and boat captains and operators ........................................... 25 26 .0 .0 1 3.4 9 Ship engineers ............................................................................... 9 9 .0 .0 0 5.8 3 All other water transportation workers ........................................... 5 5 .0 .0 0 4.2 2 Related transportation occupations ................................................. 309 341 .2 .2 32 10.4 139 Bridge and lock tenders ................................................................. 4 4 .0 .0 -1 -19.1 2 Parking lot attendants .................................................................... 117 140 .1 .1 23 19.8 43 Service station attendants ............................................................. 112 110 .1 .1 -2 -1.7 57 Traffic technicians .......................................................................... 4 5 .0 .0 1 14.1 2
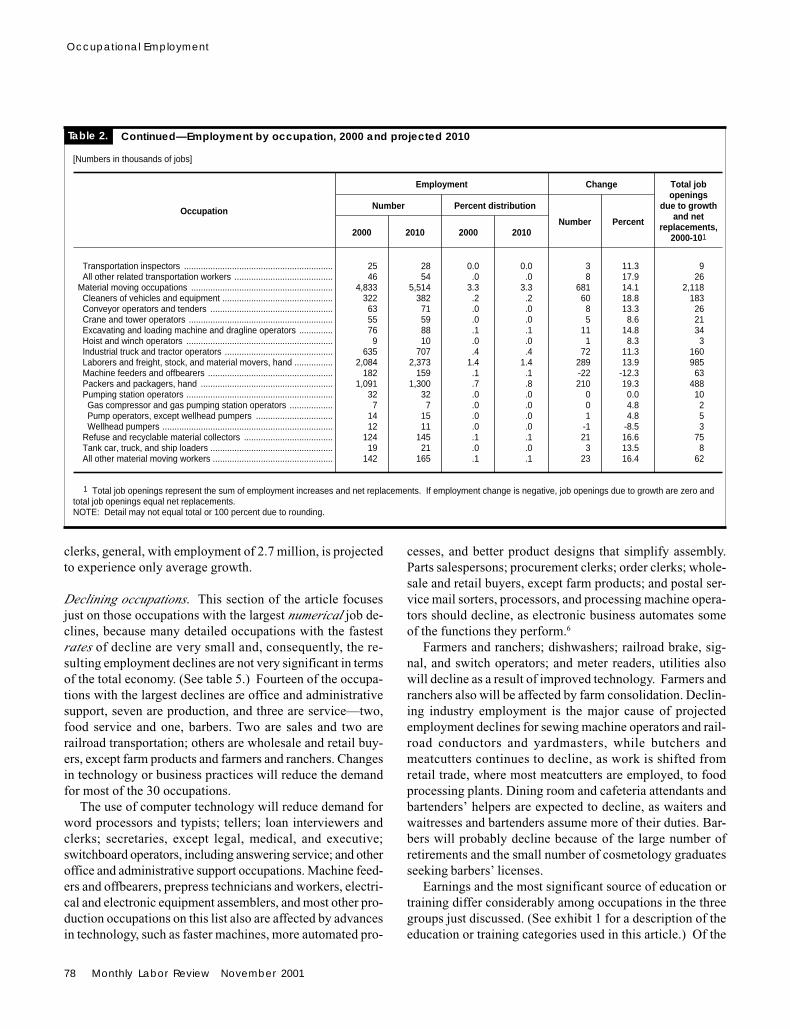
78 Monthly Labor Review November 2001
Occupational Employment
Table 2. Continued—Employment by occupation, 2000 and projected 2010
clerks, general, with employment of 2.7 million, is projectedto experience only average growth.
Declining occupations. This section of the article focusesjust on those occupations with the largest numerical job de-clines, because many detailed occupations with the fastestrates of decline are very small and, consequently, the re-sulting employment declines are not very significant in termsof the total economy. (See table 5.) Fourteen of the occupa-tions with the largest declines are office and administrativesupport, seven are production, and three are service—two,food service and one, barbers. Two are sales and two arerailroad transportation; others are wholesale and retail buy-ers, except farm products and farmers and ranchers. Changesin technology or business practices will reduce the demandfor most of the 30 occupations.
The use of computer technology will reduce demand forword processors and typists; tellers; loan interviewers andclerks; secretaries, except legal, medical, and executive;switchboard operators, including answering service; and otheroffice and administrative support occupations. Machine feed-ers and offbearers, prepress technicians and workers, electri-cal and electronic equipment assemblers, and most other pro-duction occupations on this list also are affected by advancesin technology, such as faster machines, more automated pro-
cesses, and better product designs that simplify assembly.Parts salespersons; procurement clerks; order clerks; whole-sale and retail buyers, except farm products; and postal ser-vice mail sorters, processors, and processing machine opera-tors should decline, as electronic business automates someof the functions they perform.6
Farmers and ranchers; dishwashers; railroad brake, sig-nal, and switch operators; and meter readers, utilities alsowill decline as a result of improved technology. Farmers andranchers also will be affected by farm consolidation. Declin-ing industry employment is the major cause of projectedemployment declines for sewing machine operators and rail-road conductors and yardmasters, while butchers andmeatcutters continues to decline, as work is shifted fromretail trade, where most meatcutters are employed, to foodprocessing plants. Dining room and cafeteria attendants andbartenders’ helpers are expected to decline, as waiters andwaitresses and bartenders assume more of their duties. Bar-bers will probably decline because of the large number ofretirements and the small number of cosmetology graduatesseeking barbers’ licenses.
Earnings and the most significant source of education ortraining differ considerably among occupations in the threegroups just discussed. (See exhibit 1 for a description of theeducation or training categories used in this article.) Of the
[Numbers in thousands of jobs]
Occupation
Employment Change Total jobopenings
due to growthand net
replacements,2000-101
Number Percent distribution
Number Percent2000 2010 2000 2010
Transportation inspectors .............................................................. 25 28 0.0 0.0 3 11.3 9 All other related transportation workers ......................................... 46 54 .0 .0 8 17.9 26 Material moving occupations ........................................................... 4,833 5,514 3.3 3.3 681 14.1 2,118 Cleaners of vehicles and equipment .............................................. 322 382 .2 .2 60 18.8 183 Conveyor operators and tenders ................................................... 63 71 .0 .0 8 13.3 26 Crane and tower operators ............................................................ 55 59 .0 .0 5 8.6 21 Excavating and loading machine and dragline operators .............. 76 88 .1 .1 11 14.8 34 Hoist and winch operators ............................................................. 9 10 .0 .0 1 8.3 3 Industrial truck and tractor operators ............................................. 635 707 .4 .4 72 11.3 160 Laborers and freight, stock, and material movers, hand ................ 2,084 2,373 1.4 1.4 289 13.9 985 Machine feeders and offbearers .................................................... 182 159 .1 .1 -22 -12.3 63 Packers and packagers, hand ....................................................... 1,091 1,300 .7 .8 210 19.3 488 Pumping station operators ............................................................. 32 32 .0 .0 0 0.0 10 Gas compressor and gas pumping station operators .................. 7 7 .0 .0 0 4.8 2 Pump operators, except wellhead pumpers ................................ 14 15 .0 .0 1 4.8 5 Wellhead pumpers ....................................................................... 12 11 .0 .0 -1 -8.5 3 Refuse and recyclable material collectors ..................................... 124 145 .1 .1 21 16.6 75 Tank car, truck, and ship loaders ................................................... 19 21 .0 .0 3 13.5 8 All other material moving workers .................................................. 142 165 .1 .1 23 16.4 62
1 Total job openings represent the sum of employment increases and net replacements. If employment change is negative, job openings due to growth are zero andtotal job openings equal net replacements.NOTE: Detail may not equal total or 100 percent due to rounding.

Monthly Labor Review November 2001 79
Table 3. Fastest growing occupations, 2000–2010
30 fastest growing occupations, 21 generally require apostsecondary degree or other award, compared with 11 ofthose with the largest numerical job growth and 2 of thosewith the largest numerical declines. Of the fastest growingoccupations, 13 are concentrated in the first earnings quartileand 8 in the third earnings quartile; of those with the largestnumeric increases, 10 are in the first and 11 in the fourthquartile; and of the largest declines, 10 are in the second and14 are in the third quartile.
Total job openings
In addition to occupational employment growth, another as-pect of the demand for workers is the need to replace work-ers who leave their jobs to enter other occupations, retire, orleave the labor force for other reasons. Job openings result-
ing from replacement needs are very important, because, inmost occupations, they exceed those that are the result ofemployment growth. Even occupations that are projected todecline provide some job openings, for example, farmers andranchers and wholesale and retail buyers, except farm prod-ucts. (See table 2, pp. 64–78.)
The measure of replacement needs is complex becauseof the continuous movement of workers into and out ofoccupations. The replacement needs cited in this articleare based on the net change in employment (entrants mi-nus separations) in each age cohort over the projectionperiod. Although this measure understates the total numberof job openings in an occupation, it best represents the jobopenings for new labor force entrants over the projectionperiod.7
Over the 2000–10 period, more job openings are expected
[Numbers in thousands of jobs]
Occupation
Employment Change Quartilerank by2000
medianannual
earnings1
Most significant source of education or training2000 2010 Number Percent
Computer software engineers, applications ........................ 380 760 380 100 1 Bachelor’s degree Computer support specialists .............................................. 506 996 490 97 2 Associate degree Computer software engineers, systems software ............... 317 601 284 90 1 Bachelor’s degree Network and computer systems administrators .................. 229 416 187 82 1 Bachelor’s degree Network systems and data communications analysts ........ 119 211 92 77 1 Bachelor’s degree Desktop publishers ............................................................. 38 63 25 67 2 Postsecondary vocational award Database administrators ..................................................... 106 176 70 66 1 Bachelor’s degree Personal and home care aides ........................................... 414 672 258 62 4 Short-term on-the-job training Computer systems analysts ................................................ 431 689 258 60 1 Bachelor’s degree Medical assistants ............................................................... 329 516 187 57 3 Moderate-term on-the-job training
Social and human service assistants .................................. 271 418 147 54 3 Moderate-term on-the-job training Physician assistants ............................................................ 58 89 31 53 1 Bachelor’s degree Medical records and health information technicians ........... 136 202 66 49 3 Associate degree Computer and information systems managers ................... 313 463 150 48 1 Bachelor’s or higher degree, plus work experienceHome health aides .............................................................. 615 907 291 47 4 Short-term on-the-job training Physical therapist aides ...................................................... 36 53 17 46 3 Short-term on-the-job training Occupational therapist aides ............................................... 9 12 4 45 3 Short-term on-the-job training Physical therapist assistants ............................................... 44 64 20 45 2 Associate degree Audiologists ......................................................................... 13 19 6 45 1 Master’s degree Fitness trainers and aerobics instructors ............................ 158 222 64 40 3 Postsecondary vocational award
Computer and information scientists, research ................... 28 39 11 40 1 Doctoral degree Veterinary assistants and laboratory animal caretakers ..... 55 77 22 40 4 Short-term on-the-job training Occupational therapist assistants ....................................... 17 23 7 40 2 Associate degree Veterinary technologists and technicians ............................ 49 69 19 39 3 Associate degree Speech-language pathologists ............................................ 88 122 34 39 1 Master’s degree Mental health and substance abuse social workers ........... 83 116 33 39 2 Master’s degree Dental assistants ................................................................. 247 339 92 37 2 Moderate-term on-the-job training Dental hygienists ................................................................. 147 201 54 37 1 Associate degree Special education teachers, preschool, kindergarten, and
elementary school ................................................... 234 320 86 37 1 Bachelor’s degree Pharmacy technicians ......................................................... 190 259 69 36 3 Moderate-term on-the-job training
1 The quartile rankings of Occupational Employment Statistics annual earnings dataare presented in the following categories: 1=very high ($39,700 and over), 2=high($25,760 to $39,660), 3=low ($18,500 to $25,760), and 4=very low (up to $18,490). The
rankings were based on quartiles using one-fourth of total employment to define eachquartile. Earnings are for wage and salary workers.

80 Monthly Labor Review November 2001
Occupational Employment
Table 4. Occupations with the largest job growth, 2000–2010
to result from replacement needs (35.8 million) than fromemployment growth in the economy (22.2 million). Serviceoccupations are projected to have the largest number of totaljob openings, 13.5 million. Large occupations characterizedby relatively low pay and limited training requirements, suchas food preparation and service occupations, generate nu-merous job openings due to replacement needs. Even withinservice occupations, however, rapidly growing healthcaresupport occupations should generate more openings from jobgrowth than from replacement needs.
The only major group with fewer openings from replace-ment needs than from employment growth is professionaland related occupations, the fastest growing. Even withinprofessional and related occupations, however, replacement
openings should exceed growth openings in the three slow-est growing groups—architecture and engineering occupa-tions; education, training, and library occupations; and life,physical, and social science occupations.
Education or training categories and earnings
While the education and training requirements of theworkforce continue to increase, in 2000, only 21 percent ofjobs were in occupations generally requiring a bachelor’s de-gree or more education. (See table 6.) However, these jobswill account for 29 percent of total job growth from 2000 to2010. Occupations generally requiring a postsecondary vo-cational award or an associate degree, which accounted for 8
[Numbers in thousands of jobs]
Occupation
Employment Change Quartilerank by2000
medianannual
earnings1
Most significant source of education or training2000 2010 Number Percent
Combined food preparation and serving workers, includingfast food .................................................................. 2,206 2,879 673 30 4 Short-term on-the-job training
Customer service representatives ...................................... 1,946 2,577 631 32 3 Moderate-term on-the-job training Registered nurses ............................................................... 2,194 2,755 561 26 1 Associate degree Retail salespersons ............................................................. 4,109 4,619 510 12 4 Short-term on-the-job training Computer support specialists .............................................. 506 996 490 97 2 Associate degree Cashiers, except gaming .................................................... 3,325 3,799 474 14 4 Short-term on-the-job training Office clerks, general .......................................................... 2,705 3,135 430 16 3 Short-term on-the-job training Security guards ................................................................... 1,106 1,497 391 35 4 Short-term on-the-job training Computer software engineers, applications ........................ 380 760 380 100 1 Bachelor’s degree Waiters and waitresses ....................................................... 1,983 2,347 364 18 4 Short-term on-the-job training
General and operations managers ..................................... 2,398 2,761 363 15 1 Bachelor’s or higher degree, plus work experienceTruck drivers, heavy and tractor-trailer ............................... 1,749 2,095 346 20 2 Moderate-term on-the-job training Nursing aides, orderlies, and attendants ............................ 1,373 1,697 323 24 3 Short-term on-the-job training Janitors and cleaners, except maids and housekeeping
cleaners .................................................................. 2,348 2,665 317 13 4 Short-term on-the-job training Postsecondary teachers ..................................................... 1,344 1,659 315 23 1 Doctoral degree Teacher assistants .............................................................. 1,262 1,562 301 24 4 Short-term on-the-job training Home health aides .............................................................. 615 907 291 47 4 Short-term on-the-job training Laborers and freight, stock, and material movers, hand ..... 2,084 2,373 289 14 3 Short-term on-the-job training Computer software engineers, systems software ............... 317 601 284 90 1 Bachelor’s degree Landscaping and groundskeeping workers ........................ 894 1,154 260 29 4 Short-term on-the-job training
Personal and home care aides ........................................... 414 672 258 62 4 Short-term on-the-job training Computer systems analysts ................................................ 431 689 258 60 1 Bachelor’s degree Receptionists and information clerks .................................. 1,078 1,334 256 24 3 Short-term on-the-job training Truck drivers, light or delivery services ............................... 1,117 1,331 215 19 3 Short-term on-the-job training Packers and packagers, hand ............................................ 1,091 1,300 210 19 4 Short-term on-the-job training Elementary school teachers, except special education ...... 1,532 1,734 202 13 1 Bachelor’s degree Medical assistants ............................................................... 329 516 187 57 3 Moderate-term on-the-job training Network and computer systems administrators .................. 229 416 187 82 1 Bachelor’s degree Secondary school teachers, except special and vocational
education ................................................................ 1,004 1,190 187 19 1 Bachelor’s degree Accountants and auditors ................................................... 976 1,157 181 19 1 Bachelor’s degree
1 The quartile rankings of Occupational Employment Statistics annual earnings dataare presented in the following categories: 1=very high ($39,700 and over), 2=high($25,760 to $39,660), 3=low ($18,500 to $25,760), and 4=very low (up to $18,490). The
rankings were based on quartiles using one-fourth of total employment to define eachquartile. Earnings are for wage and salary workers.

Monthly Labor Review November 2001 81
Table 5. Occupations with the largest job decline, 2000–2010
percent of all jobs in 2000, will account for 13 percent of thejob growth over the 2000–10 period. Occupations generallyrequiring only work-related training, which accounted for 71percent of all jobs in 2000, will account for 58 percent of thejob growth over the 2000–10 period. (See exhibit 1 for defi-nitions of categories.)
All seven categories generally requiring a postsecondaryaward are projected to have faster-than-average employmentgrowth over the 2000–10 period. These categories are madeup mostly of professional and related occupations, projectedto grow the fastest, along with a number of faster-than-aver-age growing management, business, and financial occupa-tions. All four work-related training categories are expected
to have slower growth. These categories include many slowgrowing or declining production, office and administrativesupport, and other occupations.
The largest education and training category, short-termon-the job training, with 53 million workers in 2000, ac-counted for 37 percent of total employment and is projectedto account for 35 percent of job growth. It is the fastest grow-ing of the four categories requiring work-related training, andincludes large faster-than-average-growing occupationssuch as security guards, teacher assistants, and combined foodpreparation and serving workers, including fast food. Morethan half of the 30 occupations with the largest numericaljob growth fall into this category. These workers had the low-
[Numbers in thousands of jobs]
Occupation
Employment Change Quartilerank by2000
medianannual
earnings1
Most significant source of education or training2000 2010 Number Percent
Farmers and ranchers ......................................................... 1,294 965 -328 -25 2 Long-term on-the-job training Order clerks ........................................................................ 348 277 -71 -20 3 Short-term on-the-job training Tellers ................................................................................. 499 440 -59 -12 3 Short-term on-the-job training Insurance claims and policy processing clerks ................... 289 231 -58 -20 2 Moderate-term on-the-job training Word processors and typists ............................................... 297 240 -57 -19 3 Moderate-term on-the-job training Sewing machine operators ................................................. 399 348 -51 -13 4 Moderate-term on-the-job training Dishwashers ....................................................................... 525 483 -42 -8 4 Short-term on-the-job training Switchboard operators, including answering service .......... 259 218 -41 -16 3 Short-term on-the-job training Loan interviewers and clerks .............................................. 139 101 -38 -28 2 Short-term on-the-job training Computer operators ............................................................ 194 161 -33 -17 2 Moderate-term on-the-job training
Dining room and cafeteria attendants and bartenderhelpers .................................................................... 431 402 -29 -7 4 Short-term on-the-job training
Electrical and electronic equipment assemblers ................. 379 355 -24 -6 3 Short-term on-the-job training Machine feeders and offbearers ......................................... 182 159 -22 -12 3 Short-term on-the-job training Telephone operators ........................................................... 54 35 -19 -35 2 Short-term on-the-job training Secretaries, except legal, medical, and executive .............. 1,864 1,846 -18 -1 3 Moderate-term on-the-job training Prepress technicians and workers ...................................... 107 90 -17 -16 2 Long-term on-the-job training Office machine operators, except computer ....................... 84 68 -16 -19 3 Short-term on-the-job training Cutting, punching, and press machine setters, operators,
and tenders, metal and plastic ................................ 372 357 -15 -4 3 Moderate-term on-the-job training Postal service mail sorters, processors, and processing
machine operators .................................................. 289 275 -14 -5 2 Short-term on-the-job training Railroad brake, signal, and switch operators ...................... 22 9 -13 -61 2 Work experience in a related occupation
Wholesale and retail buyers, except farm products ............ 148 135 -13 -9 2 Bachelor’s degree Meter readers, utilities ......................................................... 49 36 -13 -26 2 Short-term on-the-job training Butchers and meat cutters .................................................. 141 128 -13 -9 3 Long-term on-the-job training Parts salespersons ............................................................. 260 248 -12 -4 3 Moderate-term on-the-job training Inspectors, testers, sorters, samplers, and weighers .......... 602 591 -11 -2 3 Moderate-term on-the-job training Eligibility interviewers, government programs ..................... 117 106 -11 -9 2 Moderate-term on-the-job training Door-to-door sales workers, news and street vendors, and
related workers ....................................................... 166 156 -10 -6 3 Short-term on-the-job training Procurement clerks ............................................................. 76 67 -9 -12 2 Short-term on-the-job training Railroad conductors and yardmasters ................................ 45 36 -8 -19 2 Work experience in a related occupation Barbers ............................................................................... 73 64 -8 -12 4 Postsecondary vocational award
1 The quartile rankings of Occupational Employment Statistics annual earnings dataare presented in the following categories: 1=very high ($39,700 and over), 2=high($25,760 to $39,660), 3=low ($18,500 to $25,760), and 4=very low (up to $18,490). The
rankings were based on quartiles using one-fourth of total employment to define eachquartile. Earnings are for wage and salary workers.

82 Monthly Labor Review November 2001
Occupational Employment
Most significant source of education or trainingExhibit 1.
Occupations are classified into one of eleven categorieslisted below according to these principles:
• An occupation is placed into the category that bestdescribes the education or training needed by mostworkers to become fully qualified.
• Postsecondary awards, if generally needed for entryinto the occupation, take precedence over work-relatedtraining even though additional skills or experiencemay be needed for a worker to become fully quali-fied.
• The length of time an average worker generally needsto become fully qualified through a combination ofon-the-job training and experience is used to catego-rize occupations in which a postsecondary award gen-erally is not needed for entry.
Postsecondary awards
First professional degree. Completion of the degreeusually requires at least 3 years of full-time academicstudy beyond a bachelor’s degree.
Doctoral degree. Completion of a Ph.D. or other doc-toral degree usually requires at least 3 years of full-time academic study beyond a bachelor’s degree.
Master’s degree. Completion of the degree usually re-quires 1 or 2 years of full-time academic study be-yond a bachelor’s degree.
Bachelor’s or higher degree, plus work experience.Most occupations in this category are managementoccupations. All require experience in a related non-management position for which a bachelor’s or higherdegree is usually required.
Bachelor’s degree. Completion of the degree gener-ally requires at least 4 years, but not more than 5years, of full-time academic study.
Associate degree. Completion of the degree usuallyrequires at least 2 years of full-time academic study.
Postsecondary vocational award. Some programs lastonly a few weeks while others may last more than ayear. Programs lead to a certificate or other awardbut not a degree.
Work-related training
Work experience in a related occupation. Many occu-pations requiring work experience are first-line su-pervisors/managers of service, sales and related, pro-duction, or other occupations, or are managementoccupations.
Long-term on-the-job training. More than 12 monthsof on-the-job training or combined work experienceand formal classroom instruction are needed for work-ers to develop the skills necessary to be fully quali-fied. This category includes formal and informal ap-prenticeships that may last up to 5 years. Long-termon-the-job training also includes intensive occupa-tion-specific, employer-sponsored programs thatworkers must successfully complete. These includefire and police academies and schools for air trafficcontrollers and flight attendants. In other occupa-tions—insurance sales and securities sales, for ex-ample—trainees take formal courses, often providedon the job site, to prepare for the required licensingexams. Individuals undergoing training generally areconsidered to be employed in the occupation. Alsoincluded in this category is the development of a natu-ral ability—such as that possessed by musicians, ath-letes, actors, and other entertainers—that must becultivated over several years, frequently in a nonworksetting.
Moderate-term on-the-job training. Skills needed tobe fully qualified can be acquired during 1 to 12months of combined on-the-job experience and in-formal training.
Short-term on-the-job training. Skills needed to be fullyqualified can be acquired during a short demonstra-tion of job duties or during 1 month or less of on-the-job experience or instruction.

Monthly Labor Review November 2001 83
Table 6. Employment and total job openings, 2000–2010, and 2000 average annual earningsby education or training category
est earnings of any education and training group in 2000—60 percent as much as the mean for all wage and salary workers.
Occupations generally requiring moderate-term on-the-jobtraining, including medical assistants and painters, construc-tion and maintenance, accounted for 28 million workers, or19 percent of total employment in 2000, and are projected toaccount for 14 percent of new jobs. These workers earned 88percent as much as the mean for all wage and salary workersin 2000.
The long-term on-the-job training category is projectedto grow the slowest. It accounted for 8.5 percent of totalemployment in 2000, but should account for only 4.2 per-cent of new jobs. It includes slow growing occupations, suchas carpenters, and declining ones, such as butchers andmeatcutters, and farmers and ranchers. These workers earnedthe mean for all workers in 2000. An additional 7.2 percentwere employed in occupations requiring experience in an-other occupation that generally did not require postsecondaryeducation or training; these are projected to account for 5percent of new jobs. Most workers in these occupations arefirst-line supervisors or managers, so it is not surprising thatthey earned 24 percent more than the mean for all workers.
The postsecondary vocational award category accounted
for 4.6 percent of total employment in 2000 and shouldaccount for 5.5 percent of new jobs. This group includes au-tomobile service technicians and mechanics; licensed practi-cal nurses; and hairdressers, hairstylists, and cosmetologists.They earned 95 percent as much as the mean for all workersin 2000. Occupations generally requiring an associate de-gree is the fastest growing group; it includes computer sup-port specialists, paralegals and legal assistants, and many fast-growing health occupations. It accounted for 3.5 percent ofall jobs in the base year but is expected to account for 7.3percent of total growth. More than two-fifths of the workersin this group are registered nurses.8
The bachelor’s degree category accounted for 12 percentof all workers in 2000 and is projected to account for 18percent of job growth. Most computer occupations are in thisgroup. In addition, jobs in which workers generally needexperience in another occupation requiring at least abachelor’s degree before getting their current job accountedfor another 5 percent of all workers in 2000 and should ac-count for 6.4 percent of job growth. Almost all workers inthis category were in management, business, and financialoccupations. Many of the fastest growing occupations andthose with the largest projected numerical increases require
[Numbers in thousands of jobs]
Most significant source of education ortraining
Employment ChangeTotal job openings
due to growth and netreplacements, 2000-101 2000
meanannual
earnings2Number Percent distributionNumber Percent
distribution Percent Number Percentdistribution2000 2010 2000 2010
Total, all occupations ........................... 145,594 167,754 100.0 100.0 22,160 100.0 15.2 57,932 100.0 $33,089
Bachelor’s or higher degree ...................... 30,072 36,556 20.7 21.8 6,484 29.3 21.6 12,130 20.9 56,553 First professional degree ........................ 2,034 2,404 1.4 1.4 370 1.7 18.2 691 1.2 91,424 Doctoral degree ...................................... 1,492 1,845 1.0 1.1 353 1.6 23.7 760 1.3 52,146 Master’s degree ...................................... 1,426 1,759 1.0 1.0 333 1.5 23.4 634 1.1 43,842 Bachelor’s or higher degree, plus work
experience .................................... 7,319 8,741 5.0 5.2 1,422 6.4 19.4 2,741 4.7 69,967 Bachelor’s degree ................................... 17,801 21,807 12.2 13.0 4,006 18.1 22.5 7,304 12.6 48,440
Associate degree or postsecondaryvocational award ........................... 11,761 14,600 8.1 8.7 2,839 12.8 24.1 5,383 9.3 35,701
Associate degree .................................... 5,083 6,710 3.5 4.0 1,626 7.3 32.0 2,608 4.5 41,488 Postsecondary vocational award ............ 6,678 7,891 4.6 4.7 1,213 5.5 18.2 2,775 4.8 31,296
Work-related training ................................. 103,760 116,597 71.3 69.5 12,837 57.9 12.4 40,419 69.8 25,993 Work experience in a related occupation 10,456 11,559 7.2 6.9 1,102 5.0 10.5 3,180 5.5 40,881 Long-term on-the-job training .................. 12,435 13,373 8.5 8.0 938 4.2 7.5 3,737 6.5 33,125 Moderate-term on-the-job training .......... 27,671 30,794 19.0 18.4 3,123 14.1 11.3 8,767 15.1 29,069 Short-term on-the-job training ................. 53,198 60,871 36.5 36.3 7,673 34.6 14.4 24,735 42.7 19,799
1 Total job openings represent the sum of employment increases and netreplacements. If employment change is negative, job openings due to growth are zeroand total job openings equal net replacements.
2 Earnings are for wage and salary workers.NOTE: Detail may not equal total or 100 percent due to rounding.

84 Monthly Labor Review November 2001
Occupational Employment
a bachelor’s degree. Mean earnings of occupations generallyrequiring a bachelor’s degree were 46 percent more than themean for all wage and salary workers and for those in occu-pations generally requiring work experience plus a bachelor’sor higher degree, 111 percent more.
About 3.4 percent of workers are employed in occupa-tions that generally require more education than a bachelor’sdegree, including those requiring a first professional degree(1.4 percent), doctoral degree (1 percent), or master’s de-gree (1 percent). Together, these three categories are pro-jected to account for 4.8 percent of job growth. The firstprofessional degree category, which includes lawyers, phy-sicians and surgeons, and pharmacists, had the highest aver-age earnings of any group in 2000—2.8 times as much as themean for all wage and salary workers. The doctoral degreecategory earned 58 percent more than the mean; most work-ers in this group are postsecondary teachers. Those in the master’s
degree category earned 32 percent more than the mean, not asmuch as occupations requiring a bachelor’s. This group includeslibrarians and several counseling occupations.
The share of total job openings resulting from both em-ployment growth and net replacement needs in each of theeducation and training categories differs from job openingsresulting from employment growth alone. In general, occu-pations requiring the least amount of education and trainingaccount for a greater share of net replacement needs—andtotal job openings—because workers in them have less jobattachment than workers in other occupations. While occu-pations requiring a postsecondary vocational award or anacademic degree should generate 42 percent of jobs fromgrowth alone, they should generate only 30 percent of totaljob openings. Occupations requiring work-related trainingshould generate 58 percent of openings due to growth, but70 percent of total openings.
Notes
These projections were completed prior to the tragic events of September11. BLS will continue to review its projections and, as the long-term eco-nomic consequences of September 11 become clearer, will incorporatethese effects in subsequent releases of the occupational outlook. (See boxon page 3.)
1 Occupational projections presented in this article provide informa-tion to those interested in labor market issues. They also provide the back-ground for analyses of future employment opportunities described in theforthcoming 2002–03 Occupational Outlook Handbook. The Internet ver-sion of this edition of the Handbook, which will be accessible at http://http://http://http://http://wwwwwwwwwwwwwww.bls.gov/emp,.bls.gov/emp,.bls.gov/emp,.bls.gov/emp,.bls.gov/emp, is expected to be available in December 2001; theprint version of the 2002–03 Handbook, BLS Bulletin 2540, should beavailable in early 2002. Job outlook information in the 2002-03 Hand-book will use the projections presented in each of the articles in this issueof the Monthly Labor Review. For a description of the methodology usedto develop employment projections, see BLS Handbook of Methods, Bul-letin 2490 (Bureau of Labor Statistics, April 1997), pp. 122–29.
2 Service industries include health, engineering and management, so-cial, and computer and data processing services. Services industries, withbusinesses that supply services to a wide variety of other businesses andto individuals, are projected to grow by 27.1 percent, overall, and accountfor 61.9 percent of all new jobs over the 2000–10 period.
3 Services industries in this article include State and local governmenthospitals and public education. In the article on industry employment byJay Berman (this issue, pp. 39–56), workers in State and local govern-ment hospitals and public education are included in the estimates of gov-ernment employment.
4 See Daniel E. Hecker, “Employment impact of electronic business,”Monthly Labor Review, May 2001, p. 6.
5 Ibid., p. 5.6 Ibid.
7 Net separations do not count all movements of workers out of an oc-cupation, which is a measure termed total separations. For example, anopening caused by a worker who stops working for a period and then getsanother job in his or her previous occupation would be counted in themeasure of total separations but not net separations. See the discussion onthe uses of replacement needs information developed in OccupationalProjections and Training Data, Bulletin 2542 (Bureau of Labor Statis-tics, forthcoming).
8 While most nurses currently get their training in associate degree pro-grams, a considerable number have a bachelor’s degree, which indicatesthat there is some overlapping of educational requirements among thegroups.