Embed Size (px)
Citation preview
New Mexico Employment
Projections 2010-2020 Growth Trends of New Mexico’s Industries and Occupations
New Mexico
Employment Projections
2010-2020
NEW MEXICO DEPARTMENT OF WORKFORCE SOLUTIONS
Celina Bussey, Cabinet Secretary
Prepared by
BUREAU OF ECONOMIC RESEARCH AND ANALYSIS
Bob Richards, Economist
December 2012
FOR FURTHER INFORMATION CONTACT:
New Mexico Department of Workforce Solutions
Economic Research and Analysis Bureau
PO Box 1928
Albuquerque, NM 87103
TELEPHONE: (505) 383-2732
Table of Contents
Introduction ....................................................................................................................... 4
Industry Projections ..........................................................................................................5 Industry Employment Changes ........................................................................................5
Industry Projections 2010-2020 ...................................................................................5
Goods-Producing Industries .............................................................................................6
Service-Producing Industries ...........................................................................................7
Industries to Watch .........................................................................................................11
Occupational Projections ................................................................................................12 Occupational Employment Trends .................................................................................12
Occupational Projections 2010-2020 ........................................................................12
Fastest Growing Occupations ....................................................................................13
Occupations Adding the Most Jobs ............................................................................13
Occupational Projections Detail .....................................................................................14
Assumptions, Limitations, and Technical Notes ...........................................................29 Assumptions ...................................................................................................................29
Limitations .....................................................................................................................29
Technical Notes ..............................................................................................................29
Additional Notes ............................................................................................................30

NM Employment Projections 2010-2020 4
Introduction The 2012 employment projection report is designed to meet the needs of students, counselors, job seekers, employers, and
public and private planning groups for information about industrial patterns and career opportunities in New Mexico. The
projections in this report are based on methodologies developed by the U.S. Department of Labor for forecasting state and
area occupational needs using both national information and procedures specifically adapted to each state’s industrial and
occupational patterns. This is the statewide edition of the Employment Projections 2010-2020, a series that includes
separate condensed reports for New Mexico’s four metropolitan statistical areas (Albuquerque, Farmington, Las Cruces,
and Santa Fe), and four Workforce Investment Act areas (Central, Northern, Eastern, and Southwestern).
This publication uses current occupational information and revises previous projections. The occupational staffing patterns
for each industry were derived from information collected by the Occupational Employment Statistics (OES) survey, a
federal-state cooperative program between the U.S. Bureau of Labor Statistics and the New Mexico Department of
Workforce Solutions. This is a statewide survey of approximately 11,400 employers representing all industrial sectors. The
OES survey was initiated in New Mexico in 1977 and was conducted in cycles so that each industry was surveyed every
three years. The methodology and cycles were changed in 1996 to survey a sample of all industries each year. The survey
cycle 2008-2010 was used in the derivation of staffing patterns for this publication. This statewide edition of the
occupational biannual projections report includes information on nearly half of the 800 occupations defined in the Standard
Occupational Classification Manual. For occupations not listed in this publication, visit www.jobs.state.nm.us/analyzer.
General types of information in the 2010-2020 projections report include assumptions of the economy, survey data, analysis
concerning total and industrial sector employment, and data and analysis of occupational employment. A brief explanation
of the methodology used to develop these projections is provided at the end of the report.
While changes to the economy tend to happen at a slow pace, abrupt shocks do occur and these changes can and will affect
the growth across industries. This is especially true with the 2007-2009 recession and the slow climb to recovery.
Projections are designed to provide general guidance and are unlikely to precisely predict actual employment
developments. It is intended that the direction or trend associated with the projection will prove sufficiently accurate for
thoughtful planning.
NM Employment Projections 2010-2020 5
Industry Projections Industry Employment Changes
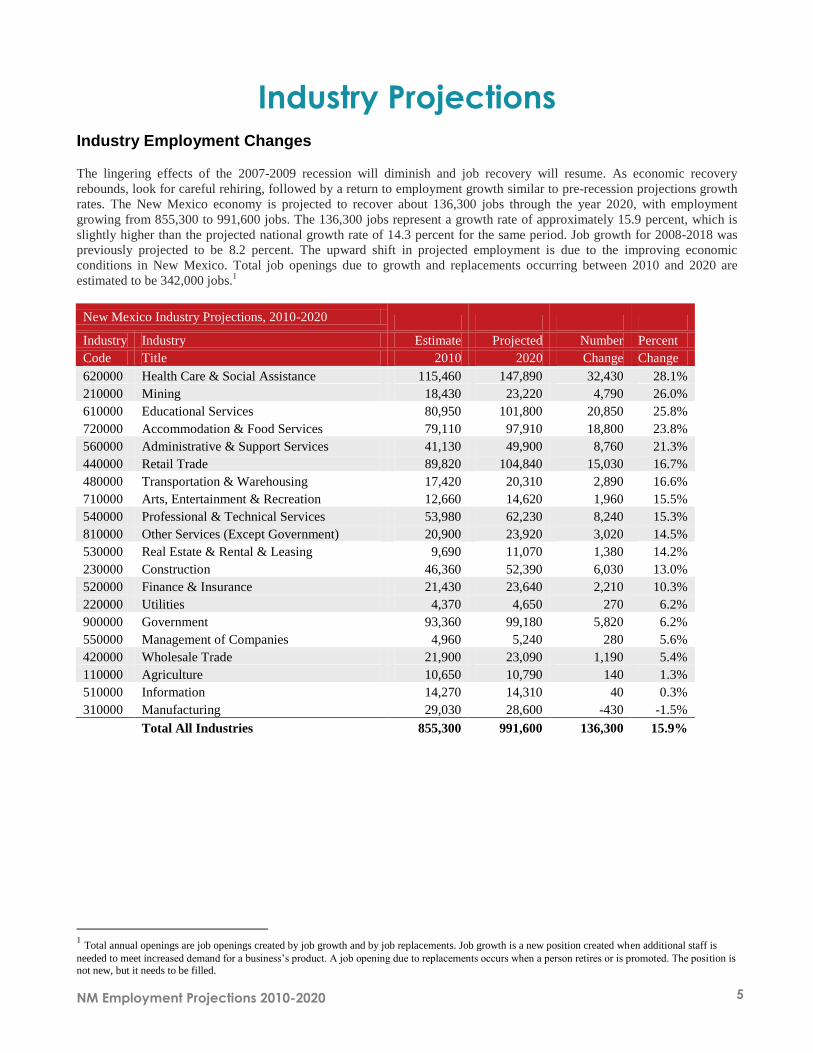
The lingering effects of the 2007-2009 recession will diminish and job recovery will resume. As economic recovery
rebounds, look for careful rehiring, followed by a return to employment growth similar to pre-recession projections growth
rates. The New Mexico economy is projected to recover about 136,300 jobs through the year 2020, with employment
growing from 855,300 to 991,600 jobs. The 136,300 jobs represent a growth rate of approximately 15.9 percent, which is
slightly higher than the projected national growth rate of 14.3 percent for the same period. Job growth for 2008-2018 was
previously projected to be 8.2 percent. The upward shift in projected employment is due to the improving economic
conditions in New Mexico. Total job openings due to growth and replacements occurring between 2010 and 2020 are
estimated to be 342,000 jobs.1
New Mexico Industry Projections, 2010-2020
Industry Industry Estimate Projected Number Percent
Code Title 2010 2020 Change Change
620000 Health Care & Social Assistance 115,460 147,890 32,430 28.1%
210000 Mining 18,430 23,220 4,790 26.0%
610000 Educational Services 80,950 101,800 20,850 25.8%
720000 Accommodation & Food Services 79,110 97,910 18,800 23.8%
560000 Administrative & Support Services 41,130 49,900 8,760 21.3%
440000 Retail Trade 89,820 104,840 15,030 16.7%
480000 Transportation & Warehousing 17,420 20,310 2,890 16.6%
710000 Arts, Entertainment & Recreation 12,660 14,620 1,960 15.5%
540000 Professional & Technical Services 53,980 62,230 8,240 15.3%
810000 Other Services (Except Government) 20,900 23,920 3,020 14.5%
530000 Real Estate & Rental & Leasing 9,690 11,070 1,380 14.2%
230000 Construction 46,360 52,390 6,030 13.0%
520000 Finance & Insurance 21,430 23,640 2,210 10.3%
220000 Utilities 4,370 4,650 270 6.2%
900000 Government 93,360 99,180 5,820 6.2%
550000 Management of Companies 4,960 5,240 280 5.6%
420000 Wholesale Trade 21,900 23,090 1,190 5.4%
110000 Agriculture 10,650 10,790 140 1.3%
510000 Information 14,270 14,310 40 0.3%
310000 Manufacturing 29,030 28,600 -430 -1.5%
Total All Industries 855,300 991,600 136,300 15.9%
1 Total annual openings are job openings created by job growth and by job replacements. Job growth is a new position created when additional staff is
needed to meet increased demand for a business’s product. A job opening due to replacements occurs when a person retires or is promoted. The position is not new, but it needs to be filled.
NM Employment Projections 2010-2020 6
Goods-Producing Industries
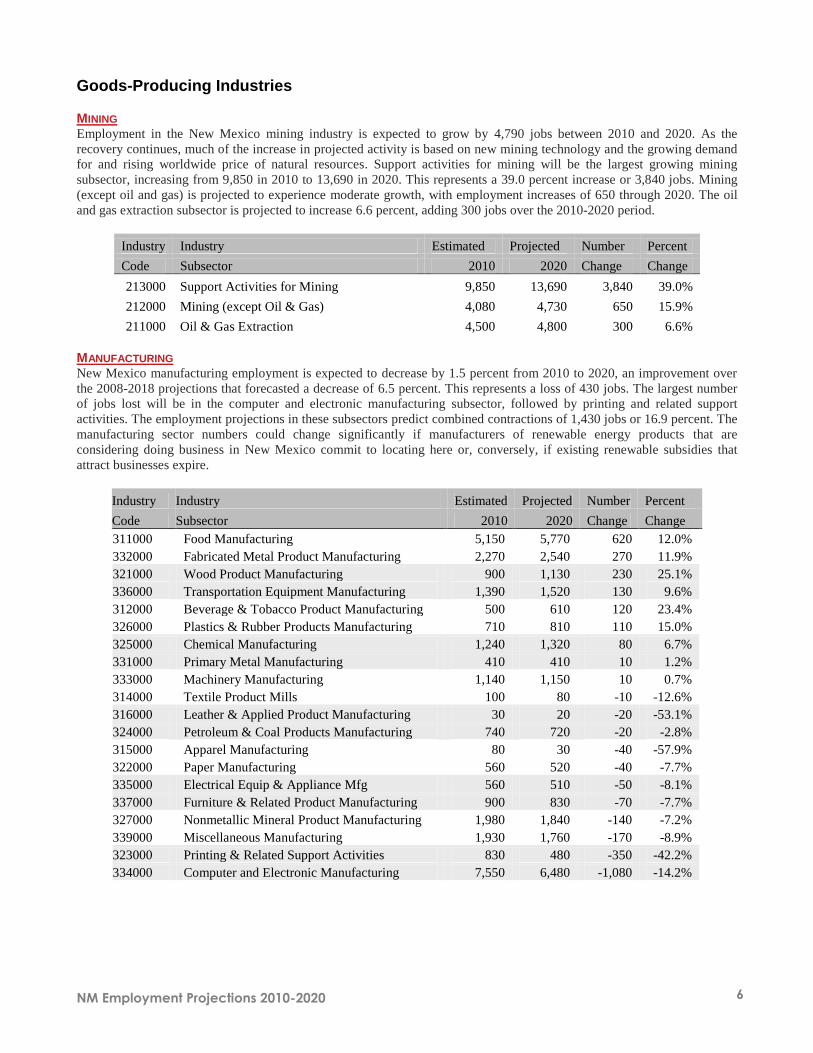
MINING Employment in the New Mexico mining industry is expected to grow by 4,790 jobs between 2010 and 2020. As the
recovery continues, much of the increase in projected activity is based on new mining technology and the growing demand
for and rising worldwide price of natural resources. Support activities for mining will be the largest growing mining
subsector, increasing from 9,850 in 2010 to 13,690 in 2020. This represents a 39.0 percent increase or 3,840 jobs. Mining
(except oil and gas) is projected to experience moderate growth, with employment increases of 650 through 2020. The oil
and gas extraction subsector is projected to increase 6.6 percent, adding 300 jobs over the 2010-2020 period.
Industry Industry Estimated Projected Number Percent
Code Subsector 2010 2020 Change Change
213000 Support Activities for Mining 9,850 13,690 3,840 39.0%
212000 Mining (except Oil & Gas) 4,080 4,730 650 15.9%
211000 Oil & Gas Extraction 4,500 4,800 300 6.6%
MANUFACTURING New Mexico manufacturing employment is expected to decrease by 1.5 percent from 2010 to 2020, an improvement over
the 2008-2018 projections that forecasted a decrease of 6.5 percent. This represents a loss of 430 jobs. The largest number
of jobs lost will be in the computer and electronic manufacturing subsector, followed by printing and related support
activities. The employment projections in these subsectors predict combined contractions of 1,430 jobs or 16.9 percent. The
manufacturing sector numbers could change significantly if manufacturers of renewable energy products that are
considering doing business in New Mexico commit to locating here or, conversely, if existing renewable subsidies that
attract businesses expire.
Industry Industry Estimated Projected Number Percent
Code Subsector 2010 2020 Change Change
311000 Food Manufacturing 5,150 5,770 620 12.0%
332000 Fabricated Metal Product Manufacturing 2,270 2,540 270 11.9%
321000 Wood Product Manufacturing 900 1,130 230 25.1%
336000 Transportation Equipment Manufacturing 1,390 1,520 130 9.6%
312000 Beverage & Tobacco Product Manufacturing 500 610 120 23.4%
326000 Plastics & Rubber Products Manufacturing 710 810 110 15.0%
325000 Chemical Manufacturing 1,240 1,320 80 6.7%
331000 Primary Metal Manufacturing 410 410 10 1.2%
333000 Machinery Manufacturing 1,140 1,150 10 0.7%
314000 Textile Product Mills 100 80 -10 -12.6%
316000 Leather & Applied Product Manufacturing 30 20 -20 -53.1%
324000 Petroleum & Coal Products Manufacturing 740 720 -20 -2.8%
315000 Apparel Manufacturing 80 30 -40 -57.9%
322000 Paper Manufacturing 560 520 -40 -7.7%
335000 Electrical Equip & Appliance Mfg 560 510 -50 -8.1%
337000 Furniture & Related Product Manufacturing 900 830 -70 -7.7%
327000 Nonmetallic Mineral Product Manufacturing 1,980 1,840 -140 -7.2%
339000 Miscellaneous Manufacturing 1,930 1,760 -170 -8.9%
323000 Printing & Related Support Activities 830 480 -350 -42.2%
334000 Computer and Electronic Manufacturing 7,550 6,480 -1,080 -14.2%
NM Employment Projections 2010-2020 7
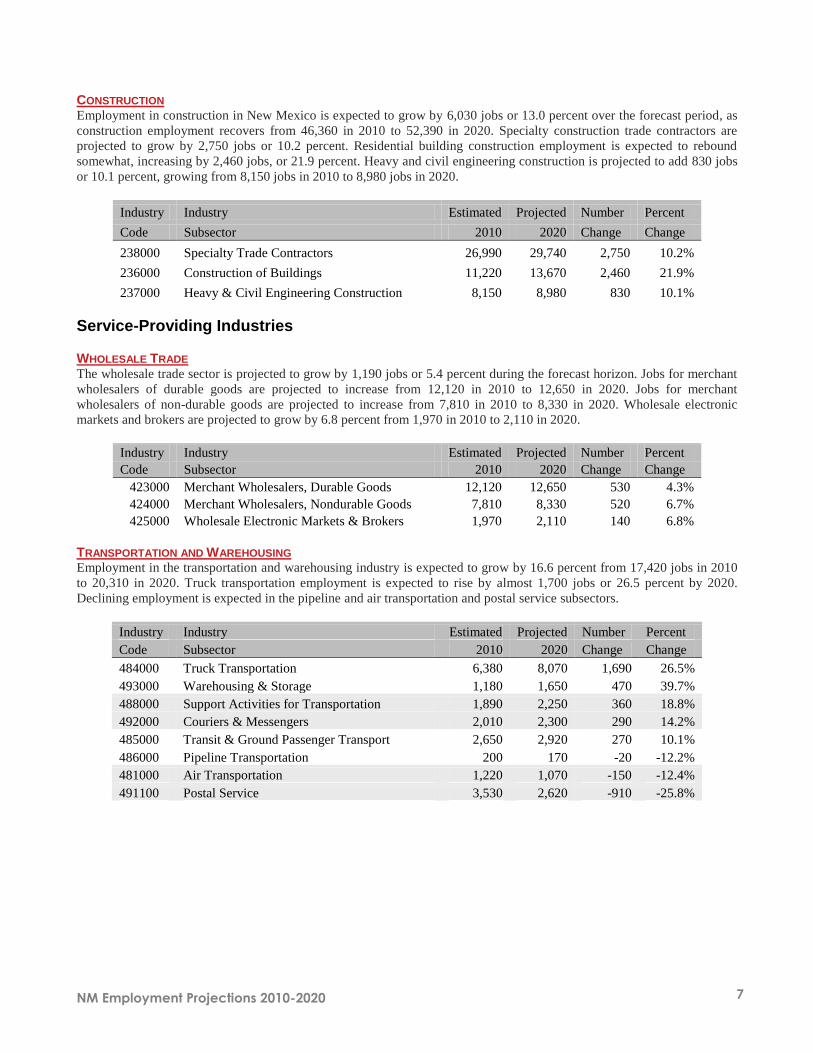
CONSTRUCTION Employment in construction in New Mexico is expected to grow by 6,030 jobs or 13.0 percent over the forecast period, as
construction employment recovers from 46,360 in 2010 to 52,390 in 2020. Specialty construction trade contractors are
projected to grow by 2,750 jobs or 10.2 percent. Residential building construction employment is expected to rebound
somewhat, increasing by 2,460 jobs, or 21.9 percent. Heavy and civil engineering construction is projected to add 830 jobs
or 10.1 percent, growing from 8,150 jobs in 2010 to 8,980 jobs in 2020.
Industry Industry Estimated Projected Number Percent
Code Subsector 2010 2020 Change Change
238000 Specialty Trade Contractors 26,990 29,740 2,750 10.2%
236000 Construction of Buildings 11,220 13,670 2,460 21.9%
237000 Heavy & Civil Engineering Construction 8,150 8,980 830 10.1%
Service-Providing Industries
WHOLESALE TRADE The wholesale trade sector is projected to grow by 1,190 jobs or 5.4 percent during the forecast horizon. Jobs for merchant
wholesalers of durable goods are projected to increase from 12,120 in 2010 to 12,650 in 2020. Jobs for merchant
wholesalers of non-durable goods are projected to increase from 7,810 in 2010 to 8,330 in 2020. Wholesale electronic
markets and brokers are projected to grow by 6.8 percent from 1,970 in 2010 to 2,110 in 2020.
Industry Industry Estimated Projected Number Percent
Code Subsector 2010 2020 Change Change
423000 Merchant Wholesalers, Durable Goods 12,120 12,650 530 4.3%
424000 Merchant Wholesalers, Nondurable Goods 7,810 8,330 520 6.7%
425000 Wholesale Electronic Markets & Brokers 1,970 2,110 140 6.8%
TRANSPORTATION AND WAREHOUSING Employment in the transportation and warehousing industry is expected to grow by 16.6 percent from 17,420 jobs in 2010
to 20,310 in 2020. Truck transportation employment is expected to rise by almost 1,700 jobs or 26.5 percent by 2020.
Declining employment is expected in the pipeline and air transportation and postal service subsectors.
Industry Industry Estimated Projected Number Percent
Code Subsector 2010 2020 Change Change
484000 Truck Transportation 6,380 8,070 1,690 26.5%
493000 Warehousing & Storage 1,180 1,650 470 39.7%
488000 Support Activities for Transportation 1,890 2,250 360 18.8%
492000 Couriers & Messengers 2,010 2,300 290 14.2%
485000 Transit & Ground Passenger Transport 2,650 2,920 270 10.1%
486000 Pipeline Transportation 200 170 -20 -12.2%
481000 Air Transportation 1,220 1,070 -150 -12.4%
491100 Postal Service 3,530 2,620 -910 -25.8%

NM Employment Projections 2010-2020 8
RETAIL TRADE The retail trade sector is projected to grow by 15,030 jobs or 16.7 percent over the projection period. Retail employment is
expected to increase from 89,820 in 2010 to 104,840 in 2020. General merchandising stores will experience the most
significant increase in the retail sector, adding 7,520 jobs or 34.7 percent during the 2010 to 2020 period. The general
merchandise subsector includes the Wal-Mart and Target chains. The building material and garden equipment suppliers
subsector is expected to grow by more than 3,000 jobs, while motor vehicle and parts dealers are projected to add an
additional 1,720 jobs through 2020.
Industry Industry Estimated Projected Number Percent
Code Subsector 2010 2020 Change Change
452000 General Merchandise Stores 21,680 29,200 7,520 34.7%
444000 Building Material & Garden Equip Suppliers 7,670 10,790 3,120 40.6%
441000 Motor Vehicle & Parts Dealers 11,470 13,190 1,720 15.0%
445000 Food & Beverage Stores 13,610 14,200 600 4.4%
443000 Electronics & Appliance Stores 2,430 3,020 590 24.2%
448000 Clothing & Clothing Accessories Stores 6,410 6,960 540 8.5%
446000 Health & Personal Care Stores 4,560 4,950 390 8.5%
442000 Furniture & Home Furnishings Stores 2,070 2,280 210 10.3%
453000 Miscellaneous Store Retailers 6,130 6,320 190 3.1%
451000 Sporting Goods, Hobby, Book & Music Stores 3,920 4,070 150 3.9%
454000 Non-store Retailers 2,350 2,490 140 6.0%
447000 Gasoline Stations 7,520 7,380 -140 -1.9%
UTILITIES Utilities sector employment is projected to grow from 4,400 in 2010 to 4,700 in 2020. The addition of almost 300 jobs
represents a growth rate of 6.2 percent across the projection horizon.
Industry Industry Estimated Projected Number Percent
Code Subsector 2010 2020 Change Change
221000 Utilities 4,370 4,650 270 6.2%
INFORMATION Employment in the information industry is projected to be relatively flat between 2010 and 2020. The telecommunications
subsector is projected to be the only subsector adding a significant number of jobs. The remaining subsectors are not
expected to generate a large number of jobs through 2020, with three subsectors losing jobs.
Industry Industry Estimated Projected Number Percent
Code Subsector 2010 2020 Change Change
517000 Telecommunications 6,830 7,390 560 8.2%
519000 Other Information Services 250 290 40 16.5%
518000 ISP, Web Search Portals & Data Processing 400 410 10 3.0%
515000 Broadcasting 1,310 1,130 -170 -13.1%
511000 Publishing Industries 2,290 2,090 -200 -8.6%
512000 Motion Picture & Sound Recording Industries 3,210 2,990 -210 -6.6%

NM Employment Projections 2010-2020 9
FINANCE AND INSURANCE Employment in the finance and insurance sector is expected to increase from 21,430 in 2010 to 23,640 in 2020, adding
2,210 jobs or 10.3 percent. Credit intermediation subsector employment is expected to increase by 1,260 jobs or 10.1
percent. Insurance carriers are projected to grow by 8.7 percent or 630 jobs, over the forecast horizon.
Industry Industry Estimated Projected Number Percent
Code Subsector 2010 2020 Change Change
522000 Credit Intermediation 12,440 13,700 1,260 10.1%
524000 Insurance Carriers 7,210 7,840 630 8.7%
REAL ESTATE, RENTAL, AND LEASING Between 2010 and 2020, employment in the real estate and leasing sector is expected to increase from 9,690 to 11,070.
Employment in rental activities is projected to increase by over 700 jobs, representing a growth rate of 21.1 percent. Real
estate employment is estimated to add 660 jobs.
Industry Industry Estimated Projected Number Percent
Code Subsector 2010 2020 Change Change
532000 Rental & Leasing Services 3,410 4,130 720 21.1%
531000 Real Estate 6,280 6,940 660 10.5%
PROFESSIONAL, SCIENTIFIC, AND TECHNICAL SERVICES The professional, scientific and technical services sector is projected to grow from 53,980 jobs in 2010 to 62,230 in 2020,
adding over 8,200 jobs or 15.3 percent.
Industry Industry Estimated Projected Number Percent
Code Subsector 2010 2020 Change Change
541000 Professional, Scientific & Technical Services 53,980 62,230 8,240 15.3%
MANAGEMENT OF COMPANIES Management of companies and services is projected to grow from 4,960 jobs to 5,240, adding 280 jobs, with growth of 5.6
percent through 2020.
Industry Industry Estimated Projected Number Percent
Code Subsector 2010 2020 Change Change
551000 Management of Companies 4,960 5,240 280 5.6%
ADMINISTRATIVE SUPPORT, AND WASTE MANAGEMENT SERVICES Employment growth in the administrative support and waste management services industry is expected to increase from
41,130 jobs in 2010 to 49,900 by 2020. The additional 8,760 jobs represent a growth rate of 21.3, an improvement over the
2008-2018 projection of 8.6 percent growth.
Industry Industry Estimated Projected Number Percent
Code Subsector 2010 2020 Change Change
561000 Administrative & Support Services 38,720 46,970 8,250 21.3%
562000 Waste Management & Remediation 2,420 2,920 510 21.0%

NM Employment Projections 2010-2020 10
EDUCATIONAL SERVICES
The educational services industry continued to grow through the recession and is projected to experience employment
growth of 20,850 jobs over the projection period. A growth rate of 25.8 percent places this most recent projected rate close
to that which was forecasted for the previous 2008-2018 period.
Industry Estimated Projected Number Percent
Code Subsector 2010 2020 Change Change
611000 Educational Services 80,950 101,800 20,850 25.8%
HEALTH CARE AND SOCIAL ASSISTANCE The health care & social assistance sector is the largest sector in New Mexico’s economy. It is also the fastest growing
sector. In 2010, employment was 115,460 and is projected to increase to 147,890 by 2020, adding 32,430 jobs. This
represents a 28.1 percent growth rate. The ambulatory health care services subsector is forecasted to grow from 42,790 jobs
in 2010 to 57,300 by 2020, adding 14,510 jobs or 33.9 percent. Social assistance employment is projected to increase by
30.0 percent, growing from 24,560 jobs in 2010 to 31,940 in 2020. About 10,500 jobs are projected to come from growth in
the hospitals and nursing facilities subsectors through 2020.
Industry Industry Estimated Projected Number Percent
Code Subsector 2010 2020 Change Change
621000 Ambulatory Health Care Services 42,790 57,300 14,510 33.9%
624000 Social Assistance 24,560 31,940 7,380 30.0%
622000 Hospitals 35,170 41,700 6,530 18.6%
623000 Nursing & Residential Care Facilities 12,930 16,950 4,020 31.1%
ARTS, ENTERTAINMENT, AND RECREATION Employment in the arts, entertainment, and recreation industry is expected to increase by 1,960 jobs, growing from 12,660
in 2010 to 14,620 in 2020. This represents a growth rate of 15.5 percent, which is slightly less than the total average growth
for all industries. The amusement, gambling, and recreation subsector is expected to create 1,800 jobs, growing from
10,270 in 2010 to 12,060 in 2020, representing a 17.5 percent growth rate. Employment in the museums, historical sites,
and similar institution subsector is projected to grow at 18.9 percent through the projection period, adding 110 jobs.
Employment in the performing arts and spectator sports subsector is likely to remain nearly flat through 2020.
Industry Industry Estimated Projected Number Percent
Code Subsector 2010 2020 Change Change
713000 Amusement, Gambling & Recreation 10,270 12,060 1,800 17.5%
712000 Museums & Historical Sites 560 670 110 18.9%
711000 Performing Arts & Spectator Sports 1,830 1,890 60 3.0%
ACCOMMODATION AND FOOD SERVICES Accommodation and food services industry employment is projected to grow by 18,800 or 23.8 percent through the
projection horizon. Food services and drinking places, the larger subsector in this industry, is projected to grow from
61,650 jobs to 77,880 or 26.3 percent. Accommodation jobs are expected to grow by 14.7 percent, increasing from 17,470
to 20,030 over the period.
Industry Industry Estimated Projected Number Percent
Code Subsector 2010 2020 Change Change
722000 Food Services & Drinking Places 61,650 77,880 16,230 26.3%
721000 Accommodation 17,470 20,030 2,570 14.7%

NM Employment Projections 2010-2020 11
OTHER SERVICES Growth in other services is expected to account for an additional 3,020 jobs between 2010 and 2020, representing a 14.5
percent increase. The fastest growing subsector within other services is the religious, civic & professional subsector. This
subsector is expected to create 1,470 jobs and grow by over 23 percent. Repair and maintenance, personal & laundry
services, and private households are projected to add another 1,500 jobs by 2020.
Industry Industry Estimated Projected Number Percent
Code Subsector 2010 2020 Change Change
813000 Religious, Civic & Professional 6,320 7,790 1,470 23.3%
811000 Repair & Maintenance 7,250 8,350 1,100 15.2%
812000 Personal & Laundry Services 5,880 6,180 310 5.2%
814000 Private Households 1,450 1,600 150 10.1%
GOVERNMENT The government category used in the occupational projections is confined to administration and public safety and excludes
almost all direct production and service functions of the government. Government construction, the U.S. Postal Service,
public transportation, public utilities, public education, and health services functions are allocated to other related
categories. The overall government category is projected to add 5,820 jobs, growing from 93,360 to 99,180 during the
projection period. The local government subsector is projected to add 3,210 jobs for an increase of 7.9 percent. Federal
government employment is projected to grow by 2,550 jobs or 10.2 percent over the forecast period. This includes the
added workers for the 2020 Census count. State government employment is projected to increase by 4.0 percent, adding
almost 1,000 jobs.
Industry Industry Estimated Projected Number Percent
Code Subsector 2010 2020 Change Change
999300 Local Government 40,420 43,630 3,210 7.9%
999100 Federal Government 25,000 27,550 2,550 10.2%
Industries to Watch New Mexico is receiving a great deal of attention from solar panel manufacturers looking at setting up operations due to
New Mexico’s labor force and favorable business climate. However, foreign competition and uncertain subsidies have
made this a volatile industry in New Mexico. The aerospace industry is another industry to watch. New Mexico does not
have an employment data series specific to this emerging industry, although many of its workers are classified under
manufacturing. The addition of Spaceport America at Upham, New Mexico, is certainly breaking new ground in an
industry for which there is no historic data to input into our economic models. New developments include the announced
construction and/or permitting of several spaceports around the country. Without industry data, it difficult to determine the
level of demand for spaceport services verses the level of supply.

NM Employment Projections 2010-2020 12
Occupational Projections Occupational Employment Trends The occupational patterns that have existed in New Mexico in recent years are expected to shift somewhat over the 2010-
2020 projection period. Slower employment growth, changing industrial trends, and technological advances are the primary
reasons for these shifts. Other factors affecting occupational trends include differences in the size and age structure of the
population, changes in business practices, and economic factors. The health care support and personal care and service
occupational groups are projected to be the fastest growing groups. One of the occupational groups requiring the highest
levels of education— education, training, and library occupations—is expected to increase at an average rate. Food
preparation and serving related occupations; health care practitioners; and technical, management, and computer and
mathematical occupations will experience average growth through the projection period. All other occupational groups are
expected to grow at rates that are below average or are projected not to grow. No occupational groups are projected to
decline between 2010 and 2020.2
New Mexico Occupational Projections, 2010-2020
Occs Occupational Estimated Projected Number Percent Annual
Code Group 2010 2020 Change Change Openings
350000 Food Preparation & Serving Related 73,030 89,950 16,920 23.2% 4,300
250000 Education, Training & Library 54,610 68,780 14,170 26.0% 2,620
390000 Personal Care & Service 42,050 54,990 12,940 30.8% 2,090
430000 Office & Administrative Support 124,430 137,130 12,700 10.2% 4,110
410000 Sales & Related 83,240 95,250 12,000 14.4% 3,790
290000 Healthcare Practitioners & Technical 46,010 55,980 9,970 21.7% 1,930
310000 Healthcare Support 27,020 35,600 8,580 31.7% 1,250
470000 Construction & Extraction 64,260 72,220 7,960 12.4% 2,140
530000 Transportation & Material Moving 45,820 52,380 6,560 14.3% 1,800
130000 Business & Financial Operations 28,530 33,360 4,830 16.9% 1,060
370000 Bldg & Grounds Cleaning & Maint. 33,660 38,420 4,760 14.1% 1,070
490000 Installation, Maintenance & Repair 34,380 39,060 4,680 13.6% 1,260
110000 Management 56,060 59,980 3,920 7.0% 1,560
330000 Protective Service 23,620 26,780 3,160 13.4% 890
150000 Computer & Mathematical 13,870 16,870 3,000 21.6% 570
210000 Community & Social Services 16,230 19,040 2,810 17.3% 640
170000 Architecture & Engineering 21,340 23,800 2,460 11.5% 720
190000 Life, Physical & Social Science 14,190 16,260 2,070 14.6% 670
510000 Production 29,170 30,760 1,590 5.4% 860
270000 Arts, Design & Entertainment 10,930 11,700 770 7.1% 390
450000 Farming, Fishing & Forestry 7,460 7,710 250 3.4% 250
230000 Legal 5,390 5,610 210 4.0% 120
Total, All Occupations 855,300 991,600 136,300 15.9% 34,100
2 Total annual openings are job openings created by job growth and by job replacements. Job growth is a new position created when
additional staff is needed to meet increased demand for a business’s product. A job opening due to replacements occurs when a person
retires or is promoted. The position is not new, but it needs to be filled.

NM Employment Projections 2010-2020 13
NM Fastest Growing Occupations, 2010-2020 NM Occupations Adding the Most Jobs, 2010-2020
Growth Employment
Percent Growth
Occupational Title 2010-20 Occupational Title 2010-20
Home Health Aides 60.1% Personal Care Aides 9,420
Personal Care Aides 53.0% Retail Salespersons 5,650
Roustabouts 40.2% Home Health Aides 4,950
Systems Software Developers 32.7% Combined Food Prep & Servers 4,330
Combined Food Prep & Servers 32.1% Registered Nurses 3,920
Middle School Teachers 29.8% Waiters & Waitresses 3,580
Elementary School Teachers 29.8% Elementary School Teachers 2,880
Graduate Teaching Assistants 29.0% Cashiers 2,500
Restaurant Cooks 28.6% Teacher Assistants 2,480
Registered Nurses 25.9% Janitors & Cleaners 1,900
Food Preparation Workers 25.5% Cooks, Restaurant 1,880
Sprvrs of Food Prep & Servers 24.1% Customer Service Representatives 1,840
Teacher Assistants 24.1% Office Clerks, General 1,810
Waiters & Waitresses 23.6% Bookkeeping, Accounting & Auditing
Clerks 1,740
Medical Assistants 21.4% Laborers & Freight, Stock & Material
Movers 1,670
Nursing Aides, Orderlies & Attendants 21.3% Heavy & Tractor-Trailer Truck Drivers 1,640
Dishwashers 20.8% Nursing Aides, Orderlies & Attendants 1,600
Security Guards 20.6% Supervisors of Food Prep & Servers 1,580
Management Analysts 20.6% Supervisors of Retail Sales Workers 1,550
Clinical & School Psychologists 19.9% Sprvrs of Admin Support Workers 1,490
Retail Salespersons 19.0% Security Guards 1,450
Heavy & Tractor-Trailer Truck Drivers 18.8% Receptionists 1,390
Secondary School Teachers 18.8% Maids & Housekeeping Cleaners 1,390
Landscaping & Groundskeeping Wkrs 18.0% Middle School Teachers 1,350
Licensed Practical Nurses 17.2% Food Preparation Workers 1,350
Receptionists 17.2% Roustabouts 1,180
Customer Service Representatives 16.5% Landscaping & Groundskeeping Workers 1,150
Laborers & Freight, Stock & Material
Movers 16.2%
Secondary School Teachers 1,110
General Office Clerks 15.7% General Maintenance & Repair Workers 1,090
Sprvrs of Admin Support Workers 15.4% Construction Laborers 980

NM Employment Projections 2010-2020 14
Occupational Projections Detail
MANAGEMENT Employment growth of management occupations (1,560) is expected to be less than average through the year 2020. General
and operations managers (300) are projected to add the most jobs, followed by administrative and construction managers.
Postsecondary education administrators (40) are expected to grow faster than average, while elementary and secondary
education administrators (60) and medical and health service managers (70) are expected to experience average growth. All
other listed occupations are projected to grow less than average.3
Management Estimated Projected Number Percent Annual
Occupations 2010 2020 Change Change Openings
General & Operations 13,990 14,410 420 3.0% 300
Administrative Services 2,730 3,130 400 14.5% 110
Construction 4,320 4,620 300 6.9% 60
Medical & Health Services 1,510 1,810 300 20.0% 70
Financial 2,480 2,740 260 10.3% 70
Education Administrators, Elem & Sec 1,190 1,450 260 21.9% 60
Education Administrators, Postsecondary 690 910 220 32.6% 40
Sales 1,730 1,920 190 10.9% 70
Education Administrators, Preschool 980 1,170 190 19.6% 50
Social & Community Service 1,440 1,610 170 11.8% 50
Computer & Information Systems 970 1,130 160 16.4% 30
Architectural & Engineering 1,450 1,600 150 10.6% 40
Food Service 1,110 1,200 90 7.8% 30
Lodging 650 740 90 13.6% 30
Property & Community Assoc. 1,450 1,520 80 5.2% 40
Transportation, Storage & Distribution 470 540 70 13.8% 20
Industrial Production 350 400 50 14.5% 10
Natural Sciences 450 500 50 10.9% 30
Marketing 330 380 40 12.9% 10
Human Resources 280 310 40 12.6% 10
Training & Development 240 290 40 18.0% 10
Public Relations & Fundraising 150 180 20 15.0% 10
Purchasing 190 210 20 9.5% 10
Management Occupations 56,060 59,980 3,920 7.0% 1,560
3 For the entire Occupational and Employment Trends section of this report, numbers in parenthesis represent the total annual openings.

NM Employment Projections 2010-2020 15
BUSINESS AND FINANCIAL OPERATIONS Employment growth of business and financial operations occupations (1,060) is expected to be slightly less than average
through the year 2020. The growth of training and development specialists (60), market research specialists (30),
logisticians (20), and meeting planners (10) is expected to be above average. Management analysts (130), loan officers (70),
compliance officers (40), cost estimators (30), personal financial advisors (20), credit analysts (10), and credit counselors
(10) are projected to grow at an average rate. The remaining occupations are projected to grow less than average or see little
to no growth.
Business & Financial Estimated Projected Number Percent Annual
Occupations 2010 2020 Change Change Openings
Management Analysts 3,550 4,290 730 20.6% 130
Accountants & Auditors 5,940 6,670 730 12.3% 200
Training & Development Specialists 1,290 1,720 430 32.9% 60
Loan Officers 1,550 1,870 320 20.8% 70
Labor Relations Specialists 1,730 2,020 290 16.6% 60
Compliance Officers 1,080 1,320 240 22.3% 40
Cost Estimators 780 950 170 22.0% 30
Market Research Specialists 430 600 170 39.4% 30
Personal Financial Advisors 560 710 160 28.0% 20
Purchasing Agents 1,360 1,490 130 9.3% 50
Budget Analysts 670 800 130 18.6% 30
Logisticians 400 520 120 30.2% 20
Claims Adjusters, Examiners & Investigators 1,090 1,180 90 8.4% 40
Appraisers & Assessors of Real Estate 780 840 70 8.4% 20
Financial Analysts 430 500 70 16.4% 20
Meeting, Convention & Event Planners 150 210 60 42.2% 10
Credit Analysts 140 170 40 26.5% 10
Compensation & Benefits Specialists 550 570 30 5.3% 10
Credit Counselors 100 130 30 27.5% 10
Business and Financial Operations 28,530 33,360 4,830 16.9% 1,060
COMPUTER AND MATHEMATICAL Employment growth of computer and mathematical occupations (570) is expected to be about average through 2020.
System software engineers (80) are projected to add the most employment, 620 jobs, and experience faster than average
growth. Growth of network and systems administrators (60), systems analysts (60), application developers (40), and
database administrators (30) is expected to be about average. The remaining occupations will grow less than average
through 2020.
Computer & Mathematical Estimated Projected Number Percent Annual
Occupations 2010 2020 Change Change Openings
Systems Software Developers 1,880 2,500 620 32.7% 80
Network & Systems Administrators 1,250 1,600 350 28.1% 60
Computer Systems Analysts 1,620 1,950 340 20.7% 60
Applications Software Developers 1,170 1,430 260 21.9% 40
Database Administrators 560 730 170 29.9% 30
Computer Programmers 1,220 1,360 140 11.9% 40
Operations Research Analysts 290 340 50 15.7% 10
Computer & Information Research Scientists 190 220 30 18.1% 10
Statisticians 50 60 10 13.0% 0
Computer and Mathematical Occupations 13,870 16,870 3,000 21.6% 570

NM Employment Projections 2010-2020 16
BUILDING AND GROUNDS CLEANING AND MAINTENANCE Building and grounds cleaning and maintenance occupations (1,070) are expected to grow less than average. Employment
growth of pest control workers (20) is projected to be about average while all of the other occupations in this category are
expected to experience less than average to no growth through 2020.
Building, Grounds Cleaning & Maint. Estimated Projected Number Percent Annual
Occupations 2010 2020 Change Change Openings
Janitors & Cleaners 13,170 15,060 1,900 14.4% 440
Maids & Housekeeping Cleaners 10,300 11,690 1,390 13.5% 310
Landscaping & Groundskeeping Workers 6,410 7,570 1,150 18.0% 230
Sprvrs of Landscapers & Groundskeepers 1,280 1,450 160 12.8% 40
Pest Control Workers 280 350 70 24.7% 20
Sprvrs of Housekeepers & Janitors 1,980 2,040 60 3.2% 30
Building, Grounds Cleaning &
Maintenance 33,660 38,420 4,760 14.1% 1,070
COMMUNITY AND SOCIAL SERVICES Employment growth of community and social services occupations (640) is expected to be below average. Growth in all
occupations on this list is expected to be below average, with the exception of guidance counselors (70), and mental health
counselors (50), which are projected to experience average growth through 2020. Only health educators (30) are expected
to see growth slightly above average.
Community & Social Services Estimated Projected Number Percent Annual
Occupations 2010 2020 Change Change Openings
Social & Human Service Assistants 2,980 3,420 440 14.9% 110
Guidance Counselors 1,430 1,840 410 28.7% 70
Child, Family & School Social Workers 2,320 2,710 390 16.9% 90
Substance Abuse Social Workers 1,980 2,290 320 15.9% 80
Probation & Correctional Treatment Spec. 1,320 1,550 230 17.3% 50
Mental Health Counselors 1,080 1,300 220 20.6% 50
Healthcare Social Workers 1,080 1,260 170 16.1% 40
Health Educators 480 630 150 30.5% 30
Rehabilitation Counselors 740 820 80 11.1% 20
Behavioral Disorder Counselors 410 490 70 18.0% 20
Community & Social Services 16,230 19,040 2,810 17.3% 640
LEGAL Employment growth of legal occupations (120) is expected to be slower than average. Growth of all occupations within
this occupational group is expected to be slower than average, except title examiners (10), which is expected to decline.
Legal Estimated Projected Number Percent Annual
Occupations 2010 2020 Change Change Openings
Paralegals & Legal Assistants 1,360 1,480 120 9.1% 30
Lawyers 3,020 3,120 100 3.2% 70
Arbitrators, Mediators & Conciliators 50 50 10 13.3% 0
Judges, Magistrate Judges & Magistrates 110 130 10 12.3% 0
Court Reporters 70 80 10 16.7% 0
Title Examiners, Abstractors & Searchers 530 480 -50 -9.2% 10
Legal Occupations 5,390 5,610 210 4.0% 120

NM Employment Projections 2010-2020 17
ARCHITECTURE AND ENGINEERING Employment growth of architecture and engineering occupations (720) is expected to be less than the average. Nuclear
engineers (10) are projected to have slightly faster than average growth through 2020. Growth of environmental engineers
(30), petroleum engineers (10), and GIS techs (10) is expected to be about average. Employment growth for the remaining
occupations on this list is expected to be slower than the average.
Architecture & Engineering Estimated Projected Number Percent Annual
Occupations 2010 2020 Change Change Openings
Civil Engineers 1,650 1,930 280 17.2% 60
Electronics Engineers, Except Computer 1,530 1,730 190 12.7% 60
Environmental Engineers 780 950 170 21.8% 30
Mechanical Engineers 920 1,060 140 15.0% 40
Electro-Mechanical Technicians 1,460 1,580 120 7.9% 40
Electrical Engineers 1,000 1,110 110 10.5% 30
Architects 710 810 100 14.0% 20
Electrical & Electronics Technicians 1,540 1,630 90 5.8% 40
Aerospace Engineers 590 660 70 12.1% 20
Industrial Engineers 790 860 70 9.3% 20
Nuclear Engineers 240 310 70 31.0% 10
Environmental Engineering Technicians 350 420 70 19.8% 10
Surveyors 430 500 60 14.6% 20
Petroleum Engineers 280 340 60 22.7% 10
Civil Engineering Technicians 580 640 60 10.6% 20
Surveying & Mapping Technicians 550 600 50 8.3% 20
Computer Hardware Engineers 1,590 1,630 40 2.3% 40
Mechanical Drafters 280 320 40 14.9% 10
Cartographers (GIS Techs) 160 190 30 20.4% 10
Health & Safety Engineers 230 260 30 12.9% 10
Materials Engineers 140 150 20 12.6% 10
Industrial Engineering Technicians 190 210 20 7.8% 10
Mechanical Engineering Technicians 310 330 20 6.2% 10
Landscape Architects 90 100 10 10.8% 0
Chemical Engineers 120 140 10 10.7% 10
Architecture & Engineering Occupations 21,340 23,800 2,460 11.5% 720
NM Employment Projections 2010-2020 18
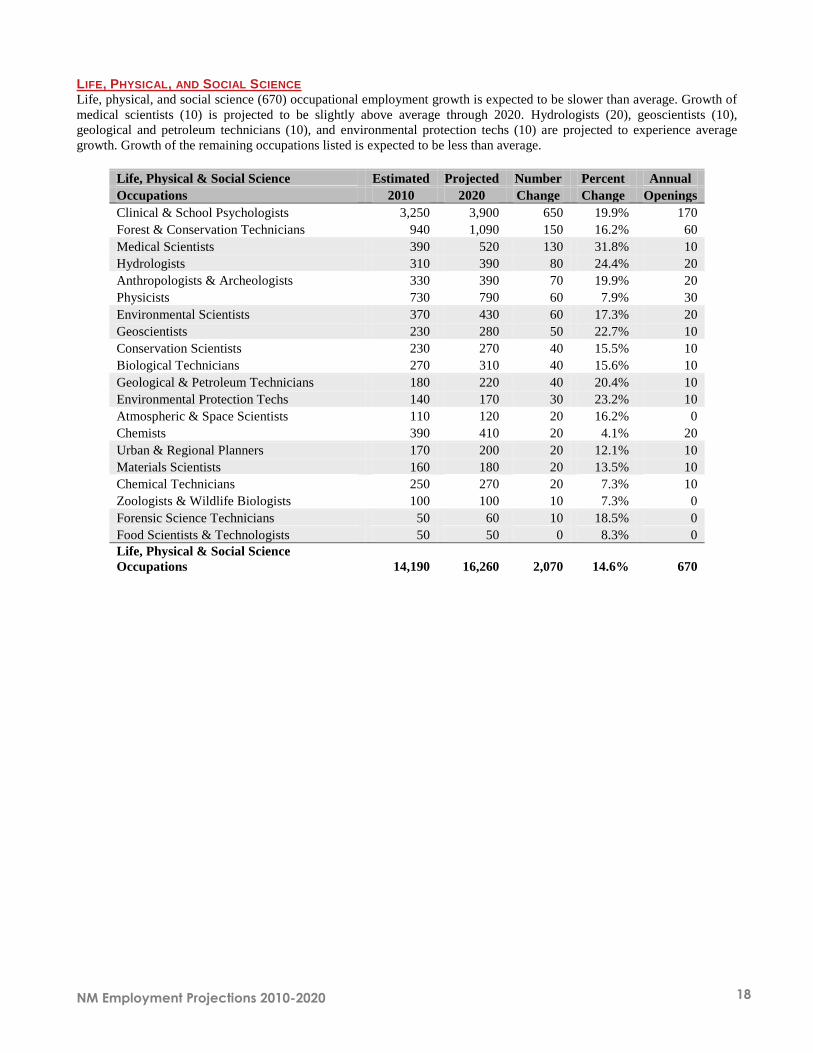
LIFE, PHYSICAL, AND SOCIAL SCIENCE Life, physical, and social science (670) occupational employment growth is expected to be slower than average. Growth of
medical scientists (10) is projected to be slightly above average through 2020. Hydrologists (20), geoscientists (10),
geological and petroleum technicians (10), and environmental protection techs (10) are projected to experience average
growth. Growth of the remaining occupations listed is expected to be less than average.
Life, Physical & Social Science Estimated Projected Number Percent Annual
Occupations 2010 2020 Change Change Openings
Clinical & School Psychologists 3,250 3,900 650 19.9% 170
Forest & Conservation Technicians 940 1,090 150 16.2% 60
Medical Scientists 390 520 130 31.8% 10
Hydrologists 310 390 80 24.4% 20
Anthropologists & Archeologists 330 390 70 19.9% 20
Physicists 730 790 60 7.9% 30
Environmental Scientists 370 430 60 17.3% 20
Geoscientists 230 280 50 22.7% 10
Conservation Scientists 230 270 40 15.5% 10
Biological Technicians 270 310 40 15.6% 10
Geological & Petroleum Technicians 180 220 40 20.4% 10
Environmental Protection Techs 140 170 30 23.2% 10
Atmospheric & Space Scientists 110 120 20 16.2% 0
Chemists 390 410 20 4.1% 20
Urban & Regional Planners 170 200 20 12.1% 10
Materials Scientists 160 180 20 13.5% 10
Chemical Technicians 250 270 20 7.3% 10
Zoologists & Wildlife Biologists 100 100 10 7.3% 0
Forensic Science Technicians 50 60 10 18.5% 0
Food Scientists & Technologists 50 50 0 8.3% 0
Life, Physical & Social Science
Occupations 14,190 16,260 2,070 14.6% 670

NM Employment Projections 2010-2020 19
ARTS, DESIGN, AND ENTERTAINMENT Growth among arts, design, and entertainment occupations (390) is projected to be less than average through 2020.
Employment growth of coaches and scouts (80), and interpreters and translators (30) is projected to be greater than average.
Audio/video equipment technicians (20) and technical writers (10) are the only two occupations projected to have average
growth. Most occupations in this group are projected to have less than average or declining growth through 2020.
Arts, Design & Entertainment Estimated Projected Number Percent Annual
Occupations 2010 2020 Change Change Openings
Coaches & Scouts 1,050 1,530 490 46.4% 80
Interpreters & Translators 380 540 160 42.3% 30
Graphic Designers 980 1,080 100 9.8% 40
Public Relations Specialists 510 600 90 17.3% 20
Technical Writers 340 420 70 20.6% 10
Audio & Video Equipment Technicians 330 400 70 21.0% 20
Interior Designers 240 280 40 15.4% 10
Merchandise Displayers 210 240 30 11.9% 10
Producers & Directors 820 840 10 1.6% 30
Music Directors & Composers 90 110 10 11.7% 0
Photographers 930 930 10 0.8% 10
Art Directors 60 60 0 0.0% 0
Multi-Media Artists & Animators 50 50 0 -2.0% 0
Commercial & Industrial Designers 30 30 0 7.4% 0
Set & Exhibit Designers 60 60 0 3.3% 0
Umpires & Other Sports Officials 30 30 0 16.0% 0
Musicians & Singers 180 180 0 -2.2% 0
Editors 340 330 -10 -3.6% 10
Camera Operators, Video & Motion Picture 90 80 -10 -13.8% 0
Writers & Authors 480 460 -20 -3.8% 10
Broadcast Technicians 240 220 -20 -10.0% 10
Floral Designers 280 250 -30 -11.7% 10
Reporters & Correspondents 400 350 -50 -12.4% 10
Radio & Television Announcers 530 460 -70 -13.3% 10
Actors 1,570 1,490 -80 -4.9% 40
Film & Video Editors 70 70 0 -2.9% 0
Arts, Design & Entertainment 10,930 11,700 770 7.1% 390

NM Employment Projections 2010-2020 20
HEALTHCARE PRACTIONERS AND TECHNICAL Healthcare practitioners and technical occupations (1,930) are expected to experience average growth. Employment among
registered nurses (670) is the highest of the healthcare practitioners and technical occupations. Growth of registered nurses
is expected to be average. Employment growth of sonographers (30), veterinary technicians (20), and physical therapists
(50) is expected to be faster than average. Ten of the remaining occupations are projected to grow at an average rate,
including respiratory therapists (20) and cardiovascular techs (10). Eleven occupations are projected to grow less than
average over the projection period.
Healthcare Practitioners & Technical Estimated Projected Number Percent Annual
Occupations 2010 2020 Change Change Openings
Registered Nurses 15,150 19,070 3,920 25.9% 670
Licensed Practical Nurses 4,470 5,240 770 17.2% 200
Pharmacy Technicians 2,010 2,440 430 21.4% 80
Physical Therapists 1,080 1,430 350 32.1% 50
EMTs & Paramedics 1,390 1,730 340 24.1% 60
Speech-Language Pathologists 1,110 1,420 310 27.9% 50
Family & General Practitioners 1,750 2,040 290 16.7% 60
Pharmacists 1,530 1,810 280 18.3% 70
Dental Hygienists 1,030 1,260 230 22.5% 40
Medical Records Technicians 1,340 1,560 220 16.3% 50
Radiologic Technologists & Technicians 770 970 200 25.5% 30
Diagnostic Medical Sonographers 470 650 180 38.9% 30
Medical & Clinical Laboratory Technologists 1,330 1,490 160 11.8% 40
Occupational Therapists 560 710 150 27.3% 30
Veterinary Technologists & Technicians 380 530 140 37.4% 20
Physician Assistants 710 850 130 18.8% 30
Respiratory Therapists 390 500 110 28.8% 20
Occupational Health & Safety Specialists 550 660 110 19.2% 30
Medical & Clinical Laboratory Technicians 940 1,040 100 10.4% 30
Cardiovascular Technologists & Technicians 310 400 90 28.3% 10
Surgical Technologists 540 630 90 17.1% 20
Opticians, Dispensing 390 480 90 23.2% 20
Dentists, General 850 920 80 8.8% 30
Internists, General 490 570 80 15.5% 20
Veterinarians 360 440 80 23.5% 20
Healthcare Practitioners & Technical
Occupations 46,010 55,980 9,970 21.7% 1,930

NM Employment Projections 2010-2020 21
HEALTHCARE SUPPORT Healthcare support occupations (1,250) are expected to grow at an above average rate through 2020. Home health aides
(600) are projected to add the most employment and grow much faster than average. Physical therapist assistants and aides
are both projected to grow more than average. Employment growth of nursing aides, orderlies & attendants (260), medical
assistants, and occupational therapy aids is projected to be average. Job growth of medical transcriptionists (10) is expected
to decline through the projections horizon.
Healthcare Support Estimated Projected Number Percent Annual
Occupations 2010 2020 Change Change Openings
Home Health Aides 8,230 13,180 4,950 60.1% 600
Nursing Aides, Orderlies & Attendants 7,510 9,100 1,600 21.3% 260
Medical Assistants 4,400 5,350 940 21.4% 160
Dental Assistants 2,030 2,370 340 16.5% 80
Physical Therapist Assistants 370 500 130 35.5% 20
Massage Therapists 750 880 120 16.5% 20
Physical Therapist Aides 320 430 110 34.4% 20
Pharmacy Aides 360 410 50 13.8% 10
Veterinary Assistants 690 720 40 5.1% 10
Psychiatric Aides 100 120 20 16.0% 0
Occupational Therapy Aides 80 110 20 25.0% 0
Medical Equipment Preparers 120 130 20 13.7% 0
Medical Transcriptionists 620 610 -10 -1.1% 10
Healthcare Support Occupations 27,020 35,600 8,580 31.7% 1,250
EDUCATION, TRAINING, AND LIBRARY Education, training, and library occupations (2,620) are expected to have average growth. Employment growth of all
special education teachers (100 for P-K and elementary and 50 for middle school), except secondary school teachers (40), is
projected to experience faster than average growth through 2020. Instructional coordinators (40), along with self-
enrichment (30) and vocational teachers (20) are also in the group growing faster than average. Elementary school teachers
(500), middle school teachers (240), kindergarten teachers (80) and teachers assistants (480) are projected to grow at an
average rate, while the remaining occupations listed are expected to grow more slowly than average.
Education Estimated Projected Number Percent Annual
Occupations 2010 2020 Change Change Openings
Elementary School Teachers 9,660 12,540 2,880 29.8% 500
Teacher Assistants 10,280 12,760 2,480 24.1% 480
Middle School Teachers 4,540 5,890 1,350 29.8% 240
Secondary School Teachers 5,910 7,020 1,110 18.8% 270
Special Education Teachers, P-K & Elem 1,510 2,020 510 33.4% 100
Kindergarten Teachers 1,410 1,820 420 29.8% 80
Special Education Teachers, Middle 810 1,080 270 33.4% 50
Instructional Coordinators 700 920 210 30.1% 40
Self-Enrichment Education Teachers 560 740 180 32.3% 30
Preschool Teachers 1,410 1,580 170 12.0% 50
Vocational Teachers, Postsecondary 510 660 160 31.2% 20
Special Education Teachers, Secondary 860 1,020 160 18.8% 40
Librarians 860 1,000 140 16.1% 40
Library Technicians 680 800 120 17.7% 40
Education, Training & Library
Occupations 54,610 68,780 14,170 26.0% 2,620

NM Employment Projections 2010-2020 22
PROTECTIVE SERVICE Protective service occupations (890) are expected to grow slower than average. Employment growth of private detectives
and investigators (0) and security guards (260) is projected to be about average from 2010 through 2020. All other
occupations in this group are expected to grow at a slower than average rate.
Protective Service Estimated Projected Number Percent Annual
Occupations 2010 2020 Change Change Openings
Security Guards 7,030 8,480 1,450 20.6% 260
Correctional Officers & Jailers 5,530 5,970 440 7.9% 140
Police & Sheriff's Patrol Officers 3,100 3,380 280 9.0% 120
Detectives & Criminal Investigators 1,600 1,860 250 15.8% 60
Firefighters 1,650 1,800 150 9.0% 60
1st-Line Sprvrs of Correctional Officers 660 700 40 6.1% 30
1st-Line Sprvrs of Police & Detectives 670 700 30 4.6% 30
Private Detectives & Investigators 90 120 30 27.5% 0
1st-Line Sprvrs of Fire Fighters 260 280 20 8.6% 10
Fire Inspectors & Investigators 70 70 10 8.8% 0
Protective Service Occupations 23,620 26,780 3,160 13.4% 890
FOOD PREPARATION AND SERVING RELATED
Food preparation and serving related occupations (4,300) are projected to add the most employment and grow at an average
rate through 2020. Only combined food preparation and servers (810) employment growth is expected to be above average
through 2020. Restaurant cooks (330), food prep workers (330), food prep supervisors (300), waiters and waitresses
(1,100), and bartenders (140) are expected to grow at an average rate. Growth among the remainder of the listed
occupations is projected to be less than average.
Food Preparation & Servers Estimated Projected Number Percent Annual
Occupations 2010 2020 Change Change Openings
Combined Food Prep & Servers 13,490 17,820 4,330 32.1% 810
Waiters & Waitresses 15,140 18,720 3,580 23.6% 1,110
Cooks, Restaurant 6,570 8,450 1,880 28.6% 330
1st-Line Sprvrs of Food Prep & Servers 6,550 8,130 1,580 24.1% 300
Food Preparation Workers 5,300 6,650 1,350 25.5% 330
Dishwashers 3,780 4,570 790 20.8% 250
Cooks, Fast Food 5,370 5,980 600 11.2% 170
Bartenders 2,420 2,930 510 21.0% 140
Counter Attendants & Coffee Shop Workers 3,200 3,720 510 16.0% 280
Cooks, Institution & Cafeteria 3,410 3,870 450 13.3% 120
Dining Room Attendants & Bartender Helpers 2,670 3,120 450 16.6% 140
Hosts & Hostesses 2,300 2,760 450 19.6% 210
Food Servers, Nonrestaurant 1,190 1,400 210 17.7% 60
Cooks, Short Order 920 1,060 140 15.5% 30
Chefs & Head Cooks 580 640 60 10.6% 20
Food Preparation & Serving Occupations 73,030 89,950 16,920 23.2% 4,300

NM Employment Projections 2010-2020 23
PERSONAL CARE AND SERVICE Personal care and service occupations (2,090) are expected to grow at a slightly above average rate. Employment growth of
personal and home care aides (1,080) is expected to be much faster than average. Growth of all other occupations listed is
expected to be slower than average, except for fitness trainers (90) and residential advisors (10), which are projected to
grow at about average through 2020.
Personal Care & Service Estimated Projected Number Percent Annual
Occupations 2010 2020 Change Change Openings
Personal Care Aides 17,780 27,190 9,420 53.0% 1,080
Childcare Workers 6,460 7,160 710 11.0% 270
Fitness Trainers & Aerobics Instructors 1,920 2,490 570 29.8% 90
Recreation Workers 2,150 2,470 330 15.3% 70
1st-Line Sprvrs of Personal Service Workers 1,820 2,040 220 12.2% 70
Amusement & Recreation Attendants 1,140 1,290 140 12.3% 80
Residential Advisors 180 220 40 21.9% 10
Baggage Porters & Bellhops 220 250 30 13.8% 10
Ushers, Lobby Attendants & Ticket Takers 350 370 20 4.6% 20
Funeral Service Managers & Undertakers 90 110 20 16.5% 0
Concierges 110 130 20 18.2% 10
Personal Care & Service Occupations 42,050 54,990 12,940 30.8% 2,090
SALES AND RELATED Sales and related occupations (3,790) are expected to grow more slowly than the average. Retail sales workers (1,440) are
expected to add the most employment in this sector, but grow slightly less than average. Insurance sales agents (70) are
expected to grow at the average rate through 2020. All other occupations listed are projected to grow slower than average.
Sales Estimated Projected Number Percent Annual
Occupations 2010 2020 Change Change Openings
Retail Salespersons 29,640 35,280 5,650 19.0% 1,440
Cashiers 19,000 21,500 2,500 13.1% 1,110
1st-Line Sprvrs of Retail Sales Workers 12,640 14,190 1,550 12.3% 450
Sales Reps, Wholesale & Mfg, non- Technical 5,860 6,440 580 9.9% 200
Counter & Rental Clerks 2,640 3,000 370 13.9% 100
Insurance Sales Agents 1,500 1,860 360 24.3% 70
Parts Salespersons 1,530 1,750 220 14.2% 80
Telemarketers 2,530 2,680 150 5.9% 70
Real Estate Sales Agents 1,040 1,160 130 12.2% 40
Demonstrators & Product Promoters 500 600 100 18.8% 30
Securities & Commodities Sales Agents 550 620 80 13.8% 20
Sales Reps, Wholesale & Mfg, Technical 1,410 1,490 80 5.5% 40
Real Estate Brokers 330 360 30 8.5% 10
Travel Agents 150 170 20 9.9% 0
Sales & Related Occupations 83,240 95,250 12,000 14.4% 3,790

NM Employment Projections 2010-2020 24
OFFICE AND ADMINISTRATIVE SUPPORT Employment growth of office and administrative support occupations (4,110) is expected to be slower than average.
Medical secretaries (60) are expected to have above average growth. All other listed occupations are expected to have less
than average growth through 2020.
Office & Administrative Support Estimated Projected Number Percent Annual
Occupations 2010 2020 Change Change Openings
Customer Service Representatives 11,160 13,000 1,840 16.5% 500
Office Clerks, General 11,510 13,320 1,810 15.7% 380
Bookkeeping, Accounting & Auditing Clerks 13,690 15,440 1,740 12.7% 330
1st-Line Spvrs of Admin Support Workers 9,650 11,130 1,490 15.4% 410
Receptionists 8,080 9,470 1,390 17.2% 380
Secretaries & Administrative Assistants, 17,490 18,310 830 4.7% 320
Stock Clerks & Order Fillers 10,210 11,000 790 7.7% 330
Hotel, Motel & Resort Desk Clerks 3,600 4,190 600 16.6% 200
Executive Secretaries & Executive Admin Asst 4,330 4,860 530 12.1% 110
Bill & Account Collectors 2,600 3,050 450 17.5% 100
Medical Secretaries 1,260 1,650 400 31.4% 60
Tellers 3,160 3,430 270 8.5% 160
Billing & Posting Clerks 1,320 1,490 170 12.8% 40
Payroll & Timekeeping Clerks 1,020 1,170 150 15.0% 40
Human Resources Assistants 1,130 1,280 150 13.6% 50
Eligibility Interviewers, Government Programs 1,210 1,350 140 11.6% 50
Shipping, Receiving & Traffic Clerks 2,210 2,330 120 5.4% 70
Library Assistants, Clerical 610 720 110 17.7% 40
Dispatchers, Except Police, Fire & Ambulance 730 840 110 15.3% 30
Interviewers, Except Eligibility & Loan 670 770 100 15.3% 20
Insurance Claims & Policy Processing Clerks 740 830 80 11.3% 30
Production, Planning & Expediting Clerks 830 900 70 8.2% 30
Office & Administrative Support
Occupations 124,430 137,130 12,700 10.2% 4,110

NM Employment Projections 2010-2020 25
CONSTRUCTION AND EXTRACTION Construction and extraction occupations (2,140) are expected to grow less than average through the projections horizon.
Carpenter helpers (60); roustabouts (180); oil and gas derrick operators (50); oil and gas drill operators (30); brick, stone,
and tile setters helpers (10); and oil and gas service unit operators (90) are projected to grow faster than average.
Employment growth for extraction worker helpers (20), glaziers (20), hazardous materials removal workers (20), and
plumbers’ helpers (50) is expected to be about average. The remaining occupations in construction and extraction are
expected to have less than average growth through 2020.
Construction & Extraction Estimated Projected Number Percent Annual
Occupations 2010 2020 Change Change Openings
Roustabouts 2,930 4,110 1,180 40.2% 180
Construction Laborers 11,520 12,500 980 8.5% 190
1st-Line Spvrs of Const & Extraction Workers 5,960 6,750 800 13.4% 220
Carpenters 7,040 7,720 680 9.7% 220
Construction Equipment Operators 4,070 4,610 540 13.4% 150
Oil, Gas & Mining Service Unit Operators 1,650 2,160 500 30.5% 90
Helpers--Carpenters 860 1,220 370 42.5% 60
Plumbers, Pipefitters & Steamfitters 3,770 4,100 320 8.6% 140
Derrick Operators, Oil & Gas 810 1,120 310 38.9% 50
Electricians 3,310 3,550 240 7.3% 110
Cement Masons & Concrete Finishers 1,830 2,060 230 12.5% 50
Helpers--Plumbers & Fitters 1,070 1,300 230 21.5% 50
Rotary Drill Operators, Oil & Gas 550 760 210 37.7% 30
Helpers--Electricians 1,630 1,760 130 8.0% 60
Helpers--Extraction Workers 430 540 120 27.5% 20
Highway Maintenance Workers 2,140 2,250 100 4.8% 70
Glaziers 340 430 90 27.0% 20
Continuous Mining Machine Operators 500 580 90 17.4% 20
Brickmasons & Blockmasons 500 570 80 15.1% 20
Painters, Construction & Maintenance 2,290 2,370 80 3.5% 60
Pipelayers 550 630 80 13.5% 20
Drywall & Ceiling Tile Installers 980 1,050 70 7.2% 30
Helpers--Brick, Stone & Tile Setters 200 270 70 32.2% 10
Hazardous Materials Removal Workers 330 400 70 22.6% 20
Construction & Building Inspectors 440 500 60 13.5% 20
Construction & Extraction Occupations 64,260 72,220 7,960 12.4% 2,140

NM Employment Projections 2010-2020 26
INSTALLATION, MAINTENANCE, AND REPAIR Installation, maintenance, and repair occupations (1,260) are expected to experience less than average growth. Employment
growth for small engine mechanics (10) is projected to be faster than average. Average growth is expected for security and
fire alarm installers (20), industrial machinery mechanics (40), medical equipment repairers (10), and home entertainment
equipment installers and repairers (20). All other listed occupations are expected to grow less than average.
Installation, Maintenance & Repair Estimated Projected Number Percent Annual
Occupations 2010 2020 Change Change Openings
General Maintenance & Repair Workers 8,200 9,290 1,090 13.3% 260
Automotive Service Technicians & Mechanics 4,680 5,300 620 13.1% 180
1st-Line Sprvrs of Mech., Install. & Repairers 3,150 3,550 400 12.8% 120
Bus, Truck & Diesel Engine Mechanics 2,280 2,560 270 12.0% 80
Telecommunications Equipment Techs 1,650 1,900 250 15.2% 50
Mobile Heavy Equipment Mechanics 1,460 1,700 240 16.5% 60
Industrial Machinery Mechanics 810 1,030 210 26.4% 40
Aircraft Mechanics & Service Technicians 1,080 1,250 160 15.0% 50
Tire Repairers & Changers 930 1,080 150 15.7% 40
Helpers--Installation, Maint & Repair Workers 810 940 120 15.0% 50
Security & Fire Alarm Systems Installers 380 480 100 26.6% 20
Automotive Body & Related Repairers 810 910 100 12.1% 30
HVAC Installers & Repairers 630 720 90 14.9% 20
Electrical Power-Line Installers & Repairers 790 880 90 12.0% 40
Home Entertainment Equip Installers & Repairers 310 380 70 21.7% 20
Powerhouse, Substation & Relay Techs 700 750 50 7.2% 20
Small Engine Mechanics 120 160 40 33.3% 10
Maintenance Workers, Machinery 470 510 40 9.2% 10
Telecommunications Line Installers & Repairers 660 700 40 5.6% 20
Medical Equipment Repairers 150 190 40 26.2% 10
Coin & Vending Machine Servicers 230 270 40 19.1% 10
Installation, Maintenance & Repair
Occupations 34,380 39,060 4,680 13.6% 1,260
NM Employment Projections 2010-2020 27
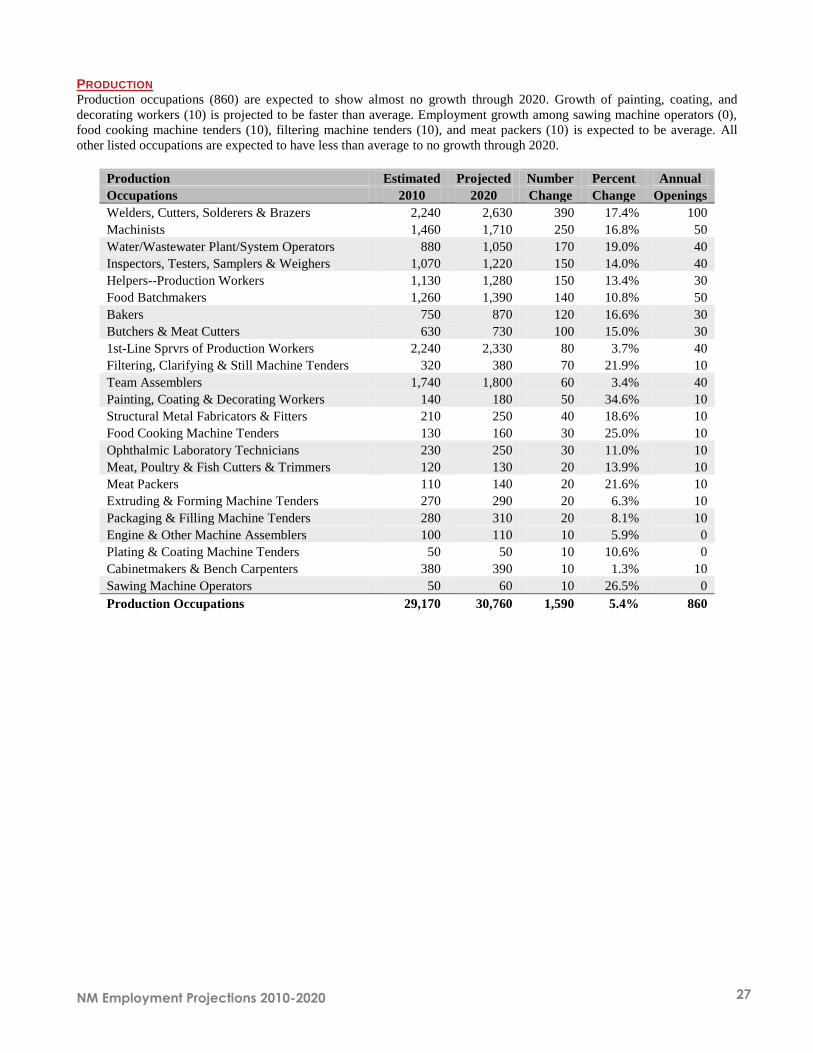
PRODUCTION Production occupations (860) are expected to show almost no growth through 2020. Growth of painting, coating, and
decorating workers (10) is projected to be faster than average. Employment growth among sawing machine operators (0),
food cooking machine tenders (10), filtering machine tenders (10), and meat packers (10) is expected to be average. All
other listed occupations are expected to have less than average to no growth through 2020.
Production Estimated Projected Number Percent Annual
Occupations 2010 2020 Change Change Openings
Welders, Cutters, Solderers & Brazers 2,240 2,630 390 17.4% 100
Machinists 1,460 1,710 250 16.8% 50
Water/Wastewater Plant/System Operators 880 1,050 170 19.0% 40
Inspectors, Testers, Samplers & Weighers 1,070 1,220 150 14.0% 40
Helpers--Production Workers 1,130 1,280 150 13.4% 30
Food Batchmakers 1,260 1,390 140 10.8% 50
Bakers 750 870 120 16.6% 30
Butchers & Meat Cutters 630 730 100 15.0% 30
1st-Line Sprvrs of Production Workers 2,240 2,330 80 3.7% 40
Filtering, Clarifying & Still Machine Tenders 320 380 70 21.9% 10
Team Assemblers 1,740 1,800 60 3.4% 40
Painting, Coating & Decorating Workers 140 180 50 34.6% 10
Structural Metal Fabricators & Fitters 210 250 40 18.6% 10
Food Cooking Machine Tenders 130 160 30 25.0% 10
Ophthalmic Laboratory Technicians 230 250 30 11.0% 10
Meat, Poultry & Fish Cutters & Trimmers 120 130 20 13.9% 10
Meat Packers 110 140 20 21.6% 10
Extruding & Forming Machine Tenders 270 290 20 6.3% 10
Packaging & Filling Machine Tenders 280 310 20 8.1% 10
Engine & Other Machine Assemblers 100 110 10 5.9% 0
Plating & Coating Machine Tenders 50 50 10 10.6% 0
Cabinetmakers & Bench Carpenters 380 390 10 1.3% 10
Sawing Machine Operators 50 60 10 26.5% 0
Production Occupations 29,170 30,760 1,590 5.4% 860

NM Employment Projections 2010-2020 28
TRANSPORTATION AND MATERIAL MOVING Transportation and material moving occupations (1,800) are expected to have less than average growth. Employment
growth of machine feeders (20) is expected to be faster than average. Service station attendants (70) and material handler
supervisors (50) are projected to experience average growth through 2020. Growth for all other listed occupations is
expected to be less than average to no growth through the projections horizon.
Transportation & Material Moving Estimated Projected Number Percent Annual
Occupations 2010 2020 Change Change Openings
Heavy & Tractor-Trailer Truck Drivers 8,680 10,310 1,640 18.8% 340
Light Truck or Delivery Services Drivers 5,140 5,670 530 10.3% 160
Bus Drivers, School or Special Client 2,690 3,000 310 11.7% 80
Driver/Sales Workers 2,310 2,620 310 13.5% 80
Automotive & Watercraft Service Attendants 1,070 1,370 300 28.2% 70
1st-Line Sprvrs of Material Handlers 1,040 1,320 280 26.4% 50
Cleaners of Vehicles & Equipment 1,500 1,730 240 15.7% 70
Industrial Truck & Tractor Operators 1,080 1,270 200 18.1% 50
Taxi Drivers & Chauffeurs 1,500 1,670 180 12.0% 40
Wellhead Pumpers 790 920 130 16.4% 40
1st-Line Sprvrs of Transport. & Machine Operators 930 1,060 120 13.2% 30
Machine Feeders & Offbearers 360 480 120 31.9% 20
Refuse & Recyclable Material Collectors 730 830 100 13.7% 30
Air Traffic Controllers 420 480 70 15.6% 20
Packers & Packagers, Hand 2,180 2,230 60 2.6% 70
Bus Drivers, Transit & Intercity 550 600 50 9.5% 20
Loading Machine & Dragline Operators 480 530 50 10.0% 20
Commercial Pilots 200 240 40 18.7% 10
Ambulance Drivers & Attendants 140 170 30 19.9% 10
Pump Operators 130 150 30 19.8% 10
Traffic Technicians 90 100 10 6.4% 0
Transportation & Material Moving Occupations 45,820 52,380 6,560 14.3% 1,800

NM Employment Projections 2010-2020 29
Assumptions, Limitations, &Technical Notes Assumptions
NATIONAL ASSUMPTIONS The general assumptions for projections of the U.S. Department of Labor are:
1) Strong productivity growth (3.0 percent average annual growth).
2) A labor force growth roughly equivalent to the rate posted for the 2000 to 2010 period (0.8 percent average annual
growth).
3) Continued low unemployment (5.2 percent average annual rate).
4) Increasing trade deficits.
5) A larger federal budget deficit.
6) Modest growth in federal defense and non-defense expenditures.
7) Consumer spending on durable goods growing faster than consumer spending on services and non-durable goods.
8) Consumer spending on drugs and medicines is assumed to grow much faster than spending on other categories.
9) Consumer spending on medical care is expected to drive growth.
10) Investment spending for production equipment is expected to grow.
11) Expenditures for construction of residential structures are to grow at about a 2.0 percent average annual rate.
12) Spending on non-residential construction is to grow at an annual average rate of about 5.7 percent.
STATE ASSUMPTIONS In addition to the national assumptions, which fold into New Mexico’s analysis, it is assumed that the state will also be
influenced by the following circumstances:
1) New Mexico population growth will closely track the national average.
2) Personal incomes will continue to grow moderately.
3) Tourism will increase due to promotion, special events, and the state’s unique appeal.
4) Federal government spending for both defense and non-defense purposes will remain at roughly the current level.
5) Natural resources will play a larger role in the New Mexico economy than it was in the recent past due to higher
prices, demand, and other factors such as technology improvements.
6) Employment in the manufacturing sector will maintain its share of between 4 and 5 percent of non-farm
employment.
7) Manufacturing employment will grow in absolute terms as manufacturing and other companies relocate to New
Mexico and existing businesses expand their operations due to extensive recruitment campaigns, an ample supply
of labor at relatively low wage scales, favorable living conditions, and other considerations.
Limitations These projections do not take into consideration the effects of terrorism, war, attack or oil shocks. New developments will
undoubtedly play a major economic role. Perhaps most difficult to predict are energy developments, since they are
influenced by national and international political decisions as well as by economic considerations. Employment in
industries that are particularly sensitive to business cycles, such as construction, is also difficult to accurately predict.
Estimates should therefore be carefully reviewed to take into account developments that could not be anticipated at the time
these projections were prepared.
Technical Notes The nonagricultural forecasts for major industries provided are based on quarterly employment and wage data for workers
covered by New Mexico Unemployment Insurance (UI) laws (this includes all state and local government employees), and
for federal government employees covered by the Federal Unemployment Tax Act (FUTA). The occupational projections
are based on an augmented employment base that includes agricultural workers, the self-employed, and private household
workers. The occupational projections include data for occupations in which 20 or more workers are employed. Workers in
the agriculture and private household sectors are included in the occupational base figures and ultimately reflected in the
projections of this report. Self-employed workers are also included in the occupational base and projections. All figures
have been rounded to the nearest 10. Annual job openings are the sum of employment growth and replacement needs. The
occupational projections included in this report were produced using the Occupational Projection System developed by the

NM Employment Projections 2010-2020 30
Utah Department of Employment Security. This methodology has been found to be a reliable general guide to project
occupational demand.
KEY PHRASES IN “EMPLOYMENT PROJECTIONS 2010-2020”
Changing employment between 2010 and 2020
If the statement about growth reads…
much faster than average
faster than average
average
less than average, little or no change
decline
Employment is projected to…
Increase 46 percent or more
Increase 31 to 45 percent
Increase 20 to 30 percent
Increase 0 to 19 percent
Decrease 1 percent or more
Additional Notes The BLS projections are built on the assumption of a full employment economy in 2020. The 2007-09 recession
represented a sharp downturn in the economy--and the economy, especially the labor market, has been slow to recover. As
a result, the 2010-20 projections reach a robust 2020 target year largely because the 2010 base year began from a relatively
low point. Rapid growth rates for some measures reflect recovery from the recession and, with some important exceptions,
growth beyond recovery.
Sources: Bureau of Labor Statistics, January 2012 Monthly Labor Review • Employment Outlook: 2010–2020 and the 2012-2013 Occupational Outlook Handbook.

NM Employment Projections 2010-2020 31
Need Workforce Information?
We have several major publications detailing New Mexico’s:
Current economic conditions and trends.
Wages by occupations and areas.
Growing jobs with skills and training needs.
Job market with helpful information for finding a job.
Career exploration tips.
Check Out Our Website!
For fast and easy access to the latest workforce information, please visit the New Mexico Workforce Connection website.
There you will find a wide variety of information and tools for all kinds of people, including business owners, managers,
job seekers, employers, decision-makers, teachers, grant writers, career counselors, and students. All of our publications,
including the one you are reading now, can be accessed online. The Economic Research & Analysis Bureau of the New
Mexico Department of Workforce Solutions has recently begun a new online publication series. Throughout the year,
ER&A economists will be publishing articles focused on New Mexico’s labor market. Articles will address a variety of
topics and will be targeted to NMDWS’s many audiences (businesses, job seekers, researchers/data users, policy makers).
Additional article on topics related to projections will be posted on this site.
http://www.jobs.state.nm.us/analyzer