Embed Size (px)
Citation preview

OBSERVATIONS FROM LOAD TESTS ON
GEOSYNTHETIC REINFORCED SOIL
A THESIS SUBMITTED TO THE GRADUATE DIVISION OF THE
UNIVERSITY OF HAWAI‘I AT MĀNOA IN PARTIAL FULFILLMENT
OF THE REQUIREMENTS FOR THE DEGREE OF
MASTER OF SCIENCE
IN
CIVIL ENGINEERING
MAY 2014
By
Melia K. Iwamoto
Thesis Committee:
Phillip S. K. Ooi, Chair Person
Horst G. Brandes
Peter G. Nicholson

1
ACKNOWLEDGEMENTS
I would like to thank:
My advisor, Dr. Phillip Ooi, for the priceless guidance, instruction,
encouragement, and patience during my master’s research.
Mr. Mike Adams and Dr. Jennifer Nicks for allowing me to work on this project
and for the support during conference and journal submissions.
The TFHRC researchers and lab technicians for their quality work on the GRS
mini-piers.
Dr. Horst Brandes and Dr. Peter Nicholson for increasing my knowledge of
geotechnical engineering and for sitting in on my thesis committee.
Ms. Janis Kusatsu for the warm talks; Ms. Amy Fujishige for preparing my
paperwork for graduation.
Dr. Daniel Lipe for the countless hours of advice and emotional support.
The Lamb of God Church and Bible School for the prayers and encouragement.
And finally my family and friends, for keeping me grounded and making me
smile but most of all my mom, for giving me motivation when I’ve seemed to
have lost mine.

2
ABSTRACT
In lieu of conventional concrete cantilever retaining walls, geosynthetic reinforced
soil (GRS) is increasingly being used as bridge abutments to support single span bridges.
When backfilled with cohesionless material, GRS abutments have good drainage, large
bearing capacities, and great flexibility to withstand seismic loads and do not suffer from
the bump-at-the-end-of-the-bridge syndrome. GRS differs from geosynthetic
mechanically stabilized earth (GMSE) structures in many ways particularly with respect
to reinforcement spacing. The reinforcement spacing in GRS is closer (typically 8
inches) whereas the spacing in GMSE can be as large as 32 inches.
Four pairs of instrumented GRS square columns, also known as performance tests or
mini-piers, were load tested at the Turner-Fairbank Highway Research Center (TFHRC)
in McLean, Virginia from 2011 – 2012. Each pair consisted of identical reinforcement
strength to spacing ratio, backfill, and dimensions; however, one was loaded with a light-
weight dry-stacked friction-only concrete masonry unit (CMU) facing in place and the
other with the CMU removed prior to load testing. Moreover, each pair had different
reinforcement strength (Tf) and vertical spacing (Sv). The effects of the CMU facing and
varying Tf, Sv and Tf/Sv ratios on the GRS vertical capacity, load-settlement curves,
lateral deformation and lateral earth pressures during mini-pier construction and during
load testing were investigated. A method to deduce the composite shear strength
parameters using stress paths for pairs of these mini-piers was developed; the validity of
the postulate of zero volume change was investigated; and the appropriateness of using
fully softened versus peak backfill shear strength parameters to predict the bearing
capacity of a footing on a GRS abutment was studied.

3
TABLE OF CONTENTS
Table of Contents .............................................................................................................. 3
List of Figures .................................................................................................................... 5
List of Tables ..................................................................................................................... 8
Introduction ................................................................................................................. 9
1.1 Introduction ............................................................................................................. 9
1.2 Motivation for Research ....................................................................................... 11
1.3 Thesis Overview ................................................................................................... 12
Literature Review ..................................................................................................... 14
2.1 Large-scale triaxial load tests and full-scale load tests on GRS ........................... 14
2.2 GRS Load Tests .................................................................................................... 15
2.2.1 Vegas Mini-Pier Experiments and the Postulate of Zero Volume Change
(Adams et al., 2002) ............................................................................................... 15
2.2.2 Large-Scale Unconfined Cylindrical Tests (Elton and Patawaran, 2005) .... 16
2.2.3 Mini Pier Experiments (Adams et al., 2007) ................................................ 20
2.2.4 GSGC Tests (Pham, 2009; Wu and Pham, 2013) ......................................... 22
2.2.5 TF tests and Validation Sessions (Nicks et al., 2013)................................... 24
2.2.6 University of Massachusetts at Amherst Load Tests (Mitchell 2002) .......... 27
2.3 Influence of Spacing versus Strength of Reinforcement on Performance of GRS 32
2.4 Bearing Capacity of a Footing on a GRS Abutment Wall .................................... 32
2.5 GRS versus GSME ............................................................................................... 36
Performance Test Program ...................................................................................... 38
3.1 Test Configuration ................................................................................................ 38
3.2 Backfill .................................................................................................................. 44
3.3 Geosynthetic Reinforcement ................................................................................. 47
3.4 Facing Elements .................................................................................................... 48
3.5 Loading System .................................................................................................... 48
3.6 Instrumentation ..................................................................................................... 50
3.6.1 Lateral and Vertical Deflection ..................................................................... 50
3.6.2 Lateral and Vertical Earth Pressure .............................................................. 51
3.6.3 Strain Gauges ................................................................................................ 52
Performance Test Results......................................................................................... 54
4.1 Ultimate Bearing Capacity .................................................................................... 54
4.2 Failure Plane ......................................................................................................... 59
4.3 Lateral Pressures ................................................................................................... 64

4
4.3.1 During Mini-Pier Construction ..................................................................... 64
4.3.2 During Load Testing ..................................................................................... 66
4.3.3 Lateral Earth Pressure Coefficients .............................................................. 68
4.4 Lateral Deformation .............................................................................................. 69
4.4.1 Postulate of Zero Volume Change ................................................................ 73
4.5 Fabric Strains ........................................................................................................ 78
4.5.1 Introduction ................................................................................................... 78
4.5.2 Strain Gauge Layout ..................................................................................... 79
4.5.3 Results ........................................................................................................... 80
4.6 Shear Strength Parameters of a GRS/GMSE ........................................................ 86
4.6.1 Construction of Stress Paths ......................................................................... 89
4.6.2 Strength Parameters ...................................................................................... 92
4.6.3 Discussion on the Shear Strength Parameters ............................................... 94
Use of Fully Softened Versus Peak Strengths to Predict the Ultimate Bearing
Capacity of Footings on GRS ......................................................................................... 96
5.1 Peak versus Fully Softened Strengths ................................................................... 96
5.1.1 Use of Peak Strengths to Predict Bearing Capacity ...................................... 99
5.1.2 Use of Fully Softened Strengths to Predict Bearing Capacity .................... 102
5.2 Summary ............................................................................................................. 103
Summary and Conclusions .................................................................................... 104
6.1 Summary ............................................................................................................. 104
6.2 Findings and Conclusions ................................................................................... 104
6.2.1 Bearing Capacity ......................................................................................... 104
6.2.2 Failure Plane: .............................................................................................. 105
6.2.3 Lateral Pressures: ........................................................................................ 105
6.2.4 Lateral Deformation: ................................................................................... 106
6.2.5 Postulate of Zero Volume Change .............................................................. 107
6.2.6 Fabric Strains .............................................................................................. 107
6.2.7 Shear Strength Parameters .......................................................................... 108
6.2.8 Fully Softened versus Peak Strengths ......................................................... 108
6.3 Key Findings ....................................................................................................... 109
6.4 Recommendations for Future Works .................................................................. 109
References ................................................................................................................ 111

5
LIST OF FIGURES
Figure 1-1 Typical cross-section of a GRS-IBS (Adams et al., 2011) ....................... 11
Figure 2-1 Schematic and photograph of Vegas Mini-Pier (Adams et al., 2002) ...... 16
Figure 2-2 Large-scale unconfined GRS load test (a) before loading and (b) after
failure (Elton and Patawaran, 2005) ......................................................... 19
Figure 2-3 Stress-strain curves of GRS with identical reinforcement strengths spaced
at 6 inches and 12 inches vertically (Elton and Patawaran, 2005)............ 19
Figure 2-4 Method to derive the (a) reinforced friction angle and (b) reinforced
cohesion of the GRS (Elton and Patawaran, 2005) ................................... 20
Figure 2-5 Schematic of Mini Pier dimensions and reinforcement spacing (in meters)
(Adams et al., 2007). ................................................................................. 21
Figure 2-6 (a) and (b) failures of widely spaced Mini Pier, MPs A and B; (c) and (d)
failures of closely spaced Mini Pier, MPs C and D (Adams et al., 2007) 22
Figure 2-7 (a) Application of grease to plexi glass within test frame to assure plane
strain conditions during loading (b) Latex membrane which enabled a
confining stress of 5 psi to be applied during loading (c) failed GSGC2
test specimen (Pham, 2009) ...................................................................... 24
Figure 2-8 Validation Session (VS) test set up (Nicks et al., 2013) ........................... 26
Figure 2-9 (a) Construction of TF-1 and (b) – (d) photographs test set up and loading
system of TF-1 through -3 (Nicks et al., 2013)......................................... 27
Figure 2-10 Variation of Ncq/2 with footing geometry and the stability factor. ........... 35
Figure 3-1 (a) Plan and profile schematic of TF-6; and (b) plan and profile schematic
of TF-7 ...................................................................................................... 40
Figure 3-2 (a) Schematic of TF-9; and (b) schematic of TF-10 ................................. 41
Figure 3-3 (a) Schematic of TF-12; and (b) schematic of TF-11 ............................... 42
Figure 3-4 (a) Schematic of TF-14; and (b) schematic of TF-13 ............................... 43
Figure 3-5 (a) Photograph of mini-pier test with CMU; (b) photograph of mini-pier
test without CMU; (c) photograph of TF-14............................................. 43
Figure 3-6 VDOT 21A grain size distribution ............................................................ 44
Figure 3-7 Compaction curve of VDOT 21A ............................................................. 45
Figure 3-8 Mohr-Coulomb failure envelope of GRS backfill based on large scale
direct shear tests ........................................................................................ 45
Figure 3-9 Schematic of CMU block.......................................................................... 48
Figure 3-10 Loading system ......................................................................................... 49
Figure 3-11 Schematics of deflection instrumentation for mini-piers (a) with CMU and
(b) without CMU....................................................................................... 51
Figure 3-12 Fatback cell mounted onto the CMU block. ............................................. 52

6
Figure 3-13 Attachment of strain gauge on geotextile using the University of Colorado
at Denver attachment technique. ............................................................... 53
Figure 4-1 Ultimate capacity versus Tf/Sv .................................................................. 56
Figure 4-2 Ratio of ultimate capacities with and without CMUs versus reinforcement
spacing ...................................................................................................... 56
Figure 4-3 Ratio of ultimate capacities with and without CMUs versus reinforcement
strength ...................................................................................................... 57
Figure 4-4 Load-settlement curves of the mini-pier load tests ................................... 58
Figure 4-5 Dimensionless form of the load-settlement curves of the mini-pier load
tests ........................................................................................................... 59
Figure 4-6 TF-11 at failure (qult,emp = 23.2 ksf) with Sv = 3-13/16 in and Tf = 1400
lb/ft (Nicks et al, 2013) ............................................................................. 60
Figure 4-7 TF-13 at failure (qult,emp = 13.0 ksf) with Sv = 11-1/4 in and Tf = 3600 lb/ft
(Nicks et al, 2013) ..................................................................................... 60
Figure 4-8 TF-10 at Failure (qult,emp = 10.33 ksf) with Sv = 15-1/4 in and Tf = 4800
lb/ft (Nicks et al, 2013) ............................................................................. 61
Figure 4-9 (a) – (i) Rupture pattern for geotextiles in TF-6; (j) Schematic of tears in
geotextiles in TF-6. ................................................................................... 63
Figure 4-10 Measured lateral pressures at Fatback cell during construction of Mini-
Piers........................................................................................................... 66
Figure 4-11 Measured lateral pressures at Fatback cell location during load testing of
TF-6, -9, -12, and -14. ............................................................................... 67
Figure 4-12 Lateral earth pressure coefficients versus dimensionless lateral movement.
................................................................................................................... 69
Figure 4-13 Lateral deformation profiles of GRS at loads ≈ 83% of ultimate load. .... 71
Figure 4-14 Lateral displacement of TF-6 with increasing applied load (with CMU)
Tf/Sv = 7.55 ksf. ........................................................................................ 72
Figure 4-15 Lateral deformation of TF-7 with increasing applied load (without CMU)
Tf/Sv = 7.55 ksf. ........................................................................................ 72
Figure 4-16 Schematic of assumed deformed mass for TF-11 at applied load = 23 ksf
(drawn to scale) as assumed by Adams, et al. (2002) and TF tests in (a)
profile view and (b) plan view. ................................................................. 74
Figure 4-17 Volumetric strain versus vertical applied load .......................................... 76
Figure 4-18 Volumetric strain due to service loads (4 ksf). ......................................... 77
Figure 4-19 Volume gained versus volume lost ........................................................... 78
Figure 4-20 Strain measured using strain gauges and POTs versus distance from the
center of the GRS mass for (a) Geotextile 7 (b) Geotextile 5 and (c)
Geotextile 3 for TF-6. ............................................................................... 83

7
Figure 4-21 Strain measured using strain gauges and POTs versus distance from the
center of the GRS mass for (a) Geotextile 14 (b) Geotextile 10 and (c)
Geotextile 6 for TF-11. ............................................................................. 84
Figure 4-22 Strain measured using strain gauges and POTs versus distance from the
center of the GRS mass for (a) Geotextile 16 (b) Geotextile 12 and (c)
Geotextile 8 for TF-12. ............................................................................. 85
Figure 4-23 Stress paths during load testing of TF-13 (without CMU) and TF-14 (with
CMU) with Tf/Sv = 3.84 ksf. ..................................................................... 87
Figure 4-24 Stress paths during load testing of TF-9 (with CMU) and TF-10 (without
CMU) with Tf/Sv = 3.78 ksf. ..................................................................... 87
Figure 4-25 Stress paths during load testing of TF-11 (without CMU) and TF-12 (with
CMU) with Tf/Sv = 4.41 ksf. ..................................................................... 88
Figure 4-26 Stress paths during load testing of TF-6 (with CMU) and TF-7 (without
CMU) with Tf/Sv = 7.55 ksf. ..................................................................... 88
Figure 4-27 Free-body diagram of vertically loaded GRS ........................................... 91
Figure 4-28 (a) and (b) Photographic evidence of when CMU blocks lurched forward
at failure of TF-6; (c) and (d) Photographic evidence of when CMU blocks
lurched forward at failure of TF-12. ......................................................... 93
Figure 4-29 Dimensionless forms of cohesion and friction angle versus dimensionless
for of Tf/Sv ratio ........................................................................................ 95
Figure 5-1 (a) Large scale direct shear device (LSDS) (b) Large scale triaxial device
(LSTX) ...................................................................................................... 98
Figure 5-2 Typical stress-strain curve of an overconsolidated soil ............................ 98
Figure 5-3 Histogram and normal distribution of the bias using peak strengths ...... 101
Figure 5-4 Measured versus predicted capacities using peak strengths ................... 101
Figure 5-5 Histogram and normal distribution of the bias using fully softened
strengths .................................................................................................. 102
Figure 5-6 Measured versus predicted capacities using fully softened strength ...... 103

8
LIST OF TABLES
Table 2-1 Summary of test variables and results from large-scale unconfined
cylindrical GRS load tests (Elton and Patawaran, 2005) .......................... 18
Table 2-2 Test variables of Mini Pier experiments (Adams et al., 2007) ................. 21
Table 2-3 Test variables of GSGC tests (Pham, 2009) ............................................. 24
Table 2-4 Summary of test variables for TF and VS tests (Nicks et al., 2013)......... 25
Table 2-5 Influence of spacing versus tensile strength on the bearing capacity of a
footing on a GRS ...................................................................................... 32
Table 3-1 Mini-pier load tests conducted at TFHRC ................................................ 39
Table 3-2 Properties of geotextiles used in the mini-pier load or performance tests
conducted at TFHRC. ............................................................................... 48
Table 3-3 Instruments deployed in TF tests. ............................................................. 50
Table 4-1 Ultimate bearing capacity and strain at failure of mini-pier load tests ..... 55
Table 4-2 Performance tests dates and Fatback cell temperatures ............................ 65
Table 4-3 Summary of strain gages in performance tests ......................................... 79
Table 4-4 Shear strength parameters of GRS ............................................................ 93
Table 5-1 Test parameters of GRS performance tests selected from literature ......... 97
Table 5-2 Predicted and measured ultimate bearing capacity of GRS load tests using
fully softened versus peak strengths ....................................................... 100

9
INTRODUCTION
1.1 Introduction
Geosynthetic reinforced soil (GRS) is defined as closely-spaced (≤ 12 inches;
typically ≈ 8 inches) alternating layers of geosynthetic reinforcement and compacted
granular fill material (Adams, et al., 2011). GRS has been used for a variety of
geotechnical applications but has recently been promoted by the Federal Highway
Administration (FHWA) for use as abutments for single span steel or concrete bridges in
their Everyday Counts Initiative, which is focused on accelerating implementation of
proven, market-ready technologies. GRS-IBS, where IBS stands for Integrated Bridge
System, consists of a reinforced soil foundation (RSF), a GRS abutment and a GRS
integrated approach (Figure 1-1). The RSF consists of granular fill compacted and
encapsulated in geotextile. The RSF provides embedment and increases the bearing width
and capacity of the GRS abutment. The GRS abutment provides load-bearing support for
the bridge, which is placed directly on the abutment. GRS is also used to construct the
integrated approach adjacent to the superstructure. GRS-IBS has the following
advantages:
It is a fast and cost-effective method of bridge support which eliminates the need
for cast-in-place reinforced concrete abutments traditionally supported on deep
foundations.
Quality compaction control can be realized since closely-spaced geosynthetics
ensure backfill is placed in thin lifts.

10
Catastrophic collapse was not observed in numerous load tests carried out to
failure; GRS abutments behave in a ductile fashion.
It can be built in variable weather with common labor, materials and equipment,
and can be easily modified in the field.
The “bump-at-the-end-of-the-bridge” problem caused by differential settlement
between the bridge abutment and the approach roadway is alleviated. This is
made possible by eliminating deep foundations, by using GRS to construct the
integrated approach, and by limiting its use to short, single-span integral bridge
systems.
It enjoys all the advantages associated with an integral abutment bridge.
A very flexible system, it is amenable to differential settlement and seismic
loading.

11
Figure 1-1 Typical cross-section of a GRS-IBS (Adams et al., 2011)
GRS differs from geosynthetic mechanically stabilized earth (GMSE) structures in
many ways particularly with respect to the maximum reinforcement spacing. The
reinforcement spacing in GRS is closer whereas the spacing in GMSE can be as large as
32 inches. GMSE and GRS are also designed differently. Therefore, it is of interest to
the geotechnical engineer to understand differences in their behavior upon loading.
1.2 Motivation for Research
Because GRS-IBS is load bearing, its capacity is an important design consideration.
Many large-scale load tests to determine the bearing capacity of GRS has been performed
and are available in the literature. Recently, an extensive series of load tests on
GRS/GMSE mini-piers or square columns were performed at FHWA's Turner-Fairbank

12
Highway Research Center (TFHRC) in McLean, Virginia with and without concrete
masonry unit (CMU) facing frictionally connected to the reinforcement (Nicks et al.
2013). The tests were instrumented to provide valuable information on the internal
behavior of the GRS and can be used to understand the influence of the facing,
reinforcement strength (Tf) and reinforcement spacing (Sv) on the bearing capacity of a
footing on the GRS.
In light of this, the objectives of this research were to: (1) investigate the effects of
modular block facing with frictional connection and varying Tf/Sv (reinforcement
strength to vertical spacing) ratios on the GRS vertical capacity, load-settlement curves,
lateral deformation and lateral earth pressures during mini-pier construction and during
load testing, (2) derive the composite shear strength parameters of the GRS/GMSE; (3)
examine the validity of the postulate of zero volume change (Adams et al., 2002) during
loading of GRS, which forms the basis for estimating lateral deformations of GRS walls
and (4) assess the appropriateness of using the soil’s fully softened versus peak shear
strengths to predict the bearing capacity of footings on GRS.
1.3 Thesis Overview
An outline of the thesis is provided below:
Chapter 2 Findings from a literature review on GRS load tests, method of
estimating the bearing capacity of a footing on a GRS wall, and
differences between GRS and GMSE
Chapter 3 Description and test set up of the TFHRC performance tests
Chapter 4 Presentation of results from the TFHRC performance tests
13
Chapter 5 Study on the appropriateness of using the soil’s fully softened versus
peak shear strengths to predict the bearing capacity of footings on GRS
Chapter 6 Summary and conclusions

14
LITERATURE REVIEW
2.1 Large-scale triaxial load tests and full-scale load tests on GRS
Many large-scale triaxial tests have been performed on GRS reinforced soil (Chen
et al., 2000; Lee, 2000; Ketchart and Wu, 2001; Holtz and Lee, 2002; Zhang et al., 2006;
Ziegler, 2008; etc.). These tests are useful for shedding light on the influence of
reinforcement spacing and ultimate tensile strength on the strength and performance of
GRS. However, the U.S. Army Corps of Engineers (Jewell 1993) suggested that the test
specimen must be at least 6 times larger than the maximum particle size and at least 15
times larger than the average particle size of the backfill to eliminate particle size effects
on the test specimen.
Another concern with laboratory triaxial tests on GRS is the limit on reinforcement
spacing. The spacing in the field cannot be mimicked with triaxial size specimens.
Many full-scale GRS abutment experiments have been performed (Adams et al.,
1997; Gotteland et al., 1997; Ketchart and Wu, 1997; Tatsuoka et al., 1997; Wu et al.,
2006; Yoo and Kim, 2008). These tests demonstrated the reliability of GRS walls
subjected to typical working loads, but they were not loaded to failure. Also, a series of
large-scale plane strain load tests were performed on geogrid reinforced soil structures at
the Royal Military College of Canada (Bathurst et al., 1988; Bathurst and Benjamin,
1990; Bathurst et al., 2000; Burges, 1999; Vlachopoulos, 2000; Saunders, 2001; Leblanc,
2002; Reeves, 2003; Nelson, 2005). However, these tests will not be discussed further
because: (1) the tests involve geogrid-reinforced soils with large rectangular panels as
facing. These panels are significantly larger than the modular block facing typically

15
associated with GRS. In some tests, the panels were stacked horizontally while in others,
they stood vertically side-by-side; (2) the connections between the facing panels and the
reinforcement were not frictional. In fact, the connection strengths are believed to be
much higher than the frictional connection in a GRS; (3) the reinforcement spacings were
higher than 12 inches in most tests; (4) some of the load tests on the geogrid walls were
not carried out to failure; and (5) the soil’s fully softened strengths could not be discerned
from the publications.
Large-scale GRS load tests carried out to failure are expensive to perform and are
primarily research-based. Hence, there are only a few available, a summary of which is
presented in the sections below.
2.2 GRS Load Tests
2.2.1 Vegas Mini-Pier Experiments and the Postulate of Zero Volume Change (Adams
et al., 2002)
In 2000, the FHWA began its first series of large-scale GRS load tests with the
Vegas Mini-Pier (Adams et al., 2002). This test was not loaded to failure due to time
constraints and stroke limitations. However, it is discussed because this publication
introduced the postulate of zero volume change.
This test was performed on a square column (3.5 ft x 3.5 ft x 8 ft high) with
segmental retaining wall (SRW) blocks as facing (Figure 2-1). The geotextile was a
woven polypropylene having an ultimate tensile strength (Tf) of 2400 lb/ft spaced (Sv)
every 6 inches giving a Tf/Sv ratio of 4800 psf. Bearing bed reinforcements were

16
provided in the top two rows (Sv = 3 in). The soil was a poorly graded-silty gravel
backfill (GP-GM).
This test was instrumented to measure applied vertical load, settlement, and lateral
deformation. When loaded, Adams et al. (2002) found that the lateral expansion was
equal to the vertical compression of the GRS. This along with other similar load tests
gave rise to the postulate of zero volume change, which can be used to predict the
maximum lateral displacement of a GRS wall based on its settlement, and vice versa. An
objective of this study is to validate the postulate of zero volume change (discussed in
greater detail in Section 4.4.1).
Figure 2-1 Schematic and photograph of Vegas Mini-Pier (Adams et al., 2002)
2.2.2 Large-Scale Unconfined Cylindrical Tests (Elton and Patawaran, 2005)
Elton and Patawaran (2005) performed unconfined load tests on 7 large-scale
cylindrical columns (2.5ft diameter x 5 ft high) reinforced with nonwoven polypropylene
geotextiles of varying tensile strengths at a constant vertical spacing of 6 inches (Table 2-
1 and Figure 2-2). The backfill was a poorly graded sand (SP) with less than 5% fines.

17
An initial test was performed with a reinforcing spacing of 12 inches. Upon conducting a
post-mortem of this test column, it was found that the reinforcement strength was not
mobilized (no tears in the geotextile). The stress-strain curves of two GRS columns
utilizing the same geotextile but one having a 12 inch spacing and the other 6 inch
spacing are shown in Figure 2-3. From these two tests, Elton and Patawaran (2005)
noted that the reinforcement strength of the 12-inch-spaced GRS column was not
mobilized. Therefore, subsequent tests were spaced 6 inches apart. These tests were
instrumented to measure vertical applied load, lateral deformation and settlement.
These tests were run on asymmetrically loaded cylindrical columns, which is very
different from the plain strain condition of a footing on a GRS abutment. Nevertheless,
they provide valuable information to this study.
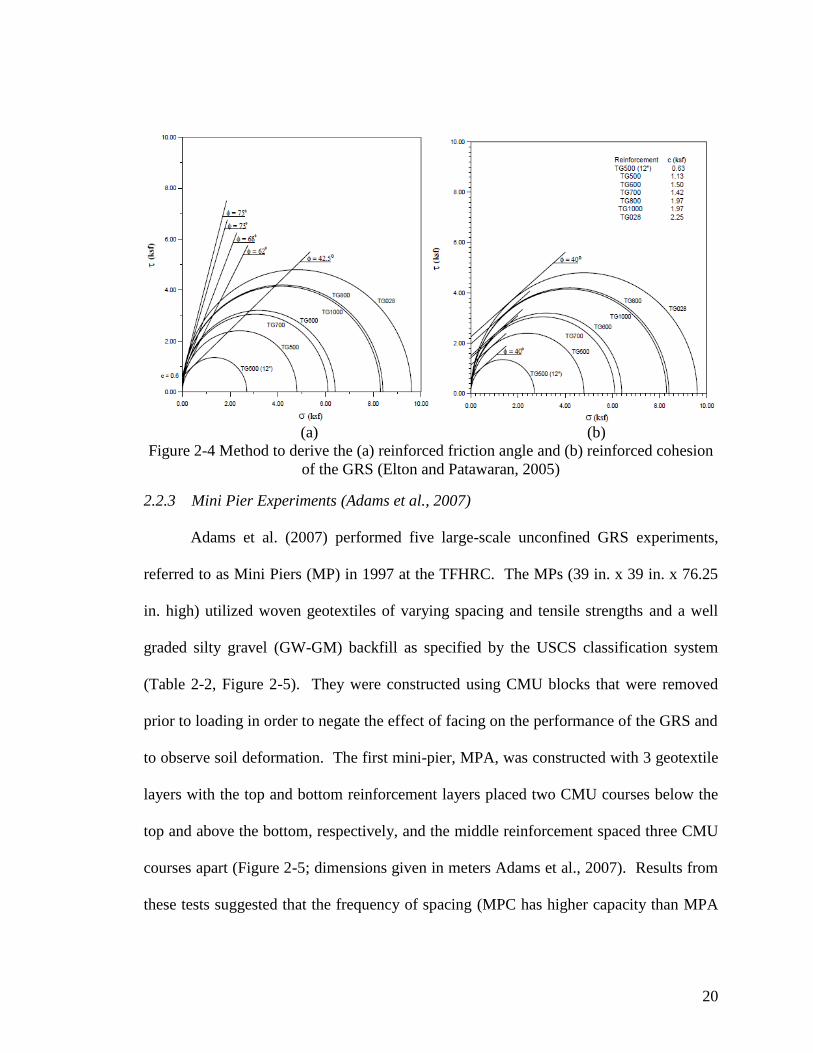
The peak cohesion and friction angle of the backfill determined from direct shear
tests were 0.6 ksf and 40°, respectively. Elton and Patawaran (2005) estimated the
friction angle of the composite, ϕreinf, as the angle of a line that is drawn through the soil’s
cohesion = 0.6 ksf and that intersects the reinforced soil’s Mohr circle at failure (Figure
2-4a). The cohesion of the composite was calculated by drawing a 40° line tangent to the
reinforced soil’s Mohr circle at failure. Where this line crosses the y-axis was taken as
creinf (Figure 2-4b).
The method to determine the shear strength parameters of the GRS composite
follow the concept of apparent cohesion (Yang, 1972) to derive creinf and the concept of
apparent confining pressure (Schlosser and Long, 1972) to derive ϕreinf. However, these
methods were incorrectly executed. First, the cohesion that should be used to determine

18
the reinforced friction angle is not the backfill cohesion but rather a function of the
backfill friction angle, reinforcement spacing and strength which has been shown by
Yang (1972) to be:
𝑐𝑅′ =
∆𝜎3
2√𝐾𝑝 + 𝑐 =
𝑇𝑓√𝐾𝑝
2𝑆𝑣+ 𝑐 (2-1)
where Kp is the Rankine passive earth pressure coefficient = tan2(45°+ϕ/2), Tf and Sv are
the reinforcement strength and spacing, and c is the cohesion of the backfill. One note on
Yang’s (1972) concept of apparent cohesion is that the assumption that the increased
apparent confining pressure is equal to Tf/Sv (implying that increasing Tf has the same
effect as a proportional decrease in Sv) has been proven to be untrue (see Section 2.3 for
evidence on why this concept is incorrect).
Table 2-1 Summary of test variables and results from large-scale unconfined cylindrical
GRS load tests (Elton and Patawaran, 2005)
Test
USCS
Symbol
Tf
(lb/ft)
Sv
(in)
Tf/Sv
(ksf)
Facing
Type
Boundary
Condition H/B1
qult,emp2
(ksf)
Elton1 SP 612 6.0 1.22 None Cylindrical Column 2 4.81
Elton2 SP 612 12.0 0.61 None Cylindrical Column 2 2.69
Elton3 SP 960 6.0 1.92 None Cylindrical Column 2 6.39
Elton4 SP 996 6.0 1.99 None Cylindrical Column 2 6.10
Elton5 SP 1272 6.0 2.54 None Cylindrical Column 2 8.40
Elton5 SP 1380 6.0 2.76 None Cylindrical Column 2 8.29
Elton7 SP 1704 6.0 3.41 None Cylindrical Column 2 9.59
Notes: 1. H = specimen height and B = specimen diameter
2. qult,emp = measured ultimate bearing capacity of the GRS test

19
(a) (b)
Figure 2-2 Large-scale unconfined GRS load test (a) before loading and (b) after failure
(Elton and Patawaran, 2005)
Figure 2-3 Stress-strain curves of GRS with identical reinforcement strengths spaced at 6
inches and 12 inches vertically (Elton and Patawaran, 2005)
20
(a) (b)
Figure 2-4 Method to derive the (a) reinforced friction angle and (b) reinforced cohesion
of the GRS (Elton and Patawaran, 2005)
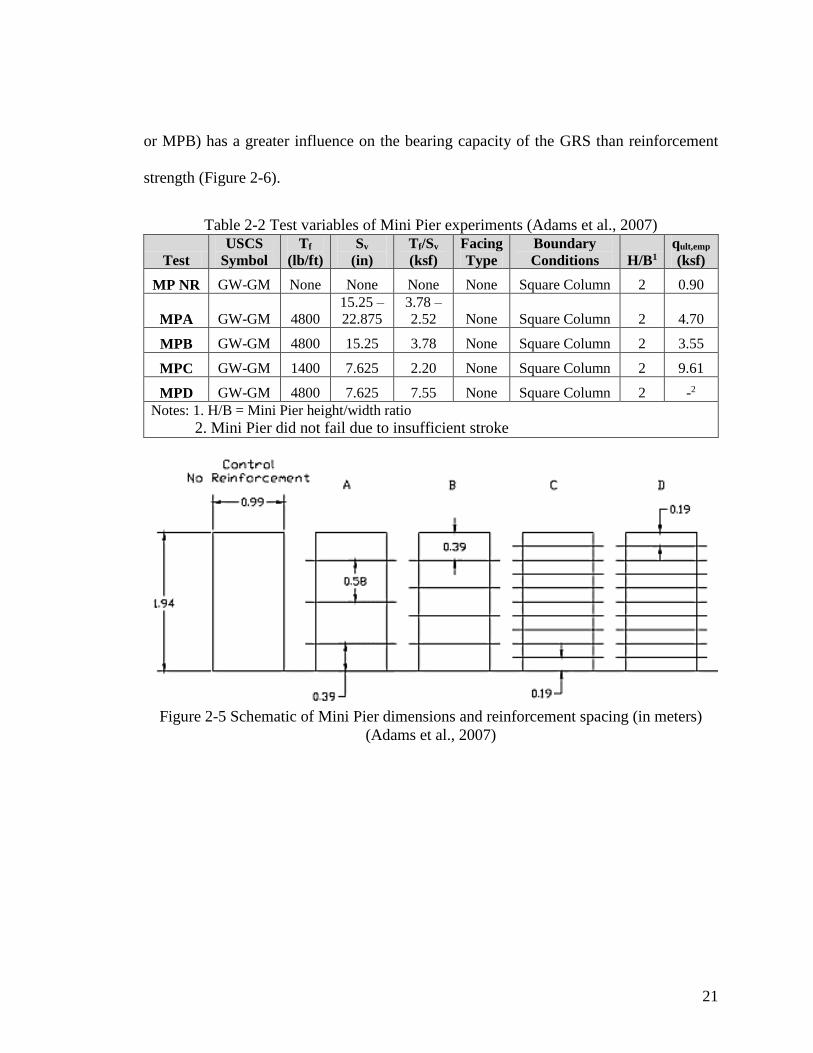
2.2.3 Mini Pier Experiments (Adams et al., 2007)
Adams et al. (2007) performed five large-scale unconfined GRS experiments,
referred to as Mini Piers (MP) in 1997 at the TFHRC. The MPs (39 in. x 39 in. x 76.25
in. high) utilized woven geotextiles of varying spacing and tensile strengths and a well
graded silty gravel (GW-GM) backfill as specified by the USCS classification system
(Table 2-2, Figure 2-5). They were constructed using CMU blocks that were removed
prior to loading in order to negate the effect of facing on the performance of the GRS and
to observe soil deformation. The first mini-pier, MPA, was constructed with 3 geotextile
layers with the top and bottom reinforcement layers placed two CMU courses below the
top and above the bottom, respectively, and the middle reinforcement spaced three CMU
courses apart (Figure 2-5; dimensions given in meters Adams et al., 2007). Results from
these tests suggested that the frequency of spacing (MPC has higher capacity than MPA
21
or MPB) has a greater influence on the bearing capacity of the GRS than reinforcement
strength (Figure 2-6).
Table 2-2 Test variables of Mini Pier experiments (Adams et al., 2007)
Test
USCS
Symbol
Tf
(lb/ft)
Sv
(in)
Tf/Sv
(ksf)
Facing
Type
Boundary
Conditions H/B1
qult,emp
(ksf)
MP NR GW-GM None None None None Square Column 2 0.90
MPA GW-GM 4800
15.25 –
22.875
3.78 –
2.52 None Square Column 2 4.70
MPB GW-GM 4800 15.25 3.78 None Square Column 2 3.55
MPC GW-GM 1400 7.625 2.20 None Square Column 2 9.61
MPD GW-GM 4800 7.625 7.55 None Square Column 2 -2
Notes: 1. H/B = Mini Pier height/width ratio
2. Mini Pier did not fail due to insufficient stroke
Figure 2-5 Schematic of Mini Pier dimensions and reinforcement spacing (in meters)
(Adams et al., 2007)

22
(a) (b)
(c) (d)
Figure 2-6 (a) and (b) failures of widely spaced Mini Pier, MPs A and B; (c) and (d)
failures of closely spaced Mini Pier, MPs C and D (Adams et al., 2007)
2.2.4 GSGC Tests (Pham, 2009; Wu and Pham, 2013)
Pham (2009) performed five large-scale GRS load tests, referred to as “Generic
Soil-Geosynthetic Composite” or GSGC tests. The GSGC tests were set up in plane
strain to more closely resemble a footing on a GRS abutment by using greased plexi-glass

23
at two opposite ends. The plexi-glass ends are restricted from lateral strain in the out-of-
plane direction. Photographs of the application of grease to the plexi-glass within the test
frame, the latex membrane which enabled a confining pressure of 5 psi to be applied to
the GRS, and a failed GSGC specimen are shown in Figures 2-7(a) – (c). Table 2-3
summarizes details of tests GSGC1 through GSGC5. GSGC1 was unreinforced while
GSGC 2 through 5 were reinforced. GSGC1 through GSGC4 were subjected to a
confining stress of 5 psi while GSGC5 had no applied confining pressure.
Composite strength parameters were obtained by applying Schlosser and Long’s
method (1972) and assuming ϕreinf = ϕbackfill. The apparent cohesion was calculated using
Equation 2-1. Pham (2009) observed that a GRS with a reinforcement strength Tf at
spacing Sv will not have the same capacity as a GRS with a reinforcement strength 2Tf at
spacing 2Sv. Realizing that the spacing has a greater influence than the reinforcement
strength, he developed Equation 2-2 to estimate the composite cohesion of a GRS.
Equation 2-2 includes a W-factor that amplifies the contribution of spacing to GRS
capacity.
𝑐𝑅 =∆𝜎3
2√𝐾𝑝 + 𝑐 = 𝑊
𝑇𝑓
2𝑆𝑣√𝐾𝑝 + 𝑐 = [0.7
(𝑆𝑣
6𝑑𝑚𝑎𝑥)]
𝑇𝑓
2𝑆𝑣√𝐾𝑝 + 𝑐 (2-2)
where Δ3 = increased confining pressure in a GRS mass due to the reinforcement, Kp =
Rankine passive earth pressure coefficient, c = backfill cohesion, dmax = maximum
particle size of the soil, Sv = reinforcement spacing, and Tf = reinforcement tensile
strength. The friction angle of the GRS was assumed to be equal to that for the
unreinforced soil. Pham’s W-factor was used to develop a model to predict the bearing

24
capacity of a footing on a GRS abutment, the derivation of which is discussed in Section
2.3. This model is included in the FHWA’s GRS-IBS Interim Implementation Guide and
Synthesis Report [FHWA, 2011(a) and 2011(b)] as a method to predict the bearing
capacity of a footing on a GRS abutment.
Table 2-3 Test variables of GSGC tests (Pham, 2009)
Test
No.
USCS
Symbol
Tf
(lb/ft)
Sv
(in)
Facing
type
Boundary
Conditions
H1
(in)
B2
(in)
L3
(in)
qult,emp
(ksf)
GSGC1 GW-GM - - 4 Plain Strain 76.25 57 47 16.09
GSGC2 GW-GM 4800 7.63 4 Plain Strain 76.35 54 46.75 70.95
GSGC3 GW-GM 9600 15.25 4 Plain Strain 76.35 53 46.75 42.58
GSGC4 GW-GM 4800 15.25 4 Plain Strain 76.30 58.75 46.75 37.25
GSGC5 GW-GM 4800 7.63 None Plain Strain 76.35 49 46.75 42.45
Note: 1. H = GSGC height (in)
2. B = GSGC width (in)
3. L = GSGC length (in)
4. No facing was used. Instead, a confining pressure = 5 psi was applied with a
latex rubber membrane wrapped around the GRS
(a) (b) (c)
Figure 2-7 (a) Application of grease to plexi glass within test frame to assure plane strain
conditions during loading (b) Latex membrane which enabled a confining stress of 5 psi
to be applied during loading (c) failed GSGC2 test specimen (Pham, 2009)
2.2.5 TF tests and Validation Sessions (Nicks et al., 2013)
The FHWA reported 19 load tests on square GRS columns (Nicks et al., 2013).
Five load tests were performed at the Defiance County, Ohio highway maintenance

25
facility and are referred to as Validation Sessions or “VS” (Figure 2-8). Fourteen load
tests were performed at the TFHRC in McLean, Virginia and are denoted as “TF”. Table
2-4 contains a summary of the test variables. The VS tests and TF-8 included two
courses of bearing bed reinforcement placed at the top of the mini pier. VS-1, -2, -3, -5
and TF-1 utilized open-graded backfill (GP), VS-4 poorly graded sand (SP), and the
remaining tests well-graded backfill (GW-GM). Difficulties in testing rendered the
results from VS-3, -4, TF-4 and -5 unreliable. TF-8 is not considered herein because it is
similar to TF-7 except that it has the bearing bed reinforcement.
Table 2-4 Summary of test variables for TF and VS tests (Nicks et al., 2013)
Test
No.
USCS
Symbol
Tf
(lb/ft)
Sv
(in)
Tf/Sv
(lb/ft2)
Facing
type
Boundary
Conditions H/B1
qult,emp
(ksf)
VS-1 GP 4800 7.63 7600 CMU Square Column 2 23.32
VS-2 GP 4800 7.63 7600 CMU Square Column 2 22.71
VS-3 GP 4800 7.63 7600 CMU Square Column 2 -
VS-4 SP 4800 7.63 7600 CMU Square Column 2 -
VS-5 GP 4800 7.63 7600 CMU Square Column 2 21.54
TF-1 GP 2400 7.63 3800 CMU Square Column 2 20.50
TF-2 GW-GM 2400 7.63 3800 CMU Square Column 2 25.26
TF-3 GW-GM 2400 7.63 3800 None Square Column 2 17.49
TF-4 GW-GM 4800 7.63 7600 None Square Column 2 -
TF-5 GW-GM 4800 7.63 7600 None Square Column 2 -
TF-6 GW-GM 4800 7.63 7600 CMU Square Column 2 43.77
TF-7 GW-GM 4800 7.63 7600 None Square Column 2 26.55
TF-8 GW-GM 4800 7.63 7600 None Square Column 2 -
TF-9 GW-GM 4800 15.25 3800 CMU Square Column 2 22.31
TF-10 GW-GM 4800 15.25 3800 None Square Column 2 10.32
TF-11 GW-GM 1400 3.82 4400 None Square Column 2 23.25
TF-12 GW-GM 1400 3.82 4400 CMU Square Column 2 29.04
TF-13 GW-GM 3600 11.25 3800 None Square Column 2 12.95
TF-14 GW-GM 3600 11.25 3800 CMU Square Column 2 23.57
Note: 1. H/B = GRS mini-pier height/width ratio

26
Figure 2-8 Validation Session (VS) test set up (Nicks et al., 2013)
Figures 2-9(a) shows the backfill and construction of TF-1. Figures 2-9(b)
through (d) are photographs of TF-1, -2, and -3, respectively, just before loading. Notice
that the loading system used for these tests are different than as described in Chapter 3 for
TF-6 through -14. For these tests, four Enerpac hydraulic jacks applied loads at the ends
of two steel beams which transferred the load to the concrete footing. Uneven loading to
the GRS inspired the transition to the new loading system employed in the remaining
tests. Note that TF-9 and -10 did not meet minimum GRS spacing requirements (≤ 12
inches).

27
(b)
(c) (d)
Figure 2-9 (a) Construction of TF-1 and (b) – (d) photographs test set up and loading
system of TF-1 through -3 (Nicks et al., 2013)
2.2.6 University of Massachusetts at Amherst Load Tests (Mitchell 2002)
Mitchell (2002) measured lateral pressures on the concrete masonry unit (CMU)
facing of four GRS mini-piers (Figure 2-9). The reinforcement (Amoco 2066 - wide
width tensile strength = 2100 lb/ft) spacings were 24 in, 16 in, 8 in and 32 in in piers 1, 2,

28
3 and 4, respectively. The facing consisted of 99-lb split face keystone retaining wall
blocks that were 18 in long, 5 in wide and 8 in deep with a flange protruding to the inside
of the piers. Corner blocks with slightly different weight and dimensions were used.
Known as trap rock gravel (32.1 % gravel, 56.5% sand and 11.5% fines, Cu = 40,
Cc = 3.2, Gs = 2.93, Standard Proctor d max = 144 pcf, wopt = 8.75%, Modified Proctor d
max = 150 pcf, wopt = 6.5%), the backfill had shear strength parameters of = 36˚ and c =
637 psf based on a failure relative displacement of 10% of the shear box length as
measured in a 12-inch x 12-inch direct shear box. The shear stress-displacement curves
appear to still be strain hardening at the interpreted failure relative displacement. Hence
these tests were not considered in this research.
(a)

29
(b)
Figure 2-9 GRS mini-pier (a) elevation (b) plan (after Mitchell, 2002)
Geokon vibrating wire pressure transducers were placed at 5 elevations (1 ft, 4.3 ft, 7 ft,
9.7 ft and 13 ft above base) along the GRS wall height. The measured lateral pressures
are shown in Figure 2-10. These pressure readings were zeroed at zero load and
represent only the increase in the lateral pressures during the load test. Mitchell (2002)
noted that with a decrease in reinforcement spacing, the lateral pressures increased and
became more equally distributed over the wall height.
The actual measured lateral pressures at zero load were provided in Appendix C
of Mitchell's (2002) report. Unfortunately, they are mostly negative with a few
exceptions. When and how the zero readings were obtained could not be discerned from
Mitchell's (2002) report.

30
Figure 2-10 Measured increase in lateral pressures on the facing of GRS mini-piers
during the load test (after Mitchell, 2002)

31

32
2.3 Influence of Spacing versus Strength of Reinforcement on Performance of GRS
Large-scale GRS load tests indicate that reinforcement spacing, Sv, has a greater
influence on the bearing capacity than the reinforcement ultimate tensile strength, Tf
(Adams et al., 2002; Elton and Patawaran, 2005; Adams et al., 2007; Pham, 2009; and
Nicks et al., 2013). Table 2-5 presents the ratio of measured ultimate bearing capacities
when the spacing is doubled versus when the reinforcement strength is doubled. From
this table, it can be seen that the increase in bearing capacity due to doubling the
reinforcement spacing is 2 to 67% higher than when doubling the reinforcement strength.
Table 2-5 Influence of spacing versus tensile strength on the bearing capacity of a footing
on a GRS
Test
No.
Tf
(lb/ft)
Sv
(in)
qult,emp
(ksf)
qult,emp, Sv/
qult,emp,2Sv
qult,emp,2Tf/
qult,emp,Tf
Percent
Difference
GSGC2 4800 7.63 70.96 1.90
67% GSGC4 4800 15.25 37.25 1.14
GSGC3 9600 15.25 42.57
Elton2 612 12 2.70 1.78
2% Elton1 612 6 4.81 1.75
Elton5 1272 6 8.40
TF-9 4800 15.25 22.31 1.96
13% TF-6 4800 7.63 43.76 1.73
TF-2 2400 7.63 25.26
2.4 Bearing Capacity of a Footing on a GRS Abutment Wall
Because GRS-IBS is load bearing, its capacity is an important design consideration.
Many large-scale load tests to determine the bearing capacity of GRS have been
performed (Adams, 1997; Adams et al., 2007; Elton and Patawaran, 2005; Mitchell,
2002; Pham, 2009).

33
Pham (2009) derived the bearing capacity of a footing on a GRS abutment wall
(qult) as follows:
𝑞ult = (𝜎h + 𝑊𝑇𝑓
𝑆𝑣) 𝐾𝑝 + 2𝑐√𝐾𝑝 (2-3)
where σh is the lateral stress, Tf and Sv are the reinforcement strength and spacing,
respectively, c is the soil cohesion, Kp is the Rankine passive earth pressure coefficient,
defined as
𝐾𝑝 =1+sin 𝜙
1−sin 𝜙 (2-4)
is the soil friction angle. W is a dimensionless factor that amplifies the contribution of
Sv to the GRS capacity, and was semi-empirically derived as
𝑊 = 0.7𝑆𝑣
6𝑑𝑚𝑎𝑥 (2-5)
where dmax is the maximum particle size of the GRS backfill. Note that the 0.7 factor was
theoretically derived using the concept of “average stresses” proposed by Ketchart and
Wu (2001) while the exponent was empirically derived. For details on this derivation,
refer to Pham (2009).
For a GRS wall with dry stacked modular block facing, σh = lateral stress exerted
by the facing on the GRS mass, defined by Pham (2009) as
𝜎ℎ = 𝛾𝑏𝑙𝐷 tan 𝛿 (2-6)
where γbl = bulk unit weight of facing block = weight of block/volume of block assuming
it is not hollow, D = depth of facing block perpendicular to the wall face and δ = friction
angle between geosynthetic reinforcement and the top and bottom surface of the facing
block.

34
Applicability of the Bearing Capacity Equation
Considering that most of the load tests in the database were performed on GRS
columns (mostly square with some circular in plan) while a bridge footing resting on an
abutment more resembles a plane strain (PS) condition, the relationship between the
column tests and that of a strip footing loading the top of a GRS wall is of interest.
Assume that the strength of a GRS column can be represented by the Mohr-Coulomb
equation as follows:
𝜏 = 𝑐𝐺𝑅𝑆 + 𝜎𝑡𝑎𝑛𝜙𝐺𝑅𝑆 (2-7)
where = shear strength, = applied normal stress, cGRS and GRS = cohesion and friction
angle of the GRS composite, respectively. In an unconfined compression load or
Performance Test (PT), where the facing has been removed, the ultimate capacity of the
GRS column (qult,PT) can be expressed as
𝑞𝑢𝑙𝑡,𝑃𝑇 = 2𝑐𝐺𝑅𝑆 (2-8)
For the PS condition, the bearing capacity of a footing supporting the bridge
superstructure can be estimated using Meyerhof’s (1957) solution for a rough strip
bearing on top of a slope
𝑞𝑢𝑙𝑡,𝑃𝑆 = 𝑐𝐺𝑅𝑆𝑁𝑐𝑞 + 0.5𝛾𝐺𝑅𝑆𝑏𝑁𝛾𝑞 (2-9)
where qult,PS = ultimate capacity of strip footing under PS conditions, GRS = unit weight
of the GRS backfill, b = footing width, and Ncq and Nq = Meyerhof’s (1957) bearing
capacity factors for a strip footing with a rough base. Nq approaches zero when the slope
angle is 90 for a GRS abutment wall; thus Equation (2-9) reduces to

35
𝑞𝑢𝑙𝑡,𝑃𝑆 = 𝑐𝐺𝑅𝑆𝑁𝑐𝑞 (2-10)
Dividing Equation (2-10) by (6), the ratio of the bearing capacity of a strip footing
on top of a GRS abutment to that of an unconfined GRS column can be estimated as
𝑞𝑢𝑙𝑡,𝑃𝑆
𝑞𝑢𝑙𝑡,𝑃𝑇=
𝑁𝑐𝑞
2 (2-11)
For a surface footing on top of a vertical GRS abutment, the value of Ncq varies
with the footing offset from the edge of the wall face, a, wall height, H, footing width, b,
and stability factor, 𝑁𝑠 =𝛾𝐺𝑅𝑆𝐻
𝑐𝐺𝑅𝑆, as shown in Figure 2-10.
Figure 2-10 Variation of Ncq/2 with footing geometry and the stability factor
cGRS can be obtained from laboratory or numerical experiments. For example, Pham
(2009) conducted a series of plane strain load tests on 6.36-ft-high GRS that can be used
to derive a cohesion value for the GRS. Two of the tests (GSGC2 and 5 in Table 2-3)
were identical in every respect (Tensile strength of reinforcement = 4800 lb/ft,
0
1
2
3
0 1 2 3 4 5
qu
lt,P
S/q
ult
,PT
a/H
Ns = 0
Ns = 2
Ns = 4
36
Reinforcement spacing = 7.625 in, Backfill c = 1562 psf and = 50º) except for the
confining stresses (0 in GSGC5 and 5 psi in GSGC2). The corresponding failure stresses
were 42.45 and 70.95 ksf for the 0 and 5 psi confining stresses, respectively. The
resulting shear strength parameters for the GRS are cGRS = 3343 psf and GRS = 72. The
corresponding stability factor H/c ≈ 0.29. Based on this stability factor, the ratio of
plane strain capacity for a typical GRS abutment with a typical set-back a = 7.63 in and H
varying from 10 ft to 33 ft (i.e. a/H = 0.02 to 0.07) to column (PT) capacity is close to
unity. Therefore, the column PT is fairly representative of an in-service PS condition for
well-graded gravels in this case.
2.5 GRS versus GSME
GRS differs from geosynthetic mechanically stabilized earth (GMSE) structures in
many ways particularly with respect to the maximum reinforcement spacing. The
reinforcement spacing in GRS is closer whereas the spacing in GMSE can be as large as
32 inches. GMSE is typically designed using the Simplified Method (SM), which was
developed from the Tieback Wedge Method (Bell et al., 1975). The SM applies to both
extensible and inextensible reinforcements. For the latter, the SM assumes a bi-linear
failure plane in accordance with the Coherent Gravity Method (Anderson et al., 2010)
while the linear Rankine active failure wedge is assumed for the former. Regardless of
reinforcement type, the SM models the GMSE reinforcements as tieback elements that
provide tensile resistance to the driving forces. Because the reinforcement layers in a
GRS are much closer, they increase the confinement, reduce lateral soil displacements
and limit soil dilation in addition to providing tensile resistance. Consequently, the

37
vertical and lateral displacements in a GRS are smaller, the bearing capacity of footings
on a GRS is larger and the lateral thrusts on facings in a GRS are smaller than in a GMSE
(Adams et al., 2011). These advantages offered by having closer-spaced reinforcements
are not accounted for in the SM. Instead, GRS is customarily designed using the
guidelines provided by Adams et al. (2011). One possible way of “harmonizing” the two
different design procedures is to analyze both GRS and GMSE as composite structures
whereby a composite strength of the reinforced soil is determined for use in the design
process.
Another use of composite strength in a GRS/GMSE wall is to determine the
relationship between the results of a columnar GRS/GMSE load test to those of the more
realistic plane strain condition (Nicks et al., 2013; Iwamoto et al., 2013) in the field as
discussed in Section 2.4.1. Full scale GRS load tests performed under plane strain
conditions (Bathurst and Benjamin, 1990; Pham, 2009; Wu et al., 2006) are more
expensive and more involved to set up and perform. As a result, many researchers have
resorted to testing a column of GRS instead (Adams, 1997; Adams et al., 2007; Adams et
al., 2002; Elton and Patawaran, 2005; Mitchell, 2002).
38
Performance Test Program
3.1 Test Configuration
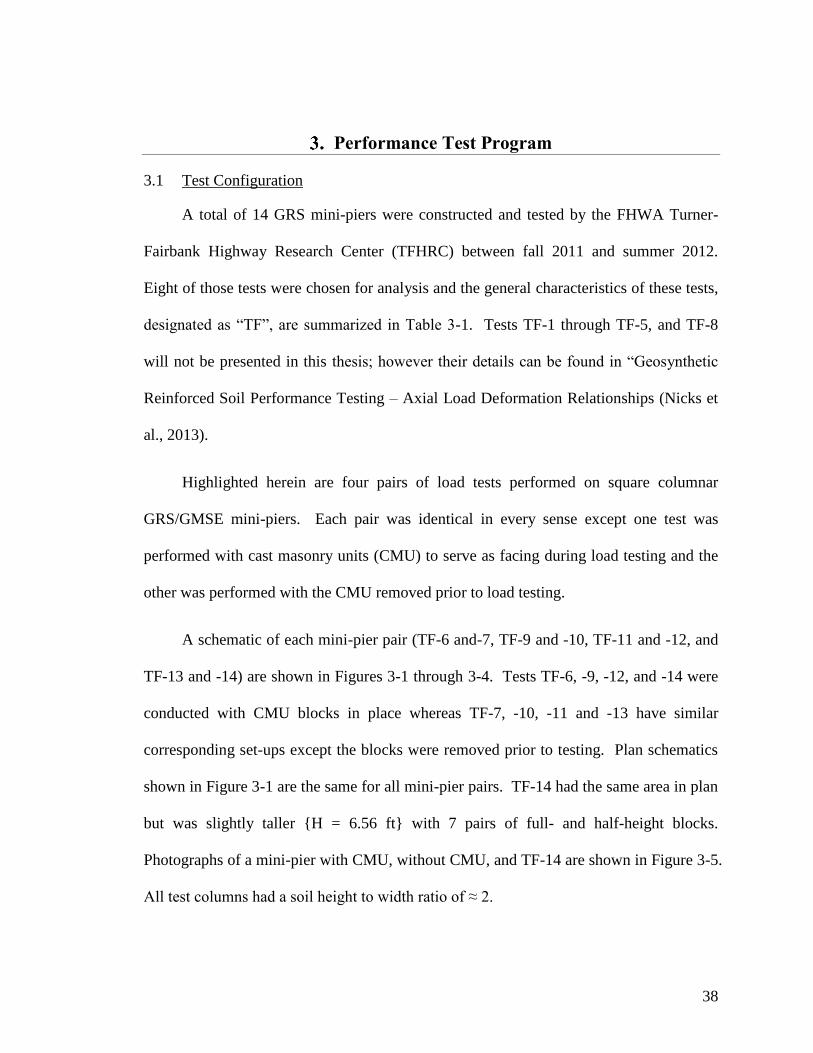
A total of 14 GRS mini-piers were constructed and tested by the FHWA Turner-
Fairbank Highway Research Center (TFHRC) between fall 2011 and summer 2012.
Eight of those tests were chosen for analysis and the general characteristics of these tests,
designated as “TF”, are summarized in Table 3-1. Tests TF-1 through TF-5, and TF-8
will not be presented in this thesis; however their details can be found in “Geosynthetic
Reinforced Soil Performance Testing – Axial Load Deformation Relationships (Nicks et
al., 2013).
Highlighted herein are four pairs of load tests performed on square columnar
GRS/GMSE mini-piers. Each pair was identical in every sense except one test was
performed with cast masonry units (CMU) to serve as facing during load testing and the
other was performed with the CMU removed prior to load testing.
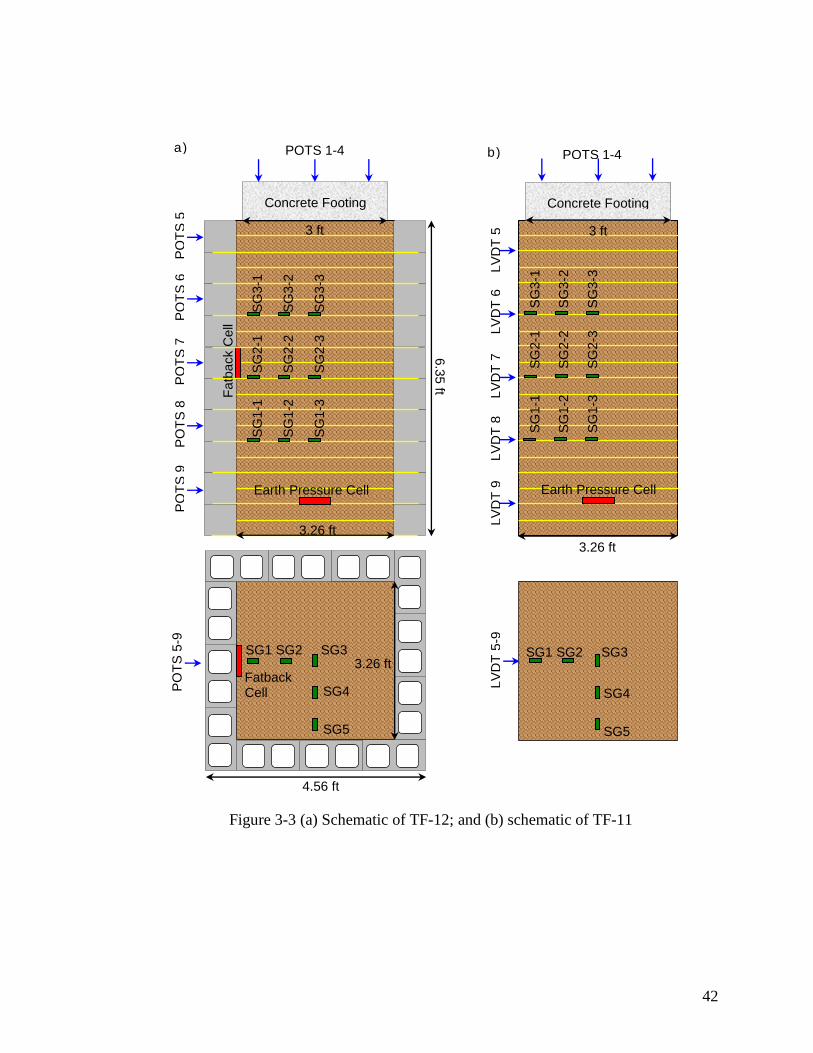
A schematic of each mini-pier pair (TF-6 and-7, TF-9 and -10, TF-11 and -12, and
TF-13 and -14) are shown in Figures 3-1 through 3-4. Tests TF-6, -9, -12, and -14 were
conducted with CMU blocks in place whereas TF-7, -10, -11 and -13 have similar
corresponding set-ups except the blocks were removed prior to testing. Plan schematics
shown in Figure 3-1 are the same for all mini-pier pairs. TF-14 had the same area in plan
but was slightly taller {H = 6.56 ft} with 7 pairs of full- and half-height blocks.
Photographs of a mini-pier with CMU, without CMU, and TF-14 are shown in Figure 3-5.
All test columns had a soil height to width ratio of ≈ 2.

39
Table 3-1 Mini-pier load tests conducted at TFHRC
Test Tf1
(lb/ft)
Sv2
(in)
Tf/Sv
(ksf)
Height of
Mini-Pier
(ft)
H/B Facing
Type
TF-6 4800 x 4800 7.63 7.55 6.35 1.95 CMU
TF-7 4800 x 4800 7.63 7.55 6.35 1.95 None
TF-9 4800 x 4800 15.3 3.78 6.35 1.95 CMU
TF-10 4800 x 4800 15.3 3.78 6.35 1.95 None
TF-11 1400 x 1400 3.81 4.41 6.35 1.95 None
TF-12 1400 x 1400 3.81 4.41 6.35 1.95 CMU
TF-13 3600 x 3600 11.3 3.84 6.56 2.02 None
TF-14 3600 x 3600 11.3 3.84 6.56 2.02 CMU
Notes: Tf = wide width tensile strength (all geotextiles have identical wide
width tensile strengths in the machine and cross machine directions)
Sv = reinforcement spacing

40
Figure 3-1 (a) Plan and profile schematic of TF-6; and (b) plan and profile schematic of
TF-7
a) b) POTS 1-4
Concrete Footing
Earth Pressure Cell
3 ft
4.56 ft
3.26 ft
Fatb
ack C
ell
Fatback Cell
6.3
5 ft
PO
TS
5
PO
TS
6
PO
TS
7
PO
TS
8
PO
TS
9
PO
TS
5-9
Concrete Footing
3 ft
3.26 ft
POTS 1-4
LV
DT
5
LV
DT
6
LV
DT
7
LV
DT
8
LV
DT
9
Earth Pressure Cell LV
DT
5-9
SG
1-1
S
G2-1
S
G3
-1
SG
1-2
S
G2-2
S
G3
-2
SG
1-3
S
G2
-3
S
G3
-3
3.26 ft
SG
1-1
S
G2
-1
S
G3
-1
SG
1-2
S
G2-2
S
G3-2
SG
1-3
S
G2
-3
S
G3
-3
SG1 SG2 SG3
SG4
SG5
SG1 SG2 SG3
SG4
SG5

41
Figure 3-2 (a) Schematic of TF-9; and (b) schematic of TF-10
a) b) POTS 1-4
Concrete Footing
Earth Pressure Cell
3 ft
6.3
5 ft
PO
TS
5
PO
TS
6
PO
TS
7
PO
TS
8
PO
TS
9
Concrete Footing
3 ft
3.26 ft
POTS 1-4
LVDT 5
LVDT 6
LVDT 7
LVDT 8
LVDT 9 Earth Pressure Cell
3.26 ft
Fatback Cell
42
Figure 3-3 (a) Schematic of TF-12; and (b) schematic of TF-11
a) b) POTS 1-4
Concrete Footing
Earth Pressure Cell
3 ft
4.56 ft
3.26 ft
Fatb
ack C
ell
Fatback Cell
6.3
5 ft
PO
TS
5
PO
TS
6
PO
TS
7
PO
TS
8
PO
TS
9
PO
TS
5-9
Concrete Footing
3 ft
3.26 ft
POTS 1-4
LV
DT
5
LV
DT
6
LV
DT
7
LV
DT
8
LV
DT
9
Earth Pressure Cell LV
DT
5-9
SG
1-1
S
G2-1
S
G3
-1
SG
1-2
S
G2-2
S
G3
-2
SG
1-3
S
G2
-3
S
G3
-3
3.26 ft
SG
1-1
S
G2
-1
S
G3-1
SG
1-2
S
G2-2
S
G3-2
SG
1-3
S
G2
-3
S
G3
-3
SG1 SG2 SG3
SG4
SG5
SG1 SG2 SG3
SG4
SG5

43
Figure 3-4 (a) Schematic of TF-14; and (b) schematic of TF-13
Figure 3-5 (a) Photograph of mini-pier test with CMU; (b) photograph of mini-pier test
without CMU; (c) photograph of TF-14
6.5
6 ft
a) POTS 1-4
Concrete Footing
3 ft
b) POTS 1-4
Concrete Footing
Fatback Cell
Earth Pressure Cell
3.26 ft
PO
TS
5
PO
TS
6
PO
TS
7
PO
TS
8
PO
TS
9
LV
DT
5
LV
DT
6
LV
DT
7
LV
DT
8
LV
DT
9
3.26 ft
Earth Pressure Cell
a) b) c)
44
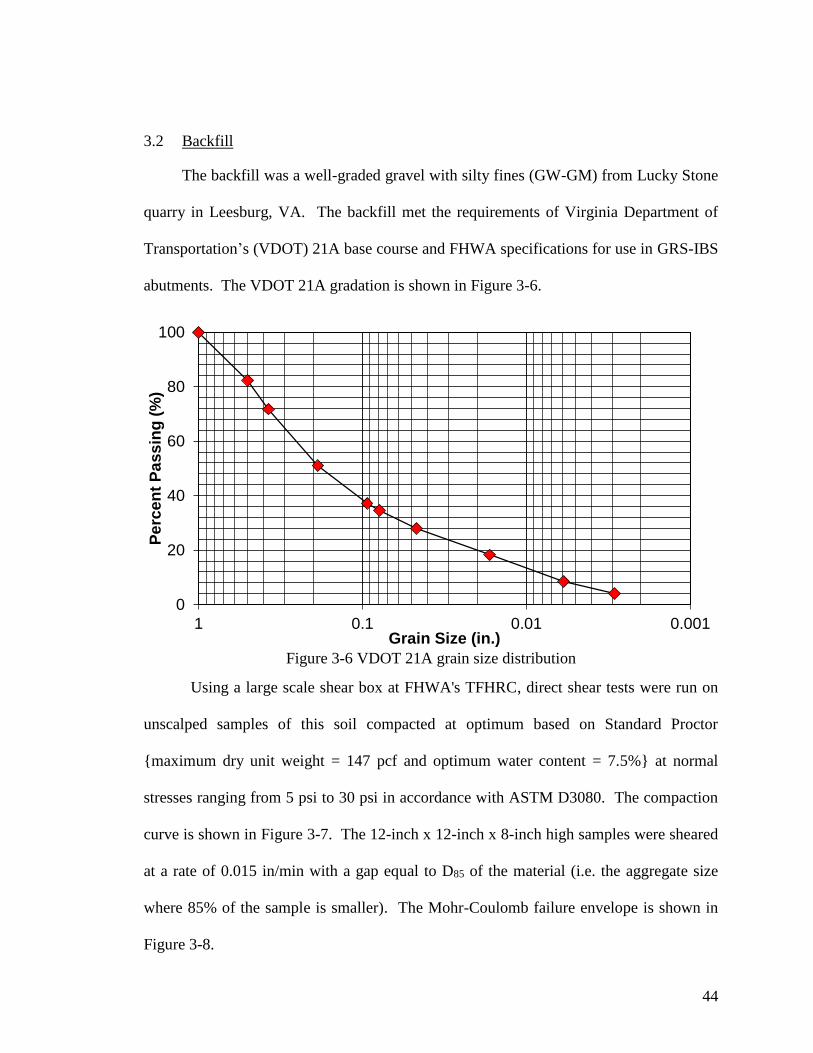
3.2 Backfill
The backfill was a well-graded gravel with silty fines (GW-GM) from Lucky Stone
quarry in Leesburg, VA. The backfill met the requirements of Virginia Department of
Transportation’s (VDOT) 21A base course and FHWA specifications for use in GRS-IBS
abutments. The VDOT 21A gradation is shown in Figure 3-6.
Figure 3-6 VDOT 21A grain size distribution
Using a large scale shear box at FHWA's TFHRC, direct shear tests were run on
unscalped samples of this soil compacted at optimum based on Standard Proctor
{maximum dry unit weight = 147 pcf and optimum water content = 7.5%} at normal
stresses ranging from 5 psi to 30 psi in accordance with ASTM D3080. The compaction
curve is shown in Figure 3-7. The 12-inch x 12-inch x 8-inch high samples were sheared
at a rate of 0.015 in/min with a gap equal to D85 of the material (i.e. the aggregate size
where 85% of the sample is smaller). The Mohr-Coulomb failure envelope is shown in
Figure 3-8.
0
20
40
60
80
100
0.0010.010.11
Pe
rce
nt
Pa
ss
ing
(%
)
Grain Size (in.)

45
Figure 3-7 Compaction curve of VDOT 21A
Figure 3-8 Mohr-Coulomb failure envelope of GRS backfill based on large scale direct
shear tests
Assuming a linear Mohr-Coulomb (MC) envelope for the range of normal stresses
utilized, a friction angle and cohesion based on the measured peak strength during testing
were ≈ 54 and c ≈ 1560 psf, respectively for the partially saturated sample. When the
134
136
138
140
142
144
146
148
5% 6% 7% 8% 9% 10%
Dry
Un
it W
eig
ht
(pc
f)
Moisture Content (%)
Peak: = tan53° + 1563 psfR² = 0.9877
Fully Softened: = tan54°
R² = 0.9956
0
1000
2000
3000
4000
5000
6000
7000
8000
0 1000 2000 3000 4000 5000
Sh
ea
r S
tre
ss
(p
sf)
Normal Stress (psf)
Unsaturated - Peak MC EnvelopeSaturated - Peak MC EnvelopeUnsaturated - Fully Softened MC Envelope

46
samples were saturated prior to shear, the cohesion reduced to 125 psf. The MC
envelope is actually curved. A linear envelope was drawn to provide average shear
strength parameters of the backfill over the range of normal stresses utilized. Iwamoto et
al. (2013) showed that fully softened strengths of the backfill yielded capacities that
agreed better with measured GRS/GMSE capacities. A rationale for this is that the strong
reinforcement strengthens the soil considerably causing the GRS/GMSE to experience
large strains (> 10%) prior to failure whereas the peak strengths of the soils utilized in
these load tests were mobilized at relatively small shear strains (≈ 2-5%) in large scale
direct shear or triaxial tests. The fully softened was similar but c ≈ 0. This will be
discussed in more detail in the chapter entitled “Use of fully softened versus peak
strengths to predict the bearing capacity of a footing on GRS”.
Compaction was performed on each 3.8-inch-thick lift of the mini-pier using a
Vibco Patchman PM1012 plate compactor. The top two rows of blocks were ratchet
strapped together as compaction proceeded. Short pieces of 2 x 4 lumber were used to
increase contact between the straps and the blocks. Figure 3-9 shows the compaction of
the GRS mini-pier using this method. A nuclear gauge was employed to verify that the
relative compaction for each lift was close to 100% based on standard Proctor and that
the water content was within ±2% of optimum.

47
Figure 3-9 Ratchet straps and lumber used during compaction of GRS mini-pier
3.3 Geosynthetic Reinforcement
All geotextiles utilized were biaxial, woven polypropylene. However, they differed
in strength, stiffness and spacing as detailed in Table 3-2. The geotextiles were selected
with the aim of having a wide range of tensile strength to spacing ratio.
While the geotextiles used in each test were biaxial, the stiffnesses in the cross-
machine and machine directions of the reinforcement were different. For this reason, the
reinforcement was placed in an alternating pattern with each subsequent layer to prevent
preferential failure of the performance test in the weaker reinforcement direction.

48
Table 3-2 Properties of geotextiles used in the mini-pier load or performance tests
conducted at TFHRC.
Test Geotextile
Manufacturer
Wide Width
Tensile
Strength
(lb/ft)
Wide width
tensile strength
at 5% strain
(lb/ft)
Tensile
Strength
(Grab)
(lb)
Wide
Width
Elongation
(%)
TF-6, -7,
TF-9, -10 Propex 4800 x 4800 660 x 1500 600 x 500 (10 x 8%)
TF-11, -12 Industrial
Fabrics 1400 x 1400 Not specified 200 x 200 (9 x 7%)
TF-13, -14 US Fabrics 3600 x 3600 1392 x 1740 450 x 350 (15 x 10%)
3.4 Facing Elements
Each dry-cast and split-faced CMU block was 7.625 inches high x 15.625 inches
long x 7.625 inches wide (Figure 3-9 ) and weighed about 42 lbs on average. They were
frictionally connected to the geotextile reinforcement, with a coverage ratio of at least 85
percent as specified by Adams et al. (2011a). For mini-piers with CMU removed prior to
loading, the geotextiles were trimmed to be flush with the backfill. TF-13 and -14 used
alternating full- and half-height blocks to achieve a spacing of 11.3 inches. The top view
of the half block is identical. Its height is 3.8 inches.
Figure 3-9 Schematic of CMU block
3.5 Loading System
Load was applied by means of two 12-inch-stroke Enerpac jacks in series {giving a
total stroke of 24 inches} mounted on a two-post reaction frame that was bolted into a
7.63 in
15.63 in
Top view Side view

49
strong floor (Figure 3-10). A spherical bearing was placed on the footing centroid to
maintain a normal load on the concrete footing. Each load increment was manually
applied with the aid of a solenoid valve hydraulic pump. Load was maintained with a
strain indicator box calibrated to a load cell placed within the reaction assembly.
Hydraulic jack pressure was also checked at each load increment to ensure reliable
operation of the system throughout the course of a load test. At each increment, the load
was increased only when there was no significant change {< 0.003 inches} in settlement
between any two recording times as stated below; however, the load increment was held
for a minimum of 5 minutes and a maximum of 30 minutes. The data acquisition system
was programmed to record settlements at 1, 3, 5, 7, 15, 20, 25, and 30 minute intervals
from the start of each load increment. Typically, each test took about 6 hours to complete.
Figure 3-10 Loading system
Enerpac Jacks
Reaction frame
Data Acquisition
System

50
3.6 Instrumentation
The following is a list of instruments utilized during the load tests along with their
purposes.
Table 3-3 Instruments utilized in TF tests.
Instrument Purpose
Potentiometers and LVDT To measure lateral deflection of the GRS/GMSE
column along its height on one face
Potentiometers To measure vertical deflection of the footing at the top
of the GRS/GMSE column
Fatback Cell To measure lateral earth pressure at the CMU face near
the GRS/GMSE column mid-height
Earth Pressure Cell To measure vertical earth pressure near the bottom of
the GRS/GMSE column
Strain Gages To measure strains in two orthogonal directions in
three geotextile layers
3.6.1 Lateral and Vertical Deflection
Four string potentiometers (POTs), mounted on two reference beams, were
utilized to measure vertical settlement of the footing during load testing (Figure 3-11).
String potentiometers, mounted on a reference column, were utilized to measure lateral
displacements in the tests with CMUs. The potentiometers were replaced by linear
variable differential transducers (LVDTs) in the tests without CMUs (Figure 3-12). The
settlement of the footing and lateral displacement of one face of the mini-pier were
recorded every minute within each load increment. Movements were recorded during the
load test but not during construction of the test columns.

51
(a) (b)
Figure 3-11 Schematics of deflection instrumentation for mini-piers (a) with CMU and
(b) without CMU
3.6.2 Lateral and Vertical Earth Pressure
6-inch-diameter lateral earth pressure cells (Geokon Model 4810), also known as
Fatback cells, were located on the sixth block from the floor in tests TF-6, -9 and -12.
Figure 3-12 shows the installation of the Fatback cell onto the CMU block. In Test TF-
14, the Fatback cell was located on the fifth full block from the floor. Specifically
designed to measure soil pressures against a structural face, the Fatback cells have a thick
plate that stiffens the back of the cell so that its stiffness is more compatible with that of
the structure that it is mounted to. The performance tests were carried out to failure and
POTS 5
POTS 6
POTS 7
POTS 8
POTS 9
POTS 1-4
REFERENCE BEAMS
POTS 1-4
REFERENCE BEAMS
REFERENCE COLUMN

52
consequently, the Fatback cells were deemed not re-useable after each test. Due to
economic reasons, only one Fatback cell was used per test with facing.
Figure 3-12 Fatback cell mounted onto the CMU block.
Single-use 9-inch-diameter earth pressure cells (Geokon Model 4815) were also
placed horizontally at the centroid of the load test column in plan and at a fill height of
7.625 inches from the bottom to measure the vertical pressure in the soil at that elevation.
Vertical and lateral earth pressure measurements were collected at the end of each lift
during construction and at the end of each load increment.
3.6.3 Strain Gauges
Strain gauges were utilized to measure the strains in the geotextile during loading.
Five strain gauges were mounted on three of the geotextile layers in each mini-pier. The
strain gauges (type EP-08-250BG-120) were manufactured by Vishay Measurements
Group, Inc. and glued to a 1 inch x 3 inch rectangular piece of geotextile at two ends to
avoid stiffening of the geotextile if glued along its entire length. The rectangular patch

53
was then attached to the geotextile following the strain gauge attachment. This technique
was developed by the University of Colorado at Denver (Figure 3-13). The plan and
profile view of the strain gauge configuration is shown in the mini-pier schematics
(figures 3-1 through 3-4). The strain gauges were set up such that the strains in both
directions of the geotextile were measured.
Figure 3-13 Attachment of strain gauge on geotextile using the University of Colorado at
Denver attachment technique

54
Performance Test Results
Presented in this chapter are the results from four pairs of instrumented GRS/GMSE
mini-pier load tests with and without CMU blocks, designated as “TF”.
4.1 Ultimate Bearing Capacity
The ultimate bearing capacity, qult,emp, and the strain at failure, f are summarized in
Table 4-1. Figure 4-1 presents the load-settlement curves of the GRS mini-pier load tests.
In three pairs of tests, Tf/Sv = 4.095 0.315 ksf while the fourth pair had a Tf/Sv ratio =
7.55 ksf where Tf = reinforcing tensile strength and Sv = reinforcing spacing. The
following observations are offered:
Comparing the load tests with and without facing, the tests with CMU have higher
capacities due to the confinement provided by the CMU to the GRS.
The ultimate capacity increased significantly as the ratio Tf/Sv increased from 4.095
to 7.55 ksf (Figure 4-1). However, for a given value of Tf/Sv = 4.095 0.315 ksf, the
ultimate capacity varied amongst the three pairs of tests suggesting that the contribution
of the reinforcing tensile strength does not have the same weight as that of the fabric
spacing. In fact, it has been shown by Adams (1997), Adams et al (2007), Elton and
Patawaran (2004), Ziegler et al (2008) and Pham (2009) that spacing has a greater
influence on GRS capacity than tensile strength.
The ratio of the ultimate capacities with and without CMUs increased with
increasing reinforcement spacing and reinforcement tensile strength as shown in figures
4-2 and 4-3. This means that the CMU contribution to capacity increases with increasing

55
reinforcing spacing and reinforcing strength; i.e.; the smaller the reinforcing spacing and
the weaker the reinforcing, the smaller will be the effect of the CMU blocks on the
capacity.
TF-6 and -7 had a Tf and Sv similar to those used in the design of GRS-IBS bridge
abutments in the United States (Adams et al, 2011). TF-6 had the greatest ultimate
capacity, which was 11 times greater than the allowable bearing pressure of 4 ksf (Elias
and Christopher, 1997), and 65% greater than the corresponding unconfined test, TF-7.
TF-10 had the lowest ultimate capacity; however, it was still higher than the
allowable bearing pressure by a factor of 2.58. Note that the reinforcement spacing in
TF-9 and -10 is greater than the prescribed GRS maximum of12 in (Adams et al, 2011).
Table 4-1 Ultimate bearing capacity and strain at failure of mini-pier load tests
Test
Tf1
(lb/ft)
Sv2
(in)
Tf/Sv
(ksf)
Height
(ft)
Facing
Type
qult,emp3
(ksf)
qult,CMU4/
qult,No CMU5
f6
%
TF-6 4800 7.63 7.55 6.35 CMU 43.8 1.65
15.7
TF-7 4800 7.63 7.55 6.35 None 26.5 12.5
TF-9 4800 15.3 3.78 6.35 CMU 22.3 2.17
15.6
TF-10 4800 15.3 3.78 6.35 None 10.3 14.3
TF-11 1400 3.81 4.41 6.35 None 23.2 1.25
12.8
TF-12 1400 3.81 4.41 6.35 CMU 29.0 13.4
TF-13 3600 11.3 3.84 6.56 None 13.0 1.82
12.3
TF-14 3600 11.3 3.84 6.56 CMU 23.6 12.7
Notes:
1. Tf = wide width tensile strength (all geotextiles have identical wide width tensile
strengths in the machine and cross machine directions)
2. Sv = reinforcement spacing
3. qult,emp = ultimate bearing capacity of mini-pier
4. qult, CMU = ultimate bearing capacity of mini-pier with CMU
5. qult, No CMU = ultimate bearing capacity of mini-pier without CMU
6. εf = strain of load test at failure

56
Figure 4-1 Ultimate capacity versus Tf/Sv
Figure 4-2 Ratio of ultimate capacities with and without CMUs versus reinforcement
spacing
43.8
22.3
29.0
23.6 26.6
10.3
23.3
12.9
10
15
20
25
30
35
40
45
0 1000 2000 3000 4000 5000 6000 7000 8000
Ult
ima
te C
ap
ac
ity (
ks
f)
Tf/Sv (psf)
CMU
No CMU
2.17
1.24
1.82
1.65
y = 0.6302ln(x) + 0.3813R² = 0.972
0.0
0.5
1.0
1.5
2.0
2.5
0 5 10 15 20
Ult
ima
te C
ap
ac
ity W
ith
C
MU
/Ult
ima
te C
ap
ac
ity W
ith
ou
t C
MU
Reinforcement Spacing, Sv (inches)
Tf/Sv = 4095psf

57
Figure 4-3 Ratio of ultimate capacities with and without CMUs versus reinforcement
strength
The load-settlement curves for these tests are plotted in Figure 4-4. When the
applied vertical pressure is normalized by qult,emp and the settlement is normalized by the
settlement when q = qult,emp, the data plot within a fairly narrow range as shown in Figure
4-5.
2.17
1.24
1.82
1.65
y = 0.714ln(x) - 3.9476R² = 0.9767
0.0
0.5
1.0
1.5
2.0
2.5
0 1000 2000 3000 4000 5000 6000
Ult
ima
te C
ap
ac
ity W
ith
CM
U/U
ltim
ate
C
ap
ac
ity W
ith
ou
t C
MU
Reinforcement Strength, Tf (lb/ft)
Tf/Sv = 4095 psf
Tf/Sv = 7550 psf
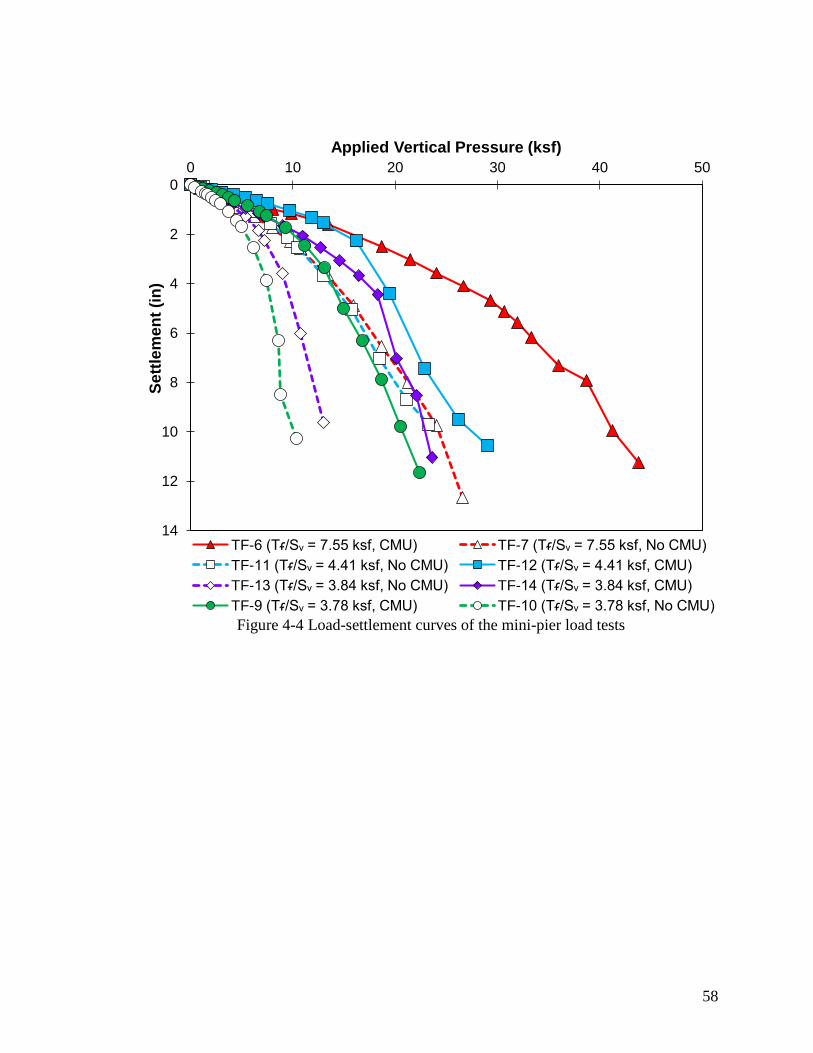
58
Figure 4-4 Load-settlement curves of the mini-pier load tests
0
2
4
6
8
10
12
14
0 10 20 30 40 50S
ett
lem
en
t (i
n)
Applied Vertical Pressure (ksf)
TF-6 (Tᵳ/Sᵥ = 7.55 ksf, CMU) TF-7 (Tᵳ/Sᵥ = 7.55 ksf, No CMU)
TF-11 (Tᵳ/Sᵥ = 4.41 ksf, No CMU) TF-12 (Tᵳ/Sᵥ = 4.41 ksf, CMU)
TF-13 (Tᵳ/Sᵥ = 3.84 ksf, No CMU) TF-14 (Tᵳ/Sᵥ = 3.84 ksf, CMU)
TF-9 (Tᵳ/Sᵥ = 3.78 ksf, CMU) TF-10 (Tᵳ/Sᵥ = 3.78 ksf, No CMU)

59
Figure 4-5 Dimensionless form of the load-settlement curves of the mini-pier load tests
4.2 Failure Plane
In the tests without CMUs, distinct failure planes with ruptures in the geotextile
were observed when the reinforcement spacing was less than 12 inches (e.g.; figures 4-6
and 4-7).
0.0
0.1
0.2
0.3
0.4
0.5
0.6
0.7
0.8
0.9
1.0
0.0 0.2 0.4 0.6 0.8 1.0S
ett
lem
en
t/S
ett
lem
en
t a
t q
ult
,em
p
q/qult,emp
TF-6 (Tᵳ/Sᵥ = 7.55 ksf, CMU)
TF-7 (Tᵳ/Sᵥ = 7.55 ksf, No CMU)
TF-11 (Tᵳ/Sᵥ = 4.41 ksf, No CMU)
TF-12 (Tᵳ/Sᵥ = 4.41 ksf, CMU)
TF-13 (Tᵳ/Sᵥ = 3.84 ksf, No CMU)
TF-14 (Tᵳ/Sᵥ = 3.84 ksf, CMU)
TF-9 (Tᵳ/Sᵥ = 3.78 ksf, CMU)
TF-10 (Tᵳ/Sᵥ = 3.78 ksf, No CMU)

60
Figure 4-6 TF-11 at failure (qult,emp = 23.2 ksf) with Sv = 3-13/16 in and Tf = 1400 lb/ft
(Nicks et al, 2013)
Figure 4-7 TF-13 at failure (qult,emp = 13.0 ksf) with Sv = 11-1/4 in and Tf = 3600 lb/ft
(Nicks et al, 2013)

61
When the spacing exceeded 12 inches, no shear failure surface was evident in TF-
10 (Figure 4-8). According to Nicks et al (2013), failure of the soil between the
reinforcement occurred but the reinforcement themselves did not shear.
Figure 4-8 TF-10 at Failure (qult,emp = 10.33 ksf) with Sv = 15-1/4 in and Tf = 4800 lb/ft
(Nicks et al, 2013)
In the tests with CMU, shear failure development was not visible during the test.
However, upon removal of the CMU blocks at the end of the test, tear trends in the
geotextile provided some clues on the shear failure development. Pictures of individual
reinforcement layers are shown in Figure 4-9(a) through (i) for TF-6. Tears along all four
CMU edges occurred in the reinforcement layers from 2 to 6 CMU courses below the
footing. The reinforcement in the 7th CMU course below the footing had a tear along one
CMU edge while the reinforcements below that have no tears along the CMU. Also,

62
there were tears in the middle of the reinforcement layers from 1 to 7 CMU courses
below the footing. These middle tears progressively translate from one face of the test
column diagonally down towards the opposite face (Figure 4-9j). This is akin to the
classical shear surface observed in triaxial specimens. Tear trends in the other tests with
CMU closely resemble this pattern.

63
Figure 4-9 (a) – (i) Rupture pattern for geotextiles in TF-6; (j) Schematic of tears in
geotextiles in TF-6
a) Geotextile 1 c) Geotextile 3
d) Geotextile 4 e) Geotextile 5 f) Geotextile 6
g) Geotextile 7 h) Geotextile 8 i) Geotextile 9
b) Geotextile 2
Geotextile 9
Geotextile 8
Geotextile 5
Geotextile 6
Geotextile 7
Geotextile 4
Geotextile 3
Geotextile 1
Geotextile 2
j)

64
4.3 Lateral Pressures
4.3.1 During Mini-Pier Construction
Figure 4-10 presents measured lateral pressures as the fill height above the Fatback
cell increased during construction of mini-piers TF-6, -9, -12 and -14. In most tests, it
was observed that the lateral pressures during construction were small or negligible (< 0.2
ksf) and mostly less than the at-rest values for the unreinforced soil with ϕ = 54°. The
following observations are offered:
1. Compaction-induced stresses at the facing exceeded the soil at-rest values in TF-9
and TF-14 at shallow depths. However, as the depth increased, they dip below at-
rest values possibly due to (a) lateral displacement of the CMU blocks during
construction and/or (b) the geotextile restricts lateral movement of the soil, hence the
low lateral pressures on the CMU blocks. This implies that the reinforcement must
increase the soil’s apparent cohesion.
2. The fact that the lateral pressures are very small is consistent with the suggestions
of Wu (2001) and Soong and Koerner (1997) that the lateral stress on the facing of a
GRS/GMSE is proportional to the reinforcement spacing rather than a function of
the wall height and that for a constant reinforcement spacing, the lateral pressure
distribution is nearly uniform.
The highest lateral pressures were observed in TF-14, which had the second largest
spacing. However, TF-14 was also constructed during the warmest time of the year. It is
known that the 6-inch-diameter Fatback cells have a relatively high surface area to
volume ratio and thus may be temperature sensitive. The dates of construction of the

65
mini-pier and the temperatures recorded in the Fatback cells are summarized in Table 4-2.
The Fatback cell temperatures were more variable during construction of the mini-pier
than during load testing. Some lateral pressures were even negative which implies they
are essentially zero due to thermal effects. Since the temperatures remained fairly
constant during load testing and since the temperature-induced pressures are small
relative to the load-test-induced values by 1 to 2 orders of magnitude, temperature is thus
not expected to be a significant influencing factor in the lateral pressure trends during
testing as discussed below.
Table 4-2 Performance tests dates and Fatback cell temperatures
Test Date
Fatback Cell
Temperature
During Mini-Pier
Construction
(˚C)
Fatback Cell
Temperature
During Load
Testing
(˚C)
TF-6 December 2011 9.8-13.5 14.9-19.5
TF-9 February 2012 11.9-18.5 18.5-18.8
TF-12 April 2012 17.7-21.1 20.9-21.1
TF-14 June 2012 24.3-26.7 23.6-24.2

66
Figure 4-10 Measured lateral pressures at Fatback cell during construction of Mini-Piers.
4.3.2 During Load Testing
Measured lateral pressures on the CMU facing during load testing are presented in
Figure 4-11. As an example in TF-14, the measured horizontal stress increased with
increasing vertical load to about 1.63 ksf followed by a decrease. It is postulated that the
mechanism for the development of this confining stress is that as the footing is jacked,
the soil settles causing the geotextile to turn downward. This downturn of the fabric
exerts an axial load on the CMU blocks, which restrains the blocks from lateral
movement. Consequently, there is a build-up in lateral pressure giving rise to an
immensely strong and robust structure. Finally, as the load in the geotextile approaches
its tensile strength, the geotextile ruptures along the perimeter of the CMU blocks (Figure
0
5
10
15
20
25
30
35
40
-0.3 -0.2 -0.1 0.0 0.1 0.2 0.3 0.4 0.5F
ill H
eig
ht
Ab
ove
Fa
tba
ck
Ce
ll (
in)
Measured Lateral Pressure (ksf)
TF-6 (Tᵳ/Sᵥ = 7550 psf)
TF-12 (Tᵳ/Sᵥ = 4410 psf)
TF-14 (Tᵳ/Sᵥ = 3840 psf)
TF-9 (Tᵳ/Sᵥ = 3780 psf)
At-rest pressures with φ = 54˚

67
4-9). Its load is then shed to other reinforcement layers. A series of tears and load
spreads eventually causes the CMUs to lurch forward and the lateral pressure to reduce
abruptly. When the blocks are no longer part of the soil/geotextile/CMU composite, the
behavior tends towards a test without CMUs and the soil/fabric composite eventually
shears.
Figure 4-11 Measured lateral pressures at Fatback cell location during load testing of TF-
6, -9, -12, and -14
From Figure 4-11, the lateral stress is largest when Tf/Sv is highest. For a Tf/Sv =
7.55 ksf in TF- 6, up to 6.32 ksf of lateral stress was recorded before the Fatback cell
failed. In the other 3 tests where Tf/Sv ≈ one half that for TF-6, the lateral stresses never
-2
0
2
4
6
8
10
12
14
0 10 20 30 40 50
Me
as
ure
d L
ate
ral E
art
h P
res
su
re (
ks
f)
Applied Vertical Pressure (ksf)
TF-6 (Tᵳ/Sᵥ = 7550 psf)
TF-6 Extrapolated
TF-6 Kₐ
TF-12 (Tᵳ/Sᵥ = 4410 psf)
TF-12 Extrapolated
TF-12 Kₐ
TF-14 (Tᵳ/Sᵥ = 3840 psf)
TF-14 Kₐ
TF-9 (Tᵳ/Sᵥ = 3780 psf)
TF-9 Kₐ

68
exceeded 2.09 ksf. However, at approximately the same Tf/Sv = 4.095 0.315 ksf (tests
TF-9, -12 and -14), the larger the spacing, the larger the lateral stress against the face.
Also shown in Figure 4-11 are lines representing active pressures for the
GRS/GMSE composites. The lateral pressures during load testing at or near failure are
consistent with the Rankine active lateral earth pressure coefficients, Ka, the derivation of
which is discussed in the section on Lateral Earth Pressure Coefficients below. Also in
Figure 4-11, the lateral pressures for TF-6 and TF-12 near failure had to be extrapolated
because the Fatback Cells stopped working prematurely. The methodology for the
extrapolation is discussed in Section 4.6.
4.3.3 Lateral Earth Pressure Coefficients
Lateral earth pressure coefficients are plotted versus lateral movement in Figure
4-12. Assuming that the cohesion, c, (tabulated in Table 4-3 and derived in Section 4.6)
for the geo-composite is fully mobilized, the lateral earth pressure coefficient can be
calculated by solving for K in the following expression:
h = Kav – 2cKa½ (4-1)
where h = measured horizontal stress in the fatback cell and v = applied vertical stress
at the top. Some cohesion, whether it is due to soil suction, geosynthetic-induced-lateral-
soil restraint or a combination of both, has to be mobilized from the onset because the
GRS/GMSE can stand vertically and sustain load after the CMUs are removed (tests TF-
7, -10, -11 and -13). From Figure 4-12, it is observed that the lateral earth pressure
coefficients at failure are simply the Rankine active values based on the composite
friction angles in Table 4-3 (presented in Section 4.6.2). . This consistency justifies the

69
values of friction angles of the GRS composite derived in Section 4.6.2. Therefore, as
the friction angle increases, Ka [= tan2(45˚ - /2)] decreases.
Figure 4-12 Lateral earth pressure coefficients versus dimensionless lateral movement
4.4 Lateral Deformation
Lateral deformations along the face of GRS columns were instrumented using
POTS and LVDTs in tests with and without facing, respectively. LVDTs were removed
before failure of TF-10 and -13 due to raveling of the soil around the LVDT reaction
plates. Reliable readings for these two tests were available only up to 83% of the
ultimate load. For consistency, lateral deformation readings for all tests are presented at
0.2
0.3
0.4
0.5
0.6
0.7
0.8
0.9
1.0
0.00 0.01 0.02 0.03 0.04
La
tera
l E
art
h P
res
su
re C
oe
ffic
ien
t
Lateral Deformation/Height (in/in)
Rankine Kₐ for TF-6Rankine Kₐ for TF-12Rankine Kₐ for TF-14Rankine Kₐ for TF-9TF-6 (Tᵳ/Sᵥ = 7550 psf)TF-12 (Tᵳ/Sᵥ = 4410 psf)TF-14 (Tᵳ/Sᵥ = 3840 psf)TF-9 (Tᵳ/Sᵥ = 3780 psf)TF-6 ExtrapolatedTF-12 Extrapolated
TF-12 Ka = tan2(45° - 30°/2) = 0.33
TF-6 Ka = tan2(45° - 11°/2) = 0.67
TF-9 Ka = tan2(45° - 32°/2) = 0.305
TF-14 Ka = tan2(45° - 33°/2) = 0.29

70
an applied load level of q approximately equal to 83% of the ultimate load, qult,emp in
Figure 4-13. Actual q/qult,emp values are labeled in Figure 4-13.
It can be observed that:
1. The maximum lateral deformation increased with decreasing spacing.
2. The maximum lateral deformation tends to occur in the middle of the pier
(sometimes a little higher) when the spacing were less than 12 inches. At a
reinforcement spacing of 15.3 inches, the maximum lateral deformation occurred
at or near the top. Directly below the footing where the load is highest, the soil-
reinforcement interface friction restrains lateral deformation of the soil. It also
results in higher locked-in lateral stresses in the GRS (not to be confused with
lateral stress on the CMU) after compaction. This explains why the deformation
is higher when there is less reinforcement at the top. There is an upward shift in
the location of maximum lateral deformation from tests without CMU to those
with CMU.

71
Figure 4-13 Lateral deformation profiles of GRS at loads ≈ 83% of ultimate load
Figures 4-14 and 4-15 show the lateral displacement along the height of the GRS
column at several loads throughout testing of TF-6 and -7. It is evident that:
1. Larger lateral strains are attained in the test with CMU.
2. The lateral movement is generally largest at mid-height; i.e.; the GRS face bellies
out. Initially, the entire deflected profile translates horizontally. After the
deflections at the top reach a maximum, they then reduce towards the end of the
test, and the deflected profile at larger loads cross over those at lower loads near
the top. This trend is true in both tests regardless of whether there is a facing or
not.
0
10
20
30
40
50
60
70
0 1 2 3 4D
ep
th b
elo
w t
op
of
wa
ll (
in)
Horizontal Displacment (in)
TF-6 (q/qᵤ = 0.82, Tᵳ/Sᵥ = 7.55 ksf, CMU)
TF-7 (q/qᵤ = 0.80, Tᵳ/Sᵥ = 7.55 ksf, No CMU)
TF-11 (q/qᵤ = 0.79, Tᵳ/Sᵥ = 4.41 ksf, No CMU)
TF-12 (q/qᵤ = 0.79, Tᵳ/Sᵥ = 4.41 ksf, CMU)
TF-13 (q/qᵤ = 0.83, Tᵳ/Sᵥ = 3.84 ksf, No CMU)
TF-14 (q/qᵤ = 0.85, Tᵳ/Sᵥ = 3.84 ksf, CMU)
TF-9 (q/qᵤ = 0.84, Tᵳ/Sᵥ = 3.78 ksf, CMU)
TF-10 (q/qᵤ = 0.83, Tᵳ/Sᵥ = 3.78 ksf, No CMU)

72
Figure 4-14 Lateral displacement of TF-6 with increasing applied load (with CMU) Tf/Sv
= 7.55 ksf
Figure 4-15 Lateral deformation of TF-7 with increasing applied load (without CMU)
Tf/Sv = 7.55 ksf
0
10
20
30
40
50
60
70
-0.5 0.0 0.5 1.0 1.5 2.0 2.5 3.0D
ista
nc
e f
rom
to
p o
f w
all
(in
)Horizontal Displacment (in) .9 ksf
1.8 ksf2.5 ksf3.7 ksf4.5 ksf5.4 ksf6.3 ksf9.9 ksf13.4 ksf18.7 ksf21.4 ksf24.0 ksf26.7 ksf29.3 ksf30.6 ksf31.9 ksf33.3 ksf35.8 ksf38.7 ksf41.3 ksf43.8 ksf
0
10
20
30
40
50
60
70
-0.5 0.0 0.5 1.0 1.5 2.0 2.5 3.0
Dep
th b
elo
w t
op
of
wa
ll (
in)
Horizontal Displacement (in)
.9 ksf
1.8 ksf
2.7 ksf
3.6 ksf
4.4 ksf
5.4 ksf
6.2 ksf
8.0 ksf
9.8 ksf
10.7 ksf
13.4 ksf
16.0 ksf
18.7 ksf
21.3 ksf
24.1 ksf
26.6 ksf

73
4.4.1 Postulate of Zero Volume Change
Adams, et al. (2002) performed load tests on large scale GRS mini-piers (3.67ft x
3.67ft x 8ft high; Tf = 2400 lb/ft; Sv = 6 inches with 3 inch spacing in the top 4 layers;
segmental retaining wall block facing). Results from vertical and lateral deformation
data suggested a zero net volume change during vertical loading. Based on this and other
available tests from the literature, Adams et al (2002) postulated the theory of zero
volume change (ZVC). They suggested that this postulate can be used to predict the
maximum lateral deflection of a GRS structure. The validity of the postulate of zero
volume change is investigated in this section.
Adams, et al. (2002), calculated lateral expansion using Vlateral = 4 x Vface = 4 x
(Ho x W x DL/2), where Vface is the lateral expansion of the instrumented face of the mini
pier, Ho is the original height, W is the width, and DL is the maximum measured lateral
deformation. The lateral expansion along all faces of the mini-pier was assumed to be
equal. The vertical compression was calculated as Vtop = As x S, where As was the plan
area of the GRS and S was the average settlement of the GRS.
The lateral expansion of the TF tests was calculated differently. First, the height
of the GRS used to calculate the lateral expansion at each load increment was a function
of the measured vertical settlement. As an example, in Figure 4-16a, the lateral
deformation measured by LVDT-5 was not included in the calculation of the lateral
expansion because the GRS mass settled past the LVDT location at this load. Second,
the lateral deformation along the face of the GRS was integrated over the GRS height
which allowed for a more accurate representation of the lateral deformation of the GRS

74
with load increase. Finally, it was assumed that the corners of the GRS did not move or
expand with vertical compression, Figure 4-16b. Although expansion of the corners was
observed in photographic evidence of the tests, the movements were slight and not large
enough to discredit this assumption. All four faces of the GRS were assumed to deform
equally. Figures 4-16a and b show the difference in the assumed shape of the deformed
GRS mass (e.g. TF-11 at q = 23 ksf) between Adams, et al. (2002) and the TF tests.
Figure 4-16 Schematic of assumed deformed mass for TF-11 at applied load = 23 ksf
(drawn to scale) as assumed by Adams, et al. (2002) and TF tests in (a) profile view and
(b) plan view
q = 23 ksf
Original dimensions Ho = 76.25 in. W = 39.06 in.
Settlement ρ = 9.72 in
Adams, et al. (2002) Deformed GRS mass
(blue)
TF
Deformed GRS mass
(red)
DLmax
DLmax
1.98 in
LVDT-6 DL = 1.98 in
LVDT-7 DL = 1.88 in
LVDT-8 DL = 1.37 in
LVDT-9 DL = 0.52 in
DL
a) profile b) plan

75
Volumetric strain, εv, defined as volume change/ original volume, is plotted versus
vertical applied load in Figure 4-17. In this figure, it can be seen that:
1. The theory of zero volume change is true at service loads (less than 4 ksf) where
there is less than 0.7% change in volume in all tests (Figure 4-18). At applied
stresses larger than 4 ksf, the volume change does not exceed 5%.
2. The smaller the spacing (TF-11 and -12 have the smallest while TF-9 and -10
have the largest), the closer the behavior tends towards zero volume change.
3. All tests except TF-6 dilated with initial increase in vertical load. TF-14 dilated
the most (εv = 4.3%). TF-6 first compressed until about 10 ksf, then “dilated”
until about 36 ksf and then compressed again until failure.
4. Among the tests with CMU, the maximum dilation occurred at the maximum
measured lateral stress in TF-9. The GRS then experienced vertical compression
with additional increase in load, ultimately approaching zero volume change (v =
0). Among the tests with CMU, the maximum measured lateral stress occurred
just past the peak dilation in TF-14. Therefore, the peak dilation and the peak
lateral stress roughly coincided in these two tests. In TF-14, the fabric that
ruptured first probably did not coincide elevation-wise with the POT that recorded
the largest lateral deflection.
5. Among the tests with CMU, the Fatbacks failed prematurely in TF-6 and -12.
6. TF-9 and -14, and TF10 and -13 have similar deformation shapes with load
increase. These are the piers with the largest spacing with Sv = 11.3 and 15.3
inches in TF-13 and -14, and TF-9 and 10, respectively.

76
7. In the tests without CMU (TF-7, -10, -11, and -13), the GRS dilated and never
compressed when the spacing are large. However as the spacing decreased, (TF-7
and -11), the GRS deforms closer to the ZVC line.
Figure 4-17 Volumetric strain versus vertical applied load
Figure 4-18 presents the volumetric strain varying with applied load up to a
typical service load of 4 ksf. As indicated previously, |εv| < 0.7%. In this plot,
volumetric strains are smallest in tests without CMU. Also among these tests without
CMU, volumetric strain decreased with increasing Tf/Sv ratio. TF-6 only compressed and
-0.05
-0.04
-0.03
-0.02
-0.01
0
0.01
0.02
0.03
0.04
0.05
0 5 10 15 20 25 30 35 40 45
v
Vertical Applied Load (ksf)
TF-6 (Tᵳ/Sᵥ = 7.55 ksf, CMU)
TF-7 (Tᵳ/Sᵥ = 7.55 ksf, No CMU)
TF-12 (Tᵳ/Sᵥ = 4.41 ksf, CMU)
TF-11 (Tᵳ/Sᵥ = 4.41 ksf, No CMU)
TF-14 (Tᵳ/Sᵥ = 3.84 ksf, CMU)
TF-13 (Tᵳ/Sᵥ = 3.84 ksf, No CMU)
TF-9 (Tᵳ/Sᵥ = 3.78 ksf, CMU)
TF-10 (Tᵳ/Sᵥ = 3.78 ksf, No CMU)
Late
ral E
xp
an
sio
n
Ve
rtica
l Co
mp
ressio
n
Maximum
measured h

77
never expanded in this range of stress. The remaining tests all dilated in this range of
stress.
Figure 4-18 Volumetric strain up to the service load limit (4 ksf)
Figure 4-19 presents the volume gained (lateral strain) versus volume lost
(vertical strain) as a percent of the initial volume (lateral expansion versus vertical
compression). From this plot, it can be observed that without CMU, the “strain-paths”
“concaved” away from the ZVC line whereas the “strain-paths” of the tests with CMU
“convexed” toward the ZVC line. In other words, the CMU “contained” the GRS when
the GRS was subjected to large vertical loads.
-0.01
-0.005
0
0.005
0.01
0 1 2 3 4
v
Vertical Applied Load (ksf)
TF-6 (Tᵳ/Sᵥ = 7.55 ksf, CMU)
TF-7 (Tᵳ/Sᵥ = 7.55 ksf, No CMU)
TF-12 (Tᵳ/Sᵥ = 4.41 ksf, CMU)
TF-11 (Tᵳ/Sᵥ = 4.41 ksf, No CMU)
TF-14 (Tᵳ/Sᵥ = 3.84 ksf, CMU)
TF-13 (Tᵳ/Sᵥ = 3.84 ksf, No CMU)
TF-9 (Tᵳ/Sᵥ = 3.78 ksf, CMU)
TF-10 (Tᵳ/Sᵥ = 3.78 ksf, No CMU)
Late
ral E
xpansio
n
Ve
rtica
l Co
mp
ressio
n
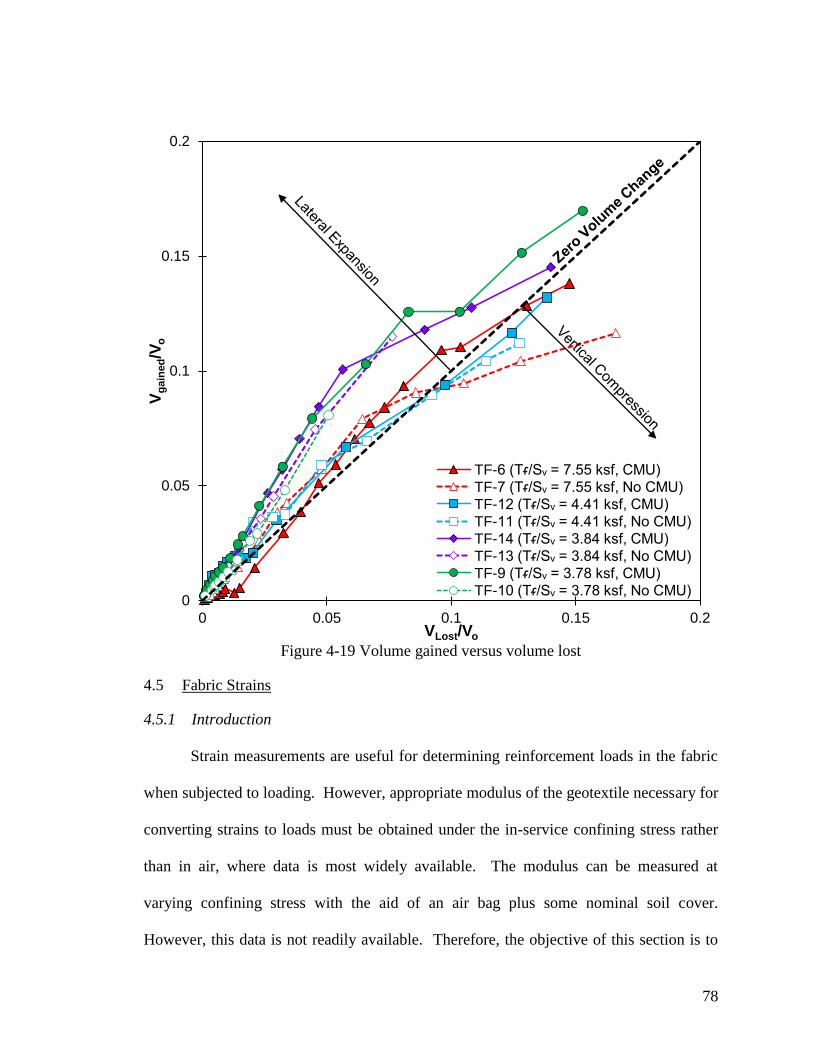
78
Figure 4-19 Volume gained versus volume lost
4.5 Fabric Strains
4.5.1 Introduction
Strain measurements are useful for determining reinforcement loads in the fabric
when subjected to loading. However, appropriate modulus of the geotextile necessary for
converting strains to loads must be obtained under the in-service confining stress rather
than in air, where data is most widely available. The modulus can be measured at
varying confining stress with the aid of an air bag plus some nominal soil cover.
However, this data is not readily available. Therefore, the objective of this section is to
0
0.05
0.1
0.15
0.2
0 0.05 0.1 0.15 0.2
Vg
ain
ed/V
o
VLost/Vo
TF-6 (Tᵳ/Sᵥ = 7.55 ksf, CMU)
TF-7 (Tᵳ/Sᵥ = 7.55 ksf, No CMU)
TF-12 (Tᵳ/Sᵥ = 4.41 ksf, CMU)
TF-11 (Tᵳ/Sᵥ = 4.41 ksf, No CMU)
TF-14 (Tᵳ/Sᵥ = 3.84 ksf, CMU)
TF-13 (Tᵳ/Sᵥ = 3.84 ksf, No CMU)
TF-9 (Tᵳ/Sᵥ = 3.78 ksf, CMU)
TF-10 (Tᵳ/Sᵥ = 3.78 ksf, No CMU)

79
observe trends in the measured fabric strains in the TF tests, and to comment on some of
the results.
4.5.2 Strain Gauge Layout
Strains in three levels of geotextile reinforcing in both the machine and cross-
machine directions were measured in the performance tests. Table 4-3 summarizes the
strain gage locations. Schematics of the instrumented geotextiles in the GRS piers are
shown in figures 3-1 through 3-4.
Table 4-3 Summary of strain gages in performance tests
Test Sv
(in)
Instrumented
Geotextile1
Instrumented Geotextile
Between CMU Blocks2
TF-6 and -7 7.6
3
5
7
3 and 4
5 and 6
7 and 8
TF-9 and -10 15.3
2
3
4
4 and 5
6 and 7
8 and 9
TF-11 and 12 3.8
6
10
14
3 and 4
5 and 6
7 and 8
TF-13 and -14 11.3
2
3
5
2nd ½ block and 3rd full block
3rd ½ block and 4th full block
5th ½ block and 6th full block Notes: 1. Geotextile numbering counted from bottom up. This numbering
system is used in this section.
2. CMU block numbering counted from bottom up.
As an example, the numbering of the strain gages is as follows in TF-6 and -7.
The third strain gauge of an instrumented geotextile sheet, say geotextile layer L, or SGL-
3 was located at the centroid of the square geotextile; SGL-4 and -5 extended 7.5 and 15
inches, respectively out towards the face in the cross-machine direction. SGL-2 and -1
extended 7.5 and 15 inches, respectively, out toward the face in the machine direction.

80
The machine direction of the geotextile also coincides with the direction of lateral
deformation measurements.
4.5.3 Results
Strain measurements were available during the early stages of loading with most
gauges failing once the applied pressure exceeded ~ 4 ksf. These strains are plotted
against lateral distance from the center of the GRS (or SGL-3) in Figures 4-20(a) – (c)
through 4-22(a) – (c) for TF-6, -11 and -12, respectively. Results for tests TF-7, -9, -10, -
13 and -14 were sparser and have been omitted. Also plotted on the far left are the lateral
strains estimated using lateral deformations at the facing measured using POTs (tests with
CMU) or LVDT (tests without CMU). These lateral strains at the facing can be
compared to strains from the strain gages. The lateral strain at the facing can be
calculated as the ratio of the lateral deformation to half the width of the GRS.
The following observations are offered:
TF-6 (test with the largest Tf/Sv ratio and with CMU):
Fabric strains increased with increasing applied stress in all tests. Fabric strains
were larger in the machine direction than the cross-machine direction suggesting
that there was eccentricity in the loading.
Strains calculated from the POTs were less than the fabric strains indicating that
some of the geotextile strain energy is used to overcome friction between the
fabric and the CMU and between the fabric and the soil.

81
Geotextile strains are largest in the middle of the test column than at the top. This
is also true in tests TF-9 and -11 but not -12.
TF-11 (test with the smallest reinforcement spacing and without CMU):
Fabric strains are symmetric in the machine and cross-machine directions when
the applied stresses reached 4.37 ksf or 19% of the failure capacity (23.2 ksf).
This suggests that this column is very uniformly loaded up to this point.
The calculated strains from the LVDTs are lower than the fabric strains,
suggesting that a large portion of the strain energy goes into overcoming friction
between the soil and fabric only, since this test was conducted without CMU.
TF-12 (test with the smallest reinforcement spacing and with CMU):
Fabric strain distribution is also fairly symmetric in the machine and cross-
machine directions, as observed in TF-11.
Strains were highest at the center of the GRS for top and middle geotextile layers.
It could be inferred that no shear plane has developed yet at this stage of the test.
The strain magnitude in this test is lower than in all the other tests. Due to the
small reinforcement spacing, not much load has transferred down to the geotextile
at an applied pressure of 3.08 ksf.
From the observations discussed above, it can be deduced that:
1. The type of strain gages used does not last very long into the load test. They
generally fail at an applied pressure of approximately 4 ksf. The longer they last,
the more useful they can be for indicating the direction of the failure plane.

82
2. The strain gages provide a good indication of the concentricity of the applied load
and may be useful for real-time load adjustments.
3. In many of the tests, the largest strains occur close to the test column mid-height.
This agrees with the fact that the GRS column tends to deflect or barrel most at
mid-height.
4. For very closely spaced reinforcement (~4 inches), the strain distribution between
the machine and cross-machine directions are fairly uniform at small load levels.
A uniform strain distribution in a geotextile is an indication that development of a
shear plane has not begun.

83
Figure 4-20 Strain measured using strain gauges and POTs versus distance from the
center of the GRS mass for (a) Geotextile 7 (b) Geotextile 5 and (c) Geotextile 3 for TF-6
POT6
SG3-1SG3-2
SG3-3SG3-4
SG3-5
-0.2
0.0
0.2
0.4
0.6
0.8
1.0
1.2
-15-7.507.51522.530
Str
ain
(%
)
Distance from center (in)
0.89 ksf
1.76 ksf
2.52 ksf
3.72 ksf
POT7
SG2-1SG2-2
SG2-3
SG2-4
SG2-5
-0.2
0.0
0.2
0.4
0.6
0.8
1.0
1.2
-15-7.507.51522.530
Str
ain
(%
)
Distance from Center (in)
0.89 ksf1.76 ksf2.52 ksf3.72 ksf
POT8 SG1-1SG1-2
SG1-3SG1-4
SG1-5
-0.2
0.0
0.2
0.4
0.6
0.8
1.0
1.2
-15-7.507.51522.530
Str
ain
(%
)
Distance from Center (in)
0.89 ksf1.76 ksf2.52 ksf3.72 ksf

84
Figure 4-21 Strain measured using strain gauges and POTs versus distance from the
center of the GRS mass for (a) Geotextile 14 (b) Geotextile 10 and (c) Geotextile 6 for
TF-11
LVDT6
SG3-1SG3-2
SG3-3
SG3-4
SG3-5
0.0
1.0
2.0
3.0
4.0
5.0
-15-7.507.51522.530
Str
ain
(%
)
Distance from Center (in)
1.32 ksf1.71 ksf2.68 ksf3.51 ksf4.37 ksf
a)
LVDT7
SG2-1SG2-2
SG2-3
SG2-4 SG2-5
0.0
1.0
2.0
3.0
4.0
5.0
-15-7.507.51522.530
Str
ain
(%
)
Distance from Center (in)
1.32 ksf
1.71 ksf
2.68 ksf
3.51 ksf
4.37 ksf
b)
LVDT8
SG1-1SG1-2
SG1-3SG1-4
0.0
1.0
2.0
3.0
4.0
5.0
-15-7.507.51522.530
Str
ain
(%
)
Distance from Center (in)
1.32 ksf
1.71 ksf
2.68 ksf
3.51 ksf
4.37 ksf
c)

85
Figure 4-22 Strain measured using strain gauges and POTs versus distance from the
center of the GRS mass for (a) Geotextile 16 (b) Geotextile 12 and (c) Geotextile 8 for
TF-12
POT6SG3-1
SG3-2
SG3-3
SG3-4SG3-5
0.0
0.2
0.4
0.6
0.8
1.0
1.2
-15-7.507.51522.530
Str
ain
(%
)
Distance from Center (in)
0.99 ksf
2.02 ksf
3.08 ksf
a)
POT7
SG2-1SG2-2
SG2-3
SG2-4SG2-5
0.0
0.2
0.4
0.6
0.8
1.0
1.2
-15-7.507.51522.530
Str
ain
(%
)
Distance from Center (in)
0.99 ksf
2.02 ksf
3.08 ksf
b)
POT8
SG1-3 SG1-4SG1-5
0.0
0.2
0.4
0.6
0.8
1.0
1.2
-15-7.507.51522.530
Str
ain
(%
)
Distance from Center (in)
0.99 ksf
2.02 ksf
3.08 ksf
c)

86
4.6 Shear Strength Parameters of a GRS/GMSE
For a given backfill, it can be shown that the shear strength parameters of a
GRS/GMSE composite compacted to the same physical state varies with Tf and Sv. The
load test results can be used to discern shear strength parameters of pairs of
corresponding load tests with and without CMUs by constructing their stress paths.
Stress path of the MIT (Lambe and Whitman, 1969) variety {p = ½(1 + 3) and q =
½(1 - 3)} is used herein but there is no reason why other types cannot be utilized. The
MIT stress path represents the top of the Mohr circle during the progression of a load test.
Without CMU, there is no applied lateral pressure or confining stress and the stress path
rises from the origin along a 45˚ line to the right till failure as shown in Figure 4-23 for
TF-13. Also shown in Figure 4-23 is the stress path for TF-14 which is identical in all
respects to TF-13 except that CMUs provide confinement. The stress paths for the other
three pairs of tests with and without CMUs are shown in figures 4-24 (TF-9 and -10), 4-
25 (TF-11 and -12) and 4-26 (TF-6 and -7). The procedure for plotting the stress path for
all tests with CMUs is described below.

87
Figure 4-23 Stress paths during load testing of TF-13 (without CMU) and TF-14 (with
CMU) with Tf/Sv = 3.84 ksf
Figure 4-24 Stress paths during load testing of TF-9 (with CMU) and TF-10 (without
CMU) with Tf/Sv = 3.78 ksf
Maximum σh
measured in Fatback Cell
Kf Lineq = tan31°p' + 3 ksf
0
2
4
6
8
10
12
14
16
18
0 5 10 15 20 25 30
, q
(k
sf)
σ, p' (ksf)
TF-14TF-14 Post-failureTF-13
TF-13 and 14 Kᵳ-LineTF-13 and 14 MC Envelope21A Peak MC Envelope21A Fully Softened MC Envelope
Maximum σh
measured in Fatback Cell
Kf Lineq = tan31°p' + 2.5 ksf
0
2
4
6
8
10
12
14
16
18
0 5 10 15 20 25 30
, q
(ks
f)
σ, p' (ksf)
TF-9TF-9 Post-failureTF-10TF-9 and 10 Kᵳ-LineTF-9 and 10 MC Envelope21A Peak MC Envelope21A Fully Softened MC Envelope

88
Figure 4-25 Stress paths during load testing of TF-11 (without CMU) and TF-12 (with
CMU) with Tf/Sv = 4.41 ksf
Figure 4-26 Stress paths during load testing of TF-6 (with CMU) and TF-7 (without
CMU) with Tf/Sv = 7.55 ksf
Best-fit curveR² = 0.999
Kf Lineq = tan29°p' + 6 ksf
0
2
4
6
8
10
12
14
16
18
0 5 10 15 20 25 30
, q
(k
sf)
σ, p' (ksf)
TF-12
TF-12 Extrapolated
TF-11
TF-11 and 12 Kᵳ-LineTF-11 and 12 MC Envelope
21A Peak MC Envelope
21A Fully Softened MC Envelope
Best-fit CurveR² = 0.999
Kf Lineq = tan11.5°p' + 10.7 ksf
0
2
4
6
8
10
12
14
16
18
0 5 10 15 20 25 30
, q
(k
sf)
σ, p' (ksf)
TF-6TF-6 ExtrapolatedTF-7TF-6 and 7 Kᵳ-LineTF-6 and -7 MC Envelope21A Fully Softened MC Envelope21A Peak MC Envelope

89
4.6.1 Construction of Stress Paths
One necessary assumption needed to plot the stress paths for tests with CMU is
that the lateral stress in the Fatback cell is representative of the confining stress along the
entire height of the GRS/GMSE. This assumption is made in light of the following (a)
Figure 4-10 shows that the lateral pressures are relatively small even when the height of
backfill increases; (b) Wu (2001) and Soong and Koerner (1997) suggest that for a
constant reinforcement spacing, the lateral pressure distribution is approximately constant
with depth; and (c) Mitchell (2002) showed that the lateral pressures measured in
performance tests were fairly equally distributed over the wall height for geotextile
spacings of 16 inches or less. Upon making this assumption, the entire GRS/GMSE
column can be idealized as a single element as in the case of a triaxial soil sample with
constant horizontal and vertical stresses, except that the vertical and horizontal stresses
are not principal stresses because vertical shear stresses act along the CMU and
complementary horizontal shear stresses act below the footing. The shear stresses can be
estimated as follows:
Like conventional retaining walls, "shear stresses" do develop along the soil-wall
interface of the mini-piers with CMUs. This shear force, T, embodies both the upward
wall friction between the soil and the facing and the upward tensile force in the geotextile,
the mechanism for which has been explained in Section 4.3.2. It can be estimated by
vertical force equilibrium (Figure 4-27) and by using the measured vertical stress from
the earth pressure cell near the bottom as follows:

90
T = Qapp + Wf + Ws - VEP
(4-2)
where Qapp = applied jacking load from the load cell, Wf = weight of footing, Ws =
weight of soil above the bottom earth pressure cell and VEP = upward vertical reaction
force = vertical stress measured by the bottom earth pressure cell x area of soil in the
GRS/GMSE. In a separate free body diagram (Figure 4-27), it can be shown that the
vertical downward components of wall friction and of load in the geotextile, plus the
weight of the CMU blocks are resisted by the upward reaction of the CMUs with the
strong floor. Hence, they do not factor into Equation 3. The shear stress, , can then be
calculated as:
= T/ACMU
(4-3)
where ACMU = vertical area of the CMU wall above the earth pressure cell. It is also
assumed that is representative of the shear stress at the wall mid-height.
At each load test increment, the Mohr circle passes through (h, ) and (v, )
where h = measured horizontal stress in the Fatback cell, v = applied vertical stress at
the top and = shear stress at the Fatback cell elevation calculated using Equation 4-3. In
all cases, it was found that was quite small; i.e.; v and h ≈ major and minor principal
stresses, respectively.

91
Figure 4-27 Free-body diagram of vertically loaded GRS
The lateral pressures in the Fatback reach a peak and then decrease when the
geotextiles rupture along the facing periphery as seen in Figure 4-11 for TF-9 and -14.
At this juncture, the CMU blocks lurch forward and offer little confinement to the geo-
composite. The behavior then tends towards a test without CMU as there is then a shift
in direction of the stress path towards the 45˚ line as seen in figures 4-23 and 4-24. If
failure is defined as the point when the horizontal stress is a maximum, the Kf-line which
Geotextile 9
Geotextile 8
Geotextile 5
Geotextile 6
Geotextile 7
Geotextile 4
Geotextile 3
Geotextile 1
Geotextile 2
T
Qapp
Wf
Ws
VEP
Rfloor
Wblock
Rfloor
Wblock
T
T = Qapp + Wf + Ws − VEP
T = Rfloor − Wblock

92
is the equivalent of the Mohr-Coulomb envelope in p-q space, can be drawn by joining
this point to the last point of the corresponding test without CMU; i.e.; it is assumed that
the failure envelope is linear and the shear strength parameters for the geo-composite is
the same for the load tests with and without CMUs. Essentially, the CMUs merely serve
as a means to apply a variable confining stress to the GRS/GMSE.
Using the slope (tan ) and intercept (m) of the Kf-line, the corresponding shear
strength parameters for the GRS/GMSE can be computed as follows (Lambe and
Whitman, 1969):
= sin-1(tan ) (4-4)
c = m/cos 4-5)
4.6.2 Strength Parameters
The composite shear strength parameters are summarized in Table 4-3. It should
be noted that the Fatback cells in tests TF-6 and -12 stopped working prior to failure and
extrapolation of the stress path using a second order polynomial was necessary to discern
the shear strength parameters for these tests. However, the extrapolated results should
not be too erroneous based on the fact that: (1) the vertical stress is known throughout the
test and it constrains the values of p and q; and (2) photographic evidence of when the
CMU blocks lurch forward is available to “identify” the failure load step, examples of
which are shown in figures 4-28 (a) and (b) for TF-6 and (c) and (d) for TF-12.

93
Table 4-4 Shear strength parameters of GRS
Test Tf
(lb/ft)
Sv
(in)
Tf/Sv
(ksf)
Facing
Type
Composite Shear
Strength Parameters
c
(ksf)
ϕ
(°)
TF-6 4800 7.63 7.55 CMU 10.9 11
TF-7 4800 7.63 7.55 None
TF-9 4800 15.3 3.78 CMU 2.9 32
TF-10 4800 15.3 3.78 None
TF-11 1400 3.81 4.41 None 6.7 30
TF-12 1400 3.81 4.41 CMU
TF-13 3600 11.3 3.84 None 3.6 33
TF-14 3600 11.3 3.84 CMU
Figure 4-28 (a) and (b) Photographic evidence of when CMU blocks lurched forward at
failure of TF-6; (c) and (d) Photographic evidence of when CMU blocks lurched forward
at failure of TF-12
c) 26.2 ksf
a) 41.25 ksf b) 43.8 ksf – Failure Load
d) 29.1 ksf – Failure Load

94
4.6.3 Discussion on the Shear Strength Parameters
Dimensionless forms of cohesion and friction angle are plotted versus a
dimensionless form of the Tf/Sv ratio, Tf/(Svpa) where pa = atmospheric pressure in Figure
4-29. From Figures 4-23 through 4-26, Figure 4-29, and Table 4-3, the following
observations can be made:
The Mohr-Coulomb envelopes for the GRS/GMSE are not parallel to those for the
unreinforced soil, nor are they parallel to each other (unless they have similar Tf/Sv
ratios) despite having similar soil unit weights and water contents. This is contradictory
to Yang’s (1972) and Schlosser and Long’s (1974) assertion that the friction angles of the
unreinforced and reinforced soil are identical.
The friction angle of the GRS/GMSE composite is less than that of the
unreinforced soil. In general, the composite friction angle increases with decreasing Tf/Sv
(decreasing Tf and increasing Sv).
The cohesion of the GRS/GMSE is considerably higher than that of the
unreinforced soil. It increases with decreasing spacing and increasing geotextile strength.
The benefits of reinforcing a soil become significant if Sv is small since the smaller the Sv,
the further the failure envelope extends above that for the unreinforced soil (Figure 4-23
through 4-26).

95
Figure 4-29 Dimensionless forms of cohesion and friction angle versus dimensionless for
of Tf/Sv ratio
0.1
0.2
0.3
0.4
0.5
0.6
0.7
2
4
6
8
10
12
14
1.5 2.0 2.5 3.0 3.5 4.0
tan
G
RSc
GR
S/
H
Tf/SvPa

96
Use of Fully Softened Versus Peak Strengths to Predict the Ultimate
Bearing Capacity of Footings on GRS
5.1 Peak versus Fully Softened Strengths
A database of 28 GRS load tests were collected from the literature and from this
study to investigate whether the fully softened or the peak shear strength is more
appropriate for use in predicting the ultimate carrying capacity of footings on GRS. The
work in this chapter has been published by Iwamoto et al (2013 and 2014). Table 5-1
summarizes details of these tests, most of which were discussed in sections 2.1, 3 and 4.
Zornberg (2002) proposed that peak strengths of the backfill be used to design GRS
slopes based on centrifuge model testing. Christopher et al. (1990) proposed that peak
strengths of the backfill be used to predict the bearing capacity of footings on
mechanically stabilized earth (MSE) type bridge abutments reinforced using extensible
elements. For the soils used to construct the GRS in this database, it was observed that
the peak strength from large scale direct shear (LSDS) tests (Figure 5-1a) on granular
soils was mobilized at about 0.51 to 0.63 inch lateral displacements, which correspond to
about 4.5 to 5.4% shear strain for a 12 in x 12 in x 8 in high direct shear sample.
Additionally, the peak strengths from large scale (6 inch diameter x 12 inch high) triaxial
tests on granular soils (Figure 5-1b) was mobilized at about 2.3 to 5.0% axial strain
(Pham, 2009). In this study, it was observed that load tests on GRS with closely spaced
(< 12 inch) reinforcement having a wide width tensile strength of at least 4800 lb/ft
generally fail at strains greater than 10%, implying that the soil’s shear strength then is
past its peak value.

97
Table 5-1 Test parameters of GRS performance tests selected from literature
Test
dmax
in
USCS
Symbol
Strength
Test Type
Tf
lb/ft
Sv
in
Facing
Type
h
psi
Boundary
Conditions
GSGC21 1.3 GS-GM TX2 4800 7.63 3 4.9 PS4
GSGC31 1.3 GS-GM TX2 9600 15.25 3 4.9 PS4
GSGC41 1.3 GS-GM TX2 4800 15.25 3 4.9 PS4
GSGC51 1.3 GS-GM TX2 4800 7.63 None 0.0 PS4
Elton1 0.5 SP DS5 612 6.00 None 0.0 CC6
Elton2 0.5 SP DS5 612 12.00 None 0.0 CC6
Elton3 0.5 SP DS5 960 6.00 None 0.0 CC6
Elton4 0.5 SP DS5 996 6.00 None 0.0 CC6
Elton5 0.5 SP DS5 1272 6.00 None 0.0 CC6
Elton6 0.5 SP DS5 1380 6.00 None 0.0 CC6
Elton7 0.5 SP DS5 1704 6.00 None 0.0 CC6
VS-17 0.5 GP LSDS8 2400 7.63 CMU 4.4 SC9
VS-27 0.5 GP LSDS8 4800 7.63 CMU 4.4 SC9
VS-57 0.5 GP LSDS8 4800 7.63 CMU 4.4 SC9
MPA11 0.8 GW-GM LSDS8 4800 15.25 None 4.4 SC9
MPB11 0.5 GW-GM LSDS8 4800 7.63 None 4.4 SC9
MPC11 1.0 GW-GM LSDS8 4800 7.63 None 0.0 SC9
TF-1 1.0 GP LSDS8 4800 7.63 CMU 0.0 SC9
TF-2 1.0 GW-GM LSDS8 1400 7.63 CMU 0.0 SC9
TF-3 0.5 GW-GM LSDS8 2400 7.63 None 4.4 SC9
TF-6 1.0 GW-GM LSDS8 4800 7.63 CMU 4.4 SC9
TF-7 1.0 GW-GM LSDS8 4800 7.63 None 0.0 SC9
TF-9 1.0 GW-GM LSDS8 4800 15.25 CMU 4.4 SC9
TF-10 1.0 GW-GM LSDS8 4800 15.25 None 0.0 SC9
TF-11 1.0 GW-GM LSDS8 1400 3.81 None 4.4 SC9
TF-12 1.0 GW-GM LSDS8 1400 3.81 CMU 0.0 SC9
TF-13 1.0 GW-GM LSDS8 2400 11.44 None 0.0 SC9
TF-14 1.0 GW-GM LSDS8 2400 11.44 CMU 4.4 SC9 Notes: 1. GSGC = Generic Soil-Geosynthetic Composite
2. TX = Consolidated drained triaxial compression tests on 0.15-m-diameter and 0.3-m-high
samples
3. No facing was used. Instead, a confining pressure = 5 psi was applied using a rubber
membrane wrapped around the GRS
4. PS = Plane strain boundary conditions
5. DS = direct shear test. Because soil was SP, direct shear sample was 2.5 in. diameter
performed in accordance with ASTM D3080
6. CC = Cylindrical Column
7. VS = Performance tests conducted in Defiance County, OH as part of the FHWA’s Every
Day Counts GRS Validation Sessions
8. LSDS = Large Scale Direct Shear tests on 12 in by 12 in by 8 in high specimen
9. SC = Square Column
10. MP = Mini pier tests or more widely referred to herein as performance tests

98
a) b)
Figure 5-1 (a) Large scale direct shear device (LSDS) (b) Large scale triaxial device
(LSTX)
Figure 5-2 Typical stress-strain curve of an overconsolidated soil
The notion of using fully softened strength is not new in geotechnical engineering.
Duncan and Wright (2005) recommend the use of fully softened strength when analyzing
the stability of cuts in heavily overconsolidated soil. The rationale for this is that
swelling and softening was found to have occurred along the slip surfaces during forensic
studies of such slides and use of fully softened strength, or the strength if the soil was
normally consolidated, provided better agreement when back-calculating the factors of
safety in these failed slopes. Wu (1996) indicated that the fully softened strength is
typically mobilized at strains on the order of 10% (Figure 5-2). Clearly soil swelling is
irrelevant here. In the case of GRS, the reinforcement strengthens the soil and forces
Peak strength
Fully softened strength
Residual strength
ε ≈ 2 - 5% ε ≥ 10%
𝜎𝑑

99
failure to occur very often at double-digit strains (Table 5-2). Therefore, in the interest of
preserving strain compatibility, a study was conducted to see whether fully softened
strengths provide a better prediction of the bearing capacity of footings on GRS
abutments than peak strengths.
The ultimate bearing capacities of the 28 load tests were predicted using Equation
2-3 and both the backfill’s peak and fully softened shear strength parameters (as shown in
Table 5-2). Figure 3-8 shows a plot of the fully softened and peak Mohr-Coulomb
envelopes for the Virginia 21A well-graded soil used in this study.
5.1.1 Use of Peak Strengths to Predict Bearing Capacity
The predicted ultimate bearing capacities using the soil’s peak, qult,peak, and fully
softened, qult,fs, strengths and the measured ultimate capacities (qult,emp) of the 28 load
tests are shown in Table 5-2. Also shown is the bias defined as the ratio of the measured
to predicted ultimate capacities. The mean, standard deviation, and coefficient of
variation (COV) of the biases are shown at the bottom of Table 5-2.
The average bias, defined as the measured capacity divided by the predicted
capacity, calculated using peak strengths was 0.79 (COV = 36%). Figure 5-4 shows the
histogram and the probability density function (PDF) of the normal distribution of the
bias. Figure 5-5 shows the predicted versus measured ultimate capacities using peak
strengths. Clearly, Equation 2-3 over-predicts the GRS capacity when using peak
strengths.

100
Table 5-2 Predicted and measured ultimate bearing capacity of GRS load tests using fully
softened versus peak strengths
Test
qult,emp
psf
εf1
% ϕpeak
˚
cpeak
psi
qult,peak
psf
ϕfs
˚
cfs
psi
qult,fs
psf
Bias, λ
Peak FS
GSGC2 70957 6.5 50 10 51299 41 17 46429 1.35 1.80
GSGC3 42574 6.1 50 10 42183 41 17 37438 1.04 1.33
GSGC4 37252 4 50 10 31265 41 17 26669 1.38 1.62
GSGC5 42449 6 50 10 47174 41 17 42360 0.90 1.18
Elton1 4805 1.7 40 4 5351 41 4 5266 0.92 0.91
Elton2 2695 3.1 40 4 3215 41 4 3125 0.86 0.86
Elton3 6392 3.9 40 4 6959 41 4 6879 0.94 0.93
Elton4 6100 4.5 40 4 7126 41 4 7045 0.88 0.87
Elton5 8398 4.7 40 4 8401 41 4 8324 1.02 1.01
Elton6 8293 7.7 40 4 8901 41 4 8825 0.95 0.94
Elton7 9589 8.5 40 4 10398 41 4 10326 0.94 0.93
VS-1 23310 8 54 3 38891 51 0 28829 0.70 0.96
VS-2 22709 7.1 46 3 31419 45 0 27537 0.82 0.94
VS-5 21539 10.4 51 0 28829 51 0 28829 0.89 0.89
MPA 4696 1.9 54 11 14989 53 0 5559 0.31 0.87
MPB 3548 2.2 54 11 22676 53 0 13316 0.16 0.27
MPC 9600 6.4 54 11 22363 53 0 13000 0.43 0.76
TF-1 20487 10.9 53 10 27834 55 0 21101 0.88 1.34
TF-2 25260 11.5 54 112 37331 53 0 28105 0.79 1.15
TF-3 17491 13.8 54 112 31565 53 0 22286 0.55 0.81
TF-6 43763 15.7 54 112 59416 53 0 50391 0.81 1.00
TF-7 26546 12.5 54 112 53650 53 0 44572 0.49 0.61
TF-9 22310 15.6 54 112 29282 53 0 19982 0.94 1.60
TF-10 10330 14.3 54 112 23516 53 0 14164 0.44 0.75
TF-11 23249 12.8 54 112 41800 53 0 32615 0.56 0.73
TF-12 29030 13.4 54 112 47566 53 0 38433 0.69 0.90
TF-13 12960 12.3 54 112 27086 53 0 17767 0.48 0.75
TF-14 23562 12.7 54 112 32853 53 0 23585 0.85 1.32
Average Bias 0.79 1.00
Standard Deviation of the Bias 0.28 0.32
Coefficient of Variation (%) 0.36 0.32 Notes: 1. εf = Strain of GRS load tests at failure
2. Best fit linear Mohr-Coulomb envelopes for soil used in TF-2 through TF-14
yielded values of cohesion of 11 psi and 1 psi for the partially saturated and
saturated samples, respectively. A cohesion of 11 psi was used when
estimating the GRS capacity since the soil was partially saturated during load
testing in FHWA’s TFHRC laboratory.

101
Figure 5-3 Histogram and normal distribution of the bias using peak strengths
Figure 5-4 Measured versus predicted capacities using peak strengths
0
0.3
0.6
0.9
1.2
1.5
0
1
2
3
4
5
0 0.5 1 1.5 2
Pro
ba
bility
Den
sity
Fu
nctio
n
Fre
qu
en
cy
l (qult,emp/qult,peak)
0
10
20
30
40
50
60
70
80
0 20 40 60 80
qu
lt,p
eak
(ks
f)
qult,emp (ksf)
GSGC (Pham, 2009)
Elton (Elton and Patawaran, 2005)
VS (Nicks et al., 2013)
MP (Adams et al., 2007)
TF (Nicks et al., 2013)

102
5.1.2 Use of Fully Softened Strengths to Predict Bearing Capacity
In contrast, the average bias of the measured capacity to the predicted capacity
using fully softened strengths was 1.00 (COV = 32%). Figure 5-6 shows the histogram
and PDF of the normal distribution of the bias; Figure 5-7 shows the predicted versus
measured capacities using fully softened strengths. In Figure 5-7, the data points are
more centered on the line of equality. Based on these results, Equation 2-3 with the use
of fully softened strengths yield a bias that is close to unity with a slightly smaller COV
compared to the use of peak strengths for this dataset.
Hypothesis testing on the normal distribution of the bias indicate that using
Equation 2-3 and fully softened strengths will result in a mean bias of 1.00, with a 90%
confidence that the bias will be within 3 standard deviations of the mean.
Figure 5-5 Histogram and normal distribution of the bias using fully softened strengths
0
0.3
0.6
0.9
1.2
1.5
0
1
2
3
4
5
0 0.5 1 1.5 2
Pro
ba
bility
Den
sity
Fu
nctio
n
Fre
qu
en
cy
l (qult,emp/qult,fs)

103
Figure 5-6 Measured versus predicted capacities using fully softened strength
5.2 Summary
Fully softened strengths are more suitable for bearing capacity predictions because
GRS with closely spaced reinforcement generally fail at large strains past the backfill’s
peak strengths. A follow-on to this is that since large movements are required to fail, say
a GRS abutment, the design of GRS abutments will most likely be governed by the
serviceability limit state rather than the ultimate limit state
0
10
20
30
40
50
60
70
80
0 20 40 60 80
qu
lt,f
s(k
sf)
qult,emp (ksf)
GSGC (Pham, 2009)
Elton (Elton and Patawaran, 2005)
VS (Nicks et al., 2013)
MP (Adams et al., 2007)
TF (Nicks et al., 2013)

104
Summary and Conclusions
6.1 Summary
Four pairs (one with and one without CMU facing) of GRS load tests, also known
as mini-piers and denoted as “TF” in this study, were tested at the TFHRC. Tests were
instrumented to measure the vertical load, vertical and lateral deformation, and vertical
earth pressure near the bottom and lateral earth pressures at mid-height of the mini-piers
with CMU and geotextile fabric strains. The mini-pier pairs had varying Tf/Sv ratio (TF-
6 and -7 Tf/Sv = 7.55 ksf; TF-9 and -10 Tf/Sv = 3.78 ksf; TF-11 and -12 Tf/Sv = 4.41 ksf;
TF-13 and -14 Tf/Sv = 3.84 ksf). This study focused on observations of the vertical
capacity of GRS columns in particular the effects of CMU facing on capacity and also
their load-settlement curves, lateral earth pressures during mini-pier construction and
during load testing to failure, the validity of the postulate of zero volume change (Adams
et al., 2002), composite shear strength parameters of GRS, and the appropriateness of
using the soil’s fully softened versus peak shear strengths to predict the bearing capacity
of footings on GRS.
6.2 Findings and Conclusions
The following findings and conclusions from this study are offered:
6.2.1 Bearing Capacity
Comparing the load tests with and without facing, the tests with CMU have higher
capacities due to the confinement provided by the CMU to the GRS.
The ultimate capacity increased significantly as the ratio Tf/Sv increased.
However, for a given value of Tf/Sv, the ultimate capacity varied amongst three

105
pairs of tests having different combinations of Tf and Sv suggesting that the
contribution of the reinforcing tensile strength does not have the same weight as
that of the fabric spacing. In fact, it has been shown by other researchers that
spacing has a greater influence on GRS capacity than tensile strength.
The CMU contribution to capacity increased with increasing reinforcing spacing
and reinforcing strength; i.e.; the smaller the reinforcing spacing and the weaker
the reinforcing, the smaller will be the effect of the CMU blocks on the capacity
6.2.2 Failure Plane:
In the tests without CMUs, distinct failure planes with ruptures in the geotextile
were observed when the reinforcement spacings were less than 12 inches. Shear
failure development was not visible during the tests with CMU. However, upon
removal of the CMU blocks at the end of the test, tear trends in the geotextile
provided some clues on the shear failure development.
When the spacing exceeded 12 inches, no shear failure surface was evident.
Failure of the soil between the reinforcement occurred but the reinforcement
themselves did not shear.
6.2.3 Lateral Pressures:
For the CMU facing utilized, measured lateral pressures were very small or
negligible and less than the at-rest values of the unreinforced soil during GRS
construction.
106
Measured lateral pressures increased during load testing and are largest when
Tf/Sv is highest. However, at approximately the same Tf/Sv, the larger the spacing,
the larger the lateral stress.
A behavioral mechanism for the load tests is theorized as follows. As the footing
is loaded, the soil settles causing the geotextile to turn downward. This downturn
in the geotextile exerts an axial force on the CMU blocks, which restrains the
blocks from lateral movement. As a result, there is a build-up in lateral pressure
giving rise to an immensely strong and robust structure. Finally, as the load in the
geotextile approaches its tensile strength, the geotextile ruptures along the
perimeter of the CMU blocks. When this happens, the lateral pressure in the
CMU drops. The CMU blocks are now no longer part of the geo-composite.
Instead the behavior now tends towards the test without any CMU blocks. With a
loss in confining stress, the soil/fabric composite then shears more readily.
6.2.4 Lateral Deformation:
The maximum lateral deformation increased with increasing spacing.
The maximum lateral deformation tends to occur in the middle of the pier
(sometimes a little higher) when the spacings were less than 12 inches. At a
reinforcement spacing greater than 12 inches, the maximum lateral deformation
occurred at or near the top. Soil-reinforcement interface friction restrains lateral
deformation of the soil. It also results in higher locked-in lateral stresses in the
GRS. This explains why the top deformation is higher when there is less
reinforcement at the top.

107
6.2.5 Postulate of Zero Volume Change
The theory of zero volume change is true at service loads (less than 4 ksf) where
there is less than 0.7% change in volume in all tests. At applied stresses larger
than 4 ksf, the volume change does not exceed 5%.
The smaller the reinforcement spacing, the closer the behavior tends towards zero
volume change.
6.2.6 Fabric Strains
The type of strain gages used does not last very long into the load test. They
generally fail at an applied pressure of approximately 4 ksf. The longer they last,
the more useful they can be for indicating the direction of the failure plane.
The strain gages provide a good indication of the concentricity of the applied load
and may be useful for real-time load adjustments.
In many of the tests, the largest strains occur close to the test column mid-height.
This agrees with the fact that the GRS column tends to deflect or barrel most at
mid-height.
For very closely spaced reinforcement (~4 inches), the strain distribution between
the machine and cross-machine directions are fairly uniform at small load levels.
A uniform strain distribution in a geotextile is an indication that development of a
shear plane has not begun.

108
6.2.7 Shear Strength Parameters
The Mohr-Coulomb envelopes for the GRS/GMSE composites are not parallel to
those of the unreinforced soil nor are they parallel to each other despite having
similar soil densities and water contents.
The friction angle of the GRS/GMSE composite is less than that of the
unreinforced soil. In general, the composite friction angle increases with
decreasing Tf/Sv (decreasing Tf and increasing Sv). The same factors affecting
friction angle also affect the derived lateral earth pressure coefficients in the same
manner.
Geosynthetic reinforcement introduces a significant cohesion to the soil that is
higher than that of the unreinforced soil. The cohesion increases with decreasing
spacing and increasing geotextile strength.
The benefits of reinforcing a soil become increasingly significant when Sv
decreases since the smaller the Sv, the further the failure envelope extends above
that for the unreinforced soil.
6.2.8 Fully Softened versus Peak Strengths
Fully softened strengths are more suitable for bearing capacity predictions
because GRS with closely spaced reinforcement generally fail at large strains past
the backfill’s peak strengths.
A follow-on to this is that since large movements are required to fail say a GRS
abutment, the design of GRS abutments will most likely be governed by the
serviceability limit state rather than the ultimate limit state

109
6.3 Key Findings
Key contributions from this study include: (1) the derivation of the soil-
geosynthetic composite shear strength parameters and (2) the use of the soil’s fully
softened strength to predict the bearing capacity of a footing on a GRS is more
appropriate than the peak.
Use of stress paths and measured lateral and vertical earth pressures to deduce the
composite shear strength parameters of a GRS has not been performed previously. From
this study, it was observed that the soil-geosynthetic composite friction angle is less than
that of the unreinforced soil, contrary to what has been assumed by several researchers
(Schlosser and Long, 1972; Yang, 1972). The composite friction angle decreases with
increasing Tf/Sv ratio and increases with decreasing Tf and increasing Sv. The
geosynthetic reinforcement also introduces a significant cohesion to the soil that is higher
than that of the unreinforced soil. The cohesion increases with decreasing Sv and
increasing Tf.
Use of fully softened strengths improves the accuracy and reliability of Pham’s
(2009) equation used for predicting the ultimate bearing capacity of a footing on a GRS.
6.4 Recommendations for Future Works
1. Lateral earth pressures were measured using one Fatback cell installed mid-height
and mid-width of one face of the GRS. The lateral pressure at that one location
was assumed to be equal along the height of the wall and for all faces. Installing
more Fatback cells along all faces of the wall would allow for verification of this
assumption.

110
2. This study considered only the measured vertical and lateral stresses at failure
using only two GRS/GMSE tests and assumed a linear failure envelope when
deriving the composite shear strength parameters. It does not consider the
kinematic effects of the load tests. Conceivably more rationally sound composite
shear strength parameters can be back calculated using numerical analyses to
match both the measured vertical and lateral deflections and stresses.
3. The TF test series were built as square columns whereas a footing on a GRS
abutment more resembles a plane strain condition. The bearing capacity equation
using GRS composite shear strength parameters was deemed to be applicable.
However, the effects of the corners formed by the CMU of the square columns on
the prediction of GRS behavior when subjected to vertical load should be
investigated. This may be performed using numerical analyses such as the finite
element method, which is beyond the scope of this thesis. The load tests reported
herein were conducted using only one soil type, essentially one wall height, one
type of CMU block and woven polypropylene geotextiles. To fully develop a
prediction method for the composite shear strength of a GRS/GMSE, additional
tests involving different soils, wall heights, reinforcement and facing types may
be of interest.

111
References
Adams, M., Nicks, J., Stabile, T., Wu, J., Schlatter, W. and Hartmann, J. (2011).
Geosynthetic Reinforced Soil Integrated Bridge System Interim Implementation
Guide. Federal Highway Administration, Report No. FHWA-HRT-11-026,
McLean, VA.
Adams, M.T. (1997). Performance of a prestrained geosynthetic reinforced soil bridge
pier. Proc., Int. Symposium on Mechanically Stabilized Backfill, Balkema,
Rotterdam, The Netherlands: 25-34.
Adams, M.T., Ketchart K., and Wu, J.T.H. (2007). Mini Pier Experiments: Geosynthetic
Reinforcement Spacing and Strength as Related to Performance. Proceedings,
Geo-Denver 2007, Denver, CO, ASCE, Reston, VA.
Adams, M.T., Lillis, C.P., Wu, J.T.H, and Ketchart, K. (2002). Vegas Mini Pier
Experiment and Postulate of Zero Volume Change. Proceedings, Seventh
International Conference on Geosynthetics, Nice, France, 389-394.
Anderson, P.L., Gladstone, R.A. and Withiam, J.L. (2010). Coherent gravity: The correct
design method for steel-reinforced MSE walls. Proceedings, 2010 Earth Retention
Conference 3, ASCE: 512-521.
Bathurst, R.J., Benjamin, D.J. and Jarrett, P.M. (1988). Laboratory Study of Geogrid
Reinforced Soils Walls, ASCE Special Publication No. 18 (Geosynthetics for Soil
Improvement), pp. 178-192
Bathurst, R.J. and Benjamin, D.J. (1990). Failure of a geogrid reinforced soil wall.
Transportation Research Record 1288, Washington D.C., pp. 109-116.
Bathurst, R.J., Walters, D., Vlachopoulos, N., Burgess, P., Allen, T.M. (2000). Full Scale
Testing of Geosynthetic Reinforced Walls. Proceedings, Geo-Denver 2000,
Denver, CO, ASCE Special Publications (103): 201-217.
Bell, J.R., Stilley, A.N. and Vandre, B. (1975). Fabric retained earth walls. Proceedings,
Thirteenth Annual Engineering Geology and Soils Engineering Symposium,
University of Idaho, Moscow, ID, 271-297.
Burgess, G.P. (1999). Performance of two full-scale model geosynthetic-reinforced
segmental retaining walls, Master of Engineering Thesis, Royal Military College,
Kingston, Ontario, Canada, 207 p.
Chen, T.C, Chen, R.H, Lin, S.S. (2000). A nonlinear Homogenized Model Applicable to
Reinforced Soil Analysis. Geotextile and Geomembranes, (18): 349-366.
Christopher B, Gill SA, Giroud JP, Juran I, Schlosser F, Mitchell JK, Dunnicliff J, (1990).
Reinforced Soil Structures, Volume 1, Design and Construction Guidelines.
Federal Highway Administration, Washington, D.C., Report No. FHWA-RD-89-
043.
Duncan, M., Wright, S. (2005). Soil Strength and Slope Stability. Hoboken: John Wiley
and Sons, Inc., Ch. 5.
Elton, D.J., and Patawaran, M.A.B. (2005). Mechanically Stabilized Earth (MSE)
Reinforcement Tensile Strength from Tests of Geotextile Reinforced Soil,
Alabama Highway Research Center, Auburn University, Auburn, AL.
Gotteland, P., Gourc, J. P., and Villard, P. (1997). Geosynthetics reinforced structures as
bridge abutments: Full scale experimentation and comparison with modelisations.

112
Mechanically stabilized backfill, J. T. H. Wu, ed., Balkema, Rotterdam, The
Netherlands, 25–34.
Holtz, R. D. and Lee, W. F. (2002). Internal Stability Analyses of Geosynthetic
Reinforced Retaining Walls. Report WA-RD 532.1, Washington State
Department of Transportation, Washington.
Iwamoto, M.K., Ooi, P.S.K., Nicks, J.E. and Adams, M.T. (2013). Use of fully softened
versus peak strength to predict the capacity of footings on geosynthetic reinforced
soil. Proceedings, GEOMATE 2013, Nagoya, Japan.
Ketchart, K. and Wu, J.T.H. (1997). Performance of Geosynthetic-Reinforced Soil
Bridge Pier and Abutment, Denver, Colorado. Proceedings, International
Symposium on Mechanically stabilized Backfill, Denver, Colorado, Balkema,
Rotterdam, 101-116.
Ketchart, K., Wu, J.T.H. (2001) Performance Test for Geosynthetic-Reinforced Soil
including Effects of Preloading. McLean: Federal Highway Administration,
Office of Infrastructure R&D, Report No. FHWA-RD-01-018.
Lambe, T.W. and Whitman, R.V. (1969). Soil Mechanics. John Wiley and Sons, New
York, NY.
Lee, W. F. (2000). Internal Stability Analyses of Geosynthetic Reinforced Retaining
Walls. Ph.D. Thesis, Dept. of Civil and Environmental Engineering, University of
Washington, 379 pages.
Meyerhof, GG. (1957). The ultimate capacity of foundations on slopes. Proceedings, 4th
Int. Conf. on Soil Mechanics and Found. Engrg., London, 384-386.
Mitchell, J.W. (2002). Behavior of Geosynthetically Reinforced Soil Bridge Piers. M.S.
Report, University of Massachusetts at Amherst.
Nelson, R. 2005. Performance of two full-scale reinforced retaining walls - modular
block and incremental panel, Master of Applied Science Thesis, Royal Military
College, Kingston, Ontario, Canada, 254 p.
Nicks, J.E., Adams, M.T., Ooi, P.S.K. and Stabile, T. (2013). Geosynthetic Reinforced
Soil Performance Testing – Axial Load Deformation Relationships. Federal
Highway Administration, Report No. FHWA-HRT-13-066, McLean, VA.
Pham, T.Q. (2009). Investigating Composite Behavior of Geosynthetic Reinforced Soil
(GRS) Mass. Ph.D. Thesis, University of Colorado, Denver.
Reeves, J.W. (2003). Performance of a Full-Scale Wrapped Face Welded Wire Mesh
Reinforced Soil Retaining Wall. Master of Engineering Thesis, Royal Military
College, Kingston, Ontario, Canada, 161 p.
Saunders, D.D. (2001). Performance of two full-scale reinforced segmental soil retaining
walls, Master of Engineering Thesis, Royal Military College, Kingston, Ontario,
Canada, 305 p.
Schlosser, F. and Long, N.T. (1974). Recent Results in French Research on Reinforced
Earth. ASCE, J. of the Construction Division, 100(3): 223-237.
Soong, T-Y. and Koerner, R.M. (1997). On the Required Connection Strength of
Geosynthetically Reinforced Walls. Geotextiles and Geomembranes, (15): 377-
393.

113
Tatsuoka, F., Uchimura, T., Tateyama, M., and Koseki, J. (1997). Geosynthetic
Reinforcement Soil Retaining Walls as Important Permanent Structures.
Mechanically stabilized backfill, J. T. H. Wu, ed., Balkema, Rotterdam, The
Netherlands, 3–24.
Vlachopoulos, N. (2000). Performance of two full-scale model geosynthetic reinforced
walls: segmental and wrapped-faced, Master of Engineering Thesis, Royal
Military College, Kingston, Ontario, Canada, 242 p.
Wu JTH, (1996). Soil Strength Properties and Their Measurement. Landslides
Investigation and Mitigation, Spec. Rep. 247, Transportation Research Board,
Turner A, Schuster R, Ed. Washington, D.C., National Academy Press, 319-336.
Wu, J.T.H. (2001). Revising the AASHTO guidelines for design and construction of
GRS walls. Report No. CDOT-DTD-R-2001-16 prepared for the Colorado
Department of Transportation.
Wu JTH, Pham TQ (2013). Load-Carrying Capacity and Required Reinforcement
Strength of Closely-Spaced Soil-Geosynthetic Composites. ASCE J. of Geotech.
and GeoEnv. Engrg. (139).
Yang, Z. (1972). Strength and Deformation Characteristics of Reinforced Sand. Ph.D.
Thesis, University of California at Los Angeles, Los Angeles, CA.
Yoo, C. and Kim S.B. (2008). Performance of a Two-Tier Geosynthetic Reinforced
Segmental Retaining Wall Under a Surcharge Load: Full-Scale Load Test and 3D
Finite Element Analysis. Geotextiles and Geomembranes, 26(6): 460-472.
Zhang, M.X., Javadi, A.A., Lai, Y.M., and Sun, J. (2006). Analysis of Geosynthetic
Reinforced Soil Structures with Orthogonal Anisotropy. Geotechnical and
Geological Engineering, (24): 903-917.
Ziegler, M., Heerten, G., and Ruiken. G. (2008). Progress in the Understanding of
Geosynthetic/Soil Composite Material Behaviour in Geosynthetic Reinforced
Earth Structures. The First Pan American Geosynthetics Conference & Exhibition,
Cancun, Mexico.


![Geosynthetic Reinforced Pavement System Testing Design[1]](https://img.dokumen.tips/doc/110x75/577ccfcc1a28ab9e78909acc/geosynthetic-reinforced-pavement-system-testing-design1.jpg)