Embed Size (px)
Citation preview
OAO/TR-81/OQ52
7500 GREENWAY CENTER
GREENBELT, MARYLAND 20770
ENGINEERING SYSTEMS ANALYSIS ENVIRONMENTAL SYSTEMS SUPPORT SERVICES
https://ntrs.nasa.gov/search.jsp?R=19830014015 2018-05-27T23:09:32+00:00Z
OAO/TR-81/0052
SPACE TRANSPORTATION SYSTEM FLIGHT 2
OSTA-1 SCIENTIFIC PAYLOAD
DATA MANAGEMENT PLAN •" '
September 25, 1981
NATIONAL AERONAUTICS AMD SPACE ADMINISTRATION
OFFICE OF SPACE AND TERRESTRIAL APPLICATIONS
WASHINGTON, D.C.

APPROVEDPRINCIPAL INVESTIGATORS:
Dr. Charles ElachiShuttle Imaging Radar (SIR-A)Jet Propulsion Laboratory
DrX AlexanderShuttle Multispecfcfal InfraredRadiometer (SMIRR)Jet Propulsion Laboratory
Mr, Roge*-ScKappelIT~SFeature Identification anaLocation Experiment (FILE)Martin-Marietta Aerospace
Ocean Color Experiment (OCE)Goddard Space Flight Center
Dr. Henry Reichle, Jr. ~7Measurement of Air Pollutionfrom Satellites (MAPS) 'Langley Research Center
„,/-dc:/,/Dr. Bernard VonnegutNight/Day Optical Survey ofLightning (NOSL)State University of New York
Dr.Allan B r o w n IHeflex Bioengineering Test (HBT)University of Pennsylvania
PROGRAM SCIENTIST:
James V. Taranik""Office of Space and TerrestrialApplicationsNASA HeadquartersWashington, D.C.
MISSION SCIENTIST:
Dr. Andrew PotterSpace and Life Sciences DirectorateJohnson Space CenterHouston, Texas
ACKNOWLEDGEMENTS
This OSTA-1 Scientific Payload Data Management Plan was prepared by the OAOCorporation, 7500 Greenway Center, Greenbelt, MD 20770, under ContractNo. NASW 3358, Task No. 41A. The task participants were Rud V. Moe, Chieh-San Cheng, and Dr. Bernard Rubin. The Plan was compiled from materialsprovided by the Non-renewable Resources Branch, . Resource ObservationDivision of the Office of Space and Terrestial Applications, and by the STS
Mission Managers Office at JSC, and specific experiment information pro-vided by the Principal Investigators and Co-Investigators. Direction and
guidance were given by Dr. James Taranik and Bruton Schardt of the Non-renewable Resources Branch, OSTA. Significant contributions were made byGerry Kenney and Richard Baldwin of JSC and Jules Dishler of Lockheed atJSC for the mission plans, and data acquisition timelines. Substantial
materials were provided by the Investigators and their management staffincluding Dr. Charles Elachi of JPL (SIR-A), Dr. Alexander Goetz of JPL
(SMIRR), Hongsuk Kim of GSFC (OCE), Dr. Henry Reichle and Dr. Harry Orr ofLaRC (MAPS), W. Eugene Sivertson and R. Gale Wilson of LaRC (FILE),Dr. Bernard Vonnegut of SUNY and James Dodge of NASA HQ (NOSL), and Dr.Allan Brown of University of Pennsylvania (HBT).

CONTENTS
Section Page
APPROVAL ii
ACKNOWLEDGEMENTS iii
1. INTRODUCTION 1-1
2. BACKGROUND 2-1
2.1 Experiment Goals and Minimum Experiment Performance. . . . 2-12.1.1 SIR-A 2-12.1.2 SMIRR 2-12.1.3 FILE 2-32.1.4 MAPS 2-4
2.1.5 OCE 2-5
2.1.6 NOSL 2-8
2.1.7 HBT 2-11
2.2 History of Experiments 2-11
2.2.1 SIR-A 2-112.2.2 SMIRR 2-122.2.3 FILE 2-122.2.4 MAPS 2-13
2.2.5 OCE . . . 2-15
2.2.6 NOSL 2-17
2.2.7 HBT 2-17
3. EXPERIMENT DESCRIPTIONS 3-1
3.1 SIR-A 3-1
3.1.1 Instrument Description 3-1
3.1.2 Instrument Characteristics 3-6
3.1.3 Instrument Calibration 3-63.1.4 Accuracy 3-8
3.2 SMIRR 3-9
3.2.1 Instrument Description 3-9
3.2.2 Instrument Characteristics 3-9
3.2.3 Instrument Calibration 3-143.2.4 Accuracy 3-16

CONTENTS (cont.)
Section Page
3.3 FILE 3-16
3.3.1 Instrument Description 3-163.3.2 Instrument Characteristics 3-233.3.3 Instrument Calibration 3-233.3.4 Accuracy 3-25
3.4 MAPS 3-25
3.4.1 Instrument Description 3-25
3.4.2 Instrument Characteristics 3-273.4.3 Instrument Calibration 3-303.4.4 Accuracy 3-32
3.5 OCE 3-32
3.5.1 Instrument Description 3-32
3.5.2 Instrument Characteristics 3-343.5.3 Instrument Calibration 3-37
3.5.4"" Accuracy. 3-37
3.6 NOSL 3-38
3.6.1 Instrument Description 3-38
3.6.2 Instrument Characteristics 3-383.6.3 Instrument Calibration 3-40
3.7 HBT 3-40
4. DATA DESCRIPTION 4-1
4.1 SIR-A 4-1
4.1.1 Fight Data 4-1
4.1.2 Ground Truth and Ancillary Data 4-5
4.2 SMIRR .4 -8
4.2.1 Flight Data 4-8
4.2.2 Ground Truth Data 4-10
4.3 FILE 4-13
4.3.1 Flight Data 4-13
4.3.2 Ground Truth and Ancillary Data 4-14

CONTENTS (cont.)
Section Page
4.4 MAPS 4-144.4.1 Flight Data 4-14
4.4.2 Correlative and Ancillary Data 4-15
4.5 OCE. 4-154.5.1 Flight Data 4-15
4.5.2 Ground Truth and Ancillary Data 4-17
4.6 NOSL 4-20
4.6.1 Flight Data 4-20
4.6.2 Ground Truth and Ancillary Data 4-20
4.7 HBT 4-21
4.7.1 Flight Data 4-21
4.7.2 Ground Truth and Ancillary Data 4-21
5. DATA ACQUISITION PLAN 5-1
5.1 Priority Coverage by Area and Actual Ground Coverage . . . 5-1
5.1.1 SIR-A 5-1
5.1.2 SMIRR .". ~r.~TT ." . . . . . ; . . . . . . . 7 . . 5 -4
5.1.3 FILE 5-8
5.1.4 MAPS 5-8
5.1.5 OCE 5-8
5.2 Effects of Changes in Flight Operations 5-19
5.2.1 SIR-A 5-19
5.2.2 SMIRR 5-21
5.2.3 FILE 5-21
5.2.4 MAPS 5-21
5.2.5 OCE 5-21
5.3 Constraints during Data Collection 5-225.3.1 SIR-A 5-22
5.3.2 SMMIR 5-22
5.3.3 FILE 5-22
5.3.4 MAPS 5-22
5.3.5 OCE 5-23

CONTENTS (cont.)
Section Page
5.3.6 NOSL 5-23
5.4 Impacts of Changes in Data Acqusition Plan . 5-23
5.4.1 SIR-A 5-23
5.4.2 SMIRR . . 5-23
5.4.3 FILE 5-24
5.4.4 MAPS 5-24
5.4.5 OCE 5-24
5.4.6 NOSL 5-24
5.5 Use of Other Orbiter Resources 5-25
5.5.1 SIR-A 5-25
5.5.2 SMIRR 5-25
5.5.3 FILE 5-25
5.5.4 MAPS 5-25
5.5.5 OCE 5-25
6. PAYLOAD OPERATIONS CONTROL CENTER 6-1
6.1 Services Required for Mission 6-16.1.1 SIR-A 6-1
6.1.2 SMIRR 6-4
6.1.3 FILE 6-4
6.1.4 MAPS 6-5
6.1.5 OCE 6-5
6.2 Payload Command and Control 6-6
6.2.1 SIR-A 6-6
6.2.2 SMIRR 6-7
6.2.3 FILE 6-7
6.2.4 MAPS 6-7
6.2.5 OCE 6-7
6.3 Payload Operations and Real-Time Decisions 6-86.3.1 SIR-A 6-86.3.2 SMIRR 6-8
6.3.3 FILE 6-8
VII
CONTENTS (cont.)
Section Page
6.3.4 MAPS 6r8
6.3.5 OCE 6-9
6.3.6 NOSL 6-9
7. DATA RECEIVED FROM ORBITER. 7-1
7.1 In i t ia l Data Retrieval, Transportation arid Storage . . . . 7-17.1.1 SIR-A 7-17.1.2 SMIRR 7-3
7.1.3 FILE 7-9
7.1.4 MAPS 7-10
7.1.5 OCE , 7-12
7.1.6 NOSL 7-137.1.7 HBT 7-14
7.2 Environmental History and Other Orbiter Support Data . . . 7-14
7.2.1 SIR-A 7-14
7.2.2 SMIRR 7-14
7.2.3 FILE 7-14
7.2.4 MAPS 7-15
7.2.5 OCE 7-15
7.2.6 NOSL 7-15
7.2.7 HBT 7-16
8. DATA PROCESSING . . 8-1
8.1 SIR-A 8-1
8.1.1 Introduction 8-18.1.2 Preprocessing 8-158.1.3 Processing 8-17
8.2 SMIRR 8-18
8.2.1 Data Preprocessing 8-188.2.2 Data Processing 8-18
8.3 FILE 8-19
vm

CONTENTS (cent.)
Section Page
8.4 MAPS 8-23
8.4.1 Introduction 8-23
8.4.2 Preprocessing 8-24
8.4.3 Processing 8-258.5 OCE. . 8-25
8.5.1 Preprocessing 8-25
8.5.2 Processing S-258.6 NOSL 8-29
8.6.1 Data Processing 8-298.7 HBT 8-31
9. DATA ARCHIVING AND DISSEMINATION 9-1
9.1 SIR-A 9-1
9.1.1 Introduction 9-1
9.1.2 SIR-A Film Products 9-3
9.1.3 SIR-A Non-Image Products 9-8
9.2 SMIRR 9-10
9.2.1 Post Mission Data Quality Report . 9-10
9.2.2 Duplicate Printing of Masters 9-109.2.3 Original Flight Data Disposition 9-10
9.2.4 Quality Control Screening 9-119.2.5 Data Dissemination to the Co-Investigator 9-119.2.6 Data Archiving 9-119.2.7 Availability of Data to the Public 9-11
9.3 FILE 9-119.3.1 Post Mission Data Quality Report 9-11
9.3.2 Duplication of Masters 9-129.3.3 Original Flight Data Disposition 9-129.3.4 Data Dissumination to the Co-Investigations .... 9-12
9.3.5 Data Archiving 9-129.3.6 Availability of Data to the Public 9-12
CONTENTS (cont.)
Section Page
9.4 MAPS 9-139.4.1 Post Mission Data Quality Report 9-13
9.4.2 Duplication of Masters 9-139.4.3 Original Flight Data Disposition 9-139.4.4 Data Dissemination to the Co-Investigation 9-139.4.5 Data Archiving 9-149.4.6 Availability of Data to the Public 9-14
9.5 OCE 9-149.5.1 Post-Mission Data Quality Report 9-159.5.2 Duplication of Masters 9-159.5.3 Original Flight Data Disposition 9-159.5.4 Data Quality Control and Screening 9-159.5.5 Data Dissemination to the Co-Investigators 9-169.5.6 Data Archiving and Availability to the Public . . . 9-16
9.6 NOSL 9-169.6.1 Post-Mission Data Quality Report 9-16
9.6.2 Duplication of Masters. . 9-179.6.3 Original Flight Data Disposition 9-17
9.6.4 Data Quality Control and Screening 9-17
9.6.5 Data Dissemination to the Co-Investigators 9-179.6.6 Data Archiving and Availability to the Public . . . 9-17
9.7 HBT 9-17
10. DATA ANALYSIS 10-11 10.1 SIR-A 10-1
10.2 SMIRR 10-1
10.2.1 Analysis Procedures 10-110.2.2 Support Required 10-3
10.3 FILE 10-3
10.3.1 Analysis Procedures 10-310.3.2 Time Required 10-6

CONTENTS (cont.)
Section Page
10.4 MAPS 10-6
10.4.1 Data Analysis 10-610.4.2 Time Required 10-8
10.5 OCE 10-8
10.5.1 Analysis Procedures 10-8
10.5.2 Time Required . 10-10
10.5.3 Support Required 10-10
10.6 NOSL 10-10
10.7 H8T 10-16
11. SCIENCE RESULTS REPORTING 11-1
11.1 SIR-A 11-1
11.1.1 Mission Science Report 11-1
11.1.2 Planned Publications 11-1
11.2 SMIRR 11-1
11.2.1 Mission Science Report 11-111.2.2 Planned Publications 11-2
11.3 FILE 11-3
11.3.1 Mission Science Report 11-311.3.2 Planned Publications 11-3
11.4 MAPS 11-3
11.4.1 Mission Science Report 11-3
11.4.2 Planned Publications 11-3
11.5 OCE 11-3
11.5.1 Mission Science Report 11-311.5.2 Planned Publications 11-3
11.6 NOSL 11-4
11.6.1 Mission Science Report 11-4
11.6.2 Planned Publications 11-411.7 HBT 11-4
11.7.1 Mission Science Report 11-4
11.7.2 Planned Publications 11-4

CONTENTS (cont.)
Section Page
APPENDIX A. ACRONYMS AND ABBREVIATIONS A-l
APPENDIX B. HOW TO ACQUIRE OSTA-1 DATA FROM NSSDC B-l
APPENDIX C. ACTUAL DATA ACQUISITION C-l
APPENDIX D. CHARACTERISTICS OF EPHEMERIS DATA AND
HOW TO OBTAIN IT D-l
ILLUSTRATIONS
Figure Page
1-1 OSTA-1 Experiment Ground Coverage and Resolution 1-42.1.5-1 Energy Sensed by the OCE Instrument 2-62.2.4-1 General Distribution of CO in Marine Air in the Troposphere
and Lower Stratosphere 2-142.2.5-1 Ocean Color Scanner Images Taken from a U-2 Aircraft . . . 2-163.0-1 -The OSTA-1 Pallet General Configuration. . . 3-33.1-1 SIR-A Instrument Location 3-4
3.1-2 SIR-A Geometry and Signal Flow Diagram 3-53.1-3 SIR-A Optical Correlation 3-7
3.2-1 SMIRR Instrument Location 3-10
3.2-2 SMIRR Instrument 3-11
3.2-3 Simplified SMIRR Block Diagram 3-12
3.2-4 SMIRR Radiance vs. Wavelength 3-15
3.2-5 SMIRR Light Transfer Curve 3-17
3.3-1 Feature Separability for FILE Experiment 3-19
3.3-2 Simplified Decision Circuitry of FILE 3-20
3.3-3 The FILE Experiment Configuration 3-21
3.3-4 FILE Instrument Location 3-22
3.3-5 Orbit Timing as a Function of Time Since Sunrise 3-24
3.4-1 The MAPS Instrument in Operation 3-26
3.4-2 MAPS Instrument Operation 3-28
3.4-3 Location of the MAPS Instrument on the OSTA-1 Pallet . . . 3-29
3.4-4 The MAPS Instrument Calibration Scheme 3-31
xii
CONTENTS (cont.)
ILLUSTRATIONS (cont.)
Figure Page
3.5-1 Location of the OCE Instrument on the OSTA-1 Pallet. . . . 3-33
3.5-2 The OCE Optical Diagram 3-36
3.6-1 NOSL Camera, Photocell and Tape Recorder Signal
Flow Diagram . . 3-39
4.1-1 SIR-A Signal Film Layout 4-3
4.1-2 SIR-A Optical Recorder Data Annotation 4-4
4.2-1 SMIRR Film Time Annotation Format 4-9
4.2.2 Final SMIRR Rock Test 4-11
4.2.3 SMIRR Aircraft Data-Lone Mountain, Nevada . 4-12
5.1.1-1 SIR-A Baseline Coverage - 5-3
5.1.2-1 SMIRR Primary Coverage Pattern 5-9
5.1.2-2 SMIRR Secondary Coverage Pattern 5-10
5.1.5-1 OCE Primary Coverage Pattern 5-17
5.1.5-2 OCE Secondary Coverage Pattern 5-18
5.1.5-3 OCE Coverage of the Areas Across the Kuroshio
and Tushima Current 5-20
6.0-1 Payload Operations Structure 6-2
8.0-1 SIR-A Data Flow Diagram 8-2
8.0-2 SIR-A Data Analysis Schedule 8-3
8.0-3 SMIRR Data Flow Diagram 8-4
8.0-4 SMIRR Data Analysis Schedule 8-5
8.0-5 FILE Data Flow Diagram 8-6
8.0-6 FILE Data Analysis Schedule 8-7
8.0-7 MAPS Data Flow Diagram 8-8
8.0-8 MAPS Data Analysis Schedule 8-9
8.0-9 OCE Data Flow Diagram 8-10
8.0-10 OCE Data Analysis Schedule ,. . 8-11
8.0-11 NOSL Data Flow Diagram 8-12
8.0-12 NOSL Data Analysis Schedule 8-13
8.0-13 HBT Data Flow Diagram 8-14
CONTENTS (cont.)
ILLUSTRATIONS (cont.)
Figure Page
8.1-1 Data Processing Flow for SIR-A 8-16
8.2-1 Data Processing Flow for SMIRR 8-20
8.3-1 Data Processing Flow for FILE 8-21
8.4-1 Data Processing Flow for MAPS 8-26
8.5-1 Data Processing Flow for OCE 8-28
8.6-1 Data Processing Flow for NOSL 8-30
8.7-1 Data Processing Flow for HBT 8-32
9.1-1 Image Products Generation Flow 9-2
9.2-1 Image Film Format 9-6
10.1-1 Data Analysis Flow for the SIR-A 10-2
10.2-1 Data Analysis Flow for the SIMMR 10-4
10.3-1 Data Analysis Flow for FILE 10-7
10.4-1 Data Analysis flow for MAPS 10-9
10.5-1 Data Analysis Flow~for OCE . . . .""."". . . . . . ~. . . V .10-11
10.5-2 Correction for Atmospheric Contribution to Obtain
True Water Radiance 10-12
10.5-3 Chlorophyl Index R Determination 10-13
10.5-4 Chlorophyl Contour Map Generation 10-14
10.6-1 Data Analysis Flow for NOSL 10-17
10.7-1 Data Analysis Flow for HBT 10-18
TABLES
Table Page
1-1 Characteristics of the Second Space Shuttle Flight . . . . 1-2
1-2 OSTA-1 Science Management Team 1-5
1-3 OSTA-1 Program Management Team 1-6
2.0-1 OSTA-1 Experiment Potential Applications 2-2
3.0-1 OSTA-1 Instrument Characteristics 3-2
xiv

CONTENTS (cont.)
TABLES (cont.)
Table Page
3.1-1 SIR-A Characteristics 3-63.2-1 Filter Spectral Characteristics 3-143.5-1 OCE Channel Characteristics 3-354.0-1 OSTA-1 Flight Data Acquisition/Handling 4-2
4.1-1 SIR-A Data Swath Parameters .4 -5
4.4-1 MAPS Correlative Measurements 4-16
5.0-1 OSTA-1 Target Prioritization 5-2
5.1.1-1 Data Acquisition Periods for SIR-A 5-5
5.1.2-1 Data Acquisition Periods for SMIRR and OCE 5-11
6.0-1 OSTA-1 POCC Activities 6-3
6.1-1 SMIRR Commands and Status 6-4
7.1.2-1 Format of Rev. #1 of Minor Frame 0 7-6
7.1.2-2 Format of Rev. #1 of Minor Frame 1-7 7-8
xv

SECTION 1. INTRODUCTION
SECTION 1. INTRODUCTION
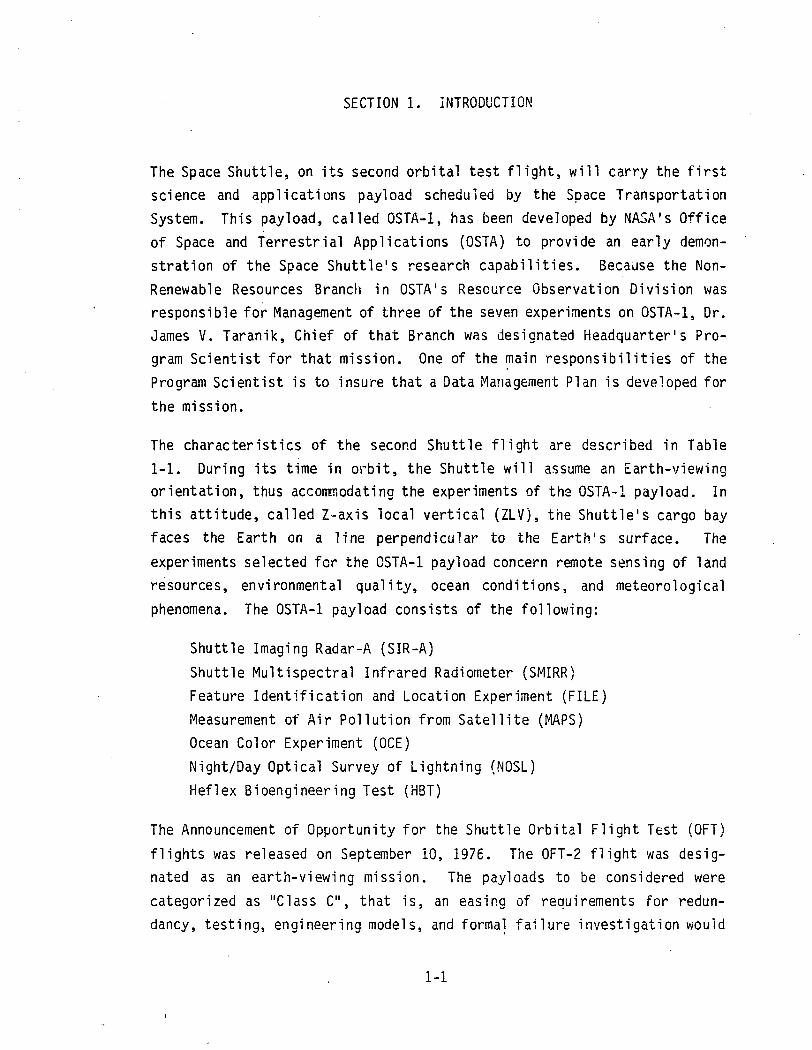
The Space Shuttle, on its second orbital test flight, will carry the first
science and applications payload scheduled by the Space Transportation
System. This payload, called OSTA-1, has been developed by NASA's Office
of Space and Terrestrial Applications (OSTA) to provide an early demon-
stration of the Space Shuttle's research capabilities. Because the Non-
Renewable Resources Branch in OSTA's Resource Observation Division wasresponsible for Management of three of the seven experiments on OSTA-1, Dr.James V. Taranik, Chief of that Branch was designated Headquarter's Pro-
gram Scientist for that mission. One of the main responsibilities of the
Program Scientist is to insure that a Data Management Plan is developed for
the mission.
The characteristics of the second Shuttle flight are described in Table
1-1. During its time in orbit, the Shuttle will assume an Earth-viewingorientation, thus accommodating the experiments of the OSTA-1 payload. In
this attitude, called Z-axis local vertical (ZLV), the Shuttle's cargo bay
faces the Earth on a line perpendicular to the Earth's surface. The
experiments selected for the OSTA-1 payload concern remote sensing of land
resources, environmental quality, ocean conditions, and meteorological
phenomena. The OSTA-1 payload consists of the following:
Shuttle Imaging Radar-A (SIR-A)
Shuttle Multispectral Infrared Radiometer (SMIRR)
Feature Identification and Location Experiment (FILE)
Measurement of Air Pollution from Satellite (MAPS)
Ocean Color Experiment (OCE)
Night/Day Optical Survey of Lightning (NOSL)
Heflex Bioengineering Test (HBT)
The Announcement of Opportunity for the Shuttle Orbital Flight Test (OFT)
flights was released on September 10, 1976. The OFT-2 flight was desig-
nated as an earth-viewing mission. The payloads to be considered were
categorized as "Class C", that is, an easing of requirements for redun-
dancy, testing, engineering models, and formal failure investigation would
1-1

Table 1-1. Characteristics of the Second Space Shuttle Flight
Crew:Pilot Navy Capt. Richard H. TrulyCommander . Air Force Col. Joe H. Engle
Cargo Weight Constraints:OSTA-1 and Pallet 2443 kgAerodynamic Coefficient Identification Package 119 kgInduced Environment Contamination Monitor 438 kgDevelopment Flight Instruments 4556 kg
Launch:Time TBDPlace Pad 39A at Kennedy Space Center
Staging:First Solid rocket booster staging at 27 n.mi. altitude
20 n.mi. downrangeSRB splashdown
125 n.mi. downrange
Second Liquid Hp-O^ main engine cutoff at 60 n.mi. altitude720 n.mi. downrange
External tank splashdown near theantipode in the Indian Ocean
Orbit:
Altitude Insertion to a circular orbit of 137 n.mi.
Inclination 38° + 0.1
Length of Mission 5 days
Time in Z-axis Local Vertical 88 hours
Crew Consumables Contingency Provisions +2 days
Landing:Time DaytimePlace Runaway 23 at Edwards Air Force Base
1-2

be allowed in order to achieve reduction of experiment developmentexpenses. Because of limitations on available funding, encouragement wasgiven for modification of existing instruments. The proposals were sub-mitted by December 3, 1976. Thirty-two proposals for OFT-2 were consideredand six were selected by August 19, 1977. Later, HBT was added to form thecurrent complement of experiments for the OSTA-1 mission.
The instruments for five experiments will be located in the cargo bay. Apallet, supplied by the European Space Agency, provides the mountinginterface between the cargo bay and these five experiments. The NOSL andHBT instruments will be located in the crew compartment.
Figure 1-1 shows the ground coverage (and resolution) for the five experi-ments carried in the cargo bay. SIR-A, SMIRR, and FILE are all concernedin various ways with remote sensing of Earth resources, though FILE focuseson the technology of autonomous Earth feature classification and selectivedata acquisition. MAPS is concerned with remote sensing of environmentalquality. OCE is concerned with remote sensing of ocean conditions.
The OSTA-1 Science Management team and Program Management team aresummarized in Table 1-2 and 1-3 respectively.
The Shuttle Imaging Radar-A (SIR-A) experiment is the most conspicuous ofthe OSTA-1 components. Its 9.35-m antenna will send and receive radarsignals which will be used to create maplike images of the Earth's surface.The delineation of geological structures from radar data when combinedwith geological information from Landsat imagery (from the visible portionof the energy spectrum) may be used to develop geologic information helpfulin evaluating areas of potentially economic mineral deposits. The SIR-Aexperiment will be conducted by Principal Investigator Charles Elachi ofthe Jet Propulsion Laboratory (JPL) and by Co-Investigators Walter E.Brown (JPL), Louis, Dellwig (U. of Kansas), Anthony W. England (JSC), MaxGuy (France), Harold MacDonald (U. of Arkansas), R. Stephen Saunders (JPL)and Gerald Schaber (US Geological Survey). The Chief Engineer for SIR-A isJames Granger of JPL, and he was assisted by Harold Nitschke of JSC.
1-3
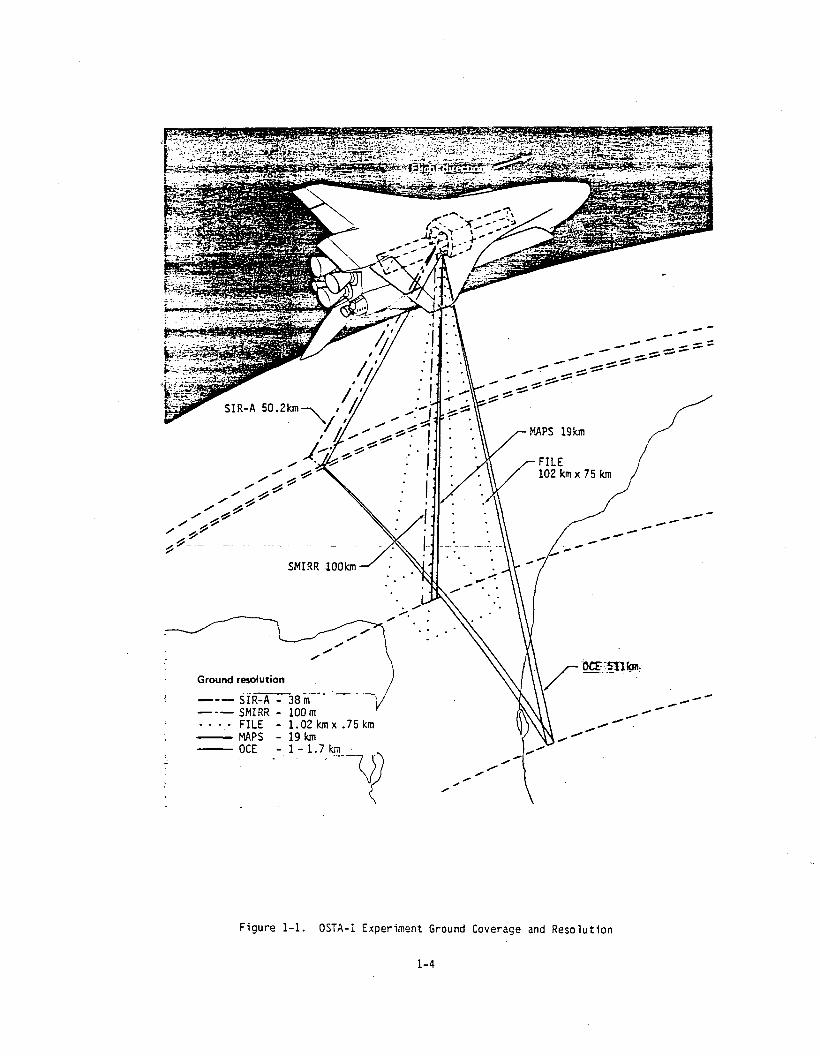
SiR-A - 38mSMIRR - 100m
• • • • FILE - 1.02 km x .75kmMAPS - 19 kmOCE - 1-1.7 km
Figure 1-1. OSTA-1 Experiment Ground Coverage and Resolution
1-4
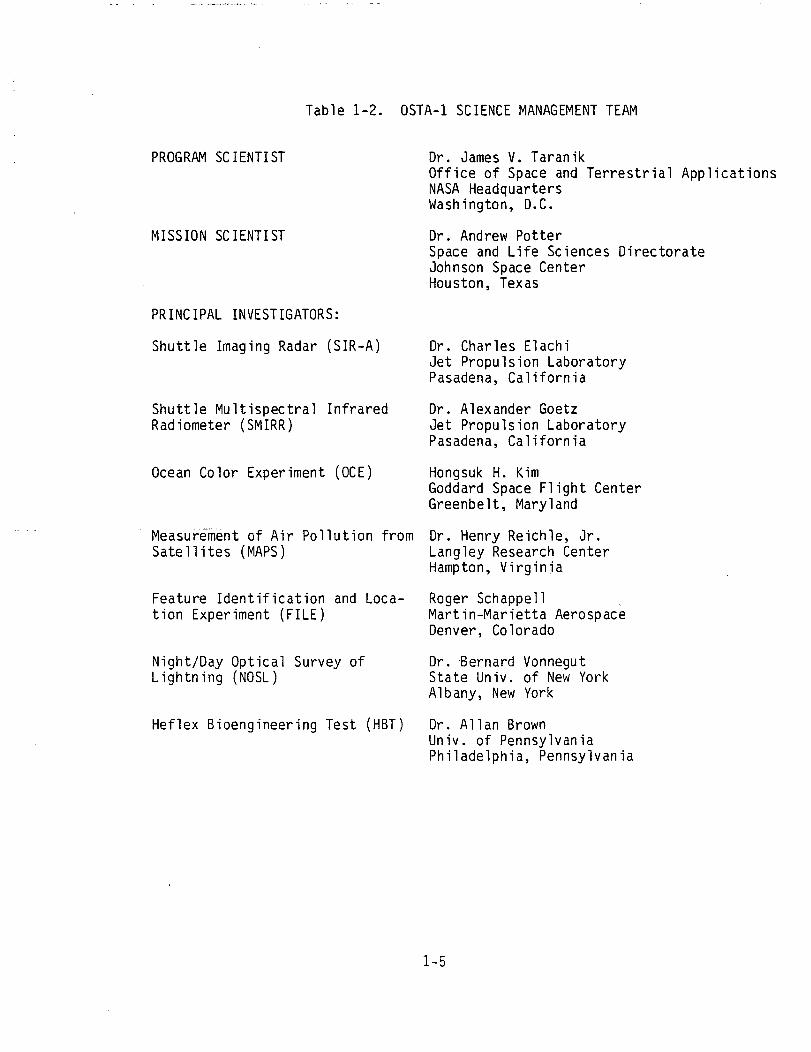
Table 1-2. OSTA-1 SCIENCE MANAGEMENT TEAM
PROGRAM SCIENTIST
MISSION SCIENTIST
PRINCIPAL INVESTIGATORS:
Shuttle Imaging Radar (SIR-A)
Shuttle Multispectral InfraredRadiometer (SMIRR)
Ocean Color Experiment (OCE)
Measurement of Air Pollution fromSatellites (MAPS)
Feature Identification and Loca-tion Experiment (FILE)
Night/Day Optical Survey ofLightning (NOSL)
Heflex Bioengineering Test (HBT)
Dr. James V. TaranikOffice of Space and Terrestrial ApplicationsNASA HeadquartersWashington, D.C.
Dr. Andrew PotterSpace and Life Sciences DirectorateJohnson Space CenterHouston, Texas
Dr. Charles ElachiJet Propulsion LaboratoryPasadena, California
Dr. Alexander GoetzJet Propulsion LaboratoryPasadena, California
Hongsuk H. KimGoddard Space Flight CenterGreenbelt, Maryland
Dr. Henry Reichle, Jr.Langley Research CenterHampton, Virginia
Roger SchappellMartin-Marietta AerospaceDenver, Colorado
Dr. -Bernard VonnegutState Univ. of New YorkAlbany, New York
Dr. Allan BrownUniv. of PennsylvaniaPhiladelphia, Pennsylvania
1-5
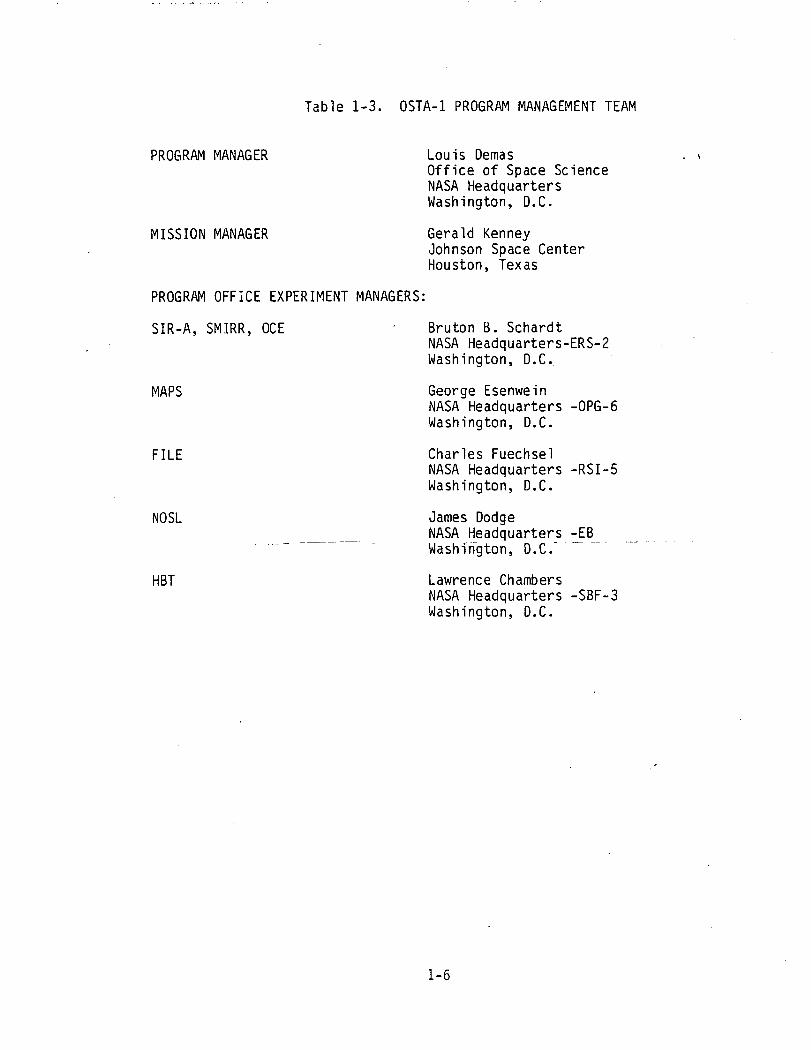
Table 1-3. OSTA-1 PROGRAM MANAGEMENT TEAM
PROGRAM MANAGER Louis DemasOffice of Space ScienceNASA HeadquartersWashington, D.C.
MISSION MANAGER Gerald KenneyJohnson Space CenterHouston, Texas
PROGRAM OFFICE EXPERIMENT MANAGERS:
SIR-A, SMIRR, OCE ' Bruton B. SchardtNASA Headquarters-ERS-2Washington, D.C.
MAPS George EsenweinNASA Headquarters -OPG-6Washington, D.C.
FILE Charles FuechselNASA Headquarters -RSI-5Washington, D.C.
NOSL James DodgeNASA Headquarters -EBWashington, D.C."
HBT Lawrence ChambersNASA Headquarters -SBF-3Washington, D.C.
1-6
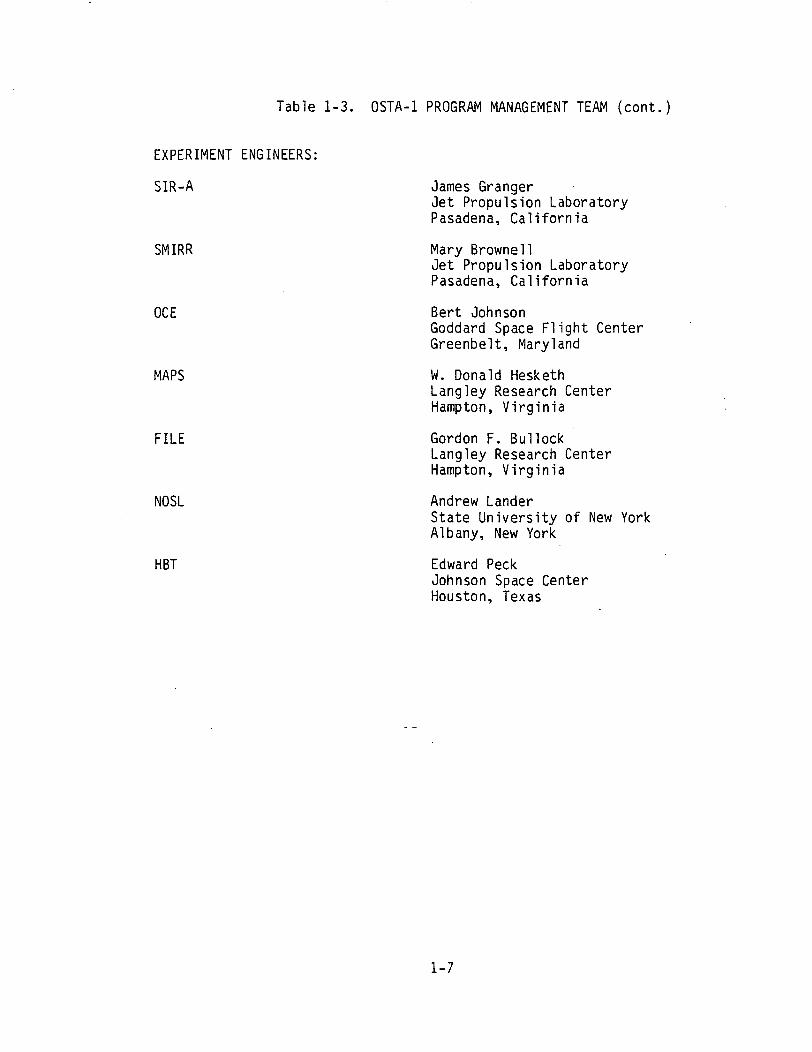
Table 1-3. OSTA-1 PROGRAM MANAGEMENT TEAM (cont.)
EXPERIMENT ENGINEERS:
SIR-A
SMIRR
OCE
MAPS
FILE
NOSL
HBT
Oames GrangerJet Propulsion LaboratoryPasadena, California
Mary Browne11Jet Propulsion LaboratoryPasadena, California
Bert JohnsonGoddard Space Flight CenterGreenbelt, Maryland
W. Donald HeskethLangley Research CenterHampton, Virginia
Gordon F. BullockLangley Research CenterHampton, Virginia
Andrew LanderState University of New YorkAlbany, New York
Edward PeckJohnson Space CenterHouston, Texas
1-7

The Shuttle Multispectral Infrared Radiometer (SMIRR) experiment is com-plementary to the SIR-A experiment because both are concerned with geo-logic mapping from orbital data. The microwave data provided by SIR-A canbe used to delineate geological structures, such as faults. The infrareddata provided by SMIRR can be used to identify rock types. But SMIRR isnot an imaging system, as is SIR-A (and Landsat); its purpose is to findthe best spectral bands in which to gather remotely sensed data todistinguish between rock types. Ground-gathered data indicate thatsignificant information can be extracted from infrared spectra fordistinguishing rock types. The bands determined by SMIRR could then beincluded in future spaceborne imaging systems for the purpose of mappingrock types. The SMIRR experiment will be conducted by PrincipalInvestigator -Alexander F. H. Goetz of the OPL and by Co-InvestigatorLawrence C. Rowan of the US Geological Survey at Reston, Virginia. TheChief Engineer for SMIRR is Mary Brownell of JPL.
The Feature Identification and Location Experiment (FILE) is intended totest Earth feature classification techniques that could, in the future,help such direct sensors as SIR-A and SMIRR find the scenes from which dataare to be taken. The enormous quantities of data collected by the threeLandsats that have orbited the Earth and the even more mammoth quantitiesexpected from advanced systems demand onboard signal processing to selectuseful data. FILE technology addresses this type of data management.Using the ratio between visual red reflectance and near-infraredreflectance, it will categorize scenes as vegetation, bare ground, water,and clouds/snow/ice. And it will suppress further data acquisition incertain categories after it has acquired a given number of classifiedscenes. The FILE experiment will be conducted by Principal InvestigatorRoger T. Schappell of Martin Marietta (MMA) and by Co-Investigators JohnC. Tietz (MMA), and W. Eugene Sivertson and R. Gale Wilson (LaRC). GordonF. Bullock (LaRC) is the Experiment Project Manager.
The Measurement of Air Pollution from Satellites (MAPS) experiment willmeasure the distribution of carbon monoxide in the troposphere (from 12 to18 km above the Earth's surface). The performance of the MAPS instrumentunder various temperatures and other orbital conditions will indicate the

utility of orbiting sensors for measurement of environmental quality. The
MAPS experiment will be conducted by Principal Investigator Henry G.
Reichle, Or., of NASA's LaRC and by Co-Investigators W i l l i a m L. Chameides
(Georgia Institute of Technology), W. Donald Hesketh (LaRC), Claus B.Ludwig (Photon Research, Inc.), Reginald E. Newell (MIT), Leonard K.Peters (U. of Kentucky) Wolfgang Seiler (Germany), John W. Swinnerton
(NRL), H. Andrew Wallio (LaRC), and Sherwin Beck (LaRC).
The Ocean Color Experiment (OCE) will scan the ocean to detect areas where
a high concentration of chlorophyll-bearing algae shifts the pure blue ofocean water to greenish. Information on the distribution of algae can helplocate fish schools or track ocean currents using the chlorophyll pigmentas tracers. Considerable experimental effort wil.l be spent eliminatingthe effects of surface reflections and atmospheric scatterings thatobscure the detection of ocean coloration. The OCE will be conducted byPrincipal Investigator Hongsuk H. Kim of Goddard Space Flight Center
(GSFC) and by Co-Investigators Lamdin R. Blaine (GSFC), Robert S. Fraser(GSFC), Norden E. Huang (WFC) and Heinz Van der Piepen (Germany). The
Chief Engineer for OCE is Bert Johnson of GSFC.
The Night/Day Optical Survey of Lightning (NOSL) will involve the crew in
taking the first motion pictures and photocell readings of lightning andthunderstorms from orbit. Data obtained from this unique vantage pointwill be analyzed in the hope of developing techniques for identifying
severe weather situations from meteorological satellites. The NOSL willbe conducted by Principal Investigator Bernard Vonnegut of the State
University of New York at Albany and by Co-Investigators Otha H. Vaughan,Jr. (MSFC) and Marx Brook of the New Mexico Institute of Mining and Tech-
nology.
The Heflex Bioengineering Test (KBT) is a preliminary step in leading to a
plant physiology experiment scheduled for Spacelab 1. The HBT hardwareconsists of a container of planted pots with varying soil moisture levels.
The technical objective of the Heflex Bioengineering Test is to determinethe relationship between initial soil moisture content and final plantheight after growth in a microgravity environment. The results will helpdetermine the optimal soil moisture conditions for the Spacelab
1-9

experiment. The HBT will be conducted by Principal Investigator Allan H.Brown of the University of Pennsylvania and his colleagues.
1-10

SECTION 2. BACKGROUND

SECTION 2. BACKGROUND
In this section, for each experiment, the goals or objectives of theexperiment are given, along with the criteria against which the overallperformance of the experiment will be assessed. The experiment goals aresummarized in Table 2.0-1.
2.1 EXPERIMENT OBJECTIVES AND MINIMUM EXPERIMENT PERFORMANCE
2.1.1 SIR-A
The objectives of the Shuttle Imaging Radar-A (SIR-A) experiment are toevaluate the potential of spaceborne imaging radar in geologic mapping andto determine the synergism of using radar imaging in conjection withLandsat imagery for Earth resources observations.
The minimum experiment performance for the SIR-A experiment is:
1) Transmitted peak power in excess of 300 watts.
2) a median signal to noise ratio of 10 dB. This will be verified bythe engineering data which provide the average of the echo powerand the receiver noise power.
3) Two hours of data acquisition time. This corresponds to a totalfi ?coverage of 2.5 x 10 km .
2.1.2 SMIRR
The Shuttle Multispectral Infrared Radiometer was proposed to meet thefollowing objectives:
1. Obtain radiometric reflectance measurements in 10 wavelengthchannels between 0.5 and 2.5 ym of selected portions of theEarth's surface.
2. Assess the value of very narrow spectral channels (0.02 urn) formineralogic and lithologic identification from orbit.
2-1

Table 2.0-1. OSTA-1 Experiment Potential Applications
EXPERIMENT
SIR-A
SMIRR
FILE
MAPS
OCE
NOSL
HBT
POTENTIAL APPLICATION
Analysis of Topography and Morphology forGeologic Investigations
Improved Rock Type Classification
Vegetation, Bare Ground, Water, and Clouds/Snow/Ice Categorization
Carbon Monoxide Measurements in the Tropo-sphere (up to 18 km Above the Earth's Sur-face)
Oceanic Chlorophyll Mapping
Lightning and Thunderstorm Investigation
Effect of Zero-G on Soil Moisture and PlantGrowth
2-2

3. Assess the value of the 10 chosen wavelength channels for use infuture imaging systems for geologic mapping.
4. Assess the variability of reflectance signatures of major rocktypes from portions of the earth as affected by environmentalconditions.
5. Determine the correlation between ground-based reflectancemeasurements and SMIRR orbital measurements.
The minimum experiment performance for SMIRR is defined as follows:
1. One camera operational during data takes2. Cover open for data takes3. Detector at temperature4. Detector within 20% of sensitivity measured in June 19815. Bit error rate less than 10 as measured on the CCT's6. One hour of cloud-free data acquisition
2.1.3 FILE
NASA has a goal of providing a 1000-fold increase in the ability to obtainuseful data from space without increasing the cost of obtaining the data.The FILE experiment represents one step in a technology-development effortdirected toward providing improved data selectivity (at sensor stage) inspace, and therefore, the ability to obtain a given amount of useful datawhile reducing the volume of associated data handling and management.Early emphasis is on techniques for Earth terrain classification. Thetechnology development effort of which FILE is a part at the same timeaddresses the NASA goal of making useful space data available more quicklyto the data users, and in real time when timeliness is essential.
The specific objective of FILE is to test a technique for autonomouslyclassifying Earth's features into four categories: water, vegetation, bareland, and clouds/snow/ice. Autonomous (on-board) feature classificationis recognized as a logical first step toward improving data management formany Earth observation space missions. Autonomous feature classificationprovides the basis for further remote sensing advancements, including the
2-3

acquisition, or reacquisition, of given landmarks (features), boundary orfeature tracking, and navigation via landmark recognition.
The instrument has been designed to perform the following functions duringthe mission:
o Record two-channel digital image data,o Record 70-mm photographic imageso Record real-time feature pixel count,o Record high or low cloud reference,o Record GMT for images.
2.1.4 MAPS
The MAPS experiment will measure the distribution of carbon monoxide (CO)in the middle and upper troposphere. (The troposphere extends from theEarth's surface to the stratosphere, i.e., to an altitude varying from 12to 18 km.) The major technical objective of the experiment is to evaluatethe performance of the MAPS instrument in actual operation under varioustemperatures and other environmental conditions encountered during spaceflight. The measurements of the CO concentrations will be used to deter-mine the interhemispheric mass transport of the gas and to verify two-andthree-dimensional chemical transport models. Furthermore, the experimentwill allow the MAPS sensor to be evaluated as a possible long term monitorof changes in the tropospheric CO distribution and the evaluation of tech-niques and procedures for the accumulation, classification, and analysisof global data.
The MAPS experiment will be -considered 100 percent successful if highquality CO measurements are obtained in 50 percent of the 288 10° latitudeby 10° longitude areas that underlie the orbital track. A high quality COmeasurement is one of 20 seconds duration made through an air column freeof mid- and high- altitude clouds and having a signal-to-noise ratio of 20or greater.
2-4
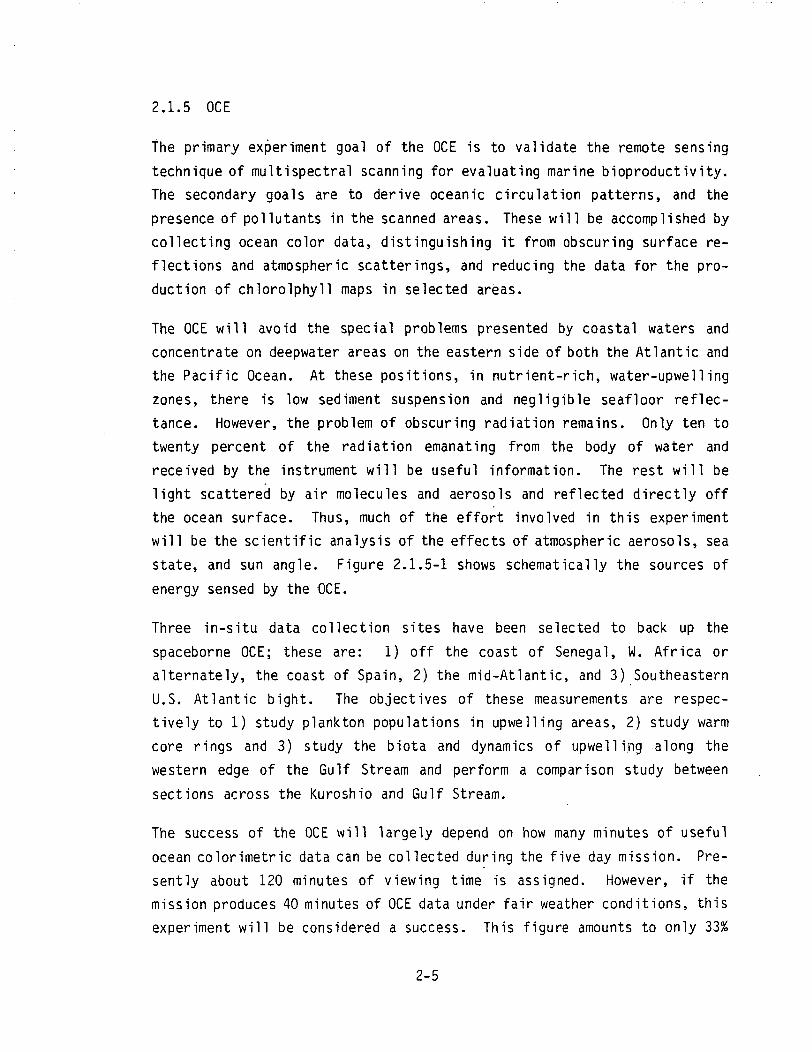
2.1.5 OCE
The primary experiment goal of the OCE is to validate the remote sensing
technique of multispectral scanning for evaluating marine bioproductivity.The secondary goals are to derive oceanic circulation patterns, and thepresence of pollutants in the scanned areas. These will be accomplished bycollecting ocean color data, distinguishing it from obscuring surface re-flections and atmospheric scatterings, and reducing the data for the pro-duction of chlorolphyll maps in selected areas.
The OCE will avoid the special problems presented by coastal waters andconcentrate on deepwater areas on the eastern side of both the Atlantic andthe Pacific Ocean. At these positions, in nutrient-rich, water-upwelling
zones, there is low sediment suspension and negligible seafloor reflec-tance. However, the problem of obscuring radiation remains. Only ten totwenty percent of the radiation emanating from the body of water andreceived by the instrument will be useful information. The rest will be
light scattered by air molecules and aerosols and reflected directly offthe ocean surface. Thus, much of the effort involved in this experimentwill be the scientific analysis of the effects of atmo-spheric aerosols, seastate, and sun angle. Figure 2.1.5-1 shows schematically the sources of
energy sensed by the OCE.
Three in-situ data collection sites have been selected to back up the
spaceborne OCE; these are: 1) off the coast of Senegal, W. Africa oralternately, the coast of Spain, 2) the mid-Atlantic, and 3) SoutheasternU.S. Atlantic bight. The objectives of these measurements are respec-tively to 1) study plankton populations in upwelling areas, 2) study warmcore rings and 3) study the biota and dynamics of upwelling along thewestern edge of the Gulf Stream and perform a comparison study between
sections across the Kuroshio and Gulf Stream.
The success of the OCE will largely depend on how many minutes of useful
ocean colorimetric data can be collected during the five day mission. Pre-sently about 120 minutes of viewing time is assigned. However, if themission produces 40 minutes of OCE data under fair weather conditions, thisexperiment will be considered a success. This figure amounts to only 33%
2-5

Ocean colorsensor
7A SPACE
Light from beneath the sea plusreflected sun and skylight andatmospheric path radiance
oooDi t sun|iqhtuirect sum g i
ooUpwelling lightfrom beneaththe sea and reflectedsun and skylightfrom the surface
ATMOSPHERE
Direct but attenuatedsunlight
oUpwelling lightafter absorptionand scattering
Skylight 1 1 1 1 1 WATER
Sunlit
Figure 2.1.5-1. Energy Sensed by the OCE Instrument
2-6

of the original goal, but the percentage is not unreasonable when one con-siders the fact that in ocean data collection, the probability of havingfair weather over a predetermined target site on a given day is rathersmall.
Another aspect to be considered is the quality of the OCE data. OCE data-taking is strategically planned so that the data can be useful not only formesoscale case studies but also for future colorimetric data processingalgorithms study. OCE has a total of eight predetermined test sites.Repetitive coverage of each test site is planned so that at least one setof OCE data will be acquired for each test site. However, successfulrepetitive coverage of a site means that the particular data set can beused for studies relating to the flow dynamics of the area in a time seriesmanner.
The next criterion to be considered is how useful the acquired data are forstudies relating to the atmospheric effects and chlorophyll analysis. Forthis purpose, it is desireable that the data from the Orbiter containseveral different values of atmospheric aerosol values ranging from anaerosol optical thickness, TM- , of zero (Rayleigh sky) to a TM. of 0.2,and a variety of chlorophyll values ranging from near zero to several
. 3mg/m .
In summary the success of the OCE Mission will be considered accordingto the following criteria:
Criteria Levels to Meet the Success Criteria
a. Frequency of successful 33% of original data plan completeddata gathering events
b. Case studies involving One set of data for each siteeach test site
c. OCE data for algorithms The total data includes:
va ida ion ^ Atmospheric aerosol parameters
fromTMie = 0 to 0.2b) Chlorophyll concentrations fromzero to 5.0 mg/m
2-7

2.1.6 NOSL
The objective of the Night/Day Optical Survey of Lightning (NOSL) is toobtain motion picture film and correlated photocell sensor signals oflightning storms. The information obtained will not only shed new light onelectrical charging processes in thunderstorms, but will lead to thedevelopment of the Night/Day spaceborne lightning detection system.
NOSL will use a motion picture camera to obtain films of ordinary andsevere thunderstorms, which will provide information on storm dynamics andelectrical phenomena. In addition to film records of the appearance ofcloud systems and lightning, the detailed structure of the lightning dis-charges will be recorded by a photocell optical system, which also gener-ates an audible pulse tone in response to the detection of a lightningflash. While the motion picture camera will not be able to photographlightning during the day, the photocell optical system will be capable ofdetecting and providing data on lightning in daylight, even from cloudsilluminated by direct sunlight. The photocell optical system data will berecorded on magnetic tape.
A lightning event which appears visually as only one flash is usually com-posed of many separate discharges, called strokes, that can be detected bythe photocell. In this way, the frequency of the lightning and its charac-teristics during day or night can be correlated with the cloud structureand the convective circulation in the storm. The adaptation of thesetechniques may prove to be useful for identifying severe weather situa-tions from meteorological satellites. The following are features of thun-derstorm activity that will be of particular interest:
a. Long Lightning Discharges. There are a few reports in scientificliterature describing both visual and radar observations oflightning discharges of unusual length, sometimes as long as 150kilometers. Photographs of such discharges would be of consider-able scientific value.
b. Unusual Lightning in Tornado-Producing Storms. Airline pilotsflying in the central U.S. have stated that they often can
2-8
identify tornado-producing storms by the very unusual lightningphenomena they produce. Although no photographs of this activityhave apparently been taken, the descriptions indicate unusuallyfrequent lightning and sometimes lightning of various colors.Photography of this unusual lightning activity would be avaluable contribution to our understanding of tornado-producingstorms.
c. Electrical Discharges in the Clear Air Above Thunderstorms.Observations of thunderstorms, particularly of the more intensevariety, sometimes include descriptions of electrical dischargesunusual in that they are occurring not beneath or within thunder-clouds, but in the clear air above them. Such descriptionsinclude not only what are apparently normal lightning discharges(except for the fact that they extend upwards into the clear airof the stratosphere above the cloud), but also luminous pillarsof light and glowing fireballs. At present there are no photo-graphs of this phenomenon, and it would be of great value ifpictures could be obtained from the Space Shuttle.
d. Changes in the Reflection of Sunlight from the Upper Part of aThundercloud as a Result of Electrical Reorientation of IceCrystals. There have been a few observations made from the groundand from high altitude aircraft above thunderclouds, showing thatthe intensity of the sunlight reflected from the upper part of thecloud can suddenly increase or decrease following a lightningevent. This effect is probably produced by electrically inducedreorientation of ice crystals and would occur when the directionor intensity of the electric field changes as the result oflightning.
e. Cloud Circulation. Despite the brief time that strongly convec-tive cumulonimbus clouds will be in the field-of-view of theobserver, it may be possible to recognize interesting cloudmotions. Observers should make note if they recognize regions ofconvergence and divergence in thunderstorm cloud areas andperhaps regions of strong rotation. If these can be documented by
2-9

the camera, it will be of considerable value to students of stormand cloud dynamics.
There are separate criteria for the success of the instrument, the mission,and the proposed experiment. For the operation of the instrument to beconsidered a success, the camera must expose the film properly, thelightning flash detector must operate unambiguously, the two-channel taperecorder must record both sensor "clicks" and voice records, and astronautnotes must allow location of the photographed events.
For the mission to be a success, the astronauts would have to photographand record lightning sources on at least two overpasses (30 sec) by day andtwo overpasses by night for each of the following phenomena: isolatedthunderstorms, frontal or cluster storms, hurricanes/typhoons, the Inter-tropical Convergence Zone, and organized convection over Florida, SouthAfrica, and Indonesia. Certain unscheduleable observations would make thedata scientifically highly interesting and valuable. These include chanceobservations of long discharges, convective storms, stratosphericdischarges, and lightning associated with volcanic eruptions.
For the total experiment to be an unqualified success, subsequent missionsshould be used to observe intense spring season thunderstorms in the U.S.Midwest, peak season South African thunderstorms, "inverted" warm-cloudthunderstorms in winter over the Sea of Japan, and to collect adequateobservations for statistically significant studies of hurricane/typhoonlightning occurrences, stratospheric lightning and long connected dis-charges.
The success levels for NOSL data collection are given as follows:
Success Level Data Collection
65% Obtain nighttime lightning photographic data
75% Also obtain nighttime photocell data fromlightning
85% Also obtain daytime convection stormphotography
95% Also obtain daytime photocell data fromlightning
2-10

2.1.7 HBT
The Heflex Bioengineering Test (HBT), unlike the other components of theOSTA-i payload, is a preliminary test that supports a subsequent experi-ment called Heflex (Helianthus Annuus Flight Experiment) which will beflown on the planned Spacelab-1 mission.
The objective of the HBT is to determine the proper soil moisture contentfor maximum growth in the microgravity environment of Earth's orbit.
2.2 HISTORY OF EXPERIMENTS
2.2.1 SIR-A
Airborne radar imaging systems have been used for large-scale mapping,particularly in equatorial regions with extensive cloud cover, for manyyears. It also has been recognized for some time that airborne imagingradars can provide useful ocean wave information, although the exactmechanism by which microwave radar energy is backscattered and modulatedto produce ocean wave imagery is still not well understood.
In June 1978, the Seasat-A which carried the first Spaceborne imaging radarsystem, Synthetic Aperture Radar (SAR), was put into orbit. The Seasat-ASAR was designed to provide 25-m spatial resolution images over a 100-kmswath width. The Seasat-A SAR operated at a frequency of 1.37 GHz (23 cm).In this spectral region, the backscatter energy is dependent primarily onthe surface physical properties (slope and roughness) and on the complexdielectric constant, which is dependent on surface rock type, moisture,vegetation cover, and near-surface inhomogeneities. The Seasat-A SAR hasprovided large-scale radar images of land and ocean surfaces for the firsttime. A preliminary analysis of the data indicates that spaceborne imagingradar will improve our capability to assess earth resources and monitor theocean surface. It is expected that evaluation of the data from the radarsensor will add new types of information that will complement thegeological information presently being collected by optical and infraredsensors and by other conventional mapping techniques. Much more work isneeded to understand the geophysical information in the radar signature ofdifferent surfaces and to determine the optimum sensor characteristics for
2-11

specific applications. The Shuttle Imaging Radar-A (SIR-A) which isscheduled to be flown on the STS-2 is going to address a portion of thisresearch goal.
2.2.2 SMIRR
With the advent of Landsat in 1972 multispectral images have become theprimary tool in geologic remote sensing. Research into the use of spectro-scopic methods carried out over the last 10 years has shown that the use ofnarrow spectral bands in the region beyond 1 m can lead to discriminationof important mineralogic constituents of surface materials as opposed tomere discrimination of materials with the use of shorter wavelengthinformation derived from analysis of Landsat data. The U.S GeologicalSurvey has indicated that it may be possible to identify specific clayminerals with narrow-band (0.02 ym) measurements in the 2.2ym portion ofthe spectrum. If different clay mineral species can be discriminated usingremote sensing techniques, then it may be possible to categorize differenttypes of mineral deposits. Also, different feldspar minerals in unalteredrocks may weather so that different clay minerals are produced which mayallow rocks to be better discriminated. To test these concepts, scientistsfrom the JPL and US Geological Survey designed a ten-channel multispectralinfrared radio, meter to test the value of both broad and narrow spectralbands beyond 1.0 ji-.m for the identification of geologic materials fromorbit. Future imaging systems should incorporate such narrow spectralchannels if the SMIRR results are positive.
2.2.3 FILE
Remote sensing as a science must account for many variables, some of whichare not yet well understood and have not been completely modeled. The
observed (by remote sensor) radiance from an Earth feature is a function ofthe feature's reflectance, the incident illumination level and angle, the
radiance and absorption of th'e atmosphere, and the sensor spectral
responses. In addition, the spectral data (feature) classificationaccuracy ultimately depends upon the classification algorithm chosen.
2-12

Earth remote sensing activities of the past have been largely based oncollection of data from aircraft and spacecraft over areas of the Earththat contain information of interest, processing of the data in groundfacilities, separation of the data of interest from the total collecteddata, and distribution of the data to the interested users. The time lapsefrom data sensing to delivery to the user has usually been undesirablylong—weeks or months. For some important applications of remotely senseddata, real-time or near-real-time availability of the data is required.Present methods are not only inefficient in terms of waiting time for theuser, but also in terms of the volume of discarded data, i.e., data of nointerest to the users, such as partially or totally cloud-covered imagery.
The FILE is an experiment designed to test a s.imple method for doing in-orbit autonomous feature identification and classification, which couldprovide a tool for greatly improving the efficiency and usefulness offuture remote sensing, pointing, tracking, and navigation systems. FILEis based on the principle of spectral radiance (reflectance) ratioing,which has been well developed in ground processing as a useful method ofextracting information from spectral data.
2.2.4 MAPS
In 1974, the global distribution of tropospheric CO was summarized usingdata taken by a number of research groups over a period of several years.The data were obtained at the Earth's surface using ships and at a fewaltitudes using aircraft platforms. The results indicated that the CO con-centration was generally higher in the northern hemisphere than in thesouthern hemisphere. It was noted that the maritime data was averaged overall seasons and longitudes and did not necessarily represent the continen-tal 'distribution. The distribution of CO in marine air in the troposphereis given in Figure 2.2.4-1. The thick lines represent the tropopause andthe trade wind inversion.
The current MAPS instrument is a space-qualified version of the brassboardsystem developed for the Nimbus-G program but fabricated as an aircrafttest instrument. The instrument from the Nimbus program was used in acontinuing flight test program to investigate the utility of
2-13

O)s_
OQ.Os-
o;
s_•r—(O
OJ
•t—s-«
c.O
=3.0
s- «a-(/) CTi
•i— i—I-o
»<— s.IW d)S- .—OJ -I-C (U
CSJ
CM
OJ
3
CO
' 3aninnv
2-14

aircraft-borne remote sensors for defining urban and regional airpollution problems. The proposed MAPS experiment represents the next stepin the logical development of the CO measurement program.
The current gas filter correlation instrument represents a further evolu-tion of a laboratory type nondispersive infrared analyzer, a selectivechopper radiometer, a family of gas filter instruments developed underNASA sponsorship, and an instrument developed by the Canadian company,Barringer Research, Inc.
2.2.5 OCE
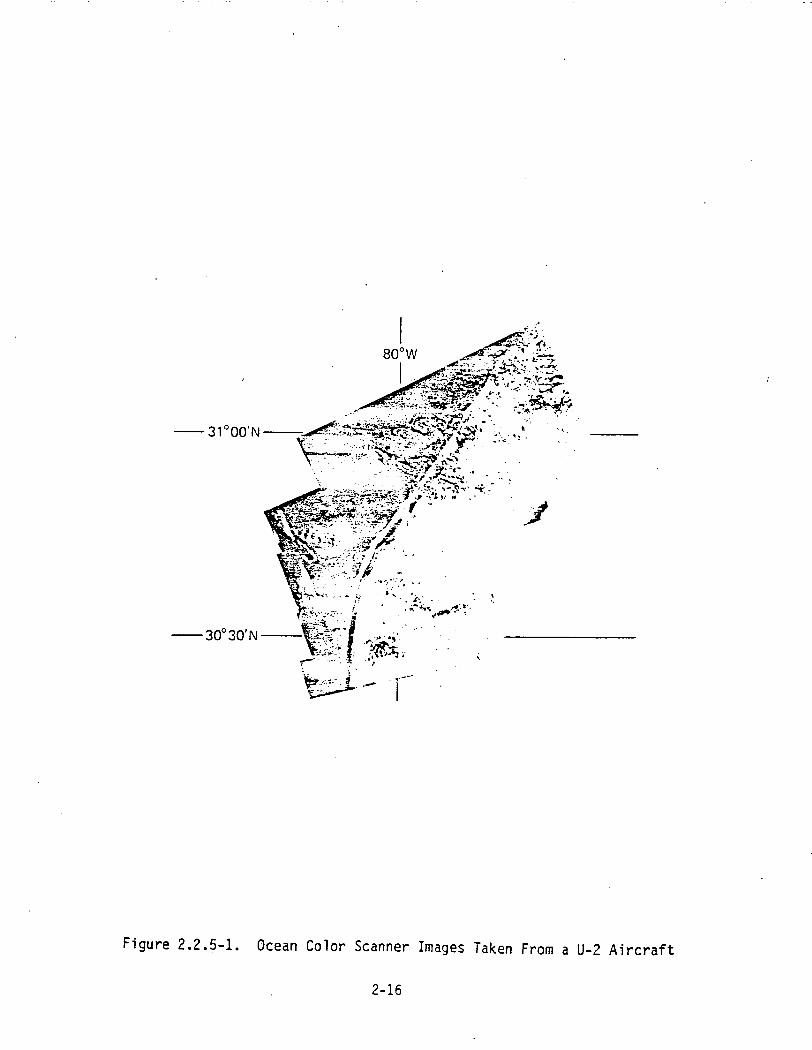
NASA has built several different ocean color sensors; for example, theDifferential Radiometer, the Multispectral Ocean Color Sensor, and the U-2aircraft-borne Ocean Color Scanner (OCS). These have been tested on air-craft flying at both high and low altitudes. A prototype U-2/OCS wasdesigned and built at Goddard in 1974. Subsequently two more units werebuilt in 1976. The OCE is a modified version of this instrument. ManyU-2/OCS flights have been made over inland bays and near-shore waters. AnOcean Color Scanner image taken from a U-2 aircraft 120 n.mi. due east ofJacksonville, Florida, in April, 1980 is shown in Figure 2.2.5-1. Thelight-colored area on the right side of the computer-processed montage isthe warm Gulf Stream. (The speckles are clouds.) On the left is the coldershelf water, which shows up darker because of its high chlorophyll content.The dark filament along the western edge of the Gulf Stream is an upwellingof nutrient-rich (chlorophyll content 1.5 to 2.0 mg/m ) water from a deeperlayer. Such an upwelling, seen here at a very early stage, can developinto a large meander or eddy. Thus, chlorophyll contour images can be usednot only to locate high bioproductivity areas in the ocean but also totrace the dynamics of ocean flow.
Currently, a Coastal Zone Color Scanner (CZCS), a variation of the OCS, isbeing flown on the Nimbus-7 satellite, launched on August 12, 1978. Theprimary objective of CZCS is to interpret coastal phenomena on the basis ofocean color information.
2-15
•31°00'N
•30°30'N
**X&**'.*Sse:?& . •• , - t V•'" ' ' '' ££i''H&f*) '' "• ' ' "'!f »w & f.:. '• »'• • .....s^., -,x.,..
Figure 2.2.5-1. Ocean Color Scanner Images Taken From a U-2 Aircraft
2-16

2.2.6 NOSL
Various methods for the detection and recording of lightning strokes havebeen used by scientists and researchers for many years. The instrumentsused differ widely according to their function, depending on the particu-lar features of the lightning that are to be studied.
A portable directional lightning recorder was designed for studying indi-vidual return strokes by detecting the luminosity of the lightning chan-nel. This principle has been used by other researchers, such as: Brookand Kitagawa (1960), who used a photo-multiplier in conjunction with anelectric-field change meter; Krider (1966), using a photodiode at thedetector; and Clegg (1971), who used a photocell with associated elec-tronics packages to process the signal. Griffiths and Vonnegut (1975),simplified Clegg1s instrument and designed a simple apparatus which con-sists of a photocell and a tape recorder for detecting and recordingcharacteristics of lightning. A modified cine-sound camera proposed byVonnegut and Passarelli (1978) can be used not only to photograph thunder-storms but simultaneously to record optical characteristics of lightningevents occurring within them. Simultaneous observations of lightningradiations from above and below clouds were studied by Vonnegut and Vaughan(1980). Data was obtained from U-2 overflight during the summer of 1979.
Experience gained from the Gemini, Apollo, Skylab, and Apollo-Soyuz mis-sions indicates that an orbiting platform several hundred kilometers abovethe Earth affords a view of thunderstorms and lightning that cannot beequaled on the ground or from aircraft. Therefore, it is believed that theorbital flights of the'Space Shuttle offer a unique opportunity for obtain-ing new data on the fine scale circulation of thunderstorms and the elec-trification processes as induced by lightning. This effort would providenew, invaluable insights into the dynamics of thunderstorms and severe
weather.
2.2.7 HBT
Previous experiments by the Russians during the Salyut-4 mission have beenreported to indicate that the lack of gravity has two prominent effects on
2-17

the growth of plants. First, the water around the roots is redistributed,thereby affecting absorption. Second, the capillary action of the plantroots is enhanced because of the lack of a counteracting g-force. The neteffect of these two phenomena, according to the reports, is that plantsabsorb water more efficiently under microgravity than under normal gravityconditions. Thus, in the microgravity environment of Earth orbit, plantsmay require less water in their soil for maximum growth.
2-18

SECTION 3. EXPERIMENT DESCRIPTIONS
SECTION 3. EXPERIMENT DESCRIPTIONS
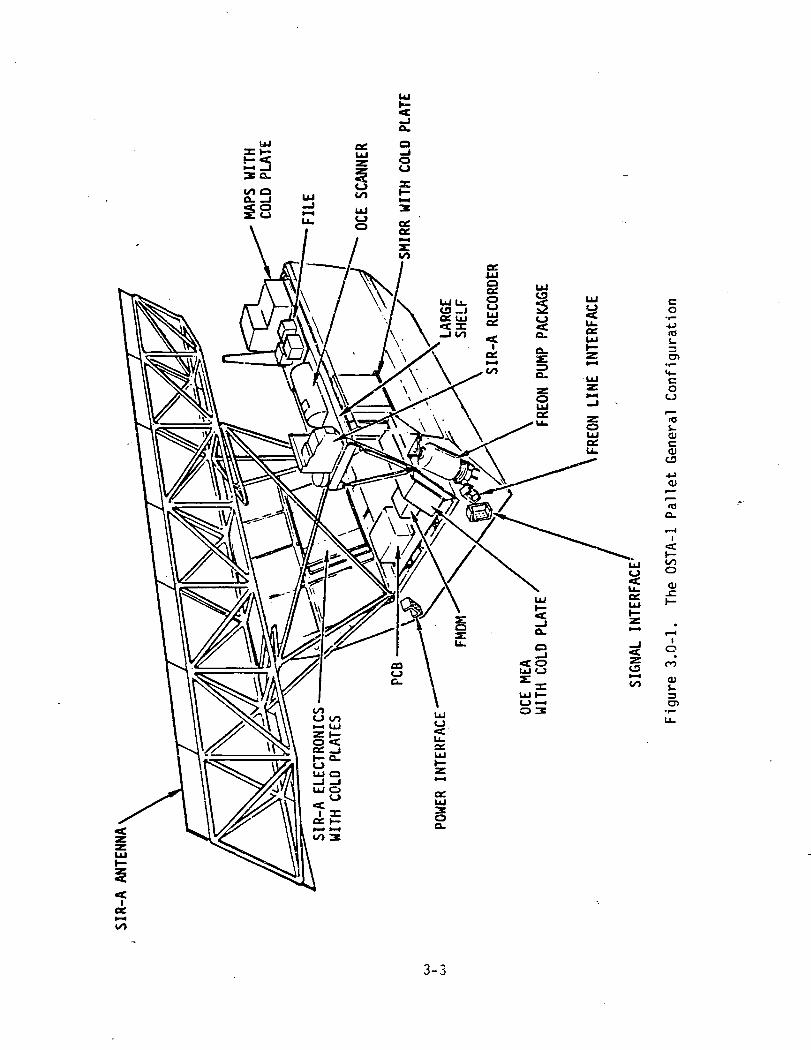
A general description of the equipment and the operation of each experimentis presented in this section, along with salient instrument characteris-tics, calibration required, and accuracies. A summary table of character-istics of all the instruments is given in Table 3.0-1. The location of theexperiments on the OSTA-1 pallet is shown in Figure 3.0-1 except for NOSLand HBT which are located in the Orbiter cabin.
3.1 SIR-A
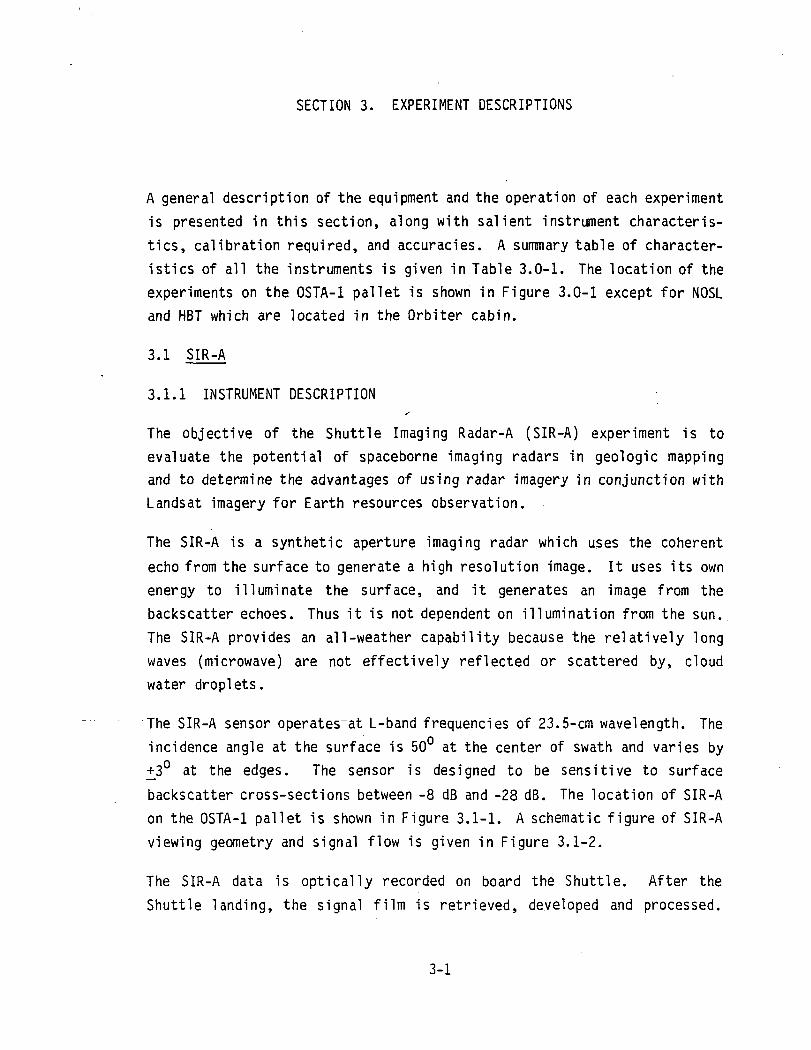
3.1.1 INSTRUMENT DESCRIPTIONy
The objective of the Shuttle Imaging Radar-A (SIR-A) experiment is to
evaluate the potential of spaceborne imaging radars in geologic mappingand to determine the advantages of using radar imagery in conjunction with
Landsat imagery for Earth resources observation.
The SIR-A is a synthetic aperture imaging radar which uses the coherent
echo from the surface to generate a high resolution image. It uses its own
energy to illuminate the surface, and it generates an image from the
backscatter echoes. Thus it is not dependent on illumination from the sun.
The SIR-A provides an all-weather capability because the relatively long
waves (microwave) are not effectively reflected or scattered by, cloudwater droplets.
The SIR-A sensor operates~at L-band frequencies of 23.5-cm wavelength. The
incidence angle at the surface is 50° at the center of swath and varies by
+3° at the edges. The sensor is designed to be sensitive to surface
backscatter cross-sections between -8 dB and -28 dB. The location of SIR-A
on the OSTA-1 pallet is shown in Figure 3.1-1. A schematic figure of SIR-A
viewing geometry and signal flow is given in Figure 3.1-2.
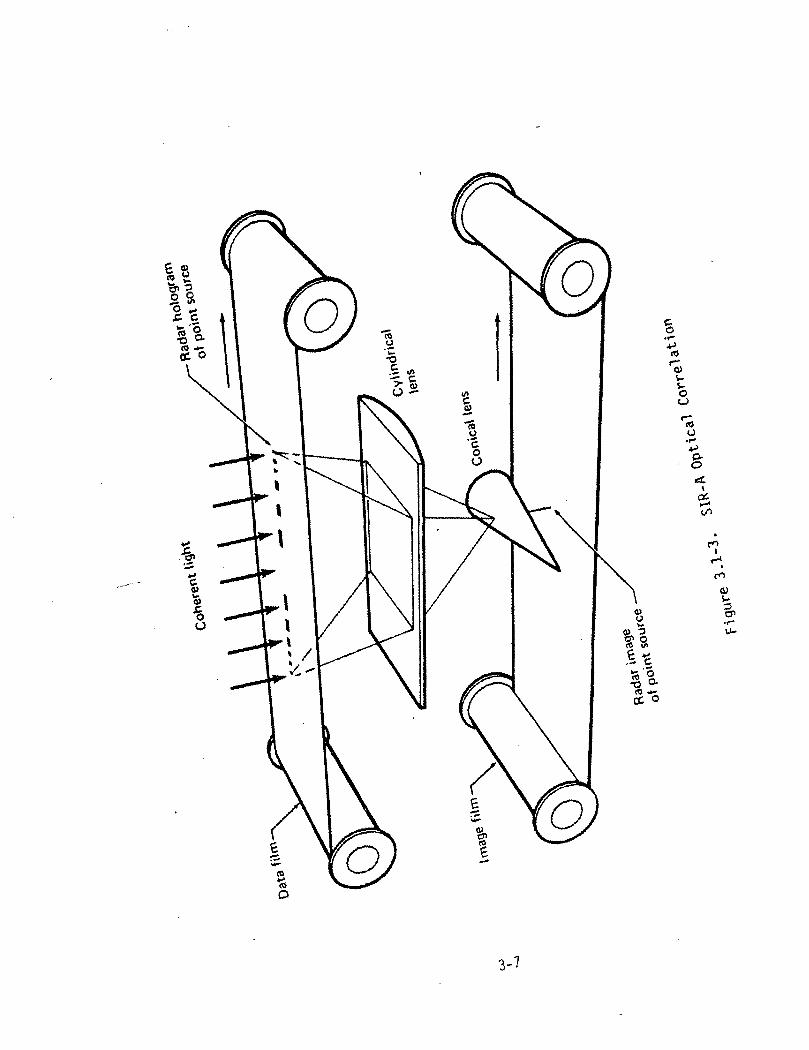
The SIR-A data is optically recorded on board the Shuttle. After the
Shuttle landing, the signal film is retrieved, developed and processed.
3-1

Table 3.0-1 OSTA-1 Instrument Characteristics
Experiment
SIR-A
SMIRR
FILE
MAPS
OCE
NOSL
Characteristics
Spatial ResolutionSwath WidthTotal Surface CoverageData Acquisition Time
Radiometer Spatial ResolutionCamera Field of ViewData Acquisition TimeSpectral Resolution
Spatial ResolutionField of ViewSpectral ResolutionTotal Surface CoverageData Acquisition Time
Spatial ResolutionField of ViewGlobal CoverageData Acquisition TimeSpectral Resolution
Spatial ResolutionSwath WidthTotal Surface CoverageData Acquisition Time
Spectral Resolution
Camera Spatial ResolutionDetector Spatial ResolutionCamera Field of View
Detector Field of View
38 m50.2 km10 x 106 km2
8 hours
100 m18 x 23 km6 hours0.06 to 0.1 m half band-width (10 channels)
1.02 km x 0.75 km102 km x 75 km20 nm5.2 x 107 km2
80-96 hours
19 km19 km3.75 x 107 km2
80-96 hours
0.05 cm
1-1.7 km511 km2.6 X 107 km2
2 hours
23 nm full bandwidthat half maximum
100 ft15 nautical miles32° x 24° at 17 mm focallength6° X 4.5° at 85 mm focallength
6° X 6°
3-2
co
s-3o>
co
(8s-OJcOJtfl
o.r—I
1
O
OJ
IO
<D
3
3-3

Figure 3.1-1. SIR-A Instrument Location
3-4

Cathode raytube display
Figure 3.1-2. SIR-A Geometry and Signal Flow Diagram
3-5

Then it is converted to an image using an optical correlator. This corre-
lation process is shown schematically in Figure 3.1-3.
3.1.2 INSTRUMENT CHARACTERISTICS
A summary of the SIR-A planned and expected characteristics is given in
Table 3.1-1.
Table 3.1-1. SIR-A Characteristics
Characteristics Value
Frequency (GHz) 1.278
Spatial Resolution (m) 38 x 38
Total-Surface Coverage 10 x 106
(km2)Data Acquisition Time 8
(hrs)
Swath Width (km) 50.2
___Number_Pl looks (pulses 4-7during"'tar get visibilityinterval)
Peak Power Transmitted . 1000(watts)
3.1.3 INSTRUMENT CALIBRATION
3.1.3.1 Preflight Calibration. The SIR-A data collection and processing
systems have been designed to be stable with time, that is, the relation-
ship between image reflectance and surface radar cross section will be held
constant throughout SIR-A1s data. This stability is verified and
controlled by using the calibration techniques.
3.1.3.2 Prelaunch Calibration. Prior to film loading, a series of sensi-
tometric wedges will be exposed onto the signal film. After loading, a
series of Modulation Transfer Function (MTF) and Automatic Test Function
(ATF) square-wave patterns will be exposed by the on-board optical record-
er, together with a bias-only reference.
3-6
3-1

3.1.3.3 Inflight Calibration. During flight, a known calibration signalwhich will always lie within the signal fi lm's dynamic range will be placedon the signal film at the beginning of each data take. A smaller number ofcalibration signals which will lie within the image f i lm's dynamic rangeafter correction will also be used.
3.1.3.4 Postflight Calibration. Information obtained during the pre-launch calibration will be used to monitor the development and correlationprocess after the flight.
3.1.4 ACCURACY
3.1.4.1 Instrument Accuracy. The range resolution will nominally be 38meters. However unfavorable pointing errors at the-equator can degrade the
range resolution at the swath edges up to 60 meters with 38 meter resolu-tion still occuring over the center 25 km of the swath.
In general, 38 meter azimuth resolution will be maintained with between 6and 7 azimuth looks. In cases where unfavorable pointing errors or opticalrecorder film drive jitter occur, 38 meter resolution can be maintained butthe number-of—looks may-drop-to 4 or 5. --
3.1.4.2 Geometric Accuracy. The azimuth scale factor of 500,000:1 willbe maintained to within at least 1%. For selected processing runs, usingorbital information, an accuracy of at least 0.1% can be achieved.
Range scale factor will nominally be 500,000:1 at the center swath. Sincethe presentation is in slant range, however, the near range scale factorwill be about 515,000:1 and the far range factor about 485,000:1 with anapproximately linear variation in between. During the mission the inci-dence angle can change by as much as j l.5 degrees. In the initial surveyprocessing this variation will not be corrected, and the resulting imagerywill not always have a 500,000:1 range scale factor at swath center. Thisunity aspect ratio point will occur anywhere within about +20 km of swathcenter. The near range and far range scale factors can thus vary about +2%of the values stated above.
3-8
Data skew will in general be present in the image. A square on the groundoriented parallel to swath direction will be changed to a parallelogram inthe image. Range lines perpendicular to the swath direction will be imagedat an angle approximately equivalent to the Doppler angle being processed.This skew, which can be as high as 3 or 4 degrees, can be mostly removed forselected processing runs.
3.1.4.3 Radiometric Accuracy. Within a given 50-km square the relativeradiometric accuracy should be about 1 dB. Over long distances and frompass to pass the relative accuracy is more likely about 3 dB.
3.2 SMIRR
3.2.1 INSTRUMENT DESCRIPTION
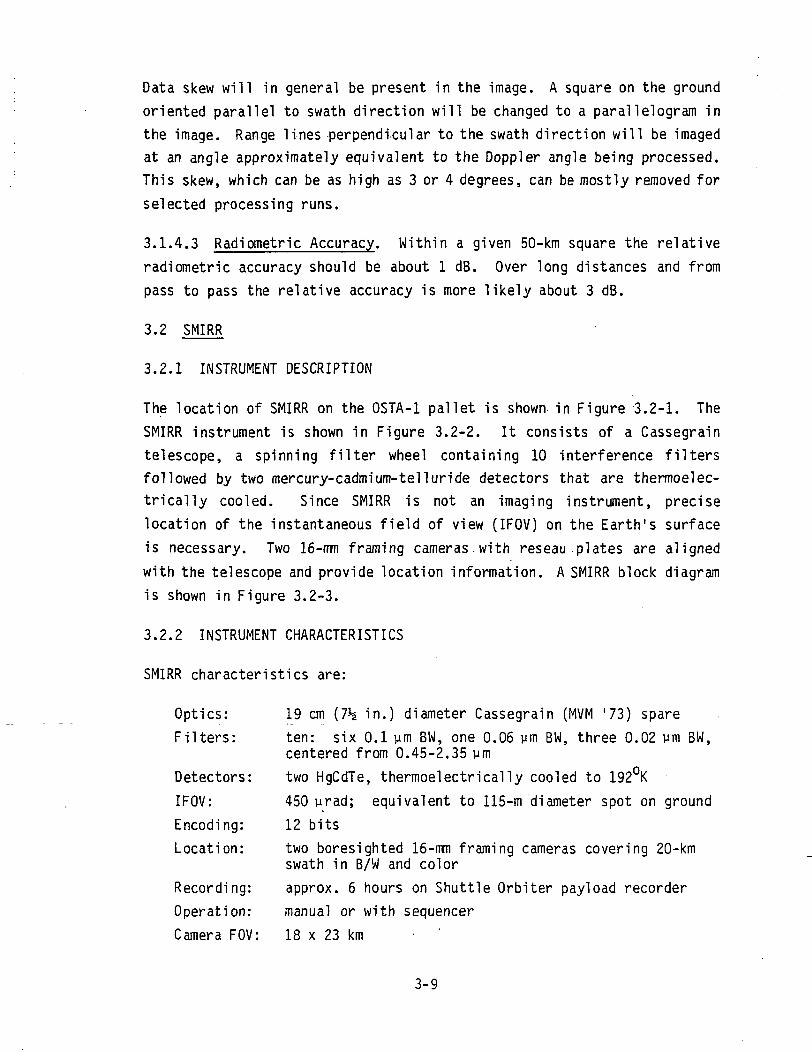
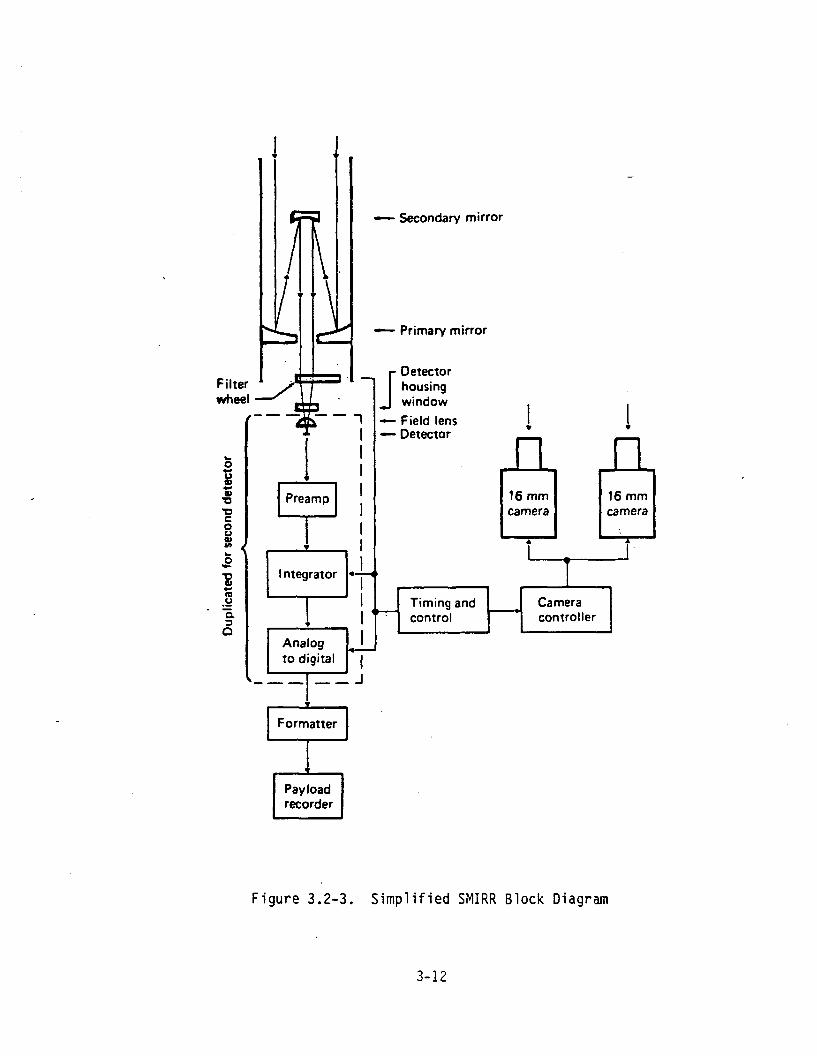
The location of SMIRR on the OSTA-1 pallet is shown in Figure 3.2-1. TheSMIRR instrument is shown in Figure 3.2-2. It consists of a Cassegraintelescope, a spinning filter wheel containing 10 interference filtersfollowed by two mercury-cadmium-telluride detectors that are thermoelec-trically cooled. Since SMIRR is not an imaging instrument, preciselocation of the instantaneous field of view (IFOV) on the Earth's surfaceis necessary. Two 16-mn framing cameras.with reseau plates are alignedwith the telescope and provide location information. A SMIRR block diagramis shown in Figure 3.2-3.
3.2.2 INSTRUMENT CHARACTERISTICS
SMIRR characteristics are:
Optics: 19 cm (7h i n . ) diameter Cassegrain (MVM '73) spareFilters: ten: six 0.1 ym BW, one 0.06 ym BW, three 0.02 urn BW,
centered from 0.45-2.35 ymDetectors: two HgCdTe, thermoelectrically cooled to 192°KIFOV: 450 yrad; equivalent to 115-m diameter spot on groundEncoding: 12 bitsLocation: two .boresighted 16-mm f raming cameras covering 20-km
swath in B/W and colorRecording: approx. 6 hours on Shutt le Orbiter payload recorderOperation: manual or wi th sequencerCamera FOV: 18 x 23 km
3-9

Fl'9Ure 3-2-1' SMIRR Instrument Location
3-10

Telescope cover
* Digitalelectronics
Telescope(modifiedMarinerVenus-Mercury 73)
Analogelectronics
Powersupply
Camera housing
-Filmcamera (2)
Base plate
Filter wheel
Filter wheel motor
HgCdTe detectorassembly
Figure 3.2-2. SMIRR Instrument
3-11
s
Filter *wheel —
0
bK•D•O
§
w <£•gas
_u
a
Il\^
^mm
2
|i\rdX
=3
— Secondary mirror
— Primary mirror
— i
1 ii
Preamp
i
1
i1
V
1 ntegrator
1
Analogto digital
1
,'~riii
JDetectorhousingwindow
— Field lens 1 1
A A16 mm 16 mmcamera camera
•tA A
1 . '
Timing and Cameracontrol controller
i
Figure 3.2-3. Simplified SMIRR Block Diagram
3-12
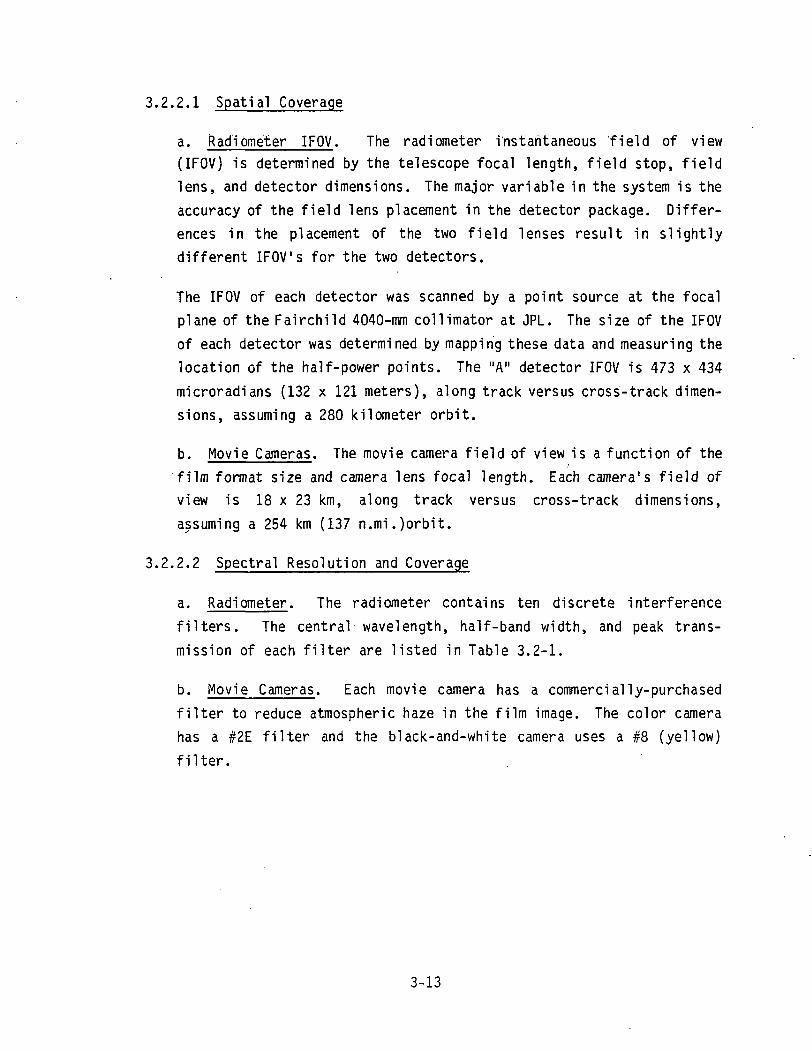
3.2.2.1 Spatial Coverage
a. Radiometer IFOV. The radiometer instantaneous field of view(IFOV) is determined by the telescope focal length, field stop, fieldlens, and detector dimensions. The major variable in the system is theaccuracy of the field lens placement in the detector package. Differ-ences in the placement of the two field lenses result in slightlydifferent IFOV's for the two detectors.
The IFOV of each detector was scanned by a point source at the focalplane of the Fairchild 4040-mm collimator at JPL. The size of the IFOVof each detector was determined by mapping these data and measuring thelocation of the half-power points. The "A" detector IFOV is 473 x 434microradians (132 x 121 meters), along track versus cross-track dimen-sions, assuming a 280 kilometer orbit.
b. Movie Cameras. The movie camera field of view is a function of the_^^^^_^____^^ /
film format size and camera lens focal length. Each camera's field of
view is 18 x 23 km, along track versus cross-track dimensions,
assuming a 254 km (137 n.mi.)orbit.
3.2.2.2 Spectral Resolution and Coverage
a. Radiometer. The radiometer contains ten discrete interference
filters. The central wavelength, half-band width, and peak trans-
mission of each filter are listed in Table 3.2-1.
b. Movie Cameras. Each movie camera has a commercially-purchased
filter to reduce atmospheric haze in the film image. The color camera
has a #2E filter and the black-and-white camera uses a #8 (yellow)
filter.
3-13

Table 3.2-1. Filter Spectral Characteristics
Central Wavelength(Microns)
0.500.601.051.201.602.102.172.202.222.35
Half-bandwidth(Microns)
0.100.100.100.100.100.100.020.020.020.06
Peak Transmission(Per Cent)
59.664.051.058.252.874.266.071.860.859.5
3.2.3 INSTRUMENT CALIBRATION
3.2.3.1 Preflight Calibration
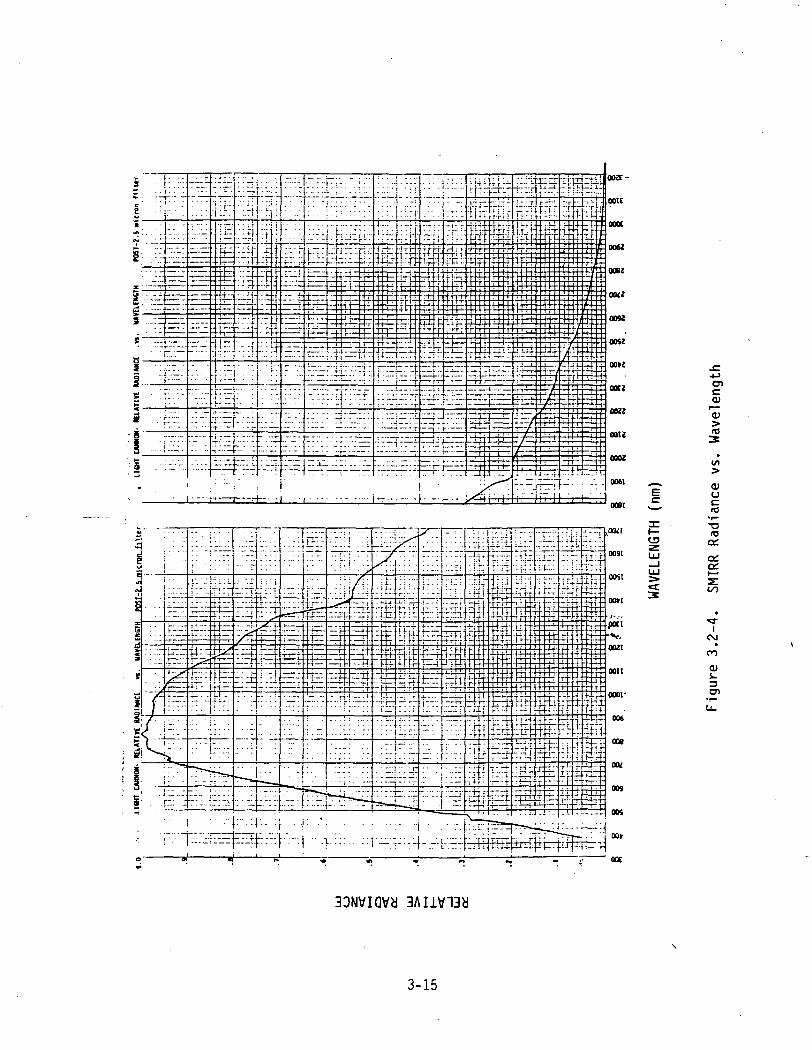
a. Light Cannon. The response of SMIRR over the range of lightlevels expected in flight is measured with a light cannon. The lightcannon is a radiometrically calibrated light source that can bevaried in intensity without changing its color temperature. It con-sists of quartz iodide lamps, an integrating hemisphere, an iris tovary the intensity, and a ground-quartz diffuser. The light cannonwas spectrally calibrated at Johnson Space Center with an EG&G spec-troradiometer. The relative spectral data is presented in Figure3.2-4. Data at wavelengths longer than 2.5ym have been extra-polated. The iris was calibrated using a cross-polarized variabletransmittance standard and a Gamma 700 photometer at JPL. Theseresults were compared to a National Bureau of Standards secondary100-foot-lambert source before and after each instrument calibrationto select the proper light levels for the calibration.
b. Instrument Calibration. Each instrument calibration consists ofdata taken with the cover closed and internal calibration lamps off,
3-14
LLJ
O)c<D
(O
uc(O
a:a:
iCSJ
•CO
(U
3CD
33NVIQVH
3-15

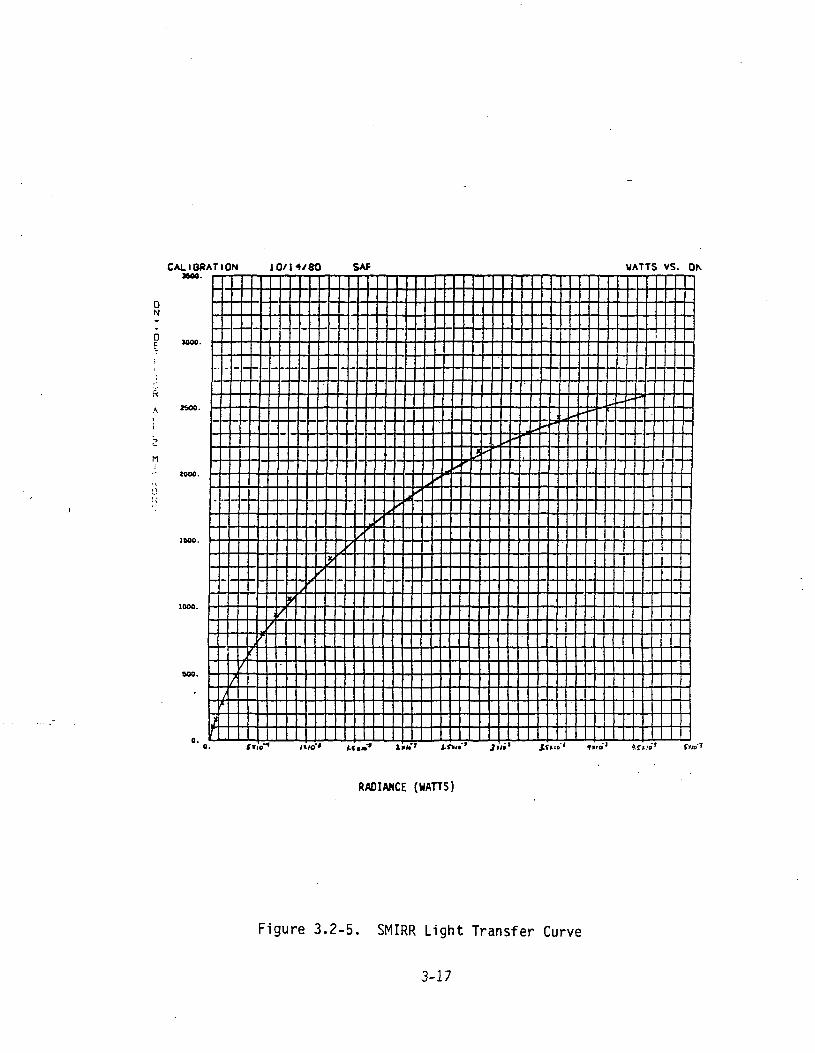
with the cover closed and internal calibration lamps on, and with thelight cannon at fifteen light levels between 30 and 3000 foot-
lamberts. The data were recorded on a digital tape in the GSE ando
then values of DN and the corresponding radiance (watts/cm at the
telescope entrance aperture) were plotted for each filter. These"light transfer curves" are the basic tool for decalibrating theflight data. Typical light transfer curves for the 1.2 ym filter and
detector A are given in Figure 3.2-5.
3.2.3.2 Prelaunch Calibration. Every two months a calibration verifica-tion is run using the internal calibration lamps to monitor the health of
the detectors.
3.2.3.3 Inflight Calibrations. Prior to every data-taking period, theinternal calibration lamps are observed. These data will be used to adjustthe instrument calibration data for any changes that have occurred since
the last calibration.
3.2.3.4 Post Flight Calibration. A full calibration procedure using the
light cannon and the internal lamps will be performed at JPL after returnof the instrument.
3.2.4 ACCURACY
The desired absolute accuracy for SMIRR is +10%. However, the desired
relative accuracy for SMIRR is +5%.
3.3 FILE
3.3.1 INSTRUMENT DESCRIPTION
FILE is based on the fact that the Earth's surface cover, namely water,bare land, vegetation, and clouds/snow/ice can be identified by ratioing
two spectral channels of reflected solar radiation in bands located at0.65 ym and 0.85 ym. The ratio of the reflected solar radiations at these
two wavelengths is relatively independent of such factors as solarillumination angle and atmospheric effects, and these two channels do notinclude any major atmospheric absorption (radiation) bands. Figure 3.3-1
3-16
CALIBRATION JO/M/80 SAP WATTS VS.
R
A Koa-
t fc"' J.«W' «i>o' l.fito' S'KJ
RADIANCE (WATTS)
Figure 3.2-5. SMIRR Light Transfer Curve
3-17

shows the approximate feature separability to be expected from the FILE
radiance measurements.
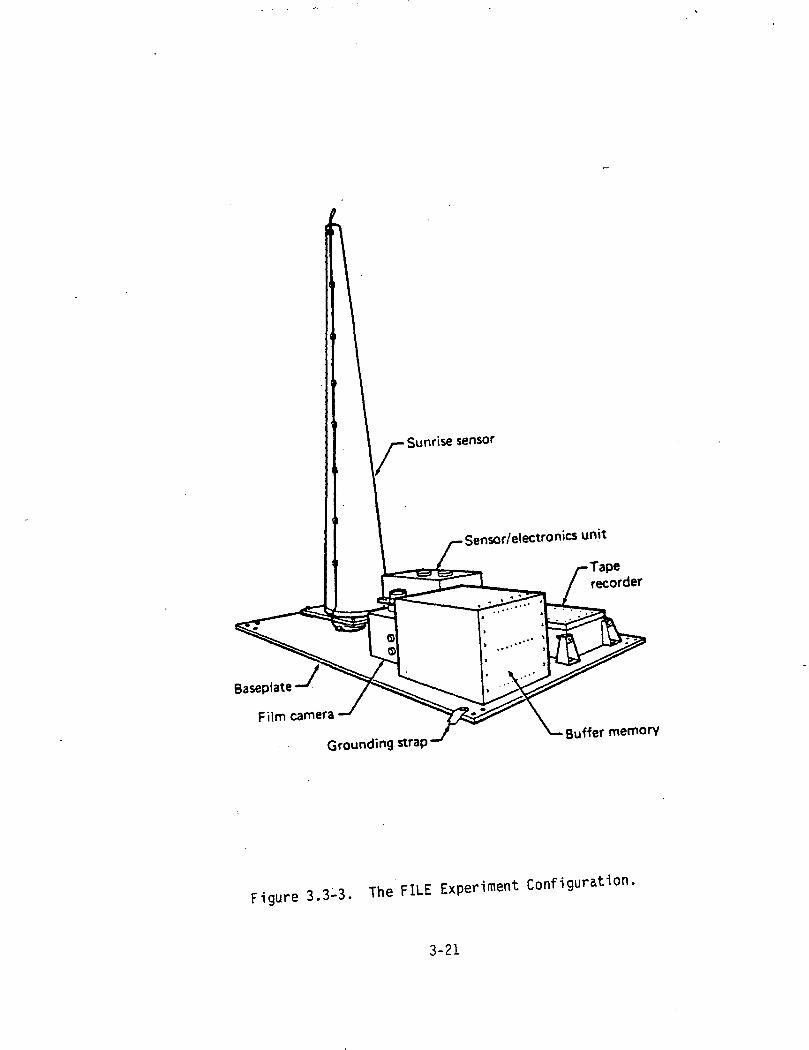
The two FILE sensors are bore-sighted charge-coupled device (CCD) cameras(100 x 100 arrays). Instrument characteristics are summarized in Section3.3.2. The FILE system consists, in addition to the two CCD sensors, of adecision-making electronics unit which does the real-time feature classi-fication, a tape recorder, a tape recorder storage buffer, a 70-mm cameraand a sunrise sensor to provide operation of the instrument only on thedaylight side of the Earth. The decision-making circuitry is shown inFigure 3.3-2, and the hardware arrangement in Figure 3.3-3. The FILEequipment is mounted on the OSTA-1 pallet experiment shelf, as shown inFigure 3.3-4. About 120 frames of data will be sent via the temporarybuffer storage to the FILE tape recorder during the mission. Data recordedfor each frame include digitized images from the two CCD cameras, a countof the total number of pixels in each scene that were classified into eachfeature category, and the date and time of day to allow post-flight deter-mination of latitude and longitude. To provide auxiliary ground-truthdata, the FILE experiment also includes a 70-mm color-film camera, bore-sighted with the CCD cameras, to record an image each time a CCD image isread into the buffer.
To increase the variety of data returned, the instrument counts the numberof frames of data representing scenes that are predominantly water andclouds or bare land. It will not record data for scenes in either of theseclasses after a quota of 31 frames has been taken.
The FILE power supply receives +28-volt direct-current primary power fromthe Shuttle. A FILE timer controls the timing of data taking. Dectectionof sunrise by the sunrise sensor initializes the timer (see Figure 3.3.-5),and the timer activates the power supply and buffer memory unit for datataking at a pre-determined timing interval, starting at a set time aftersunrise detection. At the completion of the CCD sensor raster scans, for agiven data take, the buffer memory unit is commanded to transfer its datato the recorder, and the film camera shutter is activated. This action canbe inhibited by the scene processor, on the basis of the scene analysis. Aformat timer generates scan timing for the CCD sensors and formats all datatransferred to the buffer memory unit. The format timer also demodulates
3-18

4.r
H
P*H
§
OSOto
CO2.
r.
CLOUD
'WATERVEGETATION
1. 2. 3.
"IR" SENSOR OUTPUT
Figure 3.3-1. Feature Separability for FILE Experiment.
3-19

"RED" SENSOR,OUTPUT
111R" SENSOR,OUTPUT
iUl
RED > 1.18IR
U2RED < .695IR
RED < V,U3 REF
-o WATER
-o VEGETATION
BARE LAND
CLOUD/SNOW
Figure 3.3-2. Simplified Decision Circuitry of FILE,
3-20
ics unit
Taperecorder
Baseplate
Film camera
Grounding strapBuffer memory
Figure 3 .3-3. The FILE Experiment Configurat ion,
3-21

Fl3.3.4
* * FILE i
3.22

the Shuttle Greenwich mean time (GMT) data stream for insertion into thedata format. The scene processor performs two major fuctions: 1) itdigitizes the CCD signals for incorporation into the data format, and 2) itclassifies the image into the four basic feature categories, as discussedearlier. Classification is based on sensor amplitude and ratio. Thenumber of pixel elements classified into each feature category isaccumulated and incorporated into the data format.
The temperature controller operates on the primary + 28 volts and turns onheater resistors when (if) the temperature falls below + 13°C. The heatercontrol is independent of the FILE timer controls.
3.3.2 INSTRUMENT CHARACTERISTICS
Field of View : 102 km x 75 kmSpatial Resolution : 1.02 km x 0.75 kmSpectral Resolution : .65 ym, 20 nm. bandwidth
.85 ym, 20 nm. bandwidth
Total Surface Coverage: 0.8 x 10⁶ km2
Data Acquisition Time : 80 - 96 hours depending on Shuttlemaneuvers
Camera Field of View : 142 km
3.3.3 INSTRUMENT CALIBRATION
Prior to flight, sensors are boresighted to +_ 0.05 degrees and then arecalibrated for response before installation on the pallet. The FILE CCDcameras were calibrated in November, 1980. The calibration was done bycomparing the outputs of the cameras with the output of a radiometer(silicon detector) while the cameras and radiometer were viewing the sameuniformly lighted white target. The target was illuminated with a quartziodide floodlamp. The radiometer spectral response was matched to theresponse of each camera by using matching spectral filters. Before thecamera calibrations, the radiometer was calibrated, with each filter, byusing a secondary lamp whose calibration is traceable to the C.N.R.C.calibrated lamp. The dominant error sources were the pixel-to-pixel
3-23

INSTRUMENTENABLED
SUNRISE
SHUTTLEMOTION
SUNRISEDETECTORENABLED
LOW VALUE OFREFERENCE-USED
I HIGH VALUE OFREFERENCE USED
LOW VALUE OFREFERENCE USED
OPERATIONINHIBITED
DARKNESS SUNLIGHT
Figure 3.3-5. Orbit Timing as a Function of Time Since Sunrise.
3-24

response nonuniformity of the cameras themselves and nonuniformity ofillumination of the target for the cameras.
After the flight, preflight calibration will be repeated.
3.3.4 ACCURACY
The geometric accuracy and radiometric accuracy are explained in Section
3.3.3. Calibration accuracy is approximately 16%.
3.4 MAPS
3.4.1 INSTRUMENT DESCRIPTION
The MAPS instrument consists of an electro-optical head, an electronicsmodule, a digital tape recorder, and a camera. The 80-kg MAPS package is
90 cm long, 76 cm wide, and 58 cm high. The equipment is coupled to a coldplate and mounted on the experiment pallet shelf. The electro-optical head
contains two gas cells, one at 266 torr CO, the other at 76 torr CO; theircorresponding detectors; a direct radiation detector; an external balance
and gain check system; and an internal balance system. The electronicsmodule consists of the signal processors, the balance system controls, andthe circuits needed to operate the system. The Lockheed Mark V digitaltape recorder records data at 50 bits per second. The aerial camera,equipped with a light sensor, will photograph the ground track duringsunlit portions of the orbit. Figure 3.4-1 depicts the MAPS instrument inoperation.
The core of the MAPS instrument is a gas filter correlation radiometer.
Thermal radiation passes up through the atmosphere into the viewport of thedownlooking instrument. The carbon monoxide in the air produces uniqueabsorption lines in the transmitted energy. A beam of the incident radia-
tion passes through the high pressure CO gas cell and onto a detector.This high pressure CO gas cell acts as a filter for the effects of COpresent at low altitudes. A second beam falls directly onto a detector
without passing through any gas filter. The difference in the voltage ofthe signals from these two detectors can be used to determine the amount ofcarbon monoxide present in the atmosphere at an altitude of 7-8 km. A
3-25

third beam of the incident radiation passes through the low pressure CO gascell and onto a detector. The low pressure CO gas cell filters out theeffects of CO present at high altitudes. The differen.ce in voltage fromthis and the direct detector provides a measure of CO concentration at analtitude of 10-12 km. Figure 3.4-2 illustrates this operation.
The instrument is contained within an enclosure designed to attenuate theShuttle acoustical vibrational, and thermal environments. An aluminumbox-shaped cover completes the package. For thermal protection, the en-closure is wrapped with multilayer aluminized Mylar film.
The MAPS equipment is attached to a single base plate located in theShuttle bay. This method of mechanical attachment simplifies the instru-ment integration and testing and permits the use of standardized interfaceequipment. The location of the instrument on the OSTA-1 pallet in shown inFigure 3.4-3.
Thermal control requirements are satisfied for the MAPS components bythermal coupling to the mounting plate. The experiment is thermally isola-ted from the radiative environment by a multilayer-insulation thermalblanket. Thermal control is maintaine'd through the Shuttle pallet freoncooling loop and a cold plate thermally coupled to the MAPS mounting plate.
When the Space Shuttle has attained its Earth-viewing position, palletpower will be supplied and the MAPS instrument turned on. After a 30-minute warmup, the instrument is balanced and its gain is checked before itbegins to take data. Data-taking continues throughout the Earth-observingperiod, with balance and gain check recurring at 12-hour intervals or uponrequest sent from the Principal Investigator. The three instrument out-puts (two difference signals and one radiometer signal) are digitized,formatted, and stored on the experiment's tape recorder. The aerial cameramounted alongside the MAPS electro-optical head will provide informationon cloud cover and the terrain over which the data are gathered.
3.4.2 INSTRUMENT CHARACTERISTICS
Spatial Resolution = 19 km
Spectral Resolution = 0.05 cm
3-27
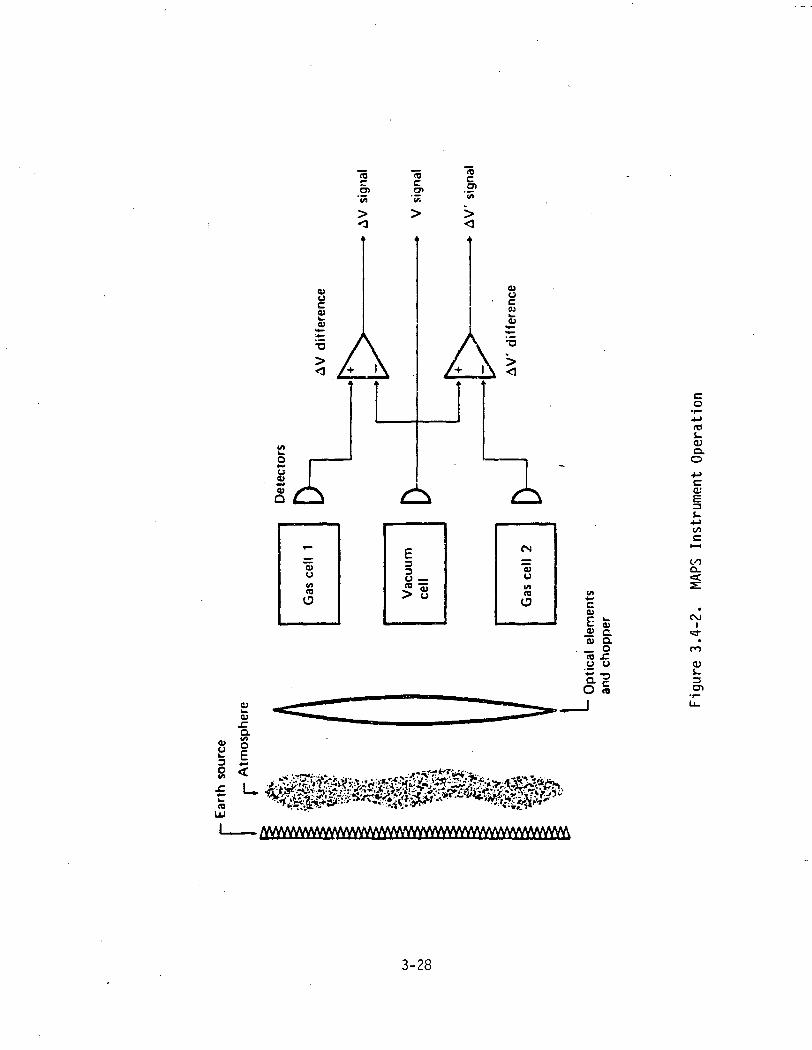
(T3S-O)Q.O
coQ_
0)
3CD
3-28
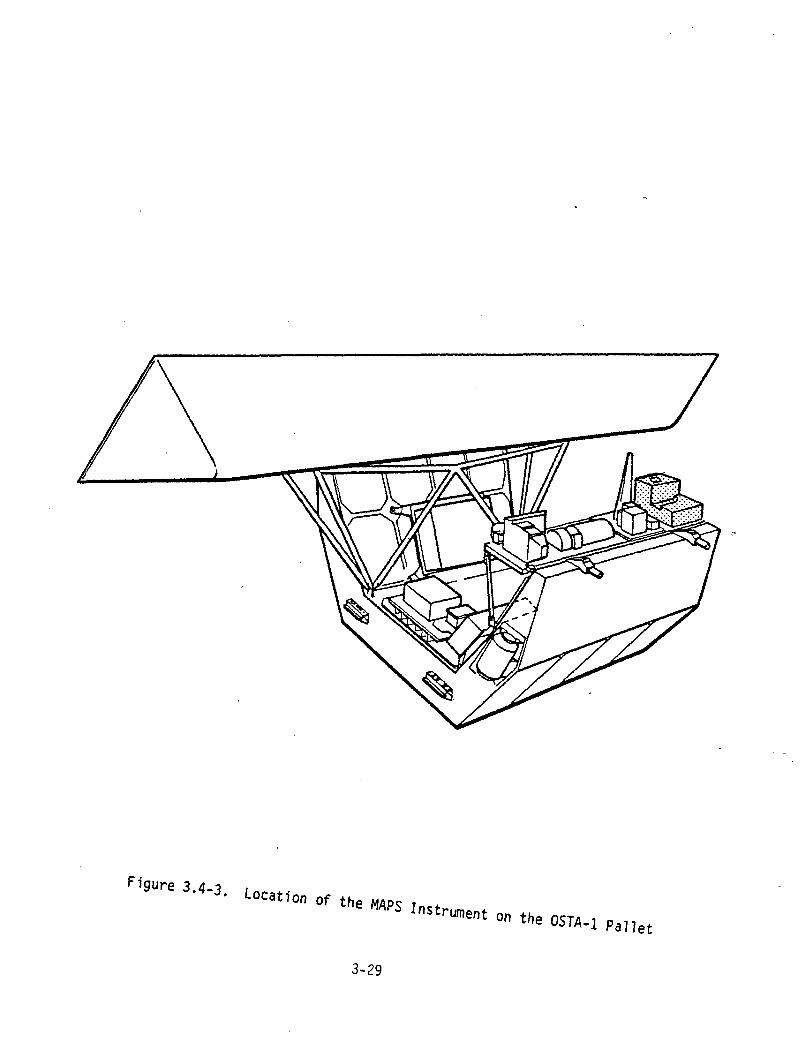
3.4-3.of
MAPS Instrument the OSTA-l
3-29

Global Coverage = 3.75 x 10⁷ km2
Data Acquisition Time = 80-96 hours depending on Shuttle maneuvers
3.4.3 INSTRUMENT CALIBRATION
3.4.3.1 Preflight Calibration. The preflight calibration will occur at
Langley Research Center using the dedicated MAPS calibration variabletemperature gas cell, a high quality variable temperature blackbody radia-tion source, and the associated filling, control, and measurement equip-ment. This unit serves as the radiometric standard for the MAPS instrument
and provides a capability for simulating a broad range of source tempera-tures and gas concentrations. The source and cell operate at variable,controlled temperatures. When used with the test set, it provides thecapability for a complete end-to-end checkout and calibration of the MAPS
instrument.
The instrument is internally balanced so as to be relatively insensitive to
changes in background temperature. Two blackbodies, one at the hot end ofthe expected temperature range, the other at the cold end, are introducedone at a time into the optical path with no gas between them and theinstrument. The gain of each gas cell detector is adjusted so that each
blackbody registers the same voltage, thus providing a baseline for signalmeasurement.
A similar system located externally serves to check both the balance set by
the internal system and the instrument's gain stability. A pointer mirrorrotates from a hot blackbody, to a cold blackbody, to a normalizing source,
and finally to the viewport. Figure 3.4-4 shows the MAPS instrumentcalibration scheme.
The instrument was first calibrated during August, 1979 before the level IV
integration and later after integration. In September, 1980, followingstorage at Langley, it was recalibrated. The two calibrations agreedclosely, but with a slight decrease in responsivity and a slight increase
in noise. As of September, 1980, the instrument was performing well withinacceptable limits of operation.
3-30

TOPVIEW
wwv
SIDEVIEW
External [wwy Referencenormalizing I I I blackbodyblackbody and '
gas ce" ! Beam
Pointermirror
External balancehot blackbody
Directradiationdetector
\ Gascell 2
Viewingport
Pointermirror
External balancecold blackbody
MAMInternal balanceblackbodies
Figure 3.4-4. The MAPS Instrument Calibration Scheme
3-31
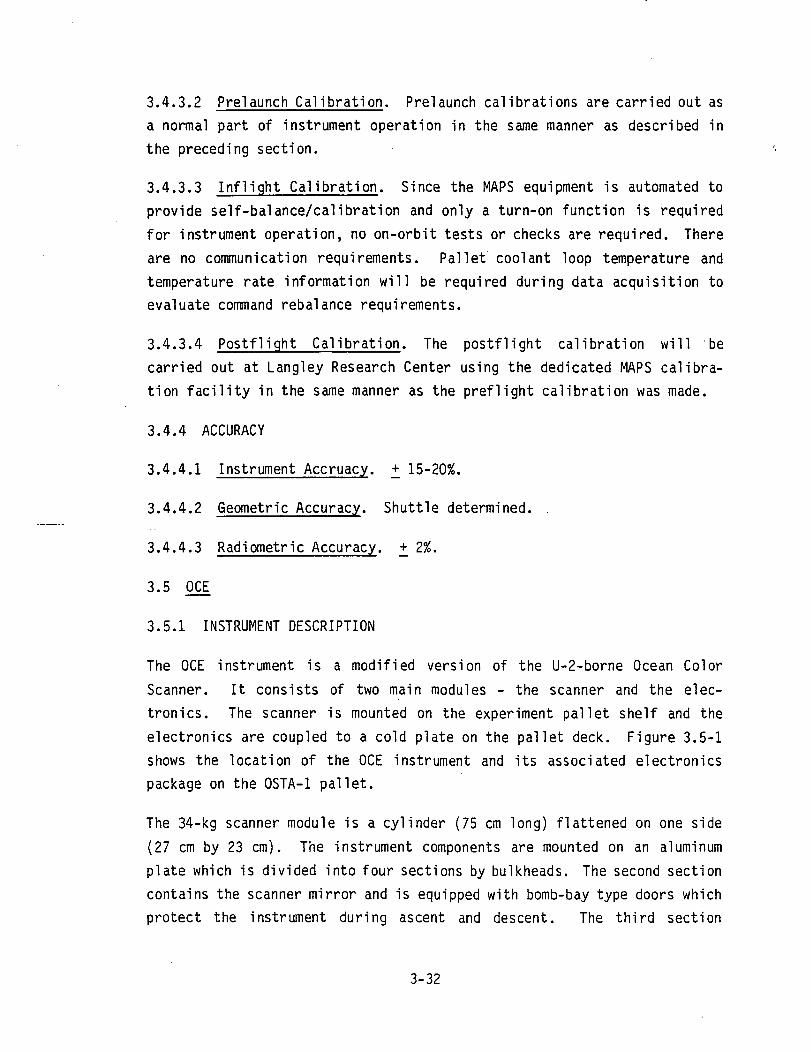
3.4.3.2 Prelaunch Calibration. Prelaunch calibrations are carried out asa normal part of instrument operation in the same manner as described inthe preceding section.
3.4.3.3 Inflight Calibration. Since the MAPS equipment is automated toprovide self-balance/calibration and only a turn-on function is requiredfor instrument operation, no on-orbit tests or checks are required. Thereare no communication requirements. Pallet coolant loop temperature andtemperature rate information will be required during data acquisition toevaluate command rebalance requirements.
3.4.3.4 Postflight Calibration. The postflight calibration will becarried out at Langley Research Center using the dedicated MAPS calibra-tion facility in the same manner as the preflight calibration was made.
3.4.4 ACCURACY
3.4.4.1 Instrument Accruacy. + 15-20%.
3.4.4.2 Geometric Accuracy. Shuttle determined.
3.4.4.3 Radiometric Accuracy. + 2%.
3.5 OCE
3.5.1 INSTRUMENT DESCRIPTION
The OCE instrument is a modified version of the U-2-borne Ocean ColorScanner. It consists of two main modules - the scanner and the elec-tronics. The scanner is mounted on the experiment pallet shelf and theelectronics are coupled to a cold plate on the pallet deck. Figure 3.5-1shows the location of the OCE instrument and its associated electronicspackage on the OSTA-1 pallet.
The 34-kg scanner module is a cylinder (75 cm long) flattened on one side(27 cm by 23 cm). The instrument components are mounted on an aluminumplate which is divided into four sections by bulkheads. The second sectioncontains the scanner mirror and is equipped with bomb-bay type doors whichprotect the instrument during ascent and descent. The third section
3-32

3.5-1. Locat,onof the OCE Instrument on the OSTA-1 Pallet
3-33

contains the telescope. The first section houses the motors for thescanner mirror and doors and the devices for timing pickup. The fourthsection houses the optics and an electronics box.
The electronics module weighs 60 kg and measures 29x71x91 cm. It consistsof the signal amplifiers, a digitizer, and the data handling system.
The rotating scanner mirror on the OCE instrument scans +45 degrees fromnadir across the direction of flight and reflects radiation into a Dall-Kirkham telescope. The telescope images the scene through a 1x2 mm fieldstop and onto a diffraction grating. This diffracted light which has beenseparated into its component colors is diverted onto a bundle of 24 glassfibers, and a different spectral band is channeled through each glassfiber. The fibers are coupled to 8 silicon photodiode detectors. Thecenter frequency and bandwidths of each of the 8 spectral channels are aslisted in Table 3.5-1. Figure 3.5-2 shows the optical diagram of the OCEinstrument.
The power requirements at 28 volts D.C. are:
maximumoperationalstandby
3.5.2 INSTRUMENT CHARACTERISTICS
IFOV
Spatial resolution (sea level)
Scan anglePlatform altitudeSpectral resolutionTotal surface coverageData acquisition timeSensitivity (chlorophyllconcentration)
197 watts180 watts50 watts
3.5 mrad1 km at nadir1.7 km at 40° off nadir+45°254 km23 nm full width at h maximum2.6 x 107 km2
120 min0.1 mg/m
3-34
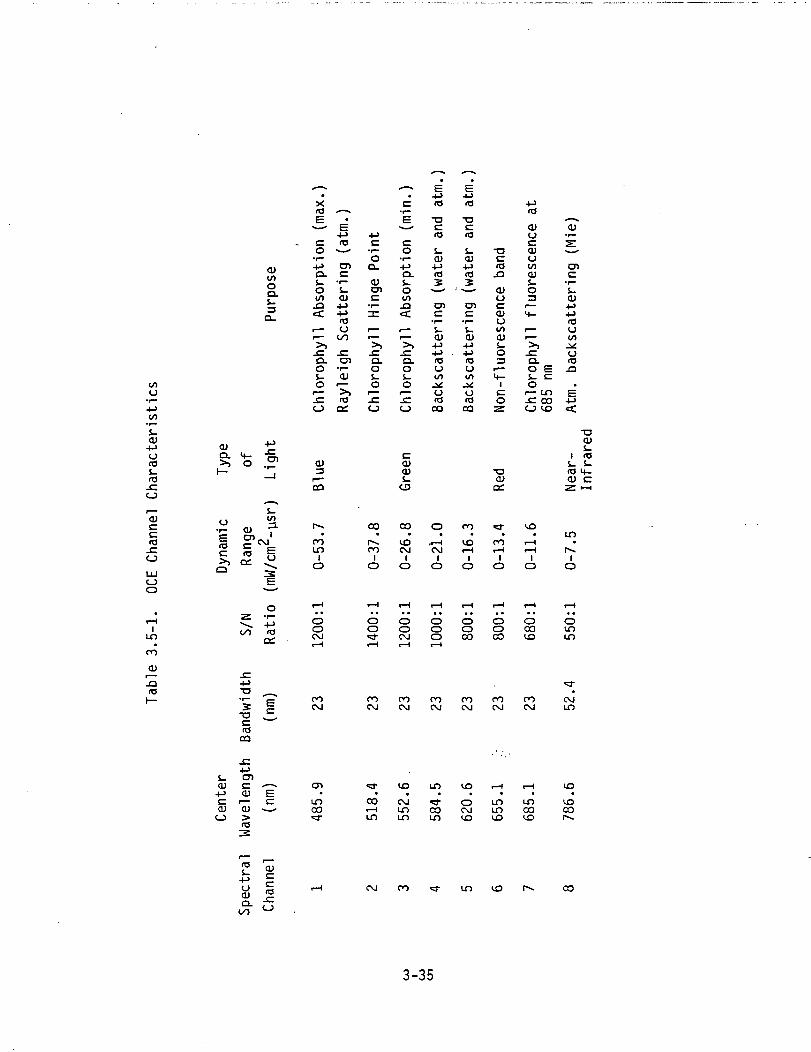
OJCOOa.s_
coo
-MCO
s<D
CUcc
o
iOca
s-co
LO•
CO
cuJ3
cu
ITSC£
to <ao:
T3
's-oCn3
CQ
cuCDCcu
cu 'cuo >
XIO
co
•r—4*9
a.s-ocoJ3<C
r— •
' —
Ja.os-o
r—.co
cu3
r—ca
r^
COLO
1O
1— 1
0oOJI— I
COOJ
CD
LOCO«3"
(O.
CDC•r-S-cu-M4^tjo
CO
J=CD
• r~CU
^—>}iOa:
c• 1—
Oa.cuCDc•^3:^—' —
-CO.Os_0r~J=CJ
CO
f^CO
1
o
oo<— 1
COOJ
^>
cor-HLO
ci
co
• r~
^Ja.S-or^
^^^«^~
^0.OS-0
r-™_g^
CJ
ccucus_
C3
CO
COOJ
1o
ooOJrH
COOJ
OJLOLO
TD
iO
s_<D
(O2
CDc
•f—c^CU
JjfOoCO\sO
CO
0
rf-lOJ
1o
ooo!— (
COOJ
LO
,_llCOLO
ITS
T3
n3
C-
CU
tO3
CDC•r-S-0)
^jro(Jco\s
O
CQ
mIO<— 1
10
ooCO
COOJ
CO
oOJCO
T3c(Of*s
cuof~
cuococu03
r—c^
1e~0z
T^cua;
.
COr-H
1
O
ooCO
COOJ
r- 1
LOLOCO
CUoccuoCOcuo3
r—<+-r—
' —
_^"a.o e0
i— LOJ= COCJ CO
CO
.— 1r— 1
1
o
oCO
COOJ
r— 1
LOcoCO
"a?•r™
s
CDC
•r™S_cu-us4->It3CJCO
•yIOo
•
E+j<
is_itscuz
1 (^Li }
f ,.|
0
,— 4
OLOLO
*rOJLO
CO
COCOr-s.
T3CUS_IOs_4-
i — i
"3
cua.
cu
(T3^zC_3
OJ CO LO CO
3-35

Scannermirror
12.7-cm Dall-Kirkham[— 1.0-mm field
stop
Shutter600 line per mmdiffraction grating-
Spherical mirror75 X 75 mm
24-eiementfiber-opticreceiver
8 silicon detectors
8 optical relays-5
8-order-isolatingfilters
Figure 3.5-2. The OCE Optical Diagram
3-36
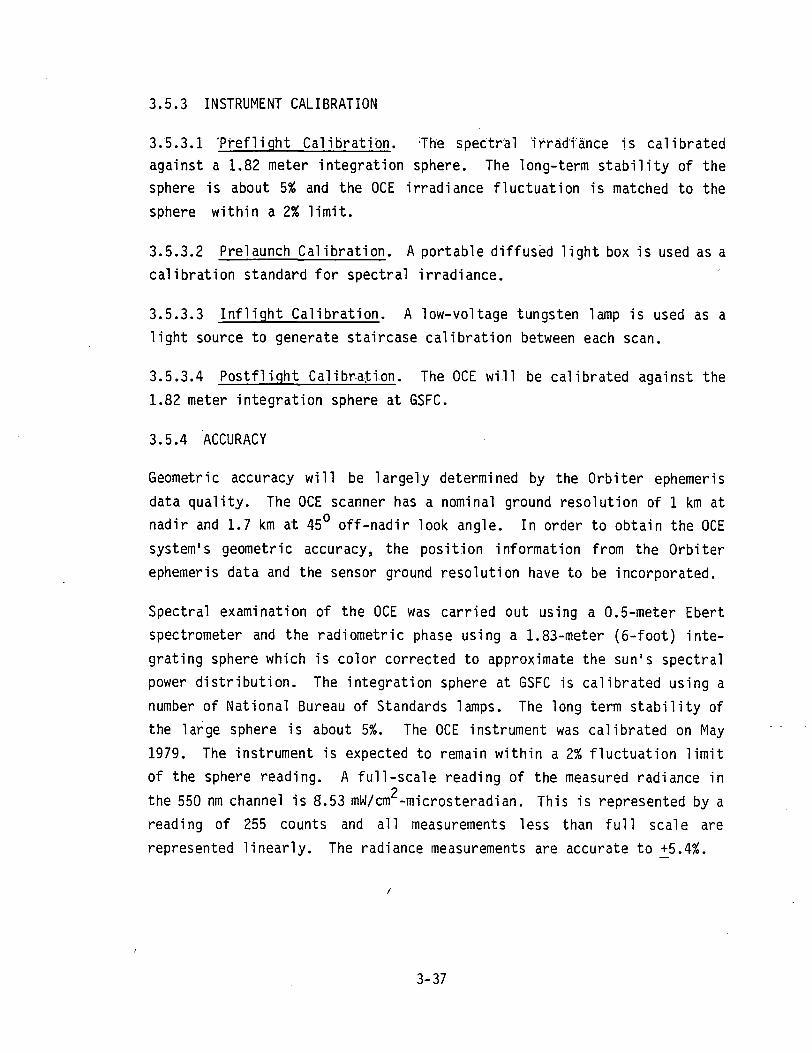
3.5.3 INSTRUMENT CALIBRATION
3.5.3.1 'Pref light Calibration. The Spectral irradiance is calibratedagainst a 1.82 meter integration sphere. The long-term stability of thesphere is about 5% and the OCE irradiance fluctuation is matched to thesphere within a 2% limit.
3.5.3.2 Prelaunch Calibration. A portable diffused light box is used as acalibration standard for spectral irradiance.
3.5.3.3 Inflight Calibration. A low-voltage tungsten lamp is used as alight source to generate staircase calibration between each scan.
3.5.3.4 Postf1ight Calibration. The OCE will be calibrated against the1.82 meter integration sphere at GSFC.
3.5.4 ACCURACY
Geometric accuracy will be largely determined by the Orbiter ephemerisdata quality. The OCE scanner has a nominal ground resolution of 1 km atnadir and 1.7 km at 45° off-nadir look angle. In order to obtain the OCEsystem's geometric accuracy, the position information from the Orbiterephemeris data and the sensor ground resolution have to be incorporated.
Spectral examination of the OCE was carried out using a 0.5-meter Ebertspectrometer and the radiometric phase using a 1.83-meter (6-foot) inte-grating sphere which is color corrected to approximate the sun's spectralpower distribution. The integration sphere at GSFC is calibrated using anumber of National Bureau of Standards lamps. The long term stability ofthe large sphere is about 5%. The OCE instrument was calibrated on May1979. The instrument is expected to remain within a 2% fluctuation limitof the sphere reading. A full-scale reading of the measured radiance in
othe 550 nm channel is 8.53 mW/cm -microsteradian. This is represented by areading of 255 counts and all measurements less than full scale arerepresented linearly. The radiance measurements are accurate to +5.4%.
3-37

3.6 NOSL
3.6.1 INSTRUMENT DESCRIPTION
The NOSL instrument consists of the camera, the attached photocell sensor,and the connected tape recorder. Figure 3.6-1 shows how the camera,photocell, and tape recorder are interconnected. The camera is a 16-mmData Acquisition Camera (DAC) which has been flight tested on Apollo andSkylab missions. The camera will run on 28 Vdc power supplied by theOrbiter. The photocell sensor is mounted on top of the camera, and itsfield of view is aligned with the camera's. The camera sensor package is40 cm long, 24 cm wide, and 20 cm high. The photocell/amplifier assemblycontains its own battery power supply. The stereo cassette tape recorderis a 25-cm long, 18-cm wideband 6-cm high Sony TC 124, equipped with aplug-in earphone. The tape recorder interfaces with the photocell, whichin turn interfaces with the camera, via connecting wires. The recorder isbattery powered.
During launch, boost, and reentry, this instrument will be secured instorage lockers in the crew compartment. In orbit, the instrument will beretrieved and assembled for use in the crew cabin.
Twenty 140-ft. film magazines, two 60-minute tape cassettes, and sparebatteries will be kept in a storage apron mounted on the crew cabin wall.
3.6.2 INSTRUMENT CHARACTERISTICS
FOV (Camera) 32° X 24° at 17 mm focal length6° X 4.5° at 85 mm focal length
FOV (Photodetector) 6° X 6°Spatial resolution 100 ft (30 m)(camera with lens intelephoto position)Spatial resolution 15 nautical miles (20 km)(photodetector)
3-38
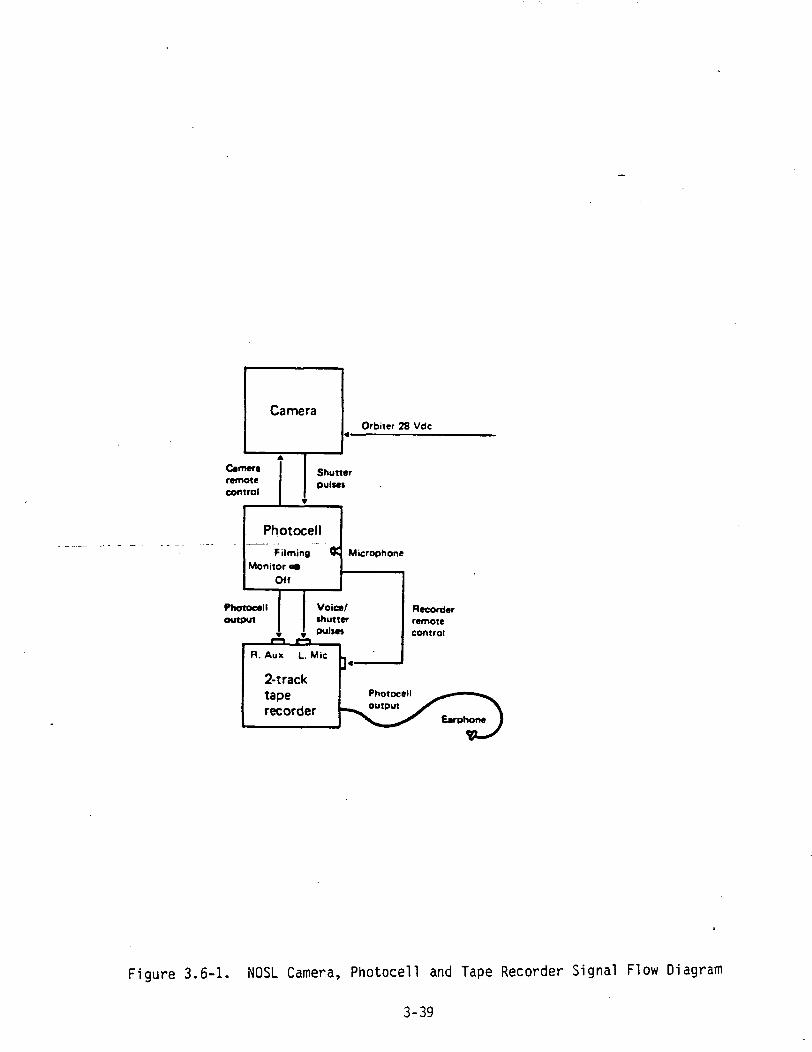
CameraOrbiter 28 Vdc
Cameraremotecontrol
Shutterpulses
Photocell
FilmingMonitor «•
Off
Microphone
Photocelloutput
Voice/shutterpulses
R. Aux L. Mic
2-tracktaperecorder
Recorderremotecontrol
Photocelloutput
Figure 3.6-1. NOSL Camera, Photocell and Tape Recorder Signal Flow Diagram
3-39

3.6.3 INSTRUMENT CALIBRATION
The NOSL equipment calibration cons'is ted of a comparison of photodetectoroutput to that of the experiment hardware of JSC. Signals were comparable.Testing included strobe light detection and angular sensitivity tests.Calibration will be done using equipment at Sandia Laboratories afterlanding at DFRC.
3.7 HBT
The HBT will use the dwarf sunflower (Helianthus Annuus) as the testmedium. A suitcase-like container will be loaded with 85 sealed .plantmodules varying in soil moisture content from 58 percent by weight (belowwhich plant growth is minimal) to 80 percent (above wNch anaerobic condi-tions inhibit growth). The aluminum container is 50 cm high, 43 cm wide,and 24 cm thick. It weighs 21 kg when fully loaded. It contains a battery-powered temperature recorder. This plant carry-on container will bestored in a locker in the crew compartment of the Space Shuttle middecksoon after the modules are planted and loaded as near launch time asfeasible. The test will require no crew attention. There are no power,cooling, data, or control interfaces with the Orbiter or crew.
3-40
SECTION 4. DATA "DESCRIPTION

SECTION 4. DATA DESCRIPTION
The amount, content, format, and storage medium of the data collected inflight by each instrument are described in this section. Those data, otherthan that collected by the flight instrument, which are necessary toprocessing or analysis of the flight instrument data, are referred to hereas ground truth data and other ancillary data. These data collections orrequirements are briefly described here.
An overview of the amount of data collected in flight is summarized inTable 4.0-1. Also given is the disposition of the data by the MissionManager upon landing of the Orbiter -at Dryden Flight Research Center. Thisdisposition is addressed more fully in Section 7, Data Received fromOrbiter.
4.1 SIR-A
4.1.1 FLIGHT DATA
The SIR-A image data are recorded on the SIR-A flight film. The film is
70 mm wide by approximately 3650 feet in length by 2.5 mils thick. Filmtype is Kodak RAR 3493. The film is exposed with a SAR data swath and five
auxiliary data channels as shown in Figure 4.1-1. Data swath parameters
are film speed, swath width, range focal length, azimuth focal length,
range spatial frequency range, and maximum azimuth spatial frequency.
Their values are given in Table 4.1-1. Five auxiliary data channels
include radar system parameters, sensitivity time control delay, data and
timing clock, spacecraft mission elapsed time and re-triggered chirp
status. The details of these five channels are given in Figure 4.1-2. The
SIR-A signal has a bandwidth of 6 MHz. This limitation was imposed by the
bandwidth of the optical recorder. In comparison, the Seasat SAR had abandwidth of 18 MHz.
4-1

>-1—I-H
>>-H
1—
OLLUCD
<
zO>— 100oo1— *s
0o;LUQ
*
i ^ ^^
•Q.CU+-> 0^J j ^
^Jto cuto T3(O T-
CJ >o
CU S_> Q_OE -oCU Cry (O
00
1—S- 0CU CJ-u•i- CU
o >0
o a.4- X3
e
to s-o cu
3a. s-•r- 0s_ u+-> cu1/1 o;
T3c
o;LU•a
J
1 1VI
CU (/)> cu§ (J
oa> s-o; Q.
T3cH3
CJQ£LU"a
-i_> 1-4ro •
a.cuQ. O(C 4->
1—0)
CU T3> •!-
§ >O
cu s-rv^ f>_
-a
CJC£.LU•Q
to
Luto
CU to> CU
§ (jO
cu s-Q£ r\
S_O)
JO
0
0S-
oot—CJ
S-cu cu
~O T3••- s-> oO 0i_ CL)Q. Qi
E
•r—LU
a.
S
4-O
Q.0
CU-a
>0s-Q.
T3CrO
oiLUo+•» >— 1
Q.cua. orT3 -»->
1—a>
cu "a> »p^§ >
oCU S-
CH Q-
T3
to<Jo;Lu
<o
1 1to
CU to> CUO (JE 0cu s-a: Q-
cuT3
oCI-
TS
to
Q
(O•
CU *~~i^ •§ 0.
cu oo: •(->
Q)
OS-a.T3c(O
(U 1-> •O Q-
a> o
•otO
co
o
d)<D
OoLOCO
(Ucu
COo
vo
toS-
ooo
<u(U
to
to
'OOO
OJcu
X00
CM
cu<u
oto
toCO
tos_
oCNJ
cucu
ooCO
(T3S-4-
o,—I
X
(0
rOa
<5
cua.to
cuQ.(O
cua.to
cua.tO
cuQ.(O
cu
CU ua. cu(O Q.
io
fO
C_5 OOLU O_l O_1 t-to a:O UJ
Q.
O3
Oo
o
too
oCM
oCM
3o3
Oo
Ia:00
OOQ. UJ
oo
00o
4-2

1.4
m
mm 53 DATA £;*;;;;
;70 mm SiSS
5432
CH. 12,3 ran TYP
5.2
J J
0.2 mi Line W i d t h ,
DATAANNOTATION
CHANNELS
Figure 4.1-1. SIR-A Signal Film Layout
4-3
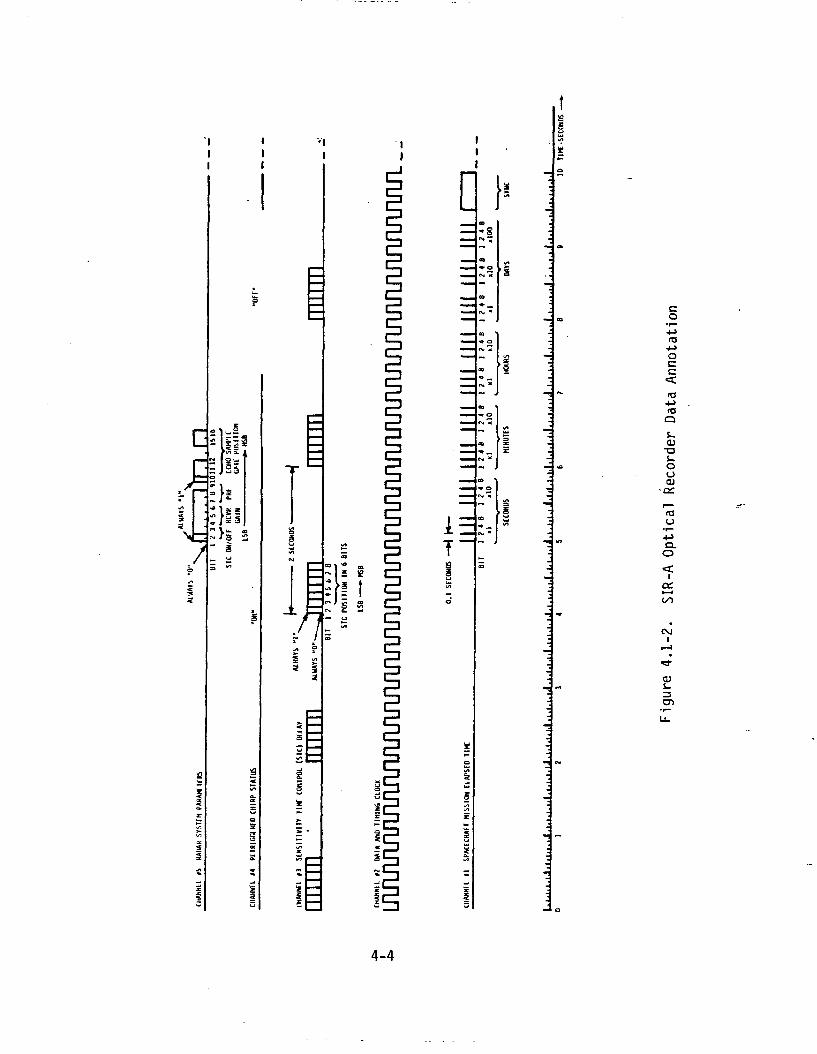
A _ o
* I
2
D
o
03
oc
(Oos_01
T3i-ooOl
<au
a.o
a:
CM
0)
3CT>
4-4

Table 4.1-1. SIR-A Data Swath Parameters
Data Swath Parameters Value
Film speed 37 mm/sec, nominal
Swath width 50.2 km
Range focal length 300 mm
Azimuth focal length 2 meters
Range spatial frequency range 3-34 cycles/mm
Azimuth spatial frequency maximum 44 cycles/mm
4.1.2 GROUND TRUTH AND ANCILLARY DATA
4.1.2.1 Simultaneous or Near-Real-Time Ground Truth. There is no simul-taneous ground truth information required for this experiment.
4.1.2.2 Other Ground Truth or Ancillary Data Spacecraft time, radarstatus parameters, and orbital parameters which will be stored on micro-fiche in real time are required. This information is required to set-upfor SAR data correlation. The microfiche is generated by JSC during theflight and will be sent to the Principal Investigator approximately one to
two weeks after Shuttle landing. The formats of microfiche data aredescribed in the JSC document JSC-16196, October 1979, with letterchanges.
Calibration data on the film will include sensitometric wedges, MTF/ATF
square-wave patterns, and bias only reference, all at the beginning of thefilm.
JPL will receive from the Mathematical Physics Branch/Mission Planning andAnalysis Division (MPB/MPAD) of JSC, a 9-track, 1600-bpi tape which willcontain trajectory and attitude data for the STS-2 mission. This tape willbe processed by JPL to obtain formatted position and engineering data foruse in the correlation of the optical recorder film.
4-5
Other ground truth and ancillary data which has been collected in studiesby each Investigator for his test sites are given as follows:
o C. Elachi, R. S. Saunders and other JPL collaborators
- Lineament mapping in the Knoxville, Tennessee region. Simultan-eous analysis of radar/Landsat/Seasat will be done. This testis being extended to other regions in the Appalachians.
- Texture analysis for surface unit mapping. A quantitativetechnique for texture discrimination is being developed. Thistechnique will be applied using Seasat data over Jamaica,Central America and other Caribbean Islands with heavyvegetation cover.
- Lithologic units discrimination using radar image tone (San
Rafael Swell, Utah). Landsat and Seasat data have beenacquired.
- Classification of volcanic fields and sand dune fields in.. . ..western. U.S. using Seasat-A data. Seasat data and aircraft
scatterometer data have already been acquired.
- Radar data analysis of Geosat test sites.
o H. Macdonald (U. of Arkansas) and collaborators
Arkansas test site: Lineament analysis
- Data set now includes: aircraft L-band radar, aircraft X-band
radar (RAR, SAR), aircraft Ka-band radar, Seasat-A, Landsat andground mapping.
- Detailed report on available data analysis has been completed.
Gulf Coast Test Site:
- Work is in progress on analysis of available data over theLousiana test site: Landsat, Seasat, aircraft Ka-band radar,Skylab, IR color photography.
4-6
- Work has been started on the Houston—Brownsville coast area:land use and and ground cover maps have been obtained, groundtruth checking has been initiated.
Panama and Columbia:
- Ka-band radar imagery has been obtained and mosaics have been
prepared.
- Reconnaissance geologic maps of Columbia test site'are being
prepared.
o L. Dellwig (U. of Kansas) and collaborators
- Work is underway on preparatory analysis of the Baja California
test site using Seasat/Landsat data.
- Work has been conducted on Togo aircraft radar data. Results
will be used in the analysis of the SIR-A data.
- Contacts with Nigerian and Australian colleagues have been
established for support in ground truth activities. Othercontacts are being established with colleagues in Central
America.
o A. England (JSC) and collaborators
- Main test sites are in the Piedmont/coastal plain of the EasternU.S. Fredericksburg, Virginia is being studied in detail. Other
sites are being considered.
- Work is directed mostly toward determining the correlationbetween geology and forest species in the coastal plains and
Piedmont provinces, and how well the radar can detect canopyvariations.
- Work emphasis is on the simultaneous use of radar/Landsat data.
4-7
o G. Schaber (USGS) and W. E. Brown (JPL)
- Quantitative work in'Death Valley is "conducted by using radarbackscatter imaging data.
- Work has been started on the test site in northern Arizona (SanFrancisco volcanic field). Quantitative work will be extended.Aircraft data and Seasat-A data have been acquired and are being
analysed.
- Work on volcanic field is being done in cooperation with JPLincluding classification of volcanic fields radar signature and
quantitative modeling.
4.2 SMIRR
4.2.1 FLIGHT DATA
a. PCM Data. The instrument produces 12-bit PCM data output at 36kilobits per second to the payload recorder. The data are dividedinto 5760-bit frames, each beginning with a 32-bit pseudo-random
noise (PN) word. Each of these frames will constitute one record onthe CCTs delivered after the mission. The data are taken when thecold plate is controlled to 7° + 5°C.
b. Film. One camera contains black and white Shellburst film; the
other, Ektachrome EF color film. The film is annotated with the eventtime in the area between sprocket holes (Figure 4.2-1). Temperatureconstraints on the film mainly concern the time betwen loading theflight film and launch. Once the flight film is installed, it must bechanged if it remains in the cameras longer than three months prior tolaunch or if the ambient temperature of the pallet environment
exceeds 80°F for a cumulative period of five hours. If the palletenvironment is ever warmer than 100°F prior to launch, the film mustbe changed.
4-8

FIDUCIAL
FILM IMAGE
NOT TO SCALE
-f
s sM RH MD D
4.2-1. SMIRR F i l m Time Annotat ion Format
4-9
4.2.2 GROUND TRUTH DATA
4.2.2.1 Pre-Mission Data
a. Rock Tests. On three occasions measurements were made of knownrock and mineral samples with SMIRR in sunlight. Figure 4.2-2 shows acompilation of ratios of the five channels beginning at 2.1 ym. Puresamples of koalinite and montmorillonite minerals and basalt andrhyolite rocks were made in order to obtain data against which tocompare aircraft flight data as well as Shuttle mission data.
b. Aircraft Flight Tests. On two occasions in May 1979 and August1980, SMIRR was mounted in the JPL Queenair aircraft and flown over 10test sites in Nevada and Utah in order to obtain data with which totest SMIRR in simulated flight conditions. Data analysis procedureswere developed and will also be used to reduce Shuttle flight data.Tests also were made of the ability to position the radiometer fieldof view within the camera images. The aircraft flights were success-ful in all aspects. Figure 4.2-3 shows a segment of a flight lineacross the Lone Mountain, Nevada Test Site. Two major rock unitsconsisting of a limonitic marble and a limonitic granodiorite werepresent, and in Figure 4.2-3 a plot of the ratios of the two shortwavelength channels and the two long wavelength channels are shown.The short wavelength channel data, equivalent to Landsat bands fourand five, do not show separation between the marble and the grano-diorite. However, the long wavelength data show a clear separationbecause of the sharply reduced reflectance of the marble in the 2.35micron carbonate band.
4.2.2.2 Post-mission Data
a. Calibration. SMIRR will be removed from the pallet at KSC anddelivered to JPL. A post-flight calibration will be made using theinternal calibration lamps and the light cannon. Rock tests with thesame samples used in the preflight rock test will be made. Thesetests will point out any anomalies that may have been present duringthe flight.
4-10

NORMALIZED TO FIBERFRAX
2.0
1.5
1.0
0.5
ccQ 0ui
ccoH
2.0
1.5
1.0
0.5
ALUNITE
KAOLINITE
:!LLITE
MONTMORILLONITE
I I I I
I I
- BASALT
- RHYOLITE
- CALCITE
~ CHALK
- ST. PETER'S SAND
I I I J I I
2.10/2.17 2.10/2.22 2.17/2.20 2.17/2.35 2.20/2.352.10/2.20 2.10/2.35 2.17/2.22 2.20/2.22 2.22/2.35
FILTER RATIO
Figure 4.2-2. Final SMIRR Rock Test
4-11

CM _r~
00q
8 *
03T3(O
0
GOSt.fo
§
OJeo_JI
too
ITS
os_
o;a:
fOi
CM
at3CD
ouvd
4-12

b. Ground Truth. Based on the preliminary data processing andanalysis, areas will be chosen within the US and in other importantareas 'in the world for sample collection and measurement. Thesemeasurements will be made in order to verify anomalies and determinewhether they were induced by the atmosphere or a peculiar mineralogyor environmental condition. A portable instrument called the Hand-held Ratioing Radiometer, incorporating the same ten filters found inSMIRR, will be used to make selected measurements of ratios ofspectral bands. These ground truth data will be used in thesubsequent data analysis phases.
4.3 FILE
4.3.1 FLIGHT DATA
The flight data will consist of the following:
a. About 120 imagery frames (100 x 100 picture elements, or pixels)of TV-type (CCD solid-state array) camera imagery, for each oftwo spectral bands, one at 0.65 ^m and the other at 0.85 ym. Foreach band the image (reflectance) will be digitally stored on theFILE magnetic tape. (Lockheed Mark V tape recorder)
b. In-flight feature classification for each of the 120 Earth imagesvia ratioing the two bands of electronic camera data on a pixel-by-pixel basis. The feature classification information is storedon the FILE magnetic tape, i.e., the number of pixels for eachframe classified as water, vegetation, and clouds/snow/ice.
c. 70-mm Kodak QX-824 color film exposures, one image for each set (2bands) of CCD imagery.
d. Time of data taking, referenced to Greenwich Mean Time, stored onFILE magnetic tape.
e. Cloud reference value, stored on the FILE magnetic tape.
4-13

4.3.2 GROUND TRUTH AND ANCILLARY DATA
4.3.2.1 Simultaneous Ground Truth'and'Ancillary Data. THe ground truthconsisting of photographic imagery is supplied by the 70-mm camera that ispart of the FILE experiment. In addition, the MAPS color IR photographywill be examined for possible correlation with the FILE color photographyto possibly provide additional useful ground truth data. Landsat scenes ofsome areas may be ordered post-flight.
4.3.2.2 Ancillary Data. Premission data required consists of the missionprofile and postmission data consists of the mission ephemeris data.
4.4 MAPS
4.4.1 FLIGHT DATA
Primary MAPS data are digitized and stored on a dedicated Lockheed taperecorder that is a part of the MAPS experiment package. The recorder hassufficient capacity for a 105-hour mission. A 35-mm Flight Research Inc.camera acquires overlapping pictures of the underlying surface during day-light portions of the orbit. Camera operation is automatic after turn onof the experiment. The film used is Kodak 2443 Aerochrome, a false colorinfrared film.
The tape recorder survival temperature range is -55°C to +65°C. The filmsituation is somewhat different in that degradation begins at temperaturesabove -18°C (0°F) and rapidly accelerates as the temperature increases.Tests have indicated that the degradation is unaffected by film exposure.For the time periods to be encountered during the OSTA-1 program, it isfelt that the following temperature-time limits will keep the degradationwithin acceptable limits:
T > 32°C 45 days or lessT > 43°C less than 8 hoursT > 54°C less than 1 hour
4-14

4.4.2 CORRELATIVE AND ANCILLARY DATA
The correlative measurements needed for the MAPS experiment will be made bya Learjet aircraft and a Convair 990. The Learjet will operate out ofLeRC, and it will carry a prototype of the OSTA-1 instrument, equipment forobtaining in situ gas samples, navigational information and meteorologicaldata. It is anticipated that the Learjet and instrumentation will be flownin connection with the mission simulation exercise. Weather conditionswill play a major role in the operation of the aircraft. Cloud freeconditions are required for the acquisition of the most useful data. TheConvair 990 is expected to operate out of ARC, carrying instrumentation toobtain in situ gas samples and meteorological data. Ground track estimatesfrom JSC will be used to match the flight path and flight time of theseaircraft with that of STS-2 overpasses.
The aircraft measurements are summarized in Table 4.4-1. GeostationaryOperational Environmental Satellite (GOES) cloud cover imagery will beordered after the data collection is completed to supplement the MAPScamera results. This is desirable but not mandatory. Primary dataanalysis will be done over clear or cloud-filled sites.
NOAA and/or Navy weather data (from the Fleet Numerical OceanigraphicCentral, Monterey, California) sites will be selected after the post-flight data is screened.
Detailed analysis of the Shuttle data will start with results obtained overthe ground-truth sites where the maximum supporting data exists. For localsurface position, the subsatellite point will be required to within 10miles and the spacecraft attitude to within +5°.
4.5 OCE
4.5.1 FLIGHT DATA
The OCE colorimetric data are recorded on the payload tape recorder. Theon-board OCE data system includes a digitizer which pre-processes the 8-channel radiometric signal to 10-bit binary words in PCM format. Thedigitized data along with the selected engineering analog data are fed into
4-15

°0
oo oPO Or-l O
oooo o o
o^ o
o
o+->d)Oto
C_3 O S- CJ QQi IT) 3 Q; CQ«a: oo oo < H-
COOl
C 00
3 n3s- s-
•»-» oCOC 3
1—1 +JQ. COOO<c eCD 1-1
CU CU CU CU CUE S E E Efl3 'O fO tO to
(/I OO OO OO 1/1CO
ccu<u3l/)
OJ
(t3
(1)
S-oo
CO<O
LU
Oo
o o— O - O
r^ o
Ol
I/)o
Q_
cu
•I- r— CUco < -a>v =>
O OOCM n
ccuE
cu•<-JS-03cu
cu
n3
Ua:cu
o oO -!->
cuI U
n3
O i-LO 3OO OO
0) CO f Ooo in
13
too
rtJS-
CQ
COQ.
C r-O «C
«3 •£ C|_CD (J O
3 CCO U_ OCU -I-
i— CO +-> CUQ. <O O CU -OE c -o 3n3 CU 3 13 •!->
OO S- Ll_ +J '•—3 -i- O>
rO tO tO ^~ O &-i- S- <C _l CU
CD CU +-> -- EQ. C CU CU (OE •<- S- T3 OCU O 3 3
I— a. co 4-> ES- 3 CU -(-> Q
_ T- cu s- <o ir> CQi—1|< a Q 1 ro i—
S-
S-
<
co
O)a.o
(O
OJS-
CUCD
ccO)
T33
co
(Oi.cuQ.o4-O
•i- CU
toCQ
-C S_C75O
i— CU4- i—
O) -U•a 3
I/Ic:o
CO C•(-> CUc: oCU d
CU CJS-3 OCO C_>(0cus: i
IM ~--—' Mi-•r- a.(O T3
on3S-
-ac3O
. S-CD
I I
cuT3
O</JO
-atoa:r—to•I- (_)o cCU 3O. n300 _J
coCU
4-16
the payload 14-track tape recorder. The payload tape recorder will be timeshared with SMIRR investigators. For OCE, about 120 minutes of viewingtime containing about 2 billion bits of data are assigned and the data
7 2content is equivalent to a 2.6 X 10 km of ocean area.
STS-2/OSTA-1 has provisions to downlink telemetric data, whenever possi-ble, to the investigators at Payload Operations Control Center (POCC). Thetelemetric data consists of the various temperatures of the OCE system andseveral discrete status indicators in five analog and eight digital chan-nels. These are described in subsection 6.1.5.
4.5.2 GROUND TRUTH AND ANCILLARY DATA
4.5.2.1 Simultaneous Ground Truth. In situ data collection is an inte-
gral part of ocean data gathering. In OCE, the following four in situ datacollection activities are being planned to support the OCE science. Thetest sites, means of collecting in situ data, and participants in the fieldactivities are as follows:
a. Site 1, Off the Coast of Senegal (W. Africa). The objective ofthe experiment is to study phytoplankton population in upwellingareas along the Atlantic Gyre's southward flow. The experiment is aninternational effort in which a West German aircraft carrying NASA'sOcean Color Scanner will conduct underflights to coincide with theShuttle's overflight. An international agreement on this experimenthas been signed between NASA's International Office and the WestGerman Ministry of Research and Technology.
As an alternative, upwelling zones off the coast of Spain are alsobeing considered in the case of adverse weather conditions at theoriginal W. African site.
Participating Investigators:
Heinz van der Piepen, DFVLR, and about 10 others from West GermanyMichel Viollier, University of Lille, FranceH.H. Kim, NASA/Goddard Space Flight Center, Greenbelt, Maryland
4-17
b. Site 2, Mid-Atlantic Warm Core Eddy Rings. The objective of thisexperiment is to study the warm core rings which are located in thegeneral areas of 40°N latitude and 70°W longitude. If the Orbiterflight takes place in September, investigators will make use of amulti-ship operation which is already planned for a time series study
of these rings during this month.
Participating Investigators:
P. Wiebe, Woods Hole Oceanographic Institution, Woods Hole, MAP. La Violette, NORDA, Bay St. Louis, MS
c. Site 3, Off the Coast of the Southeastern US Bight. The objectiveof this experiment is to study the dynamics and biota of upwellingalong the western edge of the Gulf Stream. Shipborne measurements ofchlorophyll concentration and other ocean parameters will be takenfrom the R.V. Bluefin from Skidaway Institute of Oceanography,Savannah, GA, along the Orbiter's ground tracks.
Participating Investigators:
Y.A. Yoder, and L.P. Atkinson, Skidaway Institute of Ocean-ography, Savannah, GAC.R. McClain, NASA/Goddard Space Flight Center, Greenbelt, MD
d. Site 4, Central American Coastal Upwelling. The objective ofthis activity is to investigate Pacific coastal upwelling by correla-ting OCE imagery with chlorophyll and thermal data obtained by ships.The data obtained will be used to verify an upwelling model beingdeveloped by Panamanian, Costa Rican, and U.S. scientists which willhelp local fisherman predict upwelling phenomena. Since 1978, theUniversity of Delaware has been involved in a five year physical andbiological study of the Gulf of Nicoya in Costa Rica. The inves-tigators will schedule some of the monthly cruises to match theOrbiter's overpass tracks.
4-18

Participating Investigators:
Vic KTemas, College of Marine Studies, Univ. of Delaware, Newark,DLM.M. Murillo, Universidad de Costa Rica, San Jose, Costa RicaR. Legeckis, NOAA/NESS, Washington, DC
4.5.2.2 Real Time Weather Coverage and Ancillary Data. In OCE, both in
situ and flight activities will be aided by reviewing the real-time weathersatellite imagery at POCC. A facsimile unit which receives images fromGOES and foreign meteorological satellites will be available to displaythe cloud coverage of the OCE target areas. Thus, pertinent go/no-gostatus will be relayed via telephone link to selected field teams. Arepresentative from DFVLR, West Germany, will participate in POCC opera-
tions and will relay the OCE mission status to a European underflight teamin the field.
The OCE will also use 35-mm photographic film data collected by the MAPScamera on the OSTA-1 payload. The MAPS wide angle field-of-view 35-mmcamera covers the total swath of the OCE scanner and provides usefulinformation, i.e., general siting of the OCE field of view and discrimina-tion of surface and cloud features, continental land features, islands,ships, etc. Thus it serves as a useful footprint camera covering theOrbiter's track.
4.5.2.3 Post Mission Data. OCE investigators need the Orbiter's locationinformation and the solar zenith angle at the times of data taking. TheJSC Mission office will provide the STS-2 ephemeris data within 14 weeksafter the flight. These data will contain the Orbiter's altitude, attitude(IMU corrected), velocity, and the Best Estimate of Trajectory (BET). Theinformation can then be converted into the Earth latitude and longitudecoordinates.
4-19
4.6 NOSL
4.6.1 FLIGHT DATA
The data taken in the NOSL experiment will comprise motion pictures ofthunderstorms taken with a 16-mm color film data acquisition camera andphotocell signals produced by lightning in the same area as the photographsrecorded on a dual channel cassette recorder. The photographs will showthe appearance of convective cloud systems by day and lightning activity inthunderclouds during the night. The data on the tape recorder will giveinformation on the frequency and characteristics of lightning occurring inthe field of view of the camera both by day and by night.
4.6.2 GROUND TRUTH AND ANCILLARY DATA
4.6.2.1 Simultaneous or Near-Real-Time Ground Truth. Thunderstormresearch centers operated by the University of Florida at Gainesville, bythe National Severe Storms Laboratory at Norman, Oklahoma, and by NewMexico Institute of Mining and Technology in Socorro, New Mexico, have beenalerted to the NOSL experiment, and they will make observations onlightning occurring during the OSTA-1 mission. Any simultaneous observa-tions made from these observatories on the ground and from the overflyingshuttle will be of great value in the interpretation of the data.
Due to the characteristics of the NOSL experiment which is determined fromthe weather condition and mission timeline, precise ground truth measure-ment cannot be scheduled in advance.
4.6.2.2 Other Ground Truth or Ancillary Data. Details of the time andplace of thunderstorm observations and noteworthy characteristics of thesestorms will be voice recorded by the crew members on one of the channels ofthe cassette recorder. There will probably be additional data provided onthe operation in the form of notes and interviews obtained during debrief-ing.
Data extracted from Landsat, GOES and any other pertinent satelliteimagery is expected to be used for supporting the studies of NOSL experi-ment.
4-20

4.7 HBT
4.7.1 FLIGHT DATA
A tape recorder in the experiment container will monitor environmentalcondition.
4.7.2 GROUND TRUTH AND ANCILLARY DATA
A record of the Orbiter cabin air pressure and the middeck locker tempera-ture is required.
4-21

SECTION 5. DATA ACQUISITION PLAN
SECTION 5. DATA ACQUISITION PLAN
This section summarizes the intentions for data collection during the
flight, as well as considerations affecting data collection, such as
changes in flight plans, interactions with the Orbiter, and real-time
changes in data plans.
The information in this section is organized by aspects of the Data
Acquisition Plan for the convenience of mission users at the time of plan
operations. The information for each experiment is stated in each subsec-
tion. Since HBT is completely passive in flight and self-contained, it is
not discussed here.
.The prioritization of all the mission targets is summarized in Table 5.0-1.
5.1 PRIORITY COVERAGE BY AREA AND ACTUAL GROUND COVERAGE
5.1.1 SIR-A
The baseline coverage of SIR-A is shgwn in Figure 5.1.1-1.
The data acquisition scenario was developed by the SIR-A team using the
following criteria which are listed in priority:
a. Coverage over the U.S.; data is acquired during all passes over
the U.S. where it is allowed by Shuttle activities.
b. Areas outside the U.S. where a Co-investigator has a test site or
has surface truth data already acquired.
c. Areas outside the U.S. where some radar coverage (Seasat or
airborne) is available for comparison purposes.
d. Areas which provide a wide variety of climatic and surface cover
conditions.
e. Areas where extensive mapping is underway or planned and where
the SIR-A data might be useful on an experimental basis.
5-1

a;oo
N•^•(->
S-oi-o.
tus-re
tno;
o;eCO
Oc_>UJOO
(1) (O <Oa. c s_ uO T3 •!- +J T-
5- •!- to m s_3 t/l C. 3 «+-
UJ <C OO =C <C
O O O O O
CO<C
C
OJ
O O <O -r-••- OO O C 03 r-^ ••"" ro O rOCD T3 i- OJ -I— S_E =4- C S_ 4->
S- E 3•— i— C 1- < <Zto to s». ojs_ i- o» -M -c -c
O. (J <T3 •!-(O •!- o -O•"D i- •!- C
(O (U
Q. O • OOO •<- OO O C
O O O O -t->S_ C
•(-> 3 +-> -M Ol</i i : (/> </i i.(O (3 .n3 •&-O CU O O 3o x: c_j o o
Cao
co -o s» s_ro rjD O Ouu s: 2: z:
O O O O O O
O) OJ <U-C W> -E SI+J c/1 -M +->
O<4- J- M- <4-l|_ O M- >«-O =t O O
O O O O O
I<=c00o
o•in
<D 1— UUJ •!-
C3 S-
1— <C
LU -Cs: -i->i— i 3o: -M oQ. c: oo
CDc -o•:- C
C0 •—
f ^ fOt.
• 4J00 C. (U
ZD O
0 0
*o•r™CO
fO OJU C•r- OS- T3u- c:
Cf 1— (
o o
to•r™r—rai.
-(->CO3
«=co
to• CO
<C
O
toU
s_c
r30
CO+->C 4-O) OC
•1- +J+J COc toO 0o o
• 1-}OO CO. O!
=3 3
0 0
Cen
tral
A
fric
aa
T3 •!-C CO
^ ™S- rdOJ t.^J 4_9
CO C<D O)3 0
O 0
to•r*
roi.•Mco3J|
r—toi.
^_>
^O)
«_>0
oo*
UJ•
oo
4-O
COtoOoQJc^
^_2
t|
4-0
O
COCD
O •!-•r- S-S-4- O)
0 0• O C •!-
3 to S-E Q. QJ
0 g --3
co o O OfO •!-
o +-»0 C
O) •—.C -M4^ ^C
1
'4- T3
o sEO O
•4-> •*->CO COto to0 0
<_) O
^J ^_>CO COto O)UJ 3
0 0
(00)
ro
O)-l->
r—OJ-M
COJQ3CO
OJs_
•r~4->CUJ
o
cu(O
CD4->•»—
reCOJ33CO
OJs_
•1—4_>
cUJ
o
oo
a:UJD-X
Iaz00
o:a:
C_3o
UJ OO I_i a. ooi—i «C O ca
5-2

O)C7>
O)
OCJ
O)
4/J<o
CO
a:(S)
OJ
3CD
8 S °
, bp 'ipnti i 3i|>po»0
5-3

Table 5.1.1-1 gives a listing of all the baseline passes and of the backuppasses. The backup passes will be used in case some of the baseline passescannot be achieved due to unforeseen problems during the mission. Thebackup coverage was selected to provide coverage over geologic regionssimilar to the ones in the baseline scenario. However, premission groundtruth and preparatory work, such as acquisition and analysis of Landsat andaircraft data, will be done only on test sites which are in the baselinescenario.
There is no single site which is absolutely necessary for the success ofthe SIR-A experiment. Because of the limited capability and the uncer-tainty associated with the second Shuttle flight characteristics, thecoverage was selected such that numerous similar geologic regions arecovered. This will allow data acquisition of a wide variety of geologicsurfaces even if a good portion of the coverage is not acquired due toproblems or changes in the orbital parameters.
In case of unforeseen problems or changes during or immediately before theflight the coverage priority should be as follows:
a. Keep at least three quarters of the passes over the U.S.b. Keep at least three quarters of the passes over Central America.c. Keep at least half the passes over Western and Central Africa.d. Keep at least half the passes over South America.e. Keep at least two passes over Indonesia and Australia.
5.1.2 SMIRR
Since SMIRR is not an imaging instrument and it is pointed at the nadir, it
is impractical to choose specific targets. Therefore, general regionswere chosen as primary targets based on the following factors:
a. Geological importance to the objectives of the mission.b. Accessibility on the ground.c. Good chance of a cloud-free pass.d. Variety of geologic units.e. Local sun angle.
5-4

CO
inCM
00
01O)
O)A
(U•o
o co in ro in vo o co co o
«=CI
oo
o•**-.
CO-OO
•i—
CUo.
3O"
A<TJ•MITSO
CT>0) <4
(U•o3
oi.Q.
42°^tO i. .Q CU •
._ . a.
a.cu M- iCU tf. UJS O S
oo
incu
tocui-
•!->•r- •
s-o
cooi— i
1
coCOCMr~4i
VOCM
VO
CO
i—4
O.
ooin0
Oooinooo
oom*O
oo
•S-01
vo
oCMc-41
inenCO
j
i
^COCM
VO
CMCO
CMO_
OO
ino
oo<— 4CM
g
OoVOi— I
g
to•t—Jtoca
r-.
CMin
i
enj.VOji 1i
VO,3.r— (
0
COCM
Q_
in
CO0
0oCMCM
ini — ioCMCMi—4
•t—•r—tO3<a3:
en
0
o
VO
COo
i— iCOco
00
CMO
Q.
in1— 1
«=»•i—4
00enCMVOi— i
in^«1—4VOt— 1
tou•r-S(4
°*CMi— 1
encooi
enrVO
1
encoo
1
CO
CM1
a_
oo
g
oCOi—4
H
OCOCMCO
i—4
•
•OO
CMi—4
OCMi— 1
CO
,>OT™H
oCOo1
1— 1
COo
a.
0CO
•sfO
OCOoooCM
ooVOineni— i
<o•r-1/1CUco-aei — i
*±1—4-
VOO1
oVO
1
1— 1
r-H1—4
rs.COo
Q.
OoCOo
0COVO
oCM
OCOCO« "oCM
•eC•
oo
ini—4
,-j!(•
o •1
vo
O
gt_j
i— i
CMCM
VO
0i— 1
a.
ooin0
inf0CMCMCM
in«3-ini— iCMCM
•
<c•
C_3
VO1— t
VOVOO
1
cnCOo
1
CM
inCO
CO
i—i
D_
in"*
S
o0COinCOCM
inr— 4CO«=»-coCM
•
1•t_j"•
00•
^
t—4
0
o1
r
co1—4
'
O
COco
cninCM
a.
oo0i— i
0COI— 1CO1— 1o5"o
oCOi—4CM
O
i— 1O
•OO•
13
COi—4
inini—4
en,3.i— i
CO,_j.CM
1
VO
CO1
Q.
OCO
g
ini— ienCMCMo
incnCMo
(O•r—
r—to+J1/13<
CO<— 4
(< -rH
enin•-4
oorj-T-4
i
CM
CMCO
1
CL-
IO
COo
in»— iCOo
oCO
mCOo
tofr~_tO_[ »CO3
cnr— 4
infv .
o
ooCO
1
r-4
CMCO
CO
VOCO
a_
in«=!•i— ir— 4
"ini—lcnCO
o
oCO
CM
0
*
OO•
Z3
OCM
CM
01
<*
OCM
1
inr— 41—4
,-j.
co
o.
Ooin1—4
inCO
voo
mCOovo0
•oo•
=
1—4CM
CMCM
CO
COO
O
CM0
i— 1
g1
Q_
OCO
§
Oogo
oCO
oo
tO
CO01coT3C
1— 1CM
CMf0
,_4
00CM
CM
CMCVJ1
^
CO
Q.
**
If)CM
inI— 1CM0COo
oCOvoCO
o
<oo• s£
c ^-•>.oo>
CMCM
1—4VO0
coo1— 1
vo,-f.CM
,x.
1—41
O-
oCO
ini—4
0COVO1— 1CO
oo0COr-4
tOVJ•r—L-C|-<
inCM
CO
o
injCM
cnenCM
^i— i
o.
o0
VOO
in00
i— i
mCM
^1-4
to0
i-4-
CM
CM
O
CM
cnvo
r-t
CM0
1
CM
CMCM1
a.
oCO
COo
oCOcoCO
i —r-4
OOinCM
i— i
•<£•
oo
coCM
r-4J>i— 1
CO
vo1— IJ
o1— 1r-H
'
O
01— 1
0.
oCO
s
oCOCOCM001— 1
ooini— iCOi— i
tO.,—cocuco-och— 1
CM
5-5

CO
LOCM
CO
OO
adi— ioo
o
COT3O
CUCL.
O
to
3CT
rO
rOQ
LO
co
•CDCO <+_-0 £_
CO
CO-o3
-t->
l>c0°_J
cn<U M—
COT3
CO
5
So_1
0
•f—s_ot-
D_
T3
la T "0 CO S
a.
exCO If- r—CO M_ LiJS O S
_
O. "QJ f*
% 0 I—
* ys
fOCOs_"*
4->
-a oo
10
<_|
rH
^t
COCM^^
O
1— 1CO1
s1
Q.
OO
COO
OCOCMOOCM
OCO
^^LOcnrH
rO<r_r_
(OS-
to^
0CO
«3-
CM
O1
rH
0CO
^COrH
O
LOO
a.
LO^~LOo
oor— 1
^fOCM
LOT-H
LOCOOCM
<
°
r— 1
CO
enCM
01
•et,-j.Oi H
of^CO
CM
CM
D-
LO«— '
O
LOrHrHLOCOCM
OOrH
^fCOCM
•
^^•
0~N»
00
rj
COCO
«5f
j^
O1
«sf
LOrH
^^1
rH
COCO
cn
CM
a.
LOrH
0rH
OCO
^^CMrHO
LO^fCOrHrHO
00
Z3
<=tco
O
voo
encnrH
0
.CM
1
CM
LOCM
n.
oorHCM
OCOVOLOrHO
CMO
OCOLOCOrHO
CMO
rO(J
S_
**
CO
LO
LO
O1
CO
rHCO
^^
O
oCO
o
CO
a.
LOrH
CMrH
LO
^-rHCO
§
0COcnrH
O
OO
ID
LOCO
coCO
o1
LO
rHCO
^^
rH
10rH
en
i —co
a_
LOrH
«*rH
OOCOOVOO
LO
^^COLOLOO
OO
Z3
co
t~Q
CO
rH
CM
,-f.O^^
rH
CMrH
CO
§1
Q-
LOrH
COO
LOrH
^O
o
ooVOLOVOo
rO,f—toCO
g-t-H
CO
LO
LOs1
CO
COCM^^1
O,-J.CM
1
rH
rHCO
Q-
LOrH
-j.CM
LOi— 1
^fLO
O
oooCO
0
=co
COCO
CM
CM
O
VO
rHLO
CM
rHCO
CM
LOO
Q.
0O
CMT—4
LO«^rH
^f
rH
LO^*cnCMrH
rH
ro
^<
rH
^-
O
.
o
«3-
COo
rH
0CO
O
COO
Q-
LO«— <
CMrH
O0O
rH
LO
^^p^CM
rH
rOO
'£
=a:
CO
^^
VO
.
.8
CO
enVO
^rHCM
«^
coCO
Q_
OCO
VOo
oorHOCO1— 1
0CO^fLO
rH
rO
^
un^-
i-VO
o1
LO
CO
1
CM
OrH
CO
COO
1
a.
oCO
P^o
0oen
• LOCOrH
OCOrHLO03rH
<
OO
LO
^tVO
-0
CO
,3.oo
1
00
cni— i
rH
VOO
Q_
LO^~
LOo
0COCMCOOCM
LO^»VOCM0CM
<
°
^^
CO
.
o1
r*.CO
0v_/1
i— I
COCM
0
COrH
a.
oo(o
0oVOoCMCM
oocnLOrHCM
•=c(_j
~~-oo3
co
LO
CO
o
oorH
1
o
ro
CVJ
CM
a.
LOrH
OrH
LOrHCM^»COCM
OOOvJroroCM
•^£•£j-v.
OO
^
cn
CM
CO
o1
cnCOCM
i
i— iLOCO
rH
LOCO
Q-
LO*3"
O
LO^fenCMO
CO0
O0enCOCMoCOo
oo:D
rH
LO
O,
O1
rH
CMCO
1
CO
COrH
1
LO
CO
a_
LOT— 1
LOCM
OorHrHVOO
LO«=!•LO^«LO0
^£OO
*=£
oorD
COLO
rH
rH
CO
rH0
LO
OO
1
LOO
1
Q.
OCO
CMO
OCOOLOVOO
ooooVOo
rO•r-toQJ
^~r— 1
COLO
LT)
CO
s
LO
enrH
'
enCMrH
VO
CM
D-
LOi—1
VOO
LO*t^cnCM
o
oCOCOCM
o
<c0
LO
CM
CO
rH
rH
O
enLOCO
CO
cnrH
Q.
LO^*
eno
oCOr*^COCOo
LO^fr^^CMCOo
fO
<
LOLO
5-6

CO
CM
00
OO
OO
o
to•oo
0)Q.
o
3 "CT
lO
tOO
incu
to
*OlCU i*_
^£cu
cuT33
4->
IS
*cnO) 4-
^fe-o
us01-Q
—1
O
+J
s-oS-Q.
5S«T.i i .--Q CD s:
— — Q;
Q.QJ *Jr |—<D <+- UJ5 O S
^O. "QJ «_-
QJ ^"f
35 £M
tO0)
<=C
-w•r~ •-Q 0i» •3*o
ID O
CO «3-r* OO0 0
oo enCT> t— I«3- OO O
1
O i-l• •
ID COCM CM
CO CM
f**« OO0 0
Q- Q.
0 0co o
^^ ^^O t-l
if) ID
CT) CT*CM CMt— 1 «3-«— t t— I
Lf> ID
^- ^f.-H COCM <— 1i-H •*r-< I— 1
to0
IO -i-•i- S-CO CL.< -=C
r^^ cr>Lf> Lf>
ooCMvoo
o0COo
1
o•o
1— 1
o1
Q_
8o
ITS
CTi
COr-H
LD
^fOO
t^COr— (
•<
OO
,—1VO
I—)
0t— 1
cr>o
r^•
0
i
r .CM0
Q_
OOO
ooo
ID
OO<T>t— 1
IDt— 1r— 1OOeni~H
ro•^
CU
0•oc
CM10
t— 1
COVO0
VO
s
00•
CMCM
cn
§
Q.
Lf>1— 1
o
oooCM0CM
ID
^^00I—I0CM
•
•
oov.0
r-H•
CM
^^*
• •ff— xQ_• -
cu•^4->
0)c
OlCOto-Q
^~lO
0H-
00COI—
• •*-ooN.
cue
• r—
Q.3
OfOo
!»»
iO4->O
1—
•.EO
(O^~
r-lOOcr>i— i
A
OooS-O)
JD
CU
Q.CUoo£_o
Lu
•
CUE'£O)COQ.fO
UJ
Co
>r»COco
•r~S
IO
•uE•r-(—
<§Q.Q}
" ~cu00
o
0•r-
Q.
•acooa>co
CM
•acutO
•f—4->(_j(O
CO
CU
to>
T3lO
sr~~
•r*^j^
^
M-•r~
>>•co
cu
<oto•oII
CM
a.• »
o+J
1)
= p
refe
rre
d
da
ta
acq
uis
i
Q.
• «*lOCUS-<o^^s_tO
T3
oCUooii
oo
tOcuiO
^>»-
•r~
D-
II
Q.
>>-<->•r—S-os_
o
J "
CJ_E
cuc
QJ
tQ-Q
C
^0)T5
,HUC
oc
^^^^
cur^to
r«~•r-IO
to+•>os=CO
• t—
^_^
rH^ .
Q.
JZ
i-0
CO•r-
X
V|_CU
Q.
o
A
,g?
r ^j
3Ooo|L
OC|-
(/I
>r—^-^
1
X.
i*-<DS_Q.
CUT334->•i4-1
_J-a
COIOt . i
•r-
X.
(U
a.oc
«>-1-1cu3
i.0
CO*r**
•1
^ —
X
41cuQ.
CUT3
-l->• r^CT)cO_J
cu
5-7

Figure 5.1.2-1 shows the prime coverage expected from the earlier missionorbit altitude. Figure 5.1.2-2 shows secondary targets. The primarytarget is coverage in the Western U.S. since it meets all the above-statedcriteria and many studies have been carried out in this area over the past
10 years.
Table 5.1.2-1 gives a listing of all the baseline passes and of the backuppasses for the SMIRR and OCE. The backup passes will be used in case someof the baseline passes cannot be achieved due to unforeseen problems duringthe mission.
5.1.3 FILE
FILE data taking is automatically controlled. Images are selectivelyrecorded during high-sun-angle daylight, ZLV periods of the mission.
5.1.4 MAPS
Observations and measurements of tropospheric CO concentrations will bemade throughout the Earth-observing period with no prioritization ofcoverage by area. All the data acquired will be used to determine theinterhemispheric mass transport of the gas and to authenticate transportmodels for CO. Actual ground coverage will be determined by the Shuttle'sorbits and the terrain over which the data will be collected will bemonitored by the aerial camera which is mounted alongside the MAPS electro-optical head.
5.1.5 OCE
OCE will take data during the Orbiter's daylight passes over the openoceans. The OCE will focus on several predetermined test areas where in-situ activities are planned. Table 5.1.2-1 also gives the areas chosen forOCE primary and secondary targets.
Figure 5.1.5-1 shows the prime coverage planned from the OCE dataacquisition period for the Atlantic and Indian Oceans and the Pacific Oceanregion. Figure 5.1.5-2 shows secondary targets. In order to maximize theprobability of successful collection of data in the event that adverse
5-8
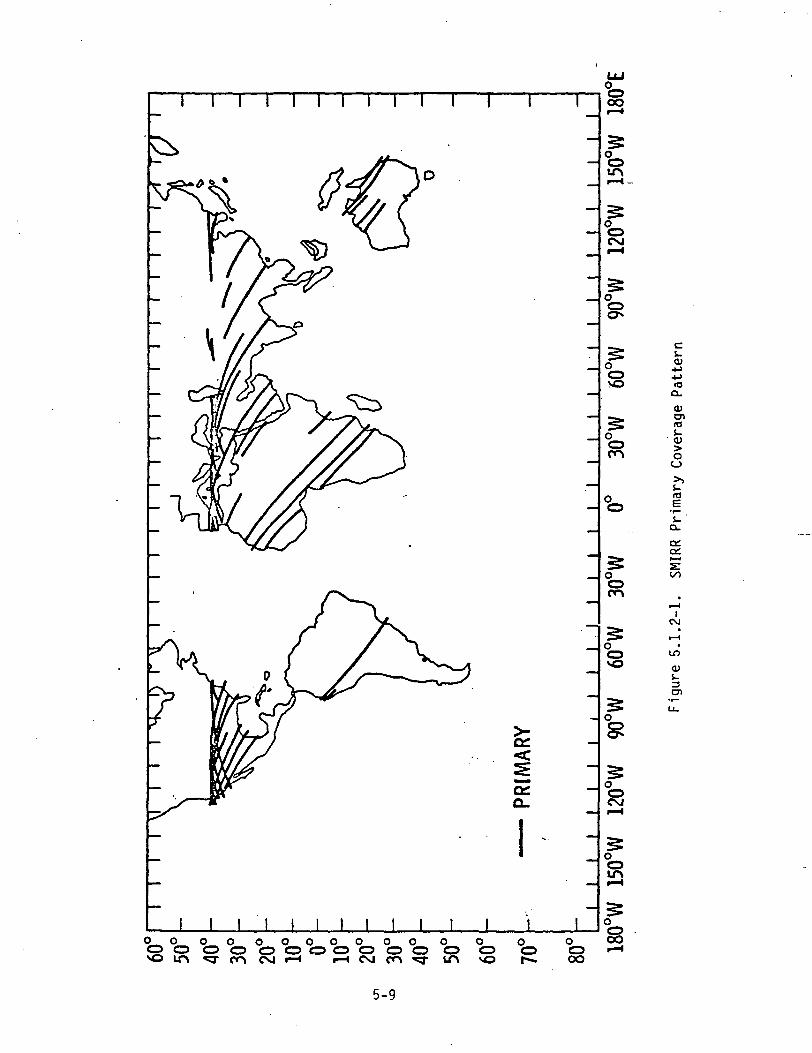
ct:a.
I I I I I I I IO O O O O O O O O O O O O OO O O O O O C 3 0 O O O O O O^o ir> ^3- co <V4 r- < i— i CM co ^r ir\ vo r*«
oO OO
oo
°0
°oCM
oO
°o
°o
oO
i-O)
(O0.
<Dcn<a
OO
IT]
s_O.
toO)s-en
U.
oC3CVJ
oo
5-9
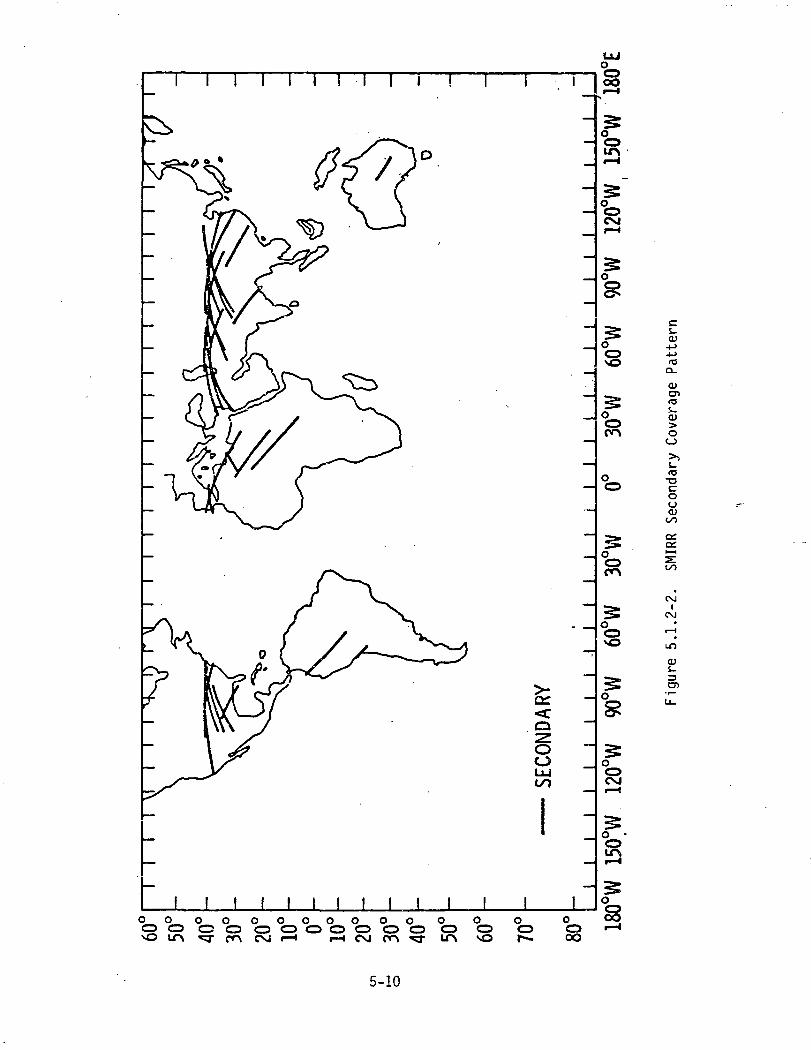
°0CO
oo
OOCM
OC3vO
Oo
°0
cO)
-l->4-><O
O)CT>(O
d)o
(OT3
OO01
a:
iOJ
Lf)
O)
oo o
OCXI
I I I I 1 I Io _ o o o o o o o o o o o oO C 3 C 3 O O O O O O O O O OvO LT> *g- m CVJ i— a r- I C V I C O ^ J - I ^ ^ O
oCDOO
5-10

*!•a "'I
r—enT
infHvo
o
CO
r-.
S
ininCO
OfHfa-
en
CO
CO
inCO
en
5
CO
COin
CM
OCO
CO
to
to10in
eninVO
r-to
CO
enin
toin
to
S
otoCO
ento
CM
S
.a-CM
oCOCO
r.
CO
CO
f-Hto
CM
Oco
0COin
ino
VO
COCO
CM
CO
f»
?o
toCOCO
inen
CM
^
in10in
CO
CMto
entoCO
intoin
«r -a-co c1—•a- co
CM -O-
CO COin TJ-
inf-Hin
q.
i —CO
envoCO
enfH
c o e n c o v o c M c o e o t o» 10
3 5IwOf-H•— 1 8
cor-O
to
S
inin
0inf-H fH
OinfH O
o•a-fH
enino
en§
to§
to§
toCOfH
go
S 80 C
n co§ §
•a-o
§o
c M c n o i o c o i n c o i n o c o c n o o c O f H c o c o c o v oC M C O f H r - . C M c n f H c oC M O c O f H c n r - ' a - c M r - . C M v o c o c o c M O v o c Mf H f H f H f - H O O f H f - H O f H O — — — —O O O O fH
so S CMo
C M C M l O C M C M O C O C O i n f H l O C O C M e M c o c O f H i n c o c n mco •*CO CO
_ . co o en en co co r--C O C O C O C O C M C O C O C O f H f — 4 'CO CO CO
CM co .en c o r - . r - r - . c o v o r - . r —CO CM O f-H CO
co o CMf-4 O CO
vu•a
o to o co t o c o o t o c o o c M C M f - H c O f H O c o e n oCO VO COCO CO CO
in r— o r—CO CO CO CO
r— co coco co co
S.
•a
ki'00
o SOO I
Q
oo
§
%fH
O
o
in
ino
inf-H
5oo
inf—4
COo
oCO
IO
oo
oCO
inO
in
in
oo
in
S
in
•»•CO
So
in
S
co1
coCO
so
in
CM0
infH
IOCO
o
o
oCO
§
%sCM
O
oofH
f—4
OCO
enCO
CO
o
gino
oo
5CO
0
oCO
CMO
in«3-
CMO
in
o
inf-H
CMo
in•a-vofH
in
o
in
ino
infH
COCO
VO
o
°ino
S
Sco
o
ginf—4
in-CO
en
0
o•CO
ino
infH
en
en
0
oCO
CMO
ssCM
O
ooCMo
oCO
COofHCM
O
°r-o
gfHf—4
f—4CM
O
inf-H
COo
in
inCO
CMCM
O
in
f-H
3oinCMCM
o
oCO
inO
ooVOinCMCM
O
in
CMO
OCO
O«—4
g
fH
00
ii
oCO
r-co
s
om
5s
f—4
CO
r-O
in
to
r-O
goCO
S
IOf-H
ss
oCO
COCO
o
ginO
CM
oCO
coCM
CO
g
CO
CO
inf-H
g
in
°•a-fH
in
oCO
CM
to
oo
SCO
in
COCM
en
in
CO
en
gPOoCMO
OCO
*—4O
f-HCM
OCO
COO
f— 1CM
OCO
CMCO
CMCM
infa-inCO
CMCM
OCO
OinCMCM
in
5oo
o.c
< < < «*oo oo oo oo
ex10
O)0.
C•f at— Q}
O OO
10UJ
<u•o
3 cu s:w S <o3 T3 -f>» -i— l/iSi S «*
U
4-
lO
(OS- UJ_ fCU 4->
(O 4-> f 'f 10 'f- lO-r- t/i 10 -a i— <o £1/1 3 d CU 4J Q. O< •* oo s <: oo oo
t o v o r — . r — c o c n o O f - i f H C M c o in' vn vo vo vo
oo oo oo a. oo cu a. a. a. a.
o at•i- a:i. 1—1 OO OO O O O - Q . O O Q . a -
5-11
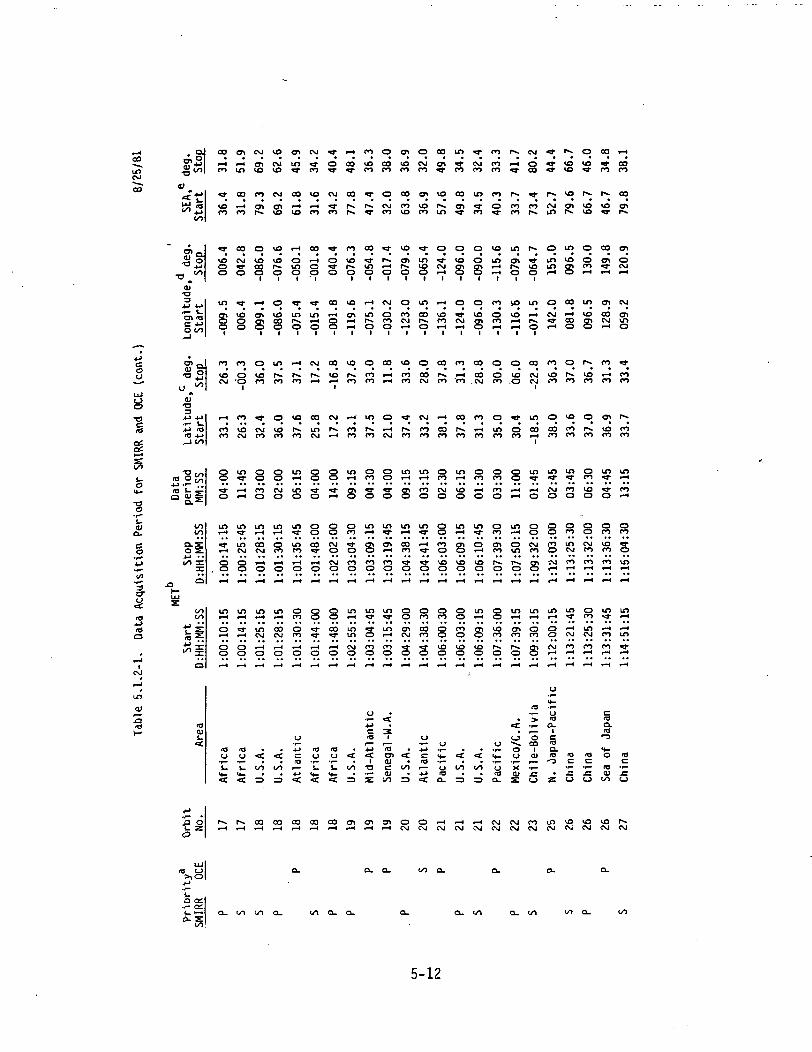
r-H
Cvl
CO
*~*.
4Jc
_S
•ofet— 4
5
u~
10)Q,
§
O
10
O
,1
CM
r-l
in
l—
. 0.
-S«
V
2-#2OO
" ciJS°
*."0)t33
4-> 4->'r- tO> <OC 4->O OO^1
S-cx«2o^cu•a
ss
01
oi1/1 3:
3:
J3 °p-UJ
•t-1 -r-S- &<o 2-
o
<O0)t.
cS
>J•r* •-go
LU
•vs4.o ce•r- c£
CO
ro
CO
•*8
in
roto
i— t
COCO
8o
in
S
.8
inrH
Oi-H
OO
<auU
r^
a_
atrHin
i
tooo
CO
o•o
CO
<NJ
in
rHrH
in
inCM
8
inrH
I— 1
Oo
<o
s-
CM
CT><O
?
atS
oIO
CMCO
8o
in
coCM
*-Ho
inrH
inCM
O
00
co
01
to
S
O
to§
1
in
CO
O
8CMO
in
CO
o
inrH
COCM
i— 1O
01
ca
atin>*
O
inO
rH
CO
CO
ini— i
S
in
inCO
rHO
oCO
8I-HO
u
ca
4->
00
a-
CM
fl-ro
*inrHoi
CM
rH
CO
inCM
8o
8co
rHO
85i-HO
oil
<«-
«fo«T
1
r-*
81
OO
i-H
CVJ
rH
8rH
OO
CMO
CMO
8co
rHO
ui_
<4-
Q_
i— 1
COfl-
o1
at
to
ro
rH
roro
inrH
S
sCOo
in
ininCMo
oo
a.
roto
o
inS
ororo
in
CO
OCO
o
in
SPOo
in
SroO
u
c
4-1
1•a•E
a.
oco
o1
oCOo
corHrH
O
1— 1CM
8o
infl-
rH
COO
in•3-
inrH
COo
<
"iao>ccuoo
a.
aito
0
CMrH
1
toCOCO
PO
inrH
S
in
S
S
8atCM
S
=•
Q-
oCMPO
O1
COr-.O
OcoCM
CM
POro
ini— iCOo
in
rH
S
oro
coCO
S
u4->
01
coat«•
rH1
toPOrH
1
co
CO
1— t
coCO
oPO
CMo
ooCOotoo
oroooto0
u•r-
Sa.
a.
in
S
i
CMrH
1
CO
rH'CO
CO
CO
inrH
too
ini— i
gtoo
83o
oo
Q_
«rCMro
i
tos
coooCM
PO
rHCO
oPO
I-Ho
in
oi— itoo
in
S0
oo
oo
PO
POPO
rH1
CO
orH
1
O
PO
O
inCO
oCO
COo
a>ro
o
8toCO
o
u14-
sa.
Q-
r^
r^CO
O
tovoi—t
O
.s
oCO
8r-Hf-H
i-H
Oin
O
in4-H
8o
•f
ouitCU
a.
CM
Oco
ro
iiinI-H
O1
coCMCVJ
1
inCOi— ii
in
rHO
8CMCO
S
i-H
S
S
03
>
S1
in
*r«»•«r
CM
rH
O
CM
rH
CO
toCO
0
coro
in
CMo
8SCM
inrH
S<M
U
vt-
fOa.i
a.
•z.
a.
r-.
to
to
sCO
io
ro
toPOro
in
roo
inCM
PO
in
rHCM
ro
c
0
01
oto
r^to
rH
inIO
S
r-.toro
O
ro
O
toO
CMPO
CO
OCO
inCM
CO
c.c
a_
CO
*rPO
r~to
rH
atcoCMrH
PO
rHPO
attoPO
in
S
toCO
PO
in
rHCO
PO
ia.«5'-3
14-0
IOcu
oo
a.
rH
COCO
coatr^
rH
CM
ato
»rPOro
roCO
in
COrH
Sin
inrH
rHin
S
c'r-
O
OO
5-12

vo r-i co in co in cn i-i vo o -H co co
gj« T » - < t - 4 l O « a - V O C M O
c n c n v n c n ' » p ~ o c ni n i n c n c M i n c n c n c M
o P"* co co cn coco in «• «• CM cn cn cn co eo p- o cnvo - vo vo «r »r «•
o v o . - i o o c n O P ^ c n O i n c n v oO cn cn in cn ^oo in in cn vo in l O v o i n i n - a - c n c n p - v o c M c o v o T r c n
cn co cn in cn p~ cn oo in cn r» cn in in cn p~
O O r H r - l o O ' - 4 O O i - i O O O O O O O O O i - 4 O O Oi ii i i i i
O O O i - « O O O O O
o> CM o i—i vo «rt—t o *-*• cn en P--o o o o o oI I I I I
o «a- voCM o f-I—t «—l O
cou
•acIQ
CM
CO
HI•o•
a 4->_l OO
O v o v o c M c n c n c M v o c n r - <^ 'CMO O
o vo vo in cn —iP ~ i - 4 C M C O i n v O C M P ~ ^ C O < O V O - V Om c n c M P O c n r t C M r ^ c M c n c n c n i — i
co p^ co i— vo cn
c M O c o m v o c O i - t v o i n i ocn encn cn
PX .-4 vo co in Pcn cn m ro cn cn
p^ co co in «-cn ro cn cn cn
S o i n o o i n o o o o o o o o i n o m o oO ^ H O c n ^ c n o o c n o o c n o ^ r o ^ o o
oovo CM vo in - cno o o o o o
vn CM o-r-< O O
c M c n c M t — i c M r o ^ r ^ mO O O ' H r - I O O O r - l
cn vo cn ino o O o
i.(Ua. 00__.oo
o Soo 3:
a
in
voCM
VO
in
coCM
vo
ooincnvo
o.0..oV
vo
in in
in or-. co
in
CMi— ico
int— i
ro1cn
inf— 4
•a-cn
88cn
8voinO
8SS
ScoCM
CMCM
in
o
CMCM
8ini— t
8
8COi— t
8
8cnCM
o
oo
CM
O
CM
8in
oCM
8«— iinCMoCM
in
inCMoCM
in
eninCMoCM
in
in«— icnOCM
(Oo
00oo
iHIzo
in•a-oCM
VO
in
voCM
^
in
COCM
VO
8inrovo
inr-l
cnin
p-
8coinr-.
in
i— toco
inT— t
«•CM
cn
ini— t
8cn
O ocn of «Tin inen o
8voinoCM
OO
voCM
CMCM
in
S3CMCM
OcnCMo
8CM
OO
vnt— t
ooCM
in
co
r-tO
CM
8cnCM
I—IoCM
8cncni-H0CM
°
§
CMO
CM
8in
0
CM
vn
vovnCMOCM
inr— tOrH
cnO
CM
in<u
"Jo
to rane
an ean
Afr
ica
i. Ui. •!-
CO 4->CU 0) - r - C U <O C 0 4 - » ^ < d < t Ji— to a t— w 4 J < a s _ c - i - > c c o o•O 19 C C T3 to <C -F- ••— 4J ••— -r- to -r- ••- -f•a -p- •!— -I- -o -I— - a - a w i r t j - a r — < O L - I _• i— l / > . C . C T - * / > U J C U C 3 C l . C y 4 J C l < 4 - «*_s « c o c j 2 : = e o o s : i - > « j : o o 2 : « t o o < < t
i -r- • ••a u oo oo
t/> cu oo a.
5-13

CM
co
i—4 rx. m »M ^ ro co co r**?+>\ to ^H O
co ro ror-» Oin vo in CM
•3- co S S
.T+j c n c n c n t - i c M C M c o c o o r^ r^ CM voi n v o v o c o e n c n c o c n c M c n ^ 1
c o i n v o v o v o v o p o i n r v v o c M p o
™ o j d d ^ r ^ c O ^ v n ' o d^•wl c o r - . - - 4 r ^ v o i n i n c o i n, Oil O O «—I O O f-* T-4 ^H •—I" I t i I i i
r*. CM c n v O t — i c n c M C M C O c o c Mvo vo
r * c o v o v o o o o o i n c M * r e nS e n i - 4 « » i o o T O r - 4 i n o r » . i n
O i - H i - H O < - l O O O O O Oi i i i
<U•a
c o O v n v o c n c M « — ic M C O C M e n r - - < r « » -^ H O ' - t O O ^ H r H
P O C O C O C n ^ C M C M O Oi — l O O O i - ' O ' - i O O
en voC M i — 4o o
icno
o vo cor ^ r - I Oo o o
oU
8•o
O co r ,-< CM CM en O O CD O
T3 3 C M r ~ V O O C M C O f l - i n C O r - 4 < - I C M C n v O O 3 C O V O• " ' C O C M C M O t - 4 P O P O P O C M C O C O C V 4 r - 4 t - I O J P O P O
«j- co r»» m oCO CO PO O CM
vU•a
^ .•4-) (a(0 +J—1 01
en
CO
OCMPO
co «re~ 4 in
O r>CM rO f
- in
1 PO
CO
inPO
O
CO
en fin *CO P
» CO
r i-*1 CO
0
ini
«— 4 *
CO rPO r
T CM
-. COH PO
o •«•CO 1~4ro co
CM inPx IOPO CO
^ enco en
^
8
O in ino ^H «r §
in o O<»• co PO
in in in S!S^S82S8g
c M c o v o i n c M P O c n P O C Mo o o o o o o o ^ - i
CM «•o o o .-H i n » — I C M P * , C O < - C M V O C O
o o o o o o o o o
<uO.
(O.)->
a
So 201 3:T:
i—UJ
to01
•M —
i^ =a
oCO
oPO
SCM
in
r-tCM
SCM
8CO
SCM
OPO
S
§
CM
CO
CMCO
g
CM
OPO
SJ
O
CM
85oCM
•a-
PO
i —oCM
8Sr—OCM
in
CO
g
CM
8CM
O
CM
OPO
co*— 4
O
CM
OCO
inin
i—4
CM
CMin
">
CM
8
CM
CO
CM
vn
•a-•—4PO
CM
inf— 4
enCM
CO
CM
in
inCM
CO
CM
in
voCM
vo
CM
in
POf— 4
VO
CM
OCO
voCM
10
CM
8•a-CM
VO
CM
in«— 4
r— 4PO
VO
CM
VOCM
VO
CM
8CO
CO
CM
in.—4
VO(—4
co
CM
8COPO
CTI
CM
in
co•—4
en
CM
in•-4
CMinen
CM
in
vo
en
CM
8coTT
gCM
OPO
VO
OCM
CM
vni—4
OLO
CM
CM
in
•a-oCM
CM
8CMO
f- 4CM
CM
in
SSCM
OO
CMCM
CMCM
CM
82CMCM
CM
in
in1—4
O
PO
8r*rH0
CO
int— 4
cot-H
HO
CO
8VOf— 4
O
PO
8inCO
f— 4O
PO
ooenCM
i— ioCO
8<O
i— *O
ro
tnr— t
r-.roi-HO
ro
ta<uu<
•n.01
=3
tt(U1_
4->01
v>-3
ID
U
<4-
a0,
ro
"ioe*j->rC3
C3
aus_0)
4
01
•r-UroQ.
1
^O.ro
*~3
.,—
Q.1
a.l~3
roc,cu
.
a.icroa.
l~^
ro
i/)<
3
(O01
(O (O rt•f- S- -r-
OS i— i. r—
tO •*- -r-
O y 3 ^ O C O C O C O O « — ( C M C Mro ro ro ro ro ^ ^- ^j- ^
L n v o v o r * . p * » r ^ c o O O O O^ • ^ • T ^ ^ ^ r ^ i n m i n m
o o:•f- at
O O C O Q . O O Q . Q . C U Q - </i a. a.
5-14

couo •o
cu
cn co o 10 C M i n O r H p o o c n o icn to o cn «-H f*PO PO PO ° PO PO
co «r in cn O PO f-4•T PO PO to to in CM
to in PO toco in
O f-" CO PO PO
f-4 f-i co m cnin in PO 10 r—
PO in PO o c o « r i n i o e O r - H r - 4 r oo c o c o t o o c n f ^ i nC O « 3 " t O P O l O « r C M C M § o
co r— o<a to p- to o f-4 in in coCM to co in in to in
O) rts°'.'"
cu•o
•r- S-
C -UO OO
PO
iCM
CO»— 4r— 1
1
inPOtoOi
ini —oi
o
8
•a-CMr-H
1
Q-
PO
o
oCM
8
IO
CMr—4
1
inPO»— 4
cntoS
1
tor-HCMf—4
CM
CM
8
O
«— i
S
ro
ii
in«— t
8
inoinf-4
POr—4
inin
T-H
o>CMr-4
0
CMCMf—4
CM
10O
CO
POinf—4
in
r-H
<0
1
0
1
p^cooo
10
o8
mCMino
r-.cnr-HO
r-H
1
CM
r-p-4O
1
tor-4
§
CM
§oi
•a-ininOi
CM
inOi
cnr-*O
1
coinr-lf-H
1
CM
POtooi
r-.O
1
r-
0
CM
inoo
ro
atCMO
P-.
r- 4O
1
10
oCMr—4
1
01
f—4POr-H
oo
tO r-l Ol i n o i n c M O c n c o c O L n r - H OCM o to in toPO PO CM PO CM
o toO CMI I
c o c o i o p - t o t n « a ' p o « - « S ' O i i n c M « 'C U C M C M P O P O r - 4 P O r - H P O P O C M C M P O P O
I I I I
•o§a:ce
i n o t o o i o i n c o c o t nto m co o p * . t n i O f - H p " . * r p ^ f — i c o p - » p o i o c M C O P - . » < i - c n i n i o
P O P O O O P O P O r O r - H P O P O P O P O C M P O P O P O f M C M P OI I I I
.
OIt-
•g
O ino <s-
i n o o o i n o o i n o i n o o i n o i n o o m i nr - H O O O « a p m o « a - o ^ ' O O r - i o r - 4 o r o « a ' « 5 r
S C M c n c M o o t o p o o P O T 3 - c M i - - r - H C M e n c M i n > a - c o P O C M P o C MO O O O O O t - H O O T - l O O O O O f - H O O O O O O
o•f—4-1
I/I
in in o<a- -a- o
i n i n o i n o o o o o o o i n i n i n o i n i nt — 4 r - 4 P O f — I P O C O O O P O - O O r - H ^ - f - H P O r - H T — I
c M C M T c r c o ^ m i o i o oi n c M C M ^ - i n p O ' j r ' a - C M
C M O C M r o p o < r f ^ O " a - c o c M Or—I <T ^ in f—4 O fH ^T "ST O fH ^
CM CM •* ^ in in P-o o o o o o o
p ~ r - 4 p o « r c o o o o c M OO r — 4 r - 4 f - H r — 4 C M C M C M C M O
«—4 CM CM PO PO inO O O O O O
co n m •ro ro PO ro co ro co co co co co ro *r «^ « - «a-
oo
%%o
inr—4
O
CMO
PO
in
cn
CMoPO
in
PO
§ro
oCO
CJou
§PO
8in
inOPO
ooco
SPO
inr- 1CMPO
O
PO
3inPO
r-.oPO
8PO
SPO
inf— 4
IOr—4
POf-H
PO
in
toPO
r—4
PO
°ScorH
PO
m
80CM
PO
Ooo
oCM
PO
OPO
•a-oCM
PO
in
of—4
CMCM
PO
8Ol
POCM
PO
8o
0
fa-
in
PvJPO
0
fa-
in
O•a-
0
1-
in•»
0
POo•a-
oPO
§POo•a-
in
PO
Sr
ma>
•o^SS-Vcai
CJ
z
,
«*oo
^3
o
C
4->
U
*-%0_
•
•*oo
^
U
•*-
8a.
s iei- CUCU U i.a. T- o
o o u-i- a.
M S 5a. s.
• rO 4-1OO l~3 OO
fa>f—£LUOO
(Q
i.
Ul
<c
,5too.00
anea
n
i.s-OJ4-1
-oSI
CJ U U U•r- -i— O> *•—
ft* 4-J <TJ •*-» • CO 4-12 c u c «c i^ cT3 i— J.. •— OO O •—SM. 4-» If- •*-> • • -M
<C «=C <C <C O 2= <
j a o t ^ r H C M c \ i r o r o ^ ^ - p - v c o ^ ' ~ * f ^ r r > ( ^ * = r | ^ ^ O ' * ^ ' 1 * * f l l i i i - f l l ^ < ^^ z i r i L n i r > i ^ L n i r ) L n i n i ^ L n L n v o u 3 v o i o t o i o v - o v o u 3 \ o v o v o
(X) OO O.. Q.
o Q£•r- QC
ctSoo a. a-
5-15

COco
(/I
CM en
^H cdCO "3-O OI
en >aC +J01/1
U3 IT)• •ro os s.
coo
en
•8s
+J IB«J 4->—1 U1
T O>
O CO
•oo
S ifyr*
co
cr2
a.:o :
J3t—UJs:
r- OO CM
8
O tr>§ •• LO ^H
CO i-t •
in CM en coo .-HCO UJ r-* UJ
UJ i—i UJ i—i
(/>
>>
T3co
V. T3<O CS O
.I
U
n)4JO
OU
II
</1
e 2O. 0.
oc
O en -i-
O O£•i- 01
I- —a- s
0
i.a.c0
4->
t/l
cr^c(O-t-»(013
0£C£i—1
•oO•r-
OJQ.
C0
4-1
VI
3cr^f
(Q.MraOLU
<jc3nj_jt— iCOeni— t*
SL_QJJ3S<u4-1CLOJtO
&.
(O
i_
>^^_
^ss_cuII
Cu
• •>,
*->
s-oi.
QJE^_
0)
Q.(O
UJ
££
O
in
^^
II
I—UJ
s-oM-
VI
1
X
t-(US-Q.
0)•a3
•M(O
I.o<+-i/i
X
u-OJs_a.<u•a3
. >cnco
aicn^2
§4->f<3
OJ
UJ
c3
tO
11
^^LU
8 U T3 01
5-16
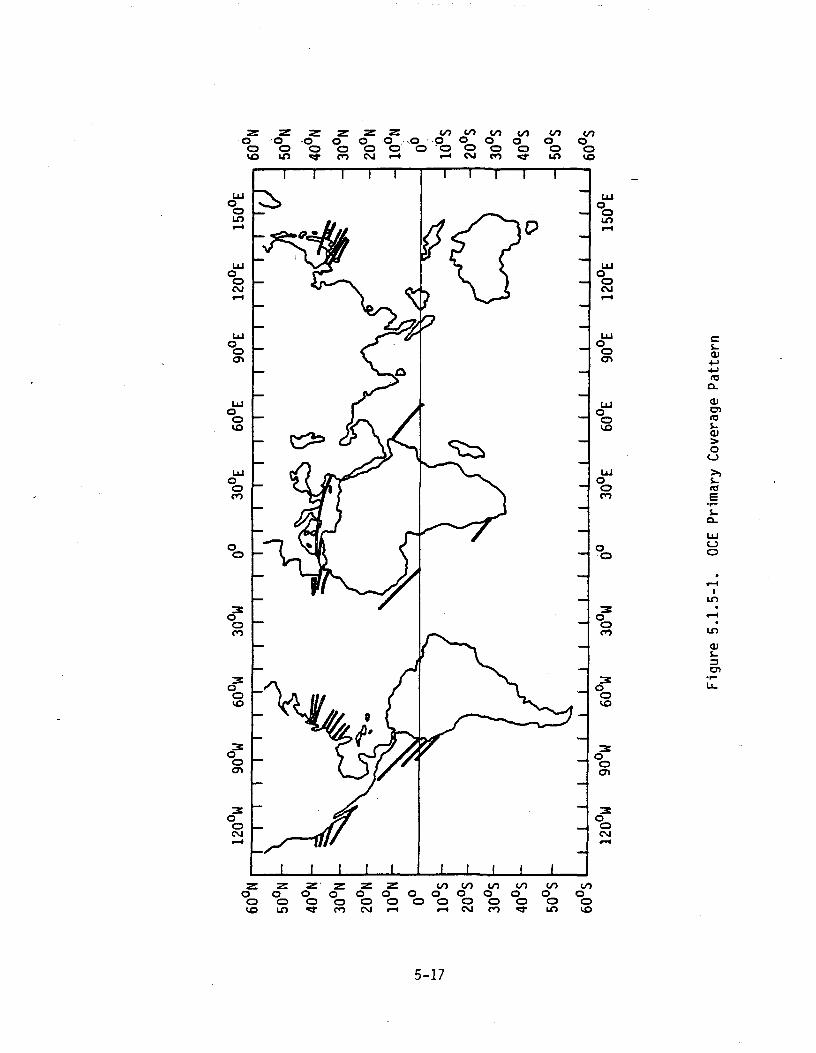
Z Z Z Z Z Z </> C/l to t/) COO >O O O O O O O O O O OO O O O O O O ' O O O O OVO Ui • *T CO CVI
(/)OOVO
cs_CD+J4-1(O
CL
OJenro
OJ
(O
Iin
<u3O)
z z z ' z z z t / > < / ) t n o o < / ) t oO O O O O O O O O O O O OO O O O O O O O O O O O OVO ID «* CO CVJ i—t i—« CM M ^" LO VO
5-17
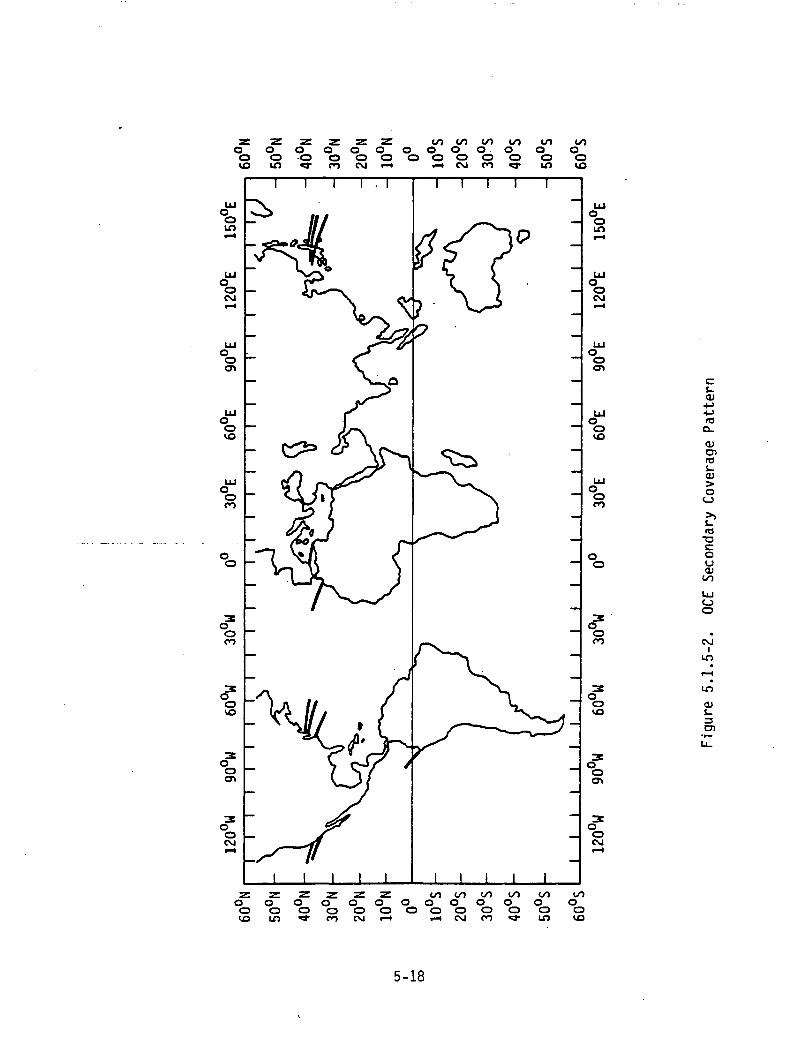
Z Z Z Z Z Z < / > ( / ) ( / > < / ) ( / • >o o o o o o o o o o o oO O - O O O O O O O O O Ovo ir> ^- co CM r-i .-i CM m ^» LO
00oO
O)
COCL<venS-O)
oo
•oou01
oo
CVJI
IT)
<D
en
5-18

weather conditions occur at the designated sites, repeated coverage ofeach designated area is planned as shown in the figures. An exampleshowing the OCE coverage of the areas across the Kuroshio and TushimaCurrent is given in Figure 5.1.5-3.
5.2 EFFECT OF CHANGES IN FLIGHT OPERATIONS
5.2.1 SIR-A
The orbital parameters which are critical to the SIR-A experiment are, inpriority:
a. Low ellipticityb. Shuttle attitudec. Altitude of 150 n. mile with error of + 2 n. milesd. Orbital maneuvers timinge. Inclination
The low ellipticity is essential to be able to process the data nominally.Larger orbital ellipticity will lead to additional doppler shift which canonly be partially accounted for. This will lead to a degradation in the.image quality. The limit on ellipticity is less than 0.0002.
The Shuttle attitude is important for the proper setting of the sensitivitytime control (STC). It is essential that the following requirements aremet:
a. Antenna pointing angle is 47° +_ 2° from vertical.b. Pointing angle drift rate is less than 0.05°/sec.
The Shuttle altitude determines the set-up of the pulse repetitionfrequency (PRF), STC and receiver gain. It also determines the on-offsequence. The SIR-A sensor can nominally accommodate all altitudesbetween 125 nautical miles and 160 nautical miles, however the sequencewhich will be loaded in the sequencer corresponds to the nominal altitude.Any variation in the altitude requires MET updates and commands for properoperations. The details are provided in the "SIR-A Mission OperationsProcedures Handbook".
5-19

o
-cto3
c
o
00e
e
O)-c
0105tr<D
O
to
to
Ien
5-20

Small changes ir. orbital inclination will require updating the MET to makesure proper coverage is achieved. This will lead to a slightly differentspatial coverage; however, this is not critical to the success of theexperiment.
5.2.2 SMIRR
The major requirement for SMIRR is that a relatively high inclination be
chosen for the mission, such as the 38.5°inclination chosen for the OSTA-1
flight. The data quality is not affected by a change in altitude of + 50 km
and variations in attitude within the nominal values. Changes in altitude
affect ths ground IFOV and variations in attitude are recorded by the
cameras.
5.2.3 FILE
Orbiter flight attitudes can affect the data acquisition plan of FILE.Launch slippage to winter will result in poor lighting and snow cover, bothnegative impacts.
5.2.4 MAPS
Since the atmosphere is a dynamic system that is global in nature, it isimportant for the MAPS experiment to survey the entire subsatellite area asthoroughly as possible. In order to carry this out, it is planned that theexperiment will be turned on as early as possible during the flight andwill remain on as long as possible while the bay doors are open. If theinstrument is turned off for any reason, approximately 1 hour of data islost while the instrument warms up and is recalibrated. The instrumentwill not be damaged by short periods of direct solar viewing (the roll rateshould be greater than 0.2 deg./sec. while rolling the field of viewthrough the Sun). However, under normal conditions, if the instrument isturned off, the mirror should be placed in the "STOWED" position.
5.2.5 OCE
The following changes in flight operations will influence the OCE's dataacquisition capability: 1) any Shuttle maneuver which causes the
5-21

spacecraft to go out of the ZLV mode will prevent OCE measurements; 2) alldata-taking presupposes a 280-km altitude for the platform; during theOMS-3 to'OMS-4 or -5'maneuvers, data taking will be'precluded; 3) duringRMS maneuvers, data acquisition will be interrupted when the mechanicalarm blocks the field-of-view.
5.3 CONSTRAINTS DURING DATA COLLECTION
5.3.1 SIR-A
During the SIR-A sensor operations, the following constraints must be met:
a. No water dumpsb. The RMS arm cannot be on the same side of the Shuttle as the SIR-A
antenna during data collection.
5.3.2 SMMIR
The constraints of SMIRR data acquisition are
a. +80° sun angleb. ZLV orientationc. No data acquisition within 10 minutes of a water dump.
5.3.3 FILE
The experiment operates automatically after initial crew activation.
There are no scheduled crew activities.
5.3.4 MAPS
The MAPS experiment is not particularly sensitive to orbital parameters.The inclination affects the latitude belt covered and the altitude affects
the size of the instantaneous field of view, but the variations likely tobe encountered on the STS-2 mission should have only minor impact on theexperiment. In the interest of simplicity in the data reduction, it isdesirable that the vehicle Z-axis be aligned to local vertical within 5°;however, known misalignments of up to 20° could be handled by the use ofsomewhat more complex data reduction techniques.
5-22

5.3.5 OCE
The OCE is particularly sensitive to orbital parameters. Several majorconstraints that will limit data acquisition during the flight are cloudcover of target areas, direct sun-glint from the sea surface into thesensor and the Orbiter's altitude and attitude. Orbits have been selectedwith solar zenith angle in the range of 30° to 60°. Changes in altitudeseffect the ground resolution.
The OCE data-taking should be aborted if unscheduled Orbiter effluentdischarge occurs. The salient instrumental feature of the OCE is a fullyrotating scanner mirror with a dielectric coating on. the surface. Thismirror is extremely susceptible to contaminants such as water vapor orother degassing chemicals. Whenever this happens, the scanner hatch doorshould be securely closed and data-taking should be postponed.
5.3.6 NOSL
During the NOSL operations, the constraints are: Modulated light fromlights or CRT must not be allowed to reach photocell detector during datataking. Reflected light from surface of windows may interfere withphotography particularly during daylight operations.
5.4 IMPACT OF CHANGES IN DATA ACQUISITION PLANS
5.4.1 SIR-A
Changes in the data acquisition plan will have impact on the SIR-A
operations. Any change in the data acqusition plan will most likelyrequire changes to all or some of the following SIR-A parameters: turn on
time, turn off time, STC location, PRF and receiver gain.
5.4.2 SMIRR
The investigators understand a need for flexibility in data acquisition to
accommodate mission requirements. Since the data acquired are of an
exploratory nature and no specific test site is being sought, other than
the western U.S. region, changes in data acquisition plans do not strongly
affect the success of the experiment. However, significant reduction in
5-23

the time allotted to the experiment will reduce the value of thestatistical sample of reflectance data acquired on a worldwide basis.
5.4.3 FILE
The experiment is designed to obtain data over a statistically significantmix of the major Earth Features, which can be expected from a typicalShuttle mission, provided sufficient ZLV time and sun angle of 40° orgreater (from horizon) is available and the Shuttle orientation is notchanged frequently. Significant reduction in ZLV time can reduce thevalue of the statistical sample of reflectance data acquired on a worldwidebasis. Out-of-ZLV maneuvers or other attitude changes of Shuttle on thedaylight side can cause loss of data—loss greater than would be repre-sented by a linear proportionality to time out-of-ZLV.
5.4.4 MAPS
Any loss of viewing time for this experiment results in a loss of data.Such losses are particularly important on the second and third days of themission since there is some overlap in the ground coverage of days one andfour. ~™~
5.4.5 OCE
Real-time coverage of target areas via weather satellite images is beingset up at POCC so that the investigators at POCC can advise the missionmanager of cloud coverage in the test areas and assist in making go/no-godecisions concerning changes in the data acquisition plan.
The OCE will focus on the preselected test areas where in-situ activitiesare planned. In order to maximize the probability of successful collectionof data in the event that adverse weather conditions occur at thedesignated sites, repeated coverage of each designated area is planned.
5.4.6 NOSL
Changes in the data acquisition plans generated either by the astronauts orat POCC should have minimal impact due to flexibility of operation.
5-24

5.5 USE OF ORBITER DATA RESOURCES
5.5.1 SIR-A
No use of Orbiter data resources is required.
5.5.2 SMIRR
SMIRR data are stored on the flight payload recorder. The present flightplan calls for approximately 5 hours of data acquisition from the radi-ometer. The film cameras have a capacity for 6 hours of data taking.
The recorder is shared with OCE. SMIRR has been allotted 315 minutes ofrecorder time at 6 in/sec.
The crew command capability is used whenever available. However, SMIRR iscompletely autonomous through use of ground commands, stored programcommands and the instrument sequencer.
5.5.3 FILE
There is no requirement for use of Orbiter data resources.
5.5.4 MAPS
The instrument contains its own single reel digital tape recorder. No reelreplacement is required during the flight, and no data is transmitted toPOCC. The payload crew operation consists of turning the experiment on toenable the instrumentation to warmup prior to data acquisition, and ofturning the switch off at the completion of the experiment.
5.5.5 OCE
The OCE will use the Orbiter's payload tape recorder to record eightchannels of spectro-radiometric data collected during the mission. Thetape recorder will be time-shared by OCE and the Shuttle MultispectralInfrared Radiometer (SMIRR) experiment. This alternate use is feasiblebecause SMIRR will take data only over land and OCE only over oceans duringsunlit passes. For the OCE, approximately 120 minutes of recording time isallocated. In order to accommodate the OCE 307.2 kbps biphase data rate,
5-25

the Orbiter payload tape recorder will be operated at a speed of 38 inchesper second. Even though data will be limited to 120 minutes (2x10 bits),this period is equivalent to roughly 5 x 10 km. in linear distance, withthe Scanner's swath width of 511 km.
OCE is a preprogrammed experiment with crew command control optional.
5-26

SECTION 6. PAYLOAD OPERATIONS CONTROL CENTER

SECTION 6. PAYLOAD OPERATIONS CONTROL CENTER
The Payload Operations Control Center (POCC) at JSC is designed to perform
the ground operations for the Shuttle flights. Therefore, the OSTA-1
operations shall be conducted from the POCC. All payload real-time opera-
tions commands and timeline changes will originate from within the POCC and
provide interfaces to the Mission Control Center (MCC) with the intent of
optimizing the payload science return. The POCC staffing will include the
Program Scientist and Program Manager for OSTA-1 from NASA Headquarters,
and the POCC Director and his POCC team, consisting of Mission Scientist,
Science Planning, Experiment Systems Support, Principle Investigators, and
Payload Command.
The interfaces between the Space Transportation System (STS) team in the
MCC and the OSTA-1 team in the POCC are shown in Figure 6.0-1. The
services required, command and control, and operation and real-time
decision for the operation of experiments at the POCC are summarized in
Table 6.0-1. The requirements of each experiment on the POCC are described
in the following subsections.
6.1 SERVICES REQUIRED FOR MISSION
6.1.1 SIR-A
The services required for the SIR-A at the POCC can be divided into the
following categories:
a. Mission activities update - The status of IMU, water dump, pay-
load door activity, RMS activity and non-planned attitude change
(from ZLV) are required to be reported to the SIR-A experiment
team.
b. Orbital element update - The orbital element information such as
semi-major axis, eccentricity, inclination, and mean anomaly
should be provided.
c. Command and control interface.
6-1

co
o a:< LU -»OCJQ—I i—i O>- LU U_^ CUl *Hm^a. o
co
o: e>o oo a:a: o.Q-
CJOQ_
o i— oo o s;O LU ZQ. ai co
a«f.
z o«C —iUJ >-t- «£
a.o a:a: oj- u.z coo LU z<_) O O<c •-.I— Ll. I—z ex: «co UJ a;•-i >— LU—i^a.U-l-l O
i— o
co
0
CO>•co a
—i o<: oa.
ce.f- cou. a.o -s.
coLUI—CO
CO
•a:CO
ox coUJ >-s.
a o co<£ sO «.UJ— I Z H->- CJ CO<C UJ >-a. 1-4 co
2. LU Q*-« LU gC£. Z gLU 1-1"-^^ C^ ^*~x z
co o t—iH«s: \-O O «£LU —i ega: >- LU>-. <: a.a o. o
to zCOLU
CO
CO
Q. <<: f-z oo
ce. oi—•S CO
LU COO >-o co
I-CM
LU C£Z LU-I—I LU |
LU i—i !r\ i n *X Z
LU IXCJ LU-JTz z 2LU Z fe
CO
ZI—I•ZLZ
_lO.
LUa:
co
U. CO
"CO_1 D-co ooz •
co«t coi
O£ »—t-i caco z
co
2^^J— ^j O
DC ^~ oS
o oo <
< Oa. <_>
•a:CtLLUQ,O
o
COo:—i o< i-
CJ l— iZ H-•-. COIX uia. •>
COzoI-*COl~(oLUoLUCJ
CO
6-2

Table 6.0-1. OSTA-1 POCC Activities
INSTRUMENT
SIR-A
SMIRR
MAPS
FILE
OCE
NOSL
HBT
COMMAND ANDCONTROL
o Crew Commando Stored Program
Command
o Crew Commando Stored Program
Command
o Stored ProgramCommand
o Stored ProgramCommand
o Crew Commando Stored Program
Command
N/A
N/A
OPERATION ANDREAL-TIME DECISION
Corrective actionsare applied for anyanomalous behavior
Secondary targetsare chosen becauseof excessive cloudcoverage
Rebalance command
Optional crewturn-on
Secondary targetsare chosen forexcessive cloudcoverage
Target of opportu-nity experiment
N/A
REMARKS
No scheduledcrew activitiesexcept forINHIBIT/ENABLEfor some RMS OPS
6-3
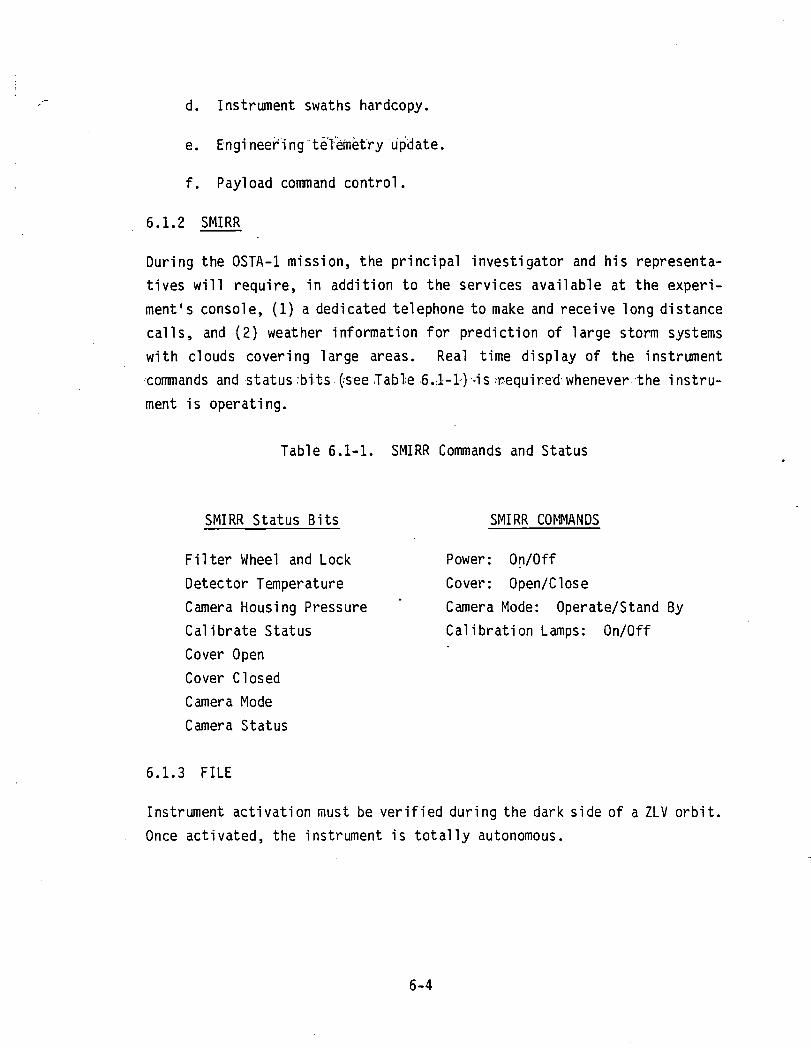
d. Instrument swaths hardcopy.
e. Engineer ing"telemetry update.
f. Payload command control.
6.1.2 SMIRR
During the OSTA-1 mission, the principal investigator and his representa-
tives will require, in addition to the services available at the experi-
ment's console, (1) a dedicated telephone to make and receive long distance
calls, and (2) weather information for prediction of large storm systems
with clouds covering large areas. Real time display of the instrument
commands and status ;bits (=see Table 6.1-1-) -is .-required whenever the instru-
ment is operating.
Table 6.1-1. SMIRR Commands and Status
SMIRR Status Bits
Filter Wheel and Lock
Detector Temperature
Camera Housing Pressure
Calibrate Status
Cover Open
Cover Closed
Camera Mode
Camera Status
SMIRR COMMANDS
Power: On/Off
Cover: Open/Close
Camera Mode: Operate/Stand By
Calibration Lamps: On/Off
6.1.3 FILE
Instrument activation must be verified during the dark side of a ZLV orbit.Once activated, the instrument is totally autonomous.
6-4

6.1.4 MAPS
The pre-launch service required is precalibration of the infrared film.During the mission, the Principal Investigator and his representativeswill require coolant loop temperatures, times of effluent discharges,weather analyses indicating probable cloud cover over STS-2 ground trackfor the purpose of coordinating correlative underflights.
Post-mission services required are processing and sensiometric calibrationof infrared film, ephemeris data (ground track latitude and longitude,altitude and attitude as a function of time), and launch and landingvibration levels. Laboratory and dark-room facilities will be required atDFRC for data strip-out and film removal.
6.1.5 OCE
The services required for OCE operation at the POCC can be divided into thefollowing three categories:
a. Mission Activities Update - The status of the IMU, water dump,data taking activities of_SMIRR.,__and the performance of the pay-load tape recorder.
b. Engineering Telemetry Update - The team requires .the followinghousekeeping telemetry display whenever the Orbiter's downlink ispossible. There are 8 discrete (I/O) status channels and 5 analogchannels as follows:
Status Indicator Scanner door open(Yes or No) Scanner mirror rotating
Channel 5 video signal operatingPCM operatingPCM sync operatingDC power presentScanner power presentScanner AC power present
6-5

Analog Signal Scanner base plate temperature
Main electronic assembly baseplate temperature
Scanner AC current
Total current
Detector box temperature
c. In addition to the above services available at the experiment
console, the OCE-POCC team will require:
(1) A facsimile unit to display cloud coverage of OCE's pre-
determined target areas.
(2) A G4 telephone link from-Goddard1s direct readout station
(WEFAX) to POCC.
(3) Two dedicated telephone links to make and receive long
distance calls to field teams. This includes a telephone
link to the European field team from POCC which is to be
arranged by the DFVLR team, West Germany.
6.2 PAYLOAD COMMAND AND CONTROL
6.2.1 SIR-A
The SIR-A can be controlled in two primary ways: 1) an onboard sequencer
can operate the instrument with appropriate ground initiation commands, 2)
in all cases, ground commands can be sent to reconfigure the sensor setup
and to operate it directly. The SIR-A experiment team will command the
radar system by submitting command requests of the following types:
a. Ground to radar system command (real time command)
b. Sequencer initiation commands (real-time command)
c. Stored program commands
d. Shuttle roll request
e. Crew command
f. Payload operations and real-time decisions (This will be des-
cribed in detail in Section 6.3.1).
6-6

6.2.2 SMIRR
The'instrument commands "are listed in Table 6.1-1. The instrument can be
commanded via the console in the crew compartment, stored program com-
mands, or ground commands. The instrument contains a sequencer that can
command the instrument if none of the regular command options are avail-
able. The sequencer is initiated by a power-on command when the instrument
is in the automatic mode.
6.2.3 FILE
There is an Orbiter crew turn-on command option. The instrument is
otherwise totally autonomous.
6.2.4 MAPS
MAPS, command power can be turned on or off by means of a ground command ora crew-initiated command through the Pallet Control console on theOrbiter. Periodic rebalance of the instrument occurs either auto-matically, every 12 hours, or as a result of a rebalance command from theground at the request of the Principal Investigator.
6.2.5 OCE
The commands of the OCE operation may be performed in the following threemodes:
a. Crew Commandsb. Stored Program Commands (SPC)c. Real-Time Ground Commands (RTC).
For the OCE, no crew operation will be exercised and all the data passes
will be performed via SPC or RTC. The reasons are the following:
a. Because the OCE is a self-contained automated scanner system, a
single step on and off command will sequence the data-taking.
6-7

b. Data-taking will be reviewed at POCC based on real-time cloud
cover facsimile display, and go/no-go recommendations will be
made at POCC. Thus the crew's participation will not be needed.
c. Whenever possible, each OCE data pass will follow the predeter-
mined schedule with one mode of command (SPC or RTC).
The OCE investigators at POCC will advise the cloud-cover conditions of the
upcoming test site to the POCC science planner with sufficient lead time.
6.3 PAYLOAD OPERATIONS AND REAL-TIME DECISIONS
6.3.1 SIR-A
SIR-A engineering data will be received at the POCC during the flight.
These data will indicate any anomalous behavior. Corrective actions could
then be applied for parameter changes.
6.3.2 SMIRR
SMIRR data are not relayed to the POCC and therefore real-time decisionswill be made based on the status information, weather and changes-in-theflight plan. Two persons will be at the SMIRR station at all times duringflight.
Ground commands are used whenever the crew is not available. The sequenceris only used when out of contact with the ground and when stored programcommand storage is insufficient.
6.3.3 FILE
Use of optional Orbiter crew turn-on command is dependent on time of
launch.
6.3.4 MAPS
In normal operation, MAPS command power is turned on or off by the crew as
part of the OSTA-1 pallet activation or deactivation. No other actions or
tests are required of the crew. In the event of significant pallet coolant
loop temperature variations, the Principal Investigator or his
6-8

representative may request a ground-commanded rebalance. In addition,requests for rebalance commands may be made in order to cause the rebalancecycle to coincide with non-ZLV maneuvers so as to avoid loss of data duringZLV maneuvers. In order not to exceed the capacity of the MAPS flightrecorder, it is anticipated that a request for MAPS command power off willbe made during orbit 72. If it appears that significant ZLV opportunitieswill be available later in the mission, a request for MAPS command power onmay be made.
6.3.5 OCE
To minimize data loss, a real-time display of cloud coverage of target
areas via weather satellite images at POCC will be available for guidance
to changes in the data acqusition plan.
6.3.6 NOSL
The operations and real-time decision of NOSL experiment is entirelydependent upon the weather conditions and proposed mission timelines.
6-9
SECTION 7. DATA RECEIVED FROM ORBITER

SECTION 7. DATA RECEIVED FROM ORBITER
After landing of the Shuttle Orbiter at Dryden Flight Research Center, theground crew will enter and remove film, tapes, cameras, recorders, speci-mens, etc., as described in the following section. These data media aresubsequently delivered to laboratories at DFRC, JSC, or PrincipalInvestigator's facilities, or handed over to representatives of thePrincipal Investigators. Data on the Orbiter payload tape recorder areplayed back and recorded. Provisions for handling and transporting thesedata media are also described in this section for each experiment.
Requirements for ancillary data .-which are collected onboard the Orbiter,e.g., environmental history data, are also described in this section.
7.1 INITIAL DATA TRANSPORTATION AND STORAGE
7.1.1 SIR-A
Removal of the SIR-A optical recorder take-up film cassette will occur 8 to72 hours after STS-2 touchdown. A Rockwell International technician hasbeen trained to remove the cassette at DFRC. The complete procedure fortake-up cassette removal was documented by JPL. The procedure providesinstructions for removing the thermal blanket, releasing locking pins,removing the 19-kg cassette and placing it in its carrying case, installingprotective covers on the connectors, taping the loose end of the cut filmto the optical recorder and installing a dust cover on the recorder inplace of the take-up cassette.
JPL will provide technical support at DFRC during the cassette removal fromthe SIR-A optical recorder. In order for JPL personnel to be on standby atDFRC during the removal it will be necessary for JSC Mission Manager (G.Kenney) or his designated alternate to alert the SIR-A Principal Investi-gator (Dr. C. Elachi) or his designated alternate, by telephone at least 24hours prior to the removal of the film cassette from1the SIR-A OpticalRecorder.
7-1

JPL will provide a custom carrying case for the SIR-A take-up-reel cassetteat DFRC. The size of this case is 24 x 24 x 16 inches. JPL will also pro-vide the necessary connector covers, tape and dust covers to prepare theoptical recorder for the flight to KSC. The carrying case will be carriedinto the payload bay prior to SIR-A cassette removal and the film cassettewill be placed in this carrying case immediately after removal from theoptical recorder. The SIR-A flight film cassette installed in the carryingcase will then be handed over to Dr. Charles Elachi or his designatedalternate by Jerry Kenney or his designated alternate via a DD1149. Thefilm will then be hand carried to JPL from DFRC and logged into the JPLSIR-A Data Center in Building 183, Room 713 for processing. After loggingin at JPL, the film will be unloaded from the cassette in a dark room and 15feet will be immediately developed and correlated to verify image quality.
When the signal film is first retrieved from the Shuttle, the cannister isnot only taped appropriately, but Quality Assurance seals are affixed tothe cannister in such a manner that any unauthorized opening will be indi-cated by the seals being damaged. These seals will be signed and dated.The Radar Photo Lab will not accept responsibility for physical defects orphotometric accuracy if these seals are not intact at the time of receipt.
Because of the likelihood that the film preparation procedures will quitepossibly take several days, a safe environment will be provided. The prime
considerations are:
a. The area selected for storage will be a controlled and securedaccess area.
b. Environment.
(1) Temperature and humidity.
The storage area is capable of providing both ambient temperatureand humidity ranges (i.e. 70°F and 50% relative humidity) andcold storage facilities. For environmental preparation of thesignal film prior to processing, the ambient conditions will beemployed. For this section, the term "ambient" refers to the
7-2

established environment of the signal film processing area.However, should the decision be made not to process the film atthat time, then the film will be placed in cold storage. Theconditions for cold storage will be determined by the projectedestimate of time lag prior to processing.A rough, temporary guideline will be:
Time lag before processing Conditions
less than 1 week 33°F - 45°F1 week 32°F
In either case of cold storage, the film will be enclosed in amoisture-proof bag to preclude adverse humidity conditions frominteracting with the latent image. In the case of cold storagefor less than a week, the temperature range greater than freezinghas been purposely chosen to facilitate easier environmentalseasoning.
(2) Light Conditions.
Since the film will be unprocessed, strict darkroom conditionsmeeting the requirements specified by Eastman Kodak for 3493 filmwill be adhered to. In addition, the integrity of the darkroomconditions will be tested with raw film prior to actual storage.
7.1.2 SMIRR
The film magazines will be removed from the SMIRR instrument according toRockwell International Operations Maintenance Instructions. The Rockwellperson responsible for removing the film magazines is Charles Crawford,Mechanical Systems Engineer. The film removal procedure is listed step bystep as follows:
1. Clip thermal blanket lacing cord around camera housing and remove
cord.
2. Gently lower MLI flap.
7-3

3. Unscrew the pressure release bolt' until the pressure equalizes;retighten the bolt.
4. Unbolt the 20 bolts around the camera housing.
5. Remove camera housing cover.
6. Release catch on film magazine and remove film magazines.
7. Replace camera housing cover and tighten the bolts.
8. Replace the MLI flap.
9. Remove film magazines from Payload bay.
The magazines will be received by a representative of the JSC missionmanager and will be flown direclty to JSC, and hand carried to the JSCphoto lab. It is required to keep the film magazines refrigerated orfrozen except when they are being transported. During transport,surrounding temperature must be under 80 F. Noel Lamar is responsible forprocessing the film magazines at the JSC photo lab. Each film magazineweighs eight pounds and is 9-3/4 x 7-1/4 x 2-3/4 inches in size.
The payload recorder will be played back over telemetry link to theBuckhorn Station, where the data is recorded on analog tapes. These tapeswill be delivered to Kennedy Space Center for conversion to computer-compatible tapes (CCTs). Charles Klein is responsible for this conversionat KSC. Transportation, environmental protection, and security provisionsfor the film and analog tapes are the resonsibility of the JSC missionmanager.
The SMIRR analog data is serial and is divided into 5760-bit frames, eachbeginning with a 32-bit pseudo-random noise (PN) word. This word isAB52D357 (HEX) and should be the sync word for the decommutator. Theformatting and documentation requirements for the conversion to digitalCCTs are listed below:
a. CCTs will be unlabeled, 1600 bits/inch, 9-track tapes.
7-4

b. The SMIRR data will be organized in chronological order on eachtape and from reel to reel.
c. Each group of 5760 bits, headed by the PN word, will constitute atape record.
d. When a break in data occurs due to the end of a data-take periodor due to changing tracks or direction on the payload recorder, afile mark will be written to separate.that data from the next setof data.
e. Each tape will have a double end-of-file at the end of the data oneach tape.
f. The tapes shall be utilized efficiently so a minimum number oftapes are received.
g. If data is lost due to playing back the recorder in only onedirection, CCTs shall be generated for playback in bothdirections. Playback in the forward direction is preferred.
h. No more than four PN (sync) words at the beginning of a data-takeperiod shall be required for the decom to lock onto SMIRR data.If loss of sync occurs, recovery shall occur in no more than twoPN words.
i. Each reel should be clearly,labeled so it can be identified andcompared with supporting documentation.
j. Supporting documentation should include the following:
(1) File identification and event time at beginning and endingof each file; and
(2) Explanation of breaks in data (i.e., payload recorder trackchange, loss of sync, etc.) that are not due to the separatedata take periods.
7-5
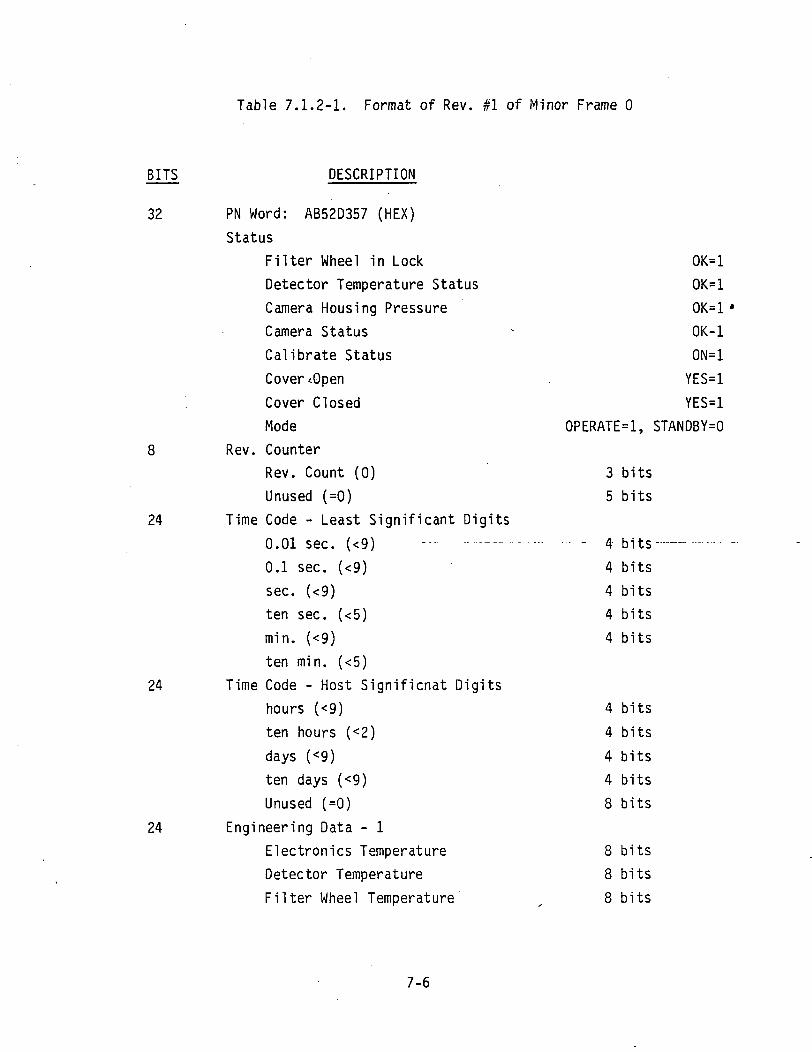
Table 7.1.2-1. Format of Rev. #1 of Minor Frame 0
BITS DESCRIPTION
32 PN Word: AB52D357 (HEX)Status
Filter Wheel in Lock OK=1Detector Temperature Status OK=1Camera Housing Pressure OK=1Camera Status - OK-1
Calibrate Status ON=1CovertOpen YES=1
Cover Closed YES=1
Mode OPERATE-!, STANDBY=08 Rev. Counter
Rev. Count (0) 3 bitsUnused (=0) 5 bits
24 Time Code - Least Significant Digits
0.01 sec. (<9) - - 4 bits —0.1 sec. (<9) 4 bits
sec. (<9) 4 bitsten sec. (<5) 4 bits
min. (<9) 4 bitsten min. (<5)
24 Time Code - Host Significnat Digitshours (<9) 4 bits
ten hours (<2) 4 bits
days (<9) 4 bitsten days (<9) 4 bitsUnused (=0) 8 bits
24 Engineering Data - 1Electronics Temperature 8 bitsDetector Temperature 8 bitsFilter Wheel Temperature 8 bits
7-6
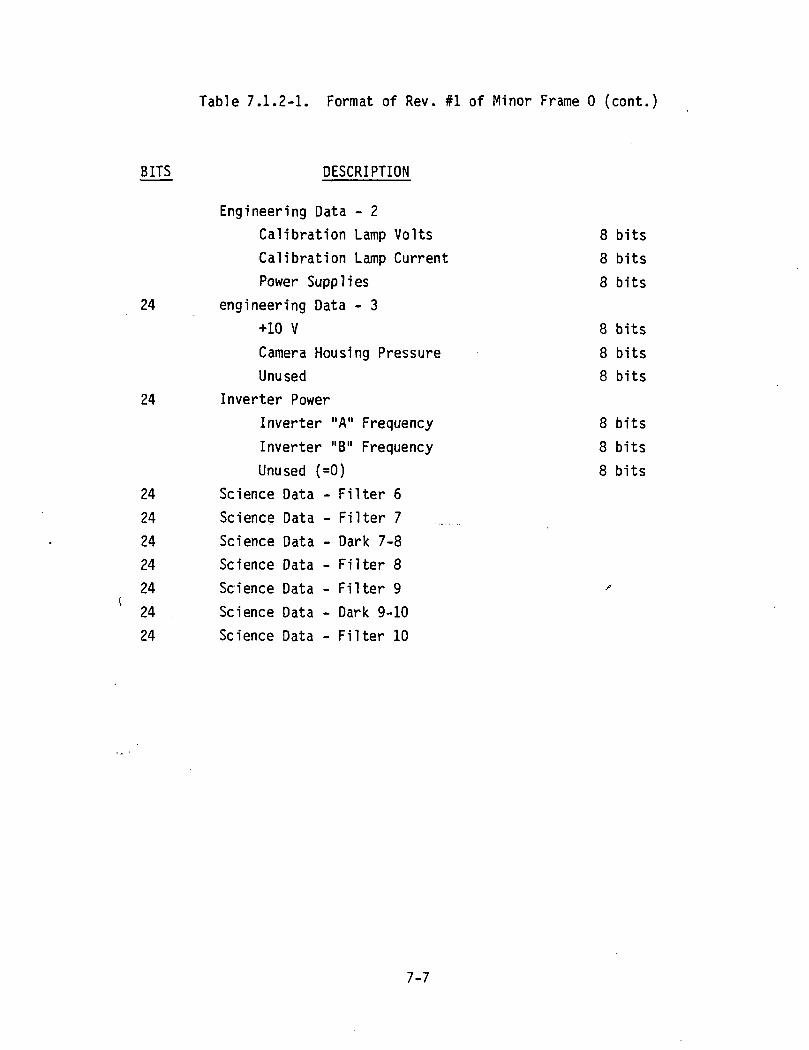
Table 7.1.2-1. Format of Rev. #1 of Minor Frame 0 (cont.)
BITS DESCRIPTION
Engineering Data - 2Calibration Lamp Volts 8 bitsCalibration Lamp Current 8 bitsPower Supplies 8 bits
24 engineering Data - 3+10 V 8 bits
Camera Housing Pressure 8 bitsUnused 8 bits
24 Inverter PowerInverter "A" Frequency 8 bitsInverter "B" Frequency 8 bitsUnused (=0) 8 bits
24 Science Data - Filter 624 Science Data - Filter 724 Science Data - Dark 7-8
24 Science Data - Filter 824 Science Data - Filter 9 '24 Science Data - Dark 9-10
24 Science Data - Filter 10
7-7

Table 7.1.2-2. Format of Rev. #1 of Minor Frame 1-7
BITS DESCRIPTION
32 PN word: AB52D3578 Status (same format as in minor frame 0)8 Rev. Counter
Rev. Counter (1-7) 3 bitsSpare (=0) 5 bits
312 Science DataBeginning with Filter 2
7-8
k. CCTs and supporting documentation shall be delivered to the SMIRRPrincipal investigator or his representative one week after theOrbiter lands.
The SMIRR data format is given in Table 7.1.2-1 and -2.
Terms which describe SMIRR data are defined as follows.
Cycle: 1.28 seconds of data; 128 revolutions of the filter wheel; 8minor frames; 46032 bits. All of the engineering data is contained inthe first revolution of each cycle (minor frame 0).
Minor Frame: 0.16 seconds of data; 16 revolutions of the filterwheel; 5760 bits. Only the status bits, rev. .counter, and PN word arecontained in the first revolution of minor frame 1-7.
Rev. Counter: The term used to define the bits which identify theminor frame number. This term is ambiguous because it is really theminor frame counter.
Revolution: One revolution of the filter wheel; 0.010 seconds; 360bits.
After the film is processed at JSC and the CCTs are generated at KSC, the
mission manager will arrange for delivery of these items to the PrincipalInvestigator. The data are expected to be delivered to the P.I. within oneweek of the Orbiter landing.
Flight data will be hand-carried to JSC and KSC. CCT's and processed filmswill be shipped to the Principle Investigator by air freight.
7.1.3 FILE
The FILE tape recorder and film camera will be removed at the landing site,
the Dryden Flight Research Center (DFRC) by personnel designated by theJohnson Space Center. The tape recorder will be given directly to experi-ment Investigators from NASA Langeley Research Center (LaRC) and MartinMarietta Aerospace Corporation (MMA, Denver) who will personally transportthe tape recorder to MMA, Denver. At MMA, the FILE tape recorder data will
7-9
be processed to produce 4 copies of 9-track computer tapes of the FILEdata. Two tapes remain at MMA and 2 tapes plus the FILE recorder will betransported by the Investigator to LaRC. The CCT's will then be analyzed
*
both at LaRC and at MMA. The tape recorder, containing the original FILEdata, will be held at LaRC (with no recorder erasure) until the major dataprocessing is complete. The tape recorder will eventually be returned toMMA to be reinstalled onto the FILE experiment.
The film magazine will be removed from the FILE camera and will be taken byJSC personnel (or JSC representative) to JSC, where the film will beprocessed, duplicated, and printed. After film removal, the cameramagazine will be sent to MMA. The FILE film camera (minus film magazine)will be taken by the FILE Investigators to MMA for temporary storage. TheFILE experiment will later be shipped from KSC to MMA.
Appropriate shipping (carrying) cartons for the 70-rnn camera, and taperecorder will be provided at DFRC by the LaRC experiment Investigator. Thepertinent physical parameters, for packaging/carrying purposes arefollows:
Unit Weight Size
Camera 2.7 kg (5.95 Ibs.) 0.15 x 0.10 x 0.12mTape Recorder 2.8 kg (6.17 Ibs.) 0.22 x 0.16 x 0.13m
7.1.4 MAPS
After Orbiter touchdown, at a time to be specified by the JSC OSTA-1Mission Manager, the MAPS tape recorder and camera package will be removedfrom the MAPS base plate. Two Rockwell International technicians have beentrained to remove these items in accordance with procedures MAPS/OSTA-1-003 ("CAMERA PACKAGE INSTALLATION/REMOVAL") and MAPS/OSTA-1006 ("TAPERECORDER REMOVAL").
The removal and details of the transport of the tape recorder and camerapackage to OFRC lab space are the responsibility of the JSC OSTA-1 MissionManager. Immediately following removal of the tape recorder and camera
7-10

package, they will be transported by vehicle to laboratory space at DFRCand transferred to the Principal Investigator or his representative.
Darkroom facilities will be required in which to remove the film from thecamera package. Removal of the film from the camera is the responsibilityof LaRC personnel designated by the MAPS/OSTA-1 Principal Investigator.After removal of the film from the camera, described in MAPS/OSTA-1-004("FILM INSTALLATION/REMOVAL"), the film will be placed in a LaRC suppliedlight-tight 35-mm film can, sealed with black photographic tape anddelivered to personnel designated by the JSC OSTA-1 Mission Manager fortransport to JSC and post-flight sensiometric calibration and processing.The data medium is one 550-ft. role of 35-mm false color infrared film typeKodak 2443 aerochrome. The film is wound on a reel approximately 6 inchesin diameter. Six copies of the film will be made. All copies will beprovided to the Principal Investigator or his representative at LaRC.Copies will then be distributed to individuals by the PrincipalInvestigator.
The strip-out and dumping of the tape recorder is the responsibility ofLaRC personnel designated by. Jthe .MAPS/OSTA-1. Principal. Investigator,, andwill be performed according to Procedure MAPS-OSTA-1-005 ("TAPE RECORDERSTRIP-OUT/REWIND").
This procedure requires the use of the LaRC-furnished MAPS Test Set and theKennedy Incremental recorder, to be located in DFRC-furnished lab space.The environmental controls required during this procedure are temperature,humidity, cleanliness and power suitable for normal data processing. Thedata medium is a 2400-foot x 1/2-inch 9-track magnetic tape to be furnishedby LaRC. Three copies of the flight tape will be made. These tapes will betransported in containers approximately 10 x 10 x 1 inches and weighingapproximately 5 Ibs. One tape will be hand carried to LaRC by thePrincipal Investigator or his designated representative. A second copywill be shipped to LaRC via Federal Express and a third copy via UnitedParcel Service. At LaRC, the tape will be stored in Bldg. 1268 in the tapestorage facilities operated by the Analysis and Computation division.
7-11

All transfer of film and magnetic tape between organizations will be bymeans of Form DD 1149.
The time required for removal of the tape recorder and camera package fromthe STS-2 is estimated to be about 3 hours. The transit time is unknownsince it depends on the location of the lab space relative to the landingsite. The total time required for film removal and data tape strip-out andcopying is approximately 3 hours.
In the event that the tape recorder and camera cannot be removed from STS-2at DFRC, they will remain attached to the MAPS/OSTA-1 base plate andreturned to KSC as part of the payload pallet and removed there. If thetape recorder is removed from the base plate bus and cannot be stripped outat DFRC, it will be hand-carried by LaRC personnel to KSC and stripped outthere, following shipment of the MAPS Test Set and the Kennedy IncrementalTape Recorder.
7.1.5 OCE
The flight 8-channel spectral radiance data in PCM format will be trans-ferred from the Orbiter's payload tape recorder upon landing at the DrydenFlight Research Center. This PCM data dump will be done one track at atime sequentially over the fourteen tracks of payload tape recorder. As aprecautionary measure, the dump will be repeated to create two sets ofduplicate tapes. One of the sets will be processed by KSC as prescribed inthe OSTA-1 mission directives. The other set of data tapes will be madeavailable to the OCE team at DFRC. This data set will be hand carried by anOCE project engineer to KSC (or GSFC) where the OCE ground support equip-ment will be located. The purpose of the OCE use of the data dump is toperform an immediate engineering review of the instrument operation and apreliminary scientific data quality check.
Dave Klein of GSFC, an OCE project engineer will oversee the DFRC payloadrecorder dump and will hand carry the duplicate tape to KSC flying on acommercial airplane. At DFRC, the OCE project engineer will have theresponsibility of verifying the quality and proper waveform of the OCE PCMdata signal during the payload recorder dump as well as verifying the
7-1.2

quality of the signal on the duplicate dump tape. These procedures will beperformed under the supervision of KSC mission personnel.
The time required for these procedures will depend on the facilities atDFRC. The actual payload recorder dump in both the reverse'and forwarddirections will take approximately one hour with the total procedure tomake two dumps taking two to five hours.
The duplicate data will be contained .on 4 to 6 reels of one inch by 9200feet tape of 14 inch diameter. The packaged tape reels will each be in ametal container approximately 1.5 inches high by 16 inches in diameter,weighing about 15 pounds. The tapes will be transported either in thecabin or temperature-controlled cargo bay of the airplane from DFRC to KSCand need to be protected from stray magnetic fields and to be maintained attemperatures in the range of 40°F to 100°F. Humidity must be controlled toprevent condensation. For safety, the OCE tape package should not belocated adjacent to the tape package going to KSC personnel.
\
Receipt and documentation procedures will be controlled by the KSC missionoffice with delivery of the actual tape from DFRC to the KSC missionrepresentative to the OCE team member. Upon delivery of the tape packageto the OCE team member at DFRC, delivery and processing of the OCE tapewill be the responsibility of OCE personnel. Contingency plans will coverpossible delivery of the OCE tape package by KSC mission personnel to OCEpersonnel at KSC. The tape package will become the property of the OCEpersonnel and will be held in storage for one year for emergency use by theKSC mission office.
7.1.6 NOSL
At the DFRC, the magazine remaining in the camera and the tape cassettefrom the Sony tape recorder will be removed by the JSC personnel. The 13DAC magazines in the locker drawer plus the 6 magazines in the storagepouch in addition to the one tape cassette in the storage pouch will alsobe removed. The JSC project office will be responsible for removing thefilm magazines and tape cassettes. The size of the film magazines
7-13

container is 5 x 4 x 1 inches and it weighs 7 Ib. The size of tapecassettes container is 3/8 x 2 x 4 inches and it weighs 2 oz.
The time required for removing the contents of the locker is about 5minutes. Transportation, environmental protection, and security provisionfor the film magazines and tape cassettes are the responsibility of the JSCmission manager.
7.1.7 HBT
The case containing the HBT will be removed at Dryden Flight ResearchCenter by the DFRC ground crew within one hour after touchdown and will beturned over to the Principal Investigator via the Mission Manager. Thetemperature recorder will be removed by the Principal Investigator andwill be sent to Ames Research Center for readout and ultimate turnover tothe Principal Investigator.
7.2 ENVIRONMENTAL HISTORY AND OTHER ORBITER SUPPORT DATA REQUIRED
7.2.1 SIR-A
Support data required by the SIR-A experiment are described in subsection4.1.2.2.
7.2.2 SMIRR
The following environmental data from the mission are required: cold plate
temperature, launch and landing vibration levels (mechanically and
acoustically induced), and the time of effluent discharges when the cargo
bay doors are open.
7.2.3 FILE
Support data consists of ephemeris data and Greenwich Mean Times for the
flight. The environmental parameter that could have the most influence on
the FILE data is temperature. The color film may experience higher
temperatures during prelaunch, reentry, and postlanding than are ideal,
causing some color degradation. Time histories of the temperature and
7-14

humidity of the cargo bay would be requested from JSC if this is found tobe necessary for data analysis.
7.2.4 MAPS
The environmental parameter that will have the greatest influence on thequality of the data is the temperature. The film is most affected, hightemperatures causing rapid color degradation. Time histories of the cargobay will be requested from JSC if this is found to be necessary.Consideration is being given to the application of peak temperatureindicating strips to the inside of the film cassette.
7.2.5 OCE
The OCE scanner's preferred operation temperature is in the range of 15°-30°C for normal operation. The instrument may become out of calibration ifthe environmental temperature exceeds the temperature limits of -20°C to50°C. Time histories of the pallet temperature which exceed the abovelimits should be made available to the OCE team.
Also the time of the Orbiter's effluent discharges (for the reasons givenin 5.3.5), the Orbiter's launch and landing vibration levels, and otherenvironmental data are required for post-flight instrumental checkup.
Ephemeris data which contains the Orbiter's altitude, attitude (correctedfor IMU) and velocity are required. There is also required location in-formation defined in terms of the Earth latitude and longitude coordinatesalong a best estimated track. This Orbiter support data will beincorporated in the CCT as part of the flight documentation record.
7.2.6 NOSL
The most critical environmental parameter is temperature. Film should notbe allowed t15 minutes.be allowed to remain at temperatures of over 100°F for periods of more than
7-15
7.2.7 HBT
The temperature in the middeck locker for the mission as well as the cabinair pressure are required.
7-16

SECTION 8. DATA PROCESSING

SECTION 8. DATA PROCESSING
Data processing, as used here, refers to the processing of the flight datain the formats and media used during collection, recovery and initialstorage, to produce intermediate data products which can be used foranalysis. This includes film developing, digital data decalibration,correlation with ephemeris data or ancillary data necessary to analysis,etc. These processes are described for each experiment; also, the pro-cessing flows are presented in Hierarchy Input, Process and Output (HIPO)format.
Figures 8.0-1 through 8.0-13 present'data flow diagrams and schedules forthe experiments. These figures give an overview of data processing andanalysis activities. The analysis activities are addressed more fully inSection 10, Data Analysis Requirements.
8.1 SIR-A
8.1.1 INTRODUCTION
The procedure for the photometric handling of the SIR-A film data issimilar to that of SEASAT-A SAR. In the development of the original signalfilm the following parameters will be used by the Radar Photo-Lab as fixedstandards.
a. Gamma (Log-Log slope of the straight line)b. D-max. (maximum density of the straight line)c. D-min. (minimum density of the straight line)d. Base-fog (Density resulting from inherent base characteristicsand development without exposure)e. Mid-range density point (found in the middle of the straightline)f. Temperature
g. Film processing speed
h. + tolerance levels for items 1-7
8-1

03
CDia
o
«3
o•
CO
OJ
en
8-2

i01
§ .uj o
g 8
0)
3•oO)
(O
(C
<CO
.
a:
g_! O
O lu C3 ~
Ul —•CK —1
uj at x xiUl —I —I <
vt
I I
» - » - • £Irt z W» UJ t-
oQ.
CMI
O
CO
O)
3O)
3
"
C K Z 22 2
8-3

01ITS
O
(O
ea:o:
roi
O•
CO
His_3CD
o z xx _i ouj >— aeae b. b.
8-4

io>
O)
T3(U
</)
I/I
»
-tfZa o— i
u. t—o <
oeh - c o& M— _iUJ «ti_> oLU LUa o
(T3
a;a:
oo
IO
*CO
(U
301
O Z>- O— ~^ ^*§ t—
«t
OC O <_) 10
i/i »• tn OZ t— LU OO 10=) V)
«t -5 — to — ' O >-3— JC «t !L — _l _lat — / </i —i*. o<
z
—«t oz »•S ui »in
x<X
—>- z •- O ee_l O b. X 1-0<i-^u >— t—< ii— <j u
z— —uj u. —ix— u-
<c u. a: o —o i— o o <-> z •- u.u. •— oh-</i — J— — oc ui<
u. —it— »— t— o vi ui H- oe z «t— u-in > « n H - z < «t aC C Z t — O * - — O - L J O L U
KUJ t- O <_> •— o z 1/1 — z i/) o _iH- > Z <_) LU O UI S O — 1 «C LU _) Q.(o — — i — i X a- Q . U J Zz a: ui LU ^ o. «t — <— a. vi v> •« < t- u. w
8-5
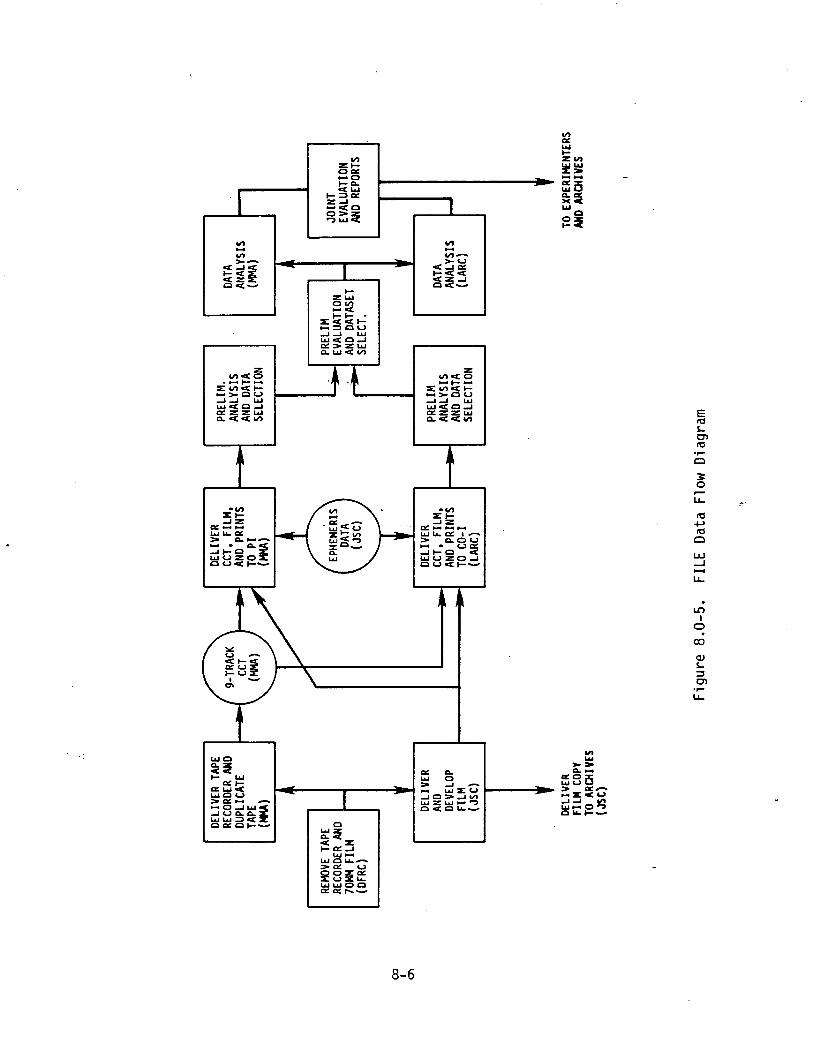
(/>oe
* jcuiO
£2
£gf
TUl5
1Z UJ
V)
>- 1?
rei.
o
fOO
IT)
O•
00
O)
3CD
8-6

oE
(71
3 .3 i
TJO)
Ooo
(O
ro4Jto
<->
oo
ce2
(U
Io
•
03
0)
3CD
oCL.
< _ ) > - . T OLU U. LU ^, <• <oe a. oc t-
X «t at I- <Z t- 3 i aUJS
o-s §o uj
<tfi
¥ oe<" fc£g
<_)m
8-7
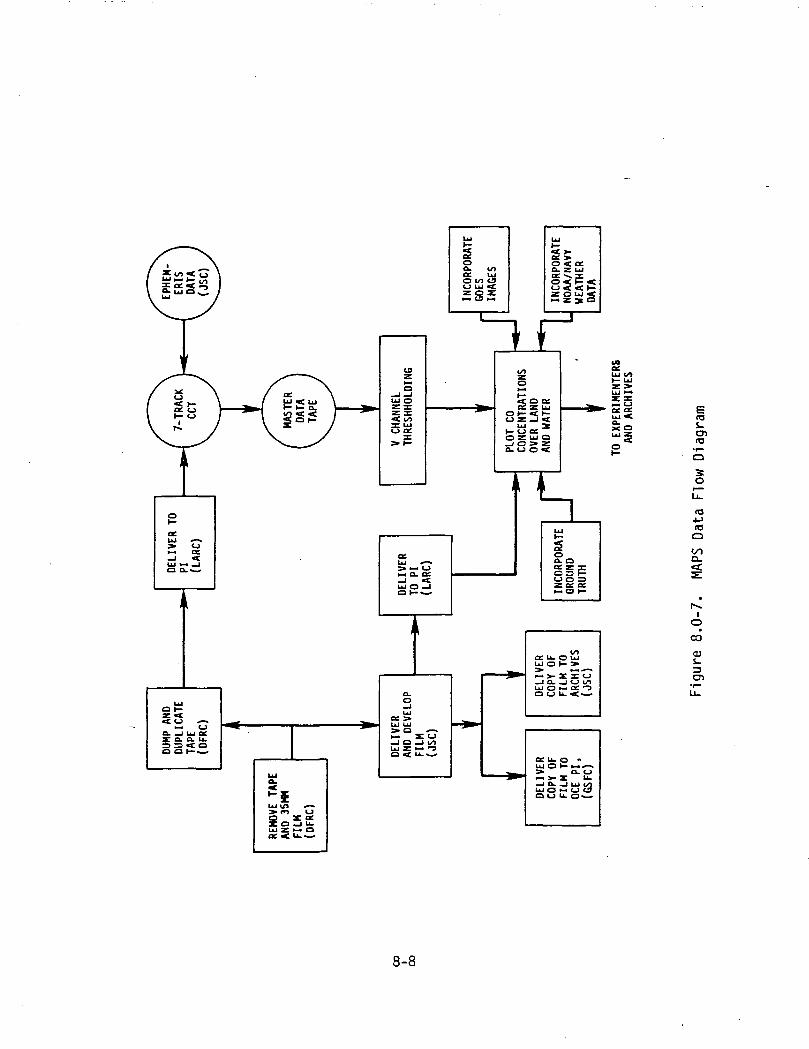
03s_CD
o
CO
onQ_
r .
o•
CO
O)
3cn
8-8
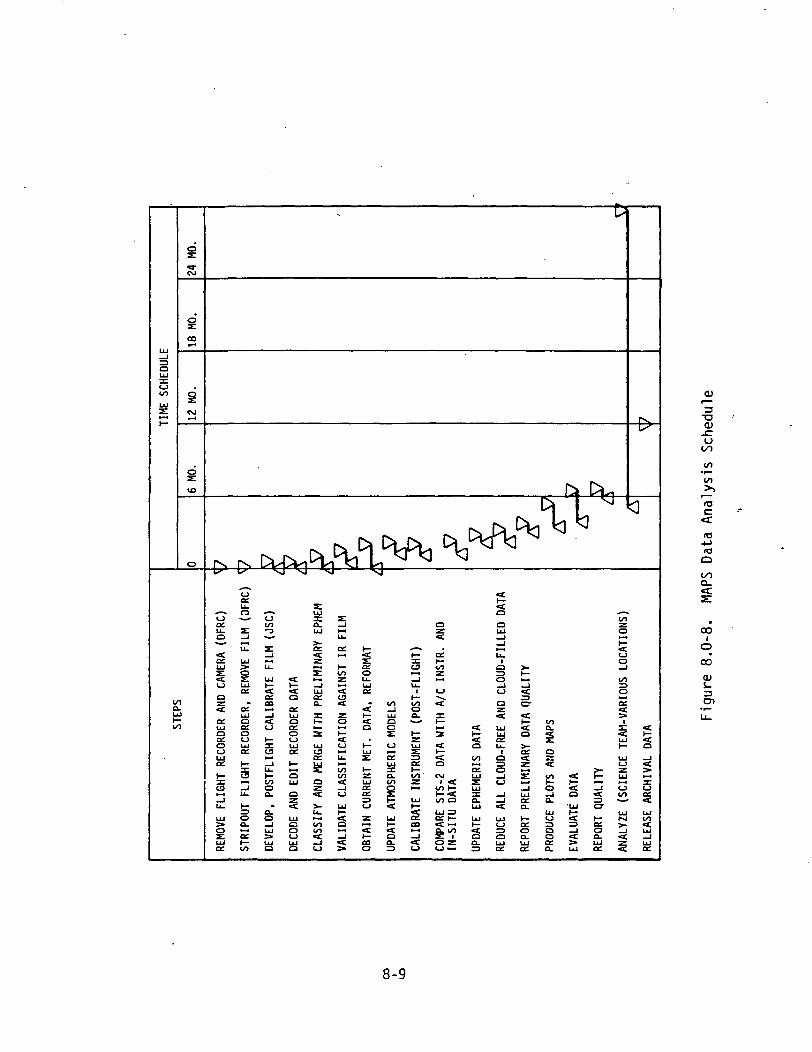
ME
SCHE
DUL
OJ
3•aa>
tO
tfl•^»to
«*<otootoQ_
CEU.
o:U-O
CJ
a
Oc_>
(_)c/>-O
—u j > - t> U .
atto
co— .— l<t
<CQ a:
a_u i z zo i— oO(_)LUce
' — ' • — > o<CCJ (_)
i— >ceLtlZ
i/io
Qil—l/V
O
a
o_J<_>o
«Ct—<s
CVJ1 «T
UII—
«CO
oo ai — = S1Z O
<:rscr<c
>-0:<c
c/i^O1-.t—«x<_)o
COIo
•
CO
(U
3CD
_L u l —
^
LUrco.LU
C O < C)— H-O <t
—«t>i->Zl_>
_« : o zo (_)<->
8-9

fOJ_CJ)
o
fO4J
O
OO
oCO
01
oc </tId Ul --J I- f- «on <t u. LU*o a. — >S 3 *-» s3 «-o Sa. 5 o
1i_
z3
S
•«HSLM UJ
S53a £-s
t *.
si
t»ju z
Ha;sr
1
i_
S-li;i bw^ i
g gt in u ae
-<°S:? x >• MC7»™« A a.
L1*3r1i <
!«
8-10

XUJ
O)
T3CU
I/I•I—in
zLU
3
n o .
25 S
O
§
22
IIIl/l O ••*LU H<-> • V)o at*-*
to J2
S ~ H Sx ,-• ^ 3t_J O I <
a LU
^1•-•a!/•> O 5. O
oe >— Q-Z I— I LU
?Ua
PS* UJ
=9 LUo-o•Cui
<0O 10
ill
rOQ
UJC_3O
IO
*
CO
a>s-3
pch~0.
8-11

03
CJ)
Q
O
u_as
4->na
OOO
IO
•CO
3
8-12
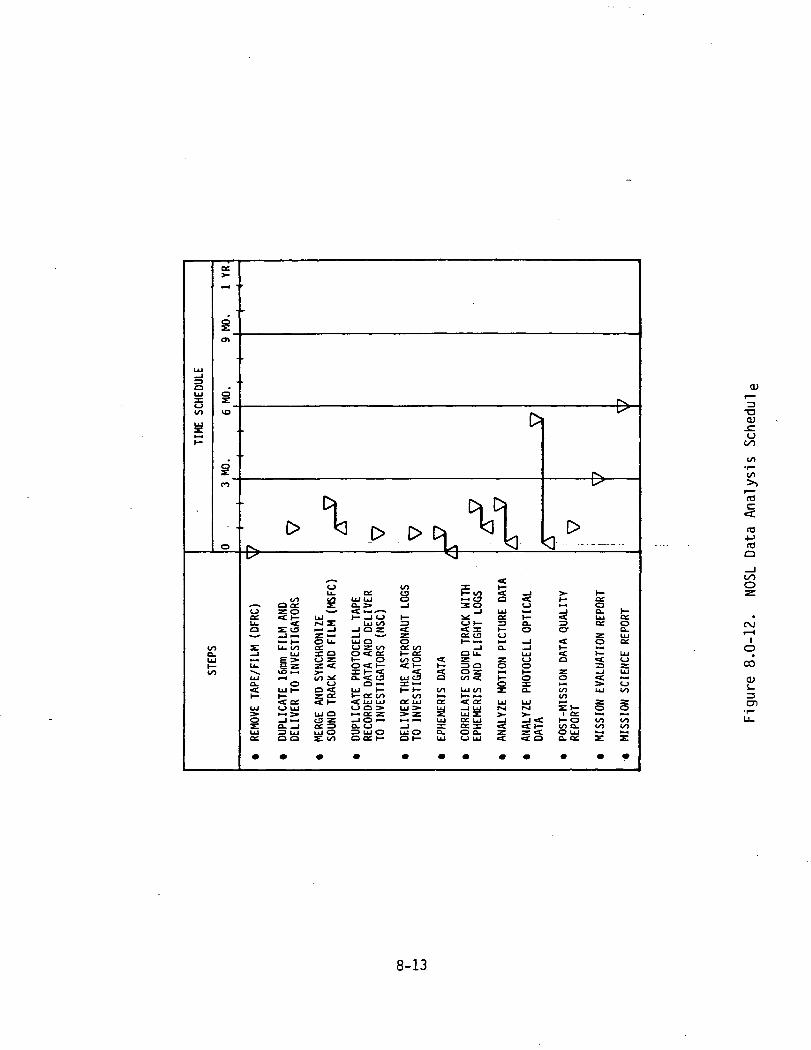
LU_J
EIjj
g
I/)
1-4
»—
Q£
i
.§VO
iCO
o
v>Q_UJt—(/)
r^
^ ^ ^O <3 [> [> O, <3L^ lx UoJ L<*|
[ ^J
o co 3: t—u. a: to P 1/1 < _J
GO o o c u c u o •— i o a <— o ce £ Q. > _i 30 oCJ ZO •— • *Ct->"^ _J LU 1— iec <e i— LU i— _i o i— ^ a: H-LL, <C r-J Z LU CO =3 O H- =3 Q-Q s: o p— _i —i o z < «s 3: i— o
• ^— C3 lJ- LU ^D CD H~ •— * H^ _J3E U . t / ) C C U Z C O O f C / ) _l O. .J—i u i z o o « t o £ t — a Q LJ_ uj^- |> Gz h- o too <c z z LJ^«» IO I— « ^™ ^~ ^~« ^J — ^^ /~ \ -y ^^ ^^LU i-i co ^ a. <t o LU CD a co <c 1— oa. o o a •— 3: >- o 31«£ LUh— O«C LU I — h— *— CO LUCO 3C O.1— 1— Z 2 t— 0£ CO CO •— 1— «<t ce <f f— <XLULU ce LU ce <t ce LU LU=> i— i > LU Q i— i ce z =» z 2: LU z: >- >-o _i ~ oz _i o i— i i— ii— • LU ce LU _j _j<c£ CL_I ce => Q.CJ — i 3: ce z < <£ t—LU =) LU LU O => LU O LU O O. O Q. Z Z <
U^1
Ot}..
>- t-i— cei— O_1 Q. I—*f LU ce= ce o0- CL
Z LU< o ce< H- LU0 <t CJ
=3 Z
§ —1 LU<C *<^
« > CJCO LU COCO
£l— O Oi ce >— • »-
1— O CO COl/> Cv CO COO LU *- • >-•Q. ce si z
T3a>
en
co
"(O
OOo
IO
CO
a>
C71
8-13
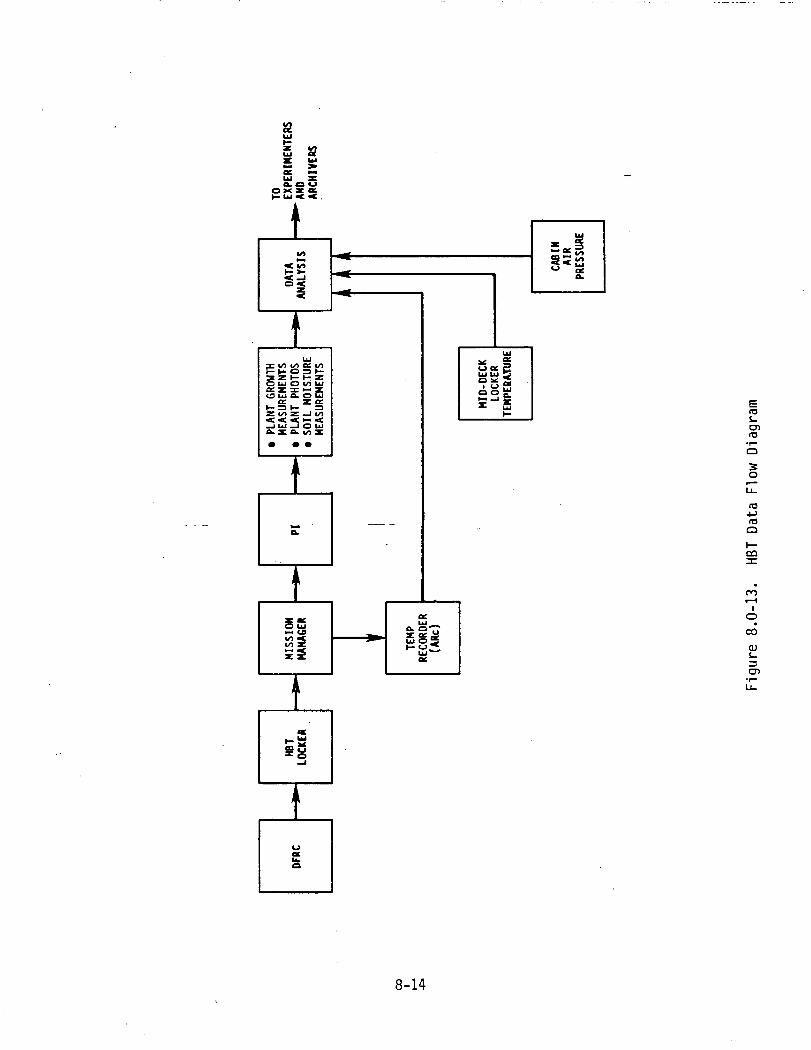
LU
£ S
10
CT>ITS
O
(OQ
CO
tr>t—io
•CO
O)
3CT)
8-14

The aim points for each parameter will be jointly agreed to by the SIR-Aprocessing team and the Radar Photo Lab in advance of the actual start ofthe mission.
Upon receipt of the original signal film at JPL, the film will first bedelivered to the SIR-A Library where it will be logged in and properlydocumented. The film will then be delivered to the Radar Photo Lab forpreprocessing.
The data processing flow diagram for the SIR-A is given in Figure 8.1-1.
8.1.2 PREPROCESSING
8.1.2.1 Mechanical .Stability.of the Ver.samat Signal Film Processor. Dueto the length and fragility of the signal film, plus the fact that thesignal film is a one-time effort only, it is paramount that the film pro-cessor be in a prime mechanical operating condition. To assure this, theVersamat will be fully rebuilt. This shall be completed one month prior toactual SIR-A film processing to allow adequate testing of the machine'smechanical stability.
8.1.2.2 Certification of the Sensitometer and Densitometer. All sensito-metric equipment (sensitometer and densitometer) will be certified on adaily basis prior to production of SIR-A data imagery.
8.1.2.3 Certification of Processor Chemistry Certification. The KodakVersamat Film Processor Model 11-CM will be certified as to chemicalactivity prior to actual processing of SIR-A data. This will include thestatistical plotting of processor trends in order to detect in advance any"out of control" situation that may be impending. Following certificationof the Versamat, the signal film will be processed. After processing, thefilm will be visually inspected for defects, then read for photometricdocumentation. The signal film will then be delivered to the SIR-A corre-lator operator, along with exposure recommendations for correlation.
8-15
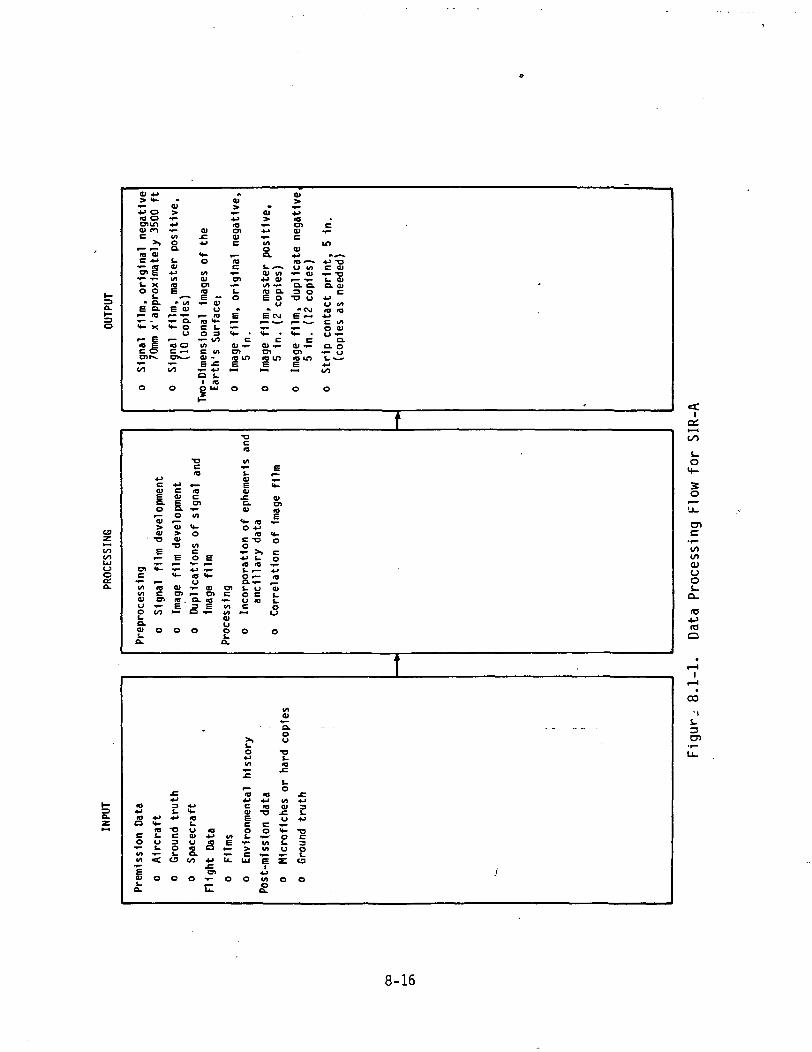
01 4J
4J 0ID Ocnin01 nc
la "oic 4->"01 6T "x0 O
t.• t^
E Q.•— <a<*- X
c ooir^
in
0
mas
ter
po
sit
ive
, 1
•-E 0>t- a.t- o
u
§ 04-4
OK—
bO
O
01JZ4J
0
I/IO)Ol
E" "f_IDCoV»CO)E
i
I
•-IVum
3
I/I
+*
QUJ
rigln
al
ne
ga
tive
.
0—
E•i •
cOl f-Ol
E»— •
o
oT
I/I
a0) VI*-> 01in f-§ 0.
ou•>
E CM
( B
M- .C
OJ ^_Olre in
"— •
o
0)
10OlOlcOl
U VI•*• O)
"o. Q.3 O
m
E
.<*-
O)Ol
*»
0
uCMr— 1
•
C
in
c
in
c 01
a. aicutocoua.
"Z00
o
</?"
I/IaiQ.0Cj
,
^ininUl
oa.
enci/it/i01ooa.aia.
ca>i.o
"o!
^3
E
n-_
§ot
</)
0
ca>§.0
*OJ
ai•o
E
K-
a>Ol
E '
0
C
A3COl
•7-
1/1
It-
0
VI
§ E
<0 <*-Ot- 0)
-5.S1
S Jo
O)cVIV)0)(J£a.
•aQ
VI
s-a>E0)
01<*.oc
44
S.
Rouc
o
4->ia•o
^
C-ucto
£
0)Ol
1<4-oco
ia
t.t.
5o
Ia:oo
o
t/1COd)OOs_a.
(T3O
a.o
i-_ '- O-c * <o jc4J 4-1 4-1 vl 4J
ID 3 4J c ie ai 34J I- H- 0, -S £ t« *» *> a E o 4Jo t- i- c c •--
r a * o u « 3 o o * * - ' oc j - c £ * 3 W L . ^ : 0 £O u 3 u < D E - ^ ( n i - 3— t. o 5 Ci ^- > wi o ov i i - i - a . •— c — -^ J.V I < U l / ) 4 J U . U J £ £ ( O
a > o o o * - o o < / > o ot C £
CO
•Ii.3
8-16
8.1.3 PROCESSING
8.1.3.1 Crossovers >and Replenishment. Since established reference points(gathered over the last 1 1/2 years) exist for the proper replenishmentrates based on 2421 sensitometric wedges, these wedges will be used as aguideline for replenishment. The procedure will be as follows:
a. Perform a crossover between the 3493 and 2421 control wedges (topossibly be used later as an additional data point).
b. During actual processing, control wedges will be run down theside of the processor every 15 minutes and will be numbered, read, andcharted. After the charts demonstrate continuity (at least threestrips in -succession which do not reveal an out-of-control trend),the strips will be run every 30 minutes.
8.1.3.2 Breakdowns. If the Versamat should break down, or if.the filmbecomes hung up in any fashion, then the drive will immediately be shutdown. Since the entire processing area will be under safelights, thecovers will be removed from the processor and the problem will be assessed.If it is apparent that a proper fix can be obtained in less than a minute orso, then the fix will be implemented. However, should the problem bedeemed more severe, then the film shall be cut and placed in a safe area.The fix shall then be made and the processor retested both mechanically andsensitometrically.
8.1.3.3 Film Take-up. Since the film will be cut into shorter lengths(less than 600 ft.) as it exits the processor, normal Seasat film take-upprocedures will be followed. Enough 600-foot reels, already assembled,will be present to take-up the entire signal film length. Spare reels willalso be immediately available. A spare take-up motor will also be immedi-ately available.
Three people will be present at all times. One person will observe thefilm feed. One person will observe the take-up. The last person will actas a spare/relief. Because the signal film is processed at such a lowspeed (5 ft/min) exchanging reels of take-up motors is extremely easy.
8-17
8.1.3.4 Correlation Procedures. After production of the required numberof signal film duplicates, the rolls should be checked for any physicaldefects such as scratches, bad focus, or lost data. Following that, the21-step grey scale should be read and the gamma plotted. If the films meetsystem's tolerances, they then may be delivered to the SIR-A Data Library.
At this point, the duplicate signal films will be correlated through theoptical correlator. Actual correlation procedures will be conducted byTom Bicknell, Tom Andersen, and the SIR-A team. Scheduling will be done bythe SIR-A Data Library and the SIR-A team. After correlation, the un-developed image film (Kodak Linagraph Shellburst Film, 2476) will bedelivered directly to the Radar Photo Lab for processing.
8.2 SMIRR
8.2.1 DATA PREPROCESSING
a. Data Integrity Verification. When the CCTs are delivered to JPL,they will be read to verify that all of the data are present and thatthey are error-free. It is expected that the source of errors can bedetermined by inspecting the data so the payload recorder can bereleased or played back again.
b. Decalibration. The data on the CCTs will be convolved with theappropriate set of radiometric calibration data on IBM 360/158 tocreate data tapes that list the radiance of each scene observed by theinstrument. These data will be used for the scientific analysis.
8.2.2 DATA PROCESSING
Data processing will consist of manipulation of the digital SMIRR dataincluding decalibration, the correlation with the ground position obtained
from the 16 mm camera and the ephemeris data and incorporation of the post-mission ground truth data. Data processing for analysis includes: (1)application of the light transfer curves (see Figure 3.2-5) obtained fromthe final post-mission calibration with modification through the use ofon-board inflight calibration data to obtain decalibrated data, (2) deter-mination of the range of 10 channel spectral signatures obtained
8-18

worldwide; (3) determination of the atmospheric transmission by use of theLowtran-5 model*; (4) incorporation of radiosonde data into the Lowtranmodel where available; (5) resampling of the data to superimpose all filtermeasurements on each individual sequential IFOV; (6) extraction of datafrom regions having known geologic units; (7) application of analysisalgorithms such as ratios, principal components and canonical statisticalanalysis (Science, Vol. 211, pp. 781-791); (8) incorporation of post-mission data in particular ground truth data for analyses purposes. Theabove eight processing steps will be done on an IBM 360/158. This dataprocessing flow is shown in Figure 8.2-1.
Black and white and color 16-mm film will be processed by the JSC photolabin accordance with the SMIRR film -.processing memorandum signed by NoelLamar in June 1981. There are no specific sensiometric requirements forfilm processing since radiometric measurements are not being made with thecameras. However, test strips made with the SMIRR cameras prior to launchwill be developed prior to flight film processing to ensure proper pro-cessor adjustment. Duplicates will be printed as discussed in Section9.2.2.
8.3 FILE
The FILE data processing plan is outlined in Figure 8.0-5 and Figure 8.3-1.Figure 8.0-5 shows that the data analysis and reporting activities will bea joint effort between the Langley Research Center and Martin MariettaAerospace, consonant with the dual experiment Investigator roles for thesetwo organizations. The OSC Photographic Technology Division will process
*The Lowtran program calculates atmospheric transmission and scatteringbased on internally contained models or externally input parameters suchas temperature pressure, dew point and others derived from any source.Specifically, radiosonde data and NOAA sounder data can be used to derivethe local model.
8-19

Ii
IJ=4-J
"*
<O4->OS
TJ
a vi
o oo> aj
€ Or- O
Olc
inOf00
Q-<U
O.
ft
Inte
gri
ty
ve
rifi
ca
tio
n
1b
rat1
on
^»ID 104J O10 Ol
0 0
c•fH>
inVI01O0
a.
CVl
1inc10i.
Ol
oC QJO >i- I.*J 3to oO
r— 4>O.l»-Q.•I
0
of
spe
ctra
l si
gn
atu
ree
rmln
atio
n
ph
eri
c tr
an
sm
issio
nng
LO
WTR
AN-5
mod
el
po
ratlo
n o
f ra
dios
onde
a
O) +•> in •«- L. 4Jo> O) O in o <oc -a B 3 o -o10 -M C
o o o
u.aioVI
O) inin <*10 1=
<*-> 3
•^ o
0 0
Ol C *Oc o a)• •»• Ol
O. o 5E 10 0
in 4-» ^a> xa: uj
O 0
o
o
OJool_o.(O+->to
ICVJ
CO
(1)s-3CD
10 W <4-•C 4->
O 4->
in ^£in o
O4->
i.
« ,— to -c4J IO -O C •!->C O O 3tt) C •»- I.
I E — O
O O " - O O O O O - O O
8-20
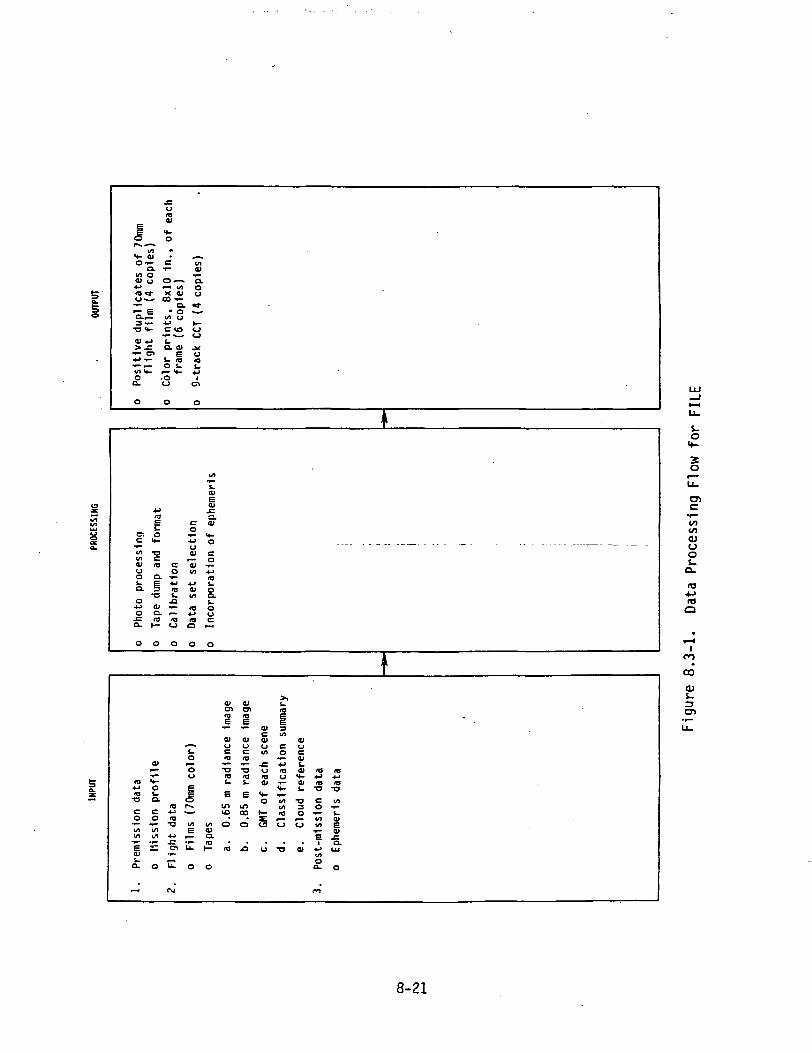
O-^ C inQ. 1- 01
V» O ••-0> u O—- Q.•*J •—i v> Oio«r x 01 u<J'—• CO •»-— CL «fr•— E " O —O. - v» u3^_ 4J (-•o **- c 10 o
•*•• *—* C.J<U *J I.> -C O. 07 .*
•*- o> e <j•w-^ i. m a•^•r— O L. L.VI <t- I— <«- *JO .O IQ. <J O
O
O
O)c
a;uoS-D-
rtJ
co*oo
<u
0)Ea)•w j:
03 Q.E c a;i- o
00 i- H-c u - -wo
•*• o"> -a ai cISt C r— OO) (O C 0) •»-o o </> -wo a. i* «g*- E -w •<-> i-o. 3 03 ai o•a i. u> o.o ja s-*» <u -^ «j oO Q. r— 4-> U-c 10 m a cQ- h— O Q 1-1
10•4-1(O
C0
VI
mCJ
CL
-
o>
o0.
co
1/1y~
o
(Q
4-1TO•o*Jen
LL.
<vj
S-oou
,§r-•VIE
iZ
o
rad
ian
ce
Imag
e
E
inVC
v) Oo>Q.
>— (O
O
rad
ian
ce
Imag
e |
E
inCO
o
.0
0)c0)uVI
-cu10Ol
>*-o
1—x:
u
Ica
tlo
n s
umm
ary
efe
ren
ce
ata
t- i- -O
°v» -o cVI 3 O*O O -^
f— r— VI<_> U VI
"E^ Ol *J
VIQ
Q.
m
10
•oVI
t.0)
-§.Ul
o
8-21

the one magazine (about 120 frames) of Kodak QX-824 color film, and willalso provide these data products:
a. Two positive transparencies copied from the processed flight filmand three 8 x 10 inch color prints of each frame of imagery,supplied directly to Martin Marietta Aerospace, Denver (withintwo weeks after STS-2 landing).
b. Two positive transparencies copied from the processed flight filmand three 8 x 10 inch color prints of each frame, supplieddirectly to NASA/LaRC (within 2 weeks after STS-2 landing).
c. Internegatives
The JSC Photographic Technology Division also will load the FILE filmcamera and provide pre-flight sensitometry calibration of the flight filmand on a control sample of the film. Before processing the film, JSC willperform complementary post-flight sensitometry calibration on the flightand control films. By means of these calibrations, it should be possibleto isolate film degradations due to the pre-launch, flight, and/or re-entry environments. The original flight film will be temporarily stored ina controlled environment at JSC.
The FILE Lockheed flight tape recorder will be taken to Martin Marietta inDenver and dumped onto 9-track computer compatible tapes (CCTs) within oneweek after landing at DFRC. (Note: The FILE recorder uses a non-standarddata- recording format, as well as a non-standard electrical and softwareinterface). The tape dump will provide CCT's for both LaRC and MartinMarietta (experiment investigators) for use in processing and dataanalysis at Martin and at Langley. The subsequent data analysis isdescribed in Section 10.3.
Parallel with the FILE data analysis progress, the FILE experiment will be
shipped from KSC back to Martin Marietta for check-out and re-calibration.The pre-flight calibration (see Section 3.3.3) measurements will berepeated after the flight, if the experiment is still operational, todetermine what degradations may have occurred. If degradations in theperformance are detected from the pre-flight and post-flight calibrations,
8-22
efforts will be directed toward isolating the causes, and the specificrelationship to the STS-2 mission. Possible correlations between degradedexperiment functioning and degradations in data obtained, if any areobserved, will be examined. If the experiment is not operational at theend of the mission, efforts will be directed toward determining the causeof the failure, the time of failure, and any data (mission) relationships.
Within about 10 weeks after the STS-2 mission, the Shuttle ephemeris datawill be made available by JSC to LaRC and Martin Marietta. These data willprovide a basis for locating important ground truth data for use with the70-mm FILE photographs, and the basis for a new FILE master tape withlatitude/longitude data for each image. The need or lack of need forsupplementary photographic data-will hav.e-vbeen determined by that time,through evaluation of FILE color photographs and MAPS color-IR photographs(to be examined for useful correlation with FILE photographs).
8.4 MAPS
8.4.1 INTRODUCTION
The primary MAPS data set is the series~~of"radiometric measurements made-and recorded by the OSTA-1 instrument.
False color infrared imagery obtained from a camera mounted on the instru-ment base-plate will provide information on the degree of cloud cover inthe instrument field-of-view during daylight operation.
Meteorological information will be used to construct atmospheric models inthe form of pressure, temperature and humidity profiles which are to beused in the data reduction process. Standard 12-hour analyses, individualrawinsonde sounding, and aircraft data may be used. One of the objectivesof the experiment is to assess the required precision of meteorologicaldata used in the reduction.
A prototype of the OSTA-1 instrument will be flown aboard a Learjet to pro-vide correlative data. Air samples will also be collected during theseunderflights and later analyzed by gas chromatography to provide indepen-dent assessment of CO concentrations.
8-23
Preliminary ground track estimates will be used to match the flight path ofthe aircraft as closely as possible to the orbital track of STS-2.
Final ephemeris data will be used to determine the exact aim point andfield-of-view of measurements made from STS-2.
8.4.2 PREPROCESSING
Following strip-out of the data from the flight tape recorder and deliveryof the resulting magnetic tapes to LaRC, the data will be written onto atape in a format convenient for processing at the LaRC computer complex.
During this phase, preflight calibration factors will be used to convertfrom raw'counts to units of'temperature, voltage and radiance. Also duringthis phase, the values of various parameters will be examined to determinethat the instrument has operated • within tolerances. Out-of-toleranceconditions will be flagged and summarized. A strip-chart record will beproduced of the V, AV, AV' signals, temperatures of the reference blackbody and the base plate, the automatic electronic balance parameter and thecamera operation pulse. This record will be used as a convenient visualreference to instrument operation history. If out-of-tolerance conditionscan be related to unanticipated variations in the baseplate temperature,an effort will be made to correct these conditions by using in-flight cali-bration data. A consistent pattern of such conditions, however, may indi-cate the need to suspend processing until an extensive post-flight check-out and recalibration of the instrument has been completed.
The next step in preprocessing will be to subdivide the data into day andnight categories based on the camera mode, and cloud-free, cloud-filled,and partially cloudy field-of-view using the V channel signal. A lowerlimit will be established for the V signal below which the field-of-view isassumed to be more than 90 percent filled by high clouds. High-frequencyvariation of the V signal will be used as an indicator of a partiallycloudly field-of-view. For daytime measurements, this sorting processwill be verified using IR imagery. Time, latitude and longitude will becollated with the observed data and written on a magnetic tape.
8-24

8.4.3 PROCESSING
In ft i al process in'g''will concentrate on data "with cloud-free and cloud-filled fields-of-view. A set of 3 to 6 climatological models will be usedto construct atmospheric models corresponding to the estimated track ofSTS-2 prior to launch. The corresponding coefficients will be computed andused to obtain "quick-look" inferrals of CO. Meteorological observationsconcurrent with the STS-2 mission will be used to update atmospheric modelson a limited basis to intercompare results of STS-2, the MAPS aircraftinstrument, and gas chromatograph analyses of "grab-samples". Agreementamong these three observations to within 30 percent will be consideredreasonable. It is estimated that this phase of the processing will be com-plete -wi-thin 60 days after the completion of the mission.
After receipt of final ephemeris data from JSC. and comparison with initialestimates, with updating where necessary, the processing of the remainderof the cloud-free and cloud-filled data will be completed within 4 to 6months after STS-2 landing. The data products will include CO vs. time,CO vs. latitude and longitude, hemispheric averages, and such other pro-ducts as the Science Team may deem useful.
A data processing flow chart is shown in summary in Figure 8.4-1.
8.5 OCE
8.5.1 PREPROCESSING
The OCE data is preprocessed on-board the Orbiter using a digitizer whichconverts the analog signal into 10-bit binary words in PCM format. Thesedigitized data along with the corresponding analog data and otherassociated parameters are recorded on 10 tracks of the Orbiter payload taperecorder.
8.5.2 PROCESSING
The conversion of OCE data recorded on-board the Space Shuttle into a formwhich is conveniently usable by the analyst requires several data
8-25
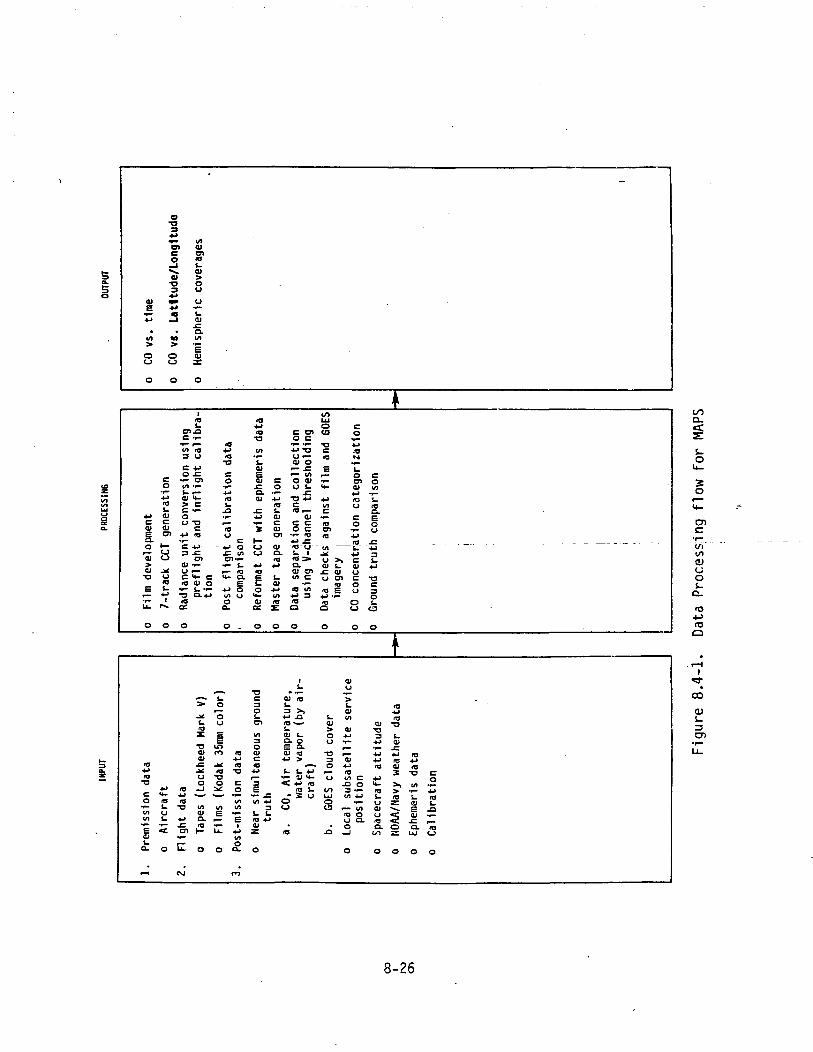
01•o
•s. 01Ol >-o o3 U
Z 3 Ol-CQ.
>
O oo
4JC
IO
"o!>01•o
J!u.
o
co+JIOi.OlcOlen
o
uIOi.i
r>"
o
i10i.
Cn.OC ••-
•r- r—VI IO3 U
C 4-1O -C•«- ento «r-01 C> cC •-0CJ ^
c4-1 10
~C 4J
"cnOl 1-
C £ C10 Ol O
-O O.4JIOo:
o
re4JIO•oco•»~4-1reuJ3
roU
C- 4J 0
cn-.-t- s-c g.
E4-1 OVI Uoa.
o .
phem
erls
d
ata
Ol
-C4-1
'51—CJ
j <I£Olce
o
co4-1rOi.O)COlenOl
ro"4.J
t.Ol
Z
O
co
lle
cti
on
•acrO
g
4-1ro
rOa.at
ro
0
o
hre
sho
ldin
g
4-1_—11CC
O
encen3
COUJoC3
•acIO
i *
croen10
at
•Ol
ro
Q
O
co
ro
UOenOl
IOucO
ro.
&.01cn
e
cOluc
uo
0
coVI•
3.gou
..C . _ .. . - - - -
3
4J
3o
C3
O
ona.eC
O
O
cnc
oos_
Q_
(OO
re
ra•oc0
VI
"EOli-a.
-
**-s-ui-<
0
re
•a
cn
u.
tM
roZ
•oOlOl
uo_J
VIOla.i2
o
i-oou
in
reT3O
V)E
iZ
0
ro
ra•aco
VI
"eJ,VI
£
rn
•o
o
V)30Olcre
_§ ^VI 4-1
3i. i.ro 4JOl
0
em
pe
ratu
re,
apor
(b
y a
ir-
4^ >
I- S. 4-1• i; >*-«£ 4-> re
ro i.
o s o
U
ro
L.Ol
ou•a30
U
COLul
S
J2
lllte
se
rvic
e
Ol4-1roVI C
JO 03 t-VI 4-1
r-* VIro Q0 0.O
o
Ol•a3
4-1
ro
4-1
roS-uOl(Jraa.
o
ra4-1re•a
Oljr
Ol2
ro
g
O
O
ro
ra•cVI
L.Ol
£CL
UJ
0
- .
c0
roL.f\
3o
CO
(U
3Ol
8-26

processing steps. The following is a brief overview of the process. Thedata processing flow for OCE is shown in Figure 8.5-1.
When the data tape is returned to Earth, the recorded OCE data are pro-cessed by PCM bit and frame synchronizers which interpret the value of theserial words and reorganize them into synchronized frames in a parallelformat. The data are then written into a magnetic tape in a format whichis readable by digital computers. These tapes are referred to as computercompatible tapes (CCT's).
The CCT's are then processed on an IBM OS/360 computer. The software isdesigned to produce calibrated OCE data in a format which can be readilyused by analysis programs. The tapes produced by the software are referredto as calibrated tapes. These calibrated tapes have two features whichfacilitate use by the data analyst. First, they contain the table of con-version coefficients which are used to convert OCE calibrated voltagevalues into instrument observed upwelling radiance. Second, data from alleight OCE channels from a single OCE-scan line are contained in singlelogical records.
The calibrated tape will be produced on an IBM OS/360 computer. The normalcharacteristics of the tape will be 9-track, no label, density of 6250 bitsper inch, variable record length, blocked records, multiple files, andmaximum physical record length of 32596 bytes. Tapes with differentcharacteristics may be produced upon need of the user.
The first file on the tape, which is the documentation file, will consistof two records. The first of these will contain pertinent informationregarding the structure of the succeeding data files. It will also containgeographic and timing information corresponding to the data files. Thesecond record will contain the conversion constants needed to produceobserved upwelling radiance values from the data values found on the tape.
An arbitrary number of data files will follow the documentation file. Thefirst record of each of these will contain documentation informationrelating to the particular segment contained in the file. The following
8-27

a4-110
<uo
•o10
O)a-r'3 (I)
4->•O «<u s4- ,<0) ~I/I ~
Olc
COO)uos-o.0)
a.
-
ron
lza
tio
n
fuc>.en
0)•oouHIE
1—
o
1c0u•a
1
(DC
•»—J">
0 C4-> O
Ol I/I0 I.
»— • 0)10 >c<c
o
alu
atl
on
>O>
>>4-1
r~10
S-IO
o
o
i101.IOa.ut/iIO
•oee.Of1-4z:i/i•ac c10 oUJ 4JCJo
o
O)c(/I1/1
u0
a.
CM
OlCf"4-*4-*IOSu
-2oji-aic
_
cIOu
o
!_ja
u•aca<a4-110•aVI
1.g
t—a.
LU
o
c0
4-1
toi.oa.s-0uc
co1 •
refo
rma
ttin
ga
t
ll™-i-
C ^L
•* ou <Co
I— O.£ 4JHIO
O
o>c
o
10
cIO
ejicucIO
-Cc11101
fQJ
o
oO
O
O
toO>OOS-o.(O
4->(O
1
I/I3OaiIO4-1^_
3
1
10
C
I/I
C -C10 *->4J 3
3 4JE
"
f— 1
L.<U
O)g
!_O
r—Ouc10uuo
4-> fe aiV- 4J CIO IO C 101- « -O 10 4-100- JZ 10L. - 4-> U"O»- .e -c i<£ u*> ai co
•»"O 0 d 0
CM
10
IO•ocoVII/I
11
4J
U1
£
CO
- ^(JeaL.
4-»
OJ
14J
V)01
V)01
CO
o
<u3
•»- >»4-1 4J
IO UO
0) o•a >4-1 ^~t- 10
!_01 0
4-1 -a4-1 Cs aj=C/1
O
01-a3
"-
C ' .o
•oIO
a)•a w»3 11
+J 4-1
+J C10 i-
-c o4^ OU U
LkJ
0
ILO
CO
3CD
8-28
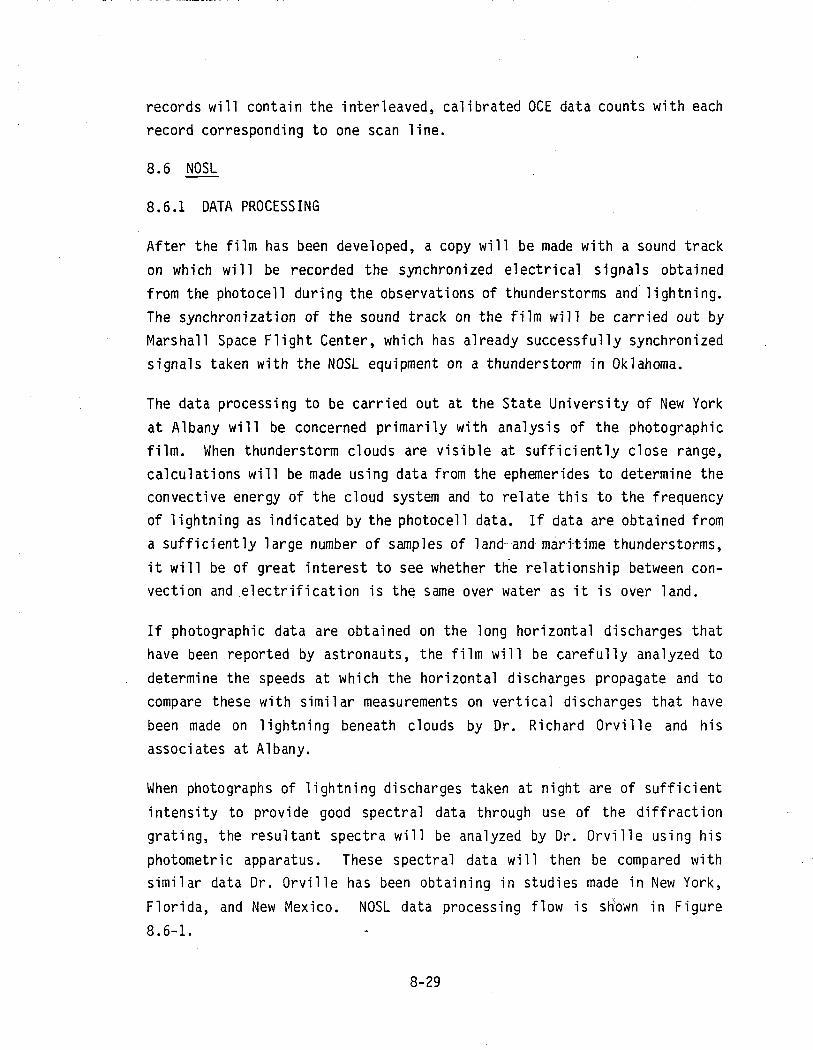
records will contain the interleaved, calibrated OCE data counts with eachrecord corresponding to one scan line.
8.6 NOSL
8.6.1 DATA PROCESSING
After the film has been developed, a copy will be made with a sound trackon which will be recorded the synchronized electrical signals obtainedfrom the photocell during the observations of thunderstorms and lightning.The synchronization of the sound track on the film will be carried out byMarshall Space Flight Center, which has already successfully synchronizedsignals taken with the NOSL equipment on a thunderstorm in Oklahoma.
The data processing to be carried out at the State University of New Yorkat Albany will be concerned primarily with analysis of the photographicfilm. When thunderstorm clouds are visible at sufficiently close range,calculations will be made using data from the ephemerides to determine theconvective energy of the cloud system and to relate this to the frequencyof lightning as indicated by the photocell data. If data are obtained froma sufficiently large number of samples of land and maritime thunderstorms,it will be of great interest to see whether the relationship between con-vection and electrification is the same over water as it is over land.
If photographic data are obtained on the long horizontal discharges thathave been reported by astronauts, the film will be carefully analyzed todetermine the speeds at which the horizontal discharges propagate and tocompare these with similar measurements on vertical discharges that havebeen made on lightning beneath clouds by Dr. Richard Orville and hisassociates at Albany.
When photographs of lightning discharges taken at night are of sufficientintensity to provide good spectral data through use of the diffractiongrating, the resultant spectra will be analyzed by Dr. Orville using hisphotometric apparatus. These spectral data will then be compared withsimilar data Dr. Orville has been obtaining in studies made in New York,Florida, and New Mexico. NOSL data processing flow is sH'own in Figure8.6-1.
8-29

cnc
a>en
ioa> ai
C IO01 i.3 *>cr u01 01
cn cn
.— c c cO) 0) *J *Jb. .c .c .ci. Q. cn cn.3 L 3
COo
So
O)
(UooQ_
« °eO. C r-<O O ••-
<0
10
•*• t- E I.•O ra a)c N cn18 clB O-
—• .c -o<*- u c
C 10"*• >>O m Jiuc -o ioo c v.•»- 10 +J
io cn^u c c•^1-3r- cn o& ^ (/i3 OJ
C g.Q-<u
O cncn
c oO •—
io -cf— cnoi **—1.1—S. 1»-ou
I<£>CO
O)
3CD
a a4-> +J10 IO
o 0) t- 10i- TJ IO -O
CM *->i .c
=i cn
10 10•4-> 4->
« -a tscno c in
F— O 1-•»• t.•w M 0)
in ^: in Eai cn t- ao. i- E £.10 r- I O.
h— U. +J UJin
8-30
8.7 HBT
"photos -taken fby *t'hV 'Principal 'ihvest'iga'tor 'after 'the experimentrecovery will be processed by him. HBT data processing flow is given inFigure 8.7-1.
8-31

§ 0,
Ol OlC *>oi n
c c
SI (X
o o CO
O
O•4->o
I/)<DOO
O.
rO
C Ol« E
01t_3
CD
O)
O>t.
|
Coo01 Ci- le
n en *J•o c 1/1
o i -^ -o KJg - 00, *.
tol^ «, u
•^ *» <o -a *jVI C p— O> -p-V) 1C - V» ** JS• r— O J= L.e Q- </i 0.0
8-32

SECTION 9. DATA ARCHIVING AND DISSEMINATION
SECTION 9. DATA ARCHIVING AND DISSEMINATION
After initial processing and duplication, the flight original data can be
archived. The quality of data must be ascertained, and quality control on
processing and reproduction must be maintained. The intermediate data
products, in useable form for analysis, are then distributed to co-
investigators, other investigators, and the public. The plans for these
activities for each experiment are given in this section.
9.1 SIR-A
9.1.1 INTRODUCTION
This section describes the procedures from the receipt of the originalimage and non-image products in the JPL SIR-A Data Center through f i n a ldistr ibution. It is expected that the correlation w i l l start immediatelywhen the signal f i l m is received at JPL and w i l l be completed in aboutthree months. A f low diagram showing the generation of SIR-A image productis given in Figure 9.1-1. The status of each stage of image product andtheir uses are detailed in the f o l l o w i n g sections.
Each fac i l i ty involved in the h a n d l i n g of SIR-A original image and non-image products shall be responsible for their protection against loss anddamage. The SIR-A data center shal l be responsible for m a i n t a i n i n g variouslogs and other documentation that w i l l faci l i ta te knowledge of the loca-tion of all products at any stage in the data generation. All productsshall be stored in the SIR-A Data Center at all times, except for periodswhen they are required for processing purposes, or when they are formal lyreleased by the Pr incipal Investigator or assignee. Security control ofimage or non-image data products is essential to the safety of data pro-ducts. Three levels of access security are def ined as fo l lows :
Level 1: Restricted access. To be stored in a special safe. Accessor release for processing ( o n l y ) by the Pr incipal Investigator or as ingle assignee. To assure maximum protection of Level 1 products, itis mandatory that they be in the physical presence of a pre-determined
9-1

70 MM. SIGNAL FILMORIGINAL NEGATIVE(SFON)
110 SE9OTS OF SFON
LEVEL 1
10 SETS OF SIGNAL FILMMASTER POSITIVE(SFMP)
1IMAGE FILM ORIGINALNEGATIVE (IMON)
- CORRELATION FACILITY
IIMAGE FILM MASTERPOSITIVE (IMMP)
LEVEL 2
IIMAGE FILM DUPLICATE
NEGATIVE (IMDN)
ISTRIP CONTACT PRINT
Figure 9.1-1. Image Products Generation Flow
9-2

authorized individual at any time that they are not secured in theData Center safe.
Level 2: Limited access. Storage to be in a locked area.Availability to users via pre-determined access lists; to processingfacilities when required. No-return releases by authorization of thePrincipal Investigator or assignee.
Level 3: Qualified access. Storage in Data Center. . Products sodesignated may be released to any interested parties when available.
9.1.2 SIR-A FILM PRODUCTS
Each U.S. team member will receive one copy of the image film set. Theforeign Investigator will receive the coverage only over his sites. Onemaster copy of the image film will be sent to the NSSDC for distribution tothe general community by request. No product will be disseminated to otherthan the Principal Investigator, the Co-Investigators, and the NASA Head-quarters official observers without approval of the Principal Investigatorand NASA Headquarters. No foreign dissemination (other than to the indivi-dual Co-Investigator) is to be made without the approval of the Office ofInternational Affairs. Requests for SIR-A data should generally behandled through NSSDC.
9.1.2.1 Signal Film, Original Negative. All radar photographic image pro-ducts listed in the following text are derived from the in-flight signalhistory designated as Signal Film. These data are recorded on a single70-mm by approximately 3500-foot length of photographic negative filmtransparency. This product is known as Signal Film Original Negative(SFON). Access shall be Level 1. A Product Traveler form will be initiat-ed at the time of removal of this film from the orbiter film recorder.
Upon receipt of the SFON at the JPL SIR-A Data Center, the appropriate in-formation will be entered on the Product Traveler form and in the SIR-AProduct Status Log. A unique File Number will be assigned, noted in theProduct Status Log, on the Product Traveler, and the Signal Film containerwill be so labeled.
9-3

Note that with the exception that Product Travelers will be initiated atthe SIR-A Data Center instead of the point of origin, all other image andnon-image products will be logged and labeled in the same manner as des-cribed in the preceeding paragraph.
The SFON will be transported under Level 1 conditions for preprocessing andprocessing operations.
As soon as the SFON is processed (i.e., developed) it shall be returned tothe Data Center under Level 1 conditions, where it will be logged in theProduct Status Log and stored in the SIR-A safe until such time that it isinspected and segmented into ten, approximately equal, units under directsupervision of the Principal Investigator. The individual segments shalleach be assigned the same File Number as the unsegmented roll with aserially incremented dash or slash number appended, thus giving each seg-ment a unique number.
The segmented units of the SFON will be transported to the Radar Photo Lab,as required, for production of Signal Film Master Positives under Level 1conditions.
9.1.2.2 Signal Film, Master Postive. The ten segments of the 70 mm SignalFilm Original Negative transparency (the aggregate of the ten segmentshereafter referred to as a set) will be used to produce ten sets of SignalFilm Master Positive (SFMP). The SFMP is a 70 mm positive-image duplicateof the SFON. The Signal Film Master Positive is designated as a Level 1product.
After production of the sets of the SFMP is accomplished, these productsand the SFON shall be transported to the Data Center, where they will belogged in. The Signal Film will immediately be returned to the SIR-A safe.
It is intended that the Signal Film Original Negative set shall be storedin the SIR-A safe until such time that the Principal Investigator ordersits removal to another location. Since the SFON is the prime signalhistory archival record, further use for any purpose is precluded, unlessby specific order of the Principal Investigator.
9-4
Unique File Numbers shall be assigned all units of the ten sets of theSignal Film Master Positives. Nine sets of the SFMP shall be stored in theSIR-A safe.
The tenth set of the SFMP will be transported to the Correlator Facility,as required, for production of an Image Film Original Negative.
9.1.2.3 Image Film, Original Negative. The tenth set of the Signal FilmMaster Positive will be employed in the generation of a single set of ImageFilm Original Negative (IMON). The correlated imagery shall be exposed ona five-inch wide continuous-roll photographic transparency film.
The resultant IMON is designated as a Level 1 product. Immediately aftercompletion of the correlation procedure, the Signal Film'Master Positiveset shall be returned to the Data Center under Level 1 conditions andstored in the SIR-A safe. The return of this product shall be noted in theappropriate Data Center log.
The IMON may be transported directly to the Radar Photo Lab for develop-ment, providing it w.ilj be processed immediately; otherwise, it must bestored in locked cold-storage or the Data Center SIR-A safe until such timethat processing may be effected. When processing is complete, the IMON setshall be returned to the Data Center under Level 1 conditions, logged in,and inspected by the Principal Investigator. If this inspection indicatesunsatisfactory quality, re-correlation will be required; otherwise, uniqueFile Numbers shall be assigned to each of the ten units of the IMON andappropriately logged. Since the Image Film Original Negative set is theprime imagery record, use of this product for any purpose other than pro-duction of the Image Film Master Positives (described below) is prohibi-ted, except on express direction of the Principal Investigator. The IMONwill be transported to the Radar Photo Lab when required for production ofthe Image Film Master Positives.
9.1.2.4 Image Film Master Positive. The single set of IMON shall be usedto produce two sets of Image Film Master Positives (IMMP). The format ofthis product, printed on five-inch wide photographic transparency film,
9-5
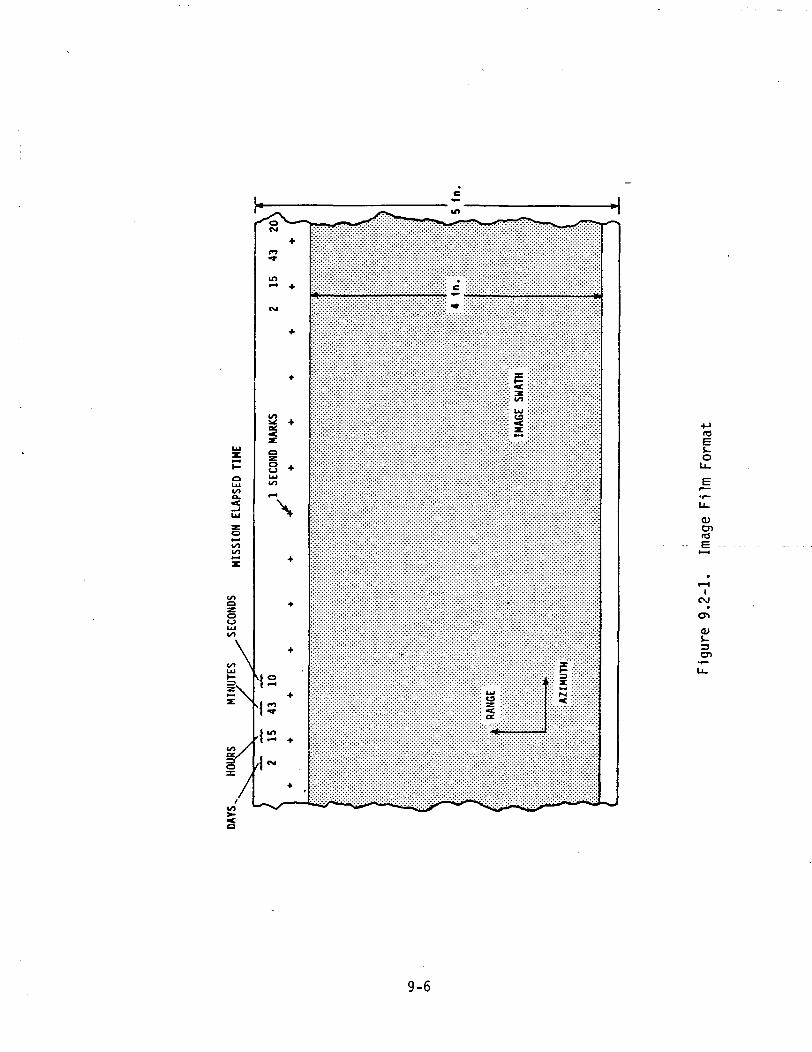
LUZ
P
aLU
a.
Ul
|to
X
a
0
LUto
LU
|\
s/
r" o -' 'CSJ
in
CM
•f.
•f
i/>W 4
§
Q
.O .<_) •*LUHO
t— 1
\
4
+
.
Ss +
13
_«-^ s— —
'.\>\ ?™??rr.-:<<<y\::<<<\%: ^^
:::::::::::::::::::::::x::::::::;::::::::::::::::x::;::::::::::::::: c xix- >Xx:|x|:|:|x|x|x-x|Xxx|x|x|:|x-x
|;:;:;;||||§|:;:S:|;;;;;;;: ^
!!iiiiiii iiiiiiiiiiiiiiiiiliiiiiiyiiii? 11111111111:::jxj:j:J:;x|x|x|>x|xxx|x|x:X:::::X:::Xx:xX:::X:Xx xjxixi: >*> HS-i-S-S-i-SS^iW
:$:S-xS^S: S: :-:-: :::::::::::::::::;:::::;:::-x;::::::::::::: HS'S- * ::::::::::::::::::::::::::x:::::x:
iSiSixSJiSi:!:;:;:;:;:! SSS:. "jSSSSSSox:;:;:!:
:|x|xjx|x;xo:|x|x|x|x|x|x|:|Xxx|:xx|x;x|x|:xX: :X:X:::>X:XxX:X:X:X:X:X:Xx:;X::
•::::x'x:x:::::::::x:::x:x;x:x::o::::::x:x:x'::::x:x:::x:x :::::::;x-:-:-:':-::::::::x::;x'x::::-x:::x:x:
IIIIII IlIllllli HlSSiii:: Illllllli 'Illl
:::::::::::::::::::::;::::::::::::::::::::::::::::::::::::::i::::::::::::::::::::::::;:::: *" i SSHW: ::: 5 ::::::::::::::
Xx:xX|:|x-xjx|xi:|x|Xx:x:x:|x|:|:|:::x:x:|:|x|:|:i:|:-:j o: xjX::j:x':xX:: :':X:^xX:X:X:>
iilisivxiliiiiiiSi
- -*
4->
Es-ou.
^E
u.QJ
re_ - _ e
i— iiCM
CT>
O)
3CD
iZ
9-6

shall be a 1:1 positive-image rendition of the IMON. This format is givenin figure 9.1-2.
Access to this product is Level 2 (product to be stored in locked compart-ments). After printing and processing is complete, the two sets of IMMPand the IMON shall be immediately delivered to the SIR-A Data Center. TheIMON set shall be logged in and secured in the SIR-A safe. Both sets of theIMMP shall be logged in and assigned unique File Numbers. One of the twosets of IMMP shall be made available for production of Image Film DuplicateNegatives; the remaining set shall be secured in a locked compartment.
9.1.2.5 Image Film, Duplicate Negative. Twelve sets of Image Film Dupli-cate Negative (IMDN) shall be produced by printing from a set of IMMP. TheIMDN is a 1:1 negative-image duplicate on five-inch wide transparencystock of the Image Film Original Negative record in all aspects, and isintended for use as a "working" medium for the production of positive-imagedata in various forms (i.e., enlargements, positive projection trans-parencies, etc.).
IMDN is designated as a Level 2 product. Release of this product by theSIR-A Data Center for dissemination or reproduction shall be authorized bythe Principal Investigator, or with the approval of the Program Office atNASA Headquarters.
As soon as possible, the Radar Photo Lab shall deliver the twelve completedsets of IMDN and the IMMP set used to produce them to the Data Center. Atthis time, these products shall be logged in, the IMMP secured, andassuming satisfactory quality, the IMDN sets shall be assigned unique FileNumbers. All sets of the IMDN shall be stored under Level 2 conditionsuntil required for distribution or generation of additional products.
At such time as authorized, one set of the Image Film Duplicate Negativerecord shall be distributed to each of the nine Co-Investigators and NSSDC.The remaining two sets shall reside in the Data Center. One of the sets ofIMDN shall be made available to the Radar Photo Lab (or other facilities onauthorization of the Principal Investigator) when required for productionof various image products.
9-7
9.1.2.6 Strip Contact Print. Strip Contact Prints (SCP's) are a 1:1 posi-tive-image rendition in all aspects of the Original Negative or DuplicateNegative Image Films. However, except under special conditions notedabove, SCP's will be generated from an Image Film Duplicate Negative setonly. Strip Contact Prints are reproducted on five-inch wide continuous-roll photographic paper. SCP's shall be designated as Level 2 products,and shall be handled and stored as such until such time that downgrading toLevel 3 may be authorized by the Principal Investigator or assignee. Onreceipt of an IMDN the Radar Photo Lab shall produce three (3) SCP sets anddeliver these products and the IMDN to the SIR-A Data Center. Whenreceived in the Data Center, the IMDN and the SCP's shall be logged in, theIMDN secured, and the three SCP sets shall be assigned File Numbers. Twosets of SCP's shall be retained in the Data Center under Level 2 conditionsand will be available as references to SIR-A imagery. The third SCP setshall be sent to NSSDC archives. Additional SCP sets shall be printed anddistributed as directed by the Principal Investigator or assignee.
9.1.2.7 Other Image Products. Other products such as photographicenlargements, viewgraphs, slides, art-work, etc., will be generated anddistributed on receipt of formal requests in the SIR-A Data Center, pro-viding such output has prior approval by the Principal Investigator orassignee and is so indicated on an Authorized SIR-A User List.
9.1.3 SIR-A NON-IMAGE PRODUCTS
Non-image products noted herein are defined as SIR-A related data not con-taining radar imagery. These products may be in digital, alphanumeric, orgraphic form, contained in magnetic tape, computer printouts,, microfilmand various catalogs, etc., originated on the.Orbiter, at remote sites, orlocally (GPL).
9.1.3.1 Real-Time Telemetry Data. SIR-A real-time telemetry data will bereceived at the JPL SIR-A Data Center from Johnson Space Center (JSC) inthree formats: microfiche, magnetic tape, and tabular/table hard copy.The microfiche will be delivered to JPL shortly after receipt of the dataat JSC; the tapes and printouts will be delivered approximately two orthree months after the end of mission.
9-8

9.1.3.2 Real-Time Telemetry Data Log Microfiche. It is estimated thatreal-time telemetry data will be contained in approximately one thousandmicrofiche units, consisting of certain flight engineering and ephemerisinformation extracted from Ephemeris and Data Parameter Telemetry Tapes(see below).
Immediately after receipt at the Data Center, the microfiche shall belogged in and a File Number will be assigned to the "package", rather thanthe individual units. Access and handling shall be under Level 1 condi-tions. It shall be the responsibility of individuals handling thesematerials to keep the package intact and in order. (It is recommended, iffeasible, that the microfiche be duplicated and stored in the Data Centerfor-use as a-back-up.).
The information contained in the Real-Time Telemetry Data Log is used bythe Correlator Facility as inputs for certain correlation operationalparameters. The microfiche shall be made available to the CorrelatorFacility under Level 1 conditions when required and returned to the DataCenter for Level 1 storage after logging in.
9.1.3.3 Ephemeris Tape. Mission orbital data will be contained in approx-imately ten ephemeris magnetic tapes generated at JSC. When received inthe Data Center, each tape shall be logged in and a unique File Numberassigned. This product is designated as Level 1 and.shall be stored assuch. Use, duplication or distribution shall be determined by, and at thedirection of, the Principal Investigator.
9.1.3.4 Data Parameter Telemetry Tape. Mission engineering data will becontained in approximately ten Data Parameter Telemetry magnetic tapesgenerated at JSC. When received in the Data Center, each tape shall belogged in and a unique File Number assigned. This product is designated asLevel 1 and shall be stored as such. Use, duplication or distributionshall be determined by, and at the direction of, the Principal Investi-gator.
9.1.3.5 Data Parameter Hardcopy. Mission engineering data extracted fromData Parameter Telemetry tapes in tabular and table hardcopy form will be
9-9

generated at JSC and delivered to JPL. When received in the SIR-A DataCenter, each unit (if segmented) will be logged in and assigned a uniqueFile Number. (If the data are received as loose sheets, they shall beassembled in binders, with each binder bearing a unique File Number.) Thisproduct shall be stored and handled per Level 2 conditions. Duplicationand disposition pending approval of the Principal Investigator shall be asfollows: one copy each to nine Co-Investigators and NSSDC, two copies re-tained in the Data Center for reference purposes.
9.2 SMIRR
9.2.1 POST MISSION DATA QUALITY REPORT
A data quality report will be published as a JPL technical document withinthree months after receipt of the computer compatible tapes, containingSMIRR data, as well as the 16-mm film. The data quality report will com-ment on the number of cloud-free data takes, the locations, the apparentsignal to noise, and any anomalies present in the data;
9.2.2 DUPLICATE PRINTING OF MASTERS
The flight film, both color and black and white, will be duplicated in theJSC photo laboratory. Four duplicates of the original data will be pro-duced. One copy will be archived along with the originals. One copy eachwill be used by the Principal and Co-Investigators, and a copy will be sentto NSSDC along with a computer compatible tape containing the original anddecalibrated data.
9.2.3 ORIGINAL FLIGHT DATA DISPOSITION
The original flight data on the flight tape recorder will be converted toCCTs at KSC. The original flight data will then be erased so that the re-corder can be reused. This erasure will take place only after it has beenverified that the data has been properly transferred to the CCTs. Dupli-cate copies of the CCTs will be made for dissemination. The original tapeobtained from KSC will be archived at JPL.
9-10
9.2.4 QUALITY CONTROL SCREENING
Quality control of "the conversion of the 'flight data to the CCTs -will bethe responsibility of personnel at KSC. When the tapes are delivered, JPLpersonnel will scan them and confirm that proper data is on the tapes be-fore the original data are erased from the flight recorder. Screening ofthe CCTs will be done to show up any bit errors or other omissions on thetapes. Selected samples will be printed out for screening by hand.
9.2.5 DATA DISSEMINATION TO THE CO-INVESTI GATOR
The Co-Investigator will receive copies of all the data produced in thisexperiment. He will also receive copies of the films as well as printsfrom selected portions of the 'film that are to be used in the dataanalysis.
9.2.6 DATA ARCHIVING
A complete set of tape and film data will be archieved at the Jet Propul-sion Laboratory. In addition the original film data and a master copy ofthe film, as well as CCTs containing the original data and decalibrateddata, will be sent to NSSDC six months after receipt of the data from KSCand JSC.
9.2.7 AVAILABILITY OF DATA TO THE PUBLIC
The public will be able to obtain copies of the SMIRR tapes and film byapplication to NSSDC. The data will be available six months after receiptof the data from KSC and JSC.
9.3 FILE
9.3.1 POST MISSION DATA QUALITY REPORT
A post mission data quality report will be available about two months afterthe tape recorder is released to the FILE experimenters. This report willinclude an assessment of instrument operation, number of frames of imageryobtained, quality of the photographic imagery, the distribution of data
9-11

relative to feature classes, and the performance of the class-rejectionalgorithm, which was designed to provide a nearly uniform distribution ofdata "among the four 'major feature 'classes.
9.3.2 DUPLICATION OF MASTERS
The flight tape recorder will be dumped and four tapes made at MartinMarietta. Additional tapes will be made at Martin Marietta and atNASA/LaRC, if needed. The flight 70-mn film will be developed andduplicated at JSC.
9.3.3 ORIGINAL FLIGHT DATA DISPOSITION
The original flight tape is an integral part of the tape recorder. Thetape recorder will be held at LaRC with the flight data on its tape untilthe data processing progress clearly indicates that no further need existsfor preserving the FILE data within the flight recorder. Then the recorderwill be returned to Martin Marietta for reconstructing the FILE experimentas needed.
The original flight photographic film will be stored for 1 year at JSC incontrolled humidity and temperature environment. At the end of that year,it will be shipped to LaRC.
9.3.4 DATA DISSEMINATION TO THE CO-INVESTIGATORS
Data dissemination to the Co-Investigators has been described in Section8.3.1.
9.3.5 DATA ARCHIVING
After the FILE experiment and science team has examined and verified theclassification data, a tape of the FILE flight data and a data summary willbe furnished to the NSSDC. It is estimated that these products will besupplied to NSSDC about 1 year after receipt of the STS-2 ephemeris data.
9.3.6 AVAILABILITY OF DATA TO THE PUBLIC
FILE data will be available to the public from NSSDC. Also, the FILEresults will be published in appropriate conference and journal publica-tions.
9-12
9.4 MAPS
9.4.1 POST MISSION'DATA QUALITY'REPORT
A post mission data quality report will be available about two weeks afterthe tape recorder is turned over to the MAPS Experiment Team. This willinclude an assessment of instrument operation, number of hours of datacollected, and the quality of those data.
9.4.2 DUPLICATION OF MASTERS
The flight tape recorder will be dumped at DFRC and three copies made.Further copies will be made at LaRC as that becomes necessary. The flightfilm will be developed and-duplicated at JSC.
9.4.3 ORIGINAL FLIGHT DATA DISPOSITION
The original flight tape is an integral part of the flight tape recorder.After the flight tape is dumped and the data quality are verified, the tapewill be erased as part of the post flight calibration.
9.4.4 DATA DISSEMINATION TO THE CO-INVESTIGATORS
The flight data will be used to generate a tape consisting of calibratedradiometric signals. This tape will serve as the source tape for the in-ference of the CO mixing ratio. The CO mixing ratio data will be distribu-ted to the MAPS Science Team in tabulated and map (isopleth) form. TheMAPS experiment will be conducted by Principal Investigator Henry G.Reichle, NASA Langley Research Center with the following Science Team:William L. Chameides, Georgia Institute of Technology; W. Donald Hesketh,NASA Langley Research Center; Claus B. Ludwig, Photon Research, Inc.,LaJolla, CA; Reginald E. Newell, Massachusetts Institute of Technology;L.K. Peters, University of Kentucky; W. Seller, Max Planck Institute forChemistry, Mainz, W. Germany; J.W. Swinnerton, Naval Research Laboratory;and H.A. Walles, NASA Langley Research Center.
9-13

9.4.5 DATA ARCHIVING
After the MAPS experiment and science teams have examined the data andverified them, tapes of the raw data, the calibrated radiances and thecarbon monoxide concentrations will be furnished to the NSSDC. It isestimated that these products will be supplied to NSSDC approximately oneyear after the receipt of the final ephemeris.
9.4.6 AVAILABILITY OF DATA TO THE PUBLIC
MAPS data will be available to the public from the NSSDC. Also, MAPS dataand results will be published in appropriate scientific journals.
9,5 OCE
There is a growing interest among oceanographers in using ocean colorimages for studies relating to ocean dynamics. In ocean colorimeterapplications, chlorophyll distribution patterns in the open ocean are usedas an important indicator of changes in water type which reflect circula-tion and anomalies associated with the main flow, such as regionalupwelling phenomena or meandering eddies. The subtle differences inchlorophyll content in large water bodies of different origin can be tracedby this ocean colorimetric technique. OCE data may provide interestingflow pattern images in the Southeastern U.S. Bight, and along the edges ofthe Kuroshio Current off the coast of the Japanese Islands, the eddies andnutrient upwellings in West Africa, and the South and Central Americancoast.
Also, chlorophyll analysis algorithms and the removal of atmosphericradiation effects are interesting scientific problems which need to beaddressed. A number of articles relating to the subjects of marinebiology, ocean flow, remote sensing, and radiative transfer processes in-volving ocean/atmospheric boundary, will be written and published in theopen literature.
This section describes the procedures that Goddard's OCE team will performfrom the receipt of the OCE data from KSC to the archiving of the processeddata at the National Space Science Data Center (NSSDC) located at GoddardSpace Flight Center, Greenbelt, Maryland.
9-14

9.5.1 POST-MISSION DATA QUALITY REPORT
A preliminary report on 'data"quality will be made available about 10 daysafter a duplicate data set is received at DFRC. This will include anassessment of instrument performance, total number of hours of useful dataacquired, and a preliminary evaluation of scientific data content.
9.5.2 DUPLICATION OF MASTERS
Formal OCE transfer will occur at KSC upon the Orbiter's return to KSC.However, as a precautionary measure, a preliminary data dump will takeplace at DFRC immediately after the Orbiter's landing. The dump will berepeated to create two sets of duplicate tapes (see subsection 7.1.5). TheOCE raw data in PCM format will not be distributed to Co-Investigators;only the 6SFC and KSC teams will have access to the PCM tapes.
9.5.3 ORIGINAL FLIGHT DATA DISPOSITION
The OCE data are recorded on the payload tape recorder and the recorder isthe Orbiter's flight instrument. The original flight data stored on therecorder will be erased only after the formal transfer at KSC and the dataquality checks have been verified by both OCE and SMIRR teams.
9.5.4 DATA QUALITY CONTROL AND SCREENING
The OCE tapes which are to be distributed to experimenters are in a formatwhich can be readily used in analysis programs, as described in subsection9.5.1. The data includes extensive document files on timing, specific geo-graphic location information of the data taking, and radiometric calibra-tion constants. The tapes will incorporate the STS-2 ancillary data thatwill be provided by the mission office. The JSC ephemeris data in BET willbe available 14 weeks after the mission is completed. Therefore, thescreening of the OCE data quality by the Principal Investigator will haveto be completed during this initial 14 weeks.
9-15

9.5.5 DATA DISSEMINATION TO THE CO-INVESTIGATORS
OCE has a number of Co-Investigators and experimenters. Current plans areto disseminate calibrated CCTs to all the Co-Investigators and experi-menters.
The Co-investigators include:
L.R. Blaine, GSFC.
R.S. Fraser, GSFC.
N.E. Huang, WFC.
H. Van der Piepen, DFVLR.
and the expnimenters are:
P.E. LaViolette, NORDA, NSTL Station, MS
J.A. Yoder, Skidaway Institute of OceanographyP. Wiebe, Woods Hole Oceanographic Inst.V. Klemas, Univ. of DelawareC.R. McClain, GSFCM. Viollier, University of Lille, France
For those investigators who are not equipped with an image processingsystem, ultimate chlorophyll gradient images can be made available toselected experimenters. This image can both be saved on magnetic tape(DICOMED tape) or as a photographic image.
9.5.6 DATA ARCHIVING AND AVAILABILITY TO THE PUBLIC
After the di'ssemination to the OCE team, all the OCE data of acceptablequality will be archived in the NSSDC and will be made available to thepublic.
9.6 NOSL
9.6.1 POST MISSION DATA QUALITY REPORT
The Data Quality Report will be prepared at the end of 1 week after receipt
of duplicate film and tapes.
9-16

9.6.2 DUPLICATION OF MASTERS
THe BupTi tat ion of'masters o'f "both1 16-"mm film and vi'deo 'tape will be
carried out by JSC.
9.6.3 ORIGINAL FLIGHT DATA DISPOSITION
The original flight data will be filed at MSFC.
9.6.4 QUALITY CONTROL AND SCREENING
Data from the camera and tape recorder will be screened and divided intothose portions showing good potential for data analysis and those portionswhich for reasons of distance, inadequate illumination, sensitivity, etc.,appear to be of marginal quality.
9.6.5 DATA DISSEMINATION TO CO-INVESTIGATORS
O.H. Vaughan, M. Brook, and B. Vonnegut are the Investigators who willreceive the data. Each Investigator receives film, magnetic tape, astro-naut notes, and ephemerides. When synchronization is completed, the 16-mmsound film will be-made available to each. Outside-investigators will gainaccess to the data by making requests to O.H. Vaughan at Marshall SpaceFlight Center. Data will be made available to outside investigators 90days after completion of the flight.
9.6.6 DATA ARCHIVING
The raw mission data and the synchronized film will be archived in NSSDC.
We expect to get the data into the NSSDC at the end of six months. No datawill be archived at SUNY at Albany.
9.7 HBT
Because the HBT is not an experiment but an engineering test, no data will
be sent to NSSDC.
9-17
SECTION 10. DATA ANALYSIS
SECTION 10. DATA ANALYSIS
The processed data is analyzed as described below for each of the experi-ments to produce useful scientific or engineering results. Estimates ofthe efforts required and time needed to perform these analyses are alsogiven. The Data Flow Diagrams and Schedules given in Section 8.0 alsoinclude the analyses described here. The data analysis.is also shown herein HIPO format.
10.1 SIR-A
Two approaches will be used in the analysis of the SIR-A data. These are:
1) In-depth analysis of specific test regions. For these areas theanalysis will use SIR-A, Landsat and Seasat (if available) datain conjunction with ground truth, including available geologicmaps, and previously acquired airborne data.
2) Survey analysis of the data from different physiographic regionsin order to understand the radar signature of a variety of terraintypes, covers and features.
The SIR-A investigators have selected a number of regions for which theywill concentrate most of their effort. Some examples of their activitiesare listed in Section 4.1.2.1.
The SIR-A investigators will also look at all the SIR-A data in order toassess the overall quality of the data and identify any highly interestingareas which would require further investigations.
t>
The SIR-A data analysis flow is depicted in Figure 10.1-1.
10.2 SMIRR
10.2.1 ANALYSIS PROCEDURES
The data analysis procedures are as follows:
1. Scan of the complete digital data set to show up anomalies.
10-1

oOl t. T- (/Io o 4J rere M- re uW- 4-> L.t. ai a> reV) 3 &*O
4-1 VI i. Olvi x re a> 4->O) O) 4-> (J.c *j i. cai
4-> — re •»-1—t. 4-> a;re c -a r- viLU ai <u aE 4J O S-
<•- re o i- oO <U <U Olt^
Cr- OVt •»- Ol r- VIcx^- vi o o.ig oi re
1-
i<c
14-oVI
VI
«reVI3O01cre
•5
(O
0
i.aiOlre
re•ares.
1re
of s
pe
cifi
c 1
V)
VI
recre.co.<U•oc
0
VIco
OlV.
coVI
Q
U
J=3
C3
|
O
co>Et/>V)
t/>I/)(O
>^
^>,_
(O
§•<Q
S
o
unus
ual
sur-
0
co
reu*4-
cOl
o
VIrei-reO)ure<*-
c0
re<j
c01•o
Ol
o . - .- _
OlOlre
t.re•a
o
OO
(U
O
V)•in>>fO
<fO
4->«a
|
C/lO)cn(O
Ot
CM
"fGC.
t/)
U
g
o1
OJ
1-<cs«c_J
VIOlOlreE
D^-
C\J ^~
a: re fin 3
re u•1 > 4->i re
l- -a«T <4- Ct/> •»- 3«I— OUJ L.in u>
VI VIa. a.1 i4-> U
t- -^-<o o^t. 0
L. *O•»- ai
fre
s-
«co"oi£u
•^ t/>•i.£re 3U 4-»
0t— 1
S-
Li_
01 re io c• OlVI «^>* VI
•CO-
10-2

2. Analysis of the anomalies to separate atmospheric from surfaceeffects.
3. Correlation of anomalous areas with prints of-the film data fromselection of geologic units from existing geologic maps, and com-pilation of digital data from each of the chosen areas.
4. Application of statistical and ratio techniques to the data todetermine separability of geologic units and the ability to iden-tify minerals.
5. Incorporation of ground truth and atmospheric data to augment theabove analysis procedures.
The data analysis flow for the SMIRR is given in Figure 10.2-1.
10.2.2 SUPPORT REQUIRED
Approximately four man-years will be required to reduce and analyze thedata during the first year. In addition computer services and travel sup-port will be required.
10.3 FILE
10.3.1 ANALYSIS PROCEDURES
Martin Marietta, under NASA LaRC contract, will reduce the digital imagerydata on the FILE 9-track CCT and analyze the data according to proceduresthat have been developed under NASA Contract NAS1-15602. The analysis willinclude these tasks:
a. Produce a four-color (one color for each feature class) hard copyof each FILE classification image, based on a processingalgorithm identical (as nearly as can be determined) to theelectronically programmed algorithm in the FILE.
b. Compare each four-color classification image with the correspond-ing color photograph obtained from the film camera. MartinMarietta will annotate one set (of the 3 sets provided by JSC) ofthe FILE color prints to show an outline of the CCD camera field
10-3

10usno
6 0
10 4J
s- ura£•o ••-<U *J*J Cu <u01 -a
o A
pp
lica
tio
n o
f a
na
lysi
sa
lgo
rith
ms,
e
.g.
rati
os,
prin-
cip
al
com
pone
nts,
an
d ca
no
nic
al
sta
tisti
ca
l a
na
lysi
s
o In
corp
ora
tio
n o
f p
ost
-mis
sio
nda
ta
o LA
NDSA
T im
age
com
paris
on
j
o D
igita
l da
ta
scan
fo
r an
omal
ies
|
o A
na
lysi
s of
ano
mal
ies
|
co+J10"ai&.uou104->10 ' ' -•- _ . _•a
ex
"e
!Z
o
J i
o S
ele
cte
d re
gio
na
l da
ta
wit
h kn
own
geol
ogic
un
its
o LA
NDSA
T im
ages
o P
ost
-mis
sio
n da
ta
- G
roun
d tr
uth
- A
tmos
pher
ic d
ata
CM•
O
10-4

of view superimposed on each print, and then send this set ofprints to LaRC. MMA will use the other 2 sets of prints and thetwo film transparencies (supplied via "JSC), 'in conjunction withany additional pertinent ground truth imagery accessible by MMAor made available by NASA, to make frame-by-frame comparisons ofthe FILE in-orbit classifications with the photo-interpretativefeature classification. From these evaluations, MMA will deter-mine for each scene the accuracy of the real-time (in-orbit)classification by FILE.
c. Perform statistical analyses of the FILE classification data todetermine the optimum algorithm for all the FILE data collected
.on STS-2. These analyses will use previously developed (underNASA contract) tools, i.e., data-clustering displays, data selec-tion capabilities for evaluating misclassification areas andexamining imagery data and statistics of those areas, and histo-grams for the spectral-ratio distribution for each feature classand the statistics for those distributions.
d. Evaluate the FILE performance and accuracy of classification of
these preselected parameters:
o Spectral band centerpoint selection,
o Spectral bandwidth.
o Classification thresholds and the scene class rejectionalgorithm, i.e., the FILE design feature for selecting nearlyequal numbers of image for-the-four feature categories.
o Optical settings, including field of view, optical filtering,lens f-number, and shutter speed.
o Film selection, including sensitivity, spectral response, andhaze-rejection properties.
o Resolution, smear, and sun angle.
10-5

The Langley Research Center will conduct a parallel FILE data analysiseffort, using independently developed data processing and analysis tech-niques for evaluating 'the "'FILE "in-'fVvght cTassifi'cation accuracy, anyneeded algorithm modification and optimization needed for improved classi-fication accuracy, and the photographic data quality. JSC's inputs will beused in making the final evaluation (joint LaRC/MMA) of the photographicperformance quality of FILE and the influence of the mission environment onit.
The data analysis flow for FILE is given in Figure 10.3-1.
10.3.2 TIME REQUIRED
A report on the Shuttle FILE results will be complete one year from thetime all the data products are available to the Co-Investigators(including Shuttle ephemeris data).
10.4 MAPS
10.4.1 DATA ANALYSIS
The MAPS experiment is not funded to perform data analysis. The*MAPS COdata will be processed to yield CO concentrations vs. elapsed time, CO vs.latitude and longitude, averages over particular geographic features,e.g., hemispheres, continents, oceans, etc. The data may also be processedto yield day vs. night averages or correlations with large weather systems.
The interests of the science team members include interhemispheric distri-.bution of CO, the role of CO in tropospheric photochemistry, sources andsinks, and transport phenomena.
As this experiment will provide the first synoptic global data on CO dis-tribution, the precise analytical procedures cannot be defined at thistime. Detailed analysis of the contour maps showing the relative varia-tions of the CO concentrations along the ground track might be carried outto detect obvious changes in the CO distribution around the Earth in orderto check the agreement with two-dimensional photochemical models.Attempts might be made to correlate the observed data with three-dimensional models combined with chemistry and observed winds and sink
10-6

>,o
o o -ot— T- 0)
0 M- MU T- T-
1 X J3 10 4-1O r— O.U- O O
O
O
(O
r-»<oOl
t2o.(-o>
3
O
o
o
raN•r~E
a.o
e4-1
S-oOl
<0.
103
(O
01
U
OlEroS-
Q.
"ioU
in Ci- OIO 4>>
LO
O
t/1f"oinL.
O.E
U
•5t.
•oc
£0
o
sses
s-
10
o10
UUIO
c0
IDU
1— 4Jin cin o>
G
O
co1310N•*•
IOc
*•I-I.oOl
5
o
<o•4-J<flQ
=o
o
^^ ** •*-O) (O 4^
< LO
0 O
S— (•-0 U
o o
E 015
o
I
•oH
1 C
|
co"£IOU
_4Jc01
01i.3
IO01«.
c01U
0
1D.
VI
a.<aOl0
oSL
f 0-
^ i.i. 0
Ol OO) -O OIO CE 3 UJ
" S it3 !_•*-
0 1
in-CexreV-010
Q.
o: —*— ' >>s- reo-o
•— c0 0U U
QJun inI*-1
10coU0)tn
OlOi
•§+J
<oirt
Crc_J
i
cnU-
10-7
estimates. In addition, the data might be analyzed to determine the totalinterhemispheric mass transport of CO and what its variation with longi-tude is. A possible data analysis scheme is shown in Figure 10.4-1.
10.4.2 TIME REQUIRED
These efforts should be complete approximately two years after the flight.
10.5 OCE
10.5.1 ANALYSIS PROCEDURES
The OCE calibrated tapes will be used to produce chlorophyll gradient maps.These maps will consist of images processed by hardware and software avail-able at the 6SFC Atmospheric and Oceanic Interactive Processing System(AOIPS) facility. The Goddard team has been successful in deriving chloro-phyll images from Ocean Color-Scanner (DCS) raw data. The OCS is similarto the OCE.
In this procedure, calibrated CCTs which contain selected geographic areaswill be processed on a Goddard Space Flight Center image processing system.The hardware used for this purpose will be the GE Image 100 system used inconjunction with a POP 11/45 computer. The system allows the user todisplay multi-channel images of OCE scenes on a video screen and tosimultaneously perform various calculations and manipulations upon thedisplayed data in order to enhance the image and to extract useful informa-tion.
Software has been developed for the Image-100 expressly for the purpose ofconstructing chlorophyll gradient images using OCE data. The techniqueinvolves band ratioing of the OCE radiometric data after an atmosphericcorrection has been made. The result of the calculation is an image of therelative chlorophyll concentration within the ocean scene. This image canboth be saved on magnetic tapes and be provided as a photographic image.The magnetic tape is one that can be processed by DICOMED hardware to pro-duce photographic images of the scene. The chlorophyll images can be pro-cured in black and white or color and can be annotated as desired by theuser. Figure 10.5-1 shows the data analysis flow for the OCE experiment
10-8

(/I VI
I0) E 4->
«- VI E 01 s.a c i- .c oo o -a i- a.4J •*- vi a) vic 4-1 m ,— 4-> c0 10 i <u c 10us- CNJ -a •»- i_
4J•o c -a01 ai 01•ou t- •—(O C **- 13 Oi. o i- O S- <*-do -o •<- a. oo. o E
o;
uo
aiocooou
oa.V)
o
V)O^(_P A)
M-lO E
(O viC
T3 OOl ••-
O 10VI o
10 orQ.
aivi -aV) O
o-
O V)V) 4^
in>?->(O
(O0
O)s_3cn
cu i— uo 10 01c o j=o — a.U E vi
OJ ••••O Jc E
COO.(O
L. VI E3 C •*-O O -O
0)"*- OO Ou
v> c»— m
1
10-9
and Figures 10.5-2 through 10.5-4 give the detailed algorithms and stepsfor producing the final chlorophyll maps.
10.5.2 TIME REQUIRED
The times required for the various parts of the data analysis are asfollows: the quick-look image will be generated within ten days afterremoval of the data from the Orbiter. The calibrated radiance tape will beavailable three to eight months after the flight, the chlorophyll contourimages will be developed six to eleven months after the flight, and the in-depth analysis of the OCE data will be completed up to one year after theflight.
-10.5.3 SUPPORT REQUIRED
The support required will consist of continuous funding for the dataanalysis activity for an additionalyear. This is estimated to be $10K forhardware close-out and $60K for data processing and dissemination duringthe first twelve-month period.
10.6 NOSL
It is expected that the analysis of the data will be completed by allgroups at the end of six months.
The data analysis to be carried out by Dr. Marx Brook and his colleagues atNew Mexico Institute of Mining and Technology will be concerned primarilywith the study of the photocell data recorded with the NOSL equipment.This data analysis will involve writing out the characteristics of dis-charges from various storms with a digital recorder and comparing these tosimilar observations that have already been carried out in studies from theground and from the U-2 aircraft. These data on the individual dischargeswill be related to the characteristics of the storm and lightning channeldetermined from the 16-mm photographic film. In the case in which we arefortunate enough to have simultaneous observations from lightning observa-tories on the ground, the two sets of data will be carefully correlated.
It is anticipated that the copies of the 16-rrm footage and the tape re-corded outputs will be available for the investigators in about a month or
10-10

0)(J
i OO
O.O
>f_
tflX
*(OC(O
l+_O
C Eo -c
10 Zu o
*S."«<o
C0
4U<U
i-0uuS-01
a.i/j
E
«
1
4->
I/I
3f—
01Uf-
-o<0
L.0)*•3
•
gC
00
LO
C(a
Sc^tCO
"-•
1C<uCD
Q.
1.
0
COu
r_
>% C
•S.5O 4JS- 10o u
•— 01
u
•
O
O
(O
(OQ
LO
0)
0) i-O L,C 4->10 C
s s(Oi- OJ
O
*— (O0) S-2O. u
> Q. C1 - W O ,0) O i- '
o <
o o
10-11

0)ucIB
•oa
Of S-<u
oj IB«-> 2
5 --*
'W •>
X
£ £i— i ^^ <«+ U S
•*- *Jl/l O£ O * W» IB
•O l-« «*- O + •<
<u -^ i— i </> S •— '« c -t- n 510 10 ,< 6 * '— c- *j s- oe3 - - <O QJ 1- r<<J II Of *J "-> i->
<e <e u •— S u jio **— oc-
_« wi ii •— i ac. «-
"^ § | ^2 -o " «tr >*- •< *-*• * -<
• • •« evj «n
;
c0
0) . — . *J•— <0 3O> —~ J3 ^~C t- 1/1« t 0 1 - ^ -•a *Jj= a) c aj•W £> O N
c c <a uio 0) jrr^*i- rvi o> o^ -o i-**j >-* u -f- ^*" o oe<e i- _ <B <u- — • v> >-ie IB o= 14- ~ o ~•5 ^^- U X L.*-> O 3 IB Ol -Ovi oo </> er «* c01 «9
•< o o o o ••<
'
t
co
•^»
4-J3J3
&IJ_>CO
o
:^oB^^
^<4-
C
•r-
0(!)S-s-0o
•CVJ
1tftot— 1
01S-3o *
*r~• ^]
<uuc03
•oIO
t•§3
QJ=
1r™*
•!••
(O+J
^•
10-12
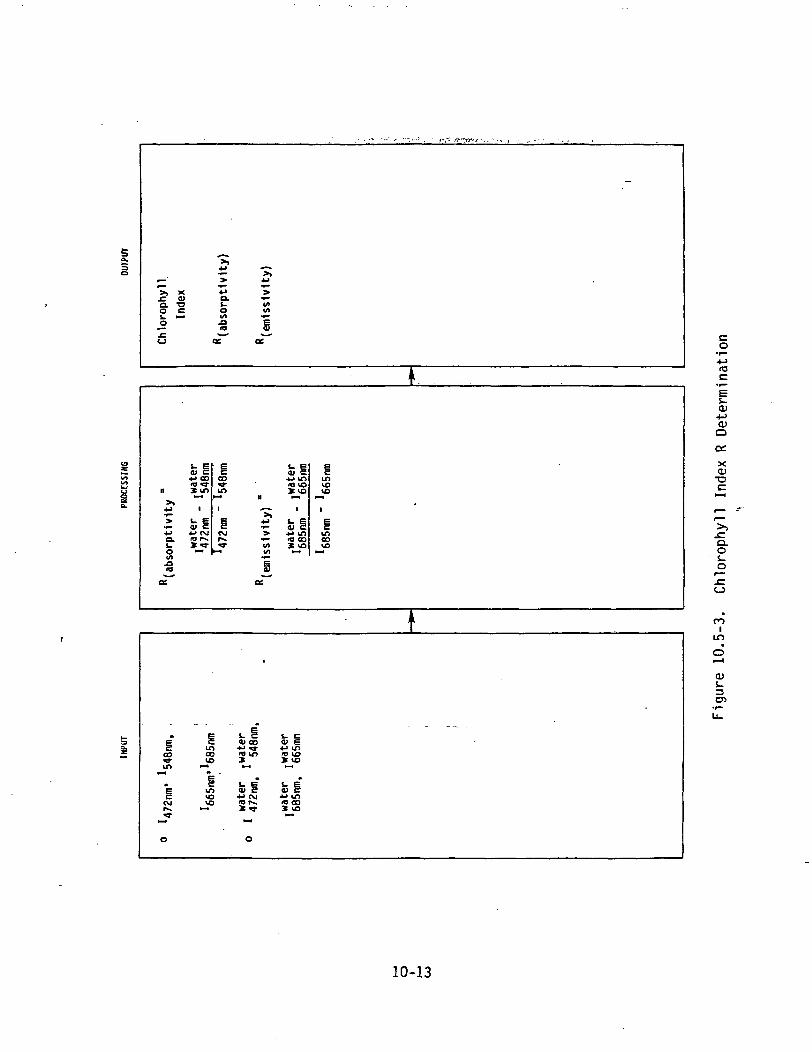
>> x.C 01Q. T3O Ct. i—•O
•Ua.
*j in10 vo
in<ovo
O>
0£
X
•oc
>»•w i
••- 0)> *j inf «coui 2 vatn <—i
COvo Q.
O• s-o
iLO
O)
305
iCO
incoto
t. £V CO
1 inVO
invovo
01 cj-> vn>e coX vo
10-13

— in>> s:n. vo 3i_ oo j->
•— c.C Oo o
S-Ol
O)
Q.te
o — <4J CD
J_
ocoo
C JlCU I Q.
os_o
•M Oc tno.o — o
<_) ro Q.I
LO
3C7>
<uT3
01•ac
>>4->
>
eo CE
o
Ol•o
Olco
10-14

less. The synchronization of the film with the tape recorder output willprobably require yet another month or two. The 16-mm film will be reviewed'to determine times and locations of lightning discharges and convectiveclouds. To the extent that is possible, weather maps and satellite datapertaining to these situations will be assembled. In order to differen-tiate between the precipitation and convective hypotheses of cloud elec-trification, the film will be analyzed to determine whether lightningdischarges are ever observed under stratiform cloud situations. Compari-sons will be made to determine the relationships that exist between thelightning flash frequency and the vertical and horizontal extent of con-vective activity. If a sufficient number of examples is available cflightning-producing cloud systems over land and over sea, comparisons willbe made between their convective activities and Ivghtning production.Lightning spectra obtained in night-time photography will be compared withspectral data that has been obtained in the past from cloud-to-ground dis-charges. It is hoped that there may be sufficient differences evident toserve as a basis for differentiating between intra-cloud and cloud-to-ground lightning. If nighttime photographs show examples of lightningflashes extending in excess of 100 km, a frame-by-frame analysts will bemade to"determine the rate of propagation of the discharge for comparisonswith existing data on stepped and dart leaders, and return strokes.
The magnetic tape recording of photocell optical data will be reviewed forsignatures of lightning discharges. These will be graphically displayedfor analysis by comparison with photocell optical signatures that havebeen obtained from the ground and from U-2 airplanes with accompanying slowantenna data. It is anticipated that with such comparisons, it may bepossible to differentiate between signatures caused by intra-cloudlightning and cloud-to-ground lightning. An effort will be made to esti-mate the energy of the lightning discharge on the basis of its photo-optical response. Because the circuit of the present apparatus responds toboth the intensity of the change, the discharge and its time rate ofchange, estimates of the energy of the discharge based on the photocelldata will be subject to uncertainty. If observations can be obtained onstrong thunderstorm-producing tornadoes, an effort will be made to relatethe frequency of the discharge rate to the tornado activity.
10-15
NOSL data analysis flow is shown in Figure 10.6-1.
10.7 HBT
Data analysis will consist of observations of the recovered specimens,
measurement of their height, and the length of the stem below the cotyledon
(hypocotyl length), documentation by photography, and measurements of soilmoisture by weight loss upon drying. This should take about one-half day.
The HBT data analysis flow is depicted in Figure 10.7-1.
10-16

VI OJ VIaj n. o•f- vi •*-Cl 4->S_ C V)01 O —C •«- kOJ 4J OJ
10 *JQJ Ol (J> IO rO
•— a. i_+-> o tou s- .eQ) O. O
c 01 01a c e
ooo
<u.*4-)U<U>c0u14.
oco4J
IOcg
4J
01a
0
£4->VI>>l/l
•o30
<_)
it-o>>Ol
a>c<u
1.ScoN
i-o
oco4J
c
€
4J
Olo
0
c0
toOl
s.0
a.ajOl
fO
ul/l•^
t—
u </i+J CJS- QJ<u a.> V
int/i
c(t)
Q-)<Q•oraS-
u(Ua.t/i01cc
0
_J
o
•ac
c0
VI(/I
g
1_a.
oc0
^J<Q
L.
30
<oQ•o
.C01
<+-
o
o
to
re
(OO
I
*o
I/IOl01
Olc
•1—c4-1
Ol
_J
o
fre
qu
en
cy
1
Olc
•f—
c4-)^Ol
-1
o
4->uOla.
Ol
•r—c4-*
01
-1
O
IO4.)IO•acoI/IVI
EHI
a_
o
to4-)
•aE
O
VI
a>•a3
1—
1
to4-)IO
•O IO
•*•> IOi -a
IO
u o'r- I/Ito vi
CNJ E
l/lo
i a.
o
<u
oX
•O i.C Olto C71
• E01 ••-LUO 0)
h- r—<c aj0 la2: vi
^
i
vtCo
4-JIO> " •L.OJV).co•ac
1Ol
v> aj
O *"*ai toC L.IO •»-
4-> VI•— HI
E *-^
10
0
OJ
3
10-17
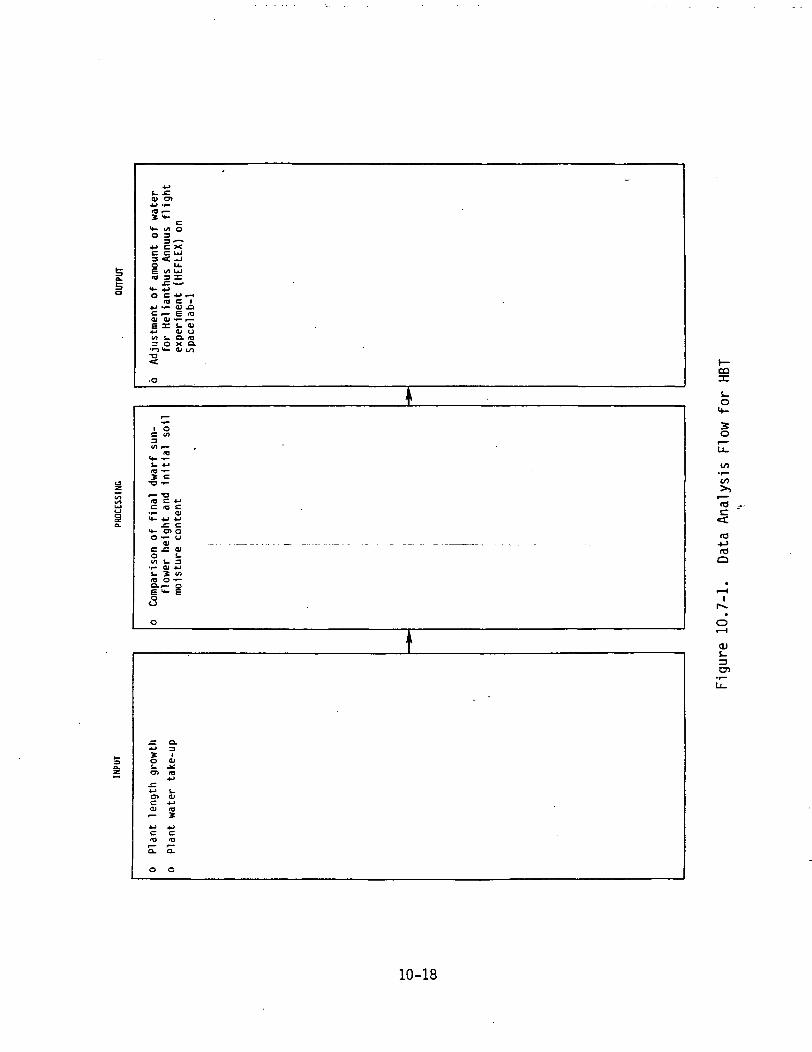
>*- (/l OO 3
3'—*-> C XC C UJ3 • -O
O C 4-1 i— I
.p- E 10
I ai ••- •—=C I- 0)
> <U UL. a. (a0 x 0 .
> U- 0) l/l
O
I/)
in
(O
.n- 01 oo "- utuc j= aio s-Ul i. 3• ai *Js. 2 en(O o •*-a.,— oE «- S
<a<T3
o
i
•
O
O)
3CD
3O
en aic 4-1ai nr- 3
10-18

SECTION 11. SCIENCE RESULTS REPORTING

SECTION 11. SCIENCE RESULTS REPORTING
A report summarizing scientific results from OSTA-1 will be published bythe Program Scientist within 1 year after receiving individual finalreports from experimenters. Such a summary report and individual papersfrom experimenters may be published in summary form in the appropriatetechnical journal.
The Principal Investigator's plans for their contributions to the MissionScience Report and their plans for publication of results of analysis ofdata from this mission are stated here.
11.1 SIR-A
11.1.1 MISSION SCIENCE REPORT
A preliminary report will be prepared by the SIR-A team within three monthsafter receipt of the SIR-A film at JPL.
A final report will be prepared within one year after the flight. Thisreport will consist of: 1) the results of the investigations of eachinvestigator and his collaborators, 2) an overall summary of the resultsfrom SIR-A including a comparison of the utility of the data in geologicmapping relative to other sensors, and 3) recommendations for future workin the area of spaceborne radar geology.
11.1.2 PLANNED PUBLICATIONS
The SIR-A team studies results will also be published in open literaturejournals and presented at various conferences.
11.2 SMIRR
11.2.1 MISSION SCIENCE REPORT
The data processing and analysis will proceed in a timely fashion and pro-ducts will be readied to meet the deadlines of the mission science reportas well as other reports required by the project.
11-1
The analysis report will contain:
1. "Haps "of "surface c'bvefa'ge2. Photo-mosaics of areas studied
3. Study of the effect of the variable atmospheric transmission onthe value of the data.
4. Linear discriminant analysis results on selected data setsshowing the relative importance of the ten spectral bands inseparating and identifying surface materials.
5. Study of the usefulness of the ten spectral bands in directidentification of surface materials.
6. Study of the variability of the spectral signature of vegetationin the SMIRR wavelength bands.
7. Study of the correlation of SMIRR results and subsequent ground
spectral measurements.
8. Recommendations for spectral bands for a reflight of an improved
SMIRR instrument.
11.2.2 PLANNED PUBLICATIONS
Several publications are planned.
a. An experiment description document will be produced as a JPLreport by the end of FY 81.
b. A data and experiment description document will be produced toaccompany the data being delivered to NSSDC.'
c. At least two publications concerning the results from the experi-
ment will be prepared for publication in the open literatureduring the first year after the flight of OSTA-1. If resultswarrant, further open literature publications will be prepared.
11-2

11.3 FILE
11.3.1 "MISSION SCFENCE'REPORT
The mission science report for FILE will be submitted within one year.
11.3.2 PLANNED PUBLICATIONS
The FILE results will be published in appropriate conference and journalpublications. Two or more papers are planned for publication of results of
FILE data.
11.4 MAPS
11.4.1 'MISSION SCIENCE REPORT
The preliminary report will be prepared three months after receipt of the
data from the orbiter.
It is intended that a considerable portion of the MAPS data will be reducedduring the first year after the flight. These data, in the form of COdistributions as a function of location will be made available for theMission Science Report.
11.4.2 PLANNED PUBLICATIONS
MAPS data and the results of their analyses will be published in the appro-priate scientific journals. It is estimated that at least five papers willbe published from one to two years after the flight.
11.5 OCE
11.5.1 MISSION SCIENCE REPORT
A preliminary science report will be published about eight months after the
Orbiter flight.
11.5.2 PLANNED PUBLICATIONS
Scientifically significant results of OCE data analysis will be submitted
for publication in the open literature and in appropriate NASA documents.
11-3

Articles published in scientific journals will discuss subjects related tomarine biology, ocean flow, radiative transfer processes, and remotesensing of the oceans.
11.6 NOSL
11.6.1 MISSION SCIENCE REPORT
A plan which provides data reports during the mission and shortly afterremoval of data from the Orbiter is planned. The preliminary findings willbe given a month or two after the mission.
11.6.2 PLANNED PUBLICATIONS
The NOSL team studies results will also be presented at symposiums. It is
expected that four or five scientific publications will result from theNOSL experiment.
11.7 HBT
11.7.1 MISSION SCIENCE REPORT
Input to the Mission Science Report will be provided within 2 to 3 weeksafter data analysis is completed.
11.7.2 PLAiNNED PUBLICATIONS
If results justify publication, a manuscript will be -submitted to a bio-logical journal within 2 to 3 months after the data analysis is completed.
11-4
APPENDIX A. ACRONYMS AND ABBREVIATIONS
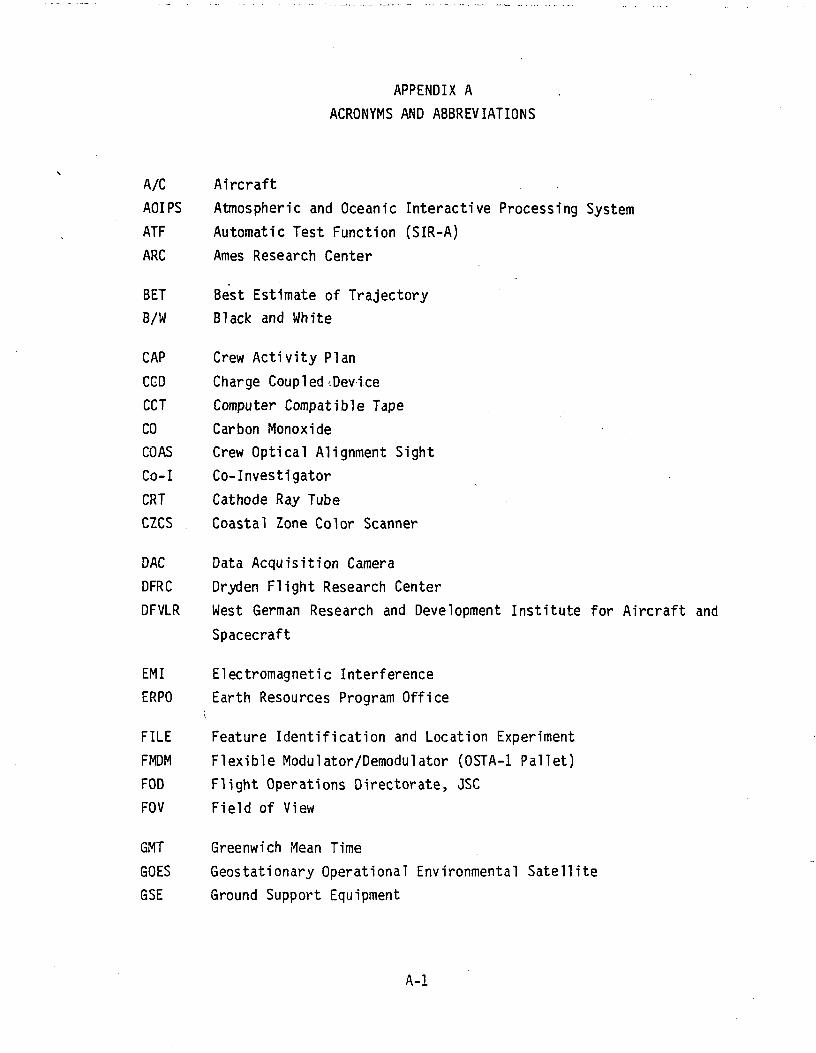
APPENDIX A
ACRONYMS AND ABBREVIATIONS
A/C AircraftAOIPS Atmospheric and Oceanic Interactive Processing SystemATF Automatic Test Function (SIR-A)
ARC Ames Research Center
BET Best Estimate of TrajectoryB/W Black and White
CAP Crew Activity Plan
CGD Charge CoupledcDeviceCCT Computer Compatible TapeCO Carbon MonoxideCOAS Crew Optical Alignment SightCo-I Co-InvestigatorCRT Cathode Ray TubeCZCS Coastal Zone Color Scanner
DAC Data Acquisition CameraDFRC Dryden Flight Research CenterDFVLR West German Research and Development Institute for Aircraft and
Spacecraft
EMI Electromagnetic InterferenceERPO Earth Resources Program Office
(FILE Feature Identification and Location ExperimentFMDM Flexible Modulator/Demodulator (OSTA-1 Pallet)
FOD Flight Operations Directorate, JSC
FOV Field of View
GMT Greenwich Mean TimeGOES Geostationary Operational Environmental SatelliteGSE Ground Support Equipment
A-l
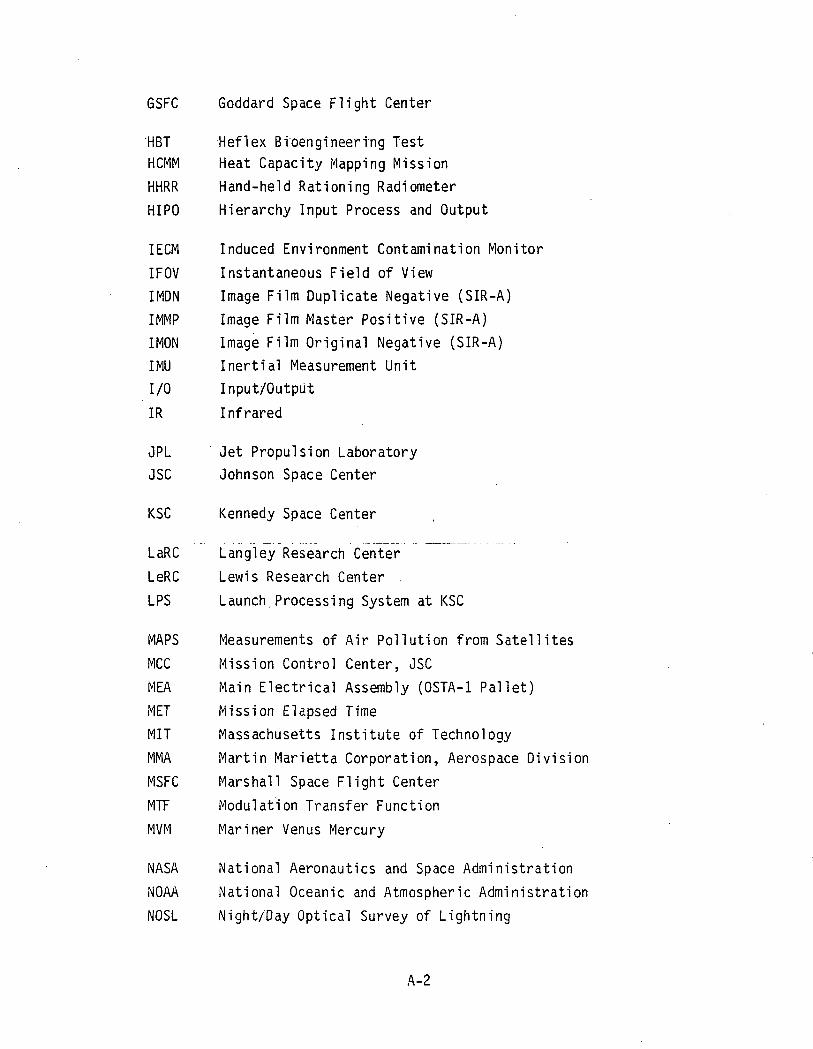
GSFC Goddard Space Flight Center
HBT Heflex Broengineering TestHCMM Heat Capacity Mapping MissionHHRR Hand-held Rationing RadiometerHIPO Hierarchy Input Process and Output
IECM Induced Environment Contamination Monitor
IFOV Instantaneous Field of ViewIMDN Image Film Duplicate Negative (SIR-A)IMMP Image Film Master Positive (SIR-A)IMON Image Film Original Negative (SIR-A)IMU Inertia! Measurement UnitI/O Input/Output
IR Infrared
JPL Jet Propulsion LaboratoryJSC Johnson Space Center
KSC Kennedy Space Center
LaRC Langley Research CenterLeRC Lewis Research Center .
LPS Launch.Processing System at KSC
MAPS Measurements of Air Pollution from SatellitesMCC Mission Control Center, JSCMEA Main Electrical Assembly (OSTA-1 Pallet)MET Mission Elapsed TimeMIT Massachusetts Institute of TechnologyMMA Martin Marietta Corporation, Aerospace DivisionMSFC Marshall Space Flight CenterMTF Modulation Transfer Function
MVM Mariner Venus Mercury
NASA National Aeronautics and Space Administration
NOAA National Oceanic and Atmospheric AdministrationNOSL Night/Day Optical Survey of Lightning
A-2

NRL Naval Research LaboratoryNSSDC National Space Science Data Center
OCE Ocean Color ExperimentDCS Ocean Color ScannerOFT Orbital Flight TestOMI Operations Management Instructions (Rockwell International)QMS Orbital Maneuvering SystemOPF Orbiter Processing FacilityOSTA Office of Space and Terrestrial Applications
PCB Power Control Box (OSTA-1 Pallet)PCM Pulse Code Modulation
PCR Payloads Control Room, JSCPI Principal Investigator
PIP Payload Integration PlanP/L PayloadPN Pseudorandom NoisePOCC Payload Operations Control Center, JSCPRF Pulse Repetition FrequencyPTD Photo Technology Division, JSC
RCS Reaction Control System
RMS- Remote Manipulator SystemRTC Real-Time Ground Command
SAR Synthetic Aperture Radar
SCP Strip Contract PrintSCR Strip Chart Recorder
SFMP Signal Film Master Positive (SIR-A)
SFON Signal Film Original Negative (SIR-A)
SIR-A Shuttle Imaging Radar-ASMIRR Shuttle Multispectral Infrared RadiometerSMMO STS Mission Manager Office, JSC
SPC Stored Program CommandSPIDPO Shuttle Payload Integration and Development Program Office, JSCSTC Sensitivity Time Control
A-3

STS Space Transportation SystemSUNY State University of New YorkSZA Solar Zenith Angle
USGS United States Geological Survey
ZLV Z-axis Local Vertical attitude
A-4

APPENDIX B. HOW TO ACQUIRE OSTA-1 DATA FROM NSSDC

APPENDIX B. HOW TO ACQUIRE OSTA-1 DATA FROM NSSDC
INTRODUCTION
The National Space Science Data Center (NSSDC) was established by theNational Aeronautics and Space Administration (NASA) to provide data andinformation from space science experiments in support of additionalstudies beyond those performed by principal investigators. In addition toits main function, NSSDC produces other publications. Among these are theReport on Active and Planned Spacecraft and Experiments and various usersguides.
Virtually all data available at or through NSSDC result from individualexperiments carried on individual spacecraft. The center has developed aninformation system utilizing spacecraft/experiment/data identificationhierarchy.
NSSDC provides facilities for reproduction of data and for on-site datause. Resident and visiting researchers are invited to study the data whileat the center. Researchers will be assisted with additional data searchesand use of equipment. In addition to satellite data, NSSDC maintains somesupporting information that may be related to the needs of researchers.
The services provided by NSSDC are available to any individual or organiza-tion resident in the United States and to researchers outside the UnitedStates through the World Data Center - A for Rockets and Satellites (WDC-A-R&S). Normally a charge is made for the requested data to cover the costof reproduction and processing the request. The researcher will benotified of the charge, and payment must be received prior to processing.However, as resources permit, the Director of NSSDC/WDC-A-R&S may waivecharges for modest amounts of data when they are to be used for scientificstudies or for specific educational purposes and when they are requested byan individual affiliated with: (1) NASA installations, NASA contractors,or NASA grantees; (2) other U.S. Government agencies, their contractors,or their grantees; (3) universities or colleges; (4) state or localgovernments; (5) nonprofit organizations.
B-l
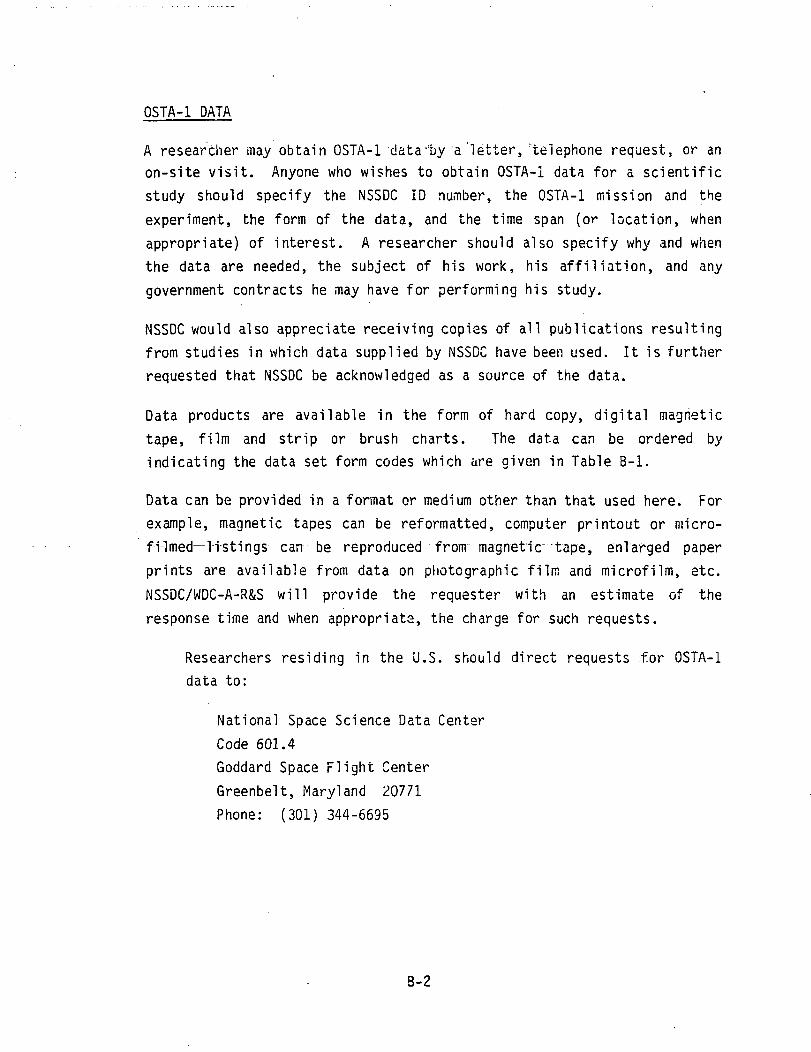
OSTA-1 DATA
A researcher may obtain OSTA-1 data "by 'a 'letter, 'telephone request, or anon-site visit. Anyone who wishes to obtain OSTA-1 data for a scientificstudy should specify the NSSDC ID number, the OSTA-1 mission and theexperiment, the form of the data, and the time span (or location, whenappropriate) of interest. A researcher should also specify why and whenthe data are needed, the subject of his work, his affiliation, and anygovernment contracts he may have for performing his study.
NSSDC would also appreciate receiving copies of all publications resultingfrom studies in which data supplied by NSSDC have been used. It is furtherrequested that NSSDC be acknowledged as a source of the d.ata.
Data products are available in the form of hard copy, digital magnetictape, film and strip or brush charts. The data can be ordered byindicating the data set form codes which are given in Table B-l.
Data can be provided in a format or medium other than that used here. Forexample, magnetic tapes can be reformatted, computer printout or micro-f rimed-1-i stings can be reproduced from magnetic tape, enlarged paperprints are available from data on photographic film and microfilm, etc.NSSDC/WDC-A-R&S will provide the requester with an estimate of theresponse time and when appropriate, the charge for such requests.
Researchers residing in the U.S. should direct requests for OSTA-1data to:
National Space Science Data CenterCode 601.4Goddard Space Flight CenterGreenbelt, Maryland 20771Phone: (301) 344-6695
B-2

Researchers who reside outside the U.S. should direct OSTA-1 datarequests to:
World Data Center A for Rockets and SatellitesCode 601Goddard Space Flight CenterGreenbelt, Maryland 20771 U.S.A.Phone: (301) 344-6695
B-3

Table B-l. Data Set Form Codes
Hardcopy
BI 8- x 10-in. books or bound volumesBT various sizes of books or bound volumesHI 8- x 10-in. pagesHK 16- x 20-in. pages
Digital Magnetic Tape'(Reels)
DD data tape
Microfilm (Reels) Microfiche (Cards)
MO 35-mmMP 16-mmMT various sizes
FR 4- x 6-in. (b/w)
Photographic Film (Frames)
35-mm color slides4- x 5-in. b/w positives
• x 10-in. b/w positives)-mm b/w positives
ROUGUI
*UMUU i^^/~imii \ji ii L/VJ.3 I \f i v^O
*UP 16-mm b/w positivesUS 5- x 8-in. b/w positivesUT various sizes of b/w posUV 5- x 5-in. b/w positivesUW 5- x 47.5-in. b/w positivesUX 9- x 80-in. b/w positivesUY 5- x 12-in. b/w positivesVG 4- x 5-in. color positivesVI 8- x 10-in. color positivesVM 70-mm color positivesVO 35-mm color positives
*VP 16-mm color positivesQ- v 10-in. b/w printsWI 8- x
YG 4- x 5-in. b/w negativesYH 5- x 7-in. b/w negativesYI 8- x 10-in. b/w negativesYK 16- x 20-in. b/w negativesYl 20- x 24-in. b/w negatives
*YM 70-mm b/w negativesYN 9.5-in. b/w negatives
*YO 35-mm b/w negatives*YP 16-mm b/w negativesKYV 5- x 5-in. b/w negativesYW 5- x 47.5-in. b/w negativesYX 9- x 80-in. b/w negativesYY 5- x 12 in. b/w negativesZG 4- x 5-in. color negativesZI 8- x 10-in. color negativesZM 70-mm color negativesZY 5- x 12-in. color negatives
Strip or Brush Charts (Rolls)
SOST
35-mmvarious sizes
*This code may have its quantity expressed in feet.
B-4
APPENDIX C. ACTUAL DATA ACQUISITION
(TO BE SUPPLIED POST-MISSION)

APPENDIX D. CHARACTERISTICS OF EPHEMERIS DATA AND HOW TO OBTAIN IT

APPENDIX 0. CHARACTERISTICS OF EPHEMERIS DATA AND HOW TO OBTAIN IT
The OSTA-1 ephemeris tape will be produced on the UNIVAC 1108 machine andwill be seven track, one file, odd parity, 800 bits/inch tape. This tape willconsist of Header and Data information. The first 43 records will beHeader information and the remaining records will be the Data information.The contents of these records will be as described in the following:
HEADER RECORDS
a. Program constants record. This record will contain physicalconstants and additional specific data that were used to computethe support data (Table D-l)
Table D-l. Program Constant Record
Parameter
AE
BE
EMU
ER2KM
OMEGE
RADS
REM
Nominal value
6.378166000D3
6.356784283607107D3
3.986012D5
6.378165D3
4.37526908789526D-3
6.96495618D5
6.367475142D3
Description
Semimajor axis of the Earth'sreference ellipsoid Fischer (km)
Semiminor axis of the Earth'sreference ellipsoid Fischer (km)
Mu of the Earth (km3/sec2)
Earth radii to kilometers
Angular velocity of the Earth(rad/min)
Radius of the Sun (km)
Mean Earth radius (km)
D-l

b. Timelines of specified inputs - 40 records. These records willcontain only data of interest used in the preparation of the finalproduct.
(1) IMU misalignments(2) IMU drifts(3) REFSMMATES(4) Onboard time biases(5) Onboard time drifts(6) Vehicles weights(7) Payload bay doors status (closed/open)(8) State vectors.(9) Manuver times
v (10) Drag aerodynamic constants(11) Unmodeled perturbations timeline(12) Attitude mode timeline.
c. Data format - two records. For tape output, these records willspecify the name and location on tape of all the support para-meters in the data records.
DATA RECORDS
The format for the data records is specified in Table D-2. The table liststhe parameter name, the parameter location, and the parameter definition.Note that the parameter units are kilometers, seconds, and degrees, unlessotherwise specified.
Information required for generating the OSTA-1 empheris tape are obtainedfrom two sources. Raw, low-speed, C- and S- band tracking data will beobtained from the Mission Control Center (MCC) through the facilities ofthe Ground Data Systems Divisions. Selected onboard navigation, attitudeand navigation - related pulse code modulation data will be obtained fromthe Institutional Data System Division (IDSD). OSC will send the OSTA-1ephemeris tape to the Principal Investigators approximately one to twoweeks after Shuttle landing.
D-2.
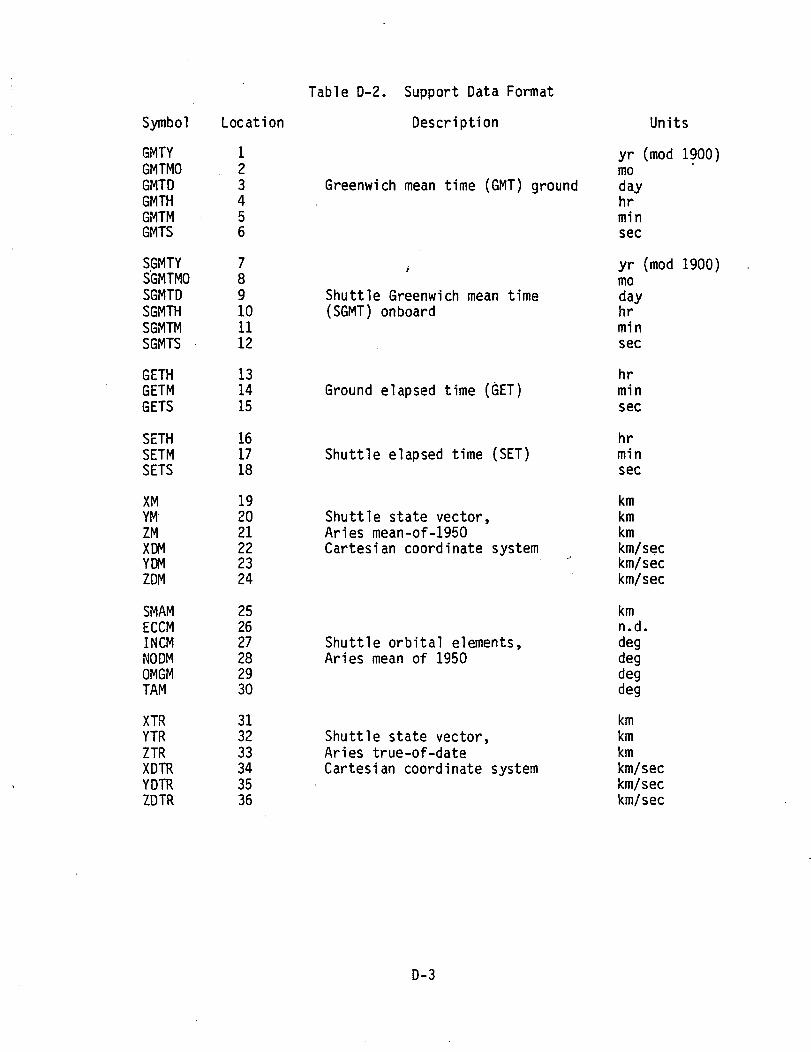
Symbol Location
GMTYGMTMOGMTDGMTHGMTMGMTS
SGMTYS'GMTMOSGMTDSGMTHSGMTMSGMTS
GETHGETMGETS
SETHSETMSETS
XMYMZMXDMYDMZDM
SMAMECCMINCMNODMOMGMTAM
XTRYTRZTRXDTRYDTRZDTR
123456
789101112
131415
161718
192021222324
252627282930
313233343536
Table 0-2. Support Data Format
Description
Greenwich mean time (GMT) ground
Shuttle Greenwich mean time(SGMT) onboard
Ground elapsed time (GET)
Shuttle elapsed time (SET)
Shuttle state vector,Aries mean-of-1950Cartesian coordinate system
Shuttle orbital elements,Aries mean of 1950
Shuttle state vector,Aries true-of-dateCartesian coordinate system
Units
yr (mod 1900)modayhrminsec
yr (mod 1900)modayhrminsec
hrminsec
hrminsec
kmkmkmkm/seckm/seckm/sec
kmn.d.degdegdegdeg
kmkmkmkm/seckm/seckm/sec
D-3

Table D-2. Support Data Format (cont),
Symbol Location
ALFTRDLTTRFPTRAZTRRTRVTR
SMATRECCTRINCTRNODTRCMGTRTATR
XGYGZGXDGYDGZDG
ALFGDLTGFPGAZGRGVG
XMSVMSZMSXDMSYDMSZDMS
XTRSYTRSZTRSXDTRSYDTRSZDTRS
ALFTRSDLTTR SRTRS '
373839404142
434445464748
495051525354
555657585960
616263646566
676869707172
737475
Description
Shuttle state vector,Aries true-of-datepolar coordinate system
Units
Shuttle orbital elements,Aries true of date
Shuttle state vector,Greenwich true-of-date(geographic) Cartesiancoordinate system
Shuttle state vector,Greenwich true-of-date(geographic) polarcoordinate system
Sun state vector,Aries mean-of-1950Cartesian coordinate system
Sun state vector, Ariestrue-of-date Cartesiancoordinate system
Sun position, Ariestrue-of-date polarcoordinate system
degdegdegdegkmkm/sec
kmn.d.degdegdegdeg
kmkmkmkm/seckm/seckm/sec
degdegdegdegkmkm/sec
kmkmkmkm/seckm/seckm/sec
kmkmkmkm/seckm/seckm/sec
degdegkm
D-4

Table D-2. Support Data Format (cont.)
Symbol Location Description Units
LATSLONSALTS
XWVMMZMMXDMMYDMMZDMM
XTRMYTRMZTRMXDTRMYDTRMZDTRM
ALFTRMDLTTRMRTRM
LATMLONMALTM
ORBIT
SUNF
SUNHSUNMSUNS
767778
798081828384
858687888990
919293
949596
97
98
99100101
BETA
QlQ2Q3Q4
102
103104105106
107
115
Sun position, geodeticcoordinate system
Moon state vector, Ariesmean-of-1950 Cartesiancoordinate system
Moon state vector, Ariestrue-of-date Cartesiancoordinate system
Moon position, Ariestrue-of-date polarcoordinate system
Moon position, geodeticcoordinate system
Orbit number
Shuttle sunrise/sunset flag
Shuttle sunrise/sunset GETtime
Earth/Sun angle
Aries mean of 1950 tobody coordinate quaternion
Aries mean of 1950 tobody coordinate tranformationmatrix (3x3), row ordered
degdegkm
kmkmkmkm/seckm/seckm/sec
kmkmkmkm/seckm/seckm/sec
degdegkm
degdeg
n.d.
n.d.
hrminsec
deg
n.d.n.d.n.d.n.d.
n.d.
D-5

Symbol Location
Table D-2. Support Data Format (cont.)
Description Units
ALPHUBETAUPHIU
ALPHGBETA6PHIG
XBYEYBYEZBYE
XBYSYBYSZBYS
XBYMYBYMZBYM
116117118
119120121
122123124
125126127
128129130
Orientation angles of theShuttle body axes with respectto the UVW axes
Orientation angles of theShuttle body axes with respect tothe Greenwich true-of-date axes
Earth position unit vectors inbody axis coordinate system
'Sun positron unit vectors -tnbody axis coordinate system
Moon position unit vectors inbody axis coordinate system
degdegdeg
degdegdeg
n.d.n.d.n.d.
n.d.n.d.n.d.
n.d.n.d.n.d.
D-6