Embed Size (px)
Citation preview

FLORIDA DEPARTMENT OF ENVIRONMENTAL PROTECTION
Division of Environmental Assessment and Restoration,
Bureau of Watershed Restoration
NORTHEAST DISTRICT • UPPER EAST COAST BASIN
Final TMDL Report
Nutrient TMDL for Tomoka River (Fresh Water),
WBID 2634
Wayne Magley, Ph.D., P.E.
May 2013

Final TMDL Report Tomoka River, WBID 2634, Nutrients
Florida Department of Environmental Protection
ii
Acknowledgments
Editorial assistance provided by: Jan Mandrup-Poulsen and Linda Lord. Geographic information assistance (GIS) provided by: Ronald Hughes For additional information on the watershed management approach and impaired waters in the Upper East Coast Basin, contact: Charles Gauthier Florida Department of Environmental Protection Bureau of Watershed Restoration Watershed Planning and Coordination Section 2600 Blair Stone Road, Mail Station 3565 Tallahassee, FL 32399-2400 Email: [email protected] Phone: (850) 245–8555 Fax: (850) 245–8434 Access to all data used in the development of this report can be obtained by contacting: Wayne Magley Florida Department of Environmental Protection Bureau of Watershed Restoration Watershed Evaluation & TMDL Section 2600 Blair Stone Road, Mail Station 3555 Tallahassee, FL 32399-2400 Email: [email protected] Phone: (850) 245–8463 Fax: (850) 245–8444

Final TMDL Report Tomoka River, WBID 2634, Nutrients
Florida Department of Environmental Protection
iii
Contents
Chapter 1: INTRODUCTION ___________________________________ 1
1.1 Purpose of Report _____________________________________________ 1
1.2 Identification of Waterbody ______________________________________ 1
1.3 Background ___________________________________________________ 1
Chapter 2: DESCRIPTION OF WATER QUALITY PROBLEM ________ 6
2.1 Statutory Requirements and Rulemaking History ____________________ 6
2.2 Information on Verified Impairment _______________________________ 6
Chapter 3. DESCRIPTION OF APPLICABLE WATER QUALITY STANDARDS AND TARGETS _______________________ 8
3.1 Classification of the Waterbody and Criteria Applicable to the TMDL ____ 8
3.2 Applicable Water Quality Standards and Numeric Water Quality Target ________________________________________________________ 8
Chapter 4: ASSESSMENT OF SOURCES _______________________ 10
4.1 Types of Sources _____________________________________________ 10
4.2 Potential Sources of Nutrients in the Tomoka River Watershed _______ 10 4.2.1 Point Sources ____________________________________________ 10 4.2.2 Land Uses and Nonpoint Sources _____________________________ 11
4.3 Source Summary _____________________________________________ 19 4.3.1 Summary of Nutrient Loadings to Tomoka River from Point
Sources _________________________________________________ 19 4.3.2 Summary of Nutrient Loadings to Tomoka River from Nonpoint
Sources _________________________________________________ 19
Chapter 5: DETERMINATION OF ASSIMILATIVE CAPACITY _______ 22
5.1 Determination of Loading Capacity _______________________________ 22 5.1.1 Data Used in the Determination of the TMDL ____________________ 22 5.1.2 TMDL Development Process ________________________________ 35 5.1.3 Critical Conditions/Seasonality _______________________________ 42
Chapter 6: DETERMINATION OF THE TMDL ____________________ 43
6.1 Expression and Allocation of the TMDL ___________________________ 43
6.2 Load Allocation _______________________________________________ 44
6.3 Wasteload Allocation __________________________________________ 44 6.3.1 NPDES Wastewater Discharges ______________________________ 44

Final TMDL Report Tomoka River, WBID 2634, Nutrients
Florida Department of Environmental Protection
iv
6.3.2 NPDES Stormwater Discharges ______________________________ 44
6.4 Margin of Safety ______________________________________________ 44
Chapter 7: NEXT STEPS: IMPLEMENTATION PLAN DEVELOPMENT AND BEYOND _____________________ 46
7.1 Basin Management Action Plan _________________________________ 46
References _______________________________________________ 48
Appendices _______________________________________________ 49
Appendix A: Background Information on Federal and State Stormwater Programs ____________________________________________________ 49
Appendix B: Historical Corrected Chla, TEMP, TN, TP, and TSS Observations in Palm Coast, 1968–2011 ___________________________ 50
Appendix C: LSPC Modeling Methodology, Daytona Watershed __________ 68
Appendix D: Kruskal–Wallis Analysis of Corrected Chla, INORGN, TN, INORGP, TP, COND, Color, and TSS, Observations versus Season in Tomoka River ________________________________________________ 90
Appendix E: Kruskal–Wallis Analysis of Corrected Chla, INORGN, TN, INORGP, TP, COND, Color, and TSS Observations versus Year in Tomoka River ________________________________________________ 93
Appendix F: Chart of Corrected Chla, INORGN TN, INORGP, TP, Cond, Color, and TSS Observations by Year, Season, and Station, in Tomoka River _______________________________________________ 101
Appendix G: Monthly and Annual Precipitation at Daytona International Airport, 1937–2011 ___________________________________________ 117
Appendix H: Spearman Correlation Matrix Analysis for Water Quality Parameters in Tomoka River ___________________________________ 119
Appendix I: Linear Regression Analysis of CHLAC Observations versus COND, SALINITY, TEMPC, Nutrients, TSS, TURBIDITY, V14DAY, V21DAY, and FLOW in Tomoka River ____________________________ 123
Appendix J: Linear Regression Analysis of Annual Average CHLAC Observations versus COND, SALINITY, TEMPC, Nutrients, Rainfall, Rainfall Deficits, and Annual Stream Flow in Tomoka River __________ 129
Appendix K: Annual and Monthly Average Precipitation Plots for Daytona International Airport ___________________________________ 137
Appendix L: Response to Comments from September 2012 Workshop ___ 142
Appendix M: Response to Comments from April 2013 Workshop ________ 151

Final TMDL Report Tomoka River, WBID 2634, Nutrients
Florida Department of Environmental Protection
v
List of Tables
Table 2.1. Summary of Corrected Chlorophyll a (CHLAC) Monitoring Data for Tomoka River (WBID 2634) During the Verified Period (January 1, 2004 – June 30, 2011) _______________________ 7
Table 2.2. Summary of Annual Average CHLAC for the Cycle 2 Verified Period (January 1, 2004 – June 30, 2011) _______________________ 7
Table 4.1. Classification of Land Use Categories in the Tomoka River Watershed ______________________________________________ 11
Table 4.2. Description of Hydrologic Soil Classes from the SSURGO Database _______________________________________________ 15
Table 4.3. Estimated Nitrogen and Phosphorus Annual Loading from Septic Tanks in the Tomoka River Watershed ___________________ 17
Table 4.4. Estimated Annual Average Discharge, TN and TP Loads from the Tomoka Farms Road Landfill _____________________________ 19
Table 4.5. Estimated Annual Average LSPC Derived Discharge, TN, TP Loads and Concentrations from the Tomoka River Watershed ______________________________________________ 20
Table 5.1. Sampling Station Summary for the Tomoka River Watershed __________ 23 Table 5.2. Statistical Summary of Historical CHLAC Data for Tomoka
River ___________________________________________________ 25 Table 5.3. Summary Statistics for Major Water Quality Parameters
Measured in Tomoka River __________________________________ 27 Table 5.4. Statistical Summary of Historical CHLAC Data by Year for the
Tomoka River ____________________________________________ 31 Table 5.5 Statistical Summary of Historical TN Data by Year for the
Tomoka River ____________________________________________ 32 Table 5.6. Statistical Summary of Historical TP Data by Year for the
Tomoka River ____________________________________________ 34 Table 6.1. TMDL Components for Tomoka River ____________________________ 44

Final TMDL Report Tomoka River, WBID 2634, Nutrients
Florida Department of Environmental Protection
vi
List of Figures
Figure 1.1. Location of the Tomoka River (WBID 2634) in Volusia County __________________________________________________ 3
Figure 1.2. Location of the Tomoka River (WBID 2634) in Volusia County and Major Hydrological Features in the Area _______________ 4
Figure 1.3. WBIDs in the Halifax River Planning Unit __________________________ 5 Figure 4.1. Principal Land Uses in the Tomoka River Watershed ________________ 14 Figure 4.2 Hydrologic Soil Groups Distribution in the Tomoka River
Watershed ______________________________________________ 15 Figure 4.3. Onsite SewageTreatment Disposal Systems in the Tomoka
River Watershed __________________________________________ 18 Figure 4.4. Box Plot of Average Daily Flow for the Tomoka River near
Holly Hill (USGS gage 02247510) ____________________________ 21 Figure 5.1. Historical Sampling Sites in the Tomoka River Watershed ____________ 28 Figure 5.2. Historical CHLAC Observations for the Tomoka River _______________ 29 Figure 5.3. Historical TN Observations for the Tomoka River ___________________ 29 Figure 5.4. Historical TP Observations for the Tomoka River ___________________ 30 Figure 5.5. Historical Color Observations for the Tomoka River _________________ 30 Figure 5.6. Historical Total Suspended Solids Observations for the
Tomoka River ____________________________________________ 31 Figure 5.7. Historical Time Series of the TN/TP Ratio for the Tomoka
River ___________________________________________________ 36 Figure 5.8. Annual Average CHLA versus Salinity for the Tomoka River __________ 37 Figure 5.9. CHLA Time Series for Three Long-term Stations in the
Tomoka River ____________________________________________ 39 Figure 5.10. Total Nitrogen Time Series for Three Long-term Stations in
the Tomoka River _________________________________________ 39 Figure 5.11. Total Phosphorus Time Series for Three Long-term Stations
in the Tomoka River _______________________________________ 40 Figure 5.12. Salinity Time Series for Three Long-term Stations in the
Tomoka River ____________________________________________ 40 Figure 5.13. General Linear Model of Annual Average CHLAC versus
TN and TP in the Tomoka River ______________________________ 41

Final TMDL Report Tomoka River, WBID 2634, Nutrients
Florida Department of Environmental Protection
vii
Websites
Florida Department of Environmental Protection, Bureau of Watershed Restoration
TMDL Program http://www.dep.state.fl.us/water/tmdl/index.htm Identification of Impaired Surface Waters Rule http://www.dep.state.fl.us/water/tmdl/docs/AmendedIWR.pdf STORET Program http://www.dep.state.fl.us/water/storet/index.htm
2012 305(b) Report
http://www.dep.state.fl.us/water/docs/2012_integrated_report.pdf Basin Assessment Report for the Upper East Coast Basin
http://www.dep.state.fl.us/water/basin411/uppereast/assessment.htm
U.S. Environmental Protection Agency, National STORET Program
http://www.epa.gov/storet/


Final TMDL Report Tomoka River, WBID 2634, Nutrients
Florida Department of Environmental Protection
1
Chapter 1: INTRODUCTION
1.1 Purpose of Report This report presents the Total Maximum Daily Load (TMDL) for nutrients for the Tomoka River in the Halifax River Planning Unit of the Upper East Coast Basin. The segment was verified as impaired for nutrients based on chlorophyll a during the second cycle, and was included on the Verified List of impaired waters for the Upper East Coast Basin that was adopted by Secretarial Order on February 7, 2012. Based on the median TN/TP ratio of 18.1, total nitrogen and total phosphorus were identified as co-limiting nutrients. This TMDL establishes the allowable loadings to this portion of the Tomoka River that would restore the waterbody so that it meets its applicable water quality criterion for nutrients.
1.2 Identification of Waterbody The Tomoka River, located in Volusia County, originates in wetlands southwest of Daytona Beach and flows north until it turns northeast and enters the Halifax River north of Ormond Beach. For assessment purposes, the Tomoka River has been divided into a fresh water and a marine segment. This TMDL addresses the fresh water portion of the Tomoka River. The fresh water segment of the Tomoka River is approximately 13.6 miles long, with a watershed area of approximately 30 square miles. Interstate 95 crosses the Tomoka River and through the watershed, while Interstate 4 intersects the southern portion of the watershed (Figure 1.1).
For assessment purposes, the Florida Department of Environmental Protection (Department) has divided the Upper East Coast Basin into water assessment polygons with a unique waterbody identification (WBID) number for each watershed or stream reach. This TMDL addresses WBID 2634, the fresh water segment of the Tomoka River for nutrients (Figure 1.2). The Tomoka River watershed is part of the Halifax River Planning Unit. Planning units are groups of smaller watersheds (WBIDs) that are part of a larger basin unit, in this case the Upper East Basin. The Halifax River Planning Unit consists of 56 WBIDs. Figure 1.3 shows the locations of these WBIDs and the Halifax River’s location in the planning unit.
1.3 Background This report was developed as part of the Department’s watershed management approach for restoring and protecting state waters and addressing TMDL Program requirements. The watershed approach, which is implemented using a cyclical management process that rotates through the state’s 52 river basins over a 5-year cycle, provides a framework for implementing the TMDL Program–related requirements of the 1972 federal Clean Water Act and the 1999 Florida Watershed Restoration Act (FWRA) (Chapter 99-223, Laws of Florida).
A TMDL represents the maximum amount of a given pollutant that a waterbody can assimilate and still meet water quality standards, including its applicable water quality criteria and its designated uses. TMDLs are developed for waterbodies that are verified as not meeting their

Final TMDL Report Tomoka River, WBID 2634, Nutrients
Florida Department of Environmental Protection
2
water quality standards. They provide important water quality restoration goals that will guide restoration activities.

Final TMDL Report Tomoka River, WBID 2634, Nutrients
Florida Department of Environmental Protection
3
Figure 1.1. Location of the Tomoka River (WBID 2634) in Volusia County

Final TMDL Report Tomoka River, WBID 2634, Nutrients
Florida Department of Environmental Protection
4
Figure 1.2. Location of the Tomoka River (WBID 2634) in Volusia County and Major Hydrological Features in the Area

Final TMDL Report Tomoka River, WBID 2634, Nutrients
Florida Department of Environmental Protection
5
Figure 1.3. WBIDs in the Halifax River Planning Unit

Final TMDL Report Tomoka River, WBID 2634, Nutrients
Florida Department of Environmental Protection
6
Chapter 2: DESCRIPTION OF WATER QUALITY PROBLEM
2.1 Statutory Requirements and Rulemaking History Section 303(d) of the federal Clean Water Act requires states to submit to the U.S. Environmental Protection Agency (EPA) lists of surface waters that do not meet applicable water quality standards (impaired waters) and establish a TMDL for each pollutant causing the impairment of listed waters on a schedule. The Department has developed such lists, commonly referred to as 303(d) lists, since 1992. The list of impaired waters in each basin, referred to as the Verified List, is also required by the FWRA (Subsection 403.067[4], Florida Statutes [F.S.]); the state’s 303(d) list is amended annually to include basin updates. Florida’s 1998 303(d) list included 15 waterbodies and 50 parameters in the Upper East Coast Basin. However, the FWRA (Section 403.067, F.S.) stated that all previous Florida 303(d) lists were for planning purposes only and directed the Department to develop, and adopt by rule, a new science-based methodology to identify impaired waters. After a long rulemaking process, the Environmental Regulation Commission adopted the new methodology as Rule 62-303, Florida Administrative Code (F.A.C.) (Identification of Impaired Surface Waters Rule, or IWR), in April 2001; the rule was modified in 2006 and 2007.
2.2 Information on Verified Impairment The Department used the IWR to assess water quality impairments in the Tomoka River watershed and has verified that this fresh water waterbody segment is impaired for nutrients, based on data in the Department’s IWR database. Tables 2.1 and 2.2 summarize the corrected chlorophyll a (CHLAC) data for the verification period, which for Cycle 2 of the Group 5 waters was January 1, 2004, through June 30, 2011. The IWR listing threshold for nutrients in estuaries was based on exceeding the historic minimum chlorophyll annual average of 3 µg/L by more than 50 percent in at least two consecutive years (2008 – 2010). Possible relationships between chla and other water quality parameters are further assessed in Chapter 5, using the complete historical dataset.

Final TMDL Report Tomoka River, WBID 2634, Nutrients
Florida Department of Environmental Protection
7
Table 2.1. Summary of Corrected Chlorophyll a (CHLAC) Monitoring
Data for Tomoka River (WBID 2634) During the Verified Period (January 1, 2004 – June 30, 2011)
-
Parameter CHLAC (µg/L)
Total number of samples 237 IWR-annual average threshold for the Verified List
(50% above historic minimum) 5
Number of observed exceedances (yrs) 2 Number of observed nonexceedances (yrs) 4
Number of seasons during which samples were collected 4
Lowest individual observation (µg/L) 1
Highest individual observation (µg/L) 28 Median TN/TP ratio for 186 observations 18.1
Possible causative pollutant by IWR TN and TP FINAL ASSESSMENT: Impaired
Table 2.2. Summary of Annual Average CHLAC for the Cycle 2
Verified Period (January 1, 2004 – June 30, 2011) CHLAC is in µg/L.
Year Number of Samples Minimum Maximum Annual Mean
Mean Precipitation
(inches) 2004 15 2.4 15.5 2 62.97 2005 36 1.0 12.2 2 65.77 2006 17 2.0 7.3 1 31.36 2007 16 2.2 12.6 1 45.02 2008 64 1.2 10.0 10 42.67 2009 50 1.6 21.0 11 50.3 2010 33 2.4 28.0 6 39.39 2011 6 3.4 7.8 48.71
Precipitation based on Daytona International Airport (Appendix G)

Final TMDL Report Tomoka River, WBID 2634, Nutrients
Florida Department of Environmental Protection
8
Chapter 3. DESCRIPTION OF APPLICABLE WATER QUALITY STANDARDS AND TARGETS
3.1 Classification of the Waterbody and Criteria Applicable to the TMDL Florida’s surface waters are protected for five designated use classifications, as follows:
Class I Potable water supplies Class II Shellfish propagation or harvesting Class III Recreation, propagation, and maintenance of a healthy, well-
balanced population of fish and wildlife Class IV Agricultural water supplies Class V Navigation, utility, and industrial use (there are no state
waters currently in this class)
The Tomoka River (WBID 2634) is a Class III fresh water waterbody, with a designated use of recreation, propagation, and maintenance of a healthy, well-balanced population of fish and wildlife. The Class III water quality criterion applicable to the impairment addressed by this TMDL is for nutrients.
3.2 Applicable Water Quality Standards and Numeric Water Quality Target The nutrient criterion in Rule 62-302, F.A.C., is expressed as a narrative:
Nutrients: In no case shall nutrient concentrations of a body of water be altered so as to cause an imbalance in natural populations of aquatic flora or fauna [Note: For Class III waters in the Everglades Protection Area, this criterion has been numerically interpreted for phosphorus in Section 62-302.540, F.A.C.].
To assess whether this narrative criterion was being exceeded, the IWR provides thresholds for nutrient impairment in estuaries based on annual average chla levels. The following language is found in Rule 62-303, F.A.C.:
62-303.351 Nutrients in Streams.
A stream or stream segment shall be included on the planning list for nutrients if the following biological imbalances are observed:
(1) Algal mats are present in sufficient quantities to pose a nuisance or hinder reproduction of a threatened or endangered species, or (2) Annual mean chlorophyll a concentrations are greater than 20 µg/L or if data
indicate annual mean chlorophyll a values have increased by more than 50% over historical values for at least two consecutive years.
62-303.450 Interpretation of Narrative Nutrient Criteria.

Final TMDL Report Tomoka River, WBID 2634, Nutrients
Florida Department of Environmental Protection
9
(1) A water shall be placed on the verified list for impairment due to nutrients if there are sufficient data from the last five years preceding the planning list assessment, combined with historical data (if needed to establish historical chlorophyll a levels or historical TSIs), to meet the data sufficiency requirements of subsection 62-303.350(2), FA.C. If there are insufficient data, additional data shall be collected as needed to meet the requirements. Once these additional data are collected, the Department shall determine if there is sufficient information to develop a site-specific threshold that better reflects conditions beyond which an imbalance in flora or fauna occurs in the water segment. If there is sufficient information, the Department shall re-evaluate the data using the site-specific thresholds. If there is insufficient information, the Department shall re-evaluate the data using the thresholds provided in Rules 62-303.351-.353, F.A.C., for streams, lakes, and estuaries, respectively. In any case, the Department shall limit its analysis to the use of data collected during the five years preceding the planning list assessment and the additional data collected in the second phase. If alternative thresholds are used for the analysis, the Department shall provide the thresholds for the record and document how the alternative threshold better represents conditions beyond which an imbalance in flora or fauna is expected to occur.
62-303.350 Interpretation of Narrative Nutrient Criteria
(3) When comparing changes in chlorophyll a or TSI values to historical levels, historical levels shall be based on the lowest five-year average for the period of record. To calculate a five-year average, there must be annual means from at least three years of the five-year period.
The annual average chla concentrations in 2008, 2009, and 2010 exceeded the historic minimum of 3.0 µg/L (1999 – 2003) by 50% or greater, and, based on the TN/TP ratio, nitrogen and phosphorus were identified as co-limiting nutrients.

Final TMDL Report Tomoka River, WBID 2634, Nutrients
Florida Department of Environmental Protection
10
Chapter 4: ASSESSMENT OF SOURCES
4.1 Types of Sources An important part of the TMDL analysis is the identification of pollutant source categories, source subcategories, or individual sources of pollutants in the watershed and the amount of pollutant loading contributed by each of these sources. Sources are broadly classified as either “point sources” or “nonpoint sources.” Historically, the term “point sources” has meant discharges to surface waters that typically have a continuous flow via a discernable, confined, and discrete conveyance, such as a pipe. Domestic and industrial wastewater treatment facilities (WWTFs) are examples of traditional point sources. In contrast, the term “nonpoint sources” was used to describe intermittent, rainfall-driven, diffuse sources of pollution associated with everyday human activities, including runoff from urban land uses, agriculture, silviculture, and mining; discharges from failing septic systems; and atmospheric deposition. However, the 1987 amendments to the Clean Water Act redefined certain nonpoint sources of pollution as point sources subject to regulation under the EPA’s National Pollutant Discharge Elimination System (NPDES) Program. These nonpoint sources included certain urban stormwater discharges, including those from local government master drainage systems, construction sites over five acres, and a wide variety of industries (see Appendix A for background information on the federal and state stormwater programs). To be consistent with Clean Water Act definitions, the term “point source” will be used to describe traditional point sources (such as domestic and industrial wastewater discharges) and stormwater systems requiring an NPDES stormwater permit when allocating pollutant load reductions required by a TMDL (see Section 6.1). However, the methodologies used to estimate nonpoint source loads do not distinguish between NPDES stormwater discharges and non-NPDES stormwater discharges, and as such, this source assessment section does not make any distinction between the two types of stormwater.
4.2 Potential Sources of Nutrients in the Tomoka River Watershed
4.2.1 Point Sources There is one NPDES wastewater facility that discharges directly into this portion of the Tomoka River. The Tomoka Farms Road Landfill (FL0037877) has a design discharge of 0.11 MGD. Over the January 2000 through March 2012 period (202 months), there were 16 months when discharge occurred. The average of the reported monthly maximum discharge events was 0.89 MGD. Daily maximum concentrations of TN and TP were reported for October 2011 and were 0.93 mg/L and < 0.05 mg/L, respectively.
Municipal Separate Storm Sewer System Permittees Portions of the Tomoka River fall within the boundaries of several Phase II municipal separate storm sewer system (MS4) permits. These include the Phase II permits for the City of Daytona

Final TMDL Report Tomoka River, WBID 2634, Nutrients
Florida Department of Environmental Protection
11
Beach (FLR04E0115) and Volusia County (FLR04E033). The Florida Department of Transportation District 5 is a co-permittee with Volusia County (FLR04E024).
4.2.2 Land Uses and Nonpoint Sources Nutrient loadings to the Tomoka River are generated from nonpoint sources in the watershed. These potential sources include loadings from surface runoff, ground water inflow, and septic tanks.
Land Uses The spatial distribution and acreage of different land use categories were identified using the SJRWMD’s year 2004 land use coverage contained in the Department’s geographic information system (GIS) library. Land use categories in the watershed were aggregated using the Level 3 land use codes and tabulated in Table 4.1. Figure 4.1 shows the principal land uses in the watershed at the Level 1 land use code. The SJRWMD’s year 2009 land use coverage was also compared to the 2004 coverage and there were insignificant differences between the two periods.
As shown in Table 4.1, the total area of the Tomoka River watershed (WBID 2634) is about 19,053 acres. Water and wetlands represents approximately 32 percent of the watershed with forested land uses accounting for approximately 30 of the watershed. Residential land use accounts for approximately 11 percent of the watershed with nearly 8 percent of the watershed classified as medium density residential. Agricultural and rangeland land uses represented 10 percent of the watershed area.
Table 4.1. Classification of Land Use Categories in the Tomoka River Watershed
Level 3 Land Use Code Attribute Acres % of Total
1100 Residential, low density - less than 2 dwelling units/acre 251.03 1.32 1180 Rural residential 64.62 0.34 1190 Low density under construction 9.13 0.05 1200 Residential, medium density - 2-5 dwelling units/acre 1421.69 7.46 1290 Medium Density Under Construction 47.6 0.25 1300 Residential, high density - 6 or more dwelling units/acre 252.61 1.33 1400 Commercial and services 670.77 3.52 1490 Commercial & services under construction 39.84 0.21 1550 Other light industrial 66.85 0.35 1600 Extractive 24.35 0.13 1620 Sand and Gravel Pits 11.48 0.06 1660 Holding ponds 49.3 0.26 1700 Institutional 190.8 1.00

Final TMDL Report Tomoka River, WBID 2634, Nutrients
Florida Department of Environmental Protection
12
Level 3 Land Use Code Attribute Acres % of Total
1820 Holding ponds 242.63 1.27 1860 Institutional 29.82 0.16 1900 Open land 14.89 0.08 2110 Improved pastures (monoculture, planted forage crops) 331.8 1.74 2130 Woodland pastures 46.5 0.24 2150 Field crops 123.54 0.65 2210 Citrus Groves <Orange, grapefruit, tangerines, etc.> 0.92 0.00 3100 Herbaceous upland nonforested 659.46 3.46
3200 Shrub and brushland (wax myrtle or saw palmetto, occasionally scrub 273.6 1.44
3300 Mixed upland nonforested/Mixed Rangeland 455.78 2.39 4110 Pine flatwoods 2654.8 13.93 4120 Longleaf pine - xeric oak 21.3 0.11 4130 Sand pine 113.88 0.60 4200 Upland hardwood forests 49.97 0.26 4340 Upland mixed coniferous/hardwood 741.84 3.89 4410 Coniferous pine 916.86 4.81 4430 Forest regeneration areas 1,294.39 6.79 5100 Streams and waterways 156.92 0.82 5300 Reservoirs - pits, retention ponds, dams 357.58 1.88 6110 Bay swamp (if distinct) 284.82 1.49 6170 Mixed wetland hardwoods 1,602.09 8.41 6181 Willow and Elderberry 38.4 0.20 6210 Cypress 193.06 1.01 6220 Pond Pine 1.35 0.01 6250 Hydric pine flatwoods 848.9 4.46 6300 Wetland forested mixed 1,492.25 7.83 6410 Fresh water marshes 82.66 0.43 6420 Saltwater marshes 72.19 0.38 6430 Wet prairies 296.98 1.56 6440 Emergent aquatic vegetation 14.27 0.07 6460 Treeless Hydric Savanna/Mixed scrub-shrub wetland 573.72 3.01 7400 Disturbed land 21.45 0.11
7410 Rural land in transition without positive indicators of intended activity 137.77 0.72
7420 Borrow Areas 20.84 0.11 7430 Spoil areas 12.42 0.07 8110 Airports 95.99 0.50 8140 Roads and highways (divided 4-lanes with medians) 670.26 3.52 8200 Communications 8.65 0.05 8320 Electrical power transmission lines 244.13 1.28 8350 Solid Waste Disposal 749.56 3.93

Final TMDL Report Tomoka River, WBID 2634, Nutrients
Florida Department of Environmental Protection
13
Level 3 Land Use Code Attribute Acres % of Total
8370 Surface water collection basins 4.6 0.02 SUM 19,052.9 100.00

Final TMDL Report Tomoka River, WBID 2634, Nutrients
Florida Department of Environmental Protection
14
Figure 4.1. Principal Land Uses in the Tomoka River Watershed

Final TMDL Report Tomoka River, WBID 2634, Nutrients
Florida Department of Environmental Protection
15
Soil Characteristics The Soil Survey Geographic Database (SSURGO) in the Department’s GIS database from the SJRWMD was accessed to provide coverage of hydrologic soil groups in the Tomoka River watershed (Figure 4.2). Table 4.2 briefly describes the major hydrology soil classes. As seen in Figure 4.2, soil group A/D was the most common in the watershed Table 4.2. Description of Hydrologic Soil Classes from the SSURGO
Database
Hydrology Class Description
A
Soils in this group have low runoff potential when thoroughly wet. Water is transmitted freely through the soil. Group A soils typically have less than 10 percent clay and more than 90 percent sand or gravel and have gravel or sand textures.
B
Soils in this group have moderately low runoff potential when thoroughly wet. Water transmission through the soil is unimpeded. Group B soils typically have between 10 percent and 20 percent clay and 50 percent to 90 percent sand and have loamy sand or sandy loam textures.
C
Soils in this group have moderately high runoff potential when thoroughly wet. Water transmission through the soil is somewhat restricted. Group C soils typically have between 20 percent and 40 percent clay and less than 50 percent sand and have loam, silt loam, sandy clay loam, clay loam, and silty clay loam textures
D
Soils in this group have high runoff potential when thoroughly wet. Water movement through the soil is restricted or very restricted. Group D soils typically have greater than 40 percent clay, less than 50 percent sand, and have clayey textures.
Dual hydrologic soil groups
Certain wet soils are placed in group D based solely on the presence of a water table within 60 centimeters [24 inches] of the surface even though the saturated hydraulic conductivity may be favorable for water transmission. If these soils can be adequately drained, then they are assigned to dual hydrologic soil groups (A/D, B/D, and C/D) based on their saturated hydraulic conductivity and the water table depth when drained. The first letter applies to the drained condition and the second to the undrained condition. For the purpose of hydrologic soil group, adequately drained means that the seasonal high water table is kept at least 60 centimeters [24 inches] below the surface in a soil where it would be higher in a natural state.
Source: USDA NRCS, Part 630 Hydrology National Engineering Handbook , Chapter 7 Hydrologic Soil Groups, January 2009

Final TMDL Report Tomoka River, WBID 2634, Nutrients
Florida Department of Environmental Protection
16
Figure 4.2 Hydrologic Soil Groups Distribution in the Tomoka River Watershed

Final TMDL Report Tomoka River, WBID 2634, Nutrients
Florida Department of Environmental Protection
17
Population The 2010 U.S. Census block data was used to estimate the human population in the Tomoka River watershed. Total population data for census blocks covering the Tomoka River watershed was clipped using GIS to estimate the population within the watershed based on the fraction of the block contained within the watershed. This yielded an estimated population of 13,452 in the Tomoka River watershed. Based on an average of 2.51 persons per household in Volusia County (U.S Census) there was an estimated 5,359 occupied residential units within the WBID boundary.
Septic Tanks Based on the Florida Department of Health January 2012 GIS coverage of onsite sewage treatment disposal systems (OSTDS), there were approximately 643 septic tanks located in the watershed (Figure 4.3). Using 70 gallons/day/person (EPA, 1999), and drainfield total nitrogen (TN) and total phosphorus (TP) concentrations of 36 mg/L and 15 mg/L, respectively, potential annual ground water loads of TN and TP were calculated. This is a screening level calculation, and soil types, the age of the system, vegetation, proximity to a receiving water, and other factors will influence the degree of attenuation of this load (Table 4.3). Table 4.3. Estimated Nitrogen and Phosphorus Annual Loading from
Septic Tanks in the Tomoka River Watershed
Estimated No.
Households on Septic
Estimated No.
Persons Per
Household1
Gallons/ Person/
Day2
TN in Drainfield
(mg/L)
TP in Drainfield
(mg/L)
Estimated Annual TN
Load (lbs/yr)
Estimated Annual TP
Load (lbs/yr)
643 2.51 70 36 15 12,388 5,161 1 U.S Census Bureau; 2 EPA, 1999.

Final TMDL Report Tomoka River, WBID 2634, Nutrients
Florida Department of Environmental Protection
18
Figure 4.3. Onsite SewageTreatment Disposal Systems in the Tomoka River Watershed

Final TMDL Report Tomoka River, WBID 2634, Nutrients
Florida Department of Environmental Protection
19
4.3 Source Summary
4.3.1 Summary of Nutrient Loadings to Tomoka River from Point Sources
Section 4.2.1 provided information on the one point source discharge in the watershed (i.e., the Tomoka Farms Road Landfill). A conservative approach was used to estimate annual TN and TP loads based on discharge monitoring reports. For each month in which a discharge was reported, a load was calculated assuming that the daily maximum reported discharge occurred for the whole month and that TN and TP concentrations in the discharge were equal to 0.93 mg/L and 0.05 mg/L, respectively (Table 4.4). Table 4.4. Estimated Annual Average Discharge, TN and TP Loads from the
Tomoka Farms Road Landfill
YEAR DISCHARGE
(MG/ACRE-FT) TN LOAD (LBS/YR)
TP LOAD (LBS/YR)
1999 0 0 0 2000 0 0 0 2001 60/186 469 25 2002 0 0 0 2003 0 0 0 2004 0 0 0 2005 0 0 0 2006 0 0 0 2007 0 0 0 2008 75/231 584 31 2009 135/414 1048 56 2010 95/293 741 40 2011 23/72 182 10
4.3.2 Summary of Nutrient Loadings to Tomoka River from Nonpoint Sources
As part of EPA’s efforts to establish numeric nutrient criteria for Florida’s estuaries, Tetra Tech setup a watershed model (LSPC) to estimate nutrient loadings to the Mantanzas and Halifax River estuaries. The model simulation covered the 1997 – 2009 period. Ms. Erin Lincoln (Tetra Tech, personal communication, 5/2/2012) provided model outputs of daily flow, TN concentration, TP concentrations, TN loads, and TP loads based on HUC 12 delineations. Daily flows and nutrient loads were summed by year to obtain estimates of annual nitrogen and phosphorus loadings from the Tomoka watershed (Table 4.5). These estimates did not include potential contribution of the marine segment of the Tomoka River. Appendix C describes the

Final TMDL Report Tomoka River, WBID 2634, Nutrients
Florida Department of Environmental Protection
20
calibration of the LSPC watershed model. The USGS gage on the Tomoka River on the downstream side of the LPGA Boulevard bridge near Holly Hill (02247510) was used in the calibration of the watershed model. A box plot of daily flows by year is graphed in Figure 4.4. Daily flows ranged between 0 and 4,570 cfs, with 25th, median, and 75th percentile values of 4.6, 15, and 63 cfs, respectively. Table 4.5. Estimated Annual Average LSPC Derived Discharge, TN, TP Loads
and Concentrations from the Tomoka River Watershed
YEAR DISCHARGE (ACRE-FT)
TN LOAD (LBS/YR)
TP LOAD (LBS/YR)
MEAN TN (MG/L)
MEAN TP (MG/L)
RAINFALL (INCHES/YR)
1997 77293 255465 19606 1.18 0.095 54.69 1998 76406 265739 17446 1.27 0.102 40.51 1999 37663 133992 14093 1.32 0.120 46.37 2000 37612 128705 11952 1.25 0.111 40.16 2001 167150 529670 32105 1.18 0.083 58.27 2002 94904 300034 19138 1.10 0.077 59.94 2003 135629 438091 24496 1.14 0.075 57.3 2004 173117 562603 34182 1.12 0.079 62.97 2005 260400 848249 49287 1.17 0.065 65.77 2006 49006 153621 11584 1.12 0.086 31.36 2007 40967 127797 11092 1.26 0.099 45.02 2008 108896 350285 21926 1.19 0.089 42.67 2009 94333 309810 20410 1.11 0.091 50.3
AVERAGE 104106 338774 22101 1.19 0.090 50.41 Precipitation based on Daytona International Airport (Appendix G)

Final TMDL Report Tomoka River, WBID 2634, Nutrients
Florida Department of Environmental Protection
21
Figure 4.4. Box Plot of Average Daily Flow for the Tomoka River near Holly Hill (USGS gage 02247510)
19641966
19681970
19721974
19761978
19801982
19841986
19881990
19921994
19961998
20002002
20042006
20082010
2012
YEAR
0300600900
12001500180021002400270030003300360039004200450048005100540057006000
DAILY
FLOW
(CFS
)

Final TMDL Report Tomoka River, WBID 2634, Nutrients
Florida Department of Environmental Protection
22
Chapter 5: DETERMINATION OF ASSIMILATIVE CAPACITY
5.1 Determination of Loading Capacity
5.1.1 Data Used in the Determination of the TMDL There are sixty-three sampling stations in the watershed, of which fifty-eight have historical CHLAC observations (Figure 5.1). Thirty-three of those sites had only one CHLAC observation. Table 5.1 contains summary information on each of the stations (N represents the number of CHLAC observations). Table 5.2 provides a statistical summary of CHLAC observations at each station, and Appendix B contains historical CHLAC, temperature (TEMPC), TN, TP, and TSS available observations from sampling sites in WBID 2634 from 1968 through 2011. Figure 5.2 displays the historical CHLAC observations over time. The simple linear regression of CHLAC versus sampling date in Figure 5.2 was not significant at an alpha (α) level of 0.05. Appendix F contains plots of CHLAC by year, season, and station, Elevated levels of CHLAC during June 2008 are shown in Figure 5.2. Seven of the highest eleven historical CHLAC measurements were reported at the seven randomized ambient monitoring stations (21FLGW 34952 – 34958) collected between June 17 – 19, 2008 in the northern most 4.64 miles of the Tomoka River WBID 2634 segment. CHLAC concentrations ranged from 48 to 450 µg/L at these stations. Salinities reported at these stations during this period ranged between 21.4 and 24.1 ppt. With respect to historical CHLAC measurements, the 75th, 80th, and 90th percentiles are 3.1 µg/L, 4.5 µg/L, and 13.7 µg/L, respectively. Similarly, based on historical salinity measurements the 75th, 80th and 90th percentiles are 0.23 ppt, 0.60 ppt, and 10.52 ppt, respectively. Figures 5.3 through 5.6 present historical TN, TP, Color, and Total Suspended Solids (TSS) observations, respectively. Linear regressions of each parameter versus sampling date indicated that none of the regressions were significant at an α level of 0.05. Appendix F contains additional plots by season, station, and year. A statistical summary of major water quality parameters from the available data is presented in Table 5.3.

Final TMDL Report Tomoka River, WBID 2634, Nutrients
Florida Department of Environmental Protection
23
Table 5.1. Sampling Station Summary for the Tomoka River Watershed
Station STORET ID Station Owner Years With Data N
CANAL TO TOMOKA @ 265 CHEROKEE RD 21FLA 27010429FLA FDEP 2009 5
TOMOKA RIVER BETWEEN AIRPORT DITCH AND ISLAND 21FLA 27010572 FDEP 1985 - 1986 7
TOMOKA RIVER EAST FORK AROUND ISLAND 21FLA 27010573 FDEP 1985 - 1986 7
TOMOKA RIVER AT INTERSTATE 95 BRIDGE 21FLA 27010574 FDEP 1985 - 1986 7
TOMOKA RIVER AT STATE ROUTE 40 BRIDGE 21FLA 27010578 FDEP 1985 - 2009 11
TOMOKA RIVER AT ELEVENTH STREET BRIDGE 21FLA 27010579 FDEP 1985 - 1998 9
TOMOKA RIVER AT RIVER BEND PARK 21FLA 27010923 FDEP 2009 5
TOMOKA RIVER AT LPGA BLVD. 21FLA 27010924 FDEP 2009 5
TOMOKA RIVER @ 1-4 21FLCEN 27010075 FDEP 2005 1 TOMOKA RIVER AT INTERSTATE 95 BRIDGE 21FLCEN 27010574 FDEP 2005 1
TOMOKA RIVER AT 11TH STREET BRIDGE 21FLCEN 27010579 FDEP 2000 - 2010 11
TOMOKA RIVER AT U.S. HIGHWAY 92 21FLCEN 27010596 FDEP 2000 - 2005 3 TOMOKA RIVER AT SR 40 (TOMOKA ROAD) 21FLCEN 27010830 FDEP 2005 4
TOMOKA RIVER AT U.S. HIGHWAY 92 21FLGW 34921 FDEP 2008 1
SJ7-LR-2003 TOMOKA RIVER 21FLGW 34929 FDEP 2008 1
SJ7-LR-2004 TOMOKA RIVER 21FLGW 34930 FDEP 2008 1
SJ7-LR-2009 TOMOKA RIVER 21FLGW 34931 FDEP 2008 1
SJ7-LR-2010 TOMOKA RIVER 21FLGW 34932 FDEP 2008 1
SJ7-LR-2015 TOMOKA RIVER 21FLGW 34933 FDEP 2008 1
SJ7-LR-2017 TOMOKA RIVER 21FLGW 34934 FDEP 2008 1
SJ7-LR-2019 TOMOKA RIVER 21FLGW 34935 FDEP 2008 1
SJ7-LR-2024 TOMOKA RIVER 21FLGW 34936 FDEP 2008 1
SJ7-LR-2029 TOMOKA RIVER 21FLGW 34937 FDEP 2008 1
SJ7-LR-2032 TOMOKA RIVER 21FLGW 34938 FDEP 2008 1
SJ7-LR-2034 TOMOKA RIVER 21FLGW 34939 FDEP 2008 1
SJ7-LR-2039 TOMOKA RIVER 21FLGW 34940 FDEP 2008 1
SJ7-LR-2040 TOMOKA RIVER 21FLGW 34941 FDEP 2008 1
SJ7-LR-2043 TOMOKA RIVER 21FLGW 34942 FDEP 2008 1
SJ7-LR-2044 TOMOKA RIVER 21FLGW 34943 FDEP 2008 1
SJ7-LR-2049 TOMOKA RIVER 21FLGW 34944 FDEP 2008 1

Final TMDL Report Tomoka River, WBID 2634, Nutrients
Florida Department of Environmental Protection
24
Station STORET ID Station Owner Years With Data N
SJ7-LR-2050 TOMOKA RIVER 21FLGW 34945 FDEP 2008 1
SJ7-LR-2053 TOMOKA RIVER 21FLGW 34946 FDEP 2008 1
SJ7-LR-2054 TOMOKA RIVER 21FLGW 34947 FDEP 2008 1
SJ7-LR-2055 TOMOKA RIVER 21FLGW 34948 FDEP 2008 1
SJ7-LR-2060 TOMOKA RIVER 21FLGW 34949 FDEP 2008 1
SJ7-LR-2064 TOMOKA RIVER 21FLGW 34950 FDEP 2008 1
SJ7-LR-2069 TOMOKA RIVER 21FLGW 34951 FDEP 2008 1
SJ7-LR-2072 TOMOKA RIVER 21FLGW 34952 FDEP 2008 1
SJ7-LR-2074 TOMOKA RIVER 21FLGW 34953 FDEP 2008 1
SJ7-LR-2080 TOMOKA RIVER 21FLGW 34954 FDEP 2008 1
SJ7-LR-2083 TOMOKA RIVER 21FLGW 34955 FDEP 2008 1
SJ7-LR-2084 TOMOKA RIVER 21FLGW 34956 FDEP 2008 1
SJ7-LR-2089 TOMOKA RIVER 21FLGW 34957 FDEP 2008 1
SJ7-LR-2091 TOMOKA RIVER 21FLGW 34958 FDEP 2008 1 TOMOKA RIVER AT ELEVENTH STREET BRIDGE 21FLGW 3516 FDEP 1998 - 2011 143
TOMOKA RIVER AT 11TH STREET BRIDGE 21FLSJWM27010579 SJRWMD 1995 - 1998 22
TOMOKA RIVER UPSTREAM AT U.S. 92 BRIDGE 21FLSJWMNCBTR05 SJRWMD 2005 - 2006 5
TOMOKA RIVER EAST BRIDGE ON POWERLINE ACCESS NEAR LPGA GOLF 21FLSJWMNCBTR06 SJRWMD 2008 - 2011 42
TOMOKA RIVER @ 11TH STREET BRIDGE 21FLSJWMTR11 SJRWMD 1993 - 1995 10
TOMOKA RIVER UPSTREAM OF S.R. 40 BRIDGE 21FLVEMDTR03 Volusia County 1993 - 1998 54
TOMOKA RIVER UPSTREAM OF 11TH ST. BRIDGE 21FLVEMDTR04 Volusia County 1993 - 1998 51
TOMOKA RIVER UPSTREAM OF U.S. 92 BRIDGE 21FLVEMDTR05 Volusia County 1993 - 1998 30
TOMOKA RIVER FROM UPSTREAM SIDE OF S.R. 40 21FLVEMDVC-077 Volusia County 1999 - 2011 78 TOMOKA RIVER, FROM UPSTREAM SIDE OF LPGA BLVD. 21FLVEMDVC-078 Volusia County 1999 - 2011 71 TOMOKA RIVER FROM UPSTREAM SIDE OF U.S. 92 21FLVEMDVC-079 Volusia County 1999 - 2006 26
TOMOKA RIVER @ 11TH STREET 21FLWPB 20010739 FDEP 2003 6
TOMOKA RIVER @ STATE HIGHWAY 40 21FLWPB 20010740 FDEP 2003 6
TOMOKA RIVER AT CR216A (WBID 2634) 21FLWQSPVOL358LR FDEP 2005 3

Final TMDL Report Tomoka River, WBID 2634, Nutrients
Florida Department of Environmental Protection
25
Table 5.2. Statistical Summary of Historical CHLAC Data for Tomoka River
Station N Minimum Maximum Median Mean
CANAL TO TOMOKA @ 265 CHEROKEE RD 5 2.8 9.2 7.5 6.1
TOMOKA RIVER BETWEEN AIRPORT DITCH AND ISLAND 7 1.2 39.9 4.5 11.6
TOMOKA RIVER EAST FORK AROUND ISLAND 7 1.0 84.3 4.3 15.1
TOMOKA RIVER AT INTERSTATE 95 BRIDGE 7 1.0 18.9 1.4 6.6
TOMOKA RIVER AT STATE ROUTE 40 BRIDGE 11 1.0 20.0 2.0 4.1
TOMOKA RIVER AT ELEVENTH STREET BRIDGE 9 1.0 2.9 1.0 1.5
TOMOKA RIVER AT RIVER BEND PARK 5 8.0 26.0 13.0 15.1
TOMOKA RIVER AT LPGA BLVD. 5 1.0 3.9 1.8 2.2
TOMOKA RIVER @ 1-4 1 2.4 2.4 2.4 2.4
TOMOKA RIVER AT INTERSTATE 95 BRIDGE 1 1.4 1.4 1.4 1.4
TOMOKA RIVER AT 11TH STREET BRIDGE 11 1.0 2.9 1.4 1.5
TOMOKA RIVER AT U.S. HIGHWAY 92 3 2.8 6.2 3.2 4.1
TOMOKA RIVER AT SR 40 (TOMOKA ROAD) 4 1.4 5.6 1.4 2.4
TOMOKA RIVER AT U.S. HIGHWAY 92 1 1.0 1.0 1.0 1.0
SJ7-LR-2003 TOMOKA RIVER 1 28.0 28.0 28.0 28.0
SJ7-LR-2004 TOMOKA RIVER 1 18.0 18.0 18.0 18.0
SJ7-LR-2009 TOMOKA RIVER 1 2.1 2.1 2.1 2.1
SJ7-LR-2010 TOMOKA RIVER 1 9.4 9.4 9.4 9.4
SJ7-LR-2015 TOMOKA RIVER 1 11.0 11.0 11.0 11.0
SJ7-LR-2017 TOMOKA RIVER 1 7.0 7.0 7.0 7.0
SJ7-LR-2019 TOMOKA RIVER 1 23.0 23.0 23.0 23.0
SJ7-LR-2024 TOMOKA RIVER 1 19.0 19.0 19.0 19.0
SJ7-LR-2029 TOMOKA RIVER 1 2.6 2.6 2.6 2.6
SJ7-LR-2032 TOMOKA RIVER 1 22.0 22.0 22.0 22.0

Final TMDL Report Tomoka River, WBID 2634, Nutrients
Florida Department of Environmental Protection
26
Station N Minimum Maximum Median Mean
SJ7-LR-2034 TOMOKA RIVER 1 10.0 10.0 10.0 10.0
SJ7-LR-2039 TOMOKA RIVER 1 19.0 19.0 19.0 19.0
SJ7-LR-2040 TOMOKA RIVER 1 14.0 14.0 14.0 14.0
SJ7-LR-2043 TOMOKA RIVER 1 7.3 7.3 7.3 7.3
SJ7-LR-2044 TOMOKA RIVER 1 17.0 17.0 17.0 17.0
SJ7-LR-2049 TOMOKA RIVER 1 4.4 4.4 4.4 4.4
SJ7-LR-2050 TOMOKA RIVER 1 12.0 12.0 12.0 12.0
SJ7-LR-2053 TOMOKA RIVER 1 10.0 10.0 10.0 10.0
SJ7-LR-2054 TOMOKA RIVER 1 10.0 10.0 10.0 10.0
SJ7-LR-2055 TOMOKA RIVER 1 1.0 1.0 1.0 1.0
SJ7-LR-2060 TOMOKA RIVER 1 15.0 15.0 15.0 15.0
SJ7-LR-2064 TOMOKA RIVER 1 22.0 22.0 22.0 22.0
SJ7-LR-2069 TOMOKA RIVER 1 4.5 4.5 4.5 4.5
SJ7-LR-2072 TOMOKA RIVER 1 120.0 120.0 120.0 120.0
SJ7-LR-2074 TOMOKA RIVER 1 450.0 450.0 450.0 450.0
SJ7-LR-2080 TOMOKA RIVER 1 98.0 98.0 98.0 98.0
SJ7-LR-2083 TOMOKA RIVER 1 65.0 65.0 65.0 65.0
SJ7-LR-2084 TOMOKA RIVER 1 48.0 48.0 48.0 48.0
SJ7-LR-2089 TOMOKA RIVER 1 49.0 49.0 49.0 49.0
SJ7-LR-2091 TOMOKA RIVER 1 210.0 210.0 210.0 210.0
TOMOKA RIVER AT ELEVENTH STREET BRIDGE 143 1.0 7.7 1.0 1.3
TOMOKA RIVER AT 11TH STREET BRIDGE 22 1.0 5.6 1.0 1.7
TOMOKA RIVER UPSTREAM AT U.S. 92 BRIDGE 5 1.0 1.3 1.1 1.1
TOMOKA RIVER EAST BRIDGE ON POWERLINE ACCESS NEAR
LPGA GOLF 42 1.0 356.8 1.2 13.7
TOMOKA RIVER @ 11TH STREET BRIDGE 10 1.0 6.2 1.5 2.1

Final TMDL Report Tomoka River, WBID 2634, Nutrients
Florida Department of Environmental Protection
27
Station N Minimum Maximum Median Mean
TOMOKA RIVER UPSTREAM OF S.R. 40 BRIDGE 54 1.0 36.6 1.1 5.3
TOMOKA RIVER UPSTREAM OF 11TH ST. BRIDGE 51 1.0 4.2 1.0 1.2
TOMOKA RIVER UPSTREAM OF U.S. 92 BRIDGE 30 1.0 17.3 1.4 3.0
TOMOKA RIVER FROM UPSTREAM SIDE OF S.R. 40 78 1.0 200.6 3.0 9.7
TOMOKA RIVER, FROM UPSTREAM SIDE OF LPGA BLVD. 71 1.0 3.7 1.0 1.1
TOMOKA RIVER FROM UPSTREAM SIDE OF U.S. 92 26 1.0 160.7 3.2 20.8
TOMOKA RIVER @ 11TH STREET 6 1.0 2.0 1.0 1.2
TOMOKA RIVER @ STATE HIGHWAY 40 6 1.0 18.6 3.5 7.3
TOMOKA RIVER AT CR216A (WBID 2634) 3 1.0 1.1 1.0 1.0
CHLAC concentrations are µg/L. Table 5.3. Summary Statistics for Major Water Quality Parameters
Measured in Tomoka River
PARAMETER N MIN 25% MEDIAN MEAN 75% MAX BOD (mg/L) 71 0.4 0.8 1.4 1.7 2.0 6.1 CHLAC (µg/L) 654 0.0 1.0 1.1 6.9 3.1 450.0 COLOR (PT-CO) 670 5 85 160 236 320 1200 COND (uS/cm) 690 0 172 315 4308 483 76100 DO (mg/L) 696 0.00 3.19 4.51 4.53 5.82 19.19 DOSAT (%) 243 0.00 38.65 53.90 51.99 66.00 133.00 NH4 (mg/L) 312 0.001 0.018 0.028 0.060 0.047 1.500 NO3O2 (mg/L) 649 0.000 0.019 0.038 0.051 0.060 0.640 PH (su) 729 4.04 6.75 7.04 6.97 7.30 8.43 SALINITY (PPT) 588 0.00 0.10 0.15 2.83 0.23 233.00 SD (m) 553 0.0 0.4 0.5 0.6 0.8 25.0
TEMPC ( o C) 738 3.50 17.59 22.00 21.43 25.53 35.00 TN (mg/L) 628 0.15 0.79 1.01 1.15 1.33 4.52 TP (mg/L) 649 0.01 0.04 0.05 0.10 0.09 4.20 TSS (mg/L) 579 0 2 4 4 5 55 TURBIDITY (NTU) 642 1 2 3 4 4 84 INORGP (mg/L) 516 0.001 0.015 0.024 0.033 0.036 0.457 INORGN (mg/L) 304 0.01 0.05 0.08 0.12 0.11 1.52 TN/TP RATIO 601 0.00 11.96 17.96 22.87 28.51 153.40 INORGNINORGP 200 0.39 2.26 3.27 5.98 4.99 99.09

Final TMDL Report Tomoka River, WBID 2634, Nutrients
Florida Department of Environmental Protection
28
Figure 5.1. Historical Sampling Sites in the Tomoka River Watershed

Final TMDL Report Tomoka River, WBID 2634, Nutrients
Florida Department of Environmental Protection
29
Figure 5.2. Historical CHLAC Observations for the Tomoka River
Figure 5.3. Historical TN Observations for the Tomoka River

Final TMDL Report Tomoka River, WBID 2634, Nutrients
Florida Department of Environmental Protection
30
Figure 5.4. Historical TP Observations for the Tomoka River
Figure 5.5. Historical Color Observations for the Tomoka River

Final TMDL Report Tomoka River, WBID 2634, Nutrients
Florida Department of Environmental Protection
31
Figure 5.6. Historical Total Suspended Solids Observations for the Tomoka River
Available CHLAC, TN, and TP measurements were also summarized by year (Tables 5.4–5.6). Annual means were based on the IWR methodology that based the average on quarterly averages. A nonparametric test (Kruskal-Wallis) was applied to the CHLAC, INORGN, TN, INORGP, TP, COND, Color, and TSS datasets to determine whether there were significant differences among seasons (Appendix D). At an α level of 0.05, differences were significant among seasons all the parameters. A similar test for differences among years was significant for all the parameters (Appendix E). Table 5.4. Statistical Summary of Historical CHLAC Data by Year for the
Tomoka River
Year N Minimum Maximum Median Mean
1985 9 1.0 4.3 1.0
1986 24 1.0 84.3 4.4
1992 34 1.0 160.7 1.4 11.2
1993 31 1.0 200.6 2.3 13.6
1994 40 1.0 84.7 1.6 5.8

Final TMDL Report Tomoka River, WBID 2634, Nutrients
Florida Department of Environmental Protection
32
Year N Minimum Maximum Median Mean
1995 35 1.0 22.0 1.0 3.3
1996 33 1.0 15.4 1.0 2.3
1997 21 1.0 8.2 1.0 2.3
1998 36 1.0 23.9 1.0 2.5
1999 35 1.0 25.2 1.1 3.7
2000 10 1.0 13.1 1.1 2.7
2001 21 1.0 14.4 1.0 1.8
2002 19 1.0 16.8 1.0 2.6
2003 33 1.0 18.6 1.0 2.2
2004 20 1.0 7.7 1.0 1.9
2005 43 1.0 21.6 1.4 2.4
2006 21 1.0 28.5 1.0 2.6
2007 19 1.0 2.5 1.0 1.3
2008 64 1.0 450.0 2.4 10.2
2009 50 1.0 356.8 2.6 11.4
2010 33 1.0 76.0 1.3 6.4
2011 24 1.0 21.5 1.3 5.9 CHLAC concentrations are µg/L. Blank cells in the mean column represent cases where data were not collected in each of the four quarters.
Table 5.5 Statistical Summary of Historical TN Data by Year for the Tomoka River
Year N Minimum Maximum Median Mean
1975 1 0.70 0.70 0.70
1983 3 0.49 2.00 0.49
1984 6 0.80 1.30 1.05
1985 10 0.75 2.48 1.06

Final TMDL Report Tomoka River, WBID 2634, Nutrients
Florida Department of Environmental Protection
33
Year N Minimum Maximum Median Mean
1986 25 0.67 1.61 1.06
1992 33 0.53 2.68 1.24 1.26
1993 33 0.39 2.74 0.91 1.08
1994 42 0.37 3.38 1.32 1.47
1995 37 0.56 2.47 1.40 1.48
1996 34 0.47 1.75 0.96 1.01
1997 22 0.48 1.90 0.98 0.92
1998 35 0.62 1.85 1.13 1.17
1999 35 0.15 2.24 0.78 0.93
2000 12 0.46 1.73 0.81 0.91
2001 21 0.29 1.91 0.72 0.91
2002 21 0.65 1.56 1.05 1.06
2003 32 0.67 1.48 1.02 1.02
2004 22 0.60 2.40 0.92 1.06
2005 38 0.69 1.94 1.01 1.08
2006 19 0.50 1.13 0.70 0.73
2007 17 0.50 1.24 0.74 0.76
2008 60 0.48 4.52 0.97 1.82
2009 21 0.69 3.42 1.14 1.40
2010 27 0.66 2.25 1.00 1.13
2011 22 0.56 4.36 0.83 1.19 TN concentrations are mg/L. Blank cells in the mean column represent cases where data were not collected in each of the four quarters.

Final TMDL Report Tomoka River, WBID 2634, Nutrients
Florida Department of Environmental Protection
34
Table 5.6. Statistical Summary of Historical TP Data by Year for the Tomoka River
Year N Minimum Maximum Median Mean
1968 1 0.130 0.130 0.130
1969 1 0.114 0.114 0.114
1970 1 0.068 0.068 0.068
1971 1 0.117 0.117 0.117
1975 1 0.090 0.090 0.090
1983 3 0.050 0.520 0.050
1984 6 0.050 0.260 0.070
1985 10 0.020 0.070 0.030
1986 25 0.020 0.230 0.090
1992 34 0.020 1.910 0.090 0.149
1993 28 0.020 4.200 0.095 0.335
1994 42 0.025 0.570 0.104 0.152
1995 37 0.015 0.180 0.067 0.071
1996 34 0.010 0.070 0.030 0.032
1997 22 0.010 0.150 0.031 0.047
1998 37 0.010 0.170 0.040 0.048
1999 35 0.023 0.140 0.040 0.053
2000 10 0.010 0.495 0.105 0.228
2001 21 0.010 0.640 0.052 0.123
2002 19 0.019 0.093 0.050 0.050
2003 34 0.010 0.210 0.051 0.059
2004 20 0.020 0.091 0.040 0.046
2005 38 0.020 0.091 0.050 0.050
2006 23 0.020 0.100 0.045 0.051

Final TMDL Report Tomoka River, WBID 2634, Nutrients
Florida Department of Environmental Protection
35
Year N Minimum Maximum Median Mean
2007 18 0.010 0.081 0.042 0.043
2008 63 0.020 0.970 0.110 0.100
2009 30 0.028 0.540 0.050 0.093
2010 33 0.010 0.470 0.048 0.084
2011 22 0.020 0.180 0.057 0.057 TP concentrations are mg/L. Blank cells in the mean column represent cases where data were not collected in each of the four quarters.
5.1.2 TMDL Development Process As part of evaluating potential relationships between CHLAC and other variables, rainfall records for the Daytona International Airport (Appendix J) were used to determine rainfall amounts associated with individual sampling dates. Rainfall recorded on the day of sampling (PRECIP), the cumulative total for the day of and the previous two days (V3DAY), the cumulative total for the day of and the previous six days (V7DAY), the cumulative total for the day of and the previous thirteen days (V14DAY), and the cumulative total for the day of and the previous twenty days (V21DAY) were all paired with the respective water quality parameter observation. A Spearman correlation matrix was used to assess potential relationships between CHLAC and other water quality parameters (Appendix G). At an alpha (α) level of 0.05, correlations between CHLAC, COND, SALINITY, water temperature (TEMPC), NO3O2, TN, TP, TSS, TURBIDITY, V14DAY, V21DAY, and daily streamflow were significant. A simple linear regression of CHLAC versus SALINITY explained nearly 10 percent of the variance in CHLAC while the regression with TN also explained nearly 10 percent of the variance in CHLAC (Appendix I). The impairment listing identified TN and TP as co-limiting nutrients. Figure 5.7 illustrates the time series of the TN/TP ratio. Although the trend line indicates an increase in the TN/TP ratio, the regression was not significant at an alpha (α) level of 0.05 (p=0.872). A similar plot of the INORGN/INORGP ratio had a slope of 0.00007. Summary statistics for the ratio’s can be found in Table 5.3. Based on the INORGN/INORGP ratio, it appeared that inorganic forms of nitrogen were typically limiting compared to inorganic phosphorus (75% value was 4.99).

Final TMDL Report Tomoka River, WBID 2634, Nutrients
Florida Department of Environmental Protection
36
Figure 5.7. Historical Time Series of the TN/TP Ratio for the Tomoka River
As the impairment for nutrients was based on an annual average for CHLAC, annual averages for water quality parameters were also calculated using available data and linear regressions were performed. The calculations of annual averages followed the methodology described in the IWR for the calculation of annual CHLAC averages. Based on simple linear regression using annual averages, correlations between CHLAC and COND, SALINITY, NH4, INORGN, TN, and TP were significant at an alpha (α) level of 0.05 (Appendix JI). Approximately 55 percent of the variance in the annual average CHLAC was explained with the annual average SALINITY concentration. Annual average NH4 explained nearly 48 percent (INORGN explained 46 percent) of the variance in the annual average CHLAC concentrations. TN and TP explained 32 percent and 37 percent of the variance, respectively. INORGP regressions with CHLAC were significant at an alpha (α) level of 0.05. Simple linear regressions with annual average CHLAC concentrations versus the model predicted annual average TN and TP watershed loads (Table 4.5) were not significant at an alpha (α) level of 0.05 (Appendix J). Although the regression between CHLAC and annual rainfall was not significant (r2 = 0.130, p=0.118), annual rainfall patterns were examined further to evaluate whether there were cumulative effects due to reduced rainfall. Annual rainfall totals over the 1937 through 2011 were ranked (Appendix K). With the exception of 2009 (50.3 inches), rainfall totals over the 2008 – 2011 period were below the long-term annual average of 49.63 inches. To evaluate the longer term effects of below average rainfall years, an annual rainfall deficit was calculated

Final TMDL Report Tomoka River, WBID 2634, Nutrients
Florida Department of Environmental Protection
37
based on the long-term average. The cumulative effect of deficits was calculated by summing over a three-year (current year and two previous years) and a five-year (current year and the four previous years) period. Simple linear regressions of the annual average CHLAC versus the three-year cumulative and five-year cumulative deficits were significant at an alpha (α) level of 0.05 (Appendix J). Plots of the annual rainfall deficit and cumulative three and five-year deficits can be found in Appendix K. As seen in the plots, following the high rainfall in 2005 (65.77 inches), the cumulative three and five-year deficits increased sharply. In seventeen of the twenty years for which annual averages for salinity were calculated, the annual average salinity was below 2.7 ppt and represented fresh water conditions. In those seventeen years, the maximum annual average CHLAC concentration was 11.2 µg/L with thirteen of the years averaging less than 3.8 µg/L. For the three years where the annual average salinity exceeded 3 ppt (1993, 2008, and 2009), annual average CHLAC concentrations were between 10.2 and 13.6 µg/L. The annual average CHLAC concentration in 2010 was 6.4 µg/L and the annual average salinity was 0.7 ppt. This is illustrated in Figure 5.8.
Figure 5.8. Annual Average CHLA versus Salinity for the Tomoka River
. As discussed in Section 5.1.1, thirty-three of the fifty-eight stations with CHLAC had only one observation. Patterns of CHLAC, SALINITY, TN, and TP were further explored at three long-term stations that were sampled over the 1998 – 2011 period. The following plots (Figures 5.9 – 5.12) illustrate conditions at stations 21FLGW 3516, 21FLVEMDVC-077, and 21FLVEMDVC-078. Stations 21FLVEMDVC-078 and 21FLGW 3516 are located near the LPGA Blvd crossing of the Tomoka River, approximately 2.9 miles south of the 21FLVEMDVC-077 station near SR

Final TMDL Report Tomoka River, WBID 2634, Nutrients
Florida Department of Environmental Protection
38
40 (Figure 5.1). Both CHLAC and SALINITY levels at the 21FLVEMDVC-077 site are elevated relative to the two sites to the south. Thirty percent of the reported salinity measurements at 21FLVEMDVC-077 represented predominantly marine conditions. In contrast, the maximum salinities at stations 21FLVEMDVC-078 and 21FLGW 3516 were both less than 0.5 ppt. Between 30 and 40 percent of the CHLAC observations at station 21FLVEMDVC-077 exceeded 5 µg/L. Approximately 45 percent of the period of record salinity observations reported for stations in the WBID located at or above SR 40 represented predominantly marine conditions, suggesting some tidal transport into this portion of the Tomoka.

Final TMDL Report Tomoka River, WBID 2634, Nutrients
Florida Department of Environmental Protection
39
Figure 5.9. CHLA Time Series for Three Long-term Stations in the Tomoka River
Figure 5.10. Total Nitrogen Time Series for Three Long-term Stations in the Tomoka River

Final TMDL Report Tomoka River, WBID 2634, Nutrients
Florida Department of Environmental Protection
40
Figure 5.11. Total Phosphorus Time Series for Three Long-term Stations in the Tomoka River
Figure 5.12. Salinity Time Series for Three Long-term Stations in the Tomoka River

Final TMDL Report Tomoka River, WBID 2634, Nutrients
Florida Department of Environmental Protection
41
As the nutrient impairment listing was based on exceeding an annual average CHLA concentration of 5 µg/L for two consecutive years, a target annual average CHLAC concentration of 4.5 µg/L was considered as an appropriate protective target and used to develop nutrient reductions. Correlations between annual average concentrations of CHLAC and inorganic nitrogen (as well as NH4), TN, and TP were significant. A general linear model GLM) that included TN and TP explained nearly 67 percent of the variance in annual average CHLAC concentrations (Appendix J). As discussed earlier and illustrated in Figure 5.7, TN/TP ratios indicated co-limitation of nitrogen and phosphorus. Therefore, similar reductions to TN and TP were applied with the GLM until annual average CHLAC concentrations were less than 4.5 µg/L (Figure 5.13).
Figure 5.13. General Linear Model of Annual Average CHLAC versus TN and TP in the Tomoka River
0.0 0.5 1.0 1.5 2.0 2.5 3.0 3.5 4.0 4.5 5.0 5.5 6.0 6.5 7.0 7.5 8.0 8.5 9.0 9.510.010.
511.
011.
512.
012.
513.
013.
514.
0
ANNUAL AVE CHLAC (UG/L)
0.000.050.100.150.200.250.300.350.400.450.500.550.600.650.700.750.800.850.900.951.00
FRAC
TIO
N O
F DA
TA
GLM70PERCENTGLM75PERCENTGLM80PERCENTGLM85PERCENTGLM90PERCENTGLMCHLACCHLAC
Annual average TN concentrations over the 1992 – 2011 period ranged between 0.73 mg/L (2006) and 1.82 mg/L (2008) with an overall average of 1.12 mg/L. Over the same period, TP concentrations ranged between 0.032 mg/L (1996) and 0.335 mg/L (1993) with an overall average of 0.094 mg/L. Applying a thirty percent reduction (GLM70PERCENT) to the annual average TN concentrations yielded a range between 0.51 mg/L and 1.27 mg/L, with an overall average of 0.78 mg/L. Application of the thirty percent reduction to the annual average TP concentrations yielded a range between 0.022 mg/L and 0.234 mg/L, with an overall average of 0.065 mg/L. The annual average TN and TP concentrations of 0.78 mg/L and 0.065 mg/L, respectively were used as the nutrient targets in the TMDL to achieve an annual CHLAC target

Final TMDL Report Tomoka River, WBID 2634, Nutrients
Florida Department of Environmental Protection
42
of 4.5 µg/L or less. Use of the averages addresses year-to-year variations in nutrient levels observed historically in the watershed. Over the September 1992 to May 2012 period, 24 stream condition index (SCI) assessments have been conducted in this WBID. The SCI uses 10 metrics to evaluate the biological health of the macroinvertebrate community. All twenty-four assessments have concluded that the biological community is healthy with good or excellent ratings. Reductions in TN ,TP and CHLAC concentrations are not expected to adversely affect the existing biological community. Estimated watershed TN and TP concentrations and loads were provided by Tetra Tech (Table 4.5) for the 1997 – 2009 period. Predicted annnual average TN concentrations over the simulation period ranged from 1.10 mg/L to 1.32 mg/L, with an overall average of 1.19 mg/L. Annual TN loadings ranged from 127,797 lbs/yr to 848,249 lbs/yr, with an overall average of 338,774 lbs/yr. Predicted annnual average TP concentrations over the simulation period ranged from 0.065 mg/L to 0.120 mg/L, with an overall average of 0.090 mg/L. Annual TP loadings ranged from 11,092 lbs/yr to 49,287 lbs/yr, with an overall average of 22,101 lbs/yr. Simple linear regressions of the model predicted annual average TN load or TP load versus the annual average CHLAC concentration were not significant at an α level of 0.05, so a TMDL-related load associated with a 30 percent reduction in annual average TN or TP concentrations were not calculated using the model.
5.1.3 Critical Conditions/Seasonality Nonparametric tests (Kruskal-Wallis) were presented in Appendices C and D that illustrated significant differences in CHLAC and nutrients on both a seasonal and annual basis. The nutrient impairment was based on annual average CHLAC concentrations exceeding a historic minimum by 50 percent or more over two consecutive years. The methodology used for calculating an annual average is based on computing individual seasonal averages. Consequently, seasonality is incorporated into the process of assessment and TMDL development. Reductions in TN and TP were based on setting a CHLAC target and corresponding TN and TP concentrations below the historic minimum chlorophyll listing threshold.

Final TMDL Report Tomoka River, WBID 2634, Nutrients
Florida Department of Environmental Protection
43
Chapter 6: DETERMINATION OF THE TMDL
6.1 Expression and Allocation of the TMDL The objective of a TMDL is to provide a basis for allocating acceptable loads among all of the known pollutant sources in a watershed so that appropriate control measures can be implemented and water quality standards achieved. A TMDL is expressed as the sum of all point source loads (Wasteload Allocations, or WLAs), nonpoint source loads (Load Allocations, or LAs), and an appropriate margin of safety (MOS), which takes into account any uncertainty concerning the relationship between effluent limitations and water quality:
TMDL = ∑ WLAs + ∑ LAs + MOS As discussed earlier, the WLA is broken out into separate subcategories for wastewater discharges and stormwater discharges regulated under the NPDES Program:
TMDL ≅ ∑ WLAswastewater + ∑ WLAsNPDES Stormwater + ∑ LAs + MOS It should be noted that the various components of the revised TMDL equation may not sum up to the value of the TMDL because (a) the WLA for NPDES stormwater is typically based on the percent reduction needed for nonpoint sources and is also accounted for within the LA, and (b) TMDL components can be expressed in different terms (for example, the WLA for stormwater is typically expressed as a percent reduction, and the WLA for wastewater is typically expressed as mass per day). WLAs for stormwater discharges are typically expressed as “percent reduction” because it is very difficult to quantify the loads from MS4s (given the numerous discharge points) and to distinguish loads from MS4s from other nonpoint sources (given the nature of stormwater transport). The permitting of stormwater discharges also differs from the permitting of most wastewater point sources. Because stormwater discharges cannot be centrally collected, monitored, and treated, they are not subject to the same types of effluent limitations as wastewater facilities, and instead are required to meet a performance standard of providing treatment to the “maximum extent practical” through the implementation of BMPs. This approach is consistent with federal regulations (40 CFR § 130.2[I]), which state that TMDLs can be expressed in terms of mass per time (e.g., pounds per day), toxicity, or other appropriate measure. The nutrient TMDL for the Tomoka River is expressed in terms of a percent reduction in total nitrogen and total phosphorus nutrient criteria and corresponding concentrations (Table 6.1).

Final TMDL Report Tomoka River, WBID 2634, Nutrients
Florida Department of Environmental Protection
44
Table 6.1. TMDL Components for Tomoka River
WBID Parameter TMDL1
(mg/L)
WLA WLA LA
(% Reduction)2 MOS Wastewater (mg/L)
NPDES Stormwater
(% Reduction)1
2634 TN 0.78 N/A 30% 30% Implicit
2634 TP 0.065 N/A 30% 30% Implicit 1 Nutrient concentrations represent annual averages
2 As the TMDL represents a percent reduction, it also complies with EPA requirements to express the TMDL on a daily basis.
6.2 Load Allocation Total nitrogen and total phosphorus reductions of 30 percent are required from nonpoint sources. It should be noted that the load allocation includes loading from stormwater discharges that are not part of the NPDES Stormwater Program.
6.3 Wasteload Allocation
6.3.1 NPDES Wastewater Discharges There is currently one permitted NPDES discharge in the Tomoka River watershed. Based on discharge monitoring reports, the Tomoka Farms Road Landfill (FL0037877) has an infrequent discharge to the Tomoka River and the reported TN and TP concentrations are below the target concentration.
6.3.2 NPDES Stormwater Discharges Several Phase II municipal separate storm sewer system (MS4) permits cover portions of the watershed, including permits for the City of Daytona Beach (FLR04E0115) and Volusia County (FLR04E033. The Florida Department of Transportation District 5 is a co-permittee with Volusia County (FLR04E024). It should be noted that any MS4 permittee is only responsible for reducing the loads associated with stormwater outfalls that it owns or otherwise has responsible control over, and it is not responsible for reducing other nonpoint source loads in its jurisdiction.
6.4 Margin of Safety Consistent with the recommendations of the Allocation Technical Advisory Committee (Department, 2001), an implicit MOS was used in the development of this TMDL. An MOS was included in the TMDL by setting an annual CHLAC target concentration of 4.5 µg/L which was below the historic minimum listing threshold and applying a 30 percent reduction to annual average TN and TP concentrations. The 30 percent reduction was based on application of a general linear model to achieve annual average CHLAC concentrations below 4.5 µg/L. The

Final TMDL Report Tomoka River, WBID 2634, Nutrients
Florida Department of Environmental Protection
45
assessment process would require at least two consecutive years CHLAC at or above 5 µg/L before being listed as impaired for nutrients.

Final TMDL Report Tomoka River, WBID 2634, Nutrients
Florida Department of Environmental Protection
46
Chapter 7: NEXT STEPS: IMPLEMENTATION PLAN DEVELOPMENT AND BEYOND
7.1 Basin Management Action Plan Following the adoption of this TMDL by rule, the Department will determine the best course of action regarding its implementation. Depending upon the pollutant(s) causing the waterbody impairment and the significance of the waterbody, the Department will select the best course of action leading to the development of a plan to restore the waterbody. Often this will be accomplished cooperatively with stakeholders by creating a Basin Management Action Plan, referred to as the BMAP. Basin Management Action Plans are the primary mechanism through which TMDLs are implemented in Florida [see Subsection 403.067(7) F.S.]. A single BMAP may provide the conceptual plan for the restoration of one or many impaired waterbodies. If the Department determines a BMAP is needed to support the implementation of this TMDL, a BMAP will be developed through a transparent stakeholder-driven process intended to result in a plan that is cost-effective, technically feasible, and meets the restoration needs of the applicable waterbodies. Once adopted by order of the Department Secretary, BMAPs are enforceable through wastewater and municipal stormwater permits for point sources and through BMP implementation for nonpoint sources. Among other components, BMAPs typically include:
• Water quality goals (based directly on the TMDL);
• Refined source identification;
• Load reduction requirements for stakeholders (quantitative detailed allocations, if technically feasible);
• A description of the load reduction activities to be undertaken, including structural projects, nonstructural BMPs, and public education and outreach;
• A description of further research, data collection, or source identification needed in order to achieve the TMDL;
• Timetables for implementation;
• Implementation funding mechanisms;
• An evaluation of future increases in pollutant loading due to population growth;
• Implementation milestones, project tracking, water quality monitoring, and adaptive management procedures; and
• Stakeholder statements of commitment (typically a local government resolution).
BMAPs are updated through annual meetings and may be officially revised every five years. Completed BMAPs in the state have improved communication and cooperation among local

Final TMDL Report Tomoka River, WBID 2634, Nutrients
Florida Department of Environmental Protection
47
stakeholders and state agencies, improved internal communication within local governments, applied high-quality science and local information in managing water resources, clarified obligations of wastewater point source, MS4 and non-MS4 stakeholders in TMDL implementation, enhanced transparency in DEP decision-making, and built strong relationships between DEP and local stakeholders that have benefited other program areas.

Final TMDL Report Tomoka River, WBID 2634, Nutrients
Florida Department of Environmental Protection
48
References
Florida Administrative Code. Rule 62-302, Surface water quality standards.
———. Rule 62-303, Identification of impaired surface waters.
Florida Department of Environmental Protection. February 2001. A report to the Governor and the Legislature on the allocation of Total Maximum Daily Loads in Florida. Tallahassee, Florida: Bureau of Watershed Management.
———. 2005. status report. Tallahassee, Florida. Available: http://www.dep.state.fl.us/water/basin411/uppereast/status.htm.
Florida Department of Health Website. 2011. Available: http://www.doh.state.fl.us/.
Florida Watershed Restoration Act. Chapter 99-223, Laws of Florida.
U. S. Census Bureau Website. 2010. Available: http://factfinder2.census.gov/faces/nav/jsf/pages/index.xhtml.
U. S. Environmental Protection Agency. 1999. Protocol for developing nutrient TMDLs. First Edition. EPA 841–B–99–007.
U. S. Environmental Protection Agency Region 4. 2002. Estimating water quality loadings from MS4 areas.
Final TMDL Report Tomoka River, WBID 2634, Nutrients
Florida Department of Environmental Protection
49
Appendices
Appendix A: Background Information on Federal and State Stormwater Programs
In 1982, Florida became the first state in the country to implement statewide regulations to address the issue of nonpoint source pollution by requiring new development and redevelopment to treat stormwater before it is discharged. The Stormwater Rule, as authorized in Chapter 403, F.S., was established as a technology-based program that relies on the implementation of BMPs that are designed to achieve a specific level of treatment (i.e., performance standards) as set forth in Rule 62-40, F.A.C. In 1994, the Department’s stormwater treatment requirements were integrated with the stormwater flood control requirements of the water management districts, along with wetland protection requirements, into the Environmental Resource Permit regulations. Rule 62-40 also requires the state’s water management districts to establish stormwater pollutant load reduction goals (PLRGs) and adopt them as part of a Surface Water Improvement and Management (SWIM) plan, other watershed plan, or rule. Stormwater PLRGs are a major component of the load allocation part of a TMDL. To date, stormwater PLRGs have been established for Tampa Bay, Lake Thonotosassa, the Winter Haven Chain of Lakes, the Everglades, Lake Okeechobee, and Lake Apopka. In 1987, the U.S. Congress established Section 402(p) as part of the federal Clean Water Act Reauthorization. This section of the law amended the scope of the federal NPDES permitting program to designate certain stormwater discharges as “point sources” of pollution. The EPA promulgated regulations and began implementing the Phase I NPDES stormwater program in 1990. These stormwater discharges include certain discharges that are associated with industrial activities designated by specific standard industrial classification (SIC) codes, construction sites disturbing 5 or more acres of land, and master drainage systems of local governments with a population above 100,000, which are better known as MS4s. However, because the master drainage systems of most local governments in Florida are interconnected, the EPA implemented Phase I of the MS4 permitting program on a countywide basis, which brought in all cities (incorporated areas), Chapter 298 urban water control districts, and the Florida Department of Transportation throughout the 15 counties meeting the population criteria. The Department received authorization to implement the NPDES stormwater program in 2000. An important difference between the federal NPDES and the state’s stormwater/environmental resource permitting programs is that the NPDES Program covers both new and existing discharges, while the state’s program focus on new discharges only. Additionally, Phase II of the NPDES Program, implemented in 2003, expands the need for these permits to construction sites between 1 and 5 acres, and to local governments with as few as 1,000 people. While these urban stormwater discharges are now technically referred to as “point sources” for the purpose of regulation, they are still diffuse sources of pollution that cannot be easily collected and treated by a central treatment facility, as are other point sources of pollution such as domestic and industrial wastewater discharges. It should be noted that all MS4 permits issued in Florida include a reopener clause that allows permit revisions to implement TMDLs when the implementation plan is formally adopted.

Final TMDL Report Tomoka River, WBID 2634, Nutrients
Florida Department of Environmental Protection
50
Appendix B: Historical Corrected Chla, TEMP, TN, TP, and TSS Observations in Palm Coast, 1968–2011
Station Sample Date Corr Chla
(µg/L)
Temp (oC)
TN (mg/l)
TP (mg/L)
TSS (mg/Ll)
112WRD 02247510 05/03/1968 26 0.1304 112WRD 02247510 05/01/1969 21 0.1141 112WRD 02247510 05/15/1970 23 0.0685 112WRD 02247510 05/14/1971 25.5 0.1174 112WRD 02247510 11/14/1973 16.5 112WRD 02247510 01/04/1974 19 112WRD 02247510 02/22/1974 18.5 112WRD 02247510 04/19/1974 19.5 112WRD 02247510 06/19/1974 27 112WRD 02247510 08/05/1974 24 21FLA 27010830 03/18/1975 21.2 0.704 0.09 4 112WRD 02247510 10/31/1979 20.5 112WRD 02247510 01/07/1980 12 112WRD 02247510 02/20/1980 13 112WRD 02247510 04/16/1980 17 112WRD 02247510 06/09/1980 27.5 112WRD 02247510 08/06/1980 26 112WRD 02247510 10/01/1980 26.5 112WRD 02247510 12/02/1980 15 112WRD 02247510 01/20/1981 8.5 112WRD 02247510 03/28/1981 19 112WRD 02247510 05/21/1981 24 112WRD 02247510 07/10/1981 27 112WRD 02247510 10/27/1981 24 112WRD 02247510 12/17/1981 14.5 112WRD 02247510 02/09/1982 18 112WRD 02247510 04/13/1982 19.5 112WRD 02247510 06/07/1982 28 112WRD 02247510 07/26/1982 25.5 112WRD 02247510 10/12/1982 22 112WRD 02247510 01/06/1983 15 112WRD 02247510 03/09/1983 14.5 112WRD 02247510 03/31/1983 18 112WRD 02247510 06/16/1983 23.5 112WRD 02247500 08/18/1983 2 0.52 112WRD 02247508 08/18/1983 25.5 0.49 0.05 112WRD 02247510 08/18/1983 0.49 0.05 112WRD 02247500 03/09/1984 13.5 1.2 0.26 112WRD 02247510 03/09/1984 14.5 1 0.05

Final TMDL Report Tomoka River, WBID 2634, Nutrients
Florida Department of Environmental Protection
51
Station Sample Date Corr Chla
(µg/L)
Temp (oC)
TN (mg/l)
TP (mg/L)
TSS (mg/Ll)
112WRD 02247508 03/15/1984 19 0.8 0.05 112WRD 02247500 09/28/1984 1.3 0.06 112WRD 02247508 09/28/1984 1.1 0.11 112WRD 02247510 09/28/1984 0.8 0.08 21FLA 27010573 10/22/1985 1 25.6 1.13 0.04 21FLA 27010574 10/22/1985 1.43 24.3 1.15 0.03 21FLA 27010578 10/22/1985 2.57 24 1.13 0.07 21FLA 27010572 10/22/1985 4.28 25.5 1.14 0.04 21FLA 27010579 10/22/1985 25 2.48 0.06 21FLA 27010573 12/16/1985 1 15.7 0.85 0.02 3 21FLA 27010574 12/16/1985 1 13.2 0.75 0.02 5 21FLA 27010578 12/16/1985 1 12.8 0.75 0.03 3 21FLA 27010579 12/16/1985 1 12 0.87 0.02 3 21FLA 27010572 12/16/1985 1.18 15.7 0.98 0.03 3 21FLA 27010578 02/11/1986 1 19.8 0.71 0.04 3 21FLA 27010579 02/11/1986 1 19 1.06 0.04 4 21FLA 27010573 02/11/1986 1.28 19.5 0.95 0.06 4 21FLA 27010574 02/11/1986 1.28 19.2 0.73 0.05 3 21FLA 27010572 02/11/1986 1.71 19.4 0.95 0.03 3 21FLA 27010573 04/28/1986 4.28 25.1 0.71 0.05 4 21FLA 27010574 04/28/1986 7.91 23.9 0.82 0.07 5 21FLA 27010572 04/28/1986 4.49 23.6 0.75 0.05 4 21FLA 27010578 04/28/1986 7.7 24 0.77 0.12 4 21FLA 27010579 04/28/1986 1.92 23 0.67 0.02 3 21FLA 27010579 06/23/1986 1.92 26 0.7 0.04 4 21FLA 27010573 06/23/1986 84.3 29.5 1.16 0.18 8 21FLA 27010578 06/23/1986 30.3 1.07 0.09 4 21FLA 27010572 06/23/1986 22 28.9 1.12 0.15 6 21FLA 27010574 06/23/1986 18.9 30.1 1.03 0.13 7 21FLA 27010579 07/28/1986 1 25.5 1.43 0.04 3 21FLA 27010573 07/28/1986 7.7 28.6 1.3 0.09 8 21FLA 27010574 07/28/1986 1 27.5 1.33 0.11 4 21FLA 27010572 07/28/1986 7.48 28.9 1.12 0.18 9 21FLA 27010578 07/28/1986 1.07 28 1.13 0.12 3 21FLA 27010579 08/25/1986 2.85 28 0.84 0.09 15 21FLA 27010578 08/25/1986 20 28 1.3 0.18 4 21FLA 27010573 08/25/1986 6.42 31.6 1.26 0.13 3 21FLA 27010572 08/25/1986 39.9 35 1.11 0.14 2 21FLA 27010574 08/25/1986 15 29.3 1.61 0.23 2 21FLVEMDVC-079 01/06/1992 37.7 14.5 1.24 0.11 15 21FLVEMDVC-078 01/06/1992 1.2 14.3 0.82 0.05 2 21FLVEMDVC-077 01/06/1992 1.5 14.1 0.87 0.05 1 21FLVEMDVC-078 02/03/1992 1 12.32 0.53 0.04 2.5

Final TMDL Report Tomoka River, WBID 2634, Nutrients
Florida Department of Environmental Protection
52
Station Sample Date Corr Chla
(µg/L)
Temp (oC)
TN (mg/l)
TP (mg/L)
TSS (mg/Ll)
21FLVEMDVC-079 02/03/1992 2 12.83 0.68 0.06 1 21FLVEMDVC-077 02/03/1992 8 13.29 0.63 0.06 5 21FLVEMDVC-079 03/02/1992 1 20.08 0.89 0.05 7 21FLVEMDVC-078 03/02/1992 1 16.1 0.88 0.07 10 21FLVEMDVC-077 03/02/1992 1 18.86 0.96 0.08 11 21FLVEMDVC-078 04/06/1992 1.8 17.2 0.9 0.05 2 21FLVEMDVC-079 04/06/1992 13.6 16.9 1.33 0.08 6 21FLVEMDVC-077 04/06/1992 21.4 20.36 1.14 0.05 10.5 21FLVEMDVC-078 05/04/1992 1.1 20.63 1.38 0.045 2.75 21FLVEMDVC-079 05/04/1992 118.3 23.1 2.68 0.25 15 21FLVEMDVC-077 05/04/1992 6.8 25.37 1.07 0.12 9 21FLVEMDVC-078 06/01/1992 1.8 23.3 0.66 0.04 3 21FLVEMDVC-079 06/01/1992 11.6 3.5 1.23 0.1 6 21FLVEMDVC-077 06/01/1992 3.8 25.2 0.98 0.11 4 21FLVEMDVC-077 07/06/1992 1.11 28 1.69 0.3 3 21FLVEMDVC-078 07/06/1992 1.6 26.7 1.59 0.24 2 21FLVEMDVC-079 07/06/1992 3.15 26.1 1.87 0.17 2.5 21FLVEMDVC-078 08/03/1992 1 25.5 0.87 0.13 3 21FLVEMDVC-077 08/03/1992 2.79 28.6 1.63 0.11 2 21FLVEMDVC-079 08/03/1992 160.7 1.91 21FLVEMDVC-078 09/09/1992 1 24 1.53 0.05 4 21FLVEMDVC-079 09/09/1992 1 24.1 1.62 0.22 3 21FLVEMDVC-077 09/09/1992 3 27 1.38 0.02 1 21FLA 27010579 09/22/1992 1 25 1.42 0.04 2 21FLVEMDVC-079 10/05/1992 1 23.1 1.461 0.15 4 21FLVEMDVC-078 10/05/1992 1 23 1.571 0.11 5 21FLVEMDVC-077 10/05/1992 1 23 1.311 0.11 6 21FLVEMDVC-078 11/02/1992 1 20.28 1.62 0.11 2 21FLVEMDVC-079 11/02/1992 1 20.31 1.17 0.17 6 21FLVEMDVC-077 11/02/1992 1 20.43 1.36 0.07 4 21FLVEMDVC-078 12/07/1992 15.32 21FLVEMDVC-079 12/07/1992 14.59 21FLVEMDVC-077 12/07/1992 14.46 21FLVEMDTR04 01/04/1993 1 19.85 1.36 0.05 3 21FLVEMDTR05 01/04/1993 17.3 19.85 2.502 0.21 6 21FLVEMDTR03 01/04/1993 1 18.9 0.896 0.08 4 21FLVEMDTR05 03/01/1993 1 12.52 1.0715 0.06 3.5 21FLVEMDTR04 03/01/1993 1 11.91 0.9015 0.07 4 21FLVEMDTR03 03/01/1993 1 12.59 0.9615 0.07 3 21FLA 27010579 03/16/1993 1 13.1 0.97 0.034 2 21FLVEMDVC-078 05/03/1993 1 20.6 0.827 0.04 1 21FLVEMDVC-077 05/03/1993 16.55 21.6 1.273 0.05 3 21FLSJWMTR11 05/19/1993 23.5 0.68 0

Final TMDL Report Tomoka River, WBID 2634, Nutrients
Florida Department of Environmental Protection
53
Station Sample Date Corr Chla
(µg/L)
Temp (oC)
TN (mg/l)
TP (mg/L)
TSS (mg/Ll)
21FLVEMDVC-078 06/07/1993 32 0.802 0.05 6 21FLVEMDVC-077 06/07/1993 9.2 30 1.06 0.11 2 21FLVEMDTR04 06/08/1993 1 32 0.8015 0.05 5.5 21FLVEMDTR03 06/08/1993 9.2 30 1.06 0.11 2 21FLSJWMTR11 06/16/1993 1 25.1 0.663 7 21FLVEMDVC-077 07/07/1993 15.15 30.32 0.938 0.12 7 21FLVEMDVC-078 07/07/1993 1.38 26.13 0.584 0.06 3 21FLSJWMTR11 07/14/1993 4.3 25.6 0.714 22 21FLVEMDVC-079 08/02/1993 5.52 27.8 2.2315 0.33 6 21FLVEMDVC-077 08/02/1993 11.5 29.2 0.917 0.11 6 21FLVEMDVC-078 08/02/1993 1.79 26.7 0.875 0.13 4.5 21FLA 27010579 08/17/1993 2.21 25 0.995 0.15 1.98 21FLSJWMTR11 08/25/1993 24.8 0.906 2 21FLVEMDVC-079 09/08/1993 34.25 26.18 0.8915 2.8 4.8 21FLVEMDVC-077 09/08/1993 23.18 29.58 1.258 8.4 21FLVEMDVC-078 09/08/1993 2.53 24.35 0.519 4.2 3.6 21FLVEMDVC-077 10/04/1993 200.59 27.86 1.9815 0.33 20.4 21FLVEMDVC-078 10/04/1993 2.32 23.55 0.629 0.08 2.8 21FLVEMDVC-077 11/01/1993 4.49 21.18 0.389 0.06 1.2 21FLVEMDVC-078 11/01/1993 1 12.2 0.4115 0.15 1.6 21FLVEMDVC-079 12/06/1993 28.58 18.11 2.741 0.55 27.5 21FLVEMDVC-077 12/06/1993 4.49 21.56 1.703 0.23 14.8 21FLVEMDVC-078 12/06/1993 1 15.92 0.5315 0.02 2.7 21FLVEMDTR04 01/03/1994 1.025 16.235 0.5965 0.04 3.2 21FLVEMDVC-079 01/03/1994 16.71 21FLVEMDTR03 01/03/1994 4.49 16.53 0.672 0.04 1.6 21FLVEMDTR05 02/07/1994 3.1 18.3 1.7415 0.07 1.5 21FLVEMDTR04 02/07/1994 1.93 17.75 0.989 0.035 2.25 21FLVEMDTR03 02/07/1994 1.01 16.3 1.075 0.04 0.5 21FLSJWMTR11 02/10/1994 1.871 19.1 0.695 0.085 0 21FLA 27010579 02/15/1994 15.9 0.86 0.038 2.3 21FLVEMDTR04 03/07/1994 1.485 16.85 1.237 0.025 1.5 21FLVEMDTR05 03/07/1994 1.44 17.7 2.2415 0.08 0.5 21FLVEMDTR03 03/07/1994 1.35 17.1 1.425 0.11 1.5 21FLVEMDVC-079 04/04/1994 84.74 18 2.5815 0.42 10.5 21FLVEMDVC-078 04/04/1994 1 18 1.119 0.19 1 21FLVEMDVC-077 04/04/1994 4.85 20.6 1.416 0.13 1 21FLSJWMTR11 04/20/1994 1 22.1 0.804 0.108 3 21FLVEMDTR04 05/02/1994 1.16 23 1.221 0.085 1.75 21FLVEMDTR05 05/02/1994 12.02 23 1.576 0.19 8 21FLVEMDTR03 05/02/1994 15.07 26 1.513 0.1 2.5 21FLVEMDTR04 06/06/1994 1.51 24 0.9255 0.24 5.75 21FLVEMDTR03 06/06/1994 36.58 29 1.017 0.15 9

Final TMDL Report Tomoka River, WBID 2634, Nutrients
Florida Department of Environmental Protection
54
Station Sample Date Corr Chla
(µg/L)
Temp (oC)
TN (mg/l)
TP (mg/L)
TSS (mg/Ll)
21FLSJWMTR11 06/30/1994 1 26.7 0.834 0.065 5 21FLVEMDTR05 07/06/1994 1.99 25 3.383 0.19 0.5 21FLVEMDTR04 07/06/1994 1 25 1.5085 0.06 2 21FLVEMDTR03 07/06/1994 3.43 25 1.964 0.07 2 21FLVEMDTR04 08/01/1994 2.61 25 1.294 0.285 1.5 21FLVEMDTR05 08/01/1994 1.62 24 2.137 0.57 1 21FLVEMDTR03 08/01/1994 2.24 26 1.182 0.28 0.5 21FLA 27010579 08/23/1994 23.9 1.355 0.083 1.67 21FLSJWMTR11 08/24/1994 1.069 24.5 1.07 0.139 4 21FLVEMDTR05 09/07/1994 2.85 22 1.541 0.21 3 21FLVEMDTR04 09/07/1994 1.44 23 1.253 0.065 13 21FLVEMDTR03 09/07/1994 13.65 26 1.7 0.08 1 21FLSJWMTR11 09/28/1994 2.138 23.4 1.049 0.112 4 21FLVEMDTR05 10/03/1994 8.19 24 2.854 0.41 9 21FLVEMDTR04 10/03/1994 1 24 1.9105 0.16 2.3 21FLVEMDTR03 10/03/1994 1.03 24 1.482 0.08 2.5 21FLVEMDTR03 11/01/1994 1 22 0.631 0.42 0.8 21FLVEMDTR04 11/01/1994 1.96 22 0.365 0.425 2 21FLVEMDTR05 11/01/1994 4.33 22 1.712 0.19 3.5 21FLVEMDTR03 12/05/1994 1 21 2.3 0.08 1.8 21FLVEMDTR04 12/05/1994 1 21 2.681 0.065 2.15 21FLVEMDTR05 12/05/1994 1.63 21 1.182 0.16 3.5 21FLSJWMTR11 12/05/1994 1 21.4 3.001 0.066 1 21FLVEMDTR04 01/09/1995 1 10 2.404 0.035 3 21FLVEMDTR03 01/09/1995 1 13 1.946 0.05 4.3 21FLVEMDTR05 01/09/1995 1 11 1.152 0.02 0.4 21FLA 27010579 01/31/1995 11 1.87 0.039 21FLVEMDTR03 02/06/1995 1 11 1.398 0.07 4.7 21FLVEMDTR04 02/06/1995 1 9.5 1.45 0.085 6.95 21FLVEMDTR05 02/06/1995 5.21 9 1.102 0.03 2 21FLSJWMTR11 02/20/1995 6.237 16.9 1.55 0.139 55 21FLVEMDTR04 03/06/1995 2.35 18 1.6005 0.115 48.2 21FLVEMDTR05 03/06/1995 8.06 18 1.266 0.09 8 21FLVEMDTR03 03/06/1995 15.07 18 1.204 0.07 6 21FLVEMDTR04 04/03/1995 1 15 1.244 0.06 2.9 21FLVEMDTR05 04/03/1995 3 13 1.193 0.09 4.21 21FLVEMDTR03 04/03/1995 22.02 21 1.117 0.07 4.75 21FLSJWMTR11 04/24/1995 1.871 24.6 0.868 0.038 6 21FLVEMDTR04 05/01/1995 1.925 22 1.1115 0.035 3.9 21FLVEMDTR03 05/01/1995 13.73 26 1.012 0.07 2.5 21FLVEMDTR04 06/05/1995 4.2 25 1.141 0.015 15.75 21FLVEMDTR03 06/05/1995 6.71 29 1.183 0.14 8.5 21FLSJWM27010579 06/05/1995 1 25.7 0.951 0.093 38
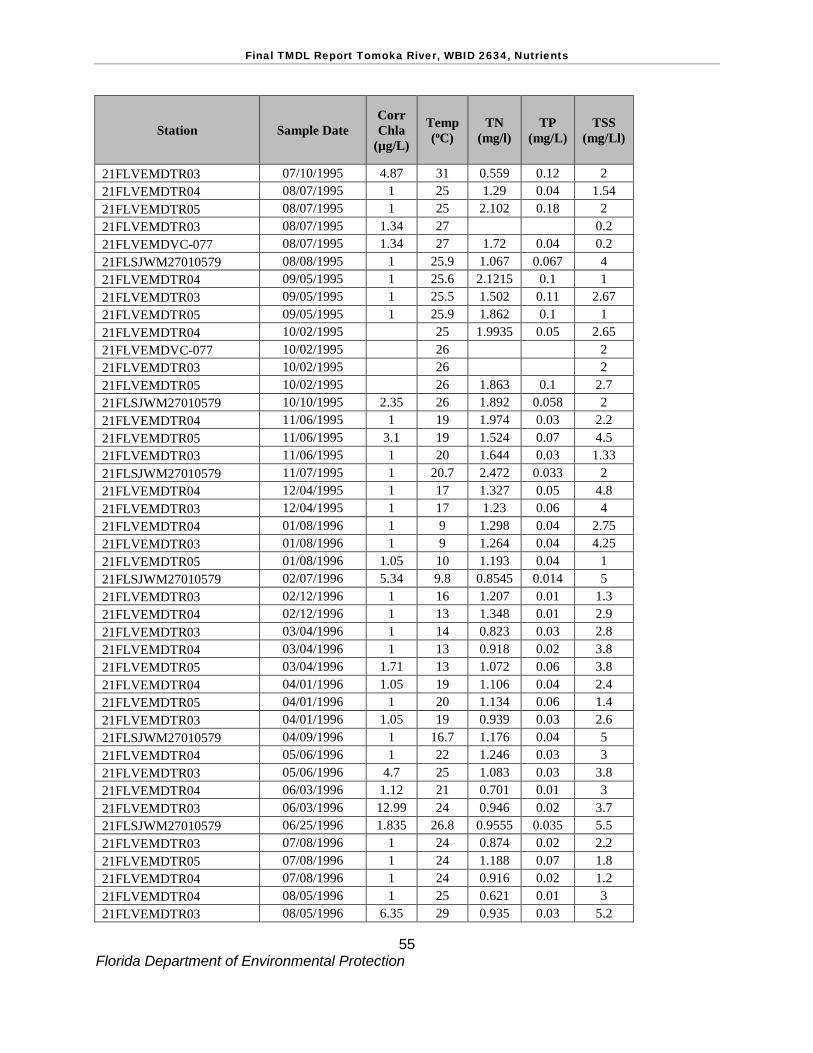
Final TMDL Report Tomoka River, WBID 2634, Nutrients
Florida Department of Environmental Protection
55
Station Sample Date Corr Chla
(µg/L)
Temp (oC)
TN (mg/l)
TP (mg/L)
TSS (mg/Ll)
21FLVEMDTR03 07/10/1995 4.87 31 0.559 0.12 2 21FLVEMDTR04 08/07/1995 1 25 1.29 0.04 1.54 21FLVEMDTR05 08/07/1995 1 25 2.102 0.18 2 21FLVEMDTR03 08/07/1995 1.34 27 0.2 21FLVEMDVC-077 08/07/1995 1.34 27 1.72 0.04 0.2 21FLSJWM27010579 08/08/1995 1 25.9 1.067 0.067 4 21FLVEMDTR04 09/05/1995 1 25.6 2.1215 0.1 1 21FLVEMDTR03 09/05/1995 1 25.5 1.502 0.11 2.67 21FLVEMDTR05 09/05/1995 1 25.9 1.862 0.1 1 21FLVEMDTR04 10/02/1995 25 1.9935 0.05 2.65 21FLVEMDVC-077 10/02/1995 26 2 21FLVEMDTR03 10/02/1995 26 2 21FLVEMDTR05 10/02/1995 26 1.863 0.1 2.7 21FLSJWM27010579 10/10/1995 2.35 26 1.892 0.058 2 21FLVEMDTR04 11/06/1995 1 19 1.974 0.03 2.2 21FLVEMDTR05 11/06/1995 3.1 19 1.524 0.07 4.5 21FLVEMDTR03 11/06/1995 1 20 1.644 0.03 1.33 21FLSJWM27010579 11/07/1995 1 20.7 2.472 0.033 2 21FLVEMDTR04 12/04/1995 1 17 1.327 0.05 4.8 21FLVEMDTR03 12/04/1995 1 17 1.23 0.06 4 21FLVEMDTR04 01/08/1996 1 9 1.298 0.04 2.75 21FLVEMDTR03 01/08/1996 1 9 1.264 0.04 4.25 21FLVEMDTR05 01/08/1996 1.05 10 1.193 0.04 1 21FLSJWM27010579 02/07/1996 5.34 9.8 0.8545 0.014 5 21FLVEMDTR03 02/12/1996 1 16 1.207 0.01 1.3 21FLVEMDTR04 02/12/1996 1 13 1.348 0.01 2.9 21FLVEMDTR03 03/04/1996 1 14 0.823 0.03 2.8 21FLVEMDTR04 03/04/1996 1 13 0.918 0.02 3.8 21FLVEMDTR05 03/04/1996 1.71 13 1.072 0.06 3.8 21FLVEMDTR04 04/01/1996 1.05 19 1.106 0.04 2.4 21FLVEMDTR05 04/01/1996 1 20 1.134 0.06 1.4 21FLVEMDTR03 04/01/1996 1.05 19 0.939 0.03 2.6 21FLSJWM27010579 04/09/1996 1 16.7 1.176 0.04 5 21FLVEMDTR04 05/06/1996 1 22 1.246 0.03 3 21FLVEMDTR03 05/06/1996 4.7 25 1.083 0.03 3.8 21FLVEMDTR04 06/03/1996 1.12 21 0.701 0.01 3 21FLVEMDTR03 06/03/1996 12.99 24 0.946 0.02 3.7 21FLSJWM27010579 06/25/1996 1.835 26.8 0.9555 0.035 5.5 21FLVEMDTR03 07/08/1996 1 24 0.874 0.02 2.2 21FLVEMDTR05 07/08/1996 1 24 1.188 0.07 1.8 21FLVEMDTR04 07/08/1996 1 24 0.916 0.02 1.2 21FLVEMDTR04 08/05/1996 1 25 0.621 0.01 3 21FLVEMDTR03 08/05/1996 6.35 29 0.935 0.03 5.2

Final TMDL Report Tomoka River, WBID 2634, Nutrients
Florida Department of Environmental Protection
56
Station Sample Date Corr Chla
(µg/L)
Temp (oC)
TN (mg/l)
TP (mg/L)
TSS (mg/Ll)
21FLSJWM27010579 08/07/1996 1 27.2 0.722 0.038 5 21FLVEMDTR03 09/03/1996 15.35 24 0.98 0.04 13 21FLA 27010579 09/09/1996 24.09 0.678 0.043 21FLVEMDTR05 10/07/1996 1 22 0.972 0.02 0.5 21FLVEMDTR04 10/07/1996 1.31 23 0.854 0.02 3 21FLSJWM27010579 10/14/1996 1.2 1.747 0.049 0 21FLVEMDTR03 11/04/1996 1 20 1.189 0.03 4 21FLVEMDTR04 11/04/1996 1 18 1.456 0.02 1.8 21FLVEMDTR04 12/02/1996 1 17 0.734 0.03 3 21FLVEMDTR03 12/02/1996 1 18 0.78 0.05 5 21FLSJWM27010579 12/18/1996 1 16.1 0.473 0.025 18 21FLVEMDTR03 01/06/1997 1 19 0.581 0.08 2.5 21FLVEMDTR03 02/03/1997 5.07 17 0.668 0.02 3 21FLSJWM27010579 02/04/1997 14.6 0.541 0.024 0 21FLVEMDTR03 03/03/1997 8.24 22 0.58 0.12 6 21FLSJWM27010579 04/28/1997 1 22 0.477 0.027 3 21FLVEMDTR03 05/05/1997 2.72 22 0.588 0.01 2 21FLVEMDTR03 06/02/1997 1.18 22 0.793 0.04 3.2 21FLSJWM27010579 06/02/1997 2.2 24.1 0.66 0.059 1 21FLVEMDTR04 07/07/1997 1 24 0.773 0.03 3 21FLVEMDTR05 08/04/1997 1.03 25 1.898 0.06 0.4 21FLVEMDTR04 08/04/1997 1.22 25 1.432 0.03 2.2 21FLSJWM27010579 08/13/1997 3.1 27.3 1.139 0.046 0 21FLVEMDTR05 09/08/1997 1 22 1.204 0.09 0.8 21FLVEMDTR04 09/08/1997 1 22 1.255 0.03 1.6 21FLSJWM27010579 09/09/1997 2 23.5 1.543 0.04 5 21FLVEMDTR04 10/06/1997 1 22 1.464 0.01 1.8 21FLSJWM27010579 10/06/1997 1 23.1 1.4435 0.0325 5 21FLVEMDTR04 11/03/1997 1 18 0.874 0.03 1.6 21FLVEMDTR05 11/03/1997 1.29 19 0.731 0.15 3.2 21FLVEMDTR03 12/01/1997 1 18.7 1.093 0.03 1.6 21FLVEMDTR04 12/01/1997 1 16.9 1.091 0.03 0.8 21FLSJWM27010579 12/01/1997 1 17.5 1.173 0.041 16 21FLVEMDTR03 01/05/1998 1 16 1.152 0.02 1.2 21FLVEMDTR04 01/05/1998 1 16 1.091 0.03 1.4 21FLVEMDTR05 01/05/1998 1 17 1.347 0.06 0.4 21FLSJWM27010579 01/12/1998 1 13.8 1.259 0.034 5 21FLVEMDTR03 02/02/1998 1 14 0.01 2.6 21FLVEMDTR04 02/02/1998 1 15 1.068 0.04 2.4 21FLVEMDTR05 02/02/1998 1 14 1.03 0.04 1.2 21FLVEMDTR03 03/02/1998 1 16.54 0.975 0.03 2.2 21FLVEMDTR04 03/02/1998 1 16.43 1.138 0.03 1.8 21FLVEMDTR05 03/02/1998 1 17.47 1.198 0.1 1.4

Final TMDL Report Tomoka River, WBID 2634, Nutrients
Florida Department of Environmental Protection
57
Station Sample Date Corr Chla
(µg/L)
Temp (oC)
TN (mg/l)
TP (mg/L)
TSS (mg/Ll)
21FLSJWM27010579 03/03/1998 1 14.8 1.244 0.0415 5 21FLVEMDTR04 04/06/1998 1 17.87 1.183 0.04 1.8 21FLVEMDTR03 04/06/1998 1 20.67 1.103 0.04 3.4 21FLVEMDTR05 04/06/1998 1 17.59 1.517 0.1 1.9 21FLSJWM27010579 04/20/1998 1 22.85 1.164 0.048 6 21FLVEMDTR04 05/04/1998 1.43 20.2 0.752 0.02 2.3 21FLVEMDTR03 05/04/1998 1 23.42 0.835 0.02 1.9 21FLVEMDTR03 06/01/1998 13.07 29.74 0.757 0.05 4.5 21FLSJWM27010579 06/10/1998 5.605 25.5 0.914 0.062 5 21FLVEMDTR03 07/06/1998 8.65 30.61 0.849 0.17 4.9 21FLVEMDTR04 08/03/1998 1 25.64 1.71 0.02 2.3 21FLVEMDTR03 08/03/1998 2.86 26.84 1.561 0.03 1.9 21FLA 27010579 08/31/1998 25.35 1.377 0.044 21FLVEMDTR04 09/08/1998 1 25.46 1.1234 0.07 1.9 21FLVEMDTR03 09/08/1998 1 26.54 0.994 0.09 1.6 21FLVEMDTR03 10/05/1998 1 25.29 1.572 0.02 1.6 21FLVEMDTR04 10/05/1998 1 25.36 1.706 0.02 1 21FLSJWM27010579 10/14/1998 1 23.6 1.846 0.041 4 21FLGW 3516 10/14/1998 1 23.6 1.846 0.041 4 21FLVEMDTR04 11/02/1998 1 20.18 0.05 1.8 21FLVEMDTR03 11/02/1998 1.55 21.32 1.368 0.05 2.2 21FLSJWM27010579 11/19/1998 22.5 1.134 0.038 4 21FLGW 3516 11/19/1998 1 22.5 1.134 0.038 4 21FLVEMDTR04 12/02/1998 1 19.75 0.821 0.03 1.9 21FLVEMDTR03 12/02/1998 23.94 19.72 0.804 0.04 3 21FLGW 3516 12/21/1998 1 18.6 0.624 0.03 4 21FLSJWM27010579 12/21/1998 1 18.6 0.624 0.03 4 21FLVEMDVC-078 01/04/1999 1 12.005 0.147 0.034 0.8 21FLVEMDVC-077 01/04/1999 1 15.005 0.517 0.05 1.3 21FLGW 3516 01/05/1999 1 9.4 0.502 0.023 4 21FLVEMDVC-077 02/01/1999 1.64 18.94 0.686 0.04 1 21FLVEMDVC-078 02/01/1999 1.45 0.64 0.03 1 21FLGW 3516 02/04/1999 3 20.5 0.639 0.041 5 21FLVEMDVC-078 03/01/1999 1.47 14.26 0.836 0.03 2 21FLVEMDVC-077 03/01/1999 1.77 16.38 0.784 0.05 2 21FLVEMDVC-079 03/01/1999 8.9 1.376 0.07 4.4 21FLGW 3516 03/15/1999 1 16.3 0.706 0.04 7 21FLVEMDVC-077 04/05/1999 12.44 25.36 0.613 0.05 2.6 21FLGW 3516 04/15/1999 1 21.9 0.687 0.042 11 21FLVEMDVC-077 05/03/1999 4.95 18.19 0.734 0.1 8.3 21FLGW 3516 05/06/1999 1 20.5 0.668 0.047 5 21FLGW 3516 06/02/1999 1 23.5 0.721 0.038 10 21FLVEMDVC-077 06/07/1999 15.6 28.57 0.787 0.12 4.1

Final TMDL Report Tomoka River, WBID 2634, Nutrients
Florida Department of Environmental Protection
58
Station Sample Date Corr Chla
(µg/L)
Temp (oC)
TN (mg/l)
TP (mg/L)
TSS (mg/Ll)
21FLVEMDVC-078 06/07/1999 21FLGW 3516 07/01/1999 2.67 21.1 0.737 0.049 4 21FLVEMDVC-078 07/06/1999 1.1 25.33 0.947 0.03 1.9 21FLVEMDVC-077 07/06/1999 3.2 25.76 0.908 0.03 1.4 21FLVEMDVC-079 08/02/1999 28.16 21FLVEMDVC-078 08/02/1999 1 27.14 0.702 0.04 1.8 21FLVEMDVC-077 08/02/1999 11.72 31 0.795 0.09 1.6 21FLGW 3516 08/04/1999 1 25.7 0.619 0.036 6 21FLVEMDVC-078 09/07/1999 1.3 24.49 0.766 0.04 1.2 21FLGW 3516 09/07/1999 1.28 24.3 0.66 0.032 5.5 21FLVEMDVC-077 09/07/1999 25.2 29.48 1.328 0.12 8.3 21FLVEMDVC-079 09/07/1999 21FLVEMDVC-078 10/04/1999 1.2 24.86 1.029 0.04 1.6 21FLVEMDVC-077 10/04/1999 1 25.07 1.624 0.04 3.2 21FLVEMDVC-079 10/04/1999 24.82 21FLGW 3516 10/20/1999 1.06 22.9 1.509 0.056 5 21FLVEMDVC-077 11/01/1999 1 21.9 1.792 0.06 1 21FLVEMDVC-078 11/01/1999 1 22.05 1.887 0.06 0.7 21FLVEMDVC-079 11/01/1999 2.6 21.82 2.24 0.14 1 21FLGW 3516 11/15/1999 1 18.1 1.318 0.028 5 21FLVEMDVC-078 12/06/1999 1 17.12 1.285 0.03 2 21FLVEMDVC-079 12/06/1999 16.46 21FLVEMDVC-077 12/06/1999 1 17.16 1.197 0.03 1.2 21FLGW 3516 12/16/1999 1.12 16.3 1.011 0.033 4 21FLVEMDVC-078 01/03/2000 1 14.4 1.105 0.01 3.2 21FLVEMDVC-077 01/03/2000 1 15.06 0.4975 0.465 0.7 21FLCEN 27010579 03/06/2000 0.742 21FLCEN 27010596 03/06/2000 1.404 21FLVEMDVC-077 04/03/2000 1.14 21.18 0.459 0.45 1.3 21FLVEMDVC-079 04/03/2000 1.4 20.93 1.625 0.12 1.8 21FLVEMDVC-078 04/03/2000 2.14 20.65 0.872 0.09 1.7 21FLVEMDVC-078 07/10/2000 1 24.4 0.714 0.02 2.6 21FLVEMDVC-077 07/10/2000 13.05 31.22 0.5075 0.495 4.4 21FLVEMDVC-077 10/02/2000 1 23.32 0.5155 0.495 1.3 21FLVEMDVC-079 10/02/2000 1 22.93 1.731 0.06 0.8 21FLVEMDVC-078 10/02/2000 1.16 22.93 1.054 0.04 1 21FLGW 3516 01/10/2001 1 7.3 0.429 0.037 4 21FLVEMDVC-078 02/05/2001 1 13.29 0.485 0.02 1 21FLVEMDVC-077 02/05/2001 2.24 17.39 0.2935 0.28 2.8 21FLGW 3516 02/06/2001 1 11.2 0.539 0.024 4 21FLGW 3516 03/08/2001 1 12.3 0.563 0.033 4 21FLGW 3516 04/03/2001 1 15.9 0.916 0.052 4 21FLGW 3516 05/02/2001 1 19.8 0.803 0.049 4

Final TMDL Report Tomoka River, WBID 2634, Nutrients
Florida Department of Environmental Protection
59
Station Sample Date Corr Chla
(µg/L)
Temp (oC)
TN (mg/l)
TP (mg/L)
TSS (mg/Ll)
21FLVEMDVC-078 05/07/2001 1 19.52 0.556 0.02 0.8 21FLVEMDVC-077 05/07/2001 14.39 23.59 0.4285 0.415 8.4 21FLGW 3516 06/06/2001 1 24.9 0.647 0.048 4 21FLGW 3516 07/09/2001 1 25.4 0.694 0.052 4 21FLVEMDVC-079 08/06/2001 1.65 24.6 1.911 0.07 2.5 21FLVEMDVC-077 08/06/2001 1.2 24.61 0.5475 0.505 7.5 21FLVEMDVC-078 08/06/2001 1.53 24.67 1.262 0.03 2.5 21FLGW 3516 08/09/2001 1.2 26 1.359 0.097 4 21FLGW 3516 09/05/2001 1 26.1 1.05 0.054 7 21FLGW 3516 10/02/2001 1 19.8 1.704 0.069 4 21FLVEMDVC-077 11/05/2001 1 22.08 0.7214 0.64 3.5 21FLVEMDVC-078 11/05/2001 1 21.09 1.534 0.01 2.2 21FLGW 3516 11/07/2001 1 18.8 1.377 0.038 4 21FLGW 3516 12/04/2001 1 19.8 1.424 0.052 4 21FLGW 3516 01/02/2002 1.7 12.4 1.188 0.046 4 21FLGW 3516 02/07/2002 1 17.4 1.058 0.045 5 21FLVEMDVC-079 03/04/2002 3.2 15.8 1.0486 0.04 1.2 21FLVEMDVC-078 03/04/2002 1.33 15.5 0.7959 0.05 7.2 21FLVEMDVC-077 03/04/2002 1 16.43 0.7782 0.06 11 21FLGW 3516 03/07/2002 1 14.3 0.909 0.035 4 21FLGW 3516 04/01/2002 1 21.4 0.899 0.054 6 21FLGW 3516 05/02/2002 1 22.8 0.73 0.045 4 21FLVEMDVC-078 06/03/2002 1.27 24.49 0.6775 0.02 3.8 21FLVEMDVC-077 06/03/2002 16.78 30 0.7533 0.08 5.6 21FLGW 3516 06/04/2002 1 25.5 0.648 0.05 4 21FLGW 3516 07/08/2002 1 25.4 1.425 0.093 4 21FLGW 3516 08/06/2002 1.7 26.1 1.43 0.069 4 21FLGW 3516 09/05/2002 1 25.5 1.556 0.05 4 21FLVEMDVC-078 09/09/2002 25.45 1.366 0.09 1.4 21FLVEMDVC-077 09/09/2002 1.59 25.83 1.367 0.07 2.4 21FLGW 3516 10/03/2002 1 24.5 1.432 0.047 4 21FLGW 3516 11/14/2002 1 17.4 0.852 0.027 4 21FLVEMDVC-078 12/02/2002 11.71 1.331 1.4 21FLVEMDVC-077 12/02/2002 10.77 17.15 1.337 2.4 21FLGW 3516 12/03/2002 1 12.2 0.669 0.019 4 21FLGW 3516 01/02/2003 1 15.7 1.019 0.1 4 21FLVEMDVC-078 02/03/2003 1 12.38 0.932 0.01 1.3 21FLGW 3516 02/03/2003 1 14.8 1.028 0.031 4 21FLVEMDVC-079 02/03/2003 11.47 21FLVEMDVC-077 02/03/2003 1.31 13.08 0.976 0.21 47 21FLWPB 20010739 03/12/2003 1 19.7 1.051 0.063 21FLWPB 20010740 03/12/2003 1 19.7 0.986 0.06 21FLGW 3516 03/19/2003 1 21.85 1.321 0.057 4

Final TMDL Report Tomoka River, WBID 2634, Nutrients
Florida Department of Environmental Protection
60
Station Sample Date Corr Chla
(µg/L)
Temp (oC)
TN (mg/l)
TP (mg/L)
TSS (mg/Ll)
21FLGW 3516 04/03/2003 1 18.52 1.312 0.049 4 21FLVEMDVC-078 05/05/2003 1 23.57 1.101 0.09 3.5 21FLVEMDVC-077 05/05/2003 7.07 26.51 1.071 0.09 5.5 21FLGW 3516 05/07/2003 1 24.5 1.05 0.066 4 21FLWPB 20010739 06/04/2003 1.36 23.7 0.79 0.044 21FLWPB 20010740 06/04/2003 5.94 24.9 0.85 0.052 21FLGW 3516 06/10/2003 1 25.48 0.804 0.053 4 21FLGW 3516 07/02/2003 1 25.3 1 0.044 4 21FLVEMDVC-079 08/04/2003 1.08 25.47 1.477 0.04 21FLVEMDVC-078 08/04/2003 1 25.56 1.255 0.03 1.8 21FLVEMDVC-077 08/04/2003 1 26.56 1.114 0.03 0 21FLGW 3516 08/05/2003 1 25.2 1.21 0.054 4 21FLCEN 27010579 08/06/2003 25.08 1.215 0.053 21FLWPB 20010740 08/13/2003 1.09 25.6 1.001 0.05 21FLWPB 20010739 08/13/2003 1.96 25.7 1.178 0.066 21FLWPB 20010739 08/26/2003 1 27 0.969 0.048 21FLWPB 20010740 08/26/2003 18.55 26.12 1 0.056 21FLGW 3516 09/02/2003 1 26.4 1.259 0.055 4 21FLWPB 20010739 09/15/2003 1 25.3 1.031 0.042 21FLWPB 20010740 09/15/2003 16.28 25.2 0.857 0.051 21FLGW 3516 10/02/2003 1 22.8 0.665 0.05 4 21FLWPB 20010739 10/09/2003 1 23.17 0.032 21FLWPB 20010740 10/09/2003 1 23.01 0.782 0.028 21FLVEMDVC-078 11/03/2003 1 23.08 0.03 1.9 21FLVEMDVC-077 11/03/2003 3.51 23.51 1.02 0.13 3.4 21FLVEMDVC-079 11/03/2003 23.12 21FLGW 3516 11/04/2003 1 24.81 1.112 0.049 4 21FLGW 3516 12/04/2003 1 17.96 1.02 0.032 4 21FLGW 3516 01/13/2004 1 11.2 0.806 0.02 4 21FLGW 3516 02/10/2004 1 17.12 0.72 0.028 4 21FLVEMDVC-078 03/01/2004 1 15.12 0.892 1.5 21FLVEMDVC-079 03/01/2004 1 15.09 1.006 0.05 1.2 21FLVEMDVC-077 03/01/2004 1 14.285 0.751 1.2 21FLGW 3516 03/08/2004 1 18.8 1.032 0.041 4 21FLGW 3516 04/05/2004 1 15.39 0.788 0.03 4 21FLGW 3516 05/10/2004 1 20.86 0.658 0.038 4 21FLGW 3516 06/02/2004 1 25.76 0.93 0.042 4 21FLVEMDVC-078 06/07/2004 1.67 23.34 0.623 0.02 2.5 21FLVEMDVC-077 06/07/2004 1.23 24.14 0.599 0.04 4.6 21FLGW 3516 07/06/2004 1 25.3 0.776 0.045 4 21FLGW 3516 08/09/2004 7.7 26.08 0.915 0.058 4 21FLGW 3516 09/01/2004 1.1 26.67 2.404 0.091 4 21FLGW 3516 10/05/2004 1.1 25.975 1.617 0.069 4

Final TMDL Report Tomoka River, WBID 2634, Nutrients
Florida Department of Environmental Protection
61
Station Sample Date Corr Chla
(µg/L)
Temp (oC)
TN (mg/l)
TP (mg/L)
TSS (mg/Ll)
21FLVEMDVC-078 10/11/2004 1 24.41 1.333 0.04 3 21FLVEMDVC-079 10/11/2004 6.82 24.52 1.317 0.04 2 21FLVEMDVC-077 10/11/2004 1 24.54 1.348 0.07 3.7 21FLGW 3516 11/08/2004 1 19.025 1.59 0.058 12 21FLGW 3516 12/01/2004 1 18.51 1.1 0.04 4 21FLVEMDVC-078 12/06/2004 15.96 1.064 0.04 1.5 21FLVEMDVC-077 12/06/2004 15.17 0.834 0.04 1 21FLGW 3516 01/04/2005 1 15.865 0.946 0.03 4 21FLCEN 27010830 01/31/2005 1.4 15.7 1.029 0.062 21FLCEN 27010574 01/31/2005 1.4 15 1.27 0.072 21FLCEN 27010579 01/31/2005 1.4 13.2 0.877 0.079 21FLCEN 27010075 01/31/2005 2.4 14.8 1.515 0.091 21FLCEN 27010596 01/31/2005 3.175 12.7 1.304 0.072 21FLGW 3516 02/01/2005 1 12.23 0.882 0.028 4 21FLVEMDVC-078 02/07/2005 1.01 14.99 0.86 0.06 3 21FLVEMDVC-077 02/07/2005 21.63 14.35 0.759 0.07 2.3 21FLGW 3516 03/02/2005 1 12.98 0.694 0.028 4 21FLGW 3516 04/04/2005 1 16.66 1.207 0.043 4 21FLCEN 27010579 04/07/2005 1.44 20.76 1.32 0.072 21FLCEN 27010596 04/07/2005 2.81 21.67 1.62 0.075 21FLCEN 27010075 04/07/2005 21.25 21FLCEN 27010830 04/07/2005 20.88 21FLWQSPVOL358LR 04/14/2005 20.02 21FLWQSPVOL358LR 04/19/2005 1 18.01 0.81 0.03 21FLVEMDVC-079 05/02/2005 20.46 21FLVEMDVC-078 05/02/2005 1 20.49 0.75 0.06 2.2 21FLGW 3516 05/02/2005 1 20.505 0.901 0.038 4 21FLVEMDVC-077 05/02/2005 2.3 21.19 0.746 0.05 2.7 21FLGW 3516 06/02/2005 1 23.74 0.865 0.045 4 21FLCEN 27010579 06/02/2005 2.92 23.9 0.932 0.069 21FLCEN 27010596 06/02/2005 6.17 23.8 1.204 0.079 21FLCEN 27010075 06/02/2005 23.3 21FLCEN 27010830 06/02/2005 23.8 21FLGW 3516 07/07/2005 1.2 27.87 1.336 0.059 4 21FLCEN 27010579 07/27/2005 1.52 26.2 21FLCEN 27010830 07/27/2005 5.56 25.8 21FLWQSPVOL358LR 07/29/2005 27.46 21FLGW 3516 08/02/2005 1.9 26.435 1.66 0.05 5 21FLWQSPVOL358LR 08/02/2005 1 26.065 1.94 0.04 21FLVEMDVC-077 08/08/2005 1.04 25.5 1.023 21FLVEMDVC-078 08/08/2005 1 26 1.06 21FLVEMDVC-079 08/08/2005 9.86 25.7 1.186 21FLGW 3516 09/12/2005 1.4 25.5 1.147 0.052 4

Final TMDL Report Tomoka River, WBID 2634, Nutrients
Florida Department of Environmental Protection
62
Station Sample Date Corr Chla
(µg/L)
Temp (oC)
TN (mg/l)
TP (mg/L)
TSS (mg/Ll)
21FLCEN 27010579 09/21/2005 1.4 26 1.031 0.031 21FLCEN 27010830 09/21/2005 1.4 25.9 1.122 0.044 21FLCEN 27010075 09/21/2005 25.7 21FLCEN 27010596 09/21/2005 25.81 21FLGW 3516 10/06/2005 5.6 25.735 0.898 0.05 4 21FLSJWMNCBTR05 10/26/2005 1 16.36 0.9274 0.0379 5 21FLGW 3516 11/02/2005 1.2 19.765 0.988 0.051 4 21FLSJWMNCBTR05 11/07/2005 1.3083 21 1.178 0.0751 5 21FLVEMDVC-077 11/07/2005 1 20.09 0.03 28 21FLVEMDVC-078 11/07/2005 1 19.96 0.02 1.8 21FLVEMDVC-079 11/07/2005 1.42 20.46 0.06 1 21FLCEN 27010579 11/15/2005 1.4 19.7 0.992 0.0215 21FLCEN 27010830 11/15/2005 1.4 20.9 0.9 0.024 21FLCEN 27010596 11/15/2005 20.1 21FLSJWMNCBTR05 12/05/2005 1.2905 15.93 1.1608 0.0291 5 21FLGW 3516 12/06/2005 1 17.65 0.907 0.035 4 21FLWQSPVOL358LR 12/15/2005 14.42 21FLWQSPVOL358LR 12/19/2005 1.1 15.37 0.84 0.02 21FLGW 3516 01/04/2006 1 16.52 0.806 0.036 4 21FLSJWMNCBTR05 01/09/2006 1 8.63 1.1329 0.0279 5 21FLVEMDVC-078 01/09/2006 1 10.36 0.02 1.3 21FLVEMDVC-079 01/09/2006 9.46 21FLVEMDVC-077 01/09/2006 1 10.01 0.677 0.02 1.3 21FLSJWMNCBTR05 02/01/2006 1.1481 13 0.8403 0.0386 5 21FLGW 3516 02/01/2006 1 12.7 0.893 0.036 4 21FLGW 3516 03/07/2006 1 16.04 0.995 0.033 4 21FLCEN 27010579 03/29/2006 1.4 15.2 0.69 0.042 21FLVEMDVC-078 04/03/2006 1 19.51 0.05 2.4 21FLGW 3516 04/03/2006 1 20.145 0.68 0.048 4 21FLVEMDVC-077 04/03/2006 3.08 21.63 0.51 0.08 7.6 21FLGW 3516 05/01/2006 1 19.99 0.702 0.045 4 21FLGW 3516 06/01/2006 1 24.97 1.066 0.08 12 21FLVEMDVC-078 07/10/2006 1 25.11 0.05 2.8 21FLGW 3516 07/10/2006 1 24.675 0.726 0.05 4 21FLVEMDVC-077 07/10/2006 28.48 27.37 0.688 0.09 3.2 21FLGW 3516 08/02/2006 1 26.27 0.667 0.05 5 21FLGW 3516 09/06/2006 1 25.55 0.774 0.052 4 21FLVEMDVC-078 10/02/2006 21.94 0.04 2.5 21FLVEMDVC-077 10/02/2006 28.97 0.71 0.1 3.9 21FLGW 3516 10/03/2006 1 22.62 0.62 0.024 4 21FLGW 3516 11/02/2006 1.7 20.655 0.584 0.034 4 21FLGW 3516 12/04/2006 1 19.79 0.504 0.068 5 21FLGW 3516 01/03/2007 1 18.73 0.608 0.038 4

Final TMDL Report Tomoka River, WBID 2634, Nutrients
Florida Department of Environmental Protection
63
Station Sample Date Corr Chla
(µg/L)
Temp (oC)
TN (mg/l)
TP (mg/L)
TSS (mg/Ll)
21FLGW 3516 02/01/2007 1 14.03 0.541 0.029 4 21FLVEMDVC-078 02/05/2007 1 13.03 0.03 1.1 21FLVEMDVC-077 02/05/2007 1 14.12 0.5 0.04 1.3 21FLGW 3516 03/06/2007 1 13.87 0.611 0.034 4 21FLGW 3516 04/02/2007 1.9 19.705 0.682 0.053 4 21FLGW 3516 05/03/2007 1 21.155 0.673 0.051 4 21FLVEMDVC-078 05/07/2007 1.83 19.6 3 21FLVEMDVC-077 05/07/2007 2.2 24.86 0.868 2.3 21FLGW 3516 06/06/2007 1.1 23.97 0.742 0.043 4 21FLGW 3516 07/05/2007 2.5 25.06 1.017 0.07 4 21FLGW 3516 07/30/2007 1 26.195 0.788 0.056 4 21FLVEMDVC-078 08/06/2007 1 26.79 0.774 0.04 1.5 21FLVEMDVC-077 08/06/2007 28.33 0.02 0.7 21FLGW 3516 09/05/2007 1.9 25.36 1.027 0.057 6 21FLGW 3516 10/04/2007 1 26.31 1.236 0.081 4 21FLGW 3516 11/01/2007 1.4 23.43 0.959 0.05 7 21FLVEMDVC-078 11/05/2007 1 17.76 0.52 0.01 1.6 21FLVEMDVC-077 11/05/2007 1.35 19.65 0.727 0.02 1.7 21FLGW 3516 12/03/2007 1 20.11 0.786 0.045 4 21FLGW 3516 01/02/2008 1 13.705 0.847 0.061 4 21FLSJWMNCBTR06 01/14/2008 1 16.56 0.6846 0.0388 5 21FLSJWMNCBTR06 02/04/2008 1 21.3 0.7539 0.0409 5 21FLVEMDVC-078 02/04/2008 1 18.09 0.483 0.04 2.9 21FLGW 3516 02/04/2008 1 18.945 0.708 0.046 4 21FLVEMDVC-077 02/04/2008 1.61 19.31 0.854 0.06 2.2 21FLVEMDVC-TR6 02/04/2008 0.02 1.6 21FLGW 3516 03/03/2008 1 15.11 0.666 0.042 10 21FLSJWMNCBTR06 03/10/2008 1.4685 16.98 0.8582 0.054 5 21FLGW 3516 04/02/2008 1.5 20.375 0.671 0.056 4 21FLSJWMNCBTR06 04/14/2008 1 15.7 0.7878 0.0493 5 21FLSJWMNCBTR06 05/05/2008 13.795 24.4 0.9605 0.0926 5 21FLVEMDVC-077 05/05/2008 13.71 25.75 0.734 0.14 6.9 21FLGW 3516 05/06/2008 1 20.12 0.612 0.047 4 21FLCEN 27010579 05/20/2008 2.4 23.6 0.748 0.13 12 21FLGW 34941 05/27/2008 14 27.63 0.866 0.11 21FLGW 34950 05/27/2008 22 27.88 1.116 0.12 21FLGW 34943 05/27/2008 17 27.84 1.017 0.12 21FLGW 34930 05/27/2008 18 27.87 0.911 0.12 21FLGW 34940 05/27/2008 19 27.57 0.911 0.11 21FLGW 34945 05/27/2008 12 27.39 0.974 0.12 21FLGW 34947 05/27/2008 10 27.295 0.937 0.11 21FLGW 34949 05/27/2008 15 27.145 0.963 0.11 21FLGW 34933 05/27/2008 11 27.055 0.966 0.12

Final TMDL Report Tomoka River, WBID 2634, Nutrients
Florida Department of Environmental Protection
64
Station Sample Date Corr Chla
(µg/L)
Temp (oC)
TN (mg/l)
TP (mg/L)
TSS (mg/Ll)
21FLGW 34934 05/27/2008 7 27.145 0.9 0.12 21FLGW 34932 05/27/2008 9.4 27.395 0.936 0.11 21FLGW 34939 05/27/2008 10 27.335 0.844 0.1 21FLGW 34937 05/28/2008 2.6 27.155 1.069 0.3 21FLGW 34931 05/28/2008 2.1 27.055 0.942 0.29 21FLGW 34946 05/28/2008 10 28.195 0.972 0.21 21FLGW 34944 05/28/2008 4.4 28.37 0.97 0.22 21FLGW 34942 05/28/2008 7.3 28.035 0.856 0.16 21FLGW 34935 05/28/2008 23 28.33 1.149 0.23 21FLGW 34929 05/28/2008 28 28.255 1.053 0.17 21FLGW 34938 05/28/2008 22 28.035 0.899 0.13 21FLGW 34936 05/28/2008 19 27.875 0.968 0.12 21FLGW 3516 06/03/2008 1.4 23.825 0.644 0.05 4 21FLGW 34948 06/16/2008 1 24.29 0.826 0.082 21FLGW 34951 06/17/2008 4.5 29.47 1.329 0.26 21FLGW 34957 06/17/2008 49 29.695 1.418 0.3 21FLGW 34955 06/17/2008 65 30.685 1.508 0.27 21FLGW 34954 06/19/2008 98 30.12 1.608 0.29 21FLGW 34952 06/19/2008 120 31.14 1.614 0.28 21FLGW 34953 06/19/2008 450 30.1 4.308 0.97 21FLGW 34958 06/19/2008 210 30.22 1.808 0.37 21FLGW 34956 06/19/2008 48 30.71 1.316 0.22 21FLGW 3516 07/01/2008 2 24.01 21FLSJWMNCBTR06 07/15/2008 5.8073 27.24 1.0223 0.0714 5.5 21FLGW 3516 08/04/2008 1 25.92 1.352 0.071 4 21FLSJWMNCBTR06 08/04/2008 1 27.6 5 21FLVEMDVC-078 08/04/2008 1 25.53 1.782 0.05 14 21FLVEMDVC-077 08/04/2008 2.47 26.08 1.716 0.06 1 21FLGW 3516 09/03/2008 1 26.78 3.53 0.13 4 21FLSJWMNCBTR06 09/09/2008 1 27.55 3.6308 0.1313 5 21FLGW 34921 09/15/2008 1 26.21 4.52 0.3 21FLGW 3516 09/30/2008 1 24.29 4.05 0.09 5 21FLSJWMNCBTR06 10/15/2008 1 24.8 3.7495 0.0696 5 21FLSJWMNCBTR06 11/03/2008 1 20.2 3.8434 0.0623 5 21FLGW 3516 11/03/2008 1 19.11 2.51 0.039 4 21FLVEMDVC-078 11/04/2008 1 19.41 0.04 2.2 21FLVEMDVC-077 11/04/2008 1 19.84 0.05 2.5 21FLCEN 27010579 11/06/2008 1 18.6 3.04 0.14 4 21FLGW 3516 12/02/2008 1 13.76 1.66 0.027 4 21FLSJWMNCBTR06 12/10/2008 1 19.18 3.3076 0.0415 6.5 21FLGW 3516 12/30/2008 1 16.06 1.047 0.041 4 21FLSJWMNCBTR06 01/07/2009 1 18.27 1.1551 0.0335 5 21FLA 27010924 01/13/2009 1.6 15.8

Final TMDL Report Tomoka River, WBID 2634, Nutrients
Florida Department of Environmental Protection
65
Station Sample Date Corr Chla
(µg/L)
Temp (oC)
TN (mg/l)
TP (mg/L)
TSS (mg/Ll)
21FLA 27010578 01/13/2009 2 17.8 21FLA 27010429FLA 01/13/2009 7.5 18.4 21FLA 27010923 01/13/2009 13 18.2 21FLVEMDVC-078 02/02/2009 2.25 13.77 0.03 1.8 21FLSJWMNCBTR06 02/02/2009 4.2275 14.3 0.8188 0.037 3 21FLVEMDVC-077 02/02/2009 17.92 13.43 0.04 6.8 21FLGW 3516 02/03/2009 2.8 13.395 0.92 0.035 4 21FLA 27010924 02/11/2009 1.8 14.3 21FLA 27010578 02/11/2009 4.1 17.1 21FLA 27010923 02/11/2009 8 17.3 21FLA 27010429FLA 02/11/2009 7.7 17.8 21FLSJWMNCBTR06 03/04/2009 1 18.9 0.7857 0.0341 5 21FLGW 3516 03/04/2009 1.6 12.445 0.698 0.09 4 21FLGW 3516 04/01/2009 1.1 19.72 0.92 0.12 4 21FLA 27010924 04/14/2009 3.9 19.33 21FLA 27010578 04/14/2009 3.7 24.01 21FLA 27010923 04/14/2009 8.5 23.5 21FLA 27010429FLA 04/14/2009 9.2 23.93 21FLSJWMNCBTR06 04/15/2009 2.5899 21.1 0.7986 0.0472 5 21FLVEMDVC-077 05/04/2009 10.46 27 0.26 11.7 21FLGW 3516 05/05/2009 1.1 22.225 0.998 0.54 4 21FLGW 3516 06/02/2009 1 24.935 2.108 0.089 4 21FLSJWMNCBTR06 06/16/2009 1.2015 26.39 2.3077 0.0472 5 21FLGW 3516 07/07/2009 3.3 26.385 1.66 0.071 5 21FLA 27010429FLA 07/15/2009 3.3 26.29 21FLA 27010923 07/15/2009 20 28.62 21FLA 27010578 07/15/2009 1.4 25.76 21FLA 27010924 07/15/2009 2.7 25.37 21FLSJWMNCBTR06 07/20/2009 1.7889 25.05 2.2476 0.1066 5 21FLSJWMNCBTR06 08/03/2009 1 27.8 0.0442 5 21FLVEMDVC-078 08/03/2009 1.65 27.76 0.05 2.6 21FLVEMDVC-077 08/03/2009 3.27 26.96 0.05 2.8 21FLGW 3516 08/04/2009 1 26.035 2.19 0.066 5 21FLGW 3516 09/03/2009 1.7 24.74 1.143 0.051 6 21FLSJWMNCBTR06 09/08/2009 16.688 26.4 1.5032 0.1615 5 21FLSJWMNCBTR06 09/09/2009 21FLA 27010923 09/16/2009 29.5 21FLGW 3516 10/06/2009 1 24.3 1.51 0.042 5 21FLSJWMNCBTR06 10/07/2009 3.5817 25.5 2.1026 0.0727 4 21FLA 27010924 10/08/2009 1 25.4 21FLA 27010578 10/08/2009 1 25.2 21FLA 27010429FLA 10/08/2009 2.8 26.9 21FLA 27010923 10/08/2009 26 28.5

Final TMDL Report Tomoka River, WBID 2634, Nutrients
Florida Department of Environmental Protection
66
Station Sample Date Corr Chla
(µg/L)
Temp (oC)
TN (mg/l)
TP (mg/L)
TSS (mg/Ll)
21FLSJWMNCBTR06 11/02/2009 356.85 23.4 3.4203 0.2731 22 21FLVEMDVC-078 11/02/2009 1 22.16 0.04 1.3 21FLVEMDVC-077 11/02/2009 7.52 23.03 0.05 1.4 21FLGW 3516 11/04/2009 1 21.045 0.793 0.028 4 21FLGW 3516 12/02/2009 1 17.265 0.697 0.03 4 21FLA 27010924 12/09/2009 21.2 21FLA 27010923 12/09/2009 21.83 21FLA 27010429FLA 12/09/2009 20.2 21FLCEN 27010579 12/09/2009 1.1 20.6 0.69 0.03 4 21FLSJWMNCBTR06 12/28/2009 3.204 13.91 0.0519 2.5 21FLGW 3516 01/07/2010 1 5.9 0.679 0.025 4 21FLSJWMNCBTR06 01/11/2010 1 6.24 0.837 0.0319 1.45 21FLSJWMNCBTR06 02/01/2010 3.0371 15.26 0.986 0.0248 1.45 21FLGW 3516 02/10/2010 3.8 12.39 0.971 0.033 4 21FLSJWMNCBTR06 03/01/2010 2.1761 14.9 1.381 0.0189 1.45 21FLVEMDVC-078 03/01/2010 1.34 12.27 0.02 0.8 21FLVEMDVC-077 03/01/2010 1 11.53 0.01 1.2 21FLGW 3516 03/04/2010 1.7 10.655 1.004 0.019 4 21FLSJWMNCBTR06 04/05/2010 1 20.9 1.5966 0.0425 1.45 21FLVEMDVC-077 04/05/2010 1 19.54 0.03 1.58 21FLVEMDVC-078 04/05/2010 1.6 19.36 0.03 1.89 21FLGW 3516 04/07/2010 1.3 19.58 1.453 0.053 4 21FLSJWMNCBTR06 05/03/2010 1 26.2 1.6284 0.0529 2.9 21FLGW 3516 05/04/2010 1 24.6 1.05 0.052 4 21FLGW 3516 06/02/2010 3.3 24.71 0.791 0.048 4 21FLSJWMNCBTR06 06/08/2010 2.4297 27.76 0.8234 0.0363 2.9 21FLGW 3516 07/06/2010 1 24.83 0.791 0.042 4 21FLSJWMNCBTR06 07/12/2010 75.962 27.4 1.5276 0.0923 6.5 21FLVEMDVC-078 07/12/2010 2.44 26.15 1.32 0.07 5.3 21FLVEMDVC-077 07/12/2010 12.15 29.87 2.254 0.26 5.1 21FLGW 3516 08/02/2010 1 26.08 1 0.16 4 21FLSJWMNCBTR06 08/02/2010 1.869 28.4 1.465 0.0581 2.9 21FLCEN 27010579 08/09/2010 1 26.9 0.86 0.093 21FLGW 3516 09/02/2010 1.8 24.59 2.02 0.068 20 21FLSJWMNCBTR06 09/13/2010 1 27.6 2.0339 0.046 3.5 21FLSJWMNCBTR06 10/04/2010 1 21.05 0.9308 0.0448 2.9 21FLVEMDVC-078 10/04/2010 1 20.46 0.25 1.3 21FLVEMDVC-077 10/04/2010 51.34 28.2 0.1 3.3 21FLGW 3516 10/06/2010 1 19.16 0.849 0.12 23 21FLGW 3516 11/02/2010 1 20.03 0.738 0.28 4 21FLSJWMNCBTR06 11/03/2010 29.682 23.2 1.0616 0.0826 5 21FLGW 3516 12/02/2010 2.2 12.755 0.78 0.47 4 21FLSJWMNCBTR06 12/15/2010 1.4377 8.8 0.6599 0.0291 4.5

Final TMDL Report Tomoka River, WBID 2634, Nutrients
Florida Department of Environmental Protection
67
Station Sample Date Corr Chla
(µg/L)
Temp (oC)
TN (mg/l)
TP (mg/L)
TSS (mg/Ll)
21FLGW 3516 01/04/2011 1 12.15 0.659 0.12 4 21FLSJWMNCBTR06 01/10/2011 1 15.5 0.6882 0.0362 3.5 21FLVEMDVC-078 01/10/2011 1 13.39 1.276 0.18 0.5 21FLVEMDVC-077 01/10/2011 18.06 15.52 3.819 0.16 2.6 21FLGW 3516 02/02/2011 1.1 16.92 0.564 0.032 4 21FLSJWMNCBTR06 02/09/2011 1.068 15.6 0.6331 0.05 2.9 21FLGW 3516 03/02/2011 1.1 18.02 0.654 0.06 4 21FLSJWMNCBTR06 03/16/2011 1 17.7 0.6023 0.031 2.9 21FLGW 3516 04/05/2011 3.4 20.48 0.76 0.057 4 21FLSJWMNCBTR06 04/06/2011 1.1748 18.1 0.958 0.0323 2.9 21FLVEMDVC-078 04/11/2011 1 21.88 21FLVEMDVC-077 04/11/2011 17.86 24.97 21FLGW 3516 05/03/2011 1.5 21.68 0.848 0.079 4 21FLSJWMNCBTR06 05/11/2011 21.467 26.7 1.2494 0.0814 5 21FLGW 3516 06/06/2011 1.7 23.92 0.831 0.074 6 21FLGW 3516 07/05/2011 1.2 26.065 0.832 0.057 4 21FLVEMDVC-078 07/11/2011 3.67 26.09 0.762 0.05 1.6 21FLSJWMNCBTR06 07/11/2011 3.7647 27.8 0.9147 0.0669 2.9 21FLVEMDVC-077 07/11/2011 16.92 26.3 4.357 0.09 2.2 21FLSJWMNCBTR06 08/03/2011 2.3763 28.6 0.8417 0.0504 5.8 21FLGW 3516 08/03/2011 1.4 25.685 0.864 0.053 5 21FLSJWMNCBTR06 09/07/2011 1 26.8 0.7362 0.0571 2.9 21FLVEMDVC-078 10/03/2011 1 20 0.742 0.02 0.7 21FLVEMDVC-077 10/03/2011 17.1 26.04 2.058 0.02 1.2

Final TMDL Report Tomoka River, WBID 2634, Nutrients
Florida Department of Environmental Protection
68
Appendix C: LSPC Modeling Methodology, Daytona Watershed An LSPC model was utilized to estimate the nutrient loads within and discharge from the Daytona watershed, which included loads from Guana, Pellicer, and Tomoka Rivers. The Loading Simulation Program in C++ (LSPC) is a watershed modeling system that includes streamlined Hydrologic Simulation Program Fortran (HSPF) algorithms for simulating hydrology, sediment, and general water quality as well as a simplified stream fate and transport model. LSPC is derived from the Mining Data Analysis System (MDAS), which was originally developed by USEPA Region 3 (under contract with Tetra Tech) and has been widely used for TMDLs. In 2003, the USEPA Region 4 contracted with Tetra Tech to refine, streamline, and produce user documentation for the model for public distribution. LSPC was developed to serve as the primary watershed model for the USEPA TMDL Modeling Toolbox. LSPC was used to simulate runoff (flow, biological oxygen demand, total nitrogen, total phosphorus and dissolved oxygen) from the land surface using a daily timestep for current and natural conditions. LSPC provided tributary flows and temperature to the EFDC estuary models and tributary water quality concentrations to WASP7 estuary models. In order to evaluate the contributing sources to a waterbody and to represent the spatial variability of these sources within the watershed model, the contributing drainage area was represented by a series of sub-watersheds for each of the models. The sub-watersheds for the Daytona Watershed model were developed using the 12-digit hydrologic unit code (HUC12) watershed data layer and the Geological Survey (USGS) National Hydrograph Dataset (NHD) (Figure 1.1).
The LSPC model has a representative reach defined for each sub-watershed, and the main channel stem within each sub-watershed was used as the representative reach. The characteristics for each reach included the length and slope of the reach, the channel geometry and the connectivity between the sub-watersheds. Length and slope data for each reach were obtained using the USGS DEM and NHD data.
The attributes supplied for each reach were used to develop a function table (FTABLE) that describes the hydrology of the stream reach by defining the functional relationship between water depth, surface area, water volume, and outflow in the segment. The assumption of a fixed depth, area, volume, outflow relationship rules out cases where the flow reverses direction or where one reach influences another upstream of it in a time-dependent way. The watershed model uses land use data as the basis for representing hydrology and nonpoint source loadings. The FDEP Level III Florida Land Use, specifically the St. Johns River Water Management District (SJRWMD) 2004 dataset, was used to determine the land use representation. The National Landuse Coverage Dataset (NLCD) was used to develop the impervious land use representations.

Final TMDL Report Tomoka River, WBID 2634, Nutrients
Florida Department of Environmental Protection
69
Figure 1.1 LSPC sub-watershed boundaries for the Daytona Watershed

Final TMDL Report Tomoka River, WBID 2634, Nutrients
Florida Department of Environmental Protection
70
The SJRWMD coverage utilized a variety of land use classes which were grouped and re-classified into 18 land use categories: beaches/dune/mud, open water, utility swaths, developed open space, developed low intensity, developed medium intensity, developed high intensity, clear-cut/sparse, quarries/strip mines, deciduous forest, evergreen forest, mixed forest, golf courses, pasture, row crop, forested wetland, non-forested wetland (salt/brackish), and non-forested wetland (freshwater). The LSPC model requires division of land uses in each sub-watershed into separate pervious and impervious land units. The NLCD 2006 percent impervious coverage was used to determine the percent impervious area associated with each land use category. Any impervious areas associated with utility swaths, developed open space, and developed low intensity, were grouped together and placed into a new land use category named low intensity development impervious. Impervious areas associated with medium intensity development and high intensity development were kept separate and placed into two new categories for medium intensity development impervious and high intensity development impervious, respectively. Finally, any impervious area not already accounted for in the three developed impervious categories, were grouped together into a fourth new category for all remaining impervious land use (Figure 1.2). Soil data for the Florida watersheds was obtained from the Soil Survey Geographic Database (SSURGO). The database was produced and distributed by the Natural Resources Conservation Service (NRCS). The SSURGO data was used to determine the total area that each hydrologic soil group covered within each sub-watershed. The sub-watersheds were represented by the hydrologic soil group that had the highest percentage of coverage within the boundaries of the sub-watershed. There dominant soil groups in Daytona are D and D-type soils (B/D), which have a high water table due to characteristics such as slow infiltration rates or shallow soils over an impervious layer (Figure 1.3). Facilities permitted under the National Pollutant Discharge Elimination System (NPDES) are, by definition, considered point sources. The NPDES geographic information system (GIS) coverages, provided by FDEP were adopted as the starting point for the evaluation of point sources for the Florida watershed models and reflected discharges as of December 2009. In areas where data was incomplete, data from EPA-PCS was used. Following data collection, any remaining gaps in the data that were three months or less were filled by averaging data from before and after gap months. If the gaps in the data were larger than three months the long term average was supplied. Stormwater discharges, such as MS4s, were not input directly into the model but were assumed to be included in the urban land use loading. Point sources that were designated as reuse facilities were not input directly into the model, but were accounted for in the adjustment of the hydrologic calibration parameters. Point sources directly discharging to the Daytona Watershed that were included in the watershed model are shown in Figure 1.4. In the watershed models, nonpoint source loadings and hydrological conditions are dependent on weather conditions. Hourly data from weather stations within the boundaries of, or in close proximity to, the sub-watersheds were applied to the watershed model. A weather data forcing file was generated in ASCII format (*.air) for each meteorological station used in the hydrological evaluations in LSPC. Each meteorological station file contained atmospheric data used in modeling the hydrological processes. These data included precipitation, air temperature, dew point temperature, wind speed, cloud cover, evaporation, and solar radiation. These data are used directly, or calculated from the observed data. The Daytona Watershed model weather stations contained data from 1996 through 2009.

Final TMDL Report Tomoka River, WBID 2634, Nutrients
Florida Department of Environmental Protection
71
Figure 1.2 Re-classified SJRWMD 2004 land use coverage of the Daytona watershed.

Final TMDL Report Tomoka River, WBID 2634, Nutrients
Florida Department of Environmental Protection
72
Figure 1.3 Hydrologic soils group for the Daytona Watershed

Final TMDL Report Tomoka River, WBID 2634, Nutrients
Florida Department of Environmental Protection
73
Figure 1.4 Point Sources included in the Daytona Watershed Model

Final TMDL Report Tomoka River, WBID 2634, Nutrients
Florida Department of Environmental Protection
74
Table 1.1 Meteorological stations used in the Daytona watershed model. Station
ID LSPC
ID Station Name Elevation County Latitude Longitude 082150 1 Daytona Beach 29 Volusia, FL 29.1903 -81.0636 082158 2 Daytona Beach Intl Airport 31 Volusia, FL 29.1828 -81.0483 084366 3 Jacksonville Beach 10 Duval, FL 30.2900 -81.3922 086767 4 Palm Coast 6 NE 5 Flagler, FL 29.6347 -81.2061 087826 5 St. Augustine Lighthouse 12 St. Johns FL 29.8875 -81.2917 The calibration of the LSPC watershed hydrology model involved comparing simulated stream flows to the USGS flow stations. The calibration of the hydrologic parameters was performed from January 1, 1997 through December 31, 2009. The best available gages were used as hydrology calibration stations. LSPC’s algorithms are identical to those in the Hydrologic Simulation Program FORTRAN (HSPF). The LSPC/HSPF modules used to represent watershed hydrology include PWATER (water budget simulation for pervious land units) and IWATER (water budget simulation for impervious land units). A detailed description of relevant hydrological algorithms is presented in the HSPF (v12) User’s Manual (Bicknell et al. 2004). Calibration parameters were adjusted within the BASINS Technical Note 6 typical minimum and maximum ranges for both hydrologic soil group and land use. Parameters were not adjusted outside the possible minimum and maximum ranges. To calibrate, information on the watersheds’ topography, geology, climate, land use, and anthropogenic influences was researched. Parameters were adjusted within reasonable constraints until an acceptable agreement was achieved between simulated and observed stream flow. Model parameters adjusted included: evapo-transpiration, infiltration, upper and lower zone storage, ground water storage, losses to the deep ground water system, and Manning’s roughness coefficient “n.” A rating system was applied to the calibration and validations stations to determine the overall calibration success. A weighted score was assigned to simulated verse observed errors, with total flow, storm flow, and low flow volumes having the greatest weight. The summation of the weighted scores was assigned a qualitative descriptor of Very Good (VG), Good (G), Fair (F), or Poor (P). The highest possible score was 80 and the lowest possible score was 20. Scores from 80-76 were rated as VG, 75-56 G, 55-36 F, and 35-20 P. Hydrologic calibration results are presented in Figure 1.5 through 1.10 and Tables 1.2 and 1.3.

Final TMDL Report Tomoka River, WBID 2634, Nutrients
Florida Department of Environmental Protection
75
0500
100015002000250030003500400045005000
Jan-97 Jul-98 Jan-00 Jul-01 Jan-03 Jul-04 Jan-06 Jul-07 Jan-09
Date
Flow
(cfs
)
0
2
4
6
8
10
12
14
Dai
ly R
ainf
all (
in.)
Avg Daily Rainfall (in.)Avg Observed Flow (1/1/1997 to 12/31/2009 )Avg Modeled Flow (Same Period)
Figure 1.5 Mean daily flow: Model Outlet 120015 vs. USGS 02247510
Tomoka River near Holly Hill, FL.
0
200
400
600
800
1000
J-97 J-98 J-00 J-01 J-03 J-04 J-06 J-07 J-09
Month
Flow
(cfs
)
0
5
10
15
20
25
Mon
thly
Rai
nfal
l (in
.)
Avg Monthly Rainfall (in.)Avg Observed Flow (1/1/1997 to 12/31/2009 )Avg Modeled Flow (Same Period)
Figure 1.6 Mean monthly flow: Model Outlet 120015 vs. USGS 02247510
Tomoka River near Holly Hill, FL.

Final TMDL Report Tomoka River, WBID 2634, Nutrients
Florida Department of Environmental Protection
76
0.1
1
10
100
1000
10000
0% 10% 20% 30% 40% 50% 60% 70% 80% 90% 100%
Percent of Time that Flow is Equaled or Exceeded
Dai
ly A
vera
ge F
low
(cfs
)Observed Flow Duration (1/1/1997 to 12/31/2009 )
Modeled Flow Duration (1/1/1997 to 12/31/2009 )
Figure 1.7 Flow exceedence: Model Outlet 120015 vs. USGS 02247510
Tomoka River near Holly Hill, FL.

Final TMDL Report Tomoka River, WBID 2634, Nutrients
Florida Department of Environmental Protection
77
Table 1.3 Summary statistics: Model Outlet 120015 vs. USGS 02247510 Tomoka River near Holly Hill, FL.
LSPC Simulated Flow Observed Flow Gage
REACH OUTFLOW FROM SUBBASIN 120015
13-Year Analysis Period: 1/1/1997 - 12/31/2009 Hydrologic Unit Code: 3080201Flow volumes are (inches/year) for upstream drainage area Latitude: 29.21748099
Longitude: -81.1086687Drainage Area (sq-mi): 76.8
Total Simulated In-stream Flow: 10.09 Total Observed In-stream Flow: 10.20
Total of simulated highest 10% flows: 6.16 Total of Observed highest 10% flows: 6.14Total of Simulated lowest 50% flows: 0.45 Total of Observed Lowest 50% flows: 0.50
Simulated Summer Flow Volume (months 7-9): 4.15 Observed Summer Flow Volume (7-9): 4.56Simulated Fall Flow Volume (months 10-12): 2.11 Observed Fall Flow Volume (10-12): 2.51Simulated Winter Flow Volume (months 1-3): 1.86 Observed Winter Flow Volume (1-3): 1.76Simulated Spring Flow Volume (months 4-6): 1.97 Observed Spring Flow Volume (4-6): 1.38
Total Simulated Storm Volume: 4.22 Total Observed Storm Volume: 2.95Simulated Summer Storm Volume (7-9): 1.76 Observed Summer Storm Volume (7-9): 1.44
Errors (Simulated-Observed) Error Statistics Recommended Criteria ScoreError in total volume: -1.07 10 16Error in 50% lowest flows: -10.09 10 9Error in 10% highest flows: 0.20 15 12Seasonal volume error - Summer: -8.89 30 8Seasonal volume error - Fall: -15.90 30 8Seasonal volume error - Winter: 5.81 30 8Seasonal volume error - Spring: 42.90 30 4Error in storm volumes: 43.01 20 1Error in summer storm volumes: 22.56 50 4Nash-Sutcliffe Coefficient of Efficiency, E: 0.250 Total Score 70Baseline adjusted coefficient (Garrick), E': 0.362 Rating G
USGS 02247510 TOMOKA RIVER NEAR HOLLY HILL, FL
0
500
1000
1500
2000
2500
Jan-97 Jul-98 Jan-00 Jul-01 Jan-03 Jul-04 Jan-06 Jul-07 Jan-09
Date
Flow
(cfs
)
0
2
4
6
8
10
12
14
Dai
ly R
ainf
all (
in.)
Avg Daily Rainfall (in.)Avg Observed Flow (1/1/1997 to 12/31/2009 )Avg Modeled Flow (Same Period)
Figure 1.8 Mean daily flow: Model Outlet 120007 vs. USGS 02248000
Spruce Creek near Samsula, FL.

Final TMDL Report Tomoka River, WBID 2634, Nutrients
Florida Department of Environmental Protection
78
0
100
200
300
400
J-97 J-98 J-00 J-01 J-03 J-04 J-06 J-07 J-09
Month
Flow
(cfs
)
0
5
10
15
20
25
Mon
thly
Rai
nfal
l (in
.)
Avg Monthly Rainfall (in.)Avg Observed Flow (1/1/1997 to 12/31/2009 )Avg Modeled Flow (Same Period)
Figure 1.9 Mean monthly flow: Model Outlet 120007 vs. USGS 02248000
Spruce Creek near Samsula, FL.
0.1
1
10
100
1000
10000
0% 10% 20% 30% 40% 50% 60% 70% 80% 90% 100%
Percent of Time that Flow is Equaled or Exceeded
Dai
ly A
vera
ge F
low
(cfs
)
Observed Flow Duration (1/1/1997 to 12/31/2009 )
Modeled Flow Duration (1/1/1997 to 12/31/2009 )
Figure 1.10 Flow exceedence: Model Outlet 120007 vs. USGS 02248000
Spruce Creek near Samsula, FL.

Final TMDL Report Tomoka River, WBID 2634, Nutrients
Florida Department of Environmental Protection
79
Table 1.4 Summary statistics: Model Outlet 120007 vs. USGS 02248000 Spruce Creek near Samsula, FL.
LSPC Simulated Flow Observed Flow Gage
REACH OUTFLOW FROM SUBBASIN 120007
13-Year Analysis Period: 1/1/1997 - 12/31/2009 Hydrologic Unit Code: 3080201Flow volumes are (inches/year) for upstream drainage area Latitude: 29.05081845
Longitude: -81.0464455Drainage Area (sq-mi): 33.4
Total Simulated In-stream Flow: 12.29 Total Observed In-stream Flow: 12.73
Total of simulated highest 10% flows: 7.88 Total of Observed highest 10% flows: 8.83Total of Simulated lowest 50% flows: 0.48 Total of Observed Lowest 50% flows: 0.42
Simulated Summer Flow Volume (months 7-9): 4.75 Observed Summer Flow Volume (7-9): 5.91Simulated Fall Flow Volume (months 10-12): 2.89 Observed Fall Flow Volume (10-12): 3.48Simulated Winter Flow Volume (months 1-3): 2.23 Observed Winter Flow Volume (1-3): 2.09Simulated Spring Flow Volume (months 4-6): 2.43 Observed Spring Flow Volume (4-6): 1.25
Total Simulated Storm Volume: 4.12 Total Observed Storm Volume: 4.58Simulated Summer Storm Volume (7-9): 1.71 Observed Summer Storm Volume (7-9): 2.10
Errors (Simulated-Observed) Error Statistics Recommended Criteria S coreError in total volume: -3.47 10 16Error in 50% lowest flows: 15.18 10 6Error in 10% highest flows: -10.82 15 12Seasonal volume error - Summer: -19.67 30 8Seasonal volume error - Fall: -17.12 30 8Seasonal volume error - Winter: 6.64 30 8Seasonal volume error - Spring: 93.90 30 2Error in storm volumes: -10.05 20 4Error in summer storm volumes: -18.54 50 4Nash-Sutcliffe Coefficient of Efficiency, E: 0.227 Total Score 68Baseline adjusted coefficient (Garrick), E': 0.404 Rating G
USGS 02248000 SPRUCE CREEK NEAR SAMSULA, FL
The calibration of the LSPC water quality model involved comparing simulated water quality concentration and loads to the measured water quality concentrations and loads. The calibration of the water quality parameters was performed from January 1, 1997 through December 31, 2009. Water quality stations used for model calibration were co-located with hydrology stations used for model calibration. LSPC models water quality parameters by using algorithms identical to those in the Hydrologic Simulation Program FORTRAN (HSPF). The LSPC/HSPF modules used to represent water temperature include PSTEMP (soil temperature) and HTRCH (heat exchange and water temperature). The LSPC/HSPF modules used to represent dissolved oxygen include PWTGAS (pervious water temperature and dissolved gas concentrations), IWTGAS (impervious water temperature and dissolved gas concentrations), and OXRX (primary DO and BOD balances). The LSPC/HSPF modules used to represent sediment include SEDMNT (pervious production and removal of sediment), SOLIDS (accumulation and removal of solids), and SEDTRN (behavior of inorganic sediment). The LSPC/HSPF module used to represent nutrients was GQUAL. A detailed description of relevant temperature algorithms is presented in the HSPF (v12) User’s Manual (Bicknell et al. 2004).

Final TMDL Report Tomoka River, WBID 2634, Nutrients
Florida Department of Environmental Protection
80
Initial water quality parameters were based on previous modeling efforts in the Chattahoochee and Flint River Basins along with information in BASINS Technical Notes 8 and Rates, Constants, and Kinetics Formulations in Surface Water Quality Modeling (USEPA 2006 and USEPA 1985). Information on TN and TP loading and application rates for specific land uses was used to determine initial TN and TP accumulation rates and interflow and ground water concentrations. Water quality parameters were adjusted within accepted minimum and maximum ranges for each hydrologic soil group, land use, and reach group. Temperature, DO, and BOD were calibrated simultaneously because the DO algorithms require water temperature, and the DO and BOD algorithms are interrelated. Temperature was calibrated by adjusting surface and interflow temperature slopes and intercepts, ground water temperature, and radiation coefficients until the simulated data closely matched observed. Following temperature calibration, dissolved oxygen and biological oxygen demand were calibrated by adjusting reaeration, DO interflow and ground water concentration, BOD decay rate, BOD settling rate, and benthic oxygen demand. Sediment was calibrated by adjusting detachment, scour, and build-up/wash-off coefficients. The nutrient constituents were modeled by build-up/wash-off and assigning land use associated concentrations in ground water and interflow. Adjustments were made to monthly accumulation rate, monthly storage limit, interflow concentration, and ground water concentration for TN and TP until the simulated data was in range with the observed field data. Both visual and statistical metrics were utilized during calibration. Visual calibration was accomplished by matching the trends in the measured water quality concentration data. Loading metrics, including annual loading percent error, were utilized for statistical calibration. Annual loading was only analyzed when two or more water quality samples were taken in a given year, and measured flow data was collected that year. If no measured flow data was collected but the contributing area of the water quality station had similar land uses and soil types as the contributing area of a neighboring hydrology station, weighted measured flow was used to calculate the loadings. A rating system was applied to the percent error of the average annual loadings at the calibration and validations stations to determine the overall calibration success. The average annual loading percent error was assigned a qualitative descriptor of Very Good (VG), Good (G), Fair (F), or Poor (P). Scores from ±0-40% were rated as VG, ±40-90% G, ±90-150% F, and ±150-500% P. Nutrient concentration and loading calibration results are presented in Figures 1.11 through 1.22 and Tables 1.4 through 1.7.

Final TMDL Report Tomoka River, WBID 2634, Nutrients
Florida Department of Environmental Protection
81
0
2
4
6
8
10
Jan1997
Feb1998
Mar1999
Apr2000
May2001
Jun2002
Jul2003
Aug2004
Sep2005
Oct2006
Nov2007
Dec2008
Tota
l Nitr
ogen
(mg/
l)Modeled (Reach 120015) Observed (21FLGW 3516 and 21FLCEN 27010579)
Figure 1.11 Modeled vs. observed total nitrogen (mg/L)
at 21FLGW 3516 and 21FLCEN 27010579.
0
0.2
0.4
0.6
0.8
1
Jan1997
Feb1998
Mar1999
Apr2000
May2001
Jun2002
Jul2003
Aug2004
Sep2005
Oct2006
Nov2007
Dec2008
Tota
l Pho
spho
rus
(mg/
l)
Modeled (Reach 120015) Observed (21FLGW 3516 and 21FLCEN 27010579)
Figure 1.12 Modeled vs. observed total phosphorus (mg/L)
at 21FLGW 3516 and 21FLCEN 27010579.

Final TMDL Report Tomoka River, WBID 2634, Nutrients
Florida Department of Environmental Protection
82
0
2
4
6
8
10
Jan1997
Feb1998
Mar1999
Apr2000
May2001
Jun2002
Jul2003
Aug2004
Sep2005
Oct2006
Nov2007
Dec2008
Tota
l Nitr
ogen
(mg/
l)Modeled (Reach 120007) Observed (21FLCEN 27010539 and 21FLSJWM02248000)
Figure 1.13 Modeled vs. observed total nitrogen (mg/L) at 21FLCEN 27010539 and
21FLSJWM02248000.
0
0.2
0.4
0.6
0.8
1
Jan1997
Feb1998
Mar1999
Apr2000
May2001
Jun2002
Jul2003
Aug2004
Sep2005
Oct2006
Nov2007
Dec2008
Tota
l Pho
spho
rus
(mg/
l)
Modeled (Reach 120007) Observed (21FLCEN 27010539 and 21FLSJWM02248000)
Figure 1.14 Modeled vs. observed total phosphorus (mg/L) at 21FLCEN 27010539 and
21FLSJWM02248000.

Final TMDL Report Tomoka River, WBID 2634, Nutrients
Florida Department of Environmental Protection
83
1
10
100
1000
10000
1 10 100 1000 10000
Measured Total Nitrogen (lb/day)
Mod
eled
Tot
al N
itrog
en (
lb/d
ay)
Modeled Total Nitrogen (lb/day) Y=x
Figure 1.15 Total nitrogen (mg/l) load scatter plot at 21FLGW 3516 and 21FLCEN 27010579.
0.1
1
10
100
1000
0.1 1 10 100 1000
Measured Total Phosphorus (lb/day)
Mod
eled
Tot
al P
hosp
horu
s (l
b/da
y)
Modeled Total Phosphorus (lb/day) Y=x
Figure 1.16 Total phosphorus (mg/l) load scatter plot at 21FLGW 3516 and 21FLCEN 27010579.

Final TMDL Report Tomoka River, WBID 2634, Nutrients
Florida Department of Environmental Protection
84
1
10
100
1000
10000
100000
0 10 20 30 40 50 60 70 80 90 100
Flow Exceedance Percentile (%)
Tota
l Nitr
ogen
(lb
/day
)Modeled Total Nitrogen (lb/day) Total Nitrogen (lb/day)
Figure 1.17 Total nitrogen (mg/L) load duration curve at 21FLGW 3516 and 21FLCEN 27010579.
0.1
1
10
100
1000
10000
0 10 20 30 40 50 60 70 80 90 100
Flow Exceedance Percentile (%)
Tota
l Pho
spho
rus
(lb/
day)
Modeled Total Phosphorus (lb/day) Total Phosphorus (lb/day)
Figure 1.18 Total phosphorus (mg/L) load duration curve at 21FLGW 3516 and 21FLCEN 27010579.

Final TMDL Report Tomoka River, WBID 2634, Nutrients
Florida Department of Environmental Protection
85
Table 1.4 Total nitrogen (lb/year) percent error for measured and modeled loading by year at 21FLGW 3516 and 21FLCEN 27010579.
Rating of % Error was Very Good
Year Measured TN (lb/year)
Modeled TN (lb/year) % Error
1999 65,823 57,694 -12.4 2000 20,510 54,931 167.8 2001 217,319 209,770 -3.5 2002 170,835 126,810 -25.8 2003 200,075 179,481 -10.3 2004 447,592 222,788 -50.2 2005 250,005 334,621 33.9 2006 14,820 66,834 351.0 2007 26,375 57,432 117.8 2008 209,614 142,172 -32.2 2009 103,072 124,330 20.6
Average 156,913 143,351 -8.6 Table 1.5 Total phosphorus (lb/year) percent error for measured and modeled loading by
year at 21FLGW 3516 and 21FLCEN 27010579. Rating of % Error was Very Good
Year Measured TP (lb/year)
Modeled TP (lb/year) % Error
1999 2,428 5,353 120.5 2000 1,113 4,459 300.7 2001 9,510 11,052 16.2 2002 8,501 7,084 -16.7 2003 9,399 8,837 -6.0 2004 18,250 12,059 -33.9 2005 11,603 16,828 45.0 2006 720 4,169 478.8 2007 1,637 4,454 172.0 2008 7,209 7,792 8.1 2009 3,922 7,281 85.7
Average 6,754 8,124 20.3

Final TMDL Report Tomoka River, WBID 2634, Nutrients
Florida Department of Environmental Protection
86
1
10
100
1000
10000
1 10 100 1000 10000
Measured Total Nitrogen (lb/day)
Mod
eled
Tot
al N
itrog
en (
lb/d
ay)
Modeled Total Nitrogen (lb/day) Y=x
Figure 1.19 Total nitrogen (mg/L) load scatter plot at 21FLCEN 27010539 and 21FLSJWM02248000.
0.1
1
10
100
1000
0.1 1 10 100 1000
Measured Total Phosphorus (lb/day)
Mod
eled
Tot
al P
hosp
horu
s (l
b/da
y)
Modeled Total Phosphorus (lb/day) Y=x
Figure 1.20 Total phosphorus (mg/l) load scatter plot at 21FLCEN 27010539 and
21FLSJWM02248000.
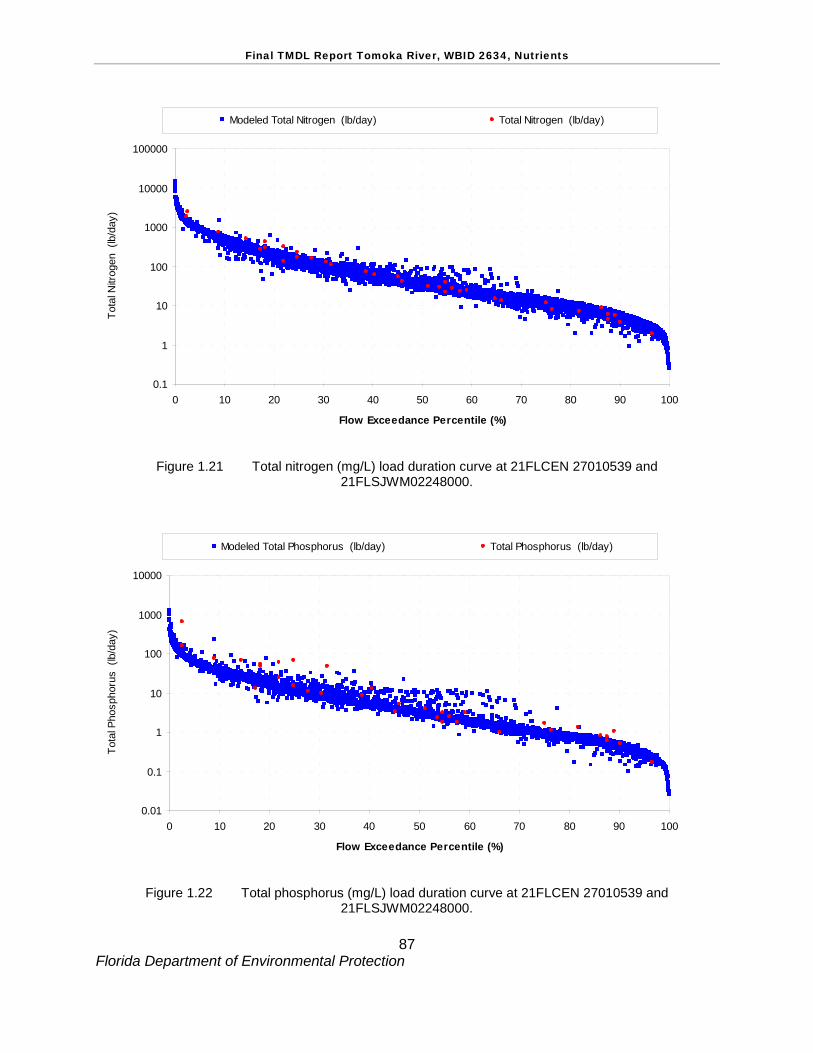
Final TMDL Report Tomoka River, WBID 2634, Nutrients
Florida Department of Environmental Protection
87
0.1
1
10
100
1000
10000
100000
0 10 20 30 40 50 60 70 80 90 100
Flow Exceedance Percentile (%)
Tota
l Nitr
ogen
(lb
/day
)Modeled Total Nitrogen (lb/day) Total Nitrogen (lb/day)
Figure 1.21 Total nitrogen (mg/L) load duration curve at 21FLCEN 27010539 and
21FLSJWM02248000.
0.01
0.1
1
10
100
1000
10000
0 10 20 30 40 50 60 70 80 90 100
Flow Exceedance Percentile (%)
Tota
l Pho
spho
rus
(lb/
day)
Modeled Total Phosphorus (lb/day) Total Phosphorus (lb/day)
Figure 1.22 Total phosphorus (mg/L) load duration curve at 21FLCEN 27010539 and
21FLSJWM02248000.

Final TMDL Report Tomoka River, WBID 2634, Nutrients
Florida Department of Environmental Protection
88
Table 1.6 Total nitrogen (lb/year) percent error for measured and modeled loading by year at 21FLCEN 27010539 and 21FLSJWM02248000.
Rating of % Error was Very Good Year Measured TN
(lb/year) Modeled TN
(lb/year) % Error
1999 119,768 26,204 -78.1 2000 9,961 42,424 325.9 2001 242,469 94,435 -61.1 2002 60,424 74,404 23.1 2003 118,289 108,736 -8.1 2004 151,387 145,047 -4.2 2005 123,844 124,677 0.7 2006 2007 2008 2009
Average 118,020 87,989 -25.4 Table 1.7 Total phosphorus (lb/year) percent error for measured and modeled loading by
year at 21FLCEN 27010539 and 21FLSJWM02248000. Rating of % Error was Good
Year Measured TP (lb/year)
Modeled TP (lb/year) % Error
1999 11,010 2,371 -78.5 2000 1,149 3,265 184.2 2001 45,523 7,424 -83.7 2002 5,675 5,882 3.7 2003 15,842 7,964 -49.7 2004 27,323 11,279 -58.7 2005 52,024 9,700 -81.4 2006 2007 2008 2009
Average 22,649 6,841 -69.8

Final TMDL Report Tomoka River, WBID 2634, Nutrients
Florida Department of Environmental Protection
89
References
Bicknell, Brian R., J.C. Imhoff, J.L. Kittle, Jr., T.H. Jobes, A.S. Donigian, Jr., 2004. HSPF Version 12 User’s Manual. Aqua Terra Consultants, Mountain View, California.
United States Environmental Protection Agency (USEPA). 1985. Rates, Constants, and Kinetics. Formulations in Surface Water Quality Modeling (Second Edition). Environmental Research Laboratory. Athens, GA. EPA/600/3-85/040.
United States Environmental Protection Agency (USEPA). 2000. BASINS Technical Note 6. Estimating Hydrology and Hydraulic Parameters for HSPF. Office of Water. EPA-823-R00-012.
United States Environmental Protection Agency (USEPA). 2006. BASINS Technical Note 8. Sediment Parameter and Calibration Guidance for HSPF. Office of Water.

Final TMDL Report Tomoka River, WBID 2634, Nutrients
Florida Department of Environmental Protection
90
Appendix D: Kruskal–Wallis Analysis of Corrected Chla, INORGN, TN, INORGP, TP, COND, Color, and TSS, Observations versus Season in Tomoka River
Kruskal-Wallis One-Way Analysis of Variance for 653 cases Dependent variable is CHLAC Grouping variable is SEASON$ Group Count Rank Sum FALL 152 39067.000 SPRING 177 71389.500 SUMMER 163 57242.000 WINTER 161 45832.500 Kruskal-Wallis Test Statistic = 67.338 Probability is 0.000 assuming Chi-square distribution with 3 df Kruskal-Wallis One-Way Analysis of Variance for 304 cases Dependent variable is INORGN Grouping variable is SEASON$ Group Count Rank Sum FALL 61 9441.500 SPRING 97 14949.000 SUMMER 74 13161.000 WINTER 72 8808.500 Kruskal-Wallis Test Statistic = 14.706 Probability is 0.002 assuming Chi-square distribution with 3 df Kruskal-Wallis One-Way Analysis of Variance for 628 cases Dependent variable is TN Grouping variable is SEASON$ Group Count Rank Sum FALL 143 52120.500 SPRING 169 46003.500 SUMMER 161 59771.500 WINTER 155 39610.500 Kruskal-Wallis Test Statistic = 52.148 Probability is 0.000 assuming Chi-square distribution with 3 df

Final TMDL Report Tomoka River, WBID 2634, Nutrients
Florida Department of Environmental Protection
91
Kruskal-Wallis One-Way Analysis of Variance for 516 cases Dependent variable is INORGP Grouping variable is SEASON$ Group Count Rank Sum FALL 126 31418.000 SPRING 122 32279.500 SUMMER 133 44591.500 WINTER 135 25097.000 Kruskal-Wallis Test Statistic = 67.983 Probability is 0.000 assuming Chi-square distribution with 3 df Kruskal-Wallis One-Way Analysis of Variance for 649 cases Dependent variable is TP Grouping variable is SEASON$ Group Count Rank Sum FALL 155 42957.500 SPRING 174 66618.000 SUMMER 161 61525.000 WINTER 159 39824.500 Kruskal-Wallis Test Statistic = 66.861 Probability is 0.000 assuming Chi-square distribution with 3 df Kruskal-Wallis One-Way Analysis of Variance for 690 cases Dependent variable is COND Grouping variable is SEASON$ Group Count Rank Sum FALL 172 49848.000 SPRING 188 83505.000 SUMMER 167 48929.500 WINTER 163 56112.500 Kruskal-Wallis Test Statistic = 71.091 Probability is 0.000 assuming Chi-square distribution with 3 df

Final TMDL Report Tomoka River, WBID 2634, Nutrients
Florida Department of Environmental Protection
92
Kruskal-Wallis One-Way Analysis of Variance for 670 cases Dependent variable is COLOR Grouping variable is SEASON$ Group Count Rank Sum FALL 163 70276.000 SPRING 180 38738.000 SUMMER 168 67110.500 WINTER 159 48660.500 Kruskal-Wallis Test Statistic = 131.497 Probability is 0.000 assuming Chi-square distribution with 3 df Kruskal-Wallis One-Way Analysis of Variance for 579 cases Dependent variable is TSS Grouping variable is SEASON$ Group Count Rank Sum FALL 149 40442.500 SPRING 137 46416.000 SUMMER 144 41185.500 WINTER 149 39866.000 Kruskal-Wallis Test Statistic = 16.512 Probability is 0.001 assuming Chi-square distribution with 3 df

Final TMDL Report Tomoka River, WBID 2634, Nutrients
Florida Department of Environmental Protection
93
Appendix E: Kruskal–Wallis Analysis of Corrected Chla, INORGN, TN, INORGP, TP, COND, Color, and TSS Observations versus Year in Tomoka River
Kruskal-Wallis One-Way Analysis of Variance for 653 cases Dependent variable is CHLAC Grouping variable is YEAR Group Count Rank Sum 1985 9 2466.000 1986 24 10924.000 1992 34 11996.500 1993 30 11996.500 1994 40 15456.500 1995 35 11249.000 1996 33 8622.000 1997 21 5969.000 1998 35 7823.500 1999 35 11314.000 2000 10 2833.500 2001 21 4815.500 2002 19 5284.000 2003 33 8088.500 2004 20 4626.500 2005 43 14241.000 2006 21 4670.000 2007 19 4946.500 2008 64 25597.000 2009 50 20808.500 2010 33 10885.000 2011 24 8918.000 Kruskal-Wallis Test Statistic = 95.752 Probability is 0.000 assuming Chi-square distribution with 21 df

Final TMDL Report Tomoka River, WBID 2634, Nutrients
Florida Department of Environmental Protection
94
Kruskal-Wallis One-Way Analysis of Variance for 304 cases Dependent variable is INORGN Grouping variable is YEAR Group Count Rank Sum 1983 3 352.000 1984 6 1508.000 1993 4 553.000 1994 8 1235.000 1995 7 1658.500 1996 7 1294.000 1997 7 868.500 1998 11 1530.000 1999 12 1417.500 2000 2 240.500 2001 12 1426.500 2002 15 2497.000 2003 26 3292.000 2004 12 2462.000 2005 30 3037.000 2006 15 2149.500 2007 12 1489.000 2008 54 8426.000 2009 21 4039.000 2010 24 4900.000 2011 16 1985.000 Kruskal-Wallis Test Statistic = 53.362 Probability is 0.000 assuming Chi-square distribution with 20 df

Final TMDL Report Tomoka River, WBID 2634, Nutrients
Florida Department of Environmental Protection
95
Kruskal-Wallis One-Way Analysis of Variance for 628 cases Dependent variable is TN Grouping variable is YEAR Group Count Rank Sum 1975 1 104.000 1983 3 614.000 1984 6 1890.000 1985 10 3151.000 1986 25 7528.000 1992 33 12528.500 1993 33 8902.500 1994 42 17531.000 1995 37 17252.500 1996 34 10081.000 1997 22 5956.500 1998 35 12746.000 1999 35 8208.500 2000 12 2842.500 2001 21 4762.500 2002 21 6530.000 2003 32 10392.000 2004 22 6281.500 2005 38 12344.000 2006 19 2666.000 2007 17 2601.500 2008 60 20622.000 2009 21 7765.000 2010 27 9068.500 2011 22 5137.000 Kruskal-Wallis Test Statistic = 106.426 Probability is 0.000 assuming Chi-square distribution with 24 df

Final TMDL Report Tomoka River, WBID 2634, Nutrients
Florida Department of Environmental Protection
96
Kruskal-Wallis One-Way Analysis of Variance for 516 cases Dependent variable is INORGP Grouping variable is YEAR Group Count Rank Sum 1966 2 608.000 1967 1 516.000 1970 1 457.000 1971 1 499.000 1975 1 207.500 1983 3 619.000 1984 6 2005.000 1992 33 7515.500 1993 31 7822.500 1994 40 12090.500 1995 39 10058.000 1996 34 5681.500 1997 22 6642.500 1998 35 9796.500 1999 34 7843.500 2000 12 4450.500 2001 21 6481.000 2002 21 6453.500 2003 19 6035.500 2004 22 5338.000 2005 23 5158.000 2006 19 4010.500 2007 16 4655.500 2008 26 6625.500 2009 18 3257.500 2010 20 3740.500 2011 16 4818.000 Kruskal-Wallis Test Statistic = 60.416 Probability is 0.000 assuming Chi-square distribution with 26 df

Final TMDL Report Tomoka River, WBID 2634, Nutrients
Florida Department of Environmental Protection
97
Kruskal-Wallis One-Way Analysis of Variance for 649 cases Dependent variable is TP Grouping variable is YEAR Group Count Rank Sum 1968 1 562.000 1969 1 531.000 1970 1 410.000 1971 1 533.000 1975 1 481.000 1983 3 1249.000 1984 6 2577.500 1985 10 1620.000 1986 25 10336.000 1992 34 14803.500 1993 28 12709.500 1994 42 19962.000 1995 37 12863.000 1996 34 4596.000 1997 22 4609.000 1998 37 7812.500 1999 35 8774.500 2000 10 4196.000 2001 21 6481.000 2002 19 5422.000 2003 34 10115.500 2004 20 4702.000 2005 38 10194.000 2006 23 5788.500 2007 18 4051.000 2008 63 28568.000 2009 30 9717.000 2010 33 9944.500 2011 22 7316.000 Kruskal-Wallis Test Statistic = 186.964 Probability is 0.000 assuming Chi-square distribution with 28 df

Final TMDL Report Tomoka River, WBID 2634, Nutrients
Florida Department of Environmental Protection
98
Kruskal-Wallis One-Way Analysis of Variance for 690 cases Dependent variable is COND Grouping variable is YEAR Group Count Rank Sum 1964 2 178.500 1965 9 2729.500 1966 5 550.000 1967 1 478.000 1968 1 515.000 1969 1 387.000 1970 1 324.500 1971 1 330.000 1975 1 594.000 1981 1 406.000 1983 2 451.000 1984 2 539.000 1985 10 2327.000 1986 24 12134.000 1992 36 15226.500 1993 33 11937.500 1994 43 16386.000 1995 40 11949.500 1996 32 7627.000 1997 22 6288.500 1998 37 9391.000 1999 36 12912.500 2000 10 3108.500 2001 21 6869.500 2002 21 6245.500 2003 35 6384.000 2004 19 7252.500 2005 31 6370.000 2006 22 8193.500 2007 20 8418.000 2008 63 31352.000 2009 52 19724.000 2010 33 10821.000 2011 23 9994.500 Kruskal-Wallis Test Statistic = 149.061 Probability is 0.000 assuming Chi-square distribution with 33 df

Final TMDL Report Tomoka River, WBID 2634, Nutrients
Florida Department of Environmental Protection
99
Kruskal-Wallis One-Way Analysis of Variance for 670 cases Dependent variable is COLOR Grouping variable is YEAR Group Count Rank Sum 1964 2 786.000 1965 9 2880.000 1966 5 2273.500 1967 1 221.000 1968 1 140.000 1969 1 333.500 1970 1 221.000 1975 1 50.000 1983 6 1604.000 1984 6 2237.500 1985 10 4566.500 1986 25 6635.000 1992 34 11656.000 1993 33 7968.000 1994 42 13857.000 1995 40 16902.000 1996 32 13075.000 1997 22 8408.500 1998 37 18618.000 1999 35 11459.500 2000 12 4466.500 2001 21 6323.000 2002 19 6695.500 2003 34 16091.000 2004 22 7399.000 2005 28 12893.500 2006 22 4630.000 2007 19 3734.000 2008 63 12964.500 2009 30 10667.000 2010 33 11008.500 2011 24 4020.500 Kruskal-Wallis Test Statistic = 159.824 Probability is 0.000 assuming Chi-square distribution with 31 df

Final TMDL Report Tomoka River, WBID 2634, Nutrients
Florida Department of Environmental Protection
100
Kruskal-Wallis One-Way Analysis of Variance for 579 cases Dependent variable is TSS Grouping variable is YEAR Group Count Rank Sum 1975 1 353.500 1985 5 1428.500 1986 25 8839.000 1992 33 10766.500 1993 33 10816.000 1994 42 8253.000 1995 39 11201.500 1996 33 8738.500 1997 22 4273.500 1998 36 7961.000 1999 35 9285.000 2000 10 1333.000 2001 21 6572.500 2002 21 6942.500 2003 20 6167.000 2004 22 6063.500 2005 22 7260.000 2006 22 7386.000 2007 20 5424.000 2008 33 12610.500 2009 30 11080.500 2010 32 9183.000 2011 22 5971.500 Kruskal-Wallis Test Statistic = 66.967 Probability is 0.000 assuming Chi-square distribution with 22 df

Final TMDL Report Tomoka River, WBID 2634, Nutrients
Florida Department of Environmental Protection
101
Appendix F: Chart of Corrected Chla, INORGN TN, INORGP, TP, Cond, Color, and TSS Observations by Year, Season, and Station, in Tomoka River
19801982
19841986
19881990
19921994
19961998
20002002
20042006
20082010
2012
YEAR
0255075
100125150175200225250275300325350375400425450475500
CHLA
C (U
G/L)
19801982
19841986
19881990
19921994
19961998
20002002
20042006
20082010
2012
YEAR
0.00.10.20.30.40.50.60.70.80.91.01.11.21.31.41.51.61.71.81.92.0
INOR
GANI
C N
(MG/
L)

Final TMDL Report Tomoka River, WBID 2634, Nutrients
Florida Department of Environmental Protection
102
19801982
19841986
19881990
19921994
19961998
20002002
20042006
20082010
2012
YEAR
0.00.30.60.91.21.51.82.12.42.73.03.33.63.94.24.54.85.15.45.76.0
TOTA
L NIT
ROGE
N (M
G/L)
19801982
19841986
19881990
19921994
19961998
20002002
20042006
20082010
2012
YEAR
0.000.030.060.090.120.150.180.210.240.270.300.330.360.390.420.450.480.510.540.570.60
INOR
GANI
C P
(MG/
L)

Final TMDL Report Tomoka River, WBID 2634, Nutrients
Florida Department of Environmental Protection
103
19801982
19841986
19881990
19921994
19961998
20002002
20042006
20082010
2012
YEAR
0.000.250.500.751.001.251.501.752.002.252.502.753.003.253.503.754.004.254.504.755.00
TOTA
L PHO
SPHO
RUS
(MG/
L)
19801982
19841986
19881990
19921994
19961998
20002002
20042006
20082010
2012
YEAR
05000
100001500020000250003000035000400004500050000550006000065000700007500080000850009000095000
100000
COND
UCTI
VITY
(US/
CM)

Final TMDL Report Tomoka River, WBID 2634, Nutrients
Florida Department of Environmental Protection
104
19801982
19841986
19881990
19921994
19961998
20002002
20042006
20082010
2012
YEAR
075
150225300375450525600675750825900975
1050112512001275135014251500
COLO
R (P
T-CO
)
1980
1982
1984
1986
1988
1990
1992
1994
1996
1998
2000
2002
2004
2006
2008
2010
2012
YEAR
0369
1215182124273033363942454851545760
TSS
(MG/
L)

Final TMDL Report Tomoka River, WBID 2634, Nutrients
Florida Department of Environmental Protection
105
SEASONAL CHLAC
FALLSPRING
SUMMERWINTER
SEASON
0255075
100125150175200225250275300325350375400425450475500
CHLA
C (UG
/L)
SEASONAL INORGN
FALLSPRING
SUMMERWINTER
SEASON
0.00.10.20.30.40.50.60.70.80.91.01.11.21.31.41.51.61.71.81.92.0
INORG
ANIC
N (MG
/L)

Final TMDL Report Tomoka River, WBID 2634, Nutrients
Florida Department of Environmental Protection
106
SEASONAL TN
FALLSPRING
SUMMERWINTER
SEASON
0.00.30.60.91.21.51.82.12.42.73.03.33.63.94.24.54.85.15.45.76.0
TOTA
L NITR
OGEN
(MG/
L)
SEASONAL INORGP
FALLSPRING
SUMMERWINTER
SEASON
0.000.030.060.090.120.150.180.210.240.270.300.330.360.390.420.450.480.510.540.570.60
INORG
ANIC
P (MG
/L)

Final TMDL Report Tomoka River, WBID 2634, Nutrients
Florida Department of Environmental Protection
107
SEASONAL TP
FALLSPRING
SUMMERWINTER
SEASON
0.000.250.500.751.001.251.501.752.002.252.502.753.003.253.503.754.004.254.504.755.00
TOTA
L PHO
SPHO
RUS (
MG/L)
SEASONAL COND
FALLSPRING
SUMMERWINTER
SEASON
05000
100001500020000250003000035000400004500050000550006000065000700007500080000850009000095000
100000
COND
UCTIV
ITY (U
S/CM)

Final TMDL Report Tomoka River, WBID 2634, Nutrients
Florida Department of Environmental Protection
108
SEASONAL COLOR
FALLSPRING
SUMMERWINTER
SEASON
075
150225300375450525600675750825900975
1050112512001275135014251500
COLO
R (PT
-CO)
SEASONAL TSS
FALLSPRING
SUMMERWINTER
SEASON
0369
1215182124273033363942454851545760
TSS (
MG/L)

Final TMDL Report Tomoka River, WBID 2634, Nutrients
Florida Department of Environmental Protection
109
112W
RD 022
4750
0
112W
RD 022
4750
8
112W
RD 022
4751
0
21FL
A 270
1042
9FLA
21FL
A 270
1057
2
21FL
A 270
1057
3
21FL
A 270
1057
4
21FL
A 270
1057
8
21FL
A 270
1057
9
21FL
A 270
1083
0
21FL
A 270
1092
3
21FL
A 270
1092
4
21FL
CEN 2701
0075
21FL
CEN 2701
0574
21FL
CEN 2701
0579
21FL
CEN 2701
0596
21FL
CEN 2701
0830
21FL
GW 349
21
21FL
GW 349
29
21FL
GW 349
30
21FL
GW 349
31
21FL
GW 349
32
21FL
GW 349
33
21FL
GW 349
34
21FL
GW 349
35
21FL
GW 349
36
21FL
GW 349
37
21FL
GW 349
38
21FL
GW 349
39
21FL
GW 349
40
21FL
GW 349
41
21FL
GW 349
42
21FL
GW 349
43
21FL
GW 349
44
21FL
GW 349
45
21FL
GW 349
46
21FL
GW 349
47
21FL
GW 349
48
21FL
GW 349
49
21FL
GW 349
50
21FL
GW 349
51
21FL
GW 349
52
21FL
GW 349
53
21FL
GW 349
54
21FL
GW 349
55
21FL
GW 349
56
21FL
GW 349
57
21FL
GW 349
58
21FL
GW 351
6
21FL
SJWM27
0105
79
21FL
SJWMNCBTR
05
21FL
SJWMNCBTR
06
21FL
SJWMTR
11
21FL
VEMDTR03
21FL
VEMDTR04
21FL
VEMDTR05
21FL
VEMDVC-077
21FL
VEMDVC-078
21FL
VEMDVC-079
21FL
VEMDVC-TR6
21FL
WPB 2001
0739
21FL
WPB 2001
0740
21FL
WQSPVOL358
LR
STATION
0255075
100125150175200225250275300325350375400425450475500
CHLA
C (U
G/L
)
112W
RD 022
4750
0
112W
RD 022
4750
8
112W
RD 022
4751
0
21FL
A 270
1042
9FLA
21FL
A 270
1057
2
21FL
A 270
1057
3
21FL
A 270
1057
4
21FL
A 270
1057
8
21FL
A 270
1057
9
21FL
A 270
1083
0
21FL
A 270
1092
3
21FL
A 270
1092
4
21FL
CEN 2701
0075
21FL
CEN 2701
0574
21FL
CEN 2701
0579
21FL
CEN 2701
0596
21FL
CEN 2701
0830
21FL
GW 349
21
21FL
GW 349
29
21FL
GW 349
30
21FL
GW 349
31
21FL
GW 349
32
21FL
GW 349
33
21FL
GW 349
34
21FL
GW 349
35
21FL
GW 349
36
21FL
GW 349
37
21FL
GW 349
38
21FL
GW 349
39
21FL
GW 349
40
21FL
GW 349
41
21FL
GW 349
42
21FL
GW 349
43
21FL
GW 349
44
21FL
GW 349
45
21FL
GW 349
46
21FL
GW 349
47
21FL
GW 349
48
21FL
GW 349
49
21FL
GW 349
50
21FL
GW 349
51
21FL
GW 349
52
21FL
GW 349
53
21FL
GW 349
54
21FL
GW 349
55
21FL
GW 349
56
21FL
GW 349
57
21FL
GW 349
58
21FL
GW 351
6
21FL
SJWM27
0105
79
21FL
SJWMNCBTR
05
21FL
SJWMNCBTR
06
21FL
SJWMTR
11
21FL
VEMDTR03
21FL
VEMDTR04
21FL
VEMDTR05
21FL
VEMDVC-077
21FL
VEMDVC-078
21FL
VEMDVC-079
21FL
VEMDVC-TR6
21FL
WPB 2001
0739
21FL
WPB 2001
0740
21FL
WQSPVOL358
LR
STATION
0.00.10.20.30.40.50.60.70.80.91.01.11.21.31.41.51.61.71.81.92.0
INO
RGAN
IC N
(MG
/L)

Final TMDL Report Tomoka River, WBID 2634, Nutrients
Florida Department of Environmental Protection
110
112W
RD 022
4750
0
112W
RD 022
4750
8
112W
RD 022
4751
0
21FL
A 270
1042
9FLA
21FL
A 270
1057
2
21FL
A 270
1057
3
21FL
A 270
1057
4
21FL
A 270
1057
8
21FL
A 270
1057
9
21FL
A 270
1083
0
21FL
A 270
1092
3
21FL
A 270
1092
4
21FL
CEN 2701
0075
21FL
CEN 2701
0574
21FL
CEN 2701
0579
21FL
CEN 2701
0596
21FL
CEN 2701
0830
21FL
GW 349
21
21FL
GW 349
29
21FL
GW 349
30
21FL
GW 349
31
21FL
GW 349
32
21FL
GW 349
33
21FL
GW 349
34
21FL
GW 349
35
21FL
GW 349
36
21FL
GW 349
37
21FL
GW 349
38
21FL
GW 349
39
21FL
GW 349
40
21FL
GW 349
41
21FL
GW 349
42
21FL
GW 349
43
21FL
GW 349
44
21FL
GW 349
45
21FL
GW 349
46
21FL
GW 349
47
21FL
GW 349
48
21FL
GW 349
49
21FL
GW 349
50
21FL
GW 349
51
21FL
GW 349
52
21FL
GW 349
53
21FL
GW 349
54
21FL
GW 349
55
21FL
GW 349
56
21FL
GW 349
57
21FL
GW 349
58
21FL
GW 351
6
21FL
SJWM27
0105
79
21FL
SJWMNCBTR
05
21FL
SJWMNCBTR
06
21FL
SJWMTR
11
21FL
VEMDTR03
21FL
VEMDTR04
21FL
VEMDTR05
21FL
VEMDVC-077
21FL
VEMDVC-078
21FL
VEMDVC-079
21FL
VEMDVC-TR6
21FL
WPB 2001
0739
21FL
WPB 2001
0740
21FL
WQSPVOL358
LR
STATION
0.00.30.60.91.21.51.82.12.42.73.03.33.63.94.24.54.85.15.45.76.0
TOTA
L NI
TRO
GEN
(MG
/L)
112W
RD 022
4750
0
112W
RD 022
4750
8
112W
RD 022
4751
0
21FL
A 270
1042
9FLA
21FL
A 270
1057
2
21FL
A 270
1057
3
21FL
A 270
1057
4
21FL
A 270
1057
8
21FL
A 270
1057
9
21FL
A 270
1083
0
21FL
A 270
1092
3
21FL
A 270
1092
4
21FL
CEN 2701
0075
21FL
CEN 2701
0574
21FL
CEN 2701
0579
21FL
CEN 2701
0596
21FL
CEN 2701
0830
21FL
GW 349
21
21FL
GW 349
29
21FL
GW 349
30
21FL
GW 349
31
21FL
GW 349
32
21FL
GW 349
33
21FL
GW 349
34
21FL
GW 349
35
21FL
GW 349
36
21FL
GW 349
37
21FL
GW 349
38
21FL
GW 349
39
21FL
GW 349
40
21FL
GW 349
41
21FL
GW 349
42
21FL
GW 349
43
21FL
GW 349
44
21FL
GW 349
45
21FL
GW 349
46
21FL
GW 349
47
21FL
GW 349
48
21FL
GW 349
49
21FL
GW 349
50
21FL
GW 349
51
21FL
GW 349
52
21FL
GW 349
53
21FL
GW 349
54
21FL
GW 349
55
21FL
GW 349
56
21FL
GW 349
57
21FL
GW 349
58
21FL
GW 351
6
21FL
SJWM27
0105
79
21FL
SJWMNCBTR
05
21FL
SJWMNCBTR
06
21FL
SJWMTR
11
21FL
VEMDTR03
21FL
VEMDTR04
21FL
VEMDTR05
21FL
VEMDVC-077
21FL
VEMDVC-078
21FL
VEMDVC-079
21FL
VEMDVC-TR6
21FL
WPB 2001
0739
21FL
WPB 2001
0740
21FL
WQSPVOL358
LR
STATION
0.000.030.060.090.120.150.180.210.240.270.300.330.360.390.420.450.480.510.540.570.60
INO
RGAN
IC P
(MG
/L)

Final TMDL Report Tomoka River, WBID 2634, Nutrients
Florida Department of Environmental Protection
111
112W
RD 022
4750
0
112W
RD 022
4750
8
112W
RD 022
4751
0
21FL
A 270
1042
9FLA
21FL
A 270
1057
2
21FL
A 270
1057
3
21FL
A 270
1057
4
21FL
A 270
1057
8
21FL
A 270
1057
9
21FL
A 270
1083
0
21FL
A 270
1092
3
21FL
A 270
1092
4
21FL
CEN 2701
0075
21FL
CEN 2701
0574
21FL
CEN 2701
0579
21FL
CEN 2701
0596
21FL
CEN 2701
0830
21FL
GW 349
21
21FL
GW 349
29
21FL
GW 349
30
21FL
GW 349
31
21FL
GW 349
32
21FL
GW 349
33
21FL
GW 349
34
21FL
GW 349
35
21FL
GW 349
36
21FL
GW 349
37
21FL
GW 349
38
21FL
GW 349
39
21FL
GW 349
40
21FL
GW 349
41
21FL
GW 349
42
21FL
GW 349
43
21FL
GW 349
44
21FL
GW 349
45
21FL
GW 349
46
21FL
GW 349
47
21FL
GW 349
48
21FL
GW 349
49
21FL
GW 349
50
21FL
GW 349
51
21FL
GW 349
52
21FL
GW 349
53
21FL
GW 349
54
21FL
GW 349
55
21FL
GW 349
56
21FL
GW 349
57
21FL
GW 349
58
21FL
GW 351
6
21FL
SJWM27
0105
79
21FL
SJWMNCBTR
05
21FL
SJWMNCBTR
06
21FL
SJWMTR
11
21FL
VEMDTR03
21FL
VEMDTR04
21FL
VEMDTR05
21FL
VEMDVC-077
21FL
VEMDVC-078
21FL
VEMDVC-079
21FL
VEMDVC-TR6
21FL
WPB 2001
0739
21FL
WPB 2001
0740
21FL
WQSPVOL358
LR
STATION
0.000.250.500.751.001.251.501.752.002.252.502.753.003.253.503.754.004.254.504.755.00
TOTA
L PH
OSP
HORU
S (M
G/L
)
112W
RD 022
4750
0
112W
RD 022
4750
8
112W
RD 022
4751
0
21FL
A 270
1042
9FLA
21FL
A 270
1057
2
21FL
A 270
1057
3
21FL
A 270
1057
4
21FL
A 270
1057
8
21FL
A 270
1057
9
21FL
A 270
1083
0
21FL
A 270
1092
3
21FL
A 270
1092
4
21FL
CEN 2701
0075
21FL
CEN 2701
0574
21FL
CEN 2701
0579
21FL
CEN 2701
0596
21FL
CEN 2701
0830
21FL
GW 349
21
21FL
GW 349
29
21FL
GW 349
30
21FL
GW 349
31
21FL
GW 349
32
21FL
GW 349
33
21FL
GW 349
34
21FL
GW 349
35
21FL
GW 349
36
21FL
GW 349
37
21FL
GW 349
38
21FL
GW 349
39
21FL
GW 349
40
21FL
GW 349
41
21FL
GW 349
42
21FL
GW 349
43
21FL
GW 349
44
21FL
GW 349
45
21FL
GW 349
46
21FL
GW 349
47
21FL
GW 349
48
21FL
GW 349
49
21FL
GW 349
50
21FL
GW 349
51
21FL
GW 349
52
21FL
GW 349
53
21FL
GW 349
54
21FL
GW 349
55
21FL
GW 349
56
21FL
GW 349
57
21FL
GW 349
58
21FL
GW 351
6
21FL
SJWM27
0105
79
21FL
SJWMNCBTR
05
21FL
SJWMNCBTR
06
21FL
SJWMTR
11
21FL
VEMDTR03
21FL
VEMDTR04
21FL
VEMDTR05
21FL
VEMDVC-077
21FL
VEMDVC-078
21FL
VEMDVC-079
21FL
VEMDVC-TR6
21FL
WPB 2001
0739
21FL
WPB 2001
0740
21FL
WQSPVOL358
LR
STATION
05,000
10,00015,00020,00025,00030,00035,00040,00045,00050,00055,00060,00065,00070,00075,00080,00085,00090,00095,000
100,000
COND
(UM
HOS/
CM)

Final TMDL Report Tomoka River, WBID 2634, Nutrients
Florida Department of Environmental Protection
112
112W
RD 022
4750
0
112W
RD 022
4750
8
112W
RD 022
4751
0
21FL
A 270
1042
9FLA
21FL
A 270
1057
2
21FL
A 270
1057
3
21FL
A 270
1057
4
21FL
A 270
1057
8
21FL
A 270
1057
9
21FL
A 270
1083
0
21FL
A 270
1092
3
21FL
A 270
1092
4
21FL
CEN 2701
0075
21FL
CEN 2701
0574
21FL
CEN 2701
0579
21FL
CEN 2701
0596
21FL
CEN 2701
0830
21FL
GW 349
21
21FL
GW 349
29
21FL
GW 349
30
21FL
GW 349
31
21FL
GW 349
32
21FL
GW 349
33
21FL
GW 349
34
21FL
GW 349
35
21FL
GW 349
36
21FL
GW 349
37
21FL
GW 349
38
21FL
GW 349
39
21FL
GW 349
40
21FL
GW 349
41
21FL
GW 349
42
21FL
GW 349
43
21FL
GW 349
44
21FL
GW 349
45
21FL
GW 349
46
21FL
GW 349
47
21FL
GW 349
48
21FL
GW 349
49
21FL
GW 349
50
21FL
GW 349
51
21FL
GW 349
52
21FL
GW 349
53
21FL
GW 349
54
21FL
GW 349
55
21FL
GW 349
56
21FL
GW 349
57
21FL
GW 349
58
21FL
GW 351
6
21FL
SJWM27
0105
79
21FL
SJWMNCBTR
05
21FL
SJWMNCBTR
06
21FL
SJWMTR
11
21FL
VEMDTR03
21FL
VEMDTR04
21FL
VEMDTR05
21FL
VEMDVC-077
21FL
VEMDVC-078
21FL
VEMDVC-079
21FL
VEMDVC-TR6
21FL
WPB 2001
0739
21FL
WPB 2001
0740
21FL
WQSPVOL358
LR
STATION
075
150225300375450525600675750825900975
1,0501,1251,2001,2751,3501,4251,500
COLO
R (P
T-CO
)
112W
RD 022
4750
0
112W
RD 022
4750
8
112W
RD 022
4751
0
21FL
A 270
1042
9FLA
21FL
A 270
1057
2
21FL
A 270
1057
3
21FL
A 270
1057
4
21FL
A 270
1057
8
21FL
A 270
1057
9
21FL
A 270
1083
0
21FL
A 270
1092
3
21FL
A 270
1092
4
21FL
CEN 2701
0075
21FL
CEN 2701
0574
21FL
CEN 2701
0579
21FL
CEN 2701
0596
21FL
CEN 2701
0830
21FL
GW 349
21
21FL
GW 349
29
21FL
GW 349
30
21FL
GW 349
31
21FL
GW 349
32
21FL
GW 349
33
21FL
GW 349
34
21FL
GW 349
35
21FL
GW 349
36
21FL
GW 349
37
21FL
GW 349
38
21FL
GW 349
39
21FL
GW 349
40
21FL
GW 349
41
21FL
GW 349
42
21FL
GW 349
43
21FL
GW 349
44
21FL
GW 349
45
21FL
GW 349
46
21FL
GW 349
47
21FL
GW 349
48
21FL
GW 349
49
21FL
GW 349
50
21FL
GW 349
51
21FL
GW 349
52
21FL
GW 349
53
21FL
GW 349
54
21FL
GW 349
55
21FL
GW 349
56
21FL
GW 349
57
21FL
GW 349
58
21FL
GW 351
6
21FL
SJWM27
0105
79
21FL
SJWMNCBTR
05
21FL
SJWMNCBTR
06
21FL
SJWMTR
11
21FL
VEMDTR03
21FL
VEMDTR04
21FL
VEMDTR05
21FL
VEMDVC-077
21FL
VEMDVC-078
21FL
VEMDVC-079
21FL
VEMDVC-TR6
21FL
WPB 2001
0739
21FL
WPB 2001
0740
21FL
WQSPVOL358
LR
STATION
0369
1215182124273033363942454851545760
TSS
(MG
/L)

Final TMDL Report Tomoka River, WBID 2634, Nutrients
Florida Department of Environmental Protection
113
CUMULATIVE FREQUENCY PLOT CHLAC
0 25 50 75 100 125 150 175 200 225 250 275 300 325 350 375 400 425 450 475 500
CHLAC (UG/L)
0.000.050.100.150.200.250.300.350.400.450.500.550.600.650.700.750.800.850.900.951.00
FRAC
TION
OF
DATA
CUMULATIVE FREQUENCY PLOT TN
0.00.30.60.91.21.51.82.12.42.73.03.33.63.94.24.54.85.15.45.76.0
TOTAL NITROGEN (MG/L)
0.000.050.100.150.200.250.300.350.400.450.500.550.600.650.700.750.800.850.900.951.00
FRAC
TION
OF
DATA

Final TMDL Report Tomoka River, WBID 2634, Nutrients
Florida Department of Environmental Protection
114
CUMULATIVE FREQUENCY PLOT TP
0.000.25
0.500.75
1.001.25
1.501.75
2.002.25
2.502.75
3.003.25
3.503.75
4.004.25
4.504.75
5.00
TOTAL PHOSPHORUS (MG/L)
0.000.050.100.150.200.250.300.350.400.450.500.550.600.650.700.750.800.850.900.951.00
FRAC
TION
OF
DATA
CUMULATIVE FREQUENCY PLOT COLOR
0 75 150 225 300 375 450 525 600 675 750 825 900 9751050
11251200
12751350
14251500
COLOR (PT-CO)
0.000.050.100.150.200.250.300.350.400.450.500.550.600.650.700.750.800.850.900.951.00
FRAC
TION
OF
DATA

Final TMDL Report Tomoka River, WBID 2634, Nutrients
Florida Department of Environmental Protection
115
CUMULATIVE FREQUENCY PLOT TSS
0 3 6 9 12 15 18 21 24 27 30 33 36 39 42 45 48 51 54 57 60
TOTAL SUSPENDED SOLIDS (MG/L)
0.000.050.100.150.200.250.300.350.400.450.500.550.600.650.700.750.800.850.900.951.00
FRAC
TION
OF
DATA
CUMULATIVE FREQUENCY PLOT TN/TP RATIO
0 10 20 30 40 50 60 70 80 90 100 110 120 130 140 150 160 170 180 190 200
TN/TP RATIO
0.000.050.100.150.200.250.300.350.400.450.500.550.600.650.700.750.800.850.900.951.00
FRAC
TION
OF D
ATA

Final TMDL Report Tomoka River, WBID 2634, Nutrients
Florida Department of Environmental Protection
116
CUMULATIVE FREQUENCY PLOT INORGN/INORGP RATIO
0 5 10 15 20 25 30 35 40 45 50 55 60 65 70 75 80 85 90 95 100
INORGN/INORGP RATIO
0.000.050.100.150.200.250.300.350.400.450.500.550.600.650.700.750.800.850.900.951.00
FRAC
TIO
N O
F DA
TA

Final TMDL Report Tomoka River, WBID 2634, Nutrients
Florida Department of Environmental Protection
117
Appendix G: Monthly and Annual Precipitation at Daytona International Airport, 1937–2011
Year Jan Feb Mar Apr May Jun Jul Aug Sep Oct Nov Dec Annual Total
1937 2.22 4.73 4.14 2.69 2.59 2.96 5.64 7.72 7.96 5.69 7.43 1.52 55.29 1938 0.73 3.18 1.69 1.04 1.96 2.84 8.36 2.82 8.14 3.23 3.93 1.37 39.29 1939 1.09 0.45 1.48 5.29 2.4 6.96 9.53 5.78 7.67 2.83 0.45 1.16 45.09 1940 1.65 2.24 1.98 2.45 0.97 5.21 8.53 4.44 8.59 0.04 0.16 4.3 40.56 1941 3.42 4.4 2.01 3.11 1.32 7.29 11.46 6.56 2.86 13.68 7.47 3.72 67.3 1942 2.15 2.52 5.68 0.98 2.35 10.12 2.38 3.73 6.54 2.67 1.06 2.22 42.4 1943 1.51 0.18 6.57 2.86 3.09 4.35 11.01 10.47 11.71 7.14 0.55 0.67 60.11 1944 1.28 0.29 7.21 2.87 0.45 8.27 14.58 9.33 6.46 4.4 0.55 0.12 55.81 1945 3.62 0.88 0.41 1.53 1.56 7 7.45 6.83 9.65 5.14 0.79 4.5 49.36 1946 1.62 2.98 1.76 0.49 2.8 4.23 8.17 10.21 10.75 3.87 2.81 0.61 50.3 1947 0.78 6.04 5.29 5.31 4.82 13.43 8.65 6.97 5.75 5.72 1.98 0.9 65.64 1948 4.52 1.22 5.13 2.37 0.49 2.4 10.43 7.33 9.82 8.29 1.07 1.93 55 1949 0.37 1.95 2.01 7.12 1.4 4.24 5.97 11.46 6.26 3.65 1.86 3.93 50.22 1950 0.15 0.59 3.53 2.79 2.13 6.45 5.56 3.88 5.86 13 0.74 2.54 47.22 1951 0.77 2.46 1.18 3.28 2.53 2.66 3.8 4.19 14.02 8.54 3.15 2.88 49.46 1952 0.66 6.76 3.01 1.66 4.39 1.35 1.25 9.02 11.92 5.41 1.96 0.71 48.1 1953 1.75 3.35 7.75 4.97 1.46 1.37 8.67 19.89 10 12.93 2.3 4.85 79.29 1954 0.37 0.86 2.33 6.29 3.21 2.35 3.5 3.04 1.88 4.91 3.98 1.24 33.96 1955 2.47 1.43 1.84 1.78 1.55 7.76 5.67 2.64 6.66 3.17 2.61 1.22 38.8 1956 2.55 0.9 0.25 2.42 2.48 7.41 3.01 4.06 1.94 5.82 0.46 0.06 31.36 1957 0.97 1.62 3.13 1.73 5.65 4.23 10.53 4.01 10.65 1.8 0.82 1.34 46.48 1958 3.94 4.73 5.52 2.24 2.27 6.06 1.96 4 2.19 8.52 1.77 1.95 45.15 1959 4.53 2.13 7.7 3.17 2.4 8.13 5.68 3.6 5.26 7.12 4.26 2.26 56.24 1960 1.16 9.13 7.52 0.76 0.62 10.75 8.7 6.84 10.96 0.97 0.53 1.24 59.18 1961 1.96 3.7 1.17 2.16 2.39 6.81 5.16 7.68 3.2 2.25 2.85 0.73 40.06 1962 0.9 0.82 1.82 0.78 0.16 7.96 10.04 8.5 8.84 3.57 2.49 0.71 46.59 1963 2.91 5.83 1.46 1.4 6.82 7.42 6.89 2.01 5.43 2.71 7.98 2.17 53.03 1964 5.29 2.65 4.84 3.61 2.58 4.73 7.67 10.81 11.39 3.54 3.13 2.52 62.76 1965 2.22 3 3.05 1 0.08 9 3.72 2.97 4.33 3.65 0.97 2.14 36.13 1966 2.89 5.58 0.36 2.56 6.77 15.19 7.09 7.93 4.49 4.6 1.19 1.6 60.25 1967 1.26 3.98 0.31 0 0.73 7.51 9.04 3.02 5.56 0.19 0 2.98 34.58 1968 0.42 1.73 1.79 0.4 4.79 14.38 6.25 11.09 6.07 7.44 2.43 1.38 58.17 1969 1.53 2.03 2.74 0.12 6.47 2.47 2.61 9.4 8.89 6.97 1.96 5.03 50.22 1970 3.94 3.79 3.59 2.08 1.68 2.62 3.65 3.61 3.54 3.87 0.31 0.72 33.4 1971 0.61 5.48 2 2.57 3.12 4.73 3.2 3.97 7.2 9.53 1.33 2.49 46.23 1972 2.37 3.97 6.66 1.41 4.02 7.06 3.22 8.29 0.42 3.08 10.96 2.48 53.94 1973 4.66 2.02 2.63 3.09 2.41 4.32 4.69 7.58 5.14 4.4 0.75 2.54 44.23 1974 0.3 1.1 3.19 0.44 2.66 8.65 6.31 9.96 10.5 1.42 0.48 2.2 47.21 1975 1.66 2.27 1.52 2.96 2.99 9 6.89 3.16 6.61 5.84 1.46 0.83 45.19 1976 0.6 0.7 2.03 4.27 12.33 11.14 1.07 3.8 5.1 1.9 3.38 6 52.32

Final TMDL Report Tomoka River, WBID 2634, Nutrients
Florida Department of Environmental Protection
118
Year Jan Feb Mar Apr May Jun Jul Aug Sep Oct Nov Dec Annual Total
1977 4.69 2.45 1.43 0.41 4.61 1.15 2.23 7.91 6.55 1.46 3.04 4.74 40.67 1978 2.89 5.98 2.31 3.3 0.56 7.48 5.53 7.99 4.63 8.31 0.07 4.89 53.94 1979 7.1 1.94 4.08 3.96 6.13 3.03 11.69 5.24 15.2 2.13 7.96 0.56 69.02 1980 3.75 0.76 2.41 2.54 3.62 5.57 5.82 4.13 1.83 2.42 3.12 1.39 37.36 1981 0.32 5.54 3 0.29 1.74 1.03 4.69 7.19 7.59 1.08 2.57 4.64 39.68 1982 2.46 2.08 5.81 6.04 4.68 8.29 5.31 3.21 4.96 3.23 1.58 2.53 50.18 1983 2.51 5.96 7.71 6.17 3.86 6.37 1.92 6.82 8.57 10.11 2.01 11.98 73.99 1984 1.46 3.44 1.31 5.29 6.04 2.84 6.77 4.02 10.73 1.09 3.52 0.2 46.71 1985 0.79 0.58 1.49 3.14 3.42 6.81 2.16 9.83 10.62 4.08 0.41 2.05 45.38 1986 7.16 1.28 1.85 0.44 0.99 3.5 14.43 3.47 3.58 3.47 5.08 2.76 48.01 1987 2.21 6.64 7.94 0.28 2.65 3.81 2.78 4.89 5.63 2.77 5.87 0.25 45.72 1988 5.36 1.72 4.57 1.68 1.78 2.39 2.94 4.79 6.81 1.24 6.7 0.93 40.91 1989 6.82 0.64 2.01 2.92 2.02 1.84 2.44 4.47 5.04 11.64 0.88 3.93 44.65 1990 1.42 5.61 1.94 1.48 1.45 2.71 5.85 7 1.61 5.88 0.83 0.34 36.12 1991 2.25 1.65 8.11 5.57 6.79 12.67 11.97 7.6 5.52 2.94 0.61 1.51 67.19 1992 2.42 1.71 2.28 2.81 3.13 10.64 0.16 8.86 6.57 5.21 2.15 0.47 46.41 1993 4.29 3.02 5.56 0.33 0.65 2.19 5.05 2.66 2.74 5.53 1.83 1.86 35.71 1994 5.6 2.66 3.44 5.05 3.09 6.54 6.91 7.08 5.93 4.72 12.91 2.71 66.64 1995 1.53 1.39 2.01 1.34 1.26 6.61 6.59 10.71 14.13 3.99 1.44 3.44 54.44 1996 5.53 1.32 12.15 2.22 2.28 11.35 1.9 5.7 3.92 11.15 0.96 2.01 60.49 1997 2.03 0.46 2.3 3.3 3.77 6.38 7.69 7.91 4.78 5.29 3.02 7.76 54.69 1998 4.33 7.25 3.97 0.14 0.16 0.83 5.63 7.56 5.79 1.84 1.66 1.35 40.51 1999 4.88 1.81 1.01 1.48 1.47 8.54 4.03 3.58 7.05 7.84 3.12 1.56 46.37 2000 1.8 0.65 8.48 1.15 0.32 3.08 5.09 3.17 13.55 0.93 1.14 0.8 40.16 2001 0.88 0.38 9.98 0.28 1.77 5.26 9.55 3.57 16.11 3.22 6.92 0.35 58.27 2002 2.01 2.76 1.51 2.53 1.66 12.3 7.35 11.56 3.86 2.94 1.85 9.61 59.94 2003 0.51 5.17 10.57 0.81 0.96 7.05 7.3 6.55 4.15 7.95 4.75 1.53 57.3 2004 1.25 4.47 1.1 1.19 0.49 5.2 10.34 17.96 16.46 1.34 0.93 2.24 62.97 2005 2.6 1.25 5.51 3.17 7.97 13.67 2.73 4.29 7.35 13.51 1.87 1.85 65.77 2006 0.24 4.33 0.08 1.11 0.78 5.72 4.48 4.81 2.97 2.53 1.1 3.21 31.36 2007 1.53 2.64 0.7 1.34 0.91 5.78 10.23 2.88 11.36 3.49 2.32 1.84 45.02 2008 1.3 2.12 3.2 1.34 0.63 3.64 9.48 10.33 4.29 4.45 0.96 0.93 42.67 2009 0.82 0.8 1.39 1.47 22.33 5.03 5.19 3.77 3.65 1.44 0.6 3.81 50.3 2010 5.92 3.92 6.2 1.04 4.74 2.86 3.88 5.83 3.49 0.18 0.95 0.38 39.39 2011 4.37 1.2 5.55 0.46 0.65 12.29 3.15 5.75 6.23 5.88 0.1 3.08 48.71 AVG 2.44 2.79 3.62 2.32 2.99 6.20 6.15 6.48 6.98 4.78 2.52 2.36 49.63
Rainfall is in inches, and represents data from DIA.

Final TMDL Report Tomoka River, WBID 2634, Nutrients
Florida Department of Environmental Protection
119
Appendix H: Spearman Correlation Matrix Analysis for Water Quality Parameters in Tomoka River
Spearman correlation matrix
CHLAC CHLORIDE COLOR COND NH4 CHLAC 1.000
CHLORIDE -0.012 1.000 COLOR -0.326 -0.707 1.000
COND 0.407 0.895 -0.682 1.000 NH4 0.078 -0.194 0.212 -0.183 1.000
NO3O2 -0.174 0.142 0.093 0.006 0.324 SALINITY 0.446 0.920 -0.688 0.841 -0.203
SO4 0.007 0.483 -0.601 0.573 -0.188 TEMPC 0.381 -0.164 -0.024 0.135 0.174
TKN 0.110 -0.603 0.613 -0.344 0.386 TN 0.088 -0.582 0.615 -0.333 0.401
TOC -0.022 -0.654 0.887 -0.756 0.373 TP 0.434 -0.046 -0.133 0.275 0.283
TSS 0.161 0.038 -0.210 0.124 -0.058 TURB 0.117 0.038 0.072 -0.025 0.032
INORGP 0.156 -0.224 0.093 0.021 0.049 INORGN -0.062 -0.011 0.226 -0.115 0.745 PRECP 0.047 -0.053 0.068 0.006 -0.004 V3DAY 0.034 -0.254 0.104 -0.113 -0.066 V7DAY 0.059 -0.338 0.132 -0.181 -0.004
V14DAY -0.028 -0.521 0.300 -0.344 0.013 V21DAY -0.099 -0.611 0.430 -0.419 0.023
NO3O2 SALINITY SO4 TEMPC TKN NO3O2 1.000
SALINITY 0.005 1.000 SO4 0.067 0.604 1.000
TEMPC 0.112 0.152 -0.143 1.000 TKN -0.040 -0.328 -0.568 0.200 1.000
TN 0.043 -0.327 -0.564 0.208 0.994 TOC -0.044 -0.736 -0.570 0.108 0.837
TP -0.084 0.275 -0.037 0.426 0.255 TSS -0.022 0.062 -0.053 0.123 -0.023
TURB 0.101 -0.063 0.016 0.001 0.137 INORGP 0.000 0.023 -0.199 0.418 0.240 INORGN 0.796 -0.149 -0.075 0.169 0.246 PRECP 0.062 -0.039 0.112 0.147 0.086 V3DAY -0.024 -0.132 0.085 0.128 0.072 V7DAY -0.054 -0.165 0.106 0.192 0.074
V14DAY -0.093 -0.319 -0.063 0.218 0.182 V21DAY -0.082 -0.386 -0.127 0.204 0.274

Final TMDL Report Tomoka River, WBID 2634, Nutrients
Florida Department of Environmental Protection
120
Spearman correlation matrix (cont.)
TN TOC TP TSS TURB TN 1.000
TOC 0.826 1.000 TP 0.266 0.046 1.000
TSS -0.025 -0.018 0.235 1.000 TURB 0.152 -0.124 0.155 0.366 1.000
INORGP 0.281 0.197 0.445 0.013 -0.022 INORGN 0.325 0.188 0.237 0.043 0.119 PRECP 0.099 0.021 0.063 -0.015 0.017 V3DAY 0.071 0.012 0.015 -0.048 0.087 V7DAY 0.068 0.009 0.077 -0.094 0.085
V14DAY 0.173 0.207 0.031 -0.158 0.052 V21DAY 0.273 0.340 0.001 -0.223 0.019
INORGP INORGN PRECP V3DAY V7DAY INORGP 1.000 INORGN 0.176 1.000 PRECP 0.091 0.059 1.000 V3DAY 0.085 -0.015 0.565 1.000 V7DAY 0.125 -0.088 0.307 0.615 1.000
V14DAY 0.226 -0.053 0.210 0.468 0.728 V21DAY 0.286 -0.055 0.188 0.423 0.633
V14DAY V21DAY V14DAY 1.000 V21DAY 0.860 1.000

Final TMDL Report Tomoka River, WBID 2634, Nutrients
Florida Department of Environmental Protection
121
Pairwise frequency table
CHLAC CHLORIDE COLOR COND NH4 CHLAC 653
CHLORIDE 180 224 COLOR 612 222 670
COND 622 211 644 690 NH4 291 197 298 286 312
NO3O2 616 199 630 612 308 SALINITY 558 141 544 573 227
SO4 178 221 221 208 197 TEMPC 649 198 641 675 304
TKN 620 199 634 617 311 TN 596 199 609 596 309
TOC 178 177 182 180 180 TP 615 197 630 613 308
TSS 558 183 572 563 237 TURB 611 188 624 620 285
INORGP 484 158 510 494 206 INORGN 284 197 290 278 304 PRECP 653 224 670 690 312 V3DAY 653 224 670 690 312 V7DAY 653 224 670 690 312
V14DAY 653 224 670 690 312 V21DAY 653 224 670 690 312
NO3O2 SALINITY SO4 TEMPC TKN NO3O2 649
SALINITY 537 587 SO4 199 140 222
TEMPC 638 587 196 738 TKN 640 542 199 643 654
TN 623 517 199 618 626 TOC 182 138 176 181 182
TP 629 537 197 639 640 TSS 562 507 182 575 569
TURB 617 549 188 636 624 INORGP 505 438 156 504 501 INORGN 304 224 197 296 304 PRECP 649 587 222 738 654 V3DAY 649 587 222 738 654 V7DAY 649 587 222 738 654
V14DAY 649 587 222 738 654 V21DAY 649 587 222 738 654

Final TMDL Report Tomoka River, WBID 2634, Nutrients
Florida Department of Environmental Protection
122
Pairwise frequency table (cont.)
TN TOC TP TSS TURB TN 628
TOC 182 182 TP 613 178 649
TSS 544 179 564 579 TURB 597 177 617 574 642
INORGP 480 139 493 492 493 INORGN 304 180 300 234 278 PRECP 628 182 649 579 642 V3DAY 628 182 649 579 642 V7DAY 628 182 649 579 642
V14DAY 628 182 649 579 642 V21DAY 628 182 649 579 642
INORGP INORGN PRECP V3DAY V7DAY INORGP 516 INORGN 203 304 PRECP 516 304 771 V3DAY 516 304 771 771 V7DAY 516 304 771 771 771
V14DAY 516 304 771 771 771 V21DAY 516 304 771 771 771
V14DAY V21DAY V14DAY 771 V21DAY 771 771
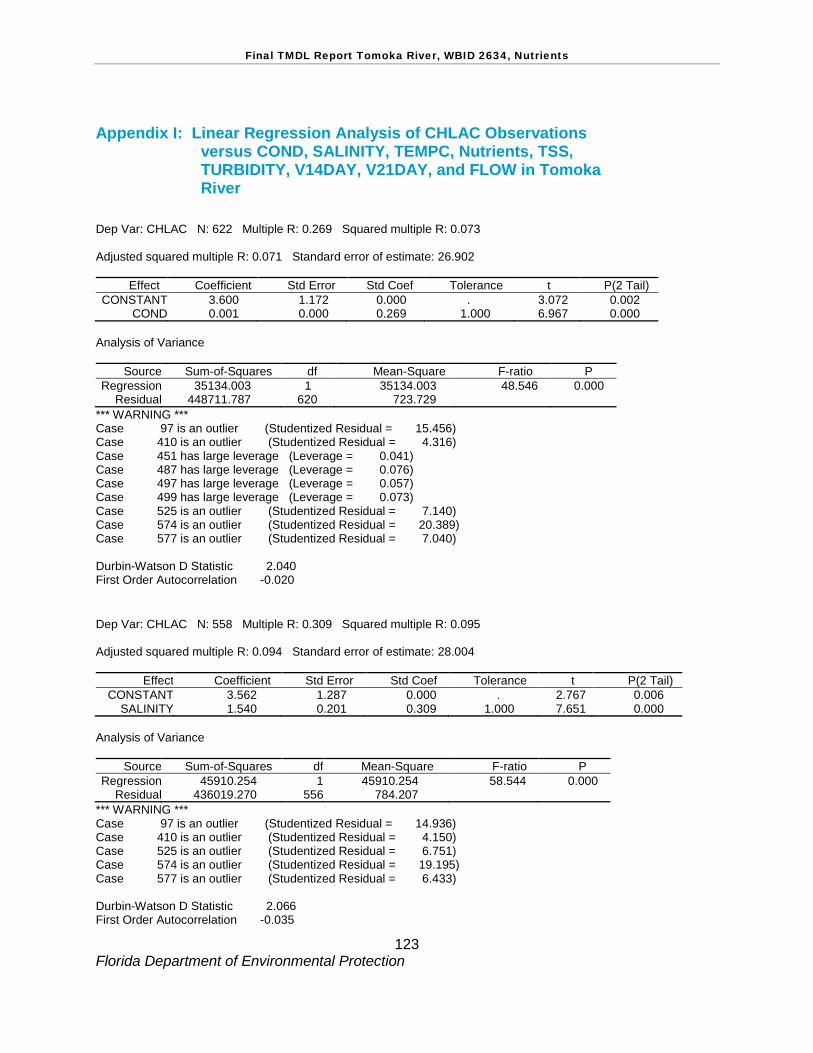
Final TMDL Report Tomoka River, WBID 2634, Nutrients
Florida Department of Environmental Protection
123
Appendix I: Linear Regression Analysis of CHLAC Observations versus COND, SALINITY, TEMPC, Nutrients, TSS, TURBIDITY, V14DAY, V21DAY, and FLOW in Tomoka River
Dep Var: CHLAC N: 622 Multiple R: 0.269 Squared multiple R: 0.073 Adjusted squared multiple R: 0.071 Standard error of estimate: 26.902
Effect Coefficient Std Error Std Coef Tolerance t P(2 Tail) CONSTANT 3.600 1.172 0.000 . 3.072 0.002
COND 0.001 0.000 0.269 1.000 6.967 0.000 Analysis of Variance
Source Sum-of-Squares df Mean-Square F-ratio P Regression 35134.003 1 35134.003 48.546 0.000
Residual 448711.787 620 723.729 *** WARNING *** Case 97 is an outlier (Studentized Residual = 15.456) Case 410 is an outlier (Studentized Residual = 4.316) Case 451 has large leverage (Leverage = 0.041) Case 487 has large leverage (Leverage = 0.076) Case 497 has large leverage (Leverage = 0.057) Case 499 has large leverage (Leverage = 0.073) Case 525 is an outlier (Studentized Residual = 7.140) Case 574 is an outlier (Studentized Residual = 20.389) Case 577 is an outlier (Studentized Residual = 7.040) Durbin-Watson D Statistic 2.040 First Order Autocorrelation -0.020 Dep Var: CHLAC N: 558 Multiple R: 0.309 Squared multiple R: 0.095 Adjusted squared multiple R: 0.094 Standard error of estimate: 28.004
Effect Coefficient Std Error Std Coef Tolerance t P(2 Tail) CONSTANT 3.562 1.287 0.000 . 2.767 0.006
SALINITY 1.540 0.201 0.309 1.000 7.651 0.000 Analysis of Variance
Source Sum-of-Squares df Mean-Square F-ratio P Regression 45910.254 1 45910.254 58.544 0.000
Residual 436019.270 556 784.207 *** WARNING *** Case 97 is an outlier (Studentized Residual = 14.936) Case 410 is an outlier (Studentized Residual = 4.150) Case 525 is an outlier (Studentized Residual = 6.751) Case 574 is an outlier (Studentized Residual = 19.195) Case 577 is an outlier (Studentized Residual = 6.433) Durbin-Watson D Statistic 2.066 First Order Autocorrelation -0.035

Final TMDL Report Tomoka River, WBID 2634, Nutrients
Florida Department of Environmental Protection
124
Dep Var: CHLAC N: 649 Multiple R: 0.191 Squared multiple R: 0.036 Adjusted squared multiple R: 0.035 Standard error of estimate: 26.869
Effect Coefficient Std Error Std Coef Tolerance t P(2 Tail) CONSTANT -14.559 4.420 0.000 . -3.294 0.001
TEMPC 0.989 0.200 0.191 1.000 4.944 0.000 Analysis of Variance
Source Sum-of-Squares df Mean-Square F-ratio P Regression 17644.051 1 17644.051 24.439 0.000
Residual 467110.255 647 721.963 *** WARNING *** Case 97 is an outlier (Studentized Residual = 15.070) Case 410 is an outlier (Studentized Residual = 4.149) Case 525 is an outlier (Studentized Residual = 7.270) Case 574 is an outlier (Studentized Residual = 21.058) Case 577 is an outlier (Studentized Residual = 7.577) Durbin-Watson D Statistic 1.923 First Order Autocorrelation 0.038 Dep Var: CHLAC N: 616 Multiple R: 0.095 Squared multiple R: 0.009 Adjusted squared multiple R: 0.007 Standard error of estimate: 28.610
Effect Coefficient Std Error Std Coef Tolerance t P(2 Tail) CONSTANT 9.213 1.473 0.000 . 6.256 0.000
NO3O2 -43.746 18.414 -0.095 1.000 -2.376 0.018 Analysis of Variance
Source Sum-of-Squares df Mean-Square F-ratio P Regression 4619.881 1 4619.881 5.644 0.018
Residual 502582.416 614 818.538 *** WARNING *** Case 76 has large leverage (Leverage = 0.031) Case 97 is an outlier (Studentized Residual = 14.009) Case 115 has large leverage (Leverage = 0.138) Case 251 has large leverage (Leverage = 0.132) Case 267 has large leverage (Leverage = 0.039) Case 275 has large leverage (Leverage = 0.048) Case 525 is an outlier (Studentized Residual = 6.954) Case 574 is an outlier (Studentized Residual = 19.719) Case 577 is an outlier (Studentized Residual = 7.335) Case 652 is an outlier (Studentized Residual = 5.439) Case 660 has large leverage (Leverage = 0.146) Case 666 has large leverage (Leverage = 0.086) Durbin-Watson D Statistic 1.883 First Order Autocorrelation 0.058
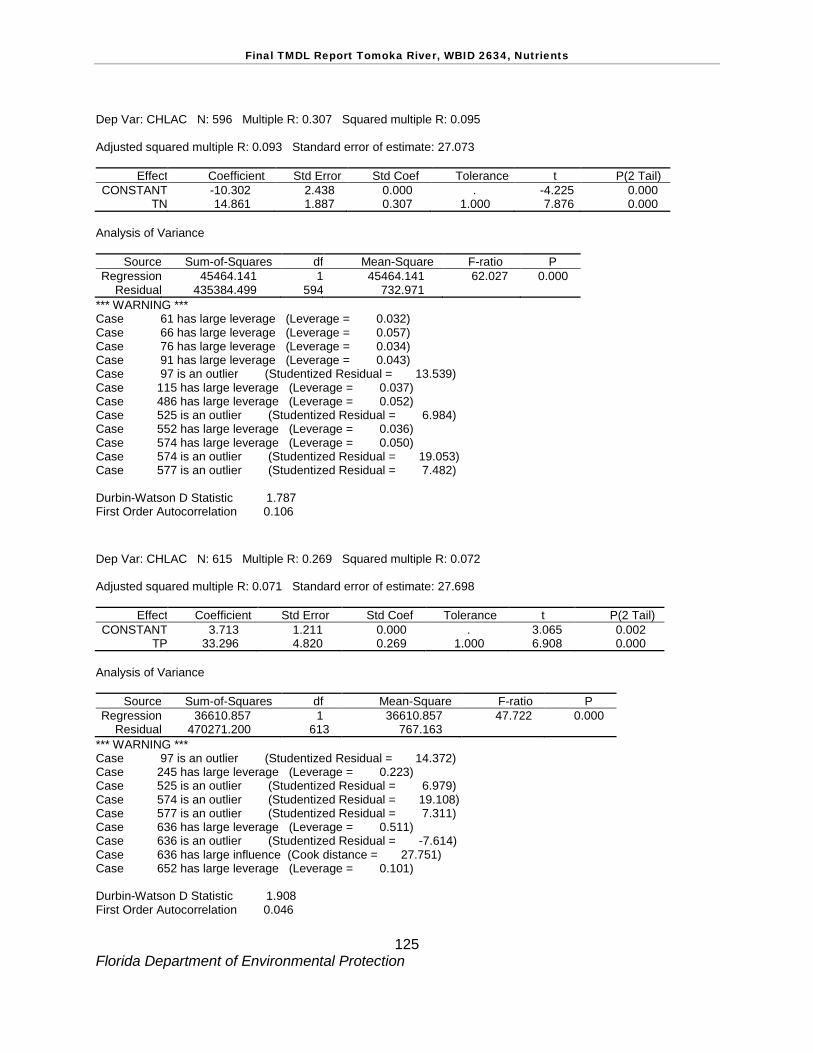
Final TMDL Report Tomoka River, WBID 2634, Nutrients
Florida Department of Environmental Protection
125
Dep Var: CHLAC N: 596 Multiple R: 0.307 Squared multiple R: 0.095 Adjusted squared multiple R: 0.093 Standard error of estimate: 27.073
Effect Coefficient Std Error Std Coef Tolerance t P(2 Tail) CONSTANT -10.302 2.438 0.000 . -4.225 0.000
TN 14.861 1.887 0.307 1.000 7.876 0.000 Analysis of Variance
Source Sum-of-Squares df Mean-Square F-ratio P Regression 45464.141 1 45464.141 62.027 0.000
Residual 435384.499 594 732.971 *** WARNING *** Case 61 has large leverage (Leverage = 0.032) Case 66 has large leverage (Leverage = 0.057) Case 76 has large leverage (Leverage = 0.034) Case 91 has large leverage (Leverage = 0.043) Case 97 is an outlier (Studentized Residual = 13.539) Case 115 has large leverage (Leverage = 0.037) Case 486 has large leverage (Leverage = 0.052) Case 525 is an outlier (Studentized Residual = 6.984) Case 552 has large leverage (Leverage = 0.036) Case 574 has large leverage (Leverage = 0.050) Case 574 is an outlier (Studentized Residual = 19.053) Case 577 is an outlier (Studentized Residual = 7.482) Durbin-Watson D Statistic 1.787 First Order Autocorrelation 0.106 Dep Var: CHLAC N: 615 Multiple R: 0.269 Squared multiple R: 0.072 Adjusted squared multiple R: 0.071 Standard error of estimate: 27.698
Effect Coefficient Std Error Std Coef Tolerance t P(2 Tail) CONSTANT 3.713 1.211 0.000 . 3.065 0.002
TP 33.296 4.820 0.269 1.000 6.908 0.000 Analysis of Variance
Source Sum-of-Squares df Mean-Square F-ratio P Regression 36610.857 1 36610.857 47.722 0.000
Residual 470271.200 613 767.163 *** WARNING *** Case 97 is an outlier (Studentized Residual = 14.372) Case 245 has large leverage (Leverage = 0.223) Case 525 is an outlier (Studentized Residual = 6.979) Case 574 is an outlier (Studentized Residual = 19.108) Case 577 is an outlier (Studentized Residual = 7.311) Case 636 has large leverage (Leverage = 0.511) Case 636 is an outlier (Studentized Residual = -7.614) Case 636 has large influence (Cook distance = 27.751) Case 652 has large leverage (Leverage = 0.101) Durbin-Watson D Statistic 1.908 First Order Autocorrelation 0.046

Final TMDL Report Tomoka River, WBID 2634, Nutrients
Florida Department of Environmental Protection
126
Dep Var: CHLAC N: 558 Multiple R: 0.254 Squared multiple R: 0.065 Adjusted squared multiple R: 0.063 Standard error of estimate: 18.926
Effect Coefficient Std Error Std Coef Tolerance t P(2 Tail) CONSTANT 0.572 1.064 0.000 . 0.537 0.591
TSS 1.000 0.161 0.254 1.000 6.194 0.000 Analysis of Variance
Source Sum-of-Squares df Mean-Square F-ratio P Regression 13742.446 1 13742.446 38.368 0.000
Residual 199146.513 556 358.177 *** WARNING *** Case 72 has large leverage (Leverage = 0.043) Case 97 is an outlier (Studentized Residual = 27.413) Case 244 has large leverage (Leverage = 0.041) Case 289 has large leverage (Leverage = 0.134) Case 376 has large leverage (Leverage = 0.142) Case 410 is an outlier (Studentized Residual = 5.603) Case 525 is an outlier (Studentized Residual = 10.488) Case 535 is an outlier (Studentized Residual = 4.063) Case 626 has large leverage (Leverage = 0.084) Case 644 has large leverage (Leverage = 0.188) Durbin-Watson D Statistic 1.911 First Order Autocorrelation 0.043 Dep Var: CHLAC N: 611 Multiple R: 0.190 Squared multiple R: 0.036 Adjusted squared multiple R: 0.035 Standard error of estimate: 28.324
Effect Coefficient Std Error Std Coef Tolerance t P(2 Tail) CONSTANT 3.664 1.348 0.000 . 2.718 0.007
TURB 0.893 0.187 0.190 1.000 4.785 0.000 Analysis of Variance
Source Sum-of-Squares df Mean-Square F-ratio P Regression 18368.330 1 18368.330 22.896 0.000
Residual 488568.568 609 802.247 *** WARNING *** Case 97 is an outlier (Studentized Residual = 13.880) Case 246 has large leverage (Leverage = 0.062) Case 289 has large leverage (Leverage = 0.281) Case 376 has large leverage (Leverage = 0.154) Case 525 is an outlier (Studentized Residual = 6.704) Case 547 has large leverage (Leverage = 0.072) Case 574 is an outlier (Studentized Residual = 19.517) Case 577 is an outlier (Studentized Residual = 7.313) Case 644 has large leverage (Leverage = 0.215) Case 652 is an outlier (Studentized Residual = 4.897) Durbin-Watson D Statistic 1.870 First Order Autocorrelation 0.065

Final TMDL Report Tomoka River, WBID 2634, Nutrients
Florida Department of Environmental Protection
127
Dep Var: CHLAC N: 653 Multiple R: 0.090 Squared multiple R: 0.008 Adjusted squared multiple R: 0.007 Standard error of estimate: 27.834
Effect Coefficient Std Error Std Coef Tolerance t P(2 Tail) CONSTANT 9.335 1.520 0.000 . 6.143 0.000
V14DAY -1.263 0.546 -0.090 1.000 -2.315 0.021 Analysis of Variance
Source Sum-of-Squares df Mean-Square F-ratio P Regression 4150.933 1 4150.933 5.358 0.021
Residual 504361.304 651 774.749 *** WARNING *** Case 16 has large leverage (Leverage = 0.039) Case 77 has large leverage (Leverage = 0.039) Case 97 is an outlier (Studentized Residual = 14.374) Case 525 is an outlier (Studentized Residual = 7.155) Case 574 is an outlier (Studentized Residual = 20.281) Case 577 is an outlier (Studentized Residual = 7.559) Case 594 has large leverage (Leverage = 0.039) Case 595 has large leverage (Leverage = 0.039) Case 652 is an outlier (Studentized Residual = 5.581) Durbin-Watson D Statistic 1.875 First Order Autocorrelation 0.062 Dep Var: CHLAC N: 653 Multiple R: 0.105 Squared multiple R: 0.011 Adjusted squared multiple R: 0.009 Standard error of estimate: 27.795
Effect Coefficient Std Error Std Coef Tolerance t P(2 Tail) CONSTANT 10.004 1.591 0.000 . 6.288 0.000
V21DAY -1.076 0.400 -0.105 1.000 -2.688 0.007 Analysis of Variance
Source Sum-of-Squares df Mean-Square F-ratio P Regression 5582.036 1 5582.036 7.225 0.007
Residual 502930.202 651 772.550 *** WARNING *** Case 77 has large leverage (Leverage = 0.074) Case 97 is an outlier (Studentized Residual = 14.370) Case 525 is an outlier (Studentized Residual = 7.191) Case 574 is an outlier (Studentized Residual = 20.303) Case 577 is an outlier (Studentized Residual = 7.557) Case 652 is an outlier (Studentized Residual = 5.563) Durbin-Watson D Statistic 1.884 First Order Autocorrelation 0.058

Final TMDL Report Tomoka River, WBID 2634, Nutrients
Florida Department of Environmental Protection
128
Dep Var: CHLAC N: 653 Multiple R: 0.099 Squared multiple R: 0.010 Adjusted squared multiple R: 0.008 Standard error of estimate: 27.811
Effect Coefficient Std Error Std Coef Tolerance t P(2 Tail) CONSTANT 8.491 1.260 0.000 . 6.741 0.000
FLOW -0.032 0.013 -0.099 1.000 -2.537 0.011 Analysis of Variance
Source Sum-of-Squares df Mean-Square F-ratio P Regression 4977.252 1 4977.252 6.435 0.011
Residual 503534.985 651 773.479 *** WARNING *** Case 56 has large leverage (Leverage = 0.121) Case 57 has large leverage (Leverage = 0.121) Case 61 has large leverage (Leverage = 0.075) Case 62 has large leverage (Leverage = 0.075) Case 63 has large leverage (Leverage = 0.075) Case 122 is an outlier (Studentized Residual = 5.609) Case 127 has large leverage (Leverage = 0.038) Case 128 has large leverage (Leverage = 0.038) Case 129 has large leverage (Leverage = 0.038) Case 162 is an outlier (Studentized Residual = 7.178) Case 278 has large leverage (Leverage = 0.080) Case 279 has large leverage (Leverage = 0.080) Case 444 has large leverage (Leverage = 0.029) Case 445 has large leverage (Leverage = 0.029) Case 538 has large leverage (Leverage = 0.032) Case 638 is an outlier (Studentized Residual = 20.299) Case 639 is an outlier (Studentized Residual = 7.561) Case 647 has large leverage (Leverage = 0.029) Case 705 is an outlier (Studentized Residual = 14.396) Durbin-Watson D Statistic 1.322 First Order Autocorrelation 0.339

Final TMDL Report Tomoka River, WBID 2634, Nutrients
Florida Department of Environmental Protection
129
Appendix J: Linear Regression Analysis of Annual Average CHLAC Observations versus COND, SALINITY, TEMPC, Nutrients, Rainfall, Rainfall Deficits, and Annual Stream Flow in Tomoka River
Dep Var: CHLAC N: 20 Multiple R: 0.562 Squared multiple R: 0.315 Adjusted squared multiple R: 0.277 Standard error of estimate: 3.219
Effect Coefficient Std Error Std Coef Tolerance t P(2 Tail) CONSTANT 1.422 1.376 0.000 . 1.033 0.315
COND 0.001 0.000 0.562 1.000 2.880 0.010 Analysis of Variance
Source Sum-of-Squares df Mean-Square F-ratio P Regression 85.926 1 85.926 8.292 0.010
Residual 186.523 18 10.362 *** WARNING *** Case 2 is an outlier (Studentized Residual = 2.754) Durbin-Watson D Statistic 0.965 First Order Autocorrelation 0.466 Dep Var: CHLAC N: 16 Multiple R: 0.680 Squared multiple R: 0.462 Adjusted squared multiple R: 0.423 Standard error of estimate: 2.286
Effect Coefficient Std Error Std Coef Tolerance t P(2 Tail) CONSTANT 1.172 0.977 0.000 . 1.200 0.250
INORGN 23.144 6.677 0.680 1.000 3.466 0.004 Analysis of Variance
Source Sum-of-Squares df Mean-Square F-ratio P Regression 62.759 1 62.759 12.014 0.004
Residual 73.135 14 5.224 *** WARNING *** Case 17 has large leverage (Leverage = 0.746) Case 18 is an outlier (Studentized Residual = 6.378) Durbin-Watson D Statistic 1.291 First Order Autocorrelation 0.304

Final TMDL Report Tomoka River, WBID 2634, Nutrients
Florida Department of Environmental Protection
130
Dep Var: CHLAC N: 16 Multiple R: 0.692 Squared multiple R: 0.479 Adjusted squared multiple R: 0.441 Standard error of estimate: 2.249
Effect Coefficient Std Error Std Coef Tolerance t P(2 Tail) CONSTANT 2.059 0.765 0.000 . 2.691 0.018
NH4 31.313 8.733 0.692 1.000 3.586 0.003 Analysis of Variance
Source Sum-of-Squares df Mean-Square F-ratio P Regression 65.056 1 65.056 12.857 0.003
Residual 70.839 14 5.060 *** WARNING *** Case 17 has large leverage (Leverage = 0.751) Case 18 is an outlier (Studentized Residual = 5.860) Durbin-Watson D Statistic 1.238 First Order Autocorrelation 0.311 Dep Var: CHLAC N: 20 Multiple R: 0.177 Squared multiple R: 0.031 Adjusted squared multiple R: 0.000 Standard error of estimate: 3.829
Effect Coefficient Std Error Std Coef Tolerance t P(2 Tail) CONSTANT 3.353 2.081 0.000 . 1.611 0.125
NO3O2 28.355 37.158 0.177 1.000 0.763 0.455 Analysis of Variance
Source Sum-of-Squares df Mean-Square F-ratio P Regression 8.537 1 8.537 0.582 0.455
Residual 263.911 18 14.662 *** WARNING *** Case 2 is an outlier (Studentized Residual = 3.334) Case 17 has large leverage (Leverage = 0.657) Durbin-Watson D Statistic 0.673 First Order Autocorrelation 0.571
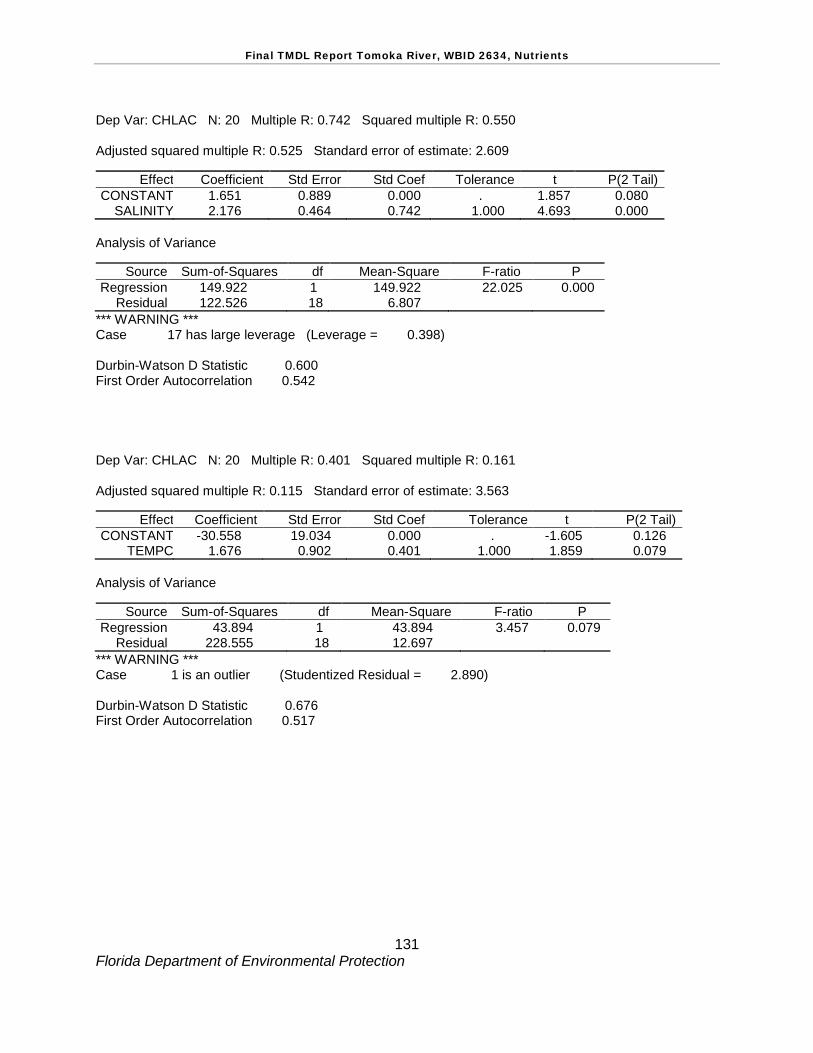
Final TMDL Report Tomoka River, WBID 2634, Nutrients
Florida Department of Environmental Protection
131
Dep Var: CHLAC N: 20 Multiple R: 0.742 Squared multiple R: 0.550 Adjusted squared multiple R: 0.525 Standard error of estimate: 2.609
Effect Coefficient Std Error Std Coef Tolerance t P(2 Tail) CONSTANT 1.651 0.889 0.000 . 1.857 0.080
SALINITY 2.176 0.464 0.742 1.000 4.693 0.000 Analysis of Variance
Source Sum-of-Squares df Mean-Square F-ratio P Regression 149.922 1 149.922 22.025 0.000
Residual 122.526 18 6.807 *** WARNING *** Case 17 has large leverage (Leverage = 0.398) Durbin-Watson D Statistic 0.600 First Order Autocorrelation 0.542 Dep Var: CHLAC N: 20 Multiple R: 0.401 Squared multiple R: 0.161 Adjusted squared multiple R: 0.115 Standard error of estimate: 3.563
Effect Coefficient Std Error Std Coef Tolerance t P(2 Tail) CONSTANT -30.558 19.034 0.000 . -1.605 0.126
TEMPC 1.676 0.902 0.401 1.000 1.859 0.079 Analysis of Variance
Source Sum-of-Squares df Mean-Square F-ratio P Regression 43.894 1 43.894 3.457 0.079
Residual 228.555 18 12.697 *** WARNING *** Case 1 is an outlier (Studentized Residual = 2.890) Durbin-Watson D Statistic 0.676 First Order Autocorrelation 0.517

Final TMDL Report Tomoka River, WBID 2634, Nutrients
Florida Department of Environmental Protection
132
Dep Var: CHLAC N: 20 Multiple R: 0.566 Squared multiple R: 0.320 Adjusted squared multiple R: 0.282 Standard error of estimate: 3.208
Effect Coefficient Std Error Std Coef Tolerance t P(2 Tail) CONSTANT -4.258 3.193 0.000 . -1.334 0.199
TN 8.099 2.782 0.566 1.000 2.911 0.009 Analysis of Variance
Source Sum-of-Squares df Mean-Square F-ratio P Regression 87.217 1 87.217 8.475 0.009
Residual 185.231 18 10.291 *** WARNING *** Case 2 is an outlier (Studentized Residual = 3.923) Case 17 has large leverage (Leverage = 0.420) Durbin-Watson D Statistic 1.121 First Order Autocorrelation 0.364 Dep Var: CHLAC N: 20 Multiple R: 0.608 Squared multiple R: 0.370 Adjusted squared multiple R: 0.335 Standard error of estimate: 3.088
Effect Coefficient Std Error Std Coef Tolerance t P(2 Tail) CONSTANT 1.930 1.120 0.000 . 1.723 0.102
TP 30.671 9.431 0.608 1.000 3.252 0.004 Analysis of Variance
Source Sum-of-Squares df Mean-Square F-ratio P Regression 100.840 1 100.840 10.577 0.004
Residual 171.608 18 9.534 *** WARNING *** Case 2 has large leverage (Leverage = 0.595) Durbin-Watson D Statistic 0.875 First Order Autocorrelation 0.485

Final TMDL Report Tomoka River, WBID 2634, Nutrients
Florida Department of Environmental Protection
133
Dep Var: CHLAC N: 13 Multiple R: 0.068 Squared multiple R: 0.005 Adjusted squared multiple R: 0.000 Standard error of estimate: 3.353
Effect Coefficient Std Error Std Coef Tolerance t P(2 Tail) CONSTANT 4.006 1.809 0.000 . 2.214 0.049
TNLOAD -0.000 0.000 -0.068 1.000 -0.225 0.826 Analysis of Variance
Source Sum-of-Squares df Mean-Square F-ratio P Regression 0.571 1 0.571 0.051 0.826
Residual 123.648 11 11.241 *** WARNING *** Case 14 has large leverage (Leverage = 0.562) Case 18 is an outlier (Studentized Residual = 3.285) Durbin-Watson D Statistic 0.720 First Order Autocorrelation 0.392 Dep Var: CHLAC N: 13 Multiple R: 0.079 Squared multiple R: 0.006 Adjusted squared multiple R: 0.000 Standard error of estimate: 3.350
Effect Coefficient Std Error Std Coef Tolerance t P(2 Tail) CONSTANT 4.170 2.168 0.000 . 1.924 0.081
TPLOAD -0.000 0.000 -0.079 1.000 -0.263 0.798 Analysis of Variance
Source Sum-of-Squares df Mean-Square F-ratio P Regression 0.774 1 0.774 0.069 0.798
Residual 123.446 11 11.222 *** WARNING *** Case 14 has large leverage (Leverage = 0.594) Case 18 is an outlier (Studentized Residual = 3.284) Durbin-Watson D Statistic 0.727 First Order Autocorrelation 0.389

Final TMDL Report Tomoka River, WBID 2634, Nutrients
Florida Department of Environmental Protection
134
Dep Var: CHLAC N: 20 Multiple R: 0.361 Squared multiple R: 0.130 Adjusted squared multiple R: 0.082 Standard error of estimate: 3.629
Effect Coefficient Std Error Std Coef Tolerance t P(2 Tail) CONSTANT 11.469 4.145 0.000 . 2.767 0.013
RAINFALL -0.132 0.081 -0.361 1.000 -1.641 0.118 Analysis of Variance
Source Sum-of-Squares df Mean-Square F-ratio P Regression 35.446 1 35.446 2.692 0.118
Residual 237.003 18 13.167 Durbin-Watson D Statistic 0.788 First Order Autocorrelation 0.532 Dep Var: CHLAC N: 20 Multiple R: 0.467 Squared multiple R: 0.218 Adjusted squared multiple R: 0.175 Standard error of estimate: 3.440
Effect Coefficient Std Error Std Coef Tolerance t P(2 Tail) CONSTANT 5.167 0.786 0.000 . 6.570 0.000
CUM3YRDEFICI -0.095 0.042 -0.467 1.000 -2.241 0.038 Analysis of Variance
Source Sum-of-Squares df Mean-Square F-ratio P Regression 59.450 1 59.450 5.024 0.038
Residual 212.999 18 11.833 *** WARNING *** Case 2 is an outlier (Studentized Residual = 3.072) Durbin-Watson D Statistic 0.876 First Order Autocorrelation 0.475

Final TMDL Report Tomoka River, WBID 2634, Nutrients
Florida Department of Environmental Protection
135
Dep Var: CHLAC N: 20 Multiple R: 0.586 Squared multiple R: 0.343 Adjusted squared multiple R: 0.306 Standard error of estimate: 3.154
Effect Coefficient Std Error Std Coef Tolerance t P(2 Tail) CONSTANT 5.410 0.733 0.000 . 7.384 0.000
CUM5YRDEFIC -0.099 0.032 -0.586 1.000 -3.065 0.007 Analysis of Variance
Source Sum-of-Squares df Mean-Square F-ratio P Regression 93.443 1 93.443 9.396 0.007
Residual 179.006 18 9.945 Durbin-Watson D Statistic 1.062 First Order Autocorrelation 0.404 Dep Var: CHLAC N: 20 Multiple R: 0.328 Squared multiple R: 0.108 Adjusted squared multiple R: 0.058 Standard error of estimate: 3.675
Effect Coefficient Std Error Std Coef Tolerance t P(2 Tail) CONSTANT 6.717 1.537 0.000 . 4.370 0.000
ANNUALFLOW -0.037 0.025 -0.328 1.000 -1.476 0.157 Analysis of Variance
Source Sum-of-Squares df Mean-Square F-ratio P Regression 29.399 1 29.399 2.177 0.157
Residual 243.050 18 13.503 Durbin-Watson D Statistic 0.891 First Order Autocorrelation 0.476

Final TMDL Report Tomoka River, WBID 2634, Nutrients
Florida Department of Environmental Protection
136
Dep Var: CHLAC N: 20 Multiple R: 0.815 Squared multiple R: 0.665 Adjusted squared multiple R: 0.602 Standard error of estimate: 2.389
Effect Coefficient Std Error Std Coef Tolerance t P(2 Tail) CONSTANT 2.453 6.081 0.000 . 0.403 0.692
TN -0.892 5.828 -0.062 0.126 -0.153 0.880 TP -62.029 60.932 -1.230 0.014 -1.018 0.324
TP*TN 85.625 57.701 1.941 0.012 1.484 0.157 Analysis of Variance
Source Sum-of-Squares df Mean-Square F-ratio P Regression 181.101 3 60.367 10.574 0.000
Residual 91.348 16 5.709 *** WARNING *** Case 2 has large leverage (Leverage = 0.625) Case 3 is an outlier (Studentized Residual = -4.009) Durbin-Watson D Statistic 1.310 First Order Autocorrelation 0.268

Final TMDL Report Tomoka River, WBID 2634, Nutrients
Florida Department of Environmental Protection
137
Appendix K: Annual and Monthly Average Precipitation Plots for Daytona International Airport

Final TMDL Report Tomoka River, WBID 2634, Nutrients
Florida Department of Environmental Protection
138

Final TMDL Report Tomoka River, WBID 2634, Nutrients
Florida Department of Environmental Protection
139
YEAR ANNUAL
TOTAL (INCHES)
RANK PERCENTILE
1956 31.36 1 1.33% 2006 31.36 2 2.67% 1970 33.4 3 4.00% 1954 33.96 4 5.33% 1967 34.58 5 6.67% 1993 35.71 6 8.00% 1990 36.12 7 9.33% 1965 36.13 8 10.67% 1980 37.36 9 12.00% 1955 38.8 10 13.33% 1938 39.29 11 14.67% 2010 39.39 12 16.00% 1981 39.68 13 17.33% 1961 40.06 14 18.67% 2000 40.16 15 20.00% 1998 40.51 16 21.33% 1940 40.56 17 22.67% 1977 40.67 18 24.00% 1988 40.91 19 25.33% 1942 42.4 20 26.67% 2008 42.67 21 28.00% 1973 44.23 22 29.33% 1989 44.65 23 30.67% 2007 45.02 24 32.00% 1939 45.09 25 33.33% 1958 45.15 26 34.67% 1975 45.19 27 36.00% 1985 45.38 28 37.33% 1987 45.72 29 38.67% 1971 46.23 30 40.00% 1999 46.37 31 41.33% 1992 46.41 32 42.67% 1957 46.48 33 44.00% 1962 46.59 34 45.33%

Final TMDL Report Tomoka River, WBID 2634, Nutrients
Florida Department of Environmental Protection
140
YEAR ANNUAL TOTAL
(INCHES)
RANK PERCENTILE
1984 46.71 35 46.67% 1974 47.21 36 48.00% 1950 47.22 37 49.33% 1986 48.01 38 50.67% 1952 48.1 39 52.00% 2011 48.71 40 53.33% 1945 49.36 41 54.67% 1951 49.46 42 56.00% 1982 50.18 43 57.33% 1949 50.22 44 58.67% 1969 50.22 45 60.00% 1946 50.3 46 61.33% 2009 50.3 47 62.67% 1976 52.32 48 64.00% 1963 53.03 49 65.33% 1972 53.94 50 66.67% 1978 53.94 51 68.00% 1995 54.44 52 69.33% 1997 54.69 53 70.67% 1948 55 54 72.00% 1937 55.29 55 73.33% 1944 55.81 56 74.67% 1959 56.24 57 76.00% 2003 57.3 58 77.33% 1968 58.17 59 78.67% 2001 58.27 60 80.00% 1960 59.18 61 81.33% 2002 59.94 62 82.67% 1943 60.11 63 84.00% 1966 60.25 64 85.33% 1996 60.49 65 86.67% 1964 62.76 66 88.00% 2004 62.97 67 89.33% 1947 65.64 68 90.67% 2005 65.77 69 92.00%

Final TMDL Report Tomoka River, WBID 2634, Nutrients
Florida Department of Environmental Protection
141
YEAR ANNUAL TOTAL
(INCHES)
RANK PERCENTILE
1994 66.64 70 93.33% 1991 67.19 71 94.67% 1941 67.3 72 96.00% 1979 69.02 73 97.33% 1983 73.99 74 98.67% 1953 79.29 75 100.00%

Final TMDL Report Tomoka River, WBID 2634, Nutrients
Florida Department of Environmental Protection
142
Appendix L: Response to Comments from September 2012 Workshop Ms. Kelly Young –Volusia County Environmental Health Lab (9/26/ 2012) email Good afternoon! The attached file contains data to hopefully add to, and in some cases detract from the data used to determine the Halifax and Tomoka TMDLs. It was determined that some data that could have been used to support the credibility of some data was never submitted to Storet, and a portion of that data is within the attached file. Unfortunately, much of this data is no longer available in its original form, and the only information available is from spreadsheets with no qualifier code information. Several values for chlorophyll and total nitrogen should not be used for determining TMDLs due to this lack of information. Some obvious unreliable data has been set in bold text, but please use your best scientific judgement on using the data attached. More data is to follow when I get additional results from the City of Daytona Beach Water Testing Lab. Please note that the data included in the file's tab 'City of Daytona Beach data' is from the city lab, and tabs 'Halifax' and 'Tomoka' each have a column indicating the lab that processed the sample for the particular parameter listed. The city lab collects and processes (except for chlorophyll) samples monthly from the Daytona area of the Halifax river which includes stations HL08, HL09, HL10, HL11, HL11a, HL12, HL12a, and 13a. Originally, the only data available from this monthly collection was occasionally field data and chlorophyll data (as I was the one processing these samples for chlorophyll in the VCEH lab, and I began including this data along with the other data I sent to Storet). The other tabs in the file (Halifax and Tomoka) are a group effort project. Samples from the Tomoka and Halifax were collected monthly until the year 2000. Since then, they have been collected quarterly. The City of Daytona Beach lab collected all samples for the Tomoka River and stations HL01 through HL10. The city lab also processed all samples for TP, TKN, Turbidity, and TSS. The Volusia County Environmental Health lab (VCEH) collected stations HL11-20 and processed all other parameters. I'm sorry for the format of the attached files, however I'm in the process of putting it into a more user friendly format and will send that as soon as I can. I hope to provide additional info soon. Sorry for the delay. Sincerely, Kelly Young Response: We really appreciate the time and effort you spent compiling water quality data collected by both the City of Daytona Beach and Volusia County. I have used your spreadsheet to add additional water quality observations to the data base used in the draft TMDL that had not been included in Florida STORET as well as correct some data errors that were present in data obtained from Florida STORET. Analyses presented in the draft TMDL were rerun using the updated data base and are reflected in this revised TMDL. Comments prepared on behalf of FDOT by Applied Technology and Management, Inc.
COMMENTS ON FDEP Proposed Total Maximum Daily Load for Nutrients
Tomoka River, Fresh Water (WBID 2634)

Final TMDL Report Tomoka River, WBID 2634, Nutrients
Florida Department of Environmental Protection
143
September 21, 2012
TMDL SUMMARY TMDL Waste Load and Load Allocation for Tomoka River (Fresh Water) (WBID 2634)
Parameter WLA
Wastewater (lbs/year)
WLA NPDES Stormwater
(% Reduction)1 Load Allocation (% Reduction)
Margin of Safety
TMDL (mg/L)
TN NAa 22 22 Implicit 1.22 a NA – Not Applicable b – As the TMDL represents a percent reduction, it also complies with EPA requirements to express the TMDL on a daily basis. The Total Maximum Daily Load (TMDL) was determined using an analysis of the empirical relationship of the trends in long-term corrected Chlorophyll a (CHLAC) and the corresponding total nitrogen (TN) concentrations in the fresh water segment of Tomoka River. More specifically, statistical analyses were performed to develop a predictive relationship between annual average CHLAC concentrations and the corresponding annual average TN concentrations. Using the regression model, the target TN concentration for waterbody segment (WBID) 2634, 1.22 milligrams per liter (mg/L), was estimated as the concentration that corresponds to CHLAC target concentration of 4.5 micrograms per liter (μg/L). A cumulative frequency plot of annual average TN in WBID 2634 indicates this corresponds to a TN reduction of 22 percent. SUMMARY OF FINDINGS The following are the key issues identified in this review of the TMDL proposal.
1. The TMDL report presents the results of extensive statistical analyses of the available water quality and rainfall data. The analyses concluded that the most significant relationships existed between CHLAC-salinity and CHLAC-TN, with most of the variation in CHLAC concentration explained by salinity. Linear regressions of CHLAC versus sampling date indicated an increasing trend in CHLAC [significant at an alpha level (α) of 0.05], while the regression of TN versus sampling date was not significant (α = 0.05). Regressions of CHLAC with long-term rainfall deficits were significant (α = 0.05). Given the correlation of CHLAC with salinity and with long-term rainfall deficits, it would seem that WBID hydrology may play a larger role in CHLAC concentrations than nutrients. The U.S. Geological Survey (USGS) has a long-term discharge monitoring station (USGS 02247510 TOMOKA RIVER NEAR HOLLY HILL, FL) located at LPGA Blvd., which is approximately the mid-point of the WBID. It is suggested that this flow record be used to perform additional statistical analyses to evaluate water quality responses and relationships. While the analyses using salinity and rainfall deficit provides insights into WBID water quality during drought periods, using the flow record would provide a more direct analysis of the relationship of watershed hydrologic condition and WBID water quality.
Response: Based upon additional water quality data provided by Volusia County from sampling conducted by the City of Daytona Beach that had not been included in Florida STORET and well as some data error corrections, data analyses presented in the draft TMDL were rerun using the updated data set. As was the case in the draft, the most significant

Final TMDL Report Tomoka River, WBID 2634, Nutrients
Florida Department of Environmental Protection
144
relationships using individual observations existed between CHLAC-salinity and CHLAC-TN, however, both TN and Salinity each explained approximately 10 percent of the variance in CHLAC. CHLAC versus sampling date did not indicate an increasing trend that was significant (Figure 5.2).
As suggested, daily flow data from the USGS gage on the Tomoka River at the LPGA Boulevard was incorporated into the data set. The simple linear regression of flow versus CHLAC observations was significant at an α level of 0.05 but only explained 1 percent of the variance in CHLAC. A simple linear regression of annual average CHLAC concentrations versus annual average daily flow was not significant.
2. The TMDL report discusses the possibility of tidal transport downstream of State Road
40, as evidenced by periods of high salinity in this reach. Based on the CHLAC-salinity relationship presented on Figure 5.8 and the time series plots presented on Figures 5.9 through 5.12, these episodic periods of high salinity, with accompanying higher CHLAC levels occurring during drought periods where tidal transport in the lower reaches is more likely, may be biasing the CHLAC statistics upward. The conclusions of the report would be strengthened if statistical analyses of the data were presented when the entire Tomoka River reach was considered fresh and the potential of tidal transport is minimal. This would clarify that the impairment is due to a watershed issue, and that the proposed TN reduction would eliminate the impairment.
Response: The updated data set was divided into fresh and marine subsets based on salinity and/or conductance (marine: salinity > 2.7 ppt, or conductance > 5000 umhos/cm). There were 545 CHLAC observations in the fresh water subset and 95 CHLAC observations in the marine water subset (there were also 14 observations that had insufficient information to classify). Sixty-three of the ninety-five CHLAC observations under marine conditions occurred in the spring period (30 of which occurred in Spring 2008). The following table summarizes the subsets by year.
Year Total Fresh Marine 1985 9 9 0 1986 24 12 12 1992 34 30 4 1993 31 22 9 1994 40 37 3 1995 35 30 5 1996 33 33 0 1997 21 18 3 1998 36 33 3 1999 35 31 4 2000 10 9 1 2001 21 20 1 2002 19 17 2 2003 33 33 0

Final TMDL Report Tomoka River, WBID 2634, Nutrients
Florida Department of Environmental Protection
145
Year Total Fresh Marine 2004 20 20 0 2005 43 31 0 2006 21 19 2 2007 19 16 1 2008 64 32 31 2009 50 40 10 2010 33 31 2 2011 24 22 2
Annual average CHLAC, TN, and TP concentrations based on the fresh water data subset were calculated using the same methodology as described in the TMDL document. The following table compares the CHLAC, TN, and TP annual averages based on the fresh water subset to the complete data set. Year Fresh
Water Subset
Fresh Water Subset
Fresh Water
Subset
Complete Data Set
Complete Data Set
Complete Data Set
CHLAC (µg/L)
TN (mg/L)
TP (mg/L)
CHLAC (µg/L)
TN (mg/L) TP (mg/L)
1992 12.5 1.28 0.149 11.2 1.26 0.149 1993 6.0 1.03 0.402 13.6 1.08 0.335 1994 5.5 1.47 0.156 5.8 1.47 0.152 1995 1.9 1.52 0.067 3.3 1.48 0.071 1996 2.3 1.01 0.032 2.3 1.01 0.032 1997 0.90 0.038 2.3 0.92 0.047 1998 1.8 1.20 0.043 2.5 1.17 0.048 1999 1.8 0.91 0.046 3.7 0.93 0.053 2000 1.2 0.90 0.169 2.7 0.91 0.228 2001 1.7 0.92 0.110 1.8 0.91 0.123 2002 1.2 1.05 0.048 2.6 1.06 0.050 2003 2.2 1.02 0.059 2.2 1.02 0.059 2004 1.9 1.06 0.046 1.9 1.06 0.046 2005 2.5 1.05 0.047 2.4 1.08 0.050 2006 1.1 0.74 0.045 2.6 0.73 0.051 2007 1.3 0.79 0.048 1.3 0.76 0.043 2008 1.6 1.79 0.074 10.2 1.82 0.100 2009 10.4 1.40 0.089 11.4 1.40 0.093 2010 5.2 1.13 0.088 6.4 1.13 0.084 2011 4.9 1.10 0.055 5.9 1.19 0.057 Annual average concentrations for TN and TP were very comparable between the two data sets. With respect to CHLAC, in two years (1992 and 2005) the fresh water annual average CHLAC was higher than that of the complete data set. The largest differences occurred in 1993 (7.6 µg/L) and 2008 (8.6 µg/L). The TMDL document discussed sampling events in 2008 that contributed to this large difference. In the twenty years that were compared, annual differences in CHLAC were 1 µg/L or less 55 percent of the time and the difference was 1.5 µg/L or less in 80 percent of the cases.

Final TMDL Report Tomoka River, WBID 2634, Nutrients
Florida Department of Environmental Protection
146
As indicated in the document, elevated salinity levels in the upper portion of the WBID indicate tidal transport. Lower fresh water flows in the Tomoka River influence the upstream extent of marine conditions which also increases the residence time of nutrients and the opportunity for algal production.
3. The TMDL report states that based on a cumulative frequency plot of annual average
TN concentrations (Figure 5.14) approximately 78 percent of the annual TN averages were less than 1.22 mg/L. The TMDL requires a 22 percent reduction in the annual average TN concentration to meet an annual average CHLAC target of 4.5 µg/L or lower in the Tomoka watershed. The way the cumulative frequency plot is used to calculate the required percent reduction in annual average nitrogen concentration seems to imply that this TN concentration target is to be met all the time, although statistically, that is not what is actually being expressed. If so, this would seem to be in conflict with the numeric nutrient criteria, which provided for natural variability (i.e., one exceedance every 3 years). This section of the TMDL report should be expanded to better explain what is expected with respect to achieving the annual average TN concentration target.
Response: Based upon additional data the analyses were rerun and significant correlations were identified between CHLAC and both TN and TP. A general linear model that included both TN and TP was used to establish reductions in both TN and TP that would achieve an annual average CHLAC target of 4.5 µg/L. The resulting TN and TP concentrations represent an average concentration based on applying a 30 percent reduction to the annual average concentration for each year. Language was added to indicate that use of the average incorporates year to year variations in historic nutrient concentrations. A footnote was also added to Table 6.1 to indicate that the TN and TP concentrations represent annual average values. At this time an effective date for the application of numeric nutrient criteria for Florida streams has not been identified.
4. Page 40 indicates that the annual average TN concentrations over the 1994 – 2011
period ranged between 0.22 mg/L (2000) and 1.91 mg/L (2008), with an overall average of 1.07 mg/L. According to Table 5.5, this minimum TN concentration occurred in1995, although other locations where the data are presented seem to validate the occurrence in 2000. Table 5.5 as well as any graphics that utilize that data should be checked to confirm they are correct.
Response: There was an error in Table 5.5 for the mean TN concentration in 1995. The table has been updated based on the updated data set.
5. The TMDL report would benefit from some discussion comparing the period from which
the target CHLAC concentration was calculated (1999-2003) and the verification period (2004-2011). Using data from the long-term station at LPGA Blvd (USGS 02247510 TOMOKA RIVER NEAR HOLLY HILL, FL), plots of flow (Figure 1) and various durations of moving averages (Figure 2) along with Weibull plotting position analysis indicate that the verification period has both the wettest and driest 2-yr periods (based on 2-yr moving averages of daily flow) in the period of record (1965-present). The 2006-2011 time period is hydrologically one of the driest periods found in the data record. The wettest

Final TMDL Report Tomoka River, WBID 2634, Nutrients
Florida Department of Environmental Protection
147
period (2004-2005) was immediately followed by the second-driest (2006-2007). It was in 2008, two years after the beginning of the drought, when the higher CHLAC concentrations started to occur. The 1999-2000 dry period was similar to but not quite as severe as the 2006-2007 dry period. A similar pattern of high CHLAC concentration also occurred during the 1999-2000 drought. A noticeable difference between the two periods of high CHLAC measurements was that one occurred during the dry period (1999-2000) and the other occurred following the dry period (2006-2007). The question is whether it is appropriate to use the target CHLAC concentration developed from the 1999-2003 time period for the 2004-2011 verification period. Some discussion of this would be of benefit in the final report.

Final TMDL Report Tomoka River, WBID 2634, Nutrients
Florida Department of Environmental Protection
148

Final TMDL Report Tomoka River, WBID 2634, Nutrients
Florida Department of Environmental Protection
149
Response: Text from the Impaired Waters Rule describing the calculation of the historic minimum CHLAC concentration has been added to Chapter three. During the development of the Impaired

Final TMDL Report Tomoka River, WBID 2634, Nutrients
Florida Department of Environmental Protection
150
Waters Rule language, the Technical Advisory Committee recommended that assessment of a potential nutrient impairment based on chlorophyll should include several measures, including a change from historical conditions. Calculation of a historic minimum based on a five year period was considered an appropriate method that incorporated temporal fluctuations in rainfall and discharge. The historic minimum also had to be exceeded by 50 percent or more in two consecutive lists inorder to be listed. Annual rainfall totals for the 1999 – 2003 period indicated below average rainfall in 1999 and 2000 followed by three years of above average rainfall. In 1998, rainfall was below the long-term average. Annual average CHLAC concentrations in the 2008 -2011 period all exceeded 5 µg/L and ranged between 5.9 µg/L (2011) and 11.4 µg/L (2009). Daily average flows from the USGS gaging station over the 1999 – 2003 period averaged 56.8 cfs while flows ovr the 2008 – 2011 period averaged 33 cfs. The long-term daily average is approximately 53 cfs. Over the 1995 – 2007 period, annual average CHLAC concentrations were all below 3.8 µg/L, including the second driest period of 2006 – 2007 as noted in the comment. Recommendation: The primary recommendations are as follows. First, additional statistical analyses should be performed to evaluate water quality responses and relationships using the USGS flow record at Station 02247510. While the analyses using salinity and rainfall deficit provide insights into WBID water quality during drought periods, using the flow record would provide a more direct analysis of the relationship of watershed hydrologic condition and WBID water quality. Second, statistical analyses of the data should be presented for when the entire Tomoka River reach was considered fresh and the potential of tidal transport is minimal. This would clarify that the impairment is due to a watershed issue and that the proposed TN reduction would eliminate the impairment.
Response: The Department appreciates the recommendations and these have been addressed in other parts of the document.

Final TMDL Report Tomoka River, WBID 2634, Nutrients
Florida Department of Environmental Protection
151
Appendix M: Response to Comments from April 2013 Workshop Comments from Kelly Young Environmental Specialist, Volusia County Environmental Health Lab Wedneday April 10, 2013 Kelly A. Young Environmental Specialist Volusia County Environmental Health Lab 1250 Indian Lake Rd. Daytona Beach, FL 32124 Phone (386) 248-1781 Hi all! The latest Draft TMDL for the Tomoka has a few data points which were processed by the City of Daytona Beach which should be excluded from calculations for the TMDL. These were collected and processed in conjunction with the Halifax points that were also questionable. The station is 21FLVEMDVC-077, locally referred to as TR03, a saline station. I would disregard the TN and TP results from that station from the following dates: 7/12/2010 10/4/2010 1/10/2011 7/11/2011 10/3/2011 I do not know that the other station listed, 21FLVEMDVC-078 (locally TR04, typically processed as fresh water) was diluted for analyses, maybe Bob can confirm this?... but if it were diluted for processing, then I would disregard the TN and TP for the same dates listed above. Hope to see you all on Friday! -Kelly Response: Total nitrogen and TP observations reported for station 21FLVEMDVC-077 for the dates cited were removed from the data set (2 TN and 3 TP values) and the General Linear Model (GLM) was rerun. There was a slight change in the coefficients of the GLM and the revised model explained 65 percent of the variance in the annual average CHLAC (old model r2 = 0.66). Under the revised GLM, a thirty percent reduction in both TN and TP was still required to achieve annual average CHLAC concentrations of less than 4.5 ug/L. Ranges in TN and TP annual averages as well as the TN and TP nutrient targets were unchanged from the earlier GLM. Dep Var: CHLAC N: 20 Multiple R: 0.808 Squared multiple R: 0.653 Adjusted squared multiple R: 0.588 Standard error of estimate: 2.431

Final TMDL Report Tomoka River, WBID 2634, Nutrients
Florida Department of Environmental Protection
152
Effect Coefficient Std Error Std Coef Tolerance t P(2 Tail) CONSTANT 3.023 6.267 0.000 . 0.482 0.636
TN -1.378 6.029 -0.096 0.123 -0.229 0.822 TP -65.449 62.664 -1.300 0.014 -1.044 0.312
TP*TN 88.690 59.423 2.017 0.012 1.493 0.155 Analysis of Variance
Source Sum-of-Squares df Mean-Square F-ratio P Regression 177.922 3 59.307 10.039 0.001
Residual 94.526 16 5.908 *** WARNING *** Case 2 has large leverage (Leverage = 0.627) Case 3 is an outlier (Studentized Residual = -3.914) Case 9 has large leverage (Leverage = 0.531) Durbin-Watson D Statistic 1.238 First Order Autocorrelation 0.296
0.0 0.5 1.0 1.5 2.0 2.5 3.0 3.5 4.0 4.5 5.0 5.5 6.0 6.5 7.0 7.5 8.0 8.5 9.0 9.510.010.
511.
011.
512.
012.
513.
013.
514.
0
ANNUAL AVERAGE CHLAC (UG/L)
0.000.050.100.150.200.250.300.350.400.450.500.550.600.650.700.750.800.850.900.951.00
FRAC
TIO
N O
F DA
TA
GLM70PERCENTGLM75PERCENTGLM80PERCENTGLM85PERCENTGLM90PERCENTCHLACGLMCHLAC
Comments from John C. Gamble, Interim Operations Manager, Volusia County Public Works Tuesday 4/16/2013 John C. Gamble Interim Operations Manager Volusia County Public Works 123 W. Indiana Ave. DeLand, FL 32720-4262 386-736-5965 X15527 DeLand Jan & Wayne,

Final TMDL Report Tomoka River, WBID 2634, Nutrients
Florida Department of Environmental Protection
153
1. Any stormwater modeling in Volusia County done since 2007 is to use the LiDAR data collected by the county in 2006. This is a publicly available data set and is the best available data that we are aware of. Use of USGS DEMs are not acceptable for stormwater modeling in this county. Response: It is our understanding that the LSPC model used for the Daytona watershed developed sub-watersheds using the 12-digit hydrologic unit code (HUC12) watershed data layer and the Geological Survey (USGS) National Hydrograph Dataset (NHD). Length and slope for the main channel reach within each sub-watershed were obtained using the USGS DEM and NHD data (Appendix C). The USGS DEM was from the National Elevation Dataset (http://ned.usgs.gov/). Based on the dataset viewer under the data source index, it appears that the best available NED resolution for Volusia County was 1/9 arc second (~3 meter). According to the website the hierarchy of data sources is: NED source data are selected from an ever-growing inventory of standard production USGS Digital Elevation Model (DEM’s), and also from an increasing number of datasets that are project- or agency-specific. The first consideration is always given to quality. Selections are made according to the following ranking, listed in order of descending priority:
1. High-resolution data, typically derived from lidar or digital photogrammetry, and often with edited water bodies. If collected at a ground sample distance no coarser than 5 meters, such data may also be offered within the NED at a resolution of 1/9th arc-second.
2. Moderate-resolution data, other than that compiled from cartographic contours. These data may also be derived from lidar or digital photogrammetry, or less often by Interferometric Synthetic Aperture Radar IFSAR. A typical ground sample distance is 10 meters, though it is commonly called “1/3 arc-second data”.
3. 10-meter DEM’s derived from cartographic contours and mapped hydrography. Most often, such data are produced by or for the USGS as a standard elevation product, and they currently account for the bulk of the NED.
4. 30-meter cartographically derived DEM’s. Similar in most respects to their 10-meter counterparts, though usually of lower overall quality.
5. 30-meter photogrammetrically derived DEM’s. These are the oldest DEM’s in the 7.5-minute series. These data were derived directly from stereo photography, either by a human operator or by an early form of electronic image correlation. They are badly marred by production artifacts that are addressed to the greatest practical extent by digital filtering within the NED production process.
6. 2-arc-second DEMs are a standard USGS product. They are derived from cartographic contours at a scale of 1:63,360 over the state of Alaska, and a scale of 1:100,000 elsewhere.
7. 1-arc-second Shuttle Radar Topography Mission (SRTM) data, to date, are only used in preference to 3 arc-second data in the Aleutian Islands.

Final TMDL Report Tomoka River, WBID 2634, Nutrients
Florida Department of Environmental Protection
154
8. 3-arc-second DEMs are another standard USGS product, and are generally only used within the NED as a source of fill values over large water bodies.
In both the Halifax and Tomoka River nutrient TMDLs, the estimated LSPC watershed TN and TP annual loads were not used to set nutrient reductions. 2. Two studies done since the LiDAR collection, using that data, have been completed in that area: Nova Canal basin (borders on Tomoka and part of Halifax) and Daytona International Airport Stormwater Master Plan (borders on Tomoka). Both of these studies were done by CDMSmith and should define the eastern boundary of the Tomoka River basin and define part of the Halifax Basin. An additional study done by Taylor Engineering for FIRMs for FEMA, included the basin east of Nova Road in Holly Hill/Ormond Beach area. Response: Comment noted. That information will be provided to EPA for consideration in their watershed model of the Daytona basin. 3. I would encourage you to closely review the water quality collected after the May 2009 Storm that dumped 20-30 inches of rain from New Smyrna Beach to Ormond Beach for a three day period. This would seem to be an extreme event and should be excluded from the calculations. Response: Linear regressions of annual average CHLAC concentrations versus water quality parameters considered in Appendix J were rerun with 2009 excluded. Results were similar to those presented in Appendix J. The analysis of CHLAC versus TN is presented below. Substituting the target annual average CHLAC concentration of 9 ug/L yields a TN annual average concentration of 1.11 mg/L. The previous analysis that included 2009 resulted in an annual average TN concentration of 1.13 mg/L. Dep Var: CHLACAVE N: 15 Multiple R: 0.673 Squared multiple R: 0.453 Adjusted squared multiple R: 0.411 Standard error of estimate: 1.620
Effect Coefficient Std Error Std Coef Tolerance t P(2 Tail) CONSTANT 0.816 1.895 0.000 . 0.431 0.674
TNAVE 7.355 2.242 0.673 1.000 3.281 0.006 Analysis of Variance
Source Sum-of-Squares df Mean-Square F-ratio P Regression 28.251 1 28.251 10.767 0.006
Residual 34.111 13 2.624 *** WARNING *** Case 15 has large leverage (Leverage = 0.626) Durbin-Watson D Statistic 1.357 First Order Autocorrelation 0.274

Final TMDL Report Tomoka River, WBID 2634, Nutrients
Florida Department of Environmental Protection
155
4. Tomoka River water quality testing should not be under minimum flow conditions. We believe sampling during drought conditions does not reflect discharge conditions and should not be included in the TMDL calculations. During drought conditions, there is little or no flow at the southern end. Although the water may be sampled at the bridge, should this data be used if the river is not discharging (flowing). Response: The impacts to receiving waters from point and nonpoint source contributions under a variety of wet and dry weather conditions are captured under the TMDL process. In the case of the Tomoka River TMDL, annual average CHLAC, TN, and TP concentrations over the 1992 – 2011 period were used to establish the TMDL. Over the 1992 through 2011 period, the long-term annual rainfall average was exceeded in 10 years and there were 10 years that were below the long-term average of 49.63 inches. If portions of a stream or river are dry and sampling occurs in isolated pools we would not consider results from such sampling events to be representative of the system. If, however, there is water throughout the stream length (whether standing or flowing) when sampling occurs, there is little justification to exclude that information from the larger data set. Comments from Robin Cook, Regulatory Compliance Officer, Utilities Department, City of Daytona Beach Friday 4/26/2013 Robin Cook Regulatory Compliance Officer Utilities Department City of Daytona Beach 386-671-8885- office 386-671-5901 - desktop fax 407-314-5743 - cell Ms. Mandrup-Poulsen, Thank you for the opportunity to provide comments. As such the City of Daytona Beach offers the following: As we stated during the meeting on April 12, CODB staff was very concerned that the May 2009 significant rain event was not thoroughly considered in the evaluation of the TMDL for the Halifax River. The rain began on May 17 , 2009. As we informed FDEP staff, the rain lasted several days and left standing water for several weeks afterward. This standing water was no doubt contaminated in some way. The run-off from this event undoubtedly continued to effect water quality in the Halifax River for a period that would have been seen in the sampling event. Response:

Final TMDL Report Tomoka River, WBID 2634, Nutrients
Florida Department of Environmental Protection
156
Please refer to the response to comment 3 from Mr. Gamble. Also, it seems a bit suspect that the County Landfill had zero discharge for that many years and then it started discharging and has continued to have some annual discharge every year since. What change in operations led to the change in discharge characteristics? Response: According to the Tomoka Farms Road Landfill permit, water from the South External Canal is pumped into the swale going east along the landfill access road. The landfill access road swale is designated as ground water discharge (G-001). The NPDES surface water discharge system designated D-001 is at the eastern end of the roadside swale where a control structure limits discharge to periods following heavy rainfall. Discharge is to a wetland area on the north side of the access road which then flows north to the headwaters of the Tomoka River. The permit authorizes only conditional surface water discharge under heavy rainfall situations (10 year 24 hour storm event (7.5 inches) or chronic rainfall event equivalent to 10 year 24 hour event). During the 2005 – 2010 permit cycle, the landfill access swale was partially filled into to accommodate the construction of a new Scale House. Permit renewal information provided in support of the permit that was issued in February 2011 identified 9 separate discharge events that occurred over the May 2007 through April 2010 period. Eight of the nine discharge events occurred following large rainfall events. Discharge during one event (July 28, 2009 – August 2009) was due to construction activities at the North Cell that required reductions in water levels to allow repair of the North Cell Leachate Collection System.

Florida Department of Environmental Protection Division of Water Resource Management
Bureau of Watershed Management 2600 Blair Stone Road, Mail Station 3565
Tallahassee, Florida 32399-2400 www.dep.state.fl.us/water/

![FINAL TMDL REPORT - Florida Dep · FINAL TMDL Report: Ochlockonee–St. Marks Basin; Munson Slough, WBID 807D (DO), Lake Munson, WBID 807C (DO, Nutrients [TSI], and Turbidity), and](https://img.dokumen.tips/doc/110x75/5b81affa7f8b9a7b6f8cf3d5/final-tmdl-report-florida-dep-final-tmdl-report-ochlockoneest-marks-basin.jpg)