Embed Size (px)
Citation preview

REPORT
Numerical modeling of the impact of sea-level rise on fringingcoral reef hydrodynamics and sediment transport
C. D. Storlazzi • E. Elias • M. E. Field •
M. K. Presto
Received: 7 September 2010 / Accepted: 7 January 2011 / Published online: 25 January 2011! The Author(s) 2011. This article is published with open access at Springerlink.com
Abstract Most climate projections suggest that sea levelmay rise on the order of 0.5–1.0 m by 2100; it is not clear,
however, how fluid flow and sediment dynamics on
exposed fringing reefs might change in response to thisrapid sea-level rise. Coupled hydrodynamic and sediment-
transport numerical modeling is consistent with recent
published results that suggest that an increase in waterdepth on the order of 0.5–1.0 m on a 1–2 m deep exposed
fringing reef flat would result in larger significant wave
heights and setup, further elevating water depths on thereef flat. Larger waves would generate higher near-bed
shear stresses, which, in turn, would result in an increase in
both the size and the quantity of sediment that can beresuspended from the seabed or eroded from adjacent
coastal plain deposits. Greater wave- and wind-driven
currents would develop with increasing water depth,increasing the alongshore and offshore flux of water and
sediment from the inner reef flat to the outer reef flat and
fore reef where coral growth is typically greatest. Sedimentresidence time on the fringing reef flat was modeled to
decrease exponentially with increasing sea-level rise as themagnitude of sea-level rise approached the mean water
depth over the reef flat. The model results presented here
suggest that a 0.5–1.0 m rise in sea level will likelyincrease coastal erosion, mixing and circulation, the
amount of sediment resuspended, and the duration of high
turbidity on exposed reef flats, resulting in decreased lightavailability for photosynthesis, increased sediment-induced
stress on the reef ecosystem, and potentially affecting a
number of other ecological processes.
Keywords Sea level ! Fringing reef ! Waves ! Currents !Sediment ! Erosion
Introduction
While rising sea-surface temperatures and ocean acidifi-cation have received most of the attention regarding the
impacts of climate change on coral reefs, the impact to coral
reefs from predicted future rising sea level has onlybeen addressed by a few researchers (Graus and Macintyre
1998; Ogston and Field 2010). A number of recent studies
(Grinsted et al. 2009; Merrifield et al. 2009) point out thatnot only is global sea level rising, but the rate is increasing in
response to global climate change. Syntheses by Grinstedet al. (2009) and Nicholls and Cazenave (2010) suggest that
global mean sea level in 2100 may exceed the 2000 level by
two to three times the average IPCC (2007) projection ofapproximately 60 cm above 2000 levels. Since corals’
upward growth is constrained by exposure to air at low tides,
Buddemeier and Smith (1988) and Edwards (1995) sug-gested that coral reef flats may benefit from the additional
accommodation space, as detrimental exposure to air would
decrease with sea-level rise. Buddemeier and Smith (1988),however, qualify this conclusion as long as ‘‘… [coral]
communities are protected from destructive waves and not
subjected to heavy sedimentation…’’.
Communicated by Guest Editor Dr. Clifford Hearn
C. D. Storlazzi (&) ! M. E. Field ! M. K. PrestoUS Geological Survey, Pacific Coastal and Marine ScienceCenter, 400 Natural Bridges Drive, Santa Cruz, CA 95060, USAe-mail: [email protected]
E. EliasUS Geological Survey/Deltares, 345 Middlefield Road, MS-999,Menlo Park, CA 94025, USA
123
Coral Reefs (2011) 30:83–96
DOI 10.1007/s00338-011-0723-9

Increased turbidity over coral reefs due to suspended
sediment can decrease light available for photosynthesis(Marszalek 1981; Phillip and Fabricius 2003; Piniak and
Storlazzi 2008) and modify coral reef zonation by affecting
coral fertilization and recruitment, which, in turn, canresult in stress to or mortality of corals (e.g., Rogers 1990;
Phillip and Fabricius 2003; Fabricius 2005). Recently, a
number of studies have addressed the growing problem ofcoral reefs impacted by anthropogenic modification of
coastal watersheds (e.g., Wolanski et al. 2003; Field et al.2008), acknowledging that climate change may alter the
quantity and timing of sediment delivery to coral reefs.
Despite the widespread discussion of climate changeimpacts on reefs, there has been little discussion of how
sea-level rise may affect fringing coral reefs, in terms of
both hydrodynamics and sediment dynamics. A number ofstudies of bio-physical coupling on reefs (e.g., Sebens and
Johnson 1991; Edwards 1995; Falter et al. 2004; Storlazzi
et al. 2005) have shown that hydrodynamics control manyecological aspects of reef systems, including photosyn-
thesis, nutrient uptake, prey capture, coral bleaching, and
species distribution. Ogston and Field (2010) presentedone-dimensional model results from Molokai, Hawaii,
USA, demonstrating that twenty-first-century sea-level rise
will increase wave heights and suspended-sediment con-centrations and cause longer periods of elevated turbidity
on the coral reef flat.
In this paper, a two-dimensional numerical profile modelof hydrodynamics and sediment transport over the Molokai
fringing reef was calibrated with in situ data and was driven
by meteorologic and oceanographic forcing conditions thatcharacterize most exposed (not sheltered) tropical coral
reefs. The goal of this effort is to better understand the rel-
ative importance of different processes (e.g., winds andwaves) to hydrodynamics and sediment transport, and the
contribution of these different characteristic sets of forcing
conditions to annual sediment fluxes. Model results forvarious projections of sea-level rise are presented to identify
the relative importance of these different forcing conditions
to hydrodynamics and sediment transport in different sea-level rise scenarios. Reef accretion or changes in roughness
were not modeled in these sea-level rise scenarios because
published vertical reef flat accretion rates for exposedfringing reefs (1–4 mm year-1 per Buddemeier and Smith
1988; Montaggioni 2005) are up to an order of magnitude
smaller than the rates of sea-level rise projected for the years2000–2100 (8–16 mm year-1 per Grinsted et al. 2009;
Nicholls and Cazenave 2010). These data suggest that pro-
jected sea-level rise will outstrip potential new reef flataccretion, resulting in a net increase in water depth over
exposed fringing reef flats on the order of 0.4–1.5 m during
the twenty-first century. Lastly, the implications of these
results in the health and sustainability for fringing coral reefs
under projected sea-level rise are discussed.
Study area
The data presented here are from Molokai, Hawaii, in the
north-central Pacific Ocean (*21"N, 157"W) between theislands of Oahu and Maui. The physical environment in
the Hawaiian Islands during the summer is dominatedby 5–10 m s-1 northeasterly trade winds that generate
wave heights of 1–3 m with periods of 5–8 s and small
(1–2 m), long-period (14–25 s) south swells (Moberly andChamberlain 1964). Winter conditions, typically beginning
in October and extending through March, are characterized
by storms and North Pacific swell that produce waveheights of 3–6 m with periods of 10–18 s that approach
from the northwest. Due to shadowing by the surrounding
islands and the island of Molokai itself, however, most ofsouth Molokai’s fringing reef is sheltered from large North
Pacific swell but is exposed to the other wave climates.
Hawaii has a mixed, semidiurnal microtidal regime, withthe mean daily tidal range of approximately 0.6 m and the
minimum and maximum daily tidal ranges are 0.4 and
0.9 m, respectively (Ogston et al. 2004; Storlazzi et al.2004).
The morphology of the south Molokai fringing reef is
discussed in detail by Storlazzi et al. (2003) and is sum-marized here. The reef flat, a roughly horizontal surface
with water depths ranging from 0.3 to 2.0 m, extends
seaward from the shoreline for distances from 0.5 to1.5 km offshore. Calcareous marine sediment dominates
the coarse-grained fraction of the bed sediment (58–65%;
Field et al. 2008) across the entire fringing reef tract. Theinner portion of the reef flat is covered by a wedge of
muddy sand (80–90% of the silt and finer grain sizes are
terrigenous in origin) that pinches out roughly 200–300 moffshore (Fig. 1a). From this point out to roughly 500 m
offshore, an ancestral reefal hardground is intermittently
exposed or mantled by sediment and algae. Shore-normalridge-and-runnel structure characterizes the reef flat from
500 m out to the reef crest roughly 1,000 m offshore. The
coral ridges are covered by low percentages of live coral,and the runnel depressions are filled by calcareous sedi-
ment. The reef crest, where most deepwater waves break, is
generally well defined along many of the fringing reefs inHawaii and is locally covered by encrusting coralline algae
and robust lobate and encrusting corals. Offshore of the
reef crest, from depths of 3–30 m, lies the fore reef that isgenerally characterized by 1–3 m high shore-normal spur-
and-groove structures covered by discontinuous, highly
variable percentages of live coral (Jokiel et al. 2001).
84 Coral Reefs (2011) 30:83–96
123
Methods
Field observations
The in situ observations used for model calibration and
validation were presented by Storlazzi et al. (2004) andPresto et al. (2006) and are summarized here. Current
velocity data were collected via acoustic Doppler current
profilers, acoustic Doppler velocimeters, or single-pointelectromagnetic current meters. Data loggers collected and
stored data from these instruments as well as pressure to
provide information on tides and waves. Optical back-scatter sensors and the acoustic backscatter from acoustic
Doppler current profilers and acoustic Doppler velocime-
ters provided information on turbidity and suspended-sediment concentrations. These instruments were mounted
on tripods or deployed from a mobile ‘‘backpack’’ in water
depths ranging from 0.5 to 11.0 m.
Numerical modeling
The Delft3D Online Morphology system (Lesser et al.
2004; Delft User Manual 2010) was used to model
hydrodynamics and sediment transport over the southMolokai fringing coral reef. The main components are the
two-way coupled Delft3D SWAN and FLOW modulesmodeling waves and currents, respectively. FLOW forms
the core of the model system, simulating water motion due
to tidal and meteorological forcing by solving the unsteadyshallow-water equations that consist of the continuity
equation, the horizontal momentum equations, and the
transport equation under the shallow water and Boussinesqassumptions. Wave effects, such as enhanced bed shear
stresses and radiation stresses, are included in the flow
simulation by coupling the FLOW module with stationaryruns of the third-generation SWAN wave model (Walstra
et al. 2000). SWAN is based on discrete spectral action
balance equations, computing the evolution of random,short-crested waves (Holthuijsen et al. 1993; Booij et al.
1999; Ris et al. 1999). Physical processes included are the
generation of waves by wind, nonlinear quadruplet andtriad wave–wave interactions, and dissipation due to
whitecapping, bottom friction, and depth-induced breaking.
The Delft3D Online Morphology model was used toresolve the sediment resuspension and transport dynami-
cally. At each computational time-step, Online Morphol-
ogy supplements the FLOW module results with sedimenttransport using the Van Rijn (1993) formulation, wherein a
distinction is made between bed-load and suspended-load
transport. Bed-load transport represents the transport ofsand particles in the wave boundary layer close to the
seabed. Suspended-sediment transport is computed by the
advection–diffusion solver. To describe sediment charac-teristics, additional formulations are included to account
for density effects of sediment in suspension, settling
velocity, vertical diffusion coefficient for sediment, sus-pended-sediment correction vector, and sediment exchange
with the bed. The elevation of the bed is dynamically
updated at each computational time-step by calculating thechange in mass of the bottom sediment resulting from the
gradients in sediment transport.
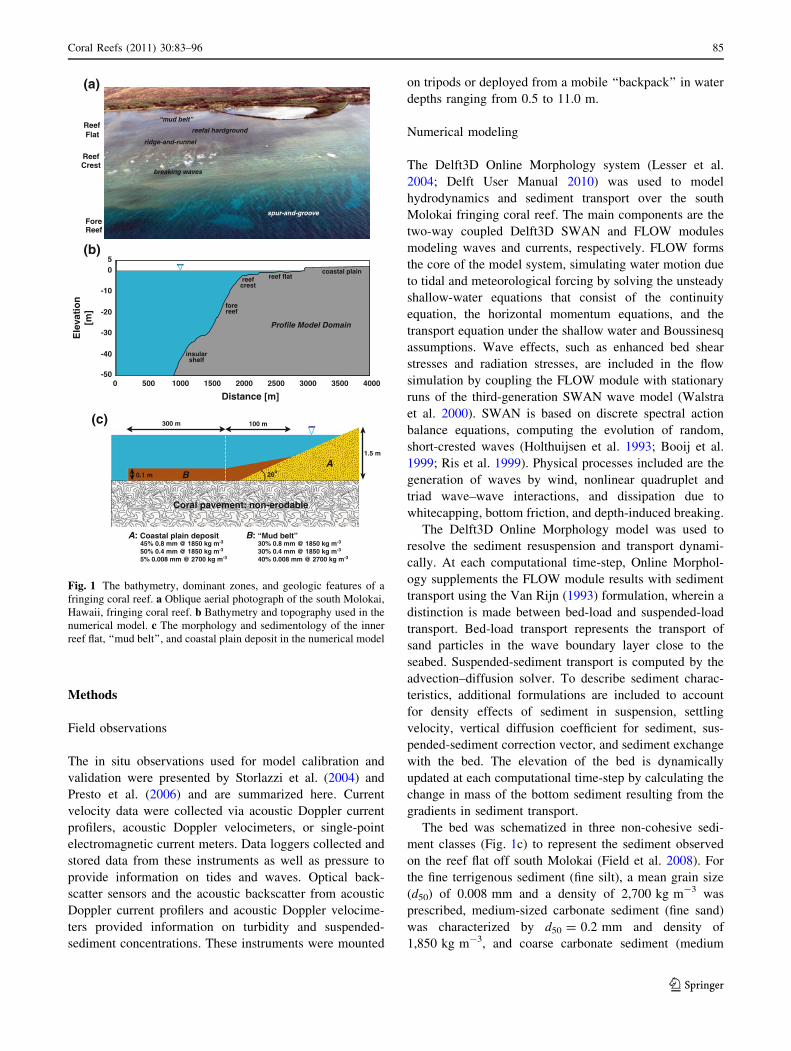
The bed was schematized in three non-cohesive sedi-ment classes (Fig. 1c) to represent the sediment observed
on the reef flat off south Molokai (Field et al. 2008). For
the fine terrigenous sediment (fine silt), a mean grain size(d50) of 0.008 mm and a density of 2,700 kg m-3 was
prescribed, medium-sized carbonate sediment (fine sand)
was characterized by d50 = 0.2 mm and density of1,850 kg m-3, and coarse carbonate sediment (medium
300 m 100 m
1.5 m
0.1 m BA
20o
45% 0.8 mm @ 1850 kg m-3 30% 0.8 mm @ 1850 kg m-3
50% 0.4 mm @ 1850 kg m-3 30% 0.4 mm @ 1850 kg m-3
5% 0.008 mm @ 2700 kg m-3 40% 0.008 mm @ 2700 kg m-3
A: Coastal plain deposit B: “Mud belt”
0 500 1000 1500 2000 2500 3000 3500 4000
5
Ele
vatio
n[m
]
0
-10
-20
-30
-40
-50
Distance [m]
coastal plainreef flat
forereef
insularshelf
reefcrest
Profile Model Domain
Reef
Fore
Reef
“mud belt”
reefal hardground
spur-and-groove
ridge-and-runnel
breaking waves
(a)
(b)
(c)
Reef
Crest
Flat
Coral pavement: non-erodable
Fig. 1 The bathymetry, dominant zones, and geologic features of afringing coral reef. a Oblique aerial photograph of the south Molokai,Hawaii, fringing coral reef. b Bathymetry and topography used in thenumerical model. c The morphology and sedimentology of the innerreef flat, ‘‘mud belt’’, and coastal plain deposit in the numerical model
Coral Reefs (2011) 30:83–96 85
123

sand) with d50 = 0.4 mm and density of 1,850 kg m-3. In
the model, sediment was initially present only in a narrowband extending 400 m from the shoreline while the
remainder of the model was initially a non-erodible layer
that represented the coral pavement of the fringing reef flat(thin, discontinuous sediment deposits were discounted)
based on field observations. The total amount of sediment
available in the profile was 56.7 m3 of fine sediment,18.2 m3 of which is contained in the mud belt (‘‘B’’),
27.9 m3 of medium sediment, and 784 m3 of coarse sedi-ment contained in the coastal plain deposit (‘‘A’’). The
volumes in the coastal plain deposit were somewhat
arbitrary, as these depended on the landward extent of themodel. The model did allow for sediment accumulation
and subsequent erosion of accumulated sediment on the
coral pavement during the sediment-transport simulations.Sediment fractions are solved individually in the transport
and bed-update modules and therefore were tracked sepa-
rately. Hydraulic roughness length scales were variedbetween approximately 0.01 and 0.10 m, with the higher
value used for coral surfaces based on previous observa-
tions on Hawaiian reefs and numerical modeling results(e.g., Hearn 1999; Lowe et al. 2005), and the lower range
(*0.01 m) set by the seabed grain size. Complete over-
views of the formulations, testing, and validation of Delft3DOnline Morphology have been reported in Lesser et al.
(2004). See Walstra and Van Rijn (2003), and Van Rijn
(1993, 2007a, b, c) for the specific transport formulations.Because most fringing reefs are relatively uniform
alongshore in water depth and hydrodynamic roughness at
larger scales (order *100 s of m) but heterogeneous atsmaller scales (order *m) due to ridge-and-runnel struc-
tures on the reef flat and spur-and-groove structures on the
fore reef, a fully realistic three-dimensional model at thespatial scales necessary to resolve the heterogeneity would
be too computationally intensive. For this reason, a sche-
matized two-dimensional profile model was used to acquireinsight into the dominant sediment-transport processes
across a fringing coral reef. Since the model is only one
grid cell in the alongshore direction, high vertical andcross-shore resolution could be obtained while minimizing
computational time. An underlying assumption in this
approach is the dominance of wind- and wave-drivenprocesses. This assumption is justified based on the small
tidal velocities observed in the study area (Ogston et al.
2004; Storlazzi et al. 2004; Presto et al. 2006). Modelvalidation therefore was focused on accurate representation
of the wave-breaking processes. Sensitivity analyses were
performed on variations in the forcing by varying theseasonally schematized input conditions, profile dimen-
sions, and the mean water level, including sea-level rise
scenarios. The model bathymetry was based on averaging anumber of cross-shore profiles from the high-resolution
SHOALS lidar data presented by Storlazzi et al. (2003).
The model grid had a 10-m cross-shore resolution, result-ing in a total of 350 grid cells in the cross-shore direction
for each vertical layer (Fig. 1b). The model was schema-
tized in the vertical by 8 sigma layers with a thickness of 2,3, 5, 8, 12, 20, 25, and 25% of the total water depth from
the seabed up to the surface.
High-resolution in situ measurements of tides, waves,currents, and suspended-sediment concentrations across the
central part of the Molokai fringing reef were availableonly for a 40-d time frame (Storlazzi et al. 2004). These
temporally limited in situ measurements were used for
model calibration and validation; however, they may not berepresentative for the conditions that govern sediment
transport over a range of seasons. To enable sediment-
transport simulations for periods of time longer than theduration of instrument measurements, schematized forcing
conditions for tides, wind, and waves were used. The
technique described by Lesser et al. (2004) was applied tothe water-level data from Presto et al. (2006) in order to
generate a morphodynamic schematized tide to force the
open ocean boundary (Table 1). The objective of the tidalschematization (input reduction) is to replace the full tide
that is composed of all constituents that represent the full
spring/neap cycle with a simplified 24.8-h tidal cycle thatclosely matches the residual tidally driven transport of the
full lunar monthly tidal cycle. Such simplified tide should
reproduce the residual sediment-transport rates and result-ing morphological change over the period of interest in the
entire model domain.
The second important schematization was that of thewind and wave climate. The schematization used in this
effort was based on the analysis of meteorologic and
oceanographic data for the region (Presto et al. 2006;Storlazzi and Jaffe 2008) but is characteristic of most
exposed coral reefs worldwide (e.g., Spalding et al. 2001;
Riegl and Dodge 2008). This schematization resulted infour classes of distinct forcing conditions (Table 2). The
Trade Wind conditions are the most prevalent, occurring
62% of the time during a year (226 days year-1). DuringTrade Wind conditions, the wind is relatively strong and
wave heights are moderate. Events characterized by minor
wind and wave energy are schematized by the Variable
Table 1 Tidal constituents of the simplified tide used to force theopen ocean model boundary based on the application of the Lesseret al. (2004) methodology
Constituent Amplitude(m)
Phase(")
AO 0.780 –
M2 0.178 64.7
C1 0.131 75.15
86 Coral Reefs (2011) 30:83–96
123

group, which occurs 25% of the time (91 days year-1).
High-energy Swell (large, long-period waves with weakwinds) and Storm conditions (large waves and strong
winds) occur less frequently (10% [37 days year-1] and
3% [11 days year-1], respectively). The model was thenrun for a year’s time driven by the four sets of wind and
wave forcing conditions for their respective durations
(Trade Wind for 226 days, Storm for 11 days, etc.).
Results
Model calibration and validation
Calibration and validation of the numerical model focused
on the water levels and wave heights. While the small tidalvelocities were of minor importance in these simulations,
the tidal water levels needed to be represented accurately.
Root-mean-squared (RMS) errors between measured andmodeled water levels across the reef (Fig. 2a–c) were
0.014 m, and the RMS errors in wave height across the reef
were 0.017 m (Fig. 2d–f), showing very good correspon-dence between the model and in situ data (Storlazzi et al.
2004). The modeled mean current speeds (7.8 cm s-1) on
the reef flat slightly exceeded the observed values of5.3 ± 3.7 cm s-1 (mean ± SD; not shown); the modeled
mean current speed on the fore reef (5.0 cm s-1) corre-
sponded well to the observations (4.1 ± 4.9 cm s-1).Importantly, the modeled tidal and total (wind ?
wave ? tide) current speeds were on the same order (0–5
and 5–20 cm s-1, respectively) as the measured currentsand also showed the same proportion of greater (*2–8
times) alongshore current speeds on the reef flat and over the
fore reef compared to the cross-shore current speeds. This isin contrast, however, to most observations and models of
primarily cross-shore flow and sediment transport on atolls
and barrier reefs (e.g., Hearn 1999; Hearn and Atkinson2000; Lowe et al. 2005) where vigorous wave-driven
onshore flow over the reef flat can occur because it is bal-
anced by strong return flow out of channels in the reef. Infringing reefs without a nearshore gully, wave-driven setup
along the shoreline offsets this cross-reef flow and results in
primarily alongshore flow and transport.
Contributions of waves and currents to sediment
transport
With confidence that the numerical model was successfully
reproducing the hydrodynamics on the reef flat and fore
reef, the four schematized forcing conditions and theresulting sediment dynamics were modeled. The goal of
these sediment dynamics simulations was not to reproduce
reality, for the schematized model domain and duration offorcing conditions when compared to the limited in situ
measurements made this not possible. Rather, the goal was
to understand the relative contribution of the differentforcing mechanisms to flow and sediment transport and
how these contributions would vary with sea-level rise. The
mean forcing and resulting suspended-sediment concen-trations for the four schematized forcing conditions are
shown in Fig. 3; the resulting sediment transport for a
1-year simulation comprised of the four schematizedforcing conditions is shown in Fig. 4. Overall, sediment
transport was dominated by the fine-grained fractions. No
coarse- or medium-grained fractions were moved on thereef flat during the base (sea level = 0.00 m) simulations.
The bulk of the wave energy was dissipated along the reef
crest, and the depth-averaged current speeds in the ‘‘mudbelt’’ were small and did not exceed the critical threshold
of motion for the larger (medium and coarse sand) grain-
size fractions, resulting in a narrow band of elevated fine-grained sediment concentrations along the shoreline. No
significant sediment losses to deep water were encountered
as a result of the minor water level gradient-induced off-shore flow near the bed, resulting in most of the sediment
transport laterally alongshore in a band extending from the
shoreline seaward approximately 400 m, which matchesobservations (Presto et al. 2006; Field et al. 2008).
The model results show distinctively different transport
rates during the different forcing conditions. Storm con-ditions dominated the hydrodynamics and resulting sedi-
ment dynamics despite their low frequency of occurrence.
Storm conditions generated the greatest setup on the reefflat (Fig. 3b) due to the strong winds and highest wave
energy on the fore reef (Fig. 3c). The winds and waves
drove strong (*5–15 cm s-1) currents across the fore reefand reef flat (Fig. 3d) and, together, generated high shear
Table 2 Model schematization of wind and wave conditions. In the model, the coast trends north–south (0–180"), with eastward (90") beingoriented onshore
Climate Percent ofdays year-1
Wind direction(")
Wind speed(m s-1)
Wave height(m)
Wave period(s)
Wave direction(")
Trade Wind 62 190 10 1 6 190
Variable 25 80 3 0.5 6 240
Swell 10 170 3 1 14 280
Storm 3 280 20 1.5 8 280
Coral Reefs (2011) 30:83–96 87
123

stresses that resuspended large quantities of sediment
across the inner reef flat (Fig. 3e). Even though the Swell
conditions did not generate strong currents, the long periodof the waves generated substantial long-wave energy that
caused almost 5 cm of setup. These long-wave motions
during the Swell conditions resulted in higher peak sus-pended-sediment concentrations right at the shoreline than
modeled during the Storm conditions, but this zone of
elevated suspended-sediment concentrations was confinedcloser to shore and thus a lower total mass of sediment in
suspension over the reef flat than in the Storm conditions.The Trade Wind conditions generated relatively strong
wind-driven currents with little wave forcing and resulted
in elevated suspended-sediment concentrations close to theshoreline, but these concentrations were on the order of a
third to a quarter of those modeled during Storm and Swell
conditions. Lastly, Variable conditions generated relativeweak currents across the reef flat that resulted in sus-
pended-sediment concentrations on the order of a third to a
quarter of those modeled during Trade Wind conditionsand almost an order of magnitude lower than during Storm
and Swell conditions. Importantly, the waves, current
speeds, and resulting suspended-sediment concentrations
during the modeled forcing conditions match well with the
in situ data collected under similar atmospheric andoceanographic forcing (Ogston et al. 2004; Storlazzi et al.
2004; Presto et al. 2006).
The relative contribution of the different sets of forcingconditions to annual sediment flux (Fig. 4) shows that
Storm conditions are the dominant contributor to annual
sediment flux, contributing just over twice the sedimentflux that was modeled during Trade Wind conditions but in
only 5% of the time (Fig. 4c; Table 3). This high per-centage (63%) of total annual sediment flux in only 11 d
shows the importance of not only large waves and strong
winds generating strong currents and high shear stresses,but the importance of setup increasing water depth over the
reef flat that, in turn, allows for larger waves and stronger
currents by reducing the hydrodynamic roughness relativeto the depth of the water column. While Swell conditions
resulted in high suspended-sediment concentrations at the
shoreline (Fig. 3e), the greater cross-shore extent of ele-vated turbidity during Trade Wind conditions and their
more frequent occurrence resulted in just under an order of
!0.50 !0.25 0 0.25 0.50 !0.50 !0.25 0 0.25 0.50 !0.10 !0.05 0 0.05 0.10
0 0.2 0.4 0.6 0.80
0.2
0.4
0.6
0.8
0 0.2 0.4 0.6 0.80
0.2
0.4
0.6
0.8
0 0.05 0.10 0.15 0.200
0.05
0.10
0.15
0.20
!0.10
!0.05
0
0.05
0.10
!0.50
!0.25
0
0.25
0.50
!0.50
0
0.25
0.50
!0.25Mod
eled
Wat
er L
evel
[m]
Total
Measured Water Level[m]
Measured Wave Height[m]
Non!tidal
Fore Reef: 10 m Fore Reef: 4 m Reef Flat: 1 m
Mod
eled
Wav
e H
eigh
t[m
]Tides
(c)(b)(a)
(f)(e)(d)
Measured Water Level[m]
Measured Water Level[m]
Measured Wave Height[m]
Measured Wave Height[m]
Mod
eled
Wat
er L
evel
[m]
Mod
eled
Wav
e H
eigh
t[m
]
Mod
eled
Wat
er L
evel
[m]
Mod
eled
Wav
e H
eigh
t[m
]Fig. 2 Comparison of in situ measurements (Storlazzi et al. 2004)and model results of water levels and wave heights. a Total waterlevel on the reef flat (depth *1 m). b The tidal component of waterlevel on the reef flat. c The non-tidal component of water level on the
reef flat. d Wave height on the fore reef (depth *10 m). e Waveheight on the fore reef (depth *4 m). f Wave height on the reef flat(depth *1 m). These comparisons show that the errors betweenobserved and modeled water levels and wave heights are less than 5%
88 Coral Reefs (2011) 30:83–96
123

magnitude greater contribution to the annual sediment flux
than Swell conditions (Fig. 4c; Table 3). Also of note is the
relative contributions of suspended and bed-load flux to theannual total sediment flux (Fig. 4c). While the total sedi-
ment flux during Trade Wind conditions is primarily
material in suspension, the more energetic Storm condi-tions result in greater erosion of the ‘‘mud belt’’ deposit and
a resulting greater proportion of bed load to the annual total
sediment flux.
Effects of sea-level rise on waves and currents
With confidence that the numerical model was successfully
reproducing the hydrodynamics and sediment dynamics on
the reef flat under present conditions (sea level = 0.00 m),
mean sea level was then elevated (?0.10, ?0.25, ?0.50,
and ?1.00 m) to investigate the influence of sea-level rise
on waves across the fringing reef. Since the four sets offorcing conditions and 5 different sea-level rise scenarios
result in 20 different model runs, for visualization purposes
the annual weighted (by frequency of occurrence duringthe year) mean hydrodynamics and resulting sediment
dynamics for the four different forcing conditions are
presented for the 5 sea-level rise scenarios in Fig. 5. As sealevel increased, the breaking wave height at the reef crest
decreased and the location of maximum wave breaking (as
evidenced from wave energy dissipation) moved landward(Fig. 5b, c) as more wave energy was able to propagate up
onto the reef flat, resulting in greater wave heights on the
reef flat. The depth-limited nature of wave height on the
!30
!20
!10
0
!50
!40
5
500 1000 1500 2000 2500 3000 3500
coastal plainreef flat
forereef
insularshelf
reefcrest
Ele
vatio
n[m
]W
ater
leve
l[m
]S
hort
-Wav
e E
nerg
y[J
m-2
]D
epth
-Ave
rage
dC
urre
nt S
peed
[cm
s-1
]
Sus
pend
ed-S
edim
ent
Con
cent
ratio
n[m
g l-1
]
Distance[m]
0
0.05
0.10
0
500
1000
1500
0
5
10
15
20
0
200
400
800
(c)
(b)
(a)
(d)
(e)
AlongshoreCross-shore
600 Trade windsVariableSwellStorm
500 1000 1500 2000 2500 3000 3500
500 1000 1500 2000 2500 3000 3500
500 1000 1500 2000 2500 3000 3500
500 1000 1500 2000 2500 3000 3500
Trade windsTidesSwellStorm
Trade windsVariableSwellStorm
Trade windsVariableSwellStorm
Fig. 3 Modeled cross-shorevariations in hydrodynamicsand sediment dynamics for thefour forcing conditions.a Morphology of the modeldomain. b Water level. c Short-wave energy. d Depth-averagedcurrent speeds, with alongshorecurrents as solid lines and cross-shore currents as dashed lines.e Suspended-sedimentconcentrations. While Swellconditions result in the highestwave energy and suspended-sediment concentrations on thereef flat, the greatest volume ofsuspended sediment over thereef flat results from Stormconditions
Coral Reefs (2011) 30:83–96 89
123

reef flat is evident not only in the landward decrease in
wave height and energy dissipation due to wave breaking,but also how both of these parameters increase with
increasing sea level. As sea level increased, the propaga-
tion of larger waves over the reef crest onto the reef flat andin situ growth of wind-waves on the reef flat resulted in
elevated peak-bed wave-induced shear stresses (Fig. 5d),
especially close to shore in the shallows where the ‘‘mudbelt’’ contains a significant proportion of terrestrial mate-
rial. While increased sea level resulted in increased wave
heights, dissipation, and peak-bed shear stresses on the reef
flat, the maximum radiation stress-induced setup on the
reef flat due to wave breaking decreased and elevated setupextended farther offshore toward the reef crest (Fig. 6b),
possibly due to an increase in flow depth over the reef crest
and reef flat relative to the hydrodynamic roughnessimparted by the corals and ridge-and-runnel structure. At a
sea level ?1.00 m (almost doubling water depth over much
of the reef flat), however, run-up onto the coastal plainextended to ?0.30 m above the oceanic water level
(?1.30 m total).
Effects of sea-level rise on sediment dynamics
Similar to the study of hydrodynamics, the effect ofsea-level rise on sediment-transport rates was investigated
by elevating mean sea level (?0.10 m, ?0.25 m, ?0.50 m,
and ?1.00 m). The remainder of the model schematiza-tions and parameter settings were unchanged compared to
the base case simulation (sea level = 0.00 m). Sediment
transport in the sea-level rise scenario model runs wasgoverned by the fine sediment fractions, similar to the
present-day (sea level = 0.00 m) model runs. Currentspeeds in the ‘‘mud belt’’ were relatively small
Trade WindsVariable Swell S
torm
Trade Winds Variable Swell
Sto
rm
Trade Winds Variable Swell
Sto
rm
Wav
e P
erio
d[s
]W
ave
Hei
ght
[m]
Win
d S
peed
[m s
-1]
0 50 100 150 200 250 300 350
0 50 100 150 200 250 300 350
0 50 100 150 200 250 300 350
0
0.5
1
1.5
0
5
10
15
10
20
0
(c)
(b)
(a)
(d)
Sed
imen
t Flu
x[m
3 ]
Time[days]
0 50 100 150 200 250 300 3500
0.5
1.0
1.5
2.0
SuspendedBed load Total
Fig. 4 Schematization of theforcing data and the resultingmodeled net annual sedimentflux. a Variations in waveheights for the forcingconditions. b Variations in waveperiods for the forcingconditions. c Variations in windspeeds for the forcingconditions. d Total netsuspended-sediment flux. Stormconditions are the dominantcontributor to annual sedimentflux, contributing just over twicethe sediment flux that wasmodeled during Trade Windconditions but in only 5% of thetime
Table 3 Modeled cumulative total annual sediment transport andresidence times under present and predicted future sea-level risescenarios
Sea level(m)
Cumulative transport (m3) Residencetime(years)Trade
WindVariable Swell Storm Total
0.00 (present) 0.570 0.031 0.073 1.146 1.820 10.1
?0.10 1.037 0.056 0.105 1.315 2.513 7.3
?0.25 1.942 0.111 0.141 1.454 3.647 5.0
?0.50 3.608 0.207 0.132 2.751 6.697 2.7
?1.00 1.047 0.311 0.749 24.478 26.585 0.7
90 Coral Reefs (2011) 30:83–96
123

(*5 cm s-1; Fig. 6c) and did not exceed the critical
threshold of motion for the larger (sand-sized) grain-size
fractions. As sea level was increased, current speedsincreased and the relative minima in alongshore current
speeds and maxima in cross-shore current speeds at the reef
crest due to wave breaking migrated onshore, similar to themaxima in wave height and energy dissipation (Fig. 5).
The higher wave-induced high peak-bed shear stresses
(Fig. 5d) and current speeds (Fig. 6c) close to shoreresulted in a narrow band of suspended-sediment concen-
trations and transport along the shoreline (Fig. 6d).
Transport rates due to Storm conditions were an order ofmagnitude larger than the Swell conditions, which were an
order higher than Trade Wind conditions. While sus-
pended-sediment concentrations increased in magnitude
close to the shoreline and elevated suspended-sediment
concentrations extend further across the inner half of the
reef flat with increasing sea level between ?0.10 m and?0.50 m, there is a distinct change in this pattern when sea
level reached ?1.00 m. When sea level was set at ?1.00 m
(almost doubling water depth over much of the reef flat),enough deep-water wave energy was able to propagate
onto the reef flat such that larger waves impacted the
shoreline, causing significant ([0.30 m) setup along theshoreline. These waves eroded approximately 350 m hor-
izontally into the coastal plain deposit, resulting in wave
heights (Fig. 5b), water levels (Fig. 6b), currents (Fig. 6c),and suspended-sediment concentrations (Fig. 6d) shore-
ward of the original shoreline location in the model at a
cross-shore distance of 3,000 m. The erosion of the coastal
!30
!20
!10
0
0
0.5
1.0
1.5
0
20
40
60
80
100
120
0
1
2
3
4
Ele
vatio
n[m
]W
ave
Hei
ght
[m]
Wav
e-E
nerg
y D
issi
patio
n[W
m-1
]P
eak-
Bed
She
ar S
tres
s[N
m-2
]
!50
!40
5
500 1000 1500 2000 2500 3000 3500
500 1000 1500 2000 2500 3000 3500
500 1000 1500 2000 2500 3000 3500
500 1000 1500 2000 2500 3000 3500
Distance[m]
(c)
(b)
(a)
(d)
Present (0.00 m)+0.10 m+0.25 m+0.50 m+1.00 m
Present (0.00 m)+0.10 m+0.25 m+0.50 m+1.00 m
Present (0.00 m)+0.10 m+0.25 m+0.50 m+1.00 m
coastal plainreef flat
forereef
insularshelf
reefcrest
Fig. 5 Modeled cross-shorevariations in wave parameters asa function of water depth.a Morphology of the modeldomain. b Wave height. c Waveenergy dissipation. d Wave-induced peak-bed shear stress.Wave height, energydissipation, and peak-bed shearstress decrease at the reef crestbut increase in the reef flat withincreasing water depth. Note thegreater cross-shore extent(distance *3,000–3,350 m) ofthe parameters at a sea-level riseof 1.0 m due to approximately350 m of erosion into thecoastal plain deposit by thelarger waves and resulting highshear stresses
Coral Reefs (2011) 30:83–96 91
123
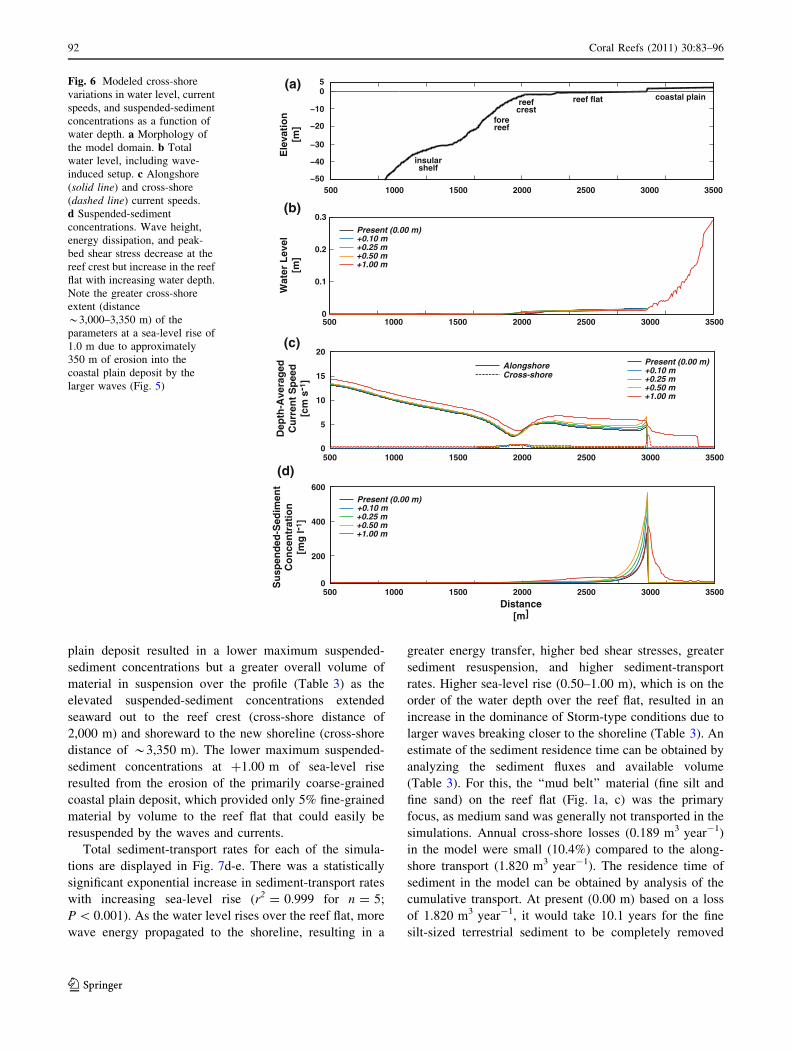
plain deposit resulted in a lower maximum suspended-
sediment concentrations but a greater overall volume of
material in suspension over the profile (Table 3) as theelevated suspended-sediment concentrations extended
seaward out to the reef crest (cross-shore distance of
2,000 m) and shoreward to the new shoreline (cross-shoredistance of *3,350 m). The lower maximum suspended-
sediment concentrations at ?1.00 m of sea-level rise
resulted from the erosion of the primarily coarse-grainedcoastal plain deposit, which provided only 5% fine-grained
material by volume to the reef flat that could easily be
resuspended by the waves and currents.Total sediment-transport rates for each of the simula-
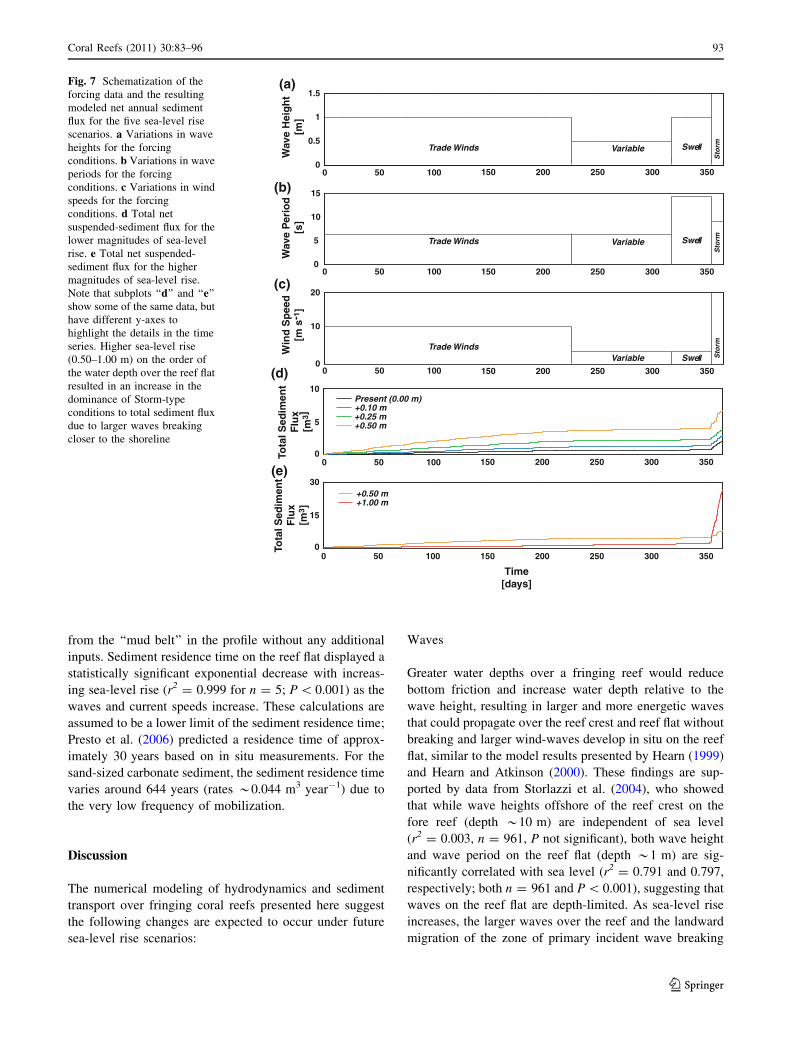
tions are displayed in Fig. 7d-e. There was a statistically
significant exponential increase in sediment-transport rateswith increasing sea-level rise (r2 = 0.999 for n = 5;
P\ 0.001). As the water level rises over the reef flat, more
wave energy propagated to the shoreline, resulting in a
greater energy transfer, higher bed shear stresses, greater
sediment resuspension, and higher sediment-transport
rates. Higher sea-level rise (0.50–1.00 m), which is on theorder of the water depth over the reef flat, resulted in an
increase in the dominance of Storm-type conditions due to
larger waves breaking closer to the shoreline (Table 3). Anestimate of the sediment residence time can be obtained by
analyzing the sediment fluxes and available volume
(Table 3). For this, the ‘‘mud belt’’ material (fine silt andfine sand) on the reef flat (Fig. 1a, c) was the primary
focus, as medium sand was generally not transported in the
simulations. Annual cross-shore losses (0.189 m3 year-1)in the model were small (10.4%) compared to the along-
shore transport (1.820 m3 year-1). The residence time of
sediment in the model can be obtained by analysis of thecumulative transport. At present (0.00 m) based on a loss
of 1.820 m3 year-1, it would take 10.1 years for the fine
silt-sized terrestrial sediment to be completely removed
500 1000 1500 2000 2500 3000 35000
5
10
15
20
Dep
th-A
vera
ged
Cur
rent
Spe
ed[c
m s
-1]
500 1000 1500 2000 2500 3000 3500
200
400
600
Distance[m]
Sus
pend
ed-S
edim
ent
Con
cent
ratio
n[m
g l- 1
]
AlongshoreCross-shore
0
(c)
(b)
(a)
(d)
Present (0.00 m)+0.10 m+0.25 m+0.50 m+1.00 m
Present (0.00 m)+0.10 m+0.25 m+0.50 m+1.00 m
Present (0.00 m)+0.10 m+0.25 m+0.50 m+1.00 m
500 1000 1500 2000 2500 3000 35000
0.1
0.2
0.3
Wat
er L
evel
[m]
!30
!20
!10
0
Ele
vatio
n[m
]
!50
!40
5
500 1000 1500 2000 2500 3000 3500
coastal plainreef flat
forereef
insularshelf
reefcrest
Fig. 6 Modeled cross-shorevariations in water level, currentspeeds, and suspended-sedimentconcentrations as a function ofwater depth. a Morphology ofthe model domain. b Totalwater level, including wave-induced setup. c Alongshore(solid line) and cross-shore(dashed line) current speeds.d Suspended-sedimentconcentrations. Wave height,energy dissipation, and peak-bed shear stress decrease at thereef crest but increase in the reefflat with increasing water depth.Note the greater cross-shoreextent (distance*3,000–3,350 m) of theparameters at a sea-level rise of1.0 m due to approximately350 m of erosion into thecoastal plain deposit by thelarger waves (Fig. 5)
92 Coral Reefs (2011) 30:83–96
123
from the ‘‘mud belt’’ in the profile without any additional
inputs. Sediment residence time on the reef flat displayed a
statistically significant exponential decrease with increas-ing sea-level rise (r2 = 0.999 for n = 5; P\ 0.001) as the
waves and current speeds increase. These calculations are
assumed to be a lower limit of the sediment residence time;Presto et al. (2006) predicted a residence time of approx-
imately 30 years based on in situ measurements. For the
sand-sized carbonate sediment, the sediment residence timevaries around 644 years (rates *0.044 m3 year-1) due to
the very low frequency of mobilization.
Discussion
The numerical modeling of hydrodynamics and sediment
transport over fringing coral reefs presented here suggest
the following changes are expected to occur under futuresea-level rise scenarios:
Waves
Greater water depths over a fringing reef would reduce
bottom friction and increase water depth relative to the
wave height, resulting in larger and more energetic wavesthat could propagate over the reef crest and reef flat without
breaking and larger wind-waves develop in situ on the reef
flat, similar to the model results presented by Hearn (1999)and Hearn and Atkinson (2000). These findings are sup-
ported by data from Storlazzi et al. (2004), who showedthat while wave heights offshore of the reef crest on the
fore reef (depth *10 m) are independent of sea level
(r2 = 0.003, n = 961, P not significant), both wave heightand wave period on the reef flat (depth *1 m) are sig-
nificantly correlated with sea level (r2 = 0.791 and 0.797,
respectively; both n = 961 and P\ 0.001), suggesting thatwaves on the reef flat are depth-limited. As sea-level rise
increases, the larger waves over the reef and the landward
migration of the zone of primary incident wave breaking
Trade WindsVariable Swell S
torm
Trade Winds Variable Swell
Sto
rm
Trade Winds Variable Swell
Sto
rm
Time[days]
Wav
e P
erio
d[s
]W
ave
Hei
ght
[m]
Tota
l Sed
imen
tFl
ux[m
3]
Tota
l Sed
imen
tFl
ux[m
3 ]
Win
d S
peed
[ms-
1 ]
150 200 250 300 350
150 200 250 300 350
150 200 250 300 350
0
0.5
1
1.5
0
5
10
15
10
20
0
5
10
0
0
15
30
150 200 250 300 350
0 50 100
0 50 100
0 50 100
0 50 100
0 50 100
150 200 250 300 350
Present (0.00 m)+0.10 m+0.25 m+0.50 m
+0.50 m+1.00 m
(c)
(b)
(a)
(d)
(e)
Fig. 7 Schematization of theforcing data and the resultingmodeled net annual sedimentflux for the five sea-level risescenarios. a Variations in waveheights for the forcingconditions. b Variations in waveperiods for the forcingconditions. c Variations in windspeeds for the forcingconditions. d Total netsuspended-sediment flux for thelower magnitudes of sea-levelrise. e Total net suspended-sediment flux for the highermagnitudes of sea-level rise.Note that subplots ‘‘d’’ and ‘‘e’’show some of the same data, buthave different y-axes tohighlight the details in the timeseries. Higher sea-level rise(0.50–1.00 m) on the order ofthe water depth over the reef flatresulted in an increase in thedominance of Storm-typeconditions to total sediment fluxdue to larger waves breakingcloser to the shoreline
Coral Reefs (2011) 30:83–96 93
123
will also modify the zone of high turbulence, primarily
moving it shorewards.
Currents
Increased water depth would result in stronger currents all
across the reef due to greater wave-driven flows from lar-
ger waves and the reduced height of hydrodynamicroughness relative to water depth that would allow for
faster wind-driven currents to develop. The greatestincreases in current velocity would be in shallow water on
the inner reef flat where the water depth is on order of the
hydrodynamic roughness of the seabed. This finding issupported by data from Presto et al. (2006), who showed
the current speed at a given location on the reef flat was
statistically greater (mean difference = 2 cm s-2, n = 27,P\ 0.05) during periods with higher sea level than during
periods of lower sea level. This would result in greater
water exchange across and lower residence time of wateron the reef flat, potentially altering the physical and
chemical properties of the water column. The increased
mixing and flushing of the reef flat with sea-level rise mayhelp to dilute material delivered to the inner reef flat from
the adjacent land, but it might also result in greater trans-
port of terrestrial sediment onto the fore reef. The modelresults presented here, along with the observations made by
Ogston et al. (2004), Storlazzi and Jaffe (2008), and Lowe
et al. (2009) and modeled by Gourlay (1996), Hearn(1999), and Hearn and Atkinson (2000), show the effect of
sea level on the magnitude of currents, driven both by wind
and by wave-breaking, on coral reef flats.
Sediment dynamics
An increase in wave energy and circulation due to elevated
sea level will also affect sediment dynamics across a
fringing coral reef. Larger waves resulting from high waterlevels will generate increased wave-induced stresses,
which, in turn, will result in greater resuspension of sedi-
ment across the reef for a given grain size or composition(e.g., density) as suggested by Ogston and Field (2010).
Statistically greater suspended-sediment concentrations
(mean difference = 46 mg l-1, n = 32, P\ 0.001) wereobserved by Presto et al. (2006) during periods with higher
sea level; Storlazzi et al. (2004; Fig. 9 therein) showed that
suspended-sediment concentrations on both reef flat(r2 = 0.383 for n = 961; P\ 0.001) and fore reef
(r2 = 0.238 for n = 961; P\ 0.02) were significantly
greater during periods with higher sea level. These obser-vations, combined with their observations showing that
greater offshore flow occurred with higher sea level,
resulted in a statistically significant greater flux of sedimentoff the reef flat (r2 = 0.369 for n = 961; P\ 0.05) and
over the fore reef (r2 = 0.576 for n = 961; P\ 0.001)
with higher sea levels. The greater resuspension andtransport would result in higher and longer persistence of
turbidity as the increased shear stresses and turbulence
would inhibit sediment from settling. The increasedresuspension and larger wave-orbital velocities with sea-
level rise may also alter patterns of abrasion of corals
adjacent to sedimentary deposits such as the sediment-fil-led ‘‘grooves’’ of spur-and-groove structures. Although
alongshore current speeds on the reef flat and over the forereef are generally much greater (*2–8 times) than the
cross-shore current speeds (Ogston et al. 2004; Presto et al.
2006), there is strong coupling between offshore flow andhigh suspended-sediment concentrations on reef flats such
that the greatest sediment fluxes generally have an offshore
component (Storlazzi et al. 2004). Storlazzi and Jaffe(2008) showed similar reef flat–fore reef coupling off west
Maui, especially during periods of large waves and storms
when water levels are elevated over the reef flat due towind- and wave-induced setup.
As pointed out by Graus and Macintyre (1998) and
Ogston and Field (2010), the larger waves on the reef flatthat would result from sea-level rise will also increase the
delivery of energy to the coastline. As these larger, more
energetic waves reach the shoreline, which at present is inquasi-equilibrium with the current wave climate, they
would exceed the critical shear stresses for resuspension of
the beach and coastal plain material, causing coastal ero-sion and adding additional sedimentary material to the reef
flat, similar to the observations by Sheppard et al. (2005).
This additional material, resuspended by larger waves andstronger currents, would likely exacerbate turbidity not
only on the reef flat but also likely on the fore reef as well
(Storlazzi et al. 2004; Storlazzi and Jaffe 2008). Althoughthe stronger currents may reduce the overall residence time
of any given sedimentary particle on the reef flat, the
increased supply of material by erosion and the increasedduration of resuspension for a given set of waves and
currents could potentially result in greater exposure of
corals to suspended sediment on both reef flat and fore reef.The one-dimensional modeling by Ogston and Field
(2010) on waves and sediment resuspension and the two-
dimensional coupled hydrodynamics and sediment-trans-port modeling presented here provide insight into the
potential affects of sea-level rise on flow and sediment
dynamics over an exposed fringing coral reef based oncurrent observations of forcing conditions (winds and
waves). The hydrodynamic and sediment-transport data
presented here suggest that while some protected fringingcoral reefs many benefit from the additional accommoda-
tion space as suggested by Edwards (1995), all will
undergo a number of changes in both chemical and bio-logical processes (e.g., Sebens and Johnson 1991; Edwards
94 Coral Reefs (2011) 30:83–96
123

1995; Falter et al. 2004; Storlazzi et al. 2005) due to
changes in the hydrodynamics caused by sea-level rise.Many exposed fringing coral reefs may be threatened by
additional input and resuspension of terrestrial sediment
that will likely negatively affect corals and the ecosystemsthey support on both reef flat and fore reef, as first postu-
lated by Buddemeier and Smith (1988).
Acknowledgments This work was carried out as part of the USGeological Survey’s Coral Reef Project as part of an effort in theUnited States and its trust territories to better understand the effects ofgeologic processes on coral reef systems. Andrea Ogston (UW),Joshua Logan, Thomas Reiss, and David Gonzales (USGS) assistedwith the fieldwork and instrumentation. We would also like to thankMark Buckley (USGS), Jeff Hansen (USGS), and the editors at CoralReefs who contributed numerous excellent suggestions and a timelyreview of our work. Any use of product, trade, or firm names is fordescriptive purposes only and does not imply endorsement by the USGovernment.
Open Access This article is distributed under the terms of theCreative Commons Attribution Noncommercial License which per-mits any noncommercial use, distribution, and reproduction in anymedium, provided the original author(s) and source are credited.
References
Booij N, Ris RC, Holthuijsen LH (1999) A third-generation wavemodel for coastal regions, Part I: model description andvalidation. J Geophys Res 104:7649–7666
Buddemeier RW, Smith SV (1988) Coral reef growth in an era ofrapidly rising sea levels: predictions and suggestions for long-term research. Coral Reefs 7:51–56
DELFT3D User Manual (2010) Delft3D-FLOW: simulation of multi-dimensional hydrodynamic flows and transport phenomena,including sediment. User Manual, Delft Hydraulics, TheNetherlands
Edwards AJ (1995) Impact of climate change on coral reefs,mangroves and tropical seagrass ecosystems. In: Eisma D (ed)Climate change- Impact on coastal habitation. Lewis Publishers,Boca Raton, pp 209–234
Fabricius KE (2005) Effects of terrestrial runoff on the ecology ofcorals and coral reefs: review and synthesis. Mar Pollut Bull50:125–146
Falter JL, Atkinson MJ, Merrifield MA (2004) Mass transferlimitation of nutrient uptake by a wave-dominated reef flatcommunity. Limnol Oceanogr 49:1820–1831
Field ME, Cochran SA, Logan JB, Storlazzi CD (2008) The coral reefof south Moloka’i, Hawai’i—Portrait of a sediment-threatenedfringing reef. US Geological Survey Scientific InvestigationReport 2007–5101 [http://pubs.usgs.gov/sir/2007/5101/sir2007-5101]
Gourlay MR (1996) Wave set-up on coral reefs, 1: set-up and wave-generated flow on an idealized two-dimensional horizontal reef.Coast Eng 27:161–193
Graus RR, Macintyre IG (1998) Global warming and the future ofCaribbean reefs. Carbonates Evaporites 13:43–47
Grinsted A, Moore JC, Jevrejeva S (2009) Reconstructing sea levelfrom paleo and projected temperatures 200 to 2100 AD. ClimDyn 34(4):461–472
Hearn C (1999) Wave-breaking hydrodynamics within coral reefsystems and the effect of changing sea level. J Geophys Res104(C12):30007–30019
Hearn C, Atkinson MJ (2000) Effects of sea-level rise on thehydrodynamics of a coral reef lagoon: Kaneohe Bay, Hawaii. In:Noye J (ed) Sea-level changes and their effects. World ScientificPublishing Co Pte Ltd, Singapore, pp 25–48
Holthuijsen LH, Booij N, Ris RC (1993) A spectral wave model forthe coastal zone. 2nd International symposium ocean wavemeasurement and analysis, New Orleans, pp 630–641
Jokiel PL, Brown EK, Friedlander A, Rodgers SK, Smith WR (2001)Hawaii coral reef initiative coral reef assessment and monitoringprogram (CRAMP) final report 1999–2000. University ofHawaii, Honolulu, p 66
Lesser GR, Roelvink JA, van Kester JATM, Stelling GS (2004)Development and validation of a three-dimensional morpholog-ical model. Coast Eng 51(8–9):883–915
Lowe RJ, Falter JL, Bandet MD, Pawlak G, Atkinson MJ, MonismithSG, Koseff JR (2005) Spectral wave dissipation over a barrierreef. J Geophys Res 110(C04001):16
Lowe RJ, Falter JL, Monismith SG, Atkinson MJ (2009) Wave-drivencirculation of a coastal reef-lagoon system. J Phys Oceanogr39(4):869–889
Marszalek DS (1981) Impact of dredging on a subtropical reefcommunity: Southeastern Florida, USA. In: Proceedings 4thinternational coral reef symposium, vol 1, pp 147–153
Merrifield MA, Merrifield ST, Mitchum GT (2009) An anomalousrecent acceleration of global sea-level rise. J Clim 22:5772–5781
Moberly RM, Chamberlain T (1964) Hawaiian beach systems. HawaiiInstitute of Geophysics Report HIG 64–2. University of Hawaii,Honolulu, p 177
Montaggioni LF (2005) History of Indo-Pacific coral reef systemssince the last glaciation: development patterns and controllingfactors. Earth Sci Rev 71(1–2):1–75
Nicholls RJ, Cazenave A (2010) Sea-level rise and its impact oncoastal zones. Science 328:1517–1520
Ogston AS, Field ME (2010) Predictions of turbidity due to enhancedsediment resuspension resulting from sea-level rise on a fringingcoral reef: evidence from Molokai, HI. J Coast Res 26(6):1027–1037
Ogston AS, Storlazzi CD, Field ME, Presto MK (2004) Currents andsuspended sediment transport on a shallow reef flat: south-central Molokai, Hawaii. Coral Reefs 23:559–569
Phillip E, Fabricius KE (2003) Photophysiological stress in sclerac-tinian corals in response to short-term sedimentation. J Exp MarBiol Ecol 287:57–78
Piniak GA, Storlazzi CD (2008) Diurnal variability in turbidity andcoral fluorescence on a fringing reef flat: southern Molokai,Hawaii. Estuar Coast Shelf Sci 77(1):56–64
Presto MK, Ogston AO, Storlazzi CD, Field ME (2006) Temporal andspatial variability in the flow and dispersal of suspended-sediment on a fringing reef flat, Molokai, Hawaii. Estuar CoastShelf Sci 67:67–81
Riegl BM, Dodge RE (2008) Coral reefs of the USA. Springer, DaniaRis RC, Booij N, Holthuijsen LH (1999) A third-generation wave
model for coastal regions, Part II: verification. J Geophys Res104(4):7649–7666
Rogers CS (1990) Responses of coral reefs and reef organisms tosedimentation. Mar Ecol Prog Ser 62:185–202
SebensKP, JohnsonAS (1991) Effects ofwatermovement on prey captureand distribution of reef corals. Hydrobiologia 216–217:247–248
Sheppard CRC, Dixon DJ, Gourlay M, Sheppard A, Payet R (2005)Coral mortality increases wave energy reaching shores protectedby reef flats: examples from the Seychelles. Estuar Coast ShelfSci 64:223–234
Coral Reefs (2011) 30:83–96 95
123
Spalding MD, Ravilious C, Green EP (2001) World atlas of coralreefs. University of California Press, Berkeley
Storlazzi CD, Jaffe BE (2008) The relative contribution of processesdriving variability in flow, shear, and turbidity over a fringingcoral reef: West Maui, Hawaii. Estuar Coast Shelf Sci 77(4):549–564
Storlazzi CD, Logan JB, Field ME (2003) Quantitative morphology ofa fringing reef tract from high-resolution laser bathymetry:southern Molokai, Hawaii. Geol Soc Am Bull 115(11):1344–1355
Storlazzi CD, Ogston AS, Bothner MH, Field ME, Presto MK (2004)Wave- and tidally-driven flow and sediment flux across afringing coral reef: south-central Molokai, Hawaii. Cont ShelfRes 24(12):1397–1419
Storlazzi CD, Brown E, Field ME, Rogers K, Jokiel PL (2005) Amodel for wave control on coral breakage and species distribu-tion in the Hawaiian Islands. Coral Reefs 24:43–55
Van Rijn LC (1993) Transport of fine sands by currents and waves.J Waterw Port Coast Ocean Eng 119(2):123–143
Van Rijn LC (2007a) Unified view of sediment transport by currentsand waves. I: Initiation of motion, bed roughness, and bed-loadtransport. J Hydraul Eng 133(6):649–667
Van Rijn LC (2007b) Unified view of sediment transport by currentsand waves. II: Suspended transport. J Hydraul Eng 133(6):668–689
Van Rijn LC (2007c) Unified view of sediment transport by currentsand waves. III: Graded beds. J Hydraul Eng 133(7):761–775
Walstra DJ, Van Rijn LC (2003) Modeling of sand transport inDelft3D. Report Z3624. WL/Delft Hydraulics, Delft
Walstra DJ, Roelvink JA, Groeneweg J (2000) Calculation of wave-driven currents in a 3D mean flow model. In: Proceedings 27thconference on coastal engineering, pp 1050–1063
Wolanski E, Richmond RH, Davis G, Bonito V (2003) Water and finesediment dynamics in transient river plumes in a small, reef-fringed bay, Guam. Estuar Coast Shelf Sci 56(5–6):1029–1040
96 Coral Reefs (2011) 30:83–96
123