Embed Size (px)
Citation preview
Hurricane Modification and Adaptation in Miami-Dade County,FloridaKelly Klima,*,† Ning Lin,‡ Kerry Emanuel,‡ M. Granger Morgan,† and Iris Grossmann†
†Engineering and Public Policy, Carnegie Mellon University, 5000 Forbes Avenue, Pittsburgh, Pennsylvania 15213, United States .‡Earth, Atmosphere, and Planetary Science, Massachusetts Institute of Technology, 77 Massachusetts Avenue, Cambridge,Massachusetts 02139, United States
*S Supporting Information
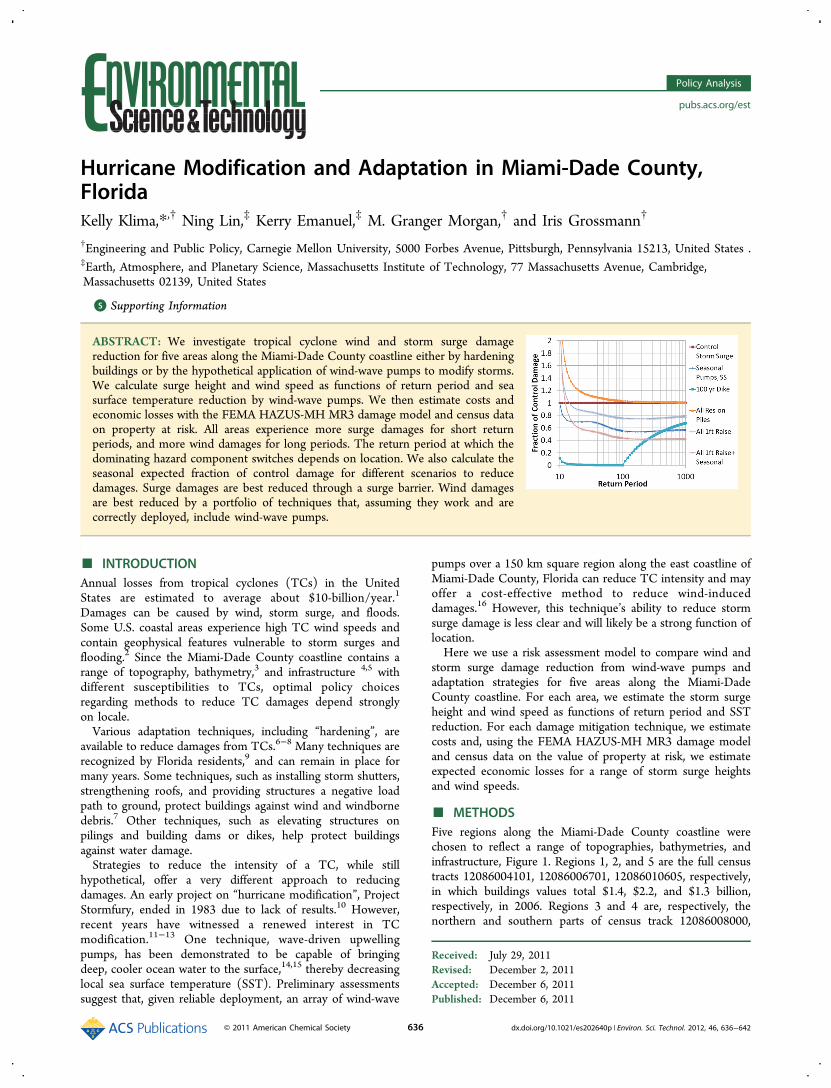
ABSTRACT: We investigate tropical cyclone wind and storm surge damagereduction for five areas along the Miami-Dade County coastline either by hardeningbuildings or by the hypothetical application of wind-wave pumps to modify storms.We calculate surge height and wind speed as functions of return period and seasurface temperature reduction by wind-wave pumps. We then estimate costs andeconomic losses with the FEMA HAZUS-MH MR3 damage model and census dataon property at risk. All areas experience more surge damages for short returnperiods, and more wind damages for long periods. The return period at which thedominating hazard component switches depends on location. We also calculate theseasonal expected fraction of control damage for different scenarios to reducedamages. Surge damages are best reduced through a surge barrier. Wind damagesare best reduced by a portfolio of techniques that, assuming they work and arecorrectly deployed, include wind-wave pumps.
■ INTRODUCTIONAnnual losses from tropical cyclones (TCs) in the UnitedStates are estimated to average about $10-billion/year.1
Damages can be caused by wind, storm surge, and floods.Some U.S. coastal areas experience high TC wind speeds andcontain geophysical features vulnerable to storm surges andflooding.2 Since the Miami-Dade County coastline contains arange of topography, bathymetry,3 and infrastructure 4,5 withdifferent susceptibilities to TCs, optimal policy choicesregarding methods to reduce TC damages depend stronglyon locale.Various adaptation techniques, including “hardening”, are
available to reduce damages from TCs.6−8 Many techniques arerecognized by Florida residents,9 and can remain in place formany years. Some techniques, such as installing storm shutters,strengthening roofs, and providing structures a negative loadpath to ground, protect buildings against wind and windbornedebris.7 Other techniques, such as elevating structures onpilings and building dams or dikes, help protect buildingsagainst water damage.Strategies to reduce the intensity of a TC, while still
hypothetical, offer a very different approach to reducingdamages. An early project on “hurricane modification”, ProjectStormfury, ended in 1983 due to lack of results.10 However,recent years have witnessed a renewed interest in TCmodification.11−13 One technique, wave-driven upwellingpumps, has been demonstrated to be capable of bringingdeep, cooler ocean water to the surface,14,15 thereby decreasinglocal sea surface temperature (SST). Preliminary assessmentssuggest that, given reliable deployment, an array of wind-wave
pumps over a 150 km square region along the east coastline ofMiami-Dade County, Florida can reduce TC intensity and mayoffer a cost-effective method to reduce wind-induceddamages.16 However, this technique’s ability to reduce stormsurge damage is less clear and will likely be a strong function oflocation.Here we use a risk assessment model to compare wind and
storm surge damage reduction from wind-wave pumps andadaptation strategies for five areas along the Miami-DadeCounty coastline. For each area, we estimate the storm surgeheight and wind speed as functions of return period and SSTreduction. For each damage mitigation technique, we estimatecosts and, using the FEMA HAZUS-MH MR3 damage modeland census data on the value of property at risk, we estimateexpected economic losses for a range of storm surge heightsand wind speeds.
■ METHODSFive regions along the Miami-Dade County coastline werechosen to reflect a range of topographies, bathymetries, andinfrastructure, Figure 1. Regions 1, 2, and 5 are the full censustracts 12086004101, 12086006701, 12086010605, respectively,in which buildings values total $1.4, $2.2, and $1.3 billion,respectively, in 2006. Regions 3 and 4 are, respectively, thenorthern and southern parts of census track 12086008000,
Received: July 29, 2011Revised: December 2, 2011Accepted: December 6, 2011Published: December 6, 2011
Policy Analysis
pubs.acs.org/est
© 2011 American Chemical Society 636 dx.doi.org/10.1021/es202640p | Environ. Sci. Technol. 2012, 46, 636−642

containing buildings worth, respectively, $600 and $160 millionin 2006.We created damage scenarios for each region in three steps.
First we used a risk assessment method to estimate the windspeed and storm surge height as functions of TC return periodand SST reductions by wind-wave pumps. Second, weidentified several possible scenarios of adaptation and hurricanemodification and calculated implementation costs. Third, weused FEMA’s HAZUS-MH MR317,18 to calculate damages andaggregate total losses from the wind and storm surge for eachscenario.In contrast to previous work that considered only wind
damages,16 this method yields wind and storm surge damagesfor a range of return periods. Additionally, damage reductionsfrom adaptation and modification can be combined.1. TC Wind and Surge Risk Assessment. To investigate
the risks of TC wind and surge and how they may be reducedby lowering SST through using wind-wave pumps, we adapteda risk assessment method previously applied to study stormsurge risk for New York City.19 We generated large numbers ofsynthetic TCs for the study area under different SSTconditions, and conducted storm surge simulation for eachstorm. Return level curves were then estimated for the windand surge as functions of return period and SST reduction foreach region.The hurricane model applied uses large-scale TC environ-
ments, which may be estimated from observations or climatemodeling, to generate synthetic TCs.20,21 Output does not relyon the limited historical track database, but is in statisticalagreement with the observations.20 For this study, we generateda control set of 500 TCs for the study area under currentclimate conditions. The annual frequency of such TCs wasestimated to be 0.41. To study the modification of the TCs bywind-wave pumps, we simulated another three 500-TC sets, foreach of the SST reductions of 0.5, 1.0, and 1.5 °C,16 yielding anannual frequency of 0.36, 0.33, and 0.3, respectively.
We applied the Sea, Lake, and Overland Surges fromHurricanes (SLOSH) model22 with a grid for Miami basin tosimulate storm surges for all 2000 synthetic tracks. SLOSH iscurrently used by the National Hurricane Center to providereal-time TC storm surge guidance. The performance of theSLOSH model has been evaluated using observed storm surgesfrom past TCs; the accuracy of the surge heights predicted bythe model is reported to be within 20% when the TC isadequately described.22,23
For each of the five selected regions and for each SSTreduction, we calculated the wind speed and storm surge heightat a coastal point near the region. We assumed that the stormsurge and wind speed at the nearby coastal point represent thewind and surge values over the region. This assumption makesit convenient to compare risks among the regions and themodification conditions. It is also reasonable, as the area of theregions was selected to be small so that the simulated windsand surges do not change much over the area.Wind/surge return level curves (or, equivalently, exceedance
probability curves), representing the long-term TC risk, wereestimated by combining the probability density function (PDF)of the wind speeds/surge heights and the annual TC frequency.The PDF of the TC wind and surge is often associated with along tail where infrequent storms cause catastrophic damage.Therefore, we modeled the tail of each PDF with a generalizedpareto distribution (GPD) using the maximum likelihoodmethod,24 and the rest of the distribution, where the data areabundant, with nonparametric density estimation, similarly toother studies on TC climatology.25,26 We calculated thestatistical confidence intervals of the estimated return levelcurves with the Delta Method.24
2. Cost Analysis for Adaptation and HurricaneModification Scenarios. We examine two hardeningmethods to reduce wind damages, three adaptation techniquesto reduce storm surge damages, and one hurricane modificationtechnique. Here we detail costs for these scenarios.
Figure 1. The five regions along the Miami-Dade County coastline with varying topographies, bathymetries, and housing types examined in thisstudy. Regions 1, 2, and 5 include the full census tract (12086004101, 12086006701, 12086010605, respectively), while Regions 3 and 4 are,respectively, the northern and southern part of census track 12086008000.
Environmental Science & Technology Policy Analysis
dx.doi.org/10.1021/es202640p | Environ. Sci. Technol. 2012, 46, 636−642637

Hardening to Reduce Wind Damages. Previous workdescribed methods to increase wind resistance of buildings,such as installing shutters on all windows and doors as well asemploying all wind hardening techniques (shutters, improvedroof-wall connections, improvement of roof during replace-ment, and tie-downs).16 According to the building data inHAZUS, adding corrugated aluminum shutters to windows anddoors of all nonshuttered residential buildings will, whenannualized over 30 years at a 5% discount rate, cost $530−760,$220−450, $250−340, $50−70, and $700−920 thousand peryear, respectively, in Regions 1, 2, 3, 4, and 5. Employing allwind hardening techniques will cost $1.2−5.6, $0.4−1.7, $0.6−2.5, $0.1−0.5, and $1.6−6.6 million per year, respectively.Adaptation to Reduce Storm Surge Damages. FEMA
maintains extensive information on ways one can protectproperty from floods and storm surges.27−31 One method is toelevate buildings above the expected flooding level, or baseflood elevation (BFE). Florida regulations require that whenbuildings below BFE are damaged by floods, they must beelevated or in some other way protected from future waterdamages when repaired.27 The highest foundation heightdescribed in HAZUS is pile foundation height.18 Here weexamine two strategies: elevating all residential buildings onefoot and elevating all buildings to pile height.The cost of elevating a building varies with building
characteristics. A Florida construction company suggested weestimate a lower bound cost for elevating a standard singlefamily home as $40 K plus $10 K per foot raised up to ninefeet. The approximate costs of elevating a home in FEMA’sretrofitting guide are similar; it costs $80, $83, and $88/sq-footto elevate a frame home without basement and $88, $91, and$96/sq-foot to elevate masonry homes without basements by 2,4, or 8 feet, respectively. Thus a lower bound estimate toelevate all residential buildings one foot annualized over 30years at a 5% discount rate is $6.6, $1.7, $4.9, $1.7, and $13.5million, respectively, in Regions 1, 2, 3, 4, and 5, while a lowerbound estimate to elevate all buildings to pile height is $13,$3.5, $9.4, $3.8, and $26.3 million, respectively.A third technique to reduce storm surge damages involves
large scale civil engineering of the coast through coastalreinforcement, the raising of quaysides, or the building of dikesand levees. Here we consider the cost of installing a surgebarrier. Optimal design depends on local bathymetry and stormclimatology.32 The U.S. Army Corps of Engineers suggests asurge barrier that would protect against a 100-year event, whichfrom our hurricane surge risk analysis is 1.1, 2.5, 3, 3, and 3 m,respectively, for Regions 1, 2, 3, 4, and 5. To fully protect theRegions, and assuming dikes would be placed in a line along thecoast, these dikes would be of length 3, 4, 5, 5, and 6 km,respectively. Costs of these structures are uncertain because ofcost of maintenance. Recently, $14.45 billion USD2010 wasallocated to build the Hurricane and Storm Damage RiskReduction System, approximately 560 km of 6 m high levees inNew Orleans,33 suggesting a cost of $4,000/sq-meter. As costlikely increases nonlinearly with dike height, this valueoverestimates costs for the heights of this study (1−3 m).Assuming a range of $80−4,000/sq-meter, annualizing over 100years at a 5% discount rate yields $0.01−1.2, $0.04−2.1, $0.06−3.3, $0.06−3.3, and $0.21−4.7 million, respectively, for Regions1, 2, 3, 4, and 5. Note this surge barrier would cause heightenedflooding at its edges if it were simply terminated at the ends ofour study region.
Hurricane Modification. We examined the hurricanemodification technique of using wind-wave pumps to raisecolder deep water to the surface and decrease SST.14 Previouswork suggests along the east coast of Miami-Dade County, thewind-wave pumps can realize an SST reduction sufficient todecrease TC intensity;12 we use the risk assessment methoddescribed above to characterize this relationship. Seasonaldeployment, or covering a large area in front of Miami (25−27°N, 78−80 °W) with pumps for the entire hurricane season,will decrease the SST by 1.0−1.5 °C and is estimated to costbetween $0.9−1.5 billion annually.12 After a storm passes re-equilibration time is less than 6 h,12 so it is very unlikely thatthe pumps will be less viable on a second storm. If pumps wereto be deployed ∼3 days ahead of the forecasted path of anintense TC, they would not have time to realize the full SSTreduction, but we assume they could be deployed in a muchsmaller area (roughly over a 150 km2 region) and withoutmaintenance costs. In this case, it may be assumed thatsuccessful deployment in front of an approaching TC willdecrease the SST by 0.5−1.0 °C and cost $400−700 milliontotal per TC.12
However, these costs are levied to reduce TC damages overthe entire area impacted by the hurricane; here our focus is thecost in each selected region. Therefore we distribute a fractionof the total hurricane modification cost to the five regions. Weassume that each region’s fraction of total cost is equal to thefraction of the seasonal expected loss (value of damage) in theregion compared to the total seasonal expected losses over theentire affected area. The expected seasonal loss is obtained byintegrating the loss curve over the annual exceedanceprobability (the reciprocal of return period). (Damage andloss estimates are discussed in the next subsection.) Thecalculated costs for seasonal deployment are $1.2−5.6, $1.6−8.0, $0.3−2.4, $0.2−2.4, $0.4−4.2 million per season,respectively, in Regions 1, 2, 3, 4, and 5. Also applying theseasonal loss ratio, we estimate the costs for deployment infront of a storm to be $0.6−2.8, $0.8−4.0, $0.2−2.2, $0.1−1.2,$0.2−2.1 million per storm, respectively.
3. Damage Analysis and Loss Estimation. To estimatetotal losses, we use FEMA’s publically available HAZUS-MHMR3 model with default input data. HAZUS uses generalbuilding stock data from the 2000 U.S. Census Bureau,commercial data by Dun and Bradstreet (2006),4 and RSMeansResidential Cost Data (2006) for calculations at the censustract level.5 Wind damages and storm surge damages werecalculated in two different submodels of HAZUS.We used the H-Wind feature in HAZUS-MH MR3
Hurricane Model17 to aggregate losses from wind damage,including total loss, building loss, contents loss, inventory loss,relocation costs, income loss, rental income loss, wage loss, anddirect output employment loss.Following FEMA’s Coastal Standard Operating Procedure,34
we subtracted the appropriate digital elevation model (DEM)in the North American Datum of 1983 (NAD83) (ref 35 andSupporting Information) and converted these data to a userdefined flood grid. We then used the HAZUS-MH MR3 floodmodel18 to aggregate total losses for storm surge damages foreach return period for all scenarios. Damage values weresmoothed along boundaries (Supporting Information).
■ RESULTSFollowing the method outlined above, we calculated returnlevel curves of the wind speed and surge height, the value of
Environmental Science & Technology Policy Analysis
dx.doi.org/10.1021/es202640p | Environ. Sci. Technol. 2012, 46, 636−642638
damage of each scenario, and the seasonal expected net cost ofeach scenario (damage reduction cost plus value of damage).Wind and storm surge analyses are presented separately.First, we calculated return level curves of the wind speed and
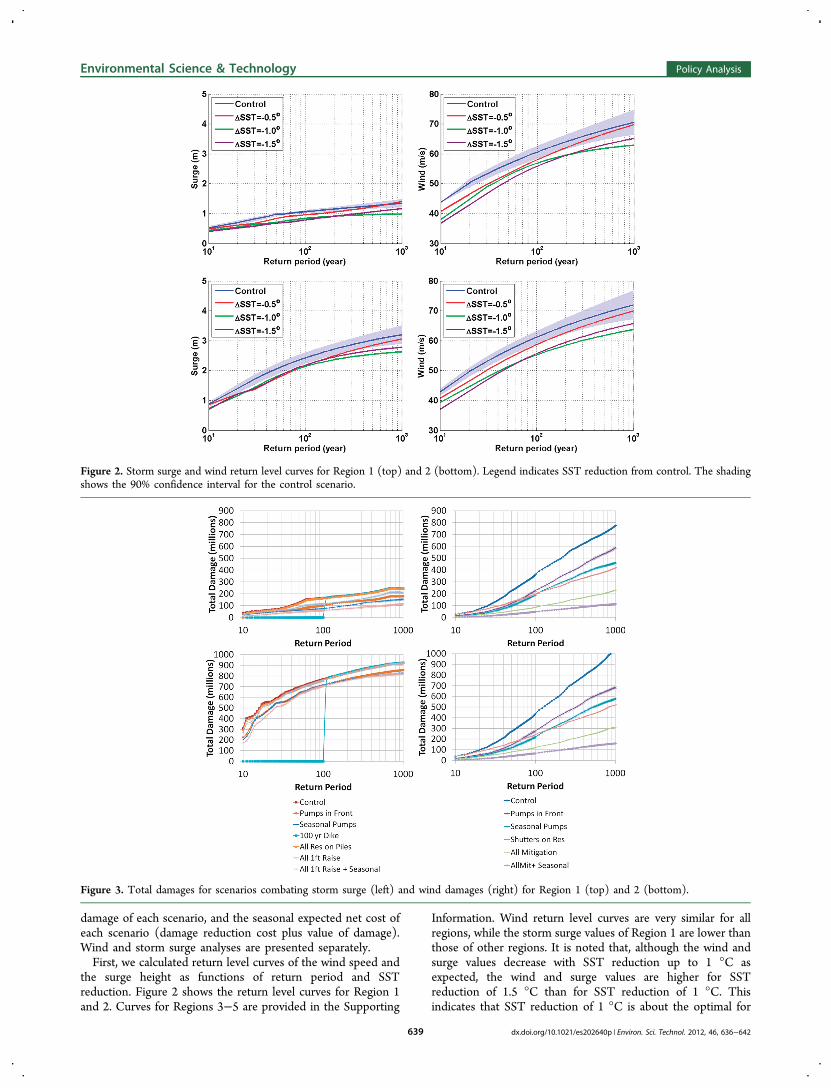
the surge height as functions of return period and SSTreduction. Figure 2 shows the return level curves for Region 1and 2. Curves for Regions 3−5 are provided in the Supporting
Information. Wind return level curves are very similar for allregions, while the storm surge values of Region 1 are lower thanthose of other regions. It is noted that, although the wind andsurge values decrease with SST reduction up to 1 °C asexpected, the wind and surge values are higher for SSTreduction of 1.5 °C than for SST reduction of 1 °C. Thisindicates that SST reduction of 1 °C is about the optimal for
Figure 2. Storm surge and wind return level curves for Region 1 (top) and 2 (bottom). Legend indicates SST reduction from control. The shadingshows the 90% confidence interval for the control scenario.
Figure 3. Total damages for scenarios combating storm surge (left) and wind damages (right) for Region 1 (top) and 2 (bottom).
Environmental Science & Technology Policy Analysis
dx.doi.org/10.1021/es202640p | Environ. Sci. Technol. 2012, 46, 636−642639

TC modification for this region; further reduction of SST mayhave little impact on storm intensity. At greater SST reduction,the boundary layer becomes stable and frictional effects becomemore confined to a thin boundary layer, enabling the vortex inthe free atmosphere to spin down less rapidly.Next we calculated the total damages that result with various
adaptation and modification techniques as a function of returnperiod using the wind and surge return level curves in Figure 2.Scenarios examined included (a) control with no damageabatement policies, (b) shutters on all residential windows anddoors, (c) the full set of wind mitigation options available inHAZUS, (d) raising all buildings one foot, (e) raising allresidential buildings to pile height, (f) building a surge barrier,(g) deployment of wind-wave pumps to modify a specificstorm, (h) seasonal deployment of wind-wave pumps, and (i)combinations of adaptation and modification. Damage valuesfor pump deployment in front of specific storms or for an entireseason were calculated by averaging the damages at each returnperiod, respectively, over the 0.5 and 1.0 °C trials or 1.0 and 1.5°C trial. Damage values are given in Figure 3 and in theSupporting Information; note the benefit of each scenario,although not given here, would be the difference between thecontrol and the specific scenario. We find that HAZUS doesnot predict total destruction of property from either wind orstorm surge alone even in a 1000 year period. Since HAZUS isunable to combine wind and storm surge damages, we cannotrule out the possibility of total destruction for long returnperiods. While all areas experience much larger storm surgedamages for short return periods, they experience more winddamages for long periods. Specifically, the return period atwhich wind damages become larger than surge damages inRegion 1 is ∼30 years; for other regions, the return period atwhich wind damages become larger than surge damages is justover 500 years. The switch between dominating hazard
component results because (a) the magnitude of storm surgeand wind both increase in a roughly linear manner with returnperiod, and (b) while surge damages are linear with the stormsurge height, wind damages increase as roughly the cube of thewind speed.Finally we calculated the seasonal expected fraction of
control damage for each scenario. We calculated the seasonalexpected total damage as an integration of the damage curve inFigure 3 up to each return period. Next we calculated seasonalnet costs for each scenario by adding the seasonal expectedtotal damage to the seasonal implementation cost (described inMethods, and $0 in the control case). Then we calculated theseasonal expected fraction of control damage as the ratio of theseasonal net cost of each scenario to the control seasonal totaldamages. Figure 4 shows, for Region 1 and 2, the seasonalexpected fraction of control damage. The seasonal expectedfraction of control damage curves for Regions 3−5 are similar(Supporting Information). Fractional values larger than oneindicate a scenario with expected net costs larger than those forthe control. High fractional values are expected at short returnperiods since scenario costs will not have been recuperated (orthe extremes will not have been expected to happen).For wind damage reduction, the all-mitigation scenario
dominates because benefits of additional mitigation techniquealways outweigh their costs. For surge damage reduction,raising all buildings by one foot dominates raising all residentialbuildings to pile height because the former raises all buildings,whereas the latter only raises a few residential buildings notalready at pile height. Seasonal deployment of wind-wavepumps dominates deployment in front of a specific stormbecause the former is more effective in reducing damages fromeach storm (due to 1.0−1.5 °C SST reduction instead of 0.5−1.0 °C reduction), and also protects against the entire season ofstorms instead of only a single storm. Even assuming
Figure 4. Seasonal expected fraction of control damage for scenarios combating storm surge (left) and wind damages (right) for Region 1 (top) and2 (bottom).
Environmental Science & Technology Policy Analysis
dx.doi.org/10.1021/es202640p | Environ. Sci. Technol. 2012, 46, 636−642640

deployment in front of a specific storm protects against thelargest storm incident in a period, on an expectation basis,damage reduction from one storm is often small compared tooverall damages.For storm surge adaptation, we find a surge barrier performs
best except in Region 1 where a combination of raising allbuildings by one foot and seasonal pump deployment is best forreturn periods longer than 200 years.For wind adaptation, we find a combination of all mitigation
possible in HAZUS and seasonal deployment of wind-wavepumps is always the best choice (assuming that pumpdeployment and operation are reliable). If techniques are notcombined, seasonal deployment of wind-wave pumps performsbest at short return periods (or when small to moderate eventsare considered), while all mitigation possible in HAZUSperforms best at long return periods (or when the extremes arealso considered). The switch between scenarios varies fromreturn periods of 5−20 years depending on the region.
■ DISCUSSION
Expected storm surge damages dominate expected winddamages in the coastal regions examined. However, the stormsurge and its response varies across the five regions weexamined due to differences in topography, bathymetry, andcoastal infrastructure. For instance, although Region 2 is“protected” from the open ocean by an archipelago, Region 1has lower storm surge values. Thus the best method to reducestorm surge damages in Region 1 varies with return period,while the best method is always a surge barrier in Regions 2−5.For wind, a portfolio of hurricane wind damage reduction
techniques is preferred across the regions examined. Whilewind damages are not dominant in these regions, damages inareas outside of the floodplain will likely be dominated by winddamages. Hence a similar portfolio will likely be best in areasaffected by hurricanes but outside of the flood plain.Since storm wind and surge vary greatly over large areas,
there is hardly any “typical storm” for a return period over largeareas (Supporting Information). Local damage risks are notnecessarily representative of the risks for larger areas, andtherefore the best policy decisions to combat damages on thelocal level may be different from the best policy decisions atlarger scales. In previous work16 we examined cumulative winddamage along an entire overland track, but research on thespatial distribution of the hurricane wind and surge, andmethods to combine the two, will be needed to predict long-term damages over large areas.The combination of wind and storm surge damage is also
nonlinear and poorly understood.6 A lower bound can beplaced on the total damages (Supporting Information), but dueto the nonlinearities in combination in the coastal area weexamined in this study, we can neither provide an upper boundlower than 100% nor make a statement about how doublecounting affects these conclusions. However, since storm surgedamages dominate in these coastal regions, eventually a strategyof only protecting against wind damages will be overwhelmedby large storm surge losses. Further study of both thecorrelation between hurricane wind and surge and thecorrelation between wind and surge damages is needed tobetter assess the likely efficacy of TC modification andadaptation.
■ ASSOCIATED CONTENT
*S Supporting InformationRaster download information for the five regions, thesmoothing of HAZUS storm surge damage values, the stormsurge and wind return level curves for Regions 3−5, thedamages for each scenario for Regions 3−5, the seasonalexpected net cost of each scenario for Regions 3−5, theinability to identify typical storms for each return period, and anattempt to combine wind and storm surge damages using lowerbound estimates. This material is available free of charge via theInternet at http://pubs.acs.org.
■ AUTHOR INFORMATION
Corresponding Author*Phone: 412-400-1436; fax: 412-268-3757; e-mail: [email protected].
■ ACKNOWLEDGMENTS
We thank members of the National Hurricane Center andHAZUS modeling team for their valuable assistance. K.K.,M.G.M., and I.G. were supported by the Climate DecisionMaking Center (SES-0345798) and by the center for Climateand Energy Decision Making (SES-0949710), both through acooperative agreement between the National Science Founda-tion and Carnegie Mellon University. N.L. was supported bythe NOAA Climate and Global Change Postdoctoral Fellow-ship Program, administered by the University Corporation forAtmospheric Research.
■ REFERENCES(1) Pielke, R. A. Jr.; Gratz, J.; Landsea, C. W.; Collins, D.; Saunders,M. A.; Musulin, R. Normalized hurricane damage in the United States:1900−2005. Nat. Hazards Rev. 2007, 9, 29−42.(2) Leatherman, S. P. The most vulnerable U.S. hurricane places.Catastrophe Risk Manage. 2007, 8−10.(3) Friday, D. Z.; Taylor, L. A.; Eakins, B. W.; Carignan, K. S.;Caldwell, R. J.; Grothe, P. R.; Lim, E. Digital Elevation Models of PalmBeach, Florida: Procedures, Data Sources and Analysis, prepared for thePacific Marine Environmental laboratory NOAA Center for TsunamiResearch by the NOAA National Geophysical Data Center. September16, 2010.(4) Market Analysis Profile Aggregated by Standard IndustrialClassification (SIC) Code Clusters; Dun & Bradstreet Inc.: ShortHills, NJ, July 2006.(5) Residential Cost Data 2006, 25th ed.; RS Means Engineering:Norwell, MA, 2005; ISBN: 087629803X.(6) Leatherman, S. P.; Gan Chowdhury, A.; Robertson, C. J. Wall ofwind full-scale, destructive testing of coastal houses and hurricanedamage mitigation. J. Coast. Res. 2007, 23:5, 1211−1217.(7) FEMA 247. Against the Wind: Protecting Your Home fromHurricane and Wind Damage, December 1993.(8) FEMA P-805. Protecting Your House From Flood Damage:Mitigation Ideas For Reducing Flood Loss, October 2010.(9) Klima, K.; Bruine de Bruin, W.; Morgan, G.; Grossmann, I. Publicperceptions of hurricane modification techniques. Risk Anal., 2011,DOI: 10.1111/j.1539-6924.2011.01717.x.(10) Willoughby, H. E.; Jorgensen, D. P.; Black, R. A.; Rosenthal, S.L. Project STORMFURY, A Scientific Chronicle, 1962−1983. Bull.Am. Meteorol. Soc. 1985, 66, 505−514.(11) American Meteorological Society. 17th Joint Conference onPlanned and Inadvertent Weather Modification/ Weather ModificationAssociation Annual Meeting, 20−25 April 2008. http://ams.confex.com/ams/17WModWMA/techprogram/authorindex.htm (accessedDecember 16, 2009).
Environmental Science & Technology Policy Analysis
dx.doi.org/10.1021/es202640p | Environ. Sci. Technol. 2012, 46, 636−642641

(12) Hurricane Modification Workshop Report; Hurricane ModificationWorkshop; Department of Homeland Security; David Skaggs ResearchCenter: Boulder, CO, February 6 and 7, 2008.(13) National Oceanic and Atmospheric Administration. HURR-MIT: The Identification and Testing of Hurricane MitigationHypotheses. http://www.ofcm.noaa.gov/ihc09/Presentations/Session10/s10-01Woodley.ppt (accessed December 14, 2009).(14) White, A. E.; Bjorkman, K.; Grabowski, E.; Letelier, R. M.;Poulos, S.; Watkins, B.; Karl, D. M. An open ocean trial of controlledupwelling using wave pump technology. J. Oceanic Atmos. Technol.2010, 27, 385−396.(15) Kithil, P. Biological ocean sequestration using wave-driven deepocean pump system. Electric Utility Environmental Conference. http://www.atmocean.com/pdf/BioOceanSeqWaveDriv.pdf (accessed Febru-ary 28, 2011).(16) Klima, K.; Morgan, M. G.; Grossmann, I.; Emanuel, K. Does itmake sense to modify tropical cyclones? A decision-analytic assess-ment. Env. Sci. Technol. 2011, 45:10, 4242−4248.(17) Multi-hazard Loss Estimation Methodology Hurricane Model,HAZUS-MH MR3 Technical Manual; Department of HomelandSecurity, Federal Emergency Management Agency, HardeningDivision: Washington, DC, 2009.(18) Multi-hazard Loss Estimation Methodology Flood Model, HAZUS-MH MR3 Technical Manual; Department of Homeland Security,Federal Emergency Management Agency, Hardening Division:Washington, DC, 2009.(19) Lin, N.; Emanuel, K. A.; Smith, J. A.; Vanmarcke, E. Riskassessment of hurricane storm surge for NewYork City. J. Geophys. Res.2011, 115, D1812.(20) Emanuel, K.; Ravela, S.; Vivant, E.; Risi, C. A statistical-deterministic approach to hurricane risk assessment. Bull. Am.Meteorol. Soc. 2006, 87, 299−314.(21) Emanuel, K.; Sundararajan, R.; Williams, J. Hurricanes andglobal warming: Results from downscaling IPCC AR4 simulations.Bull. Am. Meteorol. Soc. 2008, 89, 347−367.(22) Jelesnianski, C., Chen, J., Shaffer, W. SLOSH: Sea, lake, andoverland surges from hurricanes, NOAA Technical Report, NWS 48,1992.(23) Houston, S. H.; Shaffer, W. A.; Powell, M. D.; Chen, J.Comparisons of HRD and SLOSH surface wind fields in hurricanes:Implications for storm surge modeling.Weather Forecasting 1999, 14:5,671−686.(24) Coles, S. an Introduction to Statistical Modeling of Extreme Values;Springer: London, 2001.(25) Jagger, T. H.; Elsner, J. B. Climatology models for extremehurricane winds near the United States. J. Clim. 2006, 19, 3220−3226.(26) Simiu, E.; Heckert, N. A. Extreme wind distribution tails: A'peaks over threshold’ approach. J. Struct. Eng.. 1996. 122:5.(27) FEMA 347. Above the Flood: Elevating Your Floodprone House,May 2005.(28) Floodproofing Regulations, EP 1165-2-314; U.S. Army Corps ofEngineers, December 15, 1995.(29) FEMA 348. Protecting Building Utilities from Flood Damage,November 1999.(30) FEMA 259. Engineering Principles and Practices for RetrofittingFlood Prone Residential Buildings, January 1995.(31) FEMA Technical Bulletin 2. Flood Damage-Resistant MaterialsRequirements for Buildings Located in Special Flood Hazard Areas,August 2008.(32) Voortman, H. G.; Vrijling, J. K. Optimal design of flood defencesystems in a changing climate. HERON 2004, 49:1, 75−94.(33) U.S. Army Corps of Engineers. Greater New Orleans Hurricaneand Storm Damage Risk Reduction System: Facts and Figures, December2009.(34) Longenecker, G. HAZUS-MH Coastal Flood Module: FEMARegion IV Standard Operating Procedure For Coastal Flood Hazard &Loss Analysis, August 2008.(35) Friday, D. Z.; Taylor, L. A.; Eakins, B. W.; Carignan, K. S.;Caldwell, R. J.; Grothe, P. R.; Lim, E. Digital Elevation Models of Palm
Beach, Florida: Procedures, Data Sources and Analysis; Prepared for thePacific Marine Environmental laboratory NOAA Center for TsunamiResearch by the NOAA National Geophysical Data Center, September16, 2010.
Environmental Science & Technology Policy Analysis
dx.doi.org/10.1021/es202640p | Environ. Sci. Technol. 2012, 46, 636−642642