Embed Size (px)
Citation preview

1
Numerical Evaluation : AISI S400 Steel-Sheathed CFS Framed Shear Wall
Seismic Design Method
I. Shamim and C.A. Rogers*
Department of Civil Engineering & Applied Mechanics
McGill University, Montreal, Canada
*Corresponding author Tel. 514 398-6449
Dept. of Civil Engineering
McGill University
Macdonald Engineering Building
817 Sherbrooke Street West
Montreal, QC, Canada, H3A 0C3
2
Abstract
Seismic design provisions for steel-sheathed cold-formed steel framed shear walls, specific to
Canada, are not provided in the existing AISI S213 Standard “North American Standard for Cold-
Formed Steel Framing – Lateral Design”. A multi-phase approach was adopted in order to develop
appropriate seismic design provisions for inclusion in the new AISI S400 Standard “North
American Standard for Seismic Design of Cold-Formed Steel Structural Systems”. The approach
included the extensive displacement based testing and dynamic testing of shear walls, the analysis
of the test data results, the development and calibration of dynamic numerical models in OpenSees,
and lastly, the dynamic response history analyses of twelve archetype buildings designed for the
seismic hazard in three cities; Halifax (low seismic), Montreal (medium seismic) and Vancouver
(high seismic). It is this last phase of the study that is documented herein. Fragility curves were
developed from the buildings’ response to 44 scaled ground motion records following a method
adapted from the FEMA P695 analysis methodology. The results showed that the design method
is appropriate, including the seismic force modification factors of Rd=2 and Ro=1.3. Improvement
to the predicted seismic response of CFS framed buildings could be forthcoming if one were to
account for the contribution of the non-structural gypsum wall panels.
Keywords: Cold-formed steel, shear wall, steel sheathing, seismic, design, numerical analysis

3
1. Introduction
Provisions for the seismic design in North America of cold-formed steel (CFS) framed
structures are found in the American Iron and Steel Institute (AISI) S213 Standard for “Cold-
Formed Steel Framing – Lateral Design” [1]. This standard is to be replaced in 2015 with a new
seismic specific standard, which is to be known as AISI S400 “North American Standard for
Seismic Design of Cold-Formed Steel Structural Systems” [2]. One of the major additions to the
S400 Standard in comparison to its predecessor is the inclusion of design information for steel-
sheathed cold-formed steel framed shear walls applicable for use in Canada. The design method is
based on extensive wall assembly testing [3-7], use of an equivalent energy method to derive
nominal shear resistance values [8], development of non-linear dynamic numerical models [9]
using OpenSees [10,11] to represent the shear walls, and a building performance evaluation using
numerical dynamic models subjected to seismic loading according to an approach adapted from
the Federal Emergency Management Agency (FEMA) P695 [12] standard procedural
methodology. The response of the CFS framed buildings to ground motions is directly related to
the method used in their design, including the choice of the ductility related seismic force
modification factor, Rd, and the over-strength related seismic force modification factor, Ro, which
are used for seismic design following the National Building Code of Canada (NBCC) [13]. The
final phase in the development of this design method is presented herein: an evaluation of the
seismic performance of representative steel-sheathed cold-formed steel framed buildings using
non-linear dynamic response history numerical modelling and analyses.
The scope of this research paper comprises selecting and designing the archetype buildings,
choosing and scaling the ground motion records, developing non-linear dynamic building models,
completing incremental dynamic analyses (IDA) of the building models, developing fragility

4
curves based on building collapse probability, as well as validating R-values and an acceptable
building height limit. Four building archetypes located in three different cities were subjected to
22 pairs of ground motions (44 lateral ground motion records) selected from the far-field record
set provided in FEMA P695. The records were first normalized and then scaled to the design
uniform hazard spectra from the NBCC [13] for the three selected cities where the model buildings
were assumed to be located. These cities are of different seismic intensities from low to high, i.e.
Halifax Nova Scotia (low seismic), Montreal Quebec (medium seismic) and Vancouver British
Columbia (high seismic). Incremental scaling factors were then used with the pre-scaled ground
motion records to determine the level of earthquake that brings failure to the buildings. Fragility
curves were created using the collapse probability at each scaling factor and then used to identify
the related performance according to the FEMA P695 acceptance criteria.
2. Archetype Design
FEMA P695 defines an archetype as a “prototypical representation of a seismic force
resisting system” [12]. The archetypes consist of a range of design parameters and building
attributes that can be assembled into performance groups based on their major differences in plan
configuration, building height (number of storeys), occupancy condition, design gravity load,
seismic hazard, etc. Twelve archetype buildings differing in location (seismicity and snow load),
occupancy type and building height (number of storeys) were selected for this study. An office
building and three residential buildings (Table 1), rectangular in plan, were detailed and designed
for each of the three cities. The seismic design of the buildings was carried out using the equivalent
static force procedure for regular buildings as documented in the 2010 National Building Code of
Canada [13], the Canadian steel sheathed shear wall selection and detailing provisions to be

5
included in AISI S400 [2,8], as well as the Canadian Standards Association (CSA) S136 Standard
for general cold-formed steel member design [14].
2.1 Location: Seismic Hazard and Snow Load
Vancouver British Columbia was chosen as the representative west-coast city due to the high
seismic risk, relative to Canada, and the resulting potential to maximise the earthquake force
applied to the archetypical buildings. Montreal’s (Quebec) moderate seismic risk combined with
a high snow loading resulted in it being chosen as a representative city in the east of the country.
Halifax Nova Scotia is the largest city on the east-coast of the country, and as such has a significant
stock of buildings; it is representative of a lower seismic hazard region in Canada with medium
snow loads. The seismic spectral accelerations at 0.2 seconds and the snow loads for the archetype
buildings as obtained from the 2010 NBCC are as follows: Halifax (Sa(0.2) = 0.23g, Ss = 1.9 kPa,
Sr = 0.6 kPa), Montreal (Sa(0.2) = 0.64g, Ss = 2.6 kPa, Sr = 0.4 kPa) and Vancouver (Sa(0.2) =
0.94g, Ss = 1.8 kPa, Sr = 0.2 kPa) [13]. Sa(0.2) is the 5% damped spectral acceleration at a period
of 0.2 sec. (probability of exceedance of 2% in 50 years, i.e. a return period of approximately 2500
years), and Ss and Sr are the ground snow and associated winter rain loads (return period of 50
years), which are combined to determine the snow loading as per the NBCC [13].
FEMA P695 has been written to accord with the loading provisions in the United States
(ASCE / SEI 7 [15]); which for earthquake loading are written in terms of the seismic design
category (SDC). In contrast, the National Building Code of Canada [13] requires that the seismic
design load be based on the uniform hazard spectrum (UHS) for each specific city or location in
the country. To be consistent with the US seismic design categories (B, C, and D), the selection of
the three cities was also made to reflect the US regions of the lowest to the highest seismicity. The
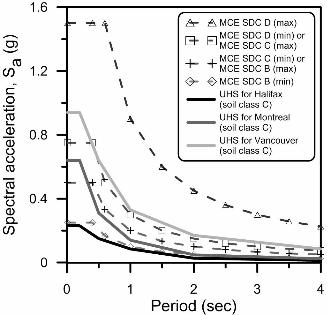
uniform hazard spectral accelerations are provided in Figure 1 for each of the three cities (soil class

6
C) along with curves that represent the range of the maximum considered earthquake (MCE) for
the US seismic design categories B, C and D. The uniform hazard spectra of the selected cities are
within the range of accelerations bounded by the US seismic design categories.
2.2 Number of Storeys
The maximum number of storeys, as limited by the overall building height, permitted for the
building system under consideration was reflected in the selection of building archetypes. Since
the height of a building affects its natural period of vibration (Table 1) it was assumed that this
variable would influence the performance and failure characteristics during seismic loading.
Applying the height limit of 15 m, which is within the current limits for wood sheathed and strap
braced CFS shear walls listed in the 2010 NBCC [13], and given the common convention of
constructing low to medium rise CFS framed buildings, a two, four, and five storey structure were
selected for the archetype buildings (Table 1). The storey height of the platform framed buildings
was set equal to 2.74 m, comprising a 2.44 m high wall with a 0.3 m deep floor or roof joist located
above.
2.3 Occupancy Type of the Building
The occupancy type of the building can affect the structural plan, the framing span, the
number and the placement of shear walls, the live load, etc.. It was decided to include both
residential and office buildings within the scope of the archetype buildings. To compute the gravity
loads, as per the 2010 NBCC [13] a live load of 1.9 kPa was used for the residential floors, whereas
for the office floors, a live load of 2.4 kPa was applied. Lastly, for both occupancy types a live
load of 1.0 kPa was applied to the roof. Figure 2 shows the building plans used for the design of
the archetype buildings for the residential and office occupancy types. The residential building

7
plan was modelled after the NEESWood project [16], with some changes in shear wall length and
location (Figure 2a). The CFS-NEES project building [17] was used as a guide to determine the
office building plan (Figure 2c).
3. Ground Motion Record Set: Selection and Scaling
The FEMA P695 [12] far-field record set (Table 2), consisting of 22 pairs of strong ground
motions (44 lateral ground motions) from the Pacific Earthquake Engineering Research Center
(PEER) strong motion database, was selected because it was assumed to conservatively represent
the types of earthquakes that could be expected in Canada. Scaling the earthquake records for use
with the Canadian seismic hazard comprised two main steps. The first step was to normalize the
ground motion record set based on the peak ground velocity (PGV) as per FEMA P695. This
resulted in normalization factors for a set of ground motion records that are essentially independent
of the design response spectrum. The normalization factor for each record is equal to the Median
(PGVPEER, i) / PGVPEER, i, where, PGVPEER, i is the peak ground velocity of the ith record (geometric
mean of PGV of the two horizontal components of the record), and the Median (PGVPEER, i) is
equal to the Median of the PGVPEER, i values of the set of ground motions.
The second step, after applying the normalization factors for the ground motion pairs, was
to scale the normalized ground motions to the archetype building design response spectra (soil
Class C). The response spectrum for each of the normalized earthquake records was determined
and the median of all the records was obtained. The median spectrum was then linearly scaled to
the uniform hazard spectrum provided for each city in the 2010 NBCC [13], within the range of
fundamental periods of the buildings under consideration. A select matching scale factor (MSF)
was applied for all the normalized ground motions in the record set for each city (Table 3). Since
the best match was observed by scaling at the fundamental period of the two storey building (Ta =

8
0.179 sec) (Figure 3) among the two, four, and five storey buildings, the scaling factor at the
fundamental period of the two storey building was set as the matching scaling factor. The scaling
factors used for the subsequent incremental dynamic analyses were, therefore, 0.280, 0.780, and
1.140 for the archetype buildings in Halifax, Montreal and Vancouver, respectively.
4. Building Design
A thorough description of the resulting archetype building designs is found in the thesis of
Shamim [18]. Due to space limitations, an overview of the building design process is presented
herein. The lateral force resisting system (LFRS) and gravity load carrying system were designed
for the archetype buildings following the general limit states design provisions of the 2010 NBCC
[13]. The live and snow loads were as described in Sections 2.1 and 2.3, while the dead load for a
typical floor was set at 2.87 kPa, and for a typical roof at 1.19 kPa. The floors were constructed of
CFS joists, plywood sheathing, a 38 mm floating gypsum/concrete layer, hardwood flooring, a
gypsum panel ceiling and a 0.25 kPa allowance for mechanical, electrical and plumbing services
(MEPs). The flat roofs were built of CFS joists, plywood sheathing, insulation, 3-ply asphalt
roofing and a gypsum panel ceiling, along with a 0.22 allowance for MEPs.
The design for seismic loading followed the equivalent static approach from the 2010 NBCC,
which is permitted for regular buildings. The seismic weight included the dead load of the floors
and roofs, along with 25% of the snow load on the roof level. The seismic force modification
factors were based on a preliminary study by Balh and Rogers [19], and were set at Rd = 2.0 and
Ro = 1.3. The design spectral acceleration S(T) was computed at the fundamental period of
vibration, T, defined as the lower of 2Ta and that obtained from the building model, Tmodel, where
according to the 2010 NBCC Ta for shear walls is equal to 0.05hn0.75 and hn (m) is the building
height. The NBCC allows for the use of up to 2Ta in the design of shear walls if this can be
9
supported by subsequent dynamic analysis of the building. The design process primarily consisted
of selecting the shear walls in terms of the required length and configuration; where the shear wall
configuration includes specifying the steel sheathing thickness, the framing and the fastener
spacing. Computing the shear force at each storey, the configuration and corresponding total
required length of shear walls was determined (Figure 2). The storey shear force, which was
increased by 10% along each wall line to account for possible torsional effects, was distributed
uniformly between the shear walls based on their total length. That is, the total length of the walls
in the direction of the earthquake load and in the storey under consideration, in order to determine
the earthquake shear demand (force per unit length). The shear wall configuration was then
determined based on the factored shear resistance of a wall as proposed for inclusion in the AISI
S400 Standard [2] (Table 4). A resistance factor of 0.7 was used and walls with stud blocking were
selected to take advantage of their higher load carrying ability [8].
The chord studs, hold-downs and anchor rods were designed, in terms of size and required
numbers, based on the probable shear resistance of the designed shear walls (nominal Sy × 1.4)
and the companion gravity loads, following the AISI S400 capacity based design approach [2].
The chord studs were designed as beam-column members, with the cumulative vertical
compression force sourced from the probable shear resistance of the shear wall in the storey under
consideration as well as those above, plus the gravity load. The tensile force in the hold-downs
was achieved similarly, with the probable shear force on the walls resulting in uplift.
5. 3D Numerical Building Model
The Open System for Earthquake Engineering Simulation (OpenSees) software [10,11],
which had already been used in developing and calibrating the 2D models of the steel sheathed
shear wall dynamic shake table tests [9], was utilized to create the non-linear dynamic 3D models
10
of the archetype buildings (Figure 4). The 3D models allowed for inclusion of the effects of all
studs placed in- or out-side of the shear walls and the diaphragm. The forty four earthquake records
were then imposed on the building models using an incremental dynamic analysis approach.
5.1 Members and Material
The archetype building models were composed of beam-column, truss and spring members as per
the wall models developed and calibrated by Shamim and Rogers [9] (Figure 5). Elastic beam-
column members were used as the CFS frame components including studs and tracks: the stud
members were modeled with elastic beam-column members whose properties were obtained from
the archetype buildings’ designed frame, whereas, the tracks and the floor were considered to be
rigid beam-column members. Given the observed behaviour of the tracks during the testing of
shear walls [3, 7] and the capacity protection of these members in the design process, it was
deemed that they act essentially as rigid members. The chord studs of a shear wall were connected
to the floor and tracks with hinge nodes. The diagonal inelastic Pinching04 [20] truss members
were used to represent the shear wall segments. In addition, linear elastic springs were added to
represent the hold-down anchor rods at the bottom of the shear wall chord studs; as well, linear
springs were used to model the stud-to-track connections in absence of the anchor rod at the base
of the gravity studs. Furthermore, rotational springs were included to model the flexural stiffness
of the bare frames with blocking. As an example, Figure 5 illustrates the components of the model
used for the end wall of a two storey archetype building.
5.1.1 Hysteretic Modelling of the Shear Walls: Pinching04Material
The non-linear inelastic response of the shear wall segments was included in the model by means
of diagonal inelastic Pinching04 [20] truss members. The parameters required to identify the
Pinching04 material primarily included the backbone trend line and degradation factors (Figure

11
6). Two applicable databases of shear wall test results were utilized to obtain the necessary
parameters: 1) dynamically tested one and two storey shear walls by Shamim et al. [7], and 2)
reversed cyclic shear wall test data documented by DaBreo et al. [3], Yu et al. [4] and Yu and
Chen [5]. Information extracted from the reversed cyclic test data were used to define the backbone
trend line, while the other Pinching04 parameters consisting of degradation factors, rDisp, rForce,
and uForce were specified from calibrated numerical models of the dynamic shake table tests [7].
In cases where dynamic test data did not exist for a specific shear wall configuration, the reversed
cyclic test data were entrusted to provide the degradation factors as well as rDisp, rForce, and
uForce, obtained through the numerical modelling in OpenSees.
5.1.1.2 Shear Walls without Blocking: Average Backbone
The archetype buildings were configured to be constructed of shear walls in which the studs
were blocked. As demonstrated by DaBreo et al. [3] the blocked walls provide higher shear
resistance. However, tests had not been completed for all the blocked shear wall configurations
used in the archetype buildings. For this reason it was necessary to rely on tests of shear walls
constructed without stud blocking, and to extrapolate an anticipated blocked wall response to
lateral loading. This section describes the process by which an expression for the backbone shear
strength vs. shear displacement curve was established for walls without blocking.
The unblocked shear wall specimens tested by Ong-Tone and Rogers [21] and Balh and Rogers
[19], which were composed of various configurations and height to width aspect ratios, were used
to define backbone trend lines. Since more than one test existed per wall configuration the average
shear strength vs shear displacement backbone curve was drawn and used in the model development
(Figure 7). Moreover, the average backbone curve of the unblocked walls with a 2:1 height to width

12
aspect ratio was set as the base backbone; and as such was relied on to extract the backbone curves
for the walls with aspect ratios other than 2:1 following Equations 1 to 5.
2
Ccos
1 C
=
+
(1)
2H 1 C= +l (2)
FP
C H=
(3)
Where H is the height of the wall, C is the ratio of wall length to height, L is the length of the
diagonal element, is the angle of the diagonal element (Figure 8), F is the shear wall strength and
P is the shear wall strength per unit length. For a certain wall configuration with an arbitrary aspect
ratio of 1/C, it was assumed that the wall shear strength per unit length, P, is constant and could
be obtained from the average backbone of the 2:1 aspect ratio walls of the same configuration;
therefore:
( ) ( ) 2
2
P C H P C HF 1f P H 1 C
C2cos 2cos 22
1 C
= = = = +
+
(4)
Where f is the axial force in the brace element and A is the brace area (Figure 8). Secondly,
it was assumed that the strain, , is constant for a certain configuration; therefore:
2L H 1 C = = + (5)
2 2
2
1 C 1 CH H
cos CC
1 C
+ + = = =
+
(6)
where is the brace elongation, and is the wall lateral displacement.

13
To validate the backbone extracting equations, the extracted backbone curves of walls with
aspect ratio different than 2:1 were compared to the backbone curve of the existing tests to see
how well the predictions worked. Overall, good agreement was observed between the extracted
backbone and the test backbone curves for the walls constructed without blocking with different
aspect ratios of 4:1, 1:1, and 1.33:1 whose test data were available from previous experimental
works [21,19].
5.1.1.3 Walls with Stud Blocking: Determining the Increase-in-Strength Factor
DaBreo et al. [3] tested stud blocked CFS framed steel sheathed shear walls (2:1 aspect ratio)
and observed an increase in strength due to the support provided to the chord studs. Since walls
with the stud blocking showed greater shear strength than the unblocked walls of the same
configuration, the average backbone curve obtained for the unblocked walls (from tests and the
extracted data (Table 5) ) was used to identify an increase-in-strength factor. The shear strength
vs. shear displacement backbone curve from the reversed cyclic test data provided by DaBreo et
al. [3] was compared with the average unblocked wall backbone curves from Table 5 for each wall
configuration (if available) in order to determine an increase-in-strength factor. This resulted in a
factor of 1.5 for the walls with a 50 mm sheathing screw fastener spacing, and a factor of 1.35 for
the walls with a sheathing fastener spacing of 75 mm, 100 mm and 150 mm. Note, these spacings
are for panel perimeter screw fasteners; all field screws were placed at 300 mm on / centre. These
factors were used with the unblocked wall data from Table 4 and Table 5 to obtain a nominal shear
resistance and a backbone curve, respectively, for the stud blocked wall configurations that had
not been tested. The data obtained in this fashion was used to supplement the existing information
on blocked stud shear walls in the design and modelling of the archetype buildings.
14
5.1.1.4 Evaluation of the Degradation Factors and Other Parameters of Pinching04 Material
In addition to the dynamic shear wall tests [7], all of the reversed cyclic shear wall tests [3-
5] were modeled in OpenSees in order to complete a calibration of the Pinching04 material for use
in the building models. These shear wall test specimen models were the same as the initial
(predictive) models used for preliminary numerical modelling [9] of the walls tested dynamically
on the shake table [7]. The degradation factors and other parameters defining the Pinching04
material achieved from the numerical modelling of the tested walls are listed in Table 6. Average
values are provided since for most wall configurations more than one test was carried out. In the
case where a dynamic shake table test had been completed, the parameters attained from numerical
modelling of this test were preferred over the displacement based reversed cyclic tests in specifying
the degradation as well as rDisp, rForce, and uForce factors for all wall configurations.
5.1.2 Zero-length Springs
Three types of linear springs were utilized in the models of the archetype buildings (Figure
5): linear uplift springs representing the anchor rods where the hold-downs were positioned; linear
springs at the bottom of gravity columns representing the stud-to-track tensile connection; and
rotational springs representing the lateral stiffness provided by the frame blocking. The stiffness
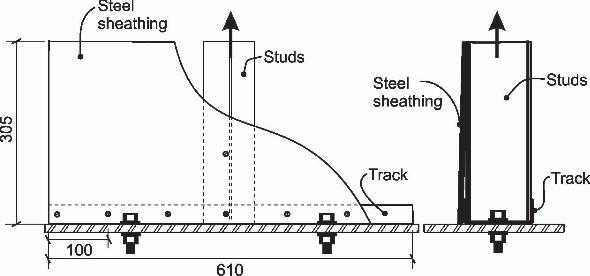
of the linear springs at the bottom of the gravity columns was found from tensile tests of stud-to-
track connections (Figure 9) [18]. A double chord stud composed of two 305 mm tall back-to-back
92.1 mm × 41.3 mm × 12.7 mm screw connected cold-formed steel C-section studs was attached
to a 610 mm long 92.1 mm × 31.8 mm cold-formed steel channel section track. A 0.76 mm thick
(230 MPa grade) steel sheathing (305 mm × 610 mm) was screw connected to the framing with
No. 8 screws spaced at 100 mm. The framing was manufactured to ASTM A653 [22] with nominal
thickness and yield stress of 1.37 mm and 345 MPa, as well as 1.73 mm and 345 MPa, respectively.

15
Two 19.1 mm diameter bolts attached the connection to the test frame; a spacing of 203 mm, 305
mm, and 406 mm was used to investigate the role of the track bending on uplift stiffness. The
average measured stiffness of the tensile tests was equal to 1.2 kN/mm, with a standard deviation
of 0.026.
The rotational spring stiffness was obtained from the numerical modelling of CFS bare frame
(no sheathing) stud blocked walls subjected to monotonic in-plane loading. Four single-storey 2:1
aspect ratio (1.22 m × 2.44 m) frames, constructed with three rows of blocking, were tested in
order to evaluate their lateral stiffness [18]. The CFS frame components, i.e. studs, track, blocking,
shear bolts, hold-downs and anchor rods were the same size and grade as those found in the shear
wall specimens tested under dynamic loading [9]. Different combinations of stud and track
thickness of 1.09, 1.37, and 1.73 mm, as well as different blocking thickness of 1.09 and 1.37 mm,
were incorporated in the frame configuration in order to investigate their effect on stiffness. A
subsequent linear elastic model was made in OpenSees and calibrated for each tested frame. The
model was composed of elastic beam-column members as the chord studs, rigid beam element as
the top track, and four linear rotational springs at the frame corners, which represented the blocked
frame lateral stiffness. The rotational stiffness values attained from the calibrated models of the
four test frames were similar, i.e. 107 kNm, 119 kNm, 95 kNm, and 139 kNm [18]; hence, an
average stiffness of 115 kNm was used as the rotational spring stiffness for all the building models.
The linear uplift spring stiffness, representing the hold-down anchor rods, was found from
the dynamic-test results of steel sheathed shear walls [7] in addition to the information provided
by Simpson Strong-Tie [23] for the design of the S/HD 10S and S/HD 15S hold-downs. The S/HD
10S hold-down type was used in the construction of the dynamically tested shear walls [7], as well
as in the model. A value of 30.4 kN/mm was assigned to the hold-downs in the ground storey of

16
the buildings. For the storeys above the first floor, longer anchor rods (over 300 mm) were used
compared to the ground storey due to the joist between the floors. In this case, the computed
stiffness values from the Simpson Strong-Tie design table could not be relied on because it
provided information for the test anchor rods with the length of 100 mm; therefore, the average
uplift spring stiffness of 14.0 kN/mm, measured at the second storey of double storey steel
sheathed shear wall tests [7], was used as the linear uplift spring stiffness for the storeys above the
first floor in the model. Where more than one hold-down had to be used, the 30.4 kN/mm and 14.0
kN/mm stiffness were multiplied by the number of required hold-downs for the first floor and the
upper floors, respectively.
5.1.3 P-delta Frame
The building lateral displacement obtained from a calculation of the seismic load on the
shear walls is usually accompanied by an additional displacement due to the P effect. To capture
this effect P framing was added to the direction of the archetype building in which the ground
motions were applied (Figure 10). The P frame consisted of rigid beam-column members with
Co-rotational Coordinate Transformation capability and rigid truss members linking the columns
to the building frame. A gravity load determined from the combination of 100% dead plus 50%
live times the live load reductions factor plus 25% snow was applied to the columns at the floor
levels. Note, the live load reduction factor only applied to the four and five storey buildings. The
tributary area for the P effects was the total floor or roof area of the storey under consideration,
excluding the tributary area of the shear walls. Preliminary numerical modeling demonstrated a
significant influence on the building lateral response due to the P-delta effect, especially for higher
earthquake scaling factors and for higher lateral displacements; as such, it was included for all
building models.
17
5.1.4 Seismic Mass, Gravity Load, and Rayleigh Damping
The seismic mass corresponding to 100% of the dead load plus 25% of the snow load was
equally distributed among the four corners of the building plan since a uniform distribution of
these loads was assumed. The gravity load (100% dead plus 50% of live and 25% of snow load)
was computed based on the tributary area of each wall stud and exerted on the gravity load carrying
columns. The linear viscous Rayleigh damping ratio was set equal to 2% for all the modes in the
model.
6. Evaluation of the Building Performance
An incremental dynamic analysis (IDA) approach was applied for all the archetype buildings
in the assessment of their collapse capacity. The records were scaled from 20% (SF = 0.2) to 300%
(SF = 3.0) with increments of 20%, where the scaling factor SF = 1.0 was associated with the
earthquake record at the design level, to determine the level of earthquake that brings failure to the
building. Failure was defined to occur when the storey drift ratio exceeded the 2% inter-storey
drift limit associated with the post peak resistance of the test walls attaining 80% of ultimate [3].
The storey drift was taken as the maximum of the response drift among all the storeys and among
all directions of the building movement. In some cases, the dynamic analysis became unstable due
to occurrence of excessive storey drift; this was also considered as the failure for the building. The
IDA curve for the four storey residential building located in Montreal is shown in Figure 11a. The
median storey drift at each given scale factor is also drawn. The median collapse intensity, SCT,
was defined in terms of scaling factor as the earthquake intensity level in which half of the records
caused the building to collapse. The collapse margin ratio, CMR, is defined as the ratio of the
median collapse to the original earthquake record, SMT. As described in Section 3 the original
earthquake records were first scaled to the design uniform hazard spectrum (UHS) for each city,

18
which in Canada is defined as having a probability of exceedance of 2% in 50 years. This is at the
level of the Maximum Considered Earthquake (MCE) in the United States. These UHS scaled
records were then used in the incremental dynamic analyses, where an IDA scaling factor of 1.0
gives the initially scaled ground motion record. Given this approach to scaling of the original
earthquake records to the UHS the value of SMT, defined in terms of scaling factor, was set equal
to 1.0. Furthermore, since the ground motion records were scaled to the UHS for each city, the
IDA and fragility curve graphs were presented as a function of the scaling factor. This approach
allows for a direct link between the building code seismic hazard and the results of the dynamic
analyses and probability of collapse.
The IDA results for each archetype building were used to draw the corresponding collapse
fragility curve. At each scale factor, the collapse probability was calculated by dividing the number
of earthquake records that caused failure in the building by the total number of records. A
lognormal distribution was fit to the failure probability points to draw the fragility curve (Figure
11b). As per FEMA P695 [12] To account for the effects of the frequency content (spectral shape)
of the applied earthquake record set, the CMR was adjusted using the spectral shape factor, SSF.
For each archetype building, the adjusted collapse margin ratio, ACMRi was calculated by
multiplying the CMRi by SSFi. Spectral shape factor is a function of seismic design category,
fundamental period of vibration, T, and the period-based ductility, μT. The fundamental period of
buildings was attained from the numerical models, and the period-based ductility was obtained
from nonlinear push over analyses.
Furthermore, FEMA P695 requires that the influence of different sources of uncertainty be
accounted for in assigning the collapse capacity. The sources of uncertainty include: uncertainty
due to record-to-record variation and, therefore, variation in response of archetype buildings, RTR,

19
uncertainty due to design requirements, DR, uncertainty related to the test data, TD, and
uncertainty related to modelling of the structure, MDL, [12]. The total system collapse uncertainty,
TOT, was calculated as the square root of the sum of the squared values of these four uncertainties.
FEMA P695 quantifies each of these uncertainties based on the following scale: (A) Superior, =
0.10; (B) Good, = 0.20; (C) Fair, = 0.35; and (D) Poor, = 0.50. The record-to-record collapse
uncertainty from FEMA P695 was used; thus RTR = 0.4 since the archetype buildings had ductility
greater than 3.0. The design requirements-related uncertainty was assumed to be of Good
reliability (DR = 0.2) because the design procedure was based on the already established 2010
NBCC [13] and AISI S213 [1] design standards. These existing design documents were
supplemented with the available extensive static and dynamic shear wall test data [3,7], which
were consistent in terms of performance under cyclic loading and modes of failure. Moreover, the
design of a shear wall’s CFS frame was improved by assuming the chord studs behaved as beam-
column members. Furthermore, the response of steel-sheathed shear walls to lateral loading was
enhanced through the installation of stud blocking [3]. The uncertainty related to test data was
taken as Good (TD = 0.2) because the dynamic tests [7] added a relevant and substantial source
of information for the purpose of the seismic design of steel-sheathed shear walls compared with
the past displacement controlled tests [3]. The effects of combined lateral and gravity load on the
steel-sheathed shear walls had been also evaluated in both the dynamic [7] and displacement
controlled tests [3]. The reliability of the numerical models was selected as Good (MDL = 0.2)
since the models had been developed and calibrated [9] based on the dynamic test data. The total
system collapse uncertainty, TOT, was calculated equal to 0.53 from the four uncertainty values.
The SCT, CMR and SSF for each archetype building are presented in Table 7. The acceptable
values of ACMRi and ACMR average were obtained according to Table 7-3 of the FEMA P695

20
[12] for acceptable values of adjusted collapse margin ratio (ACMR20% and ACMR10%) based on
the total system collapse uncertainty of TOT = 0.53. To validate the method used in design,
including the R values, FEMA P695 requires that for each archetype ACMRi must be greater than
the ACMR20% value, and the average of the ACMR for all the model buildings must be greater
than the ACMR10% value. As can be seen in Table 7, the ACMRi values are always greater than
the ACMR20% except for the archetype ID 6 (four-storey residential building in Montreal) and
archetype ID 12 (two-storey office building in Vancouver). However, the ACMRi values for these
two buildings are close to the acceptable adjusted collapse margin ratio values given by FEMA
P695. The average ACMR value exceeded the required ACMR10% value listed in FEMA P695,
further indicating that the design method used for the archetype buildings is appropriate.
7. Effect of Non-Structural Gypsum Wall Panels
The previous dynamic building models accounted for solely the CFS structure. The inclusion
of gypsum wall panels as part of the LFRS of a structure may improve on the response of the
building to seismic loading, as was observed by Van de Lindt et al. [24] in shake table testing of a
full-scale light-frame wood building. The gypsum panel, typically thought of as a non-structural
component in a building, can contribute to the shear strength and stiffness provided by the
structural shear walls. To demonstrate the added effect of the gypsum, a panel was added to one
side of each structural steel sheathed shear wall in the dynamic model of archetype buildings 6 and
12, whose original collapse capacity was marginally lower than the FEMA P695 acceptable limits.
The gypsum panels that would typically be installed on the remaining gravity walls were not
accounted for. Data from the 1220 × 2440 mm gypsum sheathed (12.7 mm thick Type X Firecode
C Core gypsum panels connected with No. 6 drywall screws placed in a 100 mm edge 150 mm
field pattern) shear wall tests carried out by Morello [25] were used to define the Pinching04

21
material characteristics of the gypsum walls in the models (Table 8). For the panels of aspect ratio
other than 2:1, the Pinching04 properties were extracted following Equations 1 to 5. These two
building models were then subjected to the suit of ground motions (Table 2) using the same IDA
approach as for the all-steel building models.
The resulting IDA and fragility curves for the two archetype buildings are provided in Figure
12. The inclusion, in this case, of only a small number of gypsum sheathed walls increased the
ACMR value on average by 20% for the two archetype buildings compared with the all-steel
building model results (Table 9). Furthermore, the FEMA P695 ACMR20% requirement of 1.56
was easily met. These results are an indication of the potential significant contribution of the
gypsum sheathed walls in a cold-formed steel framed building. This aspect of seismic performance
warrants further in-depth study to account for the variety of gypsum wall configurations.
8. Conclusions
The dynamic response of steel-sheathed CFS framed buildings to ground motions, and as
such the method used in their design, was investigated by means of numerical analyses following
a method adapted from FEMA P695. The intent was to verify the newly introduced Canadian
seismic design method for steel-sheathed shear walls found in the AISI S400 Standard. Archetype
buildings located in three cities in the country were subjected to a suite of 44 scaled ground motion
records. Through use of the developed fragility curves and the related collapse margin ratios it was
shown that the design method, including the seismic force modification factors of Rd = 2.0 and Ro
= 1.3, is appropriate for design. Furthermore, a limited scope demonstration study illustrated the
beneficial effect of the non-structural gypsum wall panels for two of the archetype buildings. On
average, the inclusion of gypsum panels on the existing shear walls increased the ACMR value by

22
20%. Further study is required to better quantify the full extent of the influence of gypsum panels
on the seismic performance of CFS framed structures.
Acknowledgements
The authors would like to acknowledge the support provided by the American Iron and Steel
Institute and the members of their FEMA P695 evaluation peer review group, the Canadian Sheet
Steel Building Institute, the Canada Foundation for Innovation and the Natural Sciences and
Engineering Research Council of Canada. The dynamic numerical analyses were run using the
computing support provided by Calcul Québec and Compute Canada. Materials for the test
specimens were supplied by Bailey Metal Products Ltd., Simpson Strong-Tie Co. Inc., ITW
Buildex and Grabber Construction Products.

23
References
[1] American Iron and Steel Institute (AISI). North American standard for cold-formed steel framing
– lateral design. AISI S213. Washington, USA; 2007.
[2] American Iron and Steel Institute (AISI). North American standard for seismic design of cold-
formed steel structural systems. AISI S400. Washington, USA; 2015.
[3] DaBreo J, Balh N, Ong-Tone C, Rogers CA. Steel sheathed cold-formed steel framed shear walls
subjected to lateral and gravity loading. Thin-Walled Structures 2014; 74: 232-245.
[4] Yu C, Vora H, Dainard T, Tucker J, Veetvkuri P. Steel sheet sheathing options for cold-formed
steel framed shear wall assemblies providing shear resistance. Denton, USA: Department of
Engineering Technology, University of North Texas; 2007 [Report No. UNT-G76234].
[5] Yu C, Chen Y. Steel sheet sheathing options for cold-formed steel framed shear wall assemblies
providing shear resistance - Phase 2. Denton, USA: Department of Engineering Technology,
University of North Texas; 2009 [Report No. UNT-G70752].
[6] Yu C. Shear resistance of cold-formed steel framed shear walls with 0.686 mm, 0.762 mm, and
0.838 mm steel sheet sheathing. Engineering Structures 2010 32(6): 1522-1529.
[7] Shamim I, DaBreo J, Rogers CA. Dynamic testing of single- and double-storey steel sheathed /
cold-formed steel framed shear walls. ASCE Journal of Structural Engineering 2013; 139(5); 807-
817.
[8] Balh N, DaBreo J, Ong-Tone C, El-Saloussy K, Yu C, Rogers CA. Design of steel sheathed cold-
formed steel framed shear walls. Thin-Walled Structures 2014; 75: 76-86.
[9] Shamim I, Rogers CA. Steel sheathed / CFS framed shear walls under dynamic loading: numerical
modelling and calibration. Thin-Walled Structures 2013 71: 57-71.
[10] Mazzoni S, McKenna F, Scott MH, Fenves GL. Open system for earthquake engineering
simulation. User command language manual. Pacific Earthquake Engineering Research Center,
University of California at Berkeley, Berkeley, USA; 2009.
[11] McKenna FT. Object-oriented finite element programming: Frameworks for analysis,
algorithms and parallel computing. Berkeley, USA: Department of Civil Engineering, University
of California at Berkeley; 1997 [PhD thesis].
[12] Federal Emergency Management Agency (FEMA). Quantification of building seismic
performance factors. FEMA P695. Washington, USA; 2009
[13] National Research Council of Canada (NRCC). National building code of Canada. 13th Edition,
Ottawa, Canada; 2010.

24
[14] Canadian Standards Association (CSA). North American specification for the design of cold-
formed steel structural members. CSA S136. Mississauga, Canada; 2010.
[15] American Society of Civil Engineers (ASCE). Minimum design loads for buildings and other
structures. ASCE/SEI 7-10, Reston, USA; 2013.
[16] Cobeen K, Van de Lindt JW, Cronin K. (2007). Design of a six-story wood frame building based
on the 2006 IBC methodology. NEESwood Report NW-03. 2007
[17] Nakata N, Schafer BW, Madsen RL. Seismic design of multi-storey cold-formed steel buildings:
the CFS-NEES archetype building. Structures Congress, Chicago, USA; 2012.
[18] Shamim I. Seismic design of lateral resisting cold-formed steel framed (CFS) structures. Montreal,
Canada: Department of Civil Engineering and Applied Mechanics, McGill University; 2012 [PhD
thesis].
[19] Balh N, Rogers CA. Development of seismic design provisions for steel sheathed shear walls.
Montreal, Canada: Department of Civil Engineering and Applied Mechanics, McGill University;
2010 [research report].
[20] Lowes LN, Mitra N, Altoontash A. A beam-column joint model for simulating the earthquake
response of reinforced concrete frames. Berkeley, USA: Pacific Earthquake Engineering Research
Center, University of California at Berkeley; 2004 [Report 2003/10].
[21] Ong-Tone C, Rogers CA. Tests and evaluation of cold-formed steel frame / steel sheathed shear
walls. Montreal, Canada: Department of Civil Engineering and Applied Mechanics, McGill
University; 2009 [research report].
[22] American Society for Testing and Materials (ASTM). Standard specification for steel sheet, zinc-
coated (galvanized) or zinc-iron alloy-coated (galvannealed) by hot-dip process. ASTM A653,
West Conshohocken, USA. 2008.
[23] Simpson Strong-Tie Company Inc. Cold-formed steel connectors. Catalogue C-CFS10,
Pleasanton, USA; 2010.
[24] Van de Lindt JW, Pei S, Liu H, Filiatrault A. Three-dimensional seismic response of a full-scale
light-frame wood building: numerical study. ASCE Journal of Structural Engineering 2010;
136(1); 56-65.
[25] Morello D. Seismic performance of multi-storey structures with cold-formed steel wood
sheathed shear walls. Montreal, Canada: Department of Civil Engineering and Applied Mechanics,
McGill University; 2010 [MEng Thesis].

25
Figure Headings
Figure 1: Spectral accelerations for the seismic design categories in the United States and the
selected cities in Canada
Figure 2: Floor plan for Residential archetype building: a) two storey (all cities) and four and
five storey (Halifax and Montreal); b) four and five storey (Vancouver) and Office archetype
building: c) two storey (Halifax and Montreal); d) two storey (Vancouver)
Figure 3: Matching the median and design response spectrum at fundamental period of the two
storey buildings for a) Halifax, b) Montreal, and c) Vancouver
Figure 4: Schematic drawing of 3D dynamic models for: a) two storey office building, and b)
two storey residential building
Figure 5: Schematic 2D representation of the east elevation (view from inside) of two storey
office building model used for Halifax and Montreal (see Figure 2 (c)), without P- framing
Figure 6: Definition of Pinching04 material parameters [20]
Figure 7: Backbone trend lines and the average backbone for the 2:1 aspect ratio shear walls with
0.46 mm thick sheathing and 150/300 mm fastener spacing
Figure 8: Parameters defining a shear wall dimension with an arbitrary aspect ratio of 1/C
Figure 9: Stud-to-track connection; a) photographs of test set up, and b) test configuration
Figure 10: P fictitious framing functioning in East-West direction in a two storey model
building
Figure 11: Four storey residential building, Montreal; a) IDA and b) Fragility curves for FEMA
P695 earthquake records
Figure 12: Four storey residential building (with gypsum), Montreal; a) IDA and b) Fragility
curves for FEMA P695 earthquake records: Two storey office building (with gypsum),
Vancouver; c) IDA and d) Fragility curves for FEMA P695 earthquake records

26
Table 1 : Archetype buildings
Archetype ID Location Occupancy type Number of storeys
(building height) Ta
1
(sec.)
1 Halifax Residential 2 (5.48 m) 0.179
2 Halifax Residential 4 (10.96 m) 0.301
3 Halifax Residential 5 (13.70 m) 0.356
4 Halifax Office 2 (5.48 m) 0.179
5 Montreal Residential 2 (5.48 m) 0.179
6 Montreal Residential 4 (10.96 m) 0.301
7 Montreal Residential 5 (13.70 m) 0.356
8 Montreal Office 2 (5.48 m) 0.179
9 Vancouver Residential 2 (5.48 m) 0.179
10 Vancouver Residential 4 (10.96 m) 0.301
11 Vancouver Residential 5 (13.70 m) 0.356
12 Vancouver Office 2 (5.48 m) 0.179 1 Period of vibration calculated using NBCC [13] equation for shear walls Ta = 0.05 hn
0.75. (hn = building height)
Table 2 : Far field ground motion records from FEMA P695 [12]
ID Event - Year Magnitude
Epicentral
distance
(km)
Component 1 Component 2 Normalization
factor
1 Northridge 1994 6.7 13.3 NORTHR/MUL009 NORTHR/MUL279 0.65
2 Northridge 1994 6.7 26.5 NORTHR/LOS000 NORTHR/LOS270 0.83
3 Duzce Turkey 1999 7.1 41.3 DUZCE/BOL000 DUZCE/BOL090 0.63
4 Hector Mine 1999 7.1 26.5 HECTOR/HEC000 HECTOR/HEC090 1.09
5 Imperial Valley 1979 6.5 33.7 IMPVALL/H-DLT262 IMPVALL/H-DLT352 1.31
6 Imperial Valley 1979 6.5 29.4 IMPVALL/H-E11140 IMPVALL/H-E11230 1.01
7 Kobe Japan 1995 6.9 8.7 KOBE/NIS000 KOBE/NIS090 1.03
8 Kobe Japan 1995 6.9 46.0 KOBE/SHI000 KOBE/SHI090 1.10
9 Kocaeli Turkey 1999 7.5 98.2 KOCAELI/DZC180 KOCAELI/DZC270 0.69
10 Kocaeli Turkey 1999 7.5 53.7 KOCAELI/ARC000 KOCAELI/ARC090 1.36
11 Landers 1992 7.3 86.0 LANDERS/YER270 LANDERS/YER360 0.99
12 Landers 1992 7.3 82.1 LANDERS/CLW-LN LANDERS/CLW-TR 1.15
13 Loma Prieta 1989 6.9 9.8 LOMAP/CAP000 LOMAP/CAP090 1.09
14 Loma Prieta 1989 6.9 31.4 LOMAP/G03000 LOMAP/G03090 0.88
15 Manjil Iran 1990 7.4 40.4 MANJIL/ABBAR--L MANJIL/ABBA--T 0.79
16 Superstition Hills 1987 6.5 35.8 SUPERST/B-ICC000 SUPERST/B-ICC090 0.87
17 Superstition Hills 1987 6.5 11.2 SUPERST/B-POE270 SUPERST/B-POE360 1.17
18 Cape Mendocino 1992 7.0 22.7 CAPEMEND/RIO270 CAPEMEND/RIO360 0.82
19 Chi-Chi Taiwan 1999 7.6 32.0 CHICHI/HY101E CHICHI/CHY101-N 0.41
20 Chi-Chi Taiwan 1999 7.6 77.5 CHICHI/TCU045-E CHICHI/TCU045-N 0.96
21 San Fernando 1971 6.6 39.5 SFERN/PEL090 SFERN/PEL180 2.10
22 Friuli Italy 1976 6.5 20.2 FRIULI/A-TMZ000 FRIULI/A-TMZ270 1.44

27
Table 3 : Scaling factors to match far-field record set to 2010 NBCC [13] UHS over fundamental
period of vibration of the archetype buildings
Location Sa(0.2sec)
(g)
2 storey
buildings
4 storey
buildings
5 storey
buildings All buildings
Halifax 0.23 0.279 0.234 0.218 0.280
Montreal 0.64 0.775 0.609 0.542 0.780
Vancouver 0.94 1.139 0.966 0.907 1.140
Table 4: Proposed nominal shear resistance, Sy, for CFS framed / steel sheathed shear walls
(kN/m) [8] for inclusion in AISI S400 [2]
Sheathing
thickness1
(mm)
Max. Aspect
ratio (height
/width)
Fastener spacing at panel edges
(mm)
Stud
blocking
required
Designation
thickness of
stud and
track (mm)
Sheathing
screw size
150 100 75 50
0.46 mm 2:1 4.1 - - - No 0.84 8
0.46 mm 2:1 4.5 6.0 6.8 7.5 No 1.09 8
0.68 mm 2:1 6.5 7.2 7.9 8.7 No 0.84 8
0.76 mm 4:1 8.9 10.6 11.6 12.5 No 1.09 8
0.84 mm 4:1 10.7 12.0 13.0 14.0 No 1.09 8
0.46 mm 2:1 7.4 9.7 11.6 13.5 Yes 1.09 8
0.76 mm 2:1 11.7 14.3 - - Yes 1.09 8
0.76 mm 2:1 - - 19.9 23.3 Yes 1.37 8 1Walls are one side sheathed

28
Table 5: Average backbone used to define shear wall strength vs. displacement response for
different wall configurations (2:1 aspect ratio walls without stud blocking)
Shear wall:
sheathing thickness
(mm), fastener
spacing (mm)
Shear displacement (mm), Shear strength (kN/m), P
1 2 3 4 1 2 3 4
0.46, 50/300 7.0 23.0 76.0 99.0 8.1 11.0 9.5 3.27
0.46, 150/300 3.5 20.0 46.0 85.0 4.0 6.5 6.0 2.73
0.68, 50/300 11.5 35.0 55.0 72.0 10.5 12.2 9.0 4.1
0.68, 100/300 6.3 18.5 42.0 71.0 6.1 10.4 9.5 4.1
0.68, 150/300 4.6 18.5 40.0 68.0 5.7 9.4 8.8 4.1
0.76, 50/300 9.5 25.0 86.0 104.0 13.5 16.9 10.6 3.5
0.76, 100/300 7.0 28.0 53.0 82.0 11.0 14.5 12.4 4.1
0.76, 150/300 5.2 19.0 41.0 84.0 7.1 11.3 12.4 3.68
0.84, 50/300 6.0 18.5 45.0 77.0 14.5 21.0 19.0 5.3
0.84, 100/300 5.1 18.8 38.0 76.0 9.3 17.1 16.4 6.56
0.84, 150/300 6.2 20.0 36.0 66.5 9.2 15.0 15.4 4.1
Table 6: Pinching04 parameters used in shear wall brace members of archetype buildings models
Configuration Unloading stiffness
degradation factors
Reloading stiffness
degradation factors
Sheathing
thickness
(mm)
Fastener
spacing
(mm) gK1,2 gK3,4 gKLim gD1,2 gD3,4 gDLim gFLim gE rDisp rForce uForce
0.46 50 0.5 1.5 0.8 0.1 1.5 0.25 0.0 4.8 0.4 0.24 -0.1
0.46 100 0.5 1.5 0.8 0.2 1.5 0.25 0.0 4.8 0.4 0.24 -0.1
0.46 150 0.5 1.5 0.8 0.25 1.5 0.25 0.0 4.8 0.4 0.24 -0.1
0.68 50 0.5 1.5 0.8 0.125 1.5 0.25 0.0 3.6 0.4/0.35 0.2 -0.1
0.68 100 0.5 1.5 0.8 0.15 1.5 0.25 0.0 3.6 0.4 0.2 -0.1
0.68 150 0.5 1.5 0.8 0.3 1.5 0.25 0.0 3.4 0.4/0.35 0.24 -0.1
0.76 50 0.5 1.5 0.8 0.15 1.5 0.25 0.0 5.23 0.4 0.2 -0.1
0.76 100 0.5 1.5 0.8 0.15 1.5 0.25 0.0 5.33 0.3 0.2 -0.1
0.76 150 0.5 1.5 0.8 0.35 1.5 0.25 0.0 5.61 0.45 0.2 -0.1
0.84 50 0.35 1.5 0.8 0.15 1.5 0.25 0.0 5.23 0.3 0.2 -0.1
0.84 100 0.35 1.5 0.8 0.15 1.5 0.25 0.0 5.33 0.35 0.2 -0.1
0.84 150 0.35 1.5 0.8 0.25 1.5 0.25 0.0 5.61 0.4 0.24 -0.1

29
Table 7: Evaluation of the archetype buildings according to FEMA P695 [12] for Halifax,
Montreal, and Vancouver
City Archetype
ID1 T (sec) SCT CMRi
2 SSFi ACMRi ACMR20% ACMR
average4 ACMR10%
Hal
ifax
1 0.27 3.483 3.48 1.14 3.97 ≥ 1.56
2.36 ≥ 1.97
2 0.52 4.103 4.10 1.14 4.67 ≥ 1.56
3 0.65 3.073 3.07 1.14 3.50 ≥ 1.56
4 0.50 2.51 2.51 1.10 2.77 ≥ 1.56
Mo
ntr
eal 5 0.30 1.45 1.45 1.12 1.62 ≥ 1.56
6 0.51 1.35 1.35 1.12 1.51 < 1.56
7 0.61 1.63 1.63 1.12 1.83 ≥ 1.56
8 0.35 1.50 1.50 1.12 1.68 ≥ 1.56
Van
cou
ver
9 0.25 1.49 1.49 1.12 1.67 ≥ 1.56
10 0.36 1.70 1.70 1.12 1.90 ≥ 1.56
11 0.42 1.54 1.54 1.12 1.73 ≥ 1.56
12 0.26 1.34 1.34 1.12 1.50 < 1.56 1See Table 1 2SMT = 1.0 (records initially scaled to building code uniform hazard spectrum 3Estimated median collapse intensity in case the SCT was greater than 3.0 4ACMR average is equal to 1.80 excluding the estimated SCTs in averaging
Table 8: Pinching04 material parameters for the 2:1 aspect ratio gypsum panel (diagonal brace)
d1 - d4 (mm/mm) f1 - f4 (N)
1 2 3 4 1 2 3 4
1.23e-3 4.1e-3 9.84e-3 12.3e-3 7826.2 11180.3 8944.3 3354.1
gK1,2 gK3,4 gKlim gD1,2 gD3,4 gDlim gFlim
0.2 1.5 0.5 0.2 1.5 0.5 0.0
rForce uForce rDisp
0.18 -0.1 0.4
Table 9: Comparison between CMR and ACMR of the archetype buildings with and without the
gypsum panel for Montreal, four-storey residential and Vancouver, two-storey office building
Archetype
ID
CMRi ACMRi Percentage of
increase in
collapse
margin ratio
No gypsum Gypsum
included No gypsum
Gypsum
included
6 1.35 1.67 1.51 1.87 25%
12 1.34 1.54 1.50 1.73 15%