Embed Size (px)
Citation preview
Performance of Ceiling Diaphragms in Steel-Framed
Domestic Structures Subjected to Wind Loading
Ismail Saifullah
A thesis submitted in total fulfilment of the requirements of the degree of
Doctor of Philosophy
March 2016
Faculty of Science, Engineering and Technology
Swinburne University of Technology
Hawthorn, Victoria 3122

To My Parents
who trained me diligence in difficult situations
&
My Wife
who stood by me all the way throughout this journey
i
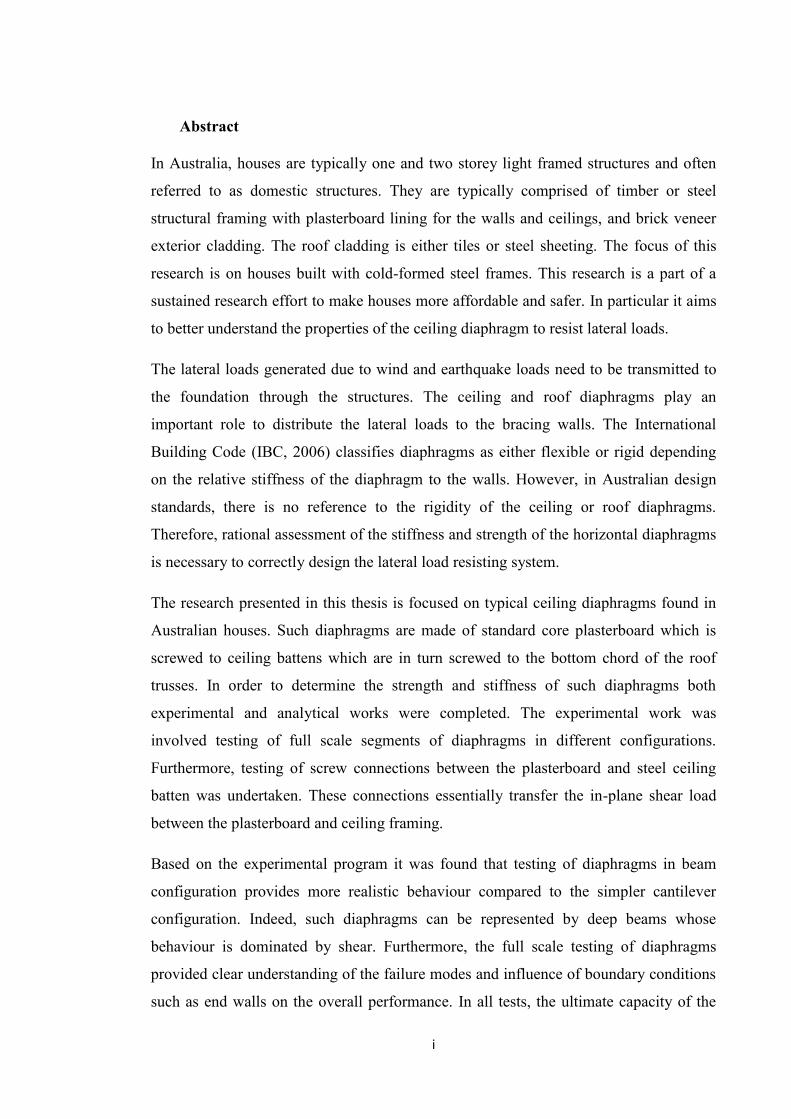
Abstract
In Australia, houses are typically one and two storey light framed structures and often
referred to as domestic structures. They are typically comprised of timber or steel
structural framing with plasterboard lining for the walls and ceilings, and brick veneer
exterior cladding. The roof cladding is either tiles or steel sheeting. The focus of this
research is on houses built with cold-formed steel frames. This research is a part of a
sustained research effort to make houses more affordable and safer. In particular it aims
to better understand the properties of the ceiling diaphragm to resist lateral loads.
The lateral loads generated due to wind and earthquake loads need to be transmitted to
the foundation through the structures. The ceiling and roof diaphragms play an
important role to distribute the lateral loads to the bracing walls. The International
Building Code (IBC, 2006) classifies diaphragms as either flexible or rigid depending
on the relative stiffness of the diaphragm to the walls. However, in Australian design
standards, there is no reference to the rigidity of the ceiling or roof diaphragms.
Therefore, rational assessment of the stiffness and strength of the horizontal diaphragms
is necessary to correctly design the lateral load resisting system.
The research presented in this thesis is focused on typical ceiling diaphragms found in
Australian houses. Such diaphragms are made of standard core plasterboard which is
screwed to ceiling battens which are in turn screwed to the bottom chord of the roof
trusses. In order to determine the strength and stiffness of such diaphragms both
experimental and analytical works were completed. The experimental work was
involved testing of full scale segments of diaphragms in different configurations.
Furthermore, testing of screw connections between the plasterboard and steel ceiling
batten was undertaken. These connections essentially transfer the in-plane shear load
between the plasterboard and ceiling framing.
Based on the experimental program it was found that testing of diaphragms in beam
configuration provides more realistic behaviour compared to the simpler cantilever
configuration. Indeed, such diaphragms can be represented by deep beams whose
behaviour is dominated by shear. Furthermore, the full scale testing of diaphragms
provided clear understanding of the failure modes and influence of boundary conditions
such as end walls on the overall performance. In all tests, the ultimate capacity of the
ii
diaphragms was limited by the failure of the connections between the plasterboard and
the ceiling battens. All the tests were undertaken under monotonic loading using
specially developed test rigs.
Detailed finite element (FE) modelling was undertaken to represent the behaviour and
ultimate capacity of ceiling diaphragms. The developed FE models included the
plasterboard, battens, truss bottom chords and associated connections. All the material
properties used were based on published data. The connections between the battens and
the bottom chords were considered to be pinned, while the connections between the
plasterboard and the battens were represented by non-linear springs whose properties
were obtained from the completed tests.
Remarkable agreement was achieved between the FE models and experimental results
for all ceiling specimens tested. The load-deflection curves, deformed shapes and failure
modes matched very well. Hence, the developed FE modelling technique was deemed
appropriate based on these validations.
The validated FE models were used to undertake a parametric study to cover a range of
typical diaphragm configurations and properties. These parameters included: diaphragm
aspect ratio; batten spacing; bottom chord spacing; different plasterboard to framing
connection patterns and strength; and different boundary conditions around the
plasterboard edges.
Based on the parametric studies it was found that the lateral performance of the
diaphragm can be increased with the addition of a limited number of extra screws. The
strength and stiffness of the diaphragm also increased considerably with the reduction
of the batten spacing. Moreover, longer ceilings (those with high aspect ratios) exhibit
greater flexural deformation and hence, failure occurred at a larger deflection compared
to shorter ceilings which have their deflection dominated by shear action. There was no
significant variation of strength due to changes of length.
A simplified mathematical model was developed for determining the deflection; and
hence, the stiffness of typical steel framed ceiling diaphragms used in Australia. This
model was verified against the experimental results as well as the FE model results.
Based on strength and serviceability limit states, a typical example for the development
of a design chart for maximum spacing between bracing walls is presented.
iii
Declaration
This is to certify that this thesis includes:
Contains no material which has been accepted for the award to the candidate of
any other degree or diploma, except where due reference is made in the text of
the examinable outcome;
To the best of the my knowledge, it contains no material previously published or
written by another person except where due reference is made in the text of the
examinable outcome; and
Where the work is based on joint research or publications, discloses the relative
contributions of the respective workers or authors.
Sincerely Yours
Ismail Saifullah
March 2016
iv
Preface
The following publications have been produced:
Saifullah, I., Gad, E., Shahi, R., Wilson, J., Lam N.T.K. and Watson K. (2014),
‘Ceiling diaphragm actions in cold formed steel-framed domestic structures’,
ASEC 2014-Structural Engineering in Australasia-World Standard, July 9-11,
Auckland, New Zealand.
Saifullah I., Gad E., Wilson J., Lam N.T.K. and Watson K. (2012), ‘Review of
diaphragm actions in domestic structures’, Australasian Conference on the
Mechanics of Structures and Materials, December 11-14, Sydney, Australia
Publications from second components of the entire research project:
Shahi, R., Lam, N., Saifullah, I., Gad, E., Wilson, J. and Watson, K. (2014),
‘Application of a new racking cyclic loading protocol on cold-formed steel-
framed wall panels’, Proceedings of the Structural Engineering in Australasia
ASEC 2014 Conference, Auckland, New Zealand, Paper No. 21.
Shahi, R., Lam, N., Saifullah, I., Gad, E., Wilson, J. and Watson, K. (2014), “In-
plane behaviour of cold-formed steel-framed wall panels sheathed with fibre
cement board”, Proceedings of the 22nd International Specialty Conference on
Cold-Formed Steel Structures, St. Louis, Missouri, USA, pp. 809-823. (This
paper had received a Wei-Wen Yu Student Scholar Award provided by the Wei-
Wen Yu Center for Cold-Formed Steel Structures)
Shahi, R., Lam, N., Gad, E., Saifullah, I., Wilson, J. and Watson, K. (2014),
“Incremental dynamic analysis for seismic assessment of cold-formed steel-
framed shear wall panel”, Proceedings of the Australian Earthquake
Engineering Society 2014 Conference, Victoria, Australia, Paper No. 31.
Shahi, R., Lam, N., Saifullah, I., Gad, E. and Wilson, J. (2013), “Realistic
modelling of cold-formed steel in domestic constructions for performance based
design”, Proceedings of the Australian Earthquake Engineering Society 2013
Conference, Tasmania, Australia, Paper No. 06.

v
Acknowledgements
It is a great pleasure to acknowledge my principal supervisors, Professor Emad Gad,
Chair, Department of Civil and Construction Engineering, Swinburne University of
Technology, Australia. Without his continuous advice, valuable guidance, consistent
encouragement, extra financial support and friendly discussions throughout my
research, my research would never have concluded. The continuous support and help
from my supervisor both technically and theoretically, particularly, experimental tests
and finite element modelling provide me the motivation to be continuously engaged in
my research despite of having several difficulties throughout the study.
I would like to express my profound gratitude to my co-supervisor Professor John
Wilson of Swinburne University of Technology, and Associate Professor Nelson Lam,
of the University of Melbourne for their valuable suggestions and encouragement. The
work described in this research is supported by the Australian Research Council (ARC)
Linkage Grant LP110100430. I would also like to thank the members of the project
team, Mr. Ken Watson and Les McGrath of the National Association of Steel-framed
Housing (NASH) for their input into this research. I am indebted to John Shayler,
Business Development Manager at Steel Frame Solutions who supplied test materials
used for the experimental work. The financial and technical support provided by NASH
members is also gratefully acknowledged. The contributions of NASH members who
supplied the materials are acknowledged.
I owe special thanks to the Smart Structures Laboratory Staff, Mr. Kia Rasekhi, Mr.
Graeme Burnett, Mr. Sanjeet Chandra, and Mr. Michael Culton who always assisted in
various ways while working in the laboratory. I would like to express a special thanks to
Mr. Rojit Shahi, my PhD colleague, who is also studying the lateral performance of
cold-formed steel-framed domestic structures at the University of Melbourne, for his
willingness to assist in every possible way.
My sincere love and deepest gratitude are to my beloved parents, brothers and sisters for
their unconditional love and continuous encouragement throughout the study. I would
like to express my gratitude to my wife for her support and patience throughout the
course of my study.
Finally, my greatest thank to the Almighty who has been always looking after me.
vi
Table of Contents
Abstract .............................................................................................................................. i
Declaration ....................................................................................................................... iii
Preface .............................................................................................................................. iv
Acknowledgements ........................................................................................................... v
List of Figures ................................................................................................................ xiv
List of Tables................................................................................................................. xxv
CHAPTER 1 ..................................................................................................................... 1
INTRODUCTION ............................................................................................................ 1
1.1 Background of the Research ............................................................................... 1
1.2 Research Aim and Objectives ............................................................................ 5
1.3 Outline of Thesis ................................................................................................ 6
CHAPTER 2 ..................................................................................................................... 8
LITERATURE REVIEW.................................................................................................. 8
2.1 Introduction ............................................................................................................. 8
2.2 Background on Cold-formed Steel .......................................................................... 8
2.3 Current Design Practices in Australia ................................................................... 10
2.4 Components of Steel-framed Domestic Structures ............................................... 11
2.4.1 Floor ................................................................................................................ 12
2.4.2 Walls ............................................................................................................... 12
2.4.3 Roof ................................................................................................................ 13
2.5 Behaviour of Light-framed Structures................................................................... 14
2.6 Diaphragm Analysis .............................................................................................. 22
vii
2.6.1 Diaphragm Stiffness ....................................................................................... 23
2.6.2 Diaphragm Classifications .............................................................................. 24
2.6.3 Continuous Diaphragms ................................................................................. 28
2.7 Bracing System of Diaphragm .............................................................................. 30
2.7.1 Roof Bracing ................................................................................................... 30
2.7.2 Wall Bracing ................................................................................................... 31
2.7.3 Floor and Subfloor Bracing ............................................................................ 31
2.7.4 Combination of Bracing Systems ................................................................... 32
2.7.5 Typical Location and Distribution of Bracing Walls ...................................... 33
2.8 Lateral Force Distribution Methods for Light-framed Structures ......................... 35
2.8.1 Tributary Area Method ................................................................................... 36
2.8.2 Simple and/or Continuous Beam Methods ..................................................... 37
2.8.3 Total Shear Method ........................................................................................ 38
2.8.4 Relative Stiffness Method without Torsion .................................................... 39
2.8.5 Rigid Beam on Elastic Foundation/ Relative Stiffness with Torsion ............. 39
2.8.6 Plate Method ................................................................................................... 41
2.8.7 Finite Element Method ................................................................................... 41
2.9 Performance of Light-framed Structures under Lateral Loads ............................. 41
2.10 Experimental Studies of Light-framed Structures ............................................... 43
2.10.1 Full-scale Structures ..................................................................................... 44
2.10.2 Roof and Ceiling Diaphragm ........................................................................ 47
2.11 Analytical Modelling ........................................................................................... 49
2.11.1 Full-scale Structures Modelling .................................................................... 50
viii
2.11.2 Ceiling and Roof diaphragm ......................................................................... 51
2.12 Summary and Research Needs ............................................................................ 52
CHAPTER 3 ................................................................................................................... 54
EXPERIMENTAL PROGRAM (PHASE I): SHEAR CONNECTION TESTS ............ 54
3.1 Introduction ........................................................................................................... 54
3.2 Overview of Experimental Program ...................................................................... 55
3.3 Test Methodology .................................................................................................. 56
3.3.1 Test Materials ................................................................................................. 61
3.3.2 Specimen Configurations and Fabrication ...................................................... 62
3.3.3 Test Equipment ............................................................................................... 65
3.3.4 Instrumentation ............................................................................................... 65
3.3.5 Loading ........................................................................................................... 68
3.4 Results and Discussion .......................................................................................... 68
3.4.1 Failure Mechanisms ........................................................................................ 73
3.4.2 Effect of Edge Distance .................................................................................. 76
3.4.3 Effect of Section Thickness ............................................................................ 79
3.4.4 Idealization of Load-Slip Behaviour for Sheathing-to-framing Connection .. 79
3.5 Summary and Conclusions .................................................................................... 81
CHAPTER 4 ................................................................................................................... 82
EXPERIMENTAL PROGRAM (PHASE II): FULL-SCALE TESTING OF CEILING
DIAPHRAGM IN CANTILEVER CONFIGURATION ............................................... 82
4.1 Introduction ........................................................................................................... 82
4.2 Experimental Arrangement ................................................................................... 82
ix
4.3 Testing Program .................................................................................................... 84
4.3.1 Test Set up ...................................................................................................... 84
4.3.2 Test Specimen ................................................................................................. 86
4.3.3 Instrumentation and Data Acquisition System ............................................... 91
4.3.4 Loading ........................................................................................................... 92
4.4 Results and Discussions ........................................................................................ 92
4.4.1 Loading Frame Friction .................................................................................. 92
4.4.2 Discussion of Test Results .............................................................................. 93
4.4.3 Estimation of Design Strength ...................................................................... 103
4.5 Summary and Conclusions .................................................................................. 104
CHAPTER 5 ................................................................................................................. 106
EXPERIMENTAL PROGRAM (PHASE III): FULL-SCALE TESTING OF CEILING
DIAPHRAGM IN BEAM CONFIGURATION ........................................................... 106
5.1 Introduction ......................................................................................................... 106
5.2 Scope of Testing .................................................................................................. 106
5.3 Testing Arrangement ........................................................................................... 107
5.4 Instrumentation and Loading ............................................................................... 115
5.5 Description of Tests ............................................................................................. 116
5.5.1 Beam Test Specimen #1 (5.4 m x 2.4 m diaphragm with 600 mm batten
spacing) .................................................................................................................. 116
5.5.2 Beam Test Specimen #2 (5.4 m x 2.4 m diaphragm with 600 mm batten
spacing and effects of plasterboard bearing) ......................................................... 119
5.5.3 Beam Test Specimen #3 (5.4 m x 2.4 m diaphragm with 400 mm batten
spacing and effects of plasterboard bearing) ......................................................... 122
x
5.5.4 Beam Test Specimen #4 (8.1 m x 2.4 m diaphragm with 400 mm batten
spacing) .................................................................................................................. 124
5.5.5 Beam Test Specimen #5 (8.1 m x 2.4 m diaphragm with 400 mm batten
spacing and effects of plasterboard bearing) ......................................................... 127
5.6 Results and Discussion ........................................................................................ 129
5.6.1 Frame Test .................................................................................................... 129
5.6.2 Beam Test Specimen #1 (5.4 m x 2.4 m diaphragm with 600 mm batten
spacing) .................................................................................................................. 130
5.6.3 Beam Test Specimen #2 (5.4 m x 2.4 m diaphragm with 600 mm batten
spacing and effects of plasterboard bearing) ......................................................... 133
5.6.4 Beam Test Specimen #3 (5.4 m x 2.4 m diaphragm with 400 mm batten
spacing and effects of plasterboard bearing) ......................................................... 136
5.6.5 Beam Test Specimen #4 (8.1 m x 2.4 m diaphragm with 400 mm batten
spacing) .................................................................................................................. 139
5.6.6 Beam Test Specimen #5 (8.1 m x 2.4 m diaphragm with 400 mm batten
spacing and effects of plasterboard bearing) ......................................................... 141
5.7 Load-deflection Behaviour of Tested Diaphragm ............................................... 147
5.7.1 Diaphragm Behaviour in Region I (linear portion of the curve) .................. 147
5.7.2 Diaphragm Behaviour in Region II (transition portion of the curve) ........... 148
5.7.3 Diaphragm Behaviour in Region III (inelastic portion of the curve) ........... 149
5.8 Summary and Conclusions .................................................................................. 149
CHAPTER 6 ................................................................................................................. 152
ANALYTICAL MODELLING .................................................................................... 152
6.1 Introduction ......................................................................................................... 152
6.2 Finite Element Modelling Software .................................................................... 152

xi
6.3 Finite Element Modelling Strategy ..................................................................... 153
6.3.1 Representation of Structural Components .................................................... 153
6.3.2 Material and Sectional Properties ................................................................. 154
6.3.3 Plasterboard Screw Connections .................................................................. 155
6.3.4 Boundary Conditions .................................................................................... 156
6.4 Model Validation against Test Results ................................................................ 158
6.4.1 Validation of Model against Cantilever Test Results ................................... 158
6.4.2 Validation of FE Model against Beam Test Results ..................................... 160
6.4.2.1 Validation of Beam Test Specimen #1................................................... 161
6.4.2.2 Validation of Beam Test Specimen #2................................................... 163
6.4.2.3 Validation of Beam Test Specimen #3................................................... 165
6.4.2.4 Validation of Beam Test Specimen #4................................................... 167
6.4.2.5 Validation of Beam Test Specimen #5................................................... 169
6.5 Finite Element Modelling under Different Loading Configurations ................... 173
6.6 Parametric Studies ............................................................................................... 174
6.6.1 Investigation 1: Ceiling Diaphragms with Boundary Conditions ................. 174
6.6.1.1 Aspect ratio ............................................................................................ 174
6.6.1.2 Spacing of Plasterboard Screws ............................................................. 180
6.6.1.3 Gap Size ................................................................................................. 187
6.6.1.4 Batten Spacing ....................................................................................... 189
6.6.2 Investigation 2: Sensitivity of Isolated Ceiling Diaphragms ........................ 191
6.6.2.1 Aspect ratio ............................................................................................ 191
6.6.2.2 Spacing of Plasterboard Screws ............................................................. 195
6.6.2.3 Batten Spacing ....................................................................................... 201
6.6.2.4 Bottom Chord Spacing ........................................................................... 203
xii
6.6.3 Investigation 3: Sensitivity of Isolated Ceiling Diaphragms with Different
Structural Arrangements ........................................................................................ 204
6.6.3.1 Loading Directions ................................................................................. 205
6.6.3.2 Type of Testing Assembly ..................................................................... 206
6.6.3.3 Plasterboard Fixing to Different Structural Members ............................ 207
6.6.3.4 Properties of Plasterboard Screws .......................................................... 209
6.7 Summary and Conclusions .................................................................................. 211
CHAPTER 7 ................................................................................................................. 215
LATERAL LOAD DISTRIBUTION AND INDUSTRIAL APPLICATIONS ........... 215
7.1 Introduction ......................................................................................................... 215
7.2 Simplified Mathematical Model to Predict Diaphragm Deflections ................... 215
7.2.1 Estimation of Deflection Equation Parameters under One-third Loading .... 219
7.2.2 Simplified Mathematical Model Validation against Test Results ................ 225
7.2.3 Simplified Mathematical Model Modification to Replicate Wind Load ...... 226
7.2.4 Sample Calculation of Diaphragm Deflection using Simplified Mathematical
Model ..................................................................................................................... 228
7.2.5 Simplified Mathematical Model Validation against Finite Element Model
Results .................................................................................................................... 230
7.3 Approximate FE model for diaphragm deflection............................................... 231
7.3.1 Deep Beam Model ........................................................................................ 231
7.3.2 Plate Element Model ..................................................................................... 233
7.4 Case study ............................................................................................................ 234
7.4.1 Maximum bracing wall spacing .................................................................... 236
7.4.2 Method 1: Total shear ................................................................................... 236
xiii
7.4.3 Method 2: Deep beam method ...................................................................... 237
7.4.4 Method 3: Plate method ................................................................................ 240
7.4.5 Diaphragm load distribution ......................................................................... 244
7.5 Design Charts for Industrial Applications ........................................................... 245
7.6 Summary and Conclusions .................................................................................. 249
CHAPTER 8 ................................................................................................................. 250
CONCLUSIONS AND RECOMMENDATIONS ....................................................... 250
8.1 Conclusions ......................................................................................................... 250
8.2 Recommendations for Future Research .............................................................. 256
References ..................................................................................................................... 257

xiv
List of Figures
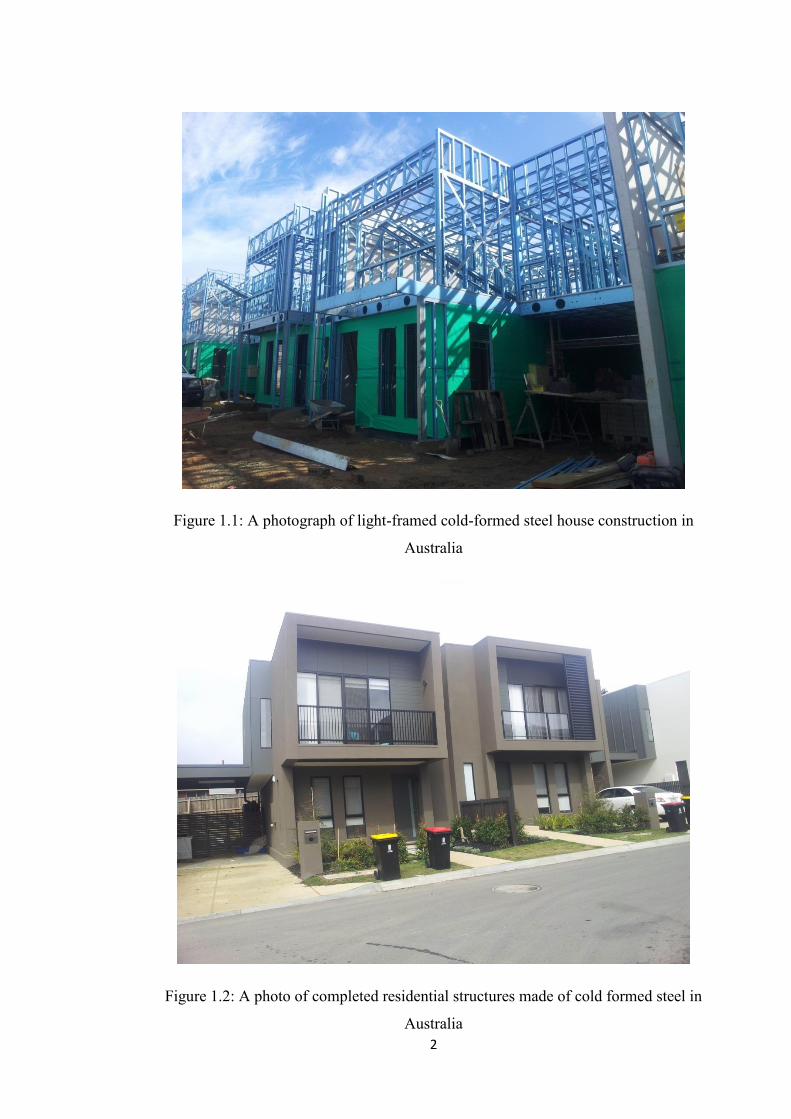
Figure 1.1: A photograph of light-framed cold-formed steel house construction in
Australia ............................................................................................................................ 2
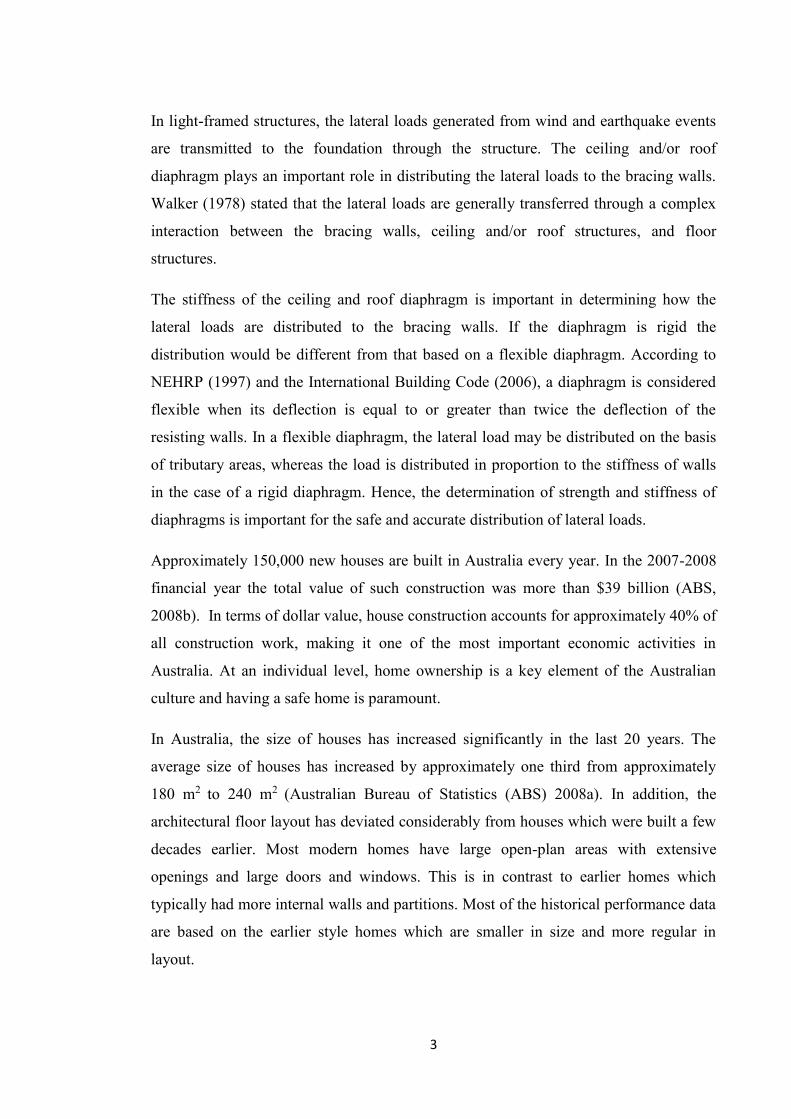
Figure 1.2: A photo of completed residential structures made of cold formed steel in
Australia ............................................................................................................................ 2
Figure 2.1: Cold-formed steel sections used for structural framing (NASH, 2014) ......... 9
Figure 2.2: Various truss cross sections (NASH, 2009) ................................................... 9
Figure 2.3: Typical framing of steel-framed structures (NASH, 2014) .......................... 12
Figure 2.4: Typical wall framing system (NASH, 2009) ................................................ 13
Figure 2.5: Typical truss roof system (NASH, 2009) ..................................................... 14
Figure 2.6: Factors affecting strength and stiffness of ceiling diaphragms .................... 15
Figure 2.7: Factors affecting strength and stiffness of roof diaphragms ........................ 16
Figure 2.8: Transfer of racking load from ceiling and roof diaphragm to walls via the
cornice (Golledge et al., 1990) ........................................................................................ 20
Figure 2.9: Arrangement of wind forces on the surface of single storey building.......... 23
Figure 2.10: Determination of diaphragm flexibility (Florida Building Code
Commentary, 2007)......................................................................................................... 25
Figure 2.11: Schematic representation of rigid and flexible diaphragm ......................... 26
Figure 2.12: Ceiling diaphragm actions in two extreme conditions ............................... 27
Figure 2.13: Configurations of simplified continuous diaphragms ................................ 29
Figure 2.14: Various bracing systems (NASH, 2009) .................................................... 30
Figure 2.15: Illustration of the importance of deformation compatibility or ductility in
assessing the cumulative effects of different bracing types (NASH, 2009) ................... 32
Figure 2.16: Typical location and distribution of bracing walls ..................................... 34
xv
Figure 2.17: Plan view of various load distribution methods (Kasal et. al. 2004) .......... 36
Figure 3.1: Summary of the experimental testing of this study ..................................... 55
Figure 3.2: Test arrangement for lateral resistance of screws (ASTM D1761-12) ......... 57
Figure 3.3: Field shear connection test set-up to replicate connection with top-hat
section member (dimensions are in mm) ........................................................................ 58
Figure 3.4: Edge shear connection test set-up to replicate connection with top-hat
section member (dimensions are in mm) ........................................................................ 59
Figure 3.5: Field shear connection test setup to replicate connection with channel
section member (dimensions are in mm) ........................................................................ 60
Figure 3.6: Edge shear connection test setup to replicate connection with channel
section steel member (here Y designates edge distance 15 mm, 17 mm and 20 mm)
(dimensions are in mm) ................................................................................................... 61
Figure 3.7: Specimens of shear connections constructed by the author (a) field screw
connection specimens for top-hat sections, (b) edge screw connection specimens for
top- hat sections, and (c) field screw connection specimens for channel sections. ........ 64
Figure 3.8: Shear connection test set-up for plasterboard sheathing-to-top hat sections
(a) field screw tests, and (b) edge screw tests ................................................................. 66
Figure 3.9: Shear connection test set-up for plasterboard sheathing-to-channel section
(a) field screw tests, and (b) edge screw tests ................................................................. 67
Figure 3.10: The upper and lower bounds (red lines) of the field screw shear (sheathing-
to-top hat section) connection test results (for one screw) .............................................. 69
Figure 3.11: The upper and lower bounds (red lines) of the edge screw shear (sheathing-
to-top hat section) connection test results (for one screw) .............................................. 69
Figure 3.12: Load-slip behaviour of plasterboard sheathing-to-top hat section
connections under monotonic loading (for one screw). This figure shows measurements
from LDTs on both sides of the specimens. .................................................................... 70

xvi
Figure 3.13: Load-slip behaviour of plasterboard sheathing-to-top hat section
connections under monotonic loading (mean values obtained for one screw) ............... 71
Figure 3.14: Load-slip behaviour of plasterboard sheathing-to-channel section
connections under monotonic loading (mean values obtained for one screw) ............... 71
Figure 3.15: Definition of tangent and secant stiffness under monotonic loading ......... 73
Figure 3.16: ‘Bulging’ of plasterboard happened as the screw head penetrated into the
plasterboard. .................................................................................................................... 74
Figure 3.17: Failure modes of plasteroard sheathing-to-top hat section connections
under monotonic loading (a) field screw, and (b) edge screw ........................................ 75
Figure 3.18: Failure modes of field screw connection tests of sheathing-to- channel
section framing connections under monotonic loading .................................................. 76
Figure 3.19: Load-slip behaviour of plasterboard sheathing-to-channel section
connections for different edge distances under monotonic loading (mean values
obtained for one screw) ................................................................................................... 77
Figure 3.20: Failure modes of plastebroard sheathing-to-channel section connections for
different edge distances under monotonic loading (a) 15 mm edge distance, (b) 17 mm
edge distance, and (c) 20 mm edge distance ................................................................... 78
Figure 3.21: Load-slip behaviour of plasterboard sheathing-to-framing (top hat and
channel sections) connections under monotonic loading (mean values obtained for one
screw) .............................................................................................................................. 79
Figure 3.22: Load-slip behaviour of sheathing-to-framing connection under monotonic
loading ............................................................................................................................. 80
Figure 4.1: Configuration of ceiling diaphragm testing systems (a) Cantilever/racking
test assembly, (b) beam test assembly............................................................................. 83
Figure 4.2 Test set-up and instrumentation for cantilever test ........................................ 84
Figure 4.3: Photograph of loading frame with ceiling bottom chords and ceiling battens
mounted on it. ................................................................................................................. 85
xvii
Figure 4.4 Ceiling panel configurations along with connection details .......................... 86
Figure 4.5: Photograph showing tested ceiling diaphragm assembly ............................. 87
Figure 4.6: Photograph showing steel casters to prevent the ceiling specimen from
moving out-of-plane. ....................................................................................................... 88
Figure 4.7: Photograph of specimen (after modification) using timber sections between
bottom chords to prevent twisting of bottom chords (a) front view of the specimen, (b)
holding the specimen from the back ............................................................................... 89
Figure 4.8: Photograph showing using stud sections along the length of specimens to
prevent twisting of bottom chords................................................................................... 90
Figure 4.9: Load vs. deflection curves of loading frame only ........................................ 92
Figure 4.10: Starting of the twisting of bottom chord sections at the load of 1.7 kN and
corresponding displacement of 35 mm. .......................................................................... 93
Figure 4.11: Separation of LDT from the contact of sections at the load of 2.0 kN and
with the corresponding displacement of 42 mm ............................................................. 94
Figure 4.12: Load vs. net-deflection curve of test specimen #1 ..................................... 95
Figure 4.13: Load vs. net-deflection curve of test specimen #2 ..................................... 95
Figure 4.14: Load vs. net-deflection curve of test specimen #3 ..................................... 96
Figure 4.15: Load-deflection behaviour of tested ceiling diaphragms under monotonic
loading ............................................................................................................................. 97
Figure 4.16: Tested ceiling diaphragm assembly showing numbering of screws and
battens ............................................................................................................................. 98
Figure 4.17: Failure modes of cantilever specimen: (a) tearing of plasterboard around
screws along batten 1; (b) pulling through of plasterboard; (c) view of plasterboard from
the back ......................................................................................................................... 100
Figure 4.18: Photograph showing plasterboard rotation as a single unit ...................... 101
Figure 4.19 Definition of the initial and the secant stiffness for monotonic tests ........ 102
xviii
Figure 5.1: Beam test configuration of ceiling diaphragm testing system .................... 107
Figure 5.2: Typical structural testing arrangement of diaphragm in beam configuration
....................................................................................................................................... 108
Figure 5.3: Fixing system of plasterboard to framing members ................................... 109
Figure 5.4: Details of pin support (a) Top view, (b) Side view .................................... 110
Figure 5.5: Details of roller support (a) Top view, (b) Side view ................................. 111
Figure 5.6: Lateral supports (a) pin support, (b) roller support .................................... 112
Figure 5.7: Details of one-third loading point (a) Top view, (b) Right side view, (c) Left
side view........................................................................................................................ 114
Figure 5.8: Mechanism of loading system .................................................................... 115
Figure 5.9: Structural ceiling diaphragm testing system for beam test specimen #1 .... 117
Figure 5.10: Bottom chords and ceiling battens on the test jig before placement of
plasterboard ................................................................................................................... 118
Figure 5.11: Complete set-up of beam test specimen #1 .............................................. 118
Figure 5.12: Effects of plasterboard bearing edges on the top plates of end walls ....... 119
Figure 5.13: Structural ceiling diaphragm beam testing arrangement for beam test
specimen #2 ................................................................................................................... 120
Figure 5.14: Beam test specimen (a) complete test set-up, (b) close-up view of the
system for study of top plate effects ............................................................................. 121
Figure 5.15: Structural ceiling diaphragm beam testing arrangement for beam test
specimen #3 ................................................................................................................... 122
Figure 5.16: Bottom chords and ceiling battens on the test jig before placement of
plasterboard ................................................................................................................... 123
Figure 5.17: Complete test set-up of beam test specimen #3 ........................................ 123
xix
Figure 5.18: Structural ceiling diaphragm beam testing arrangement for beam test
specimen #4 ................................................................................................................... 124
Figure 5.19: Bottom chords and ceiling battens on the test jig before placement of
plasterboard ................................................................................................................... 125
Figure 5.20: Details of connection system of ceiling batten overlapping ..................... 125
Figure 5.21: Test set-up (a) complete test specimen, (b) lateral restraint system at pin
support, (c) lateral restraint system at roller support .................................................... 127
Figure 5.22: Structural ceiling diaphragm beam testing arrangement for beam test
specimen #5 ................................................................................................................... 128
Figure 5.23: Complete test set-up for beam test specimen #5 ...................................... 128
Figure 5.24: Load vs. net-deflection curve for the frame only (without plasterboard) . 130
Figure 5.25: Load vs. net-deflection curve for beam test specimen #1 ........................ 131
Figure 5.26: Failure mode of diaphragm for beam test specimen #1 (a) tear-out of
plasterboard at the left corner of diaphragm, (b) tear-out of plasterboard at the right
corner of diaphragm, (c) pulling out of plasterboard at the top left corner of diaphragm,
(d) pulling out of plasterboard at the top right corner of diaphragm, (e) pulling out of
plasterboard at the perimeter of diaphragm, (f) deformed shape of tilted screw .......... 132
Figure 5.27: Deformed shape of the test specimen showing the bending of battens and
translation of the plasterboard as a rigid body. ............................................................. 133
Figure 5.28: Load vs. net-deflection curve for beam test specimen #2 ........................ 134
Figure 5.29: Failure mode of diaphragm for beam test specimen #2 (a) tear-out of
plasterboard at the left corner of diaphragm, (b) tear-out of plasterboard at the right
corner of diaphragm, (c) pulling out of plasterboard at the top left corner of diaphragm,
(d) pulling out of plasterboard at the top right corner of diaphragm, (e) plasterboard
bearing on both edge of diaphragm, (f) deformed shape of tilted screw, (g) considerable
bending of ceiling battens ............................................................................................. 136
Figure 5.30: Load vs. net-deflection curve for beam test specimen #3 ........................ 137

xx
Figure 5.31: Failure mode of diaphragm for beam test specimen #3 (a) tear-out of
plasterboard at the left corner of diaphragm, (b) tear-out of plasterboard at the right
corner of diaphragm, (c) pulling out of plasterboard at the top left corner of diaphragm,
(d) pulling out of plasterboard at the middle left side of diaphragm, (e) pulling out of
plasterboard at the middle right side of diaphragm, (f) deformed shape of tilted screw
....................................................................................................................................... 138
Figure 5.32: Load vs. net-deflection curve for beam test specimen #4 ........................ 139
Figure 5.33: Failure mode of diaphragm for beam test specimen #4 (a) tear-out of
plasterboard at the left corner of diaphragm, (b) tear-out of plasterboard at the right
corner of diaphragm, (c) pulling out of plasterboard at the top left corner of diaphragm,
(d) pulling out of plasterboard at the top right corner of diaphragm, (e) pulling out of
plasterboard field screws, (f) deformed shape of tilted screw ...................................... 140
Figure 5.34: Load vs. net-deflection curve for beam test specimen #5 ........................ 142
Figure 5.35: Failure mode of diaphragm for beam test specimen #5 (a) tear-out of
plasterboard at the left corner of diaphragm, (b) tear-out of plasterboard at the right
corner of diaphragm, (c) pulling out of plasterboard at the top left corner of diaphragm,
(d) deformed shape of tilted screw ................................................................................ 143
Figure 5.36: Definition of initial and the secant stiffness for beam test ....................... 145
Figure 5.37: Typical ceiling diaphragm assembly (showing numbering for explanation)
....................................................................................................................................... 146
Figure 5.38: Load-deflection behaviour of full-scale diaphragms under monotonic
loading ........................................................................................................................... 148
Figure 6.1: Typical input load-displacement curve for a COMBIN39 non-linear spring
element. ......................................................................................................................... 153
Figure 6.2: Typical load-displacement curve based on combining a tension and a
compression spring ....................................................................................................... 156
Figure 6.3: Effects of plasterboard bearing edges on the top plates of end walls ......... 157
Figure 6.4: Schematic diagram of plasterboard-bearing edge modelling ..................... 157
xxi
Figure 6.5: FE model developed in cantilever configuration ........................................ 159
Figure 6.6: Comparison between analytical and experimental results in cantilever
configuration for an isolated ceiling diaphragm ........................................................... 159
Figure 6.7: Deflected frame shape from the FE model ................................................. 160
Figure 6.8: Developed FE model for beam test specimen #1 ....................................... 162
Figure 6.9: Comparison between experimental and analytical results for beam test
specimen #1 ................................................................................................................... 162
Figure 6.10: Deflected shape for beam test specimen #1 .............................................. 163
Figure 6.11: FE model for beam test specimen #2........................................................ 164
Figure 6.12: Load-deflection curves comparison between the experimental and
analytical for beam test specimen #2 ............................................................................ 164
Figure 6.13: Deflected shape for beam test specimen #2 .............................................. 165
Figure 6.14: FE model for beam test specimen #3........................................................ 166
Figure 6.15: Comparison between experimental and analytical results for beam test
specimen #3 ................................................................................................................... 166
Figure 6.16: Deflected shape for beam test specimen #3 .............................................. 167
Figure 6.17: FE model for beam test specimen #4........................................................ 168
Figure 6.18: Load-deflection curves of experimental and analytical results for beam test
specimen #4 ................................................................................................................... 168
Figure 6.19: Deflected shape for beam test specimen #4 .............................................. 169
Figure 6.20: FE model for beam test specimen #5........................................................ 170
Figure 6.21: Comparison between experimental and analytical results for beam test
specimen #5 ................................................................................................................... 170
Figure 6.22: Deflected shape for beam test specimen #5 .............................................. 171
xxii
Figure 6.23: Load-deflection curves for different loading configurations (one-third point
load, mid-span load, and uniformly distributed load) ................................................... 173
Figure 6.24: Load-deflection behaviour for ceilings with different lengths with
boundary conditions ...................................................................................................... 176
Figure 6.25: Load-deflection behaviour for ceilings with different widths with boundary
conditions ...................................................................................................................... 178
Figure 6.26: Comparison of load-deflection curves (with and without boundary
conditions) for ceilings with different widths ............................................................... 180
Figure 6.27: Load-deflection behaviour for ceilings with different screw spacing along
each ceiling batten with boundary conditions ............................................................... 181
Figure 6.28: Different screw patterns used for ceiling diaphragms with boundary
conditions (all dimensions are in mm) .......................................................................... 185
Figure 6.29: Load-deflection curves for different additional plasterboard screw patterns
with boundary conditions .............................................................................................. 186
Figure 6.30: Load-deflection behaviour due to variation of gap size between the
plasterboard edge and end walls ................................................................................... 188
Figure 6.31: Effect of batten spacing on load-deflection behaviour with boundary
conditions ...................................................................................................................... 190
Figure 6.32: Load-deflection curves for isolated ceilings with different lengths ......... 192
Figure 6.33: Behaviour of isolated ceiling diaphragms with different widths .............. 194
Figure 6.34: Load-deflection behaviour for different screw spacing along each ceiling
batten for isolated ceiling diaphragms .......................................................................... 196
Figure 6.35: Different screw patterns used for isolated ceiling diaphragms (all
dimensions are in mm) .................................................................................................. 199
Figure 6.36: Load-deflection curves for different plasterboard screw patterns for
isolated ceiling diaphragms ........................................................................................... 200
xxiii
Figure 6.37: Effect of batten spacing on load-deflection behaviour for an isolated ceiling
diaphragm ...................................................................................................................... 202
Figure 6.38: Load-deflection behaviour of an isolated ceiling diaphragm with bottom
chord spacing ................................................................................................................ 204
Figure 6.39: Comparison of load-deflection behaviour between loading directions
parallel to batten and parallel to bottom chords ............................................................ 205
Figure 6.40: Comparison of load-deflection behaviour of frame only (without
plasterboard) between loading directions parallel to batten and parallel to bottom chords
....................................................................................................................................... 206
Figure 6.41: Capacity-deflection curves for cantilever and beam testing assemblies .. 207
Figure 6.42: Load-deflection curves for plasterboard-batten fixed and plasterboard-
bottom chord fixed diaphragms .................................................................................... 208
Figure 6.43: Load-deflection properties of field screws ............................................... 209
Figure 6.44: Load-deflection properties of edge screws ............................................... 210
Figure 6.45: Performance of ceiling diaphragms with different plasterboard-steel frame
connection capacities .................................................................................................... 210
Figure 7.1: Various components of diaphragm deflection ............................................ 218
Figure 7.2: Diaphragm subjected to one-third loading ................................................. 219
Figure 7.3: Application of parallel axis theorem for determination of moment of inertia
....................................................................................................................................... 220
Figure 7.4: Deformed shape of a plasterboard sheathing panel in shear ...................... 222
Figure 7.5: Deformed shape of a plasterboard sheathing panel .................................... 223
Figure 7.6: Plasterboard sheathing panel elongation with respect to panel diagonal ... 224
Figure 7.7: Comparison of diaphragm deflection between simplified mathematical
model and beam test results .......................................................................................... 226
Figure 7.8: Diaphragm configuration showing lateral load along chord direction ....... 228

xxiv
Figure 7.9: Average screw load-slip response (source: Chapter 3) .............................. 229
Figure 7.10: Comparison of diaphragm deflection between simplified mathematical
model and FEM results ................................................................................................. 230
Figure 7.11: Diaphragm model using deep beam analogy ............................................ 231
Figure 7.12: Diaphragm deformed shape using deep beam model ............................... 233
Figure 7.13: Building configuration showing lateral load resisting elements in long
direction......................................................................................................................... 234
Figure 7.15: Diaphragm model using deep beam element ............................................ 237
Figure 7.16: Diaphragm and bracing wall displacement using deep beam model........ 239
Figure 7.17: Diaphragm model using plate element method ........................................ 241
Figure 7.18: Diaphragm deformed shape from plate element model............................ 242
Figure 7.19: Diaphragm and bracing wall displacement .............................................. 242
Figure 7.20: Diaphragm load distribution to bracing walls .......................................... 244
Figure 7.21: Configurations of wind load to be resisted by various types of buildings 247
Figure 7.22: Maximum bracing wall spacing for wind class N3/C1 ............................ 248
xxv
List of Tables
Table 3.1 Basic test matrix for shear connection tests .................................................... 63
Table 3.2 Summary of monotonic test results for one screw .......................................... 72
Table 4.1 Matrix of test specimens under monotonic loading ........................................ 90
Table 4.2 Summary of test results of specimens subjected to monotonic loading ....... 102
Table 4.3 Summary of loads at serviceability displacement ......................................... 102
Table 5.1 Matrix of test specimens under monotonic loading ...................................... 129
Table 5.2 Summary of test results for specimens subjected to monotonic loading ...... 144
Table 6.1: Finite-element representation of structural components in ANSYS ........... 154
Table 6.2: Material properties used in the FE model .................................................... 154
Table 6.3: Real constants for materials used in the FE model ...................................... 155
Table 6.4: Basic test matrix of tested specimens in beam configuration ...................... 161
Table 6.5: Summary of experimental and analytical results under monotonic loading 172
Table 6.6: Parameters for different ceiling lengths with boundary conditions ............ 175
Table 6.7: Load-carrying capacity and stiffness of ceiling with different ceiling length
(i.e. aspect ratios) with boundary conditions ................................................................ 176
Table 6.8: Various parameters for different ceiling width with boundary conditions .. 177
Table 6.9: Load-carrying capacity and stiffness of ceilings with different widths with
boundary conditions ...................................................................................................... 179
Table 6.10: Parameters for varying screw spacing with boundary conditions ............ 181
Table 6.11: Load-carrying capacity and stiffness of ceilings with different screw spacing
with boundary conditions .............................................................................................. 182
Table 6.12: Parameters for various screw fixing patterns ............................................. 183
xxvi
Table 6.13: Load-carrying capacity and stiffness of ceilings with boundary conditions
for different screw patterns ........................................................................................... 186
Table 6.14: Parameters for varying gap sizes with boundary conditions .................... 187
Table 6.15: Load-carrying capacity and stiffness of ceilings with boundary conditions
for different gap sizes .................................................................................................... 188
Table 6.16: Parameters for varying batten spacing with boundary conditions ............ 189
Table 6.17: Load-carrying capacity and stiffness of ceilings for different ceiling batten
spacing with boundary conditions ................................................................................. 190
Table 6.18: Parameters for isolated ceiling diaphragms with different lengths ............ 191
Table 6.19: Load-carrying capacity and stiffness of ceilings with different ceiling
lengths (i.e. aspect ratios) for isolated ceiling diaphragms ........................................... 192
Table 6.20: Parameters for isolated ceiling diaphragms with different widths............. 193
Table 6.21: Load-carrying capacity and stiffness of ceilings with different widths for
isolated ceiling diaphragms ........................................................................................... 194
Table 6.22: Parameters for varying screw spacing for isolated ceiling diaphragms .... 195
Table 6.23: Load-carrying capacity and stiffness of ceilings with different screw spacing
for isolated ceiling diaphragms ..................................................................................... 196
Table 6.24: Parameters for various screw fixing patterns for isolated ceiling diaphragms
....................................................................................................................................... 197
Table 6.25: Load-carrying capacity and stiffness of ceilings with different screw fixing
patterns for isolated ceiling diaphragms ....................................................................... 201
Table 6.26: Parameters for varying batten spacing for isolated ceiling diaphragms ... 201
Table 6.27: Load-carrying capacity and stiffness of ceilings with different screw spacing
for isolated ceiling diaphragms ..................................................................................... 202
Table 6.28: Parameters for varying bottom chord spacing for isolated ceiling
diaphragms .................................................................................................................... 203

xxvii
Table 6.29: Load-carrying capacity and stiffness of ceilings with different screw spacing
for isolated ceiling diaphragms ..................................................................................... 204
Table 7.1: Validation of equivalent diaphragm stiffness (5.4 m x 2.4 m- 400 mm batten
spacing) using deep beam model .................................................................................. 232
Table 7.2: Equivalent diaphragm stiffness (GAs) for deep beam method .................... 238
Table 7.3: Bracing wall stiffness ................................................................................... 238
Table 7.4: Bracing wall strength and deflection check ................................................. 239
Table 7.5: Diaphragm deflection check ........................................................................ 240
Table 7.6: Equivalent diaphragm stiffness (Gts) for plate method ............................... 241
Table 7.7: Bracing wall stiffness ................................................................................... 241
Table 7.8: Bracing wall strength and deflection check ................................................. 243
Table 7.9: Diaphragm deflection check ........................................................................ 243

1
CHAPTER 1
INTRODUCTION
1.1 Background of the Research
In Australia, houses are usually one- and two-storey light-framed structures, often
referred to as domestic structures. People depend on these structures for safety against
extreme natural events, including cyclones and earthquakes.
In Australia, domestic structures typically comprise of timber or steel structural frames
which have plasterboard interior wall lining, plasterboard ceiling lining and brick veneer
exterior cladding. Steel sheets or tiles are generally used as roof cladding. The overall
response of a domestic structure due to lateral loading may be greatly influenced by
both structural and non-structural components (Saifullah et al. 2012). The effects of
non-structural components on the structural behaviour of a house are known as system
effects. The system effects play an important role in determining the performance of
domestic structures under wind and earthquake loading.
Until recently, technology and engineering design have played a small part in the
development of houses, particularly those made from timber. The design and
construction techniques have been developed based on tradition and trade experience.
Steel- and timber-framed domestic structures have the same structural form and are
constructed in a similar fashion. The focus of this research is on houses built with cold-
formed steel frames. Figure 1.1 shows a typical Australian residential structure with
cold-formed steel frame members. The complete construction of a house using cold-
formed steel frames is presented in Figure 1.2. It should be mentioned that light-framed
domestic structures are not only constructed in Australia, but also in many parts of the
world, including New Zealand, the USA, South Africa and Japan.
2
Figure 1.1: A photograph of light-framed cold-formed steel house construction in
Australia
Figure 1.2: A photo of completed residential structures made of cold formed steel in
Australia
3
In light-framed structures, the lateral loads generated from wind and earthquake events
are transmitted to the foundation through the structure. The ceiling and/or roof
diaphragm plays an important role in distributing the lateral loads to the bracing walls.
Walker (1978) stated that the lateral loads are generally transferred through a complex
interaction between the bracing walls, ceiling and/or roof structures, and floor
structures.
The stiffness of the ceiling and roof diaphragm is important in determining how the
lateral loads are distributed to the bracing walls. If the diaphragm is rigid the
distribution would be different from that based on a flexible diaphragm. According to
NEHRP (1997) and the International Building Code (2006), a diaphragm is considered
flexible when its deflection is equal to or greater than twice the deflection of the
resisting walls. In a flexible diaphragm, the lateral load may be distributed on the basis
of tributary areas, whereas the load is distributed in proportion to the stiffness of walls
in the case of a rigid diaphragm. Hence, the determination of strength and stiffness of
diaphragms is important for the safe and accurate distribution of lateral loads.
Approximately 150,000 new houses are built in Australia every year. In the 2007-2008
financial year the total value of such construction was more than $39 billion (ABS,
2008b). In terms of dollar value, house construction accounts for approximately 40% of
all construction work, making it one of the most important economic activities in
Australia. At an individual level, home ownership is a key element of the Australian
culture and having a safe home is paramount.
In Australia, the size of houses has increased significantly in the last 20 years. The
average size of houses has increased by approximately one third from approximately
180 m2 to 240 m2 (Australian Bureau of Statistics (ABS) 2008a). In addition, the
architectural floor layout has deviated considerably from houses which were built a few
decades earlier. Most modern homes have large open-plan areas with extensive
openings and large doors and windows. This is in contrast to earlier homes which
typically had more internal walls and partitions. Most of the historical performance data
are based on the earlier style homes which are smaller in size and more regular in
layout.

4
Australian design standards and codes of practice (e.g., Australian Standard AS1684
and NASH Standard, 2005) allow the designer of a house to rely on nominal walls
with lining to provide up to 50% of the total bracing requirements. These nominal walls
are typically plasterboard-lined walls which can be external (along the perimeter of the
structure) or internal partition walls. Furthermore, plasterboard ceilings are used to
transfer the lateral loads to the bracing walls. These design assumptions are supported
by findings from past research, which clearly demonstrated that plasterboard lining can
act as a stiff medium (Gad et al, 1999; Reardon and Mahenderan, 1988; Reardon, 1990).
However, in recent times there have been significant changes in the manufacturing of
plasterboard and the way it is installed in new houses. For example, modern
plasterboard is lighter, due to the addition of foaming agents in the gypsum.
Furthermore, the paper liner which provides most of the strength to the board is
of lower weight (grams per square meter).
Importantly, there is very limited data available on the strength and stiffness of ceiling
and roof diaphragms in steel-framed houses. Indeed, for timber-framed houses there is
also very limited information to allow a designer to determine the capacity of ceiling
diaphragms to transfer lateral loads. The only information available is that contained in
AS1684, which specifies the maximum distance between bracing walls which can be
spanned by the roof system. This span is limited to a maximum of 9 m, regardless of the
loading, roof geometries or material properties. Hence, if the clear spacing between
bracing walls in an open plan area is greater than 9 m, there is no guidance whatsoever.
Therefore, rational assessment of the stiffness and strength of horizontal diaphragms is
necessary to correctly design the lateral load-resisting system. The development of a
rational design method would allow Australian designers and manufacturers to develop
optimised systems rather than relying on extrapolation of historical empirical data. This
would be foster innovation in the important sector of industry in both Australia and
internationally. Without rational engineering design models and performance-based
design, domestic structures will not benefit from innovation and optimisation.
Furthermore, the true performance of these structures under extreme events will be
difficult to assess.

5
1.2 Research Aim and Objectives
The overall research program is broken up into two components. A research companion,
Rojit Shahi, PhD research student, The University of Melbourne, has focused on the
assessment of bracing walls which included development of a test method for
estimating the strength and stiffness of different bracing walls under both wind and
earthquake loading. The research presented in this thesis is focused on the behaviour of
ceiling diaphragm and how lateral loads from the ceiling would be distributed to the
bracing walls.
The International Building Code (IBC, 2006) classifies diaphragms as either flexible or
rigid, depending on the relative stiffness of the diaphragm to the walls. However, in
Australian design standards, there is no reference to the rigidity of the ceiling or roof
diaphragms. Therefore, the overall aim of this project is to quantify the strength and
stiffness of typical cold-formed steel-framed plasterboard lined ceiling diaphragms
subjected to monotonic loading to simulate wind loading conditions. The specific
objectives are:
Based on a critical literature review, identify the key factors which affect the
performance of diaphragms in residential structures. In addition, review previous
research to highlight methods for testing of diaphragms and relevant analytical
models which can be used to predict their behaviour.
Using experimental testing, identify the load-deflection behaviour of the critical
connections in ceiling diaphragms, i.e. the screws connecting the plasterboard to
the supporting ceiling frame. These connections are subjected to shear loading
and their behaviour may be dependent on the locations of the screws from the
edge of the plasterboard and the thickness of the steel supporting members.
Determine the strength and stiffness properties of typical ceiling diaphragms by
testing full-scale segments. The results of these tests will also be used to validate
analytical models developed in this thesis.
Develop and validate detailed analytical models for ceiling diaphragms which
can accommodate different geometries and material properties. The developed
model should predict the correct failure models, stiffness and strength of typical
ceiling diaphragms.
6
Develop a simplified mathematical model for predicting the stiffness of typical
ceiling diaphragms which can be used by engineers for design purposes. Further,
demonstrate the use of the developed mathematical model for determining the
distribution of lateral loads to bracing walls via the ceiling for a typical
structure.
1.3 Outline of Thesis
Chapter 1 provides the background and rationale of this research. The objectives,
significance and research methodology of this thesis are described in this chapter.
Chapter 2 presents a critical literature review of domestic structures under lateral loads.
The literature review is not limited to steel-framed structures but also to some extent
related to timber-framed structures. In this chapter, the factors which affect the lateral
behaviour of ceiling diaphragm are also summarised and discussed, the research gap is
identified, and recommendations for further research are reported.
Chapter 3 discusses the first phase of the experimental program, which consisted of
shear connection tests between plasterboard sheathing and cold-formed steel framing
members. The details of the apparatus, test specimen requirements and testing
procedure are described. Detailed observation of the failure mechanism of the
connection between the plasterboard and steel framing members through the connecting
screws is also presented in this chapter.
Chapter 4 presents the second phase of the experimental program. This chapter
describes the construction of three full-scale ceiling diaphragm specimens, the testing
methodologies adopted, including the selection of appropriate loading protocols, the
testing program and the testing facilities necessary to perform the tests. The results,
analyses and conclusions obtained from this phase of the experimental program are also
reported.
Chapter 5 describes the third phase of the experimental program conducted in this
research project. This chapter mainly focuses on the ceiling diaphragm actions in beam
configurations. Five full-scale tests have been conducted based on common ceiling
systems in cold-formed steel structures with different configurations to determine the
strength and stiffness of such diaphragms under monotonic loading.

7
Chapter 6 presents the analytical modelling for predicting the lateral load-deflection
behaviour of plasterboard-clad ceiling diaphragms. A description of the strategy of the
developed modelling is also reported in this chapter. This chapter also presents the
validation of the model against the experimental results. Extensive parametric studies
are also undertaken to observe the influence of various factors such as aspect ratio,
spacing of the plasterboard screws, effect of batten and bottom chord spacing, gap size
in corners and various loading configurations. The discussion and conclusions based on
the analytical modelling provide basic guidance to designers to assess the critical
parameters for steel-framed domestic constructions.
Chapter 7 describes the different methods for the distribution of the lateral load to the
bracing walls through the ceiling diaphragm. A method is recommended to distribute
the lateral loads to the bracing walls through the ceiling diaphragms. Design chart for
the maximum spacing of bracing walls in a typical wind scenario in Australian houses is
reported in this chapter.
Chapter 8 provides a summary and conclusions of this research project. Based on the
accomplished work, the recommendations for future research are also provided in this
chapter.
8
CHAPTER 2
LITERATURE REVIEW
2.1 Introduction
The lateral load-resisting system in light-framed structures usually comprises a ceiling
and/or roof diaphragm that transmits horizontal loads to vertical load-resisting elements.
The roof diaphragm is made of corrugated steel deck sheets which are fastened to each
other and to the supporting members, typically trusses. The ceiling diaphragm in
residential structures is made of plasterboard sheeting attached to ceiling battens, which
in turn are attached to the bottom chords of trusses.
This chapter discusses all of the factors which affect the lateral behaviour of ceiling and
roof diaphragms as well as relevant experimental and analytical research conducted in
different parts of the world.
2.2 Background on Cold-formed Steel
In building construction, cold-formed steel products are mainly used as structural
members, diaphragms, and coverings for roofs, walls and floors. Cold-formed steel
members are widely used in residential construction and pre-engineered metal buildings
for industrial, commercial and agricultural applications (Yu, 2000).
Cold-formed steel has numerous advantages over other construction materials,
including: (i) light weight, (ii) high strength and stiffness, (iii) fast and easy erection and
installation, (iv) dimensionally stable material, (v) no formwork needed, (vi) durable
material, (vii) economy in transportation and handling, (viii) non-combustible material,
(ix) recyclable nature and (x) energy efficiency.
Cold-formed steel section shapes are manufactured by press-braking blanks sheared
from sheets, cut lengths of coils or plates, or by roll forming cold- or hot-rolled coils or
sheets, and conducting forming operations at ambient room temperature, i.e., without
the addition of heat as required for hot-rolling (AS/NZS 4600:2005). Various shapes are
available for walls, floors, and roof diaphragms and coverings, as shown in Figures 2.1
and 2.2. Typical cold-formed steel members such as studs, track, purlins, girts and
angles are mainly used for carrying loads, while panels and decks constitute useful
surfaces such as floors, roofs and walls, in addition to resisting in-plane and out-of-
plane surface loads. Prefabricated cold-formed steel assemblies include roof trusses,
9
panelized walls or floors, and other prefabricated structural assemblies (Yu, 2000).
Hancock (1994) and Yu (1991) stated that the behaviour, characteristics and subsequent
design of cold-formed steel elements are greatly affected by local buckling, web
stiffening, and the characteristics and effect of openings.
Figure 2.1: Cold-formed steel sections used for structural framing (NASH, 2014)
(Figure is omited from the electronic version of thesis due to copyright issue)
Figure 2.2: Various truss cross sections (NASH, 2009) (Figure is omited from the
electronic version of thesis due to copyright issue)
Structural strength and stiffness are the main considerations in the design of structures.
Load-carrying panels and decks not only withstand loads normal to their surface, but

10
also act as shear diaphragms to resist forces in their own planes if they are adequately
interconnected to each other and to supporting members (Yu, 2000).
Paultre et al. (2004) reported that structural steel framing provides designers with an
extensive choice of economic systems for floor and roof construction. Steel framing can
attain longer spans more competently than other kinds of construction. This reduces the
number of columns and footings, thus increasing speed of assembly.
2.3 Current Design Practices in Australia
In Australia, there are material-based standards for the design of structures and loading
standards for the loadings applied to structures. Most research in Australia has been
based on timber-framed structures, and research on steel-framed domestic structures has
been a recent occurrence. Before 1993, there was no Australian Standard specifically for
the structural design of steel-framed domestic structures. The Cold-formed Steel
Structures Code (AS1538:1988) was generally used for the design of cold-formed steel
framing members. However, there was a lack of information regarding steel-framed
domestic structures. For that reason, the National Association of Steel-framed Housing
(NASH) published a design manual in collaboration with BHP Steel, the CSIRO and the
Australian Institute of Steel Construction (AISC) entitled "Structural Performance
Requirements for Domestic Steel Framing" (AISC, 1991). AISC (1991) was developed
to assist in the design and development of cold-formed steel framing for domestic
construction.
In 1993, Australian Standards published the Domestic Metal Framing Standard (AS
3623). This standard provides the performance requirements, in terms of structural
adequacy and serviceability, for the framing of domestic buildings of up to two storeys
in height and roof pitches of up to 35°. This standard was developed in accordance with
AS 4055 (Wind loads for housing) and the relevant parts of AS 1170 (Minimum design
loads on structures).
Bracing systems are designed to resist horizontal loads due to wind or earthquake.
Bracing elements are as evenly distributed practicably possible and are provided in two
orthogonal directions (AS 4055:2010).
According to AS 3623:1993, all external walls are required to resist wind loads normal
to their planes. Internal walls should be designed to resist some lateral loads, to allow,
11
among other things, for the effects of varying air pressure within a building, which can
impose significant loadings during high winds if doors and windows open or break. All
walls can be used to incorporate wall bracing elements to resist horizontal loads in
shear. For the design of the top wall plates, it is usually assumed that the roof/ceiling
system (for single-storey buildings or the upper storey of two-storey buildings) or the
floor/ceiling (for lower storeys) is sufficiently stiff to carry the horizontal wind loads.
The total roof system should perform as a single unit to resist both horizontal and
vertical loads. Roof trusses or rafters are normally used to resist vertical loads.
Horizontal loads are resisted by the roof bracing system (AS 3623:1993).
AS/NZS 4600:2005 provides designers of cold-formed steel structures with
specifications for cold-formed steel structural members used for load-carrying purposes
in buildings and other structures.
In NASH Part 2 (2014), it is stated that plasterboard lining can contribute up to 50% of
the bracing resistance. It also allows for the contribution of 0.75 kN/m for walls lined on
both sides and 0.45 kN/m for walls lined on one side only, which was found on the basis
of testing. This standard is used to provide the building industry with procedures that
can be used to determine, design or check construction details, and to determine
member sizes, and bracing and fixing requirements for steel-framed construction in
cyclonic and non-cyclonic areas.
In accordance with Australian Standard AS 1170.4 (2010), no specific earthquake
design is required for steel-framed houses (BCA Class 1a and 1b structures), subject to
the following conditions:
The hazard factor Z is less than or equal to 0.11 (kP = 1.0 for housing).
The frame has been designed to resist lateral wind forces in accordance with
NASH Standard Part 1.
2.4 Components of Steel-framed Domestic Structures
In Australia, the term “houses” refers to one- and two-storey light-framed structures,
often referred to as domestic structures. There are three major components in steel-
framed domestic structures: floor, walls and roof. Figure 2.3 shows the framing of
typical steel-framed domestic structures.
12
Figure 2.3: Typical framing of steel-framed structures (NASH, 2014) (Figure is omited
from the electronic version of thesis due to copyright issue)
2.4.1 Floor
A floor is a horizontal structural system mainly consisting of joists, girders and
sheathing. In addition to resisting gravity loads, floor systems are designed to: (i) resist
lateral forces consequential from wind and seismic forces and to transfer the loads to
supporting bracing walls through diaphragm action; (ii) avoid excess vibration, noise,
etc. and (iii) function as a thermal barrier (Breyer, 1988). There are generally two types
of floors used in steel-framed houses: slab on ground and suspended floors. The floor is
expected to act as a rigid diaphragm in its own plane. The sub-floor bracing is designed
to transfer the load from the floor diaphragm into the ground (NASH, 2009).
2.4.2 Walls
A wall is a vertical structural system that transfers gravity loads from the roof and floors
to the foundations. Walls also resist lateral loads generated due to wind and earthquakes
(NAHBRC, 2000). Figure 2.4 shows a typical steel-framed wall and its components.
13
Figure 2.4: Typical wall framing system (NASH, 2009) (Figure is omited from the
electronic version of thesis due to copyright issue)
Structural wall sheathing distributes lateral loads to the wall framing and provides
lateral restraint to the wall studs (i.e., buckling resistance). Wall bracing is required for
each storey to transfer the horizontal shear forces due to wind and earthquakes to the
appropriate supports. These forces are vertically additive, i.e. the horizontal shear forces
become larger as they move closer to the foundation (NASH, 2009).
2.4.3 Roof
A roof is normally a sloping structural system that supports gravity and lateral loads and
transfers the loads to the walls. Commonly, roofs are made of trusses, as shown in
Figure 2.5. Members such as battens have an important role in providing lateral restraint
to the top and bottom chords of roof trusses (Saifullah et al. 2012). They also act in
conjunction with the rest of the ceiling system to provide a diaphragm which transfers
horizontal wind loads to the wall bracing system. The roof system should be adequately
anchored to the wall system below to enable this transfer of wind forces and also to
resist wind uplift (NASH, 2009). Depending on the shape of the roof, a variety of
trusses can be used in Australia, as shown in Figure 2.5.
14
Figure 2.5: Typical truss roof system (NASH, 2009) (Figure is omited from the
electronic version of thesis due to copyright issue)
2.5 Behaviour of Light-framed Structures
In steel-framed domestic structures, the roof is considered to be the dominant mass
compared with the walls. Hence, under earthquake loading, the inertia forces generated
at the roof level are transferred to the foundation through the bracing walls (Gad, 1997).
The distribution of wind and earthquake loads from the roof to the walls depends on the

15
behaviour of the roof diaphragm. The lateral load distribution depends on the relative
flexibility of the bracing walls and ceiling/roof diaphragm.
There are several factors which affect the behaviour of ceiling/roof diaphragms. The
diaphragm action of the roof/ceiling system and its interaction and effect on loading the
shear walls in a domestic structure can be considered to fit within two extreme
scenarios: rigid diaphragm/flexible walls and flexible diaphragm/rigid walls (Williams,
1986). Phillips et al. (1993) tested a full-scale single-storey wooden house under both
symmetrical and non-symmetrical lateral loads at several stages of loading to assess the
structural response and load-sharing features. These researchers found that (i) the roof
diaphragm affects the distribution of lateral load to the shear walls of the building and
the roof diaphragm behaves almost like a rigid diaphragm; (ii) load distribution among
the shear walls is a function of wall stiffness and position within the building; and (iii)
the walls transverse to the loading direction carry little portion of the applied lateral
load.
Based on previous experimental and analytical studies, there are several factors which
affect the stiffness and strength of diaphragms. These factors have been collected and
are presented in Figures 2.6 and 2.7. Key factors are also discussed below.
Figure 2.6: Factors affecting strength and stiffness of ceiling diaphragms (Saifullah et
al. 2012)
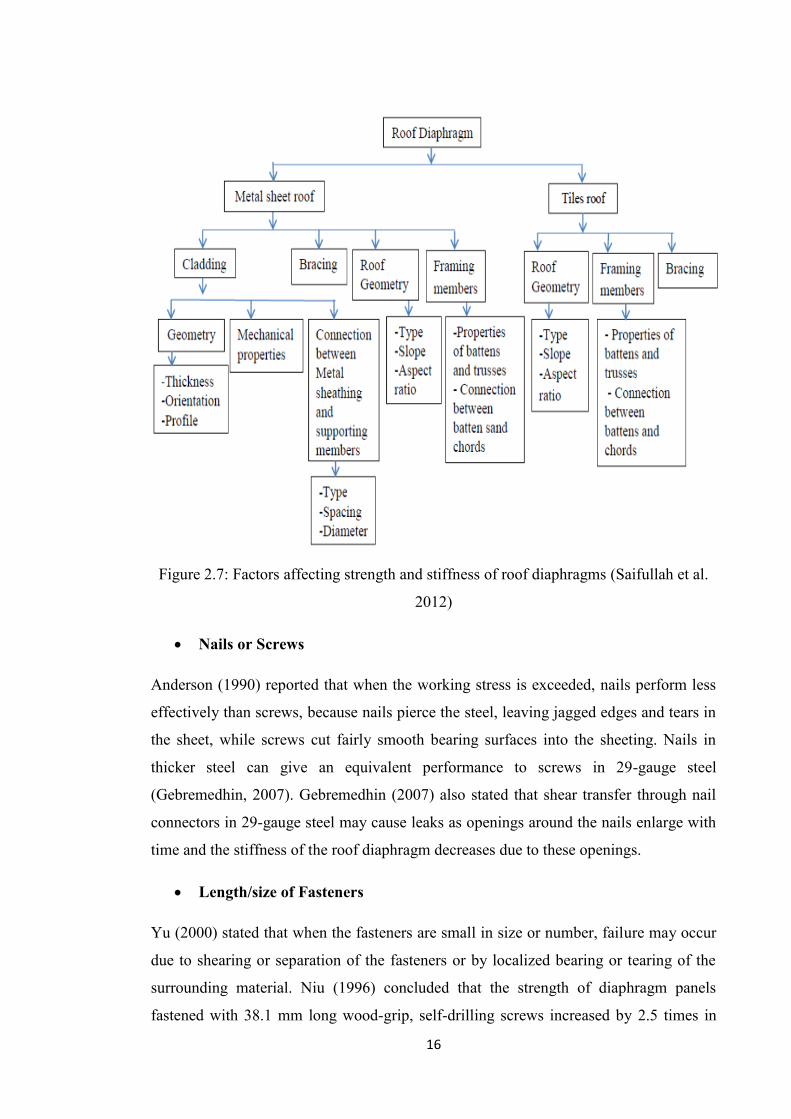
16
Figure 2.7: Factors affecting strength and stiffness of roof diaphragms (Saifullah et al.
2012)
Nails or Screws
Anderson (1990) reported that when the working stress is exceeded, nails perform less
effectively than screws, because nails pierce the steel, leaving jagged edges and tears in
the sheet, while screws cut fairly smooth bearing surfaces into the sheeting. Nails in
thicker steel can give an equivalent performance to screws in 29-gauge steel
(Gebremedhin, 2007). Gebremedhin (2007) also stated that shear transfer through nail
connectors in 29-gauge steel may cause leaks as openings around the nails enlarge with
time and the stiffness of the roof diaphragm decreases due to these openings.
Length/size of Fasteners
Yu (2000) stated that when the fasteners are small in size or number, failure may occur
due to shearing or separation of the fasteners or by localized bearing or tearing of the
surrounding material. Niu (1996) concluded that the strength of diaphragm panels
fastened with 38.1 mm long wood-grip, self-drilling screws increased by 2.5 times in

17
comparison to the strength of a similar diaphragm panel fastened with 25.4 mm long
screws, but found no obvious difference in stiffness. Atherton (1981) performed cyclic
static tests on several ceiling diaphragms (4.9 m x 14.6 m) with waferboard and
particleboard sheathing and found that there is no substantial increase in stiffness or
ultimate load due to increasing the nail size from 8d to 10d.
Position of Fasteners
The shear strength of the connection of the fastener depends on the configuration of the
surrounding metal (Yu, 2000). Hausmann and Esmay (1975) found that the orientation
of screws through the valleys of a metal cladding profile contribute significant stiffness
to the diaphragm, rather than screws through the ribs. Anderson (1990) reported that
when the sheet-to-roof batten fasteners are placed next to the rib, compression buckling
behind the fastener is prevented.
Reardon (1989) stated that when metal sheeting is fastened to the roof and walls of a
post-frame building, large metal-clad wood frame diaphragms are formed, which
increase the rigidity of the building. According to Easley (1977), Luttrell (1991) and
Davies and Bryan (1982), stiffer and stronger diaphragms can be obtained if the
fasteners used to hold the sheeting to the lumber are located in the flats of the sheet
rather than in the ribs.
Sheathings/Claddings
In Australia, generally, the term cladding is used for the exterior, while lining is used to
cover the interior side of the frames. In Australia, plasterboard is normally used for the
interior side. Cladding, sheathing and lining are all terms used to provide enclosure and
possibly lateral bracing to the wall frames. In Australia, plasterboard is used for both
walls and ceilings. Ceiling and wall plasterboards are connected through the ceiling
cornices using glue.
Thickness of Sheathing
The cladding thickness is an important factor in assessing the performance of clad
frames under lateral loading. Miller and Pekoz (1994) reported that a thicker cladding
material increases the failure load per fastener. Increasing the thickness of the cladding
increases the load carrying capacity of the clad frame (Stewart et al, 1988). Atherton
18
(1981) revealed that the strength and stiffness of the diaphragm increases with
increasing the sheathing thickness from 7/16" (11 mm) to 5/8" (16 mm) or increasing
the number of nails.
Boot (2005) found that plywood thickness and nailing schedule along with blocking to a
lesser degree, to be the leading factors in determining the strength and stiffness of the
diaphragm. He also concluded that increased plywood thickness (without using longer
nails) and corner openings reduced strength but had little effect on stiffness, and
openings in the sheathing at normal intervals caused the specimens to be ineffective as
diaphragms.
Yu (2000) stated that when a continuous flat plate is welded directly to the supporting
frame, the failure load is nearly proportional to the material thickness. Nonetheless, in a
formed panel, the shear is transferred from the support beams to the shear-resisting
element through the vertical ribs of the panels, and the shear strength of such a
diaphragm can be increased by increasing of the material thickness, but not linearly.
Test results showed that diaphragms with thicker gauge sheathing provide more strength
and stiffness (Yu, 2000). Phillips et al. (1993) conducted static tests on a full-scale
timber house and found that the stiffness contributions from additional layers of
cladding are additive.
Orientation of Sheathing
Wolfe (1982) conducted experimental tests to determine the influence of the orientation
of gypsum board on timber panels and concluded that there is an average increase in
ultimate strength of 50% and an average increase in stiffness of 43% when panels are
oriented horizontally rather than vertically. Moreover, when the sheets are fixed
horizontally, the joints between the sheets are horizontal, which are easier to construct.
Atherton (1981) found that staggered panel patterns are slightly stiffer than stacked
patterns at ultimate loads, and load cycling has no effect on the ultimate strength of the
diaphragm. The staggered panel pattern layout permits additional contact, which helps
to increase the stiffness of a horizontal diaphragm (Applied Technology Council, 1981;
James and Bryant, 1984).

19
Size of Sheathing
Yu (2000) considered the effect of the sheet width within a panel, and concluded that
wider sheets are generally stronger and stiffer because there are fewer side laps. Yu
(2000) also stated that the height of panel has a considerable effect on the shear strength
of the diaphragm when a continuous flat plate element is not provided. The deeper
profile is more flexible than shallower sections. Therefore, the distortion of the panel,
particularly near the ends, is more prominent for deeper profiles. However, the height of
panels has slight or no effect on the shear strength of the diaphragm panels when a
continuous flat plate is connected to the supporting frame (Yu, 2000).
Aspect Ratio
Gebremedhin (2007) reported that diaphragm panels are strongest at resisting forces in
their longest direction. For wind gusting perpendicular to the long side of a post-frame
building, the largest effective diaphragms are the roof and end walls. When a building
has a small length (length-to-width ratio ≤ 3:1) with no supporting transverse walls
(shear walls), the horizontal wind forces are mostly distributed to the end walls by the
roof diaphragm. On the other hand, when a building is long (length-to-width ratio ≥
3:1), the roof and ceiling diaphragms need the transverse walls to effectively distribute
the in-plane loads (Gebremedhin, 2007).
Luttrell (1988) found that the stiffness of a diaphragm is highly dependent upon the
ceiling length; however, there is no effect on the shear strength. Yu (2000) considered
that shorter span panels provide higher shear strength than longer span panels.
However, test results showed that the failure load is not mainly sensitive to changes in
span (Yu, 2000).
Boot (2005) stated that when the top plate is continuous and sufficiently fastened down,
the outside walls can efficiently stiffen a diaphragm. The primary effect of walls on
diaphragms increased flexural stiffness because of the resistance of the top plate to the
tension forces developed through bending action (Boot, 2005).
Effect of Cornice
The ceiling cornice makes some contribution to load transfer and panel stiffness, as
it binds the wall and the ceiling cladding together (Saifullah et al. 2012). Reardon
20
(1990) conducted full- scale tests on Nu-Steel framed houses in order to observe the
importance of cornices. He recommended that, assuming rigid roof diaphragm action,
the ability of cornices to transfer shear loads from the ceiling diaphragm to the
wall systems becomes crucial. Reardon (1990) also found that when there is a ceiling
only, the addition of the cornice reduces the lateral displacements to about one tenth of
the original values, and the ceiling and cornice are able to provide a very stiff path for
load transfer. The mechanism of load transfer from the ceiling and roof to a wall parallel
to the applied load through the cornice was studied by Golledge et al. (1990) and is
shown in Figure 2.8.
Figure 2.8: Transfer of racking load from ceiling and roof diaphragm to walls via the
cornice (Golledge et al., 1990) (Figure is omited from the electronic version of thesis
due to copyright issue)
Gad (1997) found that the inclusion of set corners changed the force distribution in the
frame and the cladding. Consequently, the failure mode of walls with set corners was
substantially different from that of walls without set corners. For walls without set
corners, failure was due to screws tearing in the plasterboard along the top plate, and
panels with set corners failed due to plasterboard buckling out-of-plane and tearing
around the screws along the bottom plate (Gad, 1997).

21
The ceiling cornice also prevents out-of-plane buckling of wall plasterboard when a
wall with set corners is racked (Saifullah et al. 2012). Golledge et al. (1990) stated that
strengthening the wall plasterboard at the top by the cornice may force the out-of-plane
buckling to occur at the bottom. The skirting-boards may prevent this failure mode as
they strengthen the bottom of the plasterboard.
Fixing System
Walker et al. (1982) stated that systems in which the cladding is directly attached to the
ceiling joists appear to have better structural performance than those which utilize
battens, provided that other factors remain the same. This is more marked with
plasterboard systems than with versilux asbestos cement sheeting. The difference may
be due to the difference in behaviour between the systems, the plasterboard being
representative of systems where plastering along the joints causes the cladding to act as
a single sheet, and the versilux system being representative of systems where each
cladding sheet acts independently (Walker et al, 1982).
Walker and Gonano (1983) reported that the contributing factor to the relatively high
ultimate load capacity is the nogging between battens along the edges of the sheets,
which allows continuous nailing around the full perimeter of each sheet of cladding.
Nogging between the battens along the edges of the cladding and then fastening around
the full perimeter of each sheet can more than double the ultimate load capacity in the
case of ceilings clad with individually acting sheets. Due to the connection system
between the steel battens and the ceiling joists, the ultimate strength and stiffness is
increased (Walker and Gonano, 1981).
Boot (2005) found that foam adhesive and blocking is the most effective combination of
parameters to increase the shear stiffness and cyclic stiffness. Boot (2005) also reported
that the shear stiffness can be increased by construction techniques that serve to better
“interlock” sheathing panels into one large sheathing system against horizontal shear.
Since the overall diaphragm stiffness is typically related to shear stiffness, shear
stiffness increases will generally cause similar increases in overall diaphragm stiffness
(Boot, 2005).
Walker and Gonano (1983) reported that the influence of the adhesive is small due to
the adhesive joint failing at a relatively low load (due to the weakness of the paper

22
surface of the plasterboard). The presence of effective chord members causes a
significant increase in flexural stiffness. Proper splicing and sufficient fastening of the
overhanging edge of sheathing is significant to the performance of diaphragms (Boot,
2005).
Trusses and Roof Battens
White et al. (1977) concluded that diaphragm strength and stiffness are not affected by
the truss spacing within typical construction ranges if the roof batten details are not
changed. They also concluded that if intermediate stitch connectors are used, strength
and stiffness are not affected by the roof batten spacing (within typical ranges).
Anderson (1987) stated that panels with recessed roof battens decrease the stiffness of
the panel, and there is a reduction in the stiffness if roof battens are placed on edge
rather than flat. Moreover, placing roof battens flat is geometrically more stable than
placing them on edge. This type of construction decreases eccentricity between the
sheet and the rafter and, therefore, decreases the potential for twisting of roof battens
(Gebremedhin, 2007). Yu (2000) found that with decreasing roof batten spacing, the
shear strength of panels is increased, and the effect is more noticeable in thinner panels.
Boot (2005) established that there is little impact of spacing of roof battens on the
strength and stiffness of diaphragms. Boot (2005) stated that when roof trusses are used
in light-frame structures, the bottom chord of the roof truss serves as the frame member
of the ceiling diaphragm.
2.6 Diaphragm Analysis
Diaphragms can be used as elements of the structural system in order to resist lateral
loads generated due to wind and earthquake loads. For design purposes, wind loads are
considered as acting perpendicular to the surfaces under consideration. Since the present
research is mainly concerned with the design of plasterboard-sheathed steel-framed
diaphragms acting to resist lateral loads, only the horizontal components of the wind
loads acting on the building surfaces are considered. The configuration of the wind
loads acting on building surfaces is presented in Figure 2.9.
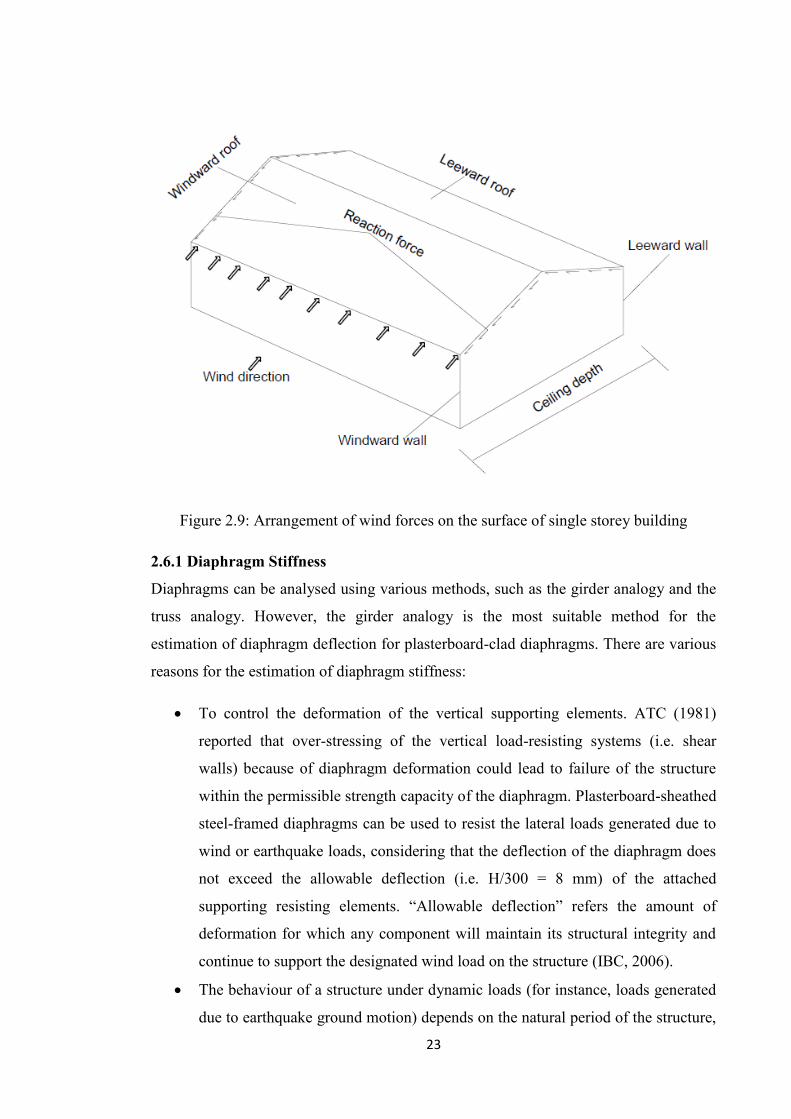
23
Figure 2.9: Arrangement of wind forces on the surface of single storey building
2.6.1 Diaphragm Stiffness
Diaphragms can be analysed using various methods, such as the girder analogy and the
truss analogy. However, the girder analogy is the most suitable method for the
estimation of diaphragm deflection for plasterboard-clad diaphragms. There are various
reasons for the estimation of diaphragm stiffness:
To control the deformation of the vertical supporting elements. ATC (1981)
reported that over-stressing of the vertical load-resisting systems (i.e. shear
walls) because of diaphragm deformation could lead to failure of the structure
within the permissible strength capacity of the diaphragm. Plasterboard-sheathed
steel-framed diaphragms can be used to resist the lateral loads generated due to
wind or earthquake loads, considering that the deflection of the diaphragm does
not exceed the allowable deflection (i.e. H/300 = 8 mm) of the attached
supporting resisting elements. “Allowable deflection” refers the amount of
deformation for which any component will maintain its structural integrity and
continue to support the designated wind load on the structure (IBC, 2006).
The behaviour of a structure under dynamic loads (for instance, loads generated
due to earthquake ground motion) depends on the natural period of the structure,
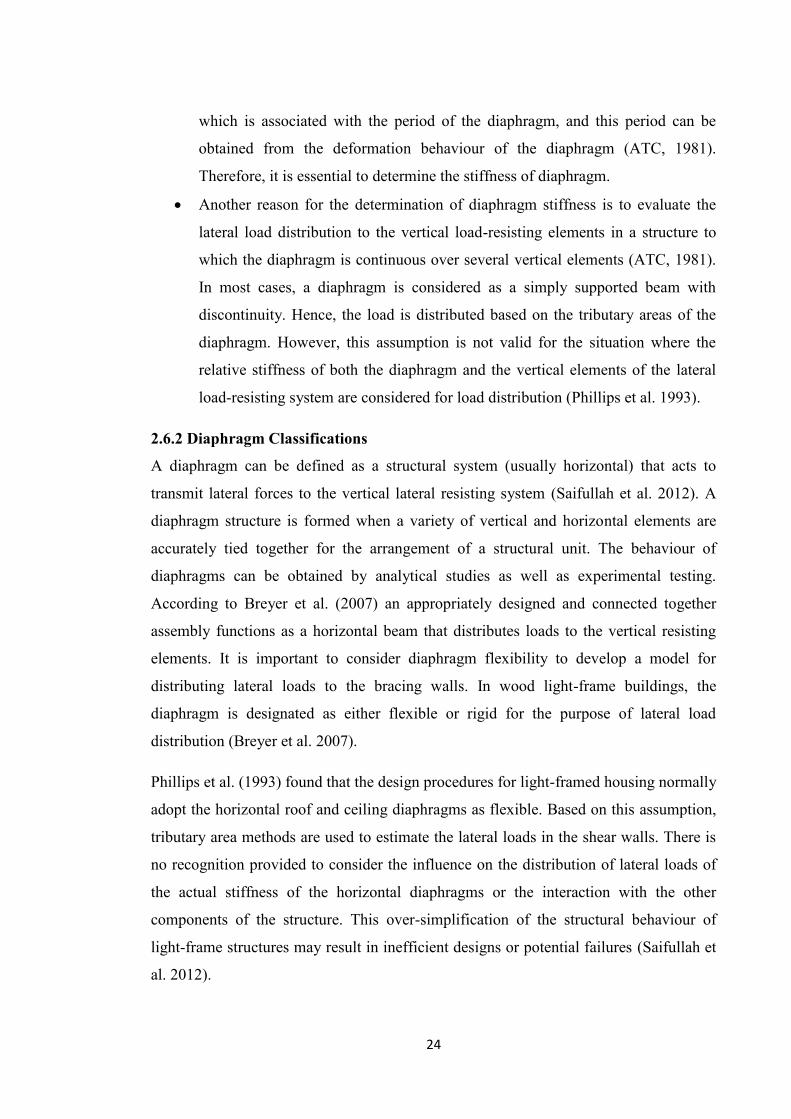
24
which is associated with the period of the diaphragm, and this period can be
obtained from the deformation behaviour of the diaphragm (ATC, 1981).
Therefore, it is essential to determine the stiffness of diaphragm.
Another reason for the determination of diaphragm stiffness is to evaluate the
lateral load distribution to the vertical load-resisting elements in a structure to
which the diaphragm is continuous over several vertical elements (ATC, 1981).
In most cases, a diaphragm is considered as a simply supported beam with
discontinuity. Hence, the load is distributed based on the tributary areas of the
diaphragm. However, this assumption is not valid for the situation where the
relative stiffness of both the diaphragm and the vertical elements of the lateral
load-resisting system are considered for load distribution (Phillips et al. 1993).
2.6.2 Diaphragm Classifications
A diaphragm can be defined as a structural system (usually horizontal) that acts to
transmit lateral forces to the vertical lateral resisting system (Saifullah et al. 2012). A
diaphragm structure is formed when a variety of vertical and horizontal elements are
accurately tied together for the arrangement of a structural unit. The behaviour of
diaphragms can be obtained by analytical studies as well as experimental testing.
According to Breyer et al. (2007) an appropriately designed and connected together
assembly functions as a horizontal beam that distributes loads to the vertical resisting
elements. It is important to consider diaphragm flexibility to develop a model for
distributing lateral loads to the bracing walls. In wood light-frame buildings, the
diaphragm is designated as either flexible or rigid for the purpose of lateral load
distribution (Breyer et al. 2007).
Phillips et al. (1993) found that the design procedures for light-framed housing normally
adopt the horizontal roof and ceiling diaphragms as flexible. Based on this assumption,
tributary area methods are used to estimate the lateral loads in the shear walls. There is
no recognition provided to consider the influence on the distribution of lateral loads of
the actual stiffness of the horizontal diaphragms or the interaction with the other
components of the structure. This over-simplification of the structural behaviour of
light-frame structures may result in inefficient designs or potential failures (Saifullah et
al. 2012).

25
It should be mentioned that in single-storey steel-framed domestic structures, there may
be up to two diaphragms. The first may be the roof diaphragm if it is metal-clad (e.g.
with colorbond) and the second is the ceiling diaphragm, if it is made of plasterboard
lining with positive fixing to the roof trusses.
Diaphragms can be classified as "rigid", "flexible", and "semi-rigid", based on the
relative rigidity between the diaphragm and bracing walls. According to IBC (2006), a
diaphragm is considered “rigid” when the lateral deformation of the diaphragm is less
than two times the average storey drift. The diaphragm is considered flexible if the
diaphragm deflection is greater than two times the average storey drift, as shown in
Figure 2.10. A diaphragm is considered semi-rigid when the diaphragm deflection and
the deflection of the vertical lateral load resisting elements are of the same order of
magnitude. The deflection in the plane of the diaphragm should not exceed the
allowable deflection of the supporting attached components.
Figure 2.10: Determination of diaphragm flexibility (Florida Building Code
Commentary, 2007) (Figure is omited from the electronic version of thesis due to
copyright issue)
Generally, if the vertical lateral resisting system comprises of light-framed members, it
can generate a rigid diaphragm on flexible supports. In the case of a rigid diaphragm,
the ceiling and/roof acts as a rigid beam spanning between the walls and results in equal
racking displacements in each of the walls (assuming no torsion). When the diaphragm

26
is rigid, the lateral load is distributed to the vertical resisting elements on the basis of the
relative stiffness of these vertical elements. If the walls have different racking stiffness,
the stiffer walls will carry more load than the more flexible walls. On the other hand, in
the case of flexible diaphragms, the lateral loads are distributed to the bracing walls
according to tributary areas, resulting in different racking deflections in walls of
different stiffness. Figure 2.11 illustrates these two cases. When there is irregular
stiffness and distribution at any level within the structure, torsional forces are developed
and this needs to be considered in the design of the structure. Torsional forces can also
be generated due to the arrangement of the vertical resisting system and can be
transferred through a rigid diaphragm. Furthermore, the additional loads on the vertical
resisting elements should be appropriately accounted for in the design of diaphragms
(ATC, 1981).
Figure 2.11: Schematic representation of rigid and flexible diaphragm (Saifullah et al.
2012)
The relative rigidities of the vertical and horizontal lateral load-resisting systems can
vary significantly. The diaphragm action of the roof/ceiling system and its interaction
and effect on loading of the bracing walls in a domestic structure can be considered to
fit within two extreme scenarios: a flexible diaphragm with infinite stiff vertical shear-
resisting elements, and flexible vertical elements with infinite rigid diaphragms. It
should be mentioned that both of these two extreme scenarios occur in most structures,
as presented in Figure 2.12 and the relative rigidities of the several components mainly
govern the lateral load distribution.
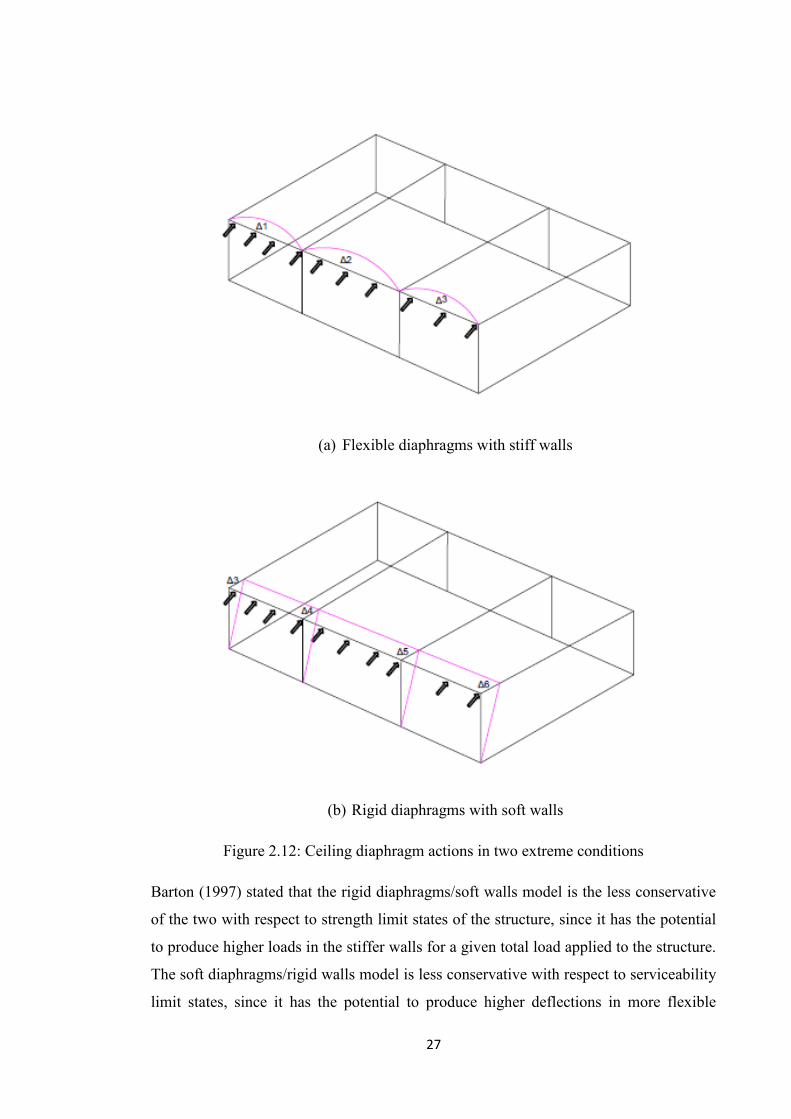
27
(a) Flexible diaphragms with stiff walls
(b) Rigid diaphragms with soft walls
Figure 2.12: Ceiling diaphragm actions in two extreme conditions
Barton (1997) stated that the rigid diaphragms/soft walls model is the less conservative
of the two with respect to strength limit states of the structure, since it has the potential
to produce higher loads in the stiffer walls for a given total load applied to the structure.
The soft diaphragms/rigid walls model is less conservative with respect to serviceability
limit states, since it has the potential to produce higher deflections in more flexible

28
walls for a given total load applied to the structure. Breyer et al. (2007) considered
timber roof diaphragms as flexible, while Paevere et al. (2003) stated that the roof and
ceiling diaphragm behave as a rigid diaphragm. Reardon (1990) tested a cold-formed
steel-framed house under simulated wind loads and concluded that both roofing and
ceiling acted as stiff diaphragms.
It should be noted that the relative stiffness between the diaphragm and walls is unlikely
to remain constant under loading. As lateral loads are imposed, the initial stiffness of
walls (including contributions from non-structural walls) may be quite high and then the
diaphragm could be considered flexible. As the lateral loads increase (particularly
beyond serviceability), the walls soften and the diaphragm may be considered rigid
compared to the walls. Foliente (1995a), Wang and Foliente (2006) also revealed that
the stiffness of light wood-framed shear walls degrades fairly quickly. In other words,
the stiffness of shear walls deviates from linearity soon after experiencing moderate
lateral displacements.
2.6.3 Continuous Diaphragms
The lateral load distribution to the vertical lateral resisting elements and the extent of
diaphragm continuity that generally exists in the analogous girder are subject to several
interpretations. It should be noted that when the diaphragm flanges are continuous, the
web should also be considered continuous and the diaphragm need to consider to some
extent of continuity. ATC (1981) reported that the web can be considered as continuous
even though the plasterboard sheathing is interrupted due to the vertical lateral resisting
elements (i.e. shear walls) where the diaphragm sheathing is connected to the vertical
elements in order to transfer the lateral loads to the element. The diaphragm sheathing is
connected on both sides of the vertical elements where fire-separation walls are used in
multi-storey structures or carried via the roof (ATC, 1981).
The girder analogy used for the estimation of diaphragm deflection is appropriate for
the determination of the lateral load distribution to the bracing walls. The diaphragm,
which acts as a continuous girder or beam supported on four walls, transfers some
portion of lateral load to each end wall and a significant portion of load to the middle
wall, where significant bending deformation is expected, as shown in Figure 2.13. The
distribution system is appropriate for simple supports where the shear deformation
predominates. However, it is conventional to design diaphragms for shear at the ends as

29
estimated for simple beams and shear at the centre as determined for full continuity of
the diaphragm (ATC, 1981). The comparison of wall stiffness with diaphragm stiffness
ensures the reasonability of the rigid supports.
It should be noted that structures with irregular configurations can result in continuous
diaphragms with different stiffness in the numerous portions of the diaphragms. When
the reactions of the walls are considered rigid, the lateral loads are distributed generally
parallel to that diaphragm with varying stiffness. Figure 2.13 illustrates the
configurations of continuous diaphragms. ATC (1981) reported that when the offsets of
the shear walls are extreme in structures, the continuity of the diaphragm is lost and in
that situation, simple beam distribution of loads should be executed. However, in order
to provide continuity in this irregular configuration, it is essential to extend the flanges
of the diaphragm at offsets into the nearby elements beyond the support (ATC, 1981).
Figure 2.13: Configurations of simplified continuous diaphragms
As the stiffness of plasterboard-sheathed steel-framed diaphragms is considerably
dependent on shear, the relative stiffness of diaphragm portions is closely associated
with the segment widths and very little affected due to the moment of inertia of the
flanges. A demanding analysis could use the ratio of inverse of deflections determined
using equal loads to assign the relative stiffness of several segments of the diaphragm

30
(ATC, 1981). It should be noted that the relative stiffness of the segments is normally
allocated according to their relative widths.
2.7 Bracing System of Diaphragm
NASH (2009) stated that bracing is provided primarily to enable the roof, wall and floor
systems to resist the wind and earthquake loads applied to the building. To transfer
these forces into the building’s foundations, the connections between systems must be
adequate. Horizontal wind forces on the external surfaces are transferred by horizontal
or near-horizontal diaphragms and bracing. Horizontal diaphragms transfer racking
forces to lower level diaphragms via the connections and vertical bracing (NASH,
2009).
There are different types of bracing, including wall bracing, roof bracing, floor and sub-
floor bracing. Figure 2.14 shows the various bracing systems of a steel-framed house.
Figure 2.14: Various bracing systems (NASH, 2009) (Figure is omited from the
electronic version of thesis due to copyright issue)
2.7.1 Roof Bracing
NASH (2009) reported that roof bracing is important to ensure that the roof performs as
an integral unit and transmits the imposed loads to the supports. Bracing should be
31
provided at the top and bottom chords of roof trusses. Top chord bracing is necessary to
transfer horizontal wind loads to the supports where load is perpendicular to the span of
trusses. Wind and earthquake loads are transferred to the top chords by the roof battens.
Bottom chord bracing is used to provide restraint to the bottom chords of trusses when
they are in compression due to wind uplift or bending. In addition to supporting roof
cladding and transferring longitudinal wind loads, roof battens are designed to provide
lateral buckling restraint to the top chords of the roof trusses (NASH, 2009). NASH
(2009) also reported that a hip roof structure provides significant permanent bracing
capacity; and continuous ceiling systems with lining, such as correctly fixed
plasterboard, can be assumed to act as diaphragms.
2.7.2 Wall Bracing
Wall bracing is necessary for every storey to transmit the horizontal shear forces
developed due to wind and earthquakes to the supports. There are different types of wall
bracing systems, such as K bracing, cross bracing, sheet bracing, and portal frame
action.
According to NASH (2009), the capacity of sheet bracing is dependent on various
factors: (i) the type and thickness of the sheeting material; (ii) the type and number of
connectors used to fix the sheet to supporting members; and (iii) the location of the
connectors (e.g. edge connectors are more effective than those along intermediate
studs). Adham et al. (1990) studied the influence of cross-sectional area of strap braces
on the lateral performance of clad frames, and concluded that the lateral load-carrying
capacity and stiffness increased as the strap size increased, and the load-carrying
capacity increased by a similar ratio to the increase in the strap brace cross-sectional
area.
2.7.3 Floor and Subfloor Bracing
Roof and wall bracing systems are designed to transfer wind and earthquake loads to the
footings. The floor is expected to act as a rigid diaphragm in its own plane. The subfloor
bracing is designed to transfer the load from the floor diaphragm into the ground. Steel
posts placed into concrete footings can be used to transfer the racking forces to the
foundations. Where the column capacity is not adequate to resist the lateral load,
additional bracing or cross bracing may be considered. Unreinforced masonry walls
may be used to transfer racking forces in the subfloor region (NASH, 2009).

32
2.7.4 Combination of Bracing Systems
When different bracing systems are combined and the diaphragm is assumed to be rigid,
it is crucial to observe if their contributions are additive. There are several methods for
determining the distribution of lateral load to the bracing walls, including the tributary
area method, the simple beam method, the relative stiffness method, the total shear
method, and the plate elements method. Details of all of these methods are presented in
Section 2.8. NASH (2009) stated that for the total shear method, all elements should
have compatible deformation capacity or sufficient ductility. The NASH (2009)
illustration of this is shown in Figure 2.15, which indicates the racking load versus
deflection relationships for three different types of wall bracing systems. In this figure,
Fx, Fy and Fz are the ultimate capacities of bracing types X, Y and Z, respectively. If
the roof and/or ceiling diaphragms are assumed to be rigid, the ultimate capacities (Fx,
Fy and Fz) cannot be cumulative, as bracing type X achieves its ultimate capacity at a
deflection value (Δ1) below that of types Y and Z. Similarly, for bracing types Y and Z,
the ultimate capacities are only cumulative if the building is designed or assessed at
deflection Δ2. However, at higher levels of deflection, for example Δ3, the contribution
of bracing type Y is limited, and the ultimate capacities (Fy and Fz) are not cumulative.
Figure 2.15: Illustration of the importance of deformation compatibility or ductility in
assessing the cumulative effects of different bracing types (NASH, 2009)
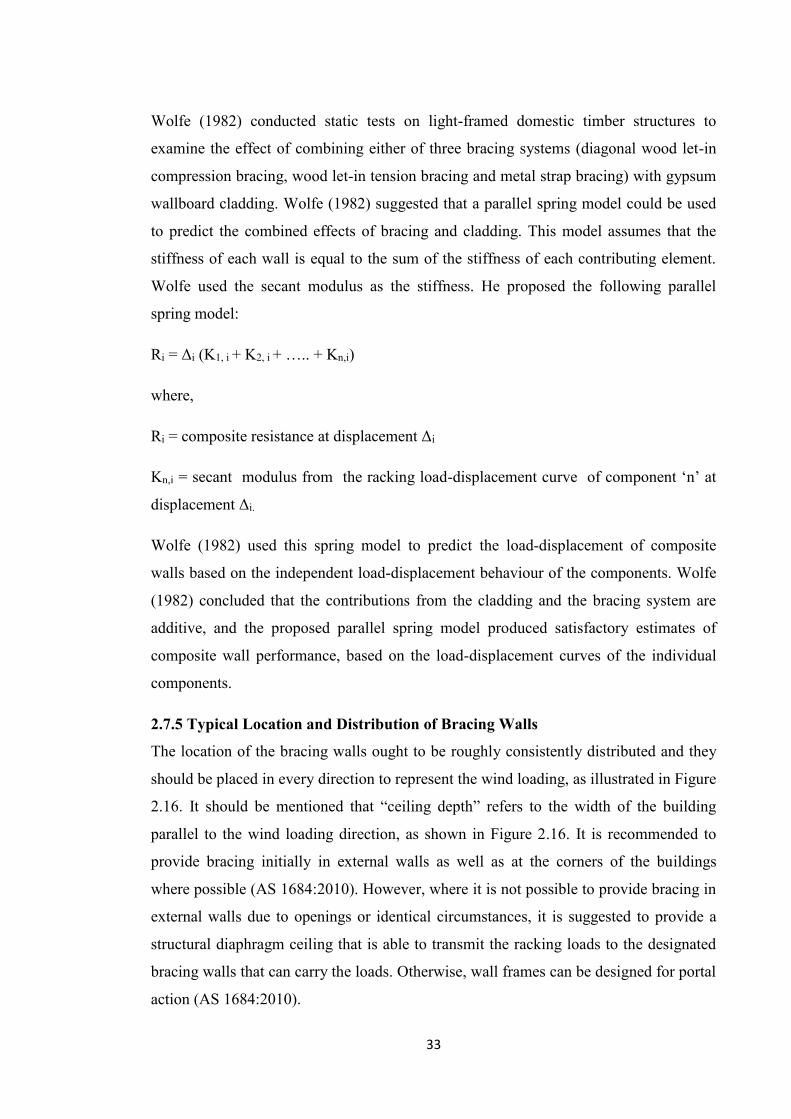
33
Wolfe (1982) conducted static tests on light-framed domestic timber structures to
examine the effect of combining either of three bracing systems (diagonal wood let-in
compression bracing, wood let-in tension bracing and metal strap bracing) with gypsum
wallboard cladding. Wolfe (1982) suggested that a parallel spring model could be used
to predict the combined effects of bracing and cladding. This model assumes that the
stiffness of each wall is equal to the sum of the stiffness of each contributing element.
Wolfe used the secant modulus as the stiffness. He proposed the following parallel
spring model:
Ri = Δi (K1, i + K2, i + ….. + Kn,i)
where,
Ri = composite resistance at displacement Δi
Kn,i = secant modulus from the racking load-displacement curve of component ‘n’ at
displacement Δi.
Wolfe (1982) used this spring model to predict the load-displacement of composite
walls based on the independent load-displacement behaviour of the components. Wolfe
(1982) concluded that the contributions from the cladding and the bracing system are
additive, and the proposed parallel spring model produced satisfactory estimates of
composite wall performance, based on the load-displacement curves of the individual
components.
2.7.5 Typical Location and Distribution of Bracing Walls
The location of the bracing walls ought to be roughly consistently distributed and they
should be placed in every direction to represent the wind loading, as illustrated in Figure
2.16. It should be mentioned that “ceiling depth” refers to the width of the building
parallel to the wind loading direction, as shown in Figure 2.16. It is recommended to
provide bracing initially in external walls as well as at the corners of the buildings
where possible (AS 1684:2010). However, where it is not possible to provide bracing in
external walls due to openings or identical circumstances, it is suggested to provide a
structural diaphragm ceiling that is able to transmit the racking loads to the designated
bracing walls that can carry the loads. Otherwise, wall frames can be designed for portal
action (AS 1684:2010).
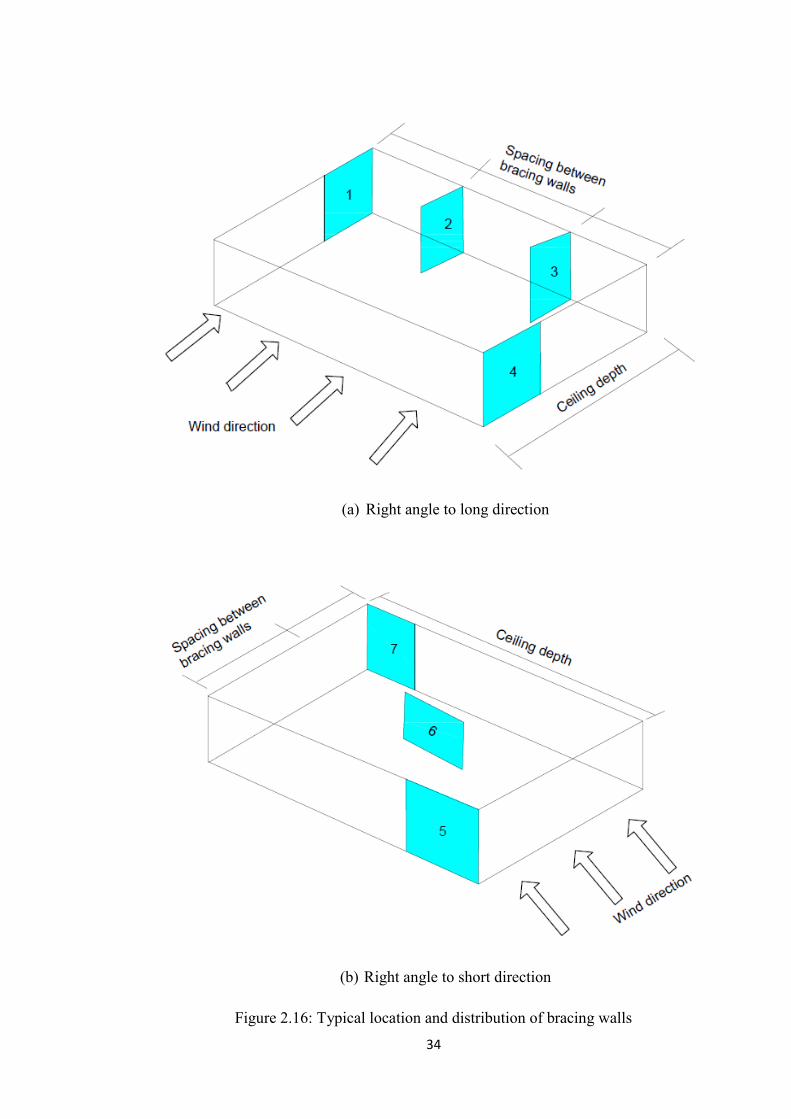
34
(a) Right angle to long direction
(b) Right angle to short direction
Figure 2.16: Typical location and distribution of bracing walls
35
2.8 Lateral Force Distribution Methods for Light-framed Structures
The lateral loads generated due to extreme wind or earthquakes on the whole structure
are distributed to the lateral force-resisting system of the structure. In order to design
light-frame structures for wind and earthquake loads, it is necessary to design lateral
load-resisting elements, such as a combination of bracing walls and diaphragms and
their connections, to transfer the loads to the building’s foundations. Light-frame
structures can be defined as an assembly of numerous components or sub-assemblies
with monotonous members (for instance, walls, floors and roof systems) connected by
inter-component connections such as bolts, metal straps or exclusive connectors,
making a three-dimensional extremely indeterminate structural system (Kasal et al.,
2004). Therefore, the design of individual sub-systems and components is greatly
dependent on the precision and trustworthiness of the methods used to distribute
structural loads to the several components of the structure.
According to Kasal et al. (2004), if the load sharing and distribution is not done
properly, it will result in either over-conservative (i.e. uneconomical) or under-
conservative (less safe) structures. Hence, if the load distribution is not anticipated
appropriately, it is possible to have an ‘‘engineered’’ structure that is potentially less
safe than the one that has not been ‘engineered’ (Paevere, 2001), or in other words, it
can be stated that an engineered structure can produce a false sense of confidence of
safety and performance (Kasal et al., 2004). It should be mentioned that UBC (1997)
classified structures into two categories such as (i) engineered structures which include
light-frame structures of unusual size, shape or split level, and (ii) non-engineered or
conventional structures that include structures of one-, two- or three stories, single-
family houses’ apartments. Non-engineered structures are constructed using the
“general construction requirements” as well as the “conventional construction
requirements’’ (NAHBRC, 2000). Cobeen (1997) and Foliente (1998) mentioned that if
performance-based methods are to be successfully applied in the design and assessment
of light-frame structures, more accurate and reliable lateral load distribution methods
need to be developed, based on a detailed understanding of the structural behaviour.
Kasal et al. (2004) describes various lateral load distribution methods, as presented in
Figure 2.17.
36
Figure 2.17: Plan view of various load distribution methods (Kasal et. al. 2004) (Figure
is omited from the electronic version of thesis due to copyright issue)
2.8.1 Tributary Area Method
The tributary area method is probably the most widespread approach used to distribute
lateral loads to shear walls. The wind or earthquake loads on various components of the
lateral load-resisting system are distributed based on the tributary areas of the geometry
of the structures. In this method, it is assumed that a horizontal diaphragm is considered
flexible (i.e. comparatively flexible with respect to the shear walls) and it distributes
lateral loads based on the tributary areas rather than the stiffness of the supporting
bracing walls, as illustrated in Figure 2.17(a). When the diaphragm is considered as
considerably rigid compared to the shear walls, and the shear walls have approximately
equal stiffness, the reactions of the shear walls will be roughly equivalent. If this
hypothesis is correct, the interior and exterior shear wall would be over-designed and
under-designed respectively using the tributary area method (NAHBRC 2000).
According to the NAHBRC (2000), diaphragm flexibility mainly depends on its
construction system and its aspect ratio (span-width ratio). Long-narrow diaphragms
37
exhibit more flexibility than short-wide diaphragms in bending along their long
dimension i.e. rectangular diaphragms are comparatively stiffer in one loading direction
while reasonably flexible in the other. Likewise, longer shear walls with few openings
are stiffer than narrow shear wall portions (Kasal et al. 2004).
Kasal et al. (2004) reported that in seismic design, tributary areas are related to uniform
area weights (i.e., dead loads) allocated to the structure systems (i.e., roof, walls, and
floors) that produce the inertial seismic load during lateral ground motion of the
structure. In contrast, in wind design, the lateral component of the wind load acting on
the exterior surfaces of the structure is considered as a tributary area.
According to Kasal et al. (2004), the tributary area method can be presented as a series
of flexible beams on rigid supports. Kasal and Leichti (1992) found that this method
can provide erroneous results for particular plan arrangements and can deliver both
conservative and non-conservative results. Kasal and Leichti (1992) also determined
that, if the structure is considered as a flexible beam on rigid supports, the forces in the
shear wall may be over-predicted by 130% or under-predicted by 60% using the
tributary area method. The tributary area method is appropriate in situations where the
layout of the shear walls is normally symmetrical in terms of spacing and they have
similar strength and stiffness characteristics. The main advantages of the tributary area
method compared to other methods are its ease and applicability to simple structural
arrangements (NAHBRC, 2000).
Phillips et al. (1993) stated that no load sharing between the shear walls is considered in
a flexible diaphragm. Hence, the lateral load distributions to every shear wall are
calculated based on their tributary areas. Phillips et al. (1993) also revealed that when a
structure is non-symmetrical and possesses variances in stiffness between nearby shear
walls, the tributary areas method is not appropriate. This is because the ceiling/roof
diaphragm will distribute a significant portion of the applied load to the stiffer walls of
the structure. In the case of a rigid diaphragm, the lateral load distribution is estimated
based on the relative stiffness of the shear walls (Phillips et al. 1993).
2.8.2 Simple and/or Continuous Beam Methods
The simple and/or continuous beam methods are a subgroup of the tributary area
method. In defining the lateral load distribution to the shear walls, the roof
38
configuration is not considered in both the simple and continuous beam methods, while
the arrangement of the roof and the wall elevations are considered in the tributary area
method. According to Kasal et al. (2004), the simple beam method (Figure 2.17(c))
represents the structure as a consideration of a sequence of simple beams loaded by
means of uniformly distributed load which is equivalent to the total wind load divided
by the length of the structure. In contrast, the continuous beam method (shown in Figure
2.17(e)) models the structure as a beam continuous over several simple supports with a
uniform distribution load that is equivalent to the total wind load divided by the length
of the structure. The continuous beam method can be analysed using analysis method
including the moment distribution method, the slope deflection method, the force
method, and the stiffness method.
2.8.3 Total Shear Method
This method is the second most common and easiest method. The method indicates that
the total shear resistance in all the shear walls needs to add up to the total applied shear
(Kasal et al. 2004). In the total shear method (as shown in Figure 2.17g), the total storey
shear developed on a specified floor level is distributed in every orthogonal direction of
loading. The amount of shear wall is then distributed consistently in the level based on
the designer’s judgment. In order to avoid inequalities of possible loading or stiffness,
the total shear method provides worthy judgment to the distribution of the shear wall
(NAHBRC, 2000).
NAHBRC (2000) stated that in seismic design, loading discrepancies can be produced if
the mass distribution of the building is not uniform, and in the case of wind design,
loading discrepancies occur if the building’s surface area is not uniform (i.e., taller walls
or steeper roof sections provide larger lateral wind loads). In both conditions,
discrepancies are generated if the centre of resistance does not coincide either with the
centre of mass (seismic design) or the resultant force centre of the exterior surface
pressures (wind design). Kasal et al. (2004) stated that the shear forces are distributed
consistently to the lateral resisting shear walls according to their stiffness or location.
After all, the accuracy of this method is dependent on the designer’s judgement;
otherwise, the method would provide poor results under severe seismic or wind events.
This method takes into account neither the distribution of wind load to each bracing
wall nor the deflection check of bracing walls. These shortcomings are taken into
39
account in other methods, such as the deep beam method, the relative stiffness method
and the plate method, which are described below.
2.8.4 Relative Stiffness Method without Torsion
This method is the contrary of the tributary area method. In this method, it is assumed
that the horizontal diaphragm is stiff compared to the shear walls, and the lateral loads
on the structure are distributed to the shear walls based on their relative stiffness (refer
to Figure 2.17.b). Several methods are available for the estimation of wall stiffness,
such as the perforated shear wall method and the segmented shear wall method. The
stiff diaphragm rotates to some extent to distribute lateral loads to all shear walls of the
structure, but not only to shear walls parallel to an expected loading direction
(NAHBRC, 2000). Therefore, the relative stiffness method considers torsional load
distribution and direct shear load distribution.
Klingner (2010) stated that plan torsion can be ignored when the structure has a
reasonable plan length of walls in every major plan direction. This method provides
reasonably precise results with less effort, and is therefore relatively cost-effective for
design. Although the method is conceptually precise and relatively more difficult than
the tributary area and total shear methods, its limitations in terms of reasonably defining
the actual stiffness of shear walls and diaphragms means that its relevance to real
structural behaviour is uncertain (NAHBRC 2000).
It is recommended that the eccentricity between the centre of mass and centre of rigidity
should be taken into account when assessing the forces acting in the various elements of
the lateral load-resisting system of structures. Nowadays, the inelastic torsional
response of building structures can be examined using a static three-dimensional push-
over analysis. However, the point of application of the lateral load is assumed to be
located at the centre of mass, which may not be representative of the conditions under
dynamic loading (Tremblay et al. 2000).
2.8.5 Rigid Beam on Elastic Foundation/ Relative Stiffness with Torsion
This method is similar to the relative stiffness method, with the consideration of
torsional effects. Kasal et al. (2004) stated that in this method, the structure is
characterized by a rigid beam on elastic foundations. In a linear elastic foundation, the
displacement is a linear function of the applied load. In this method, the shear walls can

40
be denoted by linear springs subjected to smaller amount loads and their corresponding
response. NAHBRC (2000) reported that the relative stiffness method is the only
available preference when it is necessary to consider the torsional load distribution to
exhibit the lateral stability of an unevenly braced structure or to fulfil the building code
requirements. The structure is efficiently represented as a rigid beam on linear springs
where the rotation of the structure is considered, as presented in Figure 2.17(d).
However, this method is not appropriate where strong nonlinear behaviour of the system
is expected to occur, for instance, the building may be loaded well beyond its elastic
limit under earthquake loading (Kasal et al. 2004).
Klingner (2010) stated that a torsional moment is produced when the centre of gravity
of the lateral loads does not coincide with the centre of rigidity of the lateral load-
resisting elements, providing the diaphragm is adequately rigid to transfer torsion.
When the structure’s centre of gravity and the centre of rigidity of the shear walls do not
coincide, a torsional component of shear will occur in addition to the direct shear force
(Phillips et. al 1993). The magnitude of the torsional moment generated that must be
distributed to the lateral load-resisting elements through a diaphragm is determined by
the sum of the moments produced due to the physical eccentricity of the translational
loads at the level of the diaphragm from the centre of rigidity of the resisting elements.
The torsional distribution through rigid diaphragms to the lateral load-resisting elements
is assigned in proportion to the stiffness of the walls and the distance from the centre of
rigidity. However, flexible diaphragms should not be used for torsional distribution
(Klingner, 2010).
NAHBRC (2000) reported that the torsional discrepancies in any structure may be
responsible for the comparatively better performance of particular light-framed
structures when one side is weaker (i.e. lower stiffness and lower strength) compared to
the other three sides of the structure. This situation normally occurs because of the
aesthetic aspiration and functional necessity for additional openings on the front of a
structure. Nevertheless, a torsional behaviour in under-design (i.e. “weak” or “soft”
storey) may cause devastation to a structure and create a severe risk to life (NAHBRC,
2000).
41
2.8.6 Plate Method
In this method, plate elements are used to model the diaphragm for distributing wind
load to the bracing walls. The plate method may be used for multi-storey structure
analysis and stochastic analysis, due to its simplicity. Kasal et al. (2004) stated that in
plate method, the structure can be modelled as a simplified two- or three-dimensional
structure that can capture the contribution of transverse wall stiffness in order to observe
the complete behaviour of the structure (refer to Figure 2.17(h)).
In the plate model, the plate represents the diaphragm, and the spring represents the
shear walls. It should be mentioned that the stiffness of the shear walls can be
represented by either linear or nonlinear springs. Generally, the stiffness in the plate
model is governed by the plate thickness and material properties (Kasal et. al. 2004).
Therefore, estimation of the load-deflection behaviour of the springs which represent
shear walls and plate stiffness (i.e., the diaphragm stiffness), and the location of the
vertical mass centre that expresses the floor elevations are essential in the plate method
analysis.
2.8.7 Finite Element Method
Kasal et al. (2004) reported that finite element modelling can capture the behaviour of a
whole structure according to the properties of materials as well as connections in the
structure (see Figure 2.17.i). This method can be used to observe the behaviour of steel-
framed structures under both static and dynamic loads. Finite element modelling can
also be used to conduct sensitivity analysis, and to produce inputs for further simpler
models. According to Klingner (2010), most computer programs developed for the
analysis of structures assume that floor diaphragms are rigid in their own planes. Every
floor level has three horizontal degrees of freedom (two horizontal displacements and
rotation about a vertical axis). This method (while rational for frame structures whose
floors are rigid in their own planes compared to the vertical frames), is not accurate for
wall structures whose horizontal diaphragms are usually almost as rigid as their vertical
walls (Klingner, 2010).
2.9 Performance of Light-framed Structures under Lateral Loads
Kasal and Leichti (1992) stated that the capability of a light frame structure to resist
wind loads mainly depends on the diaphragm’s shear strength. They also stated that the
proportion of transfer of the load is a function of the building geometry, wall stiffness
42
and the inter-component connections. The shear force transferred via each wall can be
calculated based on a series of simple beam analyses. A method that incorporates wall
stiffness for the distribution of the reaction forces is required (Kasal et. al. 1992).
Kasal et al. (1994) studied a three-dimensional nonlinear finite element model of a light-
frame wood building in order to determine the internal forces due to wind pressure in
shear walls. They compared the results with existing design procedures and found that
approximately one-half of the loads are transmitted directly to the foundation and
simple and continuous beam models lead to inaccurate results in calculating the internal
forces in the shear walls. They also proposed and analysed both linear and nonlinear
models with the consideration of the roof diaphragm as a rigid beam on elastic supports,
and verified their finite element model with the experimental results. They concluded
that the rigid beam analogy is an appropriate method when the shear stiffness of the
walls is known.
Henderson et al. (2006) noted that the most commonly observed building failures due to
cyclone Larry (March, 2006) included: widespread failure of roller doors, often
accompanied by loss of wall or roof panels; loss of struts, ridge members and connected
rafters when struts were not tied down; and structural component failure of under-
designed cold-formed steel sheds and garages. More than half a billion dollars was lost
due to damage to domestic and commercial buildings. Henderson et al. (2006) also
reported that another tropical cyclone Winifred crossed the same area of the North
Queensland coast in February 1986. The most common failure in older houses was loss
of roof cladding, often with battens attached.
Boughton et al. (2011) reported that tropical cyclone Yasi had wind speeds equivalent
to 55% to 90% of typical housing’s ultimate limit state. They concluded that normally
less than 3% of all post-80s houses in the worst-affected areas suffered substantial roof
damage, more than 12% of the pre-80s houses experienced considerable roof damage,
and more than 20% of the pre-80s houses in some towns had substantial roof loss.
Boughton et al. (2011) identified the main reasons for the worse performance of pre-80s
houses and indicated that the tie-down systems which were used during construction do
not satisfy the present requirements.

43
Cyclone Amy, which struck in 1980, caused considerable damage to the mining town of
Goldsworthy. Three weeks later another cyclone, Dean, crossed the coast of Port
Hedland in Western Australia. At least sixteen houses suffered extensive damage during
cyclone Amy, and a further four during cyclone Dean. Such damage usually meant loss
of roof structure and loss of some walls. Both cyclones demonstrated the need for
sufficient fasteners to be provided in the roof structure (Reardon, 1980).
Reardon and Oliver (1982) found that about 50% of industrial and commercial
buildings had significant damage, mainly loss of roof sheeting and damage to roof
structure. There were some cases where walls were damaged also, due to the loss of
lateral bracing provided by the roof structure. Investigations of some of the damaged
buildings revealed that few cyclone precautions were included in the construction of
houses. Generally, concrete block houses performed better than timber-framed houses
(Reardon and Oliver, 1982).
Boughton and Reardon (1984) noted that the Northern Territory town of Borroloola was
battered on 23 March 1984 by high winds known as cyclone Kathy. The cause of the
damage for some buildings was a complete lack of design for high winds, and this
seemed more prevalent in the temporary buildings. They also observed that many roof
sheeting failures originated near edges or corners where no attention had been given to
the high localised uplift pressures in those areas.
Boughton and Falck (2007) discovered that due to cyclone George, the damage of major
parts of the roof structure was the worst structural damage. Structural damage occurred
due to reasons including the deterioration of older structural elements, and the failure of
non-structural elements such as flashings and trims. Henderson and Leitch (2005)
surveyed the damage due to cyclone Ingrid and found that where failures were
observed, the damage was attributed to inadequate, missing or corroded structural
components, and corrosion of components initiated failure in many cases.
2.10 Experimental Studies of Light-framed Structures
The overall structural behaviour of a house is not only dependent on the behaviour of
individual elements and sub-systems in isolation, but also on their interactions. Without
considering the whole structural system, it is very difficult to identify which
components lead in determining the overall behaviour of the structure. In domestic

44
structures, both the structural and non-structural components affect the structure's
behaviour. This section reviews several experimental studies conducted in the United
States, Australia, and Japan on full-scale light-framed houses and diaphragms.
2.10.1 Full-scale Structures
Tuomi and McCutcheon (1974) conducted test on a full-scale house under simulated
wind loads to determine the structural response of a conventional wood-frame house to
simulated wind loads. They observed that the first failure occurred at the sole plate of
the loaded wall at a pressure of 3000 Pa (63 psf). At a pressure of 5900 Pa, the house
slid off the sill plate and testing was terminated. The failure pressure was equivalent to
that caused by a wind velocity of 98 m/s. They concluded that the stiffness of the wall
sheathing is sufficient to cause the loaded wall to act as a plate, resulting in
approximately three-eighths of the total windward wall force being resisted by each of
the end shear walls. This fraction of lateral loads resistance would likely change for a
longer house with interior partitions, which would act as intermediate shear walls.
Tuomi and McCutcheon (1974) also conducted wood-framed house testing with the
application of transverse loads without uplift. The researchers found that there was no
failure until the lateral load reached the “equivalent” of a 98 m/s wind event without the
inclusion of uplift loads.
The Cyclone Testing Station has tested different configurations of light-frame houses
(single-storey timber-framed brick veneer houses tested by Reardon 1986; a two-storey
split steel timber-framed brick veneer house by Reardon and Mahendran 1988; and a
single-storey light gauge steel-framed brick veneer house by Reardon 1990) to examine
the response under the design level of wind loadings. They also conducted wind tunnel
tests to determine appropriate load distributions. Their studies focussed on the necessity
of the interactions of the component and the effect of the boundary conditions and non-
structural components.
In Australia, Reardon and Henderson (1996) conducted destructive testing on a house
and concluded that conventional residential construction (only marginally different from
that in the United States) is capable to resist about 2.4 times its projected design wind
load without failure of the structure.
45
Fischer et al. (2001) conducted a shake table test of a house with plan dimensions of
4.9m x 6.1m to observe the seismic performance under different levels of seismic
shaking and for different structural configurations. They concluded that a fully
engineered timber-framed house has better seismic performance than a conventionally
constructed house. These tests were conducted to assess the contributions of different
elements to the response and the researchers found that non-structural wall finishes
considerably stiffen the structure and reduce the response level.
Filiatrault et al. (2004) performed shake table testing of a full-scale two-storey wood-
framed house model and concluded that wall linings have a positive effect on the
dynamic response of the structure. Filiatrault et al. (2010) also conducted shake table
testing of a two-storey full-scale light-framed wood structure to decide the dynamic
characteristics and the seismic performance of the test building under several base input
intensities. The building was tested with and without interior (gypsum wallboard) and
exterior (stucco) wall claddings. They found that the fixing of gypsum wallboard to the
interior surfaces, and exterior stucco of structural wood-sheathed walls significantly
enhanced the seismic performance of the structure. Shake table test results provided
evidence for the significant influence of wall finish materials on the behaviour of lateral
load-resisting systems in light-frame wood construction.
Sugiyama et al. (1988) completed lateral tests on a full-scale Japanese conventional
wood-frame house in order to study the effect on racking resistance of transverse walls.
These researchers found that transverse walls make only a minor contribution to lateral
resistance.
Boughton and Reardon (1982) conducted tests on a full-scale house under simulated
high wind loads. They concluded that the roof assembly had adequate in-plane strength
to distribute the lateral load to the shear walls. Based on the stiffness test results, they
concluded that approximately 60% of the lateral load was transmitted to the shear walls
through the roof sheathing and ceiling systems, and the remainder was transmitted
directly to the internal shear walls or was resisted by the windward wall.
Stewart et al. (1988) tested two homes under simulated wind loading to investigate the
effect of transverse walls on racking resistance and the interaction between the roof
diaphragm and the shear walls. They found that the roof system was stiffer than the
46
shear walls, so that the system could be approximately modelled as a stiff beam on
elastic foundations. Richins et al. (2000) also conducted a series of tests under simulated
design-level wind loads. They applied distributed loads and concentrated loads at the
ceiling level and measured the global displacements of the house and reactions in the
tie-down straps. They concluded that the racking and slip displacements were small
under design-level wind loads.
Reardon (1987; 1989) conducted whole-house testing in Australia and concluded that
about 75% deflection (i.e., drift) of a wall reduces due to the addition of interior ceiling
finishes. He also found that the addition of the cornice trim to cover or dress the wall-
ceiling joint reduces the deflection of the same wall by another 60% (roughly 16% of
the original deflection).
Reardon (1987) tested a brick veneer house under simulated cyclone wind conditions
and studied the diaphragm action of the ceiling and roofing materials. They found that
the house was very strong in resisting horizontal wind forces, but inadequate to resist
the applied cyclic uplift wind forces. He also concluded that (i) fatigue cracks due to
cyclic loading can severely weaken light gauge metal straps used in construction joints
of houses in cyclone-prone areas; (ii) a ceiling can act as a very efficient diaphragm in
distributing horizontal wind forces, (iii) normal internal wall cladding provides a much
stiffer wall bracing medium than conventional cross-bracing; (iv) light metal tiles can
provide some bracing diaphragm action; (v) uncracked single leaf brickwork can resist
the design loads without requiring much support from the timber frame; (vi) the
ultimate strength of the brick veneer was adequate, and dependent upon the buckling
strength of the brick ties; and (vii) return walls in the brickwork provide a considerable
stiffening effect against lateral wind forces.
Boughton (1984) provided a brief outline of the procedure used to test a complete house
designed and built in accordance with the current building regulations for houses in
cyclone-prone areas. He demonstrated mechanisms of load transfer, load sharing
between the elements in the house and areas of weakness or excessive strength. He
concluded that (i) roof, ceiling and floor diaphragms functioned as highly effective
diaphragms to transmit lateral forces to the top of vertical bracing elements; (ii) the
house structure above floor level has great reserves of strength to resist lateral loads in
spite of severe debris damage to load-carrying walls; (iii) at working loads, all walls

47
within the house function well within their elastic range to carry lateral loads from top
plate level to floor level.
Ohashi and Sakamoto (1988) conducted tests on a two-storey building with two
partition walls in every storey and found that the structure performed as a nonlinear
system with degrading stiffness. The load-deflection curves were similar to those
reported by Chou (1987) for single nail connections, and concluded that there is a robust
influence of connections on the overall behaviour of the structure.
2.10.2 Roof and Ceiling Diaphragm
Estimation of ceiling or roof diaphragm stiffness is important for determining the
distribution of lateral load to the shear walls. However, very little research has been
conducted in this area to date.
Tremblay et al. (2004) conducted an experiment to study the response of steel roof deck
diaphragms (made of corrugated steel deck panels) for low-rise steel buildings under
seismic loading. They observed that (i) diaphragms constructed with screwed side lap
fasteners and nailed deck-to-frame connectors showed a pinched hysteretic behaviour,
but could withstand large inelastic deformation cycles with limited strength
degradation; (ii) the systems that included welding with washer connections possess
higher shear resistance and less pinching, but the strength reduces quickly after reaching
the peak load, and therefore, the systems ought to be designed for limited inelastic
response; (iii) deck systems with button punched side laps and frame welds without
washers exhibited a brittle response and must be designed to resist elastic response
under severe earthquake motions; and (iv) the inelastic response increases with the
decreased spacing of the fasteners. Samples built with an interior overlap joint showed
extensive warping of the cross-section, primarily due to the shorter panel length.
Turnbull et al. (1982) performed tests on three farm building ceilings under simulated
wind loads: (i) conventional, 7.5mm sheathing of Douglas fir plywood nailed directly to
trusses spaced at 600 mm and plyclips at panel edges mid-span between trusses; (ii)
improved plywood diaphragm, 7.5-mm sheathing Douglas fir nailed along four edges to
a 1200 x 1200-mm grid under trusses spaced at 1200 mm; and (iii) screwed sheet steel
diaphragm, power-screwed under trusses spaced at 1200 mm. They found that the
screwed steel ceiling is about 2.4 times stiffer than the plywood ceiling and 1.6 times
48
stiffer than the improved plywood ceiling up to 12 mm deflection. The screwed steel
ceiling provides higher stiffness, probably due to the better connection stiffness along
the full perimeter of each steel sheet. Turnbull et al. (1982) also concluded that with a
typical 2.4 m stud wall height and 0.64 KN/ m2 wind pressure; the conventional
plywood ceiling would be safe to a ceiling length/width ratio (L/W) up to 3.67, the
improved plywood ceiling to 6.04, and the screwed steel ceiling to 5.35.
Carradine et al. (2002) conducted tests of timber frame and structural insulated panels
(SIP) roof systems to establish procedures for integrating the substantial in-plane
strength and stiffness of SIPs within the lateral load design of timber-framed and SlP
buildings. From their primary studies it has been reported that timber-framed structures
do not have the structural integrity to resist lateral loads for code-compliant designs
without including diaphragm action. They concluded that the ultimate shear capacity
and shear stiffness of the diaphragm increases with the increase of the screw diameter or
decreased spacing of the screws.
Mastrogiuseppea et al. (2008) studied the effect of non-structural roofing components
on the dynamic properties of single-storey steel buildings, particularly on the roof
diaphragm properties. They found that gypsum board is the stiffest element of the non-
structural components, and there is a higher influence on the in-plane force-deformation
behaviour of the steel roof deck diaphragm. There is very little effect due to the other
non-structural elements, either due to their low in-plane shear stiffness or the lack of a
direct connection to the steel deck. Finite element modelling showed that the stiffness of
the steel diaphragm increases with the increase of the thickness of the steel roof deck
panels as well as closer spacing of the connections.
Kunnath et al. (1994) presented a comprehensive experimental, analytical, and
parametric study to observe the performance of gypsum-roof structures under severe
earthquake excitations. They provided some recommendations for strengthening
gypsum roof diaphragms: (i) diaphragm spans may be reduced by adding vertically-
oriented lateral load-resisting elements consisting of shear walls or steel bracings; (ii)
the ends of the gypsum diaphragm (where the shear stresses are the highest) can be
strengthened by the addition of another layer of gypsum and mesh reinforcement; and
(iii) place horizontal bracings below and in the plane of the diaphragm as a substitute
49
shear-resisting element so that the bracing is stiff enough to control gypsum drift to
within prescribed strain levels.
Falk and Itani (1987) tested three floor, three ceiling, and four wall diaphragms ranging
in size from 8 x 24 ft to 16 x 28 ft to investigate the effects of typical sheathing
materials such as plywood and gypsum wallboard, as well as the effect of a stairwell
opening in one floor diaphragm and door and window openings in two walls. They
concluded as follows: (i) diaphragm stiffness decreases with increasing diaphragm
displacement and consequently decreased natural frequency; and (ii) the presence of
openings usually generates lower damping ratios than identical diaphragms without
openings.
In Australia, Boughton and Reardon (1984) tested a house with fibre cement exterior
cladding and plasterboard interior finishes and found that the roof and ceiling
diaphragm is stiff and the diaphragm rigidly distributes the lateral loads to the walls.
These researchers recommended that the house has adequate capacity to resist a design
wind speed of 65 m/s. Reardon (1989) observed the effect of various sheathing
materials on the diaphragm action of house elements and concluded that the stiffness of
the house is enhanced significantly when the wall or the roof sheathing is included in
the model.
2.11 Analytical Modelling
Analytical modelling is important to extend the usefulness of experimental results and
to predict the structural behaviour of the entire building its sub-assemblies under
different loading conditions. In analytical modelling, the physical relationships between
individual components and entire buildings are included. Analytical and experimental
studies of light-framed structures are also important to develop a design procedure. The
analysis of light-framed structures under lateral loads is a difficult task, due to several
degrees of nonlinearity (e.g. material nonlinearities, nonlinear joints and connections,
and discontinuities between adjacent elements), the complex nature of the connections
and fasteners, and the wide variability in material properties and construction
techniques.
50
2.11.1 Full-scale Structures Modelling
Yoon and Gupta (1991) developed a program to analyse the Tuomi-McCutcheon (1974)
house to compute factors of safety against possible failure modes, such as buckling
of sheathing panels and slippage of the connecting nails. The experimental results of
the Tuomi-McCutcheon house were compared with those of Yoon and Gupta (1991)
and good agreement between the two results was found.
Schmidt and Moody (1989) extended the Tuomi-McCutcheon (1978) model for the
analysis of shear walls by including the nonlinear behaviour of the fasteners. They used
the model to predict the response of 3-dimensional wood-frame structures subjected to
lateral loading. The main assumption of their 3-D model was that the ceiling and roof
diaphragms were sufficiently rigid, such that the shear walls in each storey can be
combined into a three-degrees-of-freedom system: two horizontal translations and one
rotation. The model was validated using the experimental results from the full-scale
house tested by Tuomi and McCutcheon (1974) and Boughton and Reardon (1984) and
reasonable agreement was found. They also found that the analytical results differed
from the experimental results in the cases where the building was loaded with an
eccentric point load. This may be due to the oversimplification of the model that
neglects the out-of-plane stiffness of the walls, the slippage of inter-component
connections and the shear stiffness of areas above and below the openings, and the
assumption of rigid ceiling and roof diaphragms.
Kasal et al. (2004) and Kasal et al. (1994) developed a nonlinear 3-D finite element
model of complete wood-frame structures and used the model in the analysis of the full-
scale house tested by Philips (1990). Their model was designed as an assembly of
substructures (walls, roof, and floors) joined by inter-component connections. Using the
ANSYS software, they developed two 3-D finite element models: a coarse and a refined
mesh of the house tested by Philips (1990). They observed that when only two adjacent
walls out of the four were loaded, the model did not yield accurate results for the
unloaded walls. This inaccuracy may be due to the transfer of forces through the roof
diaphragm and inter-component connections. Their results also indicated that there was
no significant difference between the response of the coarse and refined meshes and that
the distribution of loads among the shear walls depends on the combination of shear
wall stiffness, roof diaphragm action, and inter-component connection stiffness.

51
2.11.2 Ceiling and Roof diaphragm
Schmidt and Moody (1989) developed a simple 3-D model using rigid ceiling
diaphragms and nonlinear shear walls to predict the behaviour of light-frame buildings
under lateral load and derived an exponential function for the monotonic load-slip
connection. The model was compared with Tuomi and McCutcheon’s (1974) and
Boughton and Reardon’s (1984) test results and reasonable agreement was found.
In a 3-D truss model, Ge (1991) applied nonlinear diagonal springs in order to substitute
the shear behaviour of diaphragm elements due to static or pseudo-static lateral loads in
a light-framed structure. The model was validated using the experimental results of
Tuomi and McCutcheon (1974), Boughton and Reardon (1984), and Reardon and
Boughton (1985). Ge (1991) found satisfactory agreement for symmetrically-loaded
buildings, but for asymmetrically-loaded constructions, agreement was not supported
appropriately.
Kataoka (1989) developed a nonlinear three-dimensional finite element model for full-
scale structural analysis. In his model, nonlinear springs were used in order to model
inter-component connections and the shear resistance of walls. Kataoka (1989) also
modelled the building as a three-dimensional framed with nonlinear diagonals and
nonlinear member connections. However, bending stiffness of the wall was not included
in the model. He found good agreement between the analytical and experimental results.
Falk and Itani (1989) described a two-dimensional finite element model to signify the
distribution and stiffness of the nails that secure sheathing to framing in a wood
diaphragm. The load-displacement results obtained by Falk and Itani (1989) showed
that the diaphragm stiffness increases with the increasing properties of the nails. They
also concluded that nail spacing had a larger effect on diaphragm stiffness than nail
modulus. There was a very dramatic effect on diaphragm stiffness due to the variance of
perimeter nail spacing, but changing field nail spacing did not affect diaphragm stiffness
to the identical range. Falk and Itani (1989) also investigated the effect of blocking on
the standard ceiling diaphragm stiffness and found that diaphragm stiffness increased
due to blocking. They also found that extra nails that secure the sheathing to the
blocking and frame action provide an identical effect on diaphragm stiffness.

52
Collins et al. (2005) presented a nonlinear three-dimensional finite element model
which is capable of static and dynamic analysis and compared the model with the
results of an experiment on a full-scale asymmetric light-framed building. The model
was validated based on global and local responses using measures of energy dissipation,
displacement, and load. They showed that the energy dissipation, hysteretic response,
load sharing between the walls, and the torsional response were estimated reasonably
well.
Foschi (1977) presented a formulation for the structural analysis of wood diaphragms
that is executed in the SADT program and integrates the basic features of wood
structural assemblies such as orthotropic plate action and nonlinear connection
behaviour. The model provided estimates for diaphragm deformations and was capable
of providing approximations for ultimate loads based on connection yielding.
Itani and Cheung (1984) developed a finite element model to predict the static load-
deflection behaviour of sheathed wood diaphragms under racking loads and found that
the properties of nailed joints are the controlling factor for the performance of sheathed
diaphragms.
2.12 Summary and Research Needs
This chapter has discussed the main components in domestic structures, the factors
which affect the lateral behaviour of houses and ceiling and roof diaphragms, and
presented current practice in Australia. The critical factors which require research
have been identified as follows:
Several experimental studies and analytical modelling have been conducted for
the determination of the strength and stiffness of shear walls. However, very few
studies have been undertaken on the determination of the strength and stiffness
of ceiling and/or roof diaphragms in cold-formed steel houses. Determination of
diaphragm stiffness is essential in the design of light-framed structures in order
to estimate the predicted deflection and thereby classify the diaphragm as rigid
or flexible. This classification controls the method of load distribution from the
diaphragm to the resisting walls. The ability to calculate accurately diaphragm
stiffness and hence, deflections will improve the safety and economy of
diaphragms and structures.
53
Shear connection tests are essential to determine the load-displacement
behaviour of the connections between plasterboard and the steel framing
members. The values of the load-displacement curves can be used as the input
parameters for the development of analytical modelling. The proposed model
will be validated against experimental data.

54
CHAPTER 3
EXPERIMENTAL PROGRAM (PHASE I): SHEAR CONNECTION TESTS
3.1 Introduction
The experimental program comprised of three stages. The first stage was a series of
tests including shear connection tests between plasterboard sheathing and cold-formed
steel framing members as well as loading on the edge of plasterboard to determine its
bearing capacity. Figure 3.1 shows the complete experimental program in this research
project. The second stage involved full-scale ceiling diaphragm tests in cantilever
configuration, and the third stage involved full-scale ceiling diaphragm tests in beam
configurations.
In this chapter, the results of the first phase of the experimental program, i.e. individual
connections between plasterboard sheathing and cold-formed steel framing members,
are discussed. The connection between the steel framing members (ceiling battens or
bottom chords of trusses) and the plasterboard sheathing is made using screws. The
strength and stiffness of screwed steel-framed ceiling diaphragms are mainly governed
by the strength and stiffness of the connections between the steel framing members and
the plasterboard sheathing, rather than the members’ properties themselves. Since
screws are responsible for the transfer of the forces to the framing members from the
plasterboard, it is crucial to observe their performance in shear connection tests. These
tests assist understanding of the basic behaviour of these components and help to
provide understanding of the behaviour of a complete ceiling diaphragm.
Virtually all investigations of shear connection tests have focused on monotonic static
loading testing. Inexpensive test methods have been performed to replicate
representative tests in order to determine the parameters defining the load-displacement
curves for the connections between cold-formed steel framing members and
plasterboard sheathing. The objective of the shear connection tests was to determine the
upper and lower bounds of the load-displacement curves for typical framing-to-
plasterboard connections in ceiling diaphragms. The results of the connection tests were
used as the input parameters in the development of analytical models to predict the full-
sized ceiling diaphragm performance, as described in Chapter 6. The methods used in
testing, specimen configuration, specimen fabrication, instrumentation, and the data
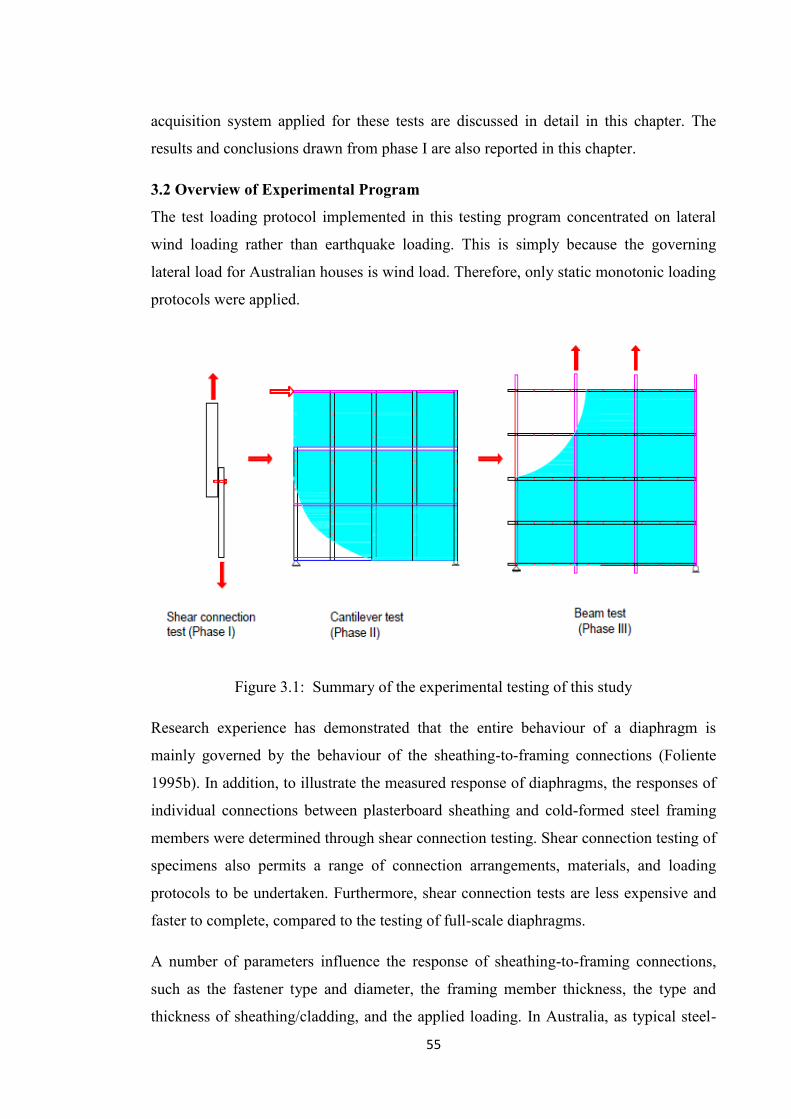
55
acquisition system applied for these tests are discussed in detail in this chapter. The
results and conclusions drawn from phase I are also reported in this chapter.
3.2 Overview of Experimental Program
The test loading protocol implemented in this testing program concentrated on lateral
wind loading rather than earthquake loading. This is simply because the governing
lateral load for Australian houses is wind load. Therefore, only static monotonic loading
protocols were applied.
Figure 3.1: Summary of the experimental testing of this study
Research experience has demonstrated that the entire behaviour of a diaphragm is
mainly governed by the behaviour of the sheathing-to-framing connections (Foliente
1995b). In addition, to illustrate the measured response of diaphragms, the responses of
individual connections between plasterboard sheathing and cold-formed steel framing
members were determined through shear connection testing. Shear connection testing of
specimens also permits a range of connection arrangements, materials, and loading
protocols to be undertaken. Furthermore, shear connection tests are less expensive and
faster to complete, compared to the testing of full-scale diaphragms.
A number of parameters influence the response of sheathing-to-framing connections,
such as the fastener type and diameter, the framing member thickness, the type and
thickness of sheathing/cladding, and the applied loading. In Australia, as typical steel-
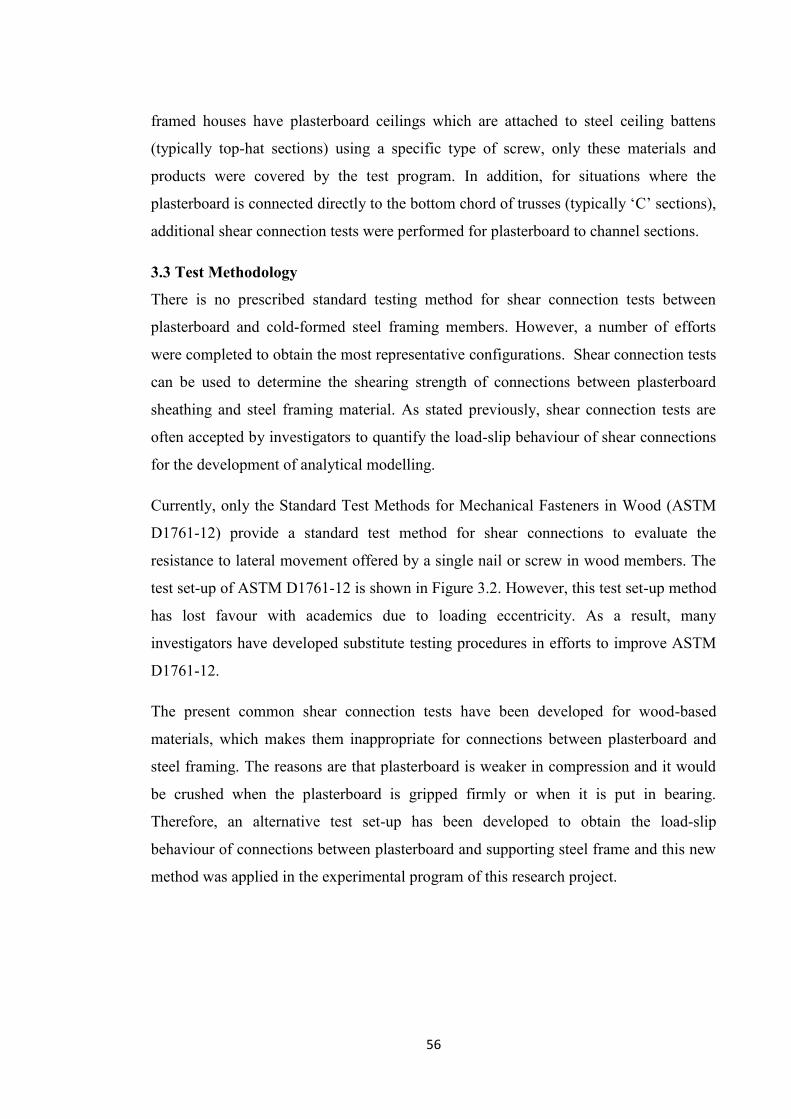
56
framed houses have plasterboard ceilings which are attached to steel ceiling battens
(typically top-hat sections) using a specific type of screw, only these materials and
products were covered by the test program. In addition, for situations where the
plasterboard is connected directly to the bottom chord of trusses (typically ‘C’ sections),
additional shear connection tests were performed for plasterboard to channel sections.
3.3 Test Methodology
There is no prescribed standard testing method for shear connection tests between
plasterboard and cold-formed steel framing members. However, a number of efforts
were completed to obtain the most representative configurations. Shear connection tests
can be used to determine the shearing strength of connections between plasterboard
sheathing and steel framing material. As stated previously, shear connection tests are
often accepted by investigators to quantify the load-slip behaviour of shear connections
for the development of analytical modelling.
Currently, only the Standard Test Methods for Mechanical Fasteners in Wood (ASTM
D1761-12) provide a standard test method for shear connections to evaluate the
resistance to lateral movement offered by a single nail or screw in wood members. The
test set-up of ASTM D1761-12 is shown in Figure 3.2. However, this test set-up method
has lost favour with academics due to loading eccentricity. As a result, many
investigators have developed substitute testing procedures in efforts to improve ASTM
D1761-12.
The present common shear connection tests have been developed for wood-based
materials, which makes them inappropriate for connections between plasterboard and
steel framing. The reasons are that plasterboard is weaker in compression and it would
be crushed when the plasterboard is gripped firmly or when it is put in bearing.
Therefore, an alternative test set-up has been developed to obtain the load-slip
behaviour of connections between plasterboard and supporting steel frame and this new
method was applied in the experimental program of this research project.

57
Figure 3.2: Test arrangement for lateral resistance of screws (ASTM D1761-12) (Figure
is omitted from the electronic version of thesis due to copyright issue)
An alternative test configuration for testing plasterboard-to-steel frame connection is
depicted in Figures 3.3 to 3.6. In this set-up, a field shear connection test set-up
replicates the shear connections away from the edges, while the edge shear connection
test set-up replicates the shear connections where the screw under shear moves towards
a plasterboard edge. In this set-up, it is not necessary to clamp or support (bearing) the
plasterboard specimens on the testing machine. As an alternative, the channel sections
provide gripping areas for the testing machine. As a consequence, the risks related to the
crushing of the plasterboard specimens and slipping due to inadequate clamping can be
disregarded.

58
Figure 3.3: Field shear connection test set-up to replicate connection with top-hat
section member (dimensions are in mm)
Screws under testing

59
Figure 3.4: Edge shear connection test set-up to replicate connection with top-hat
section member (dimensions are in mm)
Screws under testing
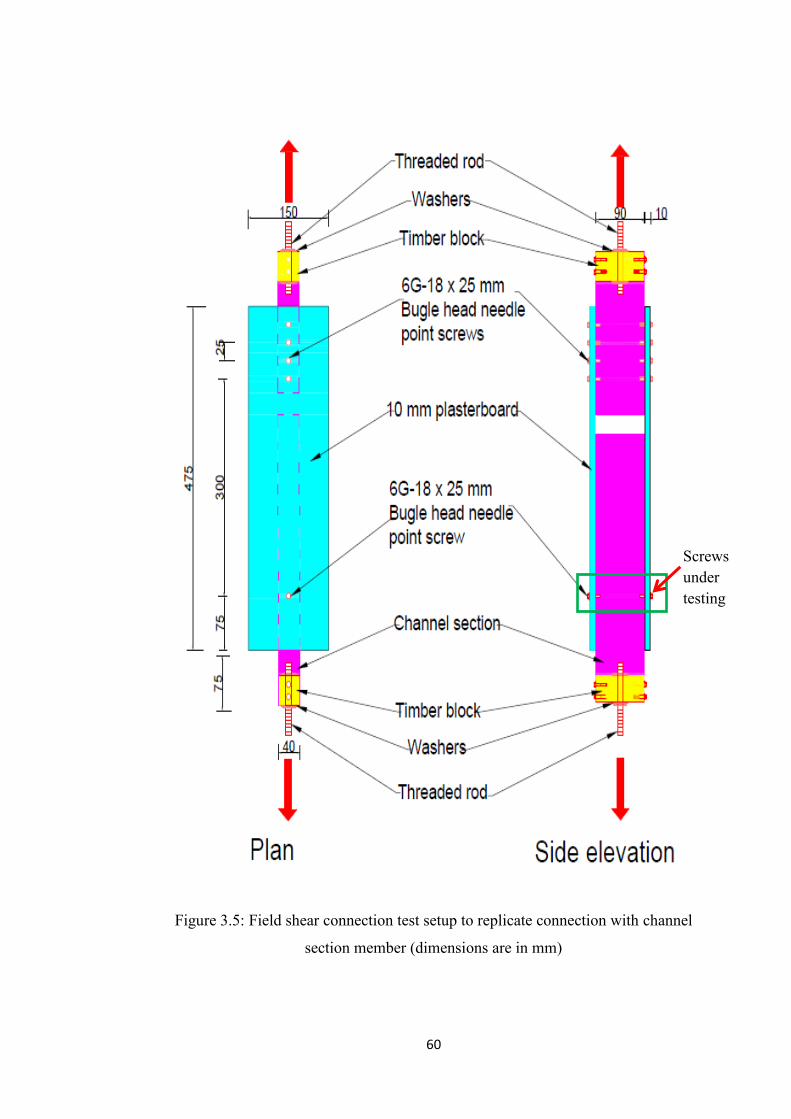
60
Figure 3.5: Field shear connection test setup to replicate connection with channel
section member (dimensions are in mm)
Screws under testing
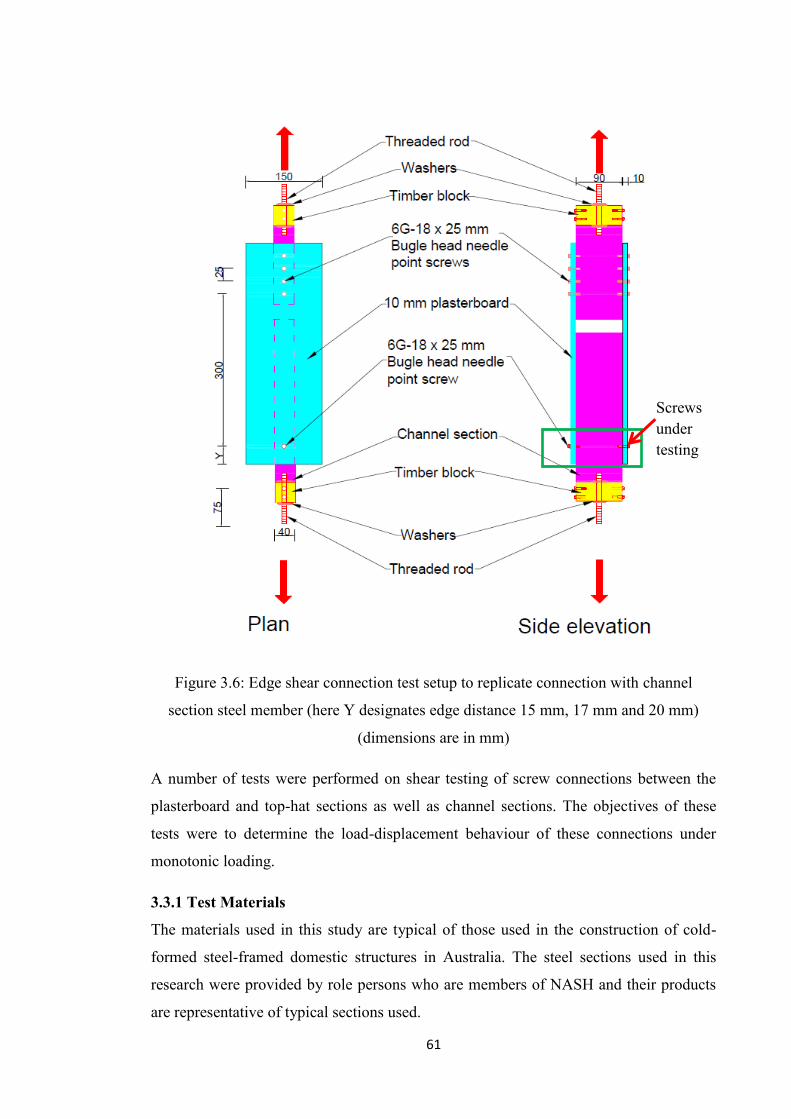
61
Figure 3.6: Edge shear connection test setup to replicate connection with channel
section steel member (here Y designates edge distance 15 mm, 17 mm and 20 mm)
(dimensions are in mm)
A number of tests were performed on shear testing of screw connections between the
plasterboard and top-hat sections as well as channel sections. The objectives of these
tests were to determine the load-displacement behaviour of these connections under
monotonic loading.
3.3.1 Test Materials
The materials used in this study are typical of those used in the construction of cold-
formed steel-framed domestic structures in Australia. The steel sections used in this
research were provided by role persons who are members of NASH and their products
are representative of typical sections used.
Screws under testing

62
Framing
Two types of cold-formed steel framing are used, depending on the system of ceiling
diaphragm construction used. These two framing members include top-hat22 section
(0.42 mm thickness) and 90 x 40 x 0.75 mm channel “C’’ sections manufactured by
BlueScope Pty Ltd. In the Australian construction industry, generally top-hat sections
are used as battens for ceilings, roofing, cladding and lining support and as joists for
flooring support. Channel “C” sections are used as truss bottom chords and ceiling
joists. The structural grade of both of the steels is G550. The dimensions and properties
of various steel top-hat sections and steel lipped and unlipped C-sections are available
in NASH Standard Part-2 (2014).
Sheathing
Plasterboard was used as a sheathing material in this study. The sheathing used in this
study was 10 mm thick plasterboard manufactured by Boral Plasterboard Pty. Ltd. This
plasterboard is manufactured to comply with AS/NZS 2588.
Screws
In Australia, screws are typically used to attach the plasterboard to the steel members.
The screws used in this study were 6G-18 x 25 mm bugle-head needle-point,
manufactured by Buildex Pty Ltd. These screws are typically used to fix plasterboard to
steel up to about 0.8 mm thick.
3.3.2 Specimen Configurations and Fabrication
A total of 24 plasterboard specimens were tested as outlined in Table 3.1. Out of the
twenty four tests, ten tests were performed for top-hat sections and the remaining 14 for
‘C’ section connections. Specimens for shear connections for both top-hat and channel
section members prior to testing are shown in Figure 3.7.
In a typical construction, the recommended minimum distance between a screw and the
edge of plasterboard ceiling varies from 15 mm to 22 mm, as described in the Gyprock
Ceiling System Installation Guide (2008) and the Gyprock Residential Installation
Guide (2010). Therefore, 20 mm edge distance is considered to be the typical edge
distance.
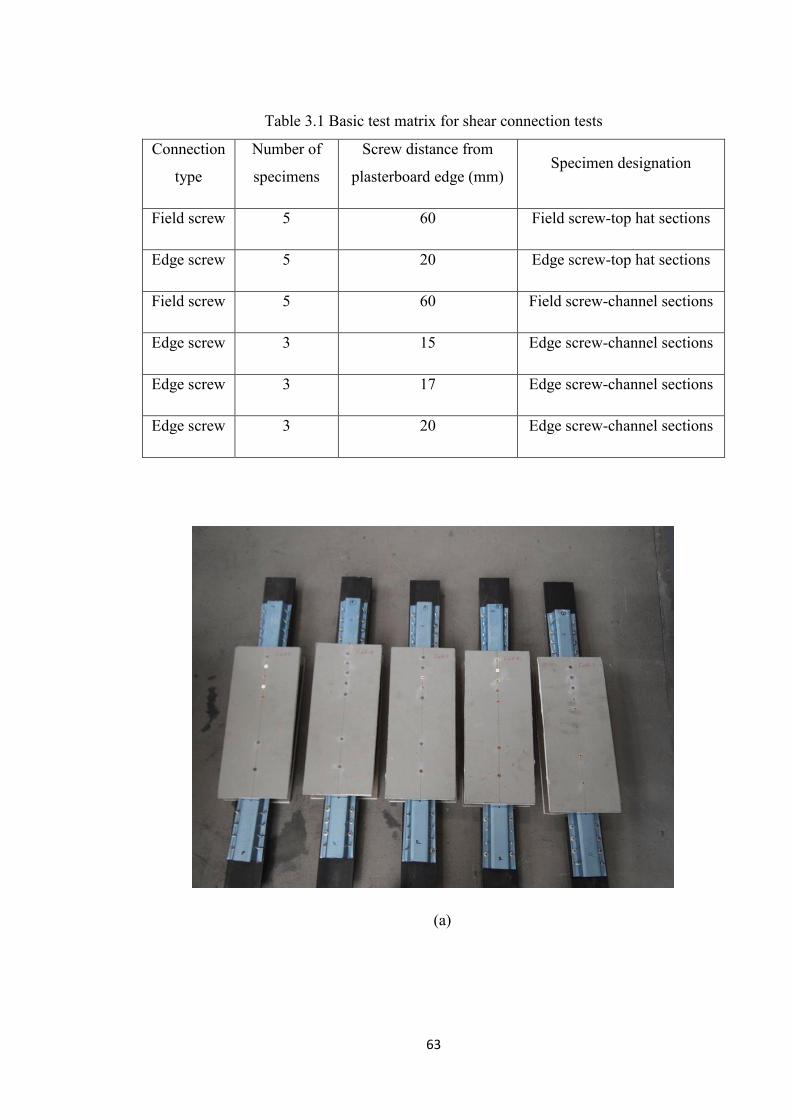
63
Table 3.1 Basic test matrix for shear connection tests
Connection
type
Number of
specimens
Screw distance from
plasterboard edge (mm) Specimen designation
Field screw 5 60 Field screw-top hat sections
Edge screw 5 20 Edge screw-top hat sections
Field screw 5 60 Field screw-channel sections
Edge screw 3 15 Edge screw-channel sections
Edge screw 3 17 Edge screw-channel sections
Edge screw 3 20 Edge screw-channel sections
(a)
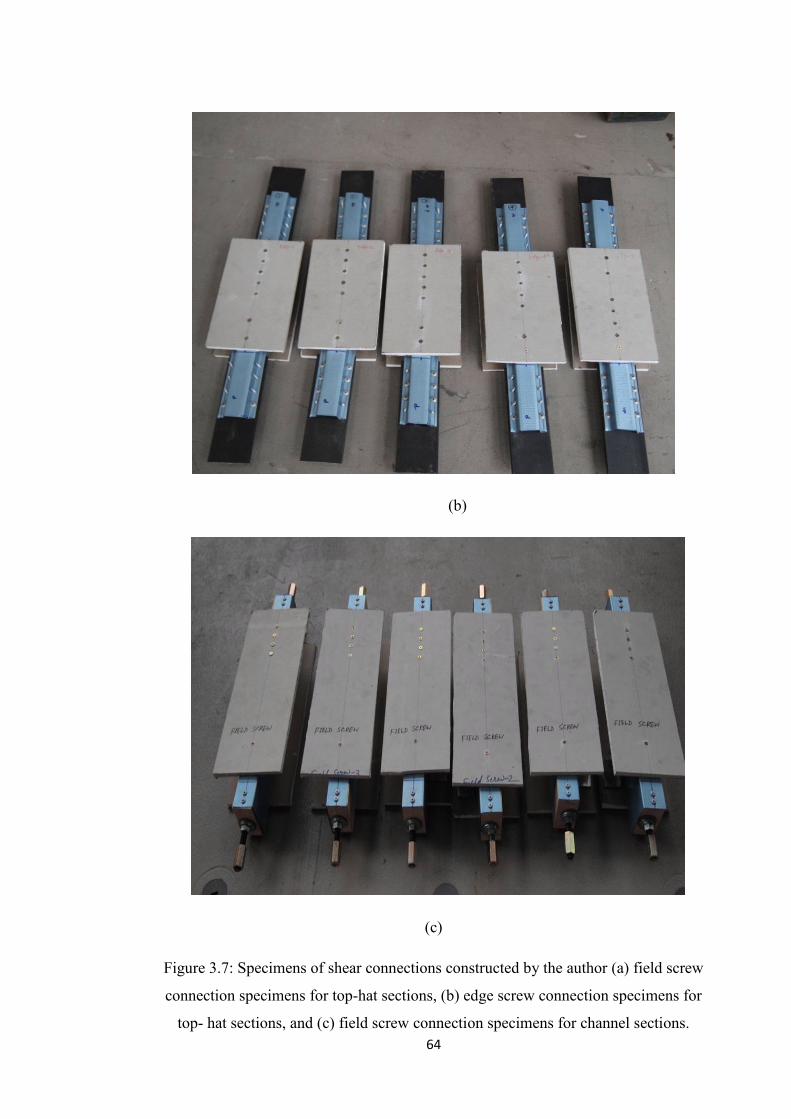
64
(b)
(c)
Figure 3.7: Specimens of shear connections constructed by the author (a) field screw
connection specimens for top-hat sections, (b) edge screw connection specimens for
top- hat sections, and (c) field screw connection specimens for channel sections.
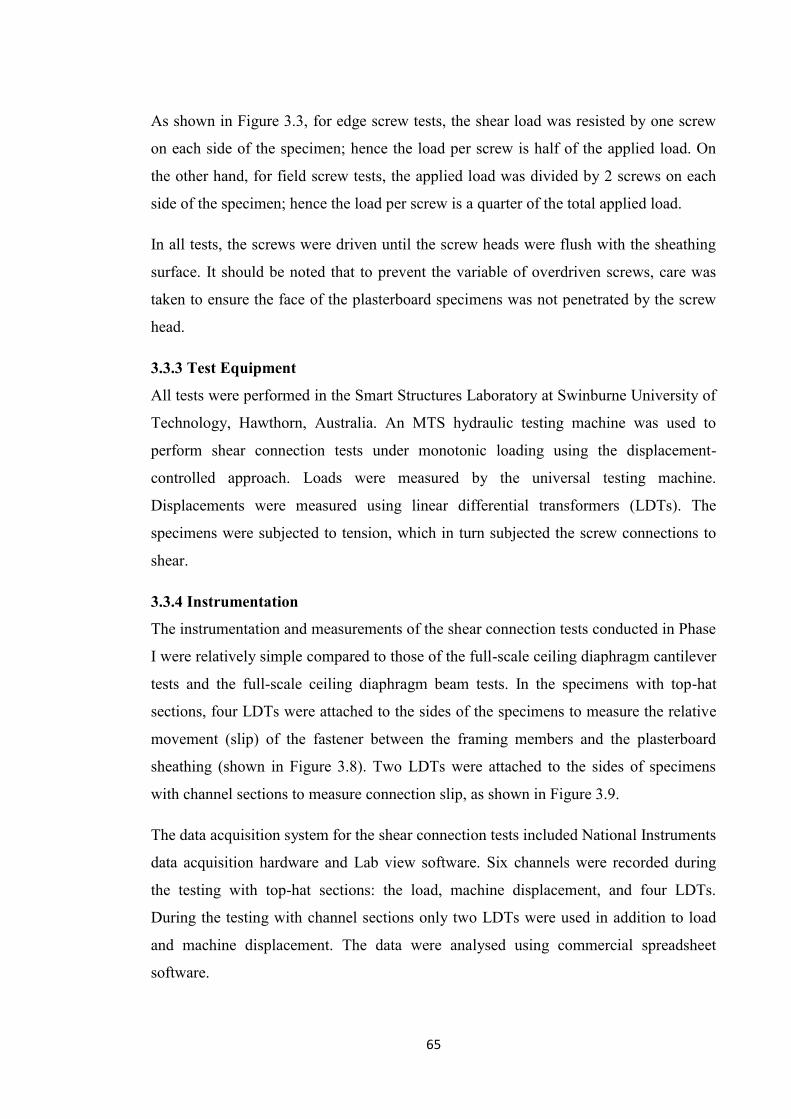
65
As shown in Figure 3.3, for edge screw tests, the shear load was resisted by one screw
on each side of the specimen; hence the load per screw is half of the applied load. On
the other hand, for field screw tests, the applied load was divided by 2 screws on each
side of the specimen; hence the load per screw is a quarter of the total applied load.
In all tests, the screws were driven until the screw heads were flush with the sheathing
surface. It should be noted that to prevent the variable of overdriven screws, care was
taken to ensure the face of the plasterboard specimens was not penetrated by the screw
head.
3.3.3 Test Equipment
All tests were performed in the Smart Structures Laboratory at Swinburne University of
Technology, Hawthorn, Australia. An MTS hydraulic testing machine was used to
perform shear connection tests under monotonic loading using the displacement-
controlled approach. Loads were measured by the universal testing machine.
Displacements were measured using linear differential transformers (LDTs). The
specimens were subjected to tension, which in turn subjected the screw connections to
shear.
3.3.4 Instrumentation
The instrumentation and measurements of the shear connection tests conducted in Phase
I were relatively simple compared to those of the full-scale ceiling diaphragm cantilever
tests and the full-scale ceiling diaphragm beam tests. In the specimens with top-hat
sections, four LDTs were attached to the sides of the specimens to measure the relative
movement (slip) of the fastener between the framing members and the plasterboard
sheathing (shown in Figure 3.8). Two LDTs were attached to the sides of specimens
with channel sections to measure connection slip, as shown in Figure 3.9.
The data acquisition system for the shear connection tests included National Instruments
data acquisition hardware and Lab view software. Six channels were recorded during
the testing with top-hat sections: the load, machine displacement, and four LDTs.
During the testing with channel sections only two LDTs were used in addition to load
and machine displacement. The data were analysed using commercial spreadsheet
software.
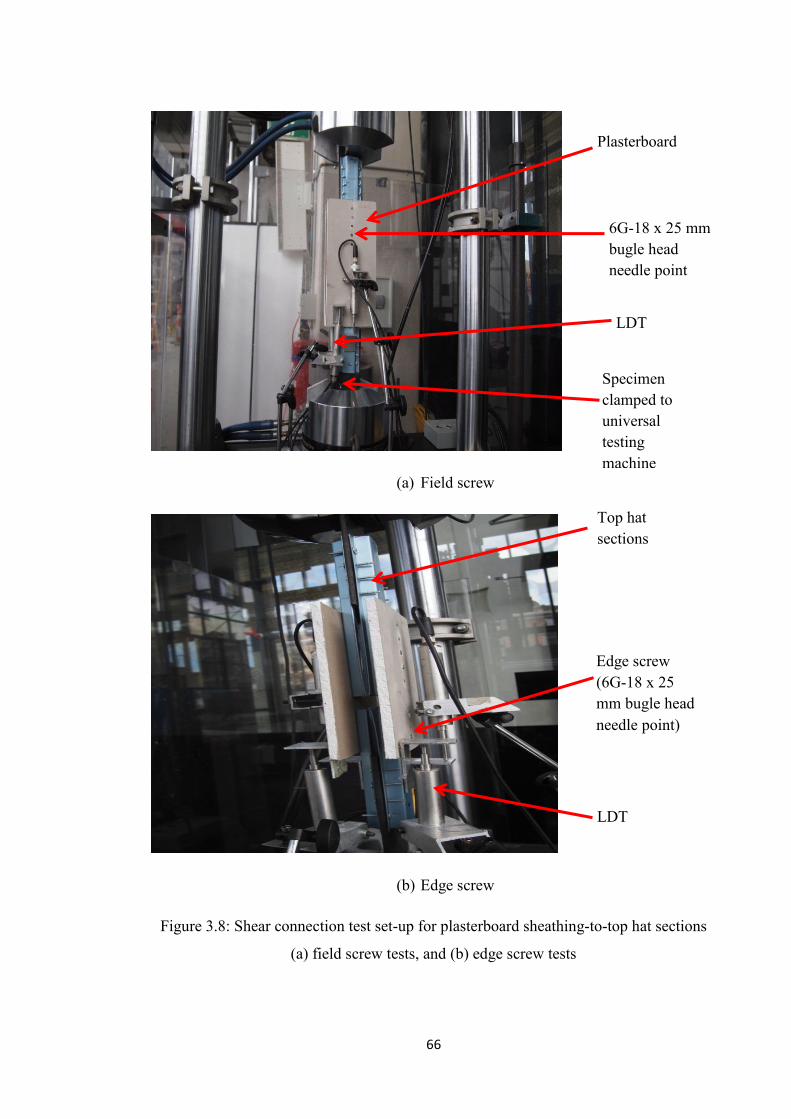
66
(a) Field screw
(b) Edge screw
Figure 3.8: Shear connection test set-up for plasterboard sheathing-to-top hat sections
(a) field screw tests, and (b) edge screw tests
6G-18 x 25 mm bugle head needle point
LDT
Plasterboard
LDT
Edge screw (6G-18 x 25 mm bugle head needle point)
Top hat sections
Specimen clamped to universal testing machine
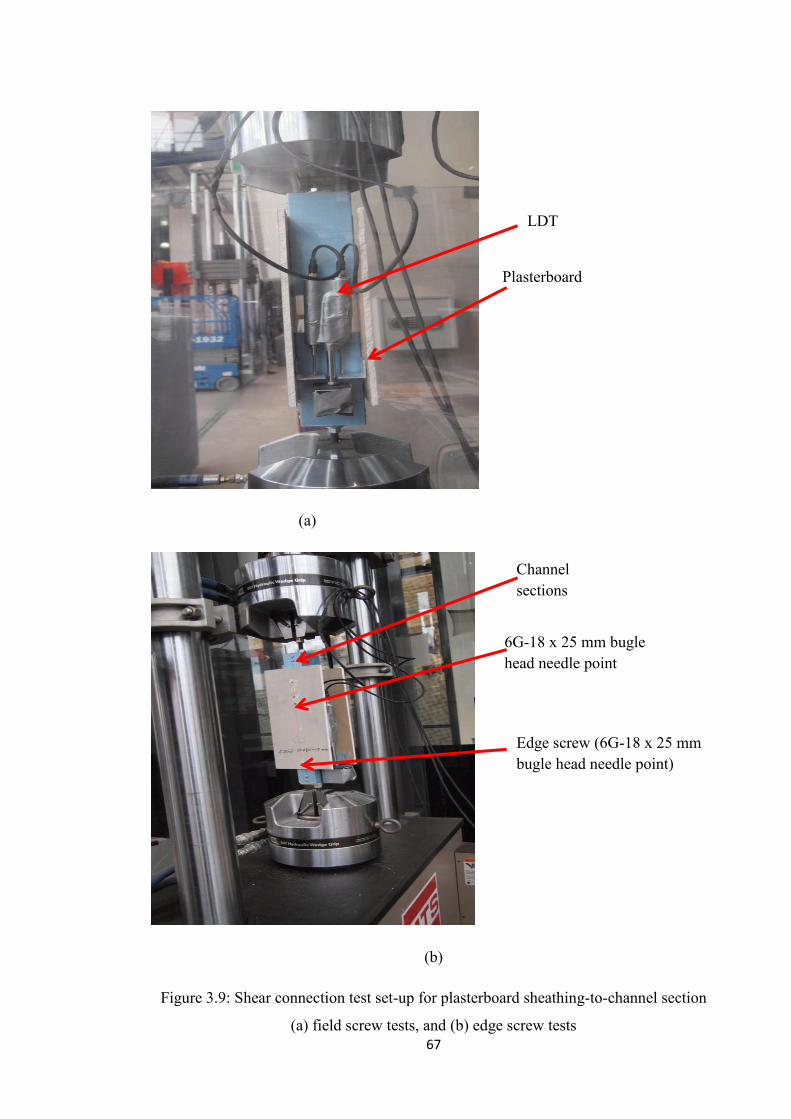
67
(a)
(b)
Figure 3.9: Shear connection test set-up for plasterboard sheathing-to-channel section
(a) field screw tests, and (b) edge screw tests
Edge screw (6G-18 x 25 mm bugle head needle point)
Channel sections
LDT
Plasterboard
6G-18 x 25 mm bugle head needle point
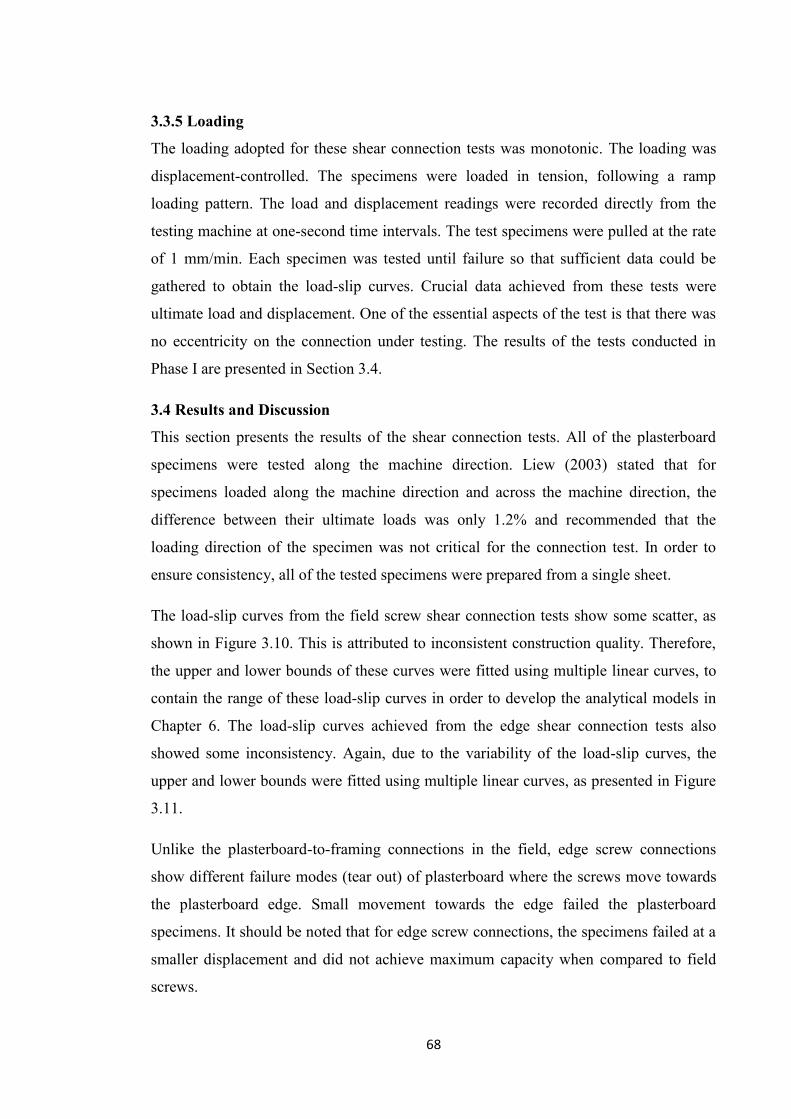
68
3.3.5 Loading
The loading adopted for these shear connection tests was monotonic. The loading was
displacement-controlled. The specimens were loaded in tension, following a ramp
loading pattern. The load and displacement readings were recorded directly from the
testing machine at one-second time intervals. The test specimens were pulled at the rate
of 1 mm/min. Each specimen was tested until failure so that sufficient data could be
gathered to obtain the load-slip curves. Crucial data achieved from these tests were
ultimate load and displacement. One of the essential aspects of the test is that there was
no eccentricity on the connection under testing. The results of the tests conducted in
Phase I are presented in Section 3.4.
3.4 Results and Discussion
This section presents the results of the shear connection tests. All of the plasterboard
specimens were tested along the machine direction. Liew (2003) stated that for
specimens loaded along the machine direction and across the machine direction, the
difference between their ultimate loads was only 1.2% and recommended that the
loading direction of the specimen was not critical for the connection test. In order to
ensure consistency, all of the tested specimens were prepared from a single sheet.
The load-slip curves from the field screw shear connection tests show some scatter, as
shown in Figure 3.10. This is attributed to inconsistent construction quality. Therefore,
the upper and lower bounds of these curves were fitted using multiple linear curves, to
contain the range of these load-slip curves in order to develop the analytical models in
Chapter 6. The load-slip curves achieved from the edge shear connection tests also
showed some inconsistency. Again, due to the variability of the load-slip curves, the
upper and lower bounds were fitted using multiple linear curves, as presented in Figure
3.11.
Unlike the plasterboard-to-framing connections in the field, edge screw connections
show different failure modes (tear out) of plasterboard where the screws move towards
the plasterboard edge. Small movement towards the edge failed the plasterboard
specimens. It should be noted that for edge screw connections, the specimens failed at a
smaller displacement and did not achieve maximum capacity when compared to field
screws.
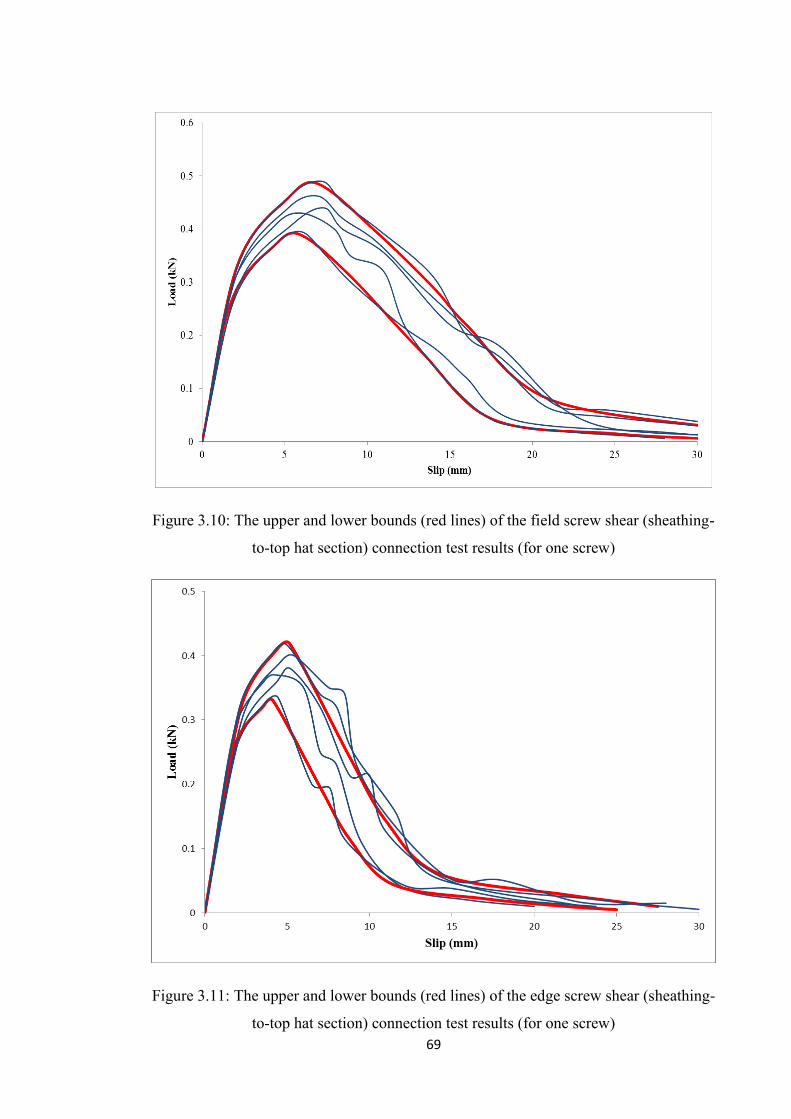
69
Figure 3.10: The upper and lower bounds (red lines) of the field screw shear (sheathing-
to-top hat section) connection test results (for one screw)
Figure 3.11: The upper and lower bounds (red lines) of the edge screw shear (sheathing-
to-top hat section) connection test results (for one screw)
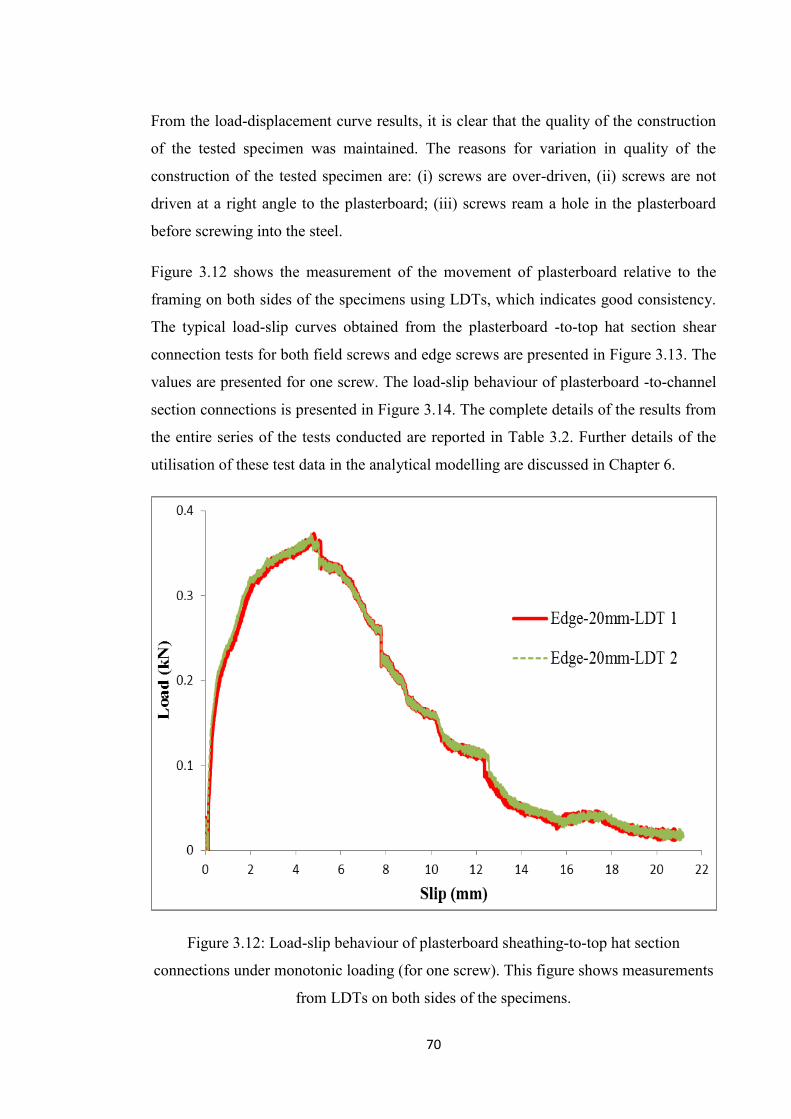
70
From the load-displacement curve results, it is clear that the quality of the construction
of the tested specimen was maintained. The reasons for variation in quality of the
construction of the tested specimen are: (i) screws are over-driven, (ii) screws are not
driven at a right angle to the plasterboard; (iii) screws ream a hole in the plasterboard
before screwing into the steel.
Figure 3.12 shows the measurement of the movement of plasterboard relative to the
framing on both sides of the specimens using LDTs, which indicates good consistency.
The typical load-slip curves obtained from the plasterboard -to-top hat section shear
connection tests for both field screws and edge screws are presented in Figure 3.13. The
values are presented for one screw. The load-slip behaviour of plasterboard -to-channel
section connections is presented in Figure 3.14. The complete details of the results from
the entire series of the tests conducted are reported in Table 3.2. Further details of the
utilisation of these test data in the analytical modelling are discussed in Chapter 6.
Figure 3.12: Load-slip behaviour of plasterboard sheathing-to-top hat section
connections under monotonic loading (for one screw). This figure shows measurements
from LDTs on both sides of the specimens.

71
Figure 3.13: Load-slip behaviour of plasterboard sheathing-to-top hat section
connections under monotonic loading (mean values obtained for one screw)
Figure 3.14: Load-slip behaviour of plasterboard sheathing-to-channel section
connections under monotonic loading (mean values obtained for one screw)
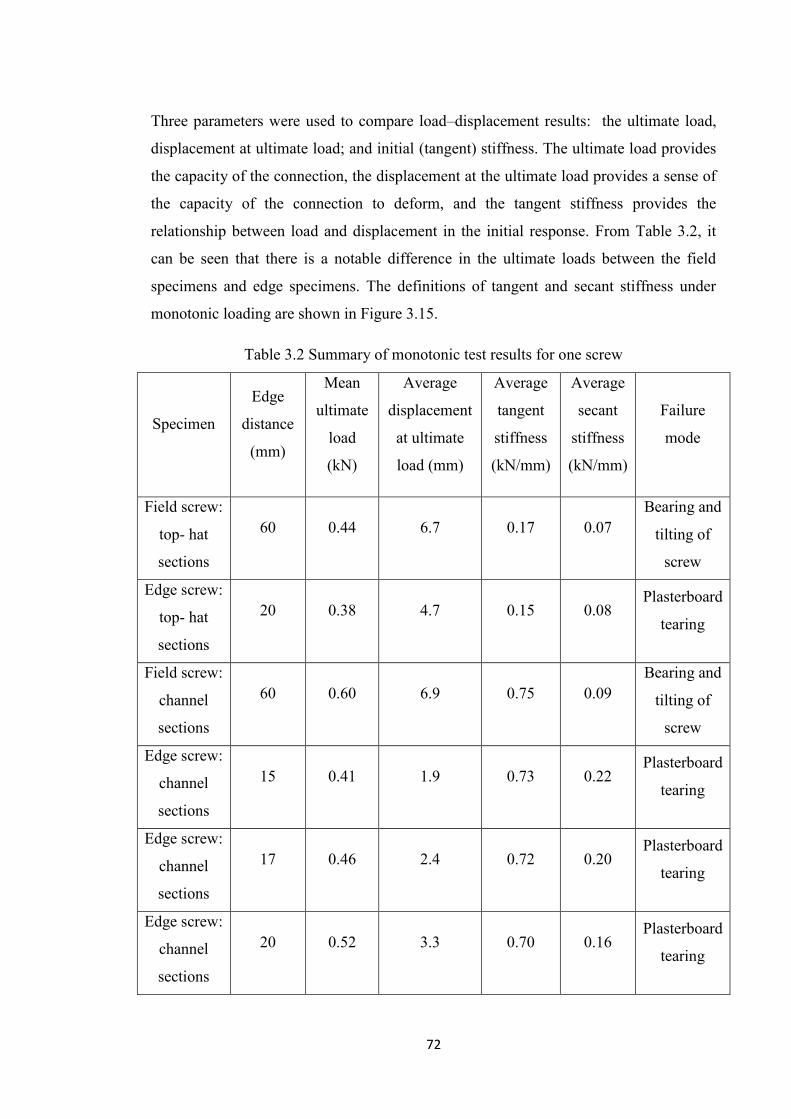
72
Three parameters were used to compare load–displacement results: the ultimate load,
displacement at ultimate load; and initial (tangent) stiffness. The ultimate load provides
the capacity of the connection, the displacement at the ultimate load provides a sense of
the capacity of the connection to deform, and the tangent stiffness provides the
relationship between load and displacement in the initial response. From Table 3.2, it
can be seen that there is a notable difference in the ultimate loads between the field
specimens and edge specimens. The definitions of tangent and secant stiffness under
monotonic loading are shown in Figure 3.15.
Table 3.2 Summary of monotonic test results for one screw
Specimen
Edge
distance
(mm)
Mean
ultimate
load
(kN)
Average
displacement
at ultimate
load (mm)
Average
tangent
stiffness
(kN/mm)
Average
secant
stiffness
(kN/mm)
Failure
mode
Field screw:
top- hat
sections
60 0.44 6.7 0.17 0.07 Bearing and
tilting of
screw
Edge screw:
top- hat
sections
20 0.38 4.7 0.15 0.08 Plasterboard
tearing
Field screw:
channel
sections
60 0.60 6.9 0.75 0.09 Bearing and
tilting of
screw
Edge screw:
channel
sections
15 0.41 1.9 0.73 0.22 Plasterboard
tearing
Edge screw:
channel
sections
17 0.46 2.4 0.72 0.20 Plasterboard
tearing
Edge screw:
channel
sections
20 0.52 3.3 0.70 0.16 Plasterboard
tearing
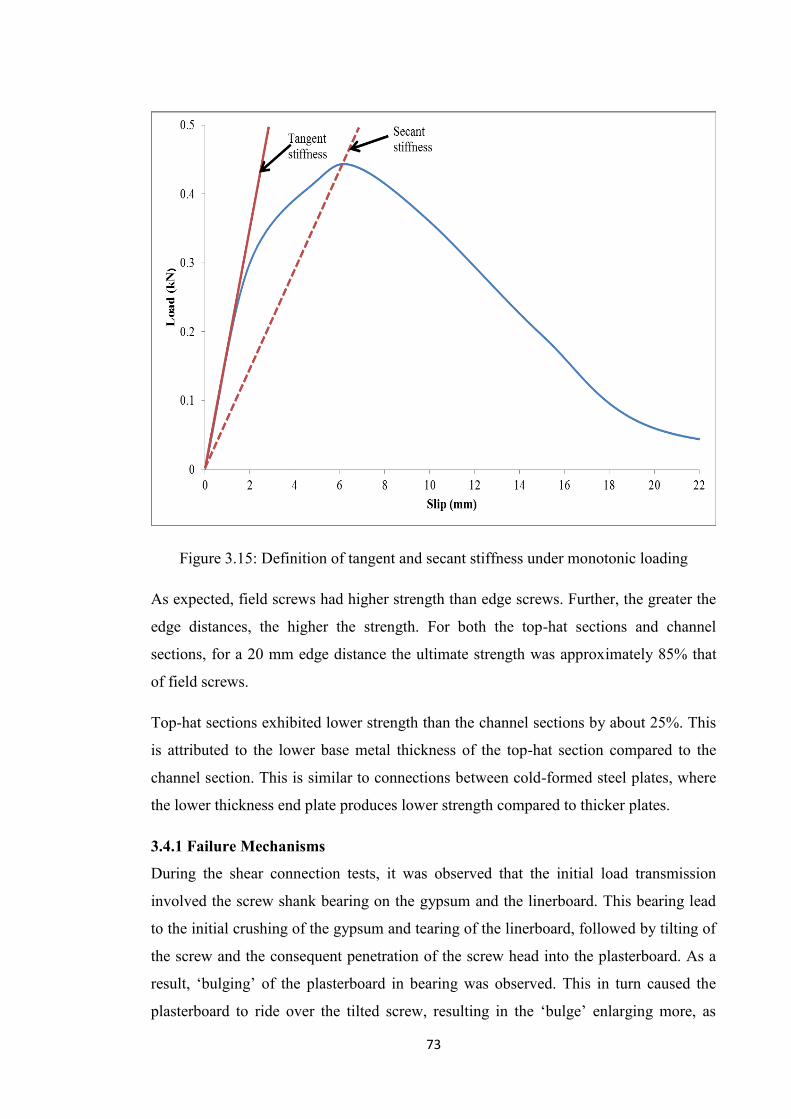
73
Figure 3.15: Definition of tangent and secant stiffness under monotonic loading
As expected, field screws had higher strength than edge screws. Further, the greater the
edge distances, the higher the strength. For both the top-hat sections and channel
sections, for a 20 mm edge distance the ultimate strength was approximately 85% that
of field screws.
Top-hat sections exhibited lower strength than the channel sections by about 25%. This
is attributed to the lower base metal thickness of the top-hat section compared to the
channel section. This is similar to connections between cold-formed steel plates, where
the lower thickness end plate produces lower strength compared to thicker plates.
3.4.1 Failure Mechanisms
During the shear connection tests, it was observed that the initial load transmission
involved the screw shank bearing on the gypsum and the linerboard. This bearing lead
to the initial crushing of the gypsum and tearing of the linerboard, followed by tilting of
the screw and the consequent penetration of the screw head into the plasterboard. As a
result, ‘bulging’ of the plasterboard in bearing was observed. This in turn caused the
plasterboard to ride over the tilted screw, resulting in the ‘bulge’ enlarging more, as
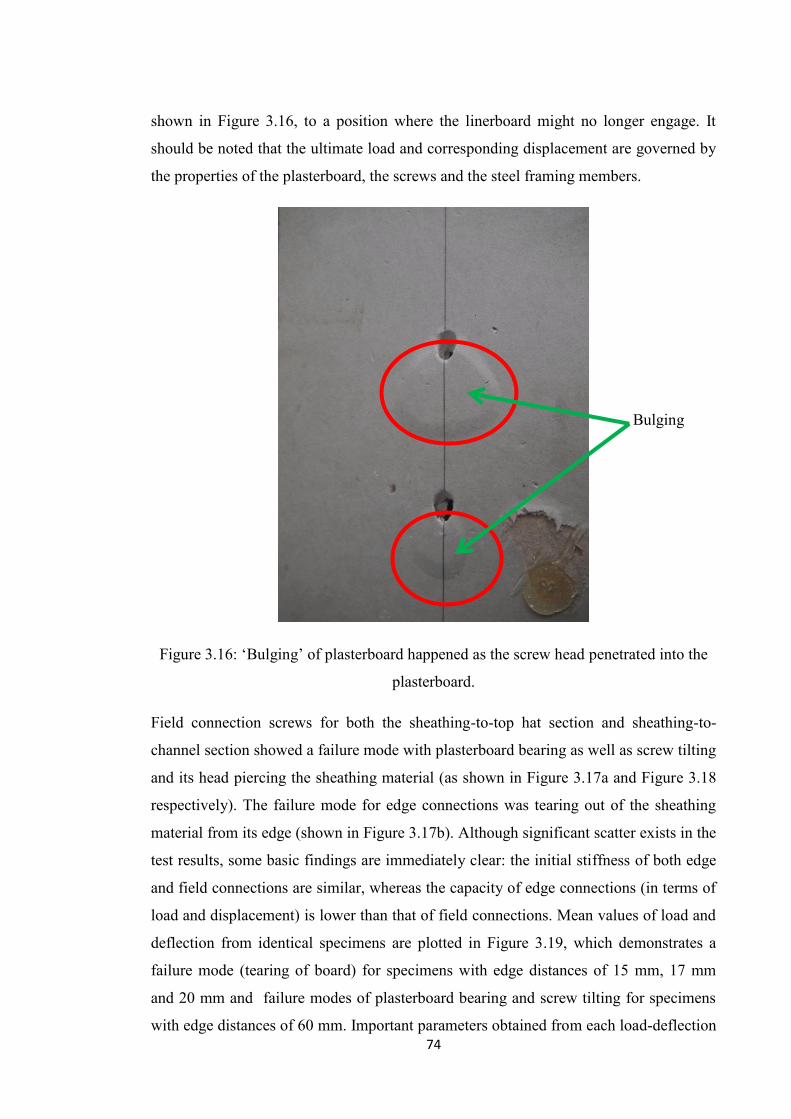
74
shown in Figure 3.16, to a position where the linerboard might no longer engage. It
should be noted that the ultimate load and corresponding displacement are governed by
the properties of the plasterboard, the screws and the steel framing members.
Figure 3.16: ‘Bulging’ of plasterboard happened as the screw head penetrated into the
plasterboard.
Field connection screws for both the sheathing-to-top hat section and sheathing-to-
channel section showed a failure mode with plasterboard bearing as well as screw tilting
and its head piercing the sheathing material (as shown in Figure 3.17a and Figure 3.18
respectively). The failure mode for edge connections was tearing out of the sheathing
material from its edge (shown in Figure 3.17b). Although significant scatter exists in the
test results, some basic findings are immediately clear: the initial stiffness of both edge
and field connections are similar, whereas the capacity of edge connections (in terms of
load and displacement) is lower than that of field connections. Mean values of load and
deflection from identical specimens are plotted in Figure 3.19, which demonstrates a
failure mode (tearing of board) for specimens with edge distances of 15 mm, 17 mm
and 20 mm and failure modes of plasterboard bearing and screw tilting for specimens
with edge distances of 60 mm. Important parameters obtained from each load-deflection
Bulging

75
curves, including tangent and secant stiffness (refer to Figure 3.15), peak strength, and
deflection at peak strength, are provided in Table 3.2.
(a) Field screw
(b) Edge screw
Figure 3.17: Failure modes of plasteroard sheathing-to-top hat section connections
under monotonic loading (a) field screw, and (b) edge screw

76
Figure 3.18: Failure modes of field screw connection tests of sheathing-to- channel
section framing connections under monotonic loading
3.4.2 Effect of Edge Distance
The effect of edge distance on the specimens in the shear connection tests is
demonstrated in Figure 3.19. All of the specimens failed by tear-out of plasterboard
edges, as shown in Figure 3.20. For specimens with 20 mm edge distance, the
plasterboard developed the load required to tear the gypsum ahead of the screw and
keep that constant load until finally tearing through the edge of the plasterboard.
Therefore, the deformation of the specimen up to failure is a function of the edge
distance. The edge shear connections with 15 mm, 17 mm and 20 mm edge distance
reached their ultimate loads at relatively small displacements compared to the field
screw shear connections. At an edge distance of 15 mm, the shear capacity of the
plasterboard in tearing is not totally involved before the failure spreads to the edge of
the board. Edge distance is significant in determining both the strength and deformation
capacity of screws connected to plasterboard.

77
Figure 3.19: Load-slip behaviour of plasterboard sheathing-to-channel section
connections for different edge distances under monotonic loading (mean values
obtained for one screw)
(a) Edge distance-15 mm
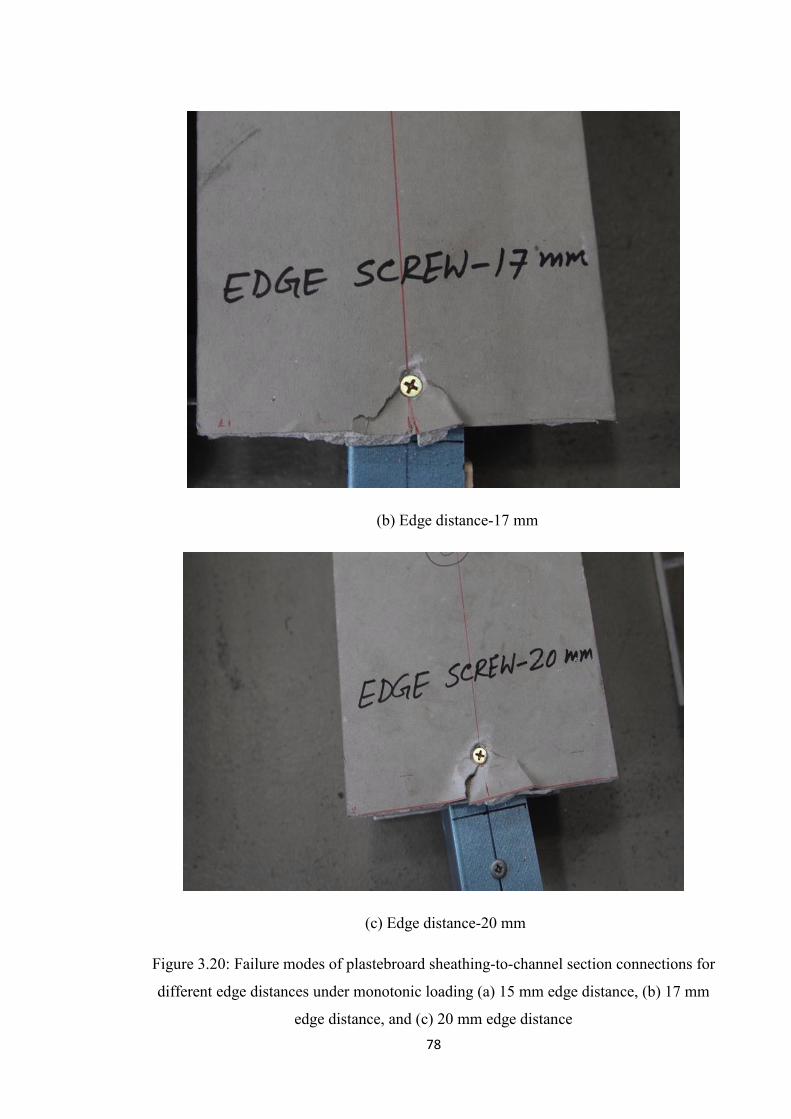
78
(b) Edge distance-17 mm
(c) Edge distance-20 mm
Figure 3.20: Failure modes of plastebroard sheathing-to-channel section connections for
different edge distances under monotonic loading (a) 15 mm edge distance, (b) 17 mm
edge distance, and (c) 20 mm edge distance
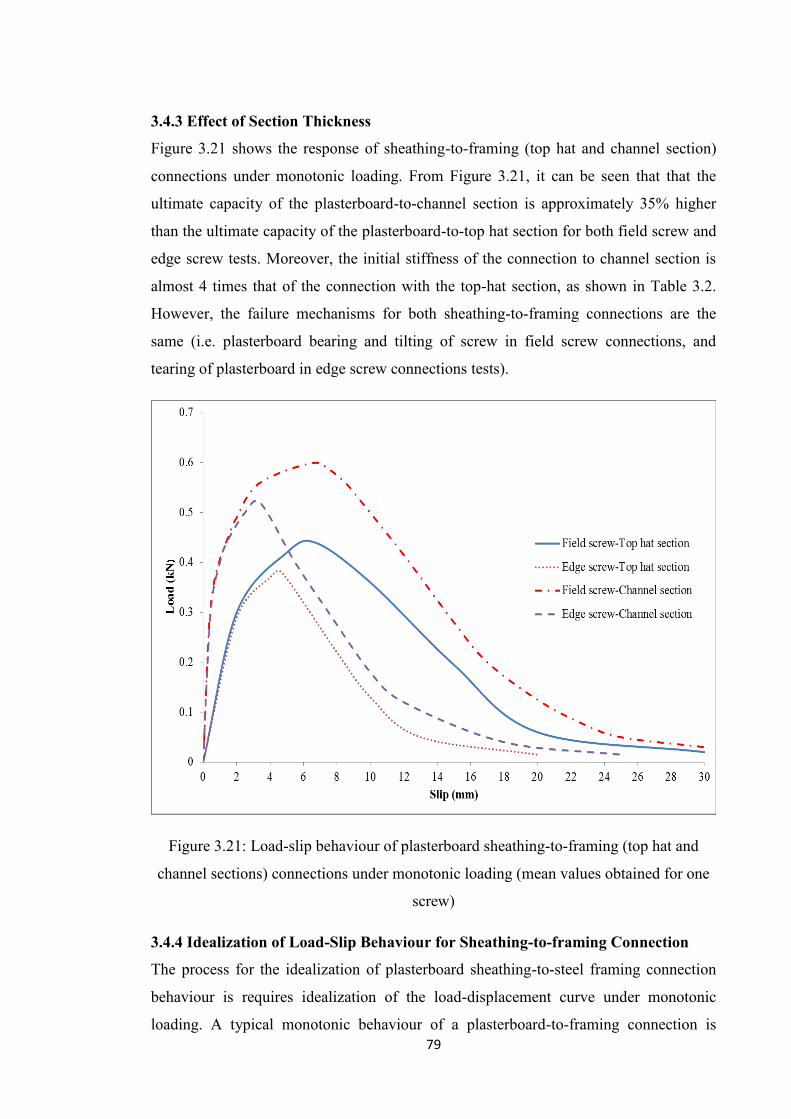
79
3.4.3 Effect of Section Thickness
Figure 3.21 shows the response of sheathing-to-framing (top hat and channel section)
connections under monotonic loading. From Figure 3.21, it can be seen that that the
ultimate capacity of the plasterboard-to-channel section is approximately 35% higher
than the ultimate capacity of the plasterboard-to-top hat section for both field screw and
edge screw tests. Moreover, the initial stiffness of the connection to channel section is
almost 4 times that of the connection with the top-hat section, as shown in Table 3.2.
However, the failure mechanisms for both sheathing-to-framing connections are the
same (i.e. plasterboard bearing and tilting of screw in field screw connections, and
tearing of plasterboard in edge screw connections tests).
Figure 3.21: Load-slip behaviour of plasterboard sheathing-to-framing (top hat and
channel sections) connections under monotonic loading (mean values obtained for one
screw)
3.4.4 Idealization of Load-Slip Behaviour for Sheathing-to-framing Connection
The process for the idealization of plasterboard sheathing-to-steel framing connection
behaviour is requires idealization of the load-displacement curve under monotonic
loading. A typical monotonic behaviour of a plasterboard-to-framing connection is

80
shown in Figure 3.22. The figure also shows the segments of data used to determine
each of the parameters. From the load-slip curves shown in Figure 3.22, it can be stated
that the shapes of the curves are characterised by a realistically linear segment followed
by a transition to plastic behaviour. The load at which plastic behaviour starts; and the
deflection at failure are greatly influenced by the geometry of the test. This was
observed during the failures of the shear connections. The load-displacement behaviour
of the connections between the plasterboard and framing, particularly the deflection at
failure, is a function of the orientation of loading on the fastener, as described by
Walker et al. (1982).
Figure 3.22: Load-slip behaviour of sheathing-to-framing connection under monotonic
loading
The load-slip curve can be illustrated using three regions. In Region I (initial stiffness),
the behaviour is initially linear (i.e. the increase of load is proportional to the
corresponding increase of displacement). In this region, the sheathing, framing material,
and screws are fundamentally elastic. In Region II (secondary stiffness), non-linear
behaviour characterizes the curve. The non-linearity occurs as sheathing screws start to
tilt. In Region III (tertiary stiffness), the load capacity of the specimen decreases with
81
increasing displacement. This region can be approached using a negative linear
relationship.
3.5 Summary and Conclusions
This chapter has discussed the first phase of the experimental program, the shear
connection tests. The details of the test set-up, test specimens and testing procedure are
described. Since the failure mechanism of shear connection is the foundation for the
evaluation of plasterboard performance, a detailed analysis of shear connection failure
mechanisms is presented. Detailed observation of the failure mechanism of the
connection between the plasterboard and steel framing members through the connecting
screws is also presented. The key findings can be summarised as follows:
For all the edge screw shear connection tests, the failure mode for edge
connections was tearing out of the sheathing material from its edge.
Field screw shear connections showed failure modes of plasterboard bearing as
well as screw tilting and the screw head piercing the sheathing material.
Edge shear connections with 20 mm edge distance achieved approximately 85%
of the ultimate loads of the field screws with the same plasterboard and steel
member
Edge shear connections with 15 mm, 17 mm and 20 mm edge distances reached
their ultimate loads at relatively small displacements compared to the field screw
shear connections.
The ultimate capacity of the plasterboard-to-channel section connection is
approximately 35% higher than that of the plasterboard -to-top hat section for
both field screw and edge screw tests. The initial stiffness of the connection to
the channel section is almost 4 times that of the connection with the top-hat
section. This is due to the greater thickness of the channel sections.

82
CHAPTER 4
EXPERIMENTAL PROGRAM (PHASE II): FULL-SCALE TESTING OF CEILING DIAPHRAGM IN CANTILEVER CONFIGURATION
4.1 Introduction
It is essential to conduct full-scale testing in order to develop understanding of the
behaviour and response of steel-framed domestic structures under lateral loading (e.g.
wind and earthquake loads). Experimental test results are also crucial to validate
analytical models.
This chapter presents the second phase of the experimental program, the testing of a
segment of a ceiling diaphragm as a cantilever wall in racking. The details of the test
specimens, test methods, instrumentation and data acquisition system are reported. The
results, analyses and conclusions obtained from this phase of the experimental program
are also reported.
4.2 Experimental Arrangement
The most common method for determining the in-plane strength and stiffness of ceiling
diaphragms is laboratory testing of full-scale diaphragm segments. Construction and
testing procedures for such assemblies are available in the ASTM E455-04 ‘Standard
Test Method for Static Load Testing of Framed Floor or Roof Diaphragm Constructions
for Buildings’. There are two different configurations for testing the diaphragm
assembly, namely: a cantilever set-up; and a simple beam set-up as shown in Figure 4.1.
In the cantilever set-up, the diaphragm is essentially tested in racking as a shear wall,
while in the beam set-up the diaphragm is tested as a deep beam in bending (Saifullah et
al. 2014). Both set-ups were employed in this research and the results for two
configurations are reported here. This chapter describes the ceiling diaphragm tests in
cantilever assembly, and the ceiling diaphragm tests in beam configuration are
illustrated in Chapter 5.
The diaphragm test assembly is almost identical to the typical ceiling diaphragm
construction of the steel-framed domestic structures in Australia. The sizes of the
specimens are restricted, due to the testing facilities available in the Smart Structures
Laboratory at Swinburne University of Technology.

83
(a) Cantilever test
(b) Beam test
Figure 4.1: Configuration of ceiling diaphragm testing systems (a) Cantilever/racking
test assembly, (b) beam test assembly

84
4.3 Testing Program
In organizing the experimental testing program, it was desired that the test specimen
should resemble what is used in practice and as large as could be suitably fitted within
the laboratory facilities. Specimens with a height of 2.25 m and width of 2.4 m were
chosen to fit within the available test rig. The ceiling was made out of standard full-
scale components and made to resemble a ceiling of a small room within a domestic
structure.
4.3.1 Test Set up
Ceiling diaphragm tests in the cantilever test assembly (shown in Figure 4.1) are
illustrated. It should be noted that the cantilever test requires less space in the laboratory
compared to the simple beam test assembly. An experimental test set-up for racking
tests is shown in Figure 4.2. The ceiling panel was placed in vertical position and was
mounted on a loading frame.
Figure 4.2 Test set-up and instrumentation for cantilever test
In the cantilever test set-up, the two end vertical members experience tension and compression (push-pull) forces generated by the horizontal racking force. The tension

85
member needs to be restrained from unrealistic uplift otherwise premature failure may occur. Such restraints would be totally artificial and hard to practically replicate a ceiling system, unlike shear or bracing walls. Given that the purpose of this test was to obtain the shear resistance of a ceiling panel, a loading frame (parallelogram) was developed to apply the racking load which would also resist the tension and compression forces, negating the need to provide supplementary restraints to the ceiling members.
The loading frame, shown in Figure 4.3, was made of hot rolled steel channel sections
with two horizontal members (top and bottom) and three vertical members. All
members were connected to each other with a single bolt to allow free rotation (i.e., all
members were truly pin connected). The bottom of the frame was anchored to the
concrete floor of the Smart Structures Laboratory using M20 threaded rods spaced at
500 mm centres. The top of the frame was restrained in the out-of-plane direction for
stability.
Figure 4.3: Photograph of loading frame with ceiling bottom chords and ceiling battens
mounted on it.
Loading frame
Bottom chord
Ceiling batten

86
4.3.2 Test Specimen
In this stage, tests of three full-scale ceiling diaphragms in cantilever tests were conducted. All the tests had the same dimensions. All plasterboard sheets and framing members had the same properties. The plasterboard screws were 6G-18 x 25 mm plasterboard screws. It should be noted that adhesive was not used on these diaphragm specimens.
To maintain consistency with the specimens of the shear connection tests described in Chapter 3, the same plasterboard type was used for the cantilever tests. Similar to the ceiling battens used in the shear connection tests in Chapter 3, the ceiling battens were made of G550 Top-hat 22 cold-formed steel sections manufactured by BlueScope Pty. Ltd. The three ceiling diaphragms specimens were fixed according to the provisions stated in the Gyprock Ceiling System Installation Guide (2008) and the Gyprock Residential Installation Guide (2010).
A typical detail of the ceiling panel configuration associated with its cold-formed steel
frame members is shown in Figure 4.4. The test specimen simulated a section of a
typical plasterboard ceiling, whereby the plasterboard is attached to battens which in
turn are fixed to the bottom chords of roof trusses.
Figure 4.4 Ceiling panel configurations along with connection details
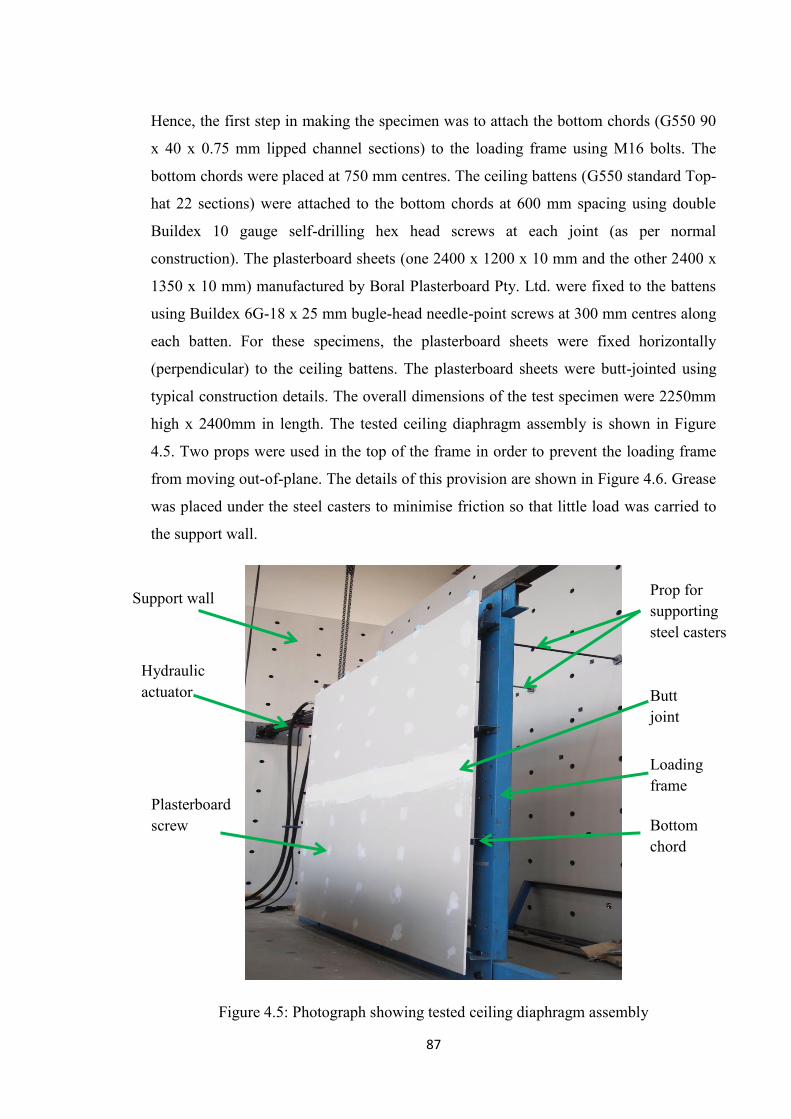
87
Hence, the first step in making the specimen was to attach the bottom chords (G550 90
x 40 x 0.75 mm lipped channel sections) to the loading frame using M16 bolts. The
bottom chords were placed at 750 mm centres. The ceiling battens (G550 standard Top-
hat 22 sections) were attached to the bottom chords at 600 mm spacing using double
Buildex 10 gauge self-drilling hex head screws at each joint (as per normal
construction). The plasterboard sheets (one 2400 x 1200 x 10 mm and the other 2400 x
1350 x 10 mm) manufactured by Boral Plasterboard Pty. Ltd. were fixed to the battens
using Buildex 6G-18 x 25 mm bugle-head needle-point screws at 300 mm centres along
each batten. For these specimens, the plasterboard sheets were fixed horizontally
(perpendicular) to the ceiling battens. The plasterboard sheets were butt-jointed using
typical construction details. The overall dimensions of the test specimen were 2250mm
high x 2400mm in length. The tested ceiling diaphragm assembly is shown in Figure
4.5. Two props were used in the top of the frame in order to prevent the loading frame
from moving out-of-plane. The details of this provision are shown in Figure 4.6. Grease
was placed under the steel casters to minimise friction so that little load was carried to
the support wall.
Figure 4.5: Photograph showing tested ceiling diaphragm assembly
Plasterboard screw
Prop for supporting steel casters
Loading frame
Support wall
Hydraulic actuator
Bottom chord
Butt joint

88
Figure 4.6: Photograph showing steel casters to prevent the ceiling specimen from
moving out-of-plane.
During loading, it was noted that the bottom chord members started to twist gradually
(see Figure 4.10) with the increase of the load, but with no damage to the tested
specimen. This phenomenon is illustrated in detail in Section 4.4. The load was released
to recover the problem. The testing arrangement was modified to eliminate the
unrealistic twisting of the bottom chord sections. The ends of the bottom chords were
blocked using timber sections (for specimen #1 and specimen #2) and stud sections (for
specimen 3) to prevent section twisting. The front and back of the overall test set-up
using timber sections are shown in Figure 4.7. Moreover, Figure 4.8 shows the overall
test set-up using stud sections to prevent twisting of the bottom chords.
Steel casters

89
(a)
Figure 4.7: Photograph of specimen (after modification) using timber sections between
bottom chords to prevent twisting of bottom chords (a) front view of the specimen, (b)
holding the specimen from the back
Timber sections

90
Figure 4.8: Photograph showing using stud sections along the length of specimens to
prevent twisting of bottom chords
Table 4.1 shows the basic test matrix of all specimens. It should be mentioned that all of
the three specimens were tested under monotonic loading.
Table 4.1 Matrix of test specimens under monotonic loading
Specimen Dimensions
(mm x mm)
Batten
spacing
(mm)
Bottom chord
spacing (mm)
Loading
direction
to failure
End restraint
to prevent
twisting
Specimen #1 2250 x 2400 600 750 Pushing Timber
sections
Specimen #2 2250 x 2400 600 750 Pulling Timber
sections
Specimen #3 2250 x 2400 600 750 Pulling Stud sections
Stud sections
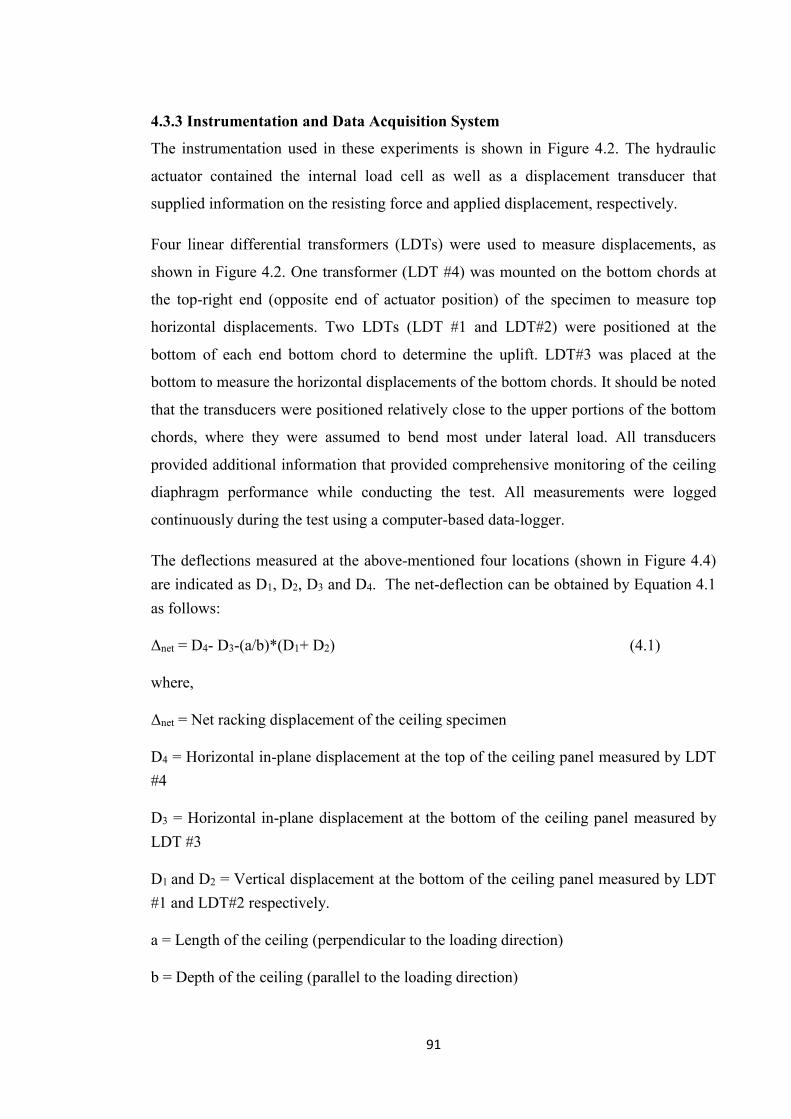
91
4.3.3 Instrumentation and Data Acquisition System
The instrumentation used in these experiments is shown in Figure 4.2. The hydraulic
actuator contained the internal load cell as well as a displacement transducer that
supplied information on the resisting force and applied displacement, respectively.
Four linear differential transformers (LDTs) were used to measure displacements, as
shown in Figure 4.2. One transformer (LDT #4) was mounted on the bottom chords at
the top-right end (opposite end of actuator position) of the specimen to measure top
horizontal displacements. Two LDTs (LDT #1 and LDT#2) were positioned at the
bottom of each end bottom chord to determine the uplift. LDT#3 was placed at the
bottom to measure the horizontal displacements of the bottom chords. It should be noted
that the transducers were positioned relatively close to the upper portions of the bottom
chords, where they were assumed to bend most under lateral load. All transducers
provided additional information that provided comprehensive monitoring of the ceiling
diaphragm performance while conducting the test. All measurements were logged
continuously during the test using a computer-based data-logger.
The deflections measured at the above-mentioned four locations (shown in Figure 4.4) are indicated as D1, D2, D3 and D4. The net-deflection can be obtained by Equation 4.1 as follows:
Δnet = D4- D3-(a/b)*(D1+ D2) (4.1)
where,
Δnet = Net racking displacement of the ceiling specimen
D4 = Horizontal in-plane displacement at the top of the ceiling panel measured by LDT #4
D3 = Horizontal in-plane displacement at the bottom of the ceiling panel measured by LDT #3
D1 and D2 = Vertical displacement at the bottom of the ceiling panel measured by LDT #1 and LDT#2 respectively.
a = Length of the ceiling (perpendicular to the loading direction)
b = Depth of the ceiling (parallel to the loading direction)

92
4.3.4 Loading
Only monotonic loading conditions were applied for the cantilever test. All tests were
performed in the displacement-controlled method. The specimens were loaded at the
rate of 2 mm/min. All the three ceiling specimens were pulled and pushed to accomplish
a complete cycle at serviceability displacement (usually equal to height/300 which is
approximately 8 mm for a 2250 mm length ceiling) before they were pulled to failure.
4.4 Results and Discussions
4.4.1 Loading Frame Friction
While the loading frame was assumed to be a mechanism without a lateral strength, an
initial racking test was performed on the loading frame only (i.e., without the ceiling) to
ensure that it had very little in-plane stiffness. The frame used in the test panel was
loaded in three different stages. In the first stage, the frame was pulled at the rate of 3
mm/min up to 8 mm, and then pushed at the same rate up to 8 mm. In the second stage,
the frame was pulled up to 45 mm and then pushed up to 45 mm at 3 mm/min. In the
final stage, to observe the effect of loading rate on the behaviour of the frame, the frame
was loaded at the rate of 10 mm/min up to the displacement of 45 mm in the pulling
direction and then the pushing direction up to 45 mm. The resulting load vs. deflection
curves of the loading frame are shown in Figure 4.9.
Figure 4.9: Load vs. deflection curves of loading frame only

93
It can be seen that the maximum load restraint of the frame due to friction was
approximately 0.2 kN. It is also observed that there are no significant differences of
magnitude of load with the application of load at different rates.
4.4.2 Discussion of Test Results
For specimen #1, it was observed that the bottom chord members started to twist at a
load of 1.7 kN with the corresponding deflection of 35 mm (shown in Figure 4.10).
With the increase of the load, the bottom chords were twisted gradually. At a load of 2.0
kN and corresponding deflection of 42 mm, LDT lost the contact from steel sections
(shown in Figure 4.11), but no damage to the specimen was observed. The load was
released to resolve this problem. The testing arrangement was modified to remove the
twisting of the bottom chord sections. The ends of the bottom chords were blocked
using timber sections (for specimen #1 and specimen #2) and stud sections (for
specimen #3) to prevent unrealistic section twisting, as described in Section 4.3.
Figure 4.10: Starting of the twisting of bottom chord sections at the load of 1.7 kN and
corresponding displacement of 35 mm.
94
Figure 4.11: Separation of LDT from the contact of sections at the load of 2.0 kN and
with the corresponding displacement of 42 mm
After modification using timber members to prevent twisting of the bottom chord
sections, specimen #1 was again pushed and pulled to accomplish a complete cycle at
serviceability displacement (8 mm) and the specimen failed in applying loading by
pushing. In order to investigate the variation in results due to specimen failure between
pushing and pulling, the researcher performed testing of specimen #2 by applying
loading in pulling direction until failure. The resulting load versus net deflection curves
for specimen #1 and specimen #2 are shown in Figure 4.12 and Figure 4.13
respectively.
Specimen #3 was modified using stud sections in order to prevent twisting of the
bottom chord sections. The specimen was pulled and pushed to accomplish a complete
cycle at serviceability displacement (8 mm) and the specimen failed in applying loading
in the pulling direction. The resulting load versus net deflection curve for the specimens
is shown in Figure 4.14. It should be noted that the initial loading cycle (±8 mm)
represents serviceability loading before the diaphragm specimens were loaded to failure.
The resulting ultimate loads and their corresponding displacements of the three
specimens are listed in Table 4.2. It should be noted that the maximum load capacity of
the frame due to friction was approximately 0.2 kN and this value was deducted from
the test results. Specific numbering of members and plasterboard screws is also shown
in Figure 4.15 to aid the explanation of the failure mode.
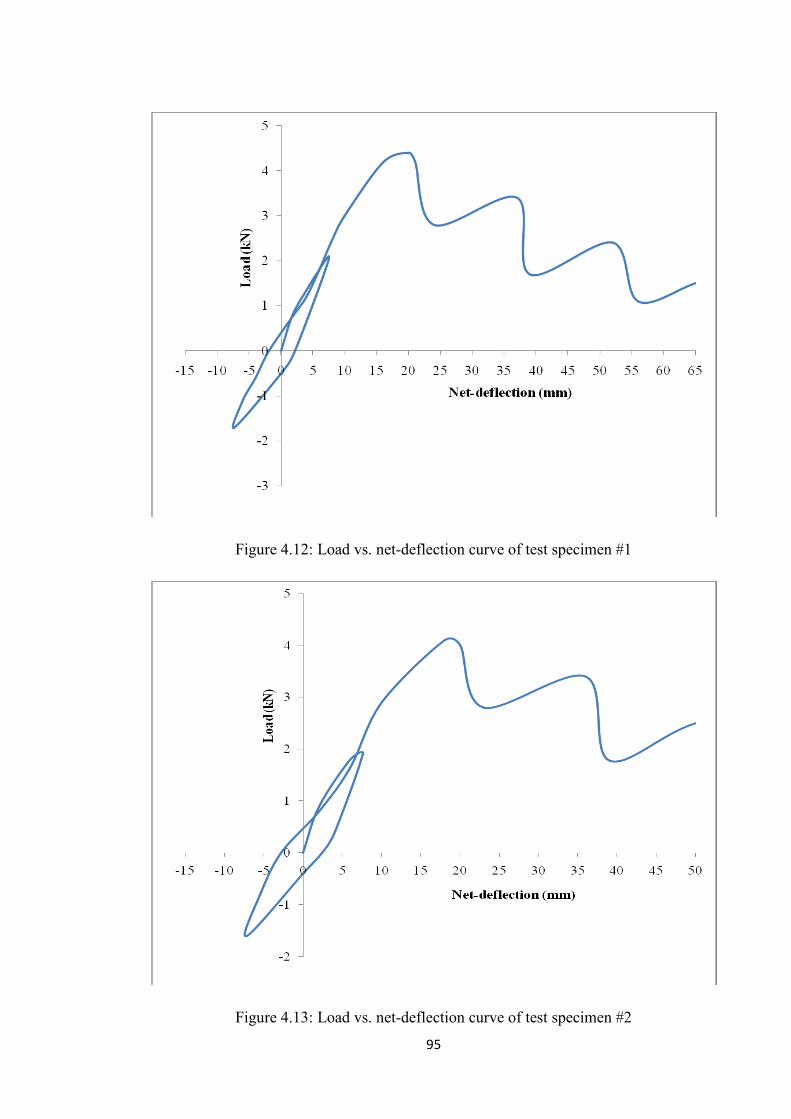
95
Figure 4.12: Load vs. net-deflection curve of test specimen #1
Figure 4.13: Load vs. net-deflection curve of test specimen #2
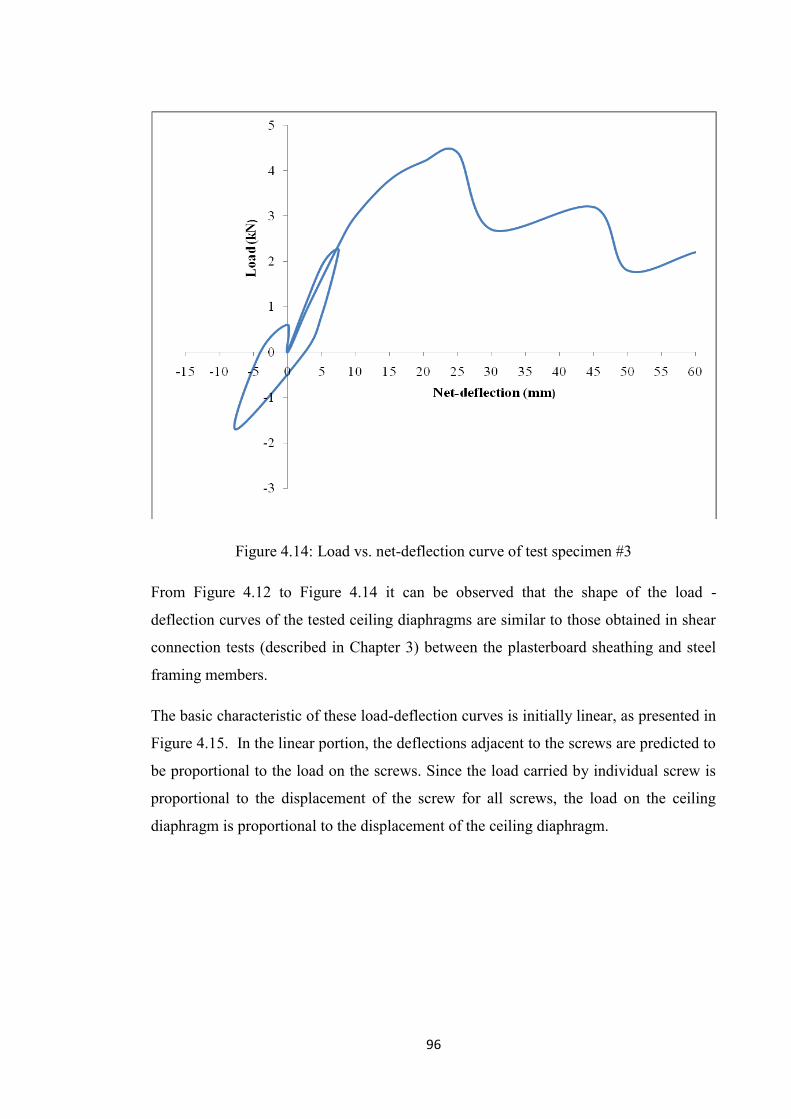
96
Figure 4.14: Load vs. net-deflection curve of test specimen #3
From Figure 4.12 to Figure 4.14 it can be observed that the shape of the load -
deflection curves of the tested ceiling diaphragms are similar to those obtained in shear
connection tests (described in Chapter 3) between the plasterboard sheathing and steel
framing members.
The basic characteristic of these load-deflection curves is initially linear, as presented in
Figure 4.15. In the linear portion, the deflections adjacent to the screws are predicted to
be proportional to the load on the screws. Since the load carried by individual screw is
proportional to the displacement of the screw for all screws, the load on the ceiling
diaphragm is proportional to the displacement of the ceiling diaphragm.

97
Figure 4.15: Load-deflection behaviour of tested ceiling diaphragms under monotonic
loading
With the increase of the force in the diaphragm, the screws near the corner of the
diaphragm approach their transition state. Therefore, the force carried by these screws is
smaller than the linear behaviour. As a result, the overall behaviour of the diaphragm is
no longer linear behaviour. With further increase of applied displacement on the
diaphragm, screws at the corners of the tension diagonal fail, with the failure mode
shown in Figure 4.17. Significant load redistribution takes place and this ceiling panel
behaviour diverges considerably from the linear behaviour. At this stage, other
connections adjacent the tension diagonal corners also move into their transition state.
However, they can withstand load for much higher deflections due to these connections,
as shown in Figure 4.12 to Figure 4.14.
With further increases in load, more connections transfer to the transition state of their
load-deflection curve, resulting the deflection of the diaphragm as an entire to be
considerably higher than the linear behaviour. Considerable redistribution of the load
occurs, and screws near the centre of the plasterboard, which have a large plastic region
in their load-deflection curve, carry greater loads.
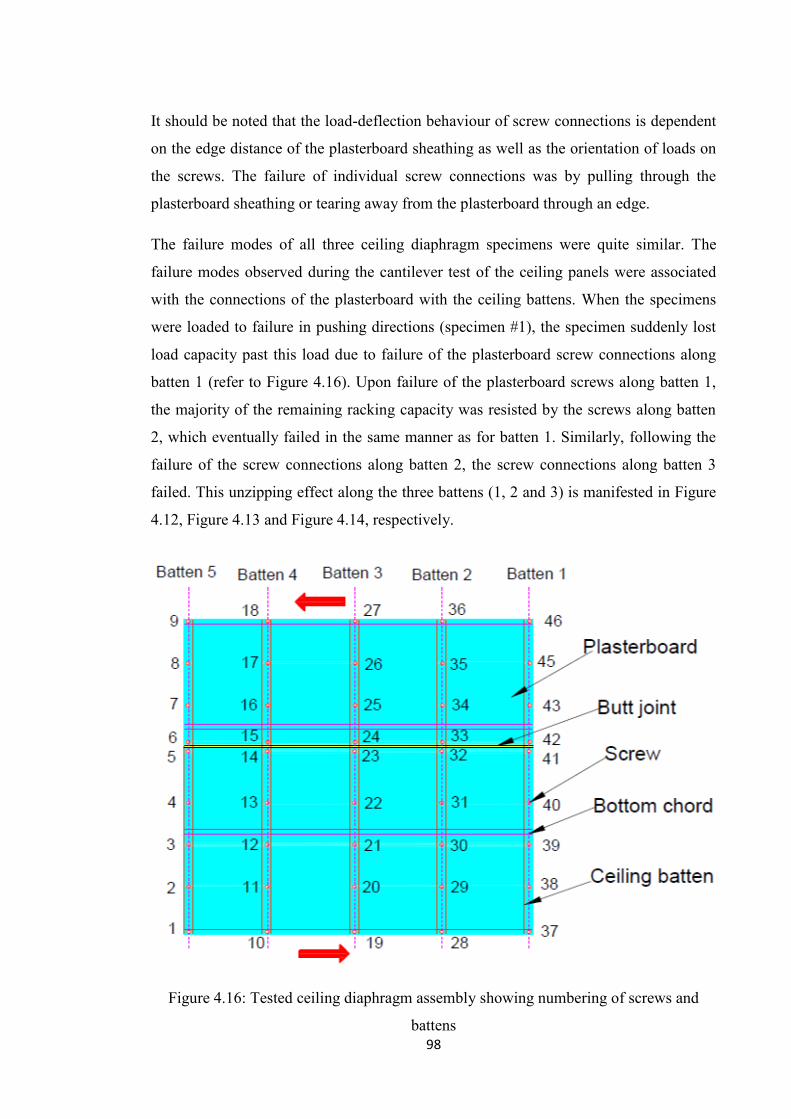
98
It should be noted that the load-deflection behaviour of screw connections is dependent
on the edge distance of the plasterboard sheathing as well as the orientation of loads on
the screws. The failure of individual screw connections was by pulling through the
plasterboard sheathing or tearing away from the plasterboard through an edge.
The failure modes of all three ceiling diaphragm specimens were quite similar. The
failure modes observed during the cantilever test of the ceiling panels were associated
with the connections of the plasterboard with the ceiling battens. When the specimens
were loaded to failure in pushing directions (specimen #1), the specimen suddenly lost
load capacity past this load due to failure of the plasterboard screw connections along
batten 1 (refer to Figure 4.16). Upon failure of the plasterboard screws along batten 1,
the majority of the remaining racking capacity was resisted by the screws along batten
2, which eventually failed in the same manner as for batten 1. Similarly, following the
failure of the screw connections along batten 2, the screw connections along batten 3
failed. This unzipping effect along the three battens (1, 2 and 3) is manifested in Figure
4.12, Figure 4.13 and Figure 4.14, respectively.
Figure 4.16: Tested ceiling diaphragm assembly showing numbering of screws and
battens
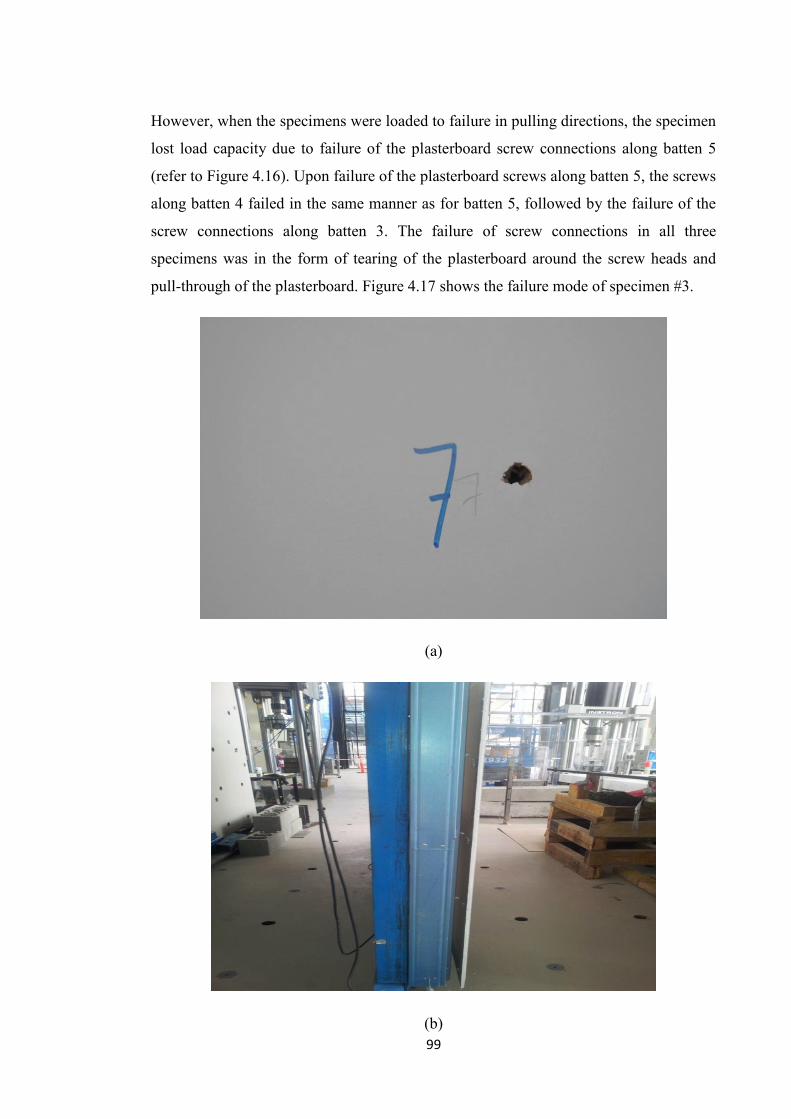
99
However, when the specimens were loaded to failure in pulling directions, the specimen
lost load capacity due to failure of the plasterboard screw connections along batten 5
(refer to Figure 4.16). Upon failure of the plasterboard screws along batten 5, the screws
along batten 4 failed in the same manner as for batten 5, followed by the failure of the
screw connections along batten 3. The failure of screw connections in all three
specimens was in the form of tearing of the plasterboard around the screw heads and
pull-through of the plasterboard. Figure 4.17 shows the failure mode of specimen #3.
(a)
(b)

100
(c)
Figure 4.17: Failure modes of cantilever specimen: (a) tearing of plasterboard around
screws along batten 1; (b) pulling through of plasterboard; (c) view of plasterboard from
the back
There was no relative movement observed between the individual plasterboard sheets
and no cracks were observed in all three specimens. The entire plasterboard lining
rotated as a single unit, as shown in Figure 4.18, rather than two plasterboard sheets
rotating individually, signifying that the butt joint between the two plasterboard sheets
almost in the middle of the ceiling diaphragm is sufficiently strong so that both
plasterboard sheets acted as a single continuous diaphragm. Further, no relative
displacement was observed between the ceiling battens and the bottom chords. No
damage was observed for the bottom chords or ceiling battens.
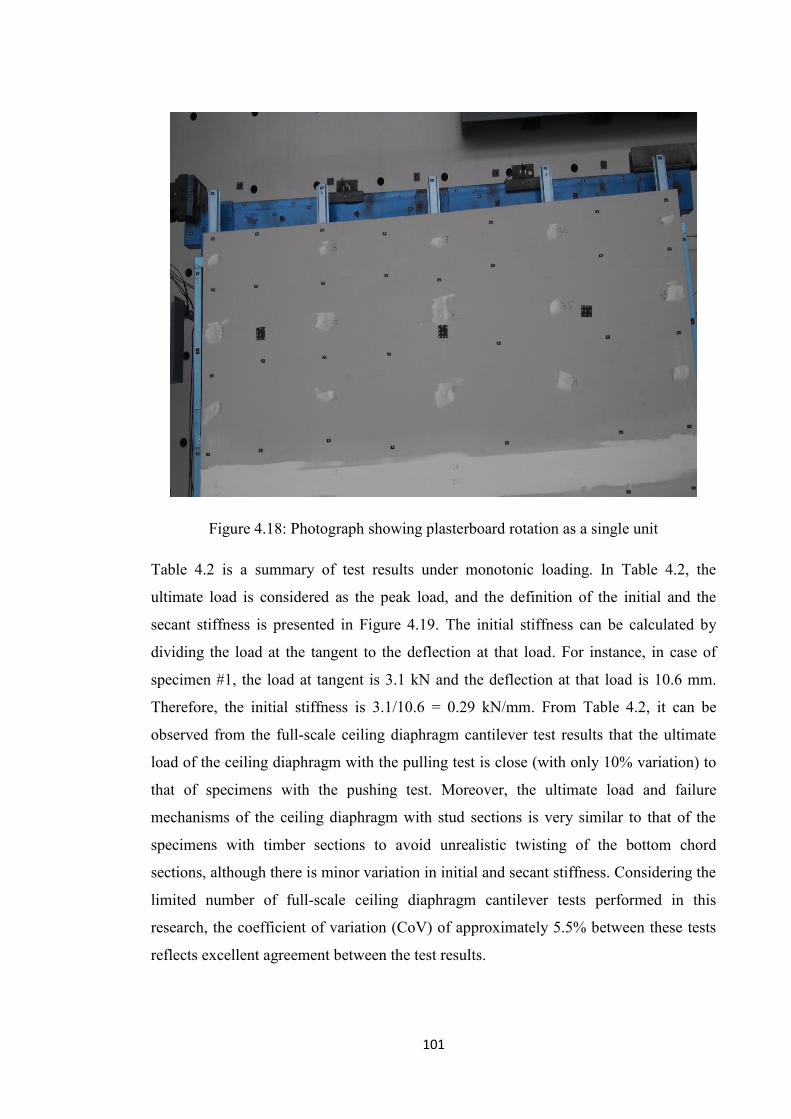
101
Figure 4.18: Photograph showing plasterboard rotation as a single unit
Table 4.2 is a summary of test results under monotonic loading. In Table 4.2, the
ultimate load is considered as the peak load, and the definition of the initial and the
secant stiffness is presented in Figure 4.19. The initial stiffness can be calculated by
dividing the load at the tangent to the deflection at that load. For instance, in case of
specimen #1, the load at tangent is 3.1 kN and the deflection at that load is 10.6 mm.
Therefore, the initial stiffness is 3.1/10.6 = 0.29 kN/mm. From Table 4.2, it can be
observed from the full-scale ceiling diaphragm cantilever test results that the ultimate
load of the ceiling diaphragm with the pulling test is close (with only 10% variation) to
that of specimens with the pushing test. Moreover, the ultimate load and failure
mechanisms of the ceiling diaphragm with stud sections is very similar to that of the
specimens with timber sections to avoid unrealistic twisting of the bottom chord
sections, although there is minor variation in initial and secant stiffness. Considering the
limited number of full-scale ceiling diaphragm cantilever tests performed in this
research, the coefficient of variation (CoV) of approximately 5.5% between these tests
reflects excellent agreement between the test results.
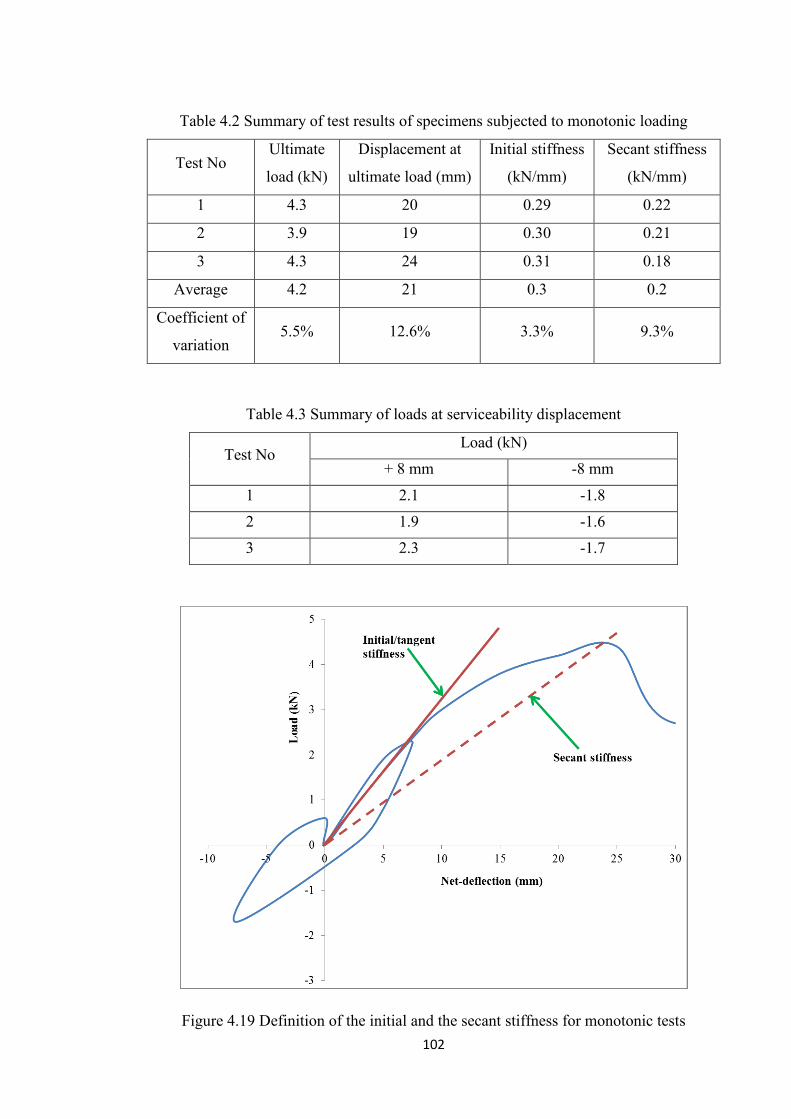
102
Table 4.2 Summary of test results of specimens subjected to monotonic loading
Test No Ultimate
load (kN)
Displacement at
ultimate load (mm)
Initial stiffness
(kN/mm)
Secant stiffness
(kN/mm)
1 4.3 20 0.29 0.22
2 3.9 19 0.30 0.21
3 4.3 24 0.31 0.18
Average 4.2 21 0.3 0.2
Coefficient of
variation 5.5% 12.6% 3.3% 9.3%
Table 4.3 Summary of loads at serviceability displacement
Test No Load (kN)
+ 8 mm -8 mm
1 2.1 -1.8
2 1.9 -1.6
3 2.3 -1.7
Figure 4.19 Definition of the initial and the secant stiffness for monotonic tests

103
From Table 4.2 and Table 4.3, it can be seen that the ultimate loads of specimens were
approximately 40% to 50% higher than the loads at serviceability displacement (±8
mm). Hence, potentially different design values for strength and serviceability can be
provided for such diaphragms.
4.4.3 Estimation of Design Strength
The maximum load that could be supported by the specimen was 4.2 kN. The design
load can be obtained as the ultimate load divided by a sampling factor of 1.93 (as
recommended in the NASH Standard, Residential and Low-rise Steel Framing, Part 1:
Design Criteria 2005, Amendment C: 2011 for three tests) and is expressed as force per
unit depth. The design stiffness can be obtained by dividing the design load on the total
ceiling depth (width of the building parallel to the wind loading direction) to the
deflection measured at that design load. The stiffness is considered at design load
because of the nature of the non-linear elastic load-deflection curve.
According to the NASH standard (Residential and Low-rise Steel Framing, Part 1:
Design Criteria 2005, Amendment C: March 2011), the design value (Rd) must satisfy
either:
Rd = (Rmin / kt-min) or Rd = (Rave / kt-ave)
where,
Rmin = minimum value of the test results;
kt-min = sampling factor
Rave = average value of the test results
kt-ave = sampling factor
According to the NASH standard (Residential and Low-rise Steel Framing, Part 1:
Design Criteria 2005), the value of the coefficient of variation of structural
characteristics (ksc) must be not less than 20% for assembly strength, and 10% for
assembly stiffness, unless a comprehensive test program is used to establish ksc. Based
on the results, the average value of the ultimate load is 4.2 kN. The sampling factor for
use with the average value of three test results = 1.93. The width of the diaphragm is 2.4
104
m. Therefore, the design strength of the tested diaphragm is calculated to be 0.9 kN/m
and is expressed as force per metre depth (i.e., 4.2 kN/2.4m/1.93). The design load is
2.2 kN and the deflection at that load would be 7.3 mm, based on the average tangent
stiffness.
4.5 Summary and Conclusions
The second phase of the experimental program conducted in this research project has
been reported in this chapter. This chapter discusses the results for specimens of ceiling
diaphragms under raking/cantilever testing under monotonic loading. This chapter also
describes the construction of three full-scale ceiling diaphragms specimens, the testing
methodologies including the selection of loading protocols, the testing program and the
testing facilities necessary to perform the tests. Descriptions of the behaviour of the
tested specimens, failure mechanisms, assessment of diaphragm parameters and
conclusions drawn from the experimental tests are also presented in this chapter.
These cantilever tests have highlighted the important aspects of the behaviour,
performance, and load-sharing characteristics of the main components in steel-framed
domestic structures. Additional findings from the test results and analyses are
summarised as follows:
The maximum load capacity of the loading frame due to friction was
approximately 0.2 kN. It is also observed that there are no significant differences
between the magnitudes of frictional resistance with the application of load at
different rates.
For all specimens the ultimate failure mode was found to be the same. In all
cases, the plasterboard connections failed at the locations where maximum
relative movement between the plasterboard and battens occurred.
The failure of screw connections in all three specimens was in the form of
tearing of plasterboard around the screw heads and pull-through of the
plasterboard.
In all specimens, no relative movement was observed between the individual
plasterboard sheets. The entire plasterboard lining rotated as a single unit rather
than two plasterboard sheets rotating individually. However, these movements
are not typically practical in a full-scale house test, because the plasterboard
105
sheathing is allowed 10 mm maximum movement in lateral directions due to
providing the cornices, skirting boards and top plates of end walls, as discussed
in Chapter 5.
In all three specimens, no relative displacement was observed between the
ceiling battens and the bottom chords.
There was no damage to the bottom chords or ceiling battens.
There was limited variation (approximately 5.5%) between the results from the
three test specimens, indicating excellent agreement between these test results.
The average ultimate racking load was 4.2 kN, which is equivalent to 1.8 kN/m.
Based on three specimens and a maximum co-efficient of variation (CoV) of
structural characteristics 20%, the corresponding design capacity would be 0.9
kN/m.
While the failure mode was as expected, the specimens seemed to have lower stiffness.
Therefore, to ensure that the performance of the ceiling specimen is not highly
influenced by the test set-up, an alternative beam setup was considered, as discussed in
Chapter 5.
Having gained understanding and knowledge of the behaviour of ceiling diaphragm
specimens under racking load, analytical models were developed to predict the lateral
load-deflection behaviour of plasterboard-clad ceiling diaphragms typically found in
light steel-framed domestic structures in Australia. The details of these analytical
models are presented in Chapter 6.
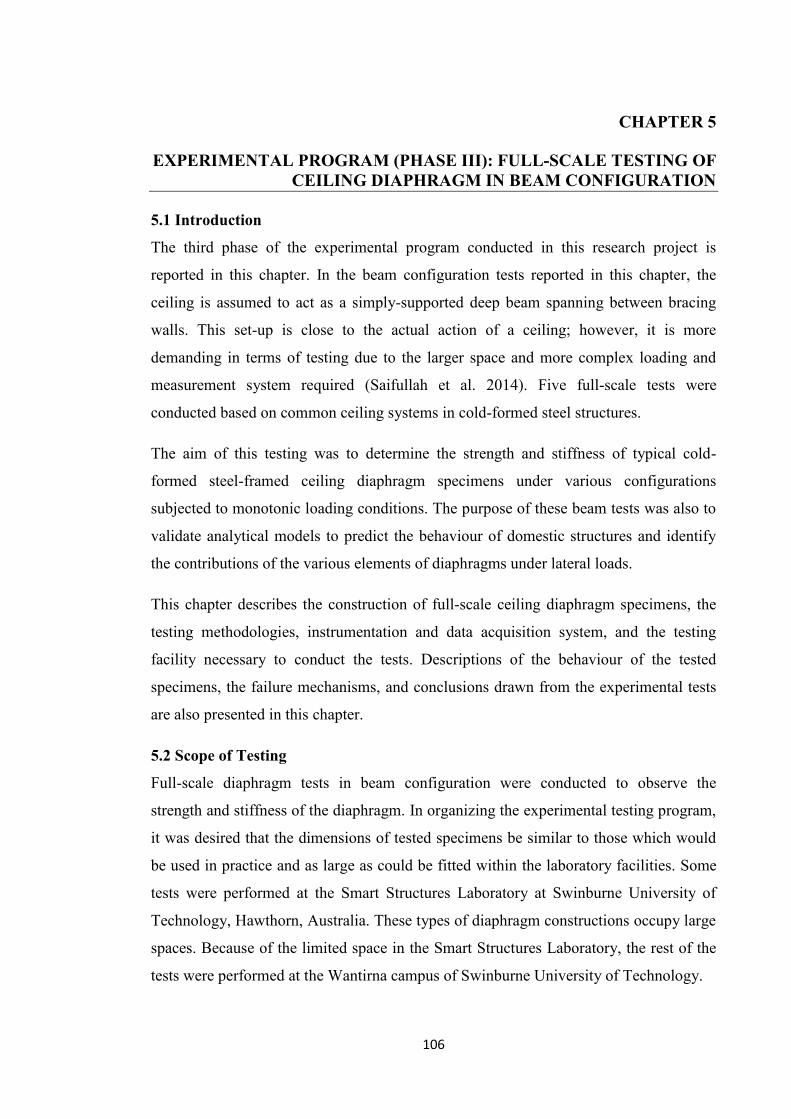
106
CHAPTER 5
EXPERIMENTAL PROGRAM (PHASE III): FULL-SCALE TESTING OF CEILING DIAPHRAGM IN BEAM CONFIGURATION
5.1 Introduction
The third phase of the experimental program conducted in this research project is
reported in this chapter. In the beam configuration tests reported in this chapter, the
ceiling is assumed to act as a simply-supported deep beam spanning between bracing
walls. This set-up is close to the actual action of a ceiling; however, it is more
demanding in terms of testing due to the larger space and more complex loading and
measurement system required (Saifullah et al. 2014). Five full-scale tests were
conducted based on common ceiling systems in cold-formed steel structures.
The aim of this testing was to determine the strength and stiffness of typical cold-
formed steel-framed ceiling diaphragm specimens under various configurations
subjected to monotonic loading conditions. The purpose of these beam tests was also to
validate analytical models to predict the behaviour of domestic structures and identify
the contributions of the various elements of diaphragms under lateral loads.
This chapter describes the construction of full-scale ceiling diaphragm specimens, the
testing methodologies, instrumentation and data acquisition system, and the testing
facility necessary to conduct the tests. Descriptions of the behaviour of the tested
specimens, the failure mechanisms, and conclusions drawn from the experimental tests
are also presented in this chapter.
5.2 Scope of Testing
Full-scale diaphragm tests in beam configuration were conducted to observe the
strength and stiffness of the diaphragm. In organizing the experimental testing program,
it was desired that the dimensions of tested specimens be similar to those which would
be used in practice and as large as could be fitted within the laboratory facilities. Some
tests were performed at the Smart Structures Laboratory at Swinburne University of
Technology, Hawthorn, Australia. These types of diaphragm constructions occupy large
spaces. Because of the limited space in the Smart Structures Laboratory, the rest of the
tests were performed at the Wantirna campus of Swinburne University of Technology.
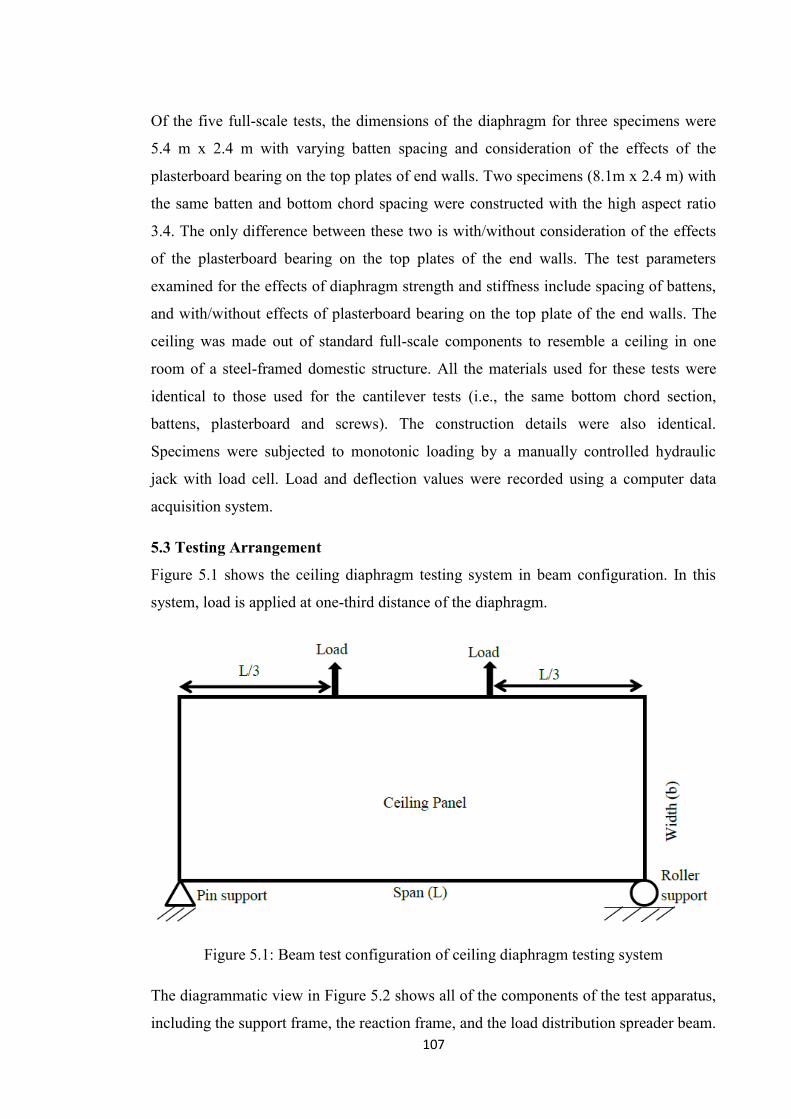
107
Of the five full-scale tests, the dimensions of the diaphragm for three specimens were
5.4 m x 2.4 m with varying batten spacing and consideration of the effects of the
plasterboard bearing on the top plates of end walls. Two specimens (8.1m x 2.4 m) with
the same batten and bottom chord spacing were constructed with the high aspect ratio
3.4. The only difference between these two is with/without consideration of the effects
of the plasterboard bearing on the top plates of the end walls. The test parameters
examined for the effects of diaphragm strength and stiffness include spacing of battens,
and with/without effects of plasterboard bearing on the top plate of the end walls. The
ceiling was made out of standard full-scale components to resemble a ceiling in one
room of a steel-framed domestic structure. All the materials used for these tests were
identical to those used for the cantilever tests (i.e., the same bottom chord section,
battens, plasterboard and screws). The construction details were also identical.
Specimens were subjected to monotonic loading by a manually controlled hydraulic
jack with load cell. Load and deflection values were recorded using a computer data
acquisition system.
5.3 Testing Arrangement
Figure 5.1 shows the ceiling diaphragm testing system in beam configuration. In this
system, load is applied at one-third distance of the diaphragm.
Figure 5.1: Beam test configuration of ceiling diaphragm testing system
The diagrammatic view in Figure 5.2 shows all of the components of the test apparatus,
including the support frame, the reaction frame, and the load distribution spreader beam.

108
To maintain consistency with the specimens in the cantilever tests (described in Chapter
4) and the shear connection tests (described in Chapter 3), the same plasterboard was
used for the beam tests. Similarly, the same ceiling battens as those used in the shear
connection tests and cantilever tests were used for the beam tests. The ceiling battens
were made of G550 Top-hat 22 cold-formed steel sections manufactured by BlueScope
Pty. Ltd. All of the ceiling diaphragms specimens were fixed in accordance with the
construction details provided in the Gyprock Ceiling System Installation Guide (2008)
and the Gyprock Residential Installation Guide (2010).
Figure 5.2: Typical structural testing arrangement of diaphragm in beam configuration
The framework consisted of ceiling battens running along the panel’s sides which were
connected to bottom chord members. The ceiling battens were top-hat 22 sections,
while the bottom chord members were 90 x 40 x 0.75 mm lipped channel sections. The
ceiling battens were connected to the bottom chord members using double Buildex self-
drilling hex head screws. Figure 5.3 shows the fixing system of plasterboard to the
ceiling battens which were in turn screwed to the bottom chord members.
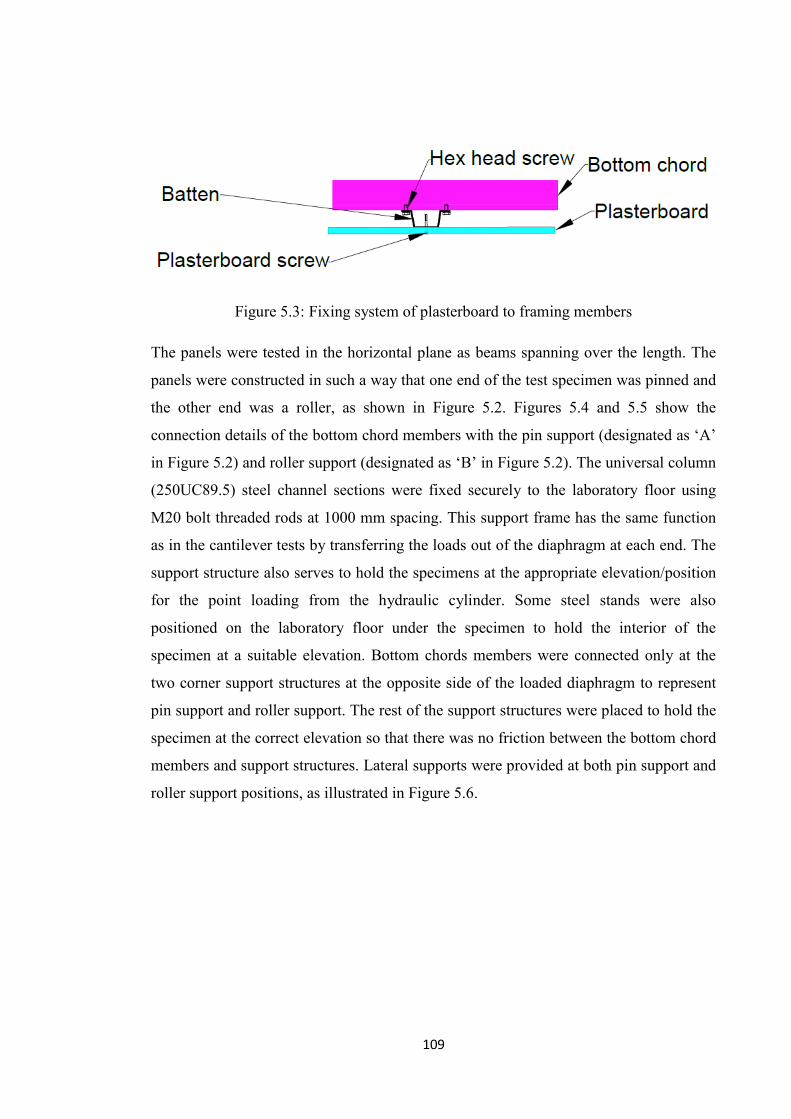
109
Figure 5.3: Fixing system of plasterboard to framing members
The panels were tested in the horizontal plane as beams spanning over the length. The
panels were constructed in such a way that one end of the test specimen was pinned and
the other end was a roller, as shown in Figure 5.2. Figures 5.4 and 5.5 show the
connection details of the bottom chord members with the pin support (designated as ‘A’
in Figure 5.2) and roller support (designated as ‘B’ in Figure 5.2). The universal column
(250UC89.5) steel channel sections were fixed securely to the laboratory floor using
M20 bolt threaded rods at 1000 mm spacing. This support frame has the same function
as in the cantilever tests by transferring the loads out of the diaphragm at each end. The
support structure also serves to hold the specimens at the appropriate elevation/position
for the point loading from the hydraulic cylinder. Some steel stands were also
positioned on the laboratory floor under the specimen to hold the interior of the
specimen at a suitable elevation. Bottom chords members were connected only at the
two corner support structures at the opposite side of the loaded diaphragm to represent
pin support and roller support. The rest of the support structures were placed to hold the
specimen at the correct elevation so that there was no friction between the bottom chord
members and support structures. Lateral supports were provided at both pin support and
roller support positions, as illustrated in Figure 5.6.
110
(a)
(b)
Figure 5.4: Details of pin support (a) Top view, (b) Side view
6 No.
M10 bolt
Washers
Bottom chord
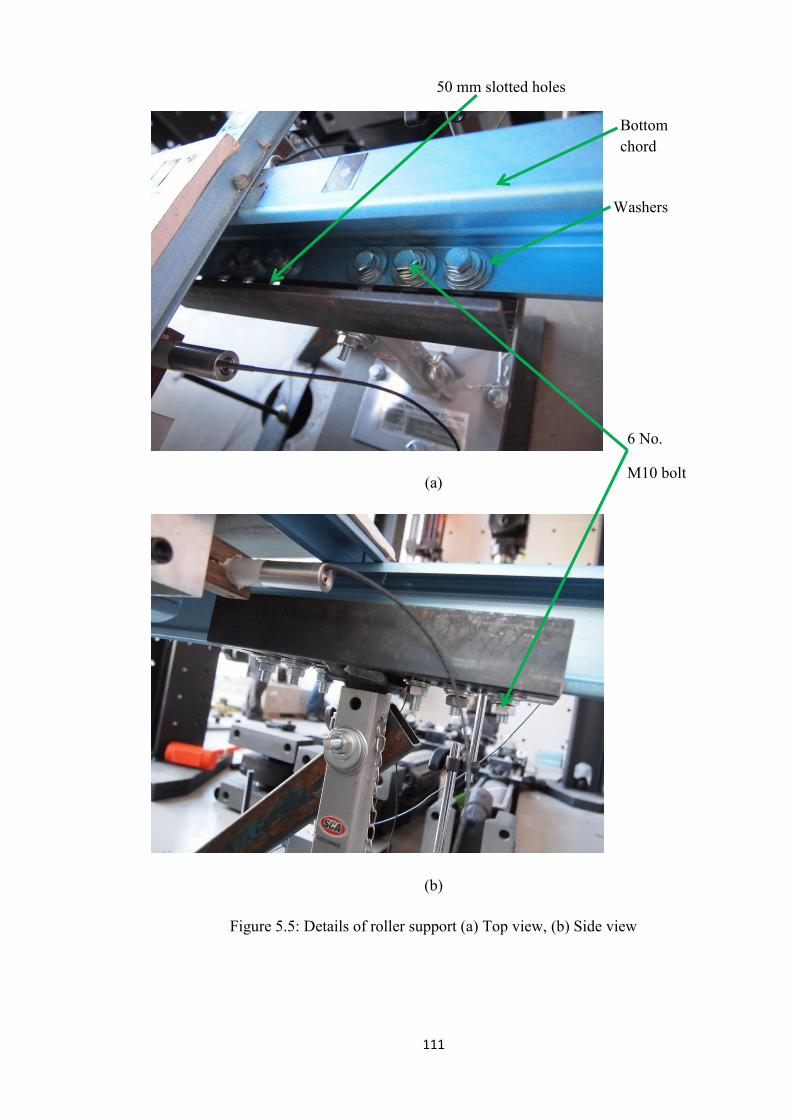
111
(a)
(b)
Figure 5.5: Details of roller support (a) Top view, (b) Side view
6 No.
M10 bolt
Washers
Bottom chord
50 mm slotted holes

112
(a)
(b)
Figure 5.6: Lateral supports (a) pin support, (b) roller support
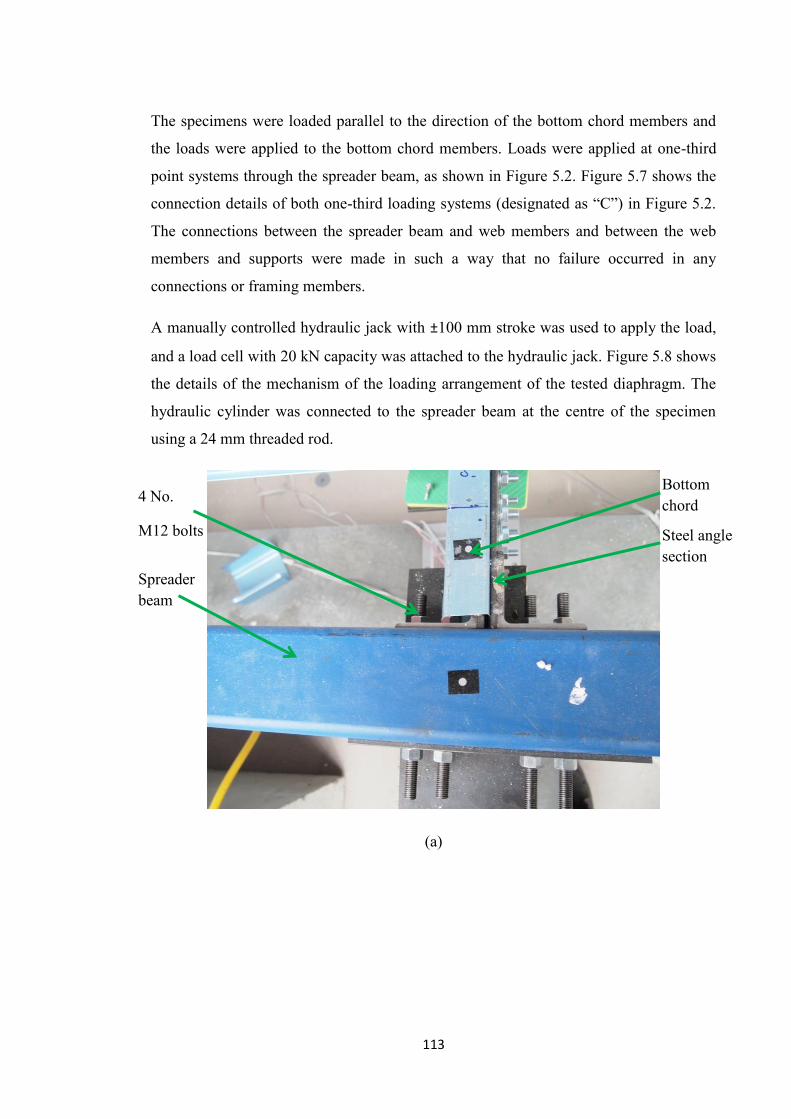
113
The specimens were loaded parallel to the direction of the bottom chord members and
the loads were applied to the bottom chord members. Loads were applied at one-third
point systems through the spreader beam, as shown in Figure 5.2. Figure 5.7 shows the
connection details of both one-third loading systems (designated as “C”) in Figure 5.2.
The connections between the spreader beam and web members and between the web
members and supports were made in such a way that no failure occurred in any
connections or framing members.
A manually controlled hydraulic jack with ±100 mm stroke was used to apply the load,
and a load cell with 20 kN capacity was attached to the hydraulic jack. Figure 5.8 shows
the details of the mechanism of the loading arrangement of the tested diaphragm. The
hydraulic cylinder was connected to the spreader beam at the centre of the specimen
using a 24 mm threaded rod.
(a)
Steel angle section
4 No.
M12 bolts
Spreader beam
Bottom chord

114
(b)
(c)
Figure 5.7: Details of one-third loading point (a) Top view, (b) Right side view, (c) Left
side view
Bottom chord
8 No. M8 bolts
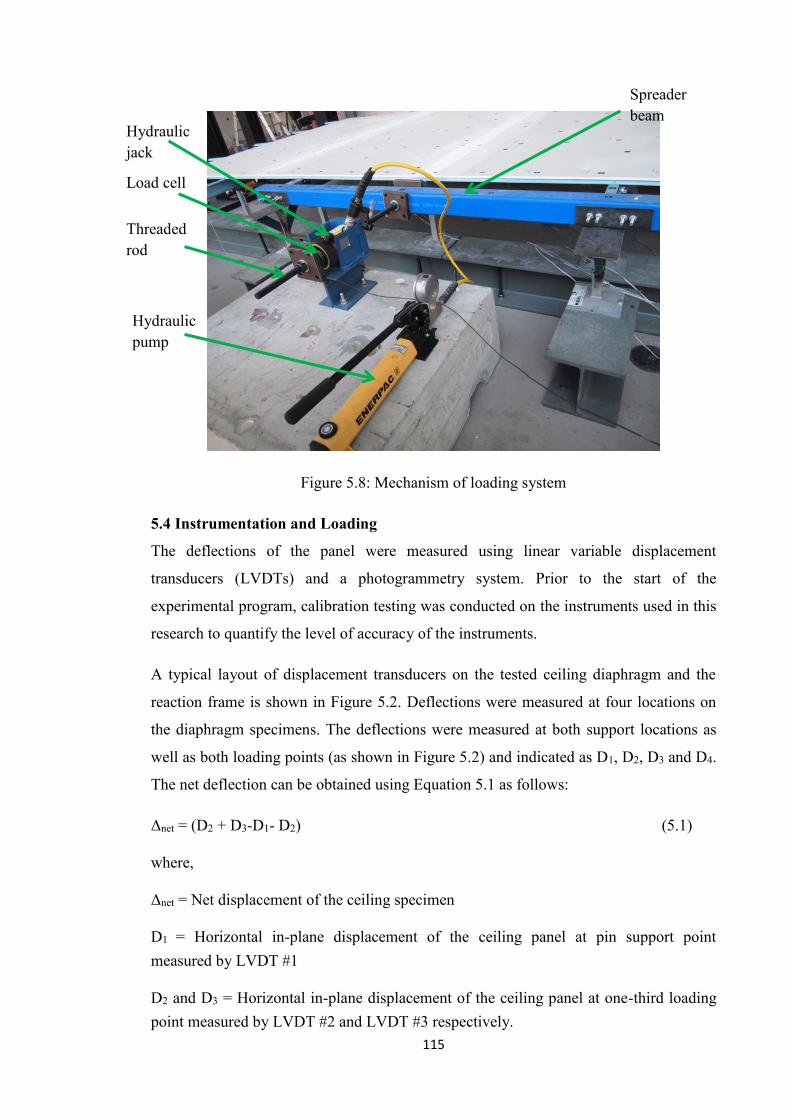
115
Figure 5.8: Mechanism of loading system
5.4 Instrumentation and Loading
The deflections of the panel were measured using linear variable displacement
transducers (LVDTs) and a photogrammetry system. Prior to the start of the
experimental program, calibration testing was conducted on the instruments used in this
research to quantify the level of accuracy of the instruments.
A typical layout of displacement transducers on the tested ceiling diaphragm and the
reaction frame is shown in Figure 5.2. Deflections were measured at four locations on
the diaphragm specimens. The deflections were measured at both support locations as
well as both loading points (as shown in Figure 5.2) and indicated as D1, D2, D3 and D4.
The net deflection can be obtained using Equation 5.1 as follows:
Δnet = (D2 + D3-D1- D2) (5.1)
where,
Δnet = Net displacement of the ceiling specimen
D1 = Horizontal in-plane displacement of the ceiling panel at pin support point measured by LVDT #1
D2 and D3 = Horizontal in-plane displacement of the ceiling panel at one-third loading point measured by LVDT #2 and LVDT #3 respectively.
Spreader beam
Hydraulic jack
Hydraulic pump
Load cell
Threaded rod
116
D4 = Horizontal in-plane displacement of the ceiling panel at roller support point measured by LVDT #4
As shown in Figure 5.2, the diaphragm was tested using two equal-point loads applied
symmetrically along the depth of the diaphragm i.e. at one-third points. The load was
applied using a hydraulic cylinder in displacement control mode.
5.5 Description of Tests
Different sizes of panel were tested. Some panels were 5.4 m long and 2.4 m wide,
while others panels were 8.1 m long and 2.4 m wide. In the 5.4 m long panels, there
were no splices in the ceiling battens, while there were splices in the ceiling battens in
the 8.1 m long panels. The splices were made according to the construction details in
Australia. In a typical construction, the recommended edge distance (typically 20 mm)
of corner screws of the diaphragm varies from 15 mm to 22 mm, as described in the
Gyprock Ceiling System Installation Guide (2008) and the Gyprock Residential
Installation Guide (2010). Therefore, plasterboard screws were provided at the typical
edge distance of 20 mm along the perimeter of the diaphragm. Plasterboard sheathing
was used as necessary to complete the desired ceiling panel configuration. Only screw
configurations using 6G-18 x 25 mm plasterboard screws were adopted for these ceiling
diaphragm specimens. Although the size of the tested panels was small, the construction
of the tested diaphragm specimen is representative of those constructed in practice in
Australian steel-framed domestic structures. In this research, adhesive was not used to
connect the plasterboard sheathing with the battens. However, some tests should be
conducted in future to observe the effect of adhesive.
5.5.1 Beam Test Specimen #1 (5.4 m x 2.4 m diaphragm with 600 mm batten
spacing)
Figure 5.9 shows a diagrammatic view of the beam testing arrangement for beam test
specimen #1. The size of the tested specimen was 5400 mm long and 2400 mm wide.
The spacing of the bottom chord members was 900 mm and the spacing of the ceiling
battens was 600 mm.
The cladding consisted of four 2400 x 1350 x 10 mm Gypsum plasterboard sheets
manufactured by Boral Plasterboard Pty. Ltd which were screwed to the ceiling battens.
The plasterboard sheets were placed perpendicular to the ceiling battens using Buildex
6G-8 x 25 mm bugle-head needle-point screws at 270 mm spacing along each ceiling
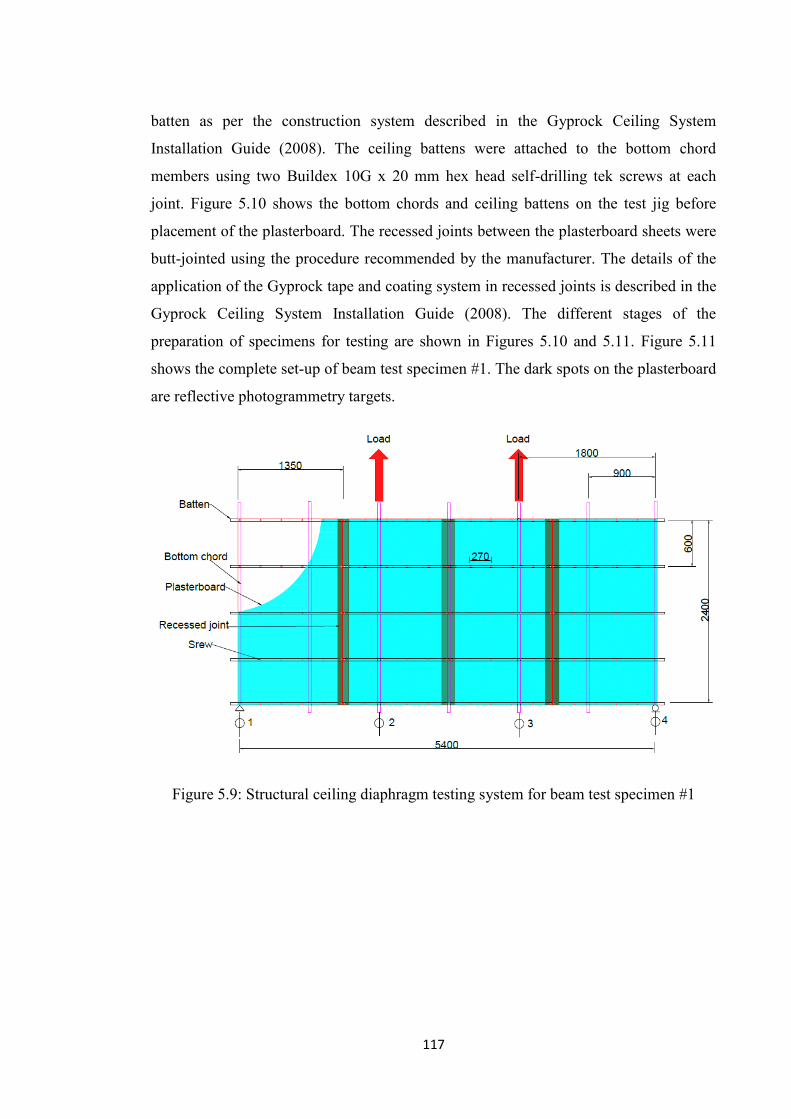
117
batten as per the construction system described in the Gyprock Ceiling System
Installation Guide (2008). The ceiling battens were attached to the bottom chord
members using two Buildex 10G x 20 mm hex head self-drilling tek screws at each
joint. Figure 5.10 shows the bottom chords and ceiling battens on the test jig before
placement of the plasterboard. The recessed joints between the plasterboard sheets were
butt-jointed using the procedure recommended by the manufacturer. The details of the
application of the Gyprock tape and coating system in recessed joints is described in the
Gyprock Ceiling System Installation Guide (2008). The different stages of the
preparation of specimens for testing are shown in Figures 5.10 and 5.11. Figure 5.11
shows the complete set-up of beam test specimen #1. The dark spots on the plasterboard
are reflective photogrammetry targets.
Figure 5.9: Structural ceiling diaphragm testing system for beam test specimen #1
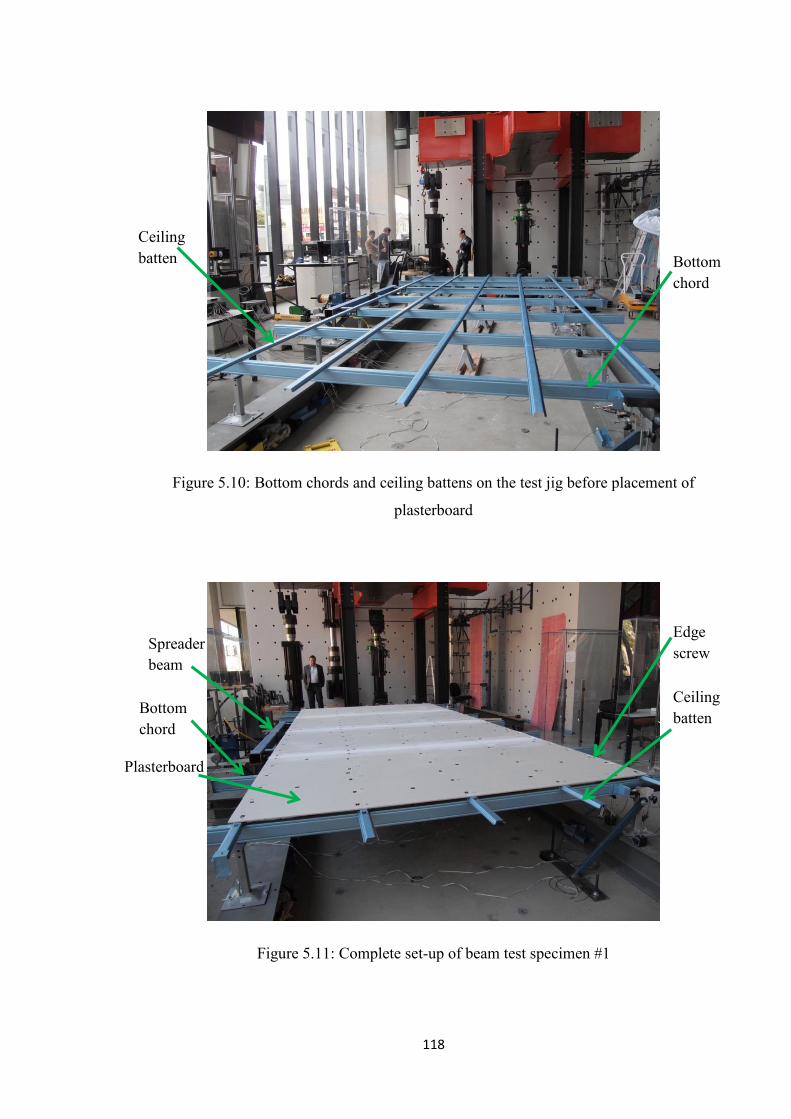
118
Figure 5.10: Bottom chords and ceiling battens on the test jig before placement of
plasterboard
Figure 5.11: Complete set-up of beam test specimen #1
Ceiling batten Bottom
chord
Spreader beam
Plasterboard
Ceiling batten Bottom
chord
Edge screw
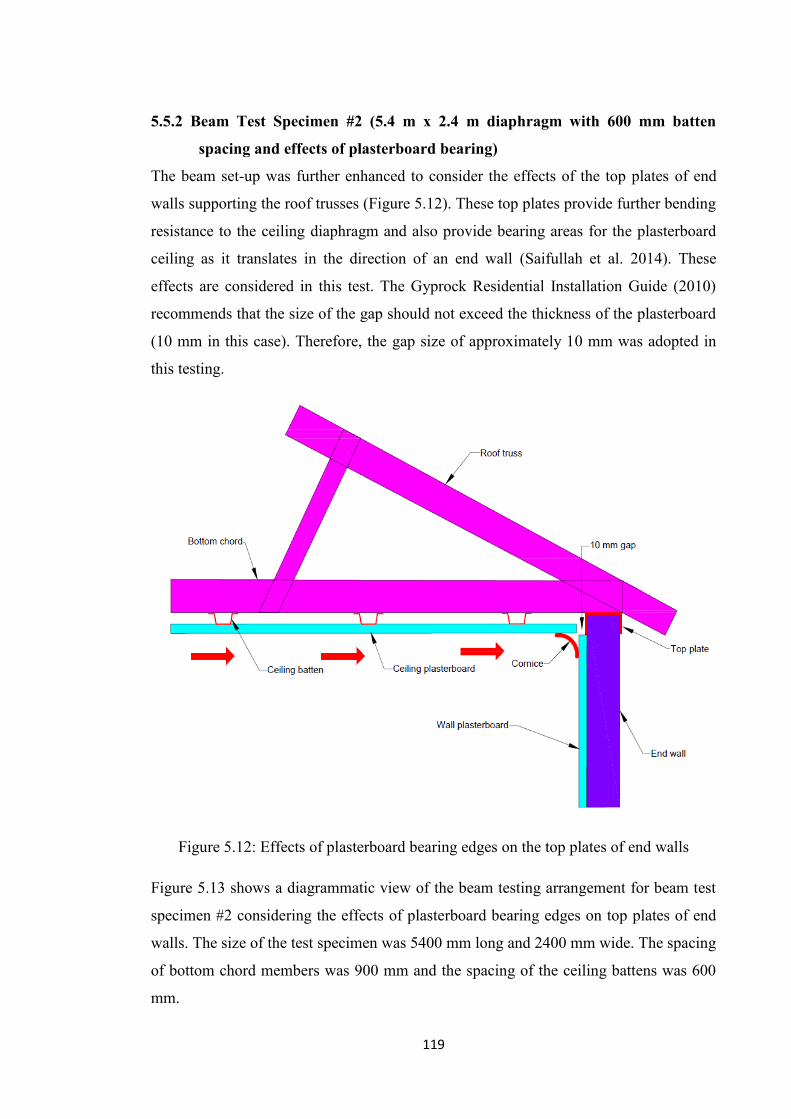
119
5.5.2 Beam Test Specimen #2 (5.4 m x 2.4 m diaphragm with 600 mm batten
spacing and effects of plasterboard bearing)
The beam set-up was further enhanced to consider the effects of the top plates of end
walls supporting the roof trusses (Figure 5.12). These top plates provide further bending
resistance to the ceiling diaphragm and also provide bearing areas for the plasterboard
ceiling as it translates in the direction of an end wall (Saifullah et al. 2014). These
effects are considered in this test. The Gyprock Residential Installation Guide (2010)
recommends that the size of the gap should not exceed the thickness of the plasterboard
(10 mm in this case). Therefore, the gap size of approximately 10 mm was adopted in
this testing.
Figure 5.12: Effects of plasterboard bearing edges on the top plates of end walls
Figure 5.13 shows a diagrammatic view of the beam testing arrangement for beam test
specimen #2 considering the effects of plasterboard bearing edges on top plates of end
walls. The size of the test specimen was 5400 mm long and 2400 mm wide. The spacing
of bottom chord members was 900 mm and the spacing of the ceiling battens was 600
mm.

120
Figure 5.13: Structural ceiling diaphragm beam testing arrangement for beam test
specimen #2
The complete set-up of this experiment is shown in Figure 5.14. The top plate, as shown
in Figure 5.14(b), was screwed to the bottom chords of the diaphragm to replicate the
flanges of the top plates of end walls.
The cladding consisted of four 2400 x 1350 x 10 mm plasterboard sheets manufactured
by Boral Plasterboard Pty. Ltd. The plasterboard sheets were placed perpendicular to the
ceiling battens using Buildex 6G-8 x 25 mm bugle-head needle-point screws at 270 mm
spacing along each ceiling batten as per the construction system recommended in the
Gyprock Ceiling System Installation Guide (2008). The ceiling battens were attached to
the bottom chord members using two Buildex 10G x 20 mm self-drilling hex head
screws at each joint. The recessed joints between the plasterboard sheets were jointed
using Gyprock Easy Tape and Coating, as recommended by the manufacturer.

121
(a)
Figure 5.14: Beam test specimen (a) complete test set-up, (b) close-up view of the
system for study of top plate effects
Top plates
10 mm gap
600 mm
Ceiling battens
Bottom chord

122
5.5.3 Beam Test Specimen #3 (5.4 m x 2.4 m diaphragm with 400 mm batten
spacing and effects of plasterboard bearing)
In Australia, the spacing of the batten in the construction system may vary from region
to region. Most of the construction systems use 450 mm spacing of the battens instead
of 600 mm. Therefore, the author conducted three additional tests with changing batten
spacings and aspect ratios. In this test series, the size of the test specimen was 5400 mm
long and 2400 mm wide. The spacing of bottom chord members was 900 mm.
However, the spacing of the ceiling battens was 400 mm to maintain equal spacing
between them, as shown in Figure 5.15.
Figure 5.15: Structural ceiling diaphragm beam testing arrangement for beam test
specimen #3
To maintain consistency, the cladding consisted of four 2400 x 1350 x 10 mm
plasterboard sheets manufactured by Boral Plasterboard Pty. Ltd. The plasterboard
sheets were placed perpendicular to the ceiling battens using Buildex 6G-8 x 25 mm
bugle-head needle-point screws at 270 mm spacing along each ceiling batten. The
ceiling battens were attached to the bottom chord members using two Buildex 10G x 20
mm self-drilling hex head screws at each joint. Figure 5.16 shows the bottom chords
and ceiling battens on the test jig before placement of the plasterboard. The complete
test set-up is shown in Figure 5.17. The test was performed at the Wantirna campus of
Swinburne University of Technology.

123
Figure 5.16: Bottom chords and ceiling battens on the test jig before placement of
plasterboard
Figure 5.17: Complete test set-up of beam test specimen #3
400 mm
Bottom chord Ceiling batten
Top plate
Direction of loading
Direction of loading
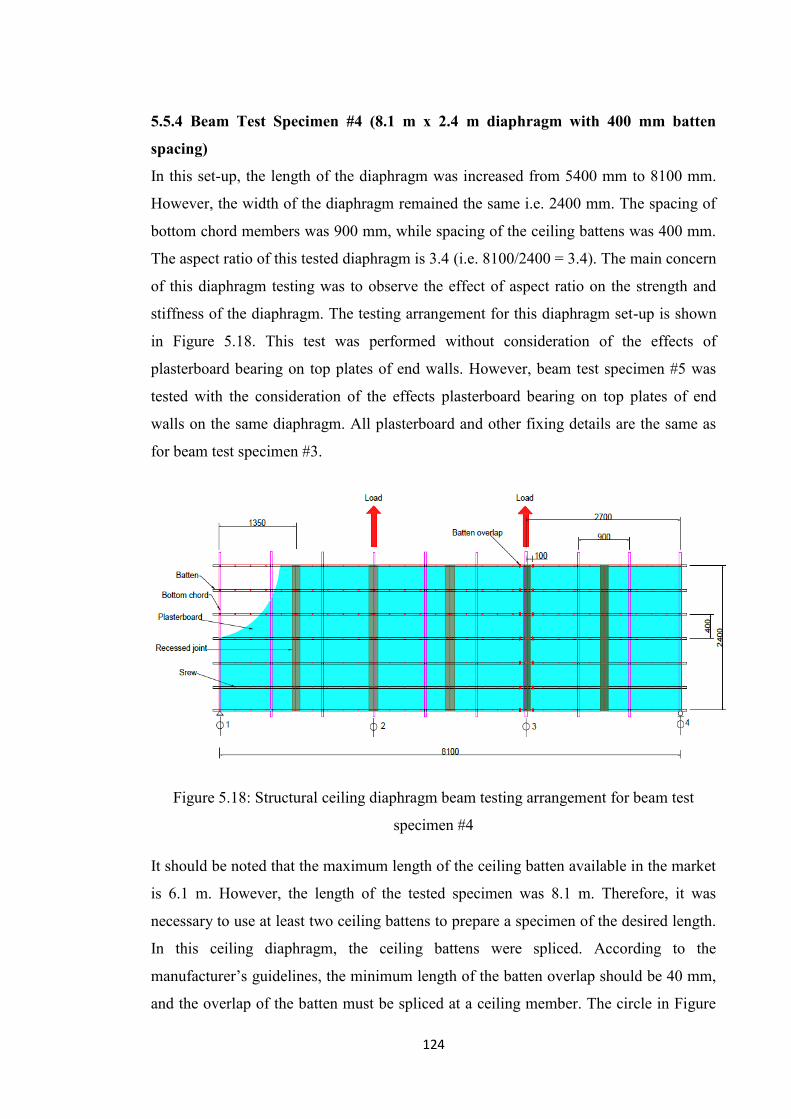
124
5.5.4 Beam Test Specimen #4 (8.1 m x 2.4 m diaphragm with 400 mm batten
spacing)
In this set-up, the length of the diaphragm was increased from 5400 mm to 8100 mm.
However, the width of the diaphragm remained the same i.e. 2400 mm. The spacing of
bottom chord members was 900 mm, while spacing of the ceiling battens was 400 mm.
The aspect ratio of this tested diaphragm is 3.4 (i.e. 8100/2400 = 3.4). The main concern
of this diaphragm testing was to observe the effect of aspect ratio on the strength and
stiffness of the diaphragm. The testing arrangement for this diaphragm set-up is shown
in Figure 5.18. This test was performed without consideration of the effects of
plasterboard bearing on top plates of end walls. However, beam test specimen #5 was
tested with the consideration of the effects plasterboard bearing on top plates of end
walls on the same diaphragm. All plasterboard and other fixing details are the same as
for beam test specimen #3.
Figure 5.18: Structural ceiling diaphragm beam testing arrangement for beam test
specimen #4
It should be noted that the maximum length of the ceiling batten available in the market
is 6.1 m. However, the length of the tested specimen was 8.1 m. Therefore, it was
necessary to use at least two ceiling battens to prepare a specimen of the desired length.
In this ceiling diaphragm, the ceiling battens were spliced. According to the
manufacturer’s guidelines, the minimum length of the batten overlap should be 40 mm,
and the overlap of the batten must be spliced at a ceiling member. The circle in Figure

125
5.19 indicates the location of the batten overlapping at the bottom chord members. The
joint between two ceiling battens was made along the ceiling batten using four 10G self-
drilling hex head screws. Figure 5.20 shows the details of the construction system of the
batten overlapping.
Figure 5.19: Bottom chords and ceiling battens on the test jig before placement of
plasterboard
Figure 5.20: Details of connection system of ceiling batten overlapping
Figure 5.21 shows the complete test set-up of this specimen. The diaphragm was also
restrained at two corners where the pin support (as shown in Figure 5.21(b)) and roller
support was located (as shown in Figure 5.21 (c)). The lateral restraint steel section was
Ceiling batten
Bottom chord
Roller support
Lateral restraint
Location of batten splice
400 mm
Spreader beam
Hydraulic jack
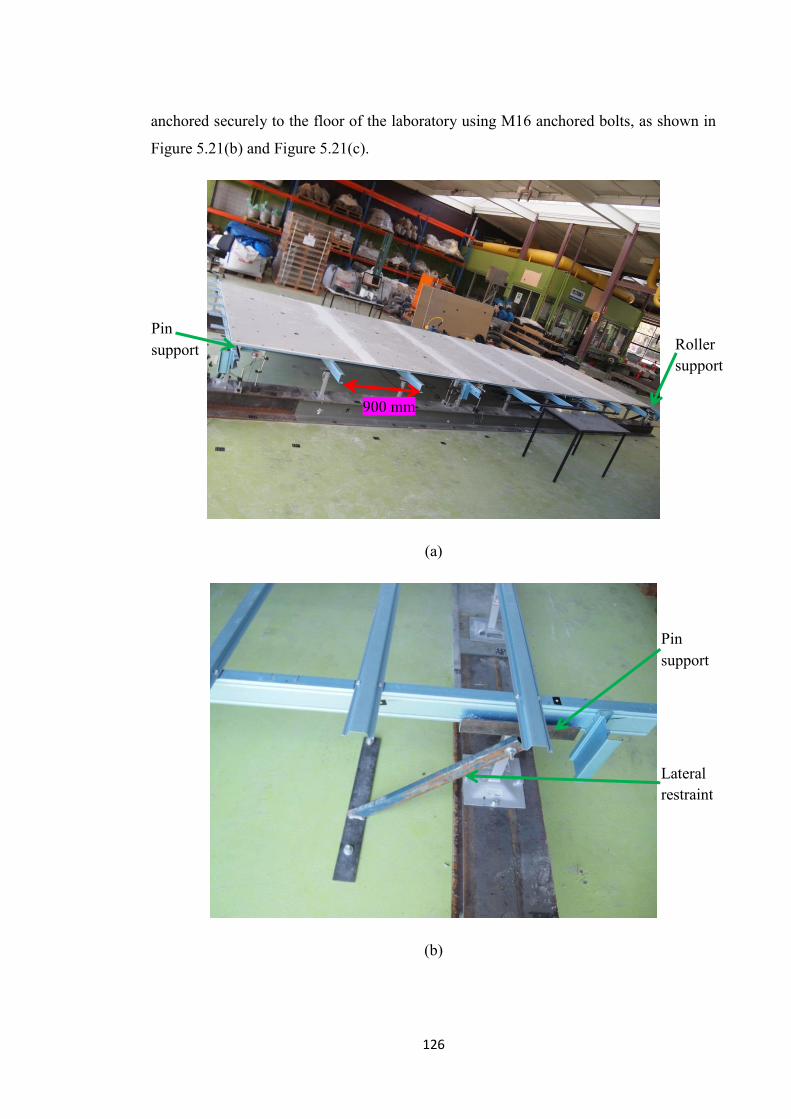
126
anchored securely to the floor of the laboratory using M16 anchored bolts, as shown in
Figure 5.21(b) and Figure 5.21(c).
(a)
(b)
Roller support
900 mm
Pin support
Pin support
Lateral restraint
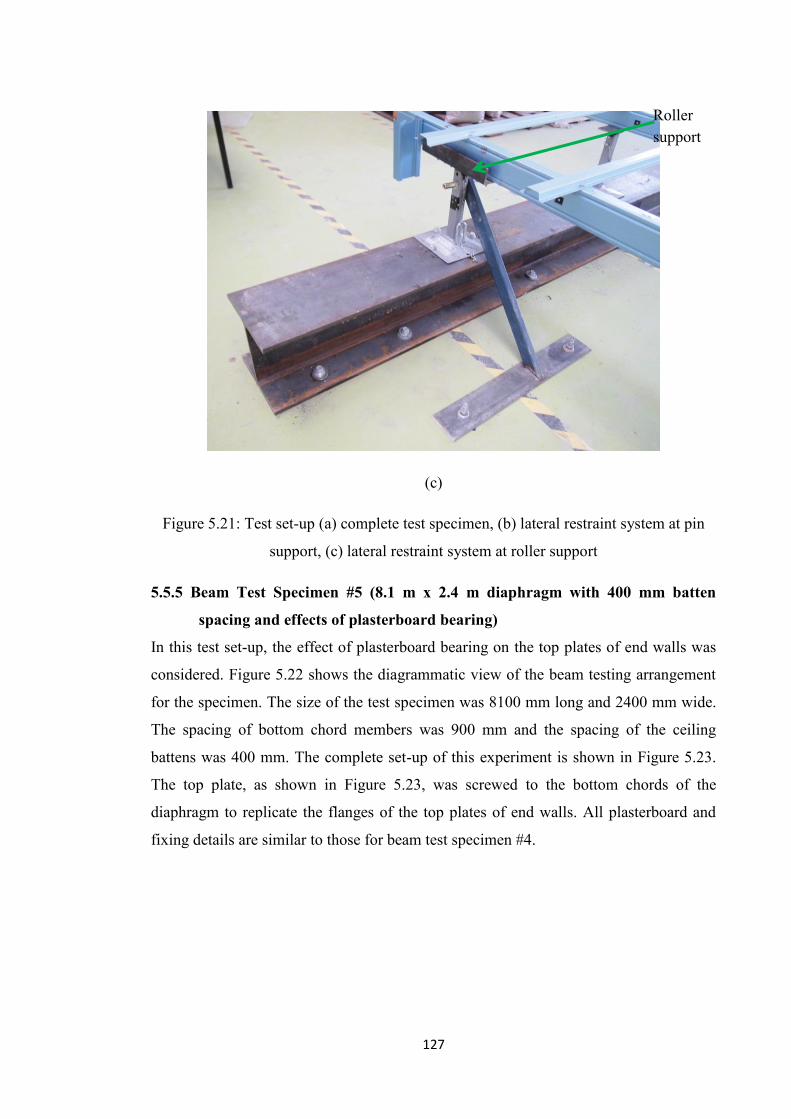
127
(c)
Figure 5.21: Test set-up (a) complete test specimen, (b) lateral restraint system at pin
support, (c) lateral restraint system at roller support
5.5.5 Beam Test Specimen #5 (8.1 m x 2.4 m diaphragm with 400 mm batten
spacing and effects of plasterboard bearing)
In this test set-up, the effect of plasterboard bearing on the top plates of end walls was
considered. Figure 5.22 shows the diagrammatic view of the beam testing arrangement
for the specimen. The size of the test specimen was 8100 mm long and 2400 mm wide.
The spacing of bottom chord members was 900 mm and the spacing of the ceiling
battens was 400 mm. The complete set-up of this experiment is shown in Figure 5.23.
The top plate, as shown in Figure 5.23, was screwed to the bottom chords of the
diaphragm to replicate the flanges of the top plates of end walls. All plasterboard and
fixing details are similar to those for beam test specimen #4.
Roller support
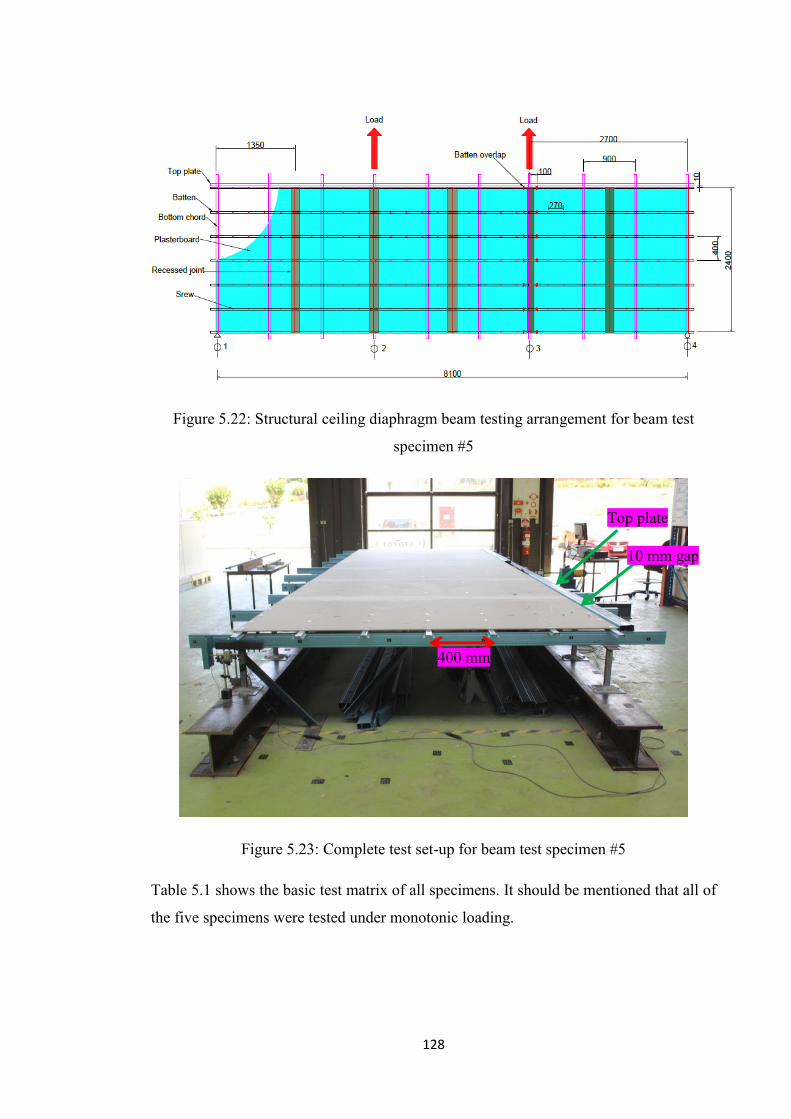
128
Figure 5.22: Structural ceiling diaphragm beam testing arrangement for beam test
specimen #5
Figure 5.23: Complete test set-up for beam test specimen #5
Table 5.1 shows the basic test matrix of all specimens. It should be mentioned that all of
the five specimens were tested under monotonic loading.
Top plate
10 mm gap
400 mm

129
Table 5.1 Matrix of test specimens under monotonic loading
Specimen
designation
Length
(m)
Width
(m)
Aspect
ratio
Batten
spacing
(mm)
Bottom
chord
spacing
(mm)
Batten
splice
Boundary
conditions
Beam test
specimen #1 5.4 2.4 2.25 600 900
No
batten
splice
No
plasterboard
bearing
Beam test
specimen #2 5.4 2.4 2.25 600 900
No
batten
splice
Plasterboard
bearing on
top plates
Beam test
specimen #3 5.4 2.4 2.25 400 900
No
batten
splice
Plasterboard
bearing on
top plates
Beam test
specimen #4 8.1 2.4 3.38 400 900
Batten
splice
No
plasterboard
bearing
Beam test
specimen #5 8.1 2.4 3.38 400 900
Batten
splice
Plasterboard
bearing on
top plates
5.6 Results and Discussion
This section reports the results from the full-scale diaphragm tests in beam
configuration. These test results are analysed and discussed in detail.
5.6.1 Frame Test
The author performed the frame test to measure the strength and stiffness of the steel
frame only without plasterboard. Figure 5.24 shows the load-deflection behaviour of the
tested frame only. It can be observed that the frame itself carries negligible load and has
negligible stiffness.
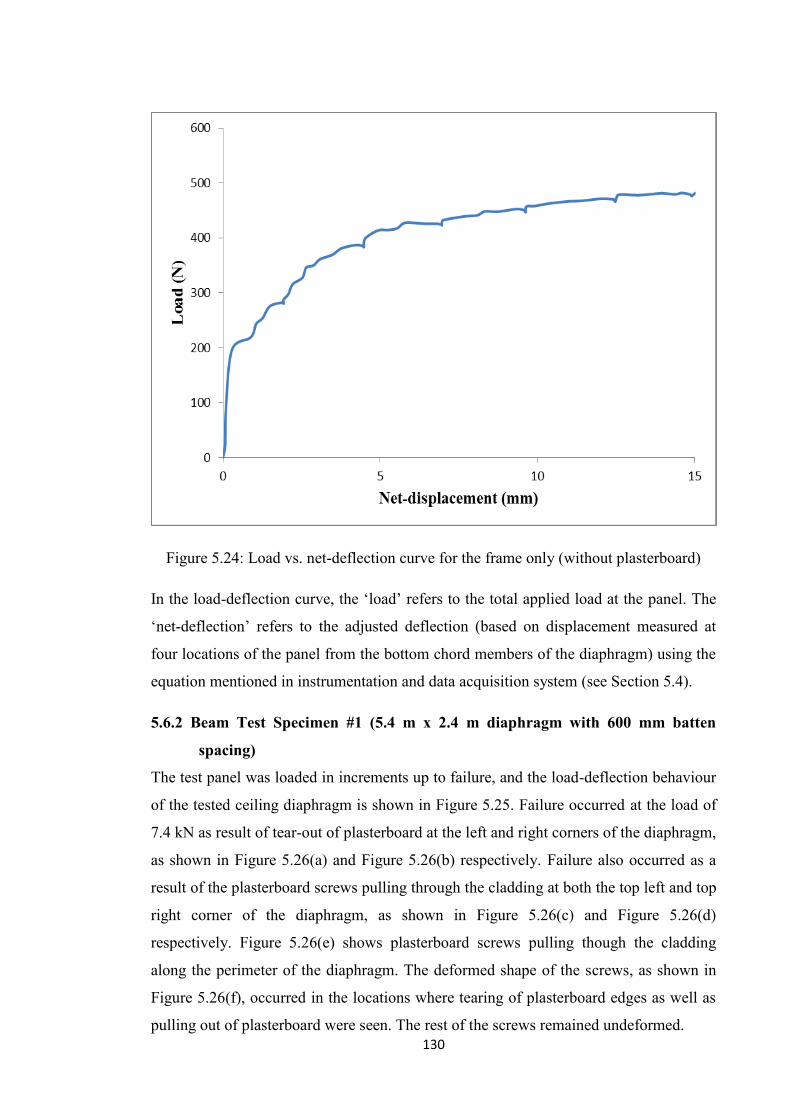
130
Figure 5.24: Load vs. net-deflection curve for the frame only (without plasterboard)
In the load-deflection curve, the ‘load’ refers to the total applied load at the panel. The
‘net-deflection’ refers to the adjusted deflection (based on displacement measured at
four locations of the panel from the bottom chord members of the diaphragm) using the
equation mentioned in instrumentation and data acquisition system (see Section 5.4).
5.6.2 Beam Test Specimen #1 (5.4 m x 2.4 m diaphragm with 600 mm batten
spacing)
The test panel was loaded in increments up to failure, and the load-deflection behaviour
of the tested ceiling diaphragm is shown in Figure 5.25. Failure occurred at the load of
7.4 kN as result of tear-out of plasterboard at the left and right corners of the diaphragm,
as shown in Figure 5.26(a) and Figure 5.26(b) respectively. Failure also occurred as a
result of the plasterboard screws pulling through the cladding at both the top left and top
right corner of the diaphragm, as shown in Figure 5.26(c) and Figure 5.26(d)
respectively. Figure 5.26(e) shows plasterboard screws pulling though the cladding
along the perimeter of the diaphragm. The deformed shape of the screws, as shown in
Figure 5.26(f), occurred in the locations where tearing of plasterboard edges as well as
pulling out of plasterboard were seen. The rest of the screws remained undeformed.
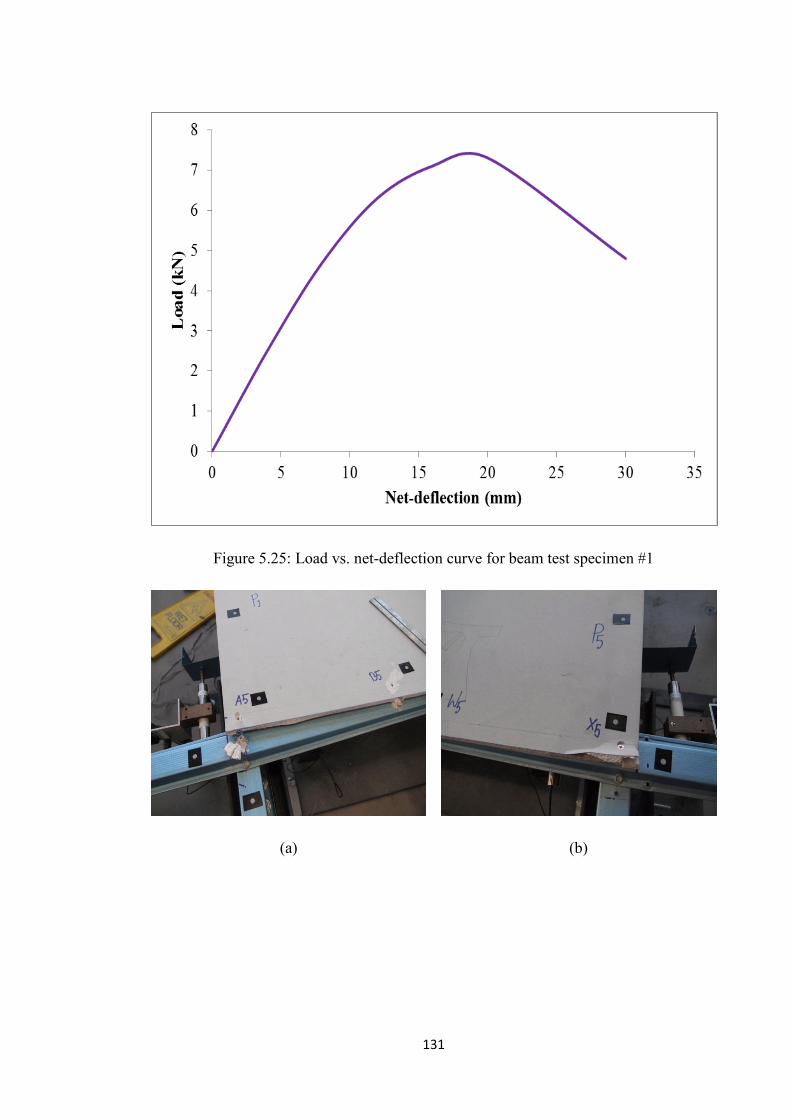
131
Figure 5.25: Load vs. net-deflection curve for beam test specimen #1
(a)
(b)

132
(c)
(d)
(e)
(f)
Figure 5.26: Failure mode of diaphragm for beam test specimen #1 (a) tear-out of
plasterboard at the left corner of diaphragm, (b) tear-out of plasterboard at the right
corner of diaphragm, (c) pulling out of plasterboard at the top left corner of diaphragm,
(d) pulling out of plasterboard at the top right corner of diaphragm, (e) pulling out of
plasterboard at the perimeter of diaphragm, (f) deformed shape of tilted screw
There was no relative movement between the individual plasterboard sheets. The whole
cladding system translated as a single unit. No relative displacement was observed
between the ceiling battens and the bottom chords. However, considerable bending of
the ceiling battens was observed. No damage was observed to the bottom chords. Some
local buckling of the bottom chord members observed during the test was recoverable
after the termination of the test.

133
The overall deformed shape of the beam test specimen #1 is illustrated in Figure 5.27,
which shows bending of the battens and translation of the plasterboard as a rigid body.
The dashed lines in Figure 5.27 indicate the original position of the plasterboard.
Figure 5.27: Deformed shape of the test specimen showing the bending of battens and
translation of the plasterboard as a rigid body.
5.6.3 Beam Test Specimen #2 (5.4 m x 2.4 m diaphragm with 600 mm batten
spacing and effects of plasterboard bearing)
The presence of top plates on end walls leads to another mode of load transfer
mechanism from the steel frame to the plasterboard. Without top plates on end walls, all
the racking loads are transferred through the screws connecting the plasterboard to the
ceiling battens via shear action. The top plates of end walls transfer some of the racking
loads through bearing on the plasterboard edges. When there is a gap between the
plasterboard and the top plates of the end walls, the racking load is initially transferred
to the plasterboard via the screws until the ceiling battens start to deform relative to the
plasterboard as the screws tear and are pulled into it. With the increase of this relative
movement, the gap closes and the top plates of end walls bear against the plasterboard
edges at the flanges of the end studs, as shown in Figure 5.29(e). This ultimately leads
Battens Chords
Plasterboard
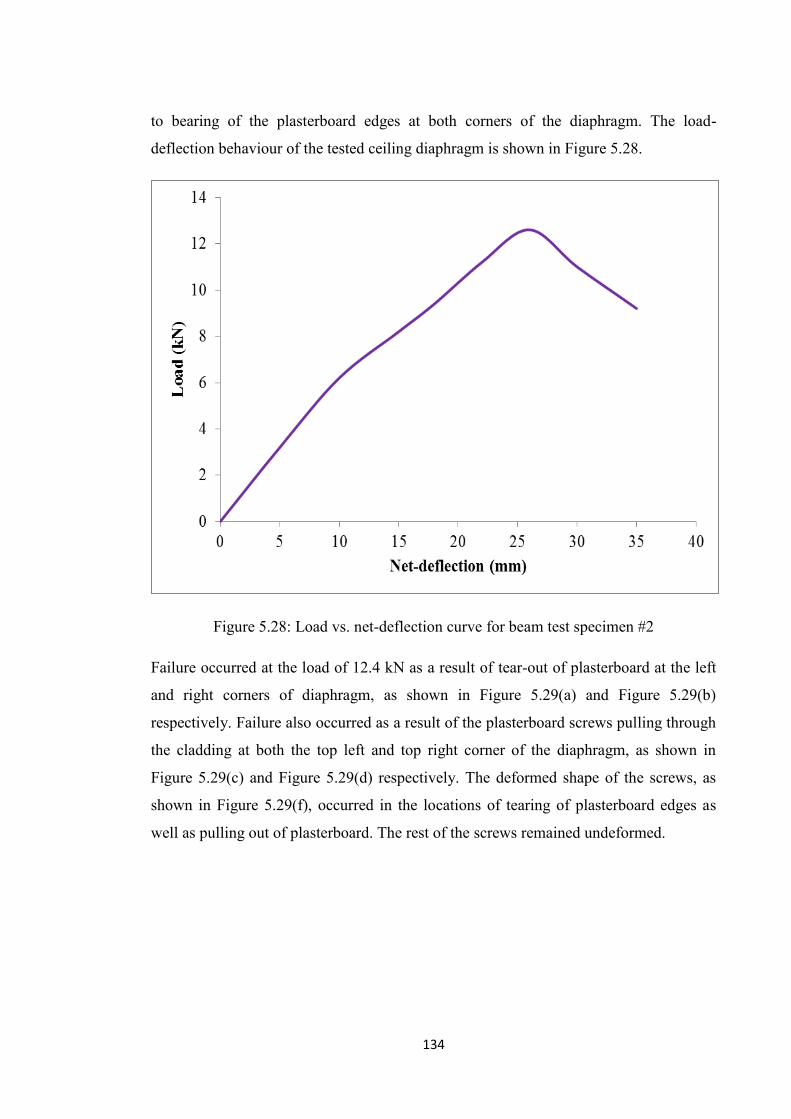
134
to bearing of the plasterboard edges at both corners of the diaphragm. The load-
deflection behaviour of the tested ceiling diaphragm is shown in Figure 5.28.
Figure 5.28: Load vs. net-deflection curve for beam test specimen #2
Failure occurred at the load of 12.4 kN as a result of tear-out of plasterboard at the left
and right corners of diaphragm, as shown in Figure 5.29(a) and Figure 5.29(b)
respectively. Failure also occurred as a result of the plasterboard screws pulling through
the cladding at both the top left and top right corner of the diaphragm, as shown in
Figure 5.29(c) and Figure 5.29(d) respectively. The deformed shape of the screws, as
shown in Figure 5.29(f), occurred in the locations of tearing of plasterboard edges as
well as pulling out of plasterboard. The rest of the screws remained undeformed.

135
(a)
(b)
(c)
(d)
(e)
(f)
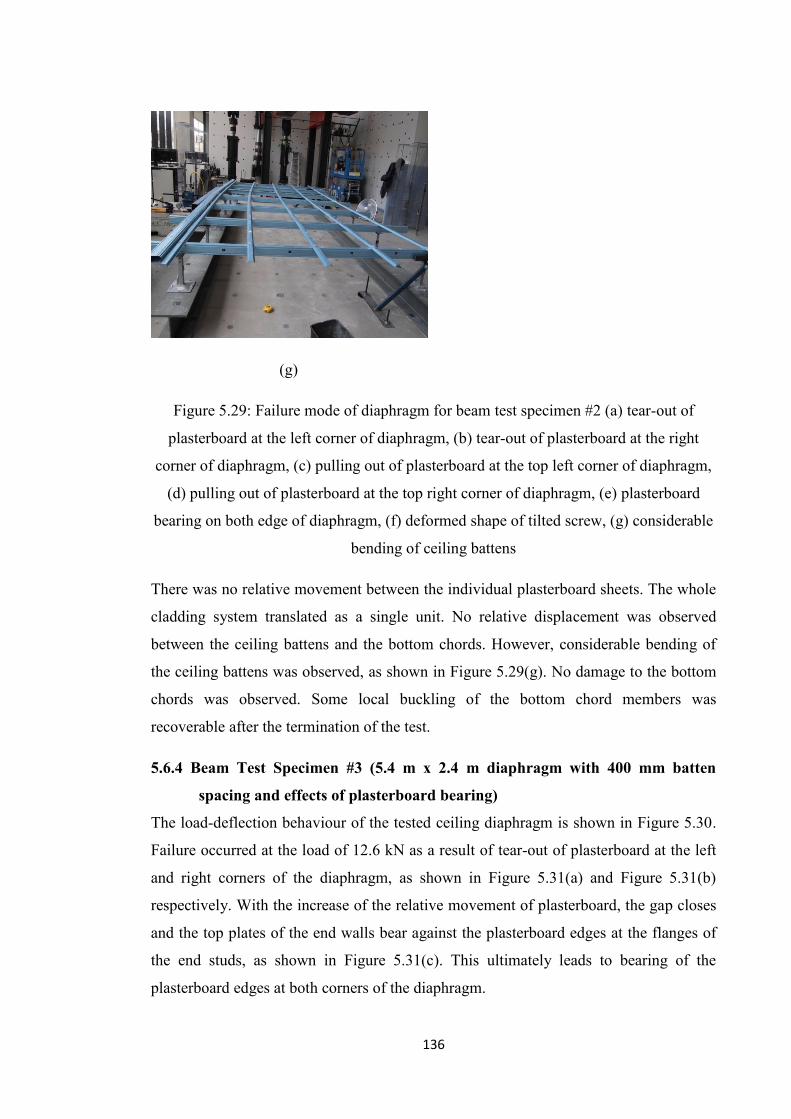
136
(g)
Figure 5.29: Failure mode of diaphragm for beam test specimen #2 (a) tear-out of
plasterboard at the left corner of diaphragm, (b) tear-out of plasterboard at the right
corner of diaphragm, (c) pulling out of plasterboard at the top left corner of diaphragm,
(d) pulling out of plasterboard at the top right corner of diaphragm, (e) plasterboard
bearing on both edge of diaphragm, (f) deformed shape of tilted screw, (g) considerable
bending of ceiling battens
There was no relative movement between the individual plasterboard sheets. The whole
cladding system translated as a single unit. No relative displacement was observed
between the ceiling battens and the bottom chords. However, considerable bending of
the ceiling battens was observed, as shown in Figure 5.29(g). No damage to the bottom
chords was observed. Some local buckling of the bottom chord members was
recoverable after the termination of the test.
5.6.4 Beam Test Specimen #3 (5.4 m x 2.4 m diaphragm with 400 mm batten
spacing and effects of plasterboard bearing)
The load-deflection behaviour of the tested ceiling diaphragm is shown in Figure 5.30.
Failure occurred at the load of 12.6 kN as a result of tear-out of plasterboard at the left
and right corners of the diaphragm, as shown in Figure 5.31(a) and Figure 5.31(b)
respectively. With the increase of the relative movement of plasterboard, the gap closes
and the top plates of the end walls bear against the plasterboard edges at the flanges of
the end studs, as shown in Figure 5.31(c). This ultimately leads to bearing of the
plasterboard edges at both corners of the diaphragm.
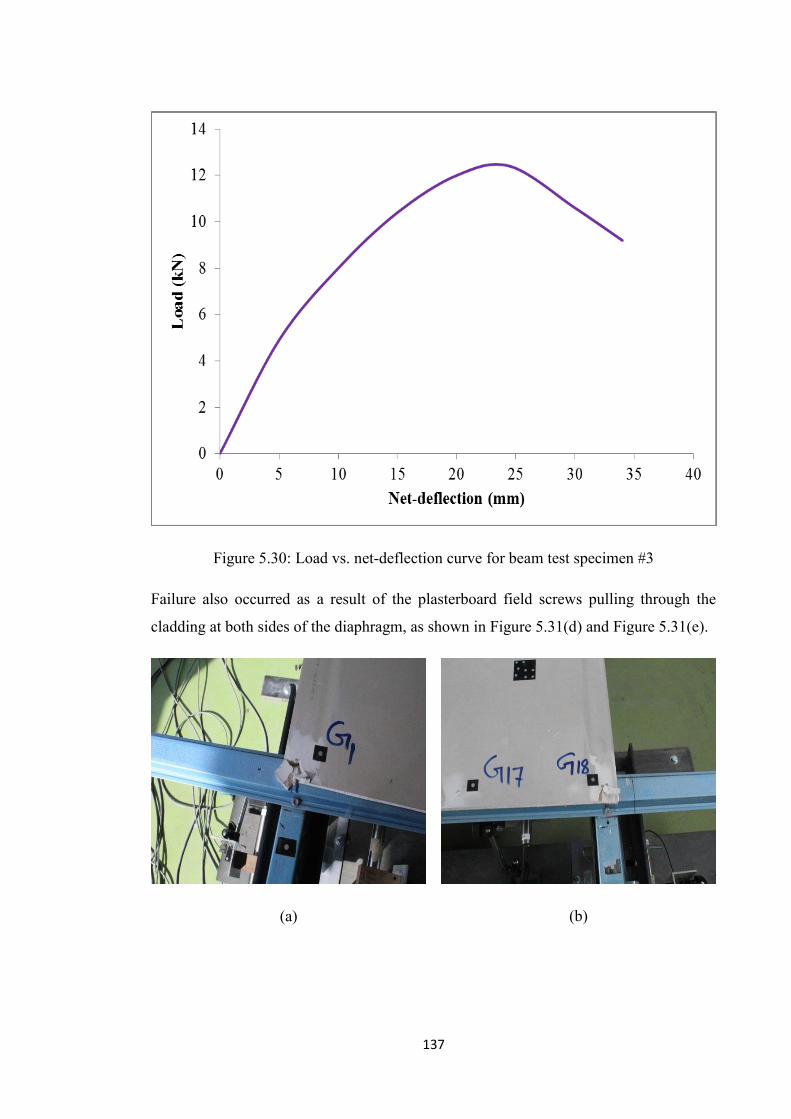
137
Figure 5.30: Load vs. net-deflection curve for beam test specimen #3
Failure also occurred as a result of the plasterboard field screws pulling through the
cladding at both sides of the diaphragm, as shown in Figure 5.31(d) and Figure 5.31(e).
(a)
(b)
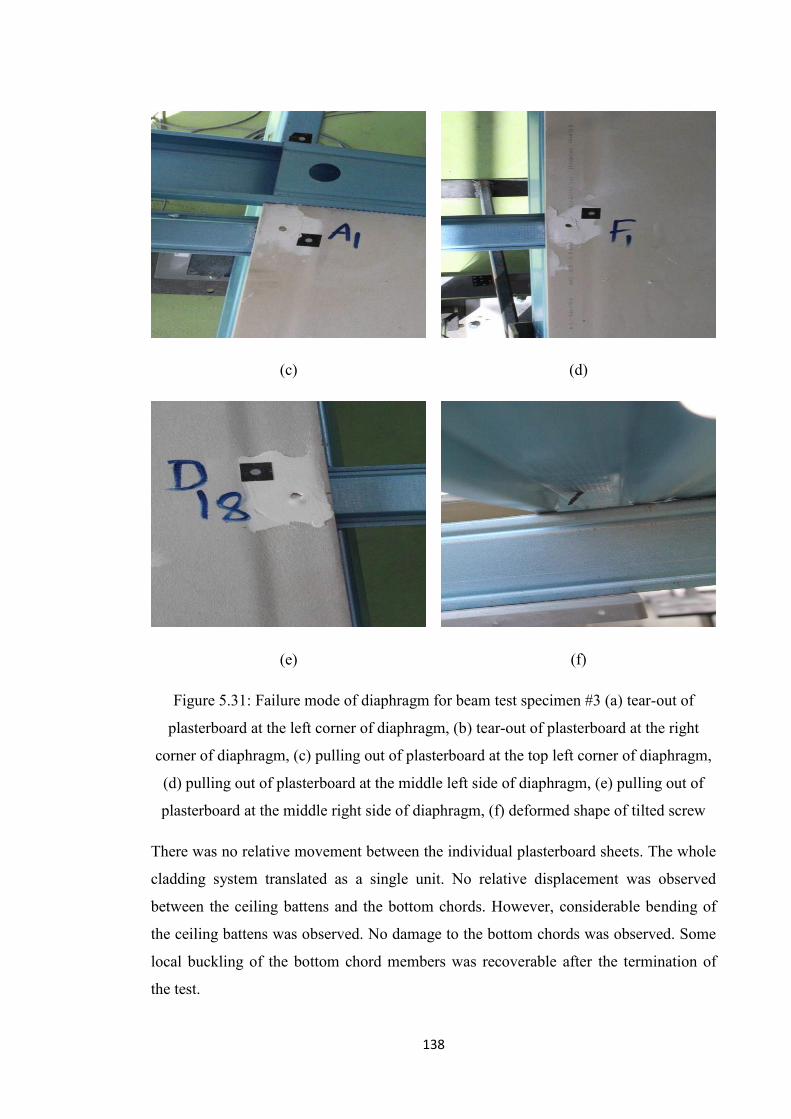
138
(c)
(d)
(e)
(f)
Figure 5.31: Failure mode of diaphragm for beam test specimen #3 (a) tear-out of
plasterboard at the left corner of diaphragm, (b) tear-out of plasterboard at the right
corner of diaphragm, (c) pulling out of plasterboard at the top left corner of diaphragm,
(d) pulling out of plasterboard at the middle left side of diaphragm, (e) pulling out of
plasterboard at the middle right side of diaphragm, (f) deformed shape of tilted screw
There was no relative movement between the individual plasterboard sheets. The whole
cladding system translated as a single unit. No relative displacement was observed
between the ceiling battens and the bottom chords. However, considerable bending of
the ceiling battens was observed. No damage to the bottom chords was observed. Some
local buckling of the bottom chord members was recoverable after the termination of
the test.
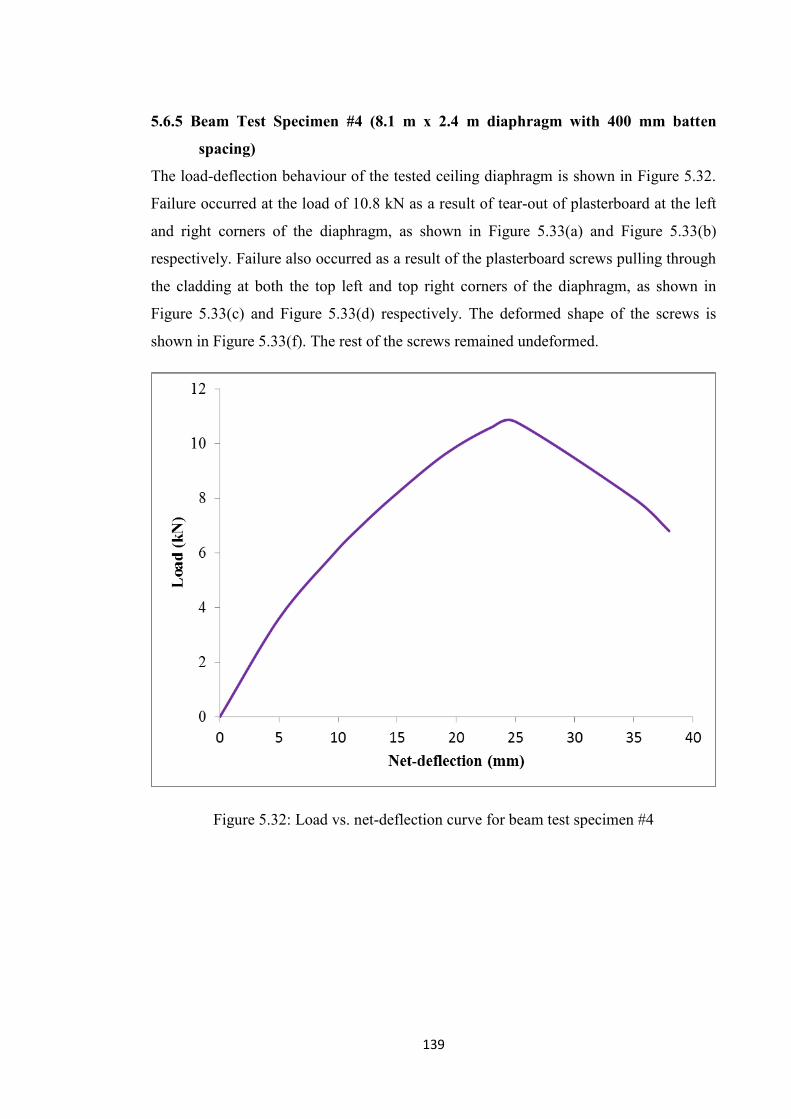
139
5.6.5 Beam Test Specimen #4 (8.1 m x 2.4 m diaphragm with 400 mm batten
spacing)
The load-deflection behaviour of the tested ceiling diaphragm is shown in Figure 5.32.
Failure occurred at the load of 10.8 kN as a result of tear-out of plasterboard at the left
and right corners of the diaphragm, as shown in Figure 5.33(a) and Figure 5.33(b)
respectively. Failure also occurred as a result of the plasterboard screws pulling through
the cladding at both the top left and top right corners of the diaphragm, as shown in
Figure 5.33(c) and Figure 5.33(d) respectively. The deformed shape of the screws is
shown in Figure 5.33(f). The rest of the screws remained undeformed.
Figure 5.32: Load vs. net-deflection curve for beam test specimen #4
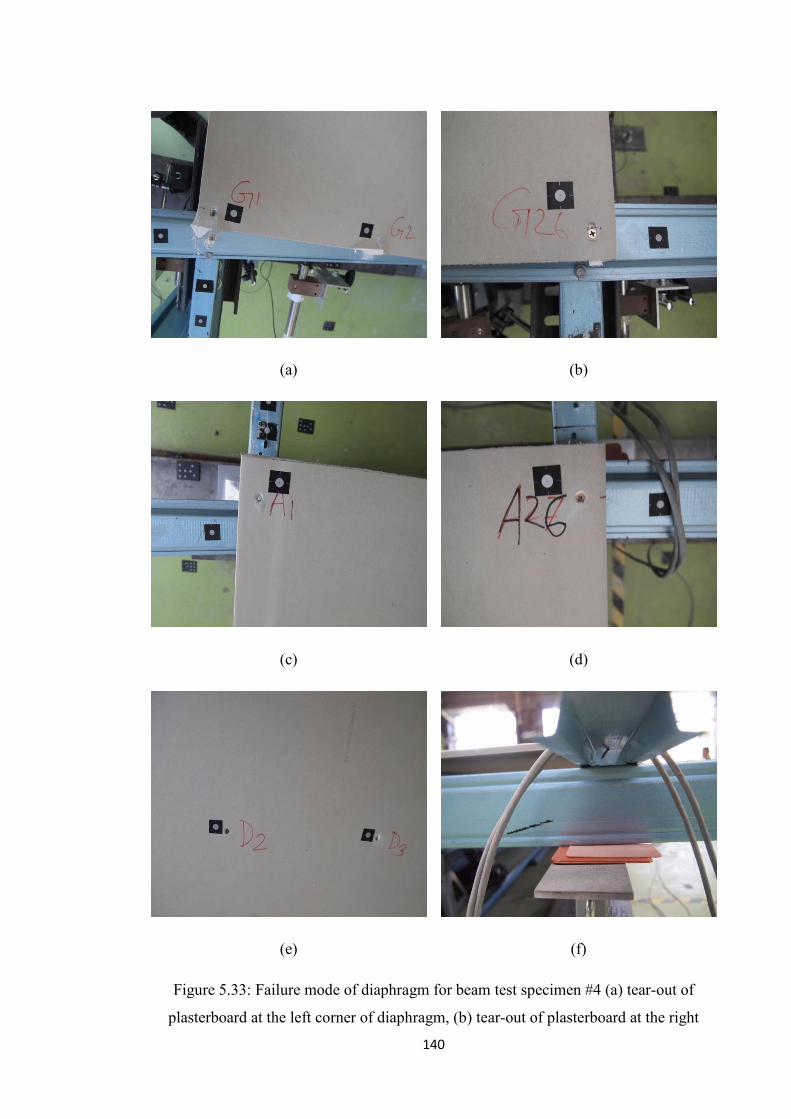
140
(a)
(b)
(c)
(d)
(e)
(f)
Figure 5.33: Failure mode of diaphragm for beam test specimen #4 (a) tear-out of
plasterboard at the left corner of diaphragm, (b) tear-out of plasterboard at the right
141
corner of diaphragm, (c) pulling out of plasterboard at the top left corner of diaphragm,
(d) pulling out of plasterboard at the top right corner of diaphragm, (e) pulling out of
plasterboard field screws, (f) deformed shape of tilted screw
There was no relative movement between the individual plasterboard sheets. The whole
cladding system translated as a single unit. No relative displacement was observed
between the ceiling battens and the bottom chords. However, there was considerable
bending of the ceiling battens. No damage to the bottom chords was observed. Some
local buckling of the bottom chord members was recoverable after the termination of
the test.
5.6.6 Beam Test Specimen #5 (8.1 m x 2.4 m diaphragm with 400 mm batten
spacing and effects of plasterboard bearing)
With the increase of the relative movement of plasterboard to the ceiling batten, the gap
closes and the top plates of the end walls bear against the plasterboard edges at the
flanges of the end studs. This ultimately leads to loading of the plasterboard edges at
both corners of the diaphragm. The load-deflection behaviour for the tested ceiling
diaphragm is shown in Figure 5.34. Failure occurred at the load of 12.8 kN as a result of
tear-out of plasterboard at the left and right corners of the diaphragm, as shown in
Figure 5.35(a) and Figure 5.35(b) respectively.
Failure occurred as a result of the plasterboard screws pulling through the cladding at
both the top corners of the diaphragm, as shown in Figure 5.35(c). The deformed shape
of the screws, as shown in Figure 5.35(d), occurred in the locations of tearing of
plasterboard edges as well as pulling out of plasterboard. The rest of the screws
remained undeformed.

142
Figure 5.34: Load vs. net-deflection curve for beam test specimen #5
(a)
(b)

143
(c)
(d)
Figure 5.35: Failure mode of diaphragm for beam test specimen #5 (a) tear-out of
plasterboard at the left corner of diaphragm, (b) tear-out of plasterboard at the right
corner of diaphragm, (c) pulling out of plasterboard at the top left corner of diaphragm,
(d) deformed shape of tilted screw
No relative movement occurred between the individual plasterboard sheets. The whole
cladding system translated as a single unit. No relative displacement was observed
between the ceiling battens and the bottom chords. However, considerable bending of
the ceiling battens was observed. No damage to the bottom chords was observed. Some
local buckling of the bottom chord members was recoverable after the termination of
the test.
The observed load-deflection behaviour of full-scale diaphragms is similar in form,
although there is variation in magnitude. These variations were also observed in the
results of the plasterboard sheathing-to-steel framing connections. The variation of the
performance of the diaphragms is possibly due to the following reasons (i) some screws
may have been over-driven; (ii) some screws may not have been driven at a right angle
to the plasterboard.
Table 5.2 shows a summary of the test results. In Table 5.2, the ultimate load is
considered as the peak load resisted by every specimen during testing. The maximum
deflection at ultimate load and strength of the diaphragms are tabulated in column 3 and
column 4 respectively. Column 5 shows the initial or tangent stiffness at the linear
portion of the load-deflection curve, whereas the secant stiffness measured at ultimate

144
load is presented in column 6. The secant stiffness per unit depth is calculated by
dividing the total load by the displacement at ultimate load and width of diaphragm. The
definitions of initial and secant stiffness are presented in Figure 5.36.
Table 5.2 Summary of test results for specimens subjected to monotonic loading
Specimen
designation
Ultimate
load (kN)
Displacement
at ultimate
load (mm)
Strength
per unit
depth
(kN/m)
Initial
stiffness per
unit depth
(kN/mm/m)
Secant
stiffness per
unit depth
(kN/mm/m)
Beam test
specimen #1 7.5 18.0 1.56 0.28 0.18
Beam test
specimen #2 12.5 26.0 2.60 0.27 0.20
Beam test
specimen #3 12.6 24.5 2.63 0.41 0.21
Beam test
specimen #4 10.8 25.0 2.25 0.29 0.18
Beam test
specimen #5 12.8 29.0 2.67 0.30 0.18
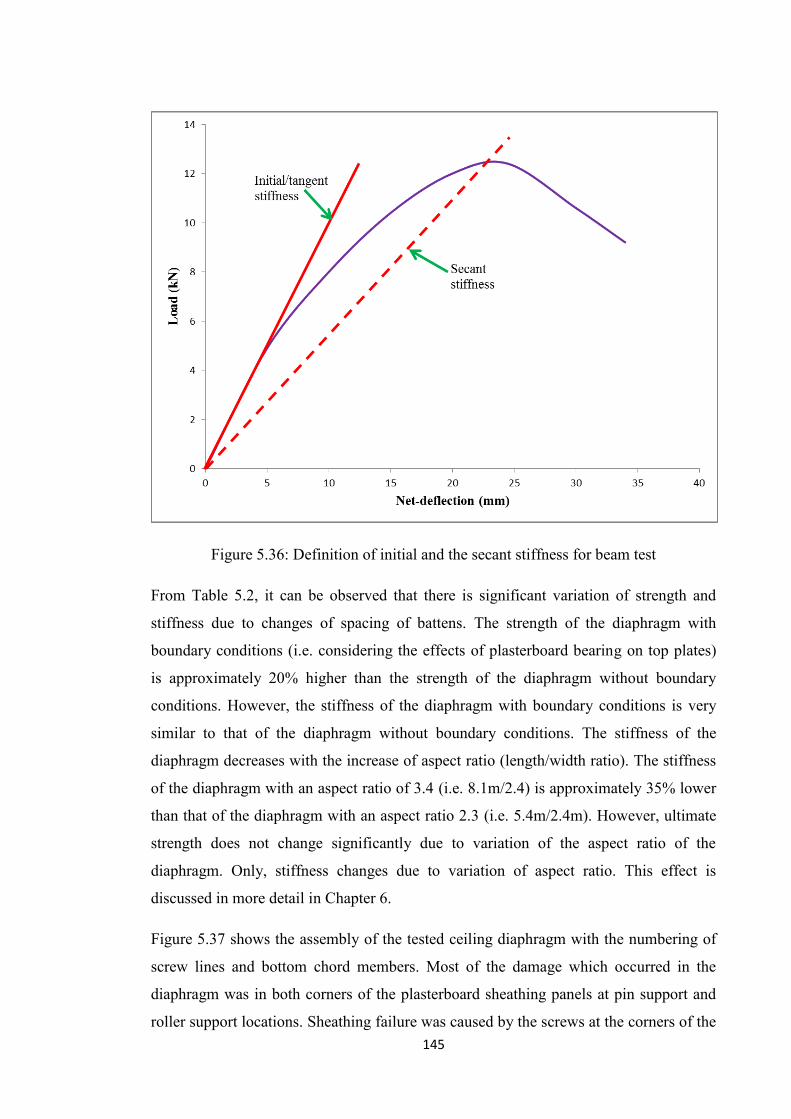
145
Figure 5.36: Definition of initial and the secant stiffness for beam test
From Table 5.2, it can be observed that there is significant variation of strength and
stiffness due to changes of spacing of battens. The strength of the diaphragm with
boundary conditions (i.e. considering the effects of plasterboard bearing on top plates)
is approximately 20% higher than the strength of the diaphragm without boundary
conditions. However, the stiffness of the diaphragm with boundary conditions is very
similar to that of the diaphragm without boundary conditions. The stiffness of the
diaphragm decreases with the increase of aspect ratio (length/width ratio). The stiffness
of the diaphragm with an aspect ratio of 3.4 (i.e. 8.1m/2.4) is approximately 35% lower
than that of the diaphragm with an aspect ratio 2.3 (i.e. 5.4m/2.4m). However, ultimate
strength does not change significantly due to variation of the aspect ratio of the
diaphragm. Only, stiffness changes due to variation of aspect ratio. This effect is
discussed in more detail in Chapter 6.
Figure 5.37 shows the assembly of the tested ceiling diaphragm with the numbering of
screw lines and bottom chord members. Most of the damage which occurred in the
diaphragm was in both corners of the plasterboard sheathing panels at pin support and
roller support locations. Sheathing failure was caused by the screws at the corners of the

146
diaphragm and along the diaphragm perimeter pulling through the plasterboard
sheathing. In all specimens, failure occurred as a result of tear-out of plasterboard edges
at both corners of the specimen. Tear-out of plasterboard edges also occurred at the first
three bottom corner screws from the left corner (i.e. line 1, line 2 and line 3) and the
right corner (i.e. line 22, line 23 and line 24) of the diaphragm (refer to Figure 5.37).
Failure also occurred due to field screws pulling out simultaneously through the
plasterboard along line 1, line 2 and line 3 between bottom chord 1 and bottom chord 2
as well as field screws pulling out along line 22, line 23 and line 24 between bottom
chord 6 and bottom chord 7. Therefore, it can be stated that failure occurred between
the first two bottom corners where the shear force is maximum. The screws along line 1,
line 2 and line 3 in the left side and along line 22, line 23 and line 24 in the right side (as
shown in Figure 5.37) also deformed at the same time. The rest of the screws remained
essentially undeformed.
Figure 5.37: Typical ceiling diaphragm assembly (showing numbering for explanation)
It should be noted that the cladding came into contact with the top plates before failure
of the screws had occurred. The movement of ceiling battens provided bearing of the
cladding against the top plates prior to the failure of the cladding screws.
In tests 1, 2, and 3, the ceiling battens were continuous. However, it is common to have
joints in ceiling battens and bottom chord members. In tests 4 and 5, the ceiling battens
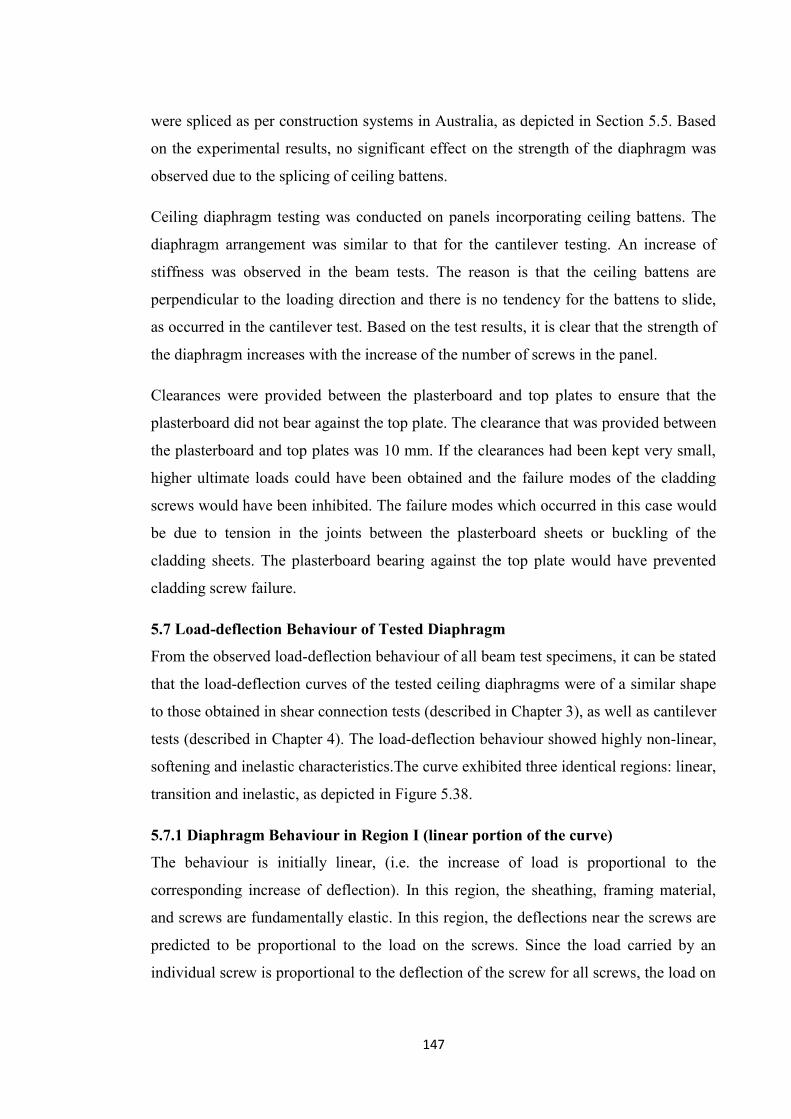
147
were spliced as per construction systems in Australia, as depicted in Section 5.5. Based
on the experimental results, no significant effect on the strength of the diaphragm was
observed due to the splicing of ceiling battens.
Ceiling diaphragm testing was conducted on panels incorporating ceiling battens. The
diaphragm arrangement was similar to that for the cantilever testing. An increase of
stiffness was observed in the beam tests. The reason is that the ceiling battens are
perpendicular to the loading direction and there is no tendency for the battens to slide,
as occurred in the cantilever test. Based on the test results, it is clear that the strength of
the diaphragm increases with the increase of the number of screws in the panel.
Clearances were provided between the plasterboard and top plates to ensure that the
plasterboard did not bear against the top plate. The clearance that was provided between
the plasterboard and top plates was 10 mm. If the clearances had been kept very small,
higher ultimate loads could have been obtained and the failure modes of the cladding
screws would have been inhibited. The failure modes which occurred in this case would
be due to tension in the joints between the plasterboard sheets or buckling of the
cladding sheets. The plasterboard bearing against the top plate would have prevented
cladding screw failure.
5.7 Load-deflection Behaviour of Tested Diaphragm
From the observed load-deflection behaviour of all beam test specimens, it can be stated
that the load-deflection curves of the tested ceiling diaphragms were of a similar shape
to those obtained in shear connection tests (described in Chapter 3), as well as cantilever
tests (described in Chapter 4). The load-deflection behaviour showed highly non-linear,
softening and inelastic characteristics.The curve exhibited three identical regions: linear,
transition and inelastic, as depicted in Figure 5.38.
5.7.1 Diaphragm Behaviour in Region I (linear portion of the curve)
The behaviour is initially linear, (i.e. the increase of load is proportional to the
corresponding increase of deflection). In this region, the sheathing, framing material,
and screws are fundamentally elastic. In this region, the deflections near the screws are
predicted to be proportional to the load on the screws. Since the load carried by an
individual screw is proportional to the deflection of the screw for all screws, the load on
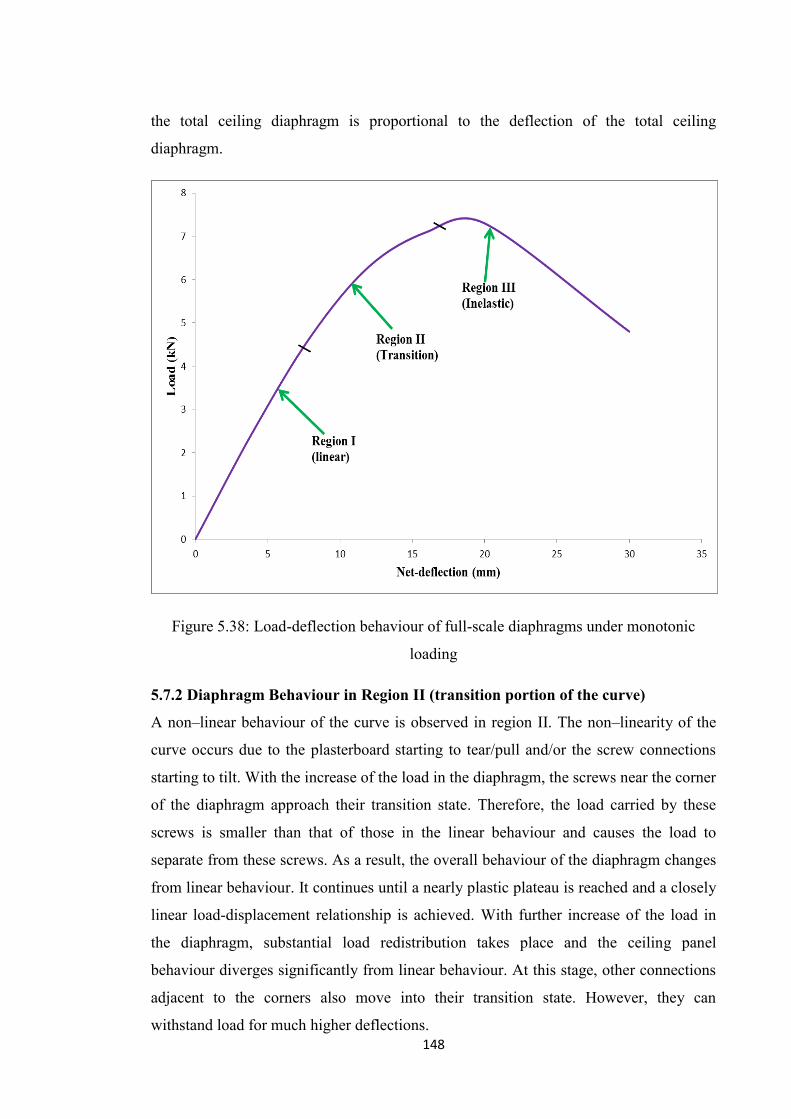
148
the total ceiling diaphragm is proportional to the deflection of the total ceiling
diaphragm.
Figure 5.38: Load-deflection behaviour of full-scale diaphragms under monotonic
loading
5.7.2 Diaphragm Behaviour in Region II (transition portion of the curve)
A non–linear behaviour of the curve is observed in region II. The non–linearity of the
curve occurs due to the plasterboard starting to tear/pull and/or the screw connections
starting to tilt. With the increase of the load in the diaphragm, the screws near the corner
of the diaphragm approach their transition state. Therefore, the load carried by these
screws is smaller than that of those in the linear behaviour and causes the load to
separate from these screws. As a result, the overall behaviour of the diaphragm changes
from linear behaviour. It continues until a nearly plastic plateau is reached and a closely
linear load-displacement relationship is achieved. With further increase of the load in
the diaphragm, substantial load redistribution takes place and the ceiling panel
behaviour diverges significantly from linear behaviour. At this stage, other connections
adjacent to the corners also move into their transition state. However, they can
withstand load for much higher deflections.

149
5.7.3 Diaphragm Behaviour in Region III (inelastic portion of the curve)
With further increases in load, more connections transfer into the transition portion,
resulting in the deflection of the diaphragm as an entire to be significantly higher than
the linear behaviour. Significant redistribution of the load occurs, and screws near the
centre of the plasterboard which have a big plastic region in their load-deflection curve
carry greater loads than linear behaviour. The load-deflection behaviour at the ultimate
loads above the transition region is determined essentially by the screws in the plastic
behaviour region. However, the load-deflection behaviour of screws in this region is not
only a function of the properties of the materials used, but also the edge distance of the
plasterboard sheet and the orientation of loads on the screws. The failure of individual
screws by pulling through the plasterboard sheathing or tearing away from the
plasterboard through an edge causes the load on the residual screws to change in
magnitude as well as direction. As a result, the load-deflection behaviour for a certain
screw deviates due to load redistribution as the test proceeds. At the failure location,
the failure of one screw and the consequent load redistribution result in overloading of
all residual screws along that edge. Therefore, screws along the edge fail at the same
time, resulting in a drop in load-carrying capacity. The carrying capacity of the
diaphragm decreases with further increase of deflection.
5.8 Summary and Conclusions
It is essential to conduct full-scale ceiling diaphragm testing in beam configuration in
order to gain a complete understanding of the performance of steel-framed domestic
structures under lateral loading. Experimental test results are also essential to validate
the analytical models. While the cantilever set-up is simpler from an experimentation
point of view, the beam analogy is a more realistic representation of how a ceiling spans
between bracing walls. Therefore, a complete beam testing program was arranged and
developed to recognize and quantify the most important factors that affect the strength
and stiffness of the ceiling diaphragm.
This chapter has presented the details of the test specimens, test methods, and
instrumentation and the data acquisition system engaged for full-scale ceiling
diaphragm in beam assembly has been reported. The results, analyses and conclusions
obtained from this phase of the experimental program were also reported. The test
results focussed on the behaviour of the ceiling diaphragm under in-plane lateral loads
150
generated due to wind. Based on the results presented for five specimens, the following
remarks can be made:
For all tested diaphragms, the ultimate failure mode was found to be the same.
In all diaphragms, the plasterboard connections failed at the locations where
maximum relative movement between the plasterboard and battens occurred.
In all specimens, failure occurred as result of tear-out of plasterboard edges at
the corners of the specimen. Tear-out of plasterboard edges also occurred at the
first three bottom corner screws from the left and right corners of the diaphragm.
The top plates of the end walls supporting the roof trusses provided further
bending resistance to the ceiling diaphragm and also provided bearing area for
the plasterboard ceiling as it translates in the direction of an end wall.
The strength of a diaphragm with boundary conditions (i.e. considering the
effects of plasterboard bearing on top plates) is approximately 20% higher than
that of a diaphragm without boundary conditions. However, the stiffness of a
diaphragm with boundary conditions is almost the same as that of a diaphragm
without boundary conditions.
The stiffness of the diaphragm decreases with the increase of aspect ratio
(length/width ratio). The stiffness of a diaphragm with an aspect ratio of 3.4 is
approximately 35% lower than that of a diaphragm with an aspect ratio 2.3.
However, the strength does not change significantly due to variation of the
aspect ratio.
The load-deflection curves of all the ceiling diaphragms tested in beam
configuration were of a similar shape to those obtained in cantilever tests.
In all specimens, no relative displacement was observed between the ceiling
battens and the bottom chords. However, considerable bending of the ceiling
battens was observed.
No damage observed to the bottom chords was observed. Some local buckling of
the bottom chord members was recoverable after the termination of the test.
No relative movement occurred between the individual plasterboard sheets. The
movement of the plasterboard relative to the frame was only in the loading
direction. The whole cladding system translated as a single unit.

151
There is no significant effect on the strength of the diaphragm due to splicing of
ceiling battens.
It is important to develop analytical models of the structural behaviour of the ceiling
diaphragm. It is also essential to observe the three-dimensional behaviour of the
structural response under in-plane loading. The analytical modelling is described in
detail in Chapter 6. As mentioned in Chapter 2, there are several factors that affect the
strength and stiffness of the diaphragm. Therefore, it is crucial to conduct parametric
studies with varying parameters in order to observe the behaviour of the diaphragm.
With the understanding and knowledge of the behaviour of the tested ceiling diaphragm
in beam configuration under a one-third loading system, analytical models have been
developed to predict the performance of plasterboard-clad ceiling diaphragms typically
found in light steel-framed domestic structures in Australia. The details of these
parametric studies are described in Chapter 6.
152
CHAPTER 6
ANALYTICAL MODELLING
6.1 Introduction
Analytical modelling is essential to complete the knowledge achieved from
experimental analyses, particularly in performing parametric analyses. The aim of this
chapter is to amalgamate the experimental test results reported in Chapter 4 and Chapter
5, and to utilise them to develop analytical models of plasterboard-clad steel-framed
ceiling diaphragms.
This chapter includes brief explanations of the assumptions considered in developing
the model, and presents analytical models under monotonic load for predicting the
lateral load-displacement behaviour of plasterboard-clad ceiling diaphragms. This
chapter presents the validation of the finite element (FE) models against the results of
the experiments. Parametric studies are also performed to determine the sensitivity of
FE models subjected to different configurations.
6.2 Finite Element Modelling Software
ANSYS (version 12.1) software was used for the analytical modelling. The reason for
choosing ANSYS is that it has an extensive library of elements and can consider
different types of non-linearity. The response of a structure or a component can vary
unduly with the applied loads due to the non-linearity of the structure. ANSYS covers
various types of non-linearity, such as material non-linearity, geometric non-linearity,
element non-linearity and non-linear buckling (SASI, 2014). In this research, element
non-linearity is only used in the model development of the ceiling diaphragm of steel-
framed domestic structures. In the ANSYS program, typical non-linear elements include
contact surface elements, interface elements, spring elements, and tension-only or
compression-only elements.
In the modelling of ceiling diaphragms of domestic structures as presented here, non-
linear spring elements were used comprehensively. This non-linear spring element is
unidirectional with a non-linear generalized load-displacement capability. The element
possesses a single degree of freedom. The input load-displacement curve has portions
with either positive or negative slopes, as presented in Figure 6.1. In the input load-
displacement curve, the unloading curve is parallel to the initial slope.
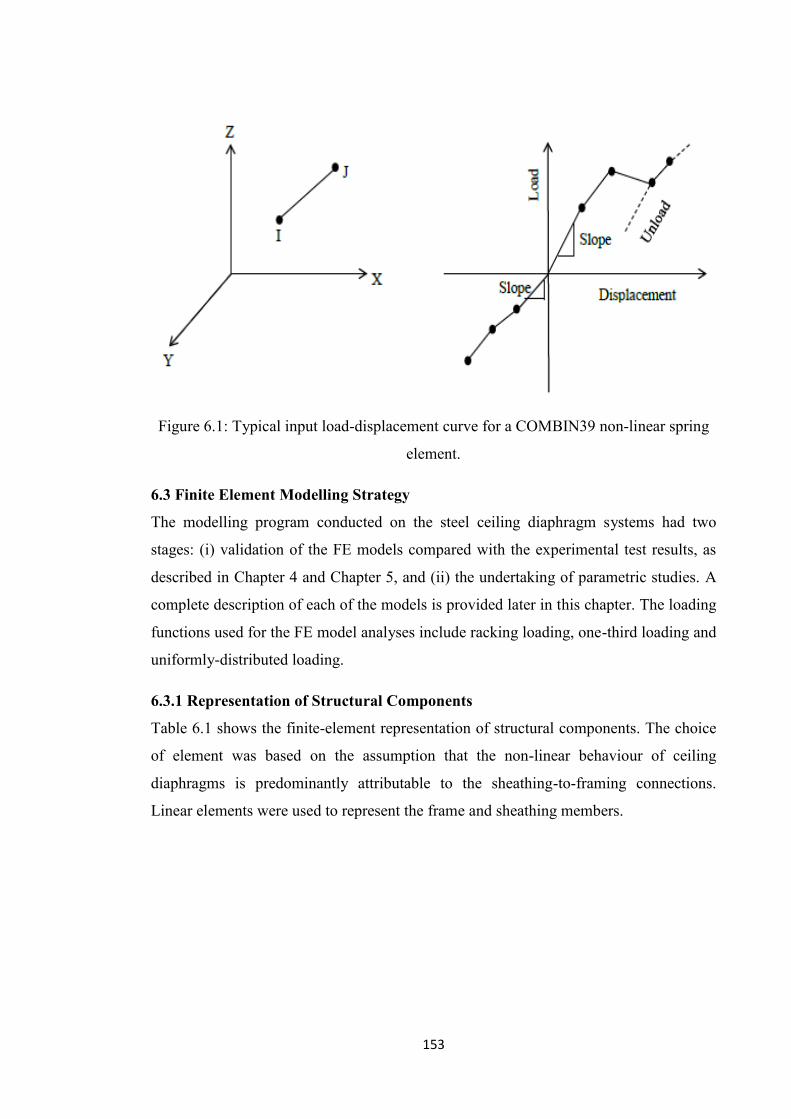
153
Figure 6.1: Typical input load-displacement curve for a COMBIN39 non-linear spring
element.
6.3 Finite Element Modelling Strategy
The modelling program conducted on the steel ceiling diaphragm systems had two
stages: (i) validation of the FE models compared with the experimental test results, as
described in Chapter 4 and Chapter 5, and (ii) the undertaking of parametric studies. A
complete description of each of the models is provided later in this chapter. The loading
functions used for the FE model analyses include racking loading, one-third loading and
uniformly-distributed loading.
6.3.1 Representation of Structural Components
Table 6.1 shows the finite-element representation of structural components. The choice
of element was based on the assumption that the non-linear behaviour of ceiling
diaphragms is predominantly attributable to the sheathing-to-framing connections.
Linear elements were used to represent the frame and sheathing members.
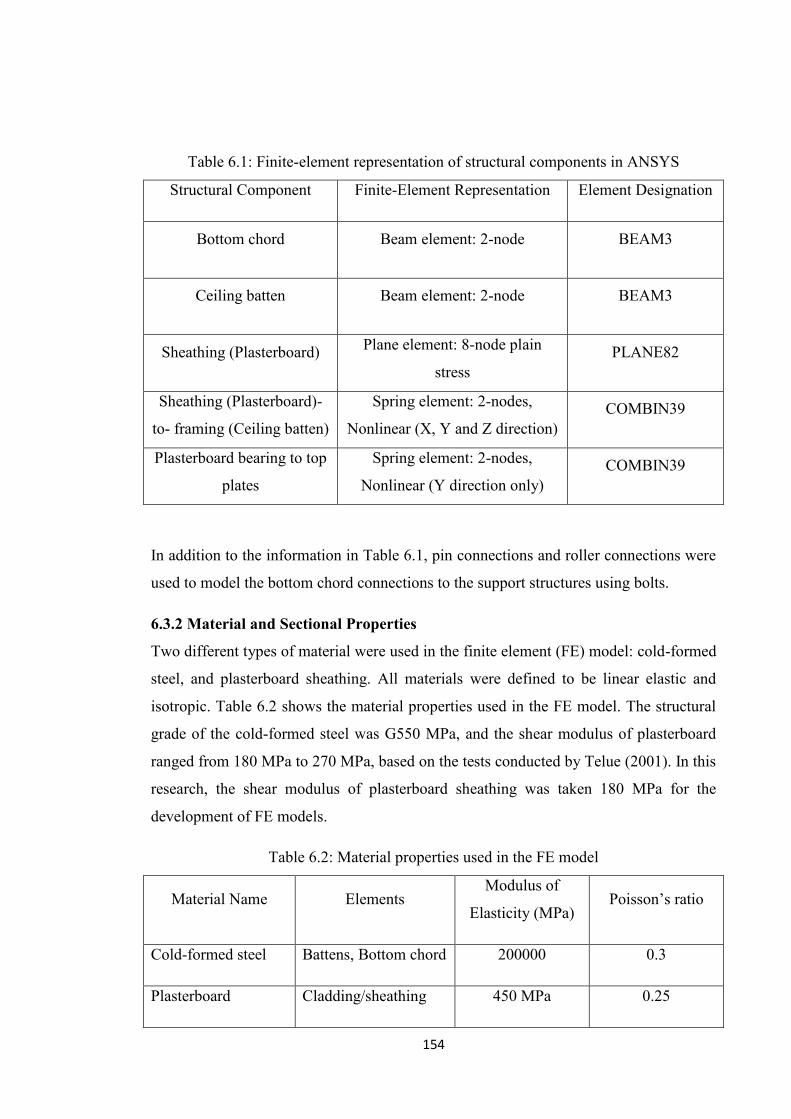
154
Table 6.1: Finite-element representation of structural components in ANSYS
Structural Component Finite-Element Representation Element Designation
Bottom chord Beam element: 2-node BEAM3
Ceiling batten Beam element: 2-node BEAM3
Sheathing (Plasterboard) Plane element: 8-node plain
stress PLANE82
Sheathing (Plasterboard)-
to- framing (Ceiling batten)
connections
Spring element: 2-nodes,
Nonlinear (X, Y and Z direction) COMBIN39
Plasterboard bearing to top
plates
Spring element: 2-nodes,
Nonlinear (Y direction only) COMBIN39
In addition to the information in Table 6.1, pin connections and roller connections were
used to model the bottom chord connections to the support structures using bolts.
6.3.2 Material and Sectional Properties
Two different types of material were used in the finite element (FE) model: cold-formed
steel, and plasterboard sheathing. All materials were defined to be linear elastic and
isotropic. Table 6.2 shows the material properties used in the FE model. The structural
grade of the cold-formed steel was G550 MPa, and the shear modulus of plasterboard
ranged from 180 MPa to 270 MPa, based on the tests conducted by Telue (2001). In this
research, the shear modulus of plasterboard sheathing was taken 180 MPa for the
development of FE models.
Table 6.2: Material properties used in the FE model
Material Name Elements Modulus of
Elasticity (MPa) Poisson’s ratio
Cold-formed steel Battens, Bottom chord 200000 0.3
Plasterboard Cladding/sheathing 450 MPa 0.25
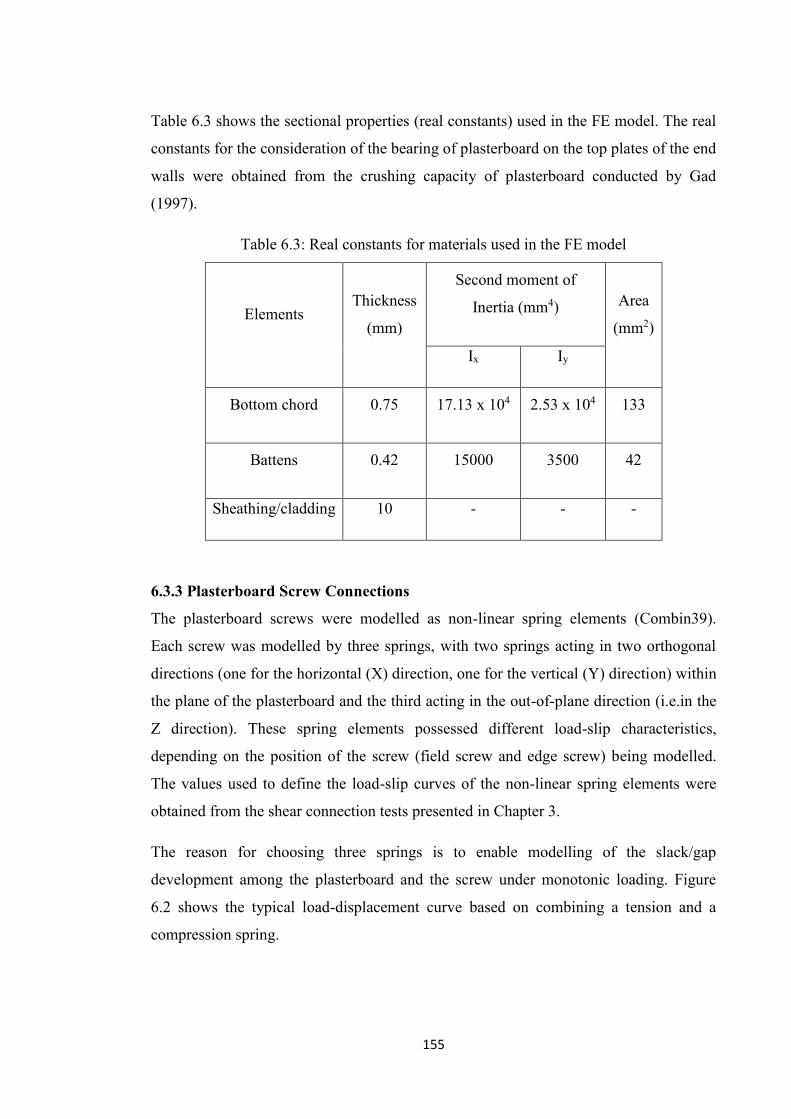
155
Table 6.3 shows the sectional properties (real constants) used in the FE model. The real
constants for the consideration of the bearing of plasterboard on the top plates of the end
walls were obtained from the crushing capacity of plasterboard conducted by Gad
(1997).
Table 6.3: Real constants for materials used in the FE model
Elements Thickness
(mm)
Second moment of
Inertia (mm4) Area
(mm2)
Ix Iy
Bottom chord 0.75 17.13 x 10⁴ 2.53 x 10⁴ 133
Battens 0.42 15000 3500 42
Sheathing/cladding 10 - - -
6.3.3 Plasterboard Screw Connections
The plasterboard screws were modelled as non-linear spring elements (Combin39).
Each screw was modelled by three springs, with two springs acting in two orthogonal
directions (one for the horizontal (X) direction, one for the vertical (Y) direction) within
the plane of the plasterboard and the third acting in the out-of-plane direction (i.e.in the
Z direction). These spring elements possessed different load-slip characteristics,
depending on the position of the screw (field screw and edge screw) being modelled.
The values used to define the load-slip curves of the non-linear spring elements were
obtained from the shear connection tests presented in Chapter 3.
The reason for choosing three springs is to enable modelling of the slack/gap
development among the plasterboard and the screw under monotonic loading. Figure
6.2 shows the typical load-displacement curve based on combining a tension and a
compression spring.
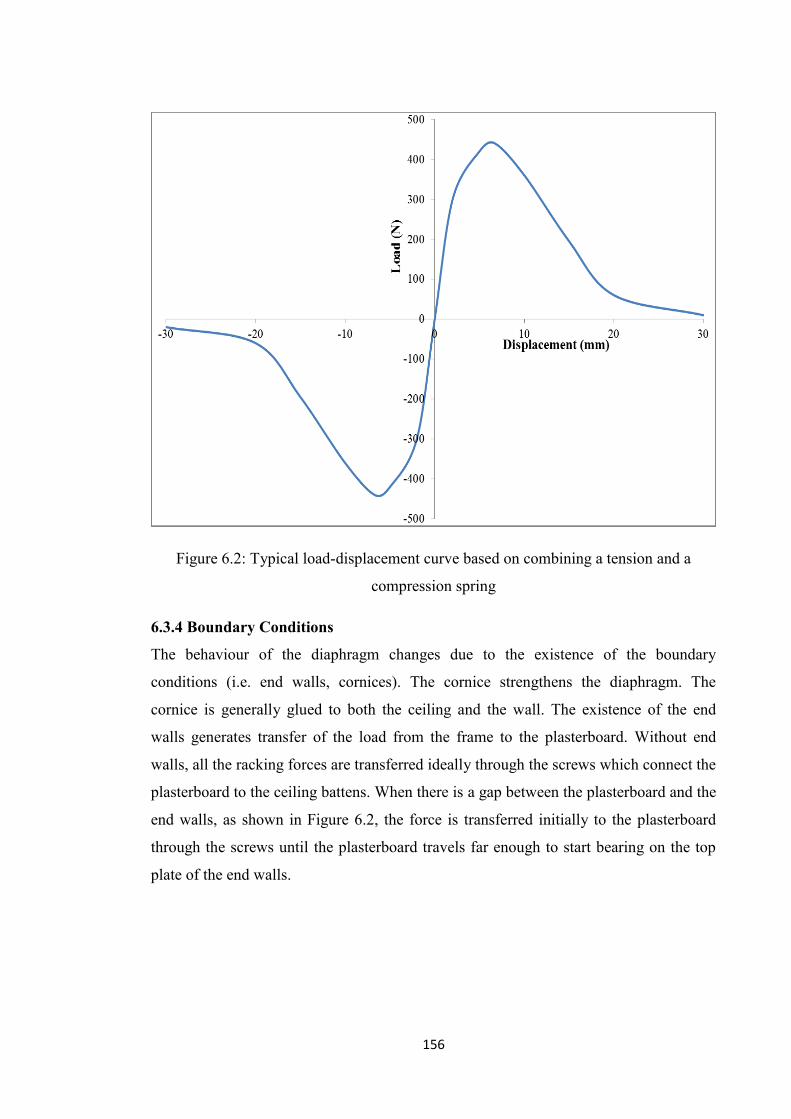
156
Figure 6.2: Typical load-displacement curve based on combining a tension and a
compression spring
6.3.4 Boundary Conditions
The behaviour of the diaphragm changes due to the existence of the boundary
conditions (i.e. end walls, cornices). The cornice strengthens the diaphragm. The
cornice is generally glued to both the ceiling and the wall. The existence of the end
walls generates transfer of the load from the frame to the plasterboard. Without end
walls, all the racking forces are transferred ideally through the screws which connect the
plasterboard to the ceiling battens. When there is a gap between the plasterboard and the
end walls, as shown in Figure 6.2, the force is transferred initially to the plasterboard
through the screws until the plasterboard travels far enough to start bearing on the top
plate of the end walls.

157
Figure 6.3: Effects of plasterboard bearing edges on the top plates of end walls
In practice, there is a 10 mm gap between the ceiling diaphragm and the end walls. In
order to model the bearing of the plasterboard against the end walls, non-linear springs
were connected along the plasterboard edges to accommodate this action, as presented
in Figure 6.4. All of the springs worked in compression only. The springs included the
initial slackness (gap) and had the load-displacement characteristics of plasterboard
crushing along the edge. Therefore, in the FE model, the top plates of the end walls
were attached to the bottom chord members on which the springs were also connected.
Figure 6.4: Schematic diagram of plasterboard-bearing edge modelling

158
Gad (1997) conducted a number of tests on crushing small segments of plasterboard
along the edge. The load-displacement behaviour for plasterboard crushing was
obtained from those tests. In this test, Gad (1997) loaded small portions of plasterboard
in compression along the edge to obtain experimentally the crushing capacity of
plasterboard and the corresponding load-deflection behaviour. The plasterboard edge
was actually loaded against the flange of a stud section as would happen in a real wall.
6.4 Model Validation against Test Results
6.4.1 Validation of Model against Cantilever Test Results
The model was verified with the experimental cantilever test results. The experimental
set-up comprised of a single steel ceiling diaphragm frame measuring 2400 x 2225 mm
with batten spacing of 600 mm and bottom chord spacing of 750 mm. It was clad with
standard 10 mm plasterboard laid horizontally. The plasterboard was fixed to the frame
by 6 gauge x 18 mm long bugle-head needle-point screws. The screw spacing was at
300 mm centres along the ceiling battens.
The FE model was created to the same construction details, except for the supporting
loading frame details. Figure 6.5 represents the modelling strategy of the isolated
ceiling diaphragm in cantilever configuration. In the experiment, the racking and uplift
displacements were measured. For the experimental results, the horizontal component of
uplift was deducted from the total racking deflection to find the net racking
displacement. In the FE model, uplift was eliminated; hence the total displacement was
the same as the net racking displacement.
To validate the modelling strategies, the FE model was subjected to increasing
displacement in pulling directions along the top bottom chord members, as illustrated in
Figure 6.5. The application of the displacement was consistent with the experimental
set-up. The obtained load-deflection curve from FE model was plotted against the
experimental results, as shown in Figure 6.6.

159
Figure 6.5: FE model developed in cantilever configuration
Figure 6.6: Comparison between analytical and experimental results in cantilever
configuration for an isolated ceiling diaphragm
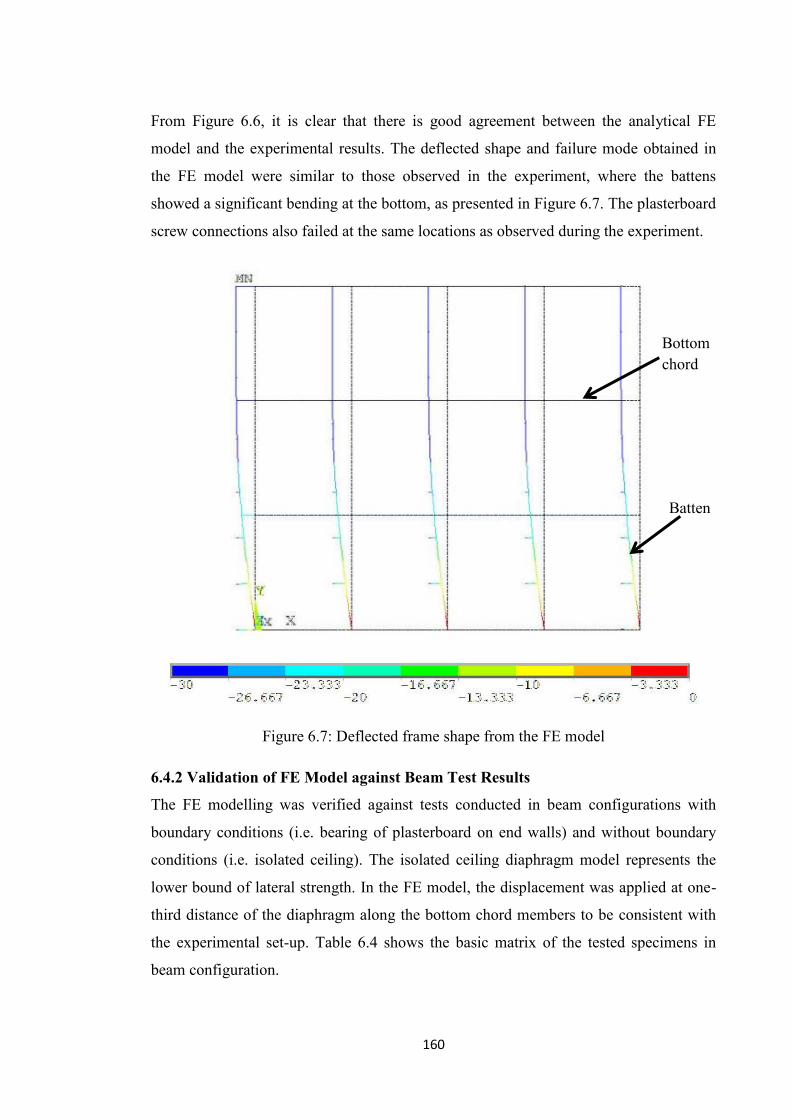
160
From Figure 6.6, it is clear that there is good agreement between the analytical FE
model and the experimental results. The deflected shape and failure mode obtained in
the FE model were similar to those observed in the experiment, where the battens
showed a significant bending at the bottom, as presented in Figure 6.7. The plasterboard
screw connections also failed at the same locations as observed during the experiment.
Figure 6.7: Deflected frame shape from the FE model
6.4.2 Validation of FE Model against Beam Test Results
The FE modelling was verified against tests conducted in beam configurations with
boundary conditions (i.e. bearing of plasterboard on end walls) and without boundary
conditions (i.e. isolated ceiling). The isolated ceiling diaphragm model represents the
lower bound of lateral strength. In the FE model, the displacement was applied at one-
third distance of the diaphragm along the bottom chord members to be consistent with
the experimental set-up. Table 6.4 shows the basic matrix of the tested specimens in
beam configuration.
Batten
Bottom chord
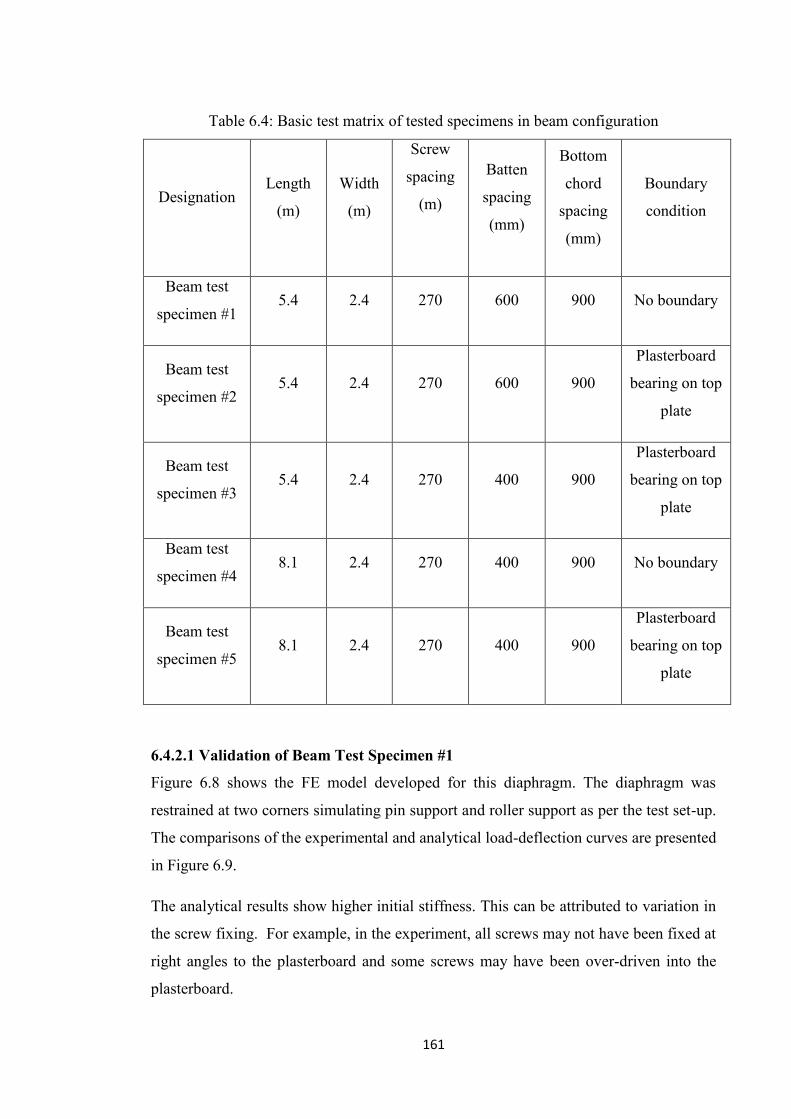
161
Table 6.4: Basic test matrix of tested specimens in beam configuration
Designation Length
(m)
Width
(m)
Screw
spacing
(m)
Batten
spacing
(mm)
Bottom
chord
spacing
(mm)
Boundary
condition
Beam test
specimen #1 5.4 2.4 270 600 900 No boundary
Beam test
specimen #2 5.4 2.4 270 600 900
Plasterboard
bearing on top
plate
Beam test
specimen #3 5.4 2.4 270 400 900
Plasterboard
bearing on top
plate
Beam test
specimen #4 8.1 2.4 270 400 900 No boundary
Beam test
specimen #5 8.1 2.4 270 400 900
Plasterboard
bearing on top
plate
6.4.2.1 Validation of Beam Test Specimen #1
Figure 6.8 shows the FE model developed for this diaphragm. The diaphragm was
restrained at two corners simulating pin support and roller support as per the test set-up.
The comparisons of the experimental and analytical load-deflection curves are presented
in Figure 6.9.
The analytical results show higher initial stiffness. This can be attributed to variation in
the screw fixing. For example, in the experiment, all screws may not have been fixed at
right angles to the plasterboard and some screws may have been over-driven into the
plasterboard.
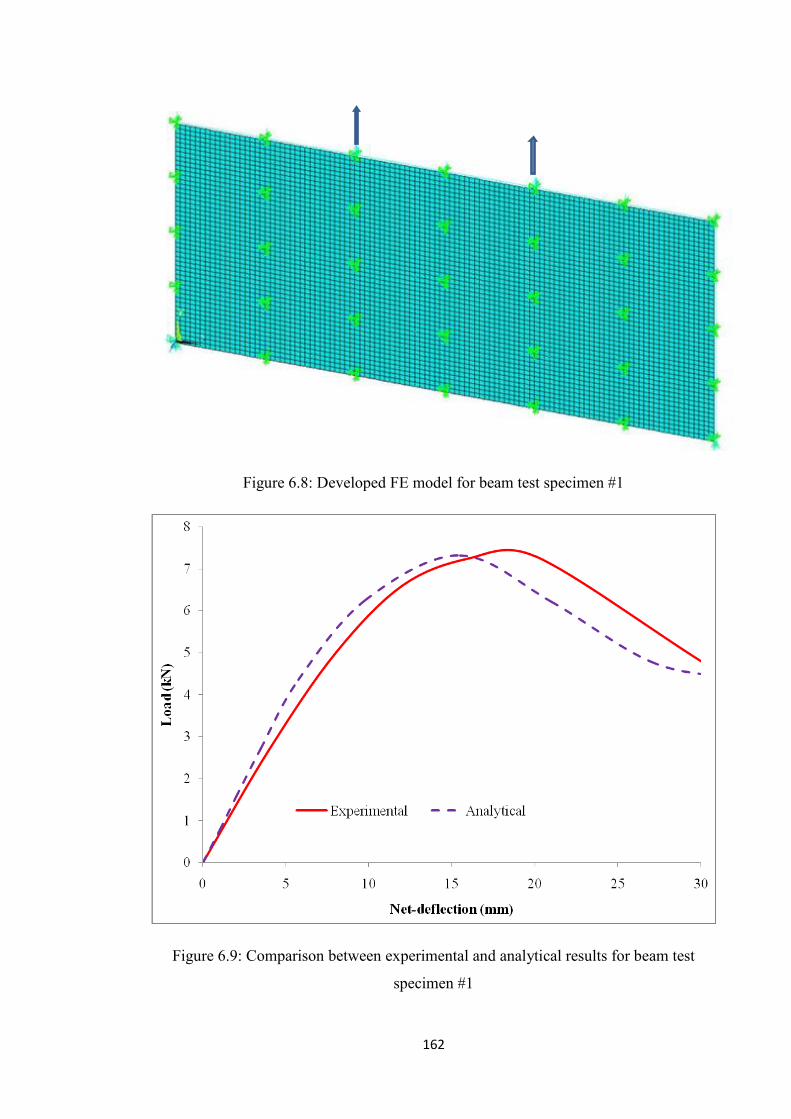
162
Figure 6.8: Developed FE model for beam test specimen #1
Figure 6.9: Comparison between experimental and analytical results for beam test
specimen #1

163
The deflected shape of the diaphragm obtained from the FE model is almost the same as
that observed in the experiment, where the ceiling battens showed a significant bending
at the ends of the diaphragm, as illustrated in Figure 6.10. The maximum relative
movement between the plasterboard and frame occurred at both ends of the diaphragm,
which was also observed in the experiment. Moreover, failure of the screw connections
also occurred at the same locations as those observed during the test.
Figure 6.10: Deflected shape for beam test specimen #1
6.4.2.2 Validation of Beam Test Specimen #2
The top plates of end walls provide bearing areas for the plasterboard ceiling as it
translates in the direction of an end wall. Using the same modelling technique and the
same elements as described earlier, a model was constructed for a single isolated
diaphragm panel (i.e. with corner effects). The construction details are same as those in
diaphragm test #1, as described in the previous section. However, the effects of
plasterboard bearing on the top plates of the flanges of end walls are considered in this
model. Figure 6.11 presents the developed FE model with the addition of consideration
of the plasterboard bearing on top plates of end walls. In this model, the top plates of the
end walls were connected with the bottom chord members using the coupling strategy in
ANSYS. The experimental and analytical results are presented in Figure 6.12. The
behaviour of the diaphragm in the FE model showed very good consistency with the
experimental results.
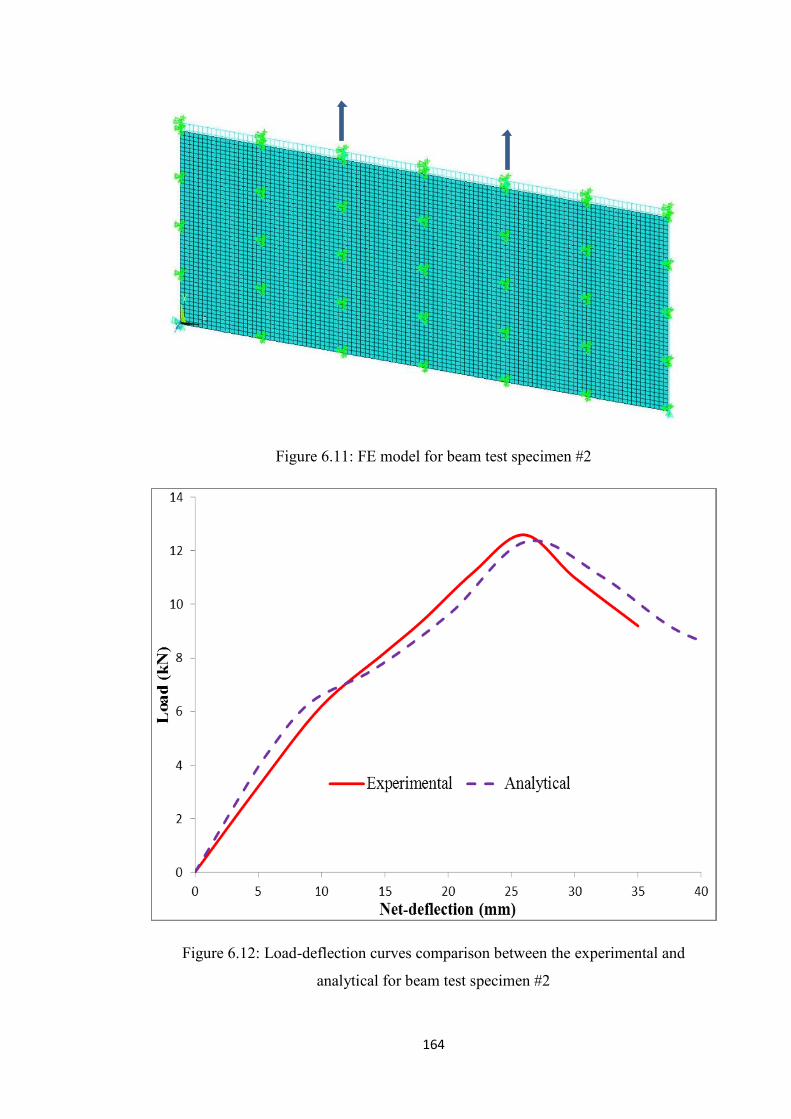
164
Figure 6.11: FE model for beam test specimen #2
Figure 6.12: Load-deflection curves comparison between the experimental and
analytical for beam test specimen #2

165
The deflection behaviour obtained from the FE model nearly followed that observed in
the experiment, where the ceiling battens showed considerable bending, as presented in
Figure 6.13. The maximum relative movement between the plasterboard and frame
occurred at both ends of the diaphragm, which was also observed in the experiment.
Moreover, failure of the screw connections also occurred at the same locations as those
observed during the test. The bearing of the plasterboard edges also occurred at almost
the same location as that observed in the experiment from both ends of the diaphragm.
Refer to Figure 6.13.
Figure 6.13: Deflected shape for beam test specimen #2
6.4.2.3 Validation of Beam Test Specimen #3
In this test, the size of the test specimen was 5400 mm long and 2400 mm wide. The
spacing of the bottom chord members was 900 mm. However, the spacing of the ceiling
battens was kept at 400 mm. The test and corresponding model also included the
bearing effect of plasterboard on the end wall, as shown in Figure 6.14.
Figure 6.15 presents the comparison of load-deflection curves between experimental
and analytical results for beam test specimen #3. The FE model behaviour of the
diaphragm matched closely, with excellent agreement with the experimental results.
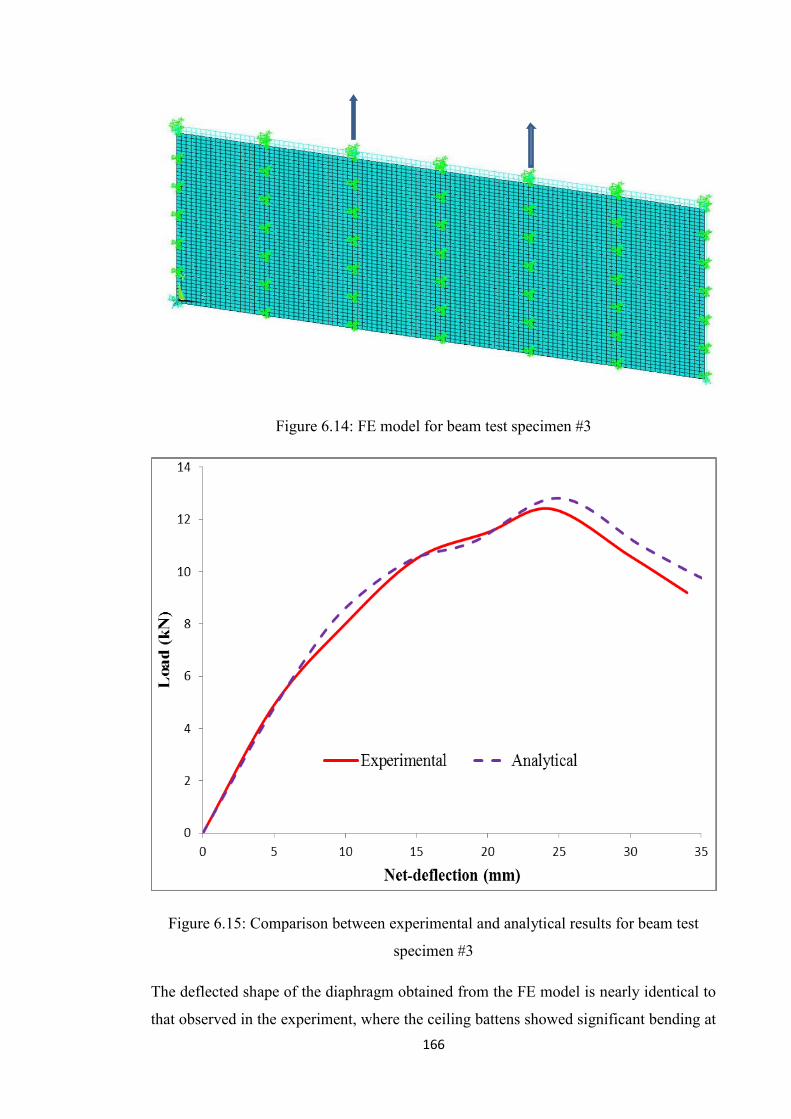
166
Figure 6.14: FE model for beam test specimen #3
Figure 6.15: Comparison between experimental and analytical results for beam test
specimen #3
The deflected shape of the diaphragm obtained from the FE model is nearly identical to
that observed in the experiment, where the ceiling battens showed significant bending at
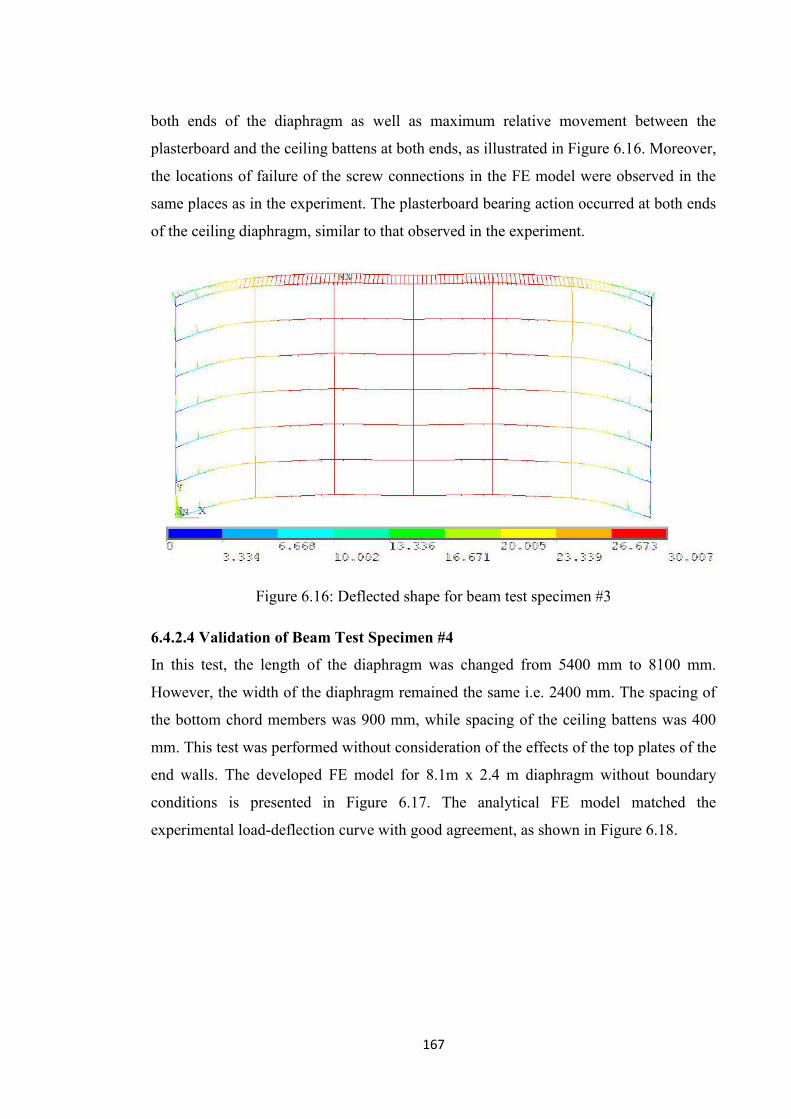
167
both ends of the diaphragm as well as maximum relative movement between the
plasterboard and the ceiling battens at both ends, as illustrated in Figure 6.16. Moreover,
the locations of failure of the screw connections in the FE model were observed in the
same places as in the experiment. The plasterboard bearing action occurred at both ends
of the ceiling diaphragm, similar to that observed in the experiment.
Figure 6.16: Deflected shape for beam test specimen #3
6.4.2.4 Validation of Beam Test Specimen #4
In this test, the length of the diaphragm was changed from 5400 mm to 8100 mm.
However, the width of the diaphragm remained the same i.e. 2400 mm. The spacing of
the bottom chord members was 900 mm, while spacing of the ceiling battens was 400
mm. This test was performed without consideration of the effects of the top plates of the
end walls. The developed FE model for 8.1m x 2.4 m diaphragm without boundary
conditions is presented in Figure 6.17. The analytical FE model matched the
experimental load-deflection curve with good agreement, as shown in Figure 6.18.
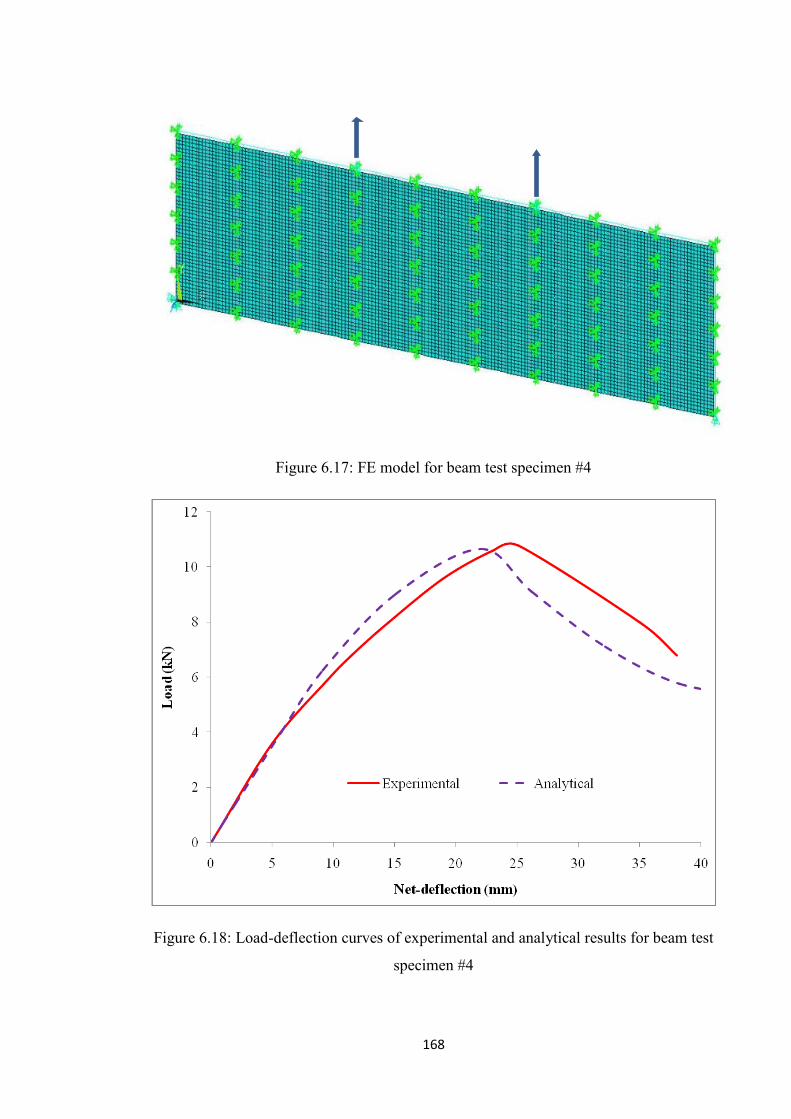
168
Figure 6.17: FE model for beam test specimen #4
Figure 6.18: Load-deflection curves of experimental and analytical results for beam test
specimen #4

169
The deflected shape and failure observed in the FE model were similar to those
observed during the experimental test, where maximum relative movement between the
plasterboard and frame occurred at both ends of the diaphragm. Significant bending of
ceiling battens at both ends of the diaphragm was also observed, as depicted in Figure
6.19. Furthermore, the locations of the failure of the screw connections were also
occurred in the same places as observed in the experiment.
Figure 6.19: Deflected shape for beam test specimen #4
6.4.2.5 Validation of Beam Test Specimen #5
The construction specification of the diaphragm in test #5 was similar to the ceiling
diaphragm of test #4. In this test set-up, the effect of the top plates of the end walls was
considered. Figure 6.20 shows the developed FE model for 8.1m x 2.4 m diaphragm,
taking into consideration the effects of end walls. Very good agreement was found
between the load-deflection behaviour in both the experimental and analytical studies,
as illustrated in Figure 6.21.
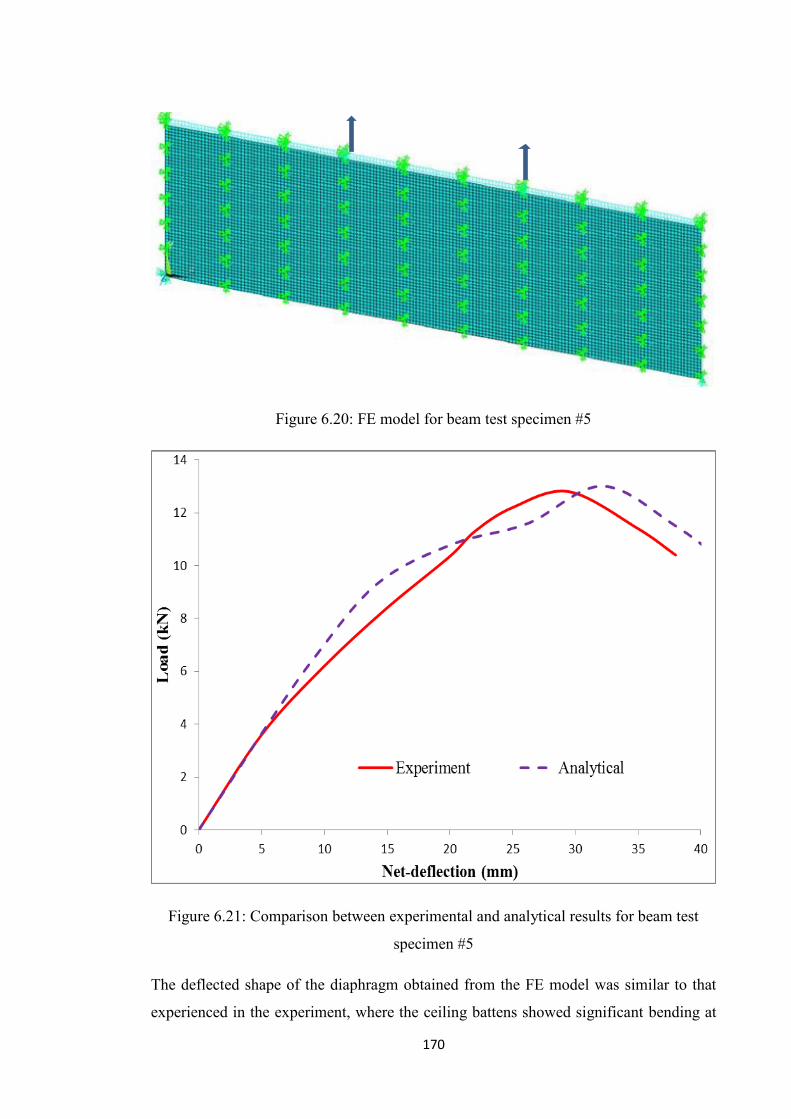
170
Figure 6.20: FE model for beam test specimen #5
Figure 6.21: Comparison between experimental and analytical results for beam test
specimen #5
The deflected shape of the diaphragm obtained from the FE model was similar to that
experienced in the experiment, where the ceiling battens showed significant bending at
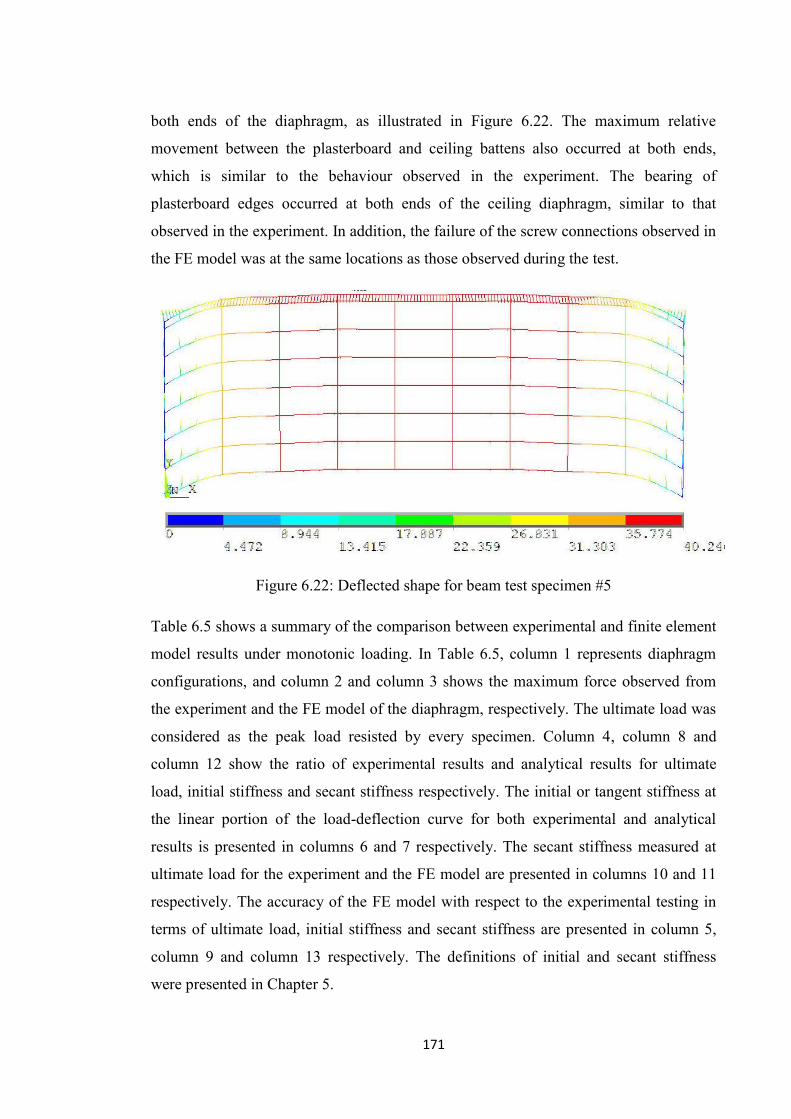
171
both ends of the diaphragm, as illustrated in Figure 6.22. The maximum relative
movement between the plasterboard and ceiling battens also occurred at both ends,
which is similar to the behaviour observed in the experiment. The bearing of
plasterboard edges occurred at both ends of the ceiling diaphragm, similar to that
observed in the experiment. In addition, the failure of the screw connections observed in
the FE model was at the same locations as those observed during the test.
Figure 6.22: Deflected shape for beam test specimen #5
Table 6.5 shows a summary of the comparison between experimental and finite element
model results under monotonic loading. In Table 6.5, column 1 represents diaphragm
configurations, and column 2 and column 3 shows the maximum force observed from
the experiment and the FE model of the diaphragm, respectively. The ultimate load was
considered as the peak load resisted by every specimen. Column 4, column 8 and
column 12 show the ratio of experimental results and analytical results for ultimate
load, initial stiffness and secant stiffness respectively. The initial or tangent stiffness at
the linear portion of the load-deflection curve for both experimental and analytical
results is presented in columns 6 and 7 respectively. The secant stiffness measured at
ultimate load for the experiment and the FE model are presented in columns 10 and 11
respectively. The accuracy of the FE model with respect to the experimental testing in
terms of ultimate load, initial stiffness and secant stiffness are presented in column 5,
column 9 and column 13 respectively. The definitions of initial and secant stiffness
were presented in Chapter 5.

172
Table 6.5: Summary of experimental and analytical results under monotonic loading
Specimen
designation
Ultimate load (kN) Initial stiffness (kN/mm) Secant stiffness (kN/mm)
Exp FEM Exp/
FEM
% difference
w. r. to Exp Exp FEM Exp/
FEM
% difference
w. r. to Exp Exp FEM Exp/
FEM
% difference
w. r. to Exp
Cantilever
configuration 3.9 3.7 1.05 5.1 0.30 0.29 1.03 3.3 0.21 0.20 1.05 4.8
Beam configuration
Beam test specimen #1
7.5 7.3 1.03 2.7 0.68 0.74 0.92 -8.8 0.41 0.46 0.90 -12.2
Beam test specimen # 2
12.5 12.4 1.01 0.8 0.66 0.73 0.90 -10.6 0.48 0.47 1.02 2.1
Beam test specimen # 3
12.6 12.8 0.98 -1.6 0.98 0.94 1.04 4.1 0.51 0.52 0.98 -2.0
Beam test specimen # 4
10.8 10.6 1.02 1.9 0.69 0.71 0.97 -2.9 0.43 0.48 0.90 -11.6
Beam test specimen # 5
12.8 13.0 0.98 -1.6 0.71 0.72 0.98 -1.4 0.44 0.42 1.05 4.5

173
6.5 Finite Element Modelling under Different Loading Configurations
An FE model was developed to understand the performance of the ceiling diaphragm
subjected to different types of lateral loading (i.e. wind loads) namely, one-third point
loading, mid-span loading, and uniformly distributed loading. The analysis was
performed in order to find whether there is any significant variation due to these loading
configurations. The length and width of the diaphragm was 5.4 m, and the spacing of
the ceiling battens and bottom chords was 450 mm and 900 mm respectively. The
plasterboard screws were fixed at 270 mm c/c along all ceiling battens. The load-
deflection curves for all the loading configurations are depicted in Figure 6.23.
Figure 6.23: Load-deflection curves for different loading configurations (one-third point
load, mid-span load, and uniformly distributed load)
From Figure 6.23, it can be seen that the ultimate capacity of the ceiling diaphragm is
quite similar for all loading configurations. However, uniform loading provides
moderately higher stiffness than the one-third point loading configuration, and the mid-
span loading system shows lower stiffness than all of the other loading configurations.
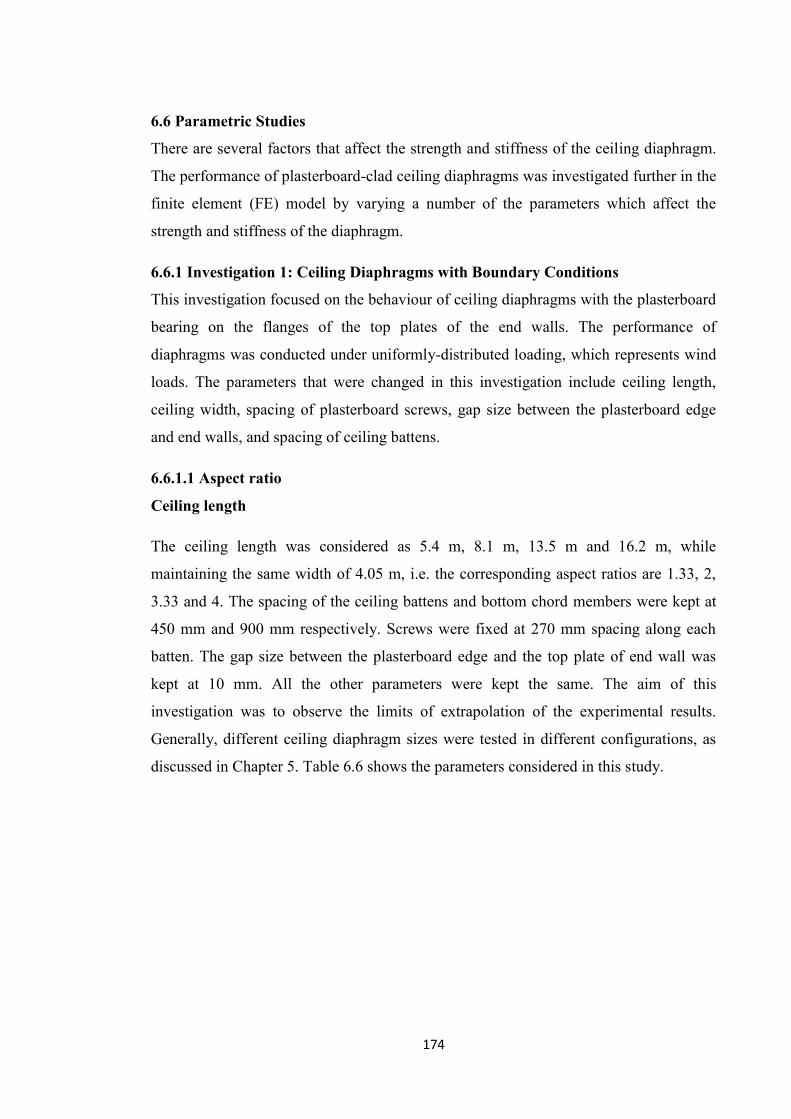
174
6.6 Parametric Studies
There are several factors that affect the strength and stiffness of the ceiling diaphragm.
The performance of plasterboard-clad ceiling diaphragms was investigated further in the
finite element (FE) model by varying a number of the parameters which affect the
strength and stiffness of the diaphragm.
6.6.1 Investigation 1: Ceiling Diaphragms with Boundary Conditions
This investigation focused on the behaviour of ceiling diaphragms with the plasterboard
bearing on the flanges of the top plates of the end walls. The performance of
diaphragms was conducted under uniformly-distributed loading, which represents wind
loads. The parameters that were changed in this investigation include ceiling length,
ceiling width, spacing of plasterboard screws, gap size between the plasterboard edge
and end walls, and spacing of ceiling battens.
6.6.1.1 Aspect ratio
Ceiling length
The ceiling length was considered as 5.4 m, 8.1 m, 13.5 m and 16.2 m, while
maintaining the same width of 4.05 m, i.e. the corresponding aspect ratios are 1.33, 2,
3.33 and 4. The spacing of the ceiling battens and bottom chord members were kept at
450 mm and 900 mm respectively. Screws were fixed at 270 mm spacing along each
batten. The gap size between the plasterboard edge and the top plate of end wall was
kept at 10 mm. All the other parameters were kept the same. The aim of this
investigation was to observe the limits of extrapolation of the experimental results.
Generally, different ceiling diaphragm sizes were tested in different configurations, as
discussed in Chapter 5. Table 6.6 shows the parameters considered in this study.

175
Table 6.6: Parameters for different ceiling lengths with boundary conditions
Model
Designation
Length
(m)
Width
(m)
Aspect
ratio
Screw
spacing
(mm)
Batten
spacing
(mm)
Bottom
chord
spacing
(mm)
Gap
size
(mm)
FEM #A 5.4 4.05 1.33 270 450 900 10
FEM #B 8.1 4.05 2 270 450 900 10
FEM #C 13.5 4.05 3.33 270 450 900 10
FEM #D 16.2 4.05 4 270 450 900 10
Figure 6.24 shows the load-deflection curves obtained from the analysis of four ceiling
lengths. Longer ceilings (those with high aspect ratios) exhibit greater flexural
deformation and failure therefore occurs at a larger deflection compared to shorter
ceilings which have their deflection dominated by shear action.
L=5.4 m
W=4.05 m
AR=1.33 AR=2
AR=3.33 AR=4
L=8.1 m
L=13.5 m L=16.2 m
W=4.05 m
W=4.05 m W=4.05 m
FEM #A FEM #B
FEM #C FEM #D
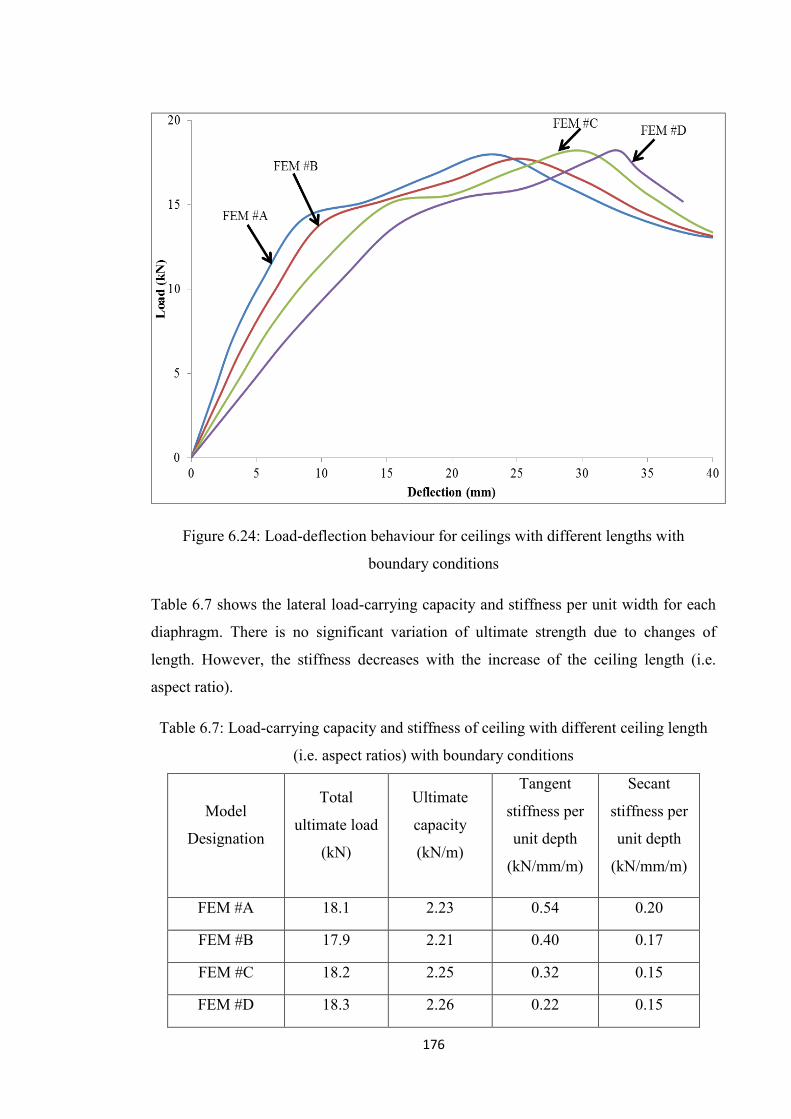
176
Figure 6.24: Load-deflection behaviour for ceilings with different lengths with
boundary conditions
Table 6.7 shows the lateral load-carrying capacity and stiffness per unit width for each
diaphragm. There is no significant variation of ultimate strength due to changes of
length. However, the stiffness decreases with the increase of the ceiling length (i.e.
aspect ratio).
Table 6.7: Load-carrying capacity and stiffness of ceiling with different ceiling length
(i.e. aspect ratios) with boundary conditions
Model
Designation
Total
ultimate load
(kN)
Ultimate
capacity
(kN/m)
Tangent
stiffness per
unit depth
(kN/mm/m)
Secant
stiffness per
unit depth
(kN/mm/m)
FEM #A 18.1 2.23 0.54 0.20
FEM #B 17.9 2.21 0.40 0.17
FEM #C 18.2 2.25 0.32 0.15
FEM #D 18.3 2.26 0.22 0.15

177
Ceiling width
The ceiling width was considered as 4.05 m, 5.4 m, 6.3m, 7.2 m and 10.8 m, while
maintaining the same length of 5.4 m, i.e. the corresponding aspect ratios are 1.33, 1,
0.86, 0.75 and 0.5. The spacings of the ceiling battens and bottom chord members were
kept at 450 mm and 900 mm respectively. Screws were fixed at 270 mm spacing along
each batten, and a 10 mm gap was kept between the edge of the plasterboard and the top
plates of the end walls. All the other parameters were kept the same. Table 6.8 shows
the parameters of diaphragm analysis for the five models considered and their
designations.
Table 6.8: Various parameters for different ceiling width with boundary conditions
Model
Designation
Length
(m)
Width
(m)
Aspect
ratio
Screw
spacing
(mm)
Batten
spacing
(mm)
Bottom
chord
spacing
(mm)
Gap
size
(mm)
FEM #E 5.4 4.05 1.33 270 450 900 10
FEM #F 5.4 5.4 1.00 270 450 900 10
FEM #G 5.4 6.3 0.86 270 450 900 10
FEM #H 5.4 7.2 0.75 270 450 900 10
FEM #I 5.4 10.8 0.50 270 450 900 10
Figure 6.25 shows the load-deflection curves obtained from the FE model of the above-
mentioned models. Similar to earlier finding, ceilings with higher aspect ratios fail at
higher displacement.

178
Figure 6.25: Load-deflection behaviour for ceilings with different widths with boundary
conditions
The lateral load-carrying capacity per unit width for each diaphragm is shown in Table
6.9. The capacity is not constant; it decreases with the increase of the width. However,
the tangent stiffness decreases with the increase of the ceiling width, whereas the secant
stiffness is not monotonic, as shown in Table 6.9. Figure 6.26 illustrates the comparison
of load-deflection behaviour with boundary conditions (i.e. effects of top plates on end
walls) and without boundary conditions for ceilings with different widths. A model
designation with a single letter (for example, FEM #I) indicates diaphragm analysis
with the consideration of the boundary conditions; whereas a double letter model
designation (i.e. FEM #II) indicates the corresponding diaphragm without boundary
conditions.
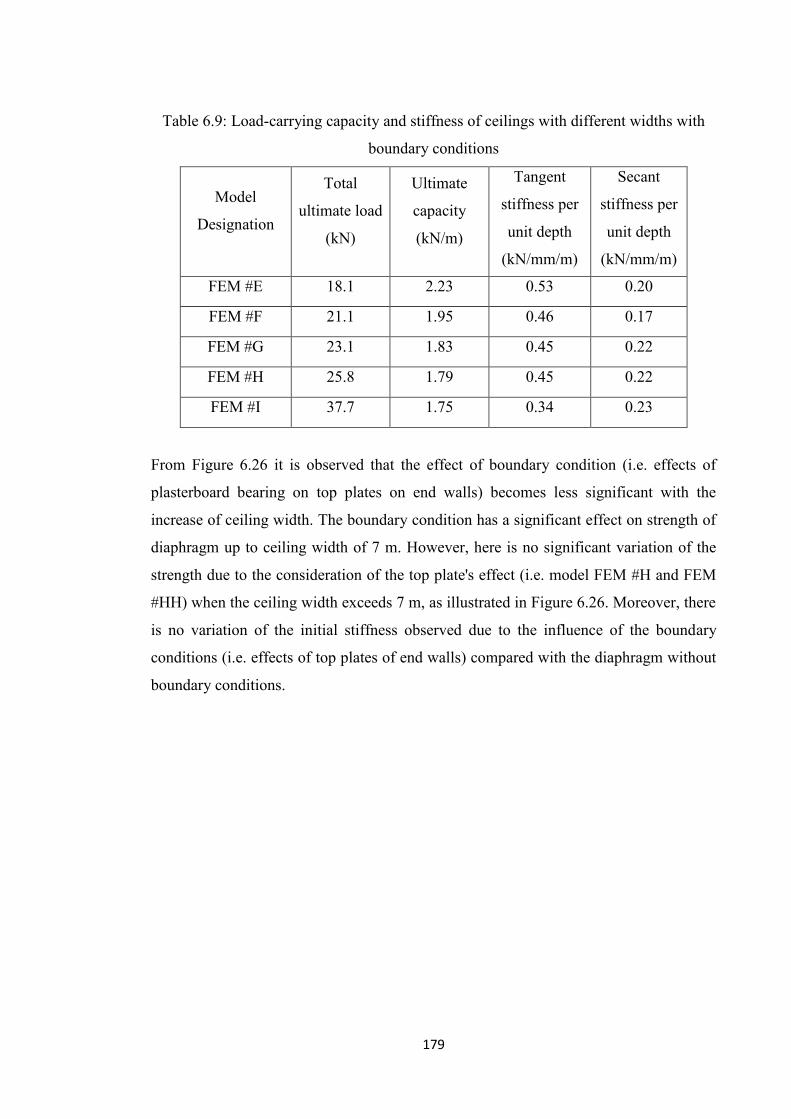
179
Table 6.9: Load-carrying capacity and stiffness of ceilings with different widths with
boundary conditions
Model
Designation
Total
ultimate load
(kN)
Ultimate
capacity
(kN/m)
Tangent
stiffness per
unit depth
(kN/mm/m)
Secant
stiffness per
unit depth
(kN/mm/m)
FEM #E 18.1 2.23 0.53 0.20
FEM #F 21.1 1.95 0.46 0.17
FEM #G 23.1 1.83 0.45 0.22
FEM #H 25.8 1.79 0.45 0.22
FEM #I 37.7 1.75 0.34 0.23
From Figure 6.26 it is observed that the effect of boundary condition (i.e. effects of
plasterboard bearing on top plates on end walls) becomes less significant with the
increase of ceiling width. The boundary condition has a significant effect on strength of
diaphragm up to ceiling width of 7 m. However, here is no significant variation of the
strength due to the consideration of the top plate's effect (i.e. model FEM #H and FEM
#HH) when the ceiling width exceeds 7 m, as illustrated in Figure 6.26. Moreover, there
is no variation of the initial stiffness observed due to the influence of the boundary
conditions (i.e. effects of top plates of end walls) compared with the diaphragm without
boundary conditions.
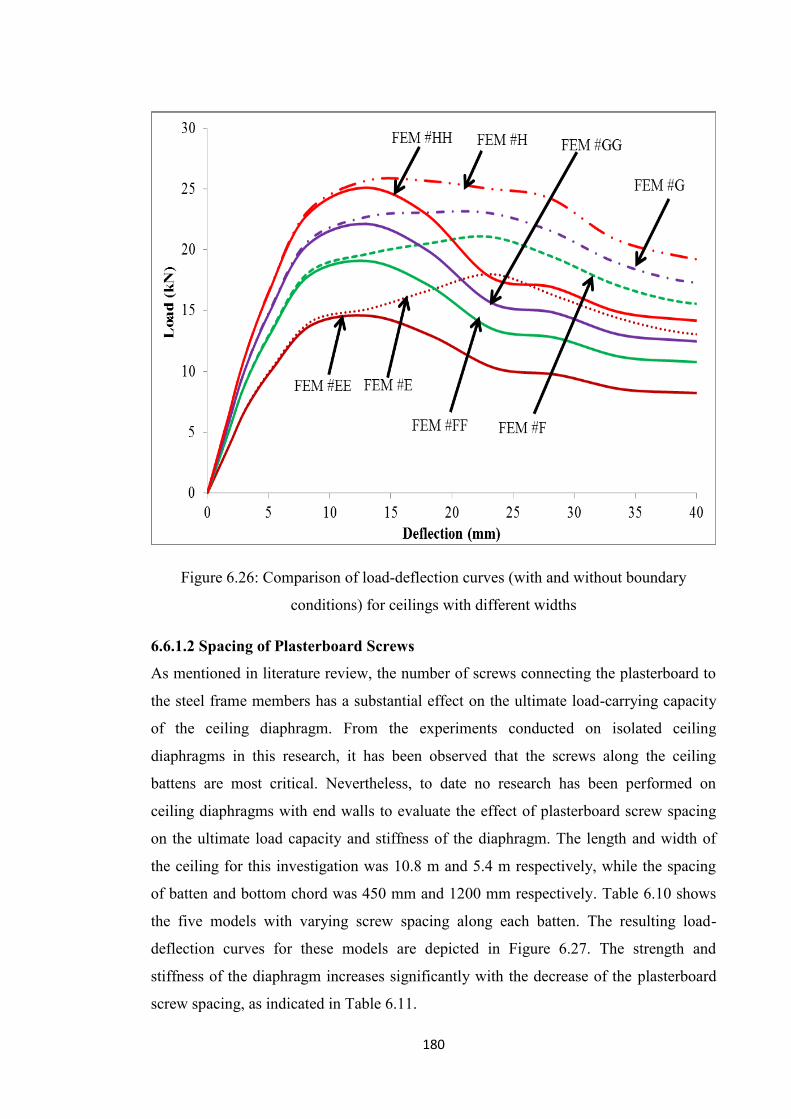
180
Figure 6.26: Comparison of load-deflection curves (with and without boundary
conditions) for ceilings with different widths
6.6.1.2 Spacing of Plasterboard Screws
As mentioned in literature review, the number of screws connecting the plasterboard to
the steel frame members has a substantial effect on the ultimate load-carrying capacity
of the ceiling diaphragm. From the experiments conducted on isolated ceiling
diaphragms in this research, it has been observed that the screws along the ceiling
battens are most critical. Nevertheless, to date no research has been performed on
ceiling diaphragms with end walls to evaluate the effect of plasterboard screw spacing
on the ultimate load capacity and stiffness of the diaphragm. The length and width of
the ceiling for this investigation was 10.8 m and 5.4 m respectively, while the spacing
of batten and bottom chord was 450 mm and 1200 mm respectively. Table 6.10 shows
the five models with varying screw spacing along each batten. The resulting load-
deflection curves for these models are depicted in Figure 6.27. The strength and
stiffness of the diaphragm increases significantly with the decrease of the plasterboard
screw spacing, as indicated in Table 6.11.
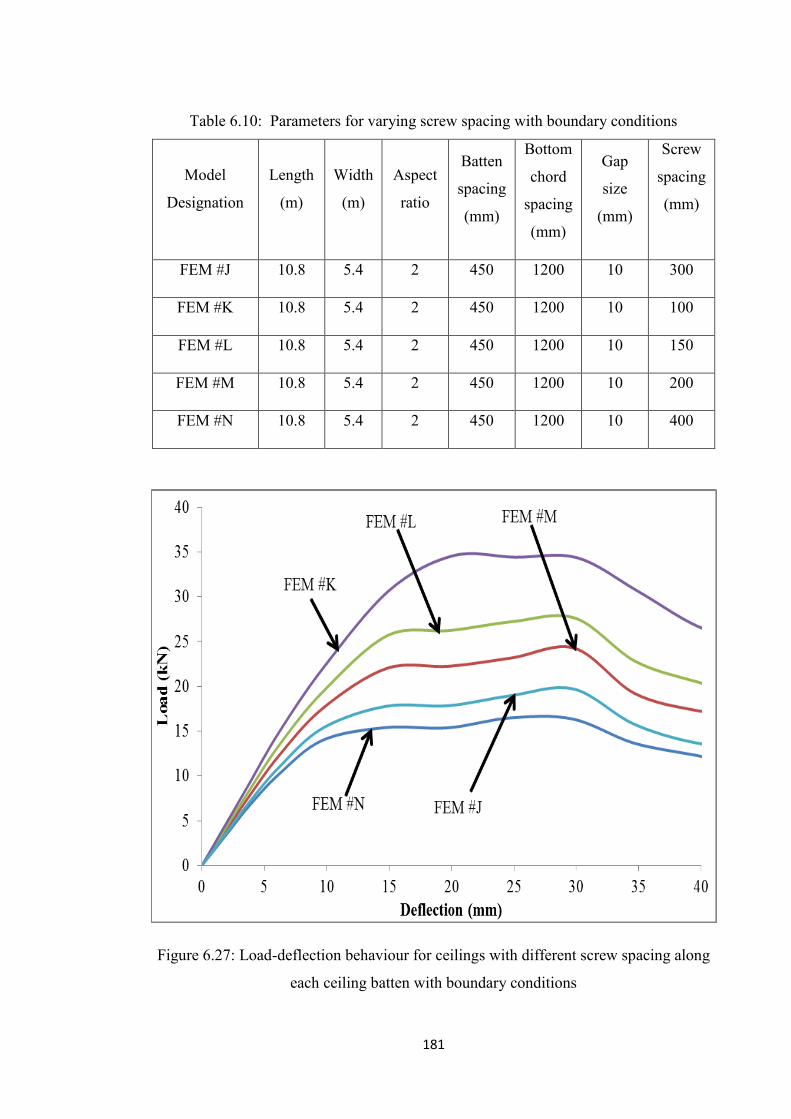
181
Table 6.10: Parameters for varying screw spacing with boundary conditions
Model
Designation
Length
(m)
Width
(m)
Aspect
ratio
Batten
spacing
(mm)
Bottom
chord
spacing
(mm)
Gap
size
(mm)
Screw
spacing
(mm)
FEM #J 10.8 5.4 2 450 1200 10 300
FEM #K 10.8 5.4 2 450 1200 10 100
FEM #L 10.8 5.4 2 450 1200 10 150
FEM #M 10.8 5.4 2 450 1200 10 200
FEM #N 10.8 5.4 2 450 1200 10 400
Figure 6.27: Load-deflection behaviour for ceilings with different screw spacing along
each ceiling batten with boundary conditions
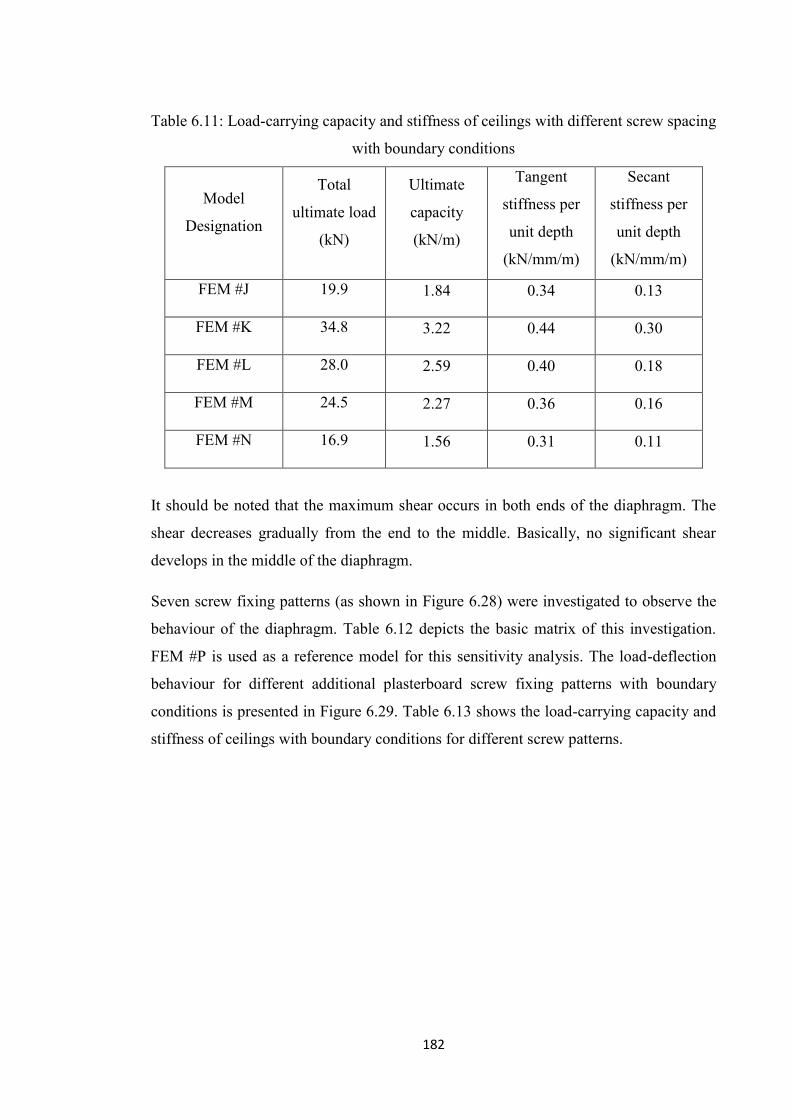
182
Table 6.11: Load-carrying capacity and stiffness of ceilings with different screw spacing
with boundary conditions
Model
Designation
Total
ultimate load
(kN)
Ultimate
capacity
(kN/m)
Tangent
stiffness per
unit depth
(kN/mm/m)
Secant
stiffness per
unit depth
(kN/mm/m)
FEM #J 19.9 1.84 0.34 0.13
FEM #K 34.8 3.22 0.44 0.30
FEM #L 28.0 2.59 0.40 0.18
FEM #M 24.5 2.27 0.36 0.16
FEM #N 16.9 1.56 0.31 0.11
It should be noted that the maximum shear occurs in both ends of the diaphragm. The
shear decreases gradually from the end to the middle. Basically, no significant shear
develops in the middle of the diaphragm.
Seven screw fixing patterns (as shown in Figure 6.28) were investigated to observe the
behaviour of the diaphragm. Table 6.12 depicts the basic matrix of this investigation.
FEM #P is used as a reference model for this sensitivity analysis. The load-deflection
behaviour for different additional plasterboard screw fixing patterns with boundary
conditions is presented in Figure 6.29. Table 6.13 shows the load-carrying capacity and
stiffness of ceilings with boundary conditions for different screw patterns.

183
Table 6.12: Parameters for various screw fixing patterns
Model
Designation
Length
(m)
Width
(m)
Screw
spacing
(mm)
Batten
spacing
(mm)
Bottom
chord
spacing
(mm)
Gap
size
(mm)
Additional
screws (from
both ends)
along each
batten (refer
Fig. 6.27)
FEM #P 10.8 5.4 300 450 1200 10 Fig. 6.27(a)
FEM #Q 10.8 5.4 300 450 1200 10 Fig. 6.27(b)
FEM #R 10.8 5.4 300 450 1200 10 Fig. 6.27(c)
FEM #S 10.8 5.4 300 450 1200 10 Fig. 6.27(d)
FEM #T 10.8 5.4 300 450 1200 10 Fig. 6.27(e)
FEM #U 10.8 5.4 300 450 1200 10 Fig. 6.27(f)
FEM #V 10.8 5.4 300 450 1200 10 Fig. 6.27(g)
(a) FEM #P 300 300

184
(b) FEM #Q
(c) FEM #R
(d) FEM #S
150 300 300 150 150 150
300 300 4@150 4@150
6@150 6@150
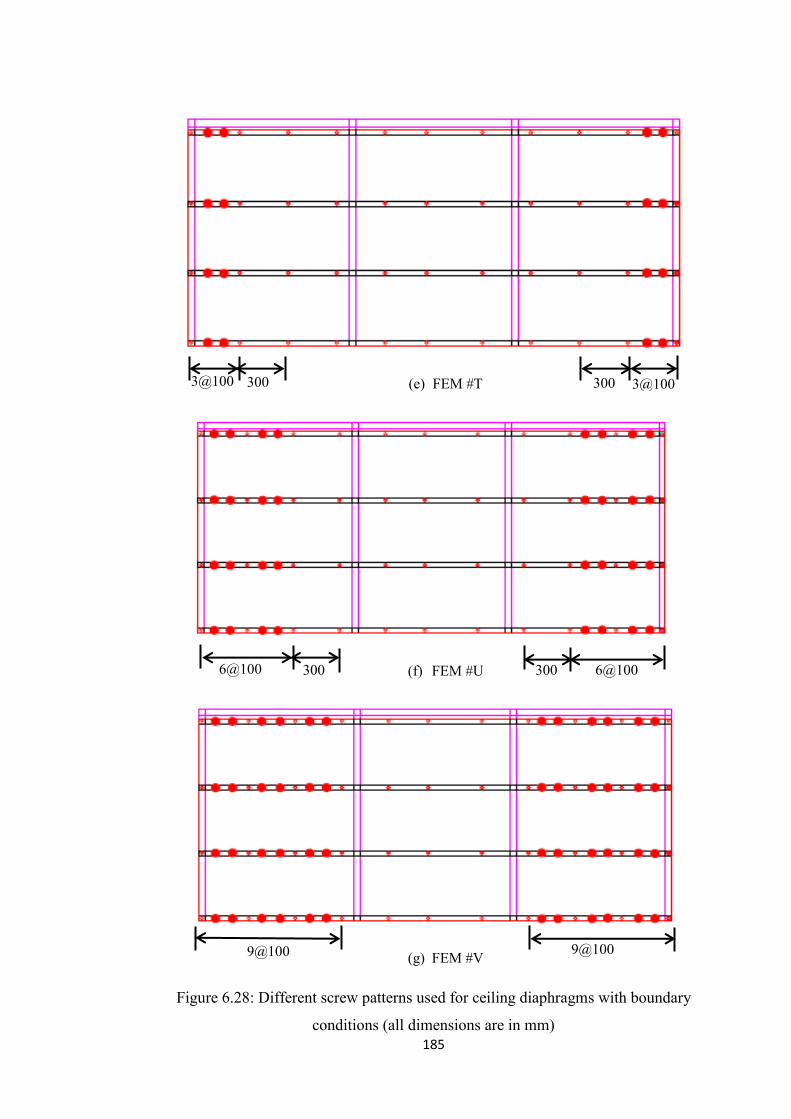
185
(e) FEM #T
(f) FEM #U
(g) FEM #V
Figure 6.28: Different screw patterns used for ceiling diaphragms with boundary
conditions (all dimensions are in mm)
300
6@100
300 3@100 3@100
300 300
9@100 9@100
6@100

186
Figure 6.29: Load-deflection curves for different additional plasterboard screw patterns
with boundary conditions
Table 6.13: Load-carrying capacity and stiffness of ceilings with boundary conditions
for different screw patterns
Model
Designation
Total ultimate
load (kN)
Ultimate
capacity
(kN/m)
Tangent
stiffness per
unit depth
(kN/mm/m)
Secant stiffness
per unit depth
(kN/mm/m)
FEM #P 19.9 1.84 0.34 0.13
FEM #Q 25.3 2.34 0.37 0.28
FEM #R 27.4 2.54 0.37 0.18
FEM #S 27.5 2.55 0.37 0.18
FEM #T 33.2 3.07 0.41 0.30
FEM #U 34.2 3.17 0.41 0.29
FEM #V 34.4 3.19 0.41 0.29
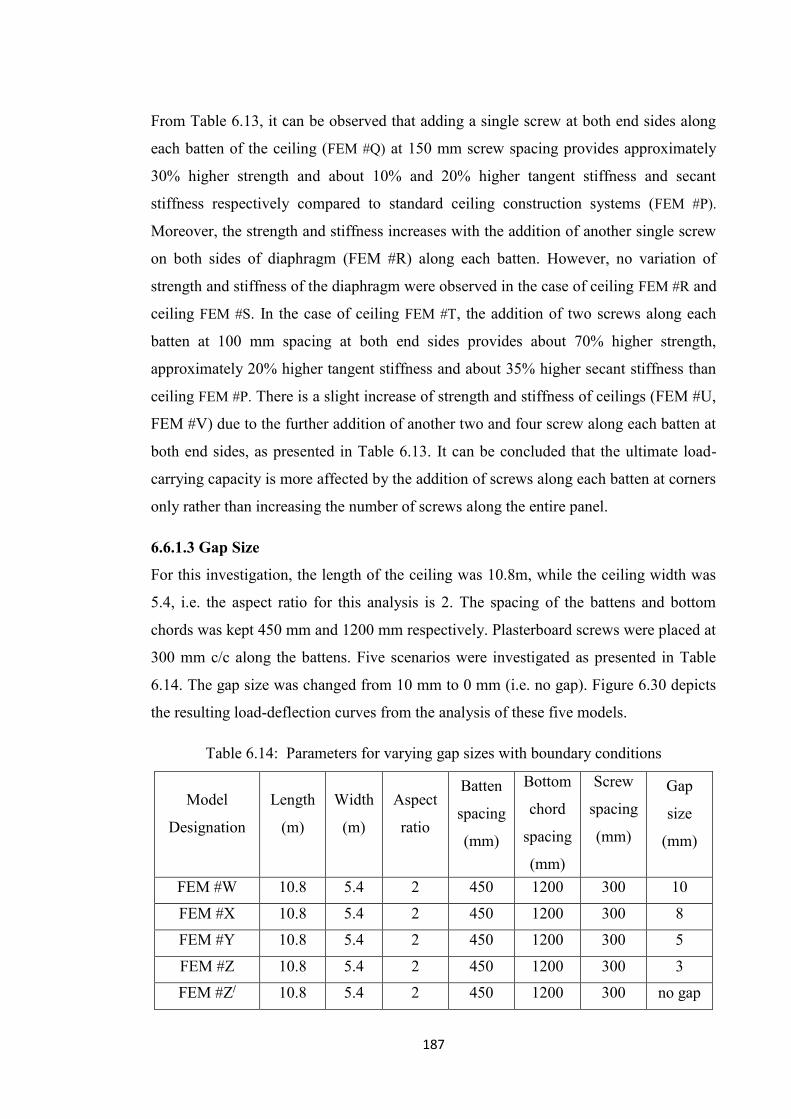
187
From Table 6.13, it can be observed that adding a single screw at both end sides along
each batten of the ceiling (FEM #Q) at 150 mm screw spacing provides approximately
30% higher strength and about 10% and 20% higher tangent stiffness and secant
stiffness respectively compared to standard ceiling construction systems (FEM #P).
Moreover, the strength and stiffness increases with the addition of another single screw
on both sides of diaphragm (FEM #R) along each batten. However, no variation of
strength and stiffness of the diaphragm were observed in the case of ceiling FEM #R and
ceiling FEM #S. In the case of ceiling FEM #T, the addition of two screws along each
batten at 100 mm spacing at both end sides provides about 70% higher strength,
approximately 20% higher tangent stiffness and about 35% higher secant stiffness than
ceiling FEM #P. There is a slight increase of strength and stiffness of ceilings (FEM #U,
FEM #V) due to the further addition of another two and four screw along each batten at
both end sides, as presented in Table 6.13. It can be concluded that the ultimate load-
carrying capacity is more affected by the addition of screws along each batten at corners
only rather than increasing the number of screws along the entire panel.
6.6.1.3 Gap Size
For this investigation, the length of the ceiling was 10.8m, while the ceiling width was
5.4, i.e. the aspect ratio for this analysis is 2. The spacing of the battens and bottom
chords was kept 450 mm and 1200 mm respectively. Plasterboard screws were placed at
300 mm c/c along the battens. Five scenarios were investigated as presented in Table
6.14. The gap size was changed from 10 mm to 0 mm (i.e. no gap). Figure 6.30 depicts
the resulting load-deflection curves from the analysis of these five models.
Table 6.14: Parameters for varying gap sizes with boundary conditions
Model
Designation
Length
(m)
Width
(m)
Aspect
ratio
Batten
spacing
(mm)
Bottom
chord
spacing
(mm)
Screw
spacing
(mm)
Gap
size
(mm)
FEM #W 10.8 5.4 2 450 1200 300 10
FEM #X 10.8 5.4 2 450 1200 300 8
FEM #Y 10.8 5.4 2 450 1200 300 5
FEM #Z 10.8 5.4 2 450 1200 300 3
FEM #Z/ 10.8 5.4 2 450 1200 300 no gap

188
Figure 6.30: Load-deflection behaviour due to variation of gap size between the
plasterboard edge and end walls
Results showed that there is a significant impact on the ultimate capacity of the
diaphragm due to changes in the gap size. The ultimate capacity of the ceiling increases
with the decrease of the gap size, as shown in Table 6.15.
Table 6.15: Load-carrying capacity and stiffness of ceilings with boundary conditions
for different gap sizes
Model
Designation
Total ultimate
load (kN)
Ultimate
capacity
(kN/m)
Tangent
stiffness per
unit depth
(kN/mm/m)
Secant
stiffness per
unit depth
(kN/mm/m) FEM #W 19.9 1.84 0.34 0.13
FEM #X 20.6 1.91 0.34 0.16
FEM #Y 23.0 2.13 0.34 0.18
FEM #Z 24.1 2.23 0.34 0.19
FEM #Z/ 25.3 2.34 0.35 0.24
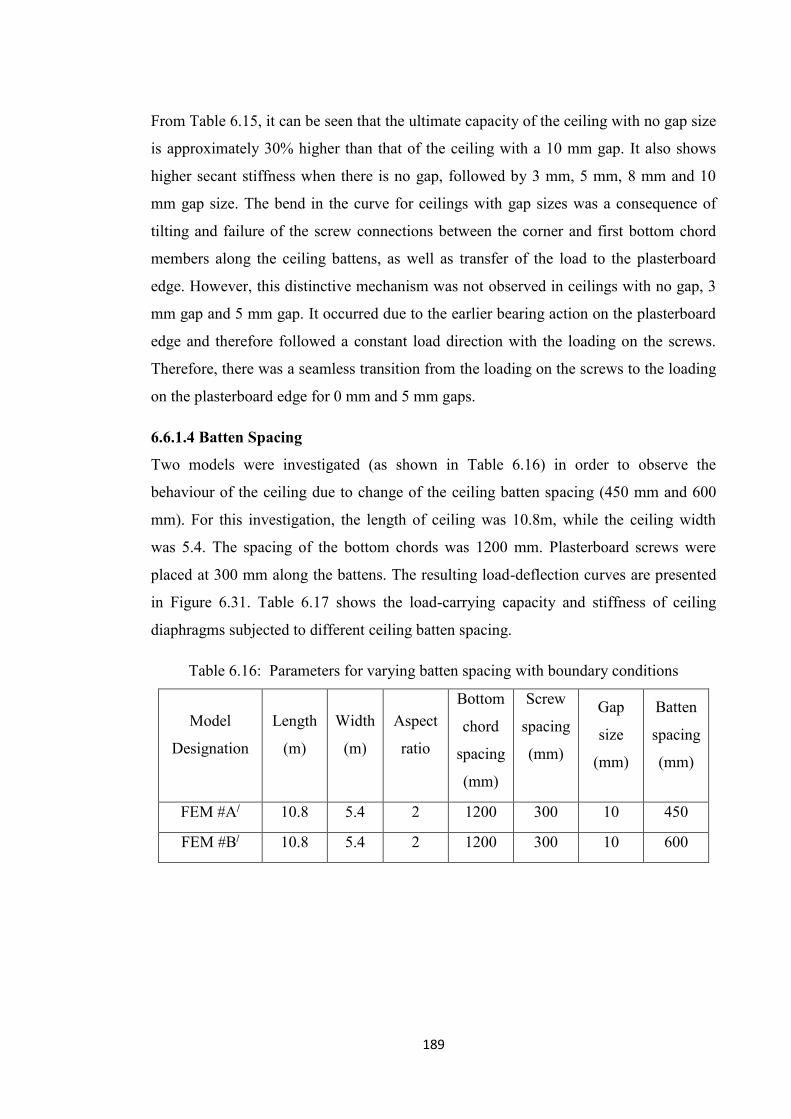
189
From Table 6.15, it can be seen that the ultimate capacity of the ceiling with no gap size
is approximately 30% higher than that of the ceiling with a 10 mm gap. It also shows
higher secant stiffness when there is no gap, followed by 3 mm, 5 mm, 8 mm and 10
mm gap size. The bend in the curve for ceilings with gap sizes was a consequence of
tilting and failure of the screw connections between the corner and first bottom chord
members along the ceiling battens, as well as transfer of the load to the plasterboard
edge. However, this distinctive mechanism was not observed in ceilings with no gap, 3
mm gap and 5 mm gap. It occurred due to the earlier bearing action on the plasterboard
edge and therefore followed a constant load direction with the loading on the screws.
Therefore, there was a seamless transition from the loading on the screws to the loading
on the plasterboard edge for 0 mm and 5 mm gaps.
6.6.1.4 Batten Spacing
Two models were investigated (as shown in Table 6.16) in order to observe the
behaviour of the ceiling due to change of the ceiling batten spacing (450 mm and 600
mm). For this investigation, the length of ceiling was 10.8m, while the ceiling width
was 5.4. The spacing of the bottom chords was 1200 mm. Plasterboard screws were
placed at 300 mm along the battens. The resulting load-deflection curves are presented
in Figure 6.31. Table 6.17 shows the load-carrying capacity and stiffness of ceiling
diaphragms subjected to different ceiling batten spacing.
Table 6.16: Parameters for varying batten spacing with boundary conditions
Model
Designation
Length
(m)
Width
(m)
Aspect
ratio
Bottom
chord
spacing
(mm)
Screw
spacing
(mm)
Gap
size
(mm)
Batten
spacing
(mm)
FEM #A/ 10.8 5.4 2 1200 300 10 450
FEM #B/ 10.8 5.4 2 1200 300 10 600

190
Figure 6.31: Effect of batten spacing on load-deflection behaviour with boundary
conditions
Table 6.17: Load-carrying capacity and stiffness of ceilings for different ceiling batten
spacing with boundary conditions
Model
Designation
Total
ultimate load
(kN)
Ultimate
capacity
(kN/m)
Tangent
stiffness per
unit depth
(kN/mm/m)
Secant
stiffness per
unit depth
(kN/mm/m) FEM #A/ 19.9 1.84 0.34 0.13
FEM #B/ 16.2 1.50 0.30 0.11
Table 6.17 illustrates that there is a moderate impact on the strength and stiffness of the
diaphragm due to increased batten spacing from 450 mm to 600 mm. The capacity of
the ceiling with 450 mm spacing is about 20% higher than that of the ceiling with 600
mm batten spacing. Since the plasterboard screws are fixed along the ceiling battens,
the number of screws increases with the increase of the number of ceiling battens. As
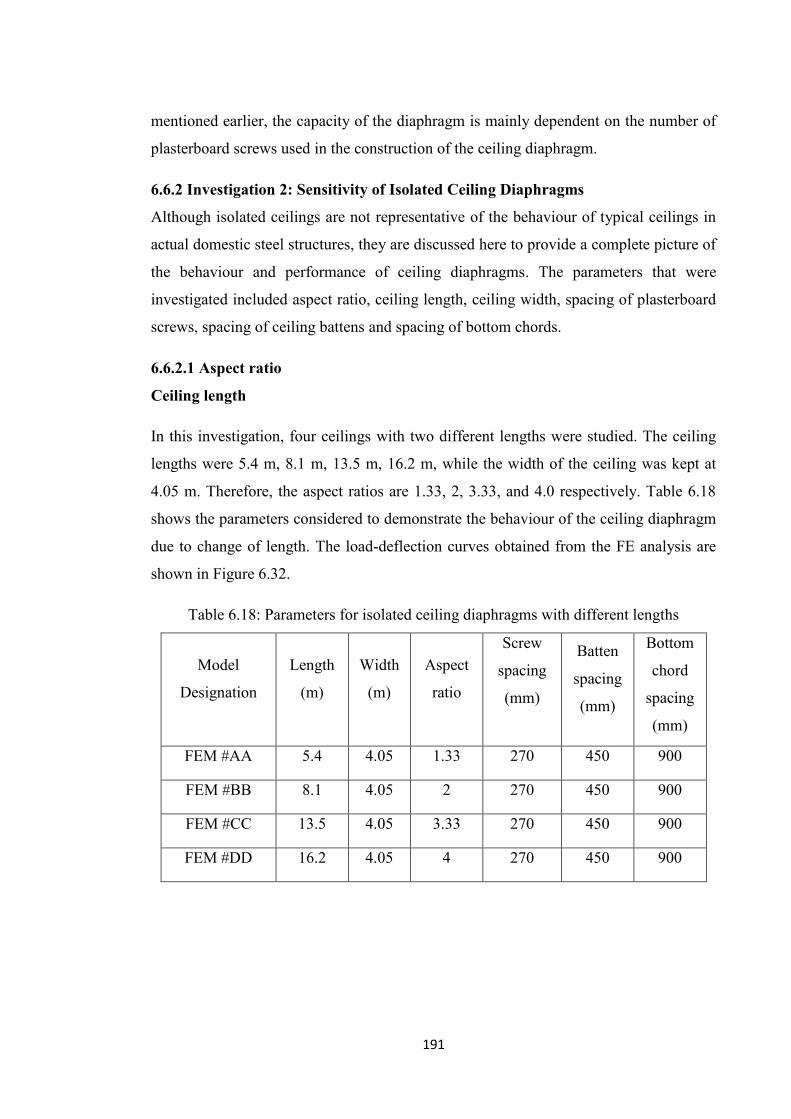
191
mentioned earlier, the capacity of the diaphragm is mainly dependent on the number of
plasterboard screws used in the construction of the ceiling diaphragm.
6.6.2 Investigation 2: Sensitivity of Isolated Ceiling Diaphragms
Although isolated ceilings are not representative of the behaviour of typical ceilings in
actual domestic steel structures, they are discussed here to provide a complete picture of
the behaviour and performance of ceiling diaphragms. The parameters that were
investigated included aspect ratio, ceiling length, ceiling width, spacing of plasterboard
screws, spacing of ceiling battens and spacing of bottom chords.
6.6.2.1 Aspect ratio
Ceiling length
In this investigation, four ceilings with two different lengths were studied. The ceiling
lengths were 5.4 m, 8.1 m, 13.5 m, 16.2 m, while the width of the ceiling was kept at
4.05 m. Therefore, the aspect ratios are 1.33, 2, 3.33, and 4.0 respectively. Table 6.18
shows the parameters considered to demonstrate the behaviour of the ceiling diaphragm
due to change of length. The load-deflection curves obtained from the FE analysis are
shown in Figure 6.32.
Table 6.18: Parameters for isolated ceiling diaphragms with different lengths
Model
Designation
Length
(m)
Width
(m)
Aspect
ratio
Screw
spacing
(mm)
Batten
spacing
(mm)
Bottom
chord
spacing
(mm)
FEM #AA 5.4 4.05 1.33 270 450 900
FEM #BB 8.1 4.05 2 270 450 900
FEM #CC 13.5 4.05 3.33 270 450 900
FEM #DD 16.2 4.05 4 270 450 900
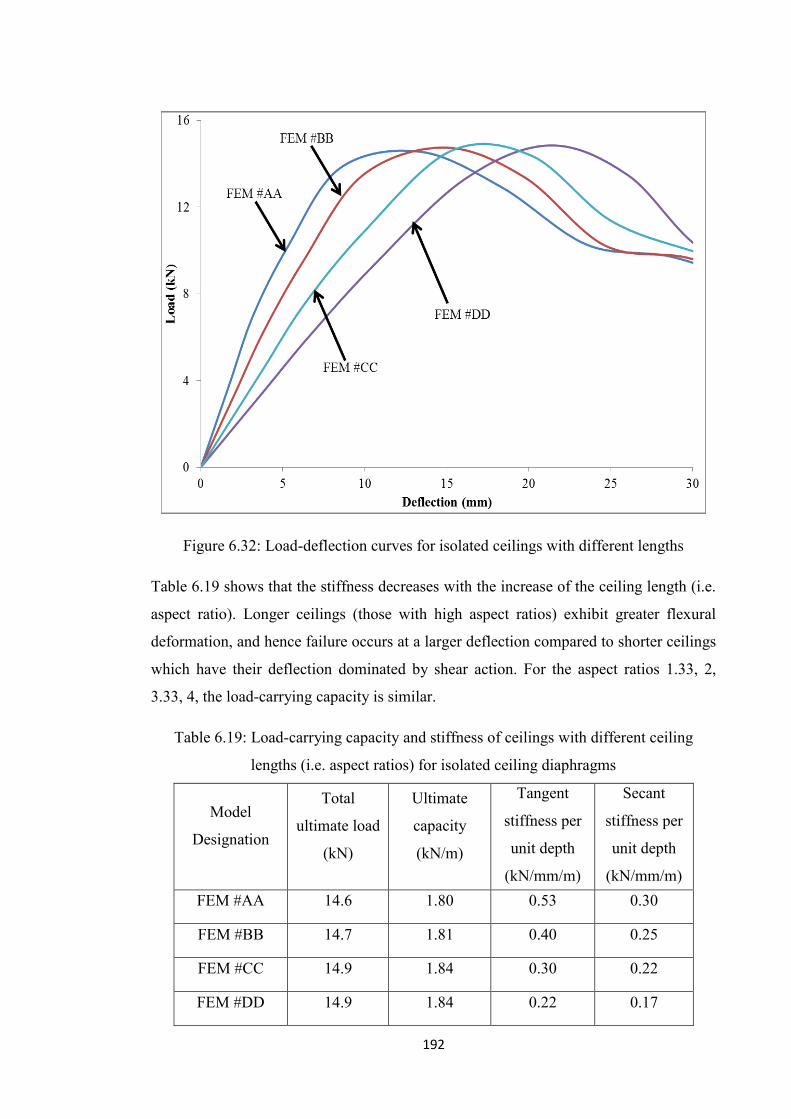
192
Figure 6.32: Load-deflection curves for isolated ceilings with different lengths
Table 6.19 shows that the stiffness decreases with the increase of the ceiling length (i.e.
aspect ratio). Longer ceilings (those with high aspect ratios) exhibit greater flexural
deformation, and hence failure occurs at a larger deflection compared to shorter ceilings
which have their deflection dominated by shear action. For the aspect ratios 1.33, 2,
3.33, 4, the load-carrying capacity is similar.
Table 6.19: Load-carrying capacity and stiffness of ceilings with different ceiling
lengths (i.e. aspect ratios) for isolated ceiling diaphragms
Model
Designation
Total
ultimate load
(kN)
Ultimate
capacity
(kN/m)
Tangent
stiffness per
unit depth
(kN/mm/m)
Secant
stiffness per
unit depth
(kN/mm/m) FEM #AA 14.6 1.80 0.53 0.30
FEM #BB 14.7 1.81 0.40 0.25
FEM #CC 14.9 1.84 0.30 0.22
FEM #DD 14.9 1.84 0.22 0.17

193
Ceiling width
The ceiling width was considered as 4.05 m, 5.4 m, 6.3 m, 7.2 m and 10.8 m, while
maintaining the same length of 5.4 m, i.e. the corresponding aspect ratios are 1.33, 1,
0.86, 0.75 and 0.5. The spacings of the ceiling battens and bottom chord members were
kept 450 mm and 900 mm respectively, as listed in Table 6.20. The aim of this
investigation was to observe the effect of ceiling width on the strength and stiffness of
diaphragms for isolated ceilings.
Table 6.20: Parameters for isolated ceiling diaphragms with different widths
Model
Designation
Length
(m)
Width
(m)
Aspect
ratio
Screw
spacing
(mm)
Batten
spacing
(mm)
Bottom
chord
spacing
(mm) FEM #EE 5.4 4.05 1.33 270 450 900
FEM #FF 5.4 5.4 1.00 270 450 900
FEM #GG 5.4 6.3 0.86 270 450 900
FEM #HH 5.4 7.2 0.75 270 450 900
FEM #II 5.4 10.8 0.50 270 450 900
Figure 6.33 depicts the load-deflection behaviour for different widths of the diaphragm.
In order to develop the relationship between the ceiling width and capacity, the ultimate
strength per unit width for each ceiling was estimated against ceiling width, as
presented in Table 6.21. The stiffness of the diaphragm increases with the increase of
the diaphragm width.
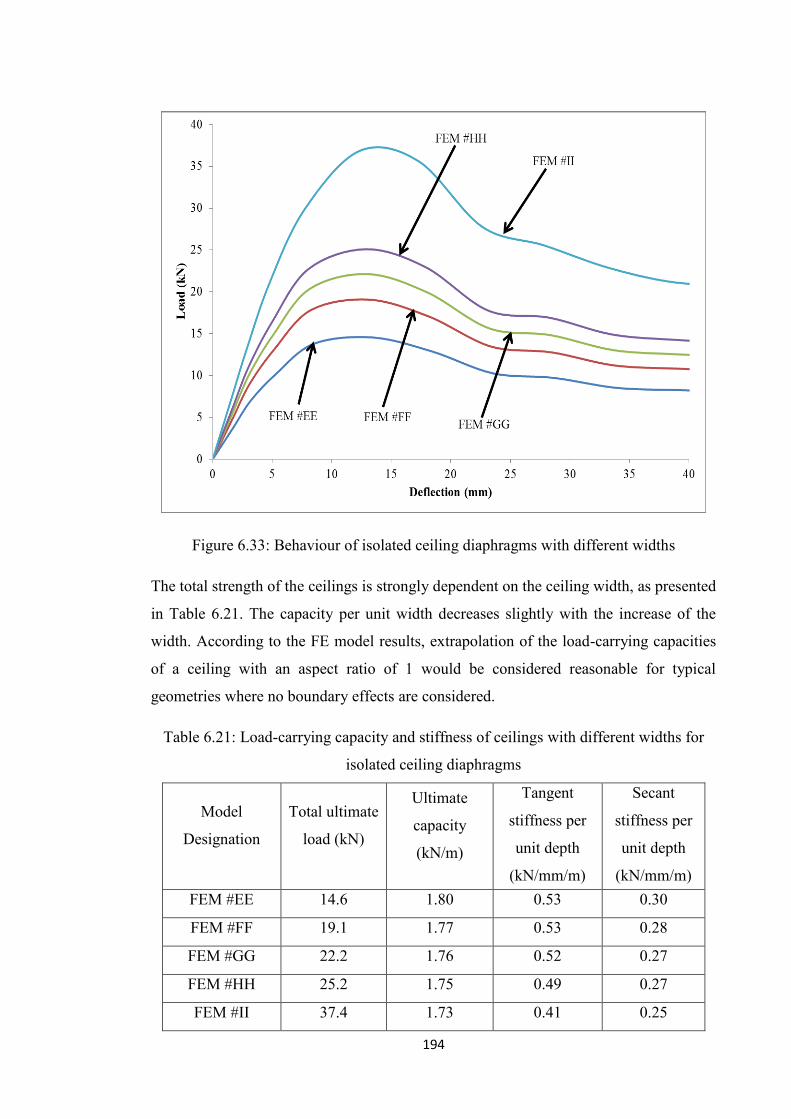
194
Figure 6.33: Behaviour of isolated ceiling diaphragms with different widths
The total strength of the ceilings is strongly dependent on the ceiling width, as presented
in Table 6.21. The capacity per unit width decreases slightly with the increase of the
width. According to the FE model results, extrapolation of the load-carrying capacities
of a ceiling with an aspect ratio of 1 would be considered reasonable for typical
geometries where no boundary effects are considered.
Table 6.21: Load-carrying capacity and stiffness of ceilings with different widths for
isolated ceiling diaphragms
Model
Designation
Total ultimate
load (kN)
Ultimate
capacity
(kN/m)
Tangent
stiffness per
unit depth
(kN/mm/m)
Secant
stiffness per
unit depth
(kN/mm/m) FEM #EE 14.6 1.80 0.53 0.30
FEM #FF 19.1 1.77 0.53 0.28
FEM #GG 22.2 1.76 0.52 0.27
FEM #HH 25.2 1.75 0.49 0.27
FEM #II 37.4 1.73 0.41 0.25
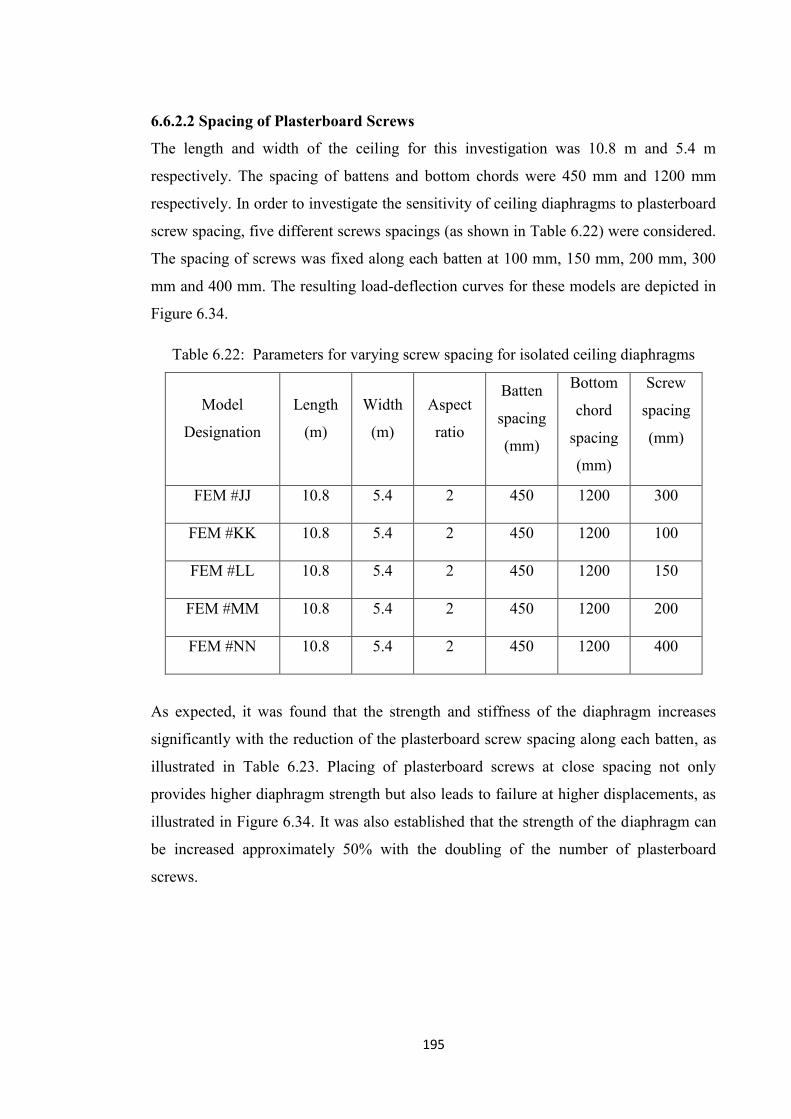
195
6.6.2.2 Spacing of Plasterboard Screws
The length and width of the ceiling for this investigation was 10.8 m and 5.4 m
respectively. The spacing of battens and bottom chords were 450 mm and 1200 mm
respectively. In order to investigate the sensitivity of ceiling diaphragms to plasterboard
screw spacing, five different screws spacings (as shown in Table 6.22) were considered.
The spacing of screws was fixed along each batten at 100 mm, 150 mm, 200 mm, 300
mm and 400 mm. The resulting load-deflection curves for these models are depicted in
Figure 6.34.
Table 6.22: Parameters for varying screw spacing for isolated ceiling diaphragms
Model
Designation
Length
(m)
Width
(m)
Aspect
ratio
Batten
spacing
(mm)
Bottom
chord
spacing
(mm)
Screw
spacing
(mm)
FEM #JJ 10.8 5.4 2 450 1200 300
FEM #KK 10.8 5.4 2 450 1200 100
FEM #LL 10.8 5.4 2 450 1200 150
FEM #MM 10.8 5.4 2 450 1200 200
FEM #NN 10.8 5.4 2 450 1200 400
As expected, it was found that the strength and stiffness of the diaphragm increases
significantly with the reduction of the plasterboard screw spacing along each batten, as
illustrated in Table 6.23. Placing of plasterboard screws at close spacing not only
provides higher diaphragm strength but also leads to failure at higher displacements, as
illustrated in Figure 6.34. It was also established that the strength of the diaphragm can
be increased approximately 50% with the doubling of the number of plasterboard
screws.
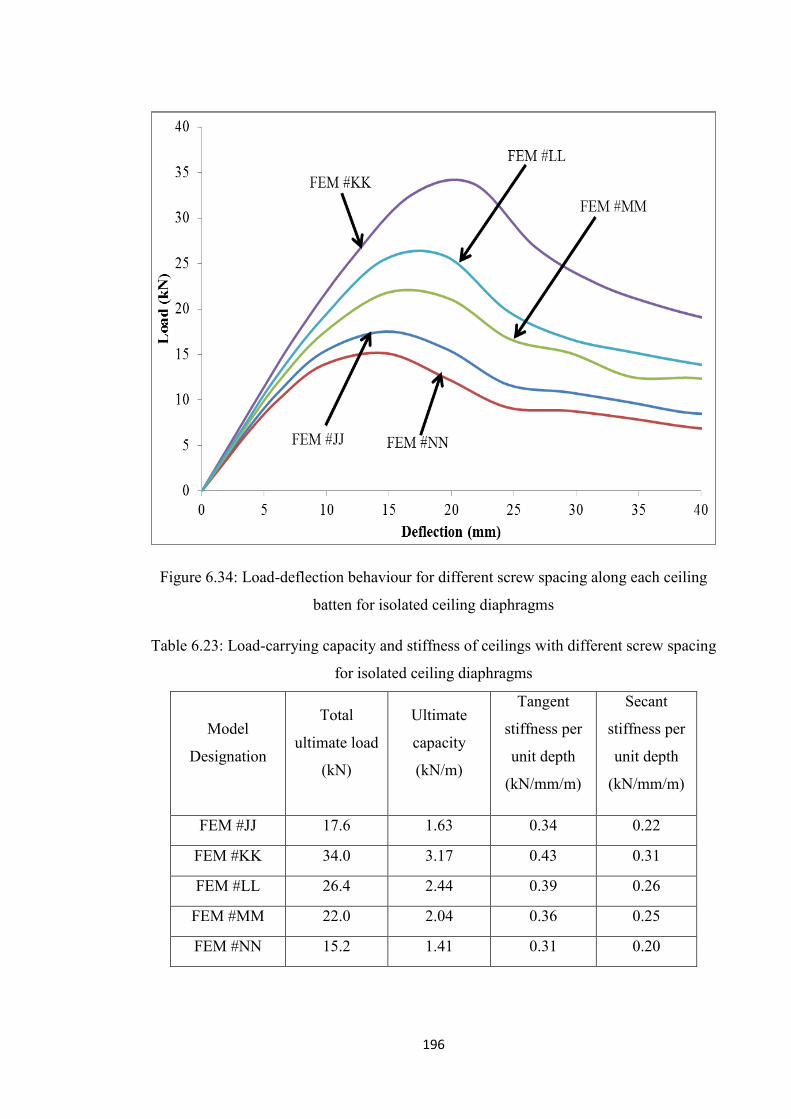
196
Figure 6.34: Load-deflection behaviour for different screw spacing along each ceiling
batten for isolated ceiling diaphragms
Table 6.23: Load-carrying capacity and stiffness of ceilings with different screw spacing
for isolated ceiling diaphragms
Model
Designation
Total
ultimate load
(kN)
Ultimate
capacity
(kN/m)
Tangent
stiffness per
unit depth
(kN/mm/m)
Secant
stiffness per
unit depth
(kN/mm/m)
FEM #JJ 17.6 1.63 0.34 0.22
FEM #KK 34.0 3.17 0.43 0.31
FEM #LL 26.4 2.44 0.39 0.26
FEM #MM 22.0 2.04 0.36 0.25
FEM #NN 15.2 1.41 0.31 0.20
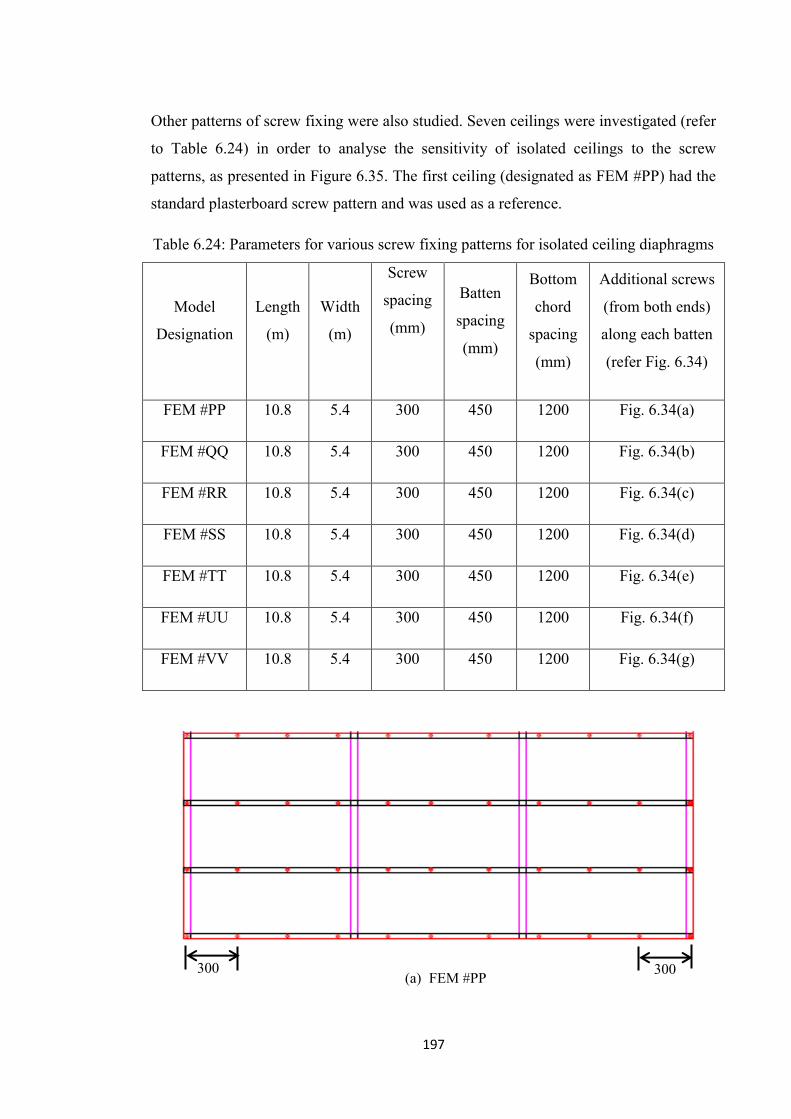
197
Other patterns of screw fixing were also studied. Seven ceilings were investigated (refer
to Table 6.24) in order to analyse the sensitivity of isolated ceilings to the screw
patterns, as presented in Figure 6.35. The first ceiling (designated as FEM #PP) had the
standard plasterboard screw pattern and was used as a reference.
Table 6.24: Parameters for various screw fixing patterns for isolated ceiling diaphragms
Model
Designation
Length
(m)
Width
(m)
Screw
spacing
(mm)
Batten
spacing
(mm)
Bottom
chord
spacing
(mm)
Additional screws
(from both ends)
along each batten
(refer Fig. 6.34)
FEM #PP 10.8 5.4 300 450 1200 Fig. 6.34(a)
FEM #QQ 10.8 5.4 300 450 1200 Fig. 6.34(b)
FEM #RR 10.8 5.4 300 450 1200 Fig. 6.34(c)
FEM #SS 10.8 5.4 300 450 1200 Fig. 6.34(d)
FEM #TT 10.8 5.4 300 450 1200 Fig. 6.34(e)
FEM #UU 10.8 5.4 300 450 1200 Fig. 6.34(f)
FEM #VV 10.8 5.4 300 450 1200 Fig. 6.34(g)
(a) FEM #PP 300 300

198
(b) FEM #QQ
(c) FEM #RR
(d) FEM #SS
2@150 300 300
300 300 4@150 4@150
6@150 6@150
2@150
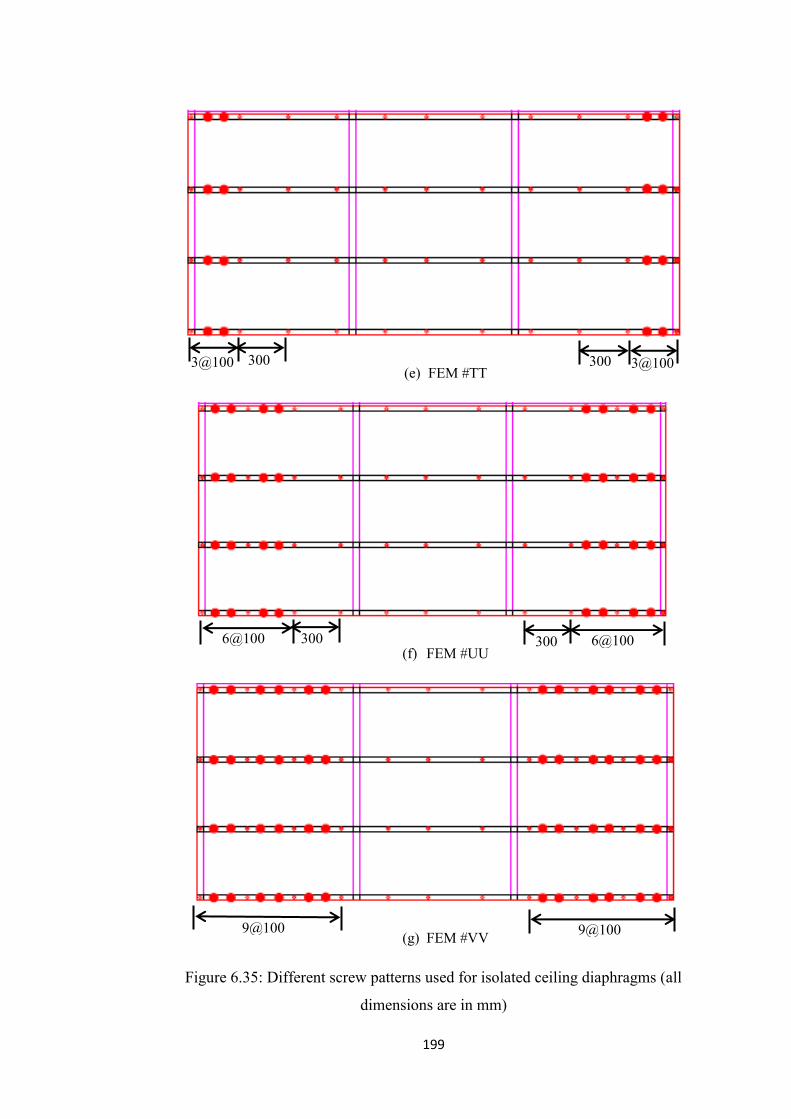
199
(e) FEM #TT
(f) FEM #UU
(g) FEM #VV
Figure 6.35: Different screw patterns used for isolated ceiling diaphragms (all
dimensions are in mm)
300
6@100
300 3@100 3@100
300 300
9@100 9@100
6@100
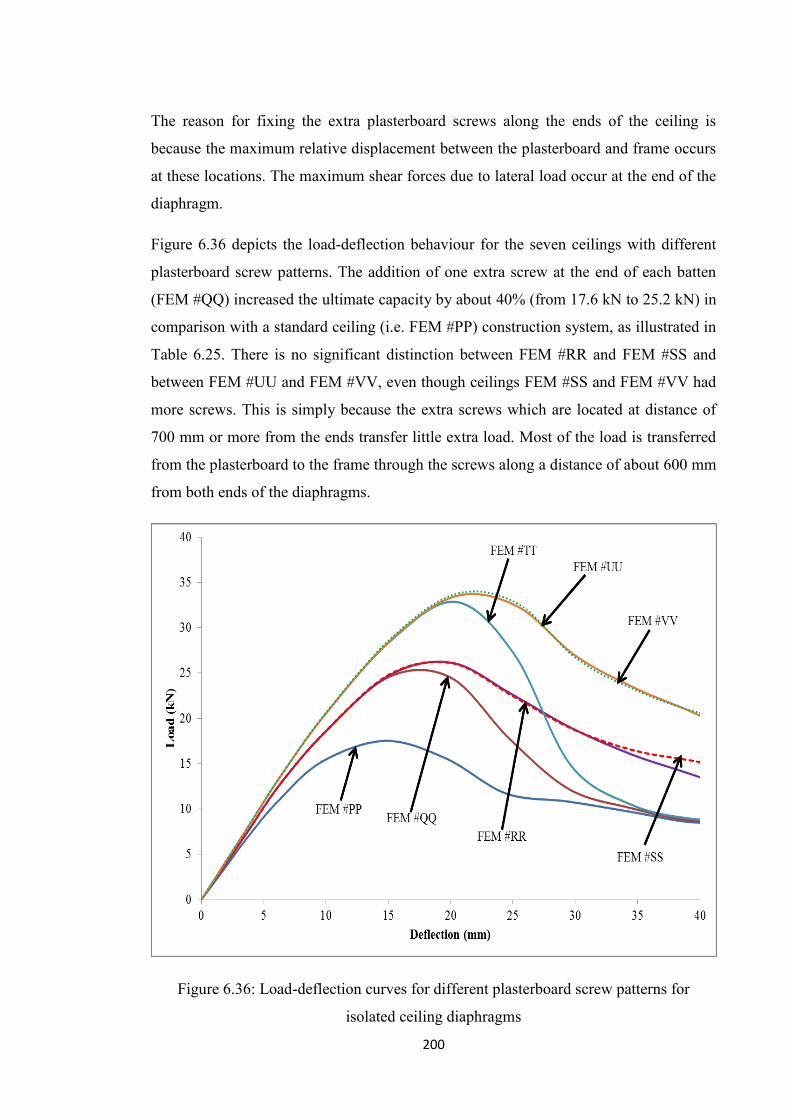
200
The reason for fixing the extra plasterboard screws along the ends of the ceiling is
because the maximum relative displacement between the plasterboard and frame occurs
at these locations. The maximum shear forces due to lateral load occur at the end of the
diaphragm.
Figure 6.36 depicts the load-deflection behaviour for the seven ceilings with different
plasterboard screw patterns. The addition of one extra screw at the end of each batten
(FEM #QQ) increased the ultimate capacity by about 40% (from 17.6 kN to 25.2 kN) in
comparison with a standard ceiling (i.e. FEM #PP) construction system, as illustrated in
Table 6.25. There is no significant distinction between FEM #RR and FEM #SS and
between FEM #UU and FEM #VV, even though ceilings FEM #SS and FEM #VV had
more screws. This is simply because the extra screws which are located at distance of
700 mm or more from the ends transfer little extra load. Most of the load is transferred
from the plasterboard to the frame through the screws along a distance of about 600 mm
from both ends of the diaphragms.
Figure 6.36: Load-deflection curves for different plasterboard screw patterns for
isolated ceiling diaphragms

201
Table 6.25: Load-carrying capacity and stiffness of ceilings with different screw fixing
patterns for isolated ceiling diaphragms
Model Designation
Total ultimate load
(kN)
Ultimate capacity (kN/m)
Tangent stiffness per unit depth
(kN/mm/m)
Secant stiffness per unit depth
(kN/mm/m) FEM #PP 17.6 1.63 0.34 0.22
FEM #QQ 25.2 2.33 0.36 0.27
FEM #RR 26.2 2.43 0.36 0.25
FEM #SS 26.3 2.44 0.36 0.26
FEM #TT 33 3.06 0.40 0.31
FEM #UU 33.8 3.13 0.40 0.29
FEM #VV 34.0 3.15 0.40 0.29
It can be stated that the capacity of isolated ceiling is sensitive to the patterns of the
plasterboard screws. The lateral performance of the diaphragm can be improved through
the addition of a limited number of extra screws. According to this analysis of the
different layouts of screw patterns, ceiling FEM #TT represents an effective case where
the addition of approximately 8% screws along the ends of each batten resulted in
increased capacity by about 85%.
6.6.2.3 Batten Spacing
In this investigation, the length of ceiling was 10.8 m, while the ceiling width was 5.4
m. The spacing of the bottom chord was 1200 mm. Plasterboard screws were placed at
300 mm along the battens. Two models as shown in Table 6.26 were investigated in
order to observe the behaviour of the ceiling due to the change of the ceiling batten
spacing from 450 mm to 600 mm. The resulting load-deflection curves are presented in
Figure 6.37.
Table 6.26: Parameters for varying batten spacing for isolated ceiling diaphragms
Model
Designation
Length
(m)
Width
(m)
Aspect
ratio
Bottom chord
spacing (mm)
Screw
spacing
(mm)
Batten
spacing
(mm) FEM #AA/ 10.8 5.4 2 1200 300 450
FEM #BB/ 10.8 5.4 2 1200 300 600
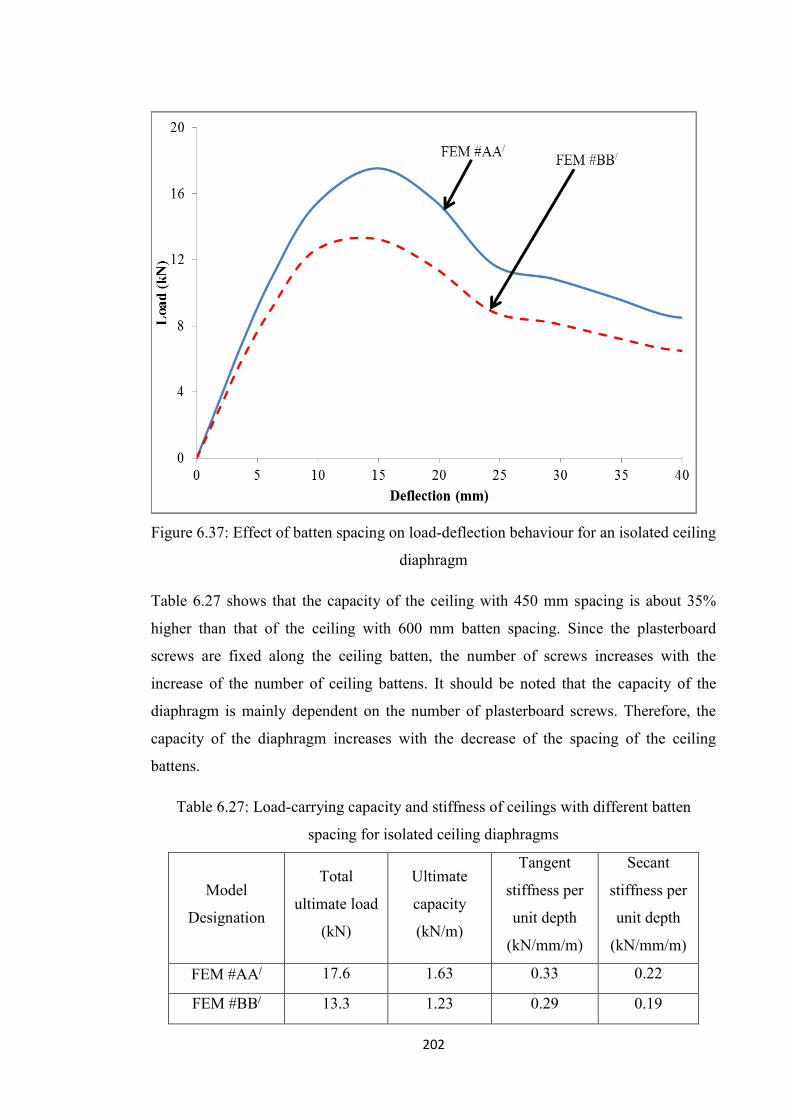
202
Figure 6.37: Effect of batten spacing on load-deflection behaviour for an isolated ceiling
diaphragm
Table 6.27 shows that the capacity of the ceiling with 450 mm spacing is about 35%
higher than that of the ceiling with 600 mm batten spacing. Since the plasterboard
screws are fixed along the ceiling batten, the number of screws increases with the
increase of the number of ceiling battens. It should be noted that the capacity of the
diaphragm is mainly dependent on the number of plasterboard screws. Therefore, the
capacity of the diaphragm increases with the decrease of the spacing of the ceiling
battens.
Table 6.27: Load-carrying capacity and stiffness of ceilings with different batten
spacing for isolated ceiling diaphragms
Model
Designation
Total
ultimate load
(kN)
Ultimate
capacity
(kN/m)
Tangent
stiffness per
unit depth
(kN/mm/m)
Secant
stiffness per
unit depth
(kN/mm/m)
FEM #AA/ 17.6 1.63 0.33 0.22
FEM #BB/ 13.3 1.23 0.29 0.19
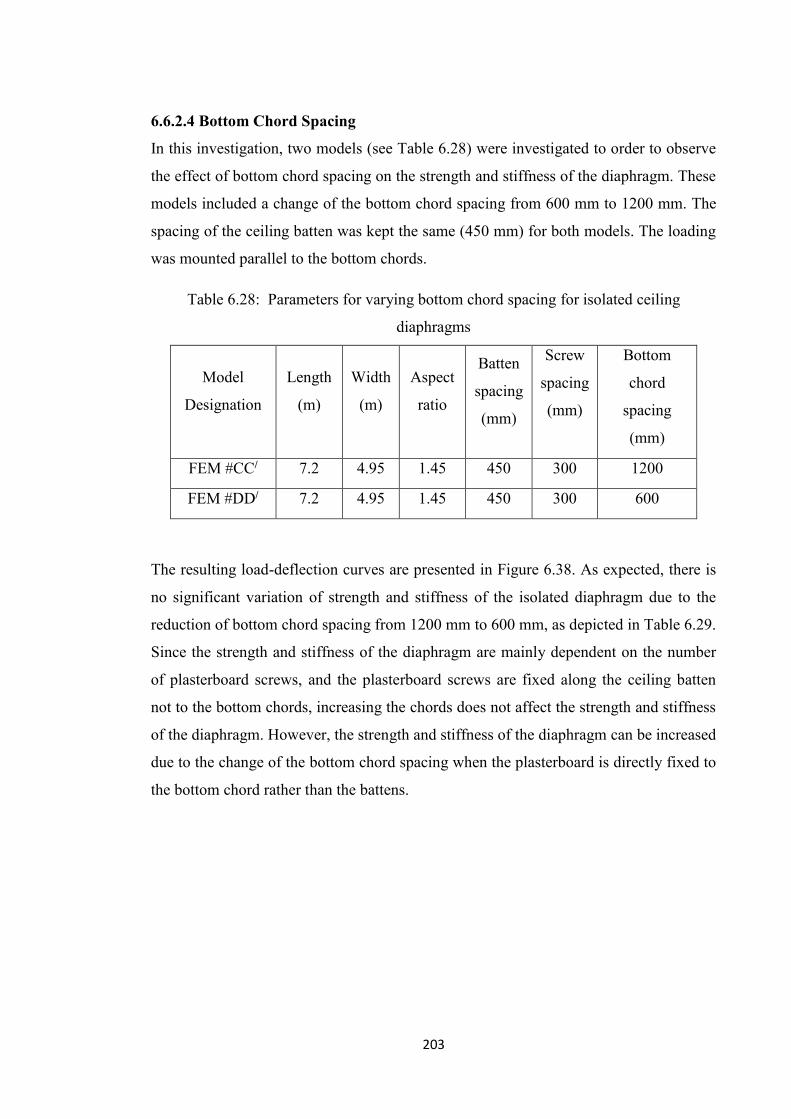
203
6.6.2.4 Bottom Chord Spacing
In this investigation, two models (see Table 6.28) were investigated to order to observe
the effect of bottom chord spacing on the strength and stiffness of the diaphragm. These
models included a change of the bottom chord spacing from 600 mm to 1200 mm. The
spacing of the ceiling batten was kept the same (450 mm) for both models. The loading
was mounted parallel to the bottom chords.
Table 6.28: Parameters for varying bottom chord spacing for isolated ceiling
diaphragms
Model
Designation
Length
(m)
Width
(m)
Aspect
ratio
Batten
spacing
(mm)
Screw
spacing
(mm)
Bottom
chord
spacing
(mm)
FEM #CC/ 7.2 4.95 1.45 450 300 1200
FEM #DD/ 7.2 4.95 1.45 450 300 600
The resulting load-deflection curves are presented in Figure 6.38. As expected, there is
no significant variation of strength and stiffness of the isolated diaphragm due to the
reduction of bottom chord spacing from 1200 mm to 600 mm, as depicted in Table 6.29.
Since the strength and stiffness of the diaphragm are mainly dependent on the number
of plasterboard screws, and the plasterboard screws are fixed along the ceiling batten
not to the bottom chords, increasing the chords does not affect the strength and stiffness
of the diaphragm. However, the strength and stiffness of the diaphragm can be increased
due to the change of the bottom chord spacing when the plasterboard is directly fixed to
the bottom chord rather than the battens.
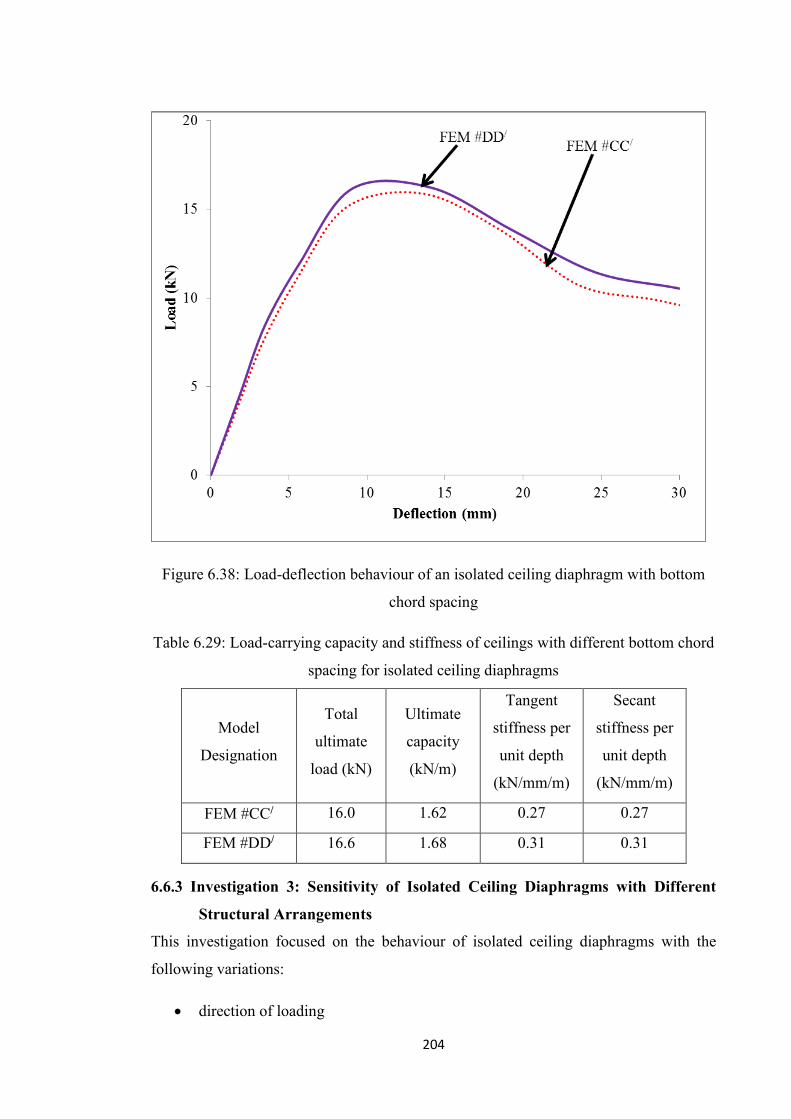
204
Figure 6.38: Load-deflection behaviour of an isolated ceiling diaphragm with bottom
chord spacing
Table 6.29: Load-carrying capacity and stiffness of ceilings with different bottom chord
spacing for isolated ceiling diaphragms
Model
Designation
Total
ultimate
load (kN)
Ultimate
capacity
(kN/m)
Tangent
stiffness per
unit depth
(kN/mm/m)
Secant
stiffness per
unit depth
(kN/mm/m)
FEM #CC/ 16.0 1.62 0.27 0.27
FEM #DD/ 16.6 1.68 0.31 0.31
6.6.3 Investigation 3: Sensitivity of Isolated Ceiling Diaphragms with Different
Structural Arrangements
This investigation focused on the behaviour of isolated ceiling diaphragms with the
following variations:
direction of loading
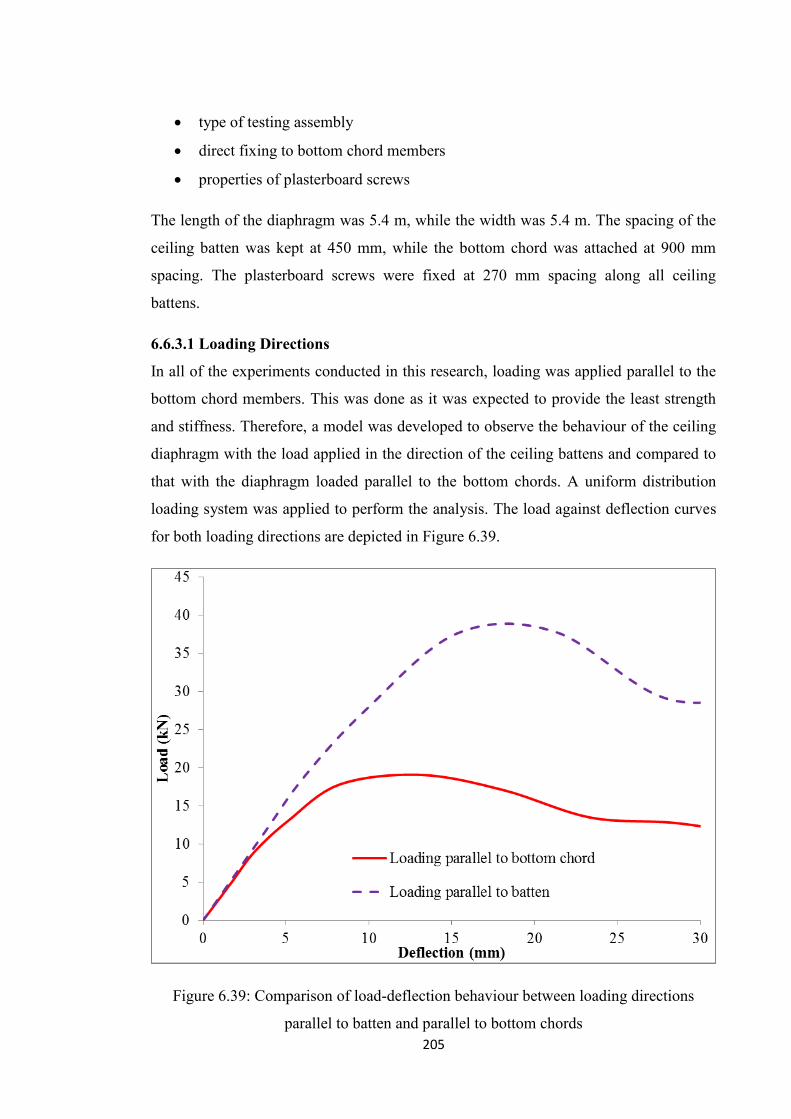
205
type of testing assembly
direct fixing to bottom chord members
properties of plasterboard screws
The length of the diaphragm was 5.4 m, while the width was 5.4 m. The spacing of the
ceiling batten was kept at 450 mm, while the bottom chord was attached at 900 mm
spacing. The plasterboard screws were fixed at 270 mm spacing along all ceiling
battens.
6.6.3.1 Loading Directions
In all of the experiments conducted in this research, loading was applied parallel to the
bottom chord members. This was done as it was expected to provide the least strength
and stiffness. Therefore, a model was developed to observe the behaviour of the ceiling
diaphragm with the load applied in the direction of the ceiling battens and compared to
that with the diaphragm loaded parallel to the bottom chords. A uniform distribution
loading system was applied to perform the analysis. The load against deflection curves
for both loading directions are depicted in Figure 6.39.
Figure 6.39: Comparison of load-deflection behaviour between loading directions
parallel to batten and parallel to bottom chords
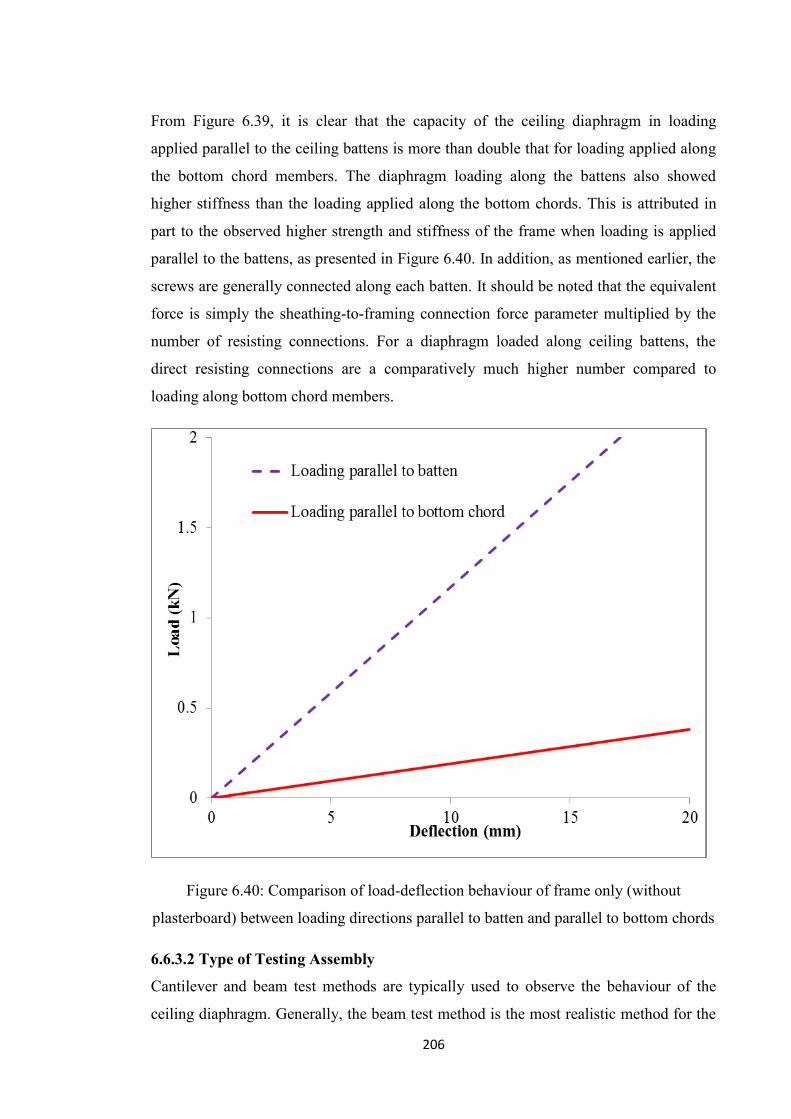
206
From Figure 6.39, it is clear that the capacity of the ceiling diaphragm in loading
applied parallel to the ceiling battens is more than double that for loading applied along
the bottom chord members. The diaphragm loading along the battens also showed
higher stiffness than the loading applied along the bottom chords. This is attributed in
part to the observed higher strength and stiffness of the frame when loading is applied
parallel to the battens, as presented in Figure 6.40. In addition, as mentioned earlier, the
screws are generally connected along each batten. It should be noted that the equivalent
force is simply the sheathing-to-framing connection force parameter multiplied by the
number of resisting connections. For a diaphragm loaded along ceiling battens, the
direct resisting connections are a comparatively much higher number compared to
loading along bottom chord members.
Figure 6.40: Comparison of load-deflection behaviour of frame only (without
plasterboard) between loading directions parallel to batten and parallel to bottom chords
6.6.3.2 Type of Testing Assembly
Cantilever and beam test methods are typically used to observe the behaviour of the
ceiling diaphragm. Generally, the beam test method is the most realistic method for the
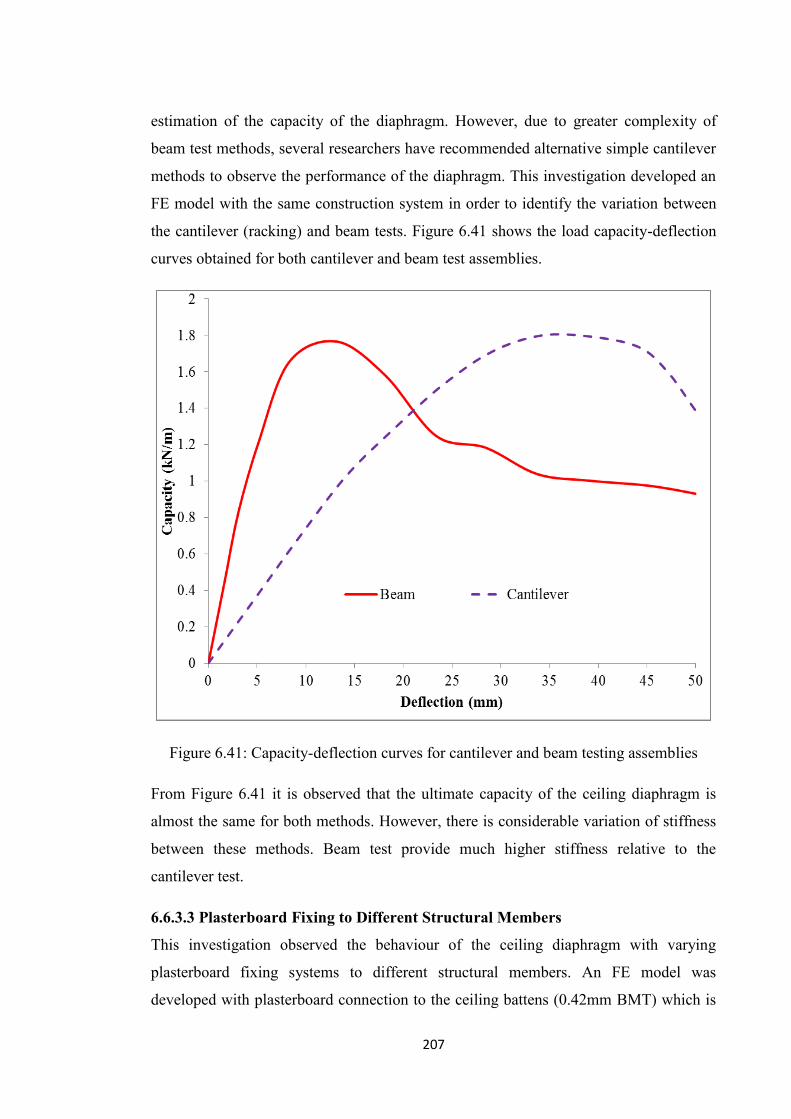
207
estimation of the capacity of the diaphragm. However, due to greater complexity of
beam test methods, several researchers have recommended alternative simple cantilever
methods to observe the performance of the diaphragm. This investigation developed an
FE model with the same construction system in order to identify the variation between
the cantilever (racking) and beam tests. Figure 6.41 shows the load capacity-deflection
curves obtained for both cantilever and beam test assemblies.
Figure 6.41: Capacity-deflection curves for cantilever and beam testing assemblies
From Figure 6.41 it is observed that the ultimate capacity of the ceiling diaphragm is
almost the same for both methods. However, there is considerable variation of stiffness
between these methods. Beam test provide much higher stiffness relative to the
cantilever test.
6.6.3.3 Plasterboard Fixing to Different Structural Members
This investigation observed the behaviour of the ceiling diaphragm with varying
plasterboard fixing systems to different structural members. An FE model was
developed with plasterboard connection to the ceiling battens (0.42mm BMT) which is
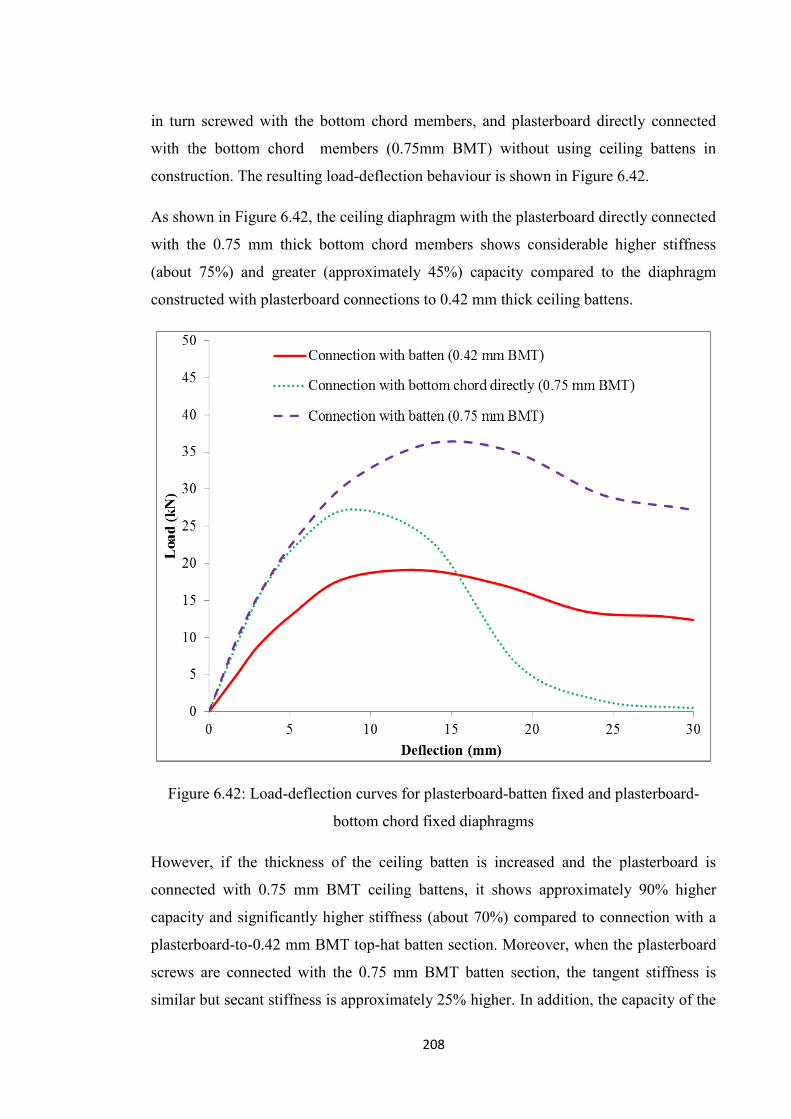
208
in turn screwed with the bottom chord members, and plasterboard directly connected
with the bottom chord members (0.75mm BMT) without using ceiling battens in
construction. The resulting load-deflection behaviour is shown in Figure 6.42.
As shown in Figure 6.42, the ceiling diaphragm with the plasterboard directly connected
with the 0.75 mm thick bottom chord members shows considerable higher stiffness
(about 75%) and greater (approximately 45%) capacity compared to the diaphragm
constructed with plasterboard connections to 0.42 mm thick ceiling battens.
Figure 6.42: Load-deflection curves for plasterboard-batten fixed and plasterboard-
bottom chord fixed diaphragms
However, if the thickness of the ceiling batten is increased and the plasterboard is
connected with 0.75 mm BMT ceiling battens, it shows approximately 90% higher
capacity and significantly higher stiffness (about 70%) compared to connection with a
plasterboard-to-0.42 mm BMT top-hat batten section. Moreover, when the plasterboard
screws are connected with the 0.75 mm BMT batten section, the tangent stiffness is
similar but secant stiffness is approximately 25% higher. In addition, the capacity of the
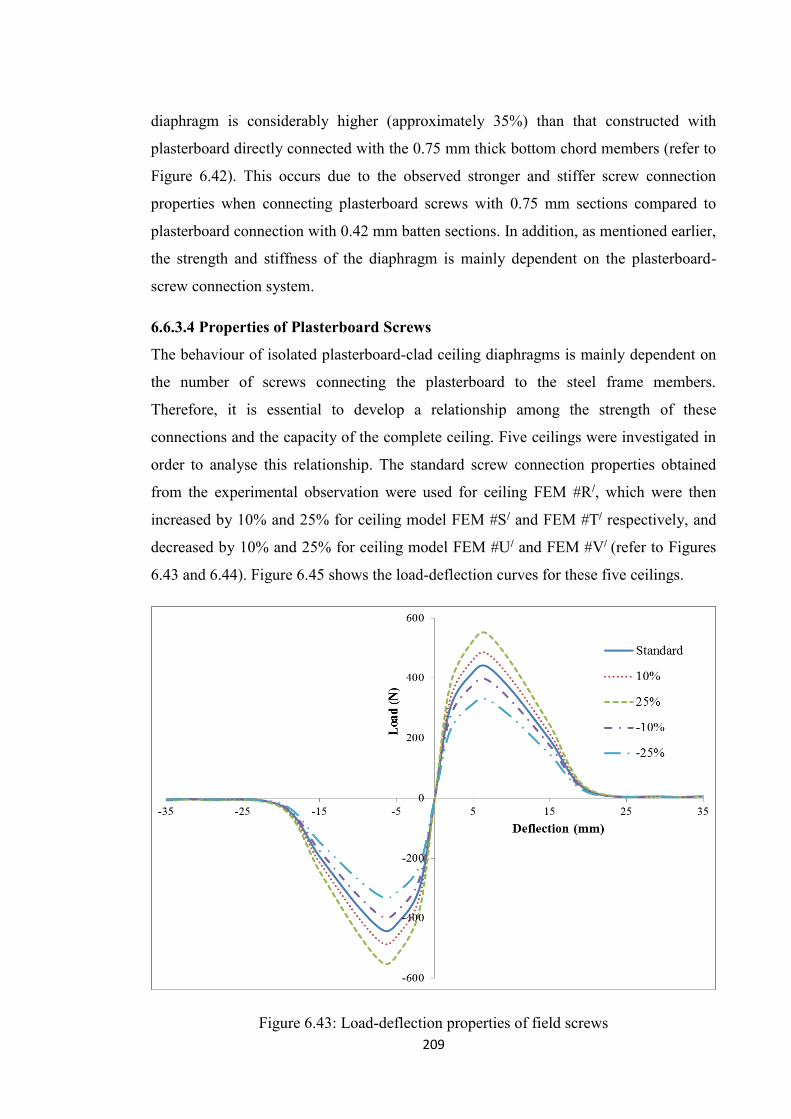
209
diaphragm is considerably higher (approximately 35%) than that constructed with
plasterboard directly connected with the 0.75 mm thick bottom chord members (refer to
Figure 6.42). This occurs due to the observed stronger and stiffer screw connection
properties when connecting plasterboard screws with 0.75 mm sections compared to
plasterboard connection with 0.42 mm batten sections. In addition, as mentioned earlier,
the strength and stiffness of the diaphragm is mainly dependent on the plasterboard-
screw connection system.
6.6.3.4 Properties of Plasterboard Screws
The behaviour of isolated plasterboard-clad ceiling diaphragms is mainly dependent on
the number of screws connecting the plasterboard to the steel frame members.
Therefore, it is essential to develop a relationship among the strength of these
connections and the capacity of the complete ceiling. Five ceilings were investigated in
order to analyse this relationship. The standard screw connection properties obtained
from the experimental observation were used for ceiling FEM #R/, which were then
increased by 10% and 25% for ceiling model FEM #S/ and FEM #T/ respectively, and
decreased by 10% and 25% for ceiling model FEM #U/ and FEM #V/ (refer to Figures
6.43 and 6.44). Figure 6.45 shows the load-deflection curves for these five ceilings.
Figure 6.43: Load-deflection properties of field screws
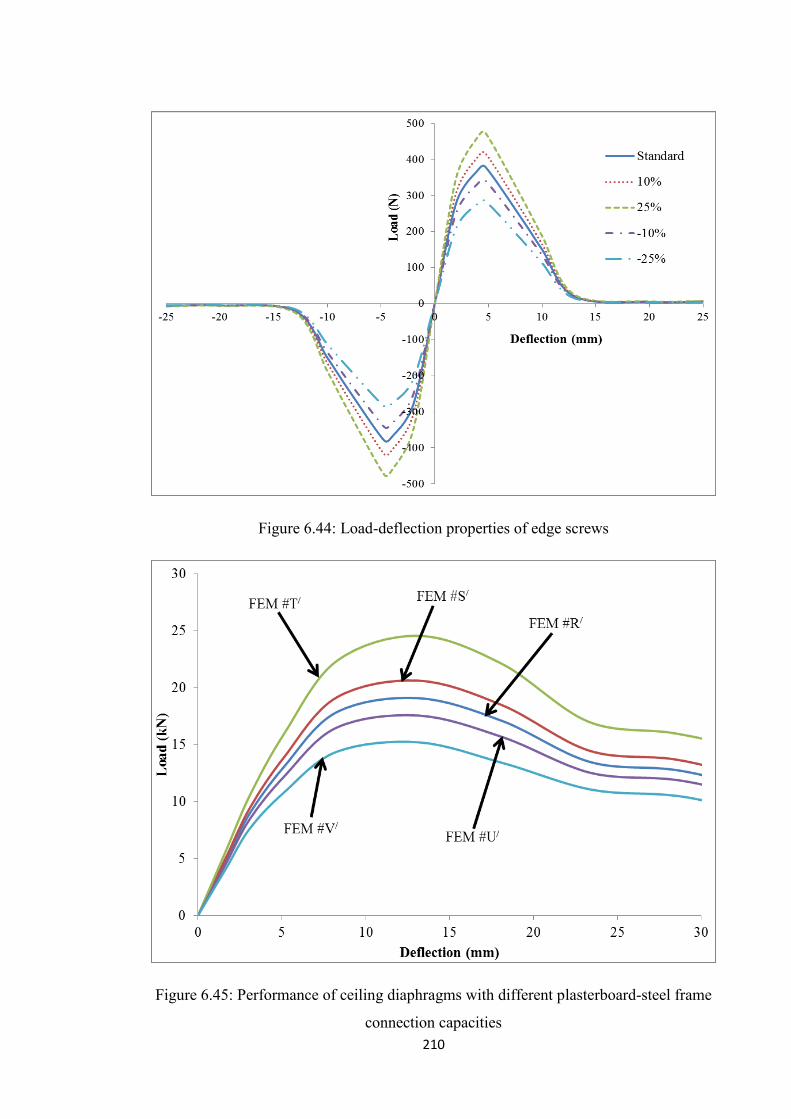
210
Figure 6.44: Load-deflection properties of edge screws
Figure 6.45: Performance of ceiling diaphragms with different plasterboard-steel frame
connection capacities
211
From Figure 6.45, it can be seen that the capacity of the ceiling is highly dependent on
the capacity of the plasterboard-steel frame connection screws. Certainly, the increase in
the capacity of the plasterboard screws by 10% and 25% resulted in the increase of the
ceiling capacity by approximately 9% and 32%. However, the capacity of the ceiling
diaphragm is decreased by about 11% and 27% if the plasterboard screw capacity is
reduced to 10% and 25% respectively.
6.7 Summary and Conclusions
In this chapter, the development of FE models to simulate the behaviour of the tested
ceiling diaphragms in the experimental program in both cantilever and beam tests has
been described. Analytical models were developed for various configurations and
verified against the test results presented in Chapters 4 and 5.
The analytical models were used to conduct further analyses for different configurations
to extend the findings of the experiments. The conclusions drawn from this chapter are
summarized as follows:
The developed FE models were verified with the experimental cantilever test
results developed FE model and good agreement was found. The deflected
shapes and failure modes obtained in FE models were similar to those observed
in the experiments, where the battens showed significant bending at the bottom
of the diaphragm. The plasterboard screw connections also failed at same
locations as observed during the experiments.
The FE modelling was verified against tests conducted on beam configurations
with boundary conditions (i.e. the effect of plasterboard bearing on top plates of
end walls) as well as without boundary conditions (i.e. isolated ceiling
diaphragms). The behaviour of the diaphragms in FE modelling showed very
good consistency with the experimental results.
Without end walls, all the racking forces are transferred through the screws
which connect the plasterboard to the ceiling battens. The failure of the
diaphragm is a result of the failure of these screw connections. Not all these
screw connections failed at the same time but they progressively tilted and
failure at different locations occurred while the diaphragm was being loaded.
The diaphragm without boundary conditions failed due to the combination of
tearing of plasterboard at both corner screws as well as pulling out of the
212
plasterboard screws located within 900 mm from both ends of the diaphragm.
Failure of the screw connections occurred at the same locations as those
observed during the test.
The diaphragm with boundary conditions failed due to the combination of
bearing of the plasterboard edge as well as tearing of the plasterboard screws at
the ends and pulling out of the plasterboard screws located within 900 mm from
both corners of the diaphragm. The bearing of the plasterboard edges occurred
at almost the same location to that observed in the experiments from both ends
of the diaphragm
The deflected shape of the diaphragm obtained from the FE model is similar to
that observed in the experiments, where the ceiling battens showed significant
bending at the ends of the diaphragm. The maximum relative movement
between the plasterboard and frame occurred at both ends of the diaphragm,
which was also observed in the experiments.
The boundary conditions play a role in the performance of plasterboard-clad
ceiling diaphragms. The presence of end walls not only increases the ultimate
capacity of the ceiling but also increases the displacement at which the ultimate
load occurs. The reason for enhanced performance is due to not only the
transfer of the load from the plasterboard screws to the steel frame but also the
bearing action along the plasterboard edges.
The strength of the ceiling diaphragm is similar when it is subjected to different
loading configurations, such as one-third point loading, mid-span loading, and
uniformly-distributed loading. However, uniform loading provides moderately
higher stiffness than one-third point loading and mid-span loading.
There is no variation of strength of ceiling diaphragms due to the variation of
testing methods such as cantilever tests and beam tests. However, the beam test
method provides considerably higher stiffness than the cantilever test method.
There is no significant variation of ultimate strength due to changes of length.
However, the stiffness decreases with the increase of the ceiling length (i.e.
aspect ratio). Longer ceilings (those with high aspect ratios) exhibit greater
flexural deformation. Hence, failure occurs at a larger deflection compared to
shorter ceilings which have their deflection dominated by shear action.
213
The effect of boundary conditions (i.e. effects of pasteboard bearing on top
plates of end walls) becomes less significant with the increase of ceiling width.
The boundary condition provides a significant effect on strength of ceiling
diaphragm up to ceiling width of 7 m. However, there is no significant variation
of strength due to the consideration of the top plate's effect when the ceiling
width exceeds 7 m.
There is a strong relationship between the plasterboard screw spacing and
strength and stiffness. Placing plasterboard screws at close spacing not only
provides higher diaphragm strength and stiffness but also leads to failure at
higher displacements. The strength of the diaphragm can be increased by
approximately 80% by reducing one-third spacing of plasterboard screws along
each batten.
The lateral performance of the diaphragm can be improved by the addition of a
limited number of extra screws. The addition of a single screw at the end of
each batten provides approximately 30% higher strength and about 10% higher
initial stiffness. The addition of two screws at the end of each batten provides
about 70% higher strength and approximately 20% higher initial stiffness.
There is a significant impact on the ultimate capacity of the diaphragm due to
changes in the gap size between the plasterboard and end walls. The ultimate
capacity of the ceiling increases with the decrease of the gap size. The ultimate
capacity of a ceiling with no gap is approximately 30% higher than that of a
ceiling with a 10 mm gap.
There is a considerable effect on strength and stiffness of the diaphragm due to
an increase of batten spacing from 450 mm to 600 mm. The capacity of a
ceiling with 450 mm spacing is about 20% higher than that of a ceiling with 600
mm batten spacing.
Since the strength and stiffness of the diaphragm are mainly dependent on the
number of plasterboard screws, and the plasterboard screws are fixed along the
ceiling batten not to the bottom chords, the reduction of bottom chord spacing
does not affect the strength and stiffness of the diaphragm.
The strength and stiffness of the ceiling diaphragm in loading applied parallel to
the ceiling battens is significantly higher than that for loading applied along the
bottom chord members. This is attributed in part to the observed higher strength
214
and stiffness of the frame when loading is applied parallel to the battens. In
addition, the direct resisting connections are comparatively much higher
number when diaphragm loading along ceiling battens compared to loading
along bottom chord members. Therefore, the diaphragm capacity in loading
parallel to the bottom chord is the critical state.
Ceiling diaphragms are sensitive to the plasterboard screw connections with the
thickness of the steel members connected to the plasterboard. When the
plasterboard is connected to 0.75 mm BMT ceiling battens, it provides
significantly higher (approximately 90%) capacity and higher stiffness (about
70%) compared to plasterboard connecting to 0.42 mm BMT top-hat batten
sections.
There is a direct relationship between the shear capacities of plasterboard screw
connections and the ultimate load-carrying capacity of ceiling diaphragms.
Increasing the capacity of the plasterboard screw by 10% and 25% resulted in
the ceiling capacity increasing by approximately 9% and 32%. However, the
capacity of the ceiling diaphragm is decreased by about 11% and 27% if the
plasterboard screw capacity is reduced by 10% and 25% respectively.
215
CHAPTER 7
LATERAL LOAD DISTRIBUTION AND INDUSTRIAL APPLICATIONS
7.1 Introduction
Deflection of the diaphragm and shear wall is important for both seismic and wind
loading. This chapter discusses the development of a simplified mathematical model for
the estimation of the deflection of plasterboard-clad steel-framed ceiling diaphragms
under different loading conditions. The simplified mathematical model has been
verified with the experimental results described in Chapter 5, as well as the finite
element model results described in Chapter 6. In this research it is proposed to utilize
this model as the basis for estimating the deflection of diaphragms in Australian
construction practice. This chapter also provides a design guideline for the distribution
of lateral load to the bracing walls through the ceiling diaphragm. Design charts for
maximum spacing of bracing walls for the most common construction systems
(plasterboard-clad screwed to cold-formed steel battens which are in turn screwed to
bottom chords) in Australian steel-framed houses are also reported in this chapter.
7.2 Simplified Mathematical Model to Predict Diaphragm Deflections
Skaggs and Martin (2004) stated that historically, deflection of diaphragms and shear
walls has not been a critical design consideration. There has been a misunderstanding
that the calculation of the deflection of diaphragms is not essential for the design of
buildings. Many engineers/designers are not aware of the deflection of diaphragms.
However, much more attention has been given to after several devastating earthquakes
(for instance, the 1994 Northridge earthquake) and cyclones. Some researchers assume
the diaphragm to be rigid, while others consider it to be flexible. However, the
International Building Code (IBC, 2006) classifies diaphragms on the basis of the
deflections of shear walls and horizontal diaphragms.
The IBC (2006) developed a model to estimate diaphragm deflection. The deflection of
a diaphragm was calculated as the sum of individual contributions to deflection from
structural components. The expression of IBC formula can be written as Equation 7.1:
Δ = (0.052vL3)/EAb + vL/4Gt + Len/1627 + Σ(ΔcX)/2b (7.1)
where,
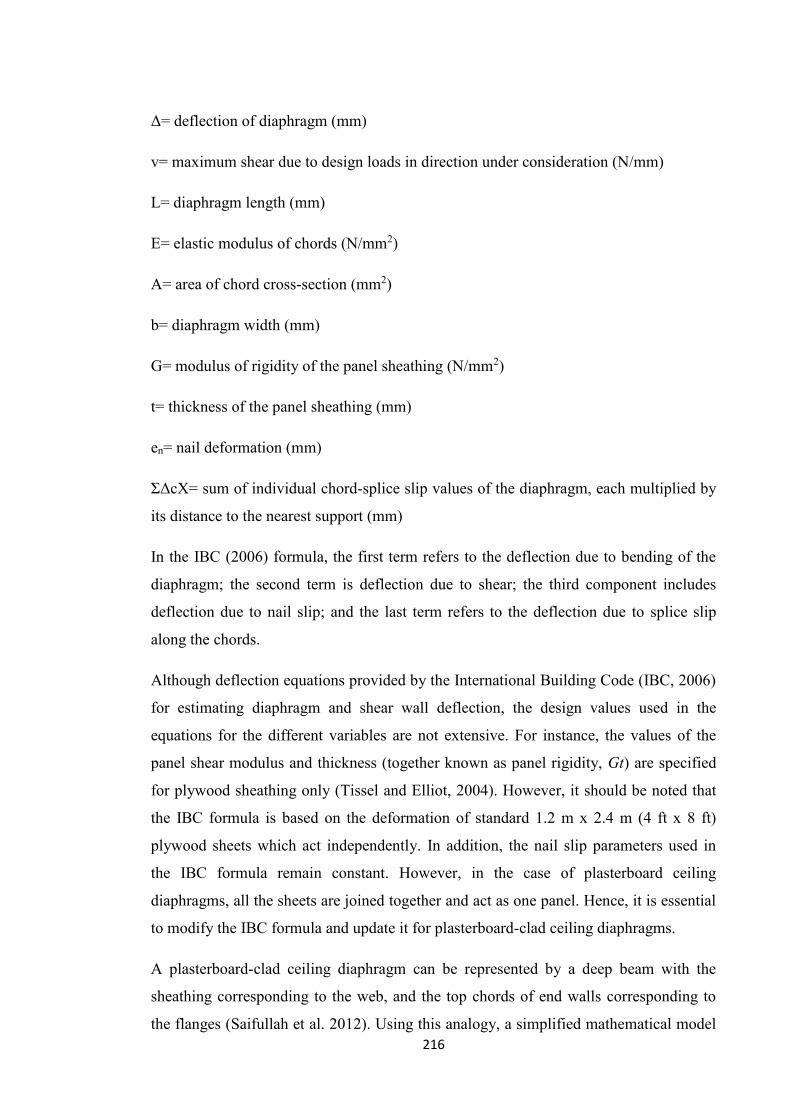
216
Δ= deflection of diaphragm (mm)
v= maximum shear due to design loads in direction under consideration (N/mm)
L= diaphragm length (mm)
E= elastic modulus of chords (N/mm2)
A= area of chord cross-section (mm2)
b= diaphragm width (mm)
G= modulus of rigidity of the panel sheathing (N/mm2)
t= thickness of the panel sheathing (mm)
en= nail deformation (mm)
ΣΔcX= sum of individual chord-splice slip values of the diaphragm, each multiplied by
its distance to the nearest support (mm)
In the IBC (2006) formula, the first term refers to the deflection due to bending of the
diaphragm; the second term is deflection due to shear; the third component includes
deflection due to nail slip; and the last term refers to the deflection due to splice slip
along the chords.
Although deflection equations provided by the International Building Code (IBC, 2006)
for estimating diaphragm and shear wall deflection, the design values used in the
equations for the different variables are not extensive. For instance, the values of the
panel shear modulus and thickness (together known as panel rigidity, Gt) are specified
for plywood sheathing only (Tissel and Elliot, 2004). However, it should be noted that
the IBC formula is based on the deformation of standard 1.2 m x 2.4 m (4 ft x 8 ft)
plywood sheets which act independently. In addition, the nail slip parameters used in
the IBC formula remain constant. However, in the case of plasterboard ceiling
diaphragms, all the sheets are joined together and act as one panel. Hence, it is essential
to modify the IBC formula and update it for plasterboard-clad ceiling diaphragms.
A plasterboard-clad ceiling diaphragm can be represented by a deep beam with the
sheathing corresponding to the web, and the top chords of end walls corresponding to
the flanges (Saifullah et al. 2012). Using this analogy, a simplified mathematical model
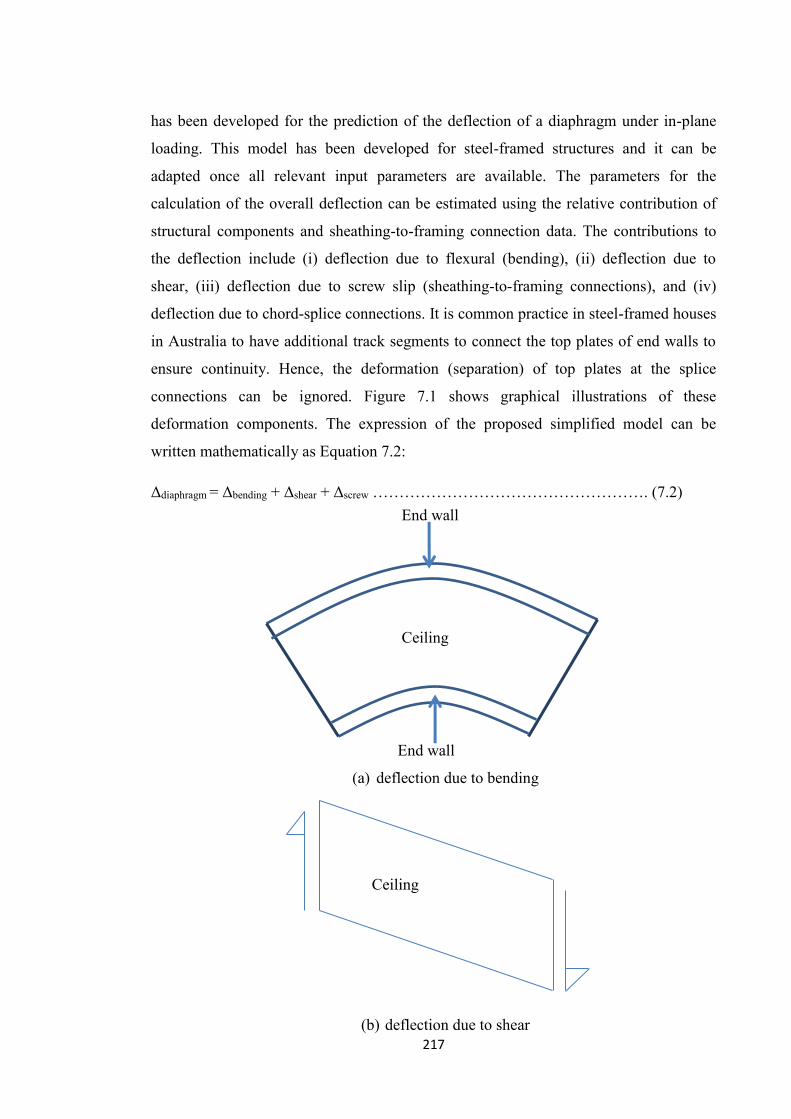
217
has been developed for the prediction of the deflection of a diaphragm under in-plane
loading. This model has been developed for steel-framed structures and it can be
adapted once all relevant input parameters are available. The parameters for the
calculation of the overall deflection can be estimated using the relative contribution of
structural components and sheathing-to-framing connection data. The contributions to
the deflection include (i) deflection due to flexural (bending), (ii) deflection due to
shear, (iii) deflection due to screw slip (sheathing-to-framing connections), and (iv)
deflection due to chord-splice connections. It is common practice in steel-framed houses
in Australia to have additional track segments to connect the top plates of end walls to
ensure continuity. Hence, the deformation (separation) of top plates at the splice
connections can be ignored. Figure 7.1 shows graphical illustrations of these
deformation components. The expression of the proposed simplified model can be
written mathematically as Equation 7.2:
Δdiaphragm = Δbending + Δshear + Δscrew ……………………………………………. (7.2)
(a) deflection due to bending
(b) deflection due to shear
Ceiling
End wall
End wall
Ceiling
218
(c) deflection due to screw slip between plasterboard and steel member
Figure 7.1: Various components of diaphragm deflection
Flange contribution
The contribution of the flange to diaphragm deflection is provided on the basis of the
girder analogy. Two components of the diaphragm deflection occur due to the
contribution of the flange. The first term is due to flexural deformation in the diaphragm
and the second term is due to slippage at flange splices. It should be noted that the
flanges of the diaphragm are assumed to be the top plate of the end walls. The
deflection due to splice slip of the diaphragm is associated with the stresses induced in
the flanges as well as the tolerance of the diaphragm fabrication.
Web shear contribution
The deflection of the girder due to the contribution of web shear with small span-to-
depth ratios is significant (ATC, 1981). However, in steel framing members with
normal span-to-depth ratios, deflection from the contribution of shear is generally of
little significance in the total deflection of the diaphragm.
The web of the diaphragm is represented by the sheathing of the diaphragm and is
considered to carry the shearing stresses introduced in the member due to the applied
lateral loads. It should be mentioned that the modulus of rigidity of the plasterboard-
sheathed panel varies according to the density of the plasterboard board. Web elements
are spliced over the steel framing members so that there are mechanisms for stress
transfer between the web and the flange. It should be noted that the buckling of the web
is typically resisted due to the stiffening effect of the steel framing members to which
the plasterboard sheathing is connected. The loads generally act uniformly distributed
along the length of the diaphragm. Hence, the critical shear condition for the diaphragm
occurs at the supports (i.e. reactions). In the derivation of the deflection due to shear of
Batten or bottom chord of roof truss
Ceiling sheeting

219
the web, it is assumed that the shear stresses are uniformly distributed across the entire
width of the web.
Screw-slip contribution
The deformation of plasterboard to frame screw connections contributes to the overall
deflection of the diaphragm. The deformation at these connections is characterised by
screw slip deformation. These deformation characteristics can be obtained from the tests
outlined in Chapter 3.
7.2.1 Estimation of Deflection Equation Parameters under One-third Loading
The deflection equation is derived on the basis of a number of assumptions: (i) simply
supported, (ii) uniformly screwed, (iii) one-third point loaded, and (iv) constant in
length and width. A representation of a diaphragm under one-third loading conditions is
presented in Figure 7.2. For diaphragms, the contribution of the deflection due to
bending and shear can be obtained using a standard formula.
Figure 7.2: Diaphragm subjected to one-third loading
Diaphragm deflection due to flexural contribution (bending)
Δbending
Where,
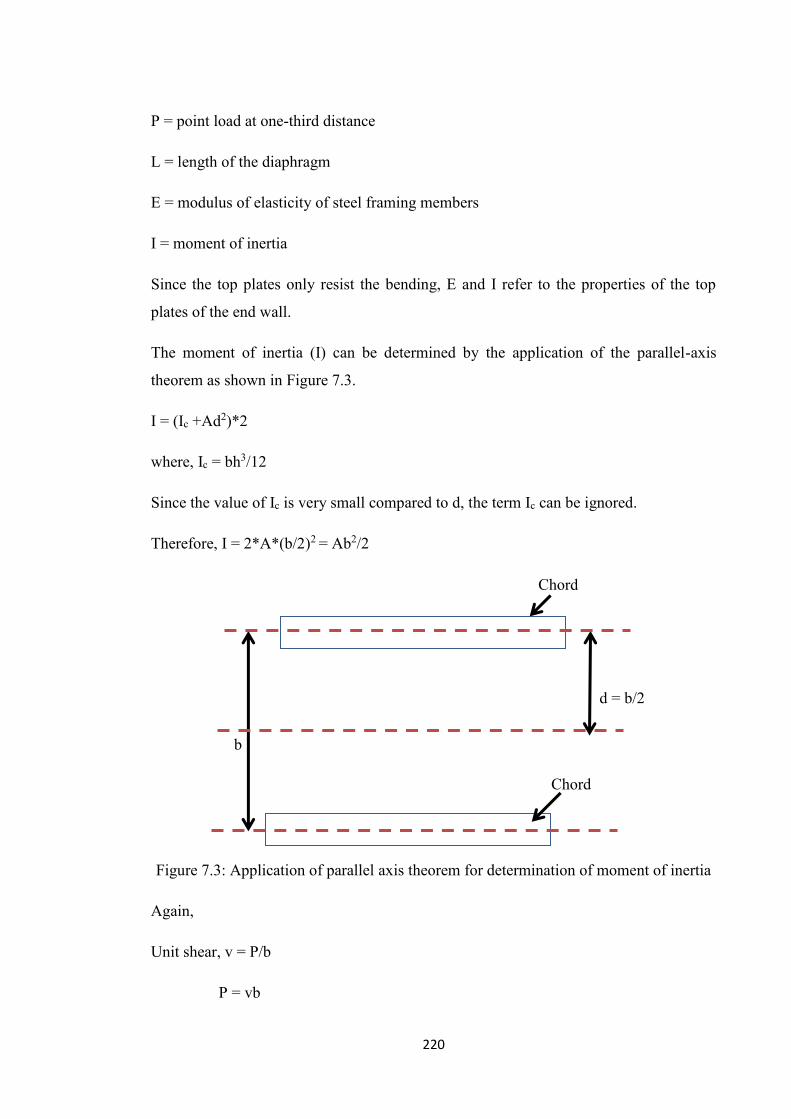
220
P = point load at one-third distance
L = length of the diaphragm
E = modulus of elasticity of steel framing members
I = moment of inertia
Since the top plates only resist the bending, E and I refer to the properties of the top
plates of the end wall.
The moment of inertia (I) can be determined by the application of the parallel-axis
theorem as shown in Figure 7.3.
I = (Ic +Ad2)*2
where, Ic = bh3/12
Since the value of Ic is very small compared to d, the term Ic can be ignored.
Therefore, I = 2*A*(b/2)2 = Ab2/2
Figure 7.3: Application of parallel axis theorem for determination of moment of inertia
Again,
Unit shear, v = P/b
P = vb
b
d = b/2
Chord
Chord

221
Δbending
= [vb*L3/ (28.2 * E * (Ab2/2)]
= 0.071vL3/EAb
This derivation ignores the bending contribution of ceiling battens as they are assumed
to have very low stiffness. However, if bending of the diaphragm is such that the bottom
chords of the trusses are in bending, then this term needs to be changed.
Diaphragm deflection due to shear
Based on cleared structural mechanics theory,
Δshear =
where,
fs = form factor for the cross-sectional area = 1 (for simplicity)
Vx= shear force due to actual load
vx= shear force due to unit load
A = cross-sectional area of the web (sheathing) = bt
b = diaphragm depth
t = sheathing thickness
G = modulus of rigidity of the sheathing
Δshear = (1/GA)[ * 2
= *2
=
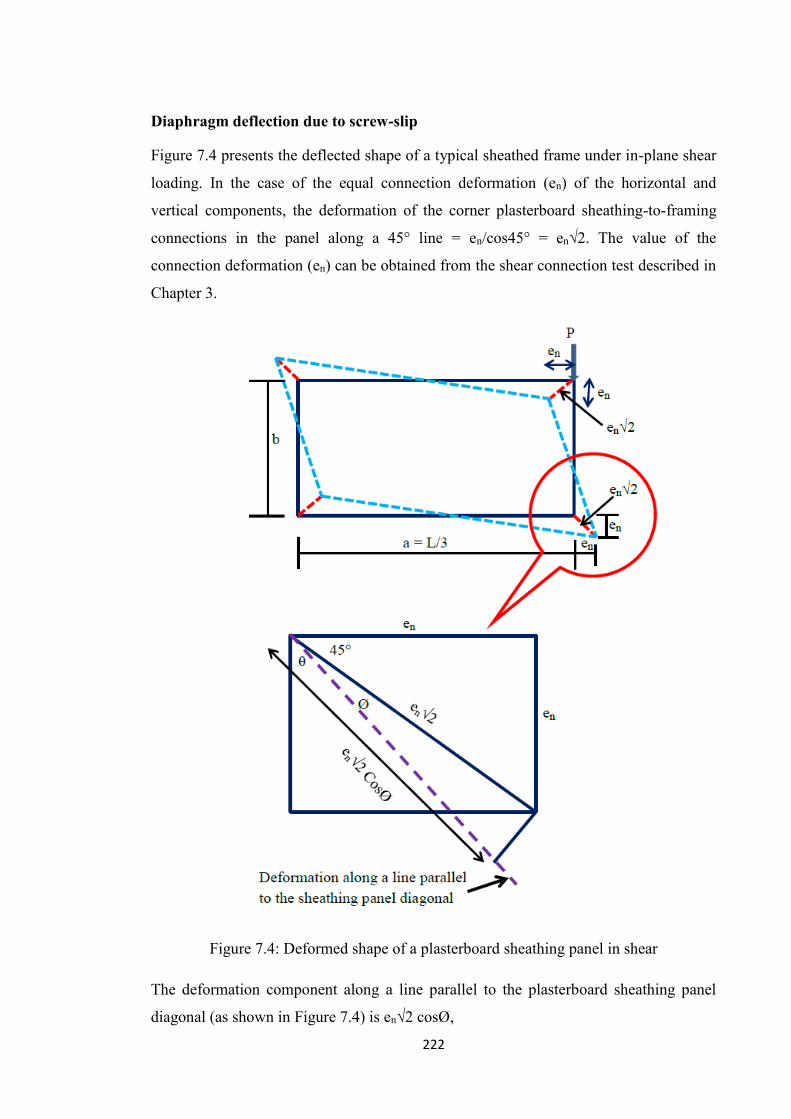
222
Diaphragm deflection due to screw-slip
Figure 7.4 presents the deflected shape of a typical sheathed frame under in-plane shear
loading. In the case of the equal connection deformation (en) of the horizontal and
vertical components, the deformation of the corner plasterboard sheathing-to-framing
connections in the panel along a 45° line = en/cos45° = en√2. The value of the
connection deformation (en) can be obtained from the shear connection test described in
Chapter 3.
Figure 7.4: Deformed shape of a plasterboard sheathing panel in shear
The deformation component along a line parallel to the plasterboard sheathing panel
diagonal (as shown in Figure 7.4) is en√2 cosØ,
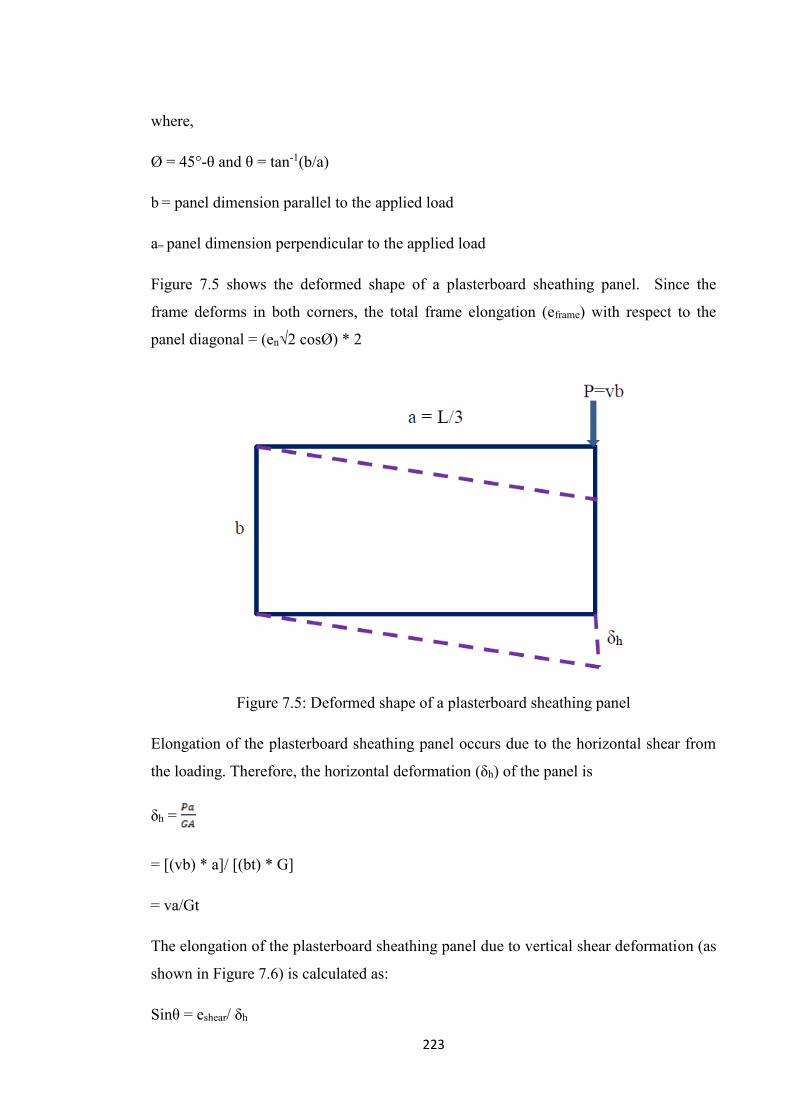
223
where,
Ø = 45°-θ and θ = tan-1(b/a)
b = panel dimension parallel to the applied load
a= panel dimension perpendicular to the applied load
Figure 7.5 shows the deformed shape of a plasterboard sheathing panel. Since the
frame deforms in both corners, the total frame elongation (eframe) with respect to the
panel diagonal = (en√2 cosØ) * 2
Figure 7.5: Deformed shape of a plasterboard sheathing panel
Elongation of the plasterboard sheathing panel occurs due to the horizontal shear from
the loading. Therefore, the horizontal deformation (δh) of the panel is
δh =
= [(vb) * a]/ [(bt) * G]
= va/Gt
The elongation of the plasterboard sheathing panel due to vertical shear deformation (as
shown in Figure 7.6) is calculated as:
Sinθ = eshear/ δh
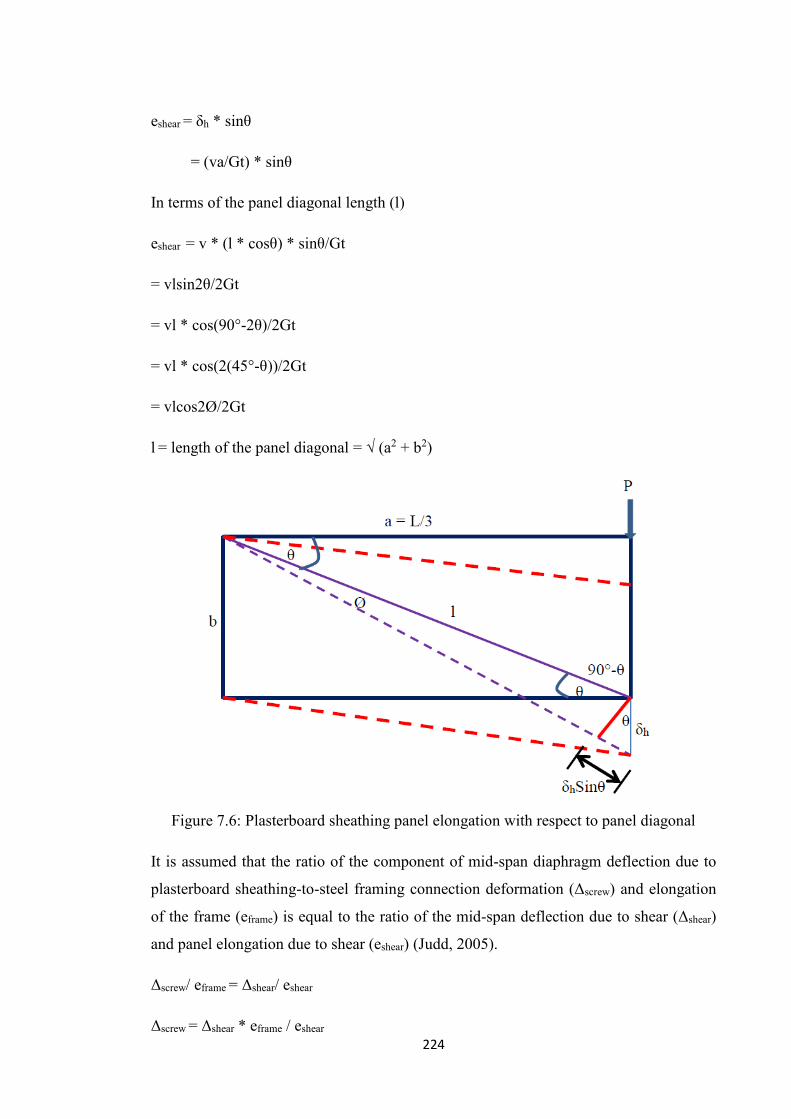
224
eshear = δh * sinθ
= (va/Gt) * sinθ
In terms of the panel diagonal length (l)
eshear = v * (l * cosθ) * sinθ/Gt
= vlsin2θ/2Gt
= vl * cos(90°-2θ)/2Gt
= vl * cos(2(45°-θ))/2Gt
= vlcos2Ø/2Gt
l = length of the panel diagonal = √ (a2 + b2)
Figure 7.6: Plasterboard sheathing panel elongation with respect to panel diagonal
It is assumed that the ratio of the component of mid-span diaphragm deflection due to
plasterboard sheathing-to-steel framing connection deformation (Δscrew) and elongation
of the frame (eframe) is equal to the ratio of the mid-span deflection due to shear (Δshear)
and panel elongation due to shear (eshear) (Judd, 2005).
Δscrew/ eframe = Δshear/ eshear
Δscrew = Δshear * eframe / eshear
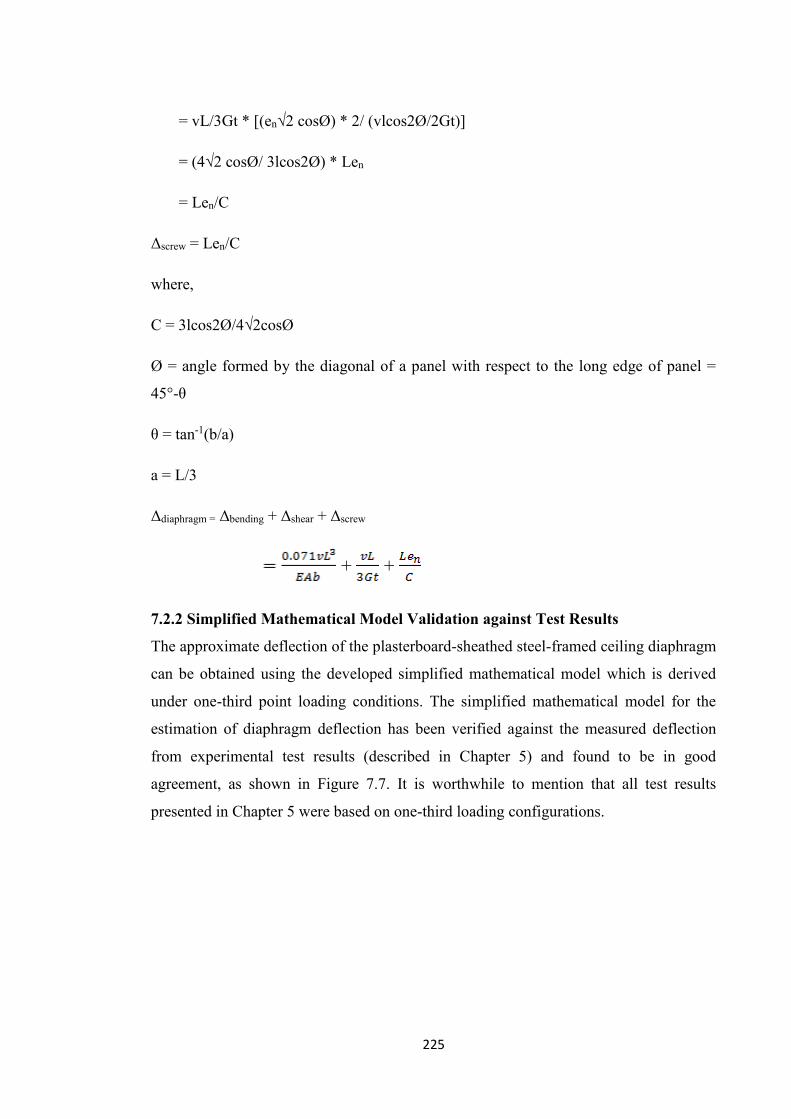
225
= vL/3Gt * [(en√2 cosØ) * 2/ (vlcos2Ø/2Gt)]
= (4√2 cosØ/ 3lcos2Ø) * Len
= Len/C
Δscrew = Len/C
where,
C = 3lcos2Ø/4√2cosØ
Ø = angle formed by the diagonal of a panel with respect to the long edge of panel =
45°-θ
θ = tan-1(b/a)
a = L/3
Δdiaphragm = Δbending + Δshear + Δscrew
+ +
7.2.2 Simplified Mathematical Model Validation against Test Results
The approximate deflection of the plasterboard-sheathed steel-framed ceiling diaphragm
can be obtained using the developed simplified mathematical model which is derived
under one-third point loading conditions. The simplified mathematical model for the
estimation of diaphragm deflection has been verified against the measured deflection
from experimental test results (described in Chapter 5) and found to be in good
agreement, as shown in Figure 7.7. It is worthwhile to mention that all test results
presented in Chapter 5 were based on one-third loading configurations.
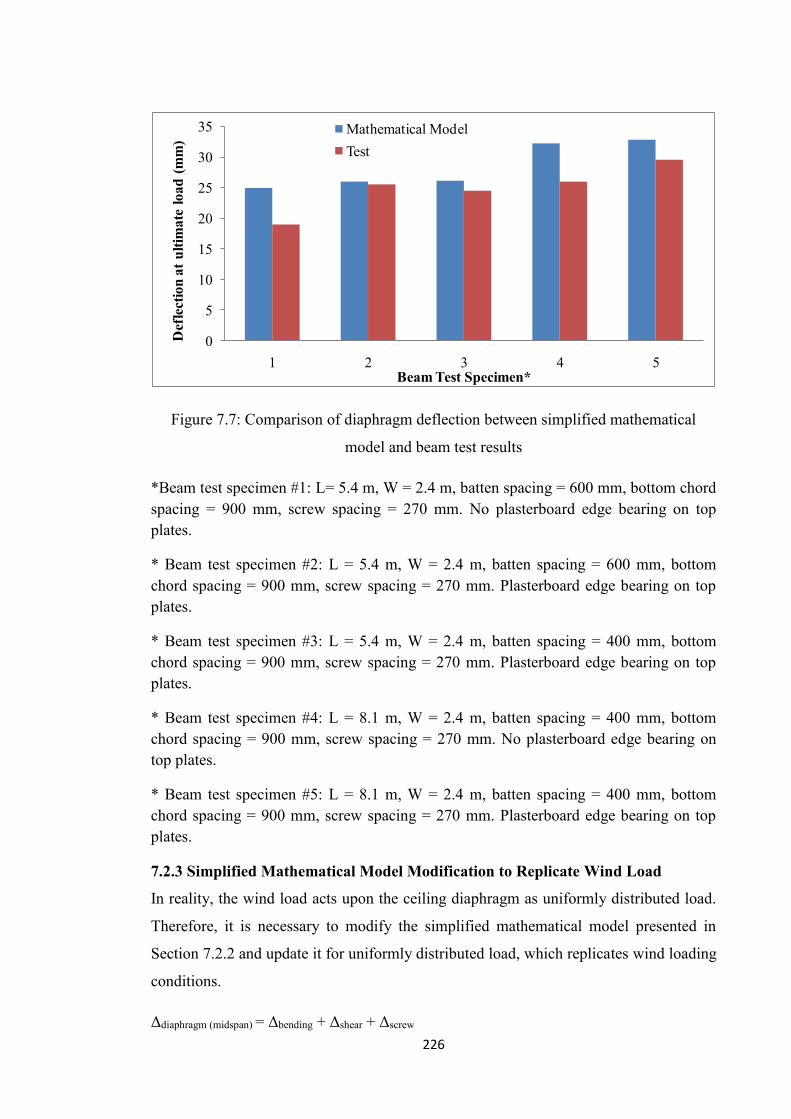
226
0
5
10
15
20
25
30
35
1 2 3 4 5
Def
lect
ion
at u
ltim
ate
load
(mm
)
Beam Test Specimen*
Mathematical ModelTest
Figure 7.7: Comparison of diaphragm deflection between simplified mathematical
model and beam test results
*Beam test specimen #1: L= 5.4 m, W = 2.4 m, batten spacing = 600 mm, bottom chord spacing = 900 mm, screw spacing = 270 mm. No plasterboard edge bearing on top plates.
* Beam test specimen #2: L = 5.4 m, W = 2.4 m, batten spacing = 600 mm, bottom chord spacing = 900 mm, screw spacing = 270 mm. Plasterboard edge bearing on top plates.
* Beam test specimen #3: L = 5.4 m, W = 2.4 m, batten spacing = 400 mm, bottom chord spacing = 900 mm, screw spacing = 270 mm. Plasterboard edge bearing on top plates.
* Beam test specimen #4: L = 8.1 m, W = 2.4 m, batten spacing = 400 mm, bottom chord spacing = 900 mm, screw spacing = 270 mm. No plasterboard edge bearing on top plates.
* Beam test specimen #5: L = 8.1 m, W = 2.4 m, batten spacing = 400 mm, bottom chord spacing = 900 mm, screw spacing = 270 mm. Plasterboard edge bearing on top plates.
7.2.3 Simplified Mathematical Model Modification to Replicate Wind Load
In reality, the wind load acts upon the ceiling diaphragm as uniformly distributed load.
Therefore, it is necessary to modify the simplified mathematical model presented in
Section 7.2.2 and update it for uniformly distributed load, which replicates wind loading
conditions.
Δdiaphragm (midspan) = Δbending + Δshear + Δscrew
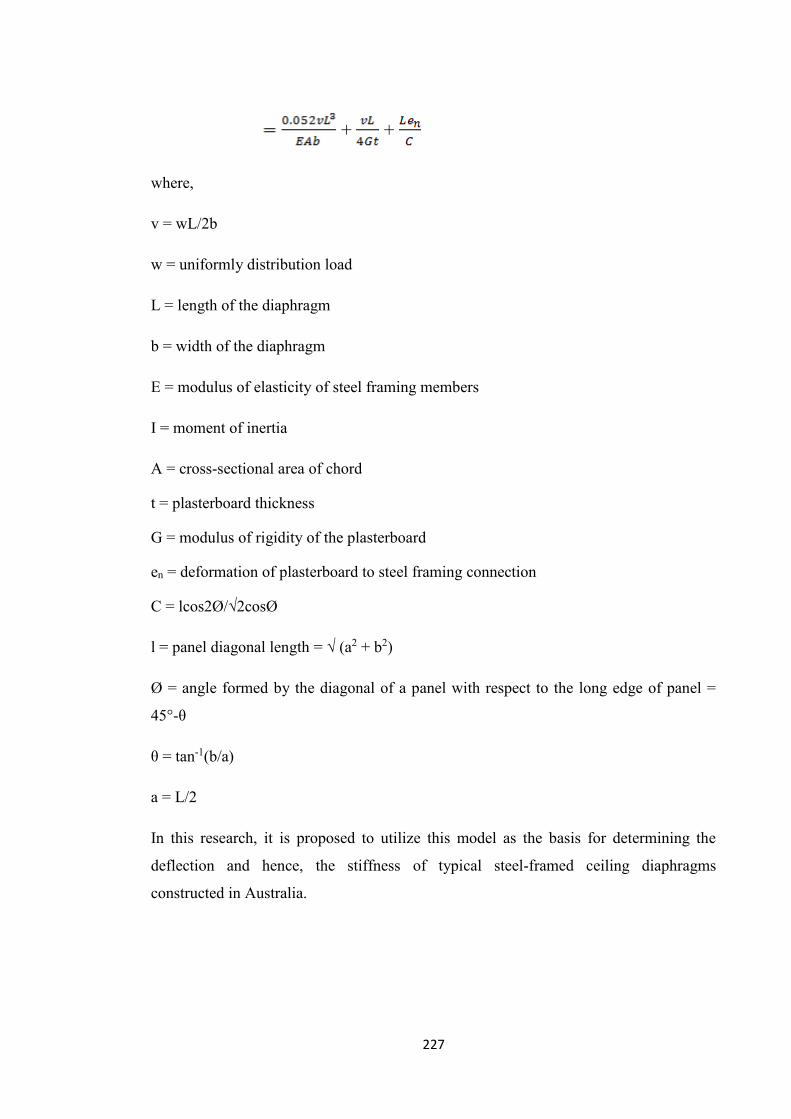
227
+ +
where,
v = wL/2b
w = uniformly distribution load
L = length of the diaphragm
b = width of the diaphragm
E = modulus of elasticity of steel framing members
I = moment of inertia
A = cross-sectional area of chord
t = plasterboard thickness
G = modulus of rigidity of the plasterboard
en = deformation of plasterboard to steel framing connection
C = lcos2Ø/√2cosØ
l = panel diagonal length = √ (a2 + b2)
Ø = angle formed by the diagonal of a panel with respect to the long edge of panel =
45°-θ
θ = tan-1(b/a)
a = L/2
In this research, it is proposed to utilize this model as the basis for determining the
deflection and hence, the stiffness of typical steel-framed ceiling diaphragms
constructed in Australia.
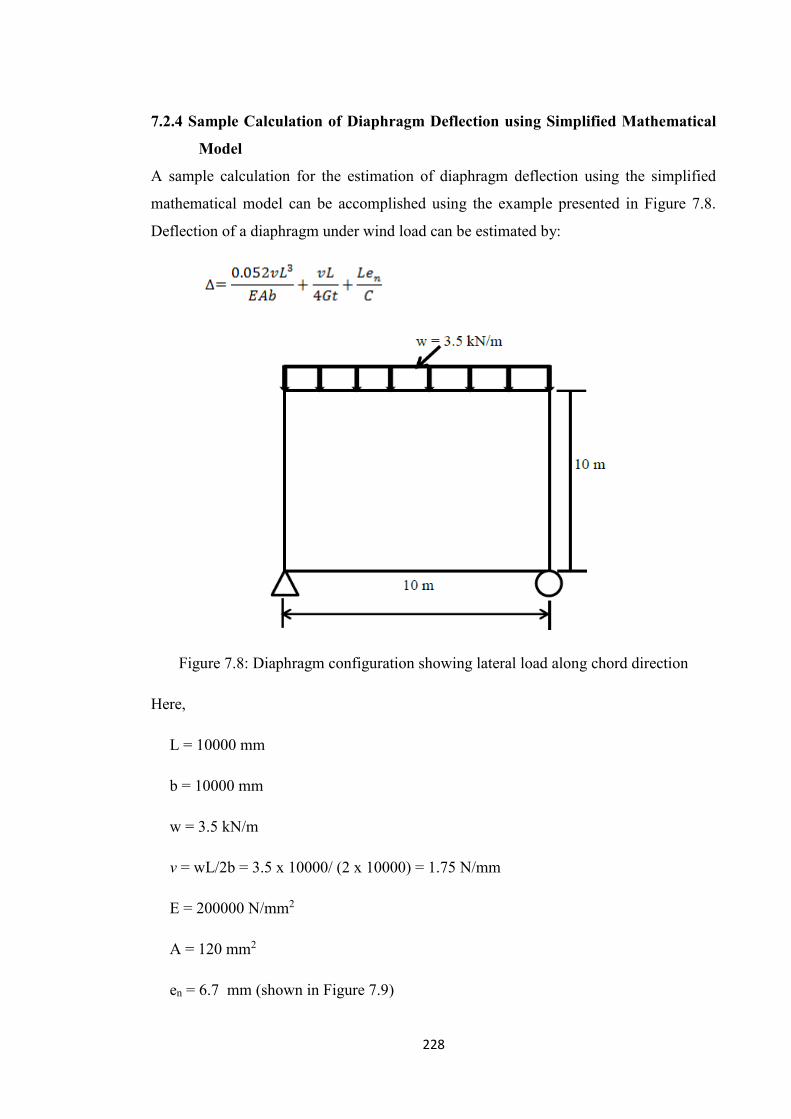
228
7.2.4 Sample Calculation of Diaphragm Deflection using Simplified Mathematical
Model
A sample calculation for the estimation of diaphragm deflection using the simplified
mathematical model can be accomplished using the example presented in Figure 7.8.
Deflection of a diaphragm under wind load can be estimated by:
Figure 7.8: Diaphragm configuration showing lateral load along chord direction
Here,
L = 10000 mm
b = 10000 mm
w = 3.5 kN/m
v = wL/2b = 3.5 x 10000/ (2 x 10000) = 1.75 N/mm
E = 200000 N/mm2
A = 120 mm2
en = 6.7 mm (shown in Figure 7.9)
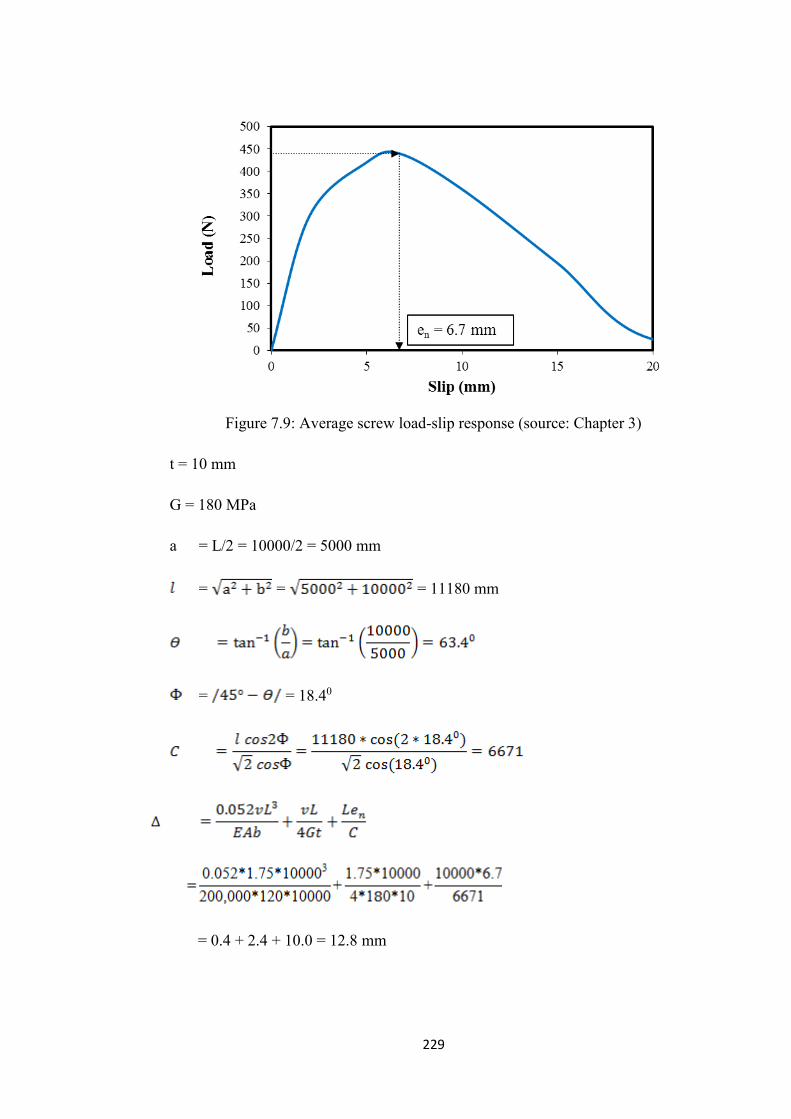
229
Figure 7.9: Average screw load-slip response (source: Chapter 3)
t = 10 mm
G = 180 MPa
a = L/2 = 10000/2 = 5000 mm
= = = 11180 mm
= = 18.40
= 0.4 + 2.4 + 10.0 = 12.8 mm

230
7.2.5 Simplified Mathematical Model Validation against Finite Element Model
Results
The developed simplified mathematical model (shown in Section 7.2.3) subjected to
uniformly distributed loading for plasterboard-sheathed ceiling diaphragms has been
validated against finite element model results (described in Chapter 6), as illustrated in
Figure 7.10. There is good agreement observed between the simplified mathematical
model and the finite element model results for aspect ratios up to 3. However, by
comparing with the FEM results (shown in Figure 7.10), the simplified mathematical
model gives underestimated deflection value for the AR-0.5 specimen and
overestimated deflection value for the specimen with AR greater than 3. When the AR
increases the simplified mathematical model provides monotonically increasing value.
0
5
10
15
20
25
30
FEM #II (AR-0.5)
FEM #HH(AR-0.75)
FEM #FF(AR-1.0)
FEM #AA(AR-1.33)
FEM #BB(AR-2.0)
FEM #CC(AR-3.33)
FEM #DD(AR-4.0)
Defle
ction
at u
ltim
ate l
oad
(mm
)
Mathematical Model FEM
Figure 7.10: Comparison of diaphragm deflection between simplified mathematical
model and FEM results
From the simplified mathematical model it has been observed that deformation of
plasterboard to steel-framing connection is the main parameter for the contribution of
diaphragm deflection. In this research (described in Chapter 3), five samples were tested
to determine the load-slip response of screw. Therefore, the more number of shear
connection tests will provide the more precise value of deformation of plasterboard to
steel-framing connection and as a consequence, the simplified mathematical model will
give diaphragm deflection value closer to FEM results. It should be mentioned that the
parameters considered for these diaphragms in finite element models included spacing
of ceiling battens and bottom chords of 450 mm and 900 mm respectively, 10 mm thick

231
plasterboard, and plasterboard screws fixed along the batten at 270 mm spacing. All of
the diaphragms were loaded parallel to the bottom chords under uniformly distributed
loading conditions.
7.3 Approximate FE model for diaphragm deflection
7.3.1 Deep Beam Model
In this model, deep beam elements are used to model the diaphragm for distributing
wind load to the bracing wall. The diaphragm is modelled using beam elements of
equivalent shear stiffness (GAs) and high value of bending stiffness (EI) to eliminate
the contribution of bending deformation. Bracing walls are modelled as linear springs of
equivalent stiffness (secant stiffness). Figure 7.11 shows the equivalent diaphragm
stiffness for the deep beam model. The equivalent diaphragm stiffness (GAs) for the
deep beam model can be obtained under various loading conditions, as presented in
Equation 7.3.
Figure 7.11: Diaphragm model using deep beam analogy
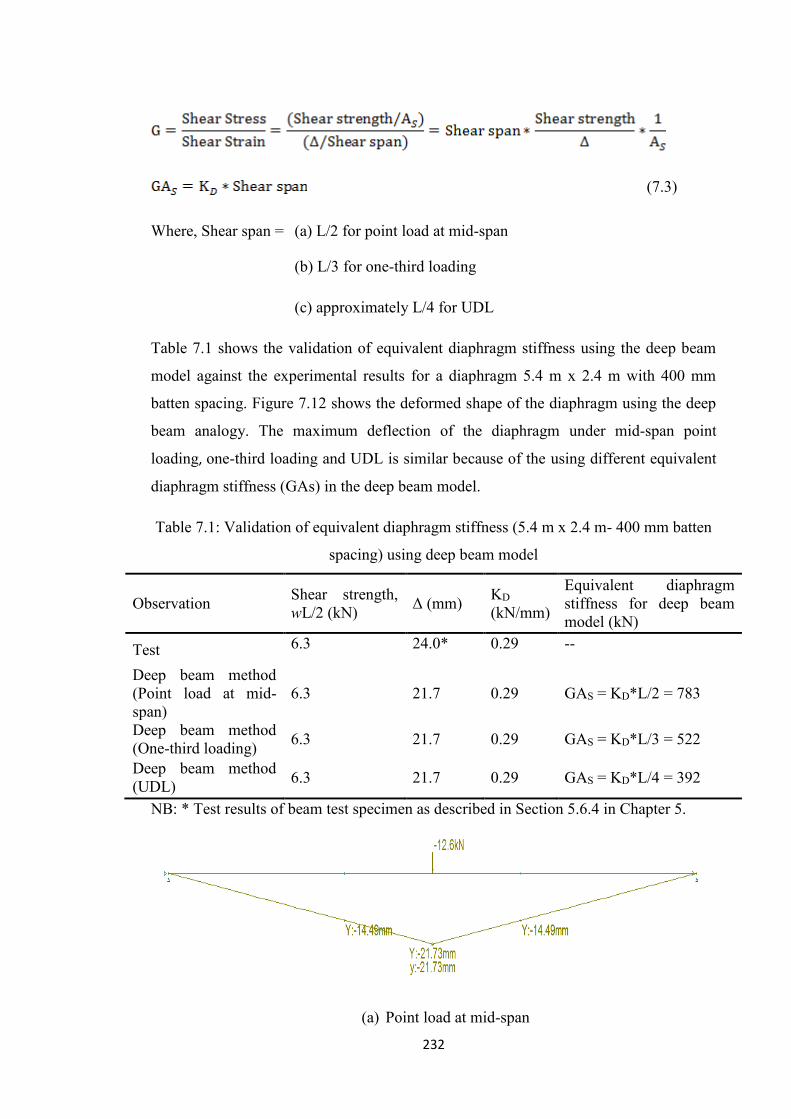
232
(7.3)
Where, Shear span = (a) L/2 for point load at mid-span
(b) L/3 for one-third loading
(c) approximately L/4 for UDL
Table 7.1 shows the validation of equivalent diaphragm stiffness using the deep beam
model against the experimental results for a diaphragm 5.4 m x 2.4 m with 400 mm
batten spacing. Figure 7.12 shows the deformed shape of the diaphragm using the deep
beam analogy. The maximum deflection of the diaphragm under mid-span point
loading, one-third loading and UDL is similar because of the using different equivalent
diaphragm stiffness (GAs) in the deep beam model.
Table 7.1: Validation of equivalent diaphragm stiffness (5.4 m x 2.4 m- 400 mm batten
spacing) using deep beam model
Observation Shear strength, wL/2 (kN) Δ (mm) KD
(kN/mm)
Equivalent diaphragm stiffness for deep beam model (kN)
Test 6.3 24.0* 0.29 --
Deep beam method (Point load at mid-span)
6.3 21.7 0.29 GAS = KD*L/2 = 783
Deep beam method (One-third loading) 6.3 21.7 0.29 GAS = KD*L/3 = 522
Deep beam method (UDL) 6.3 21.7 0.29 GAS = KD*L/4 = 392
NB: * Test results of beam test specimen as described in Section 5.6.4 in Chapter 5.
(a) Point load at mid-span
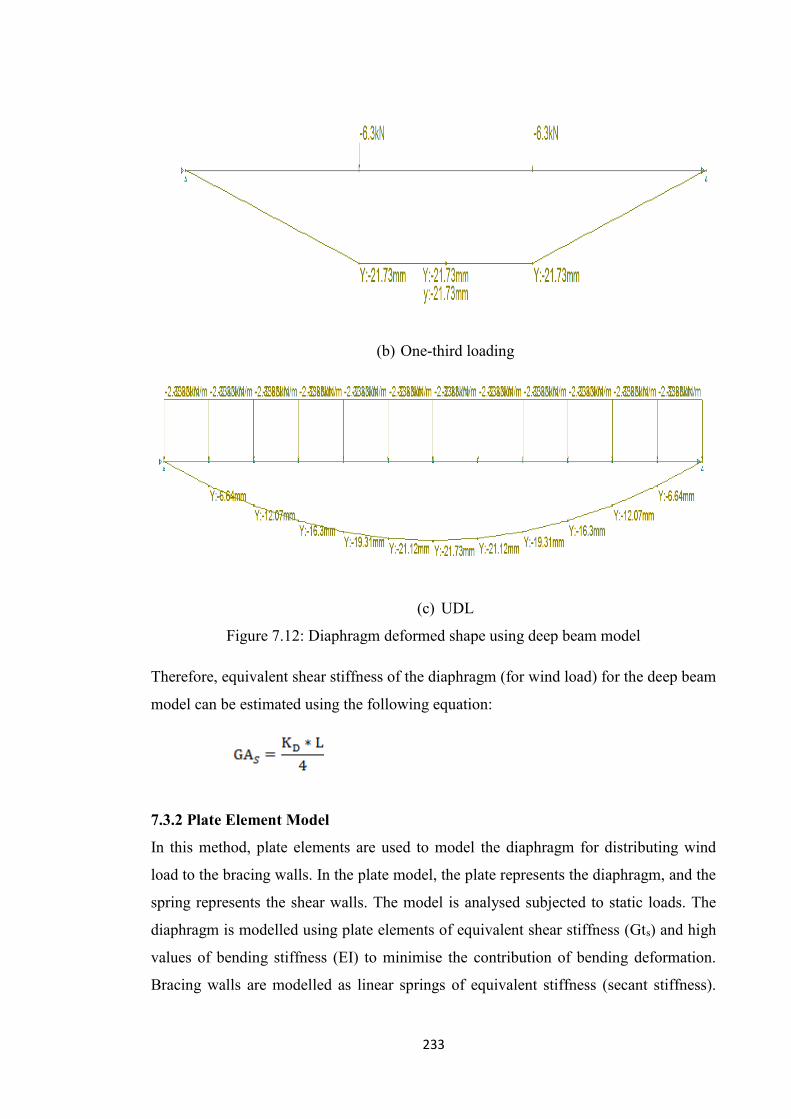
233
(b) One-third loading
(c) UDL
Figure 7.12: Diaphragm deformed shape using deep beam model
Therefore, equivalent shear stiffness of the diaphragm (for wind load) for the deep beam
model can be estimated using the following equation:
7.3.2 Plate Element Model
In this method, plate elements are used to model the diaphragm for distributing wind
load to the bracing walls. In the plate model, the plate represents the diaphragm, and the
spring represents the shear walls. The model is analysed subjected to static loads. The
diaphragm is modelled using plate elements of equivalent shear stiffness (Gts) and high
values of bending stiffness (EI) to minimise the contribution of bending deformation.
Bracing walls are modelled as linear springs of equivalent stiffness (secant stiffness).

234
The equivalent shear stiffness of diaphragms (for wind load) for the plate element
model can be estimated using Equation 7.4.
(7.4)
where, AR = Aspect ratio of diaphragm = L/b
7.4 Case study
There are several methods for the distribution of lateral loads to the bracing walls
through ceiling diaphragms. A case study was performed for the design of lateral load-
resisting elements using different lateral load distribution methods. The house is
considered for N3/C1 wind classification in Australia. Figure 7.13 shows the
configuration of the house with lateral load-resisting elements along the long direction.
The load is distributed to the walls based on a number of assumptions: (i) diaphragms
are rigid or flexible, (ii) stiffness of the shear wall is almost similar, (iii) the behaviour
of shear walls is linear, and (iv) there is no rotation of the structure due to lateral
loading.
Figure 7.13: Building configuration showing lateral load resisting elements in long
direction
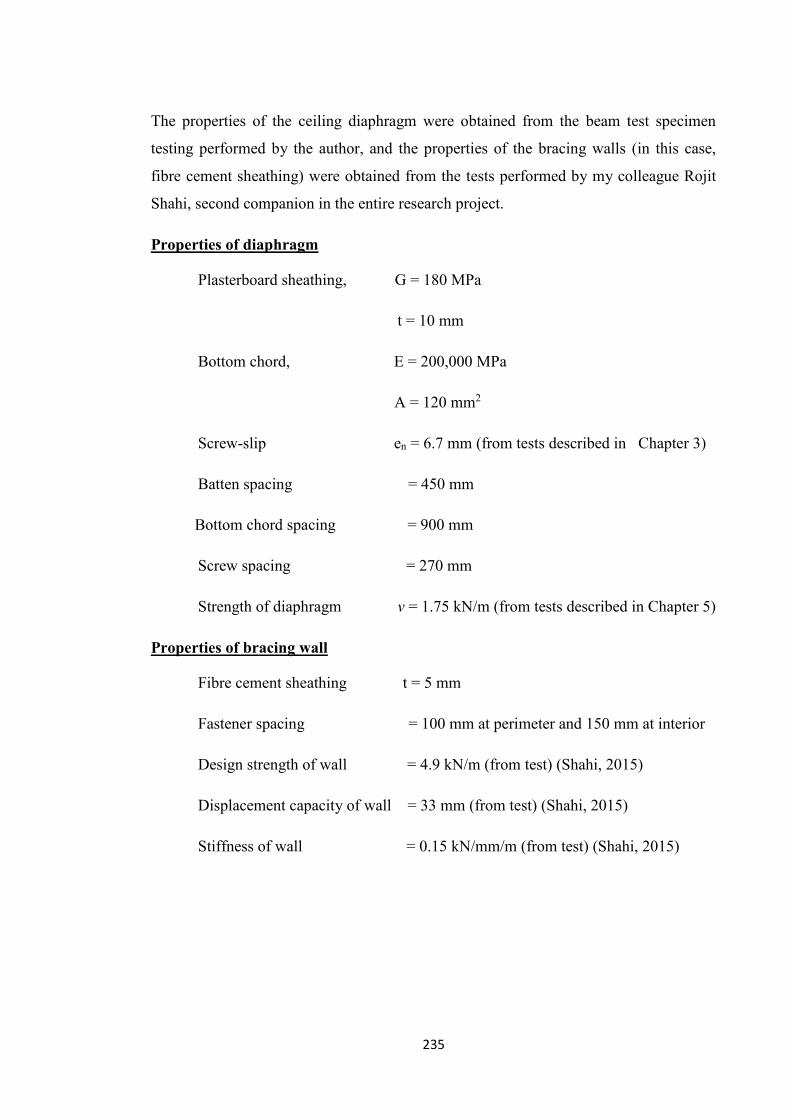
235
The properties of the ceiling diaphragm were obtained from the beam test specimen
testing performed by the author, and the properties of the bracing walls (in this case,
fibre cement sheathing) were obtained from the tests performed by my colleague Rojit
Shahi, second companion in the entire research project.
Properties of diaphragm
Plasterboard sheathing, G = 180 MPa
t = 10 mm
Bottom chord, E = 200,000 MPa
A = 120 mm2
Screw-slip en = 6.7 mm (from tests described in Chapter 3)
Batten spacing = 450 mm
Bottom chord spacing = 900 mm
Screw spacing = 270 mm
Strength of diaphragm v = 1.75 kN/m (from tests described in Chapter 5)
Properties of bracing wall
Fibre cement sheathing t = 5 mm
Fastener spacing = 100 mm at perimeter and 150 mm at interior
Design strength of wall = 4.9 kN/m (from test) (Shahi, 2015)
Displacement capacity of wall = 33 mm (from test) (Shahi, 2015)
Stiffness of wall = 0.15 kN/mm/m (from test) (Shahi, 2015)

236
7.4.1 Maximum bracing wall spacing
Maximum spacing between bracing walls is estimated based on the wind load and the
design strength of the diaphragm.
If v (1.75 kN/m) is the shear strength per unit width of the diaphragm and w (3.5 kN/m)
is the design wind load (as illustrated in Figure 7.14), then maximum spacing between
bracing wall can be obtained by:
(7.5)
Figure 7.14: Maximum spacing (L) between bracing wall for design wind load (w)
It should be noted that design wind load (w) is estimated based on the location of the
building and the direction of the wind.
Maximum spacing between bracing walls is evaluated using Equation 7.5:
7.4.2 Method 1: Total shear
In this case, estimated horizontal load, w = 3.5 kN/m and maximum spacing between
bracing walls = 10.0 m. After finding the maximum spacing between bracing wall
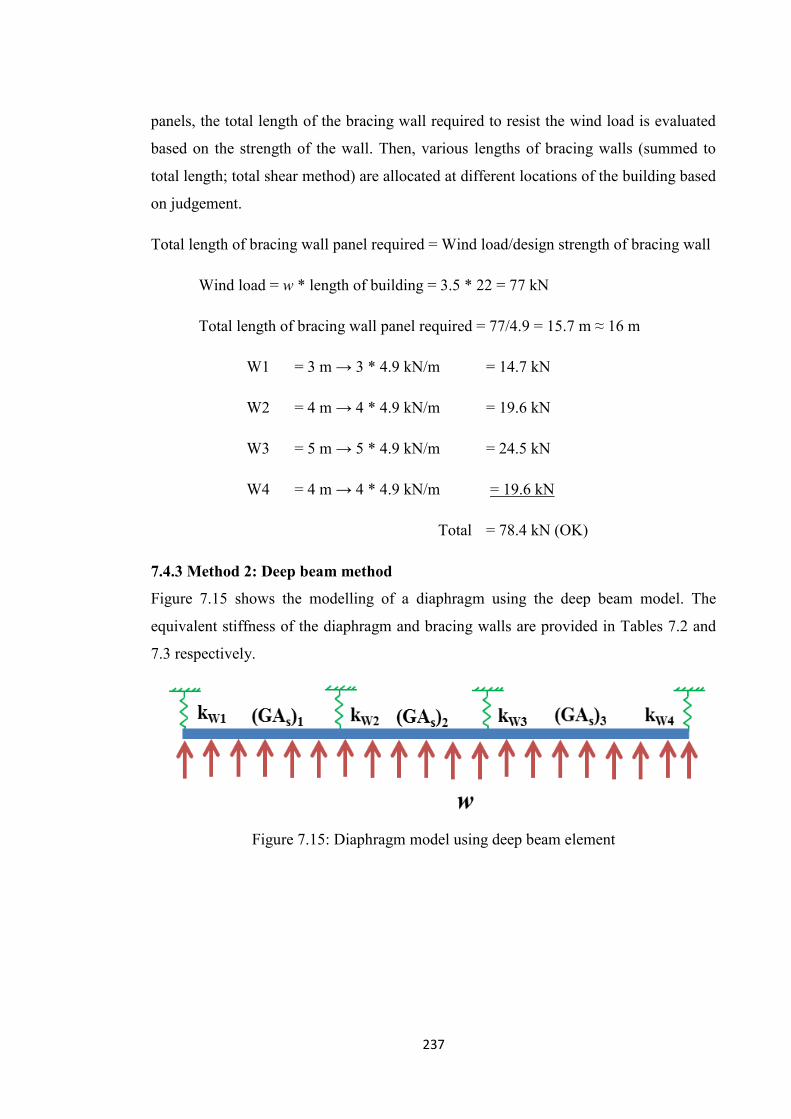
237
panels, the total length of the bracing wall required to resist the wind load is evaluated
based on the strength of the wall. Then, various lengths of bracing walls (summed to
total length; total shear method) are allocated at different locations of the building based
on judgement.
Total length of bracing wall panel required = Wind load/design strength of bracing wall
Wind load = w * length of building = 3.5 * 22 = 77 kN
Total length of bracing wall panel required = 77/4.9 = 15.7 m ≈ 16 m
W1 = 3 m → 3 * 4.9 kN/m = 14.7 kN
W2 = 4 m → 4 * 4.9 kN/m = 19.6 kN
W3 = 5 m → 5 * 4.9 kN/m = 24.5 kN
W4 = 4 m → 4 * 4.9 kN/m = 19.6 kN
Total = 78.4 kN (OK)
7.4.3 Method 2: Deep beam method
Figure 7.15 shows the modelling of a diaphragm using the deep beam model. The
equivalent stiffness of the diaphragm and bracing walls are provided in Tables 7.2 and
7.3 respectively.
Figure 7.15: Diaphragm model using deep beam element
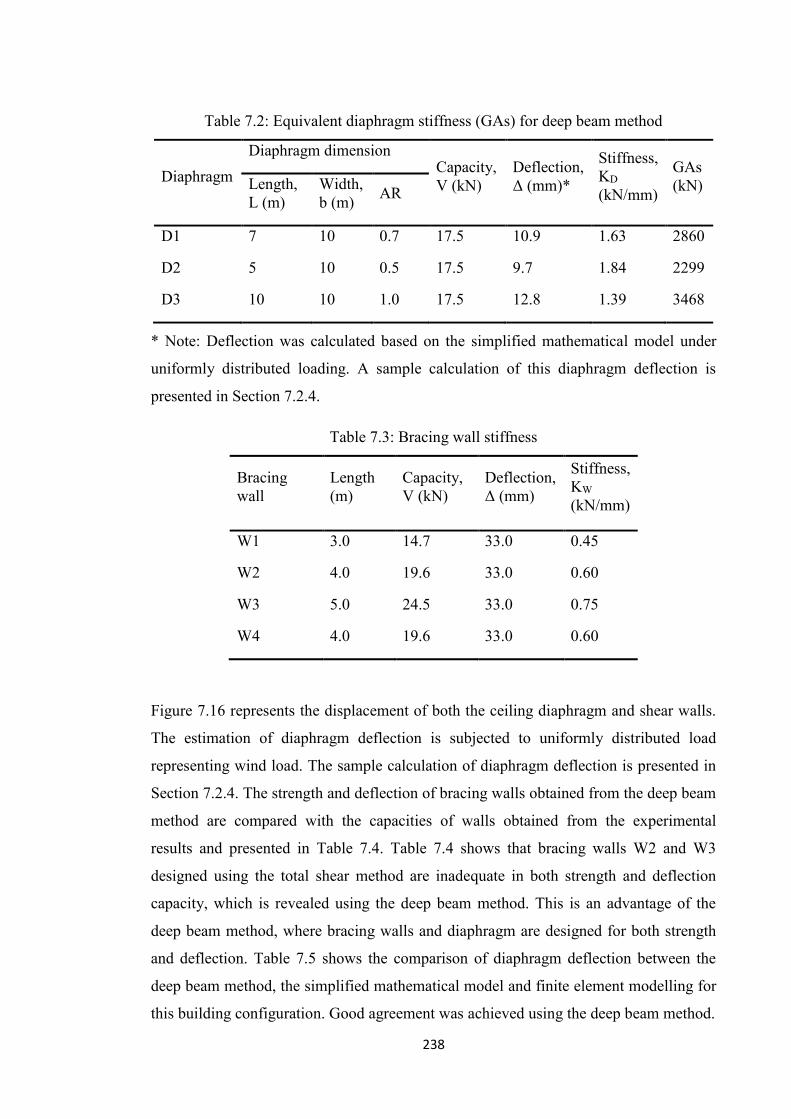
238
Table 7.2: Equivalent diaphragm stiffness (GAs) for deep beam method
Diaphragm Diaphragm dimension
Capacity, V (kN)
Deflection, Δ (mm)*
Stiffness, KD (kN/mm)
GAs (kN) Length,
L (m) Width, b (m) AR
D1 7 10 0.7 17.5 10.9 1.63 2860
D2 5 10 0.5 17.5 9.7 1.84 2299
D3 10 10 1.0 17.5 12.8 1.39 3468
* Note: Deflection was calculated based on the simplified mathematical model under
uniformly distributed loading. A sample calculation of this diaphragm deflection is
presented in Section 7.2.4.
Table 7.3: Bracing wall stiffness
Bracing wall
Length (m)
Capacity, V (kN)
Deflection, Δ (mm)
Stiffness, KW (kN/mm)
W1 3.0 14.7 33.0 0.45
W2 4.0 19.6 33.0 0.60
W3 5.0 24.5 33.0 0.75
W4 4.0 19.6 33.0 0.60
Figure 7.16 represents the displacement of both the ceiling diaphragm and shear walls.
The estimation of diaphragm deflection is subjected to uniformly distributed load
representing wind load. The sample calculation of diaphragm deflection is presented in
Section 7.2.4. The strength and deflection of bracing walls obtained from the deep beam
method are compared with the capacities of walls obtained from the experimental
results and presented in Table 7.4. Table 7.4 shows that bracing walls W2 and W3
designed using the total shear method are inadequate in both strength and deflection
capacity, which is revealed using the deep beam method. This is an advantage of the
deep beam method, where bracing walls and diaphragm are designed for both strength
and deflection. Table 7.5 shows the comparison of diaphragm deflection between the
deep beam method, the simplified mathematical model and finite element modelling for
this building configuration. Good agreement was achieved using the deep beam method.
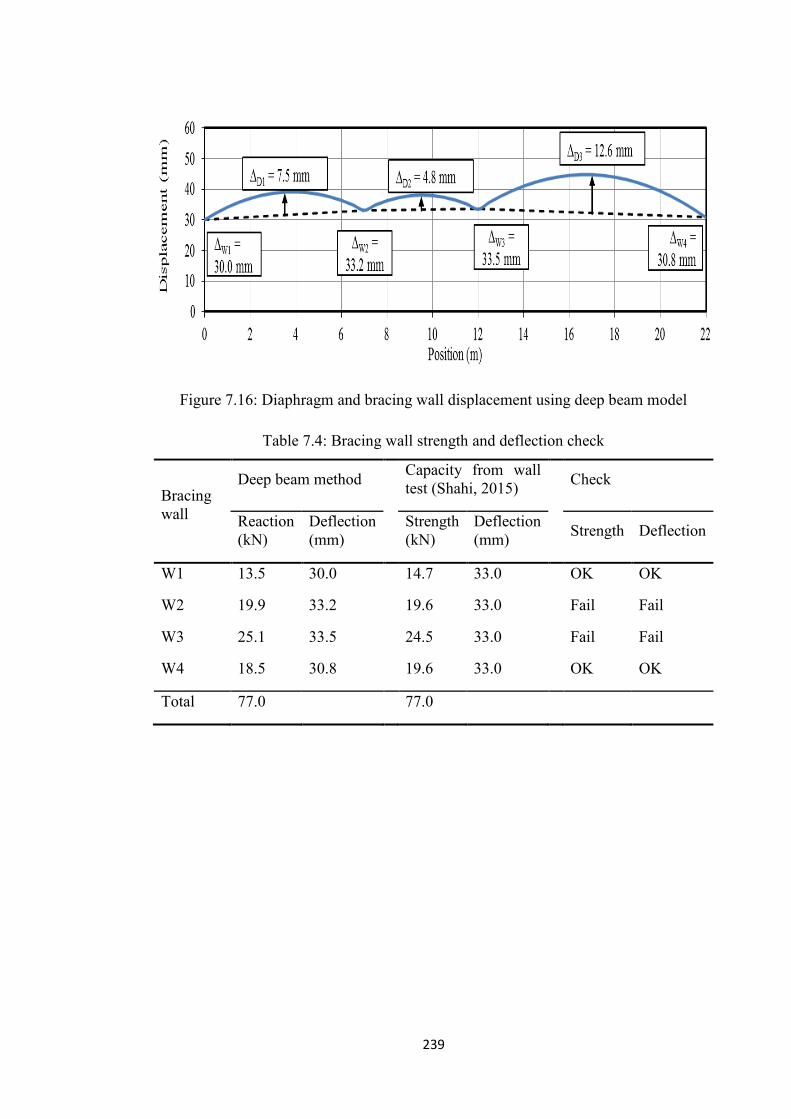
239
Figure 7.16: Diaphragm and bracing wall displacement using deep beam model
Table 7.4: Bracing wall strength and deflection check
Bracing wall
Deep beam method Capacity from wall test (Shahi, 2015) Check
Reaction (kN)
Deflection (mm) Strength
(kN) Deflection (mm) Strength Deflection
W1 13.5 30.0 14.7 33.0 OK OK
W2 19.9 33.2 19.6 33.0 Fail Fail
W3 25.1 33.5 24.5 33.0 Fail Fail
W4 18.5 30.8 19.6 33.0 OK OK
Total 77.0 77.0

240
Table 7.5: Diaphragm deflection check
Diaphragm
Diaphragm deflection (mm)
Comments Deep beam method
Simplified mathematical
model*
Finite Element model**
D1 7.5 10.9 12.4
OK as deep beam model provides less deflection value. It occurs because to D1 is loaded in deep beam method with load less than ultimate load.
D2 4.8 9.7 11.2
OK as deep beam model provides less deflection value. It occurs because D2 is loaded in deep beam method with load less than ultimate load.
D3 12.6 12.8 14.4
OK as deep beam model provides similar deflection value. It happened as D3 is loaded in deep beam method with ultimate load.
* Note: The simplified mathematical model is based on the diaphragm deflection
formula under uniformly distributed loading. A sample calculation of this diaphragm
deflection is presented in Section 7.2.4.
** Diaphragm deflection from finite element model was shown in Section 6.6 of
Chapter 6.
7.4.4 Method 3: Plate method
The plate element model was developed using commercial software Strand7. In this
method, the diaphragm is modelled using plate elements of equivalent shear stiffness
(Gts) and high values of bending stiffness (EI). Bracing walls are modelled as linear
springs of equivalent stiffness (secant stiffness), as shown in Figure 7.17.
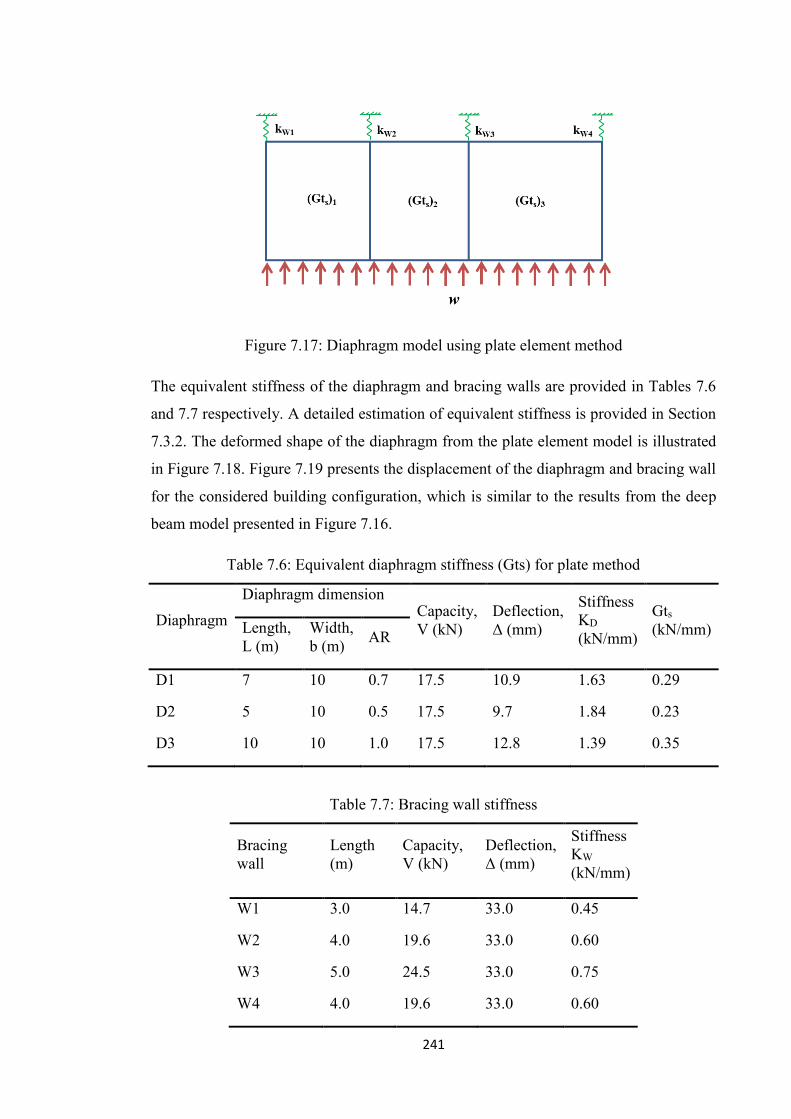
241
Figure 7.17: Diaphragm model using plate element method
The equivalent stiffness of the diaphragm and bracing walls are provided in Tables 7.6
and 7.7 respectively. A detailed estimation of equivalent stiffness is provided in Section
7.3.2. The deformed shape of the diaphragm from the plate element model is illustrated
in Figure 7.18. Figure 7.19 presents the displacement of the diaphragm and bracing wall
for the considered building configuration, which is similar to the results from the deep
beam model presented in Figure 7.16.
Table 7.6: Equivalent diaphragm stiffness (Gts) for plate method
Diaphragm Diaphragm dimension
Capacity, V (kN)
Deflection, Δ (mm)
Stiffness KD (kN/mm)
Gts (kN/mm) Length,
L (m) Width, b (m) AR
D1 7 10 0.7 17.5 10.9 1.63 0.29
D2 5 10 0.5 17.5 9.7 1.84 0.23
D3 10 10 1.0 17.5 12.8 1.39 0.35
Table 7.7: Bracing wall stiffness
Bracing wall
Length (m)
Capacity, V (kN)
Deflection, Δ (mm)
Stiffness KW (kN/mm)
W1 3.0 14.7 33.0 0.45
W2 4.0 19.6 33.0 0.60
W3 5.0 24.5 33.0 0.75
W4 4.0 19.6 33.0 0.60

242
Figure 7.18: Diaphragm deformed shape from plate element model
Figure 7.19: Diaphragm and bracing wall displacement
Table 7.8 illustrates a comparison of the strength and deflection of bracing walls based
on the experimental test results and the plate element model. Table 7.8 shows that
bracing walls W2 and W3 designed using the total shear method are inadequate in both
strength and stiffness capacity, which is revealed by the plate element method. Table 7.9
shows the comparison of estimated diaphragm deflection between the plate element
method, the simplified mathematical model and finite element modelling for this
configuration of the house. Good agreement was obtained using the plate element
model.
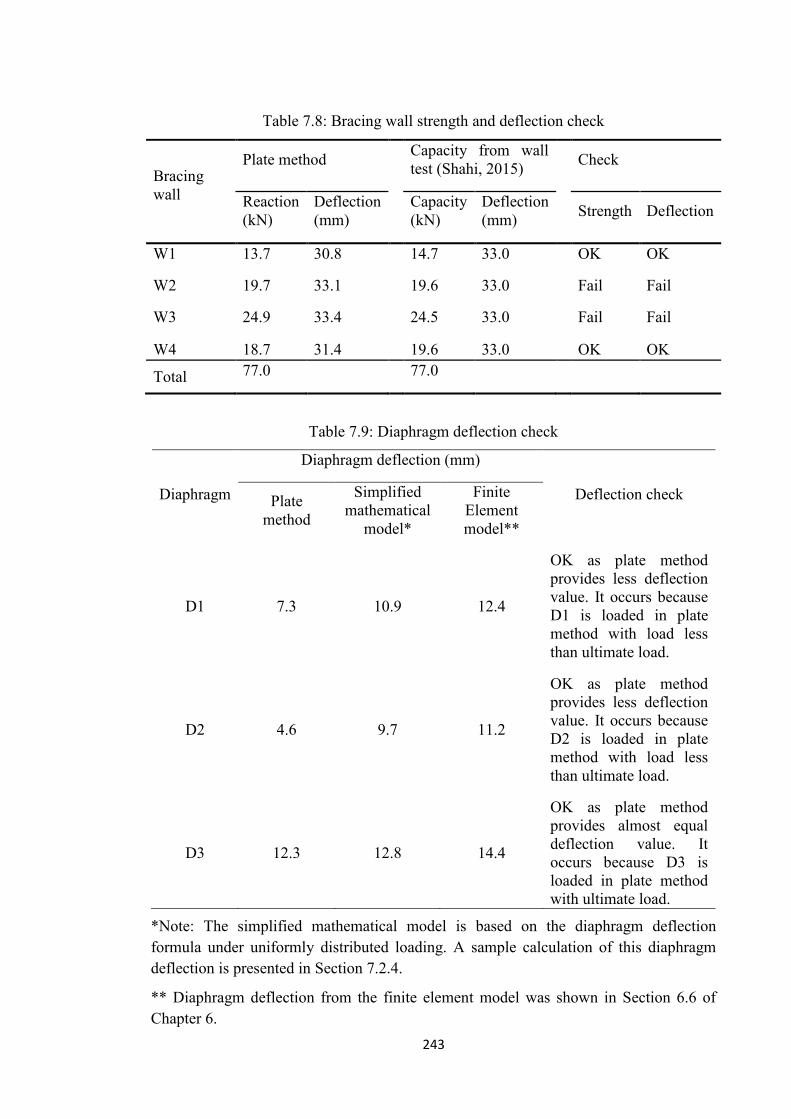
243
Table 7.8: Bracing wall strength and deflection check
Bracing wall
Plate method Capacity from wall test (Shahi, 2015) Check
Reaction (kN)
Deflection (mm) Capacity
(kN) Deflection (mm) Strength Deflection
W1 13.7 30.8 14.7 33.0 OK OK
W2 19.7 33.1 19.6 33.0 Fail Fail
W3 24.9 33.4 24.5 33.0 Fail Fail
W4 18.7 31.4 19.6 33.0 OK OK
Total 77.0 77.0
Table 7.9: Diaphragm deflection check
Diaphragm
Diaphragm deflection (mm)
Deflection check Plate method
Simplified mathematical
model*
Finite Element model**
D1 7.3 10.9 12.4
OK as plate method provides less deflection value. It occurs because D1 is loaded in plate method with load less than ultimate load.
D2 4.6 9.7 11.2
OK as plate method provides less deflection value. It occurs because D2 is loaded in plate method with load less than ultimate load.
D3 12.3 12.8 14.4
OK as plate method provides almost equal deflection value. It occurs because D3 is loaded in plate method with ultimate load.
*Note: The simplified mathematical model is based on the diaphragm deflection formula under uniformly distributed loading. A sample calculation of this diaphragm deflection is presented in Section 7.2.4.
** Diaphragm deflection from the finite element model was shown in Section 6.6 of Chapter 6.

244
7.4.5 Diaphragm load distribution
In this section, five load distribution methods were used for distributing lateral loads
from the diaphragm to the bracing walls: the deep beam method, the plate element
method, the tributary area method, the relative stiffness method, and the relative
stiffness with torsion method. Figure 7.20 shows the comparison of the distribution of
lateral load to the four bracing walls (as specified in Figure 7.13 in Section 7.4) through
ceiling diaphragms.
Figure 7.20: Diaphragm load distribution to bracing walls
From Figure 7.20 it can be seen that there is little variation in the results from all the
methods mentioned above. This is because the selected case study does not represent
some extreme conditions. However, this variation is reasonable, as the methods studied
here cover a variety of complexities and are based on different principal assumptions
about the load distribution on the structures. There is significant variation in the
calculated wall forces for the most common methods (i.e. tributary area method) in
comparison to the other methods. It should be noted that all of the lateral load
distribution approaches, with the exception of the tributary area and total shear methods,
necessitate the estimation of the characteristics of the wall stiffness. As the load

245
distribution methods are highly sensitive to the wall stiffness, it is essential to the
accurate estimation of the stiffness of walls.
The estimation of the stiffness of the wall and ceiling diaphragms was accomplished
based on the experimental testing and finite element modelling. The FE models
generated load-deflection curves under monotonic loading, based exclusively on the
properties of the materials and the individual properties of the sheathing-to-framing
connections. Based on this specific case study, it can be stated that the plate method
provides a good distribution of shear wall reactions compared with the deep beam
model. The next most precise approaches seem to be the relative stiffness method
followed by the other load distribution methods. From Figure 7.20, it can be observed
that the tributary area method is the least satisfactory approach, although this method is
presently recognized as one of the most common methods used by design engineers
because of its simplicity. It can also be concluded that the methods based on the
assumption of rigid horizontal diaphragm action provide the best results. Of the load
distribution methods described above, the deep beam method and the relative stiffness
method are the most practical, as these methods provide satisfactory precision without
using sophisticated computer modelling. However, the relative stiffness method may
not be a suitable approach when the contribution of the transverse wall to the lateral
load distribution is considerable, or when the ceiling and roof diaphragm are more
flexible than the shear walls.
7.5 Design Charts for Industrial Applications
Tests and finite element modelling were performed to obtain information about the
design strength on a wide range of ceiling systems presently used in Australia. Tests and
FE modelling were also performed to investigate the process by which diaphragm
construction systems can be improved with a view to the establishment of a more
rational method of steel-framed house construction.
In the Australian Standard AS 4055:2010, winds are classified as non-cyclonic (regions
A and B) and cyclonic (regions C and D). For each location, the wind speed is provided
for both ultimate and serviceability limit states design.
Design charts can be prepared to provide the maximum spacing of bracing walls for
different categories of wind for non-cyclonic regions (N1 to N6) and for cyclonic

246
regions (C1 to C4), classified in accordance with AS 4055:2010. Wind pressures also
depend on the roof geometry and the direction of the wind relative to the orientation of
certain roof shapes. The wind forces also depend on the tributary area. Roof geometrics
include gable ends (shown in Figure 7.21(a), hip ends (shown in Figure 7.21(b) and at
right angles to building length in hip- or gable-end buildings, as shown in Figure
7.21(c)).
(a) Wind force to be resisted by gable ends
(b) Wind force to be resisted by hip ends

247
(c) Wind force to be resisted at right angles to building length (hip or gable end
buildings)
Figure 7.21: Configurations of wind load to be resisted by various types of buildings
Figure 7.22 shows a graphical representation of the maximum spacing of bracing walls
with respect to the ceiling depth for wind class N3/C1 based on both strength and
serviceability limit states for roof pitches 5° to 35°. It should be noted that most houses
in Australia have roof pitches between 15° to 25°. This design chart was prepared on the
basis of the results of the ceiling diaphragm tests (described in Chapter 5) and
parametric studies from finite element model results (described in Chapter 6). A sample
calculation for estimating the maximum bracing wall spacing for the wind along the
long direction of a building located in the N3/C1 region is presented is Section 7.4.1.
From Figure 7.22, it is clear that the maximum spacing of the bracing wall decreases
with the increase of the roof pitch. From a practical point of view, there is a 10 mm gap
between the ceiling diaphragm and the end walls. The gap between the plasterboard and
end walls closes when relative movement occurs and the flanges of the top plates of the
end walls bear against the plasterboard edges. This finally leads to the bearing of the
plasterboard edges at the both corners of the diaphragm. As described in Chapter 6
based on parametric studies, the strength and stiffness of the ceiling diaphragm
increased due to the plasterboard bearing on the top plates of the end walls. These
effects are significant up to a ceiling depth of 7 m. Moreover, there is no significant

248
variation of the strength and stiffness of the diaphragm due to these considerations for
ceiling depths greater than 7 m. Therefore, these issues were considered in the
preparation of the design chart and a kink in the curves is observed at 7 m. Therefore,
the design chart was prepared based on the capacity of the ceiling diaphragm of 2 kN/m
for ceiling depths up to 7 m; however, 1.8 kN/m capacities is considered for ceiling
depth between 7 m and 16 m. The serviceability limit state was considered on the
maximum deflection limit of L/250 in the preparation of this design chart.
In a house/structure, wind can occur from any direction, and this chart was therefore
prepared based on the critical wind-loading conditions. As an example, for single-storey
houses or the upper storey of two-storey buildings, the maximum spacing between
designated bracing walls for each wind loading direction (i.e. at right angles to the
building length and width) can be obtained from Figure 7.22 for the wind category
N3/C1.
Figure 7.22: Maximum bracing wall spacing for wind class N3/C1
These recommendations are provided for diaphragms loaded parallel to the bottom
chord members. However, loading perpendicular to the bottom chords provides greater

249
shear strength, as observed in the parametric studies in the finite element models
presented in Chapter 6. Therefore, the wind loading parallel to the bottom chords is
critical for the design to be considered safe.
7.6 Summary and Conclusions
This chapter has provided a wide-ranging summary of the procedures for the estimation
of the deflection of plasterboard-sheathed steel-framed ceiling diaphragms. The capacity
of ceiling diaphragms to transfer lateral loads to the bracing walls by diaphragm action
is also illustrated in this chapter. This chapter has also highlighted some limitations in
the design of residential structures in relation to the distribution of lateral loads from the
ceiling and roof to the bracing walls. While the current practice in Australia is simple
and only requires the total sum of wall racking capacities to equal or exceed the total
lateral load, this is only applicable if the spacing between bracing walls is within certain
limits (e.g. AS 1684). In contemporary and architecturally designed houses, the spacing
between bracing walls may exceed the nominal limits with no further guidance given to
the design engineer. The findings from this chapter are summarised as follows:
A simplified mathematical model was developed for determining the deflection
and hence, the stiffness of typical plasterboard-sheathed steel-framed ceiling
diaphragm used in Australia. The model was verified against the experimental
results as well as the finite element model results and found to be in good
agreement. Hence, the deflection of plasterboard-sheathed steel-framed ceiling
diaphragms can be estimated using the new developed model.
A case study was presented for a house to show the distribution of lateral loads
from the plasterboard-clad steel- framed ceiling diaphragms to fibre cement-clad
shear walls. It was shown that the ceiling diaphragm can be accurately
represented by a deep beam or a plate. The equivalent properties of the deep
beam or plate can be determined using a procedure presented in this chapter.
Based on strength and serviceability limit states, the maximum spacing of
bracing walls with respect to the ceiling depth for wind class N3/C1 was
developed. However, similar design charts can be prepared to provide the
maximum spacing of bracing walls under different wind categories in non-
cyclonic regions (N1 to N6) and cyclonic regions (C1 to C4).
250
CHAPTER 8
CONCLUSIONS AND RECOMMENDATIONS
8.1 Conclusions
This research reported here involved a detailed literature review, a comprehensive
experimental program and extensive analytical modelling. The experimental program
was based on a typical ceiling framing system. The overall aim of this research is to
quantify the strength and stiffness of typical cold-formed steel-framed plasterboard-
lined ceiling diaphragms subjected to monotonic loading to simulate wind-loading
conditions.
The key factors which affect the strength and stiffness of ceiling and roof diaphragms in
Australian steel-framed domestic structures are discussed in the literature review. From
the literature review, the following findings have been obtained:
Many experimental and analytical modelling studies have been conducted on the
determination of the strength and stiffness of shear walls. However, very few
studies have been undertaken on the determination of the strength and stiffness
of ceiling and roof diaphragms in cold-formed steel houses. Determination of
diaphragm stiffness is essential in the design of light-framed structures, in order
to distribute the lateral loads from the ceiling and roof to the walls.
A key factor which affects the strength and stiffness of lined or clad light frames
is the fixity between the lining material and framing. The behaviour of these
connections in shear tends to dictate the behaviour of the entire lined system.
This is true for walls and ceilings.
Since the behaviour of the connections between the plasterboard and the steel framing
members is a major factor in assessing the strength and stiffness of ceiling diaphragms,
it was essential to conduct shear connection tests. Based on the experimental
observations and subsequent analysis of the shear connection tests, the following
conclusions can be drawn:
For all the edge screw shear connection tests, the failure mode for edge
connections was tearing out of the plasterboard from its edge.
251
Field screw shear connections showed plasterboard bearing as well as screw
tilting and head piercing through the plasterboard.
Edge shear connections with 20 mm edge distance achieved approximately 85%
of the ultimate loads of the field screws with the same plasterboard and steel
members.
The ultimate capacity of the plasterboard-to-channel section connection is
approximately 35% higher than that of the plasterboard-to-top hat section for
both field screw and edge screw tests. The initial stiffness of the connection to
the channel section is almost four times that of the connection with the top hat
section. This is due to the greater thickness of the channel sections.
In this thesis, raking/cantilever tests were conducted on three specimens of ceiling
diaphragms. From the results and analyses of the full-scale isolated ceiling diaphragms
in cantilever configuration, the following conclusions can be drawn:
The plasterboard connections failed at the locations where maximum relative
movement between the plasterboard and battens occurred. The failure of screw
connections was in the form of tearing of plasterboard around the screw heads
and pull-through of the plasterboard.
No relative movement was observed between the individual plasterboard sheets.
The entire plasterboard lining rotated as a single unit rather than two
plasterboard sheets rotating individually. No relative displacement was observed
between the ceiling battens and the bottom chords.
There was limited variation (approximately 5.5%) between the results from the
three test specimens, indicating excellent agreement between these test results.
Five full-scale tests were conducted in beam configuration. This set-up is closer to the
real action of a ceiling; however, it is more demanding in terms of testing due to the
larger space and more complex loading and measurement system required. Based on the
results and analyses of the full-scale ceiling diaphragm beam tests, the following
conclusions can be drawn:
The plasterboard connections failed at the locations where maximum relative
movement between the plasterboard and battens occurred. Failure occurred as a
result of tear-out of plasterboard edges at the corners of the specimen. Tear-out
252
of plasterboard edges also occurred at the first three bottom corner screws from
the left and right end of the diaphragm.
The top plates of the end walls supporting the roof trusses provided further
bending resistance to the ceiling diaphragm and also provided bearing area for
the plasterboard ceiling as it translates in the direction of an end wall.
The strength of a diaphragm with boundary conditions (i.e. considering the
effects of plasterboard bearing on top plates) is approximately 20% higher than
the strength of a diaphragm without boundary conditions. However, the stiffness
of the diaphragm with boundary conditions is almost the same as the stiffness of
the diaphragm without boundary conditions.
The stiffness of the diaphragm decreases with the increase of aspect ratio
(length/width ratio). The stiffness of a diaphragm with an aspect ratio of 3.4 is
approximately 35% lower than that of a diaphragm with an aspect ratio of 2.3.
However, the strength does not change significantly due to variation of the
aspect ratio.
No relative displacement was observed between the ceiling battens and the
bottom chords. However, considerable bending of the ceiling battens was
observed.
No relative movement was observed to occur between the individual
plasterboard sheets. The whole cladding system translated as a single unit.
In this thesis, analytical modelling has been conducted using a commercially available
finite element analysis package (ANSYS) in order to amalgamate the experimental test
results and to utilise them to develop analytical models of plasterboard-clad steel-
framed ceiling diaphragms. The following conclusions from the analytical modelling
can be drawn:
The developed FE model was found to be in good agreement with the
experimental cantilever test results. The deflected shape and failure mode
obtained in FE modelling were similar to those observed in the experiment,
where the battens showed significant bending at the bottom of the diaphragm.
The FE model results of ceiling diaphragms in beam configuration were found
to be in very good agreement with the experimental test results.

253
Without end walls, all the racking forces are transferred via shear action through
the screws which connect the plasterboard to the ceiling battens. The failure of
the diaphragm is a result of the failure of these screw connections. All these
screw connections did not fail at the same time but progressively tilted, and
failure at different locations occurred while the diaphragm was being loaded.
The diaphragm without boundary conditions failed due to the combination of
tearing of plasterboard at corner screws at both ends as well as pulling out of
the plasterboard screws located within 900 mm from both ends of the
diaphragm. Failure of the screw connections occurred at the same locations as
those observed during the tests.
The boundary conditions play a role in the performance of plasterboard- clad
ceiling diaphragms. The presence of end walls not only increases the ultimate
capacity of the ceiling, but also increases the displacement at which the ultimate
load occurs. The reason for the enhanced performance is not only the transfer of
the load from the plasterboard screws to the steel frame but also the bearing
action along the plasterboard edges.
The diaphragm with boundary conditions failed due to the combination of
bearing of the plasterboard edge as well as tearing of the plasterboard screws at
both corners and pulling out of the plasterboard screws located within 900 mm
from both ends of the diaphragm. The bearing of the plasterboard edges
occurred at almost the same location as that observed in the experiments.
The deflected shape of the diaphragm obtained from the FE model is similar to
that observed in the experiment, where the ceiling battens showed significant
bending at the ends of the diaphragm. The maximum relative movement
between the plasterboard and frame occurred at both ends of the diaphragm,
which was also observed in the experiments.
There is no variation of strength of ceiling diaphragm due to different testing
methods such as cantilever tests and beam tests. However, the beam test method
provides considerably higher stiffness than the cantilever test method.
The strength of the ceiling diaphragm is similar when it is subjected to different
loading configurations, such as one-third point loading, mid-span loading, and
uniformly-distributed loading. However, uniform loading provides moderately
higher stiffness than one-third point loading and mid-span loading.

254
There is no significant variation of ultimate strength due to changes of length.
However, the stiffness decreases with the increase of the ceiling length (i.e.
aspect ratio). Longer ceilings (those with high aspect ratios) exhibit greater
flexural deformation. Failure occurs at a larger deflection compared to shorter
ceilings which have their deflection dominated by shear action.
The effect of boundary conditions (i.e. effects of plasterboard bearing on end
walls) becomes less significant with the increase of ceiling width. The boundary
condition provides a significant effect on strength of ceiling diaphragm up to
ceiling width of 7 m. However, there is no significant variation of strength due
to the consideration of the top plate's effect when the ceiling width exceeds 7 m.
Placing the plasterboard screws at close spacing not only provides higher
diaphragm strength and stiffness but also leads to failure at higher
displacements. The strength of the diaphragm can be increased by
approximately 80% by reducing one-third screw spacing along each batten.
The lateral performance of the diaphragm can be improved by the addition of a
limited number of extra screws. The addition of a single screw at the end of
each batten provides approximately 30% higher strength and about 10% higher
initial stiffness. The addition of two screws at the end of each batten provides
about 70% higher strength and approximately 20% higher initial stiffness.
There is a significant impact on the ultimate capacity of the diaphragm due to
changes in the gap size between the plasterboard and end walls. The ultimate
capacity of a ceiling increases with the decrease of the gap size. The ultimate
capacity of a ceiling with no gap is approximately 30% higher than that of a
ceiling with a 10 mm gap.
There is a considerable effect on strength and stiffness of the diaphragm due to
increased batten spacing from 450 mm to 600 mm. The capacity of a ceiling
with 450 mm spacing is about 20% higher than that of a ceiling with 600 mm
batten spacing.
Since the strength and stiffness of the diaphragm are mainly dependent on the
number of plasterboard screws, and the plasterboard screws are fixed along the
ceiling batten not to the bottom chords, the reduction of bottom chord spacing
does not affect significantly to the strength and stiffness of the diaphragm.

255
The strength and stiffness of the ceiling diaphragm in loading applied parallel to
the ceiling battens is significantly higher than that for loading applied along the
bottom chord members. This is attributed in part to the observed higher strength
and stiffness of the frame when loading is applied parallel to the battens. In
addition, the direct resisting connections are comparatively much higher
number when diaphragm loading along ceiling battens compared to loading
along bottom chord members. Therefore, the diaphragm capacity in loading
parallel to the bottom chord is the critical state.
Ceiling diaphragms are sensitive to the plasterboard screw connections with the
thickness of the steel members connected to the plasterboard. When the
plasterboard is connected to 0.75 mm BMT ceiling battens, it provides
significantly higher (approximately 90%) capacity and higher stiffness (about
70%) compared to plasterboard connecting to 0.42 mm BMT top-hat batten
sections.
The IBC formula for predicting a diaphragm deflection is based on deformation of
standard 1.2 m x 2.4 m (4 ft x 8 ft) plywood sheets which act independently. However,
in the case of plasterboard-clad ceiling diaphragms, all the sheets are joined together
and they act as one panel. Therefore, it is essential to modify the IBC formula and
update it for plasterboard-clad ceiling diaphragms. The findings from this work are as
follows:
A simplified mathematical model was developed for determining the deflection
and hence, the stiffness of typical plasterboard-sheathed steel-framed ceiling
diaphragm used in Australia. The model was verified against the experimental
results as well as the finite element model results and found to be in good
agreement. Hence, the deflection of plasterboard-sheathed steel-framed ceiling
diaphragms can be estimated using the new developed model.
A case study was presented for a house to show the distribution of lateral loads
from the plasterboard-clad steel- framed ceiling diaphragms to fibre cement-clad
shear walls. It was shown that the ceiling diaphragm can be accurately
represented by a deep beam or a plate. The equivalent properties of the deep
beam or plate can be determined using a procedure presented in Chapter 7.

256
Based on both strength and serviceability limit states, a typical design chart was
prepared for the maximum spacing of bracing walls for single storey or the
upper storey of two-storey buildings in Australia. The limits of the spacing of
the bracing walls in cold-formed steel-framed structures are subject to the use of
plasterboard or other cladding materials of equivalent strength and stiffness
strongly fixed to battens which are in turn firmly fixed to the ceiling or roof
structure.
8.2 Recommendations for Future Research
This research has examined the performance of plasterboard-clad steel-framed ceiling
diaphragms subjected to lateral loading. However, some areas remain where further
work is required. The recommendations from this research are as follows:
All test specimens in this thesis were subjected to monotonic load only. Hence,
diaphragm tests should be conducted under cyclic loadings, which would also
cover seismic actions.
This research was subjected to monotonic load only. There was no inclusion of
the effects of uplift pressure considered in this study. Hence, it is recommended
to perform diaphragms tests that are subjected to both lateral loads and uplift
loads; and compare it with the performance of diaphragms by considering lateral
loads only.
In this research, tests were conducted on single-span ceiling diaphragms only.
Therefore, it is recommended to perform tests on continuous diaphragms to
further validate the developed FE and mathematical models.
There were no openings in the tested diaphragms. Therefore, evaluation of
diaphragm performance with the consideration of openings using tests as well as
analytical models is recommended.
In this thesis, all diaphragms tests were performed on screw-fixed plasterboard.
Therefore, it is important for future research to observe the effects of the use of a
combination of both adhesives and screws on diaphragm strength and stiffness
and failure mechanisms.

257
References
Anderson, G.A. (1990). ‘What affects the strength and stiffness of diaphragms?’ ASAE Paper No. 90-4028, ASABE, St. Joseph, Mich.
Anderson, G.A. (1987), ‘Evaluation of a light-gage metal diaphragm behavior and the diaphragm interaction with post frames’, PhD thesis, Iowa State University, Ames, Iowa.
Adham, S.A., Avanessian, V., Hart, G.C., Anderson, R.W., Elmlinger, J. and Gregory (1990). ‘Shear wall resistance of light gauge steel stud wall system’, Earthquake, Vol. 6, No. l, pp. l-14.
Applied Technology Council (ATC) (1981). ‘Design of horizontal wood diaphragms’, Workshop Proceedings, 10-12 December, Berkeley, California.
ASTM D1761-12 (2012). ‘Standard test methods for mechanical fasteners in wood’, Annual Book of Standards, Vol. 4. No. 10, West Conshohocken, PA.
ASTM E455-04 (2004). ‘Standard test method for static load testing of framed floor or roof diaphragm constructions for buildings’, Annual Book of Standards, West Conshohocken, PA.
Atherton, G.H. (1981). ‘Strength and stiffness of structural particleboard diaphragms’, Project Report 818-151A, Forest Research Laboratory, Oregon State University, Corvallis, Oreg.
Australian Bureau of Statistics (ABS) (2008a). ‘1350.0-Australian Economic Indicators’, ACT, Australia
Australian Bureau of Statistics (ABS) (2008b). ‘8752.0- Building Activity’ ACT, Australia
Australian Institute of Steel Construction (AISC) (1991). ‘Structural performance requirements for Domestic Steel Framing’, National Association of Steel-Framed Housing (NASH).
Barton, A.D. (1997). ‘Performance of steel framed domestic structures subjected to earthquake loads’, PhD thesis, Department of Civil and Environmental Engineer, University of Melbourne, Australia.
Bott, J.W. (2005). ‘Horizontal stiffness of wood diaphragms’, MSc thesis, Virginia Polytechnic Institute and State University, Blacksburg, Virginia
Boughton, G.N. (1988). ‘Full scale structural testing of houses under cyclonic wind loads’, Proceeding of International Conference on Timber Engineering, Forest Products Research Society, Madison, pp. 82-88.
258
Boughton, G.N. and Reardon, G.F. (1982). ‘Simulated wind tests on a house: part-I description’, Technical report No. 12, Cyclone Testing Station, James Cook University, Townsville, Australia.
Boughton, G.N. and Reardon, G.F. (1984), ‘Simulated wind test on the Tongan hurricane house’, Technical Report No. 23, Cyclone Testing Station, James Cook University, Townsville, Australia.
Boughton, G.N. (1984). ‘Simulated high winds tests on a timber framed house’, The Engineering Conference, Brisbane, 2-6 April.
Boughton, G.N. and Reardon, G.F. (1984), ‘Structural damage caused by Cyclone Kathy at Borroloola, N.T.’, Technical Report No. 21, Cyclone Testing Station, James Cook University, Townsville, Australia.
Boughton, G. and Falck, D. (2007). ‘Tropical Cyclone George damage to buildings in the port Hedland area’, Technical Report No. 52, Cyclone Testing Station, James Cook University, Townsville, Australia.
Boughton, G.N., Henderson, D.J., Ginger, J.D., Holmes, J.D., Walker, G.R., Leitch, C.J., Somerville, L.R., Frye U., Jayasinghe, N.C. and Kim, P.Y. (2011). ‘Tropical Cyclone Yasi: structural damage to buildings’, Technical Report No. 57, Cyclone Testing Station, James Cook University, Tonsville.
Breyer, D.E., Kenneth, J.F., Kelly, E.C. and David G.P. (2007). ‘Design of wood structures-ASD/LRFD’, Sixth edition, McGraw-Hill.
Breyer, D.A. (1988). ‘Design of wood structures’, 2nd Ed., Mcgraw-Hill, New York.
Carradine, D.M., Woeste, F.E., Dolan, J.D. and Loferski, J.R. (2002). ‘Utilizing diaphragm action for wind load design of timber frame and structural insulated panel buildings’, Forest Products Journal, Vol.54. No 5.
Cobeen, K. (1997). ‘Seismic design of low-rise light-frame wood buildings-State-of-the-practice and future directions’, Earthquake performance and safety of timber structures, G. C. Foliente, ed., Forest Products Society, Madison, pp. 24–35.
Collins, M., Kasal, B., Paevere, P. and Foliente, G.C. (2005). ‘Three-dimensional model of light frame wood buildings. II: Experimental investigation and validation of analytical model’, Journal of Structural Engineering, Vol. 131, No. 4.
Davies, J.M. and Bryan, E.R. (1982). ‘Manual of stressed skin diaphragm design’, Granada Publishing, New York.
Easley, J.T. (1977). ‘Strength and stiffness of corrugated metal shear diaphragms’, Journal of Structural Division, ASCE Proceedings, Vol. 103.
259
Falk, R.H. and Itani, R.Y. (1989). ‘Finite element modeling of wood diaphragms’, Journal of Structural Engineering, Vol. 115, No. 3, pp. 543-559.
Falk, R.H. and Itani R.Y. (1987). ‘Dynamic characteristics of wood and gypsum diaphragms’, Journal of Structural Engineering, Vol. 113, No. 6.
Federal Emergency Management Agency (1997), ‘NEHRP guidelines for the seismic rehabilitation of buildings’, FEMA-273, Washington, October.
Filiatrault, A., Christovasilis, L.P., Wanitkorkul, A. and Lindt, J.W.V. (2010). ‘Experimental seismic response of a full-scale light-frame wood building’, Journal of Structural Engineering, Vol. 136, No. 3.
Filiatrault, A., Fischer, D., Folz, B. and Uang, C. (2004). ‘Shake table testing of a full-scale two-storey wood frame house’, Journal of Structural Engineering, Vol. 50, No. 5
Fischer, D., Filiatrault, A., Folz, B., Uang, C.M. and Seible, F. (2001). ‘Shake table tests of a two-storey wood frame house’, CUREE Publication No. 6, CUREE, Richmond, California.
Foliente, G.C. (1998). ‘Design of timber structures subject to extreme loads’, Progressive Structural Engineering Materials, Vol. 1, No. 3, pp. 236–44
Foliente, G.C. (1995a). ‘Hysteresis modelling off wood joints and structural systems’, Journal of Structural Engineering, ASCE, Vol. 121, No. 6, 1013-1022.
Foliente, GC (1995b). ‘Earthquake performance of light-frame wood and wood-based buildings: state-of-the-art and research needs’, Proceedings, Pacific Conference on Earthquake Engineering, Melbourne, Australia, 20-22 November, pp. 333-342.
Florida Building code commentary (2007). ‘Structural design’.
Foschi, R.O. (1977), ‘Analysis of wood diaphragms and trusses: Part I, diaphragms’, Canadian Journal of Civil Engineering, Vol. 4, No.3, pp. 345-352.
Gad, E.F. (1997). ‘The response of brick veneer, steel-framed domestic structures under dynamic loading’, PhD thesis, Department of Civil and Environmental Engineering, The University of Melbourne, Australia.
Gad, E.F., Duffield, C.F., Hutchinson, G.L., Mansell, D.S. and Stark, G. (1999). ‘Lateral performance of cold-formed steel-framed domestic structures’, Engineering Structures, Vol. 21, pp. 83–95
Gebremedhin, K.G. (2007). ‘Design and construction practices that affect diaphragm strength and stiffness of post-frame buildings’, Practice Periodical on Structural Design and Construction, Vol. 12, No. 3.
Ge, Y.Z. (1991). ‘Response of wood-frame houses to lateral loads’, MSc thesis, University of Missouri, Columbia, Mo.

260
Golledge, B., Clayton, T. and Reardon, G. (1990). ‘Raking performance of plasterboard clad steel stud walls’, BHP & Lysaght Building Industries Technical Report.
Gyprock (2010). ‘Residential Installation Guide Including Wet Area Systems’, (http://www.gyprock.com.au/Documents/GYPROCK-547-Residential_Installation_Guide-201111.pdf)
Gyprock (2008), ‘Ceiling Systems Installation Guide’, (http://www.gyprock.com.au/Documents/GYPROCK-570-Ceilings_Systems-200806.pdf)
Hancock, G.J. (1994). ‘Cold-formed steel structures’, Australian Institute of Steel Construction, North Sydney, NSW, Australia.
Hausmann, C.T. and Esmay, M.L. (1975). ‘Pole barn wind resistance design using diaphragm action’, ASAE Paper No. 75-4035, ASABE, St. Joseph, Mich.
Henderson, D. and Leitch, C. (2005). ‘Damage investigation of buildings at Minjilang, Cape Don and Smith Point in NT following Cyclone Ingrid’, Technical Report No. 50, Cyclone Testing Station, James Cook University, Townsville.
Henderson, D., Ginger, J., Leitch, C., Boughton, G. and Falck, D. (2006). ‘Tropical cyclone Larry: damage to buildings in the Innisfail area’, Technical Report No. 51, Cyclone Testing Station, James Cook University, Townsville.
International Building Code (IBC) (2006). Final draft, International Code Council, Birmingham.
Itani, R.Y. and Cheung, C.K. (1984). ‘Nonlinear analysis of sheathed wood diaphragms’, Journal of Structural Engineering, Vol. 110, No. 9, pp. 2137-2147.
James, G.W. and Bryant, A.H. (1984). ‘Plywood diaphragms and shear walls’, Proceedings of Pacific Timber Engineering Conference, Auckland, New Zealand, May.
Judd, J.P. (2005). ‘Analytical modeling of wood-frame shear walls and diaphragms’, MSc thesis, Department of Civil and Environmental Engineering, Brigham Young University
Kasal B., Collins M.S., Paevere, P. and Foliente, G.C. (2004). ‘Design models of light frame wood buildings under lateral loads’, Journal of Structural Engineering, Vol. 130, No. 8.
Kasal, B., Leichti, R.J. and Itani, R.Y. (1994). ‘Nonlinear finite-element model of complete light-frame wood structure’, Journal of Structural Engineering, Vol. 120, No. 1, pp. 100–119.
Kasal, B. and Leichti, R.J. (1992). ‘Incorporating load sharing in shear wall design of light-frame structures’, Journal of Structural Engineering, Vol. 118, No. 12, pp. 3350– 3361.
261
Kataoka, Y. (1989). ‘Application of supercomputers to nonlinear analysis of wooden frame structures stiffened by shear diaphragms’, Proceeding of2nd Pacific Timber Engineering Conference, Vol. 2, University of Auckland, Auckland, New Zealand, pp. 107-112.
Klingner, R.E. (2010). ‘Masonry Structural Design”, McGraw Hill Publication.
Kunnath, S.K., Mehrain, M. and Gates, W.E. (1994). ‘Seismic damage-control design of gypsum-roof diaphragms’, Journal of Structural Engineering, Vol. 120, No. 1.
Liew, Y.L. (2003). ‘Plasterboard as a bracing material: From quality control to wall performance’, PhD thesis, Department of Civil and Environmental Engineering, The University of Melbourne.
Luttrell, L.D. (1991). ‘Diaphragm Design Manual’, 2nd ed., Steel Deck Institute, Inc., Canton, Ohio
Luttrell, L.D. (1988). ‘Shear diaphragm strength’, Proceedings of the National Steel Construction Conference, American Institute of Steel Construction, June.
Mastrogiuseppea, Rogersa C.A., Tremblayb, R. and Nedisanb, C.D. (2008). ‘Influence of non-structural components on roof diaphragm stiffness and fundamental periods of single-storey steel buildings’, Journal of Constructional Steel Research, Vol. 64, pp. 214–227
Miller, T.H. and Pekoz, T. (1994). ‘Behavior of gypsum-sheathed cold-formed steel wall studs’, Journal of Structural Engineering, Vol. 120, No. 5, pp. 1644–50.
NAHBRC (2000). ‘Residential Structural Design Guide: A State-of-the-Art Review and Application of Engineering Information for Light-Frame Homes, Apartments, and Townhouses’.
National Association of Steel-Framed Housing (NASH) (2014). ‘Residential and Low-rise Steel Framing, Part 2: Design solutions’, Handbook.
National Association of Steel-Framed Housing (NASH) (2011). ‘Residential and Low-rise Steel Framing, Part 1: Design Criteria, Amendment C’, Handbook.
National Association of Steel-Framed Housing (NASH) (2009). ‘Design of residential and low-rise steel framing’, Handbook.
National Association of Steel-Framed Housing (NASH) (2005). ‘Residential and Low-rise Steel Framing, Part 1: Design Criteria’, Handbook.
Niu, K.T. (1996). ‘A semi-empirical three-dimensional stiffness model for metal-clad post-frame buildings’, PhD dissertation, Department of Biological and Environmental Engineering, Cornell University, Ithaca, New York.
262
Ohashi, Y. and Sakamoto, I. (1988). ‘Effect of horizontal diaphragm on behaviour of wooden dwellings subjected to lateral load-experimental study on a real size frame model’, Proceeding of International Conference on Timber Engineering, Forest Products Research Society, Madison, pp. 112-120.
Paevere, P.J., Foliente, G. and Kasal, B. (2003). ‘Load-sharing and redistribution in a one-storey wood frame building’, Journal of Structural Engineering, Vol. 129, No. 9, pp. 1275–1284.
Paevere, P.J. (2001). ‘Full-scale testing, modelling and analysis of light-frame structures under lateral loading’, PhD thesis, Dept. of Civil and Environmental Engineering, The University of Melbourne, Parkville, Victoria, Australia.
Paultre, P., Proulx, J., Ventura, C.E., Tremblay R., Rogers C.A., Lamarche, C.P. and Turek M. (2004). ‘Experimental investigation and dynamic simulations of low-rise steel buildings for efficient seismic design’, 13th World Conference on Earthquake Engineering, August 1-6, Vancouver, Canada.
Phillips, T.L., Itani, R.Y. and McLean, D.I. (1993). ‘Lateral load sharing by diaphragms in wood-framed buildings’, Journal of Structural Engineering, Vol. 119, No. 5, pp. 1556–1571.
Phillips, T.L. (1990). ‘Load sharing characteristics of three-dimensional wood diaphragms’, MS thesis, Washington State University, Pullman, Washington.
Reardon, G.F. and Henderson, D. (1996). ‘An investigation into truss holds down details’, Technical Report No. 44, Cyclone Testing Station, James Cook University, Townsville.
Reardon, G.F. (1990). ‘Simulated cyclone wind loading of a Nu–steel house’, Technical Report No. 36, Cyclone Testing Station, James Cook University, Townsville.
Reardon, G.F. (1989). ‘Effect of cladding on the response of houses to wind forces’, Proceeding of 2nd Pacific Timber Engineering Conference, University of Auckland, Auckland, New Zealand.
Reardon, G.F. (1986). ‘Simulated cyclone wind loading of a brick veneer house’, Technical Report No. 2, Cyclone Testing Station, James Cook University, Townsville.
Reardon, G.F. and Mahenderan, M. (1988). ‘Simulated cyclone wind loading of a Melbourne style brick veneer house’, Technical Report No. 34, Cyclone Testing Station, James Cook University, Townsville.
Reardon, G.F. (1987). ‘The structural response of a brick veneer house to simulated cyclone winds’, First National Structural Engineering Conference, Melbourne, 26-28 August.

263
Reardon, G.F. and Oliver, J. (1982). ‘Report on damage caused by Cyclone Isaac in Tonga’, Technical Report No. 13, Cyclone Testing Station, James Cook University, Townsville.
Reardon, G.F. (1980). ‘Damage in the Pilbara caused by cyclones Amy and Dean’, Technical Report No. 4, Cyclone Testing Station, James Cook University, Townsville.
Saifullah, I., Gad, E., Shahi, R., Wilson, J., Lam N.T.K. and Watson K. (2014), ‘Ceiling diaphragm actions in cold formed steel-framed domestic structures’, ASEC-Structural Engineering in Australasia-World Standard, July 9-11, Auckland, New Zealand.
Saifullah I., Gad E., Wilson J., Lam N.T.K. and Watson K. (2012), ‘Review of diaphragm actions in domestic structures’, Australasian Conference on the Mechanics of Structures and Materials, December 11-14, Sydney, Australia
SASI (Swanson Analysis System Inc.) (2014). ‘ANSYS-Engineering analysis system manuals, Version 12.1’, Houston, Pennsylvania, USA.
Shahi, R. (2015). ‘Performance evaluation of cold-formed steel stud shear walls in seismic conditions’, PhD thesis, Department of Infrastructure Engineering, The University of Melbourne.
Skaggs, T. D. and Martin, Z. A. (2004). ‘Estimating wood structural panel diaphragm and shear wall deflection’, Practice Periodical on Structural Design and Construction, Vol. 9, No. 3, pp. 136–141.
Standards Association of Australia (1996). ‘AS 1538: Cold-formed steel structures Code’.
Standards Association of Australia (1993). ‘AS3623: Domestic framing standard’.
Standards Association of Australia (1992). ‘AS1684: National timber framing code’.
Standards Association of New Zealand (1992). Code of practice for general design and design loading for buildings: NZS 4203, Wellington, New Zealand.
Standards Association of Australia/New Zealand (1998). ‘AS/NZS 2588: Gypsum plasterboard,’
Standards Association of Australia (2010). ‘AS1170: Minimum design load on structures’.
Standards Association of Australia (2010). ‘AS1170.2: Wind Forces’.
Standards Association of Australia (2010). ‘AS1170.4: Minimum design load on structures: Earthquake loads’.
Standards Association of Australia (2010). ‘AS 1720.1: Timber Structures- Design Methods’.
264
Standards Association of Australia/New Zealand (2005). ‘AS/NZS 4600: Cold-formed steel structures,’
Standards Association of Australia (2010). ‘AS 4055: Wind Loads for Housing’.
Standards Association of Australia (2010). ‘AS 1684.2: Residential timber-framed construction - Non-cyclonic areas’.
Standards Association of Australia (2010). ‘AS 1684.3: Residential timber-framed construction - cyclonic areas’,
Stewart, A., Goodman, J., Kliewer, A. and Salsbury, E. (1988). ‘Full-scale tests of manufactured houses under simulated wind loads’, Proceeding of International Conference on Timber Engineering, Forest Products Research Scoiety, Madison, pp. 97-111.
Schmidt, R.J. and Moody, R.C. (1989). ‘Modeling laterally loaded light-frame buildings’, Journal of Structural Engineering, Vol. 115, No. 1, pp. 201–217.
Sugiyama, H., Naoto, A., Takayuki., U., Hirano., S. and Nakamura, N. (1988). ‘Full scale test on a Japanese type of two-storey wooden frame house subjected to lateral load’. Proceeding of International Conference on Timber Engineering, Forest Products Research Society, Madison, pp. 55-61.
Telue, Y.K. (2001). ‘Behaviour and design of plasterboard lined cold-formed steel stud wall systems’, PhD thesis, Queensland University of Technology, Brisbane.
Tissel, J.R. and Elliot, J.R. (2004). ‘Plywood diaphragm’, Research report 138, APA- The Engineered Wood association.
Tremblay, R., Tarek, B. and André, F. (2000). ‘Experimental behaviour of low-rise steel buildings with flexible roof diaphragms’, 12 Wceee, paper no. 2567
Tremblay, R., Martin, E. and Yang, W. (2004). ‘Analysis, testing and design of steel roof deck diaphragms for ductile earthquake resistance’, Journal of Earthquake Engineering, Vol. 8, No. 5, pp. 775-816
Tuomi, R.L. and McCutcheon, W.J. (1978). ‘Racking strength of light-frame nailed walls’, Structural Division, Vol. 104, No. 7, pp. 1131-1140.
Tuomi, R.L. and McCutcheon, W.J. (1974). ‘Testing of a full-scale house under simulated snow loads and wind loads’, Research Report, FLP 234, USDA Forest Service, Madison, 32pp.
Turnbull, J.E., Mcmartin, K.C. and Quaile, A.T. (1982). ‘Structural performance of plywood and steel ceiling diaphragms’, Canadian Agricultural Engineering, Vol. 24, No. 2.

265
Walker, G.R. and Gonano, D. (1983). ‘Investigation of diaphragm action of ceilings’, Progress Report III, Technical Report No. 20, Department of Civil and Systems Engineering, James Cook University, Townsville, Australia.
Walker, G.R., Boughton G.N. and Gonano, D. (1982). ‘Investigation of diaphragm action of ceilings’, Progress Report II, Technical Report No. 15, Department of Civil and Systems Engineering, James Cook University, Townsville, Australia
Walker, G.R. and Gonano, D. (1981). ‘Investigation of diaphragm action of ceilings’, Progress Report I, Technical Report No. 10, Department of Civil and Systems Engineering, James Cook University, Townsville, Australia.
Walker, G.R. (1978). ‘The design of walls in domestic housing to resist wind’. Design for tropical cyclones, Vol 2. James Cook University, Townsville, Australia.
Wang, C.H. and Foliente, G.C. (2006). ‘Seismic reliability of low-rise non-symmetric wood-frame buildings’, Journal of Structural Engineering, ASCE, Vol. 132, No. 5, 733-744.
White, R.N., Hartand, J. and Warshaw, C. (1977). ‘Shear strength and stiffness of aluminum diaphragms in timber-framed buildings’, Research Report No. 370. Department of Structural Engineering, Cornell University, Ithaca, New York.
Williams, R. (1986). ‘Seismic design of timber structures’, Study Group Review Bulletin of the New Zealand National Society of Earthquake Engineering, Vol. 19, No 1, pp. 40-47
Wolfe, R.W. (1982). ‘Contribution of gypsum wallboard to racking resistance of light walls’, Research Report FPL 439, Forest Products Laboratory, United States Department of Agriculture.
Yoon, T.Y. and Gupta, A.K. (1991). ‘Behavior and failure modes of low-rise wood-framed buildings subjected to seismic and wind forces’, PhD thesis, Department of Civil Engineering, North Carolina State University, Raleigh.
Yu, W.W. (2000). ‘Cold-formed steel design’, Third Edition, John Wiley & Sons, Inc. New York.
Yu, W.W. (1991). ‘Cold-formed steel design’, JohnWiley & Sons, New York.