Embed Size (px)
Citation preview
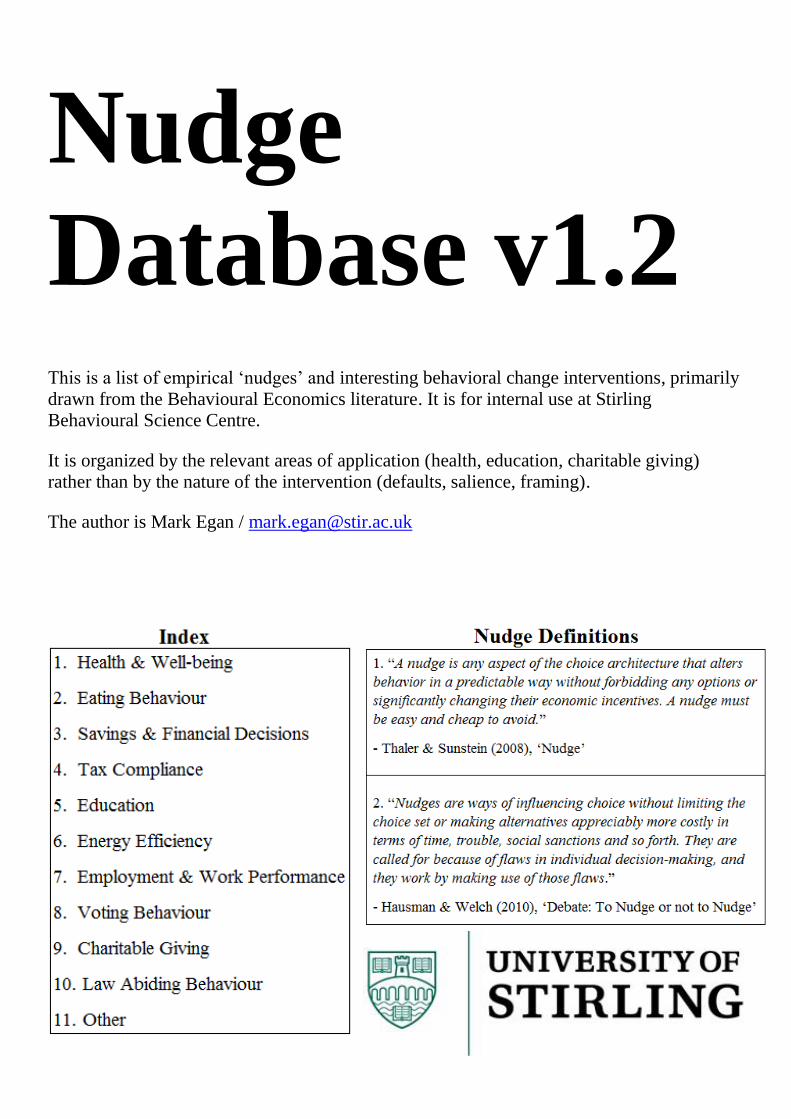
Nudge
Database v1.2
This is a list of empirical ‘nudges’ and interesting behavioral change interventions, primarily
drawn from the Behavioural Economics literature. It is for internal use at Stirling
Behavioural Science Centre.
It is organized by the relevant areas of application (health, education, charitable giving)
rather than by the nature of the intervention (defaults, salience, framing).
The author is Mark Egan / [email protected]
Health & Well-being
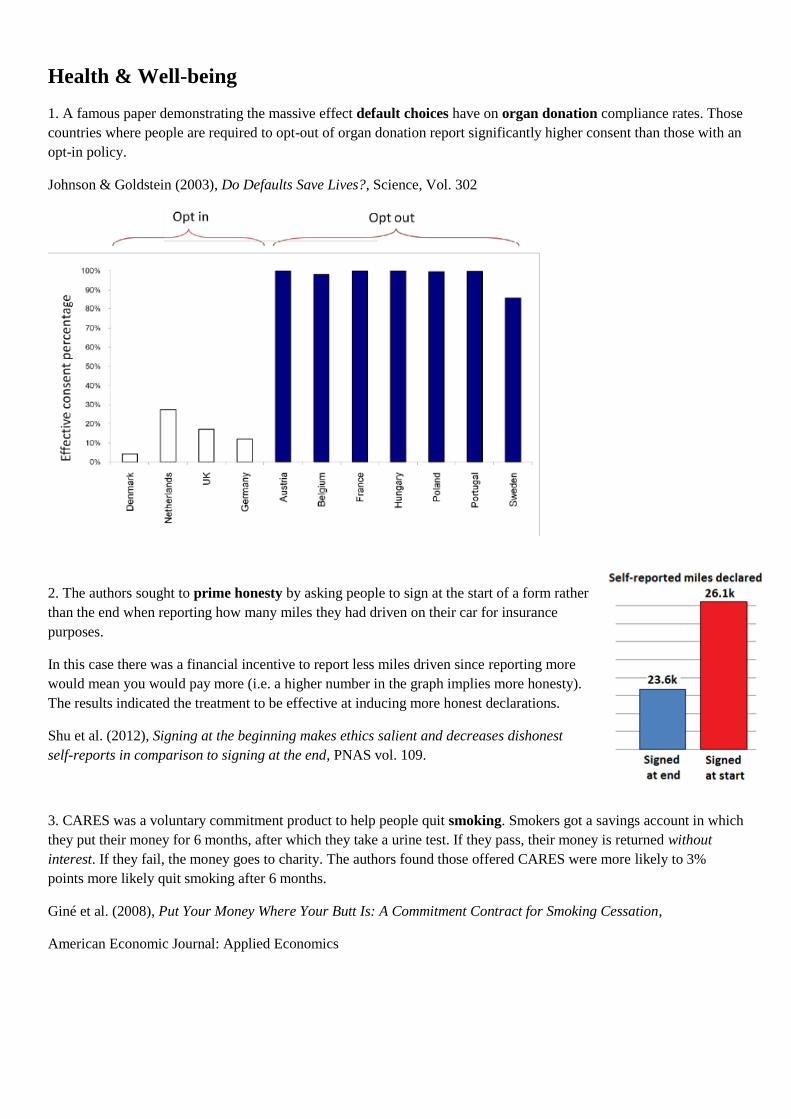
1. A famous paper demonstrating the massive effect default choices have on organ donation compliance rates. Those
countries where people are required to opt-out of organ donation report significantly higher consent than those with an
opt-in policy.
Johnson & Goldstein (2003), Do Defaults Save Lives?, Science, Vol. 302
2. The authors sought to prime honesty by asking people to sign at the start of a form rather
than the end when reporting how many miles they had driven on their car for insurance
purposes.
In this case there was a financial incentive to report less miles driven since reporting more
would mean you would pay more (i.e. a higher number in the graph implies more honesty).
The results indicated the treatment to be effective at inducing more honest declarations.
Shu et al. (2012), Signing at the beginning makes ethics salient and decreases dishonest
self-reports in comparison to signing at the end, PNAS vol. 109.
3. CARES was a voluntary commitment product to help people quit smoking. Smokers got a savings account in which
they put their money for 6 months, after which they take a urine test. If they pass, their money is returned without
interest. If they fail, the money goes to charity. The authors found those offered CARES were more likely to 3%
points more likely quit smoking after 6 months.
Giné et al. (2008), Put Your Money Where Your Butt Is: A Commitment Contract for Smoking Cessation,
American Economic Journal: Applied Economics
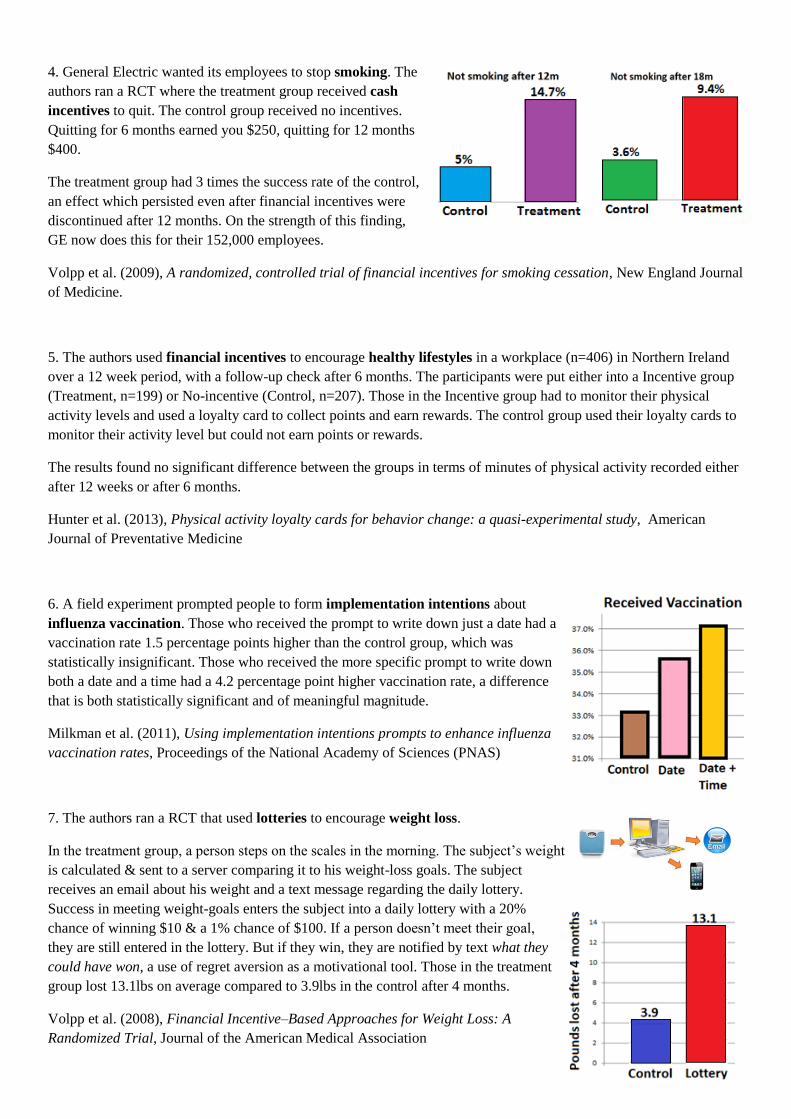
4. General Electric wanted its employees to stop smoking. The
authors ran a RCT where the treatment group received cash
incentives to quit. The control group received no incentives.
Quitting for 6 months earned you $250, quitting for 12 months
$400.
The treatment group had 3 times the success rate of the control,
an effect which persisted even after financial incentives were
discontinued after 12 months. On the strength of this finding,
GE now does this for their 152,000 employees.
Volpp et al. (2009), A randomized, controlled trial of financial incentives for smoking cessation, New England Journal
of Medicine.
5. The authors used financial incentives to encourage healthy lifestyles in a workplace (n=406) in Northern Ireland
over a 12 week period, with a follow-up check after 6 months. The participants were put either into a Incentive group
(Treatment, n=199) or No-incentive (Control, n=207). Those in the Incentive group had to monitor their physical
activity levels and used a loyalty card to collect points and earn rewards. The control group used their loyalty cards to
monitor their activity level but could not earn points or rewards.
The results found no significant difference between the groups in terms of minutes of physical activity recorded either
after 12 weeks or after 6 months.
Hunter et al. (2013), Physical activity loyalty cards for behavior change: a quasi-experimental study, American
Journal of Preventative Medicine
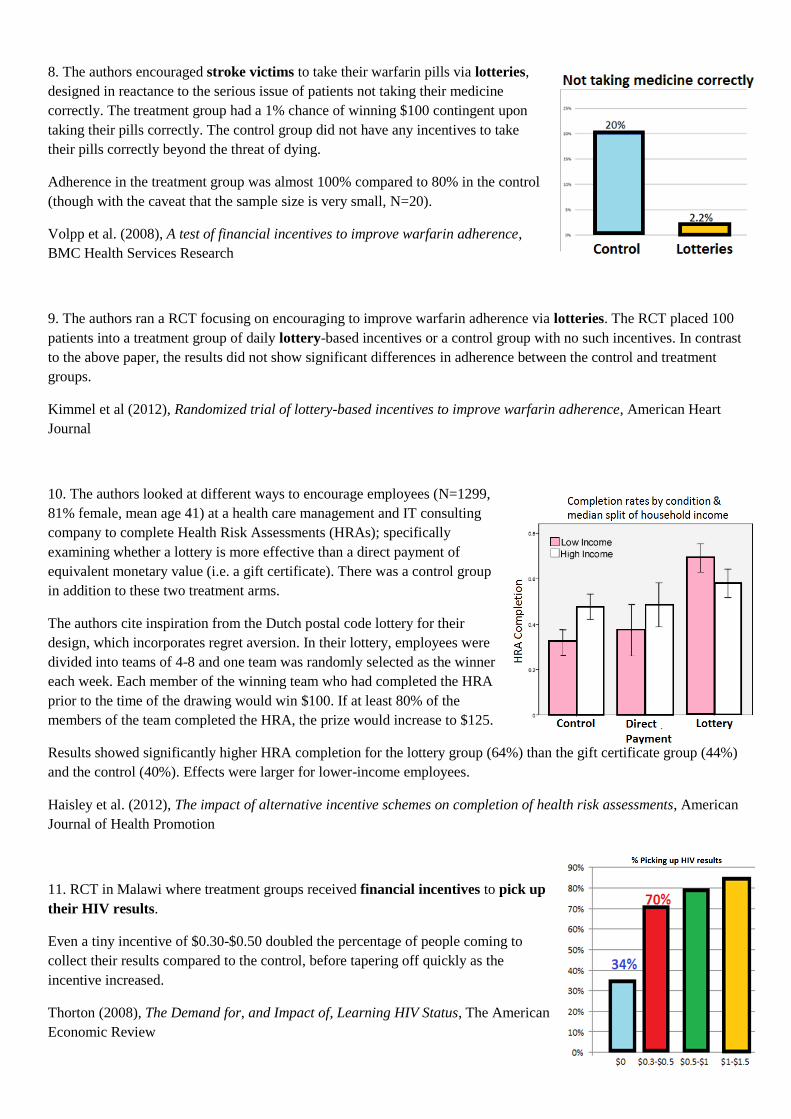
6. A field experiment prompted people to form implementation intentions about
influenza vaccination. Those who received the prompt to write down just a date had a
vaccination rate 1.5 percentage points higher than the control group, which was
statistically insignificant. Those who received the more specific prompt to write down
both a date and a time had a 4.2 percentage point higher vaccination rate, a difference
that is both statistically significant and of meaningful magnitude.
Milkman et al. (2011), Using implementation intentions prompts to enhance influenza
vaccination rates, Proceedings of the National Academy of Sciences (PNAS)
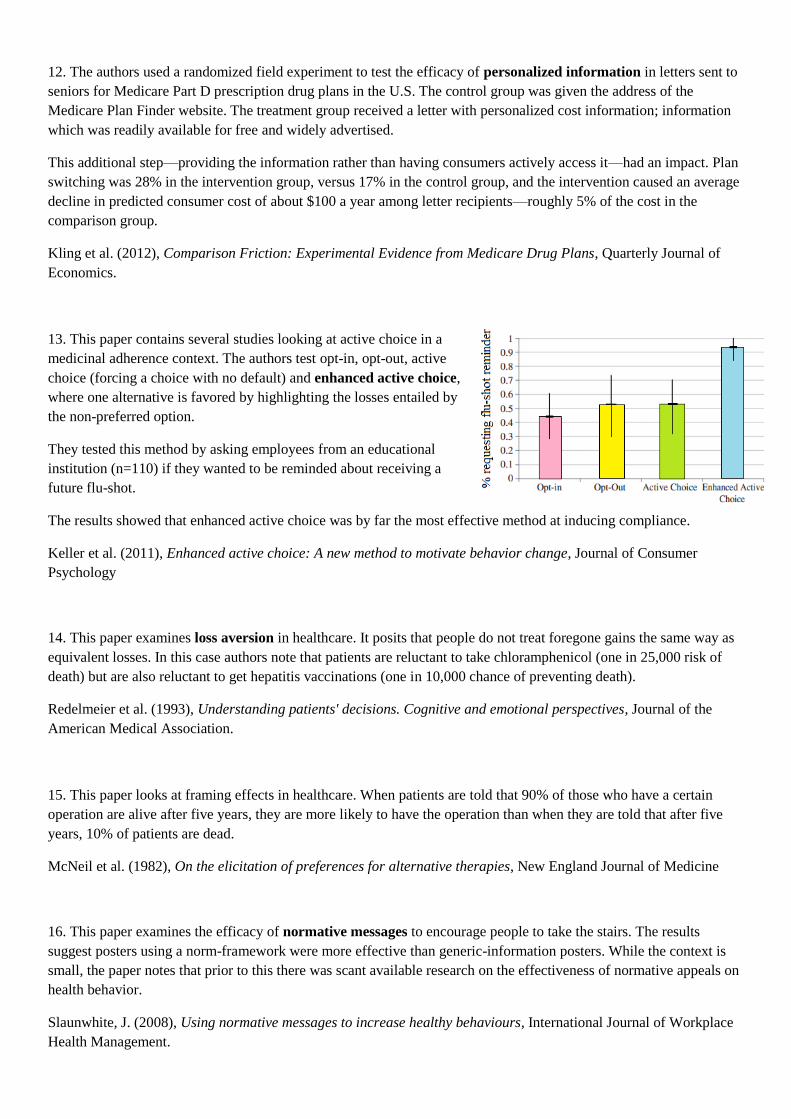
7. The authors ran a RCT that used lotteries to encourage weight loss.
In the treatment group, a person steps on the scales in the morning. The subject’s weight
is calculated & sent to a server comparing it to his weight-loss goals. The subject
receives an email about his weight and a text message regarding the daily lottery.
Success in meeting weight-goals enters the subject into a daily lottery with a 20%
chance of winning $10 & a 1% chance of $100. If a person doesn’t meet their goal,
they are still entered in the lottery. But if they win, they are notified by text what they
could have won, a use of regret aversion as a motivational tool. Those in the treatment
group lost 13.1lbs on average compared to 3.9lbs in the control after 4 months.
Volpp et al. (2008), Financial Incentive–Based Approaches for Weight Loss: A
Randomized Trial, Journal of the American Medical Association
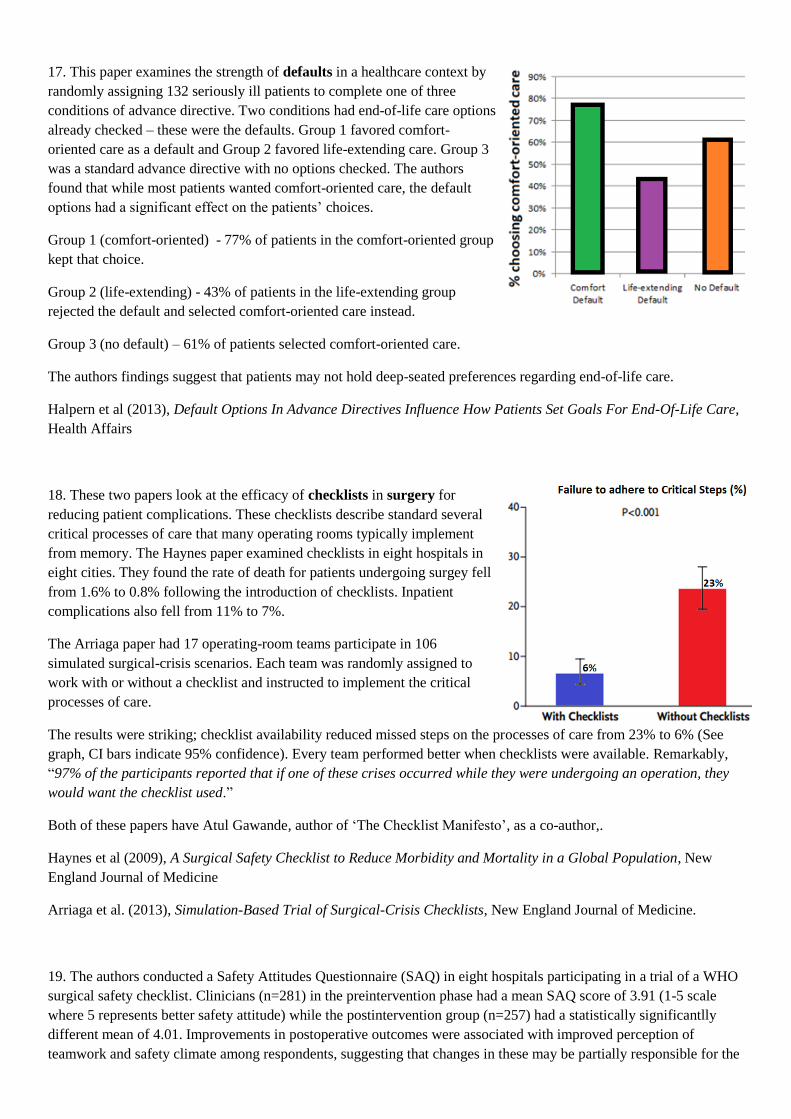
8. The authors encouraged stroke victims to take their warfarin pills via lotteries,
designed in reactance to the serious issue of patients not taking their medicine
correctly. The treatment group had a 1% chance of winning $100 contingent upon
taking their pills correctly. The control group did not have any incentives to take
their pills correctly beyond the threat of dying.
Adherence in the treatment group was almost 100% compared to 80% in the control
(though with the caveat that the sample size is very small, N=20).
Volpp et al. (2008), A test of financial incentives to improve warfarin adherence,
BMC Health Services Research
9. The authors ran a RCT focusing on encouraging to improve warfarin adherence via lotteries. The RCT placed 100
patients into a treatment group of daily lottery-based incentives or a control group with no such incentives. In contrast
to the above paper, the results did not show significant differences in adherence between the control and treatment
groups.
Kimmel et al (2012), Randomized trial of lottery-based incentives to improve warfarin adherence, American Heart
Journal
10. The authors looked at different ways to encourage employees (N=1299,
81% female, mean age 41) at a health care management and IT consulting
company to complete Health Risk Assessments (HRAs); specifically
examining whether a lottery is more effective than a direct payment of
equivalent monetary value (i.e. a gift certificate). There was a control group
in addition to these two treatment arms.
The authors cite inspiration from the Dutch postal code lottery for their
design, which incorporates regret aversion. In their lottery, employees were
divided into teams of 4-8 and one team was randomly selected as the winner
each week. Each member of the winning team who had completed the HRA
prior to the time of the drawing would win $100. If at least 80% of the
members of the team completed the HRA, the prize would increase to $125.
Results showed significantly higher HRA completion for the lottery group (64%) than the gift certificate group (44%)
and the control (40%). Effects were larger for lower-income employees.
Haisley et al. (2012), The impact of alternative incentive schemes on completion of health risk assessments, American
Journal of Health Promotion
11. RCT in Malawi where treatment groups received financial incentives to pick up
their HIV results.
Even a tiny incentive of $0.30-$0.50 doubled the percentage of people coming to
collect their results compared to the control, before tapering off quickly as the
incentive increased.
Thorton (2008), The Demand for, and Impact of, Learning HIV Status, The American
Economic Review
12. The authors used a randomized field experiment to test the efficacy of personalized information in letters sent to
seniors for Medicare Part D prescription drug plans in the U.S. The control group was given the address of the
Medicare Plan Finder website. The treatment group received a letter with personalized cost information; information
which was readily available for free and widely advertised.
This additional step—providing the information rather than having consumers actively access it—had an impact. Plan
switching was 28% in the intervention group, versus 17% in the control group, and the intervention caused an average
decline in predicted consumer cost of about $100 a year among letter recipients—roughly 5% of the cost in the
comparison group.
Kling et al. (2012), Comparison Friction: Experimental Evidence from Medicare Drug Plans, Quarterly Journal of
Economics.
13. This paper contains several studies looking at active choice in a
medicinal adherence context. The authors test opt-in, opt-out, active
choice (forcing a choice with no default) and enhanced active choice,
where one alternative is favored by highlighting the losses entailed by
the non-preferred option.
They tested this method by asking employees from an educational
institution (n=110) if they wanted to be reminded about receiving a
future flu-shot.
The results showed that enhanced active choice was by far the most effective method at inducing compliance.
Keller et al. (2011), Enhanced active choice: A new method to motivate behavior change, Journal of Consumer
Psychology
14. This paper examines loss aversion in healthcare. It posits that people do not treat foregone gains the same way as
equivalent losses. In this case authors note that patients are reluctant to take chloramphenicol (one in 25,000 risk of
death) but are also reluctant to get hepatitis vaccinations (one in 10,000 chance of preventing death).
Redelmeier et al. (1993), Understanding patients' decisions. Cognitive and emotional perspectives, Journal of the
American Medical Association.
15. This paper looks at framing effects in healthcare. When patients are told that 90% of those who have a certain
operation are alive after five years, they are more likely to have the operation than when they are told that after five
years, 10% of patients are dead.
McNeil et al. (1982), On the elicitation of preferences for alternative therapies, New England Journal of Medicine
16. This paper examines the efficacy of normative messages to encourage people to take the stairs. The results
suggest posters using a norm-framework were more effective than generic-information posters. While the context is
small, the paper notes that prior to this there was scant available research on the effectiveness of normative appeals on
health behavior.
Slaunwhite, J. (2008), Using normative messages to increase healthy behaviours, International Journal of Workplace
Health Management.
17. This paper examines the strength of defaults in a healthcare context by
randomly assigning 132 seriously ill patients to complete one of three
conditions of advance directive. Two conditions had end-of-life care options
already checked – these were the defaults. Group 1 favored comfort-
oriented care as a default and Group 2 favored life-extending care. Group 3
was a standard advance directive with no options checked. The authors
found that while most patients wanted comfort-oriented care, the default
options had a significant effect on the patients’ choices.
Group 1 (comfort-oriented) - 77% of patients in the comfort-oriented group
kept that choice.
Group 2 (life-extending) - 43% of patients in the life-extending group
rejected the default and selected comfort-oriented care instead.
Group 3 (no default) – 61% of patients selected comfort-oriented care.
The authors findings suggest that patients may not hold deep-seated preferences regarding end-of-life care.
Halpern et al (2013), Default Options In Advance Directives Influence How Patients Set Goals For End-Of-Life Care,
Health Affairs
18. These two papers look at the efficacy of checklists in surgery for
reducing patient complications. These checklists describe standard several
critical processes of care that many operating rooms typically implement
from memory. The Haynes paper examined checklists in eight hospitals in
eight cities. They found the rate of death for patients undergoing surgey fell
from 1.6% to 0.8% following the introduction of checklists. Inpatient
complications also fell from 11% to 7%.
The Arriaga paper had 17 operating-room teams participate in 106
simulated surgical-crisis scenarios. Each team was randomly assigned to
work with or without a checklist and instructed to implement the critical
processes of care.
The results were striking; checklist availability reduced missed steps on the processes of care from 23% to 6% (See
graph, CI bars indicate 95% confidence). Every team performed better when checklists were available. Remarkably,
“97% of the participants reported that if one of these crises occurred while they were undergoing an operation, they
would want the checklist used.”
Both of these papers have Atul Gawande, author of ‘The Checklist Manifesto’, as a co-author,.
Haynes et al (2009), A Surgical Safety Checklist to Reduce Morbidity and Mortality in a Global Population, New
England Journal of Medicine
Arriaga et al. (2013), Simulation-Based Trial of Surgical-Crisis Checklists, New England Journal of Medicine.
19. The authors conducted a Safety Attitudes Questionnaire (SAQ) in eight hospitals participating in a trial of a WHO
surgical safety checklist. Clinicians (n=281) in the preintervention phase had a mean SAQ score of 3.91 (1-5 scale
where 5 represents better safety attitude) while the postintervention group (n=257) had a statistically significantlly
different mean of 4.01. Improvements in postoperative outcomes were associated with improved perception of
teamwork and safety climate among respondents, suggesting that changes in these may be partially responsible for the

effect of the checklist. Clinicians held the checklist in high regard and 93.4% would want it used if they were
undergoing surgery themselves.
Haynes et al. (2011), Changes in safety attitude and relationship to decreased postoperative morbidity and mortality
following implementation of a checklist-based surgical safety intervention, Quality Safety Health Care.
20. This study looked at probability framings on preferences for cancer treatment alternatives in which tradeoffs
between quantity and quality of life are made. 129 healthy volunteers and 154 cancer patients indicated their
preferences for a toxic or non-toxic treatment at varying survival probabilities. They were randomly assigned into 3
treatments: (1) a positive frame in which the probability of survival was given; (2) a negative frame in which the
probability of dying was given; and (3) a mixed frame in which the probability of surviving and dying were both given.
The cancer patients' preferences for the more effective toxic treatment was significantly stronger than the healthy
volunteers. Both groups were significantly influenced by the level of probability that was presented. Preferences for
the toxic treatment were weaker when the chance of survival dropped below 50%. This weakening preference below
50% survival was enhanced for subjects who responded in the negative frame. A negative frame or probability level
below 0.5 seems to stimulate a "dying mode" type of value system in which quality, not quantity, of life becomes
more salient in decision making.
O’Connor (1988), Effects of Framing and Level of Probability on Patients’ Preferences for Cancer Chemotherapy,
Journal of Clinical Epidemiology.
21. The author compared the effectiveness of a conventional informational poster
intervention designed to increase condom use among gay men to a ‘self-
justification’ intervention designed to bridge the hot-cold behavioral gap
between acting in the throes of passion and later cool objectivity. Subjects in the
latter group were sent a questionnaire which instructed them to recall as vividly as
possible an unsafe (in terms of protection) sexual encounter they had previously
engaged in and were asked to indicate which of a given list of possible self-
justifications for having unsafe sex had been in their mind at the moment they
decided not to use a condom. They were then how reasonable those justifications
seemed now and to briefly justify those new responses.
The percentage of men in the ‘self-justification’ group subsequently differed
dramatically in probability of reporting 2 or more acts of unsafe sex; 17%
compared to 41% for the poster group and 42% for the control.
Gold (1994), Why we need to rethink Aids education for gay men, AIDS Care
22. This paper looked at improving child immunization rates in India with small incentives.
134 villages in India were randomised into 3 groups; (A) A monthly immunisation camp, (B)
A monthly immunisation camp with incentives (raw lentils & metal plates for completed
immunisation) and (C) the Control (no intervention). Group B outperformed A in achieving
full immunization by a factor of two despite the only notable difference between the addition
of a small reward.
Banerjee et al. (2010), Improving immunisation coverage in rural India: clustered
randomised controlled evaluation of immunisation campaigns with and without incentives,
British Medical Journal
23. Wood et al. examined whether perceptions of other people’s alcohol consumption influenced one’s own
perception of the riskiness of their drinking. The authors found that how a person ranked their drinking in the context
of others’ predicted perceptions of developing alcohol disorders.
Wood et al. (2012), Social norm influences on evaluations of the risks associated with alcohol consumption:applying
the rank-based decision by sampling model to health judgments, Alcohol and Alcoholism
24. The authors examine whether completing a household survey changed the later behaviour of the participants. This
paper describes five field studies, two concerned with microlending and three with health. Subjects in the treatment
groups were randomly assigned to receive a survey about household finances and the authors later followed up to
check their subsequent use of a related product.
In the health studies the authors find that being surveyed increases the use of water treatment products and increases
take-up of medical insurance. In the micro-lending studies however, and in contrast to the paper above, they found no
effect of surveys on borrowing behavior.
Zwane et al. (2011), Being surveyed can change later behavior and related parameter estimates, PNAS
Eating Behaviour
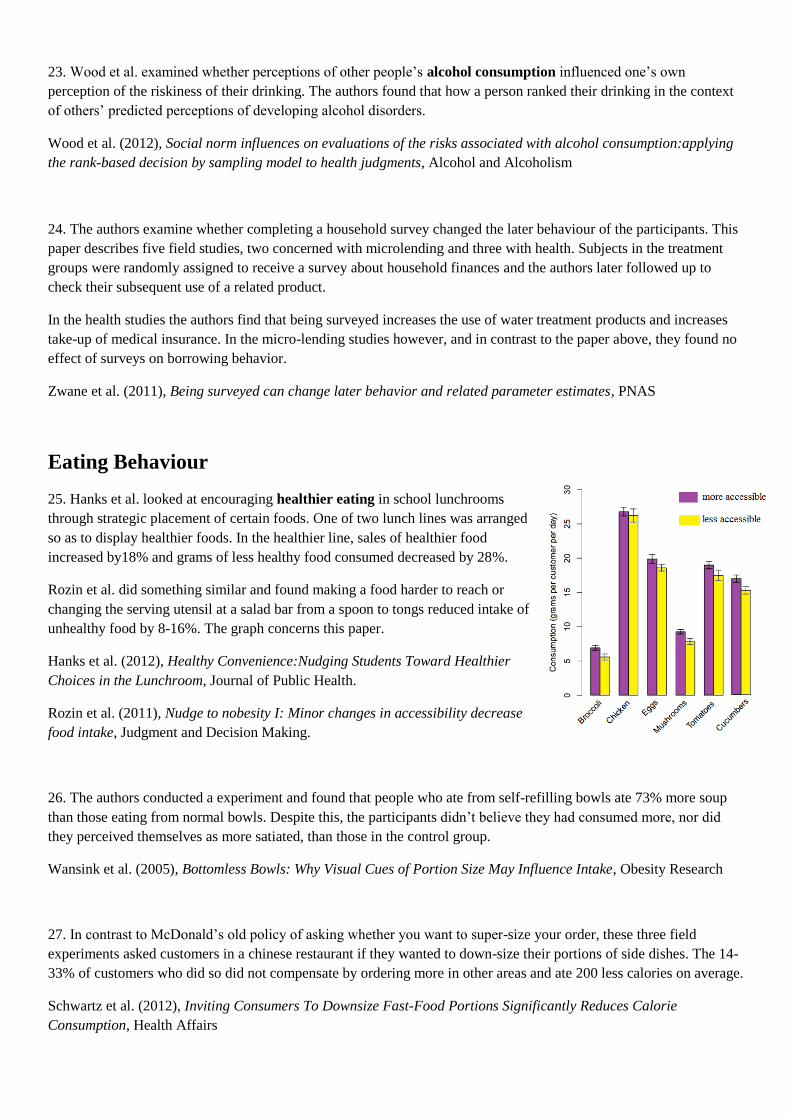
25. Hanks et al. looked at encouraging healthier eating in school lunchrooms
through strategic placement of certain foods. One of two lunch lines was arranged
so as to display healthier foods. In the healthier line, sales of healthier food
increased by18% and grams of less healthy food consumed decreased by 28%.
Rozin et al. did something similar and found making a food harder to reach or
changing the serving utensil at a salad bar from a spoon to tongs reduced intake of
unhealthy food by 8-16%. The graph concerns this paper.
Hanks et al. (2012), Healthy Convenience:Nudging Students Toward Healthier
Choices in the Lunchroom, Journal of Public Health.
Rozin et al. (2011), Nudge to nobesity I: Minor changes in accessibility decrease
food intake, Judgment and Decision Making.
26. The authors conducted a experiment and found that people who ate from self-refilling bowls ate 73% more soup
than those eating from normal bowls. Despite this, the participants didn’t believe they had consumed more, nor did
they perceived themselves as more satiated, than those in the control group.
Wansink et al. (2005), Bottomless Bowls: Why Visual Cues of Portion Size May Influence Intake, Obesity Research
27. In contrast to McDonald’s old policy of asking whether you want to super-size your order, these three field
experiments asked customers in a chinese restaurant if they wanted to down-size their portions of side dishes. The 14-
33% of customers who did so did not compensate by ordering more in other areas and ate 200 less calories on average.
Schwartz et al. (2012), Inviting Consumers To Downsize Fast-Food Portions Significantly Reduces Calorie
Consumption, Health Affairs
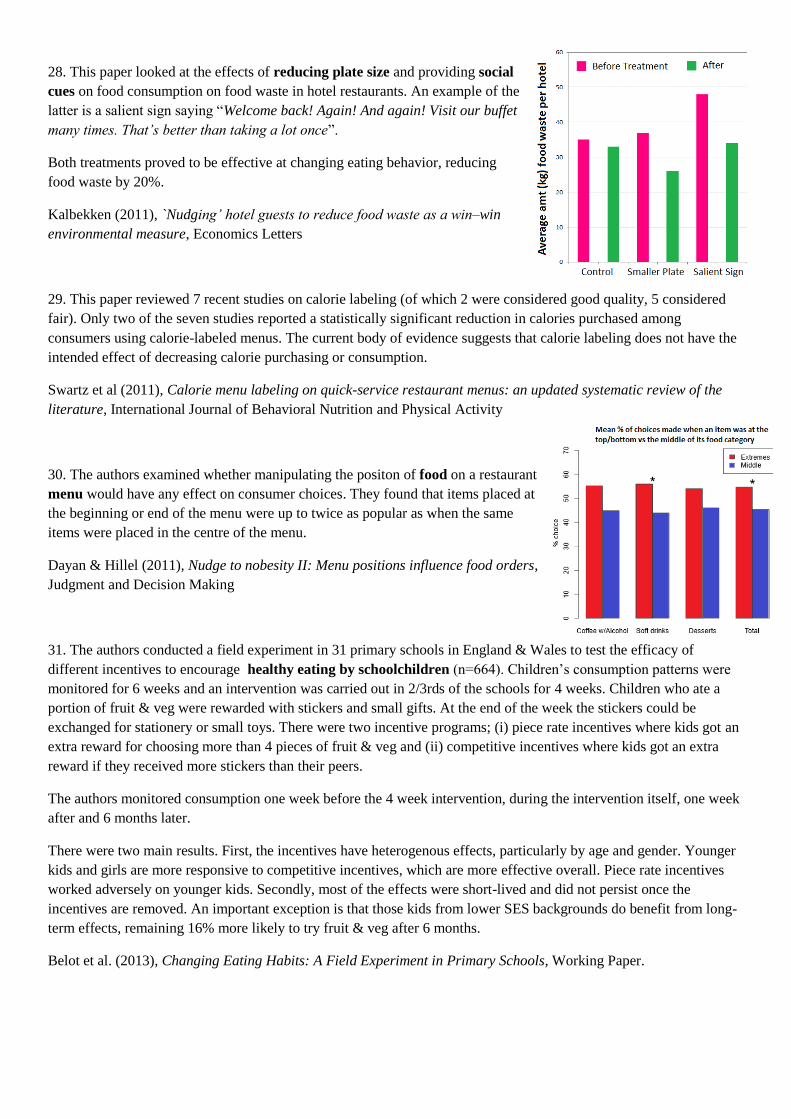
28. This paper looked at the effects of reducing plate size and providing social
cues on food consumption on food waste in hotel restaurants. An example of the
latter is a salient sign saying “Welcome back! Again! And again! Visit our buffet
many times. That’s better than taking a lot once”.
Both treatments proved to be effective at changing eating behavior, reducing
food waste by 20%.
Kalbekken (2011), `Nudging’ hotel guests to reduce food waste as a win–win
environmental measure, Economics Letters
29. This paper reviewed 7 recent studies on calorie labeling (of which 2 were considered good quality, 5 considered
fair). Only two of the seven studies reported a statistically significant reduction in calories purchased among
consumers using calorie-labeled menus. The current body of evidence suggests that calorie labeling does not have the
intended effect of decreasing calorie purchasing or consumption.
Swartz et al (2011), Calorie menu labeling on quick-service restaurant menus: an updated systematic review of the
literature, International Journal of Behavioral Nutrition and Physical Activity
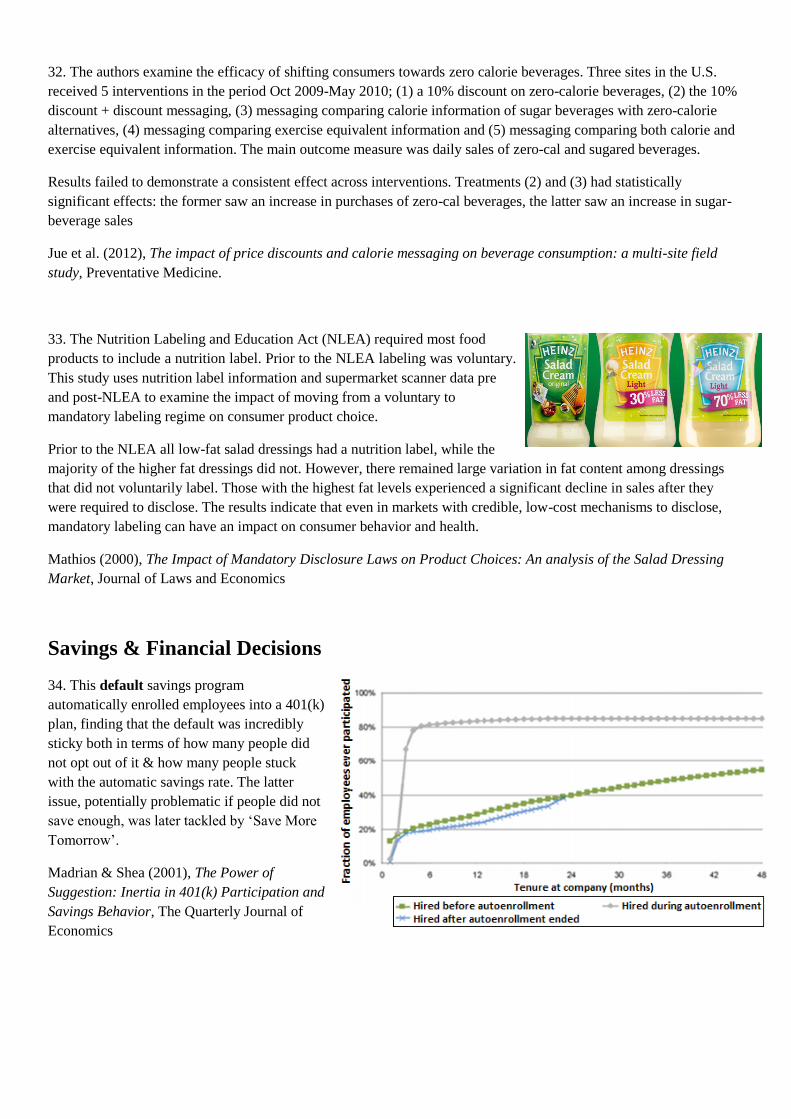
30. The authors examined whether manipulating the positon of food on a restaurant
menu would have any effect on consumer choices. They found that items placed at
the beginning or end of the menu were up to twice as popular as when the same
items were placed in the centre of the menu.
Dayan & Hillel (2011), Nudge to nobesity II: Menu positions influence food orders,
Judgment and Decision Making
31. The authors conducted a field experiment in 31 primary schools in England & Wales to test the efficacy of
different incentives to encourage healthy eating by schoolchildren (n=664). Children’s consumption patterns were
monitored for 6 weeks and an intervention was carried out in 2/3rds of the schools for 4 weeks. Children who ate a
portion of fruit & veg were rewarded with stickers and small gifts. At the end of the week the stickers could be
exchanged for stationery or small toys. There were two incentive programs; (i) piece rate incentives where kids got an
extra reward for choosing more than 4 pieces of fruit & veg and (ii) competitive incentives where kids got an extra
reward if they received more stickers than their peers.
The authors monitored consumption one week before the 4 week intervention, during the intervention itself, one week
after and 6 months later.
There were two main results. First, the incentives have heterogenous effects, particularly by age and gender. Younger
kids and girls are more responsive to competitive incentives, which are more effective overall. Piece rate incentives
worked adversely on younger kids. Secondly, most of the effects were short-lived and did not persist once the
incentives are removed. An important exception is that those kids from lower SES backgrounds do benefit from long-
term effects, remaining 16% more likely to try fruit & veg after 6 months.
Belot et al. (2013), Changing Eating Habits: A Field Experiment in Primary Schools, Working Paper.
32. The authors examine the efficacy of shifting consumers towards zero calorie beverages. Three sites in the U.S.
received 5 interventions in the period Oct 2009-May 2010; (1) a 10% discount on zero-calorie beverages, (2) the 10%
discount + discount messaging, (3) messaging comparing calorie information of sugar beverages with zero-calorie
alternatives, (4) messaging comparing exercise equivalent information and (5) messaging comparing both calorie and
exercise equivalent information. The main outcome measure was daily sales of zero-cal and sugared beverages.
Results failed to demonstrate a consistent effect across interventions. Treatments (2) and (3) had statistically
significant effects: the former saw an increase in purchases of zero-cal beverages, the latter saw an increase in sugar-
beverage sales
Jue et al. (2012), The impact of price discounts and calorie messaging on beverage consumption: a multi-site field
study, Preventative Medicine.
33. The Nutrition Labeling and Education Act (NLEA) required most food
products to include a nutrition label. Prior to the NLEA labeling was voluntary.
This study uses nutrition label information and supermarket scanner data pre
and post-NLEA to examine the impact of moving from a voluntary to
mandatory labeling regime on consumer product choice.
Prior to the NLEA all low-fat salad dressings had a nutrition label, while the
majority of the higher fat dressings did not. However, there remained large variation in fat content among dressings
that did not voluntarily label. Those with the highest fat levels experienced a significant decline in sales after they
were required to disclose. The results indicate that even in markets with credible, low-cost mechanisms to disclose,
mandatory labeling can have an impact on consumer behavior and health.
Mathios (2000), The Impact of Mandatory Disclosure Laws on Product Choices: An analysis of the Salad Dressing
Market, Journal of Laws and Economics
Savings & Financial Decisions
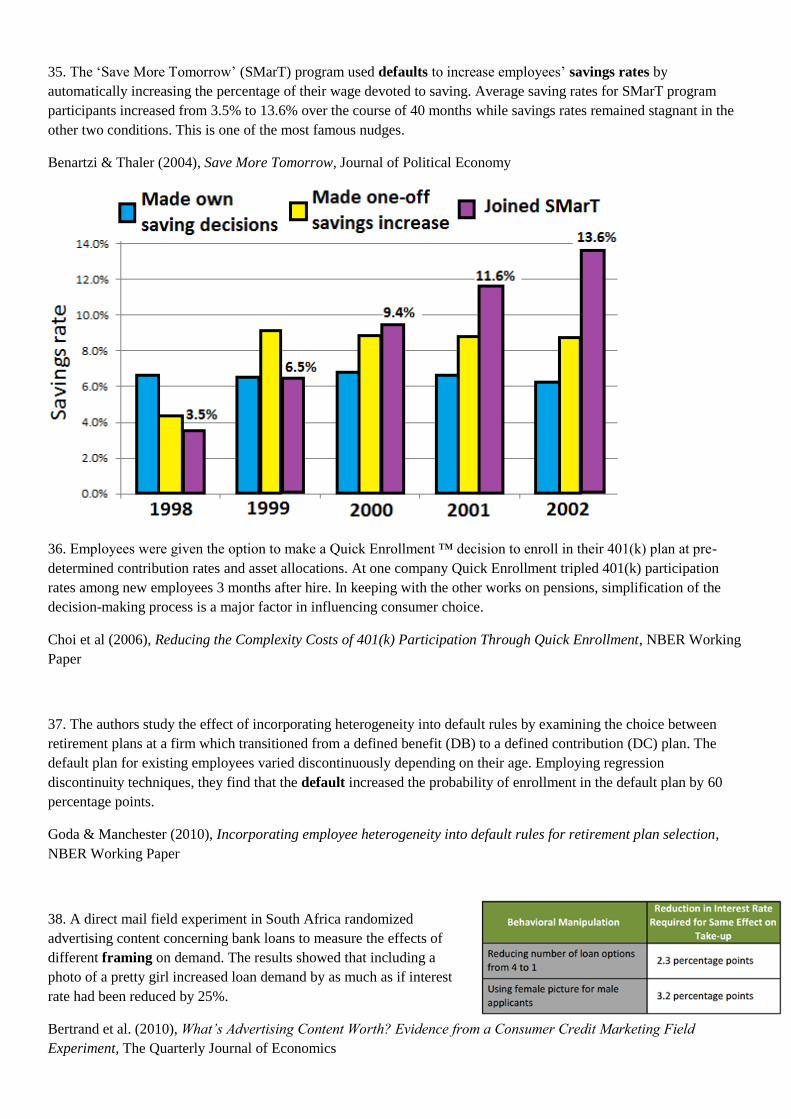
34. This default savings program
automatically enrolled employees into a 401(k)
plan, finding that the default was incredibly
sticky both in terms of how many people did
not opt out of it & how many people stuck
with the automatic savings rate. The latter
issue, potentially problematic if people did not
save enough, was later tackled by ‘Save More
Tomorrow’.
Madrian & Shea (2001), The Power of
Suggestion: Inertia in 401(k) Participation and
Savings Behavior, The Quarterly Journal of
Economics
35. The ‘Save More Tomorrow’ (SMarT) program used defaults to increase employees’ savings rates by
automatically increasing the percentage of their wage devoted to saving. Average saving rates for SMarT program
participants increased from 3.5% to 13.6% over the course of 40 months while savings rates remained stagnant in the
other two conditions. This is one of the most famous nudges.
Benartzi & Thaler (2004), Save More Tomorrow, Journal of Political Economy
36. Employees were given the option to make a Quick Enrollment ™ decision to enroll in their 401(k) plan at pre-
determined contribution rates and asset allocations. At one company Quick Enrollment tripled 401(k) participation
rates among new employees 3 months after hire. In keeping with the other works on pensions, simplification of the
decision-making process is a major factor in influencing consumer choice.
Choi et al (2006), Reducing the Complexity Costs of 401(k) Participation Through Quick Enrollment, NBER Working
Paper
37. The authors study the effect of incorporating heterogeneity into default rules by examining the choice between
retirement plans at a firm which transitioned from a defined benefit (DB) to a defined contribution (DC) plan. The
default plan for existing employees varied discontinuously depending on their age. Employing regression
discontinuity techniques, they find that the default increased the probability of enrollment in the default plan by 60
percentage points.
Goda & Manchester (2010), Incorporating employee heterogeneity into default rules for retirement plan selection,
NBER Working Paper
38. A direct mail field experiment in South Africa randomized
advertising content concerning bank loans to measure the effects of
different framing on demand. The results showed that including a
photo of a pretty girl increased loan demand by as much as if interest
rate had been reduced by 25%.
Bertrand et al. (2010), What’s Advertising Content Worth? Evidence from a Consumer Credit Marketing Field
Experiment, The Quarterly Journal of Economics
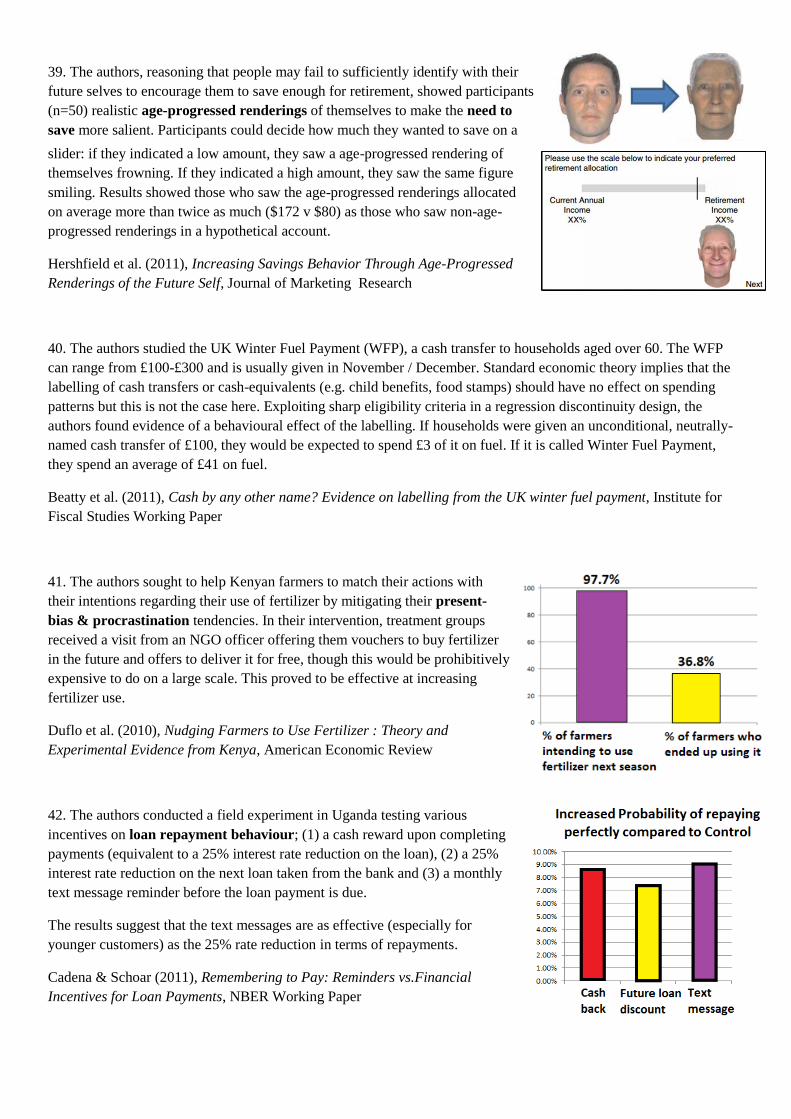
39. The authors, reasoning that people may fail to sufficiently identify with their
future selves to encourage them to save enough for retirement, showed participants
(n=50) realistic age-progressed renderings of themselves to make the need to
save more salient. Participants could decide how much they wanted to save on a
slider: if they indicated a low amount, they saw a age-progressed rendering of
themselves frowning. If they indicated a high amount, they saw the same figure
smiling. Results showed those who saw the age-progressed renderings allocated
on average more than twice as much ($172 v $80) as those who saw non-age-
progressed renderings in a hypothetical account.
Hershfield et al. (2011), Increasing Savings Behavior Through Age-Progressed
Renderings of the Future Self, Journal of Marketing Research
40. The authors studied the UK Winter Fuel Payment (WFP), a cash transfer to households aged over 60. The WFP
can range from £100-£300 and is usually given in November / December. Standard economic theory implies that the
labelling of cash transfers or cash-equivalents (e.g. child benefits, food stamps) should have no effect on spending
patterns but this is not the case here. Exploiting sharp eligibility criteria in a regression discontinuity design, the
authors found evidence of a behavioural effect of the labelling. If households were given an unconditional, neutrally-
named cash transfer of £100, they would be expected to spend £3 of it on fuel. If it is called Winter Fuel Payment,
they spend an average of £41 on fuel.
Beatty et al. (2011), Cash by any other name? Evidence on labelling from the UK winter fuel payment, Institute for
Fiscal Studies Working Paper
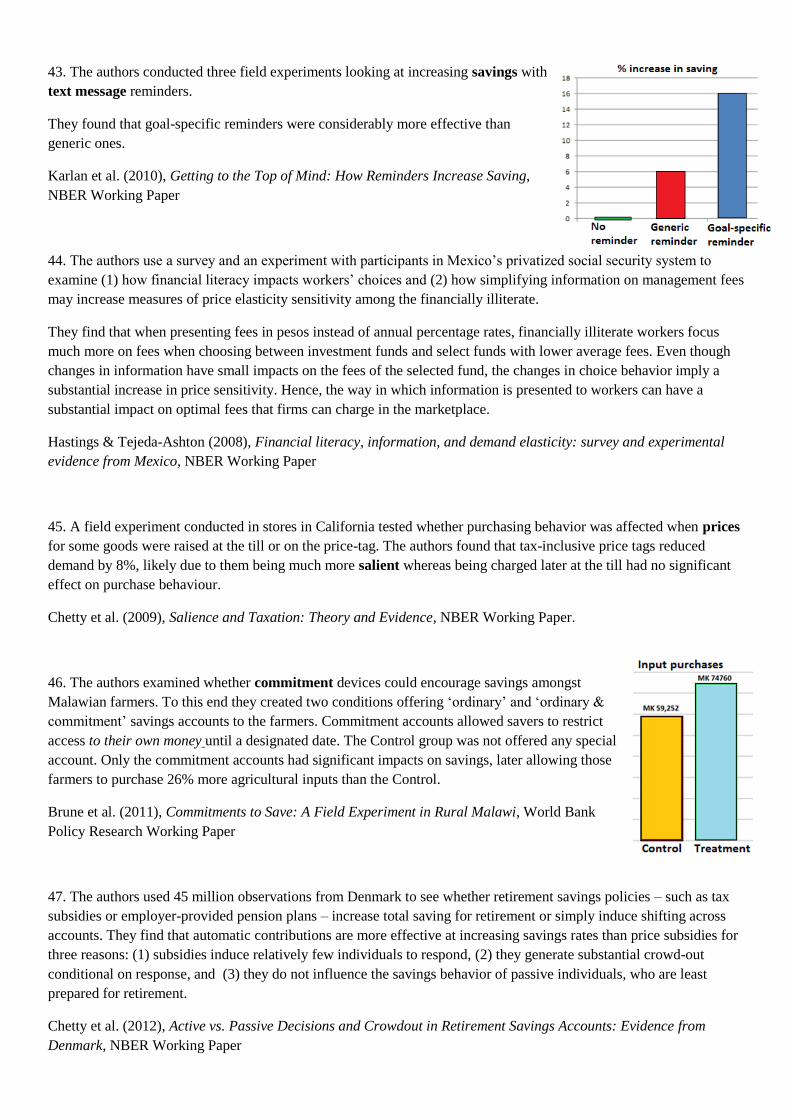
41. The authors sought to help Kenyan farmers to match their actions with
their intentions regarding their use of fertilizer by mitigating their present-
bias & procrastination tendencies. In their intervention, treatment groups
received a visit from an NGO officer offering them vouchers to buy fertilizer
in the future and offers to deliver it for free, though this would be prohibitively
expensive to do on a large scale. This proved to be effective at increasing
fertilizer use.
Duflo et al. (2010), Nudging Farmers to Use Fertilizer : Theory and
Experimental Evidence from Kenya, American Economic Review
42. The authors conducted a field experiment in Uganda testing various
incentives on loan repayment behaviour; (1) a cash reward upon completing
payments (equivalent to a 25% interest rate reduction on the loan), (2) a 25%
interest rate reduction on the next loan taken from the bank and (3) a monthly
text message reminder before the loan payment is due.
The results suggest that the text messages are as effective (especially for
younger customers) as the 25% rate reduction in terms of repayments.
Cadena & Schoar (2011), Remembering to Pay: Reminders vs.Financial
Incentives for Loan Payments, NBER Working Paper
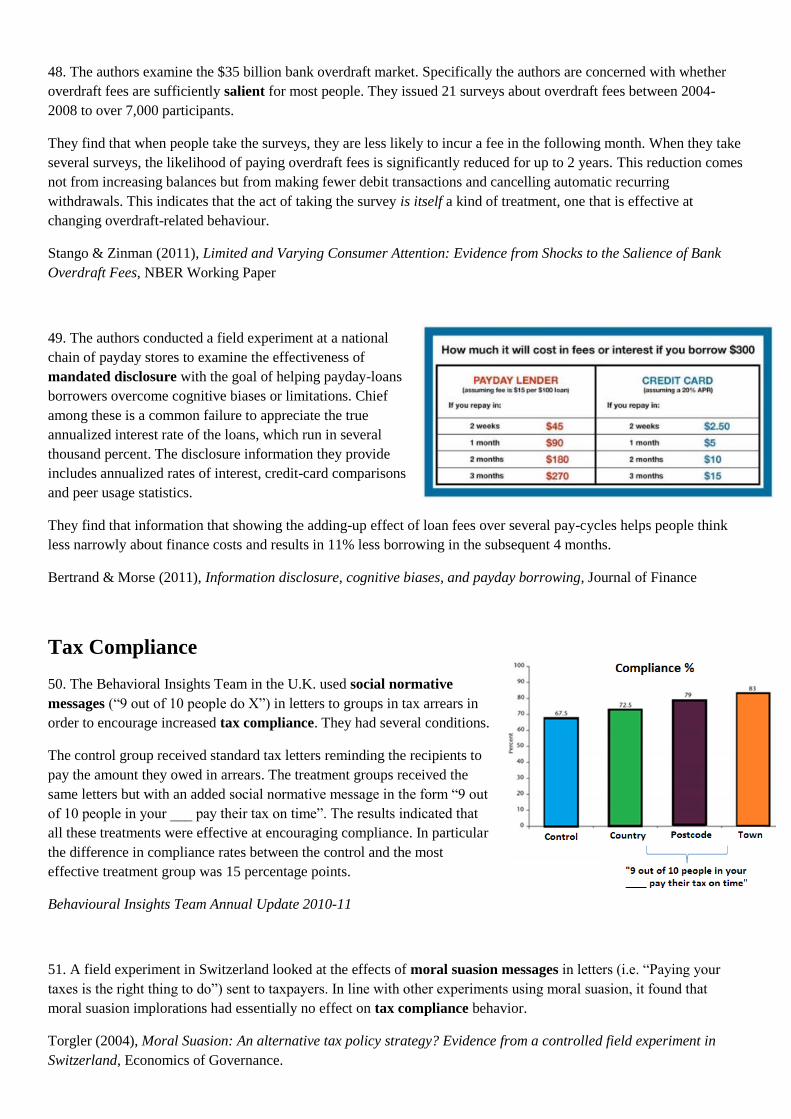
43. The authors conducted three field experiments looking at increasing savings with
text message reminders.
They found that goal-specific reminders were considerably more effective than
generic ones.
Karlan et al. (2010), Getting to the Top of Mind: How Reminders Increase Saving,
NBER Working Paper
44. The authors use a survey and an experiment with participants in Mexico’s privatized social security system to
examine (1) how financial literacy impacts workers’ choices and (2) how simplifying information on management fees
may increase measures of price elasticity sensitivity among the financially illiterate.
They find that when presenting fees in pesos instead of annual percentage rates, financially illiterate workers focus
much more on fees when choosing between investment funds and select funds with lower average fees. Even though
changes in information have small impacts on the fees of the selected fund, the changes in choice behavior imply a
substantial increase in price sensitivity. Hence, the way in which information is presented to workers can have a
substantial impact on optimal fees that firms can charge in the marketplace.
Hastings & Tejeda-Ashton (2008), Financial literacy, information, and demand elasticity: survey and experimental
evidence from Mexico, NBER Working Paper
45. A field experiment conducted in stores in California tested whether purchasing behavior was affected when prices
for some goods were raised at the till or on the price-tag. The authors found that tax-inclusive price tags reduced
demand by 8%, likely due to them being much more salient whereas being charged later at the till had no significant
effect on purchase behaviour.
Chetty et al. (2009), Salience and Taxation: Theory and Evidence, NBER Working Paper.
46. The authors examined whether commitment devices could encourage savings amongst
Malawian farmers. To this end they created two conditions offering ‘ordinary’ and ‘ordinary &
commitment’ savings accounts to the farmers. Commitment accounts allowed savers to restrict
access to their own money until a designated date. The Control group was not offered any special
account. Only the commitment accounts had significant impacts on savings, later allowing those
farmers to purchase 26% more agricultural inputs than the Control.
Brune et al. (2011), Commitments to Save: A Field Experiment in Rural Malawi, World Bank
Policy Research Working Paper
47. The authors used 45 million observations from Denmark to see whether retirement savings policies – such as tax
subsidies or employer-provided pension plans – increase total saving for retirement or simply induce shifting across
accounts. They find that automatic contributions are more effective at increasing savings rates than price subsidies for
three reasons: (1) subsidies induce relatively few individuals to respond, (2) they generate substantial crowd-out
conditional on response, and (3) they do not influence the savings behavior of passive individuals, who are least
prepared for retirement.
Chetty et al. (2012), Active vs. Passive Decisions and Crowdout in Retirement Savings Accounts: Evidence from
Denmark, NBER Working Paper
48. The authors examine the $35 billion bank overdraft market. Specifically the authors are concerned with whether
overdraft fees are sufficiently salient for most people. They issued 21 surveys about overdraft fees between 2004-
2008 to over 7,000 participants.
They find that when people take the surveys, they are less likely to incur a fee in the following month. When they take
several surveys, the likelihood of paying overdraft fees is significantly reduced for up to 2 years. This reduction comes
not from increasing balances but from making fewer debit transactions and cancelling automatic recurring
withdrawals. This indicates that the act of taking the survey is itself a kind of treatment, one that is effective at
changing overdraft-related behaviour.
Stango & Zinman (2011), Limited and Varying Consumer Attention: Evidence from Shocks to the Salience of Bank
Overdraft Fees, NBER Working Paper
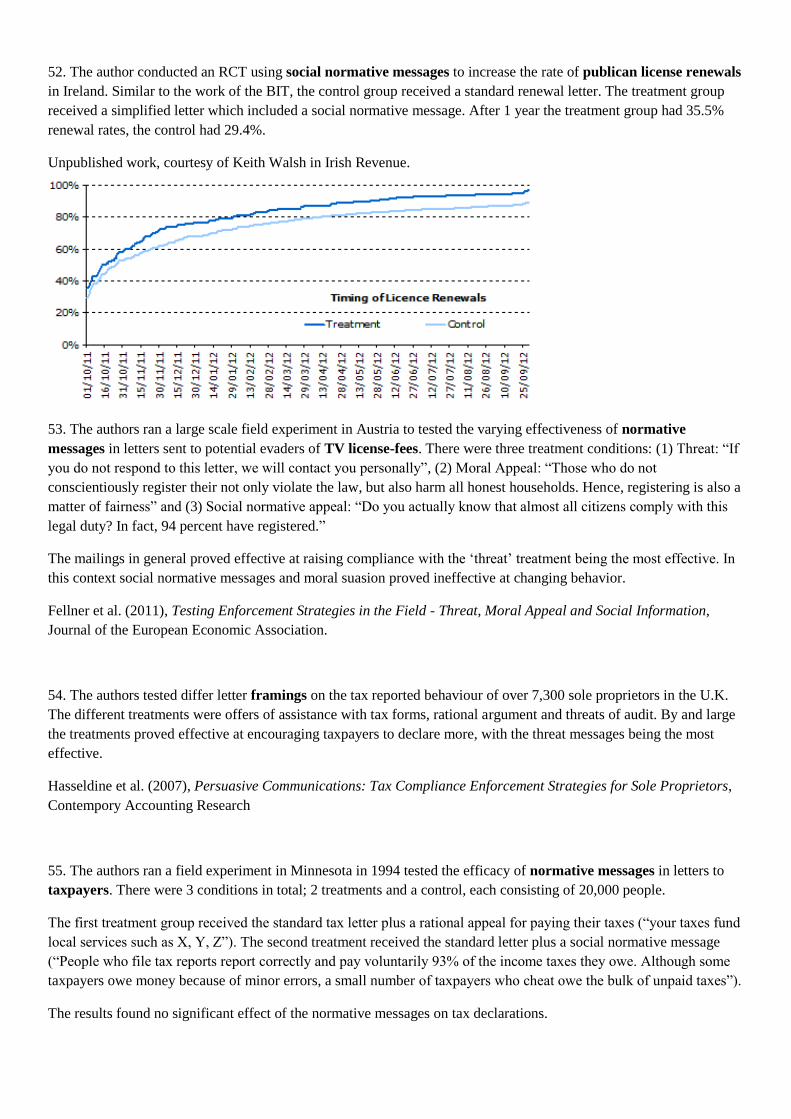
49. The authors conducted a field experiment at a national
chain of payday stores to examine the effectiveness of
mandated disclosure with the goal of helping payday-loans
borrowers overcome cognitive biases or limitations. Chief
among these is a common failure to appreciate the true
annualized interest rate of the loans, which run in several
thousand percent. The disclosure information they provide
includes annualized rates of interest, credit-card comparisons
and peer usage statistics.
They find that information that showing the adding-up effect of loan fees over several pay-cycles helps people think
less narrowly about finance costs and results in 11% less borrowing in the subsequent 4 months.
Bertrand & Morse (2011), Information disclosure, cognitive biases, and payday borrowing, Journal of Finance
Tax Compliance
50. The Behavioral Insights Team in the U.K. used social normative
messages (“9 out of 10 people do X”) in letters to groups in tax arrears in
order to encourage increased tax compliance. They had several conditions.
The control group received standard tax letters reminding the recipients to
pay the amount they owed in arrears. The treatment groups received the
same letters but with an added social normative message in the form “9 out
of 10 people in your ___ pay their tax on time”. The results indicated that
all these treatments were effective at encouraging compliance. In particular
the difference in compliance rates between the control and the most
effective treatment group was 15 percentage points.
Behavioural Insights Team Annual Update 2010-11
51. A field experiment in Switzerland looked at the effects of moral suasion messages in letters (i.e. “Paying your
taxes is the right thing to do”) sent to taxpayers. In line with other experiments using moral suasion, it found that
moral suasion implorations had essentially no effect on tax compliance behavior.
Torgler (2004), Moral Suasion: An alternative tax policy strategy? Evidence from a controlled field experiment in
Switzerland, Economics of Governance.
52. The author conducted an RCT using social normative messages to increase the rate of publican license renewals
in Ireland. Similar to the work of the BIT, the control group received a standard renewal letter. The treatment group
received a simplified letter which included a social normative message. After 1 year the treatment group had 35.5%
renewal rates, the control had 29.4%.
Unpublished work, courtesy of Keith Walsh in Irish Revenue.
53. The authors ran a large scale field experiment in Austria to tested the varying effectiveness of normative
messages in letters sent to potential evaders of TV license-fees. There were three treatment conditions: (1) Threat: “If
you do not respond to this letter, we will contact you personally”, (2) Moral Appeal: “Those who do not
conscientiously register their not only violate the law, but also harm all honest households. Hence, registering is also a
matter of fairness” and (3) Social normative appeal: “Do you actually know that almost all citizens comply with this
legal duty? In fact, 94 percent have registered.”
The mailings in general proved effective at raising compliance with the ‘threat’ treatment being the most effective. In
this context social normative messages and moral suasion proved ineffective at changing behavior.
Fellner et al. (2011), Testing Enforcement Strategies in the Field - Threat, Moral Appeal and Social Information,
Journal of the European Economic Association.
54. The authors tested differ letter framings on the tax reported behaviour of over 7,300 sole proprietors in the U.K.
The different treatments were offers of assistance with tax forms, rational argument and threats of audit. By and large
the treatments proved effective at encouraging taxpayers to declare more, with the threat messages being the most
effective.
Hasseldine et al. (2007), Persuasive Communications: Tax Compliance Enforcement Strategies for Sole Proprietors,
Contempory Accounting Research
55. The authors ran a field experiment in Minnesota in 1994 tested the efficacy of normative messages in letters to
taxpayers. There were 3 conditions in total; 2 treatments and a control, each consisting of 20,000 people.
The first treatment group received the standard tax letter plus a rational appeal for paying their taxes (“your taxes fund
local services such as X, Y, Z”). The second treatment received the standard letter plus a social normative message
(“People who file tax reports report correctly and pay voluntarily 93% of the income taxes they owe. Although some
taxpayers owe money because of minor errors, a small number of taxpayers who cheat owe the bulk of unpaid taxes”).
The results found no significant effect of the normative messages on tax declarations.
Blumenthal et al. (2001), Do Normative Appeals Affect Tax Compliance? Evidence from a Controlled Experiment in
Minnesota, National Tax Journal
56. The author argues that the low volitional and collective nature of tax-funded benefits are primary causes of low
satisfaction with tax payment. Three studies suggest that providing people with the opportunity to allocate some of
their tax payment (here, 10%) across budgets provided by the billing party introduces (i) volition into the payment
process and (ii) increases the perceived benefit associated with tax payment. The authors find that as a result,
taxpayers are significantly more satisfied with paying taxes, despite the fact that their payment amount remains
completely unchanged.
In addition to enhancing taxpayer satisfaction, an allocation program, if well-implemented, could also provide some
hope for correcting existing lack of voice, address disconnects between spending and taxpayers’ priorities, and
increase civic engagement in general.
Lamberton (2013), A Spoonful of Choice: How Allocation Increases Satisfaction with Tax Payments, Journal of Public
Policy and Marketing
57. The authors conducted a field experiment with the IRS to examine why people fail to collect benefits they are
eligible for. They sent letters to 35,050 California taxpayers who filed their taxes but didn’t claim their 2009 Earned
Income Tax Credit (EITC) despite being eligible for it. They varied the text of the mailings to create 3 different
conditions: (1) The Control group received a standard letter, (2) there was a Simplification treatment and (3) a
Display of benefit treatment .
The results show that all the mailings substantially increase the likelihood of subsequent year take-up, with the two
treatments being more effective than the control. The authors project that applying the tested interventions to all filing
non-claimants could reduce incomplete take-up among filers from 10% to 7%.
Bhargava & Manoli (forthcoming), Why are Benefits Left on the Table? Assessing the Role of Information, Complexity,
and Stigma on Take-up with an IRS Field Experiment, American Economic Review
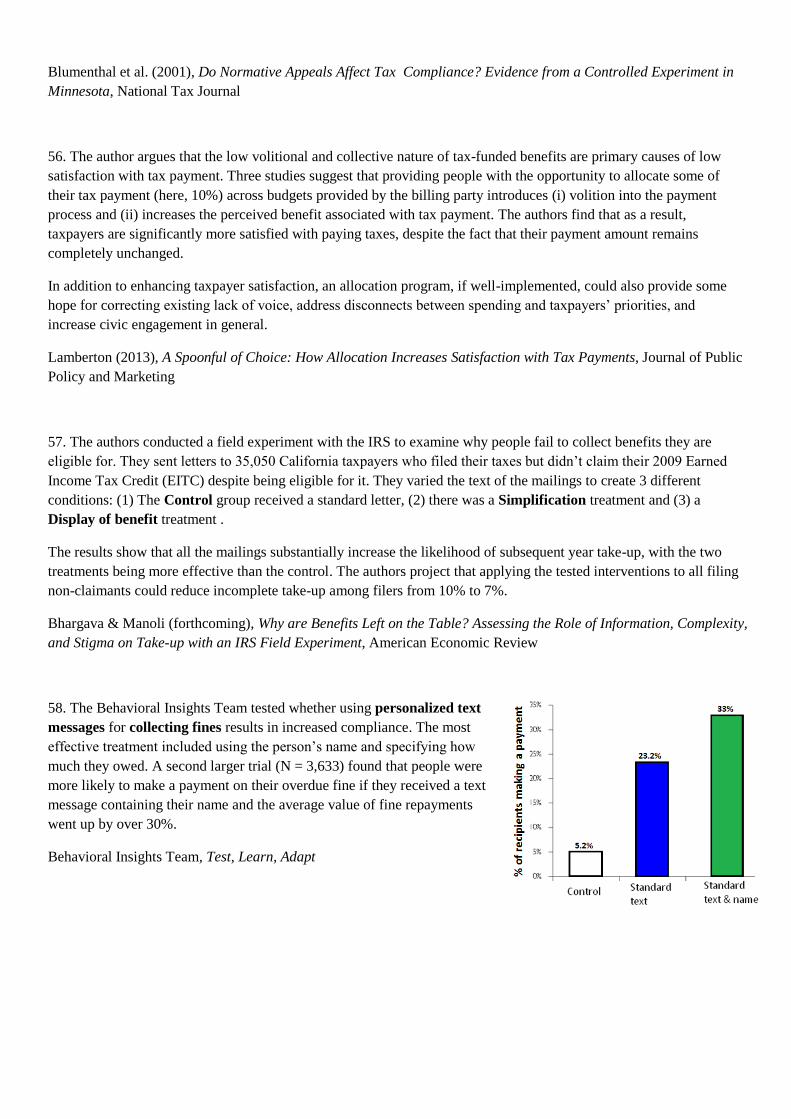
58. The Behavioral Insights Team tested whether using personalized text
messages for collecting fines results in increased compliance. The most
effective treatment included using the person’s name and specifying how
much they owed. A second larger trial (N = 3,633) found that people were
more likely to make a payment on their overdue fine if they received a text
message containing their name and the average value of fine repayments
went up by over 30%.
Behavioral Insights Team, Test, Learn, Adapt
Education
59. The author uses RCTs to look at the efficacy of text message reminders and peer mentor outreach at increasing
college entry among low-income students. The results show that an automated and personalized text messaging
campaign to remind students of required college tasks increased college enrollment by 4-7%, with effects concentrated
among students who resided in communities with low levels of educational attainment.
A peer mentor intervention increased four-year college enrollment by 4.5%, with effects largest for males and students
with less-defined college plans. Given the meagre costs - $7 per participant for the text message campaign and $80
per participant for the peer mentor campaign - both strategies are impressively cost-effective.
Castleman (2013), Summer Nudging: Can Text Messages and Peer Mentor Outreach Increase College-Going Among
Low-Income High School Graduates?
60. This paper examined the issue of low awareness and take-up rates for government support programs, specifically
for college financial aid. The authors used 2 treatment groups to test (1) the efficacy of simplifying the application
forms for college financial aid for low & middle-income families applying and (2) the efficacy of having a tax
professional provide guidance on completing the application form. The authors found that those who received
assistance with their application were significantly more likely to submit the application, enroll in college and receive
further financial aid. These benefits were not seen for those given the simplified form but not the professional
assistance. This speaks to the importance of channel factors; in this case sitting down with a professional for an hour
to complete the application.
Bettinger et al. (2009), The Role of Simplification and Information in College Decisions: Results from the H&R Block
FAFSA Experiment, NBER Working Paper
Energy Efficiency
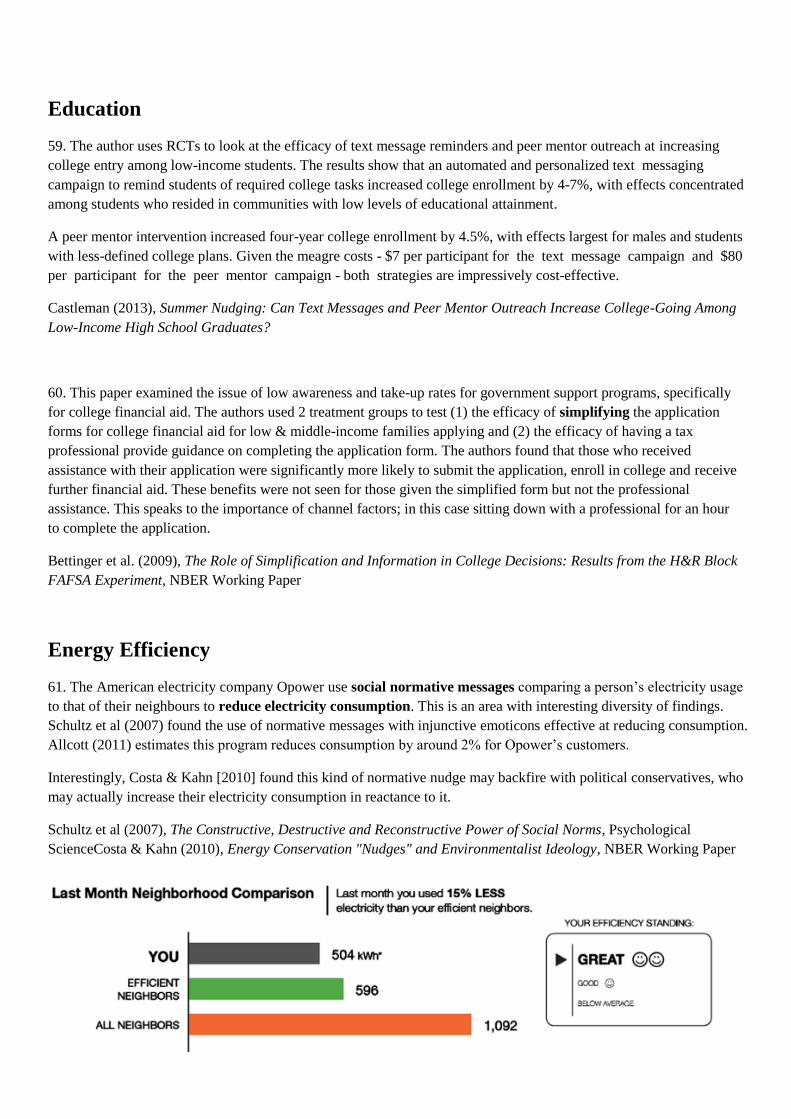
61. The American electricity company Opower use social normative messages comparing a person’s electricity usage
to that of their neighbours to reduce electricity consumption. This is an area with interesting diversity of findings.
Schultz et al (2007) found the use of normative messages with injunctive emoticons effective at reducing consumption.
Allcott (2011) estimates this program reduces consumption by around 2% for Opower’s customers.
Interestingly, Costa & Kahn [2010] found this kind of normative nudge may backfire with political conservatives, who
may actually increase their electricity consumption in reactance to it.
Schultz et al (2007), The Constructive, Destructive and Reconstructive Power of Social Norms, Psychological
ScienceCosta & Kahn (2010), Energy Conservation "Nudges" and Environmentalist Ideology, NBER Working Paper

62.This paper looks at the efficacy of using financial incentives to
encourage prosocial behavior by levying a 5 cent tax on plastic bags
in Washington D.C.
Despite the trivial fee, it had a significant effect on disposable bag use.
A similar policy that offered a 5 cent bonus had no significant effect
on behavior. In the graph note the before/after effects in Montgomery
County of introducing the tax.
Homonoff (2012), Can Small Incentives Have Large Effects? The
Impact of Taxes versus Bonuses on Disposable Bag Use, Job Market
Paper
63. The author conducted field experiments to determine the effectiveness of
normative messages designed to promote towel re-use in hotel rooms. The
control received the message “This hotel has initiated a conservation program.”
An example of a treatment message was “Nearly 75% of hotel guests choose
to reuse their towels each day. To support our guests who want to conserve,
this hotel has initiated a conservation program”. The authors find some
evidence of behavior change in the treatment groups but note the overlapping
confidence intervals.
Schultz et al (2007), Using normative social influence to promote conservation
among hotel guests, Social Influence
64. The authors analyze data from two large-scale, random-assignment field experiments conducted by utility
companies providing electricity (the Sacramento Municipal Utility District) and natural gas (Puget Sound Energy) in
partnership with the private company Opower. These companies Opowers policy of providing peer feedback reports
which introduce a social norm component to energy usage. The authors find reductions in average energy
consumption of 1.2% to 2.1%, with the decrease sustained over time.
Ayres et al. (2012), Evidence from Two Large Field Experiments that Peer Comparison Feedback Can Reduce
Residential Energy Usage, Journal of Law and Economic Organization
65. The authors hypothesize that people use the kind of electricity that is offered
to them (i.e. the default). They use 2 natural studies and 2 experiments to support
this, finding that making ‘green utility’ the default increased take-up of it.
Pichert & Katsikopoulos (2008), Green Defaults: Information Presentation and
Pro-Environmental Behaviour, Journal of Environmental Psychology
66. The authors ran a RCT where residential electricity customers saw price increases, with households in the
treatment group receiving high-frequency information displays that gave information about usage and prices. This
lowering of information acquisition costs allowed identification of the marginal information effect. Households only
experiencing price increases reduced demand by 0-7% whereas those also exposed to information feedback reduced
by 8-22%, depending on the amount of advance notice.
Jessoe & Rapson (2012), Knowledge is (Less) Power: Experimental Evidence from Residential Energy Use,
NBERWorking Paper.
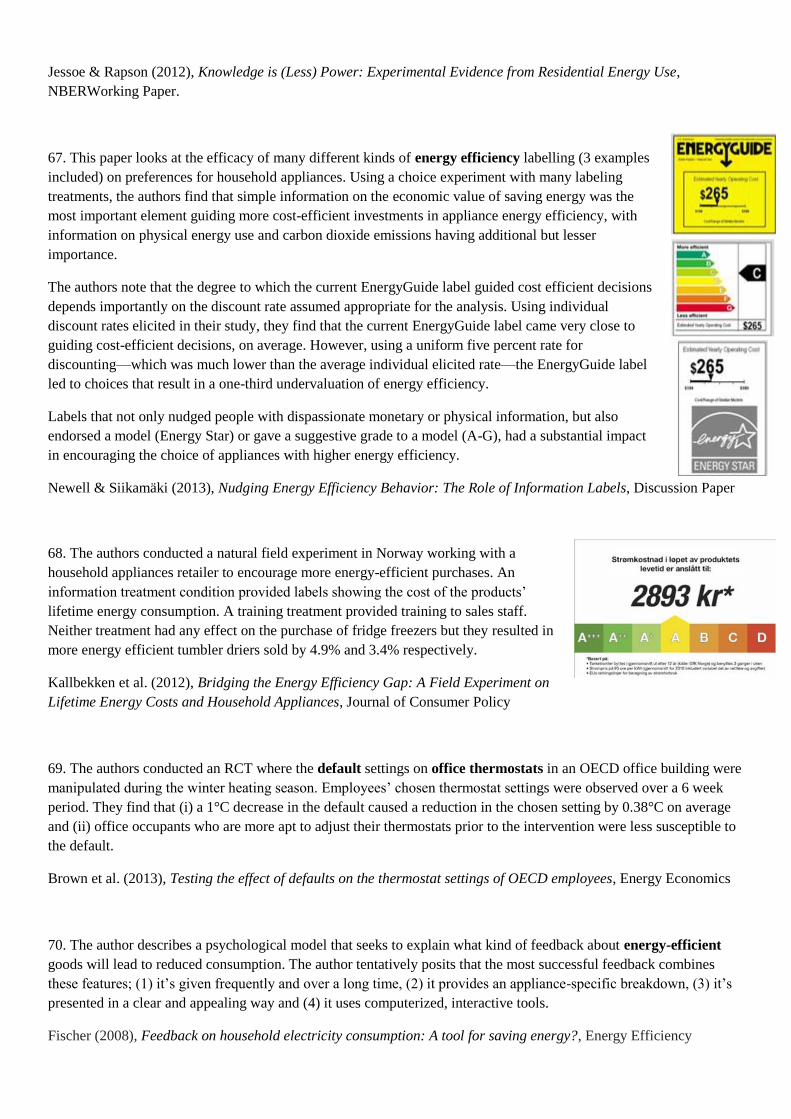
67. This paper looks at the efficacy of many different kinds of energy efficiency labelling (3 examples
included) on preferences for household appliances. Using a choice experiment with many labeling
treatments, the authors find that simple information on the economic value of saving energy was the
most important element guiding more cost-efficient investments in appliance energy efficiency, with
information on physical energy use and carbon dioxide emissions having additional but lesser
importance.
The authors note that the degree to which the current EnergyGuide label guided cost efficient decisions
depends importantly on the discount rate assumed appropriate for the analysis. Using individual
discount rates elicited in their study, they find that the current EnergyGuide label came very close to
guiding cost-efficient decisions, on average. However, using a uniform five percent rate for
discounting—which was much lower than the average individual elicited rate—the EnergyGuide label
led to choices that result in a one-third undervaluation of energy efficiency.
Labels that not only nudged people with dispassionate monetary or physical information, but also
endorsed a model (Energy Star) or gave a suggestive grade to a model (A-G), had a substantial impact
in encouraging the choice of appliances with higher energy efficiency.
Newell & Siikamäki (2013), Nudging Energy Efficiency Behavior: The Role of Information Labels, Discussion Paper
68. The authors conducted a natural field experiment in Norway working with a
household appliances retailer to encourage more energy-efficient purchases. An
information treatment condition provided labels showing the cost of the products’
lifetime energy consumption. A training treatment provided training to sales staff.
Neither treatment had any effect on the purchase of fridge freezers but they resulted in
more energy efficient tumbler driers sold by 4.9% and 3.4% respectively.
Kallbekken et al. (2012), Bridging the Energy Efficiency Gap: A Field Experiment on
Lifetime Energy Costs and Household Appliances, Journal of Consumer Policy
69. The authors conducted an RCT where the default settings on office thermostats in an OECD office building were
manipulated during the winter heating season. Employees’ chosen thermostat settings were observed over a 6 week
period. They find that (i) a 1°C decrease in the default caused a reduction in the chosen setting by 0.38°C on average
and (ii) office occupants who are more apt to adjust their thermostats prior to the intervention were less susceptible to
the default.
Brown et al. (2013), Testing the effect of defaults on the thermostat settings of OECD employees, Energy Economics
70. The author describes a psychological model that seeks to explain what kind of feedback about energy-efficient
goods will lead to reduced consumption. The author tentatively posits that the most successful feedback combines
these features; (1) it’s given frequently and over a long time, (2) it provides an appliance-specific breakdown, (3) it’s
presented in a clear and appealing way and (4) it uses computerized, interactive tools.
Fischer (2008), Feedback on household electricity consumption: A tool for saving energy?, Energy Efficiency
Employment & Work Performance
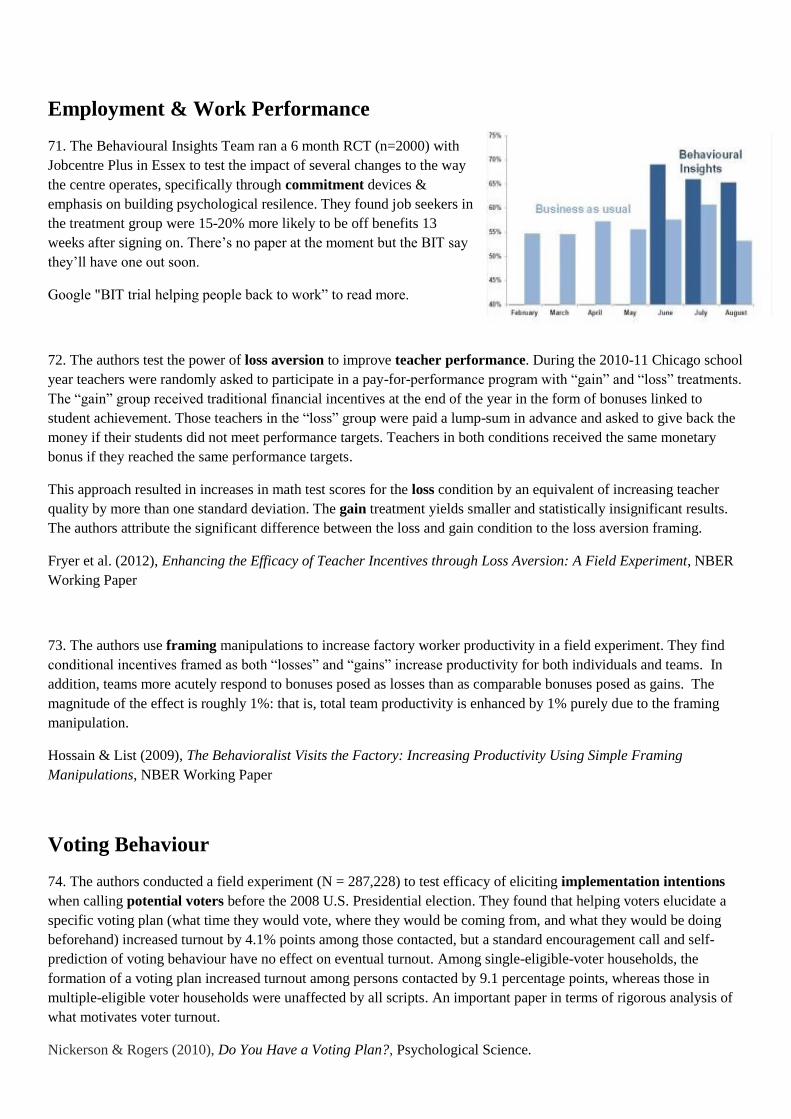
71. The Behavioural Insights Team ran a 6 month RCT (n=2000) with
Jobcentre Plus in Essex to test the impact of several changes to the way
the centre operates, specifically through commitment devices &
emphasis on building psychological resilence. They found job seekers in
the treatment group were 15-20% more likely to be off benefits 13
weeks after signing on. There’s no paper at the moment but the BIT say
they’ll have one out soon.
Google "BIT trial helping people back to work” to read more.
72. The authors test the power of loss aversion to improve teacher performance. During the 2010-11 Chicago school
year teachers were randomly asked to participate in a pay-for-performance program with “gain” and “loss” treatments.
The “gain” group received traditional financial incentives at the end of the year in the form of bonuses linked to
student achievement. Those teachers in the “loss” group were paid a lump-sum in advance and asked to give back the
money if their students did not meet performance targets. Teachers in both conditions received the same monetary
bonus if they reached the same performance targets.
This approach resulted in increases in math test scores for the loss condition by an equivalent of increasing teacher
quality by more than one standard deviation. The gain treatment yields smaller and statistically insignificant results.
The authors attribute the significant difference between the loss and gain condition to the loss aversion framing.
Fryer et al. (2012), Enhancing the Efficacy of Teacher Incentives through Loss Aversion: A Field Experiment, NBER
Working Paper
73. The authors use framing manipulations to increase factory worker productivity in a field experiment. They find
conditional incentives framed as both “losses” and “gains” increase productivity for both individuals and teams. In
addition, teams more acutely respond to bonuses posed as losses than as comparable bonuses posed as gains. The
magnitude of the effect is roughly 1%: that is, total team productivity is enhanced by 1% purely due to the framing
manipulation.
Hossain & List (2009), The Behavioralist Visits the Factory: Increasing Productivity Using Simple Framing
Manipulations, NBER Working Paper
Voting Behaviour
74. The authors conducted a field experiment (N = 287,228) to test efficacy of eliciting implementation intentions
when calling potential voters before the 2008 U.S. Presidential election. They found that helping voters elucidate a
specific voting plan (what time they would vote, where they would be coming from, and what they would be doing
beforehand) increased turnout by 4.1% points among those contacted, but a standard encouragement call and self-
prediction of voting behaviour have no effect on eventual turnout. Among single-eligible-voter households, the
formation of a voting plan increased turnout among persons contacted by 9.1 percentage points, whereas those in
multiple-eligible voter households were unaffected by all scripts. An important paper in terms of rigorous analysis of
what motivates voter turnout.
Nickerson & Rogers (2010), Do You Have a Voting Plan?, Psychological Science.
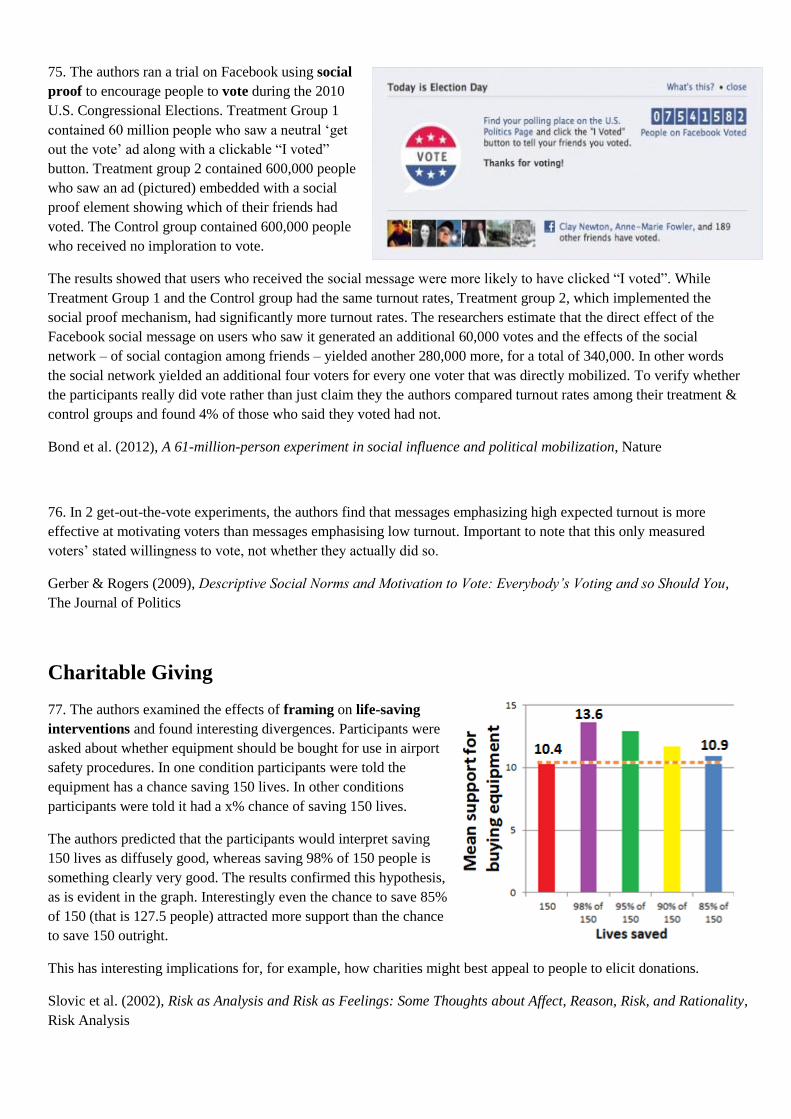
75. The authors ran a trial on Facebook using social
proof to encourage people to vote during the 2010
U.S. Congressional Elections. Treatment Group 1
contained 60 million people who saw a neutral ‘get
out the vote’ ad along with a clickable “I voted”
button. Treatment group 2 contained 600,000 people
who saw an ad (pictured) embedded with a social
proof element showing which of their friends had
voted. The Control group contained 600,000 people
who received no imploration to vote.
The results showed that users who received the social message were more likely to have clicked “I voted”. While
Treatment Group 1 and the Control group had the same turnout rates, Treatment group 2, which implemented the
social proof mechanism, had significantly more turnout rates. The researchers estimate that the direct effect of the
Facebook social message on users who saw it generated an additional 60,000 votes and the effects of the social
network – of social contagion among friends – yielded another 280,000 more, for a total of 340,000. In other words
the social network yielded an additional four voters for every one voter that was directly mobilized. To verify whether
the participants really did vote rather than just claim they the authors compared turnout rates among their treatment &
control groups and found 4% of those who said they voted had not.
Bond et al. (2012), A 61-million-person experiment in social influence and political mobilization, Nature
76. In 2 get-out-the-vote experiments, the authors find that messages emphasizing high expected turnout is more
effective at motivating voters than messages emphasising low turnout. Important to note that this only measured
voters’ stated willingness to vote, not whether they actually did so.
Gerber & Rogers (2009), Descriptive Social Norms and Motivation to Vote: Everybody’s Voting and so Should You,
The Journal of Politics
Charitable Giving
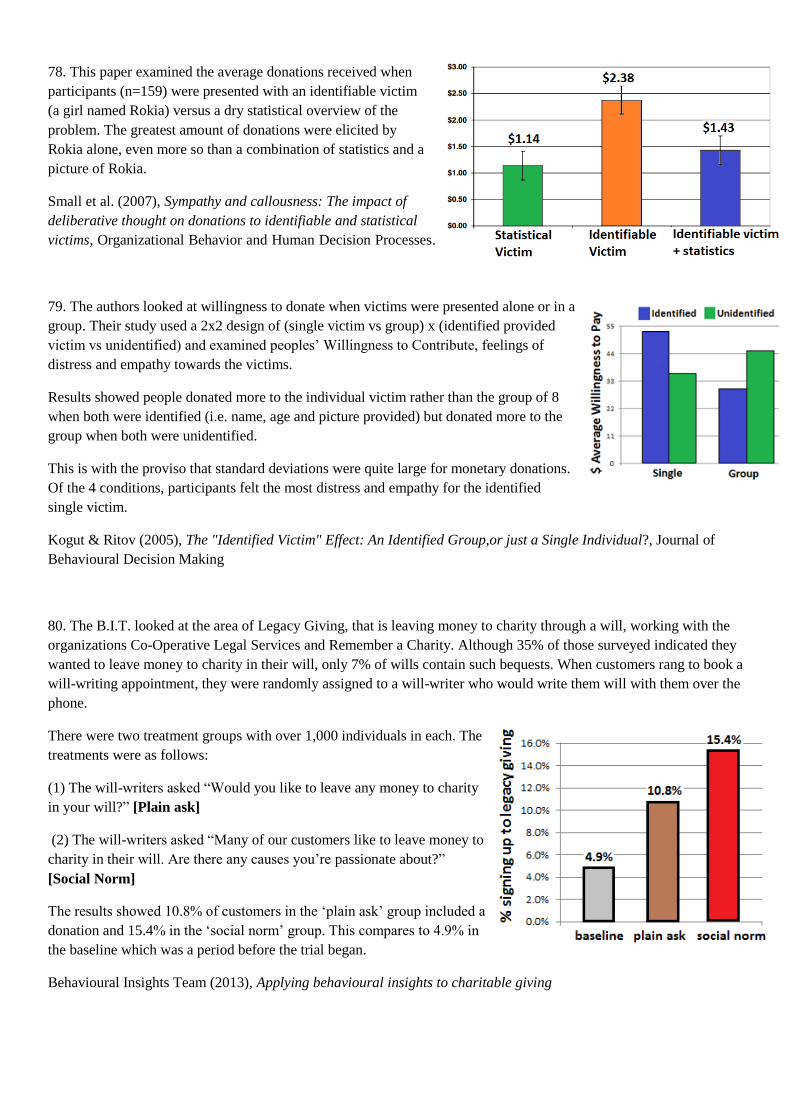
77. The authors examined the effects of framing on life-saving
interventions and found interesting divergences. Participants were
asked about whether equipment should be bought for use in airport
safety procedures. In one condition participants were told the
equipment has a chance saving 150 lives. In other conditions
participants were told it had a x% chance of saving 150 lives.
The authors predicted that the participants would interpret saving
150 lives as diffusely good, whereas saving 98% of 150 people is
something clearly very good. The results confirmed this hypothesis,
as is evident in the graph. Interestingly even the chance to save 85%
of 150 (that is 127.5 people) attracted more support than the chance
to save 150 outright.
This has interesting implications for, for example, how charities might best appeal to people to elicit donations.
Slovic et al. (2002), Risk as Analysis and Risk as Feelings: Some Thoughts about Affect, Reason, Risk, and Rationality,
Risk Analysis
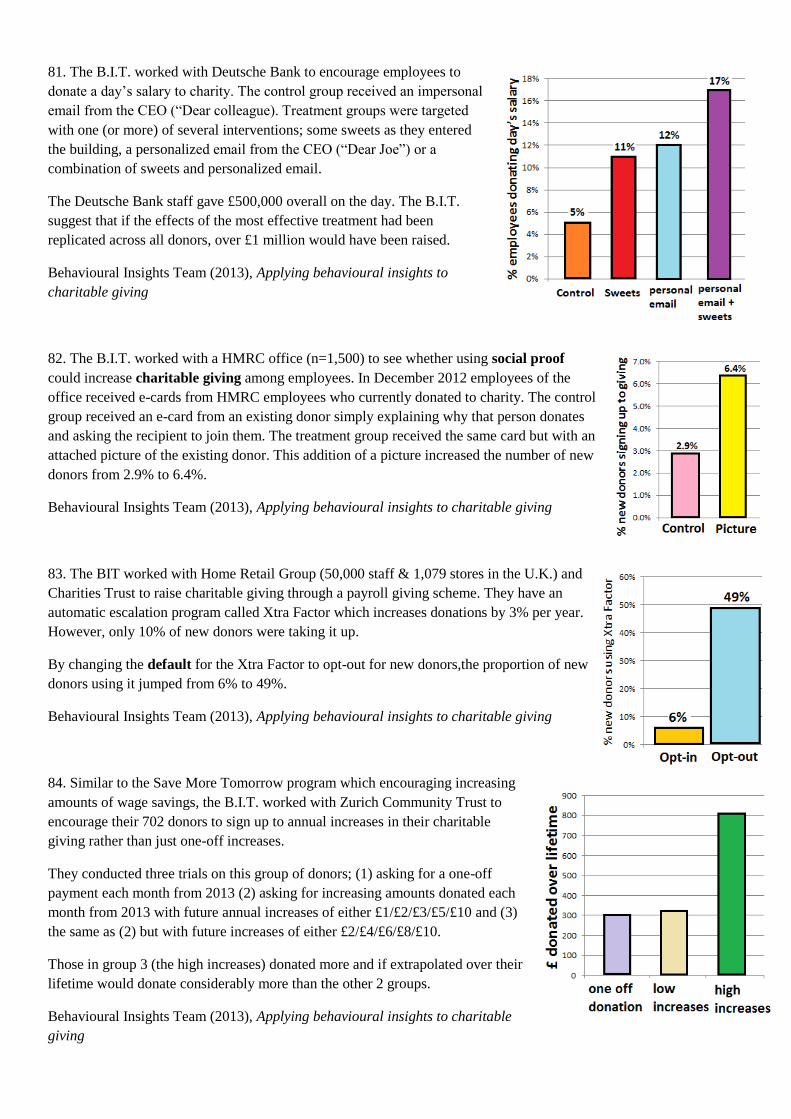
78. This paper examined the average donations received when
participants (n=159) were presented with an identifiable victim
(a girl named Rokia) versus a dry statistical overview of the
problem. The greatest amount of donations were elicited by
Rokia alone, even more so than a combination of statistics and a
picture of Rokia.
Small et al. (2007), Sympathy and callousness: The impact of
deliberative thought on donations to identifiable and statistical
victims, Organizational Behavior and Human Decision Processes.
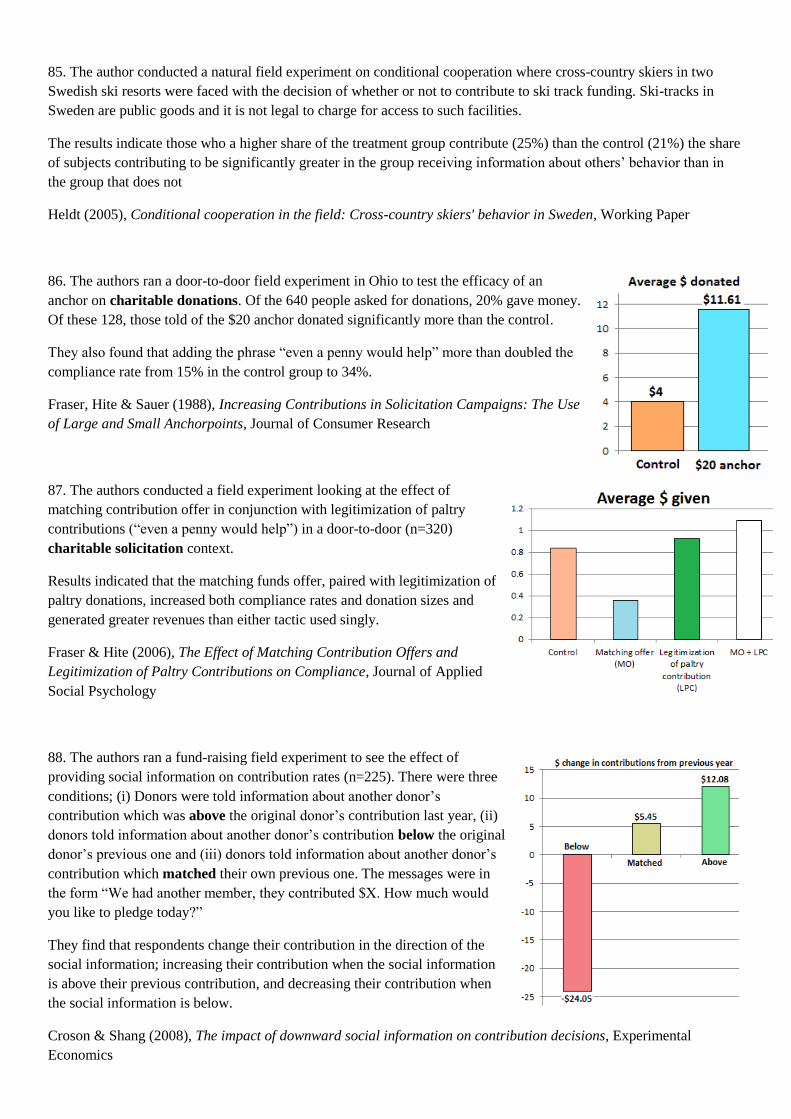
79. The authors looked at willingness to donate when victims were presented alone or in a
group. Their study used a 2x2 design of (single victim vs group) x (identified provided
victim vs unidentified) and examined peoples’ Willingness to Contribute, feelings of
distress and empathy towards the victims.
Results showed people donated more to the individual victim rather than the group of 8
when both were identified (i.e. name, age and picture provided) but donated more to the
group when both were unidentified.
This is with the proviso that standard deviations were quite large for monetary donations.
Of the 4 conditions, participants felt the most distress and empathy for the identified
single victim.
Kogut & Ritov (2005), The "Identified Victim" Effect: An Identified Group,or just a Single Individual?, Journal of
Behavioural Decision Making
80. The B.I.T. looked at the area of Legacy Giving, that is leaving money to charity through a will, working with the
organizations Co-Operative Legal Services and Remember a Charity. Although 35% of those surveyed indicated they
wanted to leave money to charity in their will, only 7% of wills contain such bequests. When customers rang to book a
will-writing appointment, they were randomly assigned to a will-writer who would write them will with them over the
phone.
There were two treatment groups with over 1,000 individuals in each. The
treatments were as follows:
(1) The will-writers asked “Would you like to leave any money to charity
in your will?” [Plain ask]
(2) The will-writers asked “Many of our customers like to leave money to
charity in their will. Are there any causes you’re passionate about?”
[Social Norm]
The results showed 10.8% of customers in the ‘plain ask’ group included a
donation and 15.4% in the ‘social norm’ group. This compares to 4.9% in
the baseline which was a period before the trial began.
Behavioural Insights Team (2013), Applying behavioural insights to charitable giving
81. The B.I.T. worked with Deutsche Bank to encourage employees to
donate a day’s salary to charity. The control group received an impersonal
email from the CEO (“Dear colleague). Treatment groups were targeted
with one (or more) of several interventions; some sweets as they entered
the building, a personalized email from the CEO (“Dear Joe”) or a
combination of sweets and personalized email.
The Deutsche Bank staff gave £500,000 overall on the day. The B.I.T.
suggest that if the effects of the most effective treatment had been
replicated across all donors, over £1 million would have been raised.
Behavioural Insights Team (2013), Applying behavioural insights to
charitable giving
82. The B.I.T. worked with a HMRC office (n=1,500) to see whether using social proof
could increase charitable giving among employees. In December 2012 employees of the
office received e-cards from HMRC employees who currently donated to charity. The control
group received an e-card from an existing donor simply explaining why that person donates
and asking the recipient to join them. The treatment group received the same card but with an
attached picture of the existing donor. This addition of a picture increased the number of new
donors from 2.9% to 6.4%.
Behavioural Insights Team (2013), Applying behavioural insights to charitable giving
83. The BIT worked with Home Retail Group (50,000 staff & 1,079 stores in the U.K.) and
Charities Trust to raise charitable giving through a payroll giving scheme. They have an
automatic escalation program called Xtra Factor which increases donations by 3% per year.
However, only 10% of new donors were taking it up.
By changing the default for the Xtra Factor to opt-out for new donors,the proportion of new
donors using it jumped from 6% to 49%.
Behavioural Insights Team (2013), Applying behavioural insights to charitable giving
84. Similar to the Save More Tomorrow program which encouraging increasing
amounts of wage savings, the B.I.T. worked with Zurich Community Trust to
encourage their 702 donors to sign up to annual increases in their charitable
giving rather than just one-off increases.
They conducted three trials on this group of donors; (1) asking for a one-off
payment each month from 2013 (2) asking for increasing amounts donated each
month from 2013 with future annual increases of either £1/£2/£3/£5/£10 and (3)
the same as (2) but with future increases of either £2/£4/£6/£8/£10.
Those in group 3 (the high increases) donated more and if extrapolated over their
lifetime would donate considerably more than the other 2 groups.
Behavioural Insights Team (2013), Applying behavioural insights to charitable
giving
85. The author conducted a natural field experiment on conditional cooperation where cross-country skiers in two
Swedish ski resorts were faced with the decision of whether or not to contribute to ski track funding. Ski-tracks in
Sweden are public goods and it is not legal to charge for access to such facilities.
The results indicate those who a higher share of the treatment group contribute (25%) than the control (21%) the share
of subjects contributing to be significantly greater in the group receiving information about others’ behavior than in
the group that does not
Heldt (2005), Conditional cooperation in the field: Cross-country skiers' behavior in Sweden, Working Paper
86. The authors ran a door-to-door field experiment in Ohio to test the efficacy of an
anchor on charitable donations. Of the 640 people asked for donations, 20% gave money.
Of these 128, those told of the $20 anchor donated significantly more than the control.
They also found that adding the phrase “even a penny would help” more than doubled the
compliance rate from 15% in the control group to 34%.
Fraser, Hite & Sauer (1988), Increasing Contributions in Solicitation Campaigns: The Use
of Large and Small Anchorpoints, Journal of Consumer Research
87. The authors conducted a field experiment looking at the effect of
matching contribution offer in conjunction with legitimization of paltry
contributions (“even a penny would help”) in a door-to-door (n=320)
charitable solicitation context.
Results indicated that the matching funds offer, paired with legitimization of
paltry donations, increased both compliance rates and donation sizes and
generated greater revenues than either tactic used singly.
Fraser & Hite (2006), The Effect of Matching Contribution Offers and
Legitimization of Paltry Contributions on Compliance, Journal of Applied
Social Psychology
88. The authors ran a fund-raising field experiment to see the effect of
providing social information on contribution rates (n=225). There were three
conditions; (i) Donors were told information about another donor’s
contribution which was above the original donor’s contribution last year, (ii)
donors told information about another donor’s contribution below the original
donor’s previous one and (iii) donors told information about another donor’s
contribution which matched their own previous one. The messages were in
the form “We had another member, they contributed $X. How much would
you like to pledge today?”
They find that respondents change their contribution in the direction of the
social information; increasing their contribution when the social information
is above their previous contribution, and decreasing their contribution when
the social information is below.
Croson & Shang (2008), The impact of downward social information on contribution decisions, Experimental
Economics
89. This paper conducted two field experiments to test inter-temporal choices in charitable giving by varying the
timing of commitment and payment. Monthly donors were asked to increase their contributions (1) immediately, (2) in
one month, (3) in two months.
The results are consistent between the two field experiments. Firstly, mean increases in donations are significantly
higher when donors are asked to commit to future donations. Secondly, follow-up data shows that the treatment effect
is persistent, making the strategy highly profitable to the charity. Finally, there is evidence of heterogeneity in the
response to different timelags, indicating differences in inter-temporal choices among donors.
Breman (2011), Give more tomorrow: two field experiments on altruism and intertemporal choice, Journal of Public
Economics
Law Abiding Behaviour
90. When nudges go wrong. In an attempt to reduce the theft of wood from Arizona’s Petrified
Forest National Park the authors put up a sign with the descriptive social normative message
“Many past visitors have removed petrified wood from the Park, changing the natural state of
the Petrified Forest”. This led to a near 8% increase in wood theft, as people interpreted the
salient message to be “theft is common” rather than “theft is bad”.
Cialdini (2003), Crafting Normative Messages to Protect the Environment, Current Directions
in Psychological Science
Other
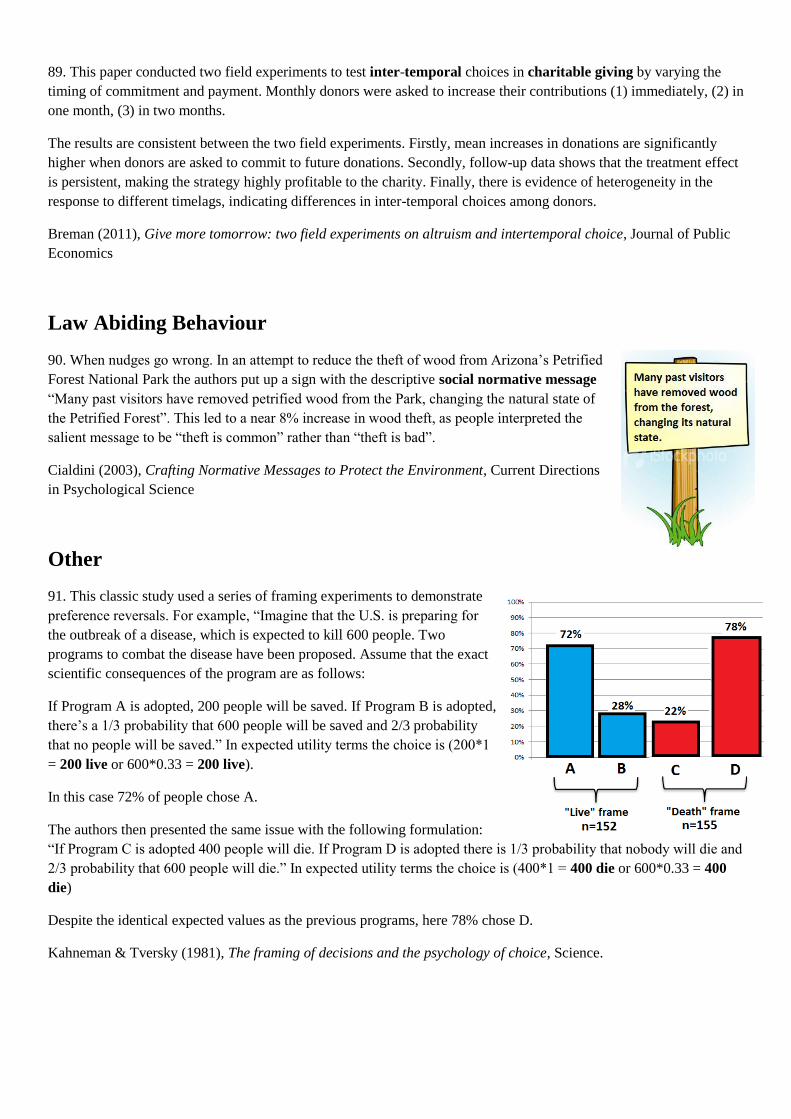
91. This classic study used a series of framing experiments to demonstrate
preference reversals. For example, “Imagine that the U.S. is preparing for
the outbreak of a disease, which is expected to kill 600 people. Two
programs to combat the disease have been proposed. Assume that the exact
scientific consequences of the program are as follows:
If Program A is adopted, 200 people will be saved. If Program B is adopted,
there’s a 1/3 probability that 600 people will be saved and 2/3 probability
that no people will be saved.” In expected utility terms the choice is (200*1
= 200 live or 600*0.33 = 200 live).
In this case 72% of people chose A.
The authors then presented the same issue with the following formulation:
“If Program C is adopted 400 people will die. If Program D is adopted there is 1/3 probability that nobody will die and
2/3 probability that 600 people will die.” In expected utility terms the choice is (400*1 = 400 die or 600*0.33 = 400
die)
Despite the identical expected values as the previous programs, here 78% chose D.
Kahneman & Tversky (1981), The framing of decisions and the psychology of choice, Science.

92. This paper delineates the diminishing sensitivity in valuing
lifesaving interventions when there is an increasing number of lives at
risk. The authors call this tendency “psychophysical numbing”,
represented in later research by the “collapse of compassion” model.
For illustrative purposes, the top image to the right represents a
normative model of how we should value human lives, the bottom image
represents the collapse model that this research investigates.
This paper has 3 studies illustrating psychophysical numbing in different
contexts. In one study subjects had to decide which medical institution to
award $10 million to – A, B or C. Subjects had to indicate how many
lives would have to be saved by the treatment to merit receiving the
award.
A – Would save 15,000 lives.
B – Would save 160,000.
C – Would save 290,000.
65% of participants gave estimates that increased as the size of the population at risk increased (indicating something
like the collapse model is at work). Only 28% gave required that the same number be saved, regardless of population
size (indicating a normative model).
Slovic et al. (1997), Insensitivity to the Value of Human Life: A Study of Psychophysical Numbing, Journal of Risk and
Uncertainty.
93. The authors developed a model of limited attention in intertemporal choice, predicting that reminders may
increase saving and that they will be more effective when they increase the salience of a specific expenditure.
Karlan et al. (2010), Getting to the Top of Mind: How Reminders Increase Saving, NBER Working Paper
94. This experiment (n=150) tested the impact of various notes on the likelihood of
a person completing a survey. For those who received only the survey and cover
page the completion rate was 36%, compared to 48% for those with a handwritten
message on the front-page and 76% when the survey was accompanied by a hand-
written post-it note.
Garner (2005), Post-It® note persuasion: a sticky influence, Journal of Consumer
Psychology
95. The authors elicit subjects' beliefs about the likelihood that they will redeem a mail-in form. Expected redemption
rates exceed actual redemption rates by 49 percentage points, meaning that subjects are overoptimistic about their
likelihood of redemption. The authors conduct three treatments to reduce overoptimism; (1) informing subjects about
a previous cohort's redemption rates, (2) reminding subjects about the redemption deadline and (3) reducing
transaction costs (i.e. making it easier). Only the third nudge had any effect and it reduced overoptimism by one half.
The third nudge increased redemption but had no effect on beliefs suggesting that weak cost-salience is the
mechanism for overoptimism.
Letzler & Tasoff (2013), Everyone Believes in Redemption: Nudges and Overoptimism in Costly Task Completion,
Working Paper.
96. This paper looks at risk preferences. An interesting example is the premium that people are willing to pay for
zero-risk through the following hypothetical: “Consider a $10 pesticide that produces a toxic reaction 15 times for
every 10,000 times used. How much is an equally effective pesticide worth if it reduces the risk to 10 /5/0 incidences
per 10,000 uses?”
Results showed people would pay $1.04 extra for the reduction from 15 to 10 reactions and $2.41 extra for the
reduction from 5 to 0. People valued absolute elimination of risk disproportionately more than mere reduction in
probability of harm.
Viscusi et al. (1987), An Investigation of the Rationality of Consumer Valuations of Multiple Health Risks, RAND
Journal of Economics.
97. An older, reasonably famous paper about the use of priming in a wine shop. By playing French or German music
in the background, sales of French and German wine seemed to be significantly affected.
North (1997), Instore Music Affects Product Choice, Nature
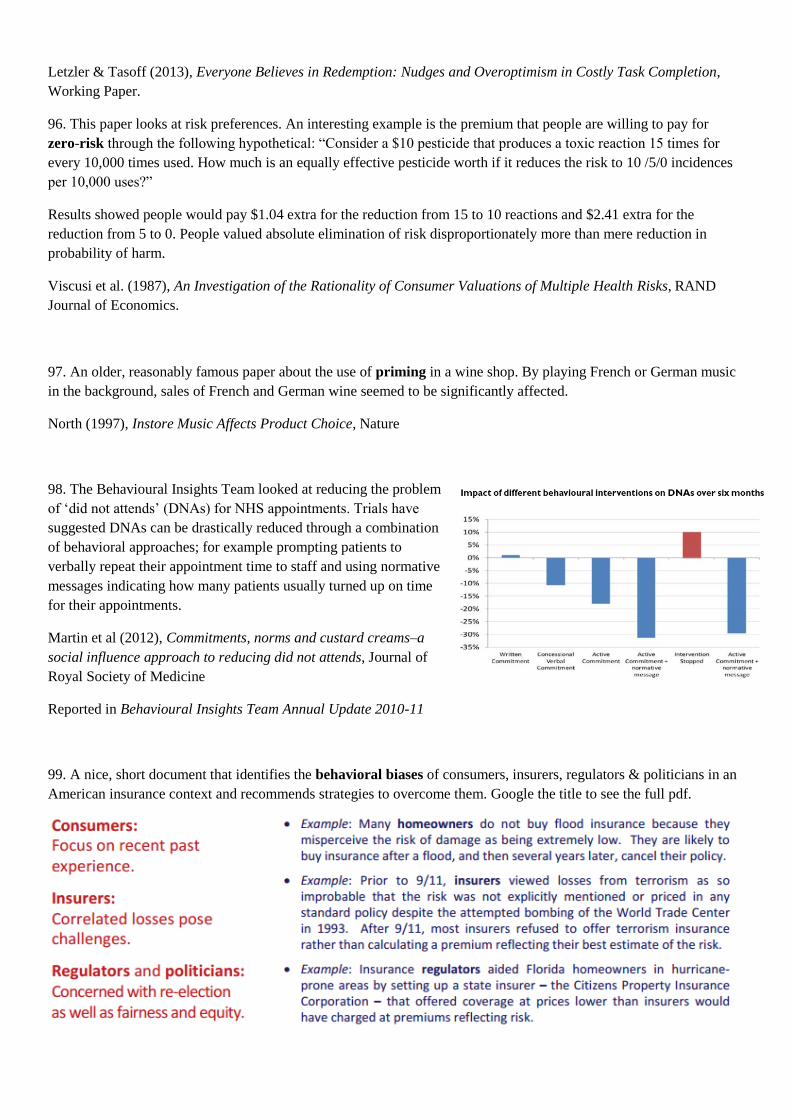
98. The Behavioural Insights Team looked at reducing the problem
of ‘did not attends’ (DNAs) for NHS appointments. Trials have
suggested DNAs can be drastically reduced through a combination
of behavioral approaches; for example prompting patients to
verbally repeat their appointment time to staff and using normative
messages indicating how many patients usually turned up on time
for their appointments.
Martin et al (2012), Commitments, norms and custard creams–a
social influence approach to reducing did not attends, Journal of
Royal Society of Medicine
Reported in Behavioural Insights Team Annual Update 2010-11
99. A nice, short document that identifies the behavioral biases of consumers, insurers, regulators & politicians in an
American insurance context and recommends strategies to overcome them. Google the title to see the full pdf.
Kunreuther et al. (2012), Insurance and Behavioral Economics : Improving Decisions in the Most Misunderstood
Industry
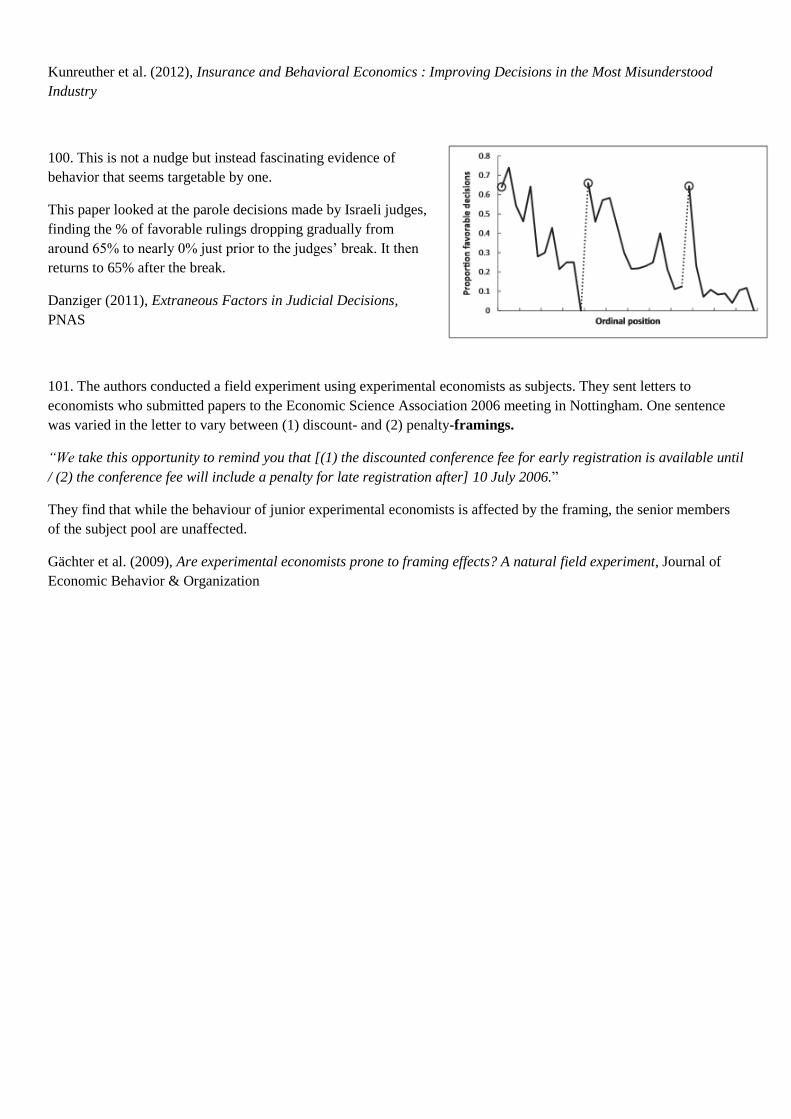
100. This is not a nudge but instead fascinating evidence of
behavior that seems targetable by one.
This paper looked at the parole decisions made by Israeli judges,
finding the % of favorable rulings dropping gradually from
around 65% to nearly 0% just prior to the judges’ break. It then
returns to 65% after the break.
Danziger (2011), Extraneous Factors in Judicial Decisions,
PNAS
101. The authors conducted a field experiment using experimental economists as subjects. They sent letters to
economists who submitted papers to the Economic Science Association 2006 meeting in Nottingham. One sentence
was varied in the letter to vary between (1) discount- and (2) penalty-framings.
“We take this opportunity to remind you that [(1) the discounted conference fee for early registration is available until
/ (2) the conference fee will include a penalty for late registration after] 10 July 2006.”
They find that while the behaviour of junior experimental economists is affected by the framing, the senior members
of the subject pool are unaffected.
Gächter et al. (2009), Are experimental economists prone to framing effects? A natural field experiment, Journal of
Economic Behavior & Organization