Embed Size (px)
Citation preview


NTPC: Vision and Core Values
Core Values
To be the world’s largest and best power producer, To be the world’s largest and best power producer,
powering India’s growthpowering India’s growth
BE-COMMITTED
2

Outline
An OverviewAn Overview
Financial HighlightsFinancial Highlights
Operations HighlightsOperations Highlights
Realigning in Changing Business EnvironmentRealigning in Changing Business Environment
Technological ProgressionTechnological Progression
3
Risks & MitigationRisks & Mitigation
NTPC, Unchahar
Sustainability InitiativesSustainability Initiatives

NTPC- A Powerful Maharatna�With 15% of India’s total installed
capacity NTPC Group contributed
24% to All India generation during
FY 16.
�NTPC is one of the 7 Maharatnas
of Government of India
�Clocked the 4th highest profit
amongst PSUs in FY 16
�Ranked 400th biggest company in
the world in the Forbes Global
2000 list 2016
�Ranked No.2 IPP and Energy
Trader Globally by Platts 2015
Leading Generator for > 2 decades
� Total installed capacity of 47,228 MW
(incl. 6,966 MW through group
companies) + 24,009 MW under
construction
� 1st Hydro project of 800 MW at Koldam
declared commercial
� 360 MW Solar PV capacity
commissioned, 510 MW under
construction
� Committed to set up 10000 MW of
Renewables over next 4-5 years.
Operational Excellence
� Highest ever gross generation of 241.98
BUs (standalone)-NTPC Group recorded
Gross generation of 263.42 BUs FY 16
� Maintaining lead over All India PLF -Coal
stations achieved PLF of 78.61% against
All India PLF of 62.28%
� Top 3 coal stations in the country in
terms of PLF belong to NTPC
� Achieved highest ever quarterly
generation of 64.56 BUs during Q1 /FY17
- registering a growth of 10% QoQ.
Shareholding Pattern
(as on 15.07.2016)
� NTPC is an Institution…… crucial for building capacity in India’s surging power sector
� Capacity set to cross 50 GW this fiscal……… inching towards 24X7 Power for all
Presence in Power Value Chain
� Subsidiary NVVN traded 12.7 BUs in FY16
as compared to 10.4 BUs in FY 15
� Also trades power with Bangladesh -
nodal agency for trading power with
Nepal & Bhutan
� Providing Consultancy in various areas of
Power Generation in domestic and
international market
� International presence- Setting up
2X250MW and 2X660MW coal based
plants in Sri Lanka & Bangladesh
Coal Mining
� 10 coal mining blocks allotted, with total
Geological Reserves of around 7.3 BT
� Blocks have production potential of ~107
MTPA - can cater to the requirement of
~20000 MW of generation capacity
� Commenced Mining at Pakri Barwadih
Coal Mining Block from western pit on
17.05.2016.
� Expect to produce 1MT of coal in the
current fiscal.
Shareholding Pattern
(as on 15.07.2016)
69.74%
11.08%
16.04%
1.85% 1.29%
GoI FIIs DIIs Retail Others

Sipat 2,980MW
Lara 1,600MW
Durgapur
(120MW)
Mouda (2,320MW)Kawas
(645MW)
Gandhar
(648MW)
Talcher Thermal
Talcher Kaniha
(3,000MW) + 10MW Solar
Bhilai
574MW
Rourkela
(120MW)Korba(2,600M
W)
Kahalgaon (2,340MW)
Kanti
(610MW)
Barh 3,300MW
Nabinagar(1,000MW + 1980 MW)
Tanda (1760 MW)
Unchahar (1,550MW) &(10 MW Solar)
Meja (1,320MW)
Vindhyachal (4,760MW)
Singrauli (2,023MW)
Auraiya (652MW)
Anta
(413MW)
Jhajjar (1,500MW)
Badarpur (705MW)NCTPP (1,820MW)
Faridabad (430MW +5MW Solar)
Dadri (817MW) Dadri SolarPV (5MW)Lata Tapovan (171MW)
Koldam
(800MW)
Rihand 3,000MW Farakka 2,100MW
Bongaigaon (750MW)
Tapovan Vishnugad (520MW)
Gadarwara (1600 MW)
Rajgarh Solar PV
50 MW Daralipali
(1600MW)
NKP 1980MW
NTPC Group: Pan India Presence
Rammam (120MW)
Khargone
Share of Electricity Generated
(during Q1 FY17)
24%
Rest of India 224.98 BUsNTPC (Group) 71.50 BUs
NTPC group today is 47228 MW strong
85%
15%
Rest of
Share of Installed Capacity
(*as on June 30,2016)
*Rest of India 255940 MW*NTPC (Group) 47178 MW
76%
Lara 1,600MW
Kayamkulam
(350MW)
Vallur
(1,500MW)
Kudgi
(2,400MW)
Ratnagiri
(1,940MW)
Solapur
(1,320MW)
Simhadri
(2,000MW)
Ramagundam
(2,600MW) + (10MW solar)
(645MW) Talcher Thermal
(460MW)
A&N Solar PV (5MW)
5
Fuel Mix
Geographically well diversified presence……. Group presence across 20 Indian StatesGeographically well diversified presence……. Group presence across 20 Indian States
Thermal Power Stations Ongoing Hydro Power Projects Gas Power Stations
Ongoing Thermal Projects Solar PV
Map not to scale. Includes capacity of under construction plants
Khargone
1320 MW
Anantpur Solar
(250MW)
Fuel Mix No. of Plants Capacity (MW) % Share
NTPC Owned
Coal 18 35,085 74.29%
Gas/Liquid Fuel 7 4,017 8.51%
Hydro 1 800 1.69%
Solar 9 360 0.76%
Sub-total 35 40,262 85.25%
Owned by JVs and Subsidiaries
Coal 8 4,999 10.58%
Gas 1 1,967 4.17%
Sub-total 9 6,966 14.75%
Total 44 47,228 100.00%
Telangana
(1600MW)
Hydro Power Stations

NTPC Group - Subsidiaries and Joint VenturesNTPC Group - Subsidiaries and Joint Ventures
Patratu Vidyut Utpadan Nigam
Ltd. (74%)
Equipment Manufacturing
NTPC BHEL Power Projects Pvt.
Ltd. (50%)
BF NTPC Energy Systems Ltd.
(49%)1
Transformers and Electricals
Kerala Ltd. (44.60%)*
Services
NTPC Electric Supply
Company Ltd. (100%)
Utility Powertech Ltd. (50%)
NTPC Alstom Power Services
Pvt. Ltd. (50%)
National High Power Test
Laboratory Pvt. Ltd. (21.63%)
Energy Efficiency
Coal Acquisition
International Coal Ventures Pvt.
Power Generation
Kanti Bijlee Utpadan
Nigam Ltd. (65%)
Bhartiya Rail Bijlee Company Ltd.
(74%)
Aravali Power Company Pvt. Ltd.
(50%)
NTPC Tamil Nadu Energy
NTPC has set up 5 Subsidiaries and 22 Joint Ventures to pursue its growth objectives
on the foundation of Strong Financials
�Out of the 27 group
companies, 12 are
operational and 6 of
them registered an
aggregate profit of ₹
1,048.10 crore in FY
16.
�JVs and Subsidiaries
together paid a
Balance Sheet Consol Stand-alone
Total Debt 1,09,889 91,810
Rs. croreFY 16
Strong
Financials
Patratu Vidyut Utpadan Nigam
Ltd. (74%)
NTPC BHEL Power Projects Pvt.
Ltd. (50%)*
BF NTPC Energy Systems Ltd.
(49%)1
NTPC Electric Supply
Company Ltd. (100%)
Utility Powertech Ltd. (50%)
NTPC Alstom Power Services
Pvt. Ltd. (50%)
Kanti Bijlee Utpadan
Nigam Ltd. (65%)
Bhartiya Rail Bijlee Company Ltd.
(74%)
Subsidiaries Joint Ventures
Power Trading
NTPC Vidyut Vyapar
Nigam Ltd. (100%)
National Power Exchange Ltd.
(16.67%)*
Energy Efficiency
Service Limited (28.80%)
International Coal Ventures Pvt.
Ltd. (0.13%)*
NTPC SCCL Global Ventures Pvt.
Ltd. (50%)**
CIL NTPC Urja Pvt. Ltd. (50%)
NTPC Tamil Nadu Energy
Company Ltd. (50%)
Nabinagar Power Generating
Company Pvt. Ltd. (50%)
Meja Urja Nigam Pvt. Ltd. (50%)
NTPC SAIL Power Company Pvt.
Ltd. (50%)
Anushakti Vidyut Nigam Ltd.
(49%)
Ratnagiri Gas and
Power Pvt. Ltd. (25.51%)
Trincomalee Power
Company Ltd. (50%)
Pan-Asian Renewables
Pvt. Ltd. (50%)**
Bangladesh India Friendship
Power Company Pvt Ltd. (50%)
Note: Figures in brackets indicate holding of NTPC as on March 31, 2016.
together paid a
dividend of ₹ 134.40
crore during FY 16.
�Investment in Group
Companies
as on 31.03.2016 is
Rs.7,950 crore,
Operational
investments are
Rs.4,355 crore.
�Group companies to
unlock their value
and add to our
earnings.
Cash & Bank 5,393 4,406
Net Debt 1,04,496 87,404
Net Worth 89,196 88,782
P&L Consol Stand-alone
Revenue 79,940 71,696
EBITDA 20,397 18,702
PAT 10,162 10,243
Fertilizer Plants
Hindustan Urvarak & Rasayan
Limted (50%)
*Company has resolved to withdraw from NTPC-
BHEL, ICVL, BF-NTPC and TELK.
**NTPC-SCCL ,NPEX and Pan-Asian Renewables
are under voluntary winding-up by members.

What We Promised … Is what we delivered in FY16
Guidance Performance
� Target PAF (Coal)(FY16) : To achieve
CERC norms
� PAF (Coal) : All stations achieved CERC norms of PAF (DC) except Farakka &
Badarpur
� Commissioning of capacity � 2255 MW commissioned in FY16 as against MOU target of 2145 MW.
� 575 MW has been added to company’s capacity during FY17, till date.
� Capex (standalone) Target of
Rs.23,000 crore in FY16
� Capex incurred Rs. 25,737 crore (112% of target)
� New projects award- No explicit � Investment Approval of 2360 MW in FY 16 (Rs.15,482 crore):
Actual Performance Against Commitments Made to Investors for FY16
1
2
3
4 � New projects award- No explicit
target given
� Investment Approval of 2360 MW in FY 16 (Rs.15,482 crore):
� 250 MW Ananthapuramu Solar(Rs.1,779 crore)
� 1600 MW Telangana-I STPP (Rs.10,599 crore)
� 260 MW Bhadla Solar(Rs.1,601 crore)
� 250 MW Mandsaur Solar (Rs.1,503 crore)
� Start of mining � Pakri Barwadih Mine opened from western pit on 17.05.2016.
� Cost Optimisation � Reduced ECR due to rationalization of linkages and reduced imported coal
consumption.
� Regulated Equity � Regulated Equity stands at Rs.41,420.42 crore as at 31.03.2016 as against
projection of ~Rs.40,000 crore.
4
5
7Awarded investment approval to projects worth Rs. 1,52,387 crore during FY12 to FY16
6
7

8
Financial Highlights
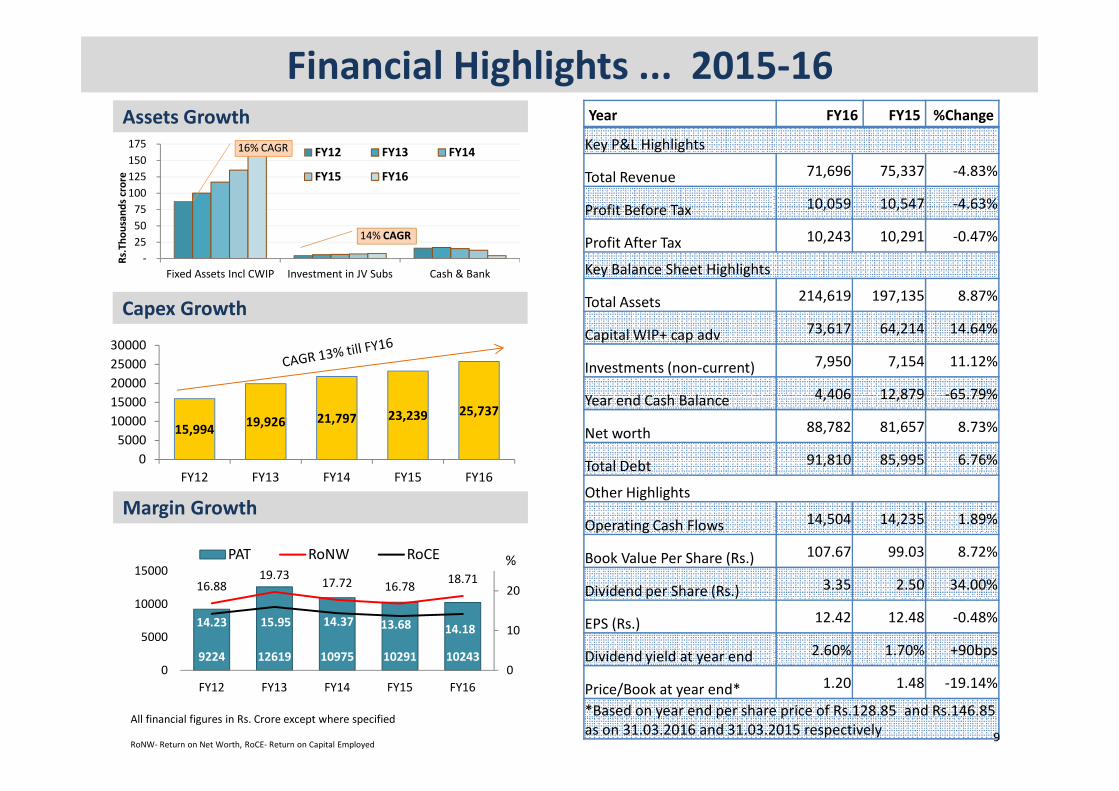
-
25
50
75
100
125
150
175
Fixed Assets Incl CWIP Investment in JV Subs Cash & Bank
Rs.
Th
ou
san
ds
cro
re
FY12 FY13 FY14
FY15 FY16
16% CAGR
14% CAGR
Financial Highlights ... 2015-16Year FY16 FY15 %Change
Key P&L Highlights
Total Revenue 71,696 75,337 -4.83%
Profit Before Tax 10,059 10,547 -4.63%
Profit After Tax 10,243 10,291 -0.47%
Key Balance Sheet Highlights
Total Assets 214,619 197,135 8.87%
Capital WIP+ cap adv 73,617 64,214 14.64%
Investments (non-current) 7,950 7,154 11.12%
Year end Cash Balance 4,406 12,879 -65.79%
Assets Growth
Capex Growth
15000
20000
25000
30000
Year end Cash Balance 4,406 12,879 -65.79%
Net worth 88,782 81,657 8.73%
Total Debt 91,810 85,995 6.76%
Other Highlights
Operating Cash Flows 14,504 14,235 1.89%
Book Value Per Share (Rs.) 107.67 99.03 8.72%
Dividend per Share (Rs.) 3.35 2.50 34.00%
EPS (Rs.) 12.42 12.48 -0.48%
Dividend yield at year end 2.60% 1.70% +90bps
Price/Book at year end* 1.20 1.48 -19.14%
*Based on year end per share price of Rs.128.85 and Rs.146.85
as on 31.03.2016 and 31.03.2015 respectively
9224 12619 10975 10291 10243
16.8819.73
17.72 16.7818.71
14.23 15.95 14.37 13.68 14.18
0
10
20
0
5000
10000
15000
FY12 FY13 FY14 FY15 FY16
PAT RoNW RoCE %
Margin Growth
9
All financial figures in Rs. Crore except where specified
RoNW- Return on Net Worth, RoCE- Return on Capital Employed
15,99419,926 21,797 23,239 25,737
0
5000
10000
15000
FY12 FY13 FY14 FY15 FY16

Particulars 2015-16 2014-15 2013-14 2012-13 2011-12
Operating Income 70,507 73,237 72,019 65,674 62,052
Other Income 1,189 2,100 2,689 3,102 2,778
Total Income 71,696 75,337 74,708 68,776 64,830
EBITDA 18,702 18,202 20,453 20,216 16,830
Profit before tax 10,046 10,547 13,905 16,579 12,326
Profit after tax 10,243 10,291 10,975 12,619 9,224
Dividend 2,762 2,061 4,741 4,741 3,298
Total Fixed Assets (Net block) 158,063 135,343 117,000 100,046 87,086
Investments (Non-current) 7,949 7,154 8,121 9,138 9,584
Net-worth 88,782 81,657 85,815 80,388 73,291
Total Debt 91,810 85,995 67,170 58,146 50,279
Key 5 year Financial HighlightsRs. crore
� Core Income
grew by over 5%
(YoY) after two
years.
� Higher
leverage leading
to improved RoE
� Growth
represented by
increase in Net
Fixed Assets
� Realign-Total Debt 91,810 85,995 67,170 58,146 50,279
Value added 27,921 25,078 25,966 22,999 19,738
Debt to equity(times) 1.03 1.05 0.78 0.72 0.69
High Dividend PayoutsHigh Dividend Payouts
Paying dividend for last 23 years.
� Realign-
ment of net-
worth improved
core RoE
10
3,826 5,523 5,546 2,479 3,320
40.00%
57.50% 57.50%
25.00%
33.50%*
41.48% 43.77%
50.53%
24.09%
32.42%
0
1000
2000
3000
4000
5000
6000
0%
10%
20%
30%
40%
50%
60%
70%
2011-12 2012-13 2013-14 2014-15 2015-16Dividend incl TaxDividend % (of paid up capital)Dividend including DDT as a % of PAT
*including proposed final dividend of
17.50% for 2015-16
NTPC Scrip Vs. NIFTY 50 during Q1/FY17NTPC Scrip Vs. NIFTY 50 during Q1/FY17
7849.808160.10
8287.75
7738.40
139.30143.15
156.30
100.00
105.00
110.00
115.00
120.00
125.00
Mar'16 Apr'16 May'16 Jun'16
Re
turn
s o
n B
ase
=1
00
NTPC Scrip has given a three fold return in Q1/FY 17 vis a
vis NIFTY 50 Index (Base=100)
NIFTY 50
NTPC
128.85

Robust Financials- Proven All round Track Record
Capacity (NTPC Group) * Generation (NTPC Standalone)
0.0020.82
61.57
99.16
133.19
232.03233.28 241.26 241.98
FY82 FY87 FY92 FY97 FY02 FY13 FY14 FY15 FY16
2003100
11333
1679520249
34194
4118444398
46653
FY82 FY87 FY92 FY97 FY02 FY11 FY13 FY15 FY16
MW Units in Billion
57,407
64,831 68,776
74,708 75,337 71,696
FY 11 FY 12 FY 13 FY 14 FY 15 FY 16
Total Revenue1Total Assets1
1,25,708 1,40,838
1,61,116 1,79,554
1,97,134 2,14,619
FY 11 FY 12 FY 13 FY 14 FY 15 FY 16
11
Rs. croreRs. crore
Note:.
1. Based on stand-alone NTPC numbers.
*including rating difference of 89 MW in case of gas stations

43,188 50,279 58,146
67,170 85,995 91,810
1,11,080 1,23,571
1,38,534 1,52,986
1,67,653 1,80,592
FY 11 FY 12 FY 13 FY 14 FY 15 FY 16
Total Debt Total Capitalisation
0.64x0.69x 0.72x
0.78x
1.05x 1.03x
FY 11 FY 12 FY 13 FY14 FY15 FY16
Robust Financials- Proven All round Track Record
Total Debt and Capitalization1 Debt/Equity1
Current Ratio
Rs. crore
2.6x
2.3x
1.8x1.6x
1.2x
0.9x
FY 11 FY 12 FY 13 FY 14 FY 15 FY 16
Interest Service Coverage Ratio1 Current Ratio1
1. Based on stand-alone NTPC numbers.
Strong Credit Metrics Ensure Debt at Optimal Cost
11.4x
9.8x10.4x
8.6x
6.7x5.9x
FY 11 FY 12 FY 13 FY 14 FY 15 FY 16
12

NTPC, Talcher Kaniha
13
Operations Highlights

Highly Efficient Plant Operations� Consistently maintaining spread of 15%-16% over the last 2
decades on All-India level.
� 6 NTPC coal stations amongst the top 10 stations of the
country in terms of PLF - Talcher TPS (PLF 93.15%) is ranked 1st
in FY 2015-16
� All stations recovered full Annual Fixed Charges under CERC
regulations in FY 2015-16 except Farakka & BTPS
� Through in-depth engineering, renovation and management
capabilities has turned around sick plants across India
� Operating and managing 177 units with varied fuel sources and
technologies.
135.37
192.86
249.74 250.63 260.58
263.42
133.19
188.67
232.03 233.28241.26 241.98
FY 02 FY 07 FY 13 FY 14 FY 15 FY 16
NTPC (Group) NTPC (Standalone)
Standalone and Group Generation during last 2 decades (in BUs)
Contribution from Group Companies in total generation has increased 10
fold from the beginning of 10th Plan.
84.1%*88.7%*
92.1%* 91.8% 88.7%91.9%
75.2%
83.6%
92.2%
81.5% 80.2%78.6%
64.7%
72.2%78.6%
65.6% 64.5% 62.3%
1997-98 2002-03 2007-08 2013-14 2014-15 2015-16
NTPC AVF (DC) NTPC PLF All-India PLF
� Driven by strong systems guided by technical
compliance documents.
� Maintenance practices and real-time monitoring
system ensure high availability and efficient operations
� 100 percent analysis of boiler tube failures .
� Daily and Monthly review system(ORT-Operation
Review team) system ensures high level of
performance.
� Periodic structured Technical Audits are carried our for
all the stations for identifying and correction of gaps .
� Fleet-wide monitoring by experts with online data
system at Antariksh centre allows real time
interventions.
� Best safety practices- Integral to NTPC’s DNA.
� All stations are OHSAS-18001/IS-18001 certified
Proven Operational Excellence over last 2 decades
*AVF on bar14

Achieved highest ever quarterly generation-Q1 /FY17
� NTPC has achieved highest ever quarterly generation
of 64.56 BU during Q1 of FY17 surpassing previous
highest of 63.16 BU achieved in Q1 of FY15.
� Group NTPC has achieved a generation of 71.50 BU in Q1
of FY17 registering a growth of 12% on QoQ basis.
� NTPC Coal achieved highest ever generation of 730.58
MU on 3rd June 2016, surpassing previous best of 724.29
MU on 2nd June 2016. NTPC (Coal + Gas + Hydro + Solar)
achieved highest ever generation of 767.53 MU on 3rd
June 2016, surpassing previous best 757.88 MU on 2nd
58.48
64.5664.01
71.50
30
40
50
60
70
80
NTPC(Standalone)
NTPC (Group)
12% Growth in Generation Q/Q
Creating New Records in Generation….Partnering SUs under UDAY
June 2016, surpassing previous best 757.88 MU on 2nd
June 2016.
30Q1 FY 16 Q1 FY 17
Partnering State Utilities under UDAY
� Entrusted by Govt. of India to handhold State GENCOs for
improvement of Operational efficiency under UDAY.
� An institutional setup has been created exclusively to enhance
operational efficiency of State GENCOs under UDAY .
� Workshops conducted for State GENCOs in which best
practices followed in NTPC power stations were shared with
them which could be followed by them to improve their
efficiency levels .
� NTPC reiterated its commitment to share its expertise with all
State GENCOs to achieve overall efficiency in the power sector.
91.61% 91.91%
77.58% 81.35%
62.01% 63.40%
0.00%
10.00%
20.00%
30.00%
40.00%
50.00%
60.00%
70.00%
80.00%
90.00%
100.00%
Q1 FY16 Q1 FY17
AVF (NTPC)
PLF (NTPC)
PLF (All India)

2.63
2.96 2.96
3.30 3.283.18
1.77
2.051.95
2.10 2.151.96
0.86 0.911.01
1.20 1.13 1.22
Sustaining its Status of Competitive Cost Power Producer� Tariffs based on Regulations notified by CERC. Regulatory
mechanism assures Returns balancing Risk -reward Ratio.
� PPAs have been signed for all operating and under
construction projects
� Policy of securing PPAs for all new plants before approval is
given for investment
� Entire power output of NTPC power stations has been
contracted under PPAs
� NTPC does not presently sell any power in the merchant
market- revenues are immune to volatile merchant power
prices
LC’s Recourse to RBI
Rs./kWh
2010-11 2011-12 2012-13 2013-14 2014-15 2015-16
Average Tariff Fuel Charges Fixed Charges
16
Coal based plants close to pit head stations ensure competitive variable cost of generationBased on NTPC stand-alone data.
Average Coal Based Power Cost (Rs/kWh)
2010-11 2011-12 2012-13 2013-14 2014-15 2015-16
Fixed Charges0.85 0.89 0.98 1.14 1.09 1.18
Variable Charges1.61 1.89 1.73 1.99 2.02 1.89
Avg. Coal tariff2.46 2.78 2.71 3.13 3.11 3.07
Overall Tariff (Coal+gas+ Solar)
SEB’sTripartite Agreement
� 100% realization continuing in 13th year in succession
� Payment Security Mechanisms
– LC coverage from SEBs adequate to cover monthly billing
– Tripartite Agreements between Government, RBI and each
state in terms of the Scheme for One Time Settlement of SEB
dues valid till October 31, 2016.
– Recourse to Reserve Bank of India (RBI) in case of default in
making payment
– Supplementary agreements signed with all discoms for first
charge over State utilities’ receivables after 2016.
– 19 states have consented to extend the TPAs already-RBI has
given its consent for extension.
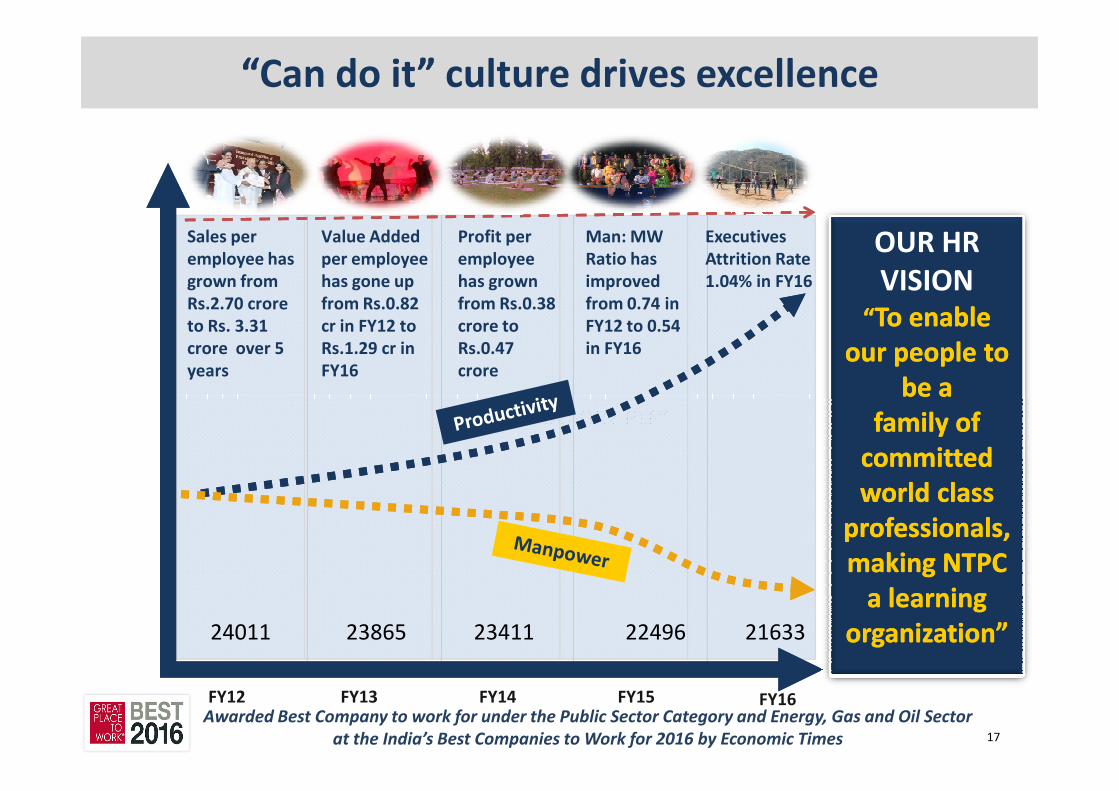
““Can do it”” culture drives excellence
Man: MW
Ratio has
improved
from 0.74 in
FY12 to 0.54
in FY16
Sales per
employee has
grown from
Rs.2.70 crore
to Rs. 3.31
crore over 5
years
Value Added
per employee
has gone up
from Rs.0.82
cr in FY12 to
Rs.1.29 cr in
FY16
Executives
Attrition Rate
1.04% in FY16
OUR HR
VISION““To enable To enable
our people to our people to
be a be a
Profit per
employee
has grown
from Rs.0.38
crore to
Rs.0.47
crore
“PEOPLE BEFORE PLF”
FY15FY14FY13FY12 FY16
2163324011 23865 23411
Awarded Best Company to work for under the Public Sector Category and Energy, Gas and Oil Sector
at the India’s Best Companies to Work for 2016 by Economic Times 17
22496
be a be a
family of family of
committed committed
world class world class
professionals, professionals,
making NTPC making NTPC
a learning a learning
organizationorganization””
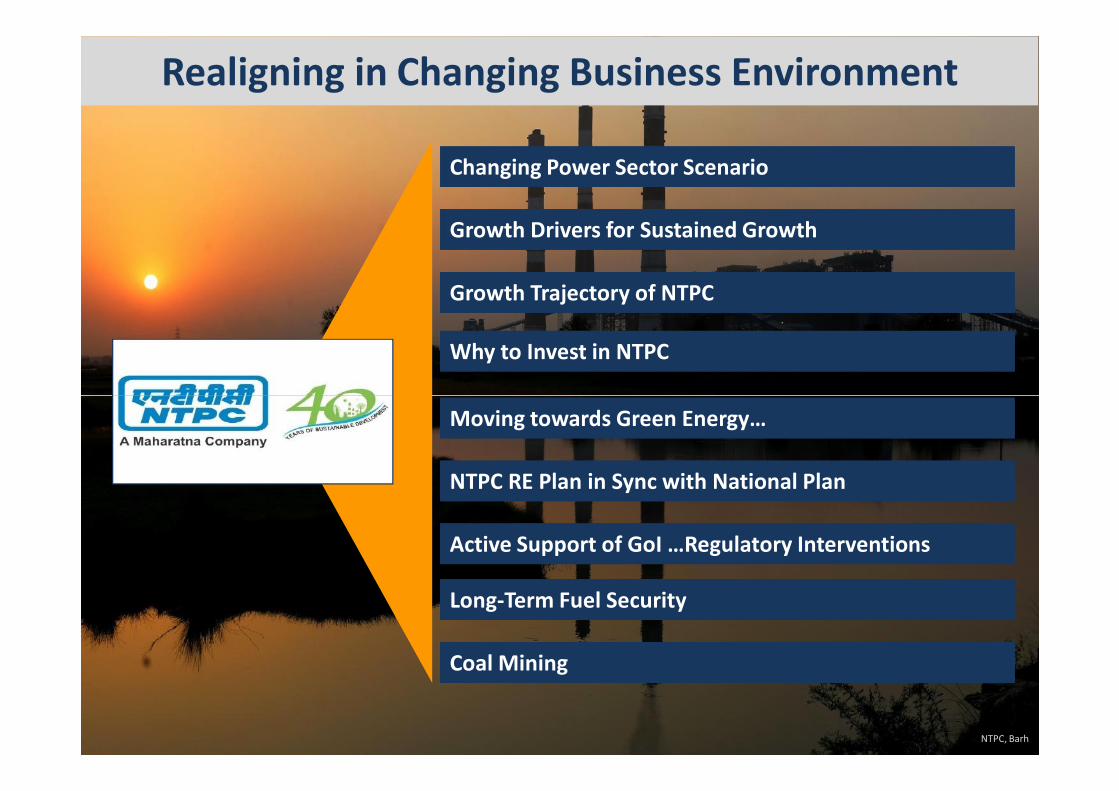
Realigning in Changing Business Environment
Changing Power Sector ScenarioChanging Power Sector Scenario
Growth Drivers for Sustained GrowthGrowth Drivers for Sustained Growth
Growth Trajectory of NTPCGrowth Trajectory of NTPC
Why to Invest in NTPCWhy to Invest in NTPC
Moving towards Green Energy…Moving towards Green Energy…
NTPC RE Plan in Sync with National PlanNTPC RE Plan in Sync with National Plan
Active Support of GoI …Regulatory InterventionsActive Support of GoI …Regulatory Interventions
Long-Term Fuel SecurityLong-Term Fuel Security
Coal MiningCoal Mining
18NTPC, Barh

Changing Power Sector Scenario
Installed Capacity
Today Target
~303 GW ~ 401 GW by FY20
Per capita consumption ~ 1075 kWh~ 3026 kWh
Generation (in BUs) ~1107 BUs ~1582 BUs by FY20
Peak Load Demand ~153 GW ~220 GW by FY20
19
Per capita consumption ~ 1075 kWh~ 3026 kWh
(World average)
Renewable capacity ~43 GW 175 GW by FY22
Coal production ~650 MT 1.5 BT by FY20
1. Government’s focus on attaining affordable “24x7 Power for All” by 2019.
2. Energy Sector growing at a CAGR of ~7%-8%.
3. Big push to Renewable Energy- to grow from ~43 GW presently to 175 GW by 2022.
AT & C Losses ~22.70% 15% by FY19
Source: MOC, MOP, CEA,NTPC
Transmission Capacity (Inter Reg) ~60 GW ~126 GW by FY22

Growth Drivers for Sustained growth …
� Demand for energy grows in tandem with the growth of
the economy.
� GDP of India is growing at faster pace as compared to
other developing countries.
� Power deficit scenario has sustained despite capacity
addition.
� Although in FY16 peak and energy deficit numbers are
lower but this is due to weak financial positions of
discoms rather than reduction in demand.
� Notwithstanding sustained demand, India continues to be
among the lowest per capita consumers of Electricity
globally, lagging Brazil & China by nearly 2.5x & 3.5x
937 996 1,002 1,069 1,114
858 909 960 1,031 1,091
FY 12 FY 13 FY 14 FY 15 FY 16
Requirement Availability
Energy Deficit Scenario Continues..1
(BU’s)% Energy Deficit
130 135 136 148 153130 141 148
4.96 % 3.20%12.07% 9.76 % 4.62%
% Peak DeficitDemand for Electricity has Consistently Exceeded Supply
(GW)1
3.69%4.38%9.21% 9.57% 2.11%
GDP Growth to increase Per Capita
Consumption
globally, lagging Brazil & China by nearly 2.5x & 3.5x
respectively
� Per capita consumption in India is ~36% of the world
average.
130 135 136 148 153
116 123 130 141 148
FY 12 FY 13 FY 14 FY 15 FY 16
Peak Requirement Availability
12,987
10,067
5,409
3,0263,766
2,5831,075
US Australia UK World China Brazil India
India has Low Per Capita Consumption2
(kWh/Year)
Source:
1. LGBR Report,CEA.
2. Answers to PQ,MoP
Electrification drive can lead to 75% higher
residential demand
� 75% jump in residential demand by Mar’20 if
government achieves 100% electrification as targeted.
� On the country level ,4-5% annual incremental growth
in power volumes can be supported by latent demand
in rural areas.
� Residential power consumption is expected to grow to
460 BU by 2020 at a CAGR of 15.1% from current level
of 262 BU if 100% electrification is achieved.

NTPC, Koldam
21
Growth Trajectory of NTPC...poised to be 128 GW company by 2032
NTPC, Bongaigaon

4722824009
21630
Present Under Construction Invited Bids from vendors Feasibility Report Approved Under feasibility & balance Total by 2032
128000
8768
26365
Growth Trajectory.. slated to add ~36% of country’s new coal capacity in FY17NTPC takes the decision to proceed with a new project only once it is satisfied on the availability of land, water, fuel, off-take arrangements and environmental clearances.
Projects Fuel Capacity (MW) Technology NTPC/JVBarh I Coal 1,980 Super-Critical NTPC
Tapovan Vishnugad Hydro 520 – NTPC
Vision to maintain leadership position in India…Current development pipeline of ~ 33GW (In MW)
NTPC’s Projects Under Construction
�Coal- 35085 MW
�Gas- 4017 MW
�Hydro- 800 MW
� Solar- 360 MW
� JVs & Subs- 6966 MW
�23 projects
�19 owned, 4 under group
companies
�Under different stages
of completion
� Projects with 8768 MW bids
invited from vendors Barethi
2640, Khulna 1320, Pudimadaka
4000 MW, Durgapur 40MW
Solar 768 MW
�Approximately 21630 MW
capacity with feasibility report
approved
�Approximately 15155 MW
capacity with feasibility report
under preparation
�Balance to be taken up later
�Capacity set to expand
by 2.7x
Tapovan Vishnugad Hydro 520 – NTPC
Bongaigaon Coal 500 Sub-Critical NTPC
Singrauli Hydro Hydro 8 – NTPC
Solapur Coal 1,320 Super-Critical NTPC
Mouda II Coal 660 Super-Critical NTPC
Kudgi Coal 2,400 Super-Critical NTPC
Unchahar Coal 500 Sub-Critical NTPC
Lara Coal 1,600 Super-Critical NTPC
Gadarwara Coal 1,600 Super-Critical NTPC
Daralipali Coal 1,600 Super-Critical NTPC
North Karanpura Coal 1,980 Super-Critical NTPC
Tanda- II Coal 1,320 Super-Critical NTPC
Khargone Coal 1,320 Ultra Sup-Critical NTPC
Lata Tapovan Hydro 171 – NTPC
Rammam Hydro 120 – NTPC
Nabinagar (BRBCL) Coal 750 Sub-Critical Sub
Nabinagar (JV with BSEB) Coal 1,980 Super-Critical JV
Rourkela (JV with SAIL) Coal 250 Sub-Critical JV
Meja Coal 1,320 Super-Critical JV
Telangana-I Coal 1,600 Ultra Sup-Critical NTPC
Solar PVs (2 in Nos.) Solar 510 Solar PV NTPC
Total 24,009
*NTPC Group YE FY12 capacity was 37,014MW, 41184 MW as at FY13 end, 43108 MW as at FY14 end ,44398 at FY 15 YE and 46653 at FY 16 YE 22
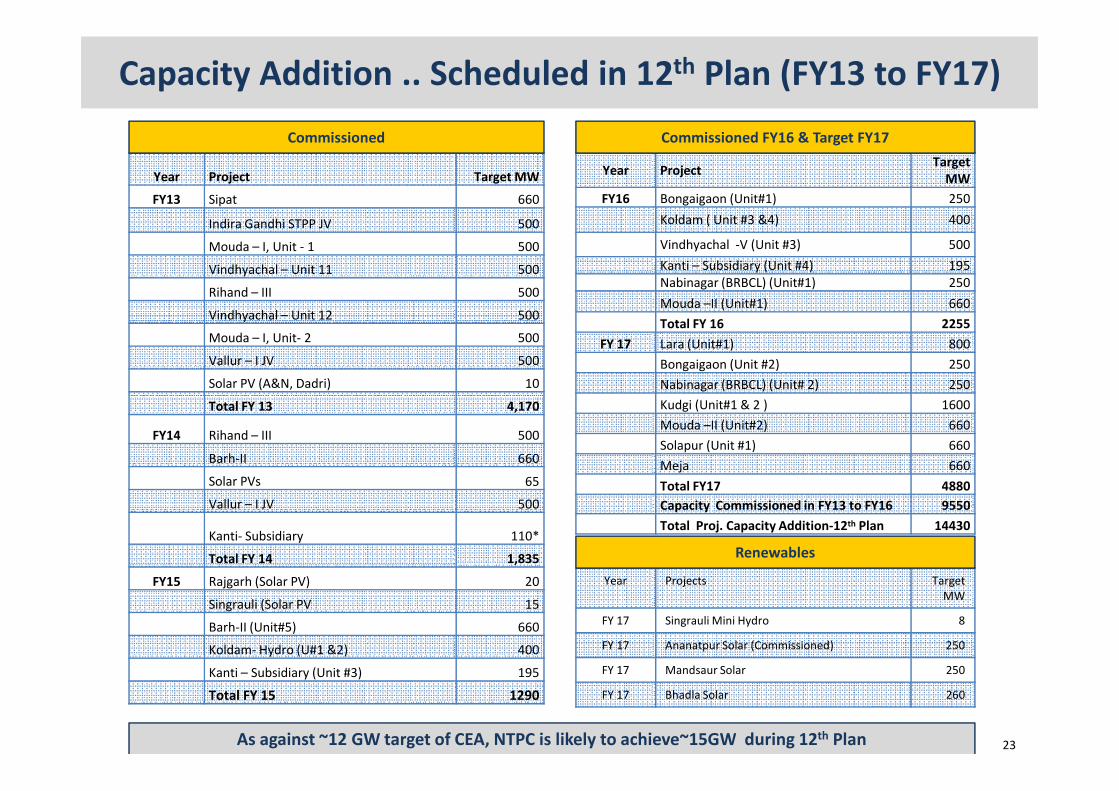
Year Project Target MW
FY13 Sipat 660
Indira Gandhi STPP JV 500
Mouda – I, Unit - 1 500
Vindhyachal – Unit 11 500
Rihand – III 500
Vindhyachal – Unit 12 500
Mouda – I, Unit- 2 500
Vallur – I JV 500
Solar PV (A&N, Dadri) 10
Capacity Addition .. Scheduled in 12th Plan (FY13 to FY17)
Year ProjectTarget
MW
FY16 Bongaigaon (Unit#1) 250
Koldam ( Unit #3 &4) 400
Vindhyachal -V (Unit #3) 500
Kanti – Subsidiary (Unit #4) 195
Nabinagar (BRBCL) (Unit#1) 250
Mouda –II (Unit#1) 660
Total FY 16 2255
FY 17 Lara (Unit#1) 800
Bongaigaon (Unit #2) 250
Nabinagar (BRBCL) (Unit# 2) 250
Commissioned Commissioned FY16 & Target FY17
Total FY 13 4,170
FY14 Rihand – III 500
Barh-II 660
Solar PVs 65
Vallur – I JV 500
Kanti- Subsidiary 110*
Total FY 14 1,835
FY15 Rajgarh (Solar PV) 20
Singrauli (Solar PV 15
Barh-II (Unit#5) 660
Koldam- Hydro (U#1 &2) 400
Kanti – Subsidiary (Unit #3) 195
Total FY 15 1290
Kudgi (Unit#1 & 2 ) 1600
Mouda –II (Unit#2) 660
Solapur (Unit #1) 660
Meja 660
Total FY17 4880
Capacity Commissioned in FY13 to FY16 9550
Total Proj. Capacity Addition-12th Plan 14430
Year Projects Target
MW
FY 17 Singrauli Mini Hydro 8
FY 17 Ananatpur Solar (Commissioned) 250
FY 17 Mandsaur Solar 250
FY 17 Bhadla Solar 260
Renewables
As against ~12 GW target of CEA, NTPC is likely to achieve~15GW during 12th Plan 23

Tentative commissioning targets for FY18 and beyondProjects already under construction and likely year of commissioning
Year Project Target MW NTPC JV Projects
FY18 Barh –I (Unit#1) 660 660
Kudgi (Unit#3) 800 800
Solapur (Unit#2) 660 660
Lara (Unit#2) 800 800
Gadarwara (Unit#1) 800 800
Unchahar- IV 500 500
Bongaigaon (Unit #3) 250 250
Nabingar (BRBCL JV) (Unit#3&4) 500 500
Meja (JV) (Unit#2) 660 660
Nabinagar (NPGCPL- JV) (Unit#1&2) 660 660
Total FY 18 E 6290 4470 1820
FY19 & beyond Barh-I (Unit#2&3) 1320 1320
Gadarwara (Unit#2) 800 800
Darlipalli (Unit# 1&2) 1600 1600
North Karanpura (Unit #1, 2 & 3) 1980 1980
Tanda-II 1320 1320
Nabinagar (NPGCPL- JV) (Unit#3) 1320 1320
Rammam (Hydro) 120 120
Lata Tapovan (Hydro) 171 171
Tapovan Vishnugarh 520 520
Khargone 1320 1320
Telangana-I 1600 1600
Rourkela (NSPCL JV) 250 250
Total FY 19 & beyond 12321 10751 1570
Total capacity to be commissioned in 13th Plan 18611 15221 3390 24

Why to Invest in NTPCWhy to Invest in NTPC
Investment Rationale- RoE expansion
Growth in Gross Block, CWIP & Financial leverage
Expansion in Regulated Equity:
17% 15% 16% 19% 23%25% 30%
30% 32% 34% 35% 30% 31% 33% 33% 36% 32% 28%17% 13%
0.40 0.42 0.43 0.41 0.45 0.50 0.52 0.60 0.61 0.64 0.69 0.72 0.78
1.05 1.03 1.18
1.27 1.35 1.40 1.38
0%
20%
40%
60%
80%
100%
120%
140%
160%
-
50,000
1,00,000
1,50,000
2,00,000
2,50,000
3,00,000
3,50,000
4,00,000
FY02 FY03 FY04 FY05 FY06 FY07 FY08 FY09 FY10 FY11 FY12 FY13 FY14 FY15 FY16 FY17E FY18E FY19E FY20E FY21E
CWIP & Cap advances Gross Block
CWIP % of total Fixed assets Financial Leverage (Debt-Equity)
Rs. crore
• Gross block increased at a CAGR of 11% while CWIP
grew at a CAGR of 19% FY 02 to FY16 .
• From FY02-FY07, CWIP to Total fixed assets (incl. CWIP)
remained between 15%-25% and later ranged between
30% - 35%.
• Reversal in this ratio expected after FY 17 due to
massive commissioning and CoD - entire capacity
awarded in bulk tender will be on stream.
• Going forward, growth continues but the turnaround
from CWIP to Gross block is quicker because of greater
mix of solar capacity having a shorter gestation of 12-18
months.
• Fall in CWIP ratio leads to RoE expansion as the equity
blocked in CWIP will start earning
• Benefit of financial leverage to result in higher RoE
25All financial figures on standalone basis
41420
0 50000 100000
FY16
FY17E
FY18E
FY19E
FY20E
FY21E
Regulated Equity (Rs. in crore)

Moving towards Green Energy….increasing RE Landscape
Promoting Renewable EnergyPromoting Renewable Energy
• Initiative for creation of renewable
energy capacity by mandating
thermal power developers to
establish capacity.
• Introduction of renewable energy
generation obligation (RGO) for
coal/lignite-based power-generating
companies.
• Cross-subsidy not to be levied for
320
43
175
0
50
100
150
200
2007 2011 2016 2022E
Renewables (installed Capacity over the years in GW-
Actual and Projected)
…….India to have 175 GW of Renewable Energy by 2022
• Cross-subsidy not to be levied for
open access based on renewable
energy sources.
• Central government to formulate
National Renewable Energy Policy.
• India has committed to reduce its
emission intensity per unit of GDP by
33% to 35% below 2005 levels by
2030 under INDC (Intended Nationally
Determined Contributions)
175 GW
60 GW +
40 GW (Rooftop)
60 GW 5 GW 10 GW
Solar Wind Small Hydro Biomass &
Others

NTPC Solar Power Plan….Diversifying Fuel Mix….360 MW already commissioned
10,000 MW OWN CAPACITY ADDITION
Current Projects-3010 MW
- Under Execution- 510 MW
- Under Tendering-768 MW
- NIT Planned-1732 MW
Projects Identified for future
implementation-7335 MW
15,000 MW UNDER NSM
FIRST TRANCHE 3000 MW
NTPC Solar Plan in sync with National Plan
Ananthapuramu (200 MW)
April 2015 April 2016
Transformation from barren land to 200 implementation-7335 MW
Commissioned
- Ananthapuramu (AP) - 250 MW
- Rooftop in VSTPP – 0.452 MW
Under Execution
- Mandsaur (MP) - 250 MW
- Bhadla (Raj.) - 260 MW
NIT issued for 768 MW
- Ananthapuramu (AP) - 750 MW
- Chidiya Tapu (A&N)- 18 MW
NIT Planned for 1732 MW
- Pavagada (Karnataka)-1000 MW
- Banaskantha (Gujarat)-700 MW
- A&N Island-32 MW
NIT published for 3000 MW
RA Completed for 2650 MW
LOI issued for 2520 MW
PPA Signed for 1960 MW
27
Image of NTPC’s 50 MW Rajgarh Solar PV in MP
Transformation from barren land to 200
MW project in 1 year time
85% capacity of NTPC’s old plants to be bundled with solar capacity - creates certain & viable market

Active Support of GoI – Regulatory Interventions
� Focus on 4 Es: Electricity for all,
Efficiency to ensure affordable
tariffs, Environment for a
sustainable future, Ease of doing
business to attract investments and
ensure financial viability.
� Reduce power cost through
Tariff Policy
� A Scheme for the Financial
Turnaround of Power Distribution
Companies (DISCOMs).
� Focuses on improving the
operational and financial efficiency
of the State-owned DISCOMs.
� No direct relief by GoI instead
UDAY
� Flexibility in utilization of domestic
coal amongst Central Generating
Stations, State Generating Stations
and Power Plants of other State
Power Utilities resulting in
reduction of cost of electricity to
the consumers.
Coal Reforms
Integrated approach towards making power affordable
� Reduce power cost through
expansion of existing power plants.
� Sale of Un-Requisitioned Surplus
(URS) power in the market. Profit
sharing mechanism with original
beneficiary surrendering URS
identified.
� Power from plants where PPAs
have expired or Plant has
completed useful life, may be
bundled with power from
renewable generating plants to be
set up through the process of
bidding.
� No direct relief by GoI instead
financial relief is being extended by
bringing down the cost of the debt
by 300-400 bps.
� UDAY mandates enabling of
quarterly tariff revision and focuses
on reducing the cost of power.
� Stringent targets set for reduction
in AT & C losses of DISCOMs.
� Total 14 States have signed MOU
with GOI for joining the UDAY-8
states have issued bonds.
� Coal Swapping & Rationalization of
Coal Linkages – Sourcing of coal
from nearest mine leading to
reduction in transportation costs.
� Reverse auction of Coal Blocks
� Increase in availability of Cheaper
Domestic Coal through
enhancement of Coal Production
by CIL.
� Bridge linkages provided to utilities
which are in the process of
commencing production from
their captive mines.
UDAY is expected to improve financial health of SEBs resulting in better off-take of NTPC Power

Long-term Fuel Security
Coal,
35085,
87.1%
Gas,
4017,
10.0%
Solar,
360,
0.9%
Hydro,
800,
2.0%
Coal Supply Agreements
� NTPC implements projects only upon establishing availability of
fuel.
� NTPC’s thermal Capacity of 32605 MW is covered by long term CSA.
signed with CIL & SCCL. MoU for 1320 MW at Barh for supply of coal
at notified prices.
� Additionally, CSA for 910 MW yet to be commissioned projects have
been signed.
� Bridge linkage for 12200 MW of upcoming capacity
� 74% of coal capacity is linked by own merry go round rail
system/belt conveyor system to coal mines representing 10 out of
18 coal plants.
Cu
rre
nt
Ca
pa
city
Bre
ak
-up
Installed Capacity Break-up – Standalone (By Fuel)1
Coal Transportation
29
Co
al:
Lo
ng
-te
rm F
ue
l S
ecu
rity
18 coal plants.
� For group companies, CSAs for 4390 MW have been signed.
Coal Mining
� Allotted/under allocation coal mining coal blocks with estimated
geological reserves of 7.3 BT .
� Estimated capacity of coal mines 107 MTPA .
� Mining commenced at PB block from western pit from
17.05.2016.
� Estimated Coal Mining capacity can cater to 20000 MW of
generation.
Gas Supply
� Long-term gas supply agreements with GAIL under APM
for supply of gas to all directly-owned gas power stations at
regulated pricing under Government orders.
MoU @
notified
prices,
1320, 4%
MGR
25840 MW
74%
Railways
7925 MW
22%
Coal Transportation (Standalone Commissioned Capacity)1
1 As on 30.06.2016Commencement of third party (CIMFR) sampling of coal at all projects

94.7% 94.6%
0.6% 1.1%
4.7%4.3%
FY17 E FY18 E
Domestic shortfall Captive ACQ/MoU/e-auction
Long-term Fuel Supply (Cont’d)
Coal Supply (For NTPC Own Plants)
6 6Equivalent
Imports (MT)
169 185
94.1% 93.3% 90.2% 94.2% 98.6%
5.9% 6.7% 9.8% 5.8% 1.4%
FY13 FY14 FY15 FY16 Q1/17
Coal Requirements FY17E to FY18E (In MT)
30
(In MMT) FY 2013 FY 2014 FY 2015 FY 2016 Q1 FY 2017
Domestic 145.9 149.8 151.0 152.4 40.2
Import 9.1 10.8 16.4 9.5 0.6
Total
Supply
155.0 160.6 167.4 161.9 40.8
6 6Imports (MT)
42% decrease in imported coal supply in FY16 vs. FY15
FY 17 E FY 18E
Coal Requirement 169 185
Domestic (ACQ/LoA/MoU /E-
auction)
160 175
Captive 1 2
Domestic shortfall 8 8
Import equivalent ~6 ~6
In MMTDomestic Imported
� 91.18% materialization during 2015-16 as compared to 89% materialization in FY 14-15
� 97.88% materialization during Q1/17 vs 89.28% in Q1/16
� Reduction in imported coal supply by 86% in Q1 /17
Status of Coal MinesCoal block GR (MMT) Mining Capacity
MMTPA
Status
EC FC Acq.
Notice
MDO
Pakri Barwadih 1574 18 Yes Yes Yes Appointed
Chatti Bariatu 548 7 Yes Yes Yes Bids under Evaluation
Kerandari 285 6 Yes St-I accorded Yes NIT to be issued
Talaipalli 1267 18 Yes Yes Yes Bids under Evaluation
Dulanga 196 7 Yes Yes Yes Bids under Evaluation
Pakri Barwadih Coal Mine opened from Western Pit on 17.05.2016 and company expects to produce 1 MMT this year.
Other Five Mines with GR of ~3.42 BT and Mining Capacity of ~51 MMTPA - under various phases of development.
NTPC Coal Mining Portfolio…10 Mines with ~7.3 BT GR
Other Five Mines with GR of ~3.42 BT and Mining Capacity of ~51 MMTPA - under various phases of development.
31
Bandag-Hazaribagh Railway Siding is now operational for coal transportation from Pakri-Barwadih Coal Mine
32
Technology Progression

Technology Progression—Increased Efficiency and Greater Environmental Protection
� Adoption of super critical parameters for higher efficiency
� Higher size units of 660 and 800MW
� Adoption of high reheat parameters for smaller units
� 765KV AC switchyard
� State of art automation technologies for C&I and Electrical
systems
� Tunnel Boring machines
� Flue gas desulphurization
� High concentration slurry disposal system & Dry Ash extraction
and disposal system
Leader in introducing new technologies in the power sector.
� Development of IGCC suitable for Indian coal
� Development of Adv Ultra supercritical power plant along
with IGCAR and BHEL for inlet steam temperature in the
range of 700°C
� Use of advanced technologies in the renovation and
modernization of aging power stations
Technologies Introduced Technologies Under Development
Every 1% increase in
efficiency yields
2.5% CO2 reductionand disposal system
Gross Efficiency HHV%
Vindhyachal II
(Yr.1999)
Simhadri II
(Yr. 2011)
Sipat I
(Yr. 2011)
Barh II onwards
(Yr. 2013)
Khargone
(Yr. 2019)
Advance USC Pilot
(Yr. 2022)
38.6% 38.9%39.5%
40.8%41.55%
46%
33
2.5% CO2 reduction
Constant endeavor to reduce CO2 emissions- steps to increase cycle efficiency

R&D-
Advanced
USC
Subcritical
170K/540oC/540o
Super critical 245K/540oC/540oC
245K/540oC/565oC
245K-
580oC/593oC
350K-700oC/720oCULTRA SUPERCRITICALSUPERCRITICALSUB- CRITICAL
Un
de
r In
du
ctio
n
Re
cen
tly
Intr
od
uce
d
310K-
610oC/
620oC285K-
600oC-
620oC
Mature
Technology
International Scenario
Paradigm shift in adopting Future Technology
NTPC adopted Super critical technology in 2004
Adopted Ultra Super critical technology in 1320 MW Khargone TPP and 1600 MW Telangana-I TPP which may result in savings of 154kcal in SHR
All USC units now ordered are with temperature upto 600oC/ 600oC34
1960s 1970s 1980s 1990s 2000s 2010sYear
Capacity Mix-Present & by 2022
0.939
0.751
0.6
0.7
0.8
0.9
1
Specific Emission tCO2 / Mwh
2015
2022
20% reduction
Target of 20% reduction in CO2 emissions by 2022
76%
8%
13%2%
Sub-Critical Coal Sup-Critical Coal
Gas Hydro & Solar
Present
39%
43%
6%
12%
Sub-Critical Coal Sup-Critical Coal
Gas Hydro & Solar
By 2022

35
Risks & MitigationRisks & Mitigation

Risk Mitigation
Coal and Gas Supply Constraints � Long term Fuel Supply Agreements with CIL for a period of 20 years – ACQ for ~164.57 MMT.
� Bridge linkage allocated for 12.2 GW of upcoming capacity
� Govt approved flexibility in use of domestic coal to reduce the cost of power generation
� Captive coal blocks – to meet coal supply of 20 GW
� Long Term APM/PMT Gas Supply Agreement with GAIL for supply of 14.48 MMSCMD gas upto 2021/2019
SEB Financial Distress � Tripartite agreement likely to be extended for 15 years with recourse to RBI
� SEB’s required to issue LCs covering 105% of the average monthly billing
� ‘UDAY’ scheme launched by GoI to address discoms financial distress.
� Supplementary agreements signed for first charge over state utilities’ receivables after 2016
Supply may outstrip demand � Pick up in industrial activity leading to spurt in generation since India is the fastest growing economy
� Suppressed demand of SEBs due to high debt. Revival in demand expected after implementation of UDAY
� Amended tariff policy allows for sale of un-requisitioned power and sharing of benefits.
� Focus on Cost optimization-Reduced ECR
� Adoption of high efficiency units into the existing fleet
Land Acquisition Uncertainty � Progressive R&R Policy, focus on consultation and participation, negotiated settlement
� Institutional mechanisms like Village Development Advisory Committees and Public Information Centers
Key Risks and Mitigation
� Institutional mechanisms like Village Development Advisory Committees and Public Information Centers
� Changing strategy to acquire land on “willing buyer and willing seller concept”.
Accelerated Capacity Addition � Multi-pronged strategy developed and enhanced delegation of power for quick decision making
� Total 24,009 MW under construction.
Consistent RoE � Capex intensive model delivering consistent earnings and dividends
� Upside from PLF incentives
� Improving leverage to increase ROE
� Increasing Solar portfolio to earn quicker returns due to lower gestation period compared to coal stations
Competition from Private Players � Relatively robust business model with regulated returns
� GoI ownership
� Unparallel depth and Width of management expertise and high standards of corporate governance
Funding Requirements for New
Projects
� Strong balance sheet and healthy leverage ratios
� Easy access to domestic and overseas debt market; mobilized debt on most optimal rates from both domestic and
international markets due to low gearing and healthy coverage ratios
� Targeting capex of Rs.30000 crore in FY17.
Environmental Laws and
Regulations
� Environmental clearances for all under construction projects received
� Targeting 10 GW solar capacity in next 5 years
36

Sustainability Initiatives

NETRA- PROVIDING THE TECHNOLOGY AND R&D EDGESpent Rs. 129.68 crore on R&D activities during the year 2015-16
Efficiency & Availability Improvement New & Renewable Energy Climate Change & Environment
Process Intensification
� Flue Gas Sea Water Desalination
� Flue Gas Air conditioning
� Flue Gas Organic Rankine Cycle
� Flue Gas CT Blow down Recovery
� Back Pressure Micro Steam Turbine
� Multi Utility Heat Pump
� Solar Thermal Hybrid Plant
� Indigenous Concentrated Solar Thermal
� Indo-German R&D - Solar Thermal Lab
� Solar Thermal Air Conditioning
� Solar Thermal Cooking System
� Floating Solar PV System
� Robotic PV Cleaning
� Nono coating for PV panel
Ash Technologies
� Light Weight Aggregate from Fly Ash
� Geo-Polymer based Sand from Fly Ash
� Geo-Polymer based building block
Environmental Technologies
� Micro Algae based CO2 fixation
Technology Development-In house & Collaborative R&D for development of new processes, tools & systems.
Intelligent Systems
� Artificial Intelligence Plant Advisory
� CFD Applications - Flue gas duct, ESP, Rotary Equipment
� PV integration with battery charger
� Indo-German R&D - Solar PV Lab
� Geo-thermal at Tattapani
� Ground Source Space Cooling
� Flexible operation of Fossil fired plant with increased renewable penetration
� Micro Algae based CO2 fixation
� Pressure Swing Adsorption CO2 capture
� Modified Amine CO2 capture
38
� Advanced Scientific Support through 11 NABL ISO 17025 accredited Labs ,5 Advance Process Labs and 3 more in Offing.
� Knowledge networking thereby leveraging best brains nationally & internationally and Institutional & Policy Support vide presence in apex bodies.
FG Desalination FG Air conditioning Floating Solar PV Solar Thermal Cooking Algae CO2 Fixation

� NTPC championed the cause of Swachh Bharat
by successfully building 29,000 toilets in
government schools for the benefit of students,
especially girl children, covering 83 Districts in
17 States across the country.
� Project was aimed to improve health and
hygiene among students, reduce girl child
dropout and improve the overall health &
hygiene of community by reducing open
defecation.
� Availability of toilets ensured by NTPC will have
direct positive impact on the lives of almost 20
lakh children.
Inclusive Growth
� NTPC has always been sensitive to the needs of
Spent Rs. 491.80 crore on CSR activities during the year 2015-16.
NTPC's CSR initiatives have touched the lives of around 25 lakh people in one way or the other at remote locations.
Swachh
Vidyalaya
Abhiyan
� NTPC has always been sensitive to the needs of
disadvantaged, vulnerable and marginalized
stakeholders.
� NTPC has also taken up the activities for women
empowerment, construction of SC/ST
multipurpose halls & hostels, relief through
distribution of various articles & support to
orphanages & old age homes in the vicinity of its
stations.
39
Social
Inclusiveness
Skill Creation
� Inked two separate MoUs with Ministry of Skill
Development & Entrepreneurship (NSDF-
National Skill Development Fund) and National
Skill Development Corporation (NSDC) for
various employability linked skill development
programs.
� Committed to contribute Rs.200 crore for
setting up IIIT, Raipur. The institute commenced
its academic session from 2015-16.
� Adopted 18 ITIs and associated with 8 ITIs.
• This presentation is issued by NTPC Limited (the “Company”) for general information purposes only and does not constitute any recommendation or form part f any offer or invitation or
inducement to sell or issue, or any solicitation of any offer to purchase or subscribe for, any securities of the Company, nor shall it or any part of it or the fact of its distribution form the
basis of, or be relied on in connection with, any contract or commitment thereof. This presentation does not solicit any action based on the material contained herein. Nothing in this
presentation is intended by the Company to be construed as legal, accounting or tax advice
• This presentation has been prepared by the Company based upon information available in the public domain. This presentation has not been approved and will not be reviewed or
approved by any statutory or regulatory authority in India or by any Stock Exchange in India.
• This presentation may include statements which may constitute forward-looking statements relating to the business, financial performance, strategy and results of the Company and/or
the industry in which it operates. Forward-looking statements are statements concerning future circumstances and results, and any other statements that are not historical facts,
sometimes identified by the words "believes", "expects", "predicts", "intends", "projects", "plans", "estimates", "aims", "foresees", "anticipates", "targets", and similar expressions. The
forward-looking statements, including those cited from third party sources, contained in this presentation are based on numerous assumptions and are uncertain and subject to risks. A
multitude of factors including, but not limited to, changes in demand, competition and technology, can cause actual events, performance or results to differ significantly from any
anticipated development. Neither the Company nor its Directors, Promoter, affiliates or advisors or representatives nor any of its or their parent or subsidiary undertakings or any such
person's officers or employees gives any assurance that the assumptions underlying such forward-looking statements are free from errors nor do any of them accept any responsibility for
the future accuracy of the forward-looking statements contained in this Presentation or the actual occurrence of the forecasted developments. Forward-looking statements speak only as
of the date of this presentation. The Company expressly disclaims any obligation or undertaking to release any update or revisions to any forward-looking statements in this presentation
as a result of any change in expectations or any change in events, conditions, assumptions or circumstances on which these forward-looking statements are based.
• The information contained in these materials has not been independently verified. None of the Company, its Directors, Promoter or affiliates, nor any of its or their respective employees,
Disclaimer
• The information contained in these materials has not been independently verified. None of the Company, its Directors, Promoter or affiliates, nor any of its or their respective employees,
advisers or representatives or any other person accepts any responsibility or liability whatsoever, whether arising in tort, contract or otherwise, for any errors, omissions or inaccuracies
in such information or opinions or for any loss, cost or damage suffered or incurred howsoever arising, directly or indirectly, from any use of this document or its contents or otherwise in
connection with this document, and makes no representation or warranty, express or implied, for the contents of this document including its accuracy, fairness, completeness or
verification or for any other statement made or purported to be made by or on behalf of any of them, and nothing in this document may be relied upon as a promise or representation in
any respect. Past performance is not a guide for future performance. The information contained in this presentation is current and, if not stated otherwise, made as of the date of this
presentation. The Company undertakes no obligation to update or revise any information in this presentation as a result of new information, future events or otherwise. Any person or
party intending to provide finance or to invest in the securities or businesses of the Company should do so after seeking their own professional advice and after carrying out their own due
diligence and conducting their own analysis of the Company and its market position.
• This presentation is strictly confidential and may not be copied or disseminated, in whole or in part, and in any manner or for any purpose. No person is authorized to give any
information or to make any representation not contained in or inconsistent with this presentation and if given or made, such information or representation must not be relied upon as
having been authorized by any person. Failure to comply with this restriction may constitute a violation of applicable securities laws. Neither this document nor any part or copy of it may
be distributed, directly or indirectly, or published in the United States. The distribution of this document in other jurisdictions may be restricted by law and persons in to whose possession
this presentation comes should inform themselves about and observe any such restrictions. By reviewing this presentation, you agree to be bound by the foregoing limitations. You
further represent and agree that (i) you are located outside the United States and you are permitted under the laws of your jurisdiction to receive this presentation or (ii) you are located
in the United States and are a “qualified institutional buyer” (as defined in Rule 144A under the Securities Act of 1933, as amended (the “Securities Act”).
• This presentation is not an offer to sell or a solicitation of any offer to buy the securities of the Company in the United States or in any other jurisdiction where such offer or sale would be
unlawful. Securities may not be offered, sold, resold, pledged, delivered, distributed or transferred, directly or indirectly, into or within the United States absent registration under the
Securities Act, except pursuant to an exemption from, or in a transaction not subject to, the registration requirements of the Securities Act and in compliance with the applicable
securities laws of any state or other jurisdiction of the United States.

Beyond Power and Profit…Beyond Power and Profit…
THANK YOUTHANK YOU