Embed Size (px)
Citation preview

SPONSORSHIP VALUATION
NSF SPONSORSHIP VALUATIONFEBRUARY 2016 | CALGARY & OTTAWAFACILITATION SESSIONS

2
Our GoalOBJECTIVES OF THE SESSION
•Sponsorship: to provide participants with knowledge and application competencies through an interactive leadership exercise
•Sponsorship valuation: to share the results of the initial stages in the NSF valuation process with participants

EXPECTATIONS FOR THE VALUATION PROJECT
Introduction

4
Overall Project GoalOUR COMMITMENT TO YOU (BY MAY 30)
•To provide you with a sponsorship valuation of your NSF and outline a strategy framework upon which you can base decisions about your sponsorship activities
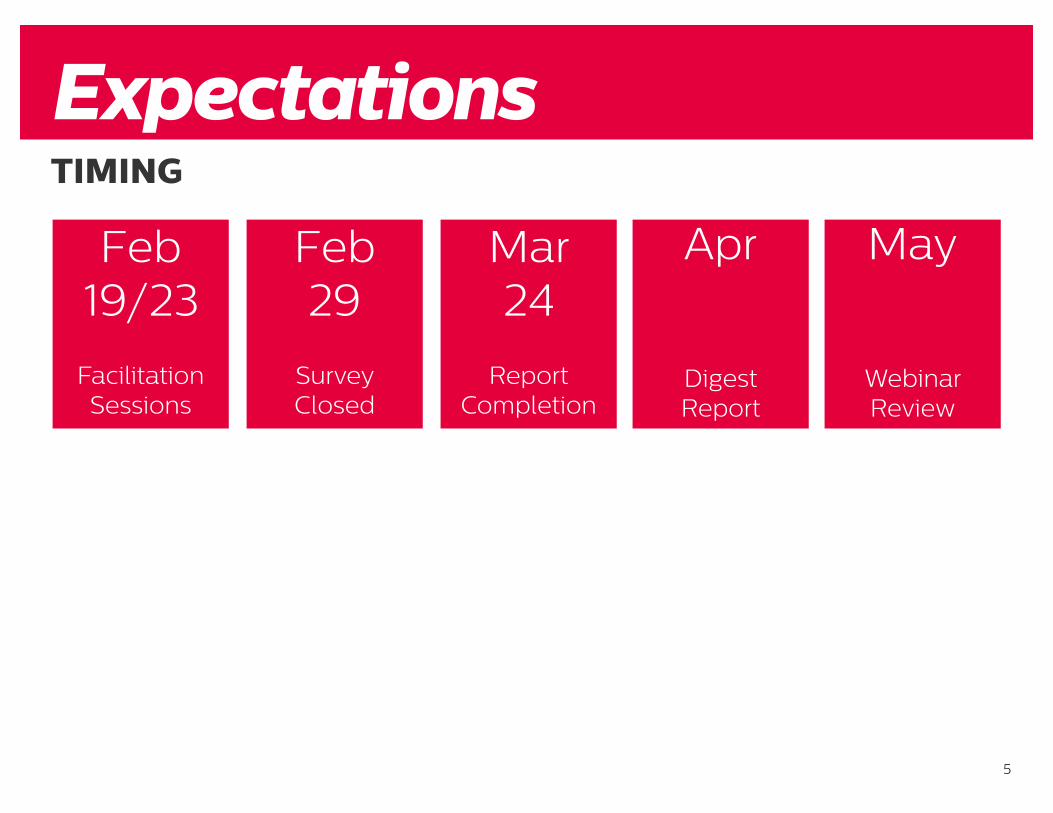
TIMING
5
Expectations
Feb 19/23
Facilitation Sessions
Feb 29
Survey Closed
Mar 24
Report Completion
Apr
DigestReport
May
Webinar Review

6
TIMING
•Facilitation Sessions in Ottawa & Calgary
Expectations
Feb 19/23
Facilitation Sessions
Feb 29
Survey Closed
Mar 24
Report Completion
Apr
DigestReport
May
Webinar Review

7
TIMING
•Deadline for completion of survey responses by all NSFs that wish to receive a study
Expectations
Feb 19/23
Facilitation Sessions
Feb 29
Survey Closed
Mar 24
Report Completion
Apr
DigestReport
May
Webinar Review

8
TIMING
•Analysis of survey results, including benchmarking and secondary research
•Crafting reports for NSFs by cluster, and an overall report for the COC
Expectations
Feb 19/23
Facilitation Sessions
Feb 29
Survey Closed
Mar 24
Report Completion
Apr
DigestReport
May
Webinar Review

9
TIMING
•Draft reports shared
•NSFs to read, review and share their reports
•Opportunity for feedback
Expectations
Feb 19/23
Facilitation Sessions
Feb 29
Survey Closed
Mar 24
Report Completion
Apr
DigestReport
May
Webinar Review

10
TIMING
•Final presentation via a webinar (or webinars) to take you through the report and answer any questions/clarify the valuation
Expectations
Feb 19/23
Facilitation Sessions
Feb 29
Survey Closed
Mar 24
Report Completion
Apr
DigestReport
May
Webinar Review
BACKGROUND
Method
12
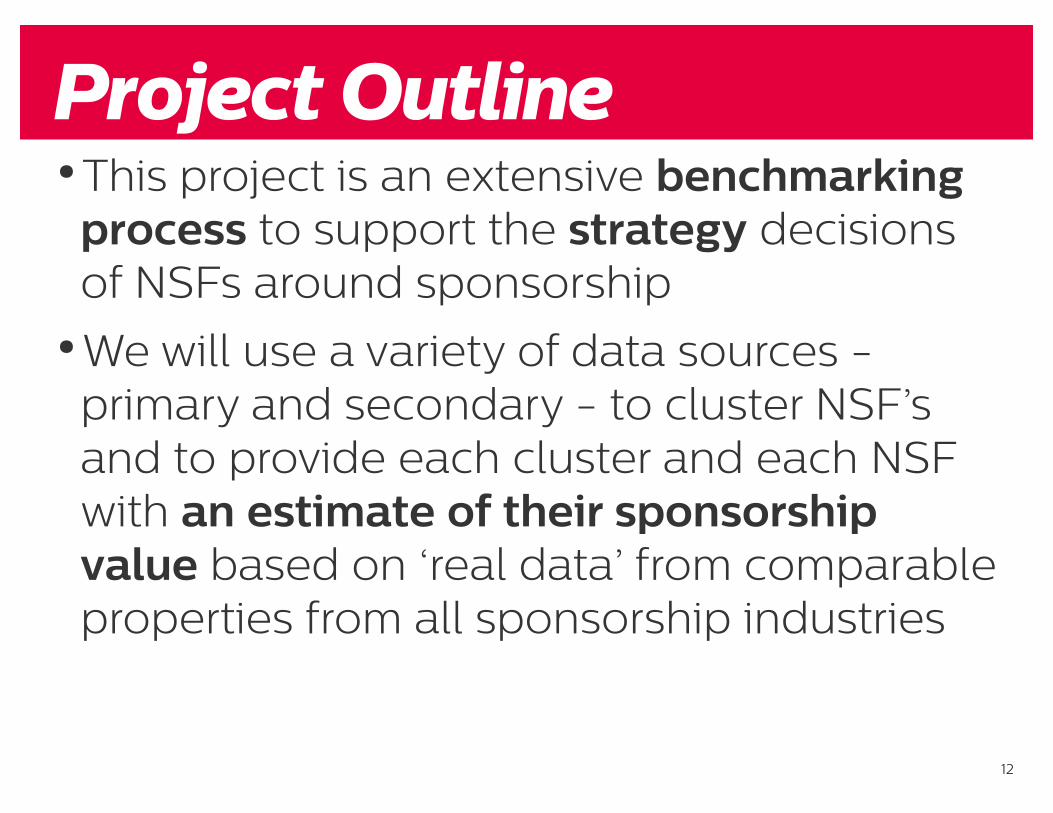
Project Outline•This project is an extensive benchmarking
process to support the strategy decisions of NSFs around sponsorship
•We will use a variety of data sources - primary and secondary - to cluster NSF’s and to provide each cluster and each NSF with an estimate of their sponsorship value based on ‘real data’ from comparable properties from all sponsorship industries
13
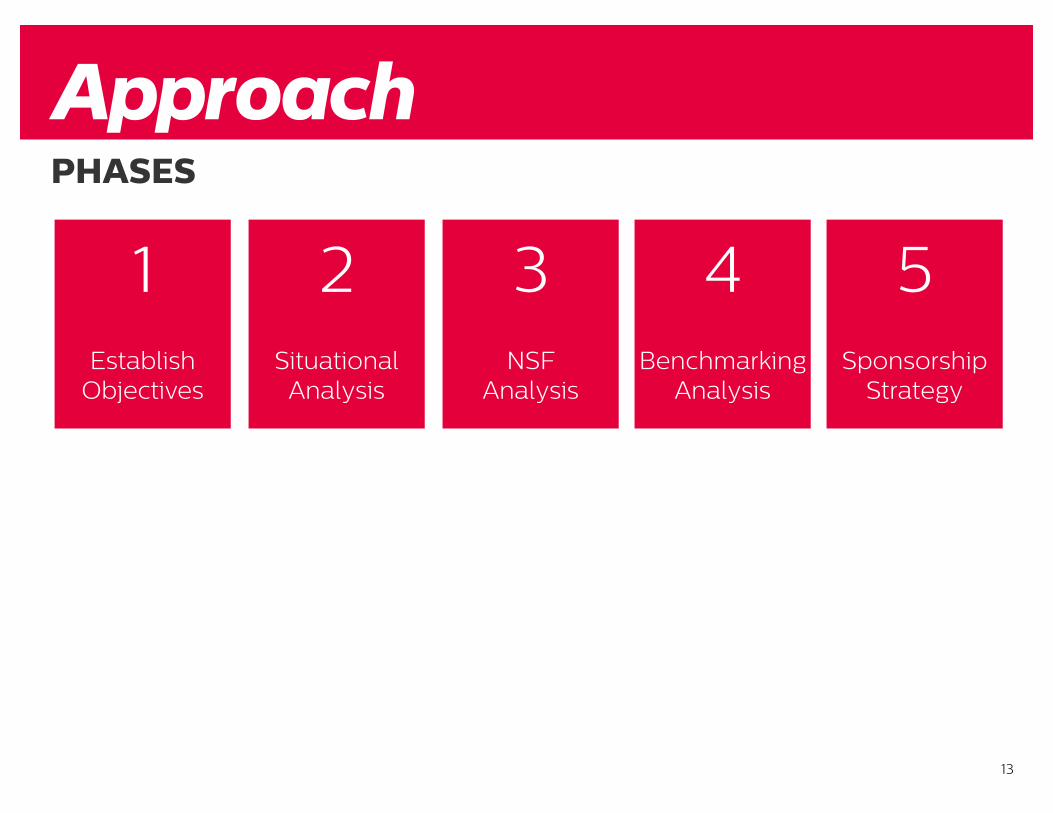
PHASES
Approach
1Establish
Objectives
2Situational
Analysis
3NSF
Analysis
4Benchmarking
Analysis
5Sponsorship
Strategy

14
PHASES
•Identify and fully understand the key outcomes and objectives of the COC and each participating NSF
Approach
1Establish
Objectives
2Situational
Analysis
3NSF
Analysis
4Benchmarking
Analysis
5Sponsorship
Strategy

15
PHASES
•Understand the internal and external environmental factors that impact sponsorship
Approach
1Establish
Objectives
2Situational
Analysis
3NSF
Analysis
4Benchmarking
Analysis
5Sponsorship
Strategy

16
PHASES
•Undertake primary and secondary research related to the participating NSFs to assess sponsorship reality by NSF cluster
Approach
1Establish
Objectives
2Situational
Analysis
3NSF
Analysis
4Benchmarking
Analysis
5Sponsorship
Strategy
17
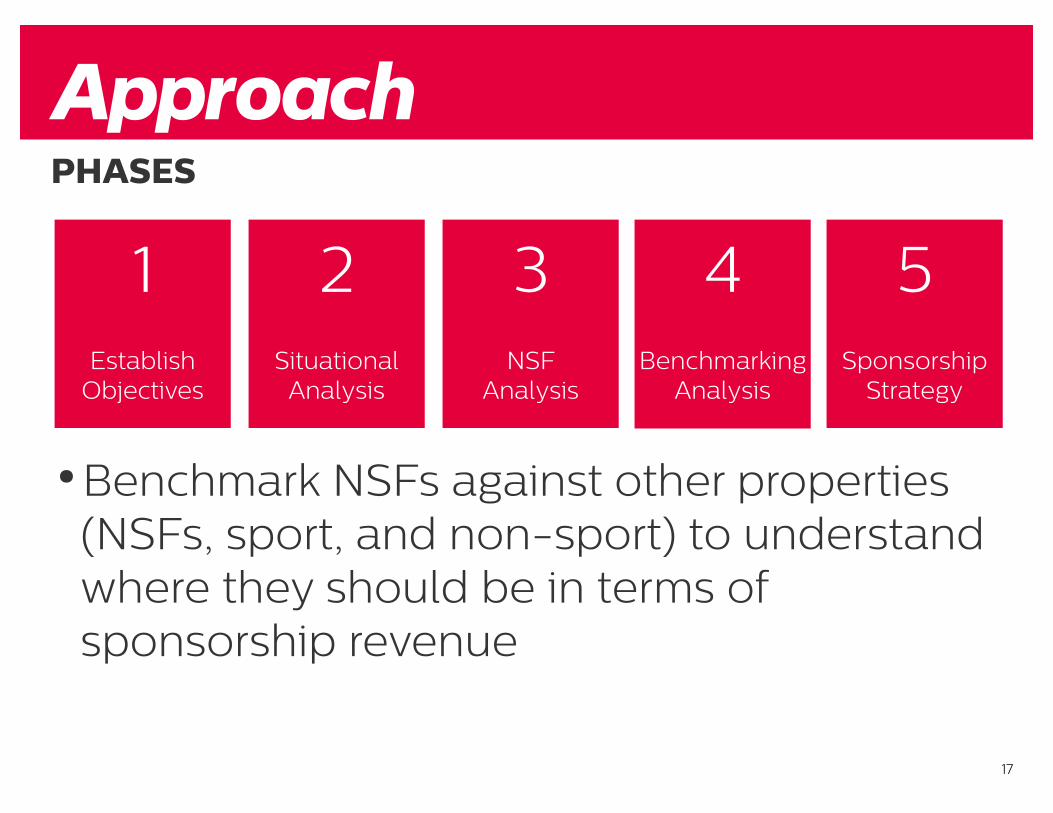
PHASES
•Benchmark NSFs against other properties (NSFs, sport, and non-sport) to understand where they should be in terms of sponsorship revenue
Approach
1Establish
Objectives
2Situational
Analysis
3NSF
Analysis
4Benchmarking
Analysis
5Sponsorship
Strategy

18
PHASES
•Provide strategic direction and recommendations for participating NSFs in their pursuit of sponsorship
Approach
1Establish
Objectives
2Situational
Analysis
3NSF
Analysis
4Benchmarking
Analysis
5Sponsorship
Strategy

GENERAL
Sponsorship in Canada
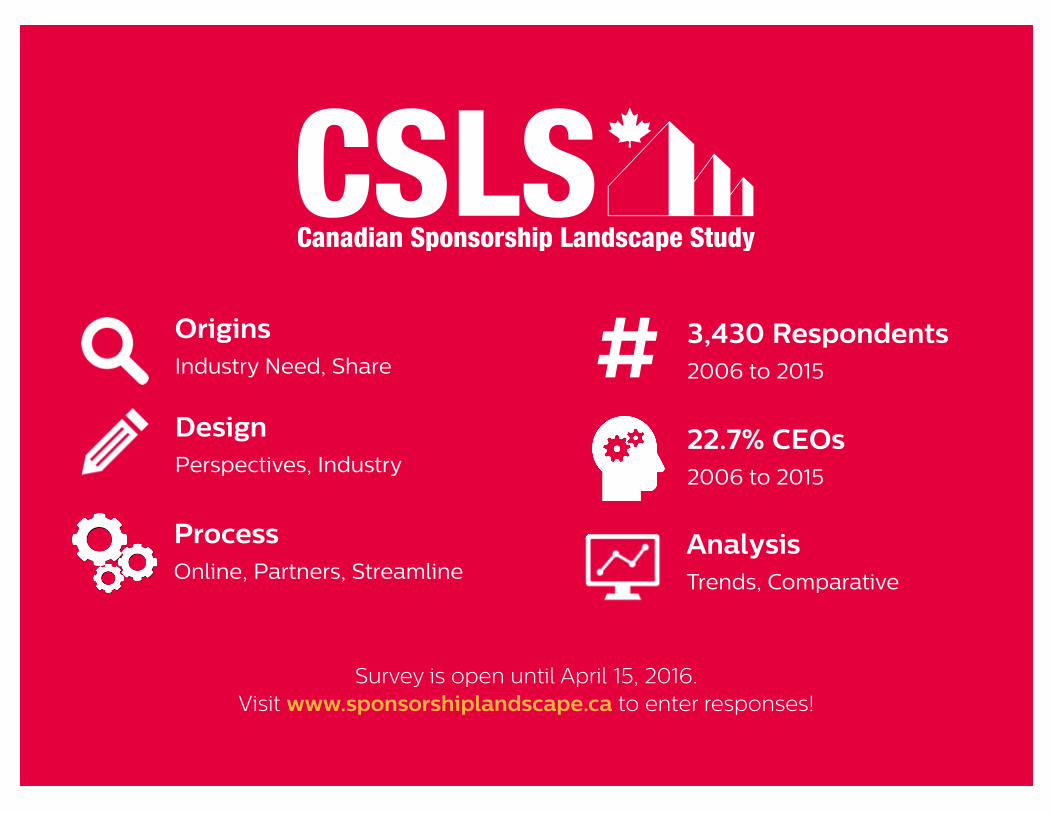
Survey is open until April 15, 2016. Visit www.sponsorshiplandscape.ca to enter responses!
AnalysisTrends, Comparative
DesignPerspectives, Industry
OriginsIndustry Need, Share
ProcessOnline, Partners, Streamline
3,430 Respondents2006 to 2015#22.7% CEOs2006 to 2015

CSLS RESPONDENTS
21
0
100
200
300
400
500
600
2007 2008 2009 2010 2011 2012 2013 2014 2015 2016
65
117132
152
238218
294
145
167
247
3431334852
73
123
6561
86
2534457481
116142
67109
171
Re
spo
nd
en
ts (
#)
Sponsors Agencies Properties
2016 So Far: 92.7% EN, 7.3% FR55.2% For-Profit, 44.8% NFP
Sponsorship Industry
22
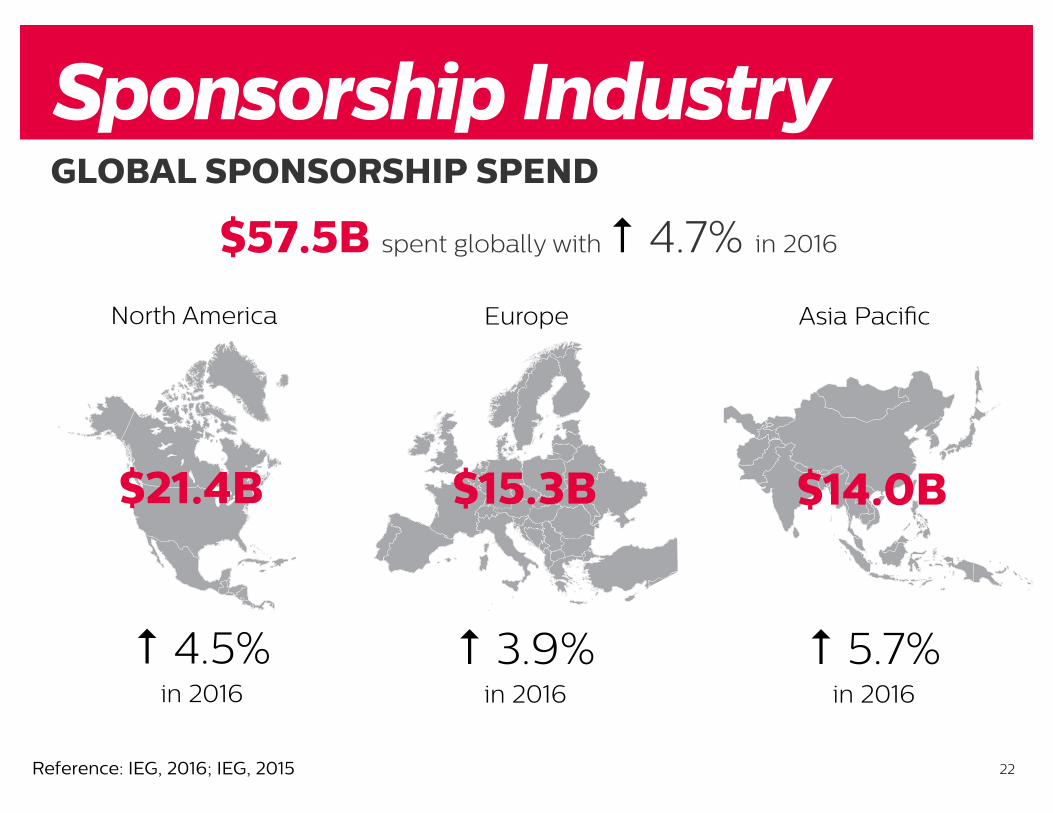
GLOBAL SPONSORSHIP SPEND
$57.5B spent globally with ↑ 4.7% in 2016
Sponsorship Industry
$21.4B
$15.3B $14.0B
↑ 4.5%in 2016
↑ 3.9%in 2016
↑ 5.7%in 2016
North America Europe Asia Pacific
Reference: IEG, 2016; IEG, 2015

23
SPONSORSHIP IN CANADA
Sponsorship Industry
$2.59B Industry Size (Rights
Fees + Activation)
$1.74B Sponsorship Spend
1 of 4 Marketing Dollars are Spent on Sponsorship
50% Industry Growth Since
2006

24
SPONSORSHIP IN CANADA
Sponsorship Industry
$0
$0.20
$0.40
$0.60
$0.80
2006 2007 2008 2009 2010 2011 2012 2013 2014 2015
0.43 0.46
0.710.76
0.620.57
0.75
0.62
0.41
0.49
Rig
hts
Fe
es:
Act
ivat
ion
Sp
en
d
Historical Activation Ratio

25
SPONSORSHIP IN CANADA
Sponsorship Industry
0%
2.0%
4.0%
6.0%
8.0%
2006 2007 2008 2009 2010 2011 2012 2013 2014 2015
7.8%
4.5%
6.0%
4.1%
2.6% 2.3%2.7% 3.0%
1.1%
3.4%
Pe
rce
nt
of S
po
nso
rsh
ip S
pe
nd
Historical Spend on Sponsorship Evaluation
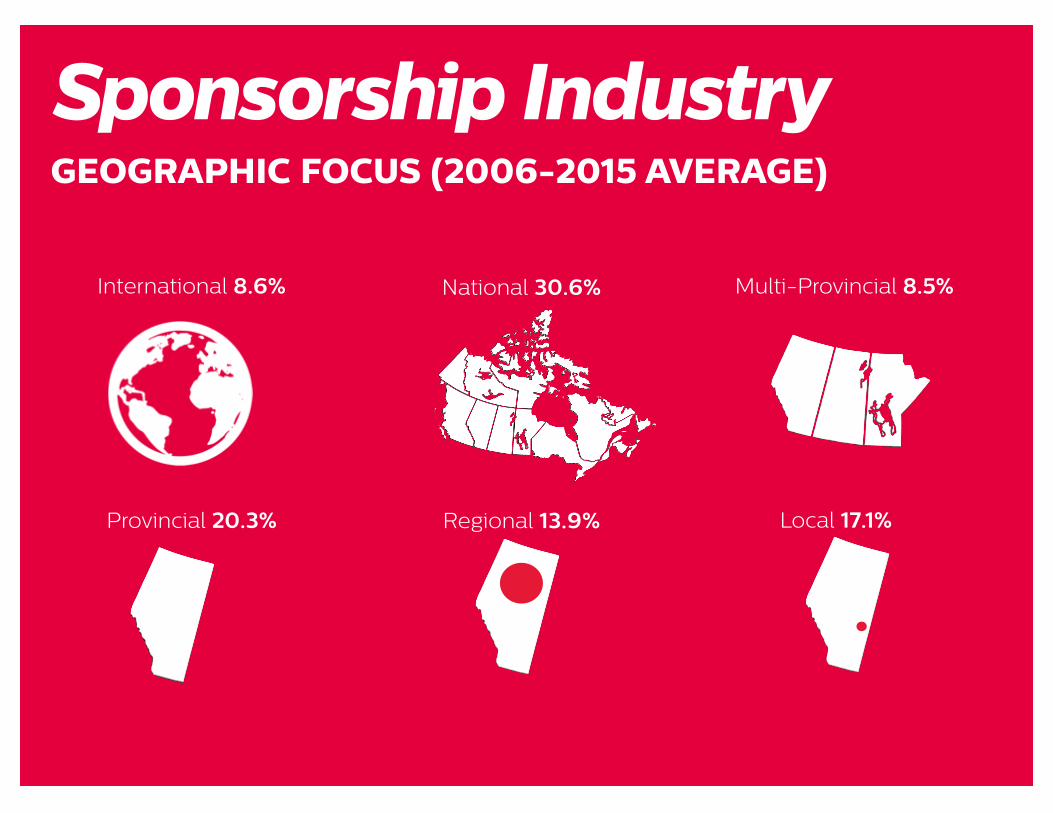
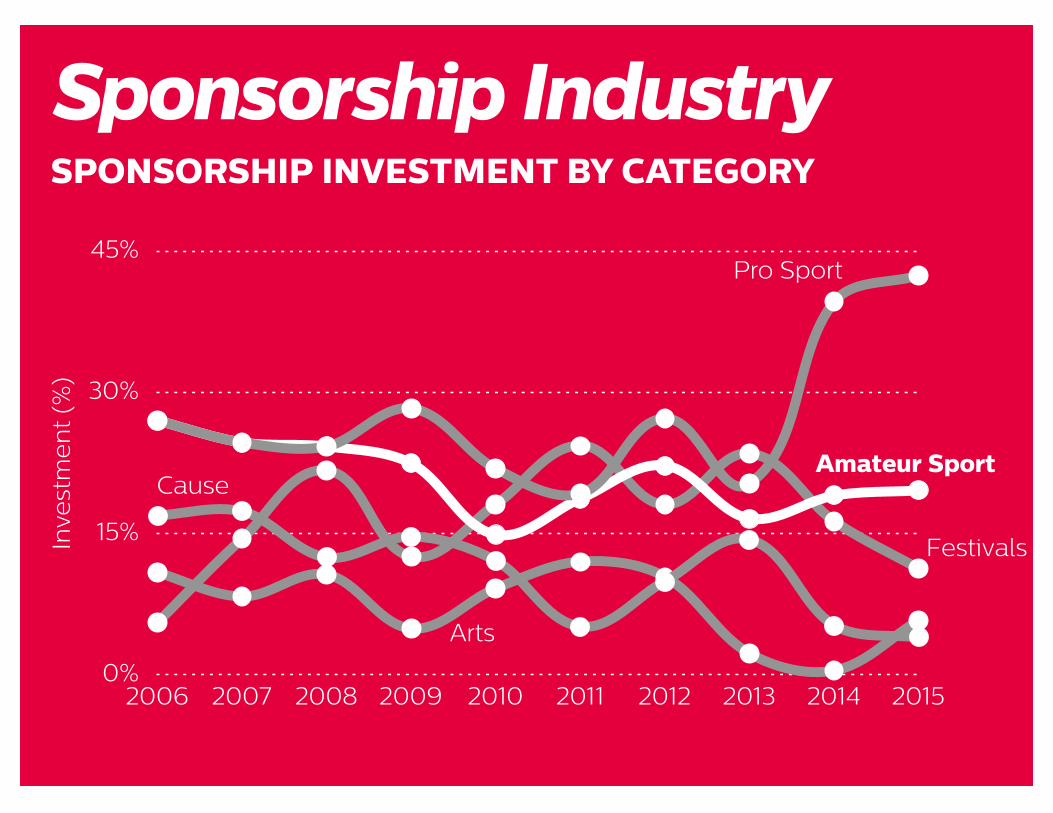
GEOGRAPHIC FOCUS (2006-2015 AVERAGE)
International 8.6% National 30.6% Multi-Provincial 8.5%
Provincial 20.3% Regional 13.9% Local 17.1%
Sponsorship Industry

0%
18%
35%
53%
70%
2006 2007 2008 2009 2010 2011 2012 2013 2014 2015
Inve
stm
en
t (%
)
Sponsorship IndustryCATEGORY OF LARGEST INVESTMENT
Pro Sport
Amateur Sport
EntertainmentFestivals

Avg
. Rig
hts
Fe
e (
$M)
$1.50
$1.20
$0.90
$0.60
$0.30
$0
Sponsorship Industry
2006 2007 2008 2009 2010 2011 2012 2013 2014 2015
$0.05$0.13
$1.20
$0.67$0.58
$1.26
$1.06
$0.72
$0.85
$1.34
LARGEST RIGHTS FEE ($M)

NSF-RELATED FINDINGS
Sponsorship in Canada
30
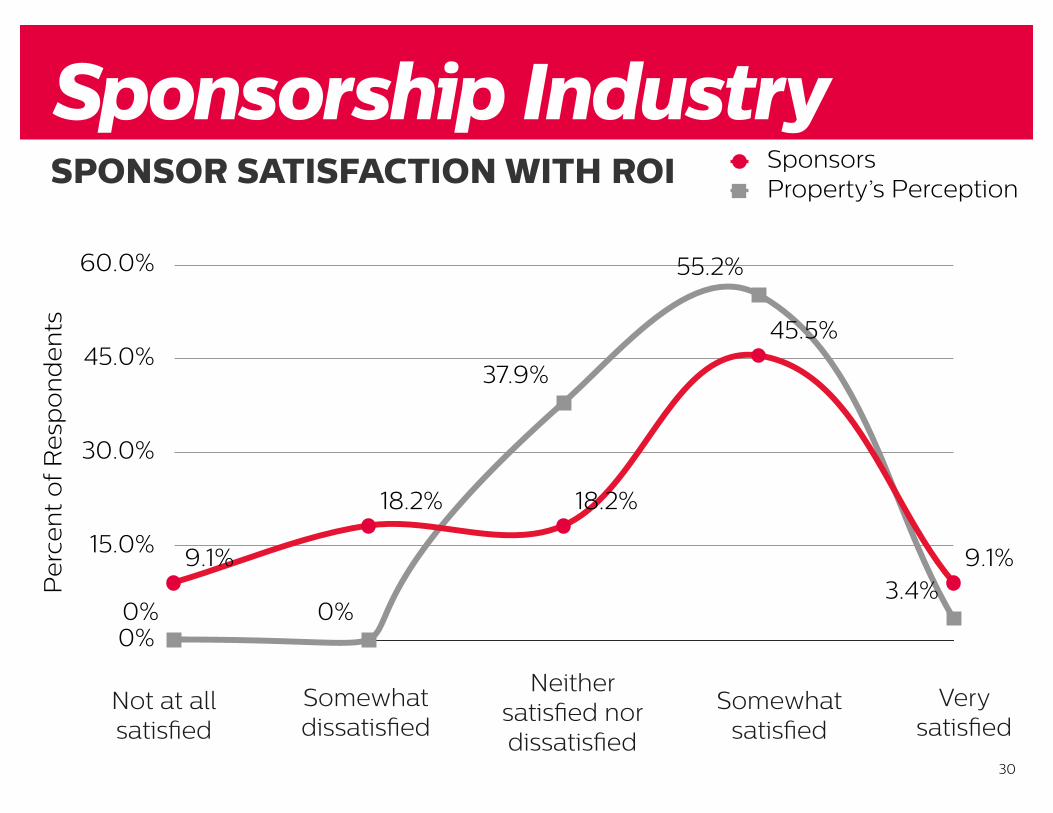
SPONSOR SATISFACTION WITH ROI
Sponsorship Industry
0%
15.0%
30.0%
45.0%
60.0%
0% 0%
37.9%
55.2%
3.4%9.1%
18.2% 18.2%
45.5%
9.1%
Pe
rce
nt
of R
esp
on
de
nts
SponsorsProperty’s Perception
Not at all satisfied
Somewhat dissatisfied
Neither satisfied nor dissatisfied
Somewhat satisfied
Very satisfied
31
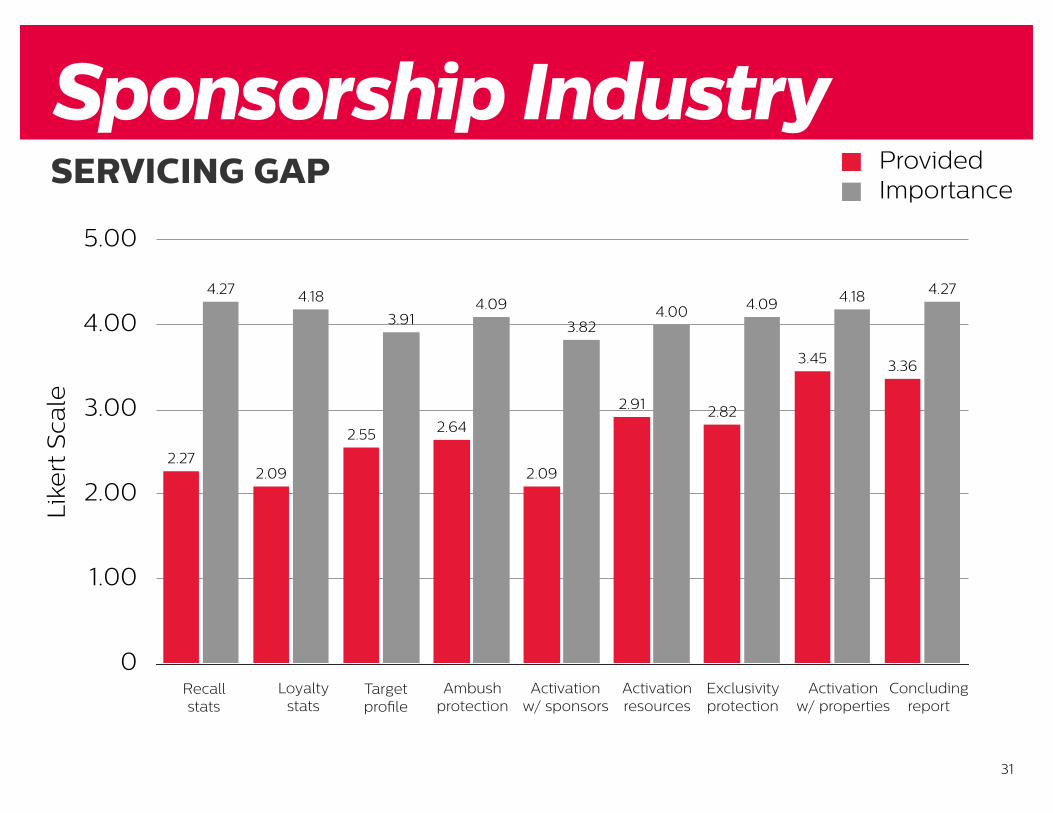
SERVICING GAP
Sponsorship Industry
Recallstats
0
1.00
2.00
3.00
4.00
5.00
4.274.184.094.003.82
4.093.91
4.184.27
3.363.45
2.822.91
2.09
2.642.55
2.092.27
Like
rt S
cale
ProvidedImportance
Loyalty stats
Target profile
Ambush protection
Activation w/ sponsors
Activation resources
Exclusivity protection
Activation w/ properties
Concluding report

Sponsorship IndustrySERVICING GAP (CONCLUDING REPORT)
0
1.00
2.00
3.00
4.00
5.00
2009 2010 2011 2012 2013 2014 2015
3.343.02 3.03 2.98
3.45 3.543.36
4.034.22
3.953.64
4.38 4.544.27
Se
rvic
es
Exp
ect
ed
/Pro
vid
ed
Expected
Provided

Sponsorship IndustrySERVICING GAP (ACTIVATION RESOURCES)
0
1.00
2.00
3.00
4.00
5.00
2009 2010 2011 2012 2013 2014 2015
3.032.84
2.592.82
3.13
2.08
2.91
4.00 3.904.09
4.33 4.17
4.77
4.00
Se
rvic
es
Exp
ect
ed
/Pro
vid
ed
Expected
Provided
0%
15%
30%
45%
2006 2007 2008 2009 2010 2011 2012 2013 2014 2015
Inve
stm
en
t (%
)
Sponsorship IndustrySPONSORSHIP INVESTMENT BY CATEGORY
Pro Sport
Amateur SportCause
Festivals
Arts
$0
$100
$200
$300
$400
2006 2007 2008 2009 2010 2011 2012 2013 2014 2015
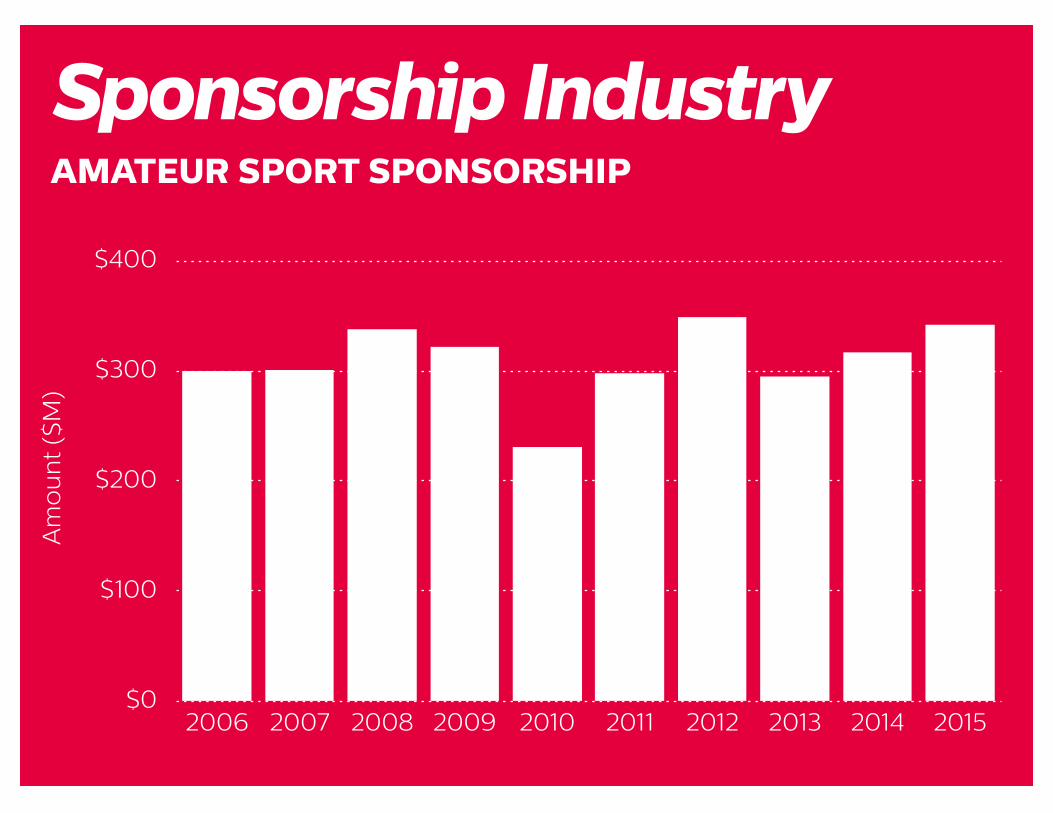
$342$317
$295
$349
$298
$231
$322$338
$301$300
Am
ou
nt
($M
)
Sponsorship IndustryAMATEUR SPORT SPONSORSHIP

36
Sponsorship IndustryNSF SPONSORSHIP (Data Tidbits from 10 years of CSLS)
• 196 responses
• Average Sponsorship Revenue: $145,500
• No ability to test reliability of sample
• Average percentage of budget from sponsorship: 6.5%
• Average number of sponsors: 11.4
• Average size of sponsorship: $13,108 ($14,491 in 2015 dollars)

SOURCE OF PROPERTY REVENUE
Sponsorship Industry
$2015 34.5%
Retail Finance Services
2014 20.5%
2013 22.1%
2015 20.7%
2014 15.9%
2013 12.3%
2015 13.8%
2014 9.1%
2013 12.9%

• 10-year cash average is 69.6% and VIK average is 30.0%
CashVIK
38
Sponsorship IndustryCASH VS. VIK REVENUE
0%
20%
40%
60%
80%
100%
2006 2007 2008 2009 2010 2011 2012 2013 2014 2015
24.2%22.1%23.6%30.8%33.6%32.3%34.8%33.0%39.0%30.0%
75.8%77.9%76.4%69.2%66.4%67.7%65.2%67.0%
61.0%
70.0%
Re
spo
nd
en
ts (
%)
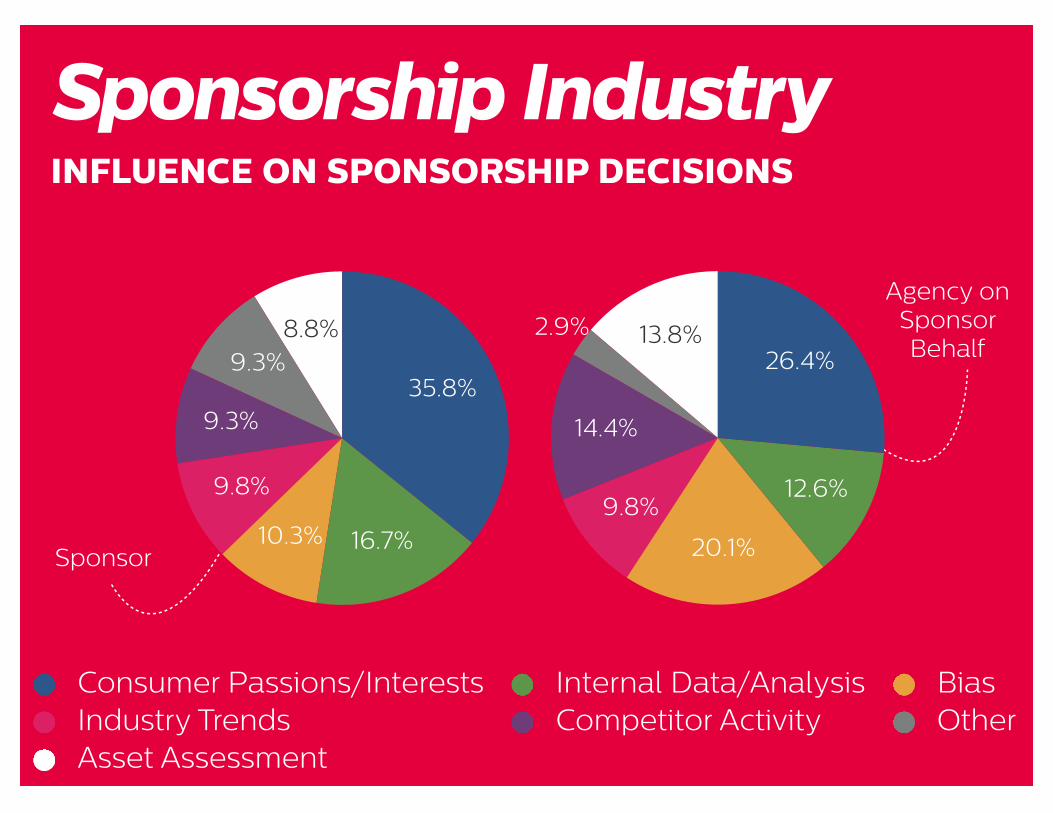
INFLUENCE ON SPONSORSHIP DECISIONS
Sponsorship Industry
8.8%9.3%
9.3%
9.8%
10.3% 16.7%
35.8%
Consumer Passions/Interests Internal Data/Analysis BiasIndustry Trends Competitor Activity OtherAsset Assessment
Sponsor
Agency on Sponsor Behalf13.8%2.9%
14.4%
9.8%
20.1%
12.6%
26.4%

ACTIVATION EXPANDS
Sponsorship Industry
0%
5%
10%
15%
20%
25%
6.0%6.3%
11.8%
15.4%
17.7%
21.7%
Act
ivat
ion
Sp
en
d (
%)
Branded content
Hosting/hospitality
Advertis-ing
Co-promotions
Socialmedia
PR
Activation Ratio (Property)
• 2015 4.10%• 2014 0.98%• 2013 0.29%
34.0% in 2014
17.0% in 2014
14.0% in 2014
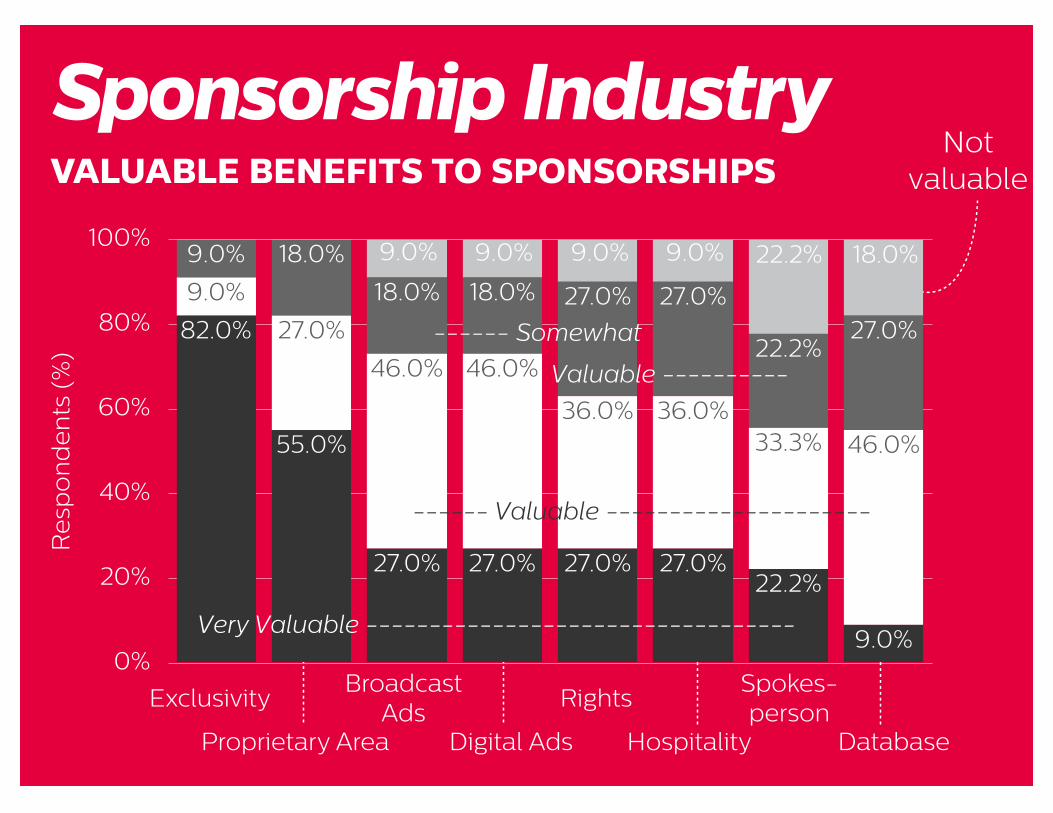
VALUABLE BENEFITS TO SPONSORSHIPS
Sponsorship Industry
ExclusivityBroadcast
AdsRights
Spokes-person
Digital AdsProprietary Area Hospitality Database
0%
20%
40%
60%
80%
100%
27.0%22.2%
27.0%27.0%18.0%18.0%
18.0%9.0%
46.0%33.3%36.0%36.0%
46.0%46.0%
27.0%
9.0%
9.0%
22.2%27.0%27.0%27.0%27.0%
55.0%
82.0%
Re
spo
nd
en
ts (
%)
9.0% 9.0% 9.0% 9.0% 18.0%22.2%
Not valuable
Very Valuable ----------------------------------
------ Valuable ---------------------
------ Somewhat
Valuable ----------

OPPORTUNITIES & THREATS TODAY
Sponsorship Industry
Opportunity Co-Sponsorship
• Having sponsors work together instead of competing for attention
• Increased integration of sponsor brands
Threat Talent Gap
• Lack of implementation, evaluation and activation knowledge
• Limited professional development opportunities• Succession planning
42
CONTENT & DIGITAL OPPORTUNITIES
Sponsorship Industry
The opportunity is well known, as is the decline of traditional mediums (e.g., cable TV). The integration across platforms, as well as enhanced digital activities are realities of sponsorship today. However, there are some very ambitious ideas expressed by industry leaders:
• “Technology opening new activation possibilities" • “Part ownership of properties by brands”• “Virtual reality to connect onsite and digital activations”• “Integrating apps with the sponsorship experience to enhance
consumer engagement thereby creating more effective sponsorships”
43

SHARED OPPORTUNITIES AND CHALLENGES
NSF Groupings
NOTE: Initial Results Only

45
METHOD
NSF Groupings
Primary Research
•Cluster Analysis - Survey Data
•CSLS Data Assessment
Secondary Research
•Case Studies
46
DATA COLLECTION (IN PROCESS)
• 33 questions
• Both languages
• 8 categories of questions
• Efficient to complete
• Up to 10 years of longitudinal data
• Survey will close Monday, February 29, 2016 - we need your data here to benchmark
Survey

47
Cluster AnalysisFIRST DRAFT (PRE-SURVEY) OF CLUSTERS
•Consultation with COC: 48 NSF’s considered
•Each analyzed on 10 factors, including 24 variables
- Factors/Variables selected to represent ‘value to sponsors’
- All variables measured using a two (no/yes) or three level (low, medium, high) categorical scale, including a ‘0’ score (no)
- This analysis will be re-assessed following survey completion by NSF’s
48
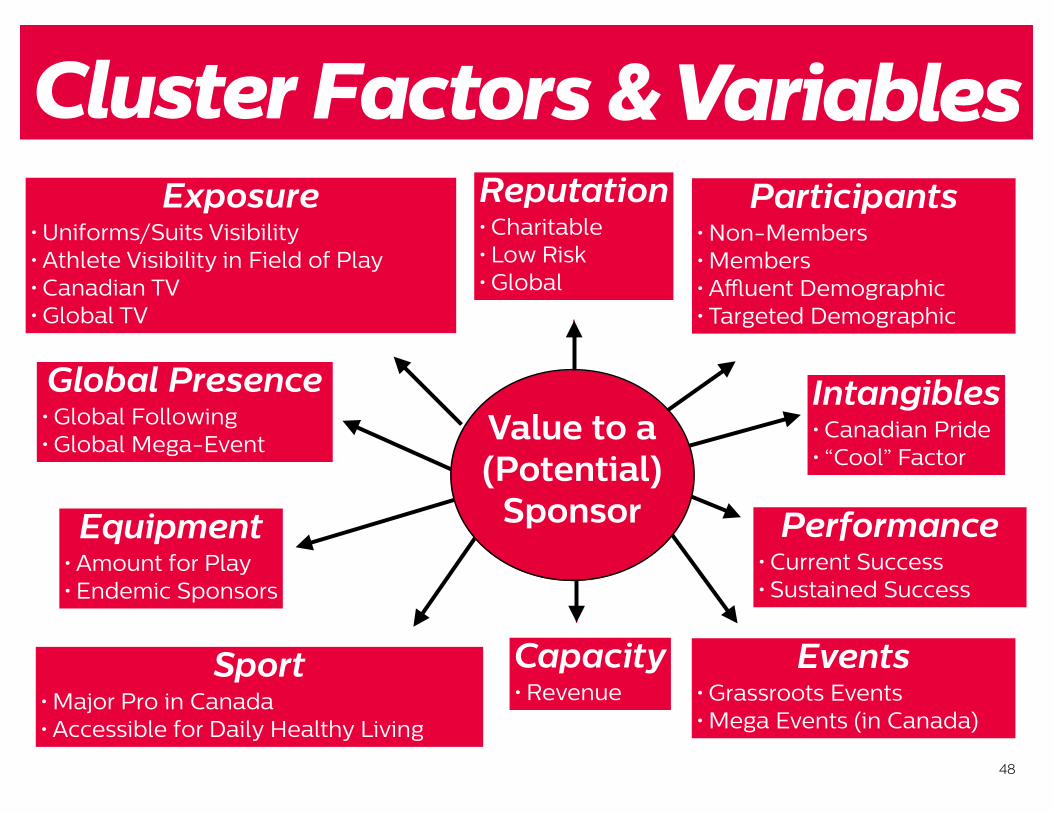
Cluster Factors & VariablesExposure
• Uniforms/Suits Visibility• Athlete Visibility in Field of Play• Canadian TV• Global TV
Reputation• Charitable• Low Risk• Global
Intangibles• Canadian Pride• “Cool” Factor
Global Presence• Global Following• Global Mega-Event
Equipment• Amount for Play• Endemic Sponsors
Sport• Major Pro in Canada• Accessible for Daily Healthy Living
Events• Grassroots Events• Mega Events (in Canada)
Performance• Current Success• Sustained Success
Capacity• Revenue
Participants• Non-Members• Members• Affluent Demographic• Targeted Demographic
Value to a(Potential)
Sponsor

49
NSF Clusters
Mega ValueCanadian
Mega ValueGlobal
Performance& Participation
PRE-SURVEYPlease note that these are the initial pre-survey clusters and may change following the data analysis.
AttractiveAttributes
High Potential
Asset Build
50
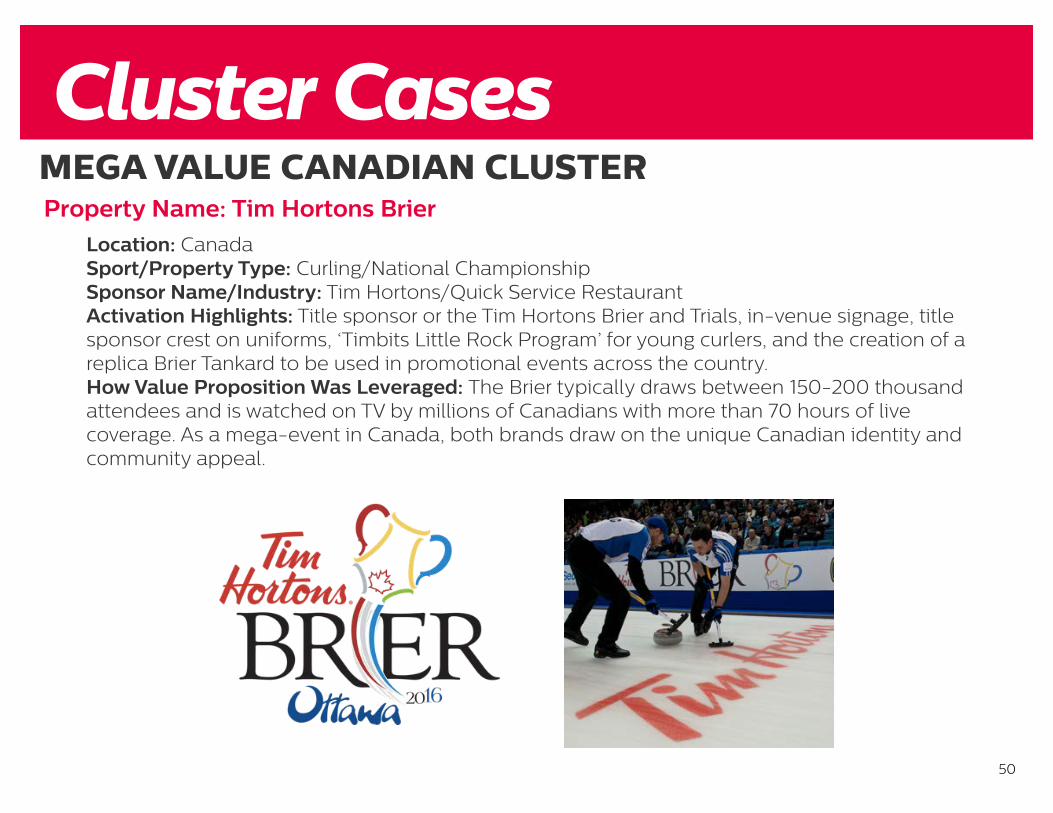
MEGA VALUE CANADIAN CLUSTERProperty Name: Tim Hortons Brier
Location: CanadaSport/Property Type: Curling/National Championship Sponsor Name/Industry: Tim Hortons/Quick Service RestaurantActivation Highlights: Title sponsor or the Tim Hortons Brier and Trials, in-venue signage, title sponsor crest on uniforms, ‘Timbits Little Rock Program’ for young curlers, and the creation of a replica Brier Tankard to be used in promotional events across the country.How Value Proposition Was Leveraged: The Brier typically draws between 150-200 thousand attendees and is watched on TV by millions of Canadians with more than 70 hours of live coverage. As a mega-event in Canada, both brands draw on the unique Canadian identity and community appeal.
Cluster Cases
51
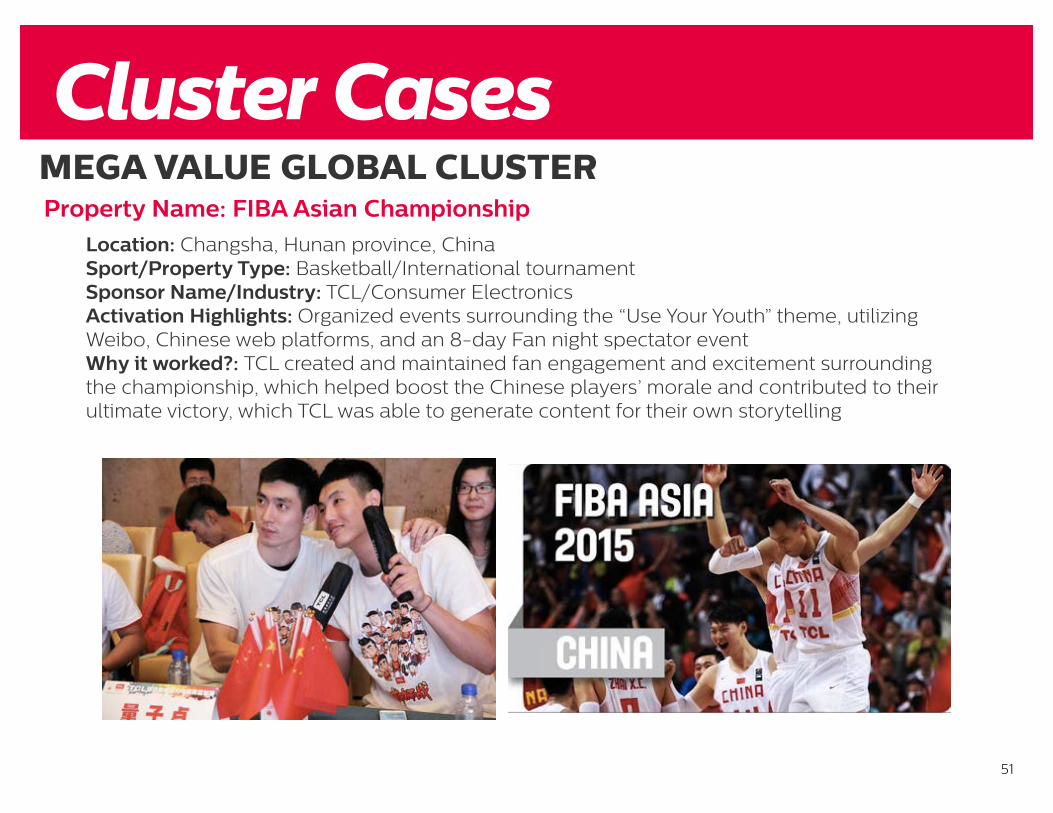
MEGA VALUE GLOBAL CLUSTERProperty Name: FIBA Asian Championship
Location: Changsha, Hunan province, ChinaSport/Property Type: Basketball/International tournamentSponsor Name/Industry: TCL/Consumer ElectronicsActivation Highlights: Organized events surrounding the “Use Your Youth” theme, utilizing Weibo, Chinese web platforms, and an 8-day Fan night spectator eventWhy it worked?: TCL created and maintained fan engagement and excitement surrounding the championship, which helped boost the Chinese players’ morale and contributed to their ultimate victory, which TCL was able to generate content for their own storytelling
Cluster Cases
52
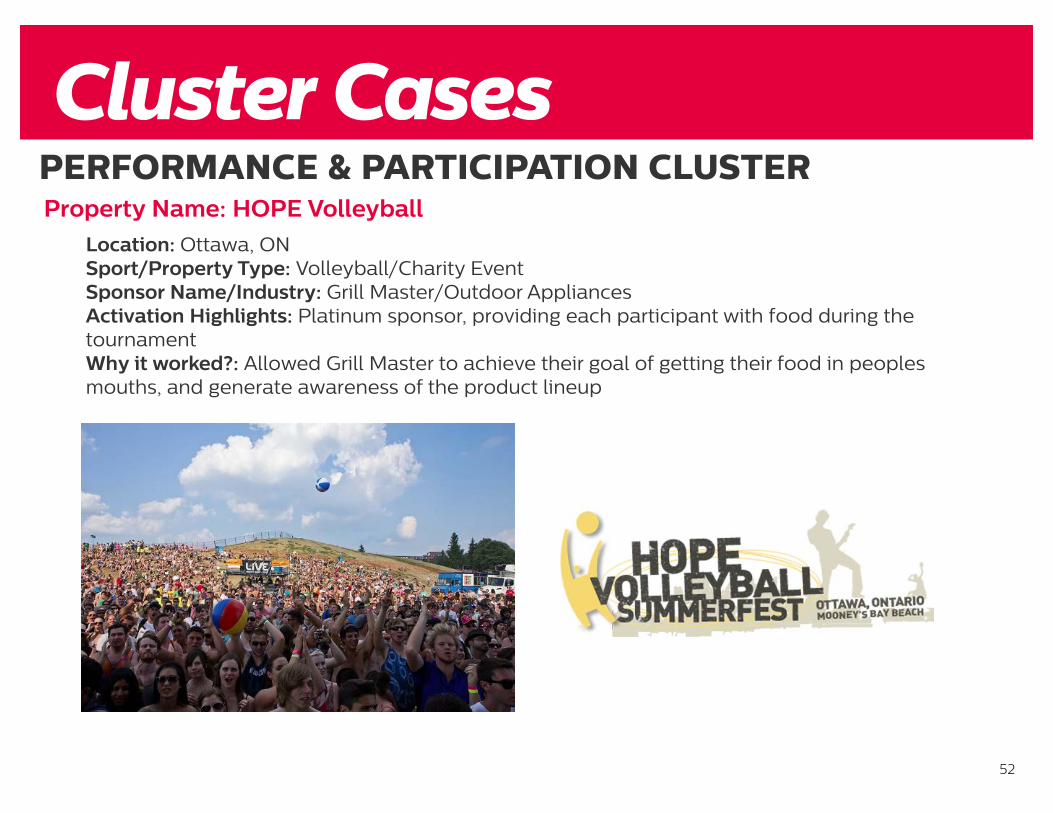
PERFORMANCE & PARTICIPATION CLUSTERProperty Name: HOPE Volleyball
Location: Ottawa, ONSport/Property Type: Volleyball/Charity EventSponsor Name/Industry: Grill Master/Outdoor AppliancesActivation Highlights: Platinum sponsor, providing each participant with food during the tournamentWhy it worked?: Allowed Grill Master to achieve their goal of getting their food in peoples mouths, and generate awareness of the product lineup
Cluster Cases

53
ATTRACTIVE ATTRIBUTES CLUSTER
Location: Mont-Tremblant, QCSport/Property Type: Triathlon/ Local eventSponsor Name/Industry: Subaru/AutomotiveActivation Highlights: Title sponsor with Subaru cars on-site as well as tent and banners set up for increased brand exposureWhy it worked?: Connected with the brands slogan for “Confidence in Motion” and the target demographic/profile of the Ironman participant and spectator
Property Name: Subaru Ironman
Cluster Cases

54
HIGH POTENTIAL CLUSTER
Location: Holmenkollen, Norway Sport/Property Type: Biathlon/National Grassroots ProgramSponsor Name/Industry: Statkraft/Renewable EnergyActivation Highlights: Financial support and talent development for youth biathlon participants Why it worked?: Positive association with finding the best talent to help further develop and access to the local communities to garner interest in future potential employees
Property Name: Statkraft Young Star
Cluster Cases
55
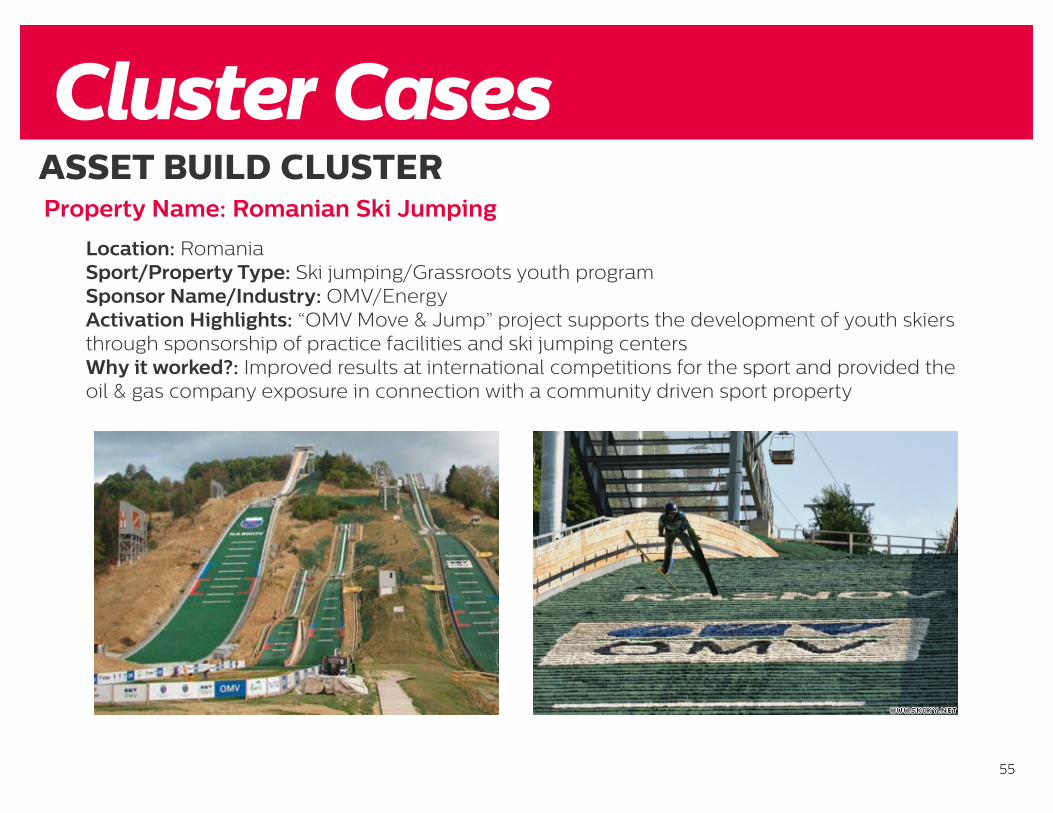
ASSET BUILD CLUSTER
Location: RomaniaSport/Property Type: Ski jumping/Grassroots youth program Sponsor Name/Industry: OMV/EnergyActivation Highlights: “OMV Move & Jump” project supports the development of youth skiers through sponsorship of practice facilities and ski jumping centersWhy it worked?: Improved results at international competitions for the sport and provided the oil & gas company exposure in connection with a community driven sport property
Property Name: Romanian Ski Jumping
Cluster Cases

Most Valuable Property Study

57
MVP Study
A syndicated study designed to identify what drives the connection between sponsors and consumers/citizens
3
Value Partnership Love
Connection
SPONSOR CONSUMER PROPERTY

58
METHOD
•Focus Groups •Survey: 2012, 2014, 2015, 2016•2016 Survey
- 100 Properties- 2,500 Canadians surveyed
MVP Study
59
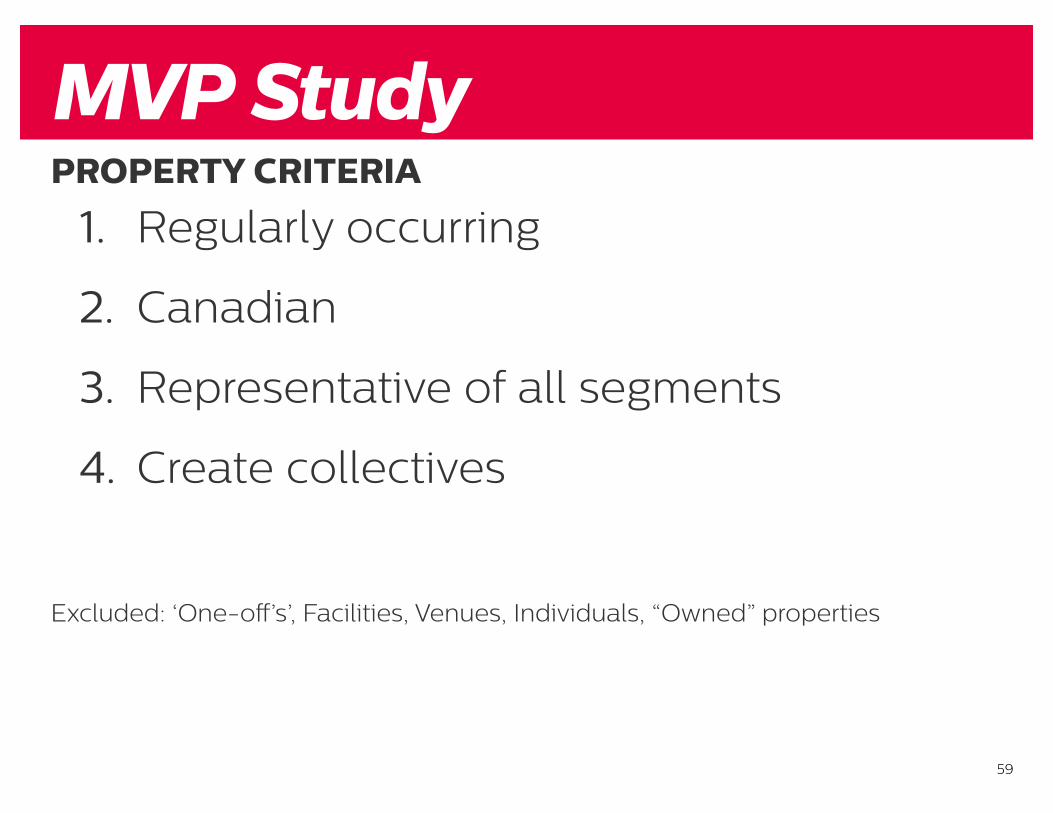
MVP StudyPROPERTY CRITERIA
1. Regularly occurring
2. Canadian
3. Representative of all segments
4. Create collectives
Excluded: ‘One-off’s’, Facilities, Venues, Individuals, “Owned” properties
60
MVP Study
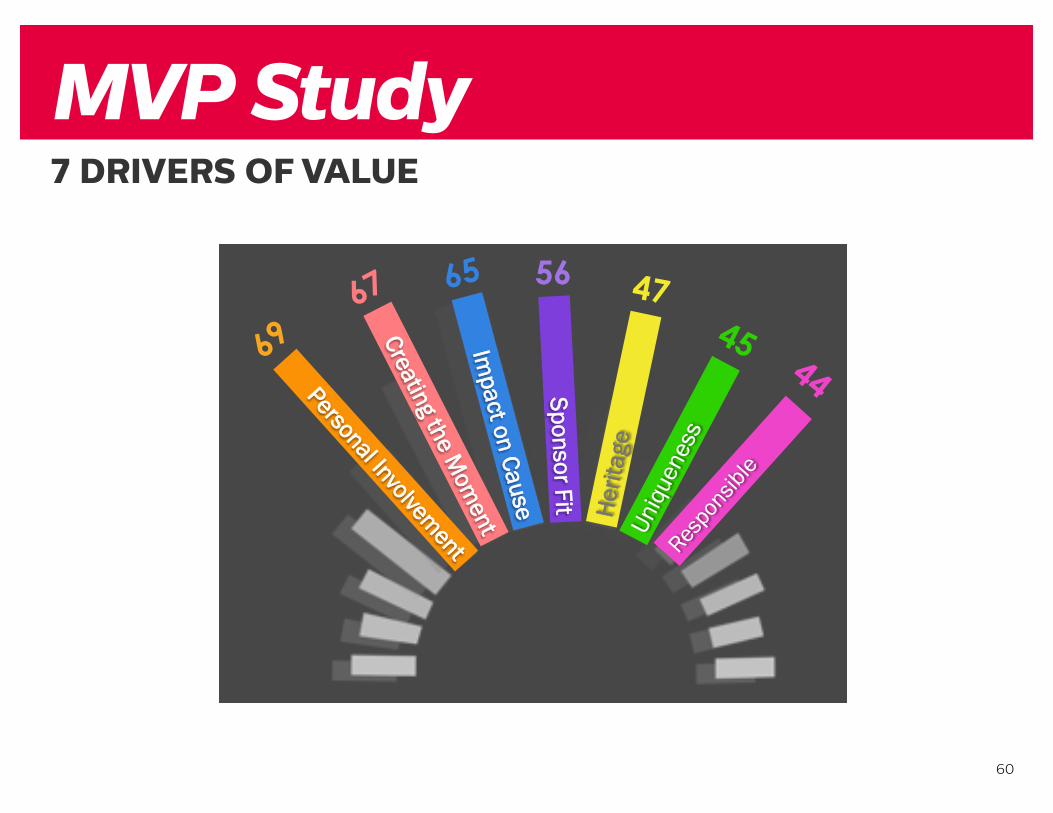
69
Personal Involvement
67
Creating the Mom
ent
65
Impact on Cause
56
Sponsor Fit Herit
age
47
Respo
nsibl
e
44
Uniq
uene
ss
45
7 D
river
s of
Val
ue
7 DRIVERS OF VALUE

PROPERTY CATEGORIES
61
MVP Study
28
EVENTS
ARTS
ENTERTAINMENT
HEALTH CAUSES
YOUTH CAUSES
AMATEUR SPORTS
PROFESSIONAL SPORTS
SOCIAL CAUSES

PAST MVPS BY CATEGORY
62
MVP Study
31
Past MVPs
Major Museum or Art Gallery
Winter Cultural Festivals
Nearest Theme Park /
Attraction
Major Museum or Art Gallery
Summer Cultural Festivals
Hockey Night in Canada
Major Performance
Arts or Theatre
Program in the nearest city
Arts Festivals in the Nearest
Major City
Hockey Night in Canada
Pro Sports Health Youth Social Entertainment Events Arts Amateur Sports
Favourite NHL Team
Canadian Olympic Team
National Hockey League
Canadian Paralympic
Team
Favourite NHL Team
Canadian Olympic Team
WWF Kids Help Phone
Canadian Cancer
Society/ Relay for Life
Salvation Army
United Nations Children’s
Fund Heart & Stroke
Salvation Army
Big Brothers and Sisters
Canadian Cancer
Society/ Relay for Life 20
12
2014
20
15
63
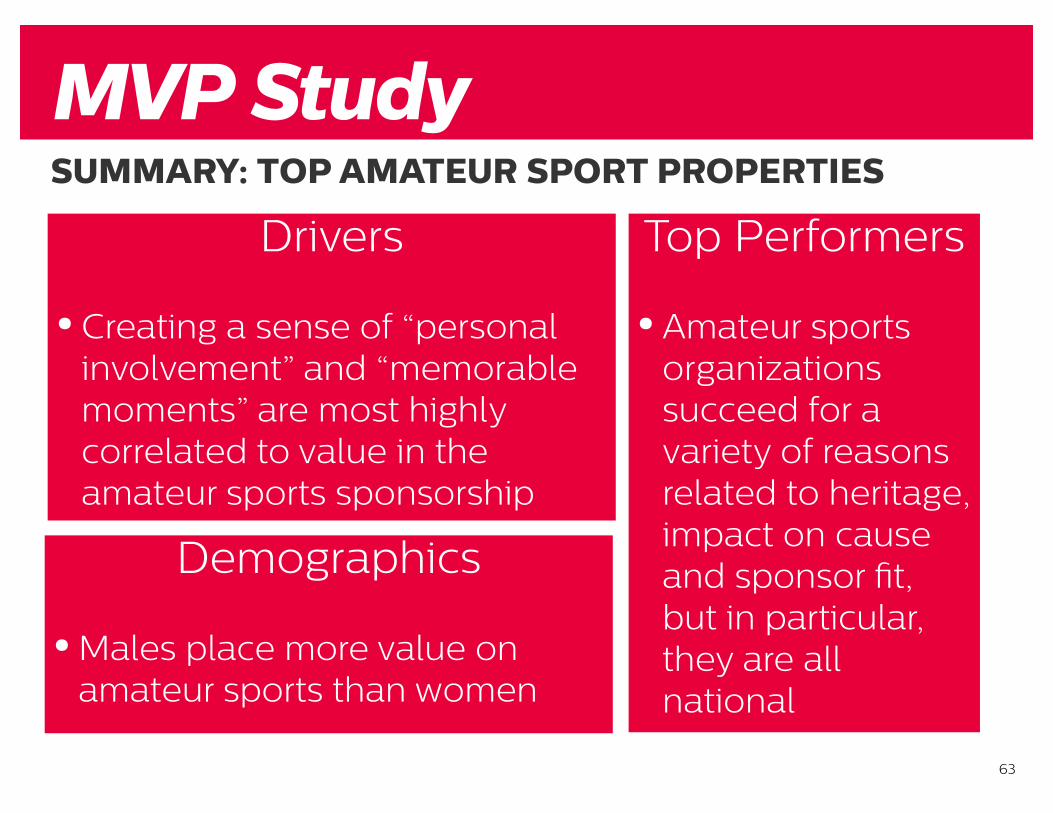
SUMMARY: TOP AMATEUR SPORT PROPERTIES
MVP Study
Drivers
•Creating a sense of “personal involvement” and “memorable moments” are most highly correlated to value in the amateur sports sponsorship
Top Performers
•Amateur sports organizations succeed for a variety of reasons related to heritage, impact on cause and sponsor fit, but in particular, they are all national
Demographics
•Males place more value on amateur sports than women

64
OVERALL KEY LEARNINGS
•Cause Champions: Sponsors are often rewarded when they are clear champions of the cause. The Sponsor - Property fit remains key
•Memories: Canadians connect through events that create collective, memorable moments
•Engagement: Getting the public personally involved. Mobilizing Canadians in communities across the country
•Building Community: If a property is attempting to make the world a better place or improve community life, it’s more likely to connect sponsors to the public
MVP Study
What Sponsors Want

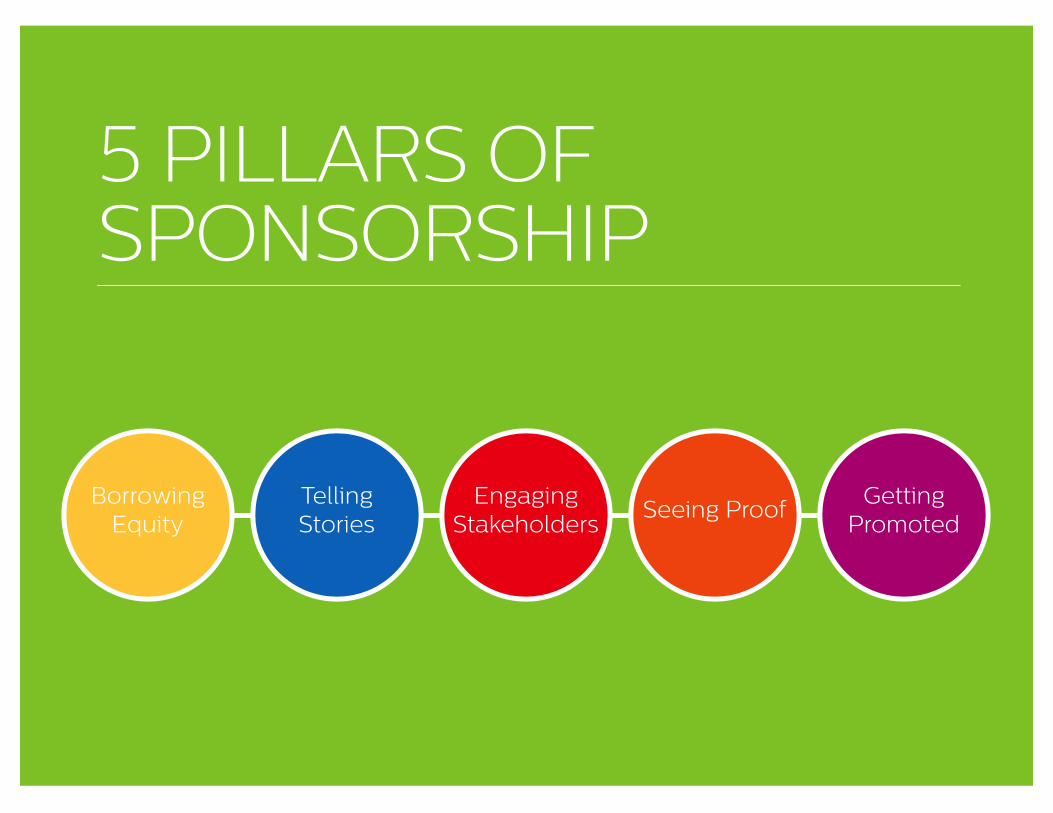
5 PILLARS OFSPONSORSHIP
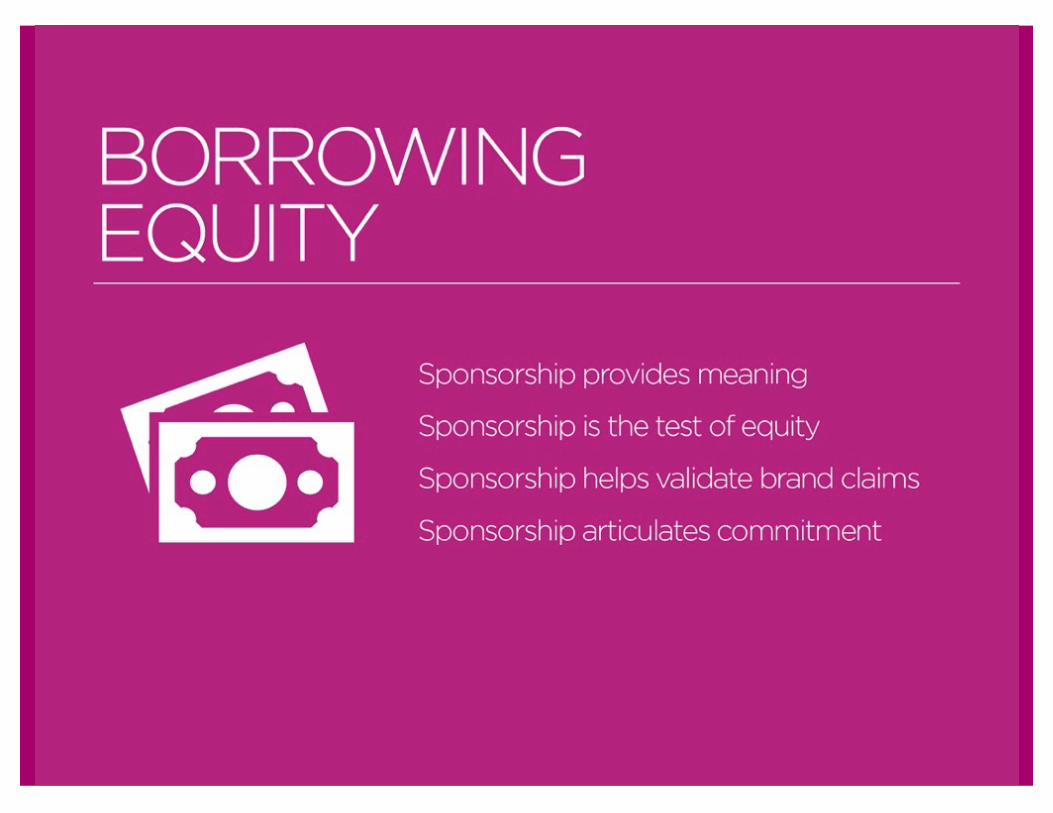
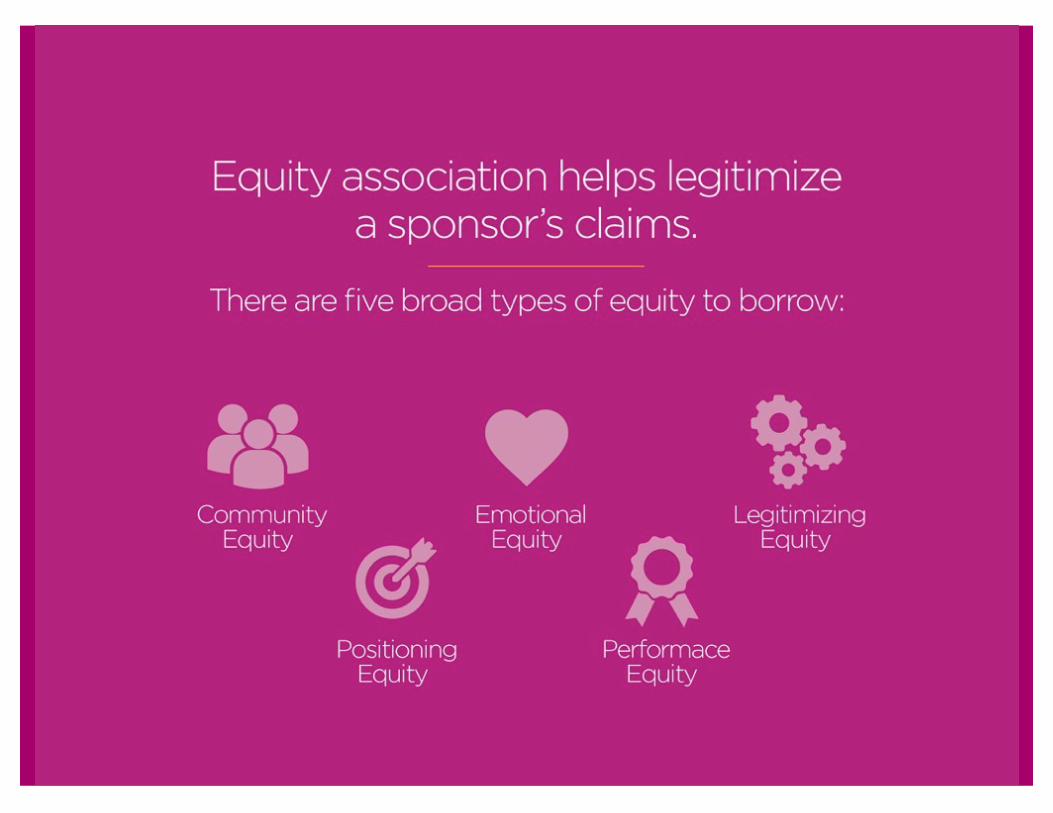
Borrowing Equity
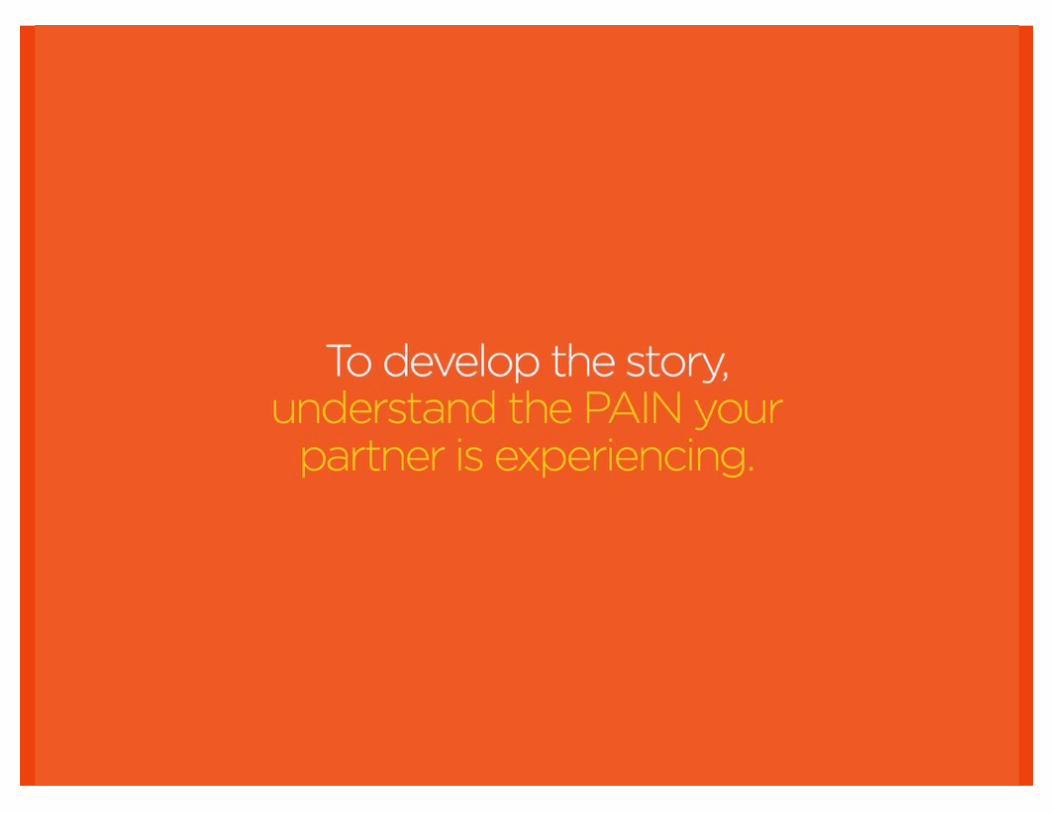
Telling Stories
Engaging Stakeholders
Seeing Proof Getting Promoted


GETTING PROMOTED
Create a vision of working together
Help your sponsor do their job better
Help them write their internal recommendation
Develop planning tools to build your credibility

• Sponsorship Fulfillment Plan
• Quarterly Planning Sessions
• Online Partner Support
• Monthly Reports
• Validated ROI
Provide the support, reports, and plans to keep your partner
confident in the final result.

Elevate your role from selling your property to providing solutions.
5 PILLARS OFSPONSORSHIP
Borrowing Equity
Telling Stories
Engaging Stakeholders
Seeing Proof Getting Promoted

Sponsorship Fulfillment

84
COMPREHENSIVE APPROACH
Fulfillment Model
Sp
on
sors
hip
Fu
lfillm
ent
Servicing
Evaluation
Activation

85
PROPERTIES SHOULD INVEST IN SPONSORSHIP
Fulfillment Model
$
Sp
on
sors
hip
Rig
hts
Fee
Evaluation• % of individual sponsor
Servicing• % of individual sponsor
Activation• % of individual sponsor

DIRECT & INDIRECT (ACTIVATION) INVESTMENTS IN SPORTS SPONSORSHIPS
86
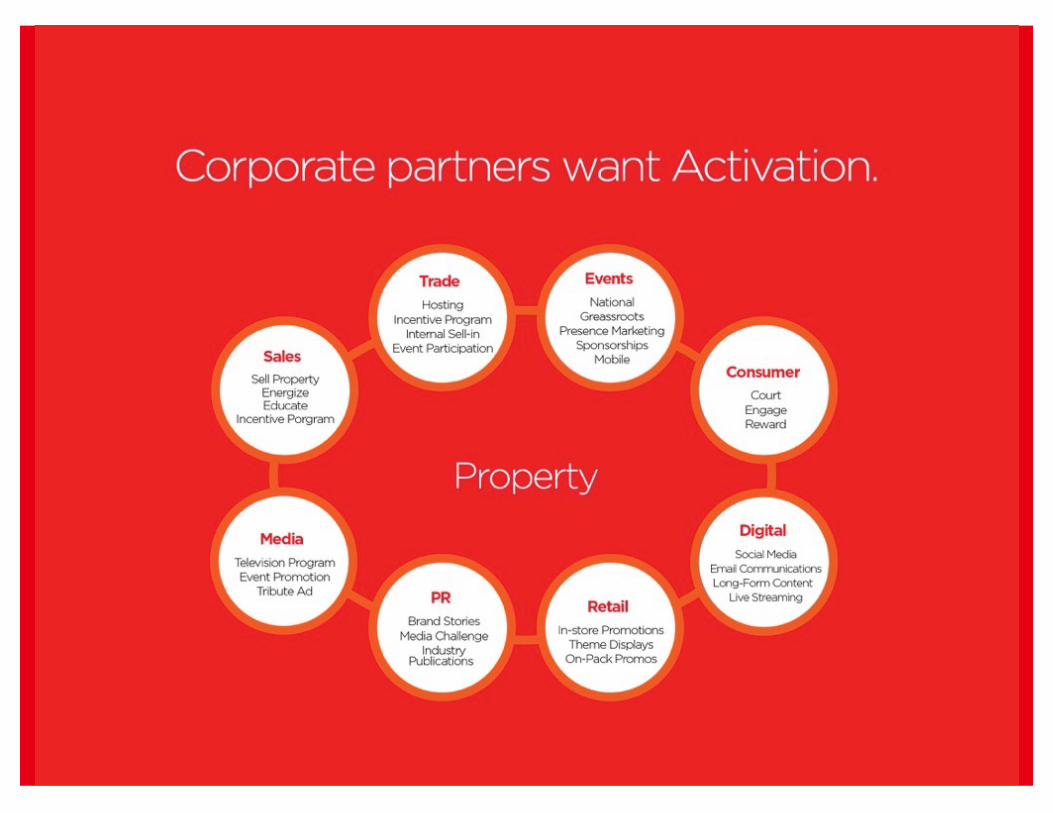
Activation 101DIRECT AND INDIRECT (ACTIVATION) INVESTMENTS
IN SPORTS SPONSORSHIP
A: DIRECT SPONSORSHIP INVESTMENT
B: INDIRECT (ACTIVATION) SPONSORSHIP INVESTMENT
Foster, O’Reilly & Davila, 2016
A. DIRECT SPONSORSHIP INVESTMENT
B. INDIRECT (ACTIVATION) SPONSORSHIP INVESTMENTS
87
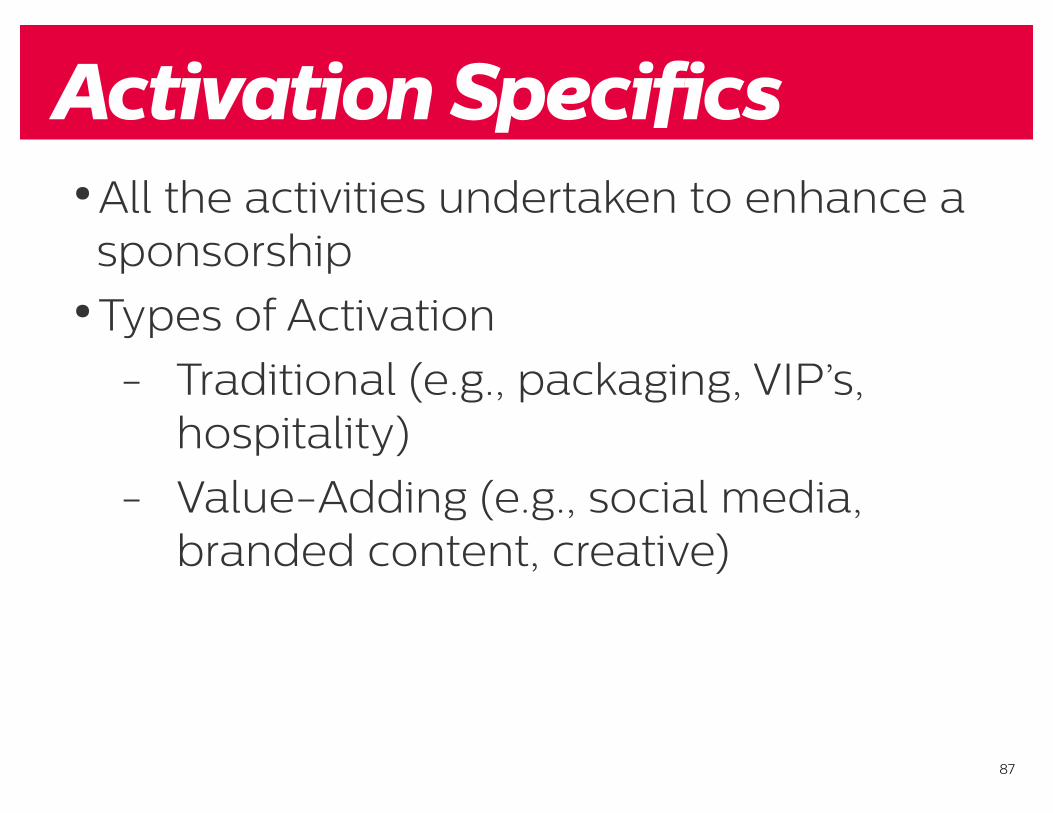
•All the activities undertaken to enhance a sponsorship
•Types of Activation- Traditional (e.g., packaging, VIP’s,
hospitality)- Value-Adding (e.g., social media,
branded content, creative)
Activation Specifics
88
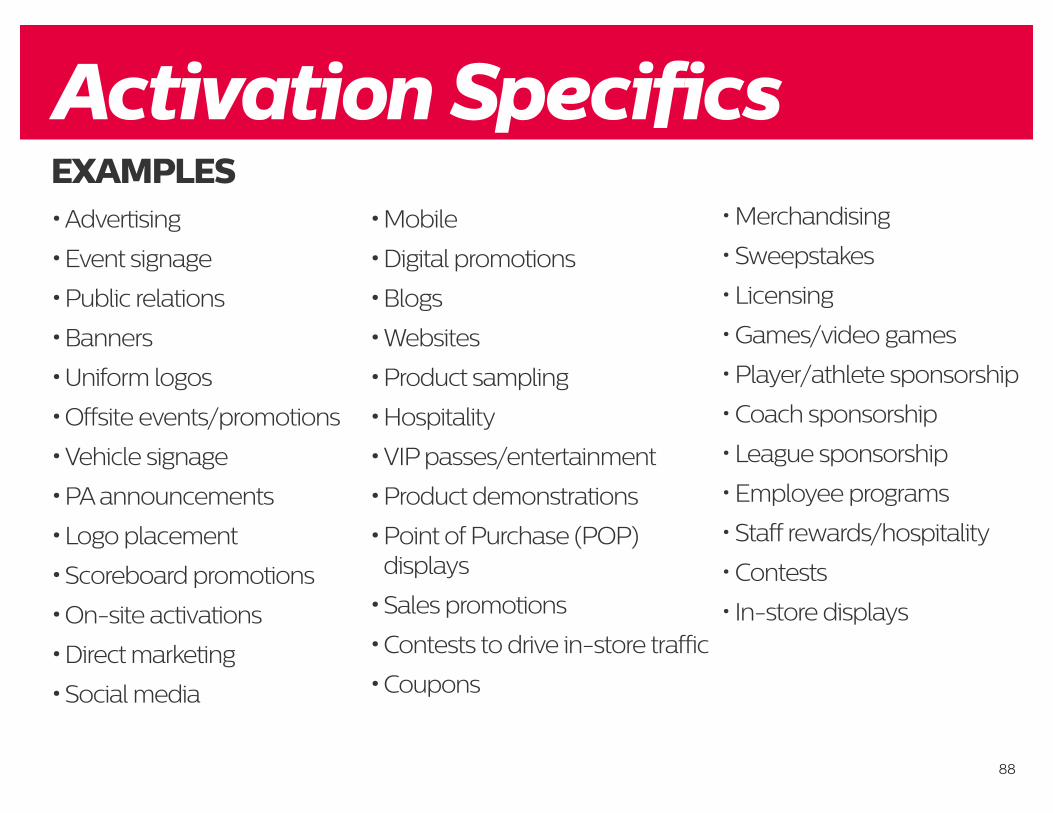
Activation SpecificsEXAMPLES•Advertising
•Event signage
•Public relations
•Banners
•Uniform logos
•Offsite events/promotions
•Vehicle signage
•PA announcements
•Logo placement
•Scoreboard promotions
•On-site activations
•Direct marketing
•Social media
•Mobile
•Digital promotions
•Blogs
•Websites
•Product sampling
•Hospitality
•VIP passes/entertainment
•Product demonstrations
•Point of Purchase (POP) displays
•Sales promotions
•Contests to drive in-store traffic
•Coupons
•Merchandising
•Sweepstakes
•Licensing
•Games/video games
•Player/athlete sponsorship
•Coach sponsorship
•League sponsorship
•Employee programs
•Staff rewards/hospitality
•Contests
• In-store displays

89
ALLOCATE RESOURCES FOR CONTRACT DELIVERY
•Set aside a small percentage of rights fees revenue
•Identify human resources•Build an Account Management Plan
- Contact control- Roles and responsibilities allocations- Critical path/workback schedule- Comprehensive schedule of fulfillment items - Inventory Tracking- Schedules- Reports
Servicing

90
BASED ON PUBLISHED MODEL
Evaluation1. Verify that sponsor wants an evaluation done.
2. Determine sponsor objective(s) by (i) reviewing contract, (ii) meeting contact at sponsor, and (iii) reviewing sponsor’s marketing plan.
3. Based on objectives, determine investment in evaluation, as well as metrics and methods to implement.
4. Measure before sponsorship begins to acquired benchmark(s).
5. Collect data and assess effectiveness.
6. Compare results to benchmark and objectives.
Build a body of evidence and case for renewal for your partner.
Assess if you are charging appropriate amount.
Determine if levels of activation are correct for both sponsor and property.
Assess if servicing and evaluation investments and activities by property are
sufficient.
From O’Reilly & Madill, 2011

91
If you have any questions, please let us know.
Contact InformationNORM O’REILLYPartner Consultant, T1Tel: (740) 517-7242 Email: [email protected]
ELISA BESELTConsultant, T1Tel: (416) 355-2688Email: [email protected]