Embed Size (px)
Citation preview

The National Report of the First Nations Regional Early Childhood, Education, and Employment Survey
NOW IS THE TIME: OUR DATA,
OUR STORIES, OUR FUTURE

This publication is available in electronic form only on the First Nations Information Governance Centre’s website, at www.FNIGC.ca/REEES2016.
This report is © 2016 First Nations Information Governance Centre
All rights reserved. This publication can be reproduced in whole or in part with the written permission of the First Nations Information Governance Centre.
For permission, please contact: [email protected]. These materials are to be used solely for non-commercial purposes.
Cite this publication in the following format: First Nations Information Governance Centre, Our Data, Our Stories, Our Future: The National Report of the First Nations Regional Early Childhood, Education and Employment Survey, (Ottawa: 2016). 104 pages. Published in July 2016.Ottawa, Ontario
ISBN 978-1-988433-00-4
The First Nations Information Governance Centre (FNIGC) is Canada’s premier source of information about First Nations people living on reserve and in northern communities. An incorporated non-profit operating with a special mandate from the Assembly of First Nations’ Chiefs in Assembly (Resolution #48, December 2009), FNIGC is committed to improving the health and well-being of First Nations people living in our 634 communities across the country.www.FNIGC.ca
First Nations Information Governance Centre
Head Office
325 Island Road, Unit 2 Akwesasne, ON K6H 5R7 Tel: 613-733-1916 Fax: 613-936-8974 Toll Free: 866-997-6248
Ottawa Office
170 Laurier Avenue W, Suite 904 Ottawa, ON K1P 5V5 Tel: 613-733-1916, ext. 100 Fax: 613-231-7072 Toll Free: 866-997-6248
General inquiries: [email protected]
About the cover The cover of this report is an original artwork created by Julie Flett, an award-winning Cree- Métis artist and author who lives in Vancouver, British Columbia. Flett studied fine arts at Concordia University and Emily Carr University of Art + Design and is a two-time recipient of the Christie Harris Illustrated Children’s Literature Prize. In 2015 she was chosen as the First Nation Communities READ title selection for her book Wild Berries/Pakwa che Menisu, which was also awarded the inaugural Aboriginal Literature Award for 2014.You can read more about her art at www.julieflett.com.

The National Report of the First Nations Regional Early Childhood, Education, and Employment Survey | 1
FOREWORD ................................................................................................................................. 3
Chapter 1: Introduction ............................................................................................................. 4BACKGROUND .........................................................................................................................................................5METHODOLOGY .......................................................................................................................................................8HOLISTIC LIFELONG LEARNING MODELS .................................................................................................................9REFERENCES ..........................................................................................................................................................13
Chapter 2: First Nations Early Childhood Education ............................................................ 14EXECUTIVE SUMMARY ..........................................................................................................................................14KEY FINDINGS ........................................................................................................................................................14INTRODUCTION .....................................................................................................................................................15METHODS .............................................................................................................................................................16RESULTS .................................................................................................................................................................18DISCUSSION ...........................................................................................................................................................26CONCLUSIONS .......................................................................................................................................................28REFERENCES .........................................................................................................................................................29
Chapter 3: First Nations Education ........................................................................................ 30EXECUTIVE SUMMARY ..........................................................................................................................................30KEY FINDINGS ........................................................................................................................................................30INTRODUCTION .....................................................................................................................................................31METHODS .............................................................................................................................................................32RESULTS .................................................................................................................................................................33DISCUSSION ...........................................................................................................................................................40CONCLUSIONS .......................................................................................................................................................41REFERENCES ..........................................................................................................................................................42
Chapter 4: Youth Employment, Culture, and Well-Being ...................................................... 43EXECUTIVE SUMMARY ..........................................................................................................................................43KEY FINDINGS .......................................................................................................................................................43INTRODUCTION ....................................................................................................................................................44METHODS ..............................................................................................................................................................44RESULTS .................................................................................................................................................................46DISCUSSION ...........................................................................................................................................................52CONCLUSIONS .......................................................................................................................................................53REFERENCES ..........................................................................................................................................................55
Table of Contents

Now is the Time: Our Data, Our Stories, Our Future 2 |
Chapter 5: Adult Employment, Culture, and Well-Being ...................................................... 57EXECUTIVE SUMMARY ..........................................................................................................................................57KEY FINDINGS ........................................................................................................................................................57INTRODUCTION .....................................................................................................................................................58METHODS ..............................................................................................................................................................58RESULTS .................................................................................................................................................................60DISCUSSION ...........................................................................................................................................................67CONCLUSIONS .......................................................................................................................................................69REFERENCES ..........................................................................................................................................................70
Chapter 6: First Nations Labour Market ................................................................................ 72EXECUTIVE SUMMARY ..........................................................................................................................................72KEY FINDINGS ........................................................................................................................................................72INTRODUCTION .....................................................................................................................................................73METHODS ..............................................................................................................................................................73RESULTS .................................................................................................................................................................74DISCUSSION AND CONCLUSSIONS ........................................................................................................................82REFERENCES ..........................................................................................................................................................84
Chapter 7: First Nations Employment, Skills, and Mobility ................................................. 85EXECUTIVE SUMMARY ..........................................................................................................................................85KEY FINDINGS ........................................................................................................................................................85INTRODUCTION .....................................................................................................................................................86METHODS ..............................................................................................................................................................86RESULTS .................................................................................................................................................................87DISCUSSION ..........................................................................................................................................................92CONCLUSIONS .......................................................................................................................................................96REFERENCES .........................................................................................................................................................98
Appendix 1: Report Authors ................................................................................................. 100
Appendix 2: FNREEES List of Participating Communities .................................................. 101
The National Report of the First Nations Regional Early Childhood, Education, and Employment Survey | 3
On behalf of the First Nations Information Governance Centre (FNIGC) and its Board of Directors I am pleased to present the National Report of the First Nations Regional Early Childhood, Education and Employment Survey (FNREEES).
FNREEES (or REEES as we came to call it) has been a labour of love for all of us involved in this important data collection process, ever since we received a national mandate from the Assembly of First Nations’ (AFN) Chiefs in Assembly in June 2011 to begin developing this new survey initiative. In the five years since we have invested a significant amount of time, effort, coordination, planning, and Communications in order to bring this exciting new survey to life.
FNIGC and our Regional Partners, along with key First Nations experts and stakeholders, made tremendous efforts to design a questionnaire that was comprehensive and methodologically sound, in addition to being holistic and culturally relevant to First Nations people.
This report reflects data contributions from 20,429 First Nations children, youth, and adults from 243 First Nations communities across Canada, which represents 70% of our target sample
For a new survey of this size and scope which was confronted with a number of hurdles, including natural disasters, extreme weather, community deaths, and other surveys in the field, we can proudly say “WE DID GOOD!”
This report presents FNREEES results that offer a descriptive analysis of the key findings in the areas of early childhood education, education, employment, and labour. You will also find a description of our survey methodology and the cultural framework that was used to develop the questionnaire and served to guide the report format.
This National-level Report is just the beginning of the knowledge we will gain from this important survey, which will provide information for years to come on the strengths, resilience, and realities in First Nations communities across our lands.
I would like to take this time to recognize the hard work of FNIGC’s national staff, the Regional Partner organizations, Regional Coordinators, data analysts, administrators, Fieldworkers, First Nations leadership, community staff, and the various committees and consultants who participated and contributed to the FNREEES data collection processes.
Most importantly, we would like to thank the First Nations community members who answered our call and took the time to complete the survey, which contributes to the overall knowledge of First Nations on reserve and in northern First Nations communities.
FNIGC would also like to acknowledge and thank Indigenous and Northern Affairs Canada, Health Canada, and Employment and Social Development Canada for supporting this effort and providing funding for this survey.
Our work is not always easy, and it takes skill, knowledge, and awareness of our First Nations communities, languages, values, traditions, protocols, and priorities, as well as respect, adherence to, and compliance with the First Nations principles of OCAP® to get the job done—and done right.
NOW IS THE TIME! — OUR DATA, OUR STORIES, OUR FUTURE
Gail Mc Donald Executive Director, FNIGC
FOREWORD

Now is the Time: Our Data, Our Stories, Our Future 4 |
IntroductionAbout the First Nations Information Governance Centre
The First Nations Information Governance Centre (FNIGC) is a non-profit First Nations organization, federally incorporated under the Canada Incorporations Act in April 2010 and mandated through the Assembly of First Nations’ Special Chiefs in Assembly (Resolution # 48/2009). It is governed by a Board of Directors from 10 Regions across Canada (representing 11 provinces and two territories)
FNIGC has a mandate to oversee data collection on First Nations reserve and Northern communities, research, knowledge dissemination, and the promotion and advancement of the First Nations principles of OCAP® on behalf of all First Nations. FNIGC reports to the Assembly of the First Nations (AFN) on an annual basis. FNIGC is responsible for the implementation of its survey processes in collaboration with its regional member organizations following established protocols, policies and procedures, and a holistic cultural framework.
FNIGC’s Vision
Founded on First Nations Principles, the First Nations Information Governance Centre is a premier Indigenous model of research and data excellence for the well-being of our Peoples and Communities.
FNIGC’s Mission
The First Nations Information Governance Centre, under the guidance of its member organizations, will build capacity and provide credible and relevant information on First Nations using the highest standards of data research practices, while respecting the rights of First Nations self-determination for research and information management and in true compliance with the First Nations principles of OCAP®.
About the First Nations Regional Early Childhood, Education and Employment Survey
The First Nations Regional Early Childhood, Education and Employment Survey (FNREEES was funded by Indigenous and Northern Affairs Canada (INAC, formerly Aboriginal Affairs and Northern Development Canada), Employment and Social
Development Canada (ESDC, formerly Human Resources and Skills Development), and Health Canada.
FNIGC coordinates survey activities at the national level. In this role, FNIGC is responsible for maintaining partnerships with various federal and First Nations organizations, preparing FNREEES-related publications and research materials, and serving as data stewards for the national FNREEES database.
While FNIGC is responsible for reporting on national-level statistics, it partners with regional First Nations organizations to coordinate activities at the regional level. These 10 Regional Partners serve as data stewards for the regional FNREEES databases.
The Regional Partners for the FNREEES are:
• The Union of Nova Scotia Indians (which represents Nova Scotia, Prince Edward Island and Newfoundland)
• The Union of New Brunswick Indians
• The First Nations of Quebec and Labrador Health and Social Services Commission
• The Chiefs of Ontario
• The First Nations Health and Social Secretariat of Manitoba (established by the Assembly of Manitoba Chiefs)
• Federation of Sovereign Indigenous Nations (Saskatchewan)
• The Alberta First Nations Information Governance Centre
• The First Nations Health Authority (British Columbia)
• The Dene Nation (Northwest Territories)
• The Council of Yukon First Nations
BACKGROUND
In June 2011 FNIGC received a mandate to conduct the FNREEES from the Assembly of First Nations’ Chiefs in Assembly (per Resolution #19/2011) during their Annual General Assembly in Moncton, New Brunswick. The FNREEES
CHAPTER 1

The National Report of the First Nations Regional Early Childhood, Education, and Employment Survey | 5
was designed with the goal of providing an unprecedented perspective of life in First Nations communities, and as a means of addressing the First Nations data gap that exists in critical areas such as early childhood education and development, youth employment and education, adult employment and education, and labour-force conditions.
This survey marks the first time these data have ever been collected for populations living in First Nations on-reserve and Northern communities. As such the baseline data collected through the FNREEES provide valuable information and identify key indicators of demographic and socio-economic well-being.
These data can be used as an important source for informing the development of performance measures. They also support further research, policy, programming, planning, knowledge-based decision making, and program evaluation with the goal of improving well-being in First Nations communities.
The FNREEES is strictly concerned with the population of First Nations people living onreserve and in northern First Nations communities in Canada. Currently there are 634 First Nations communities in Canada which represent more than 50 nations or cultural groups, and 50 languages.
Survey Development
To ensure that the FNREEES was relevant to First Nations communities and the people living in them, FNIGC established a National Advisory Committee (NAC) in 2012 to offer cultural advice and guidance during the survey development process. The NAC was made-up of experts in the fields of First Nations early childhood development, education, and employment who were tasked with assisting with the selection of a survey framework and identifying domains and themes that would be important to First Nations communities. Once the initial content of the FNREEES was developed, the survey questionnaire content underwent extensive review and revisions.
Input and feedback were received from a National Advisory committee, regional advisory committees, regional coordinators, and regional data analysts.
Throughout the survey development process, several factors were taken into consideration when decisions were made regarding content:
• relevancy of objectives, themes, content;
• cultural appropriateness of content;
• validity and reliability of questionnaire items; and
• the comparability with other surveys.
The FNREEES contained a set of questions that addressed issues common to all First Nations people across Canada. In many regions additional questions were developed to address issues specific to First Nations people living in the region.
The FNREEES was made up of the child survey, the youth survey, and the adult survey.
• The child survey collected information on children between the ages of 0 and 11 years. Child surveys were completed by the primary caregiver, usually a parent.
• The youth survey was completed by those aged 12 to 17 years.
• The adult survey was completed by those aged 18 years and older.
Prior to deployment, the FNREEES underwent two ethical review processes. Initially, an external ad hoc research ethics committee was assembled to ensure an independent review of the FNREEES. Following the research ethics committee process, a full and robust ethics review was undertaken to ensure the scientific and ethical acceptability of the FNREEES.

Now is the Time: Our Data, Our Stories, Our Future 6 |
The Ethics Review committee agreed by consensus that the study was ethically sound, and recommendations were made to FNIGC’s Board of Directors to approve the ethics review and the FNREEES protocols and procedures.
Survey Content
The following table shows the indicators included in the FNREEES in each respective survey (child, youth and adult).
FNREEES Themes Child Youth Adult
After school/ Extra-curricular activities x x x
Attitudes towards school x x
Balance (physical, mental, emotional, spiritual) x x
Birth weight x
Body mass index x x x
Bottle/Breastfeeding x
Belongingness in school x x
Bullying/Personal safety x x x
Career readiness x
Changing schools x x x
Child care x
Communication/Early development/Developmental milestones x
Communication with school x
Commute to school/job x x x
Culture in school x x x
Demographics x x x
Depression/K-10 Kessler x x
Diabetes x x
Drop-out x x
Education x x x
ECD attendance (including Head Start) x x x
Employment/Unemployment status x x
Employment climate x x
Exposure to Second-hand smoke (home and/or car) x x x
Fear of success x
First Nations teachers x x x
Food and nutrition/Traditional foods x x x
Food Security x x x
Future aspirations/orientation (school and/or career) x x
General health (self-rated health) x x x
Health and chronic conditions x x x
Table 1.1: Indicators in the FNREEES survey

The National Report of the First Nations Regional Early Childhood, Education, and Employment Survey | 7
FNREEES Themes Child Youth Adult
Historical knowledge (history of First Nations, treaty rights, residential school)
x x
Household characteristics/composition (crowding index) x x x
Income and/or income sources x x
Job industry x
Job location x
Job skills x x
Language x x x
Literacy x x x
Mastery x x
Maternal behaviours/Prenatal health/Prenatal exposure x
Migration x x x
Nurturing x
Occupation x
Parental characteristics (education, employment etc.) x x x
Parental involvement (in school and/or home) x x x
Parental sources of support x
Perceived importance of education x x
Physical activity x x x
Post-secondary costs, supports and funding x x
Pregnancy and/or Fertility x x
Racism x x x
Residential school x x x
Return to school x x
School attendance/Absenteeism x x x
School climate x x x
School location x x x
School performance x x x
School support x x
Screen time/Sedentary behaviour x x x
Sleep x x
Smoking, alcohol, and drug use x x
Social supports x x
Spirituality and religion x x x
Technology at home/Access to technology x x x
Traditional culture/teachings x x x
Tutoring x x x
Usual hours of work x x
Volunteering x x
Well-being (mental, emotional, and spiritual) x x

Now is the Time: Our Data, Our Stories, Our Future 8 |
About the FNREEES National Report
The FNREEES National Report is intended to provide an overview of the national-level results from the survey, across children, youth, and adult First Nations populations.
Contributing writers for the report were selected using a proposal-based competition which was adjudicated by an Internal Review committee at FNIGC. In all five writers/groups of writers were contracted to work on the report.
The writers included First Nations and non-First Nations academics, consultants, and researchers from nongovernmental organizations, government organizations, and universities. Each writer was provided detailed writing guidelines to ensure consistency between chapters with respect to content and style.
Writers were given access to FNREEES data through FNIGC’s First Nations Data Centre or through remote data requests which were conducted by statistical analysts within FNIGC.
Writers interpreted these outputs in the process of developing the Results section and creating relevant tables and figures. Individual writers were responsible for providing and verifying sources for any information included in the chapter besides that provided by FNIGC (i.e., information on data collection, question wording, statistical output).
For each chapter an eight-step review process was established:
1. First draft submitted to FNIGC
2. First internal technical review by FNIGC’s Internal Review Committee
3. Second draft submitted to FNIGC
4. Second internal technical review and update by internal review committee
5. External cultural review by External Review Committee
6. Internal copy-edit
7. External copy-edit
8. Final draft
While the FNREEES National Report covers many themes and topics relevant to First Nations communities in Canada, it is not intended to address all of the data gathered by the FNREEES. The FNREEES National Report offers a critical—and important—first look at First Nations early childhood, education, and employment realities on reserve and Northern communities. It will provide useful insight into these timely issues and expand our knowledge of the strengths, resiliency, and conditions of First Nations people living onreserve and in northern First Nations communities in Canada.
This National Report is not intended as the last word on these issues. As a First Nations-run organization, FNIGC is committed to produce further reports and supplemental material from the rich source of data that the FNREEES represents.
METHODOLOGY
The FNREEES is a cross-sectional survey designed to measure the status of early childhood development, education, and employment among First Nations children, youth and adults living in First Nations reserves and Northern communities across Canada. To accomplish this, three age-specific versions of the survey were developed:
• Child (0–5 and 6–11 years),
• Youth (12–17 years), and
• Adult (18–54 and 55 and older).
First Nations community members received training from FNIGC’s Regional Partner organizations to work as FNREEES Fieldworkers, who administered the surveys in their community and surrounding areas. Surveys were typically conducted in respondents’ homes using Computer Assisted Personal Interviewing (CAPI), which in this case involved laptop computers equipped with Entryware, a customized survey software.
Data collection was conducted between November 2013 and May 2015, with nearly 70% (69.5%) of the target population achieved. This represents a total of 20,428 surveys (9,428 adults, 3,842 youth, and 7,158 children) across 243 First Nations communities. In total the FNREEES

The National Report of the First Nations Regional Early Childhood, Education, and Employment Survey | 9
accounts for 5.3% of individuals living in First Nations communities across Canada.
Sampling
The sampling framework was based on INAC Indian Registry counts of those living onreserve or on Crown land. The sample design incorporated a two-stage sampling strategy.
The first stage involved the selection of communities to participate in the survey. First Nations communities were stratified by region, sub-region, and community size (large, 1500 or more people; medium, 300 to 1,499 people; and small, fewer than 300 people). Large communities were automatically included, while medium and small communities were randomly selected with equal probability within their respective strata.
The second stage pertained to the selection of individuals within each community in the national sample. Community members were identified using band membership lists. Data were gathered to represent 10 categories of the community population (gender by five age groups). The sampling rate within each community was determined as a function of the overall sub-region probability (within regions) and the probability of selection of the community (within a sub-region).
Weighting
Individual responses were weighted, using INAC Indian Registry counts, to reflect, with greater accuracy, the representation of the population by the sample.
Estimated percentages of individuals are reported in various categories along with the 95% confidence intervals (CIs) around those estimates. These CIs are a measure of the precision of each of these estimates and are produced using the survey sampling weights, information about the sampling design for the survey, and the Statistical Package for the Social Sciences (SPSS) Complex Samples statements. If the CIs around any two estimates in a chart or table are overlapping, this should be interpreted to mean that the two estimates are not statistically different from one another.
Small numbers in some categories prevent the release of estimates due to low cell counts or high sampling
variability. Estimates produced on the basis of fewer than five cases, or for which the coefficient of variation is greater than 33.3%, are not reported. Estimates for which the coefficient of variation is high (between 16.6% and 33.3%) are accompanied in the tables and figures by a warning that they should be treated with some caution.
Not all of the survey respondents answered all questions, and the degree of this “item non-response” varied from question to question. In this report those who reported “don’t know” or who refused to answer are excluded from the analyses, from the numerators and the denominators of percentages calculated. This implicitly assumes that item non-response occurs at random, and that those who did not respond to a particular question are not different, in terms of their characteristics on that item, from those who did respond. The characteristics of nonrespondents have not been investigated for this report.
HOLISTIC LIFELONG LEARNING MODELS
Based on the NAC’s recommendations the First Nations Holistic Lifelong Learning Model was used to guide the survey development process. Published as part of The Canadian Council on Learning report, Redefining How Success is Measured in First Nations, Inuit and Métis Learning (CCL, 2007) the First Nations Holistic Lifelong Learning Model represents the link between First Nations lifelong learning and community well-being.
The framework is used to measure educational success in lifelong learning among First Nations from a holistic perspective. This is important because in typical measurement approaches the focus is on discrepancies between First Nations and non-First Nations learners, and often the important aspects of learning that are integral to a First Nations perspective on learning are overlooked. As a result, conventional measurement approaches rarely reflect the specific needs and aspirations of First Nations people.
As part of their 2007 report, CCL identified several key attributes of First Nations learning. A First Nations perspective on learning is:
• Holistic: it engages and develops all aspects of the individual (emotional, physical, spiritual, and

Now is the Time: Our Data, Our Stories, Our Future 10 |
intellectual) and the community, and it stresses the interconnectedness of all life under the Creator.
• Lifelong: it begins before birth and continues through old age and involves the intergenerational transfer of knowledge.
• Experiential: it is connected to lived experience and reinforced by traditional ceremonies, meditation, community norms, oral history, storytelling, observation, and imitation.
• Rooted in languages and cultures: It is bound to language, which conveys a community’s unique values and world view while ensuring cultural continuity.
• Spiritually oriented: It possesses a spiritual element, which is fundamental to the learner’s path to knowledge. This is manifested in spiritual beliefs, practices, and experiences, such as ceremonies, vision quests, and dreams.
• Communal activity: it is a communal process in which parents, family, Elders, and community have a role and responsibility.
• Integrates First Nations and Western knowledge: it is an adaptive process that draws from the best of traditional and contemporary knowledge.
Informal Learning
COLOUR KEY
Formal Learning
elemen
tary/se
condary education
early l
earning
post-seco
ndary educationworkplace learning
adult le
arninginter
generational lear
ning
learning
rings of the individual
indige
nous
knowl
edge
western
knowledge
spiritual mental phys
ical
em
otional
self
clan
community
nation
othernations
familyancestors
naturalworld
languages
traditions& ceremonies
spiritual & cultural
socialeconomic
political
parents
teachers
mentors
counsellors elders
NURTURING
GUIDE
S
collective well-being
sources and domains of
knowledg
e
First Nations Holistic Lifelong Learning Model Living DRAFTLast Updated: June 6, 2007

The National Report of the First Nations Regional Early Childhood, Education, and Employment Survey | 11
What are the Holistic Lifelong Learning Models?
As originally designed, the Holistic Lifelong Learning Models are products of an ongoing collaboration between CCL and First Nations, Inuit, and Métis learning professionals. These three Holistic Lifelong Learning Models, released in 2007, use stylized graphics to convey what is meant by First Nations, Inuit, and Métis learning.
The models reflect the cyclical, regenerative nature of holistic lifelong learning and its relationship to community well-being. The learning models are living documents intended to be revised and adapted by First Nations, Inuit, and Métis communities and their partners across Canada.
The First Nations Holistic Lifelong Learning Model reflects First Nations’ unique perspective on lifelong learning as a holistic, lifelong developmental process that contributes to individual and community well-being. This process is both organic and self-regenerative in nature, and it integrates various types of relationships and knowledge within the community. The First Nations Holistic Lifelong Learning Model uses an illustration of a living tree to depict learning as a cyclical process that occurs throughout an individual’s lifespan.
This learning tree identifies the conditions that foster cultural continuity and provide the foundation for individual learning and collective well-being (CCL, 2007). The model contains three main components that describe the First Nations perspective on holistic, lifelong learning:
• Sources and domains of knowledge (the roots): this includes the sources and domains that an individual learns from and about: the world of people (self, family, ancestors, clan, community), languages, traditions and ceremonies, spirituality, and the natural world. The coexistence of both Western and Indigenous knowledge and learning is represented.
• The lifelong learning journey (the rings): this includes a wide range of formal and informal learning opportunities that occur in a number of places (home, community, school, land, workplace) and throughout all stages of life (from birth to death). Surrounding the rings are the four dimensions of personal development—spiritual, emotional, physical, and mental—through which each learning opportunity is experienced.
• Community well-being (the leaves): this includes the social, economic, spiritual, and political conditions that influence the learning process, and vice versa. This component depicts the individual and collective conditions that reflect an Indigenous perspective on community well-being.
Furthermore, the three learning models provided the basis for the Holistic Lifelong Learning Measurement Framework released in CCL’s 2009 State of Aboriginal Learning Report, which was recognized as the first comprehensive framework for measuring First Nations, Inuit, and Métis learning in Canada.
In this framework, each of the three components of the model is populated with a set of indicators that, when taken together, illustrate the full range of learning opportunities for First Nations people.
Informal Learning
COLOUR KEY
Formal Learning
elemen
tary/se
condary education
early l
earning
post-seco
ndary educationworkplace learning
adult le
arninginter
generational lear
ning
learning
rings of the individual
indigenou
s
knowl
edge
western
knowledge
spiritual mental physica
l em
otional
self
clan
community
nation
othernations
familyancestors
naturalworld
languages
traditions& ceremonies
spiritual & cultural
socialeconomic
political
parents
teachers
mentors
counsellors elders
NURTURING
GUIDE
S
collective well-being
sources and domains of
knowledg
e
First Nations Holistic Lifelong Learning Model Living DRAFTLast Updated: June 6, 2007

Now is the Time: Our Data, Our Stories, Our Future 12 |
Why was the First Nations Holistic Lifelong Learning Model developed?
In January 2007, CCL released its report on the state of learning in Canada. In the chapter on Aboriginal learning, the report concluded that “current approaches to measuring First Nations, Inuit and Métis learning in Canada do not reflect Aboriginal people’s articulation of holistic, lifelong learning” (CCL, 2007, p. 8).
Specifically, CCL identified that current research and approaches to measuring First Nations learning often face the following challenges:
• they are orientated towards measuring learning deficits and do not account for social, economic, and political factors.
• they do not monitor progress across the full spectrum of lifelong learning.
• they do not reflect the holistic nature of First Nations learning.
• they do not reflect the importance of experiential learning.
This was the first call to action for CCL to redefine how success is measured in First Nations learning. The First Nations Holistic Lifelong Learning Model reflects the opportunity to develop a broadly accepted framework for measuring how First Nations, Inuit, and Métis learners are doing across the full spectrum of lifelong learning. The learning model represents a new approach and a new way of thinking about measuring success and quality education for First Nations people.
First Nations people, educators, and governments working with First Nations communities to improve learning outcomes often struggle to define what learning success means and to identify what indicators should be used to measure it. The First Nations Holistic Lifelong Learning Model and the subsequent Holistic Lifelong Learning Measurement Framework have provided an effective solution to these challenges.
Prior to the release of the First Nations Holistic Lifelong Learning Model, common indicators widely used by
governments and researchers often reported on simply the years of schooling and performance on standardized tests, while overlooking the aspects of learning that are integral to a First Nations perspective.
As a result, these indicators did not fully reflect the needs and aspirations of First Nations learners and therefore ran the risk of becoming irrelevant for First Nations communities and ultimately of little practical use in informing effective policy. Such concerns were originally recognized in 1996’s Report of the Royal Commission on Aboriginal Peoples which stated:
The right of Aboriginal people to articulate and apply their own standards of excellence in education is at stake in this debate. Tension is likely to intensify as provinces and territories move to implement Canada-wide testing of students. The goals of education embodied in such testing are defined by non-Aboriginal authorities. Some Aboriginal parents and communities may share these goals, but it should not be assumed that they will place them above their own goals for the education of their children. Self-determination in education should give Aboriginal people clear authority to create curriculum and set the standards to accomplish their education goals. (Royal Commission on Aboriginal Peoples, 1996, p. 430)
How was the First Nations Holistic Lifelong Learning Model created?
In 2007, CCL launched the Redefining How Success is Measured in First Nations, Inuit and Métis Learning initiative. The primary goal of this initiative was to develop a set of holistic lifelong learning models that can help map the relationships between learning purposes, processes, and outcomes across the lifespan for First Nations, Inuit, and Métis.
To facilitate the development of the Holistic Lifelong Learning Models, CCL organized a series of workshops that brought together Indigenous learning professionals,
The National Report of the First Nations Regional Early Childhood, Education, and Employment Survey | 13
community practitioners, researchers, and governments to begin identifying the many aspects of lifelong learning that contribute to success for First Nations, Inuit, and Métis.
CCL recognized that the success of this national initiative required the leadership and vision of First Nations, Inuit, and Métis learning experts, and the support of the five national Aboriginal organizations in Canada. In the end, the series of national workshops involved the collaboration of more than 50 organizations and 100 individuals.
The workshops were structured in three separate sessions for First Nations, Inuit, and Métis to respect the distinct perspectives on lifelong learning that each group has. Each group was presented with a similar holistic learning model with the intention that participants would critique, modify, or even discard the proposed models as necessary. Specifically, the initial holistic learning model for First Nations was discussed, debated, revised, and refined over the course of the workshops to create the First Nations Holistic Lifelong Learning Model we know today.
How can the Holistic Lifelong Learning Model be used to measure success for First Nations?
Without the comprehensive understanding of the First Nations perspective on learning that the First Nations Holistic Lifelong Learning Model offers, the diverse needs and aspirations of First Nations people across Canada would be misinterpreted and misunderstood.
In fact, the implementation of the Holistic Lifelong Learning Model as a framework for measuring lifelong learning is already having a far-reaching impact on how we assess the progress of First Nations learners. All three learning models have been used as national and regional measurement frameworks, as demonstrated in CCL’s 2009 State of Aboriginal Learning Report, and now most recently in the FNREEES.
As identified in the FNREEES, a holistic approach to measurement draws attention to the many positive dimensions of First Nations learning which are often overlooked and from which both First Nations and all Canadians can learn. This allows for the inclusion of learning indicators that provide new information and a
more complete portrait of the state of First Nations learning in Canada.
Innovations like these provide the opportunity for educators and governments to shift their focus from reacting to the deficits of First Nations learners, to building on their strengths and celebrating them. Such approaches allow us to connect learning across the life cycle, recognize learning in informal settings, and provide a common framework for First Nations, Inuit, and Métis communities, governments, and researchers to monitor and report upon the learning success of Aboriginal people.
Beyond simply a tool to monitor progress in learning for First Nations, the Holistic Lifelong Learning Model is being used by educators and education systems in a variety of different ways. For example, governments, school systems, and First Nations organizations are using the learning model to support policy development, community planning, curriculum development, teacher professional development, and the creation of formative assessments in the early years.
As concluded by CCL “by broadening the scope of inquiry, the framework opens the way for innovative solutions that address the expressed needs and aspirations of Aboriginal people” (CCL, 2009, p. 60).
REFERENCES
Canadian Council on Learning. (2007). Redefining how success is measured in First Nations, Inuit and Métis learning, report on learning in Canada. Ottawa: 2007.
Canadian Council on Learning. (2009). The state of Aboriginal learning in Canada: A holistic approach to measuring success. Ottawa: 2009.
Royal Commission on Aboriginal Peoples. (1996). Report of the Royal Commission on Aboriginal Peoples. Volume 3: Gathering strength. Ottawa: 1996.

Now is the Time: Our Data, Our Stories, Our Future 14 |
First Nations Early Childhood Education
EXECUTIVE SUMMARY
The health and well-being of Indigenous peoples is rooted in a unique and special relationship between the people, the land, and the cultures and languages that connect us to the land. For Indigenous children in particular, their understanding of who they are and their connections with Indigenous ways of knowing and being in the world are integrally interconnected with their early life experiences.
This chapter presents the FNREEES findings on early childhood education. In an effort to address a long-standing data gap on First Nations children, FNIGC surveyed 7,158 primary caregivers of First Nations children on a range of topics directly and indirectly impacting the early experiences of First Nations children. When compared with previous data, results indicate modest improvements in some measures of childhood well-being and also underscoring some persistent inequities—particularly in terms of economic well-being.
Of particular note is the significant number of First Nations children that are cared for primarily in the home by biological parents, making the family home an important—and often overlooked—source of support and intervention in policies and programs aimed to improve both early learning experiences and long-term life chances for First Nations children.
KEY FINDINGS
• Most First Nations adults who responded to the survey (90.4%) reported being the child’s biological parents; 75.0% were the child’s mother and 15.4% were the child’s father. Grandparents and great-grandparents responded to the survey on behalf of the child 5.6% of the time.
• Less than 10% of primary caregivers who were biological parents (9.2% of mothers; 8.0% of fathers) reported having attended a residential school as children.
• Nearly 60 percent (58.9%) of First Nations children had at least one grandparent or great-grandparent who had attended residential school.
• More than one-third (39.2%) of First Nations children were reported to live in households with incomes of less than $20,000, a slightly lower figure than reported in the First Nations Regional Health Survey (RHS) 2008/10.
• Female and male primary caregivers have comparable levels of education with about half having less than a high-school education.
• Nearly half (46.8%) of First Nations children lived in crowded households.
• More than half (52.0%) of First Nations children have moved at least once in their lifetimes.
• Fewer than one quarter (21.3%) of First Nations children receive regular child care. This is a decrease from the 28.8% of First Nations children in regular child care as reported in the RHS 2008/10.
• Most children receiving regular child care were cared for in their own home by a relative (42.9%). Of children receiving care, 40.9% attended a daycare centre, 17.2% attended a before- or after-school program, and 13.6% received care in someone else’s home with a relative.
• Of those who did not use childcare, 84.3% of primary caregivers reported that there was no need for regular care, when asked. Other reasons given included lack of age-specific services, and that there was no child care available or accessible close to home.
CHAPTER 2

The National Report of the First Nations Regional Early Childhood, Education, and Employment Survey | 15
• Learning a First Nations language was highly valued by primary caregivers, with the majority (88.0%) reporting that their child learning one was either very important (61.9%) or somewhat important (26.5%).
• Traditional teachings were similarly valued, with 86.1% of primary caregivers reporting it was either very important (59.7%) or somewhat important (26.4%).
• While 32.4% of female caregivers and 34.9% of male primary caregivers reported a First Nations language as their mother tongue, less than 1 in 5 (18.1%) reported a First Nations language as the first language their child learned at home.
• 81.1% of First Nations children have knowledge of a First Nations language, even if only a few words.
• In terms of developmental milestones, 73.3% of primary caregivers with children (under the age of 6) attending a First Nations–specific early childhood program (like an Aboriginal Head Start On Reserve Program) reported that their children understood them when they spoke all of the time, compared to 57.5% of children who did not attend a First Nations–specific early childhood program. This difference was even more apparent when primary caregivers were asked about how well their children were understood by others.
• 89.1% of primary caregivers reported that English was the primary language used at school or in child care settings.
• In terms of how well the child did in their last year in school, 25.5% of primary caregivers reported that their child did above average, 67.8% said average, and 6.7% reported that their child did below average.
• Very few First Nations children (1.8%) were reported to have skipped a grade, while 8.4% had repeated a grade.
INTRODUCTION
The health and well-being of Indigenous peoples is rooted in a unique relationship between the people, the land, and the cultures and languages that connect us to the land. For Indigenous children in particular, their understanding of who they are and their connections with Indigenous ways of knowing and being in the world is integrally interconnected with their early life experiences. Developing an understanding of one’s self, individually and as part of a collective, is a learning process that begins at birth, with some even saying before birth.
During these critical early years between birth and age 11, children acquire the knowledge, skills, and understandings that will form the foundations of their identity and set the stage for their lifelong learning journey. If we accept that the conditions in which a child lives have a significant impact on their development, it’s crucial for us to understand the conditions in which First Nations children live and how this impacts their early development. However, our understanding of the early experiences of First Nations children has historically been limited by a deficit of research, particularly research undertaken by First Nations for First Nations.
This chapter provides the results of the FNREEES with respect to First Nations early childhood education, contextualizing it in reference to existing knowledge about the health and well-being of First Nations children, families, and communities in Canada.
A Focus on Language, Culture, Learning, and Health
Given the importance of Indigenous language and culture to the health and well-being of Indigenous peoples (Reading, 2015; Marmot, 2005; Krieger, 2008), the questions in the FNREEES addressed a spectrum of topics aimed to shed light on the holistic interconnections between language, culture, learning, health, and well-being.
Given that disparities in the social, socio-economic, and environmental determinants of health—including higher levels of substandard housing, poverty, unemployment,

Now is the Time: Our Data, Our Stories, Our Future 16 |
and lower levels of education and access to quality health care—are at the root of many of the health inequities experienced by First Nations, Inuit, and Métis peoples (Smylie & Adomako, 2010; Reading & Wien, 2009; Butler-Jones, 2008), the FNREEES child survey results provide a snapshot of the early experiences of First Nations children as they navigate the historic and ongoing impacts of European colonization.
These intergenerational impacts include:
• the legacy of residential schools,
• loss of traditional lands and self-determination,
• social welfare policies that saw the forced removal of countless First Nations, Inuit, and Métis children from their families, and
• other governance policies that have contributed to the trauma experienced by many Indigenous peoples.
Despite the devastating legacies of colonization, we also know that Indigenous people are resilient and that language, culture, and learning are crucial elements of this resilience. For Indigenous peoples across Canada, learning is understood as a lifelong social process characterized by specific Indigenous epistemologies and ontologies, and distinct values, traditions, and protocols.
The First Nations Holistic Lifelong Learning Model identifies the aspects of lifelong learning that contribute to success for First Nations. In this model of the ideal approach to learning for First Nations, learning is seen as holistic, which means that it engages and develops all aspects of the individual and community, while highlighting the interconnectedness of all life under the Creator.
Learning is also seen as being a lifelong process, one that begins before birth continues throughout the life cycle, and one that involves an intergenerational transfer of knowledge. It is also seen as experiential, rooted in First Nations languages and cultures, spiritually oriented, and communal, and it integrates First Nations and Western knowledge (Canadian Council on Learning, 2009, p. 10).
Language, culture, and learning are highly dependent on relationships within the collective: between children and their parents or caregivers, and within and outside the family. Indeed, relationships with family and the community are the vehicle through which children learn social values, a sense of identity, and cultural continuity.
Children play a unique role as recipients of these learning relationships and as such hold a special place in Indigenous communities and nations. Family, household structure, and early experiences in those contexts are integral to children’s educational experiences, acquisition of language and cultural knowledge, and holistic well-being (First Nations Information Governance Centre [FNIGC], 2012).
Parents and primary caregivers are considered to be the first teachers of children. Although schooling in a formal education system is regarded as an important site of learning for children, it also represents a site where Western ways of knowing are often privileged over those of Indigenous peoples. Despite this, First Nations peoples value education for its potential to improve individual and community socio-economic status.
Formal education may also be linked to health status, and this is particularly evident in research linking parental education to the future success of their children. In terms of educational success, children of parents with higher levels of education are more likely to attend university, thus increasing their chances of accessing higher-paying jobs and enjoying both the mental and the physical health benefits associated with higher income (FNIGC, 2012).
METHODS
Questions in the FNREEES focused on the early experiences of children living in First Nations communities across Canada. Many of the questions were rooted in themes outlined in the First Nations Holistic Lifelong Learning Model, including questions focused on whether or not children are happy at school or enjoy being there, or if they experience racism or physical violence at school. Some questions explored children’s care and learning experiences while others sought to contextualize these experiences by shedding light on the environments in which First Nations children live and learn.

The National Report of the First Nations Regional Early Childhood, Education, and Employment Survey | 17
The respondents in the child survey were primary caregivers of First Nations children, which for the purpose of the FNREEES included biological parents, grandparents, other relatives, or individuals who were primarily responsible for the care of a child. Respondents are referred to as primary caregivers throughout this section of the report.
For this chapter, select responses derived from the survey are situated within the following overarching questions that are intended to highlight the context in which children live, along with their lived experiences of learning.
Who are the children?
The children represented in this survey were aged 0 to11 years. Primary caregivers of an equal number of children aged 0 to 5 and 6 to 11 were sampled for both male and female children.
Who do the children live with?
Primary caregivers were asked to identify their relationship to the child and if more than one primary caregiver cared for a child. Questions about education, employment, household incomes and expenses were also asked of primary caregivers. In addition, primary caregivers were asked whether or not they had attended a residential school, if they had access to parental supports, and how they nurtured children.
Where do the children live?
To determine household occupancy and crowding, primary caregivers were asked how many adults and children lived in the house, along with the number of rooms in the house. Crowding was defined as more than one person per habitable room excluding bathrooms, halls, closets and rooms used for business purposes (Statistics Canada, 2009). Children’s mobility was determined by asking about their frequency of moving from one house to another.
Where are children being cared for?
Primary caregivers were asked where children were cared for and for how many hours per week. If the child was of school age, primary caregivers were also asked where children could be found after school and whether the child was home alone.
For children attending childcare, primary caregivers were asked where their childcare was located. If childcare was located outside the community, primary caregivers were asked why they chose those arrangements. Other questions focused on attributes of childcare settings, including queries related to First Nations caregivers and satisfaction with the childcare settings. Specific attention was given to early childhood programs designed for First Nations children, such as the Aboriginal Head Start On Reserve program or other similar programs.
What were children’s learning experiences?
Questions about children’s early learning experiences were divided into several themes.
Language and Culture
Questions in this section focused on a child’s knowledge of a First Nations language, including where they were exposed to the language and who helped them learn and improve upon their language abilities. Primary caregivers were asked how important it was for their child to speak and understand a First Nations language, how satisfied they were with their children’s opportunities to learn a First Nations language, and if there were any barriers to children learning or improving their knowledge of a First Nations language.
Primary caregivers were also asked about traditional teachings, the importance of children learning their cultural teachings, who helped children to learn these teachings, and children’s participation in cultural activities.
Communication
Primary caregivers whose children attended early childhood programs, including Aboriginal Head Start On Reserve programs, were asked about a child’s ability to communicate, understand, and be understood.
Formal Schooling
Indicators related to a child’s school experiences include such measures as school attendance and success rates. Questions in this section focused on school location, language, and climate. School climate (or elements beyond the academic aspects of the school) was ascertained from primary caregivers’ most knowledgeable perception of the school environment.

Now is the Time: Our Data, Our Stories, Our Future 18 |
In some instances, and where relevant, results from other national surveys and research works are included.
RESULTS
Who are the children?
The children in this survey were aged 0 to11 years. Primary caregivers for an equal percentage of males and females aged 0 to 5 and 6 to 11 were sampled. Some variation occurred in age groups, with the smallest percentage being children under the age of 1 and the highest percentages being for children aged 4 to 6, 10, and 11.
Who do the children live with?
The majority of First Nations children were shown to be cared for by their biological parents, grandparents or great-grandparents. Of the primary caregivers, 90.4% were the biological parents of the children, with 75.0% (95% CI [71.7, 78.0]) of those being mothers and 15.4% (95% CI [12.7, 18.6]) being fathers. Grandparents and great-grandparents made up 5.6% (95% CI [4.4, 7.1]) of primary caregivers. Of the children who had not been in the care of their parents or guardians since birth, 18.6% (95% CI [14.8, 23.0]) were in foster care.
Parents and primary caregivers were asked about their experiences as a child being separated from their parents by child welfare agencies, church, or government officials. A significant majority of primary caregivers (89.6%, 95% CI [87.7, 91.1]) reported that they had not been separated from their parents. Only 6.8% (95% CI [5.6, 8.2]) of mothers and female caregivers and 5.2% (95% CI [3.9, 6.9]) of fathers and male caregivers reported having been removed from the home of their biological parents.
Residential Schools
Many reports and studies, including the final report of the Truth and Reconciliation Commission of Canada, have documented the significant and lifelong impacts on health and well-being experienced by survivors of the Indian Residential School system (Truth and Reconciliation Commission of Canada, 2015).
To gauge the intergenerational impacts of residential schooling in the FNREEES, primary caregivers were asked if any of a child’s relatives had attended residential schools. Their responses showed that 9.2% (95% CI [7.1, 11.8]) of mothers and female caregivers and 8.0% (95% CI [6.6, 9.6]) of fathers and male caregivers had been students at a residential school. A significantly higher proportion (58.9%, 95% CI [53.7, 63.9]) of children had at least one grandparent who was a residential school survivor. More than one-third of primary caregivers (33.9%, 95% CI [30.1, 37.9]) reported that no family members had been students at residential schools.
Parenting Support
To ascertain levels of parenting support, primary caregivers were asked if they had someone they could rely on for support when they needed it. While nearly half of respondents (47.3%, 95% CI [43.5, 51.1]) reported that they always had people they could turn to for help, more than a third (35.7%,95% CI [31.9, 39.6]) reported that they had access to parenting support “sometimes”. Another 12.6% (95% CI [9.9, 15.9]) reported that they rarely had access to support, and 4.4% (95% CI [3.4, 5.8]) reported that they never had parenting support.
When questioned further, primary caregivers of First Nations children identified specific individuals and other sources of parenting support. (Note: this was a “mark-all-that-apply” type of question.) The most frequently reported sources of parenting support identified included family and friends (93.7%, 95% CI [92.3, 94.7]), nurses and health-care providers (32.8%, 95% CI [30.1, 35.6]), the internet (30.6%, 95% CI [27.6, 33.8]), community members (26.3%, 95% CI [23.3, 29.5]), and Elders (26.2%, 95% CI [23.3, 29.4) (See Table 2.1).

The National Report of the First Nations Regional Early Childhood, Education, and Employment Survey | 19
Table 2.1. Sources of support for parents raising their child or children
Source of support % 95% CI
Family and friends 93.7 [92.3, 94.8]
Nurse or health care provider 32.8 [30.1, 35.7]
Internet 30.6 [27.6, 33.8]
Community members 26.3 [23.3, 29.5]
Elders 26.2 [23.3, 29.4]
Books on child development 20.3 [18.1, 22.8]
Parenting program or courses 20.0 [18.1, 22.2]
Advice from early childhood educators or teachers
16.6 [14.9, 18.4]
Informational materials or pamphlets
15.8 [14.0, 17.8]
Television or DVDs 10.3 [8.8, 12.1]
Parent resource centres 8.5 [6.5, 11.1]
Knowledge holders 8.2 [6.7, 10.0]
Note: Respondents could choose more than one response
Child Nurturing
Primary caregivers were asked how often they praised their children with words or showed physical affection to their children. The majority (80.7%, 95% CI [77.3, 83.6]) reported that they praised their children daily, and an even higher percentage (87.1%, 95% CI [84.8, 89.1]) reported that they displayed physical affection towards their child daily.
Employment
Of the mothers and female primary caregivers, nearly one-third (31.1%, 95% CI [28.2, 34.0]) reported being employed full-time. About 10% (9.9%, 95% CI [8.6, 11.4]) reported working part-time, and 59.0% (95% CI [55.3, 62.5]) were not working for pay. Of those mothers and female primary caregivers not working, 73.6% (95% CI [69.9, 77.1]) were stay-at-home parents, while 9.7% (95% CI [7.4, 12.7]) were looking for work, 9.2% (95% CI [7.2, 11.6]) were students, and 2.0% (95% CI [1.4, 2.7]) were on maternity leave.
Similarly, fewer than half of the fathers and male primary caregivers (44.3%, 95% CI [41.2, 47.5]) were working full-time, 16.6% (95% CI [14.5, 18.9]) were working part-time, and 39.1% (95% CI [36.0, 42.3]) were not working for pay. Most of the fathers and male primary caregivers who were not working were stay-at-home parents (39.0%, 95% CI [34.4, 43.8]), while 30.1% (95% CI [24.2, 36.9]) reported that they were looking for work, and 12.2% (95% CI [9.7, 15.3]) reported that they work seasonally.
These figures mirror results from the RHS 2008/10, which reported that fewer than half of mothers and female guardians (42.9%) and fathers and male guardians (45.7%) were currently working for pay (FNIGC, 2012).
Income
A family’s ability to meet basic needs such as shelter and utilities is directly related to household income. The RHS 2008/10 reported that approximately 43% of First Nations children lived in a household with an annual household income of less than $20,000 (FNIGC, 2012). According to the FNREEES slightly fewer children (39.2%, 95% CI [34.8, 43.8]) were reported to live in households with incomes of less than $20,000 between the reporting period of 2013 to 2015 (See Table 2.2).
Despite the high percentage of low-income families, most primary caregivers of First Nations children (84.9%, 95% CI [82.9, 86.7]) reported that they had never had to struggle to meet their shelter needs or utility needs (70.5%, 95% CI [67.3, 73.5]) in the 12 months prior to the survey.
With respect to meeting shelter needs, a smaller percentage of respondents (11.7%, 95% CI [10.1, 13.6]) reported that they struggled a few times a year, while only 2.4% (95% CI [1.9, 3.0]) struggled monthly. Similarly, in terms of meeting utility needs, 24.9% (95% CI [22.2, 27.9]) of respondents struggled a few times a year, and 2.8% (95% CI [2.3, 3.5]) struggled monthly to meet basic needs.

Now is the Time: Our Data, Our Stories, Our Future 20 |
Table 2.2. Household Income among First Nations families
Education
It’s important to note that educational outcomes reported here do not reflect lifetime achievement in formal schooling. This due in part to the relative young age of most First Nations parents, and the fact that First Nations people often attend formal education programs later in life, and not right out of high school (Statistics Canada, 2006).
Overall, female and male primary caregivers have comparable levels of education. Nearly half of female caregivers (47.5%, 95% CI [43.1, 51.9]) and slightly more than half of male caregivers (54.6%, 95% CI [51.1, 58.0]) have less than a high-school education (See Table 2.3).
About an equal percentage of female (24.7%, 95% CI [21.7, 28.1]) and male (22.4%, 95% CI [19.8, 25.3]) primary caregivers have a high school diploma or high school equivalency certificate, and 27.5% (95% CI [25.1, 30.1]) of female and 22.9% (95% CI [19.8, 26.3]) of male primary caregivers have at least some post-secondary education.
Since lower educational achievement by primary caregivers has been shown to be associated with lower household income in the RHS 2008/10, these figures indicate that supporting primary caregivers in educational pursuits is an area still requiring support (FNIGC, 2012).
Table 2.3. Level of education among First Nations parents’/guardians’
Note. F Suppressed due to low cell count or very high sampling variability.
Where do children live?
Crowding
Nearly two-thirds of First Nations children (65.2%, 95% CI [62.1, 68.1]) lived with their biological mothers; 49.6% (95% CI [46.7, 52.5]) lived with their biological fathers, and 75.4% (95% CI [72.7, 77.9]) lived with at least one sibling in addition to their primary caregiver.
Including the child, 24.0% (95% CI [21.9, 26.2]) of First Nations children lived in households with a total of two children, 21.9% (95% CI [20.2, 23.8]) lived in households with a total of three children, 16.6% (95% CI [14.9, 18.5]) with four, 11.2% (95% CI [9.2, 13.7]) with five, and 5.3% (95% CI [4.2, 6.7]) lived in households with a total of six children. Only 13.1% (95% CI [11.5, 14.9]) of children lived in a household without other children.
More than half of the families (53.2%, 95% CI [48.9, 57.4]) did not live in a crowded household, while slightly less than half (46.8%, 95% CI [42.6, 51.1]) lived in a crowded household. Crowding is defined as having more than one person per room in a house. The crowding index is calculated by dividing the total number of people living in the household by the total number of rooms in the house.
Household income % 95% CI
Less than $20,000 39.2 [34.8, 43.8]
$20,000–$29,999 17.5 [15.2, 20.1]
$30,000–$39,999 17.8 [13.6, 22.9]
$40,000–$49,999 8.3 [6.6, 10.4]
$50,000+ 17.2 [14.9, 19.8]
Total 100 [ - ]
Level of educationFathers/male
guardians% [95% CI]
Mothers/female guardians
% [95% CI]
Less than high school 54.6 [51.1, 58.0] 47.5 [43.1, 51.9]
High school or high school equivalency
22.4 [19.8, 25.3] 24.7 [21.7, 28.1]
At least some post-secondary education
22.9 [19.8, 26.3] 27.5 [25.1, 30.1]
Others F F
Total 100 [ - ] 100 [ - ]

The National Report of the First Nations Regional Early Childhood, Education, and Employment Survey | 21
Mobility
Primary caregivers were asked how often children had moved in their lives. Fewer than half (48.0%, 95% CI [44.9, 51.2]) had never moved, while more than half had moved at least once: 18.6% (95% CI [16.5, 20.8]) had moved once, 12.8% (95% CI [11.3, 14.5]) had moved twice, 8.7% (95% CI [7.4, 10.2]) had moved three times, and 2.6% (95% CI [2.0, 3.2]) had moved five times.
Where are children being cared for?
For the purposes of the FNREEES, child care is defined as children receiving regular care from someone other than their parent or primary caregiver. Results indicate that slightly more than 1 in 5 (21.3%, 95% CI [18.9, 23.9]) of children aged 0 to 11 years received regular childcare. These figures are slightly lower than those reported in the RHS 2008/10, which indicated that 28.8% of children living in First Nations communities receive childcare (FNIGC, 2012).
For those children who attended regular childcare, results indicate that First Nations children spent on average 21.9 hours per week in childcare. Children attending after-school care spent an average of 7.1 hours per week in care.
The majority (84.0%, 95% CI [81.4, 86.3]) of children aged 0 to 5 who did not receive regular child care, spent time in their own home under direct supervision. When primary caregivers of First Nations children not attending regular childcare were asked why their child was not receiving regular childcare, the majority (84.3% (95% CI [82.0, 86.4%) identified that it was not needed, while 6.3% (95% CI [5.2, 7.7]) said that regular childcare was not available for children of their child’s age, 2.1% (95% CI [1.6, 2.8]) said no childcare was available or accessible close to home, and 1.2% said their child was on a waiting list (95% CI [0.9, 1.6]).
For the 21.3% of children aged 0 to 11 who were in regular childcare, the majority of those settings (91.3%, 95% CI [89.2, 93.1]) were located within a First Nations community.
When asked where children were cared for, 42.9% (95% CI [37.2, 48.7) of primary caregivers indicated that children were cared for in their own home with a relative, 13.6% (95% CI [11.2, 16.5]) received care in someone else’s
home with a relative, 40.9% (95% CI [35.1, 47.0]) in a daycare centre, and 17.2% (95% CI [14.2, 20.7]) attended a before- or after-school program (See Table 2.4).
Table 2.4. Childcare arrangements used by First Nations parents/guardians
Child care arrangements % 95% CI
Care in own home (relative) 42.9 [37.2, 48.7]
Daycare centre 40.9 [35.1, 47.0]
Before- and/or after-school program
17.2 [14.2, 20.7]
Care in someone else’s home (relative)
13.6 [11.2, 16.5]
Other child care arrangements 2.3E [1.3, 3.8]
Care in own home (nonrelative) 1.8E [1.2, 2.7]
Care in someone else’s home (nonrelative)
1.8E [1.1, 2.8]
Note. Respondents could choose more than one response. E High sampling variability, interpret with caution.
For children who received child care outside a First Nations community, over 1 in 5 (23.2%, 95% CI [19.6, 27.1]) primary caregivers reported the main reason was that no child care was available within their community. Other reasons included: better-quality care found outside the community (22.7%, 95% CI [18.5, 27.6]), care outside the community was easier to get to (34.6%, 95% CI [29.7, 39.8]), no child care was available that fit their schedule (6.6%E, 95% CI [4.1, 10.4]), or lack of care for the child’s age group within the community (3.8%, 95% CI [2.9, 5.0]). A small percentage (2.6%, 95% CI [2.0, 3.3]) of primary caregivers reported being on a waiting list for childcare inside the community.
When asked whether or not primary caregivers were satisfied with their childcare arrangements overall, nearly all (98.1%) reported being satisfied (58.8% were very satisfied, 95% CI [51.1, 65.4], and 39.3% were satisfied, 95% CI [32.9, 46.2]).

Now is the Time: Our Data, Our Stories, Our Future 22 |
Primary caregivers were also asked to identify specific attributes of their childcare arrangements. The majority of primary caregivers reported that their childcare arrangements included plenty of child-friendly conversation (87.6%, 95% CI [84.9, 89.9]); a neat, clean, and orderly physical setting (84.6%, 95% CI [80.6, 87.9]); a sufficient outdoor play area (76.3%, 95% CI [72.0, 80.1]); a sufficient indoor play area (79.9%, 95% CI [76.1, 83.2]); availability of developmentally appropriate materials and equipment for children of all ages (69.4%, 95% CI
[64.7, 73.8]); planned activities that are developmentally appropriate for children of all ages (66.4%, 95% CI [61.4, 71.0]); constant adult supervision (83.1%, 95% CI [79.0, 86.6]); the ability to reach parents or caregivers in case of emergency (79.6%, 95% CI [74.8, 83.7]); adherence to sanitary procedures such as hand washing (75.7%, 95% CI [72.1, 78.9]); healthy nutrition (79.2%; 95% CI [75.9, 82.2); provisions for sick children (50.8%, 95% CI [46.7, 54.8]); and natural lighting in the child care space (67.6%, 95% CI [62.9, 72.0]) (See Table 2.5).
Table 2.5. Childcare arrangement attributes
Child care arrangement attributes % 95% CI
Plenty of child-friendly conversation 87.6 [84.9, 87.9]
Neat, clean, and orderly physical setting 84.6 [80.6, 87.9]
Constant adult supervision 83.1 [79.0, 86.6]
Sufficient indoor play area 79.9 [76.1, 83.2]
Is able to reach parent or caregiver in an emergency 79.6 [74.8, 83.7]
Healthy nutrition 79.2 [75.9, 82.2]
Sufficient outdoor play area 76.3 [72.0, 80.1]
Follows sanitary procedures such as hand washing 75.7 [72.1, 78.9]
Materials and equipment available that are developmentally appropriate for children of all age levels
69.4 [64.7, 73.8]
Natural light (i.e., windows) 67.6 [62.9, 72.0]
Planned activities that are developmentally appropriate for children of all age levels
66.4 [61.4, 71.0]
Provider has specialized training in early childhood education 59.2 [54.5, 63.8]
Provisions for sick children 50.8 [46.7, 54.8]
Note: Respondents could choose more than one response.
In childcare programs serving children aged 0 to 11, the large majority of primary caregivers (90.5%, 95% CI [88.1, 92.5]) reported that care was provided by First Nations caregivers. Of these, a majority (59.2%, 95% CI [54.5, 63.8]) of primary caregivers stated that the child’s childcare provider had received training in early childhood education.
What were children’s learning experiences?
First Language
According to results from the FNREEES, primary caregivers placed a high importance on their children learning a First Nations language. Similar to the numbers reported in
the RHS 2008/10, FNREEES data showed that a total of nearly 90% of primary caregivers indicated that learning a First Nations language was very important (61.9%, 95% CI [58.6, 65.0]) or somewhat important (26.5%, 95% CI [23.9, 29.2]). A much smaller percentage (8.8%, 95% CI [7.4, 10.6]) indicated that it was a little important, and 2.8% (95% CI [2.3, 3.4]) indicated that it was not important.
When asked about their knowledge of First Nations languages, about one-third of primary caregivers (32.4%,95% CI [27.8, 37.5]) of females and 34.9% (95% CI [30.5, 39.6]) of males) reported a First Nations language as their mother tongue. In spite of this, only 18.1% (95%

The National Report of the First Nations Regional Early Childhood, Education, and Employment Survey | 23
CI [13.7, 23.6]) reported a First Nations language as the first language that their child learned at home (i.e., their mother tongue).
However, primary caregivers reported that 81.1% (95% CI [78.7, 83.3]) of children had some knowledge of a First Nations language, even if only a few words. Among these children, more than one-third (36.0%, 95% CI [30.4, 41.9]) were reported as being intermediate or fluent in a First Nations language (i.e., possessing the ability to speak, read, write, and understand) two-thirds (64.0%, 95% CI [58.1, 69.6]) were reported as not being fluent.
Although not directly comparable, these data align somewhat with those reported in the RHS 2008/10 which reported that nearly half of First Nations children (49.7%) could speak or understand a First Nations language, with one-quarter (25.0%) using a First Nations language on a daily basis (FNIGC, 2012).
In order for children to learn a First Nations language they must be exposed to it. According to the FNREEES primary caregivers reported that the majority (79.1%) of First Nations children had some exposure to a First Nations language in the home: 14.7% (95% CI [12.3, 17.4]) of children had exposure all of the time, 19.9% (95% CI [16.9, 23.4]) most of the time, 44.5% (95% CI [40.6, 48.5]) some of the time; while 20.9% (95% CI [18.0, 24.1]) had no exposure.
Results were similar when primary caregivers were asked about children’s exposure to First Nations languages in the community, with 78% saying that they had some exposure. More than 1 in 5 (10.3%, 95% CI [8.7, 12.1]) reported that children were exposed to a First Nations language in the community all of the time, 18.1% (95% CI [14.8, 21.9]) said most of the time, 49.6% (95% CI [45.4, 53.7]) said some of the time, while 22.1% (95% CI [19.4, 25.1]) said none of the time.
The development of a First Nations language also requires that children have opportunities to learn and enhance their language abilities. When primary caregivers of First Nations children who had some knowledge of a First Nations language were asked if they were satisfied with their
children’s opportunities to learn a First Nations language, the majority (79.1%, 95% CI [75.7, 82.2]) said they were.
In cases where caregivers said they were not satisfied with their children’s learning opportunities or their children did not have knowledge of a First Nations language, the most frequently reported barriers included: lack of available First Nations language classes (41.6%, 95% CI [37.7, 45.7]), no one available to teach the language (41.3%, 95% CI [35.4, 47.4]), and no one to practise with (39.9%, 95% CI [35.0, 44.9]). Other barriers included: not being motivated enough (18.7%, 95% CI [15.1%, 23.0]), that it was not easy to get to (10.3%, 95% CI [7.6, 13.8]), that caregivers were too busy (9.6%, 95% CI [7.5, 12.4]) or simply not interested (6.2%, 95% CI [5.1, 7.4]) (See Table 2.6).
Table 2.6. Barriers to learning or improving a First Nations language among children
Barriers % 95% CI
No First Nations language classes available
41.6 [37.7, 45.7]
No one available to teach the language
41.3 [35.4, 47.4]
No one to practice with 39.9 [35.0, 44.9]
Not motivated enough 18.7 [15.1, 23.0]
Not easy to get to 10.3 [7.6, 13.8]
Too busy 9.6 [7.5, 12.4]
Not interested 6.2 [5.1, 7.4]
Other 5.6 [4.3, 7.3]
Too young 4.0E [2.1, 7.4]
Cost is too high 3.1E [1.6, 5.9]
Note: Respondents could choose more than one response. E High sampling variability, interpret with caution.
However, responses also indicated that First Nations children have many sources of support for learning and improving their language. When primary caregivers of First Nations children with some knowledge of a First Nations language were asked who assisted children in learning or improving their language, those most frequently identified were parents (63.4%, 95% CI [59.3, 67.3]), grandparents

Now is the Time: Our Data, Our Stories, Our Future 24 |
(62%, 95% CI [59.7, 64.4]), teachers or other school staff (51.1%, 95% CI [48.0, 54.1]) (See Table 2.7).
Table 2.7. People who assisted children in learning and improving their First Nations language
People who assisted children
% 95% CI
Mother/father or male/female guardian
63.4 [59.3, 67.3]
Other family members (grandparents, aunt, uncle, etc.)
62.0 [59.7, 64.4]
Teachers or other school staff 51.1 [48.0, 54.1]
Elder(s) 22.3 [20.1, 24.6]
Other early childhood educators (preschool, nursery school, etc.)
13.8 [12.4, 15.4]
Community members 13.0 [11.4, 14.8]
Head Start teacher 9.8 [8.5, 11.3]
Knowledge holder(s) 5.4 [4.3, 6.8]
No one 1.0 [0.7,1.4]
Other F F
Note: Respondents could choose more than one response. F Suppressed due to low cell count or very high sampling variability.
Culture
Culture is a fundamental element of children’s individual and collective identity and is therefore highly valued in the lives of First Nations children. According to the FNREEES, the majority of primary caregivers of First Nations children (86.1%) reported that they felt it was either very important (59.7%, 95% CI [56.4, 62.8]) or somewhat important (26.4%, 95% CI [23.9, 29.2]) for children to learn about the traditional teachings of their people.
Yet despite the importance placed on learning about culture, only 39.2% (95% CI [36.6, 42.1]) of caregivers said they participated in cultural activities such as drumming, singing, storytelling, and powwows at least once a month, while 60.8% (95% CI [57.9, 63.7]) participated in these activities less than once a month.
Although participation in cultural activities may be limited, the majority of primary caregivers (90.0%) viewed the schools their children attended as being supportive of First Nations culture: 56.4% agreed (95% CI [53.3, 59.4] and 33.6% (95% CI [30.3, 37.0]) strongly agreed that their child’s school supported First Nations culture.
When asked who helped children learn about traditional teachings, primary caregivers reported parents (54.6%, 95% CI [51.6, 57.6]) and other family members such as grandparents (52.4%, 95% CI [48.8, 55.9]) helped the majority of the time. Others included teachers or school staff (33.7%, 95% CI [31.1, 36.5]), Elders (24.2%, 95% CI [21.8, 26.8]), and community members (14.4%, 95% CI [12.9, 16.0) among others (See Table 2.8).
Table 2.8. People who support First Nations children in learning and improving their First Nations culture
People who supported children % 95% CI
Mother/father or male/female guardian
54.6 [51.6, 57.6]
Other family members (grandparents, aunt, uncle, etc.)
52.4 [48.8, 55.9]
Teachers or other school staff 33.7 [31.1, 36.5]
Elder(s) 24.2 [21.8, 26.8]
Community members 14.4 [12.9, 16.0]
No one 14.2 [12.3, 16.3]
Knowledge holder(s) 8.8 [7.6, 10.3]
Other early childhood educators (preschool, nursery school, etc.)
8.7 [7.6, 10.0]
Head Start teacher 8.5 [6.9, 10.4]
Other F F
Note: Respondents could choose more than one response. F Suppressed due to low cell count or very high sampling variability.
Communication
Communication is a crucial component of any child’s overall growth and development. Many early childhood programs design activities oriented towards supporting the development of children’s communication skills. Primary caregivers of First Nations children aged 5 and

The National Report of the First Nations Regional Early Childhood, Education, and Employment Survey | 25
under who reported that their children attended an early childhood program designed for First Nations children, also reported that these children more often reached important communication milestones.
For example, of those whose children attended an early childhood program specifically designed for First Nations (such as the Aboriginal Head Start On Reserve Program), nearly three-quarters (73.3%, 95% CI [69.5, 76.8]) reported that their children understood them all the time when they spoke, compared to 57.5% (95% CI [51.7, 63.2]) of children who did not attend such programs.
The same pattern occurred when primary caregivers were asked if they could understand their children when they spoke. Of those who attended an early childhood program designed for First Nations 63.5% (95% CI [58.8, 67.9]) reported that they could understand their child all the time, compared to 41.0% (95% CI [35.5, 46.7]) of those who did not attend such a program.
Even more noteworthy is the difference reported in regards to others being able to understand their child’s communication. Nearly half (47.8%, 95% CI [43.0, 52.7]) of primary caregivers with children who attended an early childhood program for First Nations reported that others could understand their child all the time, compared to 23.7% of (95% CI [19.2, 28.8]) of those whose children did not attend such a program.
Formal Schooling
Most primary caregivers (79.5%, 95% CI [76.5, 82.2]) reported that their First Nations children were enrolled in a school within a First Nations community, while a much smaller percentage (20.5%, 95% CI [17.8, 23.5]) reported having children attend school outside the community. Of the children who were attending school within a First Nations community, 14.0% (95% CI [12.2, 16.0]) had at some point in the past attended a school outside a First Nations community.
When asked which language their children used in school, the majority of primary caregivers (89.1%, 95% CI [86.5, 91.2]) indicated it was English, while a smaller percentage (6.7%, 95% CI [4.7, 9.4]) reported it was a First Nations language and (4.2%, 95% CI [3.5, 5.0]) said it was French.
Yet, even with the small percentage of schools using a First Nations language full-time, 81.6% (95% CI [78.7, 84.2]) of children had been taught a First Nations language at school.
When it came to culture, the majority of primary caregivers either strongly agreed (33.6%, 95% CI [30.3, 37.0]) or agreed (56.4%, 95% CI [53.3, 59.4]) that their child’s school supported First Nations culture through teaching and activities. Only 10.0% disagreed or strongly disagreed (8.0%, 95% CI [6.9, 9.3]) and 2.0%, 95% CI [1.5, 2.7], respectively) to this statement.
Several factors impact children’s success in school including: attendance, school climate, and academic achievement. When primary caregivers were asked about their children’s absenteeism, nearly one-third (30.1%, 95% CI [27.4, 33.0]) reported that their children did not miss any days in the past school year, while 41.9% (95% CI [39.4, 44.3]) reported that their children missed one or two days, 19.8% (95% CI [17.6, 22.2]) missed three-to-five days, 4.8% (95% CI [3.7, 6.1]) missed six-to-nine days, and 3.5% (95% CI [2.6, 4.6]) missed 10-to-20 days.
School climate or environment and other elements that are beyond the academic aspects of the school, have been shown to affect children’s abilities to perform well in an academic setting. According to the FNREEES, the majority of primary caregivers of First Nations children either agreed (58.2%, 95% CI [55.6, 60.7]) or strongly agreed (34.7%, 95% CI [31.8, 37.7]) that their child felt safe at school. Likewise, the majority agreed (59.8%, 95% CI [56.7, 62.8]) or strongly agreed (34.3%, 95% CI [30.9, 37.8]) that their child was happy at school; and that their child enjoyed being there (65.6% (95% CI [62.4, 68.8]) agreed, and 28.3%, 95% CI [25.0, 31.8] strongly agreed with this statement) (See Table 2.9).
Despite this, the majority of primary caregivers identified bullying (which included physical, emotional, and cyber-bullying) as a problem at school. Nearly half (47.4%, 95% CI [44.3, 50.6]) agreed and 19.7% (95% CI [16.8, 23.0]) strongly agreed with this statement.
When asked about racism in the school, the majority (80.2%, 95% CI [77.4, 82.7]) felt racism was not a problem

Now is the Time: Our Data, Our Stories, Our Future 26 |
while nearly 1 in 5 (19.8%, 95% CI [17.3, 22.6]) felt that it was a problem.
About a third (30.7%) of the primary caregivers of First Nations children agreed or strongly agreed that physical violence was a problem at their children’s school (See Table 2.9). Among the 30.7% who agreed or strongly agreed with this statement, 21.5% (95% CI [18.3, 25.1]) reported that their child experienced physical violence less than once a month, 19.3% (95% CI [16.0, 23.0]) once a month, 9.8% (95% CI [7.5, 12.7]) two or three times a month and the remaining 9.1% (95% CI [7.2, 11.6]) once a week or more.
When primary caregivers were asked how well their children were doing academically in school, 25.5% (95% CI [23.1, 28.1]) reported that their children did above average, 67.8% (95% CI [65.2, 70.4]) said average, and 6.7% (95% CI [5.3, 8.4]) reported that their children did below average.
Very few children (1.8%, 95% CI [1.3, 2.6]) were reported as having skipped a grade—nearly half the percentage of what was reported in the RHS 2008/10. A significantly higher percentage of children (8.4%, 95% CI [7.0, 10.2]) were reported as having repeated a grade.
This trend mirrors a similar pattern identified in the RHS 2008/10 data, although the specific rates identified in this report are lower than those of the RHS 2008/10 on both accounts (FNIGC, 2012).
DISCUSSION
Despite the ongoing legacies of colonization, First Nations people are deeply resilient. We know that the vitality of families, communities, and collectives—especially in terms of language, culture, and learning—are key to this resilience. We also know that learning is a lifelong, social process characterized by specific and unique Indigenous epistemologies and ontologies, including distinct values, traditions, and protocols. Learning on individual and collective levels plays a key role in children’s overall health and well-being. These processes of learning take place in multiple settings, including informal settings (such as a child’s home and community) and more formal settings, such as schools and childcare programs. Experiences in these settings help determine children’s well-being now and in the future.
PerceptionsStrongly Disagree
Disagree Agree Strongly Agree
Feels safe at school0.9E
[0.6,1.5]6.2
[4.8, 7.9]58.2
[55.6, 60.7]34.7
[31.8, 37.7]
Is happy at school0.6E
[0.4, 1.0]5.3
[4.1, 6.9]59.8
[56.7, 62.8]34.3
[30.9, 37.8]
Most students in school enjoy being there0.7E
[0.4, 1.1]5.4
[4.3, 6.7]65.6
[62.4, 68.8]28.3
[25.0, 31.8]
The school offers parents many opportunities to be involved in school activities
2.0E
[1.5, 2.7]9.7
[8.1, 11.7]61.5
[58.6, 64.4]26.8
[24.4, 29.4]
This school supports First Nations culture (through teaching and/or activities)
2.0[1.5, 2.7]
8.0[6.9, 9.3]
56.4[53.3, 59.4]
33.6[30.3, 37.0]
Bullying (physical, emotional, and cyberbullying) is a problem at school
6.8[5.4, 8.5]
26.1[23.0, 29.5]
47.4[44.3, 50.6]
19.7[16.8, 23.0]
Racism is a problem at school22.8
[20.3, 25.5]57.4
[54.3, 60.4]15.6
[13.3, 18.3]4.2
[3.4, 5.1]
Physical violence is a problem at school20.7
[18.0, 23.8]48.6
[45.1, 52.0]24.4
[21.7, 27.4]6.3
[5.0, 7.9]
Table 2.9. Perception of effects of school climate on First Nations children
Note. E High sampling variability, interpret with caution.

The National Report of the First Nations Regional Early Childhood, Education, and Employment Survey | 27
The Context
Children’s learning journeys begin at home within their families. Most First Nations children sampled in this survey were cared for by their biological parents, grandparents or great-grandparents in their own homes. Although few of the parents and primary caregivers had attended a residential school, more than half of the children were reported as having a grandparents or great-grandparent who had. We can expect from these figures that the intergenerational impacts of residential schooling are still relevant in the lives of most First Nations children.
Despite the intergenerational trauma of residential schooling and other harmful colonial policies, the significant majority of First Nations children are deeply loved and cared for by their primary caregivers. Most of the children were reported to receive praise and physical affection on a regular basis. And when primary caregivers needed support, most said they had people they could turn to all, or some, of the time.
Although First Nations children generally experience a high level of love and care from their primary caregivers, low levels of parental educational attainment and high levels of poverty also impact their lives. According to the FNREEES, nearly half of the primary caregivers did not graduate from high school, and even fewer were employed full-time: in fact, 39.2% of families reported living on less than $20,000 per year.
However, despite the high levels of poverty reported the majority said that they did not significantly struggle to meet their shelter or utility needs. These results are interesting given that almost half of primary caregivers reported that children and their families live in crowded households, and over half have moved at least once. More research might reveal specific details about how low-income First Nations families meet basic needs, and how poverty directly and indirectly impacts the life chances and early experiences of First Nations children.
It is important to note that although realties such as parental educational attainment, employment, and income show significant inequities when comparing First Nations communities to the general population, these conditions are not immutable and can be changed through a mix of culturally appropriate policy and development innovations that prioritize Indigenous culture, language, and ways of being in the world.
In terms of where First Nations children learn and are cared for, the FNREEES shows that the family home is an important—perhaps the most important—setting for early development and learning. Indeed, only 1 in 5 (21.3%) of primary caregivers reported that children received regular childcare, with the majority of primary caregivers (92.7%) with children aged 5 to 11 reporting that child care services were either not needed, or were not age-appropriate, or accessible.
Of children aged 0 to 11, 40.9% attended a daycare centre, and 17.2% attended a before- or after-school program. Primary caregivers highly valued their childcare settings, citing child-friendly conversations; neat, clean and orderly physical setting; sufficient indoor play area; constant adult supervision; and ability to contact parents and caregivers in cases of emergencies as particularly favourable attributes.
One of the most-valued attributes of childcare settings overall was the presence of First Nations caregivers with specialized training in early childhood education.
Children’s Learning Experiences
Language and culture are fundamental to the development of individual, social, and cultural identity of First Nations children, and to the collective future of their communities. Given this, it is no surprise that primary caregivers highly value opportunities for their children to learn their language and culture. Primary caregivers reported that the majority of children (81.1%) had knowledge of a First Nations language, even if it was only a few words; while about one-third (36.0%) were reported as being intermediate or fluent in a First Nations language. While it was highly valued by primary caregivers, children’s involvement in cultural activities was somewhat limited, with 39.2% attending such activities at least once a month.
The FNREEES indicated that formal school settings provide an important opportunity for children to learn their language. Even though the majority (89.1%) of schools were English-speaking, most First Nations children (81.6%) were shown to have been taught a First Nations language at school.
Primary caregivers also reported that their child’s school supported First Nations culture through teaching and activities. In addition to these learning opportunities, First Nations children also have strong support from their
Now is the Time: Our Data, Our Stories, Our Future 28 |
families and broader community to maintain and enhance their knowledge and understanding of their language and culture.
Children’s academic success in school was viewed by most primary caregivers as average, with only one-quarter saying that their children achieved above-average grades. This fact was reflected in the low percentage of skipped grades (1.8%) and higher percentage of repeated grades (8.4%).
Important considerations for children’s success in school are their attendance and the climate of the school. Most primary caregivers reported that their children were happy, felt safe, and enjoyed going to school. However, caregivers also identified bullying as a significant problem. Racism in school settings, although reported to be somewhat less of a problem, nonetheless remains a problem.
Children’s overall ability to communicate is fundamental to their development and well-being. This study revealed that children who attended a First Nations–specific program such as an Aboriginal Head Start On Reserve program, more often met communication milestones. More primary caregivers reported that their children aged 5 and under could understand them all the time compared to those children who did not attend an Aboriginal Head Start On Reserve or other early childhood program designed specifically for First Nations children. Even more noteworthy is the difference among those who reported others being able to understand their child’s communication all the time: 47.8% for children who attended a First Nations early childhood program, compared to 23.7% for children who did not attend such a program.
CONCLUSIONS
First Nations children live in a complex world where they are obliged to learn to walk in multiple realities. Their early learning experiences serve not only to anchor them in their social and cultural identity, but also to ensure the survival of their collectives. The value placed on the learning of First Nations languages and traditional ways by caregivers and collective communities serves to create a foundation for children to realize their collective identities and to support them as they negotiate their realities.
The findings of this study highlight the reality that supporting First Nations children means supporting First Nations families and broader social and cultural contexts. Policies and programs designed to enhance the early learning experiences and life chances for First Nations children must be targeted to address not just the individual realities for individual children, but also the broader context in which these children live, play, and grow. Given the high numbers of children who receive all or most of their early learning experiences in a home setting—as opposed to formal child care or school settings—broader community development that impacts family well-being (culturally, socially, and economically) should be seen as directly relevant to early childhood development.
Although formal childcare and school programs are highly significant in directly supporting children and families, these programs should not be seen as adequate in and of themselves. Rather, multi-pronged and inclusive strategies designed to respect diversity should be the foundation upon which to develop programs, policies, and activities that specifically address the collective and the individual elements of health and well-being.
In other words, supporting families and communities to be culturally, spiritually, economically, and socially whole and healthy is a key element in supporting the healthy development of First Nations children. This broader, holistic approach to early childhood development and learning is resonant with an Indigenous world view that recognizes the interconnection of all things and the integral role of language, culture, and Indigenous knowledge in the health and well-being of Indigenous individuals, families, communities, and broader collectives.
Studies such as the FNREEES, which was undertaken by First Nations for First Nations, are a crucial first step in identifying both the progress made in improving the life chances of First Nations children and the still significant need for policies and programs to close the gap between First Nations children and their non-Indigenous counterparts. We know that despite the overall positive reports from primary caregivers on the health and well-being of their First Nations children, there is still much to be done to support those children—along with their families and communities—in overcoming persistent inequities in order to achieve optimal health and well-being through the generations to come.

The National Report of the First Nations Regional Early Childhood, Education, and Employment Survey | 29
REFERENCES
Butler-Jones, D. (2008). The Chief Public Health Officer’s report on the state of public health in Canada: 2008. Public Health Agency of Canada. Retrieved from http://www.phac-aspc.gc.ca.ezproxy.library.ubc.ca/cphorsphc-respcacsp/2008/fr-rc/cphorsphc-respcacsp01-eng.php
Canadian Council on Learning. (2009). The state of Aboriginal learning in Canada: A holistic approach to measuring success. Ottawa: Author. Retrieved from http://www.afn.ca/uploads/files/education2/community_dialogues_on_first_nations_holistic_lifelong_learning,_2009.pdf
First Nations Information Governance Centre. (2012). First Nations Regional Health Survey (RHS) 2008/10: National report on adults, youth and children living in First Nations communities. Ottawa: FNIGC. Retrieved from http://fnigc.ca/sites/default/files/docs/first_nations_regional_health_survey_rhs_2008-10_-_national_report.pdf
Krieger, N. (2008). Proximal, distal, and the politics of causation: What’s level got to do with it? American Journal of Public Health, 98(2), 221–230.
Reading, C. (2015). Structural determinants of Aboriginal peoples’ health. In M. Greenwood, S. de Leeuw, N.M. Lindsay, & C. Reading (Eds.), Determinants of indigenous peoples’ health (3–15). Toronto: CSPI.
Reading, C., & Wien, F. (2009). Health inequalities and the social determinants of Aboriginal peoples’ health.
Prince George, BC: National Collaborating Centre for Aboriginal Health. Retrieved from http://www.nccah-ccnsa.ca/Publications/Lists/Publications/Attachments/46/health_inequalities_EN_web.pdf
Marmot, M. (2005). Social determinants of health inequalities. The Lancet, 365(9464), 1099–1104.
Smylie, J., & Adomako, P. (2009). Indigenous children’s health report. Centre for Research on Inner City Health. Retrieved from http://dev.vawlawinfo.ca/wp-content/uploads/Indigenous-Childrens-Health-Report.pdf
Statistics Canada. (2009.) Census of Population, 1996 and 2006, Table 21: Percentage of First Nations and non-Aboriginal populations living in crowded dwellings, Canada 1996 and 2006. Retrieved from http://www12.statcan.gc.ca/census-recensement/2006/as-sa/97-558/table/t21-eng.cfm
Truth and Reconciliation Commission of Canada. (2015). Final report of the Truth and Reconciliation Commission of Canada, volume 1 summary: Honouring the truth, reconciling for the future. Lorimer Publishers.
Now is the Time: Our Data, Our Stories, Our Future 30 |
First Nations Education
EXECUTIVE SUMMARY
Using the First Nations Holistic Lifelong Learning Measurement Framework (Canadian Council on Learning, 2009) as a guide, the FNREEES youth survey results provide an unprecedented landscape of First Nations learning in Canada among 12 to 17 year olds. The sources and domains of knowledge from which First Nations youth learn are described, along with results that highlight youths learning experiences, inside and outside the classroom.
The FNREEES results point to the strengths of the informal learning taking place among First Nations youth. These results show that most First Nations youth feel that they have a good base of general support from friends and family, and receive strong support from their families for formal and informal learning.
Youth are learning about their history, language, and culture, and many participate in traditional cultural activities, have some knowledge of traditional teachings, and feel that traditional spirituality is important in their lives. The results also show that in addition to learning inside the classroom, grandparents, parents or guardians, Elders, and community members are also a strong source of learning opportunities.
In the school setting many youth report strong classroom performance, with most saying they are happy at school and attend regularly. However, some First Nations youth report high absentee rates and approximately 16% report that they have dropped out of school. Among youth who dropped out of school, nearly three-quarters eventually returned primarily due to parental encouragement and realizing the value of education.
As well, parent, family, and community involvement in education is shown to be associated with positive school experiences. If a school is supportive of First Nations culture and actively involves parents in activities, First Nations youth report being happier at school and say that other students also enjoy being there.
Similarly, perceiving that one’s parents, guardians, or family members talk to one’s teachers and attend school events, is related not only to better school attendance and school enjoyment but also to getting good grades and staying in school. Combined with future research on factors that impact learning and achievement among First Nations, these results can help inform interventions designed to support and enhance First Nations education.
KEY FINDINGS
• More than half of First Nations youth (53.1%) participated in First Nations cultural activities outside of class time, and more than three-quarters (78.3%) felt that traditional teachings were very important in their lives.
• The majority of First Nations youth (82.8%) reported having some knowledge of a First Nations language. Of those, 26.8% reported understanding it very well or relatively well and 23.9% reported speaking it very well or relatively well.
• First Nations youth most often reported learning their language from teachers or school staff (60.8%), grandparents (53.5%), and parents or guardians (49.9%).
• Among the 16.1% of First Nations youth who had dropped out of school, nearly three-quarters (73.3%) eventually returned. The most commonly reported reasons for returning to school were “parent(s)/guardian(s) suggested I return” (53.6%) and “realized value of education/wanted a diploma” (45.9%).
• Among those First Nations youth who said that their school is supportive of First Nations culture the majority (84.5%) reported that they felt happy at school; compared to 73.7% of youth who said their school did not support First Nations culture.
• Among First Nations youth who reported that their school actively involved parents, the majority (88.2%) said they felt happy at school, compared to only 67.1% of those who did not think that their school actively involved parents.
CHAPTER 3

The National Report of the First Nations Regional Early Childhood, Education, and Employment Survey | 31
• Parental involvement in school was significantly associated with several key factors for first Nations students, including: better school performance, better attendance, and fewer instances of dropping out. For example, among First Nations youth who reported that their parents spoke to their teachers, only 11.2% had ever dropped out of school, compared to 26.3% of those whose parents did not speak to their teachers.
INTRODUCTION
The First Nations Holistic Lifelong Learning Model, which is described in detail in Chapter One, presents First Nations learning as a comprehensive, lifelong developmental process that contributes to individual and community well-being.
In 2009, the Holistic Lifelong Learning Measurement Framework (CCL, 2009) was created to build upon the model and present a set of indicators that measure educational success among First Nations. Compared to conventional measures of educational achievement, these indicators more accurately reflected First Nations’ experiences and understanding of education. Rather than focusing solely on the indicators of classroom success such as years of schooling, graduation rates, and performance on standardized tests, the new framework included aspects of education that are integral to a First Nations perspective on learning. These included two new categories of educational experience: Sources and Domains of Knowledge, and the Lifelong Learning Journey.
Indicators in the Sources and Domains of Knowledge category were designed to measure the sources and domains that a person learns from and about, including: people (family, Elders, community), languages, traditions, the natural world, and spirituality. These sources and domains were organized into four key elements:
• learning from the world of people,
• learning from and about the land,
• learning from and about languages, traditions, and cultures, and
• learning from, and about, spirituality.
Indicators in the Lifelong Learning Journey category were designed to measure formal and informal learning opportunities that occur in the classroom and in the community throughout one’s life. For First Nations youth who are currently in or have recently left school, lifelong learning was broken down into two elements: learning in school and learning at home and in the community (CCL, 2009).
By incorporating concepts such as language, culture, and community, the authors of the Holistic Lifelong Learning Measurement Framework successfully broadened the scope of what it means to measure educational success in a First Nations context. However, at the time very little data existed that could be used to populate the newly proposed indicators. While the authors of the Framework were able to draw on the results of existing surveys, such as the Aboriginal Peoples Survey (Statistics Canada, 2006) and the First Nations Regional Health Survey (RHS; FNIGC, 2012) to populate some indicators, many indicators had very little or no data associated with them.
A new tool was required to measure the educational realities of First Nations people living in reserve and Northern First Nations communities. In 2012–13 the FNREEES was developed using the Holistic Lifelong Learning Measurement Framework along with a comprehensive First Nations-driven survey development process. Relevant survey items were designed to collect data reflective of the indicators described in the framework and to provide a comprehensive and inclusive picture of First Nations learning.
Although the FNREEES covers a wide range of concepts related to education, this chapter focuses primarily on results that describe the Sources and Domains of Knowledge and the Lifelong Learning Journey outlined in the Holistic Lifelong Learning Measurement Framework (CCL, 2009). For the first time using this new tool, statistics will be provided that represent the current state of First Nations learning among those living in First Nations reserve and Northern communities.
In addition, the relationship between classroom learning and some of the sources and domains of knowledge that come from outside the classroom (such as a school’s support for First Nations culture, and parental support of education)

Now is the Time: Our Data, Our Stories, Our Future 32 |
will be explored. By broadening the conventional method of assessing learning and education to one that is more inclusive of First Nations culture, community, and parental support, a more comprehensive, and fulsome portrait of First Nations learning will emerge.
METHODS
Because the most valuable insights into the current state of First Nations education will likely come from those who are currently enrolled in (or have recently left) school, the results that are described in this chapter come from the FNREEES youth survey. The youth survey covered First Nations youth 12- to 17-years-old and therefore represents a large proportion of the school-aged population living on reserve and in northern First Nations communities.
Not all the youth surveyed for the FNREEES were in school, so results for current and former students were combined
so that they represent the perspective of all First Nations youth and their learning experiences, regardless of whether or not they were currently attending school at the time of the survey.
During the development of the FNREEES, the indicators described in the Holistic Lifelong Learning Measurement Framework were further operationalized in an effort to create survey questions that measured the specific themes under investigation.
Table 3.1 lists the specific measures from the FNREEES youth survey that were used to gather information about sources and domains of knowledge and lifelong learning experiences.
Frequency statistics (percentages and 95% confidence intervals) were generated and are reported for survey items that represent each of the above measures. Note that percentages that are followed by a superscript “E” have
Holistic Lifelong Learning Framework FNREEES Measure
Sources and Domains of Knowledge
Learning from the world of people
• Support from family and friends• Parental/family engagement in youth’s education• Learning from Elders• Learning from community members
Learning from and about the land
• Participation in First Nations cultural activities• Knowledge of the history and rights of First Nations
Learning from and about languages, traditions and cultures
• Knowledge and use of a First Nations language• Sources of support for learning a First Nations language• Sources of support for learning traditional teachings• Satisfaction with knowledge of traditional teachings• Barriers to gaining knowledge of traditional teachings
Learning from and about spirituality
• Importance of traditional spirituality
Lifelong LearningLearning in school
• School performance and enjoyment• School attendance• Dropouts and reasons for dropping out• Returning to school after dropping out
Learning at home and in the community
• Participation in extracurricular activities• Community involvement through volunteerism
Table 3.1. Measures from the FNREEES within the sources and domains of knowledge from the CCL Holistic Lifelong Learning Framework

The National Report of the First Nations Regional Early Childhood, Education, and Employment Survey | 33
a high sampling variability and should be interpreted with caution.
For ease of analysis and interpretation, results from survey items with multiple response categories were re-grouped into fewer categories. For example, where response categories were strongly agree, agree, disagree, and strongly disagree, these were regrouped into two categories: strongly agree/agree and strongly disagree/disagree. Furthermore, where two survey items were asking about the same concept, these items were combined into one. For example, those who dropped out of school once and those who dropped out more than once were asked separately about their reasons for dropping out. In order to get at the overall reasons for dropping out of school, the results from these two questions were combined and reported as one.
Similarly, where current and former students were asked questions with slightly different wording, but the same intent, results from the two questions were combined so as to get at a better general overview of the views of all First Nations youth. For example, where current students were asked the extent to which they agree with statements such as “Overall, I am happy at school,” and former students were asked the extent to which they agree with statements such as “Overall, I was happy at school,” results for these items were combined to get a general sense of youth happiness at school.
Finally, cross-tabulations were conducted to explore the statistical relationships between classroom learning and both cultural and parental or family support. The relationships between youth enjoyment of school and the school’s overall support both for First Nations culture and for parental involvement were explored. Furthermore, the relationships between parental or family support for education and school performance, school absenteeism, dropping out of school, and school enjoyment were examined.
RESULTS
Learning from the World of People
Support from family and friends
Among First Nations youth (12–17), the large majority (95.8%, 95% CI [94.5, 96.9]) agreed or strongly agreed that they have family and friends who help them feel safe, secure, and happy. These results indicate that almost all First Nations youth feel that they have a strong base of general support from those around them.
Parental or family engagement in education
Looking specifically at support for school learning, FNREEES results show that three-quarters (75.5%, 95% CI [72.6, 78.2]) of First Nations youth reported that their parents, guardians, or family members spoke to, corresponded with, or visited with their teachers; while 69.9% (95% CI [66.7, 72.9]) reported that their parents, guardians, or family members attended a school event in which they participated (such as a play, cultural event, sports competition, or science fair).
When asked how often their parents, guardians, or family members talked to them about how they were doing in school, one-third of First Nations youth (33.8%, 95% CI [30.6, 37.2]) said several times a week, 23.2% (95% CI [20.5, 26.1]) said several times a month, and 9.0% (95% CI [7.4, 10.9]) said never or hardly ever.
When asked how often their parents, guardians, or family members helped them with their homework when they needed it 19.6% (95% CI [17.4, 22.1]) said all the time, 28.9% (95% CI [26.1, 31.9]) said most of the time, and 17.0% (95% CI [14.5, 19.8]) of First Nations youth said none of the time. While the majority of youth appear to have parents, guardians, or other family members who are involved in their formal education, some do not receive a great deal of family support.
Sometimes there are barriers to parental or family involvement in formal education because the school may not actively include parents in their children’s learning.

Now is the Time: Our Data, Our Stories, Our Future 34 |
Overall, three-quarters (76.2%, 95% CI [73.3, 78.9]) of First Nations youth agreed or strongly agreed that the school in their community offers parents opportunities to be involved in school activities. While the majority of First Nations youth perceive that the school involves their parents and family members in their learning, one-quarter did not agree that the school in their community offers parents opportunities to be involved in school activities.
Learning from Elders
More than one-third (36.1%, 95% CI [32.3, 40.0]) of First Nations youth reported that Elders helped them learn about traditional teachings such as beliefs, values, medicines, practices, ceremonies, stories, songs, and other cultural activities. Among First Nations youth with some knowledge of their First Nations language, slightly more than 1 in 4 (27.0%, 95% CI [23.6, 30.7]) said Elders had helped them learn a First Nations language. These FNREEES results show that Elders continue to be an important source of knowledge when it comes to learning about language and culture.
Learning from First Nations community members
In addition, about 1 in 5 First Nations youth (19.5%,95% CI [16.7, 22.6]) reported that community members helped them learn about traditional teachings such as beliefs, values, medicines, practices, ceremonies, stories, songs, and cultural activities. Among First Nations youth with some knowledge of their First Nations language, 16.0% (95% CI [13.6, 18.6]) reported that community members helped them learn the language. Community members appear to be an important source of knowledge for some First Nations youth when it comes to learning about traditional teachings and language; however, Elders remain a key source of knowledge in these domains.
Learning from and about the Land
Participation in First Nations cultural activities
Learning from and about the land is an essential aspect of First Nations learning and often entails experiential learning, a mode of learning that is frequently associated with traditional activities that occur outside the classroom (CCL, 2009). More than half of First Nations youth (53.1%, 95% CI [49.8, 56.3]) reported participating in First Nations cultural activities, such as drumming, singing, storytelling, traditional dancing, hunting and gathering, beading,
and ceremonies, outside of school hours. Of those who participated in these activities, more than one-third (36.1%, 95% CI [32.0, 40.3]) said they did so at least once-a- week.
Knowledge of the history and rights of the First Nations
Learning about First Nations history, land, and inherent rights is also an essential aspect of First Nations learning. However, according to the FNREEES only 12.5% (95% CI [10.5, 14.7]) of First Nations youth reported they knew a lot about the history of their people. Another 40.9% (95% CI [37.4, 44.6]) said they had some knowledge of the history of their people, and 37.8% (95% CI [34.6, 41.1]) said they had a little knowledge. Less than 1 in 10 (9.4%, 95% CI [7.7, 11.5]) said they knew a lot about the inherent rights of their First Nation, including territory rights and treaty rights; 32.9% (95% CI [30.2, 35.7]) said they had some knowledge, and 38.6% (95% CI [34.7, 42.7]) said they had a little knowledge about the inherent rights of their First Nation.
A slightly higher percentage of First Nations youth reported having knowledge of the history of Indian Residential Schools: 17.4% of youth (95% CI [14.7, 20.5]) reported having a lot of knowledge about the history of Indian Residential Schools, while 27.6% (95% CI [24.4, 31.0]) reported that they had some knowledge, and 31.8% (95% CI [28.5, 35.3]) reported having a little knowledge. Nearly one-quarter of First Nations youth (23.2%, 95% CI [19.2, 27.7]) reported having no knowledge of Indian Residential Schools.
Learning from and about Languages, Traditions, and Cultures
Knowledge and use of a First Nations language
Overall, the majority (82.8%,95% CI [80.4, 85.0]) of First Nations youth aged 12 to 17 reported that they had some knowledge of a First Nations language, even if it was only a few words. Among those who had knowledge of a First Nations language, 26.8% (95% CI [23.2, 30.8]) reported that they could understand it very well or relatively well, and 23.9% (95% CI [17.9, 31.1]) said they could speak it very well or relatively well. Although a large majority of First Nations youth have some knowledge of a First Nations language, only about one-quarter feel that they are strong users of the language.

The National Report of the First Nations Regional Early Childhood, Education, and Employment Survey | 35
Interestingly, 1 in 5 (20.4%, 95% CI [15.5, 26.2]) First Nations youth reported that their mother tongue was a First Nations language, however only 10.8%E (95% CI [6.4, 17.7]) of youth reported that this was the language that they used most often in daily life. While a considerable percentage of youth reported the First Nations language as their mother tongue, fewer are using it in daily life. In addition, only 15.2%E (95% CI [10.4, 21.7]) reported being exposed to a First Nations language at home all of the time, while 15.9% (95% CI [13.5, 18.6]) reported being exposed to this language at home most of the time. In contrast, 41.8% (95% CI [36.7, 47.0]) of youth were exposed to a First Nations language at home only some of the time and 27.2% (95% CI [23.8, 30.8]) were exposed none of the time.
While knowing and using a First Nations language at home is an important aspect of learning outside the classroom, incorporating a First Nations language into the school curriculum can also be an effective method of strengthening the language in a community (Baker, 2006; McCarty, 2003).
According to the FNREEES, a majority of First Nations youth (84.2%, 95% CI [81.8, 86.4]) reported that they had been taught a First Nations language at school. Of those who had been taught a First Nations language at school 16.6% (95% CI [14.3, 19.2]) reported being in a First Nations language immersion program for at least one school year. In addition, 86.4% (95% CI [84.1, 88.3]) agreed or strongly agreed that their school supports First Nations culture.
Sources of support for learning a First Nations language
Among First Nations youth who reported having some knowledge of their First Nations language, the most commonly reported source of support for learning a First Nations language was teachers and school staff (60.8%), followed by grandparents (53.5%), and parents or guardians (49.9%) (See Table 3.2). Only 4.0% of First Nations youth reported that no one helped them learn a First Nations language. According to these numbers, the school, along with parents and grandparents, appears to play a large role in teaching First Nations languages to youth.
Table 3.2. Who helped youth learn a First Nations language and learn about traditional teachings
Learn a First Nations language
% [95% CI]
Learn about traditional teachings
% [95% CI]
Grandparents 53.5 [49.9, 57.0] 52.4 [48.8, 56.0]
Parents or guardians
49.9 [45.4, 54.4] 45.2 [40.6, 49.9]
Teachers/school staff
60.8 [55.4, 65.9] 40.6 [36.9, 44.4]
Elders 27.0 [23.6, 30.7] 36.1 [32.3, 40.0]
Other family members
30.0 [24.9, 35.6] 30.0 [26.4, 33.8]
Community members
16.0 [13.6, 18.7] 19.5 [16.7, 22.6]
Friends 20.4 [15.2, 26.7] 13.1 [11.2, 15.2]
Siblings 16.2E [11.2, 22.8] 8.7 [7.2, 10.5]
Knowledge holders 7.0E [4.6, 10.4] 9.5 [7.3, 12.3]
No one 4.0 [3.1, 5.1] 11.0 [9.2, 13.2]
Other 0.5E [0.3, 0.9] 1.7 [1.5, 2.0]
Note. Respondents could choose more than one response. E High sampling variability, interpret with caution.
Sources of support for learning about traditional teachings
According to the FNREEES, the most commonly reported source of support for learning about traditional teachings (such as beliefs, values, medicines, practices, ceremonies, stories, songs, and other activities) was grandparents (52.4%). Parents or guardians (45.2%), teachers and school staff (40.6%), and Elders (36.1%) were also commonly reported as a source of support for learning traditional teachings. Slightly more than 1 in 10 of First Nations youth (11%) reported that no one helped them learn their traditional teachings. Again, parents, grandparents, and the school, along with Elders, appear to play an important role in helping First Nations youth learn traditional practices.
The sources of support reported by First Nations youth for learning about traditional teachings, including beliefs, values, medicines, practices, ceremonies, stories, songs, and

Now is the Time: Our Data, Our Stories, Our Future 36 |
activities, are described in Table 3.2. Note that respondents could choose more than one source of support.
Satisfaction with knowledge of traditional teachings
When asked about the importance of traditional teachings in their lives, the majority of First Nations youth (78.3%, 95% CI [75.0, 81.4]) said they were somewhat or very important. Furthermore, 63.2% (95% CI [59.3, 67.0]) of First Nations youth were somewhat or very satisfied with their knowledge of traditional teachings, and 36.8% (95% CI [33.0, 40.7]) were not at all or only a little satisfied.
Obstacles to gaining knowledge of traditional teachings
Among those First Nations youth who were not very satisfied with their knowledge of traditional teachings, the most commonly reported obstacles to gaining greater knowledge of traditional teachings were the following:
• “no one available to teach me” (43.1%, 95% CI [39.3, 47.0]),
• “not motivated enough” (40.9%, 95% CI [36.9, 45.0]), and
• “too busy” (29.2%, 95% CI [25.6, 33.0]).
Learning from and about Spirituality
Importance of traditional spirituality
Finally, along with traditional teachings, traditional spirituality appears to be important for many First Nations youth. Nearly two-thirds of First Nations youth (66.1%, 95% CI [62.7, 69.3]) reported that traditional spirituality was somewhat or very important to them.
Learning in School
School performance and enjoyment
Overall, First Nations youth (which includes current and former students) reported performing well in school: 1 in 5 (20%, 95% CI [17.5, 22.7]) reported having mainly A’s on their last report card; 39.8% (95% CI [36.5, 43.2]) reported having mainly B’s; 29.6% (95% CI [26.8, 32.5]) reported mainly C’s; 7.4% (95% CI [6.0, 9.1]) reported mainly D’s; and, 3.2%E (95% CI [1.8, 5.8]) reported mainly E’s or F’s.
When asked about their overall performance on their last report card, 15.7% (95% CI [13.5, 18.1]) of First Nations youth reported that they were above average, 71.2% (95% CI [68.2, 74.1]) reported that they were average, and 13.1% (95% CI [11.1, 15.4]) reported that they were below average.
Furthermore, the majority of First Nations youth (82.6%, 95% CI [80.2, 84.8]) agreed or strongly agreed that they were happy at school and 74.8% (95% CI [71.5, 77.8]) agreed or strongly agreed that most of their fellow students enjoyed being at school as well. The majority of youth appear to have general positive feelings about their school.
School attendance
When First Nations youth were asked the average number of days a month they were typically late for school, 28.4% (95% CI [25.4, 31.6]) said never, 29.1% (95% CI [25.9, 32.4]) said one or two days; 22.5% (95% CI [19.8, 25.4]) said three-to-five days; and 20.1% (95% CI [17.6, 22.9]) said more than five days.
When youth were asked the number of days a month they typically missed school 19.2% (95% CI [16.8, 21.9]) said zero, 34.4% (95% CI [31.2, 37.8]) said one or two days, 27.1% (95% CI [24.0, 30.4]) said three-to-five days, and 19.3% (95% CI [16.6, 22.2]) said more than five days.
A considerable number of First Nations youth (2 in 5) reported that they were late for school more than five days a month, and a considerable number of youth (nearly 20 percent) reported that they missed school more than five days a month.
According to the FNREEES, the most common reason given by First Nations youth for having been late for school was that they slept in (71.7%, 95% CI [67.4, 75.5]). Other responses included problems with transportation (28.0%, 95% CI [23.7, 32.8]) and illness or injury (17.9%, 95% CI [14.4, 21.9]).
The most commonly reported reason for youth to have missed school was illness or injury (56.3%, 95% CI [52.4, 60.2]), followed by sleeping in (43.0%, 95% CI [38.9, 47.3]), the school was closed (28.8%, 95% CI [25.2, 32.6]), and medical appointments (25.8%, 95% CI [22.5, 29.5]).
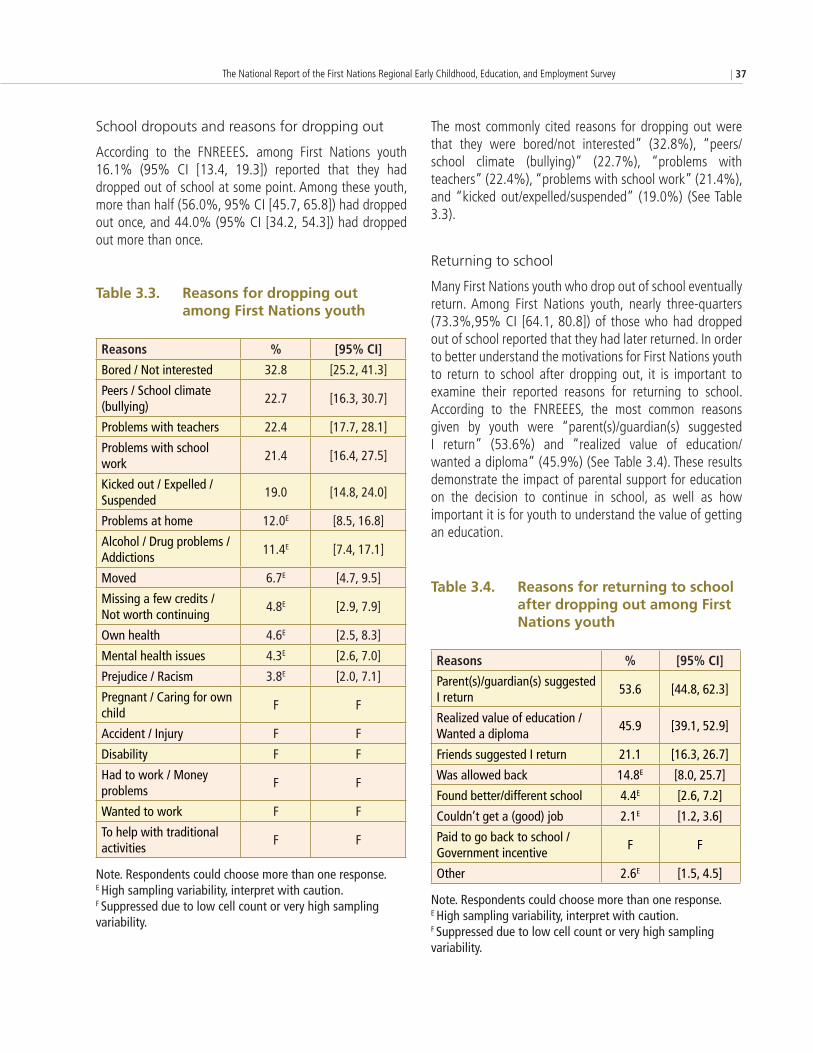
The National Report of the First Nations Regional Early Childhood, Education, and Employment Survey | 37
School dropouts and reasons for dropping out
According to the FNREEES. among First Nations youth 16.1% (95% CI [13.4, 19.3]) reported that they had dropped out of school at some point. Among these youth, more than half (56.0%, 95% CI [45.7, 65.8]) had dropped out once, and 44.0% (95% CI [34.2, 54.3]) had dropped out more than once.
The most commonly cited reasons for dropping out were that they were bored/not interested” (32.8%), “peers/school climate (bullying)” (22.7%), “problems with teachers” (22.4%), “problems with school work” (21.4%), and “kicked out/expelled/suspended” (19.0%) (See Table 3.3).
Table 3.3. Reasons for dropping out among First Nations youth
Reasons % [95% CI]
Bored / Not interested 32.8 [25.2, 41.3]
Peers / School climate (bullying)
22.7 [16.3, 30.7]
Problems with teachers 22.4 [17.7, 28.1]
Problems with school work
21.4 [16.4, 27.5]
Kicked out / Expelled / Suspended
19.0 [14.8, 24.0]
Problems at home 12.0E [8.5, 16.8]
Alcohol / Drug problems / Addictions
11.4E [7.4, 17.1]
Moved 6.7E [4.7, 9.5]
Missing a few credits / Not worth continuing
4.8E [2.9, 7.9]
Own health 4.6E [2.5, 8.3]
Mental health issues 4.3E [2.6, 7.0]
Prejudice / Racism 3.8E [2.0, 7.1]
Pregnant / Caring for own child
F F
Accident / Injury F F
Disability F F
Had to work / Money problems
F F
Wanted to work F F
To help with traditional activities
F F
Note. Respondents could choose more than one response. E High sampling variability, interpret with caution. F Suppressed due to low cell count or very high sampling variability.
Returning to school
Many First Nations youth who drop out of school eventually return. Among First Nations youth, nearly three-quarters (73.3%,95% CI [64.1, 80.8]) of those who had dropped out of school reported that they had later returned. In order to better understand the motivations for First Nations youth to return to school after dropping out, it is important to examine their reported reasons for returning to school. According to the FNREEES, the most common reasons given by youth were “parent(s)/guardian(s) suggested I return” (53.6%) and “realized value of education/wanted a diploma” (45.9%) (See Table 3.4). These results demonstrate the impact of parental support for education on the decision to continue in school, as well as how important it is for youth to understand the value of getting an education.
Table 3.4. Reasons for returning to school after dropping out among First Nations youth
Reasons % [95% CI]
Parent(s)/guardian(s) suggested I return
53.6 [44.8, 62.3]
Realized value of education /Wanted a diploma
45.9 [39.1, 52.9]
Friends suggested I return 21.1 [16.3, 26.7]
Was allowed back 14.8E [8.0, 25.7]
Found better/different school 4.4E [2.6, 7.2]
Couldn’t get a (good) job 2.1E [1.2, 3.6]
Paid to go back to school /Government incentive
F F
Other 2.6E [1.5, 4.5]
Note. Respondents could choose more than one response. E High sampling variability, interpret with caution. F Suppressed due to low cell count or very high sampling variability.

Now is the Time: Our Data, Our Stories, Our Future 38 |
Learning at Home and in the Community
Participation in extracurricular activities
Informal learning opportunities that occur outside the classroom can complement the formal learning of First Nations youth. These activities, which take place at home or in the community, can include: participation in clubs, community groups, recreational activities, and volunteer work (CCL, 2009).
According to the FNREEES, many First Nations youth (71.3%, 95% CI [68.6, 73.8]) said they participated in a sport or physical activity outside of class time; of these youth the majority (78.8%, 95% CI [75.6, 81.6]) participated at least once-a-week.
In addition, nearly one-third (29.3%, 95% CI [26.5, 32.3]) reported participating in an art, drama, or music group or lessons outside of class time, with 69.1% (95% CI [63.8, 73.9]) of those participating at least once-a-week.
Finally, nearly one-quarter (23.7%, 95% CI [21.1, 26.6]) reported participating in a school group or club, such as student council, yearbook, or science club, outside of class. Of these youth, 61.7% (95% CI [56.4, 66.8]) participated in this kind of activity at least once-a-week.
Community involvement through volunteerism
In addition to First Nations youth involvement in extracurricular activities, a high percentage of First Nations youth volunteer in their community. Overall, 41.1% (95% CI [37.7, 44.6]) of youth reported having volunteered in their community. Among those who volunteered, 8.6% (95% CI [6.5, 11.2]) reported volunteering at least once-a-week, 18.6% (95% CI [14.0, 24.3]) volunteered one to three times a month, 28.3% (95% CI [21.4, 36.5]) had volunteered four to 10 times in the year prior to the survey, and 44.5% (95% CI [37.5, 51.7]) had volunteered one to three times in the year prior to the survey.
Support for Classroom Learning
A holistic model of educational success includes learning that occurs within and outside of the classroom setting, and gives equal weight to formal and informal educational experiences. However, it is important to examine the extent to which some of the sources and domains of knowledge
that fall outside the conventional scope of formal education, such as support for culture and parental involvement in education, may actually contribute to classroom learning. This is a complex area of investigation that warrants future research, but preliminary FNREEES results describing these relationships are presented here for both current and former students.
School support for culture and school enjoyment
According to the FNREEES, the extent to which school was perceived by current and former students as being supportive of First Nations culture was significantly related to school enjoyment.
Among First Nations youth who agreed or strongly agreed that their school supports First Nations culture, the majority (84.5%, 95% CI [81.7, 87.0]) agreed or strongly agreed that they felt happy at school, compared to 73.7% (95% CI [67.1, 79.4]) of those who did not think that their school was supportive of First Nations culture.
Similarly, among First Nations youth who agreed or strongly agreed that their school supports First Nations culture, more than three-quarters (76.8%, 95% CI [73.1, 80.1]) agreed or strongly agreed that students at their school enjoyed being there, compared to one-third (63.5%, 95% CI [56.3, 70.1]) of those who did not think that their school was supportive of First Nations culture (See Figure 3.1).
Figure 3.1. Happiness and enjoyment of school among First Nations youth based on perceived support for First Nations culture at school

The National Report of the First Nations Regional Early Childhood, Education, and Employment Survey | 39
A similar pattern was observed when examining the extent to which the school involves parents in school activities. Figure 3.2 depicts a significant relationship between the school’s involvement of parents and youth enjoyment of school. Among First Nations youth who agreed or strongly agreed that the school provides parents opportunities to be involved in school activities, 88.2% (95% CI [85.3, 90.6]) agreed or strongly agreed that they felt happy at school, compared to 67.1% (95% CI [61.8, 72.0]) of those who did not think that their school engaged parents. Similarly, among First Nations youth who agreed or strongly agreed that the school provides parents opportunities to be involved in school activities, 82.1% (95% CI [78.5, 85.2]) agreed or strongly agreed that students at their school enjoyed being there, compared to 55.0% (95% CI [47.9, 61.8]) of those who did not think that their school engaged parents.
Figure 3.2. Youth enjoyment of school by school’s degree of parental engagement
Parents/family speak to or correspond with
teachers
Parents/family attend a school event
Yes% [95% CI]
No% [95% CI]
Yes% [95% CI]
No% [95% CI]
Grade average of 80% or above
23.9
[20.7, 27.5]
10.7E
[7.3, 15.3]
23.9
[20.8, 27.3]
8.7E
[6.1, 12.4]
Above average grades
18.5
[15.6, 21.8]
9.5E
[6.3, 14.1]
18.5
[15.4, 21.9]
7.5E
[5.1, 11.1]
Missed two days or less of school per month
59.1
[54.5, 63.6]
36.3
[29.5, 43.6]
57.9
[53.2, 62.4]
44.5
[38.3, 50.9]
Arrived late two times or less per month
62.6
[58.2, 66.8]
46.7
[37.6, 56.0]
60.9
[56.4, 65.2]52.8
[45.4, 60.0]
Has ever dropped out of school
11.2
[8.8, 14.2]
26.3
[18.9, 35.3]
9.3
[7.0, 12.4]
29.2
[22.9, 36.3]
Family support for education and school performance
A very strong pattern was observed between parental or family support for formal education and school performance. Table 3.5 shows significant relationships between parental involvement variables including speaking to teachers and attending school events and school performance variables, including grades and dropouts.
Note that the relationships between school attendance variables (missing school and being late for school) and parental or family attendance at school events were not significant (i.e., the confidence intervals overlap).
For example, a lower percentage (11.2%) of First Nations youth who agreed or strongly agreed that their parents, guardians, or family members spoke to or corresponded with their teachers reported ever having dropped out of school, compared to 26.3% of those who did not think that their parents/guardians, or family members spoke to or corresponded with their teachers. The results point to the crucial
role that parents and families can play in their children’s formal education. These FNREEES results indicate a positive association between parental involvement in their child’s schooling and better school performance.
Note. E High sampling variability, interpret with caution.
Table 3.5. Parental involvement in school by school performance among First Nations youth

Now is the Time: Our Data, Our Stories, Our Future 40 |
Family support for education and school enjoyment
A positive relationship was also found between parental support for formal education and school enjoyment (See Table 3.6.) The FNREEES results indicate that a higher percentage of youth are happy at school and perceive that students enjoy being at school among those who report having greater parental or family involvement in their schooling.
DISCUSSION
An examination of First Nations youths’ sources and domains of knowledge and lifelong learning journey provides a holistic picture of the current state of learning among youth living on reserve and in northern First Nations communities. This holistic picture points to existing areas of strength for First Nations education and provides insight into areas where increased attention and resources may enhance First Nations learning.
Sources and Domains of Knowledge
Results from FNREEES indicate strong learning taking place from sources and domains of knowledge that come from outside the classroom. First Nations youth feel that they have a good base of general support from friends and family and receive strong support from their families for both formal and informal learning.
Many First Nations youth have at least some knowledge of the history and rights of their First Nation and the majority (more 80%) have some knowledge of a First Nations language. Furthermore, many First Nations youth take part
in traditional cultural activities, have some knowledge of traditional teachings, and feel that traditional spirituality is important in their lives. They are learning not only from schoolteachers but also from grandparents, parents and guardians, Elders, and community members.
These are all very positive findings that indicate that the majority of young people living on reserve and in northern First Nations communities are learning about their history, culture, and language and are supported by their families and communities. Some youth, however, report that they do not have a lot of knowledge about the history and rights of their people; some are not taking part in traditional activities; and although most have some knowledge of their First Nations language, many are not using it in their daily life.
When asked directly, the majority (nearly 80%) did report that learning about traditional teachings is somewhat or very important to them. Furthermore, more than one-third of youth indicated that they were not satisfied with their knowledge of traditional teachings. The most commonly reported obstacle to learning about traditional teachings was that no one was available to teach them.
It is therefore important to continue to build on the strengths identified by First Nations youth in the FNREEES. The results show that youth are primarily learning from grandparents and parents or guardians, as well as from Elders and community members. This indicates that the lines of communication must remain open between youth and their families and communities. The school may also be an important vehicle for strengthening First Nations language and culture.
Parents/family speak to or correspond with teachers
Parents/family attend a school event
Yes% [95% CI]
No% [95% CI]
Yes% [95% CI]
No% [95% CI]
Feeling happy at school
85.2
[82.1, 87.9]
75.6
[70.0, 80.5]
86.7
[83.5, 89.3]
75.2
[70.4, 79.4]
Enjoy being at the school
77.6
[73.7, 81.0]
67.2
[60.0, 73.6]
78.5
[74.5, 82.0]
67.9
[62.1, 73.2]
Table 3.6. Family support for First Nations youth’s education and school enjoyment

The National Report of the First Nations Regional Early Childhood, Education, and Employment Survey | 41
Although a First Nations language is not commonly used at home, many First Nations youth reported learning the language at school, and many reported that schoolteachers are among the main sources of support both for learning the language and for learning about traditional teachings.
Furthermore, the majority of First Nations youth report feeling like their parents or guardians and families are involved in their formal education and that the school in their community involves parents in school activities. Given the strong association between parental involvement and school achievement and enjoyment, these are important findings. For youth who feel that their parents are not fully engaged in their education, an increased focus on parental involvement in the school may be key to their educational success.
Lifelong Learning
Lifelong learning for First Nations youth consists of learning within and outside of the classroom (CCL, 2009). Consistent with the findings discussed previously, learning that is occurring outside the classroom is strong among First Nations youth, indicating that young people are engaged in, and learning from, their communities. Many First Nations youth are participating in extracurricular activities, and more than 40% are volunteering in their communities.
Inside the classroom, many First Nations youth report strong classroom performance with approximately 60% reporting having mainly A’s or B’s on their last report card, and fewer than 4% indicating that they were failing. Most First Nations youth are happy at school and report that other students at school enjoy being there. School attendance appears to not be a problem for many students.
Still, some First Nations youth report high numbers of school absences. About 1 in 5 youth reported missing school more than five days a month. Similarly, about 1 in 5 youth reported being late for school more than five days a month. For these youth, it is particularly important to examine the reasons they report for missing school, which are most commonly that they slept in, were ill, or were injured.
In addition, approximately 16% of First Nations youth had dropped out of school at some point in their lives. This finding warrants an examination of their reasons
for dropping out. Common reasons were boredom and problems with peers, teachers, and schoolwork. Focusing on improving the school climate, engaging students, and providing support for schoolwork, both at school and at home, may be methods for preventing school dropouts.
Finally, it is especially important to examine the responses of youth who have dropped out of school and eventually returned. One of the most positive results described in this chapter is that out of those who had ever dropped out of school, nearly three-quarters eventually returned. Their decision to return appears to be primarily the result of parental encouragement and realizing the value of an education. These findings point to areas of intervention for encouraging First Nations youth who have left school to return. Again, parental involvement in and support for education appears to be crucial for school success.
Support for Classroom Learning
Although a comprehensive analysis of the relationship between informal and formal learning was not conducted in this chapter, preliminary results indicate a positive association between certain sources and domains of knowledge from outside the classroom and formal classroom learning. Results show that the partnership between the school and the community may be key to school enjoyment. If a school is supportive of First Nations culture and actively involves parents in school activities, First Nations youth report being happier at school and that other students at the school enjoy being there.
Perhaps the most striking results described in this chapter are the consistently positive and significant relationships between parental involvement in school and school achievement, school attendance, and school enjoyment. Perceiving that one’s parents, guardians, or family members talk to one’s teachers and attend school events was consistently associated not only with better school attendance and staying in school but also with getting good grades and feeling happy at school. The conclusion here is that support from outside the classroom, especially support from parents or guardians and family members could be crucial for success inside the classroom among First Nations youth.

Now is the Time: Our Data, Our Stories, Our Future 42 |
CONCLUSION
Using the Holistic Lifelong Learning Measurement Framework as a guide, the FNREEES results for First Nations youth were presented to provide information on the formal and informal educational experiences of First Nations youth. The results have highlighted the strength of the informal learning taking place among youth, as well as the importance of this informal learning for formal classroom learning. In particular, community, parent, and family involvement in education appears to be key to success in school. Combined with future research on factors that impact learning and achievement among First Nations youth, the FNREEES results can help inform interventions designed to support and enhance First Nations education.
REFERENCES
Baker, C. (2006). Foundations of bilingual education and bilingualism (4th ed.). Clevedon, UK: Multilingual Matters.
Canadian Council on Learning. (2009). The state of Aboriginal learning in Canada: A holistic approach to measuring success. Ottawa, Ontario.
First Nations Information Governance Centre. (2012). First Nations Regional Health Survey (RHS) Phase 2 (2008/10) National report on adults, youth and children living In First Nations communities. Ottawa: The First Nations Information Governance Centre.
McCarty, T. L. (2003). Revitalising indigenous languages in homogenising times. Comparative Education, 39, 147–63.
Statistics Canada. (2006). Aboriginal Peoples Survey 2006.

The National Report of the First Nations Regional Early Childhood, Education, and Employment Survey | 43
Youth Employment, Culture, and Well-Being
EXECUTIVE SUMMARY
In this chapter, the First Nations Holistic Lifelong Learning Model is used to examine employment and education conditions among First Nations youth living on reserve and in northern First Nations communities.
Data for this chapter are taken from the FNREEES youth survey, which involved those aged 12- to 17-years. Descriptive analysis was used to examine relationships between variables, including employment, education, life balance (physical, mental, emotional, and spiritual), self-rated mental health, and the importance of family, culture, and language.
Although First Nations youth face a unique and significant set of challenges compared to the general population in Canada, findings from the FNREEES paint a fairly positive picture when it comes to those living on reserve and in northern communities. For example, the majority of First Nations youth reported average to excellent work-related skills, including using a computer, oral communication, reading, writing, and math. More than half reported a high level of life balance, and most reported good to excellent self-rated mental health. With respect to culture and language, approximately half of First Nations youth reported that being able to understand and speak a First Nations language was very important, and most felt it was important to know about traditional teachings.
As the fastest growing demographic in the country, First Nations youth have the potential to play a significant role in the Canadian workforce. According to the 2006 Census, the First Nations population grew three-and-a-half times faster than the general population (Assembly of First Nations [AFN], 2012). Therefore, it is necessary to support culturally relevant educational programs that ensure success and a subsequent smooth transition into meaningful employment that fosters overall well-being and lifelong learning.
KEY FINDINGS
• Approximately 1 in 5 (17.6%) of First Nations youth (12–17) were currently working at the time of survey completion. Of those, 43.7% worked less than 10 hours per week. Breaking it down by age group, there were more youth aged 12 to 14 working (25.0%) than those aged 15 to 17 (12%), and 30.4% of 15- to 17-year-olds were currently looking for work.
• The majority (88.9%) of First Nations youth (12–17) reported that their job skills (i.e., using a computer, oral communication, reading, writing, math) were either excellent (31.3%) or average (57.6%).
• The majority of First Nations youth (88.2%) believed that it was very important to their mothers or female guardians that they graduate from high school, compared to their fathers or male guardians (81.1%). Overall, a slightly lower percentage of youth reported that their parents believed it was very important that they obtain post-secondary education, and again more youth believed it was very important to their mothers (75.2%) than believed it was very important to their fathers (66.8%).
• Half of First Nations youth (50.4%) reported a high level of life balance (a composite measure of self-rated physical, mental, emotional, and spiritual well-being). The large majority of youth (90.5%) reported their self-rated mental health as either excellent, very good, or good.
• More than half of First Nations youth (53.1%) believed that it was very important to be able to understand a First Nations language, and 50.3% believed it was very important to speak a First Nations language.
• While one-quarter of First Nations youth reported an intermediate or fluent level of proficiency (26.9% for understanding, 23.8% for speaking) many more could understand or speak only a few words (42.9% and 48.2%, respectively).
• More than two-thirds (70.1%) of First Nations youth who reported excellent proficiency in a First Nations language also reported a high level of life balance,
CHAPTER 4

Now is the Time: Our Data, Our Stories, Our Future 44 |
compared to 48.3% for First Nations youth who reported good proficiency, 51.6% for those who reported fair, and 45.4% for poor.
• More than three-quarters of First Nations youth (78.4%) felt that it was important or somewhat important to know about traditional teachings; only 6.0% said it was not important.
INTRODUCTION
First Nations youth employment and employment-related themes are part of a complex landscape influenced by multiple factors, including: historical context, systemic inequities, access to post-secondary education, employment opportunities, gender, use of information technology, and other socio-economic dynamics (FNIGC, 2012; Howard, Edge, & Watt, 2012; Looker & Thiessen, 2004; Maxim & White, 2006; Taylor, Friedel, & Edge, 2009).
Systemic barriers for First Nations people have contributed to a gap in employment rates and work opportunities between First Nations and non-First Nations populations in Canada. The employment rate for working-aged First Nations who lived on reserve in 2011 was 55%, compared to 76% for the general working-age population in Canada (Indigenous and Northern Affairs Canada [INAC], 2013).
It is a well-known fact that First Nations youth are the fastest-growing demographic in the country. According to the 2006 Census, the First Nations population grew three-and-a-half times faster than the general population (AFN, 2012). As such, if the existing employment gap between First Nations and the general Canadian population does not decrease, the implications with regard to individual and community well-being for First Nations communities could be damaging.
As one of the 94 calls to action in its final report the Truth and Reconciliation Commission of Canada called upon the federal government to “develop with Aboriginal groups a joint strategy to eliminate educational and employment gaps between Aboriginal and nonAboriginal Canadians”
(Truth and Reconciliation Commission of Canada, 2015, p. 196). The FNREEES process and analysis of employment data from the survey represent an important step towards a better understanding of the causes of—and ultimately the solutions for—this gap for First Nations people.
This chapter uses data from the FNREEES youth survey to examine employment, education, measures of well-being, and the roles that family, culture, and language play. It uses the First Nations Holistic Lifelong Learning Model as a guiding framework. This model reflects the connections and delicate balance that exist between individuals, families, and communities within the context of an Indigenous world view. Therefore, we cannot separate youth from their families and other influences. The model further stresses that youth are on a continuum of learning and growing that carries on well into adulthood. This chapter provides a strengths-based overview of findings that takes historical and cultural context into account.
METHODS
This chapter is based on analyses of data from the FNREEES completed by First Nations youth aged 12 to 17.
Several composite variables were created by combining responses to multiple survey questions that addressed the same theme and used the same response categories. For example, in order to gain a more holistic sense of the degree to which respondents felt that there was balance in their lives, the composite variable life balance was created by combining questions about physical, mental, emotional, and spiritual balance.
The variables examined in this chapter, including descriptions of composite variables and response categories, are presented in Table 4.1. Most results reflect survey data for the entire youth population (ages 12 to 17), however some reflect a subpopulation of 15- to 17-year-olds where employment-related questions were asked uniquely to them.

The National Report of the First Nations Regional Early Childhood, Education, and Employment Survey | 45
Variable Description Categories
EMPLOYMENT
Currently working
Are you currently working at a job or business for pay (wages, salary, self-employed)?Note this does not include those who are off work and will return to work.
Yes/No
Currently looking for workAre you currently looking for work? (15- to 17-year-olds only)
Yes/No
Hours worked per weekComposite variable combining (a) paid hours of work on weekdays, and (b) paid hours of work on weekends.
Number of hours
Job abilities
Composite variable combining self-rated abilities related to (a) using a computer, (b) oral communication, (c) reading, (d) writing, and (e) math. Answer categories ranged from Poor (1) to Excellent (5)
Summed scores: Low (<12), Moderate (12–18), High (>18)
Importance of education to parents or guardians
Four questions about the importance of completing high school and post-secondary education to father/male guardian and mother/female guardian
Very, Fairly, Slightly, Not at all
WELL-BEING
Self-rated mental health In general, would you say your mental health is…? Excellent, Very good, Good, Fair, Poor.
Life balance
Composite variable combining questions about being in balance in the four aspects of life: (a) physical, (b) mental, (c) emotional, and (d) spiritual. Answer categories ranged from None of the time (1) to All the time (5).
Summed scores: Low (<11), Moderate (11–15), High (>15)
Social support
Composite variable combining questions about having someone in your life (friends, family, etc.) to help when something goes wrong; feel safe, secure, and happy; turn to for advice; feel comfortable talking with about problems; count on in times of trouble. Answer categories ranged from Strongly disagree (1) to Strongly agree (4).
Summed scores: Low (<11), Moderate (11–15), High (>15)
LANGUAGE AND CULTURE
Language proficiencyFour questions about the self-rated ability to understand, speak, read, and write a First Nations language
Fluent, Intermediate, Basic, Only a few words, Cannot understand
Importance of knowing a language
Four questions about the importance of understanding, speaking, reading, and writing a First Nations language
Very, Somewhat, A little, Not at all
Satisfaction with knowledge of language
How satisfied are you with your knowledge of a First Nations language?
Very, Somewhat, A little, Not at all
Importance of traditional teachings
Importance of knowing and learning about the traditional teachings of your people (beliefs, values, medicines, practices, ceremonies, stories, songs, activities)
Very, Somewhat, A little, Not at all
Importance of spirituality How important is traditional spirituality in your life? Very, Somewhat, A little, Not at all
Table 4.1. Key variables

Now is the Time: Our Data, Our Stories, Our Future 46 |
RESULTS
Youth Employment
According to the FNREEES, 17.6% (95% CI [15.6, 19.8]) of First Nations youth aged 12 to 17 were working at the time of the survey, with nearly half (43.7%, 95% CI [36.1, 51.5]) working less than 10 hours per week. Fewer 15- to 17-year-olds (12.0%, 95% CI [9.6, 14.9]) were currently working than 12- to 14-year olds (25.0%, 95% CI [21.3, 29.1]).
However, it should be noted that among the younger sub-population (12 to 14) who said they were working, the large majority (90.5%, 95% CI [86.9, 93.3]) were working at “odd jobs” such as babysitting or shovelling snow; only 1 in 10 (9.5%) were working for an employer or working both at an odd job and for an employer.
Among those First Nations youth aged 15 to 17, nearly one-third (30.4%, 95% CI [26.2, 34.8]) reported they were looking for work (See Table 4.2).
Among 15- to 17-year-olds, no gender differences were found between those who were working for pay and those who were looking for work. Youth aged 12 to 14 were not asked whether they were currently looking for work. Among 15- to 17-year-olds who were not working, 66.0% (95% CI [59.7, 71.7]) reported that the main reason was their current enrolment in school or other training. Youth aged 12 to 14 were not asked this question.
Table 4.2. Employment patterns among First Nations youth, by age and gender
The majority of 15- to 17-year-olds who were working either strongly agreed (25.8%, 95% CI [20.0, 32.7]) or agreed (69.4%, 95% CI [62.7, 75.4]) that overall they were happy at work.
In terms of abilities required for a job (which included using a computer, oral communication, reading, writing, and math skills) most youth self-rated these combined abilities as excellent (31.3%, 95% CI [28.5, 34.2]) or average (57.6%, 95% CI [54.6, 60.5]). Slightly more than 1 in 10 (11.1%, 95% CI [9.0, 13.7]) self-rated these abilities as “poor”.
Often the home environment and parental expectations can play a major role in a young person’s educational attainment. According to the FNREEES, the perceived attitudes of mothers of First Nations youth was different than those of their fathers.
Among First Nations youth, 88.2% (95% CI [86.4, 89.8]) believed that graduating from high school was very important to their mothers (or female guardians) while 81.1% (95% CI [78.5, 83.4]) believed it was very important to their fathers (or male guardians). This difference was statistically significant.
A similar pattern was found when it came to parental attitudes towards post-secondary completion. A significantly higher percentage of youth (75.2%, 95% CI [72.5, 77.7]) reported that it was very important to their mothers (or female guardians) that they complete a post-secondary education, compared to 66.8% (95% CI [63.4, 70.0]) when it came to their fathers (or male guardians).
Well-Being
When it came to the issue of mental health, the large majority of First Nations youth (90.5%) reported having either excellent (27.8%, 95% CI [24.2, 31.6]), very good (34.5%, 95% CI [30.8, 38.5]), or good (28.2%, 95%CI [25.1, 31.5]) self-rated mental health (See Figure 4.1). No significant difference was found for this variable between youth who were currently working and those who were not.
Age Gender
12–14 years 15–17 years Male Female
Currently working25.0
[21.3, 29.1]12.0
[9.6, 14.9]17.3
[14.5, 20.5]18.0
[15.0, 21.4]
Currently looking for work
-[-]*
30.4[26.2, 34.8]
32.8[26.0, 40.3]
27.4[23.1, 32.1]
Note. *Youth aged 12 to 14 years were not asked this question.

The National Report of the First Nations Regional Early Childhood, Education, and Employment Survey | 47
Figure 4.1. Self-rated mental health among First Nations youth
Half of First Nations youth (50.4%, 95% CI [47.4, 53.5]) reported having a high level of life balance, a composite measure of the frequency with which they felt in balance physically, mentally, emotionally, and spiritually. While
43.8% (95% CI [40.6, 47.0]) reported having a moderate level of life balance (See Figure 4.2). No significant difference was found for this variable between youth who were currently working and those who were not.
Figure 4.2. Life balance (physical, mental, emotional, spiritual) among First Nations youth
Another measure of well-being for First Nations youth is social support, a composite measure that includes whether youth have people in their lives who they can: talk to about problems, turn to for advice, or help them in times of trouble and help them feel safe.
The large majority of First Nations youth reported having either a high (36.5%, 95% CI [33.5, 39.6]) or moderate
(61.9%, 95% CI [58.8, 64.9]) level of social support. The proportion of youth with a high level of social support was notably larger for youth who were working (45.1%, 95% CI [39.0, 51.3]) than for youth who were not (34.9%, 95% CI [31.4, 38.6]) (See Figure 4.3).

Now is the Time: Our Data, Our Stories, Our Future 48 |
Figure 4.3. Social support by employment status among First Nations youth
Note. E High sampling variability, interpret with caution. F Suppressed due to low cell count or very high sampling variability.
Language and Culture
The majority of First Nations youth (82.8%, 95% CI [80.4, 85.0]) reported having some knowledge of a First Nations language. Approximately half of First Nations youth believed being able to understand (53.1%, 95%
CI [48.9, 57.2]) or speak (50.3%, 95% CI [45.9, 54.7]) a First Nations language was very important while fewer believed that being able to read (38.3%, 95% CI [33.7, 43.1]) or write (38.8%, 95% CI [34.2, 43.6]) a First Nations language was very important (See Figure 4.4)
Figure 4.4. Importance of understanding, speaking, reading, and writing a First Nations language among First Nations youth

The National Report of the First Nations Regional Early Childhood, Education, and Employment Survey | 49
Though actual proficiency in a First Nations language was low among First Nations youth, overall it was significantly higher when it came to understanding and speaking the language than it was for reading and writing (See Figure 4.5). Among youth who reported having knowledge of a First Nations language, nearly half reported being able to understand (42.9%, 95% CI [37.4, 48.5]) and
speak (48.2%, 95% CI [42.6, 53.8]) only a few words; while roughly one quarter reported being fluent or at an intermediate level of proficiency. When it came to reading and writing, even fewer youth were proficient (fluent or at an intermediate level) with 27.0% (95% CI [22.9, 31.6]) unable to read, and 32.3% (95% CI [27.9, 37.0]) unable to write any words at all in a First Nations language.
Figure 4.5. Proficiency in understanding, speaking, reading, and writing a First Nations language among First Nations youth
Among First Nations youth who reported having some knowledge of a First nations language, more than half reported being either very (30.6%, 95% CI [27.9,
33.5]) or somewhat (23.0%, 95% CI [17.6, 29.4]) satisfied with their knowledge of that language (See Figure 4.6).
Figure 4.6. Satisfaction with knowledge of a First Nations language among First Nations youth

Now is the Time: Our Data, Our Stories, Our Future 50 |
More than half (53.1%, 95% CI [49.8, 56.3]) of First Nations youth reported participating in First Nations cultural activities, with one third of them (33.3%, 95% CI [28.8, 38.1]) participating less than once a month, almost
one third (30.7%, 95% CI [27.1, 34.5]) participating one to three times per month, and the rest participating once or more per week (Figure 4.9).
When it came to traditional teachings, approximately half of First Nations youth reported that knowing and learning about traditional teachings was very important (50.5%,
95% CI [46.5, 54.4]), while more than one-quarter reported that it was somewhat important (27.9%, 95% CI [24.6, 31.4]; Figure 4.7).
Figure 4.7. Importance of knowing and learning about traditional teachings among First Nations youth
These results also showed that one-third of First Nations youth (33.9%, 95% CI [30.7, 37.2]) believed traditional spirituality to be very important and one-third (32.2%,
95% CI [29.4, 35.1]) believed it to be somewhat important (See Figure 4.8).
Figure 4.8. Importance of traditional spirituality among First Nations youth

The National Report of the First Nations Regional Early Childhood, Education, and Employment Survey | 51
Figure 4.9. Frequency of participation in First Nations cultural activities among First Nations youth
A significantly higher percentage of First Nations youth (70.1%, 95% CI [58.5, 79.5]) who reported excellent proficiency in a First Nations language reported higher
levels of life balance compared to First Nations youth at lower levels of language proficiency (See Figure 4.10).
Figure 4.10. Life balance measured by proficiency in First Nations language among First Nations youth
Note. E High sampling variability, interpret with caution. F Suppressed due to low cell count or very high sampling variability.

Now is the Time: Our Data, Our Stories, Our Future 52 |
DISCUSSION
Job-Related Skills
According to the FNREEES, when First Nations youth (aged 12 to 17) were asked to rate themselves on various job-related skills (such as using a computer, oral communication, reading, writing, and mathematics) more than half rated their skills as average (57.6%) and nearly one-third rated themselves as excellent (31.3%).
From Education to Employment
Analyses of the FNREEES show that 17.6% of First Nations youth reported that they were working at the time of the survey, with two fifths of them (43.7%) working less than 10 hours per week.
The data showed that there was no significant difference in life-balance between First Nations youth who were currently working and those who were not. A multivariate analysis to better understand the relationship between employment, life-balance, and well-being for First Nations youth living on reserve and in northern communities may be informative.
Similar percentages of male and female youth aged 12 to 17 were currently working at the time of the survey. Among youth aged 15 to 17, slightly more males were currently looking for work (32.8%) compared to females (27.4%). This could be related to higher academic success rates and educational attainment among First Nations women, as seen in the FNREEES adult survey results where the percentage of males who did not complete high school was found to be higher than that of females (46.3% and 34.7%, respectively). As well, the percentage of males who completed post-secondary education was lower than that of females (28.9% and 37.9%, respectively) (See Chapter 5).
One possible interpretation of this is that girls may place a higher priority on education than boys, and may aspire to get jobs that require more education. It is also possible that young First Nations males may feel it is their social role to earn money as they enter into adulthood.
Thiessen (2001) found that some First Nations youth do not think that education is relevant to future employment and determined that this attitude is more common among those with lower grades. The author suggests that these lower grades are associated with higher dropout rates and ultimately poorer labour outcomes. Interestingly, young First Nations women have been shown to achieve higher grades than their male counterparts (Statistics Canada, 2013), have overall better academic success, enjoy school more, and have higher employment aspirations. Yet their employment outcomes are consistently lower when compared to that of their male counterparts (FNIGC, 2012).
This could be attributed to the expectation that women care for children or other family members (INAC, 2015a), or to the nature of seasonal employment activities on some reserves that are typically performed by men (CMEC, 2012; McIvor et al., 2009).
Family and Social Support
The FNREEES results show that the majority of First Nations youth said that their parents (or guardians) felt strongly that they should complete high school; though it was more common for mothers or female guardians (88.2%) than for fathers or male guardians (81.1%).
When it came to post-secondary education, a lower percentage of First Nations youth reported that their parents or guardians believed it was very important that they complete a post-secondary education: three-quarters (75.2%) for mothers or female guardians compared to 66.8% of fathers or male guardians. These results suggest that mothers and female guardians of First Nations youth play a greater role in encouraging and influencing educational attainment for their children than fathers or male guardians. Given the strong influence that parents have on their children in general it is important to consider family and community when creating programs that promote education and employment skills for youth, if you wish to have lasting results. Women’s roles in families and communities may be particularly important in this regard (Ciceri & Scott, 2006).
One measure of youth well-being analyzed in the FNREEES was the presence and role of social support networks.

The National Report of the First Nations Regional Early Childhood, Education, and Employment Survey | 53
According to the survey findings, the overwhelming majority of First Nations youth (98.4%) reported having either moderate (61.9%) or high (36.5%) levels of social support. Interestingly, the proportion of youth with a high level of social support was larger for youth who were working (45.1%), compared to youth who were not (34.9%).
In a labour force report from Atlantic Canada for which First Nations (Mi’kmaq and Maliseet) and Inuit community members were interviewed, family support was deemed to contribute more to the success of the study’s participants than any other community, institutional, or individual variable (Bruce, Marlin, & Doucette, 2010). Results from the RHS 2008/10 showed that First Nations youth looked to parents for support when they had a problem (FNIGC, 2012).
The same survey determined that youth who had been negatively impacted by the intergenerational effects of residential schools had lower levels of parental support (FNIGC, 2012). While First Nations youth may not have personally attended an Indian Residential School, FNREEES data indicated that more than 80% of First Nations adults said that they or at least one family member had. As Crooks et al. (2009) explain one cannot look at negative socio-economic statistics for First Nations youth without keeping in mind the intergenerational trauma associated with colonization, forced assimilation, and the lasting legacy of residential schools. In keeping with a strengths-based approach, it is important to focus on “developing assets that are known protective factors, such as strong relationships, life skills, and school connectedness” (Crooks et al., 2009, p. 2). According to the RHS 2008/10, immediate and extended family play a primary role in building First Nations youths’ understanding of culture, therefore it is essential that this instructional role be encouraged (FNIGC, 2012).
Language, Culture, and Well-Being
The perceived importance of First Nations language is clearly seen in the FNREEES results. Language, which has often been referred to as the “conveyer of culture” (Kirmayer, Brass, & Tait, 2000), has been linked directly to mental, physical, spiritual, and emotional well-being; which translate into other positive outcomes, including higher levels of employment and community well-being. The maintenance of Indigenous languages is believed to be
vital to the cultural continuity and persistence of Indigenous people (National Collaborating Centre for Aboriginal Health [NCCAH], 2009–2010).
Results from the RHS 2008/10 show that First Nations youth who participated in community events most of the time reported higher levels of support and self-esteem (FNIGC, 2012). For First Nations people, these factors are part of a continuum and consist of whatever teachings—positive or negative—they have acquired from youth into adulthood. The Report of the Royal Commission on Aboriginal Peoples explains that “if youth are solidly grounded in their Aboriginal identity and cultural knowledge, they will have strong personal resources to develop intellectually” (RCAP, 1996, p. 435). Results from the FNREEES seem to support this view. When First Nations youth were asked how often they felt balanced in each of the four aspects of their lives (physical, mental, emotional, and spiritual), those with an “excellent” level of proficiency in a First Nations language more often reported a high level of life balance, compared to those with lower levels of proficiency.
Analyses of the FNREEES data revealed that more than three-quarters of youth (78.4%) felt it was important or somewhat important to know about traditional teachings; only 6.0% said they were not important. Findings from the RHS 2008/10 showed that 85.7% of First Nations youth felt that traditional cultural events were very important or somewhat important in their lives. This value was higher than in the RHS 2002/03, where only 54.8% of First Nations youth felt similarly (FNIGC, 2012). In the First Nations Holistic Lifelong Learning Model, language, traditions, and ceremonies are part of the roots that comprise some of the sources and domains of knowledge. Indigenous knowledge contributes in significant ways to an individual’s approach to learning, to their knowledge base, and to their sense of identity and belonging; thus, it is a key aspect of well-being for First Nations people.
CONCLUSIONS
As the fastest-growing demographic in the country, First Nations youth have an important role to play in meeting future employment demands (Canadian Chamber of Commerce, 2012; NCCAH, 2009–2010). The FNREEES revealed positive findings for youth on reserve and in

Now is the Time: Our Data, Our Stories, Our Future 54 |
northern First Nations communities with regard to culture, health, and well-being, suggesting a promising future for this rapidly growing demographic.
Incorporating First Nations culture and language into formal education is increasingly acknowledged as being essential for the success and well-being of First Nations students and a fundamental component of lifelong learning and future employment (Battiste, 2002; FNIGC, 2012). There are already encouraging practices in many schools throughout the country that offer coursework that includes Elder involvement, spiritual teachings, First Nations languages, and teaching practices based on traditional ways of knowing (Bell et al., 2004; Mendelson, 2009).
The further development of programs that are more culturally sensitive and teach practical job skills, such as the First Nations and Inuit Summer Work Experience Program (INAC, 2015b), may help decrease high school dropout rates and increase the proportion of students who are able to engage in post-secondary education. Additionally, making university education more accessible (such as with online distance learning in remote communities) and more culturally relevant, could increase the number of First Nations students who attend (Kapsalis, 2006). Moreover, apprenticeship programs for First Nations youth, such as B.C. Hydro’s Youth Hires Program, enable youth to transition to the workforce by shadowing employees to learn their trade (Howard et al., 2012).
The FNREEES provides a unique opportunity to investigate how employment, culture, and well-being are connected to each other for First Nations youth living on reserve and in northern First Nations communities. Interpretation of these data is supported by an understanding of the First Nations Holistic Lifelong Learning Model, which recognizes a continuum beginning with the individual young person who evolves and learns through interactions with their family, community, and society. It also recognizes the economic, political, societal, and spiritual components of both individual and collective well-being.
This chapter presents data on youth employment, education, culture, and well-being, positioning each according to a First Nations perspective and worldview as reflected in the First Nations Holistic Lifelong Learning Model. Further, a strengths-based perspective recognizes that despite intergenerational trauma, systemic racism, and inequalities resulting in lower educational attainment and poorer employment outcomes, First Nations youth have maintained relatively positive outcomes with regard to their levels of mental health and life balance. They value their traditional language and culture, and value family support and guidance as they move through the life course.

The National Report of the First Nations Regional Early Childhood, Education, and Employment Survey | 55
REFERENCES
Assembly of First Nations. (2012). A portrait of First Nations and education. Chiefs Assembly on Education. Palais de Congres de Gatineau. Oct 1–3, 2012. Gatineau, QC. Retrieved from: http://www.afn.ca/uploads/files/events/fact_sheet-ccoe-3.pdf
Battiste, M. (2002). Indigenous knowledge and pedagogy in First Nations education: A literature review with recommendations. Ottawa, ON: Indian and Northern Affairs Canada. Retrieved from: www.ainc-inac.gc.ca/pr/pub/krw/ikp_e.html
Bell, D. et al. (Eds.). (2004). Sharing our success: Ten case studies in Aboriginal schooling. Kelowna: Society for the Advancement of Excellence in Education (SAEE). Retrieved from: http://www.saee.ca
Bruce, D., Marlin, A., & Doucette, M.B. (2010). The Atlantic Aboriginal post-secondary labour force. Dartmouth, NS: Atlantic Policy Congress of First Nations Chiefs Secretariat.
Canadian Chamber of Commerce. (2012). Preparing Canada’s youth for the jobs of tomorrow. Economic Policy Series. Retrieved from: http://www.chamber.ca/download.aspx?t=0&pid=d7c0b24c-9bae-e211-8bd8-000c291b8abf
Ciceri, C., & Scott, K. (2006). The determinants of employment among Aboriginal peoples. In J.P. White, Wingert, S., & Maxim, P. (Eds.). Aboriginal policy research: Moving forward, making a difference, Volume 3 (3–34). Toronto, ON: Thompson Educational Publishing.
Council of Ministers of Education Canada. (2012). Literature review on factors affecting the transition of Aboriginal youth from school to work. Toronto, ON. Retrieved from: http://www.cmec.ca/Publications/Lists/Publications/Attachments/298/Literature-Review-onFactors_EN.pdf
Crooks, C.V., Chiodo, D., Thomas, D., Burns, S., & Camillo, C. (2009). Engaging and empowering Aboriginal youth: A toolkit for service providers. Retrieved from: http://master.fnbc..info/sites/default/files/resource-files/Engaging%20and%20Empowering%20Aboriginal%20Youth%20-%20Toolkit%20for%20Service%20Providers_0.pdf
First Nations Information Governance Centre. (2012). First Nations Regional Health Survey (RHS) Phase 2 (2008/10): National report on adults, youth and children living in First Nations communities. Ottawa, ON: First Nations Information Governance Centre.
Howard, A., Edge, J., & Watt, D. (2012). Understanding the Value, Challenges, and Opportunities of Engaging Métis, Inuit, and First Nations Workers. Ottawa, ON: Conference Board of Canada. http://www.otec.org/Files/pdf/Understanding-The-Value-of-Hiring-Aboriginal-Worke.aspx
Indigenous and Northern Affairs Canada. (2013). Fact Sheet—2011 National Household Survey Aboriginal demographics, educational attainment and labour market outcomes. Retrieved from: https://www.aadnc-aandc.gc.ca/eng/1376329205785/1376329233875
Indigenous and Northern Affairs Canada. (2015a). Aboriginal Peoples Survey 2012: Gender difference in offreserve First Nations education and employment. Retrieved from: https://www.aadnc-aandc.gc.ca/eng/1421860565610/1421860622523
Indigenous and Northern Affairs Canada. (2015b). First Nations and Inuit Summer Work Experience Program. Retrieved from: https://www.aadnc-aandc.gc.ca/eng/1100100033610/1100100033615
Kapsalis, C. (2006). Occupational and skill parity of Aboriginal Canadians. Canadian Employment Research Forum. May 25, 2006. Retrieved from: http://www.cerforum.org/conferences/200605/papers/Kapsalis-Cerf-Present13b.pdf

Now is the Time: Our Data, Our Stories, Our Future 56 |
Kirmayer, L.J., Brass, G.M., & Tait, C.L. (2000). The mental health of Aboriginal peoples: Transformations of identity and community. Canadian Journal of Psychiatry, 45(7), 607-616.
Looker, D., & Thiessen, V. (2004). Aspirations of Canadian youth for higher education. Ottawa, ON: HRSDC. Retrieved from: http://www.pisa.gc.ca/eng/pdf/SP-600-05-04E.pdf
Maxim, P., & White, J. (2006). School completion and workforce transitions among urban Aboriginal youth. In J. P. White, S. Wingert, & P. Maxim (Eds.), Aboriginal policy research: Moving forward, making a difference, Volume 3 (35–51). Toronto, ON: Thompson Educational Publishing.
McIvor, O., Napolean, A., & Dickie, K.M. (2009). Language and culture as protective factors for at risk communities. Journal of Aboriginal Health, 5(1), 6–25.
Mendelson, M. (2009). Why we need a First Nations education act. Ottawa, ON: Caledon Institute of Social Policy.
National Collaborating Centre for Aboriginal Health. (2009–2010). Culture and language as social determinants of First Nations, Inuit and Métis health. Retrieved from: http://www.nccah-ccnsa.ca/docs/fact%20sheets/social%20determinates/NCCAH_fs_culture_language_EN.pdf
Royal Commission on Aboriginal Peoples. (1996). Report of the Royal Commission on Aboriginal Peoples. Volume 3: Gathering strength. Ottawa, ON: Indian and Northern Affairs Canada.
Statistics Canada. (2013). Aboriginal Peoples Survey, 2006: School experiences of offreserve First Nations children aged 6 to 14. Retrieved from: http://www.statcan.gc.ca/pub/89-637-x/89-637-x2009001-eng.htm#a9
Taylor, A., Friedel, T.L., & Edge, L. (2009). Pathways for First Nation and Métis youth in the oil sands. Ottawa, ON: Canadian Policy Research Networks Inc.
Thiessen, V. (2001). Policy research issues for Canadian youth: School-work transitions. Hull, QC: HRDC.
Truth and Reconciliation Commission of Canada. (2015). Honouring the truth, reconciling for the future: Summary of the final report of the Truth and Reconciliation Commission of Canada. Retrieved from: www.trc.ca

The National Report of the First Nations Regional Early Childhood, Education, and Employment Survey | 57
Adult Employment, Culture, and Well-Being
EXECUTIVE SUMMARY
Guided by the First Nations Holistic Lifelong Learning Model, this chapter examines employment and its relationship to education, culture and well-being among First Nations adults living in reserve and northern First Nations communities in Canada. Data for this chapter come from the FNREEES adult survey, which surveyed those aged 18 and over. Descriptive analyses and cross-tabulations were used to examine variables, including employment, education, self-rated mental health, life balance (physical, mental, emotional, spiritual), social support, culture, and language.
Results indicate that while a similar proportion of First Nations men and women onreserve and in northern First Nations communities were working for pay at the time of the survey, a higher proportion of men were not working (i.e., looking for work). A higher proportion of First Nations women had completed both high school and post-secondary programs, compared to First Nations men.
In terms of culture, the majority of First Nations adults felt that speaking and understanding a First Nations language was important, and about one-third were fluent in their First Nations language.
The majority of First Nations adults said it was very important to know and learn about the traditional teachings of their people. Self-rated mental health was high, and most individuals felt supported by their social and work-based networks; however, emotional well-being was higher among those who were working compared to those who were not. According to the literature, culture, traditions, and support, particularly from family, appear to have a protective effect on well-being, which is relatively high for First Nations adults living on reserve and in northern First Nations communities.
While overall educational attainment among First Nations adults is improving, the employment gap between First Nations people living on reserve and in northern First
Nations communities and the general population remains a significant challenge. Supporting linkages with culture and traditions, as well as culturally relevant programming to enhance academic success and workforce participation, is recommended. This involves nurturing collective well-being, promoting existing community strengths, and seeking effective ways to invest in First Nations communities as valuable contributors to society and the workforce.
KEY FINDINGS
• Nearly half (44.7%) of First Nations adults living on reserve and in northern First Nations communities were working at the time of the FNREEES data collection period. While there was no gender difference among those who were working, significantly more First Nations men (51.3%) than women (30.5%) were looking for work; more adults under the age of 40 were looking for work compared to adults over the age of 40.
• About 2 in 5 (40.5%) First Nations adults had not completed high school, with the percentage being slightly higher (43.6%) among 18- to 44-year-olds. Males also had a higher non-completion rate (46.3%; and 49.7% among 18- to 44-year-olds) than females (34.7%; and 38.0% among 18- to 44-year-olds).
• Nearly three-quarters of First Nations adults reported that it was very important to be able to understand (74.8%) and speak (73.7%) a First Nations language. More than half of First Nations adults reported that it was very important to be able to read (56.8%) and write (56.4%) a First Nations language.
• The majority of First Nations adults (71.3%) reported high levels of emotional well-being. Those who were working were significantly more likely to have high emotional well-being (77.4%) than those who were not working (66.7%).
• More than half of First Nations adults (56.0%) reported a high level of physical, mental, emotional, and spiritual life balance; while 38.3% reported a moderate level of balance.
CHAPTER 5

Now is the Time: Our Data, Our Stories, Our Future 58 |
• The majority of First Nations adults (86.1%) reported that it was somewhat or very important to know and learn about the traditional teachings of their people: nearly half (46.7%) said traditional spirituality was very important, while nearly one-third (29.6%) said it was somewhat important.
INTRODUCTION
Employment conditions and opportunities for First Nations people living in reserve and northern First Nations communities are influenced by a range of contemporary and historical factors, including educational attainment, entrepreneurial opportunities, infrastructure conditions, remoteness of location, access to training, and the inter-generational ripple effects of Indian Residential Schools (Indigenous and Northern Affairs Canada [INAC], 2013; National Aboriginal Economic Development Board [NAEDB], 2015).
Historically, low levels of formal education have contributed to much higher levels of unemployment among First Nations adults. According to the RHS 2008/10, the unemployment rate on reserve was 31.2% (FNIGC, 2012). This was much higher than what is found among non-Aboriginal populations in Canada (7.5%; NAEDB, 2015) and translates into a significant income gap between First Nations and non-Aboriginal populations (FNIGC, 2012; NAEDB, 2015). This fact was highlighted in the final report of the Truth and Reconciliation Commission of Canada which states that “the income gap is pervasive: non-Aboriginal Canadians earn more than Aboriginal workers no matter whether they work on reserve, off reserve, or in urban, rural, or remote locations” (Truth and Reconciliation Commission of Canada [TRC], 2015, p. 147). The impacts of these education, employment, and income inequities can be significant on the health and well-being of individuals and communities.
In this chapter, results from the FNREEES adult survey that touch on well-being, employment, education, First Nations languages, culture and traditions, levels of social support, and mental and emotional health are examined. The First Nations Holistic Lifelong Learning Model is used as a guiding framework for the selection of variables in these analyses. The First Nations Holistic Lifelong Learning Model outlines how an individual’s lifelong learning path is part of a continuum that is influenced by experience with numerous sources and domains of knowledge, including the natural world, culture and language, and social connections. The framework recognizes that learning is experienced holistically and contributes to economic, political, societal, and spiritual aspects of a community’s collective well-being (CCL, 2007).
METHODS
This chapter focuses on findings from the FNREEES Adult Survey, completed by adults aged 18 years and older. Analyses consisted of frequencies and cross-tabulations, which were completed using SPSS version 20. Statistical significance was determined by 95% CIs; when the numeric ranges of the CIs for different data points did not overlap, the difference was deemed to be significant.
The survey covered topics ranging from education and employment to well-being, language, and culture. When multiple survey questions addressed similar themes and had comparable response categories, composite variables were created to investigate concepts more holistically. For example, wellness at work is a composite variable that combines the respondents’ level of agreement with five different statements about (a) their happiness at work, (b) feeling valued at work, (c) stress at work, (d) opportunities to learn new skills at work, and (e) satisfaction with work-life balance. Key variables, including composite variables and category breakdowns, are described in Table 5.1.

Variable Description Categories
EMPLOYMENT AND EDUCATION
Currently workingAre you currently working at a job or business for pay (wages, salary, self-employed)?Note this does not include those who are off work and will return to work.
Yes/No
Currently looking for work Are you currently looking for work? Yes/No
Reason for working onreserve
What is the main reason that you choose to work within a First Nations community (on reserve)?
E.g., Give back to community, be close to family, connection to culture, financial reasons
Education levelComposite variable combining questions about highest level of elementary or high school, and additional education complete or incomplete for former students not currently in school
< High school, High school and equivalency, Post-secondary
WELL-BEING
Self-rated mental health In general, would you say your mental health is…? Excellent, Very good, Good, Fair, Poor
Life balanceComposite variable combining questions about frequency of being in balance in four aspects of life: physical, mental, emotional, and spiritual. Answer categories ranged from None of the time (1) to All the time (5)
Summed scores: Low (<11), Moderate (11–15), High (>15)
Social support
Composite variable combining questions about having someone in your life (e.g., friends, family) to help when something goes wrong; feel safe, secure, and happy; turn to for advice; feel comfortable talking with about problems; count on in times of trouble. Answer categories ranged from Strongly disagree (1) to Strongly agree (4)
Summed scores: Low (<11), Moderate (11–15), High (>15)
Emotional well-being Composite variable combining the frequency of feeling lonely, feeling loved, feeling stressed. Answer categories ranged from Not at all (1) to A lot (5)
Summed scores: Low (<6), Moderate (6–10), High (>10)
LANGUAGE AND CULTURE
Language proficiency Four questions about self-rated ability to understand, speak, read, and write in a First Nations language
Fluent, Intermediate, Basic, Few words, Cannot understand.
Importance of knowing a language
Four questions about the importance of understanding, speaking, reading, and writing in a First Nations language
Very, Somewhat, A little, Not at all
Satisfaction with knowledge of language How satisfied are you with your knowledge of a First Nations language? Very, Somewhat, A little, Not
at all
Importance of traditional teachings
Importance of knowing and learning about the traditional teachings of your people (e.g., beliefs, values, medicines, practices, ceremonies, stories, songs, activities)
Very, Somewhat, A little, Not at all
Importance of spirituality How important is traditional spirituality in your life? Very, Somewhat, A little, Not at all
Wellness at work Composite variable combining happiness at work, feeling valued at work, stress at work, opportunities to learn new skills, satisfaction with work-life balance
Strongly agree, Agree, Disagree, Strongly disagree
Workplace support of culture Agreement that workplace is supportive of First Nations culture Strongly agree, Agree,
Disagree, Strongly disagree
Family history of residential schooling
Composite variable combining whether (a) they, or (b) any family member went to residential school. Yes/No
Table 5.1. Key variables
| 59
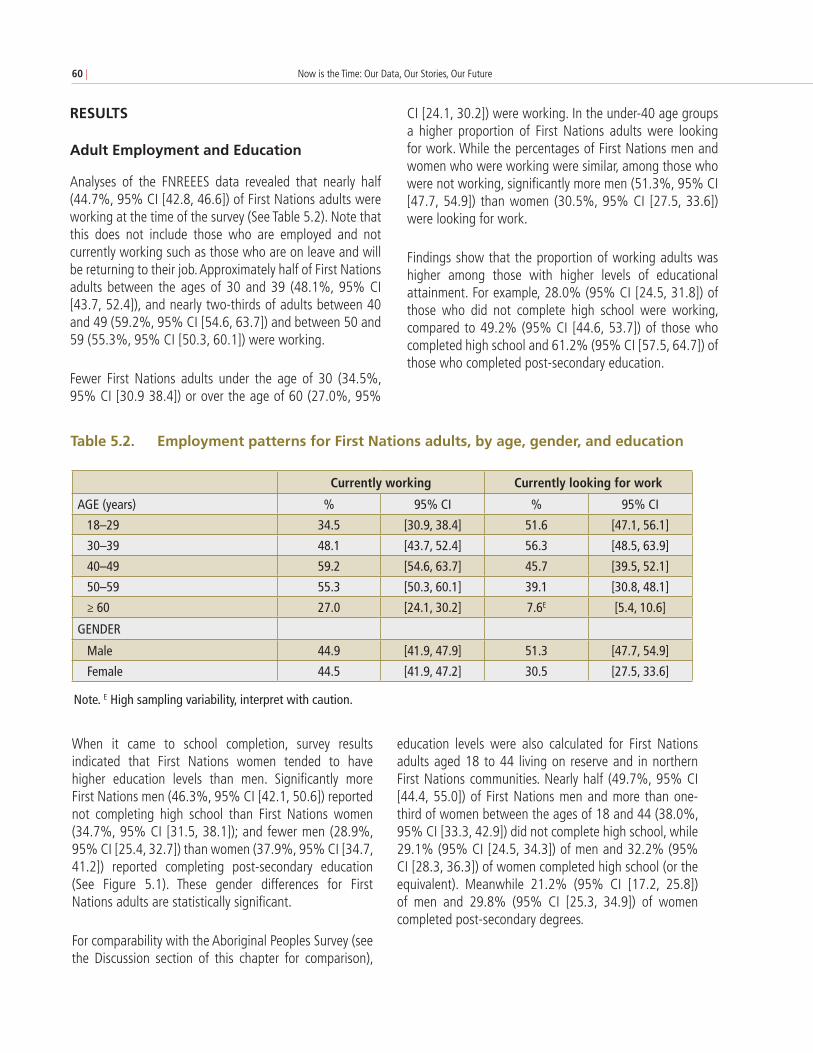
Now is the Time: Our Data, Our Stories, Our Future 60 |
Currently working Currently looking for work
AGE (years) % 95% CI % 95% CI
18–29 34.5 [30.9, 38.4] 51.6 [47.1, 56.1]
30–39 48.1 [43.7, 52.4] 56.3 [48.5, 63.9]
40–49 59.2 [54.6, 63.7] 45.7 [39.5, 52.1]
50–59 55.3 [50.3, 60.1] 39.1 [30.8, 48.1]
≥ 60 27.0 [24.1, 30.2] 7.6E [5.4, 10.6]
GENDER
Male 44.9 [41.9, 47.9] 51.3 [47.7, 54.9]
Female 44.5 [41.9, 47.2] 30.5 [27.5, 33.6]
Note. E High sampling variability, interpret with caution.
RESULTS
Adult Employment and Education
Analyses of the FNREEES data revealed that nearly half (44.7%, 95% CI [42.8, 46.6]) of First Nations adults were working at the time of the survey (See Table 5.2). Note that this does not include those who are employed and not currently working such as those who are on leave and will be returning to their job. Approximately half of First Nations adults between the ages of 30 and 39 (48.1%, 95% CI [43.7, 52.4]), and nearly two-thirds of adults between 40 and 49 (59.2%, 95% CI [54.6, 63.7]) and between 50 and 59 (55.3%, 95% CI [50.3, 60.1]) were working.
Fewer First Nations adults under the age of 30 (34.5%, 95% CI [30.9 38.4]) or over the age of 60 (27.0%, 95%
CI [24.1, 30.2]) were working. In the under-40 age groups a higher proportion of First Nations adults were looking for work. While the percentages of First Nations men and women who were working were similar, among those who were not working, significantly more men (51.3%, 95% CI [47.7, 54.9]) than women (30.5%, 95% CI [27.5, 33.6]) were looking for work.
Findings show that the proportion of working adults was higher among those with higher levels of educational attainment. For example, 28.0% (95% CI [24.5, 31.8]) of those who did not complete high school were working, compared to 49.2% (95% CI [44.6, 53.7]) of those who completed high school and 61.2% (95% CI [57.5, 64.7]) of those who completed post-secondary education.
Table 5.2. Employment patterns for First Nations adults, by age, gender, and education
When it came to school completion, survey results indicated that First Nations women tended to have higher education levels than men. Significantly more First Nations men (46.3%, 95% CI [42.1, 50.6]) reported not completing high school than First Nations women (34.7%, 95% CI [31.5, 38.1]); and fewer men (28.9%, 95% CI [25.4, 32.7]) than women (37.9%, 95% CI [34.7, 41.2]) reported completing post-secondary education (See Figure 5.1). These gender differences for First Nations adults are statistically significant.
For comparability with the Aboriginal Peoples Survey (see the Discussion section of this chapter for comparison),
education levels were also calculated for First Nations adults aged 18 to 44 living on reserve and in northern First Nations communities. Nearly half (49.7%, 95% CI [44.4, 55.0]) of First Nations men and more than one-third of women between the ages of 18 and 44 (38.0%, 95% CI [33.3, 42.9]) did not complete high school, while 29.1% (95% CI [24.5, 34.3]) of men and 32.2% (95% CI [28.3, 36.3]) of women completed high school (or the equivalent). Meanwhile 21.2% (95% CI [17.2, 25.8]) of men and 29.8% (95% CI [25.3, 34.9]) of women completed post-secondary degrees.
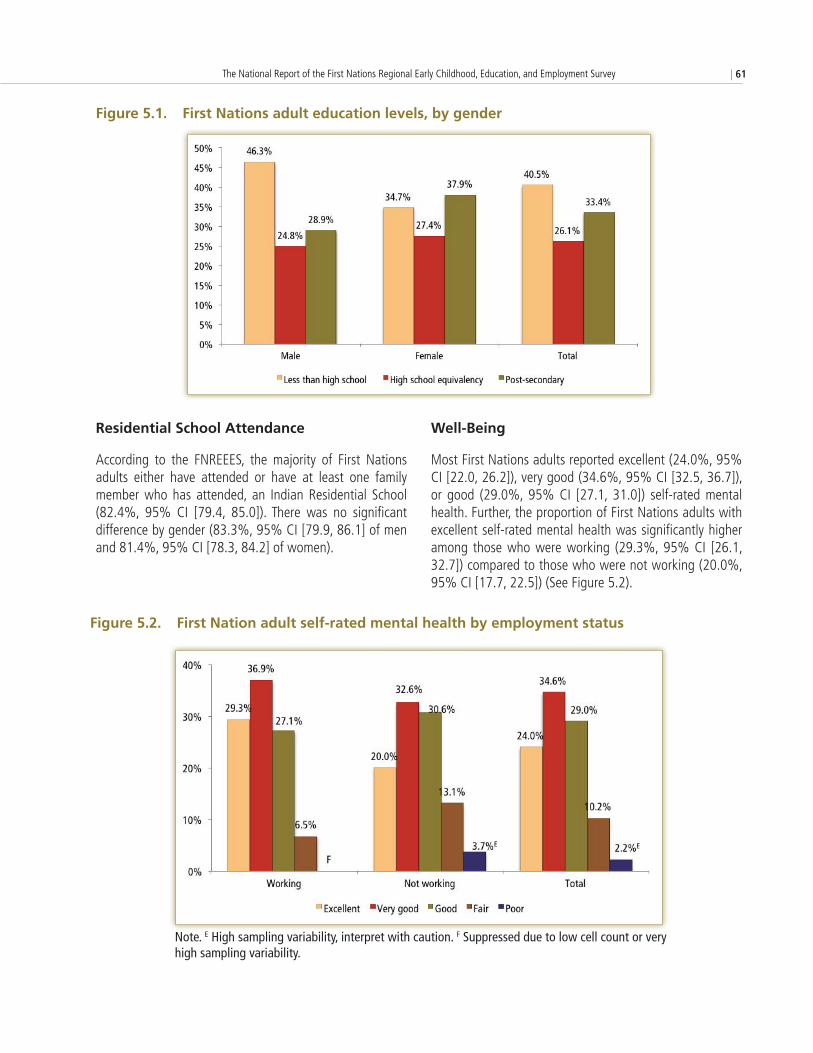
The National Report of the First Nations Regional Early Childhood, Education, and Employment Survey | 61
Figure 5.1. First Nations adult education levels, by gender
Residential School Attendance
According to the FNREEES, the majority of First Nations adults either have attended or have at least one family member who has attended, an Indian Residential School (82.4%, 95% CI [79.4, 85.0]). There was no significant difference by gender (83.3%, 95% CI [79.9, 86.1] of men and 81.4%, 95% CI [78.3, 84.2] of women).
Well-Being
Most First Nations adults reported excellent (24.0%, 95% CI [22.0, 26.2]), very good (34.6%, 95% CI [32.5, 36.7]), or good (29.0%, 95% CI [27.1, 31.0]) self-rated mental health. Further, the proportion of First Nations adults with excellent self-rated mental health was significantly higher among those who were working (29.3%, 95% CI [26.1, 32.7]) compared to those who were not working (20.0%, 95% CI [17.7, 22.5]) (See Figure 5.2).
Figure 5.2. First Nation adult self-rated mental health by employment status
Note. E High sampling variability, interpret with caution. F Suppressed due to low cell count or very high sampling variability.

Now is the Time: Our Data, Our Stories, Our Future 62 |
Results from the FNREEES adult survey showed a relationship between mental health and household income. For example, in households making $19,999 or less only 18.0% (95% CI [15.7, 20.7]) of adults reported having excellent mental health; compared to 44.7% (95% CI [35.2, 54.5]) of First
Nations adults in households making $80,000 or more (See Table 5.3). These differences are significant only between the lowest ($19,999 or less and $20,000 to $29,999) and highest ($80,000 or more) household income brackets.
Household incomeExcellent self-rated mental health
% 95% CI
$19,999 or less 18.0 [15.7, 20.7]
$20,000–29,999 24.1 [18.1, 31.3]
$30,000–49,999 29.3E [20.7, 39.8]
$50,000–79,999 31.9 [25.8, 38.7]
$80,000 or more 44.7 [35.2, 54.5]
Table 5.3. First Nations adult self-rated mental health, by household income
Note. E High sampling variability, interpret with caution.
The majority of First Nations adults (71.3%, 95% CI [69.0, 73.5]) reported a high level of emotional well-being. The proportion was higher among those who were working
(77.4%, 95% CI [74.3, 80.2]), compared to those who were not (66.7%, 95% CI [63.8, 69.4]) (See Figure 5.3).
Note. E High sampling variability, interpret with caution.
Figure 5.3. First Nations adults emotional well-being by employment status
More than half of First Nations adults (56.0%, 95% CI [53.7, 58.3]) reported having a high level of life balance, a composite measure of the frequency with which they felt in balance physically, mentally, emotionally, and spiritually), while 38.3% (95% CI [36.1, 40.5]) reported a moderate level of life balance.
The proportion of First Nations adults reporting a high life balance was significantly larger among those who were working (59.5%, 95% CI [56.6, 62.4]), compared to those who were not (52.9%, 95% CI [49.9, 55.9]) (See Figure 5.4).

The National Report of the First Nations Regional Early Childhood, Education, and Employment Survey | 63
Figure 5.4. First Nations adults’ life balance by employment status
Slightly more than one-third of First Nations adults (34.6%, 95% CI [32.5, 36.8]) reported a high level of social support (a composite variable combining questions about having supportive friends or family), while nearly two-thirds (62.0%, 95% CI [59.8, 64.2]) reported a
moderate level of support. Results showed that a larger proportion of employed First Nations adults had high social support (41.4%, 95% CI [38.4, 44.5]), compared to those who were not employed (29.2%, 95% CI [26.7, 31.8]) (See Figure 5.5).
Figure 5.5. Social support levels among First Nations adults, by employment status
Note. E High sampling variability, interpret with caution.

Now is the Time: Our Data, Our Stories, Our Future 64 |
Language and Culture
Nearly three-quarters of First Nations adults reported that the ability to understand (74.8%, 95% CI [72.5, 77.0]) or speak (73.7%, 95% CI [71.4, 75.9]) a First Nations language
was very important, while more than half reported that the ability to read (56.8%, 95% CI [54.3, 59.3]) or write (56.4%, 95% CI [53.9, 58.9]) a First Nations language was very important (See Figure 5.6).
Figure 5.6. Perceived importance of understanding, speaking, reading, and writing a First Nations language among First Nations adults
The majority of working First Nations adults reported speaking English at work most of the time (84.6%, 95% CI [82.7, 86.3]), while a smaller percentage (10.9%, 95% CI [9.5, 12.4]) reported speaking primarily a First Nations language at their job. The FNREEES findings also indicated
that among adults who had knowledge of a First Nations language, more than one-third rated themselves as fluent when it came to understanding (38.9%, 95% CI [35.7, 42.2]) or speaking (34.0%, 95% CI [31.3, 36.9]) the language (See Figure 5.7).
Figure 5.7. Language proficiency among First Nations adults who reported some knowledge of a First Nations language

The National Report of the First Nations Regional Early Childhood, Education, and Employment Survey | 65
When it came to reading and writing, very few First Nations adults rated themselves as fluent in either, with 11.3% (95% CI [9.3, 13.7]) saying they were fluent in reading and even fewer (8.5%, 95% CI [6.8, 10.7]) saying they were fluent in writing. The majority reported knowing either only a few words when reading (27.4%, 95% CI [25.5, 29.4]) or writing (27.8%, 95% CI [25.9, 29.7]) or none at all when reading (29.8%, 95% CI [27.0, 32.8]) or writing (40.3%, 95% CI [37.3, 43.3]).
Among First Nations adults who reported knowledge of a First Nations language, more than one-third (36.6%, 95% CI [33.7, 39.5]) said they were very satisfied with their level of knowledge (See Figure 5.8). The rest reported being somewhat satisfied (23.0%, 95% CI [21.3, 24.8]), a little
satisfied (19.3%, 95% CI [17.5, 21.3]), or not at all satisfied (21.1%, 95% CI [19.0, 23.2]) with their knowledge of a First Nations language.
The majority of First Nations adults reported that knowing and learning about traditional teachings was very important (65.6%, 95% CI [63.5, 67.6]) or somewhat important (20.5%, 95% CI [19.1, 22.1]) (See Figure 5.9). Meanwhile nearly half of First Nations adults reported that traditional
spirituality was very important (46.7%, 95% CI [44.3, 49.1]), and more than one- quarter reported that it was somewhat important (29.6%, 95% CI [27.4, 32.0]) (See Figure 5.10).
Figure 5.8. Satisfaction with language proficiency among First Nations adults who reported some knowledge of a First Nations language
Figure 5.9. Importance of knowing and learning about traditional teachings among First Nations adults

Now is the Time: Our Data, Our Stories, Our Future 66 |
Figure 5.10. Importance of traditional spirituality among First Nations adults
Among First Nations adults who were working, the large majority either agreed (57.1%, 95% CI [54.1, 60.0]) or strongly agreed (38.4%, 95% CI [35.5, 41.5]) that they were happy at work.
Further, a higher level of wellness at work was reported among those First Nations adults whose workplace was supportive of First Nations culture (39.0%, 95% CI [35.7, 42.4]), compared to those whose workplace was not supportive of First Nations culture (21.0%, 95% CI [15.1, 28.5]) (See Figure 5.11).
Figure 5.11. Wellness at work among First Nations adults by workplace support of First Nations culture

The National Report of the First Nations Regional Early Childhood, Education, and Employment Survey | 67
DISCUSSION
Employment
According to the FNREEES, less than half (44.7%) of First Nations adults were working at the time of the survey. The lowest rates of employment were found among the youngest and oldest groups. Employment is considered a key determinant of individual and community health (NCCAH, 2009–2010), and given the high levels of youth suicide, crime, and incarceration among younger First Nations adults (Adelson, 2005) it is critical to nurture healthy community contexts, including the creation of programs that promote high school completion, youth apprenticeships, and other means of improving employment opportunities for young First Nations adults.
It is important to take local and cultural context into account when interpreting these employment results. For example, work is often seasonal in rural and isolated First Nations communities (Preston, 2008) which could influence the survey results depending on which season the survey was conducted in. Further, traditional activities that contribute to the local economy, such as hunting and fishing or caring for children and Elders, all fall under the category of unpaid work, which is not included in the results.
Education
In order to compare the FNREEES to the 2012 Aboriginal Peoples Survey (APS), education levels were calculated for First Nations adults between the ages of 18 and 44. It was found that a high percentage of First Nations adults aged 18 to 44 (43.6%) had not completed high school. This percentage was significantly higher for men (49.7%) than for women (38.0%).
By comparison, the APS found that among First Nations adults aged 18 to 44 living off-reserve 28% had not completed the requirements for a high school diploma or the equivalent (Statistics Canada, 2016). A considerable gap was also seen in FNREEES results between completions of some form of post-secondary education among adults living on reserve and in northern First Nations communities (29.8% of women and 21.2% of men), compared to APS off-reserve levels (49% of women and 36% of men; Statistics Canada, 2016).
The education gap between adults living in First Nations communities and those living off-reserve is notable and should be of concern. It is imperative that efforts be made to improve educational outcomes for those living on reserve and in northern First Nations communities.
The consistently higher educational attainment by First Nations women compared to First Nations men is also worth noting. Hull (2009) showed that educational completion rates for women were similar whether or not they felt that having a family interfered with their studies. However, men who felt family responsibilities interfered with their studies had much lower completion rates than those who said family did not impact their studies (Hull, 2009). Explicit recognition that different realities exist for First Nations men and women can contribute to employment- and education-promoting initiatives that facilitate equal opportunities for both (NWAC, 2004).
It’s clear based on the FNREEES results that there is a relationship between education and employment. Of First Nations adults who did not complete high school only 28.0% reported being employed, compared to nearly half (49.2%) who completed high school, and nearly two-thirds (61.2%) who completed post-secondary education. Based on the results of the 2011 National Household Survey, Leonard (2013) noted a similar pattern whereby 40.7% of First Nations adults off-reserve who did not complete high school were employed compared to 68.0% who had a high school diploma or equivalent. The lower the level of education the fewer employment opportunities are available, and potential annual income is therefore impacted negatively (Reading & Halseth, 2013). There is an overwhelming consensus in the literature that improving educational outcomes among First Nations people is the key to narrowing the employment gap and mitigating the socio-economic challenges faced by this group (Brunnen, 2003; TD Bank Financial Group, 2009; TRC, 2015). Findings from the FNREEES reinforce the need to facilitate accessible and culturally relevant means to support high-school completion on reserve and in northern First Nations communities.
The lasting influence of colonization and the legacy of Indian Residential Schools have contributed to disempowerment in First Nations communities in many ways, resulting in poor physical, mental, and spiritual well-being (Alfred, 2009;

Now is the Time: Our Data, Our Stories, Our Future 68 |
Czyzewski, 2011). First Nations communities have been coping with experiences of trauma and loss for decades, which can trigger individuals to engage in a cascade of negative and unhealthy behaviours. It has also been shown to have an effect on how First Nations adults perceive education.
The FNREEES data showed that 82.4% of respondents had attended or had at least one family member who had attended a residential school. This influence of the residential school experiences among First Nations people has been shown to contribute to disempowerment, low self-esteem, and negative perceptions of formal education (Reading & Wien, 2009). More than half (53.4%) of the First Nations individuals who attended a residential school reported that it had a negative impact on their health and well-being (Health Canada, 2014).
Well-Being and Employment
Results from the FNREEES show that about two-thirds of First Nations adults reported good to excellent self-rated mental health, with the highest proportions being among those who were employed and those with higher incomes. For example, only 18.0% of First Nations adults in a household earning $19,999 or less reported having excellent mental health, compared to 44.7% of those in a household earning $80,000 or more. An even larger majority of First Nations adults (71.3%) reported high levels of emotional well-being, with a higher proportion being among those who were working (77.4%) than those who were not (66.7%).
In the case of life balance (a composite measure of physical, mental, emotional, and spiritual balance) more than half of First Nations adults (56.0%) reported high levels of life balance. However, there was a significant difference in life balance between adults who were working (59.5%) and those who were not (52.9%).
While employment status appears to influence multiple aspects of First Nations well-being, it may have a different impact on certain aspects (e.g., mental health and emotional well-being) compared to others. In addition to contributing to better employment outcomes, educational attainment has been shown in previous research to be positively associated with well-being: high school graduates reported higher levels of balance than those who did not graduate
from high school (FNIGC, 2012). Overall, findings from the FNREEES are consistent with other literature where it is suggested that “income inequalities, (un)employment and the nature of employment, and education were found to most profoundly impact Indigenous peoples’ health” (Reading & Halseth, 2013, p. 8).
Language, Culture, and Tradition
Language, culture, and tradition are believed to be fundamental to First Nations health and well-being and are a part of what constitutes a holistic world view (Health Canada, 2014). The FNREEES results showed that approximately three-quarters of First Nations adults reported that the ability to understand (74.8%) and speak (73.7%) a First Nations language was very important; while fewer reported that the ability to read (56.8%) and write (56.4%) in a First Nations language was very important.
The role of community and culture as buffers against unemployment and other negative outcomes for First Nations people on reserve has been well documented (Chandler & Lalonde, 1998; Healey & Meadows, 2008; McIvor et al., 2009). The relationships between various socio-cultural indicators for First Nations people, such as education, cultural identity, and language, with other measures of well-being, including life balance and emotional well-being, are complex and interconnected (Reading & Halseth, 2013; FNIGC, 2012).
A majority of First Nations adults reported that it was somewhat or very important to know and learn about traditional teachings (86.1%), and more than three-quarters reported that traditional spirituality was at least somewhat important (76.3%). These findings correspond with those from the RHS 2002/03 and RHS 2008/10. The former reported that First Nations living on reserve and in northern First Nations communities value traditional spirituality regardless of age, gender, income, and education (FNIGC, 2005), and the latter indicated that approximately 80% of First Nations adults reported that traditional spirituality was at least somewhat important (FNIGC, 2013).
This is a testament to the cultural strength in communities, as they continue to value traditional practices. Indeed, a spiritual and cultural revitalization is under way in many communities, as reflected through grassroots activities, traditional program delivery, and culturally appropriate

The National Report of the First Nations Regional Early Childhood, Education, and Employment Survey | 69
policy development (Robbins & Dewar, 2011). For example, programs like local culture camps and activities related to the Idle No More movement help to strengthen and renew relationships to the land, which are central to Indigenous knowledge and spirituality.
Workplace Support and Wellness at Work
While the majority of First Nations adults reported moderate to high levels of wellness at work, a larger proportion of those working in environments that were supportive of First Nations culture reported high levels of wellness (39.0%), compared to those whose workplaces were unsupportive (21.0%). This finding is perhaps not surprising, after all a work environment that is welcoming and supportive, that gives employees a sense of control, and that allows for social networks and trust building to occur, is more conducive to wellness (Hillier, Fewell, Cann, & Shephard, 2005).
On the other hand, a work environment that lacks understanding or respect for First Nations culture and cultural differences can be expected to lead to resentment and mistrust among First Nations employees, which is not conducive to wellness (Indigenous Corporate Training Inc., 2013). As such, workplace support is an essential aspect of establishing a positive working environment. Well-being in the workplace that results from employer support also contributes to optimal worker productivity (Hillier et al., 2005).
Social Support and Community Connection
The large majority of First Nations adults reported either moderate (62.0%) or high levels (34.6%) of social support. Here, social support corresponds with the FNREEES questions asking, for example, whether, someone would help if something went wrong, whether they have family and friends who help them feel safe, secure, and happy, and whether they have someone they trust and can turn to for advice.
A larger proportion of respondents who were employed reported high levels of social support (41.4%), compared to those who were unemployed (29.2%). Strong social relationships can both help individuals find employment and contribute to overall health and well-being. Immediate and extended family and friends are the primary sources
that First Nations people turn to when they need to talk about emotional issues or their mental health status (Health Canada, 2014). The RHS 2002/03 data showed that nearly two-thirds of First Nations adults reported seeing or talking to immediate family members (63.1%) or friends (62.6%) about their emotional or mental health (Health Canada, 2014, p. 40).
The importance of social support and community connection was evident in the RHS 2008/10. When study participants were asked to identify community strengths “family values” was the most frequent response (FNIGC, 2012). These outcomes reflect core values, which include an emphasis on family, that are common in First Nations communities and often associated with traditional teachings and Indigenous world views (Brant Castellano, 2006).
Re-establishing family values, connecting with Elders, and learning about language, culture, and traditions are good places to start raising self-esteem and ultimately improve educational and employment outcomes (Archibald, 2006), with the aim of restoring First Nations communities to healthier, more vibrant places.
CONCLUSIONS
This chapter outlines findings from the FNREEES adult survey that are associated with employment, education, culture, and well-being, such as rates of employment, educational attainment, language proficiency, and various indicators of well-being. Survey findings suggest that while overall educational attainment is improving, the employment gap between First Nations on reserve and in northern First Nations communities and the rest of the population remains a significant challenge. Most First Nations adults reported that speaking and understanding a First Nations language was very important, as was knowing and learning about traditional teachings. Regardless of work status, levels of emotional well-being and life balance were generally high.
Findings here demonstrate the importance of seeking culturally relevant ways to promote educational attainment on reserve and in northern First Nations communities, starting with young children (e.g., via early childhood and school programs that focus on community strengths), with the desired outcome being to increase high school success

Now is the Time: Our Data, Our Stories, Our Future 70 |
and ultimately employment success (Crooks, Chiodo, Thomas, & Hughes, 2009).
Training programs geared towards relevant and available work may create incentives for working-age First Nations community members who want to stay in their communities. Finally, it is important to further promote the positive associations between language, culture, and traditions in communities and to identify how they translate to well-being and potential employment. FNREEES results showed that First Nations adults have cited these as important values, so they should be used as teaching tools and incorporated into the work environment whenever feasible, thus contributing to workplace wellness.
REFERENCES
Adelson, N. (2005). The embodiment of inequity: Health disparities in Aboriginal Canada. Canadian Journal of Public Health, 96, S45–S61.
Alfred, T. (2009). Colonialism and state dependency. Journal of Aboriginal Health, 5(2), 42–60.
Archibald, L. (2006). Final report of the Aboriginal Healing Foundation, Volume III: Promising healing practices in Aboriginal communities. Ottawa, ON: Aboriginal Healing Foundation.
Brant Castellano, M. (2006). Final report of the Aboriginal Healing Foundation, Volume I: A Healing Journey: Reclaiming Wellness. Ottawa, ON: Aboriginal Healing Foundation.
Brunnen, B. (2003). Achieving potential: Towards improved labour market outcomes for Aboriginal people (Building the New West Project Report No. 19). Calgary, AB: Canada West Foundation. Retrieved from: http://cwf.ca/wp-content/uploads/2015/12/CWF_AchievingPotential_Report_SEP2003_ENG.pdf
Canadian Council on Learning / Aboriginal Learning Knowledge Centre. (2007). First Nations Holistic Lifelong Learning Model. Retrieved from: http://www.afn.ca/uploads/files/events/fact_sheet-ccoe-4.pdf
Chandler, M. J., & Lalonde, C. E. (1998). Cultural continuity as a hedge against suicide in Canada’s First Nations. Transcultural Psychiatry, 35, 191–219.
Crooks, C.V., Chiodo, D., Thomas, D., & Hughes, R. (2009). Strengths-based programming for First Nations youth in schools: Building engagement through healthy relationships and leadership skills. International Journal of Mental Health Addiction 8(2), 160–173.
Czyzewski, K. (2011). Colonialism as a broader social determinant of health. International Indigenous Policy Journal, 2(1).
First Nations Information Governance Centre. (2005). First Nations Regional Health Survey (RHS) 2002/03: Results for adults, youth and children living in First Nations communities. Ottawa, ON: First Nations Information Governance Centre.
First Nations Information Governance Centre. (2012). First Nations Regional Health Survey (RHS) 2008/10: National report on adults, youth and children living in First Nations communities. Ottawa, ON: First Nations Information Governance Centre.
First Nations Information Governance Centre. (2013). Quick Facts – RHS 2002/03, RHS 2008/10. Retrieved from: http://fnigc.ca/our-work/regional-health-survey/quick-facts-rhs-200203.html
Healey, G.K., & Meadows, L.M. (2008). Tradition and culture: An important determinant of Inuit women’s health. Journal of Aboriginal Health, 4(1), 25–33.
Health Canada. (2014). A statistical profile on the health of First Nations in Canada: Determinants of health, 2006 to 2010. Retrieved from: http://publications.gc.ca/collections/collection_2014/sc-hc/H34-193-1-2014-eng.pdf
Hillier, D., Fewell, F., Cann, W., & Shephard, V. (2005). Wellness at work: Enhancing the quality of our working lives. International Review of Psychiatry, 17(5), 419–431.

The National Report of the First Nations Regional Early Childhood, Education, and Employment Survey | 71
Hull, J. (2009). Postsecondary completion rates among onreserve students: Results of a follow-up survey. Canadian Issues, Winter 2009, 59–64.
Indigenous and Northern Affairs Canada. (2013). Creating the conditions for economic success on reserve lands: A report on the experiences of 25 First Nation communities. Retrieved from: https://www.aadnc-aandc.gc.ca/eng/1372346462220/1372346568198#tab4
Indigenous Corporate Training Inc.. (2013). Working effectively with Aboriginal Peoples: 8 basic barriers to Aboriginal employment. Retrieved from: http://www.ictinc.ca/8-basic-barriers-to-aboriginal-employment
Leonard, T. (2013). The 2012 Aboriginal Peoples Survey - Education and Employment: A survey of First Nations people living off reserve, Métis and Inuit. Retrieved from: http://www.rdc-cdr.ca/sites/default/files/1b_tim_leonard.pdf
McIvor, O., Napolean, A., & Dickie, K.M. (2009). Language and culture as protective factors for at risk communities. Journal of Aboriginal Health, 5(1), 6–25.
National Aboriginal Economic Development Board. (2015). The Aboriginal economic progress report. Gatineau, QC. Retrieved from: http://www.naedb-cndea.com/reports/NAEDB-progress-report-june-2015.pdf
National Collaborating Centre for Aboriginal Health. (2009–2010). Employment as a social determinant of First Nations, Inuit and Métis health. Retrieved from: http://www.nccah-ccnsa.ca/docs/fact%20sheets/social%20determinates/NCCAH_fs_employment_EN.pdf
Native Women’s Association of Canada. (2004). Background paper: Canada–Aboriginal Peoples’ roundtable economic opportunities sectoral session. Ohsweken, ON: Native Women’s Association of Canada.
Preston, J. P. (2008). The urgency of postsecondary education for Aboriginal peoples. Canadian Journal of Educational Administration and Policy, 86, 22.
Reading, C. L. & Wien, F. (2009). Health Inequalities and Social Determinants of Aboriginal Peoples’ Health. Prince George, BC: National Collaborating Centre for Aboriginal Health.
Reading, J. & Halseth, R. (2013). Pathways to improving well-being for indigenous peoples: How living conditions decide health. Prince George, BC: National Collaborating Centre for Aboriginal Health. Retrieved from: http://docplayer.net/339843-Pathways-to-improving-well-being-for-indigenous-peoples-how-living-conditions-decide-health.html
Robbins, J.A. & Dewar, J. (2011). Traditional Indigenous Approaches to Healing and the modern welfare of Traditional Knowledge, Spirituality and Lands: A critical reflection on practices and policies taken from the Canadian Example. International Indigenous Policy Journal l, 2(4). Retrieved from: http://ir.lib.uwo.ca/iipj/vol2/iss4/2.
Statistics Canada. (2016). Aboriginal Peoples Survey 2012. Part A: The education and employment experiences of First Nations people living off reserve. Retrieved from: http://www.statcan.gc.ca/pub/89-653-x/2013001/article/part-partie-a-eng.htm
TD Bank Financial Group. (2009). Aboriginal people in Canada: Growing mutual economic interest offer significant promise for improving the well-being of the Aboriginal population. TD Economics Special Report.
Truth and Reconciliation Commission of Canada. (2015) Honouring the truth, reconciling for the future: Summary of the final report of the Truth and Reconciliation Commission of Canada. Retrieved from: www.trc.ca

Now is the Time: Our Data, Our Stories, Our Future 72 |
First Nations Labour Market
EXECUTIVE SUMMARY
This chapter presents a descriptive analysis of First Nations labour markets based on data collected by the FNREEES. Using the First Nations Holistic Lifelong Learning Model as a guide, this chapter examines employment, unemployment, labour force participation, occupation and industrial characteristics of jobs, work arrangements, and commuting for First Nations adults (aged 18 and older) living on reserve and in northern First Nations communities.
Based on the FNREEES, it was found that labour force participation is higher among First Nations men than women and that unemployment rates are highest among young adults aged 18 to 24. Employment and labour force participation were highest in First Nations communities with smaller populations (less than 300 people) compared to larger communities. And contrary to expectations, there was no relationship between these labour force indicators and a community’s geographic remoteness.
A higher percentage of First Nations residents with post-secondary educational qualifications were employed, compared with those with high school qualifications or less than high school.
FNREEES data show that First Nations communities themselves are a major employer for First Nations people. More than half of those working within communities were employed in First Nations government (which includes First Nations organizations, public administration, health, and education). Construction and resource industries accounted for about 15% of employment.
Although most people worked full-time, a notable minority worked less than 30 hours per week at their main job. Many reported that this was because they could not find suitable employment, but a large proportion also said that they chose to work part-time in order to provide care to others (or because this was their preference). Nearly 40% were working in temporary or contract work.
Those who commuted to work outside their First Nations community did so mainly because employment opportunities were not available in their communities. Many chose to work in a First Nations community because it allowed them to contribute to the community and to stay connected to culture and traditions and be close to family. Nearly 40% said they did so as a way to give back to their communities or to build capacity in their communities.
KEY FINDINGS
• The overall labour force participation rate (which includes those who were working and who were looking for work) in First Nations communities was 70.8%, with significantly more First Nations men (76.0%) than women (65.4%) taking part in the Iabour force.
• Nearly half (48.7%) of those living in First Nations communities were employed, with no significant difference shown between men and women. The overall unemployment rate in First Nations communities was 31.1%, with unemployment being significantly higher for men (36.5%) than for women (24.8%). Unemployment was highest (45.9%) for young adults (18- to 24-years-old).
• Among adults between the ages of 18 and 64, employment rates (62.5%) and labour force participation rates (84.1%) were highest in smaller First Nations communities (populations of 300 people or less). In comparison, the same rates were lowest in larger communities (with populations of more than 1,500 people) with employment rates of 47.2% and labour force participation rates of 73.1%.There was no relationship between geographic remoteness of communities and employment or labour force participation.
• More than half (58.0%) of First Nations adults who were employed were working in First Nations government which includes: community organizations, education, health-care, social assistance, and public administration. A smaller percentage (15.6%) worked in resource or construction industries.
CHAPTER 6

The National Report of the First Nations Regional Early Childhood, Education, and Employment Survey | 73
• Among First Nations adults who worked within a First Nations community, 29.2% reported that they did so to be close to family, 17.3% for financial reasons, and 37.4% in order to give back to their communities or to build capacity.
• Slightly more than 1 in 10 (14.5%) First Nations adults who were employed worked less than 30 hours per week at their main job. More than half (53.4%) of those indicated that this was because they could not find more work, because of business conditions, or because they were also taking care of family members. 41.8% of men and 35.0% of women worked at a main job that was temporary, seasonal, or contract.
• Among First Nations adults who commuted to work outside a First Nations community, more than half (51.7%) did so because suitable jobs were not available; while one-third (38.7%) did so for better wages or advancement opportunities.
INTRODUCTION
There is a great deal of variation among the 634 First Nations communities across Canada, and aspects of geography may affect First Nations labour markets. In particular, community size may be related to the types of employment opportunities that are available in the community, and geographic remoteness, generally conceptualized as the distance between a community and a major urban centre, has previously been found to influence labour market characteristics (Sharpe & Lapointe, 2011).
Another important aspect of the First Nations labour market is the employment situations offered by the available jobs. Jobs may be full-time or part-time and may be occupied on a permanent or temporary basis. Some industries, particularly resource-related industries and construction, often employ workers seasonally (Galarneau, 2010). Some workers may hold more than one job, including a mix of full- and part-time jobs.
In this chapter the FNREEES data are used to describe work and the labour market for First Nations living on reserve and in northern First Nations communities. The FNREEES
collects important information on First Nations members, including activities related to paid work. This includes the demographic and educational characteristics of those who are working, those who are looking for work, and those who are out of the labour market. The data are also used to describe the kinds of jobs held by First Nations adults, including the industries and occupations in which they worked, whether these jobs were full- or part-time, and whether they were permanent or temporary. Lastly, the FNREEES asked respondents about the reasons that they chose to work in a particular community, either on or off-reserve. These data provide important insight into the benefits of working in a First Nations community.
METHODS
The data used in this chapter come from the FNREEES adult survey, which was administered to First Nations people living in a reserve or northern community who were aged 18 and older at the time of the survey. The results presented here mainly use data from the employment section of the questionnaire that refer to people’s “current” work, and their “main” job, or the job at which they work the most hours.
The terminologies used in this chapter, including employment, unemployment, and labour force participation, generally follow definitions used by Statistics Canada. For this chapter, employment is defined as working for pay, either as an employee of in self-employment (Statistics Canada, 2014). People who had a job, but were not working at the time of the survey due to illness or disability, are also considered employed. Unemployment includes those who did not have a job at the time of the survey but who were actively looking for work. People who were temporarily laid off and expected that they would be recalled to work are also defined as unemployed. Labour force participation includes either being employed or actively looking for work. Those who are neither working nor looking for work are defined as not in the labour force (Statistics Canada, 2014).
Note that there are some important differences between the way that the FNREEES asks about employment and the questions used for other data sources, such as the Labour Force Survey (Statistics Canada, 2014) and the 2012

Now is the Time: Our Data, Our Stories, Our Future 74 |
Aboriginal Peoples Survey (Cloutier & Langlet, 2014), so comparisons should therefore be made with caution.
Where possible, characteristics reported are disaggregated by gender, age group, or both. For most characteristics, four age groups are examined:
• young adults (aged 18 to 24),
• adults of typical working age (25 to 44),
• adults in middle to later adulthood (45 to 64), and
• older adults (65 and up).
These age groups allow for a better understanding of how people interact with the First Nations labour market across the life course. In some cases, we omit the oldest age group because of small numbers.
The FNREEES data set includes a measure of community remoteness, taken from the remoteness indicator used by Indigenous and Northern Affairs Canada (INAC) to classify First Nations communities (INAC, 2015). This measure is based on the road-distance to a major urban centre or whether a community is not accessible by road for at least part of the year (“special access”).
The FNREEES included several questions about First Nations elementary and secondary education, whether people had begun or completed high school or an equivalency program, and whether they had completed a range of post-secondary accreditations: including apprenticeships, trades certificates, college, and university degrees. For this report responses were categorized into four levels of education. We focus on completed educational qualifications here because it is often those qualifications that are most important for determining labour market outcomes, and to maximize comparability with other data sets, such as the 2011 National Household Survey and the 2012 Aboriginal Peoples Survey (Statistics Canada, 2015).
The FNREEES asked those who were currently working “What kind of business, industry, or service is this?” and “What kind of work or occupation is this?” The list of possible responses was developed from major categorizations that were used in the 2012 North American Industry Classification System (NAICS), to maximize comparability to other sources (Statistics Canada, 2012b), and included an “other” category with no write-in response.
Within industries, people work in a number of different roles or occupations. The FNREEES also asked people who were working at the time of the survey, “What kind of work or occupation is this?” and to select one of nine choices, or “none of these, specify.” The choices provided were designed to correspond to major categories in the National Occupational Classification, which classifies occupations according to main duties and employment requirements associated with them (Statistics Canada, 2012a).
RESULTS
Labour Force Participation, Employment, and Unemployment
Figure 6.1 presents the estimates of the proportion of the First Nations adult population that was in the labour force, by gender and age. A majority were either employed or were actively looking for paid work when they were surveyed. Overall, three-quarters of First Nations men (76.0%, 95% CI [73.9, 78.0]) and two-thirds of First Nations women (65.4%, 95% CI [62.6, 68.0]) were either working, or looking for work. Labour force participation was highest among men aged 25 to 44 (86.2%, 95% CI [83.0, 88.9]), while labour force participation among women was not significantly different between those aged 18 to 24, 25 to 44, and 45 to 64.
As expected, significantly fewer men and women aged 65 and older were in the labour force than were people at other ages: 21.1% were in the labour force (95% CI [17.6, 25.2]).

The National Report of the First Nations Regional Early Childhood, Education, and Employment Survey | 75
Figure 6.1. Labour force participation among First Nations adults (18+) by age group and gender
Employment rates reflect the proportion of the total adult population that is currently employed (either working or temporarily on leave due to illness, disability, maternity leave, etc.). Unlike labour force participation, there was
no significant difference between men’s and women’s employment rates. Overall, 48.7% of First Nations adults 18 and older were working at the time of the survey (95% CI [46.7, 50.8]).
Figure 6.2. Employment rates by age group and gender among First Nations adults (18+)

Now is the Time: Our Data, Our Stories, Our Future 76 |
As shown in Figure 6.2., employment rates were highest for First Nations adults in the middle adult age ranges (25 to 44 and 45 to 64). There were no significant gender differences in employment rates in any of the age ranges. Among those aged 25 to 44 more than half (53.2%) were employed at the time of the survey (95% CI [49.4, 56.9]).
This was not significantly different from ages 45 to 64 (57.9%, 95% CI [54.3, 61.3]). Fewer of those in the young adult age range (18 to 24) were employed (37.7%, 95% CI [32.8, 42.8]). As with labour force participation, fewer First Nations adults in the older adult age range were employed (16.8%, 95% CI [14.0, 20.0]).
Unemployment rates measure the proportion of people who are not currently working, but that are actively looking for work. Overall, a significantly higher number of First Nations men were unemployed (36.5%, 95% CI [32.4, 40.7]) compared to women (24.8%, 95% CI [22.4, 27.2]).
Unemployment appears to be related to age, with a higher percentage of First Nations adults in the young adult age range being unemployed (45.9%, 95% CI [40.6, 51.4]). Among First Nations adults aged 25 to 44 combined, 33.0% were unemployed (95% CI [29.4, 36.7]), and there was a significant difference between men (39.2%, 95% CI [32.8, 46.1]) and women (25.7%, 95% CI [22.0, 29.7]) in this age group (See Figure 6.3.).
For those aged 45 to 64, only one-quarter (23.3%) of First Nations adults were unemployed (95% CI [19.0, 28.1]). Again in this age group, significantly more men were unemployed (28.7%, 95% CI [22.1, 36.5]) compared to women (16.2%, 95% CI [13.2, 19.7]). Estimates for First Nations adults aged 65 and older are highly variable because of small numbers in this category: for men and women combined the unemployment rate was 20.6% (95% CI [12.0, 33.0]).
Figure 6.3. Unemployment among First Nations adults (18+) as a percentage of those in the labour force (currently working or looking for work) by age group and gender
Note. F Suppressed due to low cell count or very high sampling variability.
Remoteness and Community Size
Table 6.1 presents the percentage of adults employed, unemployed, and not in the labour force by size of community, for First Nations adults aged 18 to 64. Communities with fewer than 300 members had the highest percentage employed (62.5%, 95% CI [58.3,
66.5]) and the lowest percentage out of the labour force (15.9%, 95% CI [13.0, 19.5]). Medium-sized communities, with between 300 and 1,500 members, also had higher percentages employed than large communities with more than 1,500 members (56.0%, 95% CI [53.3, 58.6] versus 47.2%, 95% CI [43.1, 51.2]), although this difference is not statistically significant.

The National Report of the First Nations Regional Early Childhood, Education, and Employment Survey | 77
Medium-sized communities did have significantly lower percentages of the population out of the labour force (21.6%, 95% CI [19.8, 23.6]) than did large communities (26.9%, 95% CI [23.7, 30.5]).
Table 6.1. Labour force status of First Nations adults (18-64) by community size
Employed% [95% CI]
Unemployed% [95% CI]
Out of labour force% [95% CI]
Small (<300)62.5
[58.3, 66.5]21.6
[18.5, 25.1]15.9
[13.0, 19.5]
Medium (300–1,500)
56.0[53.3, 58.6]
22.4[20.2, 24.7]
21.6[19.8, 23.6]
Large (>1,500)
47.2[43.1, 51.2]
25.9[22.6, 29.6]
26.9[23.7, 30.5]
Total52.3
[50.0, 54.6]24.0
[22.1, 26.0]23.7
[21.9, 25.6]
As shown in Table 6.2, there was no significant difference in any of the three labour market measures for First Nations adults aged 18 to 65 between communities classified as urban, rural, remote, or special access.
Table 6.2. Labour force status of First Nations adults (18-64) by remoteness
Employed% [95% CI]
Unemployed% [95% CI]
Out of la-bour force% [95% CI]
Urban55.0
[51.1, 58.9]21.5
[18.5, 25.0]23.5
[20.4, 26.8]
Rural51.5
[48.0, 54.9]23.5
[21.2, 25.8]25.1
[22.7, 27.6]
Remote56.2
[48.7, 63.5]22.0
[18.3, 26.1]21.8
[15.5, 29.8]
Special Access
48.6[41.2, 56.0]
30.5[23.8, 38.1]
21.0[15.9, 27.2]
Total52.3
[50.0, 54.6]24.0
[22.1, 26.0]23.7
[21.9, 25.6]
Educational Attainment
Table 6.3 compares adults aged 18 to 64 with four levels of educational attainment: less than a high school diploma or certificate; only high school or the equivalent; some non-university trades, apprenticeship or college certificate or diploma; and a university diploma or degree above a bachelor’s. For each category, the percentages of First Nations adults aged 18 to 64 that were currently employed, unemployed (and looking for work), and out of the labour force at the time of the survey are shown.
Table 6.3. Employment status of First Nations (18-64) by educational attainment
Employed% [95% CI]
Unemployed% [95% CI]
Out of labour force
% [95% CI]
Less than high school
34.9[31.3, 38.7]
27.5[23.7, 31.7]
37.6[34.1, 41.2]
High school or equivalent
56.2[51.6, 60.7]
23.0[19.4, 27.1]
20.8[17.1, 25.2]
Nonuniversity certificate or diploma
64.6[59.3, 69.7]
20.9[17.0, 25.3]
14.5[10.5, 19.8]
University diploma or degree
85.7[79.7, 90.1]
9.7E
[6.2, 15.0]4.6E
[2.8, 7.4]
Total51.0
[48.5, 53.5]23.5
[21.3, 26.0]25.5
[23.5, 27.7]
Note. E High sampling variability, interpret with caution.
For First Nations adults with less than a high school diploma there was no significant difference between the percentages who were employed, unemployed, or out of the labour force. (Note: the confidence intervals around these estimates were overlapping). First Nations adults aged 18 to 64 with a high school diploma or the equivalent were significantly more likely to be employed (56.2%, 95% CI [51.5, 60.7]) than unemployed (23.0%, 95% CI [19.4, 27.1]) or out of the labour force (20.8%, 95% CI [17.1, 25.2]).
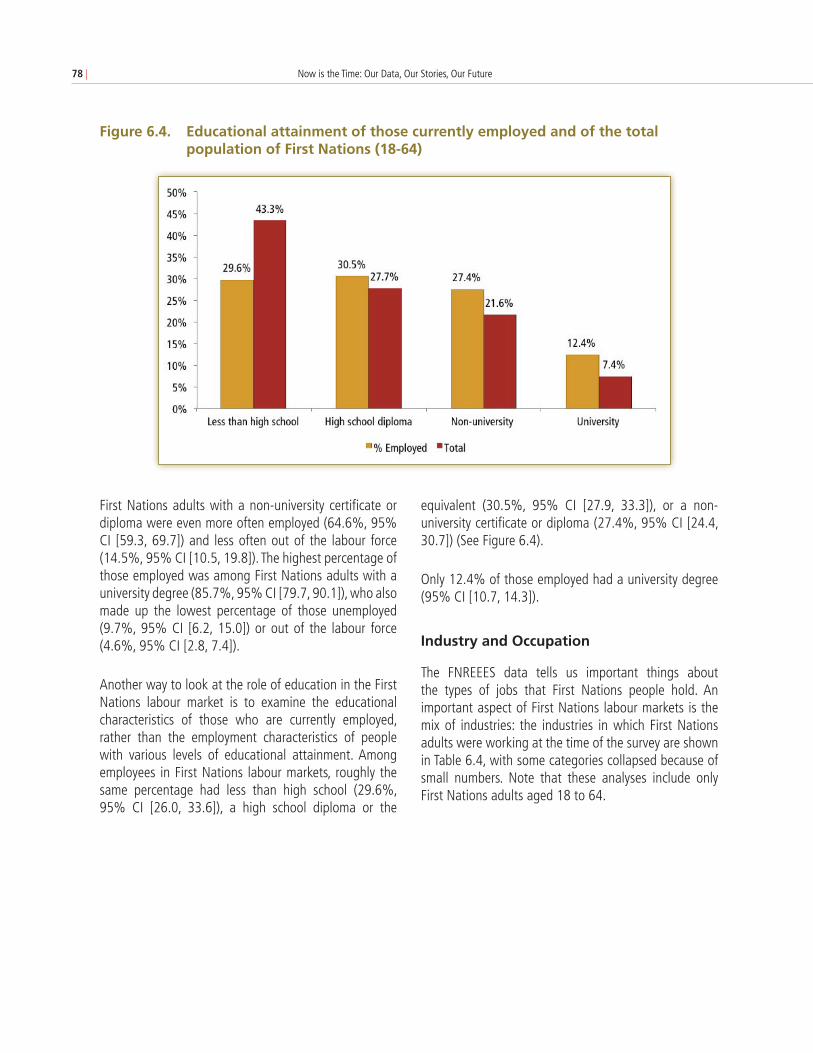
Now is the Time: Our Data, Our Stories, Our Future 78 |
First Nations adults with a non-university certificate or diploma were even more often employed (64.6%, 95% CI [59.3, 69.7]) and less often out of the labour force (14.5%, 95% CI [10.5, 19.8]). The highest percentage of those employed was among First Nations adults with a university degree (85.7%, 95% CI [79.7, 90.1]), who also made up the lowest percentage of those unemployed (9.7%, 95% CI [6.2, 15.0]) or out of the labour force (4.6%, 95% CI [2.8, 7.4]).
Another way to look at the role of education in the First Nations labour market is to examine the educational characteristics of those who are currently employed, rather than the employment characteristics of people with various levels of educational attainment. Among employees in First Nations labour markets, roughly the same percentage had less than high school (29.6%, 95% CI [26.0, 33.6]), a high school diploma or the
equivalent (30.5%, 95% CI [27.9, 33.3]), or a non-university certificate or diploma (27.4%, 95% CI [24.4, 30.7]) (See Figure 6.4).
Only 12.4% of those employed had a university degree (95% CI [10.7, 14.3]).
Industry and Occupation
The FNREEES data tells us important things about the types of jobs that First Nations people hold. An important aspect of First Nations labour markets is the mix of industries: the industries in which First Nations adults were working at the time of the survey are shown in Table 6.4, with some categories collapsed because of small numbers. Note that these analyses include only First Nations adults aged 18 to 64.
Figure 6.4. Educational attainment of those currently employed and of the total population of First Nations (18-64)

The National Report of the First Nations Regional Early Childhood, Education, and Employment Survey | 79
Table 6.4. Industry of main job among employed First Nations adults (18-64)
% 95% CI
First Nations government or organization
40.5 [37.6, 43.5]
Educational services 9.8 [8.5, 11.4]
Agriculture, forestry, fishing and hunting; mining, quarrying, and oil and gas extraction; utilities
8.1 [6.7, 9.8]
Health care and social assistance; public administration
7.7 [5.9, 10.0]
Construction 7.5 [6.2, 9.0]
Manufacturing, wholesale trade, retail trade, transportation and warehousing
5.3E [3.8, 7.4]
Arts, entertainment and recreation; accommodation and food services; tourism
4.9 [3.8, 6.3]
Other services, excluding public administration
2.2 [1.6, 3.0]
Information; finance; real estate; professional, scientific, and technical services; management and administration
1.5E [1.0, 2.1]
Other (no option to specify) 12.5 [10.9, 14.3]
Note. E High sampling variability, interpret with caution.
More than half of the employment reported was in First Nations government (including First Nations organizations,
public administration, health, administration, and educational services). First Nations themselves were major employers of First Nations members: the industry that employed the largest proportion of First Nations members was a First Nations government or organization, which accounted for 40.5% (95% CI [37.6, 43.5]).
Nearly 1 in 10 First Nations adults (9.8%, 95% CI [8.5, 11.4]) reported working in education. Health care, social assistance, and public administration, were responsible for a combined an 7.7% of employment (95% CI [5.9, 10.0]).
Resource industries (which included agriculture, forestry, fishing, mining, gas and oil, and utilities) were also major employers. Combined, these industries were, responsible for 8.1% (95% CI [6.7, 9.8]) of employment, with construction accounting for another 7.5% (95% CI [6.2, 9.0]). Manufacturing, wholesale and retail trade, along with transportation and warehousing, employed 5.3% (95% CI [3.8, 7.4]), but with a large degree of sampling variability (i.e., this estimate should be interpreted with caution).
Nearly 1 in 20 employed First Nations adults reported working in arts and entertainment, accommodation, and tourism industries (4.9%, 95% CI [3.8, 6.3]). Smaller proportions were working in services outside of public administration (2.2%, 95% CI [1.6, 3.0]) and in information, finance, real estate, professional services, and management and administration (1.5%, 95% CI [1.0, 2.1]).
Within industries, people work in a number of different roles or occupations (See Table 6.5).
% 95% CI
Plant and machine operatives or other labouring jobs 22.6 [20.5, 24.8]
Professional or technical staff (e.g., engineers, scientists, teachers, scientific technicians, nurses) 19.3 [17.2, 21.5]
Managers and administrators or more senior staff 17.1 [15.0, 19.5]
Personal and protective service staff (e.g., catering staff, hairdressers, domestic staff, security guards) 14.8 [13.2, 16.6]
Clerical or secretarial staff 10.4 [8.8, 12.4]
Craft and other skilled manual workers (e.g., skilled construction workers, electronic trade workers, textile workers)
9.9 [8.4, 11.7]
Sales staff 3.8E [2.6, 5.5]
Other (write in response) 2.0 [1.6, 2.7]
Table 6.5. Occupation of main job among employed First Nations adults (18-64)
Note.E High sampling variability, interpret with caution.

Now is the Time: Our Data, Our Stories, Our Future 80 |
Jobs that generally require a high degree of experience or training accounted for over one-third of all occupations. This included managers and senior administrators, which were 17.1% of jobs (95% CI [15.0, 19.5]), and professional and technical jobs, which were another 19.3% (95% CI [17.2, 21.5]).
More than one-fifth of those working in First Nations communities were occupied in plant or machine operation or other labouring jobs (22.6%, 95% CI [20.5, 24.8]), the next largest single category of those with jobs were working in personal or protective service jobs (14.8%, 95% CI [13.2, 16.6]); 10.4% worked as clerical or secretarial staff (95% CI [8.8, 12.4]); 9.9% were craft and other skilled manual workers (95% CI [8.4, 11.7]); and, 3.8% were working as sales staff (95% CI [2.6, 5.5]).
Hours of Work and Employment Situation
The FNREEES asked several questions related to employment situations. For the job at which they worked the most hours, respondents were asked how many paid hours they usually worked per week, “on average,” excluding overtime. Figure 6.6 presents the percentages of hours worked in an average week, by age range.
The majority of First Nations adults who were employed (85.5%, 95% CI [83.4, 87.4]) had a “main job” at which they worked at least 30 hours. We can see in Figure 6.6
that a higher percentage of young First Nations adults aged 18 to 24 (28.8%, 95% CI [22.4, 36.1]), compared to those aged 25 to 44 (13.0%, 95% CI [10.3, 16.3]) or those who were 45 to 64 (11.8%, 95% CI [9.4, 14.7]), had a main job that was part-time, or less than 30 hours a week.
First Nations adults 65 years and older were also more likely to work part-time than those in the middle age ranges (28.1%, 95% CI [20.5, 37.2]). Overall, significantly more First Nations women worked part-time (17.7%, 95% CI [14.7, 21.2]) compared with men (11.3%, 95% CI [9.2, 13.8]).
The FNREEES asked First Nations adults who were working less than 30 hours a week what was the main reason that they worked less than 30 hours per week. The responses
can be found in Table 6.6. These estimates should be treated with caution because of some small numbers and high sampling variability, but they do give some indication as to why people worked less than full-time.
More than half (53.4%, 95% CI [46.4, 60.3]) reported that this was because of business conditions or that they could not find more work. However, a large proportion of First Nations adults indicated that they were working part-time because of their own preferences (17.6%, 95% CI [13.7, 22.2]) or because they were caring for someone else or had other family responsibilities (13.8%, 95% CI [9.7, 19.4]).
Figure 6.6. Hours worked per week at main job by age group among employed First Nations adults (18+)

The National Report of the First Nations Regional Early Childhood, Education, and Employment Survey | 81
Table 6.6. Most common reasons for working less than 30 hours per week among employed First Nations adults (18+)
% 95% CI
Could not find more/business conditions
53.4 [46.4, 60.3]
Own preference/did not want more
17.6 [13.7, 22.2]
Caring, personal or family responsibilities
13.8E [9.7, 19.4]
Going to school 9.2E [6.3, 13.4]
Own illness or disability 3.9E [2.4,6.2]
Other F F
Total 100 [ - ]
Note. E High sampling variability, interpret with caution.
Of course, some people worked at other jobs in addition to their main job. Indeed, 20.0% (95% CI [17.0, 23.5]) of First Nations adults who were currently working indicated that they had more than one job at the time of the survey.
The survey also asked about the work arrangements of the main job (See Figure 6.7). Most people who were working had a main job that was permanent, compared with those who were working in temporary, seasonal, term, or contract employment. More employed First Nations women had a main job that was permanent (65%, 95% CI [61.4, 68.4]) compared to men (58.2%, 95% CI [54.4, 62.0]), but this difference is not statistically significant.
Figure 6.7. Permanent and temporary job tenure of employed First Nations adults (18+) by gender
Commuting and Working in Other Communities
Not all First Nations residents worked within a First Nations community. Some commuted to work, either to another First Nations community or outside a First Nations community. Of those who were working, nearly
one-quarter (22.1% (95% CI [19.2, 25.2]) had a main job that was located outside a First Nations community. The survey asked the main reason for this, which can be found in Table 6.7 (Note: some categories are collapsed because of small numbers).

Now is the Time: Our Data, Our Stories, Our Future 82 |
Table 6.7. Main reason for commuting to work outside a First Nations community among First Nations adults (18+)
% 95% CI
No jobs in my community; Jobs available in my community are not related to my areas of training or interest
51.7 [46.6, 56.8]
Higher wages/Pay; Better training opportunities; education/Professional recognition and advancement
38.7 [33.9, 43.8]
Job security 6.2E [4.2, 9.1]
Perks/Services (e.g., on-site day care, close to child’s school, pen-sion, etc…); Other
3.4E [2.2, 5.1]
Total 100 [ - ]
Note. E High sampling variability, interpret with caution.
The local labour market and the employment opportunities available were the major reasons people gave for working outside a First Nations community. A majority of First Nations adults who worked outside a First Nations community (51.7%, 95% CI [46.6, 56.8]) indicated that this was because there were no suitable jobs in the community. More than one-third (38.7%, 95% CI [33.9, 43.8]) did so because they felt they could receive higher wages, better training, education, personal recognition, or career advancement by working outside a First Nations community. Although the estimate should be treated with caution because of sampling variability, an additional 6.2% indicated job security as a main reason (95% CI [4.2, 9.1]), while 3.4% (95% CI [2.2, 5.1]) worked outside a First Nations community for other reasons, including the availability of “perks or services,” such as on-site daycare, being close to a child’s school, and pensions as well as other responses.
The FNREEES also asked First Nations adults whose main job was on reserve or in northern First Nations communities (77.9% of those working, 95% CI [74.9, 80.7]), the reasons that they choose to work in a First Nations community (See Table 6.8).
Table 6.8. Main reasons for choosing to work within a First Nations community among First Nations Adults (18+)
% 95% CI
To be close to family 29.4 [26.9, 32.1]
To give back to the community 22.9 [20.5, 25.5]
Financial reasons 17.6 [15.2, 20.3]
To build capacity in my community/ Support community development
14.8 [12.2, 17.8]
To stay connected to my culture, language, and traditions
8.7 [7.3, 10.3]
To create opportunities for others 3.7 [2.7, 5.0]
Other (write-in response) 2.9 [2.1, 3.9]
Total 100 [ - ]
The most common reasons for working within a First Nations community were related to family and community: nearly one-third (29.4%, 95% CI [26.9, 32.1]) worked within a First Nations community to be close to family, while 22.9% (95% CI [20.5, 25.5]) did so to “give back to the community.” Another 14.8% (95% CI [12.2, 17.8]) worked within a First Nations community to build capacity or support economic development, and 3.7% (95% CI [2.7, 5.0]) said they were motivated by creating opportunities for others.
An additional 8.7% (95% CI [7.3, 10.3]) worked within a First Nations community as a means of staying connected to their culture, language, and traditions, while 17.6% (95% CI [15.2, 20.3]) chose to work within a First Nations community for financial reasons.
DISCUSSION AND CONCLUSIONS
The FNREEES data tell us several important things about the characteristics of First Nations labour markets. In general, large proportions of the First Nations population were connected to the labour market, either working or looking for work at the time of the survey. As we might expect, labour market participation among First Nations adults varied with life-course stage, with young adults (18 to 24) and older adults (65 and older) least likely to be connected to paid work.

The National Report of the First Nations Regional Early Childhood, Education, and Employment Survey | 83
The FNREEES data provide some further evidence that a lack of available employment opportunities is a problem in many First Nations communities, and especially for men and for young adults. It was found that employment rates and labour force participation are related to community size, and the survey provides some evidence that those living in smaller communities are more likely to be employed or in the labour force. Although previous research has connected remoteness and employment, no such relationship was found here.
As the First Nations Holistic Lifelong Learning Model recognizes, formal educational credentials are only one aspect of learning, and there are many other types of knowledge and experience that might be important for employment in a First Nations context (Canadian Council on Learning, 2007). Nonetheless, people’s labour market experiences can be expected to differ by their level of formal educational attainment. In fact, analysis of the FNREEES data indicated that First Nations adults who had formal educational qualifications above high school were more often in the labour force and employed. The fact that a large percentage of those who were employed had a high school diploma or less indicates that First Nations labour markets do provide employment for people with a range of educational credentials.
The FNREEES data also tell us about the types of jobs that are available in First Nations communities. First Nations communities themselves were major employers of First Nations members: more than half of those who were working had jobs in First Nations government or organizations, such as public services, education, and health care. This characteristic of the First Nations labour market is important and underlines the link between funding for public services in First Nations communities and employment opportunities. While there were jobs in a range of other industries, including technical, retail, and
service sectors, the FNREEES shows that construction and resource industries were responsible for about 15% of employment.
Work that is not based on a permanent, full-time job has sometimes been referred to as “precarious” or “contingent” reflecting a lack of security or stability in work arrangements. However, these “nonstandard” work arrangements might also allow people to combine work with other activities (Vosko, Zukewich, & Cranford, 2003).
From a holistic, lifelong learning perspective part-time, temporary, or seasonal work may in some cases provide flexibility to combine paid employment with caregiving or other activities, at various points in people’s life courses. The FNREEES also gives us insight into how First Nations adults combine paid work and other aspects of their lives.
While most employed First Nations adults were working full-time, a sizable proportion of First Nations adults were working less than 30 hours per week at their main jobs, and about one-third were doing so because of a lack of suitable opportunities. However, other important reasons given for working part-time include caring for others or because of people’s own preferences.
The questions related to commuting for work also tell us something about the place of work in people’s lives. Some people did commute to work in another community, in many cases because they were unable to find job opportunities in their community. However, for the majority of people who worked in a First Nations community the reasons given for choosing to work there were related to their ability to contribute to the community or to be close to family. This is further evidence that paid employment and decisions related to the labour market should not be considered separately from other aspects of people’s lives.

Now is the Time: Our Data, Our Stories, Our Future 84 |
REFERENCES
Canadian Council On Learning. (2007). First Nations Holistic Lifelong Learning Model. Retrieved August 21, 2015, from Http://Firstnationspedagogy.Ca/CCL_Learning_Model_FN.Pdf
Cloutier, E., & Langlet, E. (2014). Aboriginal Peoples Survey, 2012: Concepts and methods guide. Ottawa: Minister Of Industry.
Galarneau, D. (2010). Temporary Employment in the downturn. Perspectives on Labour and Income, 11(5), 5–17.
Indigenous and Northern Affairs Canada. (2015). Definitions—Geography. Retrieved January 28, 2016, from Http://Pse5-Esd5.Ainc-Inac.Gc.Ca/Fnp/Main/Definitions.Aspx - Geography
Sharpe, A., & Lapointe, S. (2011). The Labour market and economic performance of Canada’s First Nations reserves: The role of educational attainment and remoteness. Ottawa: Centre for the Study of Living Standards.
Statistics Canada. (2012a). National Occupational Classificatin (NOC) 2011. Ottawa: Mininster Of Industry.
Statistics Canada. (2012b). North American Industry Classification Systems (NAICS) Canada. Ottawa: Minister Of Industry.
Statistics Canada. (2014). Guide to the Labour Force Survey. Ottawa: Minister Of Industry.
Statistics Canada. (2015). NHS Questionaires and guides. Retrieved January 7, 2015, from Https://Www12.Statcan.Gc.Ca/Nhs-Enm/2011/Ref/About-Apropos/Ques_Guide-Eng.Cfm
Vosko, L. F., Zukewich, N., & Cranford, C. (2003). Precarious jobs: A New typology of employment. Perspectives on Labour and Income, 4(10).

The National Report of the First Nations Regional Early Childhood, Education, and Employment Survey | 85
First Nations Employment, Skills, and Mobility
EXECUTIVE SUMMARY
This chapter investigates employment, skills, and mobility for First Nations youth (aged 15 to 17) and adults (aged 18 and over) living in reserve and northern communities in Canada. It explores employment and unemployment rates within First Nations communities, the industries in which First Nations youth and adults participate, the location of their employment, and their willingness to seek employment outside their communities. Further, it investigates the degree to which First Nations youth and adults fare on a number of fundamental skills related to current and future labour market opportunities.
The findings of the FNREEES suggest that the kind of short term employment opportunities that will be available in high-demand industries and occupations in the coming years can be accessible to First Nations people. However, the data highlight the importance of developing a further understanding of the barriers to First Nations employment within First Nations communities.
It also highlights the significance of seeking improvements in employment opportunities through strengthening the First Nations investment climate, improving the facilitation of First Nations labour mobility, and advancing further research to fill the information gap related to the First Nations labour market. This includes further analysis of FNREEES data and points to the need for future research on essential skills and to the need for greater capacity development at the community level. The application of this research could help alleviate skills mismatches within the labour market in Canada, within and outside First Nations communities.
KEY FINDINGS
• The employment rate of First Nations people living on reserve and in northern communities remains well-below the general population’s average: employment
is 48.7% for First Nations adults and 17.6% for First Nations youth. There is no significant gender difference.
• The unemployment rate of First Nations adults remains well-above that of the general population. The unemployment rate was higher among adult males (36.5%) than among adult females (24.8%).
• Among First Nations youth and adults who were working for pay at the time of the survey, a large proportion of those living on reserve or in northern First Nations communities work in First Nations government or First Nations organizations (40.4% and 32.1%, respectively).
• Among First Nations adults who are currently working for pay, more than three-quarters (77.9%) worked on reserve, while 22.1% worked off-reserve.
• Among the First Nations people who commute off-reserve for work, more than half of adults (51.7%) and a large majority of youth (83.7%) cited a lack of jobs, lack of suitable jobs related to their areas of training, or interest as the main reason for commuting.
• Of those willing to move, the majority of youth (73.2%) and adults (83.5%) indicated a willingness to move off-reserve; and more than half of youth (50.3%) and adults (53.7%) indicated a willingness to move to another First Nations community.
• Of those First Nations adults not willing to move the main reason cited was satisfaction with their employment situation (47.0%).
• Based on five fundamental employment skills, 58.4% of adults and 68.7% of youth reported that they have poor, fair, or good proficiency.
• When asked whether they have ever been provided with examples of how to write a resume and a cover letter and how to prepare for a job interview, a large proportion of First Nations youth (71.9%) and adults (79.4%) indicated that they had received at least one of these supports.
CHAPTER 7

Now is the Time: Our Data, Our Stories, Our Future 86 |
INTRODUCTION
Indigenous, and particularly First Nations, populations are a younger and faster-growing population than the general Canadian population (National Aboriginal Economic Development Board [NAEDB], 2015). Additionally, First Nations people living within First Nations communities are the most underemployed sub-populations of the Canadian labour force (NAEDB, 2015). This is significant as about half of the Indigenous population in Canada is within the prime working-age range of 25 to 64 (Indigenous and Northern Affairs Canada [INAC], 2011). Concurrently as an aging society, Canada is facing a number of productivity and policy challenges in the future. As a result, growing Indigenous and First Nations economies should be at the forefront of policy considerations for Canada as the country will increasingly be dependent on the participation and productivity of this segment of the labour force (Klinga, 2012).
One of the greatest challenges confronting the Indigenous population is the number of young adults entering the labour market (Statistics Canada, 2005; Wetere, 2014). Unfortunately, First Nations people living within First Nations communities face a number of barriers related to employment. Evidence shows that there is currently a lack of employment opportunities within reserve and northern First Nations communities (Richards, 2013; Employment and Social Development Canada [ESDC], 2015a).
In the general population in Canada more than three times as many jobs are created by the private sector compared to the public sector. However, this is not reflected in First Nations reserve and northern communities (Statistics Canada, 2015a). There is also empirical evidence that private investment and private-sector employment is lower in First Nations communities than the general population (Tulo Centre of Indigenous Economics, 2015; Fiscal Realities, 2012a; Graham, 2012).
Further, according to the Canadian Occupational Projection System (Employment and Social Development Canada’s, 2013a), nearly three-quarters (71.7%) of projected employment growth over the next 10 years will be in high-skilled occupations. In order for young people to capitalize on projected future economic opportunities they will need to possess skills that are in labour market demand, that is, those that correspond with high-skilled occupations.
METHODS
The primary data source used for this chapter was the youth (aged 15-17) and adult (aged 18+ unless stated otherwise) employment components of the FNREEES. The employment component of the FNREEES contains a number of indicators developed utilizing the First Nations Holistic Lifelong Learning Model, which formed the basis for the inquiries that were provided to First Nations survey participants. Focusing on the community wellness indicators and, more specifically, the employment domain, this chapter utilizes a number of questions asked in relation to employment, mobility, and skills. In general, statistical analysis of the FNREEES data in this chapter was limited to frequency and descriptive statistics.
Specifically, the FNREEES asked First Nations people living on reserve and in northern First Nations communities whether they were currently employed. Employed individuals were subsequently asked which industries they were employed in and where their workplace was located (within First Nations communities or outside First Nations communities).
In regards to mobility, employed individuals were asked whether they were willing to move to another community to improve their job or career opportunities. If they answered yes to this question, they were asked whether they were willing to move to another First Nations community (on reserve) or outside a First Nations community (off-reserve) to improve their career opportunities. For this chapter, these two questions were combined to show the percentage of employed First Nations that are either willing or unwilling to move, and further broke down those who were willing to move into three categories: those willing to move only to another First Nations community, those willing to move only outside First Nations communities, and those willing to move to either another First Nations community or outside a First Nations community.
In addition, employed individuals who indicated they would not be willing to move were asked their main reason why, i.e., happy with job situation; miss family or friends; no guarantee of employment elsewhere; uncertainty; cultural, linguistic, or social reasons; cost of living; moving expenses; family responsibilities. Employed individuals who worked outside First Nations communities were also asked the main reason why: no jobs available in the community or

The National Report of the First Nations Regional Early Childhood, Education, and Employment Survey | 87
related to their area of expertise, higher wages or pay, better training opportunities, job security, education or professional recognition, and advancement or perks and services.
To gauge job skills, all First Nations youth and adults were asked to evaluate their abilities (poor, fair, good, very good, or excellent) in computer use, reading, oral communication, mathematics, and writing.
To gauge the amount of support for obtaining employment First Nations people were receiving all youth and adults were asked whether they have ever been provided with examples of how to write a resume, how to write a cover letter, and how to prepare for a job interview.
RESULTS
Employment
The employment rate is the number of employed persons as a percentage of the total adult population (percentage of persons currently working for pay at the time of the survey). For youth, it is the number of employed persons as a percentage of the total youth population (those aged 12 to 17).
The employment rate for First Nations adults is 48.7% (95% CI [46.7, 50.8]) and 17.6% (95% CI [15.6, 19.8]) for First Nations youth. No significant gender difference was observed.
Unemployment
The unemployment rate for First Nations adults was 31.1% (95% CI [28.8, 33.6]), with a significantly higher percentage of adult males (36.5%, 95% CI [32.4, 40.7]) being unemployed compared to females (24.8%, 95% CI [22.4, 27.3]). The unemployment rate of First Nations adult males aged 18 to 64 is 36.6% (95% CI [32.5, 40.8]), and the rate for adult females aged 18 to 64 is 25.3% (95% CI [22.9, 27.8]).
Employment Industries
First Nations government and organizations were a major employer of First Nations people within First Nations communities. Among First Nations adults and youth who were working for pay at the time of the survey, a large proportion of adults (40.4%, 95% CI [37.6, 43.4]) and youth (32.1%, 95% CI [26.9, 37.8]) work in First Nations government or First Nations organizations (See Table 7.1).
Table 7.1. Employment industries among First Nations adults (18+) and youth (12-17)
IndustryAdult % [95% CI]
Youth % [95% CI]
First Nations government or organization
40.4 [37.6, 43.4] 32.1 [26.9, 37.8]
Educational services 10.1 [8.8, 11.6] F
Construction 7.3 [6.0, 8.7] F
Health care and social assistance
7.2 [5.5, 9.5] F
Mining, quarrying, and oil and gas extraction
3.6E [2.5, 5.1] F
Agriculture, forestry, fishing and hunting
3.4 [2.7, 4.2] F
Retail trade 2.9E [1.8, 4.6] 14.1E [9.1, 21.1]
Accommodation and food services
2.3 [1.7, 3.1] 5.1E [3.7, 7.1]
Other services (except public administration)
2.2 [1.6, 2.9] F
Arts, entertainment, and recreation
2.0 [1.3, 2.9] 1.6E [0.9, 3.0]
Transportation and warehousing
1.7E [1.1, 2.6] F
Utilities 1.0E [0.7, 1.6] 3.2[2.4, 4.3]
Professional, scientific, and technical services
0.6 [0.3, 1.0] F
Manufacturing 0.5E [0.3, 1.0] F
Public administration 0.5E [0.3, 0.8] F
Other 12.5 [11.0, 14.3] 15.2 [11.3, 20.1]
Note. E High sampling variability, interpret with caution F Suppressed due to low cell count or very high sampling variability.

Now is the Time: Our Data, Our Stories, Our Future 88 |
Employment Location
Among First Nations adults who were working for pay at the time of data collection, more than three-quarters (77.9%, 95% CI [74.9, 80.7]) reported working within a First Nations community, while nearly one-quarter (22.1%, 95% CI [19.3, 25.1]) reported working outside a First Nations community.
Among First Nations youth who reported working for pay, 71.7% (95% CI [65.4, 77.3]) reported working within a First Nations community, while 28.3% (95% CI [22.7, 34.6]) reported working outside a First Nations community.
Among First Nations people who commute for work, more than half of adults (51.7%, 95% CI [46.6, 56.8]) and the large majority of youth (83.7%, 95% CI [78.0, 88.1]) cited a lack of jobs or suitable jobs related to their areas of training or interest as the main reason for commuting outside First Nations communities (See Table 7.2).
Table 7.2. Reasons for First Nations adults and youth to commute outside a First Nations community
Reasons Adult % [95% CI]
Youth % [95% CI]
No available jobs in community/Job not related to areas of expertise
51.7[46.6, 56.8]
83.7[78.0, 88.1]
Higher wages/ better training, education, advancement
38.7[33.9, 43.8]
10.5E
[7.2, 14.9]
Job security6.2E
[4.2, 9.1]F
Other, including perks/services
3.4E
[2.2, 5.1]F
Total 100 [ - ]Note. E High sampling variability, interpret with caution F Suppressed due to low cell count or very high sampling variability.
Mobility
Among those First Nations people who were working for pay, more than half of adults (54.2%, 95% CI [51.0, 57.4]) and nearly two-thirds of youth (60.4%, 95% CI [51.5, 68.6]) said that they would be willing to move to another community in order to improve their employment opportunities (See Figure 7.2). Of those willing to move, a large proportion of both adults (83.5%, 95% CI [80.9, 85.8]) and youth (73.2%, 95% CI [67.1, 78.5]) indicated a willingness to move outside a First Nations community (i.e., off-reserve).
More than half of First Nations adults (53.7%, 95% CI [48.9, 58.4]) and youth (50.3%, 95% CI [44.3, 56.3]) who were willing to move said they would be willing to move to another First Nations community (See Figure 7.3).
Of those First Nations adults who said they were not willing to move for employment reasons, the main reason cited (47.0%, 95% CI [43.3, 50.7]) was that they were “happy with their job situation” (See Table 7.3).
Figure 7.2. Willingness to move outside a First Nations community among First Nations adults and youth

The National Report of the First Nations Regional Early Childhood, Education, and Employment Survey | 89
Table 7.3. Main reason First Nations adults are not willing to move for employment opportunities
Reasons % 95% CI
Happy with job situation 47.0 [43.3, 50.7]
Miss family/friends 17.3 [13.5, 22.0]
Other family responsibilities 10.6 [8.5, 13.2]
Cost of living elsewhere too high 4.5 [3.3, 6.0]
Cultural, linguistic, or social reasons 4.3E [2.8, 6.8]
No guarantee of finding work elsewhere
4.3 [3.2, 5.8]
Caring for own child 3.6E [2.6, 5.0]
Other 2.9E [1.9, 4.2]
Uncertainty / Afraid of changes (different city, people)
1.9E [1.2, 2.8]
Moving too expensive 1.5E [1.0, 2.2]
About to retire/ Old age 1.4E [0.9, 2.2]
Still in school F F
Maintain access to healthcare F F
Education/ Professional recognition F F
Total 100 [ - ]
Employment Skills
According to the FNREEES, more than half of First Nations adults (58.4%, 95% CI [56.4, 60.4) and more than two-thirds of First Nations youth (68.7%, 95% CI [65.8, 71.5]) said they had poor, fair, or good proficiency in a combined set of fundamental employment skills (computer use, reading, oral communication, mathematics, and writing). Only 41.6% of adults (95% CI [39.6, 43.6]) and less than one-third of youth (31.3%, 95% CI [28.5, 34.2]) said they had very good or excellent levels of these fundamental job skills (See Figure 7.4).
Comparing the scale utilized in the FNREEES to that of the International Adult Literacy and Skills Survey (IALSS) (Eaton, 2011) these results indicate that the majority of First Nations adults and youth are at or below, Level 3; the “skill level needed to take full advantage of education at the post-secondary level, to manage everyday health demands, to compete in Canada’s labour markets and to participate democratically” (Murray & Shillington, 2012, p. 8).
Figure 7.3. Willingness to move to another First Nations community among First Nations adults and youth
Note. E High sampling variability, interpret with caution F Suppressed due to low cell count or very high sampling variability.

Now is the Time: Our Data, Our Stories, Our Future 90 |
First Nations adults indicated that they possess better reading and oral communication skills, compared to computer, mathematics, and writing skills; while First
Nations youth self-rated their computer use and reading skills higher than oral communication, mathematics, and writing (See Tables 7.4 and 7.5).
Figure 7.4. Self-reported levels of combined job-related skills among First Nations adults and youth
Table 7.4. Self-rated job-related skills among First Nations adults
Skills(Adult)
Poor% [95% CI]
Fair% [95% CI]
Good% [95% CI]
Very good% [95% CI]
Excellent% [95% CI]
Computer Use 14.2[12.8, 15.7]
16.0[14.4, 17.8]
22.9[21.0, 24.9]
23.1[21.1, 25.3]
23.8[22.3, 25.3]
Reading 4.0[3.3, 5.0]
10.3[9.0, 11.7]
27.6[25.8, 29.5]
28.8[26.8, 30.9]
29.2[27.6, 30.9]
OralCommunication
5.9[4.9, 6.9]
12.3[11.1, 13.7]
30.5[28.9, 32.1]
27.3[25.2, 29.6]
24.0[22.3, 25.7]
Math 11.3[10.2, 12.6]
19.0[17.5, 20.6]
30.7[28.8, 32.7]
22.1[20.2, 24.1]
16.9[15.4, 18.5]
Writing 6.1[4.9, 7.5]
16.6[14.8, 18.5]
31.7[29.8, 33.7]
25.2[23.1, 27.4]
20.5[19.1, 22.0]
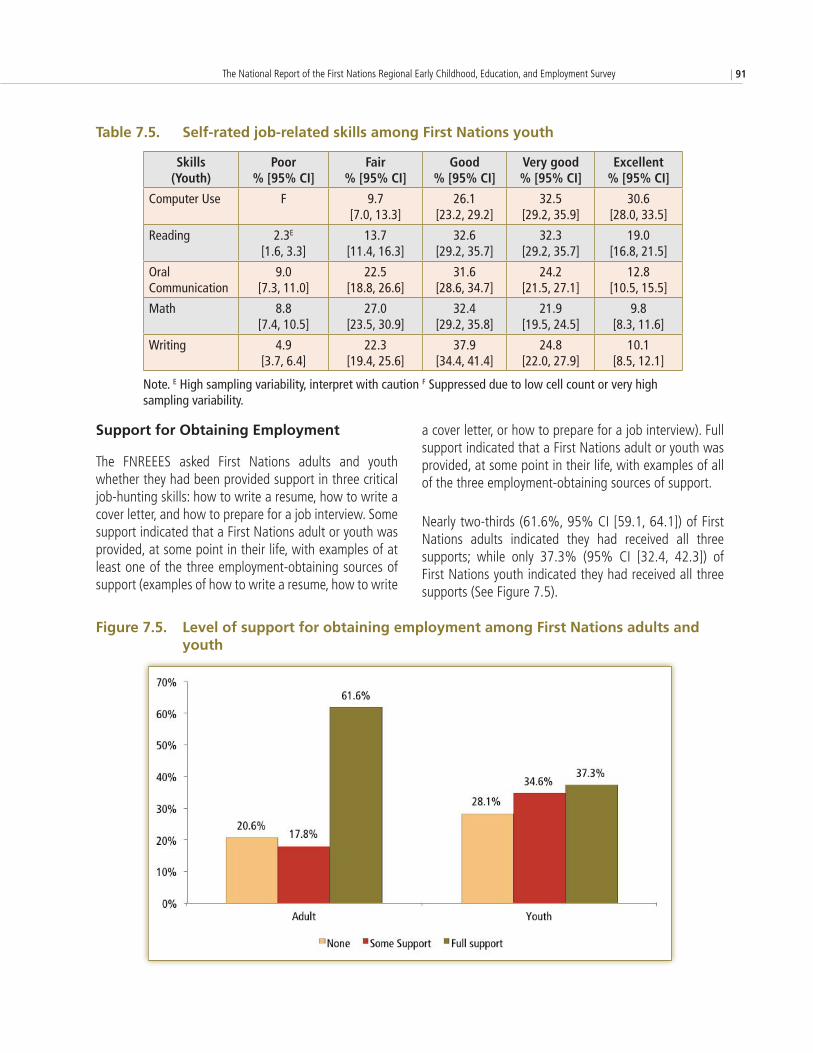
The National Report of the First Nations Regional Early Childhood, Education, and Employment Survey | 91
Table 7.5. Self-rated job-related skills among First Nations youth
Skills(Youth)
Poor% [95% CI]
Fair% [95% CI]
Good% [95% CI]
Very good% [95% CI]
Excellent% [95% CI]
Computer Use F 9.7[7.0, 13.3]
26.1[23.2, 29.2]
32.5[29.2, 35.9]
30.6[28.0, 33.5]
Reading 2.3E
[1.6, 3.3]13.7
[11.4, 16.3]32.6
[29.2, 35.7]32.3
[29.2, 35.7]19.0
[16.8, 21.5]
OralCommunication
9.0[7.3, 11.0]
22.5[18.8, 26.6]
31.6[28.6, 34.7]
24.2 [21.5, 27.1]
12.8[10.5, 15.5]
Math 8.8[7.4, 10.5]
27.0[23.5, 30.9]
32.4[29.2, 35.8]
21.9 [19.5, 24.5]
9.8[8.3, 11.6]
Writing 4.9[3.7, 6.4]
22.3[19.4, 25.6]
37.9[34.4, 41.4]
24.8 [22.0, 27.9]
10.1[8.5, 12.1]
Support for Obtaining Employment
The FNREEES asked First Nations adults and youth whether they had been provided support in three critical job-hunting skills: how to write a resume, how to write a cover letter, and how to prepare for a job interview. Some support indicated that a First Nations adult or youth was provided, at some point in their life, with examples of at least one of the three employment-obtaining sources of support (examples of how to write a resume, how to write
a cover letter, or how to prepare for a job interview). Full support indicated that a First Nations adult or youth was provided, at some point in their life, with examples of all of the three employment-obtaining sources of support.
Nearly two-thirds (61.6%, 95% CI [59.1, 64.1]) of First Nations adults indicated they had received all three supports; while only 37.3% (95% CI [32.4, 42.3]) of First Nations youth indicated they had received all three supports (See Figure 7.5).
Figure 7.5. Level of support for obtaining employment among First Nations adults and youth
Note. E High sampling variability, interpret with caution F Suppressed due to low cell count or very high sampling variability.

Now is the Time: Our Data, Our Stories, Our Future 92 |
DISCUSSION
Employment
The employment rate for First Nations adults (48.7%) living on reserve and in northern First Nations communities is significantly lower than the rate among the general non-First Nations population, and lower than First Nations people living off-reserve. There is also only a slight change from the RHS 2008/10, when it was reported that 47.2% (95%) of First Nations adults were working for pay (FNIGC, 2012).
According to Statistics Canada (2016), the employment rate of the non-First Nations Canadian population (aged 15 and over) is 61.3%; with differences among males (65.3%) and females (57.3%). The employment rate of First Nations people (aged 15 and over) living off -reserve is 50.7%.
Unemployment
As indicated previously, the results of the FNREEES suggest that First Nations adults are faced with comparatively high unemployment rates. Nearly 1 in 3 (31.1%) First Nations people living in First Nations communities are unemployed; this is more than that of off-reserve First Nations people and the general non-First Nations population in Canada.
In comparison, the unemployment rate of First Nations people (aged 15 and over) living off-reserve is less than half that of First Nations people living on reserve (14.7%), while the rate among the non-First Nations population (aged 15 and over) in Canada is 6.9%, or 4.5 times smaller.
Employment Industries
According to the FNREEES data, the main employers within First Nations communities are First Nations governments and organizations. Although the presence of this type of public-sector employment is important, having the First Nations government as the main employer suggests that the balance between private and public sectors in the rest of Canada is not evident within First Nations communities.
Outside of First Nations communities, public-sector employees make up 20.2% of all workers in Canada (Statistics Canada, 2015a), while the private sector accounts for more than three times as many jobs. (Statistics Canada, 2015a).
The employment structure within First Nations communities suggests that future strategies for creating jobs for the First Nations labour force should consider the participation and interaction of the public and the private sector, combined. This means the focus could be on strategies that aim to attract greater investment in the private sector, with the public sector assuming an active role in encouraging private investment (Tulo Centre of Indigenous Economics, 2015).
The implications of failing to attract private investment in First Nations communities is not only a lost investment, but can also contribute to a lack of job or business opportunities for individuals within the community, a minimal tax base and public revenues for the community, a lack of quality essential services comparable to those outside of First Nations communities, poverty, and out-migration (Tulo Centre of Indigenous Economics, 2015).
Mobility
According to the FNREEES, First Nations youth and adults are willing to commute outside of First Nations communities for employment opportunities and for jobs that suit their training or interest. In fact, about half of employed First Nations adults said they were willing to move to another community to improve their job or career opportunities, either to another First Nations community or a non-First Nations community, town, or city.
However, many adults said they were willing to stay in their own communities, with the main reason being their current happiness at their job. This suggests that First Nations adults may prefer living within First Nations communities (their own or another community) if career opportunities are available.
First Nations adults have seemingly expressed the desire to stay within their communities, however a shortage—or an absence—of job opportunities that match their training or interests presents a real challenge to this desire. As a result, some First Nations adults are finding it necessary to migrate outside their communities which has real impacts on the communities and families they leave behind. Cooke and O’Sullivan (2015) suggest that the implications of this are potential challenges to infrastructure or service delivery, community human capital, and social bonds within the community.

The National Report of the First Nations Regional Early Childhood, Education, and Employment Survey | 93
Employment Skills
In order for future employment opportunities to be realized, the appropriate skilled labour must be acquired. Specifically, in order to capitalize on opportunities young First Nations workers entering the labour market will need to possess skills that the labour market demands.
Unfortunately, the literature points to skill discrepancies among First Nations populations living on reserve and in northern First Nations communities, compared with First Nations people living outside of First Nations communities and non-First Nations Canadians.
Given this, how does this compare with the demand of labour? At first glance, the level of proficiency in each skill identified in the FNREEES (supply of labour) can be compared to that of the Essential Skills Research Project completed by ESDC (demand for labour) outlined previously.
First, it is prudent to identify the occupations that will be in demand in the future. ESDC established the Canadian Occupational Projection System in 2013, which developed projections of future trends in the number of job openings and job seekers by occupation at the national level. The projections allow for the identification of those occupations that may face labour shortage or labour surplus conditions in the years to come and thus provide opportunities for those seeking employment.
The latest projections of this system cover the period from 2013 to 2022 and are not only for jobs that will become available as a result of job growth, but also for those that will become available as a result of attrition, including retirement (ESDC, 2013).
Table 7.6. provides the strong, moderate, and weak growth industries according to the projections developed by ESDC (2013):
Table 7.6. Predicted top growth industries in Canada, 2013 through 2022
Growth Industry
Strongest
• Professional and scientific services
• Health care
• Mineral resources
• Construction
• Nonautomotive transportation
Moderate
• Consumer and protection services
• Educational services
• Some manufacturing (vehicles, wood products, metal fabrication and machinery, manufactured mineral products)
Weakest
• Oil and gas extraction
• Public administration
• Nonmineral primary industries (agricul-ture, forestry, and fishing)
• Most manufacturing
As illustrated in Table 7.6., occupations that will be most in demand in Canada, according to Innovation, Science and Economic Development Canada (2016), include those primarily in the following industries:
• Professional and scientific services: Consists of establishments primarily engaged in activities in which human capital is the major input. These establishments make available the knowledge and skills of their employees, often on an assignment basis. Examples include legal services; accounting, tax preparation, bookkeeping and payroll services; and computer systems design and related services occupations.
• Health care: Establishments primarily engaged in providing health care by diagnosis and treatment, providing residential care for medical and social reasons, and providing social assistance, such as counselling, welfare, child protection, community housing and food services, vocational rehabilitation and child care, to those requiring such assistance.
• Mineral resources: Establishments primarily engaged in extracting naturally occurring minerals.

Now is the Time: Our Data, Our Stories, Our Future 94 |
addition, McKellips (2015, p. 1) notes that “the mining, oil and gas extraction, and construction sectors report labour shortages in regions where Aboriginal unemployment is high. This suggests that Aboriginal workers do not have the right skills for the available jobs, although other factors such as cultural barriers and racism may also be relevant.”
Further, according to Murray and Shillington (2012), the impact of this projected employment growth in high-skilled occupations means a shift in average occupational skill levels from Level 2 to Level 3 (average for all skills defined by ESDC). More specifically, the Top 10 occupations that are projected to be in demand over that period, according to Innovation, Science and Economic Development Canada (2016), include:
• Specialist physicians (National Occupational Classification (NOC 3111)
• General practitioners and family physicians (NOC 3112)
• Database analysts and data administrators (NOC 2172)
• Professional occupations in business services to management (NOC 1122)
• Head nurses and supervisors (NOC 3151)
• Electricians (NOC 7241)
• Other technical occupations in therapy and assessment (NOC 3235)
• Information systems and data processing managers (NOC 0213)
• Underground production and development miners (NOC 8231)
• Physiotherapists (NOC 3142)
Utilizing ESDC’s Essential Skills Profiles, it is determined that all of the above occupations contain at least one task that requires at least a Level 4 proficiency, with about 50% requiring a task rated at Level 5 (ESDC, 2015b). Although this may suggest that, in general, First Nations adults and youth will have a difficult time obtaining employment in the future, it also provides insight into future potential priorities
for training and skills development programs that benefit First Nations people.
The results from the FNREEES show that First Nations adults indicated they possess relatively better reading and oral communication skills compared with computer use, mathematics, and writing skills, and First Nations youth rated their computer use and reading skills relatively better than their oral communication, mathematics, and writing skills. These areas where First Nations youth and adults self-rated their skills as fair or poor could be areas of focus for education and training.
An important caveat is that it is somewhat problematic to adequately compare the results from the two rating scales with any certainty considering the differences of methodology and survey questions asked. A number of the previous studies, most notably the International Adult Literacy and Skills Survey (IALSS) (Eaton, 2011), the Programme for the International Assessment of Adult Competencies (PIAAC) (Organisation for Economic Co-operation and Development, 2015), and the AALAT (The Saskatchewan Aboriginal Literacy Network Inc., 2011), assigned at least a component of their ratings based on a skill assessment. Further, the ESDC profiles were developed as a result of a rigorous evaluation of required skills for each occupation based on interviews and professional opinion.
Employment Skills and Job Readiness
Using self-reported skill assessments poses an issue when evaluating the job readiness of First Nations adults and youth living within First Nations communities. FNREEES job skills data are gathered through questions that ask First Nations people to rate their own abilities. Although some responses could be interpreted and compared with other skill evaluations outlined in the literature review, the methods used are quite different. Additionally, potential issues could arise as a result of a self-evaluation approach. The results are subject to participant honesty and image management, introspective ability, understanding, response bias, and interpretation of rating scales (Hoskin, 2012).
Another way by which the skills of First Nations adults and youth living within First Nations communities can be evaluated in a potentially less biased manner than self-reporting is to look at the current occupations that are held. Table 7.7. provides adult occupation data from the FNREEES.

The National Report of the First Nations Regional Early Childhood, Education, and Employment Survey | 95
Table 7.7. Occupation among First Nations adults
Occupation % 95% CI
Managers and administrators or more senior staff 17.2 [15.1., 19.6]
Other labouring jobs 15.9 [14.0, 18.0]
Personal and protective service staff (e.g., catering staff, hairdressers, domestic staff, security guards)
14.9 [13.3, 16.6]
Professional or technical staff (e.g., professional engineers, scientists, accountants, teachers, solicitors)
14.4 [12.7, 16.4]
Clerical or secretarial staff 10.3 [8.7, 12.2]
Craft and other skilled manual workers (e.g., skilled construction workers, electronic trade workers, textile workers)
9.7 [8.2, 11.4]
Plant and machine operatives 6.4 [5.0, 8.2]
Associate professional or technical staff (e.g., scientific technicians, computer programmers, nurses)
5.1 [4.2, 6.3]
Sales staff 3.7E [2.6, 5.4]
Other 2.3 [1.7, 3.0]
Total 100 [ - ]
Note. E High sampling variability, interpret with caution.
As illustrated above, many First Nations workers have jobs that require lower skills when compared to the types of jobs that are expected to be in high demand in the future. It is important to note, however, that this indicator does not provide a complete picture of the skills of the First Nations labour force; occupation is only one factor. Murray and Shillington (2012) suggest that many different factors impact employment skills. In their study they included factors such as age, gender, education, mother tongue, immigration status, province, and occupation.
Further research is required to assess the supply of skills of First Nations people compared to the skills demanded by the Canadian labour market. One way this could be done is to analyze the FNREEES data using a comparable methodology to that developed by Murray and Shillington (2012).
The authors used regression analysis based on the relationship between assessed literacy scores and personal characteristics (including age, gender, education, mother tongue, immigration status, province or territory, and occupation) outlined in the IALSS, to predict literacy scores of both the First Nations and nonFirst Nations populations. Further, they defined the demand for literacy skill by
applying ESDC’s Essential Skills Profiles to the distribution of employment by occupation from the 2006 Census.
Using this method was a way to compare supply and demand on similar terms. Subsequently, this may indicate the potential existence of skill mismatches and may be helpful in developing potential strategies to help alleviate them in order to match First Nations skills and training with employment opportunities. This can also help identify specific occupations and industries with potential opportunities where First Nations people may require further education and training to meet the appropriate qualifications.
Support for Obtaining Employment
Upon reviewing the data, it is difficult to accurately assess the appropriateness of support for employment that First Nations adults and youth are receiving. Additionally, it is beyond the scope of this chapter to evaluate the success of programs and initiatives designed to support the obtaining of employment; however, it is important to note that a large proportion of First Nations adults and youth currently working indicated they have received at least one of three identified sources of support for obtaining employment.

Now is the Time: Our Data, Our Stories, Our Future 96 |
CONCLUSIONS
According to the National Collaborating Centre for Aboriginal Health (2009), employment is a key determinant of physical and mental health. Adequate employment and income opportunities are important components in promoting individual well-being. A healthy economic environment impacts well-being by providing those opportunities for community members.
Unfortunately, at the present time employment opportunities for First Nations people living on reserve or in northern communities fall well behind those of the First Nations population living outside of First Nations communities and the non-First Nations population in Canada.
That said the employment opportunities available in Canada in the decade to come can be accessible for First Nations people in all of the high-demand future occupations and industries. It will be important to develop a further understanding of the barriers that exist to this goal and how they relate to First Nations employment within and outside First Nations communities (mobility and commuting).
Based on a review of FNREEES data, this chapter outlined three key barriers:
• Insufficient employment opportunities on First Nations lands: The lack of employment opportunities within First Nations communities is evident in the low employment rate, the high unemployment rate, the large proportion of public sector to private sector employment on First Nations lands, and a willingness to move offreserve in search of employment.
• Labour mobility: According to FNREEES data, First Nations adults and youth indicate a preference to work within First Nations communities. Although many employed First Nations adults indicate that they would move to another First Nations community or would move off-reserve to improve their job or career opportunities, the main reason cited for staying in their community was happiness with their current job. This suggests that First Nations adults may prefer living within First Nations communities (their own or another community) if opportunities are available. However, a shortage of job opportunities that match their training
or interests presents a challenge for them to do so. As a result, some First Nations adults are finding it necessary to migrate outside their communities, which has an impact on the communities they leave behind.
• Employment skills: It is difficult to discern the essential skill levels of First Nations adults and youth living within First Nations communities through this preliminary view of the data. As such, evaluating the supply of skills to the demand at a national level is inconclusive at this stage. As indicated in the literature and supported by an examination of FNREEES data, there appears to be some level of skill shortages and/or skill mismatches.
In order to address these barriers and empower First Nations people to potentially take advantage of future employment opportunities, it will be necessary to explore possible improvements in specific areas:
• First Nations institutions and the investment climate: The ability of an economy to generate employment and governmental or public revenues depends upon having sufficient private sector investment (Tulo Centre of Indigenous Economics, 2015). First Nations communities require the legal, fiscal, and administrative framework to support markets and develop a more balanced private sector–public sector economy and more employment opportunities.
• First Nations labour mobility: When suitable employment opportunities arise in First Nations communities or even outside of First Nations communities, First Nations job seekers should be sufficiently mobile to obtain these jobs. One reason for a lack of mobility (e.g., lack of migration) cited in other literature is a missing housing market within First Nations communities (Fiscal Realities, 2012b). Although more research is required in this area, this could mean there is insufficient housing to support potential increases in the labour force in some communities. As a result, this may impact the ability of First Nations people to move from their home communities to where employment opportunities exist within other First Nations communities.

The National Report of the First Nations Regional Early Childhood, Education, and Employment Survey | 97
• First Nations skills and training research: Further statistical analysis of FNREEES data in coordination with other skills-related data is necessary to better understand the skill profile of the First Nations population living on reserve and in northern First Nations communities.
• Capacity building: Lack of First Nations control over programming and lack of access to culturally relevant essential skills and technical skills training were two barriers to skills and training development outlined previously (Klinga, 2012). Further, it could be the case that current skills and training assessments are not culturally appropriate to be applied to First Nations populations living within First Nations communities. As such, First Nations skills and training programming should be focused on contributing social and economic development to First Nations communities; should enable program delivery by First Nations organizations or in partnership with First Nations; and should incorporate continuous support for First Nations people to develop the capacity to control their own education and training, where desired and necessary.
• Labour market information: There remains an information gap in relation to supplying timely labour market information to inform service delivery. According to the literature, there appears to be a need for more detailed and timely data on Indigenous labour market performance and job vacancies information for industries, occupations, and regions of particular interest to the Indigenous population to accurately forecast in-demand employment opportunities (McKellips, 2015; Statistics Canada, 2015b).
Consequently, it will be important for policy-makers, Canada and, most important, First Nations people to continue to develop an understanding of the barriers to employment within and outside of First Nations communities. The implications are significant not only for First Nations communities but also for the Canadian population as a whole. More data related to the First Nations labour market and future research on the alleviation of employment barriers must continue to be developed. This includes further analysis of FNREEES data, future research on essential skills, the application of this to First Nations labour markets, and alleviating future skills mismatches in Canada.

Now is the Time: Our Data, Our Stories, Our Future 98 |
REFERENCES
Cooke, M., & O’Sullivan, E. (2015). The impact of migration on the First Nations Community Well-Being Index. Social Indicators Research, 122(2), 371–389.
Eaton, S. E. (2011). What is the International Adult Literacy Skills Survey (IALSS)? A Canadian perspective. Literacy, Languages, and Leadership. https://drsaraheaton.wordpress.com/2011/05/01/what-is-the-international-adult-literacy-survey-ials-a-canadian-perspective/
Employment and Social Development Canada. (2013). Canadian occupational projection system: Job openings (2013–2022). http://occupations.esdc.gc.ca/sppc-cops/[email protected]?lid=22&fid=1&lang=en
Employment and Social Development Canada. (2015a). Aboriginal Labour Market Bulletin, 4(1). http://www.esdc.gc.ca/eng/jobs/aboriginal/bulletins/spring2015.shtml
Employment and Social Development Canada. (2015b). Guide to essential skills profiles. literacy and essential skills. http://www.esdc.gc.ca/en/essential_skills/profiles/guide.page
First Nations Information Governance Centre. (2012). First Nations Regional Health Survey (RHS) 2008/10: National report on adults, youth and children living in First Nations communities. Ottawa: First Nations Information Governance Centre http://fnigc.ca/sites/default/files/docs/first_nations_regional_health_survey_rhs_2008-10_-_national_report.pdf
Fiscal Realities Economists. (2012a). Supporting enterprise development II – The First Nation experience. Prepared for Aboriginal Affairs and Northern Development Canada.
Fiscal Realities Economists. (2012b). Improving on reserve housing outcomes: Stakeholders session summary. Prepared for Aboriginal Affairs and Northern Development Canada, Community Infrastructure Branch.
Graham, J. (2012). Dysfunctional governance: Eleven barriers to progress among Canada’s First Nations. Centre for the Study of Living Standards; Inroads. http://www.csls.ca/events/2012/cea.graham.pdf
Hoskin, R. (2012). The dangers of self-report. Brainwaves. http://www.sciencebrainwaves.com/the-dangers-of-self-report/
Indigenous and Northern Affairs Canada. (2011). Fact Sheet – 2011 National Household Survey Aboriginal demographics, educational attainment and labour market outcomes. From the 2011 National Household Survey from Statistics Canada. https://www.aadnc-aandc.gc.ca/eng/1376329205785/1376329233875#ft1a
Indigenous and Northern Affairs Canada. (2014). Registered Indian population by sex and residence. Statistics and Measurement Directorate. https://www.aadnc-aandc.gc.ca/eng/1429798605785/1429798785836#sec2
Indigenous and Northern Affairs Canada. (2015). The Community Well-Being Index: Well-being in First Nations communities, 1981–2011. Ottawa: Her Majesty the Queen in Right of Canada, represented by the Minister of Aboriginal Affairs and Northern Development. https://www.aadnc-aandc.gc.ca/eng/1345816651029/1345816742083
Innovation, Science and Economic Development Canada. (2016). Industries and business. Government of Canada. https://www.ic.gc.ca/eic/site/icgc.nsf/eng/h_07063.html
Klinga, S. (2012). State of practice: Essential skills applications with First Nations, Inuit & Metis in Canada. Canadian Career Development Foundation. http://www.ccdf.ca/ccdf/wp-content/uploads/2012/11/State-of-Practice-2012-10-30_FINAL.pdf
McKellips, F. (2015). Aboriginal labour market information in Canada: An overview. Centre for the Study of Living Standards. http://www.csls.ca/res_reports.asp

The National Report of the First Nations Regional Early Childhood, Education, and Employment Survey | 99
Murray, T.S., & Shillington, R. (2012). Understanding Aboriginal literacy markets in Canada: A segmentation analysis. Data Angel. Study funded by Human Resources and Skills Development Canada. www.dataangel.ca/docs/UnderstandingAboriginalLiteracy2012.pdf
National Aboriginal Economic Development Board. (2015). The Aboriginal economic progress report: 2015. http://www.naedb-cndea.com/reports/NAEDB-progress-report-june-2015.pdf
National Collaborating Centre for Aboriginal Health. (2009). Employment as a social determinant of First Nations, Inuit, and Metis health. http://www.nccah-ccnsa.ca/docs/fact%20sheets/social%20determinates/NCCAH_fs_employment_EN.pdf
Organisation for Economic Co-operation and Development. (2015). PIAAC main elements of the survey. http://www.oecd.org/site/piaac/mainelementsofthesurveyofadultskills.htm
Richards, J. (2013). Why is BC best? The role of provincial and reserve school systems in explaining Aboriginal student performance. C.D. Howe Institute: Commentary No. 390. https://www.cdhowe.org/pdf/Commentary_390.pdf
Saskatchewan Aboriginal Literacy Network Inc. (2011). Aboriginal Adult Literacy Assessment Tool (AALAT) Provincial Results. Saskatoon, SK, Canada.
Statistics Canada. (2005). Canada’s Aboriginal Population in 2017. The Daily. http://www.statcan.gc.ca/daily-quotidien/050628/dq050628d-eng.htm
Statistics Canada. (2015a). Table 282-0087 & 282-0089 Labour Force Survey (LFS), employment by age, type of work, class of worker and province (monthly) (Canada). Data from July 2015. http://www.statcan.gc.ca/tables-tableaux/sum-som/l01/cst01/labr66a-eng.htm
Statistics Canada. (2015b). Labour Force Survey, August 2015. http://www.statcan.gc.ca/daily-quotidien/150904/dq150904a-eng.htm
Statistics Canada. (2016). Table 282-0227 — Labour force survey estimates (LFS), by detailed Aboriginal group, sex and age group, Canada and selected regions, annual (persons unless otherwise noted). CANSIM (database). http://www5.statcan.gc.ca/cansim/a26#F14
Tulo Centre of Indigenous Economics. (2015). Building a competitive First Nation investment climate. First Edition. ISBN: 978-0-9940586-0-7. http://www.tulo.ca/textbook/
Wetere, R. H. (2014). Employment and literacy issues of Canada’s Aboriginal population: National skills upgrade 2014. Arrowmight. http://www.arrowmight.ca/docs/Employment%20and%20Literacy%20Issues.pdf

Now is the Time: Our Data, Our Stories, Our Future 100 |
Report Authors Kyla Marcoux, Katherine Wood, and Jarret Laughlin (Chapter 1: Introduction)
For the last four years Ms. Marcoux (FNIGC’s FNREEES Statistical Process Coordinator) and Ms. Wood (FNIGC’s FNREEES Technical Projects Coordinator) have been responsible for coordinating the roll-out and implementation of the FNREEES, and the production of the FNREEES National Report, which included preparing Chapter One.
Mr. Laughlin, who wrote the Holistic Lifelong Learning Models section of Chapter One, has been engaged in education research and policy development for more than 15 years. He is currently developing innovative education assessments that are rooted in a new, holistic approach aimed at engaging parents, teachers and Elders, ensuring the assessment is reflective of the local contexts and cultures of their students.
Dr. Margo Greenwood (Chapter 2: First Nations Early Childhood Education)
Dr. Greenwood is an Indigenous scholar of Cree ancestry with more than 25 years’ experience focused on the health and well-being of Indigenous children and families. Professionally and personally, children have been the focus of her life. She has worked as a front line caregiver of early childhood services, designed early childhood curriculum, programs, and evaluations, and taught early childhood education courses. As a mother of three, she is personally committed to the continued well-being of children and youth in Canada.
Esther Usborne (Chapter 3: First Nations Education)
Ms. Usborne completed a Ph.D. in social psychology at McGill University and a post-doctoral fellowship at the Université de Montréal. She has more than 10 years of experience in research and policy analysis in the areas of First Nations and Inuit education and health. She
has worked with First Nations and Inuit communities on projects exploring the benefit of using Indigenous languages in the classroom, parental involvement in education, and the psychological relationship between cultural identity and well-being. She is currently a Senior Policy Analyst at Health Canada and also works as an independent research consultant.
Eric Crighton (Chapter 4: Youth Employment, Culture, and Well-Being, and Chapter 5: Adult Employment, Culture, and Well-Being)
Dr. Crighton is Chair of the Department of Geography at the University of Ottawa and Director of the Health and Environment Analysis Laboratory. His research is focused broadly on understanding relationships between social, economic and physical environments and human health and well-being. He has been involved in various projects related First Nations and Métis health including analyses of the Aboriginal Peoples Survey, the Regional Health Survey and Métis administrative health data.
Martin Cooke (Chapter 6: First Nations Labour Market)
Dr. Cooke is an Associate Professor in the Department of Sociology & Legal Studies the School of Public Health and Health System at the University of Waterloo. He is currently the co-Director of the Waterloo Survey Research Centre. His research is focussed on the social demography and health of Indigenous peoples and other vulnerable populations.
Norm Lavallee (Chapter 7: First Nations Employment, Skills, and Mobility)
Mr. Lavallee holds a BBA (Economics/Finance) and an MBA from Thompson Rivers University in Kamloops, BC. As a Research Economist with Fiscal Realities Economists Ltd. for the past nine years his research has been focused on First Nation economic development, trade, transaction costs, property rights, and taxation.
APPENDIX 1

The National Report of the First Nations Regional Early Childhood, Education, and Employment Survey | 101
FNREEES Participating Communities
The First Nations Information Governance Centre would like to thank the following First Nations communities for participating in the FNREEES.
Alberta CommunitiesAlexis Nakota Sioux First NationBeaver First NationBigstone Cree NationBlood TribeDene Tha’ First NationErmineskin Cree NationFrog LakeHeart Lake First Nation
Kapawe’no First NationLittle Red River Cree NationLubicon Lake Indian NationO’ChiesePaul First NationPiikani NationSamson Cree NationSiksika NationSunchild First Nation
British Columbia CommunitiesAdams LakeBonaparteBoston Bar First NationCanim LakeWe Wai KaiChawathilCheamCowichanDitidahtGitseguklaGitxaala NationHeiltsukHupacasath First NationIskutKitasooLower KootenayLower NicolaMoricetownLil’wat
Nak’azdli‘Namgis First NationNuxalk NationPenelakutSaik’uz First NationScowlitzSkidegateSkowkaleSliammonSquamishSt. Mary’sTahltanTakla Lake First NationTla-o-qui-aht First NationsTsawout First NationTsleil-Waututh NationTzeachtenUpper NicolaWestbank First NationWet’suwet’en First Nation
APPENDIX 2

Now is the Time: Our Data, Our Stories, Our Future 102 |
Manitoba CommunitiesBerens River First NationBirdtail Sioux Dakota NationBloodvein First NationChemawawin Cree NationPimicikamak Cree Nation (Cross Lake)Dakota Plains Wahpeton NationDakota Tipi First NationEbb and Flow First NationFisher River Cree NationFox Lake Cree NationGarden Hill First NationGod’s Lake First NationKinonjeoshtegon First NationLake Manitoba Treaty 2 First NationLong Plain First NationManto Sipi Cree NationMathis Colomb Cree Nation
Mosakahiken Cree NationNisichawayasihk Cree NationNorthlands Denesuline First NationNorway House Cree NationO-Chi-Chak-Ko-Sipi First NationOpaskwayak Cree NationO-Pipon-Na-Pawin Cree NationPauingassi First NationPeguis First NationPinaymootang First NationPoplar River First NationRed Sucker Lake First NationRolling River First NationSagkeeng First NationSandy Bay First NationSioux Valley Dakota NationSt. Theresa Point First Nation Waywayseecappo First Nation
New BrunswickElsipogtog (Big Cove) First NationBuctouche First NationEsgenoopetitj First NationEel Ground First NationEel River Bar First Nation
Kingsclear First NationMetepenagiag Mi’kmaq First NationSaint Mary’s First NationWoodstock First NationTobique First Nation
Newfoundland CommunitiesMaiwpukek First Nations
Nova Scotia Communities Acadia First NationsSipekne’katik First NationsMillbrook First NationsPaqtnkek First Nations
Eskasoni First NationsPotlotek First NationsMembertou First NationsWagmatcook First NationsWaycobah First Nations

The National Report of the First Nations Regional Early Childhood, Education, and Employment Survey | 103
Ontario CommunitiesKasheshewan First Nation Ojibways of BatchewanaChippewas of Nawash Unceded First Nation (Cape Croker)Couchiching First NationCurve Lake First NationEabametoong First NationGinoogaming First Nation (Long Lac #77)Hiawatha First NationIskatewizaagegan #39 Independent First NationKingfisher Lake First NationKitchenuhmaykoosib InninuwugLong Lake No. 58 First NationM’Chigeeng First NationMohawks of Akwesasne Mohawks of the Bay of Quinte
Moose Cree First NationMoose Deer PointDelaware Nation (Moravian of the Thames)Munsee-Delaware NationNigigoonsiminikaaning First NationOneida Nation of the ThamesPikangikum First NationSagamok AnishnawbekChippewas of SaugeenSerpent River First NationShawanaga First NationMitaanjigaming (Stanjikoming) First NationTaykwa Tagamou (New Post)Temagami First NationWhitesandWikwemikong Unceded Indian Reserve
Prince Edward Island Communities Abegweit First NationsLennox Island First Nations
Quebec CommunitiesEagle VillageGesgapegiagKanesatakeKawawachikamachKitcisakikKitigan ZibiListugujManawanMashteuiatshMatimekush-Lac John
NutashkuanOdanakOpitciwanPakua ShipuPessamitPikoganUashat mak Mani-UtenamWemotaciWendakeWinneway

Now is the Time: Our Data, Our Stories, Our Future 104 |
Saskatchewan CommunitiesBig Island Lake Cree NationBig RiverBirch Narrows First NationBlack LakeBuffalo River Dene NationCanoe Lake Cree NationCowessessDay StarFishing Lake First NationFlying Dust First NationGeorge Gordon First nationIsland Lake First nationJames SmithKahkewistahawKawacatooseKeeseekooseKinistin Saulteaux NationLac La RongeMakwa Sahgaiehcan First nationMistawasisMoosominMosquito, Grizzly Bear’s Head, lean Man First NationMuscowpetung
Muskeg LakeMuskoday First NationMuskowekwanNekaneetOchapowace OkaneseOne ArrowOnion LakePasqua First Nation #79PeepeekisisPelican LakePeter Ballantyne Cree NationPheasant Rump NakotaPiapotPoundmakerRed PheasantSaulteauxSturgeon Lake First NationSweetgrassWaterhen LakeWhite BearWhitecap Dakota/Sioux First NationWitchekan LakeYellow Quill
Northwest Territories CommunitiesAcho Dene Koe First Nation (Fort Liard)Tlicho Government – BehchokoBehdzi Ahda First Nation (Colville Lake)Deh Gah Got’ie Dene Council (Fort Providence)Deninu K’ue First NationTlicho Government - GametiTwichya Gwich’in Band CouncilJean Marie River First NationK’asho Gotine Dene Band
K’atlodeeche First Nation (Hay River Dene Reserve)Lutsel K’e Dene BandNihtat Gwich’in Council (Inuvik)Pehdzeh Ki First NationTetlit Gwich’in Council (Fort McPherson)Tulita Band CouncilTlicho Government - Wekwee’tiTlich Government – WhatiYellowknives Dene First Nation
YukonChampagne & Aishihik First NationsCarcross/Tagish First NationFirst Nation of Na-Cho Nyak DunKluane First NationKwanlin Dün First NationLiard First NationLittle Salmon/Carmacks First Nation
Ross River Dena CouncilSelkirk First NationTa’an Kwäch’än CouncilTeslin Tlingit CouncilTr’ondëk Hwëch’inVuntut Gwitchin First NationWhite River First Nation