Embed Size (px)
Citation preview

University of South FloridaScholar Commons
Graduate Theses and Dissertations Graduate School
10-17-2014
Novel Therapeutic Strategies in Lung CancerCourtney A. KurtykaUniversity of South Florida, [email protected]
Follow this and additional works at: https://scholarcommons.usf.edu/etd
Part of the Cancer Biology Commons
This Dissertation is brought to you for free and open access by the Graduate School at Scholar Commons. It has been accepted for inclusion inGraduate Theses and Dissertations by an authorized administrator of Scholar Commons. For more information, please [email protected].
Scholar Commons CitationKurtyka, Courtney A., "Novel Therapeutic Strategies in Lung Cancer" (2014). Graduate Theses and Dissertations.https://scholarcommons.usf.edu/etd/5363
Novel Therapeutic Strategies in Lung Cancer
by
Courtney A. Kurtyka
A dissertation submitted in partial fulfillment of the requirements for the degree of
Doctor of Philosophy with a concentration in Cancer Biology
Department of Cell Biology, Microbiology and Molecular Biology College of Arts and Sciences University of South Florida
Major Professor: W. Douglas Cress, Ph.D. Srikumar P. Chellappan, Ph.D.
Jin Q. Cheng, M.D., Ph.D. Eric B. Haura, M.D.
Date of Approval: October 17, 2014
Keywords: NSCLC, paclitaxel, cisplatin, E2F, CDK
Copyright © 2014, Courtney A. Kurtyka

DEDICATION
I would like to dedicate this to my parents, my brother, and my best friends Eric
and Lori. Thank you for all of your support over the past few years.

ACKNOWLEDGMENTS
I would first like to acknowledge my mentor, W. Douglas Cress, for all of his
support since I was an undergraduate. I could never thank him enough for his guidance.
I would also like to thank my committee members Srikumar P. Chellappan, Jin Q.
Cheng, and Eric B. Haura for their ideas and assistance over the past few years. I
would also like to thank Brian K. Law from the University of Florida for generously
agreeing to be my outside chair. I want to acknowledge other Cress lab members, both
past (Yihong Ma, Scott N. Freeman, William Brazelle, Rachel Haviland, and Jose M.
Rodriguez) and present (Lu Chen and Brienne E. Engel), for all of their support. I would
like to thank our collaborators on the CDK12 investigation (particularly Alvaro N.
Monteiro, Ankita Jhuraney, and Uwe Rix) for offering me the opportunity to be a part of
this project. Also, I want to thank the various core members who have been
instrumental in assisting with experiments for my dissertation. Among them are the
Translational Core (particularly Chris Cubitt, Shumin Zhang, and Jillaina Menth), the
Bioinformatics Core (especially Eric A. Welsh, Anders E. Berglund, and Steven A.
Eschrich), the Biostatistics Core (particularly Dung-Tsa Chen and William J. Fulp), Fumi
Kinose from Moffitt’s SPORE in Lung Cancer Cell Core, Sean Yoder in the Molecular
Genomics Core, Matthew B. Schabath from the Department of Epidemiology, the
Microarray Core (especially Tania Mesa), the Tissue Core (especially Noel Clark), the
Pathology Core, the Microscopy Core (especially Agnieszka Kasprzak), and the Mouse

Core. Finally, I would like to thank Kenneth Wright and Cathy Gaffney for all of their
hard work managing the Cancer Biology Ph.D. program at the University of South
Florida.
i
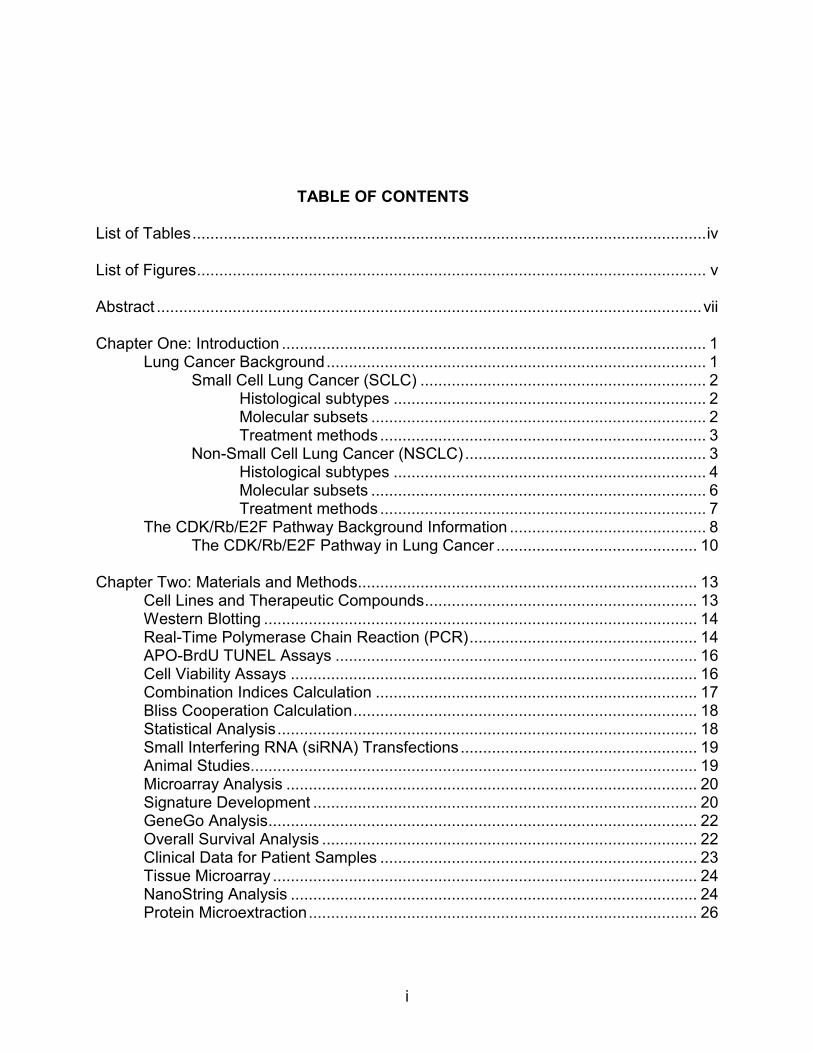
TABLE OF CONTENTS
List of Tables ................................................................................................................... iv List of Figures .................................................................................................................. v Abstract .......................................................................................................................... vii Chapter One: Introduction ............................................................................................... 1 Lung Cancer Background ..................................................................................... 1 Small Cell Lung Cancer (SCLC) ................................................................ 2 Histological subtypes ...................................................................... 2 Molecular subsets ........................................................................... 2 Treatment methods ......................................................................... 3 Non-Small Cell Lung Cancer (NSCLC) ...................................................... 3 Histological subtypes ...................................................................... 4 Molecular subsets ........................................................................... 6 Treatment methods ......................................................................... 7 The CDK/Rb/E2F Pathway Background Information ............................................ 8 The CDK/Rb/E2F Pathway in Lung Cancer ............................................. 10 Chapter Two: Materials and Methods............................................................................ 13 Cell Lines and Therapeutic Compounds ............................................................. 13 Western Blotting ................................................................................................. 14 Real-Time Polymerase Chain Reaction (PCR) ................................................... 14 APO-BrdU TUNEL Assays ................................................................................. 16 Cell Viability Assays ........................................................................................... 16 Combination Indices Calculation ........................................................................ 17 Bliss Cooperation Calculation ............................................................................. 18 Statistical Analysis .............................................................................................. 18 Small Interfering RNA (siRNA) Transfections ..................................................... 19 Animal Studies .................................................................................................... 19 Microarray Analysis ............................................................................................ 20 Signature Development ...................................................................................... 20 GeneGo Analysis ................................................................................................ 22 Overall Survival Analysis .................................................................................... 22 Clinical Data for Patient Samples ....................................................................... 23 Tissue Microarray ............................................................................................... 24 NanoString Analysis ........................................................................................... 24 Protein Microextraction ....................................................................................... 26

ii
Chapter Three: E2F Inhibition Synergizes with Paclitaxel in Lung Cancer Cell Lines ... 27 Introduction ......................................................................................................... 27 Results ............................................................................................................... 30 Sensitivity to 6474 in Lung Cancer Cell Lines Vary Between 15-75
μM ............................................................................................................ 30 Rb-Null Cells Are More Sensitive to 6474 Than Syngeneic Rb+/+
Cells ......................................................................................................... 30 6474 Synergizes with Paclitaxel, But Not Cisplatin nor Gemcitabine,
in NSCLC Cell Lines ................................................................................ 33 Sensitivity to Paclitaxel Correlates to E2F3 Levels .................................. 33 Short Treatments of NSCLC Cell Lines with 6474 Leads to
Increased Expression of E2F-Regulated Genes ...................................... 36 At the Doses Expected for Lung Cancer Treatment, 6474 Toxicity Is
High in Nude Mice ................................................................................... 37 Discussion .......................................................................................................... 37 Chapter Four: An E2F Signature Predicts Benefit of Adjuvant Chemotherapy in
Early-Stage NSCLC ................................................................................................. 44 Introduction ......................................................................................................... 44 Results ............................................................................................................... 47 The E2F Signature Is Representative of Cell Cycle ................................. 47 The E2F Signature Is Prognostic in Several Large NSCLC Datasets ...... 48 The E2F Signature Is a More Sensitive Proliferative Marker than
Ki67.......................................................................................................... 51 The E2F Signature Is Predictive of Early-Stage NSCLC Patient
Benefit from Adjuvant Chemotherapy ...................................................... 52 NanoString Analysis of the E2F Signature in Patient Samples Was
Equally Effective Using Either Fresh Frozen RNA or FFPE-Derived RNA ......................................................................................................... 54
Discussion .......................................................................................................... 56 Chapter Five: CDK12 Is Upregulated in Lung Adenocarcinoma and Its
Knockdown Sensitizes NSCLC Cells to Platinum Therapy ...................................... 58 Introduction ......................................................................................................... 58 Results ............................................................................................................... 62 CDK12 Depletion in Triple-Negative NSCLC Enhances Sensitivity
to Cisplatin ............................................................................................... 62 CDK12 Protein Levels Are Higher in Tumor Tissue than in Normal
and Correlate with Ki67 Expression ......................................................... 64 CDK12 Depletion Does Not Alter BRCA1 nor FANCI mRNA
Expression, But Does Lead to a Decrease in ATM Expression ............... 68 ATM Does Not Accumulate in the Nucleus and Become Insoluble .......... 72 ATM Protein Levels Do Not Decrease until 60-72 Hours after
CDK12 siRNA Transfection ..................................................................... 72 Discussion .......................................................................................................... 75

iii
Chapter Six: Final Conclusions and Future Work .......................................................... 77 Final Conclusions ............................................................................................... 77 Future Work ........................................................................................................ 79 References .................................................................................................................... 86 Appendices ................................................................................................................. 105 Appendix A: Institutional Animal Care Use Committee (IACUC) Approval
Letter ................................................................................................................ 106

iv
LIST OF TABLES
Table 2.1: Summary of human real-time PCR primers ............................................. 15 Table 3.1: 6474 IC50s vary in lung cancer cell lines from 15-75 μM .......................... 31 Table 3.2: High doses of 6474 lead to dramatic weight loss in mice ........................ 39 Table 4.1: Cell cycle is the most significantly altered pathway represented in
the E2F signature .................................................................................... 49 Table 4.2: Summary of samples in tissue microarray ............................................... 51 Table 5.1: Known targets of CDK inhibitors tested for synergy with cisplatin ........... 64 Table 5.2: Genes involved in DNA damage were not dramatically affected in
triple-negative NSCLC cells depleted of CDK12 ...................................... 70 Table 6.1: Blood cancers have 6474 IC50s ranging from 5-20 μM ............................ 81

v
LIST OF FIGURES
Figure 1.1: The CDK/Rb/E2F pathway and cell cycle regulation ................................. 9 Figure 3.1: Rb-null MEFs are more sensitive to 6474 than syngeneic Rb+/+ cells ...... 32 Figure 3.2: 6474 synergizes with paclitaxel, but not cisplatin nor gemcitabine,
in NSCLC cell lines .................................................................................. 34 Figure 3.3: Endogenous E2F3 mRNA and protein levels correlate to paclitaxel
sensitivity ................................................................................................. 35 Figure 3.4: NSCLC paclitaxel sensitivity is affected by E2F3 levels........................... 36 Figure 3.5: Short treatment with 6474 leads to an increase in E2F3 protein and
mRNA expression .................................................................................... 38 Figure 3.6: Short treatment with 6474 leads to an increase in the mRNA
expression of various E2F-regulated genes ............................................. 39 Figure 3.7: High levels of cleaved caspase 3 were detected in the germinal
centers of spleens of mice treated with 6474 ........................................... 40 Figure 3.8: A de-repression model for synergy between HLM006474 and
paclitaxel .................................................................................................. 42 Figure 4.1: RNAi effectively and specifically inhibits expression of the targeted
E2F/Rb family members .......................................................................... 48 Figure 4.2: The E2F signature is significantly prognostic in two large data
cohorts ..................................................................................................... 50 Figure 4.3: The E2F signature is a more sensitive proliferative marker than
Ki67.......................................................................................................... 52 Figure 4.4: The E2F signature is predictive of patient benefit from adjuvant
chemotherapy in the JBR.10 trial ............................................................. 53 Figure 4.5: NanoString analysis of the E2F signature is equally effective using
FFPE-derived RNA and fresh frozen RNA ............................................... 55

vi
Figure 5.1: CDK12 knockdown enhances sensitivity to cisplatin in triple-negative NSCLC cell lines ....................................................................... 63
Figure 5.2: Cisplatin does not synergize with commercially available CDK
inhibitors in NSCLC cell lines ................................................................... 65 Figure 5.3: Representative Ki67 and CDK12 IHC staining in the lung carcinoma
TMA ......................................................................................................... 66 Figure 5.4: CDK12 protein levels are higher in lung tumor than normal tissue,
and CDK12 protein levels correlate with Ki67 protein in both tumor and normal samples ................................................................................ 67
Figure 5.5: CDK12 knockdown does not lead to a decrease in BRCA1 nor
FANCI mRNA expression in triple-negative NSCLC cell lines ................. 69 Figure 5.6: Cells depleted of CDK12 have decreased levels of ATM protein and
mRNA ...................................................................................................... 71 Figure 5.7: ATM does not localize to the nucleus in cells when CDK12
expression is knocked down .................................................................... 73 Figure 5.8: ATM protein levels decrease approximately 60-72 hours following
transfection with CDK12 siRNA ............................................................... 74 Figure 6.1: Blood cancers are more sensitive to 6474 than other cancer types
included in the NCI60............................................................................... 80

vii
ABSTRACT
Lung cancer is the leading cause of cancer-related death and the second most
diagnosed cancer in the United States. Unfortunately, many patients either do not have
any common mutations for which there are already targetable agents, or they eventually
become resistant to these compounds. As such, there is a high demand for new,
effective methods of treating this disease as well as predicting patient prognosis and
potential benefit from chemotherapy. In this work, numerous strategies for treating this
disease are explored.
The first method of targeting lung cancer described here is through the use of a
pan-early 2 factor (E2F) inhibitor, HLM006474. This small-molecule inhibitor was
considered to have chemotherapeutic potential in lung cancer because the
CDK/Rb/E2F pathway is commonly disrupted. The IC50s (determined through viability
assays) for this compound in a panel of non-small cell lung cancer (NSCLC) and small
cell lung cancer (SCLC) cell lines varied between 15-75 µM. Combination experiments
between 6474 and common chemotherapeutic agents revealed synergy with paclitaxel,
but not cisplatin nor gemcitabine. Due to previously published results suggesting a
relationship between E2F3 activity and paclitaxel sensitivity, paclitaxel IC50s were
compared to endogenous E2F3 mRNA and protein expression in a panel of NSCLC cell
lines. These results showed a correlation between high E2F3 expression and paclitaxel
sensitivity that was then confirmed through E2F3a and E2F3b siRNA experiments.

viii
Furthermore, measurements of E2F expression as a function of time showed increased
expression of E2F3 and several E2F-regulated genes shortly following the addition of
6474, while E2F1 and E2F4 levels were not dramatically altered.
Next, we explored the use of an E2F signature that is prognostic and predictive
of early-stage NSCLC patient benefit from adjuvant chemotherapy (ACT). Currently,
there is only a small five-year survival benefit observed in early-stage NSCLC patients
who receive ACT following surgery. Therefore, a gene signature that could predict
which patients would benefit from ACT could be clinically useful. The E2F signature was
created by targeting several Rb/E2F family members with RNAi, analyzing the samples
through microarrays, and filtering the resulting probesets for those that were altered in
five out of six of the knockdowns in both cell lines and altered in tumor versus normal
samples. Principal component analysis (PCA) of this signature within the Molecular
Classification of Lung Adenocarcinoma (MCLA) dataset from the Director’s Challenge
and the SPORE442 dataset from H. Lee Moffitt Cancer Center’s Total Cancer Care
Network demonstrated that the signature is prognostic. Comparison of the efficacy of
the E2F signature versus Ki67 (a common proliferative marker) in a lung carcinoma
tissue microarray (TMA) demonstrated that the signature was a better prognostic
marker. Analysis of the signature within the JBR.10 trial data demonstrated that the
signature is predictive of patient benefit from adjuvant chemotherapy. In order for this
signature to be clinically viable, we needed to be able to measure it in formalin-fixed,
paraffin-embedded (FFPE) patient samples. To this end, 32 paired fresh frozen (FF)
and FFPE-derived RNA samples were measured via NanoString (a “barcode”-based
platform) and compared to one another. A strong correlation was noted between the

ix
paired NanoString readings. Likewise, no difference in correlation was observed
between the NanoString results using either type of RNA and microarray results.
The third project examines possible targets to enhance sensitivity to cisplatin in
NSCLC lacking Kirsten rat sarcoma viral oncogene homolog (KRAS) and epidermal
growth factor receptor (EGFR) mutations and anaplastic lymphoma receptor tyrosine
kinase (ALK) fusions (“triple-negative”), for which cisplatin is one of the few treatment
options. Examination of five cyclin-dependent kinases (CDKs) resulting from a
previously published protein-protein interaction screen showed that depleting cells of
CDK12 via RNAi led to enhanced sensitivity to cisplatin. Analysis of a lung carcinoma
TMA showed that tumors have higher levels of CDK12 protein than normal tissues, and
that CDK12 and Ki67 protein expression levels positively correlate. These results
suggested that CDK12 might serve as an oncogene. Real-time polymerase chain
reaction (PCR), microarrays, and Western blots were utilized in order to investigate
potential explanations for the increased sensitivity to cisplatin observed in cells depleted
of CDK12. We were unable to confirm previously published results by others that cells
depleted of CDK12 have decreased expression of genes involved in DNA damage
response (DDR), but did demonstrate that cells transfected with CDK12 siRNA had
decreased ataxia telangiectasia mutated (ATM) mRNA and protein expression.
Considering that ATM is known to be involved in DDR (a process induced by cisplatin),
this could be a potential explanation for the observed changes in cisplatin sensitivity.

1
CHAPTER ONE:
INTRODUCTION
Lung Cancer Background
Cancers of the lung and bronchus are the leading cause of cancer-related
death in both men and women (estimated to be nearly 160,000 in 2014) in the United
States and over 224,000 new cases are predicted to be diagnosed in 2014 [1]. The
overall five-year survival for this group of diseases is unfortunately still only around
17%. This is partially due to the fact that only 15% of patients are diagnosed at a
localized stage. As expected, the 5-year survival rates tend to be much higher for those
diagnosed with localized stage disease (54%) as compared to those diagnosed with
distant stage lung cancer (4%) [1].
The first reported cases of lung cancer were in the eighteenth century, and
remained a relatively rarely reported disease until the late 1800s. This dramatic
increase in lung cancer rates was coincident with a rise in tobacco smoking, largely due
to advanced mechanization in the industry that allowed for cheaper cigarette production
and enhanced marketing. While numerous studies throughout the world linked smoking
and lung cancer in the 1930s-1950s, a relationship between smoking and lung cancer
was not officially recognized by the US government until the landmark Surgeon
General’s report in 1964 [2, 3]. Fortunately, tobacco use and lung cancer rates in
general have decreased in the past few decades, particularly in men. Since that report,

2
cigarette smoking among adults 18 and older in the US decreased from 42% in 1965 to
19% in 2011 [4]. Smoking rates are still higher in men than women (listed at 20.5%
versus 15.8% in 2012) [5], and lung cancer deaths related to smoking therefore follow a
similar pattern (87% versus 70%) [1]. However, it has been suggested that these lung
cancer death rates will soon be identical to each other due to the stabilization of male
rates while female rates continue to increase [6, 7]).
Small Cell Lung Cancer (SCLC)
SCLC is a less common type of lung cancer and makes up approximately 15% of
cases. The five-year survival for SCLC patients is unfortunately only ~6% [1], and
according to Surveillance, Epidemiology, and End Results (SEER) data from 1988-2001
varies from 31% for stage I patients to 2% for stage IV patients. Typically, nonsmokers
do not get this type of lung cancer [1]. Previously, this cancer was known as “oat cell
sarcoma tumor,” but was changed to its current title in 1988 by the International
Association for the Study of Lung Cancer (IASLC) [8].
Histological subtypes While there are not any histological subtypes of SCLC,
this cancer can still be classified as either pure or combined. The combined SCLC
subtype is comprised of a mixture of SCLC and NSCLC cells. If the NSCLC portion is
adenocarcinoma or SCC, then the proportion of NSCLC versus SCLC cells does not
factor into the diagnosis. However, if the NSCLC portion is large cell carcinoma (LCC),
then at least 10% of the tumor must be LCC to receive this diagnosis [9, 10].
Molecular subsets As compared to NSCLC, less is known about molecular
subsets of SCLC. This is partially due to the fact that very few SCLC patients undergo
surgery, thus leaving fewer samples available for genetic analysis [11]. The most

3
commonly altered genes in SCLC are RB1 and TP53. In fact, both of these genes are
inactivated in approximately 90% of SCLC [12, 13]. These mutations have been shown
to be integral for the development of SCLC in mouse models [14-17], and result in
neuroendocrine tumors that proliferate rapidly and are very aggressive [18]. Other
genes that have been found to be altered in SCLC include CREBBP, EP300, MLL,
PTEN, SLIT2, EPHA7, and FGFR1 [11].
Treatment methods The stages of SCLC can be described by using the
Veterans’ Administration Lung Study Group (VALSG) or the IASLC Tumor, Node,
Metastasis (TNM) system. VALSG uses either “limited disease” or “extensive disease”
to describe staging, where “limited disease” means that the tumor is limited to one
hemithorax and can be covered within a single radiotherapy port, and “extensive
disease” applies to all other cases [8, 19]. TNM staging is less commonly used since it
typically requires surgical resection, which is rarely used in SCLC patients. As such, it
has been shown to be prognostic in patients and is still therefore recommended [20,
21].
Typically, SCLC is identified at late stages, and thus surgery is not typically used.
Instead, radiation and chemotherapy are the most commonly used therapies [1]. Since
there either are not any approved inhibitors for recognized targets in SCLC and not a
great deal of research has been done to identify other potential targets, no targeted
therapies are used for treating this cancer.
Non-Small Cell Lung Cancer (NSCLC)
NSCLC is the most common type, accounting for approximately 85% of cases
and can be divided into three histological subtypes (as discussed below). Five-year

4
survival among all NSCLC patients is only around 18% [1], and according to SEER data
from 1998-2000 varies between 49% for stage IA patients to 1% for stage IV patients.
The majority of cases occur in smokers, though there is a subset of cases that occur in
never-smokers who tend to be of Asian ancestry, female in gender, and present with
EGFR mutations [22].
Histological subtypes The most commonly recognized histological subtypes of
NSCLC are LCC, squamous cell carcinoma (SCC), and adenocarcinoma. LCC makes
up approximately 2-10% of all NSCLC cases [10, 23]. This tumor subtype is comprised
of large polygonal cells in no recognizable pattern [9]. According to the 2004 WHO
classification, the five subtypes of LCC are basaloid carcinoma, clear cell carcinoma,
LCC with rhabdoid phenotype, large cell neuroendocrine carcinoma, and
lymphoepithelioma-like carcinoma [9]. Little is known about large cell carcinoma as a
class, largely due to it typically being used as a diagnosis for tumors that do not exhibit
any of the common features of adenocarcinoma, SCC, nor SCLC [9, 24]. As such,
surgical resection samples are needed to demonstrate that differentiation is not present
in any portion of the tumor and be able to make this diagnosis [9, 25]. This requirement
means that histological analysis of small biopsy samples cannot lead to LCC diagnosis,
and are therefore typically diagnosed as NSCLC [9] (which accounts for 12.6% of all
NSCLC [23]).
SCC is the second most common histological subtype of NSCLC, accounting for
approximately 20-25% of all NSCLC cases [10, 23]. SCC typically arises from cells in
the lung central bronchus. Cells of this subtype typically exhibit keratinization and
intercellular bridges [9, 26]. In order to diagnose this subtype, at least 10% of the

5
resected tumor must exhibit these features [26]. According to the 2004 WHO
classification, the four variants of SCC are basaloid, clear cell, papillary, and small cell
[9, 26]. This subtype used to be most commonly associated with smoking in the late
1800s-early 1900s, but is now less common than adenocarcinoma among smokers
today.
Adenocarcinoma is the most common subtype, making up approximately 40% of
all NSCLC cases [10, 23]. This subtype is made up of cells from peripheral lung tissue
and has become increasingly common. This increase in frequency of the
adenocarcinoma histology is largely believed to be due to the tobacco market switch to
filtered cigarettes with lower tar and nicotine levels, leading many smokers to breathe in
more deeply and therefore leading peripheral tissues to be more exposed to
carcinogens in cigarette smoke [3]. According to the 2004 World Health Organization
(WHO) Classification, the subtypes of adenocarcinoma are pre-invasive lesions
(atypical adenomatous hyperplasia and bronchioalveolar carcinoma (BAC),
adenocarcinoma (mixed subtype, acinar, and papillary), and solid (for which there are
the variants mucinous cystadenocarcinoma, colloid, fetal, signet ring, and clear cell) [27,
28]. However, this classification (particularly in regards to BAC) led to a great deal of
confusion because previously BAC could apply to either invasive or noninvasive well-
differentiated tumors that could grow along alveolar structures, whereas under the new
WHO classification where it only applied to noninvasive lesions [27]. As such, in the
IASCL classification completed in 2011, the term BAC was removed and
adenocarcinoma in situ (AIS) was added in its place. Other changes in the IASCL
classification include the introduction of minimally invasive adenocarcinoma (MIA),

6
lepidic predominant, micropapillary predominant, and mucinous adenocarcinoma
classifications as well as the addition of mucinous adenocarcinoma variant and
replacement of the signet ring and clear cell variants with the enteric variant [27, 28].
Molecular subsets While histological subtyping predominately guided treatment
paradigms in the past, oncologists are increasingly making treatment decisions for
NSCLC based upon molecular subtyping. NSCLC is one of several cancers that have
an extremely high mutation rate and only a handful of targetable driver mutations are
common. The molecular profiles vary greatly in NSCLC depending on histological
subtype (particularly SCC and adenocarcinoma). In the SCC molecular profile, the most
common gene alterations are PI3KCA amplifications and mutation [29-33], AKT1
mutations [34, 35], SOX2 amplifications, FGFR1 amplifications, and PTEN mutations
[26]. In adenocarcinoma, the typically altered genes (ranked from most common to
least) [36, 37] are KRAS (typically mutated at residues G12 or G13 in 20-30% of
patients) [38-40], EGFR (typically mutated either by a deletion within exon 19 or a
missense mutation in exon 21; present in approximately 5-15% of patients) [41-43], ALK
(most commonly fused with EML4; seen in approximately 3-5% of patients) [44-46],
ERBB2 (amplified in 2-4% and mutated via exon 20 insertions in 2-4% of patients) [47-
50], BRAF (mutated either at V600 or within exons 11 and 15 in 1-5% of patients) [51,
52], PIK3CA (mutated in approximately 2-4% of patients) [32, 33, 53], AKT1 (typically
mutated at E17 in less than 1% of patients) [54], MAP2K1 (mutated in approximately
1% of patients) [55], NRAS (mutated in less than 1% of patients) [56, 57], ROS1 (most
commonly fused with CD74, present in approximately 1-2% of patients) [58], and RET
(typically fused with KIF5B, present in approximately 1-2% of patients) [58].

7
Furthermore, there are dramatic differences in molecular profiles between
adenocarcinomas from smokers and non-smokers. Smokers tend to have more
mutations overall than non-smokers [54, 59]. Also, EGFR mutations are much more
common in non-smoking Asian females than in smokers. Likewise, C:G to A:T
mutations are much more common in smokers than in non-smokers [59, 60].
Treatment methods Disease stage upon diagnosis plays an important part in
determining which treatments will be used. For those diagnosed at early stages,
surgical resection and/or chemotherapy or radiation are the most common treatments.
Unfortunately, few patients are diagnosed at the early stages, so the vast majority of
NSCLC patients are diagnosed with late stage disease. As such, most of these patients
must then rely on radiation and chemotherapy treatments. For patients with any of the
actionable alterations mentioned previously, therapy can include agents targeted to
these genes (such as erlotinib, gefitinib, or panitumumab for those with EGFR
mutations; crizotinib for those with ALK fusions; etc). Unfortunately, approximately 40%
of NSCLC patients do not have any of these mutations [61, 62]. Also, of the patients
who can receive these targeted agents, the vast majority will eventually become
resistant. As such, most patients will eventually have to use common chemotherapies
for treating this disease, which is typically a platinum doublet with gemcitabine, a
taxane, or pemetrexed. Treatment options are also somewhat dependent on histological
subtype. For example, pemetrexed should only be used for patients with non-squamous
histology as it tends to not be effective in patients with SCC, possibly due to higher
levels of thymidylate synthase in this histological subtype [63]. Also, it is important to

8
note that SCC patients are not recommended to receive bevacizumab (a VEGF
inhibitor) due to it being associated with hemorrhage [25, 64].
The CDK/Rb/E2F Pathway Background Information
The retinoblastoma protein (commonly called Rb) was the first tumor suppressor
identified, and is widely recognized as one of the most important tumor suppressors in
humans [65-67]. The gene encoding this protein, RB1, is commonly altered in
retinoblastoma, a recessive genetic disease in children that involves the formation of
tumors in the retina. It was identified in 1971 that a likely explanation for the differences
in retinoblastoma presentation in patients (such as unilateral tumors (meaning tumors
form in one eye) versus bilateral tumors (where there are tumors in both eyes), age of
disease presentation, family history) could be related to mutations of both copies of a
gene in each patient. For example, those with a family history of retinoblastoma would
inherit one mutated copy of the gene and would only need the other gene copy to
become mutated in order for tumors to form (thus leading to a higher frequency of
bilateral tumors and earlier age onset of the disease), while those without a family
history would need both copies of a gene to become mutated before tumors could form
(thus making unilateral tumors and later age onset of the disease more common in
these patients). This “two-hit” hypothesis could therefore serve as an apt explanation for
this disease [68].
Along with the similar “pocket” proteins p107 and p130, Rb is responsible for
regulating cell cycle progression [69, 70]. The pocket protein family regulates cell cycle
through binding and inhibiting the transcriptional activity of early 2 factors (E2Fs), and
its ability as a tumor suppressor activity is strongly linked to this role [71-77] (Figure

9
1.1). In G0 or early G1 of the cell cycle, these pocket proteins are unphosphorylated and
bound to E2Fs [78, 79]. Mitogenic stimulation encourages the activity of cyclin-
dependent kinases (CDKs), which are kinases that typically need to be bound to a
cyclin in order to phosphorylate various substrates. Throughout G1, CDKs -2, -4, and -6
phosphorylate and inactivate these pocket proteins. Once these proteins are
inactivated, E2Fs are freed to transcribe genes (such as dihydrofolate reductase
(DHFR)) that are important for S phase entry [80, 81]. In order to avoid aberrant cell
cycle entry, CDK inhibitors from the INK4 family (such as CDKN2A (commonly known
Figure 1.1: The CDK/Rb/E2F pathway and cell cycle regulation. (A.) In G0 or early G1, pocket proteins such as Rb can bind in a repressive complex with E2Fs and their dimerization partner (DP) proteins on the promoters of genes needed for S phase entry. (B.) Throughout G1, CDKs -2, -4, and -6 can phosphorylate and inactivate Rb, thus allowing for the transcription of S phase genes. (C.) Later in S phase, E2F transactivation of S phase genes is no longer necessary. E2Fs and DPs detach therefore from these promoters, then are phosphorylated and targeted for degradation.

10
as p16), CDKN2B (p15), CDKN2C (p18), CDKN2D (p19)) [82] and the CIP/KIP family
(such as CDKN1A (p21) CDKN1B (p27), and CDKN1C (p57)) [83] prevent CDKs from
phosphorylating pocket proteins and force cells to remain in G1 [84, 85].
E2Fs have been implicated in a variety of cellular functions, including metastasis
[86-91], angiogenesis [88, 90, 92-97], apoptosis [98-108], and cell cycle regulation [100,
105-110]. Traditionally, E2Fs are classified as either transcriptional activators
(commonly E2F1-3) or repressors (commonly E2F4-8) based on the results of previous
overexpression experiments [111]. However, these classifications are not rigid, and E2F
activity varies depending on the cellular context. As activators, E2Fs are important for
proliferation through their transcription of S phase genes, thus driving the cell cycle
forward. E2Fs activate transcription via association with histone acetyltransferase (HAT)
activity [112, 113]. As repressors, E2Fs inhibit transcription of genes utilized in S phase
entry by binding to their promoters as part of repressive complexes that also contain a
pocket protein which can then recruit chromatin modifiers such as histone deacetylases
(HDACs) [112-114]. By repressing this transcription, repressor E2Fs can inhibit cell
cycle progression.
The CDK/Rb/E2F Pathway in Lung Cancer
The CDK/Rb/E2F pathway is disrupted in virtually every instance of human lung
cancer, thus playing a major role in the unrestrained proliferation, metastasis, and
angiogenesis observed in the disease. This pathway tends to be altered very differently
in SCLC versus NSCLC.
In SCLC, the most common mechanism of disruption of this pathway is mutation
or deletion of RB1. In fact, approximately 90% of small cell lung cancers lack a
11
functional Rb protein [12, 13]. The CDK inhibitors CDKN2B, CDKN2A [115, 116],
CDKN1B [117], and CDKN1A [118] are typically not mutated, deleted, nor expressed to
a lesser degree compared to normal tissue. However, CDKN2A can be found to be
either mutated or deleted in SCLC where RB1 is still wildtype [119]. SKP2 is sometimes
amplified and overexpressed [120], while mutation of RBL1 or RBL2 is very uncommon
in SCLC [121].
In contrast, Rb mutation occurs in 15–30% of NSCLC [12, 122], and deregulation
of the CDK/Rb/E2F pathway more commonly occurs via silencing of the CDK inhibitor
CDKN2A [115, 116, 119, 123-125]. Interestingly, an inverse relationship between Rb
and p16 expression has been noted in lung cancer [119, 123, 126, 127]. CDKN2B is
deleted in NSCLC at a lower frequency than CDKN2A, but is typically not mutated nor
methylated [116, 128, 129], while CDKN2C deletions and mutations are also uncommon
[128, 129]. The CDK inhibitor protein p27 is commonly shown to be expressed to a
lesser degree in NSCLC [117, 130] largely due to increased protein degradation [131]
by proteins such as SKP2 [132], which can be overexpressed in NSCLC [133, 134].
There is decreased protein expression of p57 in approximately 90% NSCLC, both
because of degradation by SKP2 and methylation of the CDKN1C promoter [132, 135].
CCND1 is also commonly altered in NSCLC, where it is amplified in 5-30% [136-138]
and overexpressed in 18-76% of tumors [136-139]. KRAS mutations are common in this
disease, and one interesting observation in transgenic mouse models is that mice with
KRASG12V mutations have a synthetic lethal interaction with CDK4, suggesting that
targeting this CDK may be a useful strategy in treating this molecular subset of NSCLC
[140]. Mutation of CDKN1A [118], RBL1, or RBL2 is very uncommon in NSCLC [121].

12
In most cases of NSCLC where the RB1 gene is intact, inhibitors of CDK4 and 6
would represent a potential way to target this pathway. This hypothesis has been
examined in several clinical trials where preliminary results in breast cancer were
promising [141-143], suggesting that CDK/Rb/E2F pathway inhibitors may have an
important role to play in the treatment of various cancers.
Regarding the importance of this pathway in lung cancer, determining novel
strategies for targeting and identifying its activity could prove to be very useful in the
treatment of this disease. In this dissertation, three studies in relation to this pathway in
lung cancer (especially adenocarcinoma) will be discussed. The first of these is the
investigation of the efficacy of a small-molecule pan-E2F inhibitor in lung cancer,
especially in relationship to its potential synergy with common chemotherapeutic
agents. Next, we discuss our studies with an E2F signature that is both prognostic and
able to predict early-stage lung adenocarcinoma patient benefit from adjuvant
chemotherapy. The third project discussed here is in relation to CDK12, a serine-
threonine kinase that appears to have a role in DNA damage response (in which DNA
damage leads to the activation of proteins to repair the DNA and which can lead to cell
survival, cell cycle arrest, and possibly apoptosis) and its relationship to cisplatin
sensitivity in cells lacking KRAS and EGFR mutations and ALK fusions.

13
CHAPTER TWO:
MATERIALS AND METHODS
Cell Lines and Therapeutic Compounds
Cell lines (obtained either from ATCC or originators) were authenticated and
provided by the Moffitt SPORE’s Lung Cancer Cell Core facility. All cell lines were
grown in sterile conditions at 37°C with 5% CO2 and maintained free of Mycoplasma.
All NSCLC cell lines were grown in either RPMI with 5% FBS or RPMI with 10% FBS
without antibiotics, while all SCLC cell lines were grown in RPMI with 10% FBS (from
either Sigma or Atlanta Biologicals) and penicillin/streptomycin (10,000 units/mL of
penicillin and 10,000 µg/mL of streptomycin stock solution, catalog number 15140,
Gibco).
HLM006474 was synthesized and validated by the Moffitt Chemistry Core as
previously described [144] and dissolved in dimethyl sulfoxide (DMSO). Cisplatin (from
Sigma) and paclitaxel (from Sigma) were dissolved in DMSO. Gemcitabine (from the
Moffitt Pharmacy), carboplatin (from Selleck Chemicals), and pemetrexed (from
Chemietek) were dissolved in water. The CDK inhibitors indirubin (from Fisher),
purvalanol B (from R&D Systems), roscovitine (from Sigma), and dinaciclib (from
Chemietek) were dissolved into DMSO, while SNS-032 (from Jack Hunt at Bristol-Myers
Squib) was dissolved in water.
14
Western Blotting
Approximately 30 µg of whole cell lysates were resolved in each lane of 10-12%
gels via sodium dodecyl sulfate polyacrylamide gel electrophoresis (SDS-PAGE).
Protein was then wet-transferred onto polyvinylidene fluoride (PVDF) membranes for
two hours at 100 volts on ice. Membranes were blocked in 5% milk for 30 minutes at
room temperature, rinsed for 5 minutes in water, then placed in primary antibodies
diluted 1:1000 in phosphate buffered saline (PBS). Antibodies used for immunoblotting
were as follows: E2F1 (C-20, sc-193, Santa Cruz), E2F3 (C-18, sc-878, Santa Cruz),
PARP (#9542L, Cell Signaling Technology), monoclonal β-actin (clone AC-15, cat no:
A5441, Sigma), E2F4 (c-108, sc-512, Santa Cruz), Rb (Ab-1, #OP28, Calbiochem),
CDK5 (C-8, sc-173, Santa Cruz), CDK9 (D-7, sc-13130, Santa Cruz), CDK12 (ab57311,
Abcam), and ATM (D2E2, #2873s, Cell Signaling Technology). Detection of proteins
was accomplished using horseradish-peroxidase-conjugated secondary antibodies and
enhanced chemiluminescence (ECL) purchased from Amersham or Thermo Scientific.
For all densitometric analysis of protein expression, Adobe Photoshop CS was used to
quantify Western blot band intensity readings directly from exposed films using the
rectangular marquee tool/histogram and the inverted scanned film image. This same
square was used for all further band readings in order to ensure that the same area was
analyzed for each band. The readings were then adjusted to account for actin and
background and arbitrarily normalized to the cell line H23 (assigned a value of 1).
Real-Time Polymerase Chain Reaction (PCR)
Total RNA was harvested from cells via RNeasy RNA extraction kit (Qiagen), and
then converted to cDNA through use of the iScript cDNA synthesis kit (Bio-Rad). This

15
cDNA was then utilized in real-time PCR with either iQ SYBR Green Supermix (Bio-
Rad) or PerfeCTa SYBR Green SuperMix (Quanta Biosciences, VWR) and primers
from Integrated DNA Technology. The sequences for the real-time PCR primers used
throughout this work are detailed in Table 2.1.
Table 2.1: Summary of human real-time PCR primers.
Gene
Forward or
Reverse primer? Sequence (5'-3')
Forward GCTGGACCACCTGATGAATATC
Reverse TCTGCAATGCTACGAAGGTCCTG
Forward CGTCTCTTGGTCTGCTCAC
Reverse CACTTCTGCTGCCTTGTTC
Forward CTGAAGAGTGTGAGTGGTC
Reverse GCAGAGGTGGAGGTGTAG
Forward CTGTGTGTGGTGAGGGACAC
Reverse CTTGTCCTGGTCCATCTGGT
Forward CGTCAGTGAGCAGCATGAAT
Reverse TCCCGTTCCCATTTGTAGAG
Forward CAGGTTTGGAGTGGGACAGT
Reverse ACTTCCTCCAGCATAGCCAA
Forward GGGGCTGGGTAAATGGCAAA
Reverse TGGCACTGGCTCTGGGTTCG
Forward ATTCCCGTCCGCTGTTAC
Reverse TCCTCTTCAACTGGTCATCG
Forward ATTGACCTGTGGGGTGCTGGGT
Reverse TGGAGCCGCAGAGCTGACTGAT
Forward ATCGTCACCACCAGCACAG
Reverse CATAGTCATCAGTCTCCTCATTCG
Forward CAGGTCCTCAACAGGGTTGT
Reverse CAGTCTGAAGGGGCAGAAAG
Forward ATTTGAAAACCCCAAGGGAC
Reverse CTTGTTTCCCGACTGTGGTT
Forward TGCTGGCCTATCTACAGCCT
Reverse ATTTTGTGCCTCCACTGTCC
Forward GAGTCAACGGATTTGGTCGT
Reverse TTGATTTTGGAGGGATCTCG
CDK9
CDK12
GAPDH
FANCI
BRCA1
ATM
MCM10
CCNE2
Tubulin
CDK5
E2F1
E2F3
E2F4
MCM2

16
APO-BrdU TUNEL Assays
Apoptosis levels of Rb +/+ and Rb -/- cells were measured through APO-BrdU
Terminal deoxyribonucleotidyl transferase–mediated dUTP nick end labeling (TUNEL)
assays (Apoptosis Detection Kit (APO-BrdU) (Cat. No. 556405, BD Pharmingen)) as
published previously [103, 110, 144-147]. Briefly, floating and attached cells (following
trypsinization) were harvested, washed in PBS, and resuspended in PBS with 95%
ethanol added drop-wise while vortexing to reach a final concentration of 70% ethanol
to fix. Cells were then pelleted, washed, and processed for analysis according to
manufacturer protocol. At least 1 × 10⁴ cells per experimental condition were analyzed
for fluorescence on a Becton-Dickinson FACScan using Cell Quest software.
Cell Viability Assays
For the CellTiter-Blue cell viability assays of Chapter Three, 1 x 10³ cells in 24 μL
were plated in each well of 384-well plates and incubated overnight at 37°C, 5% CO2.
The following day, drugs were diluted in media and 6 μL of each dilution was added to
the appropriate wells using an automated pipetting station. Four replicate wells were
used for each drug concentration. The cells were incubated with the drug for 120 hrs
and then 5 μL CellTiter-Blue reagent (Promega Corp., Madison, WI) was added. Cell
viability was assessed by the ability of the remaining treated cells to bioreduce resazurin
to resorufin (579 nm Ex/584 nm Em). Fluorescence was read with a Synergy HT
microplate reader (Bio-Tek Instruments, Inc., Winooski, VT). IC50s were determined
using a sigmoidal equilibrium model regression using XLfit version 4.3.2 (ID Business
Solutions Ltd.) and were defined as the concentration of drug required for a 50%
reduction in growth/viability.

17
For 3-(4,5-dimethylthiazol-2-yl)-5-(3-carboxymethoxyphenyl)-2-(4-sulfophenyl)-
2H-tetrazolium (MTS) cell viability assays in Chapter Three, CellTiter 96 AQueous One
Solution (Promega) was added according to vendor instructions to cells for 2 hours
following drug treatment for 72 hrs. Cells were maintained at 37°C and 5% CO2 for all
incubations. All experiments were performed in triplicate and repeated at least three
times.
For the CellTiter-Glo cell viability assays of Chapter Five, 40 µL of cells at 1000
cells/well were seeded in triplicate for testing ten different concentrations of cisplatin (30
wells total for each cell type) into 384-well plates. Two wells along all outer edges of the
plate were each filled with 80 µL of media alone. The following day, 10 µL of each drug
at 1/3 serial dilutions for ten concentration points were added to the cells along with
sufficient DMSO to maintain constant DMSO concentrations in all treatments. Cells
were maintained at 37°C and 5% CO2 for all incubations. Following 120 hours of
treatment, 10 µL of CellTiter-Glo assay reagent (Promega) was added to each well and
measured in a Molecular Dynamics M5 Spectrophotometer Luminescence reader.
Calculations were made using GraphPad Prism.
Combination Indices Calculation
IC50s as calculated via the CellTiter-Blue experiments were used to design the
drug combination experiments. 6474 was combined with cisplatin, gemcitabine, and
paclitaxel at ratios of 1:1, 500:1, and 4000:1, respectively. CellTiter-Blue assays were
used to determine cell viability and results were analyzed for synergistic, additive, or
antagonistic effects using the combination index (CI) method by Chou and Talalay

18
[148]. Combination indices of CI < 1, CI = 1, and CI > 1 indicate synergism, additive
effects, and antagonism, respectively.
Bliss Cooperation Calculation
Cells were seeded in triplicate into 384 well plates at 2.5 x 10⁴ cells/mL in 40 µL
(or 1000 cells) per well. The next day, 10 µL of cisplatin and CDK inhibitors were added
to cells in serial ¼ dilutions for 6 different dosages. Cisplatin was the base drug and its
dosages ranged from 0 µM to 192 µM in H322 cells and 0 µM to 128 µM in H1648 cells
(based on previously determined IC50s), while all CDK inhibitors ranged from 0 µM to 10
µM in both cell lines. DMSO concentrations were kept constant in all wells. Cells were
maintained at 37°C and 5% CO2 for all incubations. Approximately 72 hours later, 10 µL
of CellTiter-Glo assay reagent was added to each well and read in a PE Envision
Luminometer. Analysis was conducted in GraphPad Prism following the Bliss additivity
model [149].
Statistical Analysis
For the 6474 real-time PCR analysis for time point experiments, the difference in
expression of each experimental gene and expression of the control gene was
calculated for each cell line at each time point. Then, the difference between each of the
non-0 hour time points and the 0 hour time point readings for each gene in each cell line
was calculated using T-Tests with Welch’s correction. For Chapter Three, all paclitaxel
IC50s were log-transformed to improve normality. The correlation of E2F3 mRNA and
protein expression with log paclitaxel IC50s was calculated using Pearson correlation
coefficient. Wilcoxon rank-sum tests were used to explore the difference of cell viability
in control siRNA treatment with either E2F3a or E2F3b siRNA treatment.

19
The correlation between CDK12 IHC and Ki67 IHC results were determined via
Pearson correlation coefficient.
Small Interfering RNA (siRNA) Transfections
Cells were plated at ~50% confluency, then transfected with siRNA (all from
Dharmacon) using Lipofectamine 2000 per manufacturer instructions. The siRNA used
were siGENOME Non-Targeting siRNA #2, E2F1 ON-TARGETplus SMARTpool siRNA,
E2F4 ON-TARGETplus SMARTpool siRNA, RB1 ON-TARGETplus SMARTpool siRNA,
CDK5 custom siRNA (sense sequence GAGCUGAAAUUGGCUGAUU, ON-TARGET
enhanced antisense loading, standard A4 processing, UU overhangs), CDK9 custom
siRNA (sense sequence GGCCAAACGUGGACAACUA, standard A4 processing, UU
overhangs), CRKRS ON-TARGETplus SMARTpool siRNA, CDC2L5 ON-TARGETplus
SMARTpool siRNA, PCTK1 ON-TARGETplus SMARTpool siRNA, and E2F3a, E2F3b,
and E2F3a+b sequences from Hurst et al [150]. Cells were trypsinized and aliquoted for
each respective experiment either approximately 24 hours following transfection or
while changing the media after the transfection (per standard manufacturer protocol).
Animal Studies
Four immunodeficient NU/NU nude female mice from Charles River (8 weeks,
~20 grams) were used to determine the maximum tolerated dose (MTD) of 6474 in
accordance to a protocol approved by the Institutional Animal Care and Use Committee
at the University of South Florida. Two mice were given injections of DMSO only while
the two other mice were given escalating doses of 6474 (at 5, 10, 20, 30, and 40 mg/kg)
twice a week for one week per dosage. Doses were prepared from a stock solution with
PBS added so that all injections were 200 μL. After each treatment, mouse weights

20
were measured and animal behavior noted. Following the highest dosage, any
remaining mice were sacrificed and necropsies performed to harvest the organs. Lungs,
hearts, livers, spleens, kidneys, pancreases, and intestines of each mouse were stored
in formaldehyde, and then used to create formalin-fixed, paraffin-embedded (FFPE)
blocks. These tissues were analyzed via immunohistochemistry by the Pathology Core
at H. Lee Moffitt Cancer Center following their standard protocol for hematoxylin and
eosin (H&E) and cleaved caspase 3 (#9661, Cell Signaling Technology) staining.
Microarray Analysis
H322, H1648, and H1666 cells were transfected with CDK12 siRNA, and total
RNA was harvested and analyzed via Affymetrix U133A microarrays. These
microarrays were normalized against the median sample (H1648 CDK12 siRNA) using
IRON [151]. For each knockdown versus control pair, probesets were filtered by
requiring a log2 intensity >5 for at least one of the two paired samples, and a fold-
change in magnitude ≥ 1.5. H1666 behaved in a very different manner from the other
two cell lines and were removed from the analysis. A further filter was then applied,
requiring each probeset to pass the above cutoffs in the two remaining cell lines and
change in the same direction, yielding 1395 probesets.
Signature Development
Samples from A549 and H1299 cell lines were normalized separately with the
RMA method using Affymetrix Power Tools software, v1.12.0 (Affymetrix, Inc., Santa
Clara, CA, USA), due to large differences in gene expression between cell lines. Log2
ratios were then calculated between knockdown and control. The following filters were
then applied to identify differentially expressed probesets. 1) For each knockdown, low

21
expressing probesets were discarded by requiring at least one sample to express a
normalized log2 intensity greater than 6. 2) Second, we required both cell lines to agree
in direction of change, to change by more than ±1.1-fold, and at least one of the cell
lines must change by at least ±1.5-fold. 3) The final list of E2F-related genes was
assembled by including all probesets that were differentially expressed in at least 5 of
the 6 knockdown conditions, yielding 471 probesets. 4) As a final filter to reduce the
number of genes in the signature, probesets that differ between tumor and adjacent
normal lung tissue were identified using GEO [152] datasets GSE18842 (45 adjacent
normals and 46 tumors) and GSE19188 (58 adjacent normals and 87 tumors, after
discarding outlier samples). Each dataset was normalized with IRON [151] and
analyzed separately. For each probeset, the average and standard deviation (SD) of
the adjacent normal log2 intensities were calculated. Upper and lower bounds for
baseline adjacent normal expression were set at ± 3 SD from average. The number of
samples outside ± 3 SD was counted for both adjacent normals and tumors. A probeset
was identified as differentially expressed within a subset of tumors if the following
criteria were met: (A) must have at least three log2 intensities ≥5 across all samples, (B)
must have at least three tumor samples outside 3 SD (significant), (C) the frequency of
significant samples within tumors must be at least twice that observed within adjacent
normals, and (D) significant tumor samples must be at least 1.5-fold further from the
adjacent normal average than significant adjacent normals. The lists of differentially
expressed probesets from each dataset were then intersected to yield the final 5604
probesets. The intersection of this list with the E2F-related signature results in 145
probesets.

22
GeneGo Analysis
Entrez GeneIDs for the 471-probeset and 145-probeset E2F-related signatures
were entered into GeneGo MetaCore for pathway enrichment analysis. Both signatures
returned cell cycle, followed by cell division-related pathways involving DNA damage, as
the most significant pathways.
Overall Survival Analysis
An overall E2F score was generated by principal component analysis to reflect
the combined expression of the E2F signature genes. Specifically, we used the first
principal component (a weighted average expression among the E2F signature genes),
as it accounts for the largest variability in the data, to represent the overall expression
level for the signature. That is, E2F score = ∑wixi, a weighted average expression
among the E2F genes, where xi represents gene i expression level, wi is the
corresponding weight (loading coefficient) with ∑w2i=1, and the wi values maximize the
variance of ∑wixi. This approach has been used to derive various gene signatures in
breast cancer and lung cancer [153, 154]. For classifying patients as having either low
or high E2F scores, the median split of E2F score was used to stratify patients. Patients
were placed in the low group if the E2F score was less than the median of E2F score
and in the high group if the E2F score was greater than or equal to the median of the
E2F score.
To determine the prognostic value of the E2F signature in both MCLA and
SPORE 442 cohorts, the Kaplan-Meier method with log rank-test was used to test if the
survival curves were different between the two groups (low and high E2F score). To find
the predictive value in JBR.10 cohort, the Cox proportional hazards model with an

23
interaction term was used to investigate a statistically significant interaction between
ACT and the E2F gene signature, which could suggest differential treatment effects
among those in the high or low E2F score groups. A p-value less than 0.05 was
considered statistically significant. For the TMA data, the Kaplan-Meier method with log
rank-test was used to test if (A) high/low E2F had a significant survival difference, (B)
high/low Ki67 yielded a significant survival difference. A p-value of less than 0.05 was
considered as statistically significant.
Clinical Data for Patient Samples
The Molecular Classification of Lung Adenocarcinoma (MCLA) from the
Director’s Challenge Consortium is a dataset comprised of microarray data from 442
lung adenocarcinoma tumors from H. Lee Moffitt Cancer Center, the University of
Michigan Cancer Center, Dana-Farber Cancer Institute, and Memorial Sloan-Kettering
Cancer Center. Samples were processed and analyzed through microarray on U133A
GeneChip microarrays from Affymetrix [155].
The SPORE442 was composed of microarray data from 442 lung
adenocarcinoma patients as part of H. Lee Moffitt’s Total Cancer Care Network. Patient
samples were analyzed via U133A GeneChip microarrays from Affymetrix.
The JBR.10 clinical trial included 482 stage IB-II NSCLC patients, of which 169
had their frozen tumor tissues banked. Of these, 133 were analyzed on U133A
GeneChip microarrays by Affymetrix and are listed as GSE14814 on Gene Expression
Omnibus (GEO). Sixty-two of these patients were only observed following surgical
resection, while the other 71 patients received cisplatin and vinorelbine adjuvant
chemotherapy (ACT) [156].

24
Tissue Microarray
Paraffin-embedded samples from 152 patients (which are a subset of the
SPORE442 patients from H. Lee Moffitt Cancer Center) were cut into slides and stained
with H&E. Following analysis by a board-certified clinical pathologist, blocks were
released for further use as appropriate. Tumor and corresponding normal tissues were
marked in each sample, and samples where the tissue diameter was at least 0.6 mm
were punched and arrayed into a paraffin block using a tissue arrayer (Beecher
Instrument, Silver Spring, MD). The final product contains 145 cores from primary
adenocarcinomas, 58 cores of adjacent normal tissue, 14 cores from non-lung tissue
controls (both normal and tumors), and 10 samples of lung cancer cell lines. The
decrease in the number of primary adenocarcinoma tissues used was due to either the
core containing tissue other than tumor or due to there being a lack of tissue in the core.
TMA slides were prepared in 4 µm sections and stained with a rabbit anti-CDK12
antibody (HPA008038, Sigma-Aldrich). Staining details are available upon request. A
board-certified clinical pathologist then analyzed the stained TMA using the normal
tissue cores to determine staining criterion. Cores were scored based on staining as
positive or negative.
NanoString Analysis
A cohort of 32 patients for whom there were 1) FFPE blocks from which RNA
could be derived, 2) fresh frozen tissue from which matching RNA could be obtained,
and 3) microarray data derived from the fresh frozen RNA was identified primarily based
on availability. Blocks were physically acquired though an established, honest broker
system under the supervision of the University of South Florida (USF) Institutional
25
Review Board (IRB). The analysis began with 112 candidates that fit all criteria.
Samples were first reviewed by a certified pathologist to release the blocks for study
and for pathologic confirmation of a diagnosis of adenocarcinoma, percent malignancy,
cellularity, stroma, and immune infiltration. Samples with inadequate characteristics or
that did not match recorded histology were excluded from analysis. Two 5-μm sections
of each FFPE block were cut for H&E staining and five sections of 25-μm thickness
were cut for RNA extraction. Each tissue specimen was processed in Moffitt’s Tissue
Core facility using Qiagen’s RNeasy FFPE kit. All samples were quality-controlled using
an Agilent 2100 Bioanalyzer, barcoded, and provided to us. Although the RNA from
FFPE tissue was highly degraded (see Chapter Four), these amounts of tumor tissue
produced well over 1000 ng of total RNA (which is sufficient for five NanoString assays).
These findings suggest that adequate RNA from a single slide should be sufficient for a
single NanoString assay in the future. The NanoString Assays were performed using
200-ng aliquots of RNA by Sean Yoder in the Molecular Genomics Core Facility. He
performed the assays using the NanoString nCounter Analysis system with codesets
and reagents designed and provided directly from NanoString. After codeset
hybridization overnight, the samples were washed and immobilized to a cartridge using
the NanoString nCounter Prep Station. Cartridges were scanned in the nCounter Digital
Analyzer at 555 fields of view (FOV) for the maximum level of sensitivity. Raw
NanoString counts (number of counts/gene/sample) were normalized technically using
spiked-in positive control probe sets and biologically using codesets corresponding to
nine genes (PRDM4, SART3, GIGYF2, HDAC3, USP4, C2orf42, MUS81, TATDN2,
DEDD). These nine genes were elected as highly invariant among tissues in published

26
work [157] and were further selected based on having the least variation in the
SPORE442 based on microarray.
Protein Microextraction
Per protocol kindly provided by Alvaro Monteiro’s lab [158, 159], 100 mm plates
of cells were washed with PBS and then scraped in 500 µL PBS into an Eppendorf tube.
Cells were pelleted by centrifugation at 4°C at 5000 rpm for 5 minutes, then supernatant
was aspirated and 60 µL of Buffer A (732.3 µL of ddH2O, 20 µL of 1M Tris pH 7.4, 200
µL 50% glycerol, 10 µL 1M KCl, 20 µL 10% NP-40, 2 µL 0.5M EDTA pH 8.0, 10 µL
PMSF, 10 µL protease inhibitors, 2.4 µL 250 mM β-mercaptoethanol) was added to
each pellet. Cells were resuspended by flicking and left for 2 minutes on ice. Samples
were then centrifuged at 4°C at 13,200 rpm for 5 minutes, and the supernatant (the
cytoplasmic extract) was harvested and stored at -70°C. Pellets were then resuspended
in 20 µL Buffer B (223.15 µL ddH2O, 10 µL 1M Tris pH 7.4, 200 µL 50% glycerol, 5 µL
1M KCl, 50 µL 4M NaCl, 1 µL 0.5M EDTA pH 8.0, 5 µL PMSF, 5 µL protease inhibitors,
1.2 µL 250 mM β-mercaptoethanol) by pipetting and incubated for 30 mins on ice.
Samples were centrifuged at 4°C at 13,200 rpm for 5 mins, and the supernatant (the
nuclear extract) was harvested and stored at -70°C. Finally, 20 µL of acid extraction
buffer (75 µL ddH2O, 125 µL 2M HCl, 100 µL 50% glycerol, 200 µL 250 mM β-
mercaptoethanol) was added to each pellet and vortexed to mix. Cells were incubated
for 2 mins at room temperature, centrifuged at 9,600 rpm at room temperature for 5
minutes, and then supernatant was harvested. This supernatant (the chromatin extract)
was mixed with 7.5 µL of neutralization buffer (220.8 µL ddH2O, 9.6 µL 1M Tris pH 7.4,
9.6 µL protease inhibitors) and 2.5 µL of 4M NaOH, and then stored at -70°C.

27
CHAPTER THREE:
E2F INHIBITION SYNERGIZES WITH PACLITAXEL IN LUNG CANCER CELL LINES
Introduction
As mentioned earlier, E2Fs are important within lung cancer for their role in a
variety of processes. The E2Fs that will be most discussed in this work include E2F1,
E2F3, and E2F4. E2F1 is traditionally recognized as an activator E2F, and is widely
recognized for its roles in proliferation [109, 160-164] and apoptosis [100] (both p53-
dependent [163, 165-173] and p53-independent mechanisms [174-177]), depending on
the situation. Interestingly, this apoptotic ability appears to be important as a means of
preventing cancer development, and loss of E2F1’s apoptotic ability is believed to be
the cause of tumor formation [98] and excessive amounts of mature T cells [99] in
E2F1-/- transgenic mice. Of all the E2F family members, E2F3 is one of the most
commonly implicated as having highly oncogenic properties. Like E2F1, it is commonly
classified as a transcriptional activator E2F. It is the only family member individually
required for cellular proliferation to occur [178-182], and is important for transcription of
various genes needed for S phase entry as well as G2/M phases (such as AURKA
[183], CDC2 [184], and CCNB1 [184, 185]). There are two E2F3 isoforms, E2F3a and
E2F3b, each resulting from transcription at two different promoters. E2F3b levels
remain constant throughout the cell cycle, whereas E2F3a expression levels fluctuate

28
and peak around the G1/S transition [186-188]. Mouse knockout studies reveal that
E2F3a and E2F3b are generally compensatory for one another [189, 190], but deletion
of both isoforms is lethal [178, 189]. E2F3 is more highly expressed in multiple cancers
(see [111] for a review), including lung [191], and its activity has been correlated with
increased sensitivity to taxane treatment in ovarian cancers [192] and ER-negative
breast cancer [193]. E2F4 is traditionally recognized as a repressor E2F. E2F4 is the
most abundant E2F protein present in cells [194], and its protein expression levels
remain constant throughout the cell cycle [195]. It is known to shuttle between the
nucleus and the cytoplasm depending on the cell cycle stage [196, 197]. Previously, our
lab demonstrated that depleting cancer cells of this E2F enhances sensitivity to a
variety of chemotherapeutic agents, suggesting that E2F4 may be involved in promoting
cell survival [146]. Transgenic E2F4-/- mice have been shown to have craniofacial
defects, which can thus increase their susceptibility to infections and eventually lead to
death [198].
Numerous methods of targeting the CDK/Rb/E2F pathway have been explored in
cancer. One method involves the use of demethylating agents, such as 5-aza-2’-
deoxycytidine, which can demethylate the promoters of genes such as CDK inhibitors
CDKN2A and CDKN1C and restore their expression, thus promoting cell cycle arrest
[199-202]. However, this method is not very specific. A different, popularly explored
method of targeting this pathway has been through the use of ATP-competitive CDK
inhibitors. Kinases have been more commonly targeted for inhibitor development, thus
making them a more desirable target. However, there can be issues with specificity to
cell cycle-related CDKs alone (such as those seen with flavopiridol), thus leading to off-

29
target effects and high toxicity [203]. Also, in regard to inhibitors that are sufficiently
specific to cell cycle related CDKs (such as palbociclib, also known as PD-0332991),
another issue can present itself where the compound is only effective in tumors that still
contain a functional, wildtype Rb protein [142, 204-211]. These compounds would
therefore not be useful in Rb mutant cells. As such, targeting even further downstream
in the pathway appeared to be an ideal method for treating a variety of cancers that may
or may not have RB1 mutations (such as lung cancer), and E2F inhibitors were
explored. HLM006474 (also discussed here as 6474) is a small molecule pan-inhibitor
of E2F-DNA binding [144]. Although the IC50 of HLM006474 is relatively high (30 µM), it
has found use as a tool compound in the laboratory [212-215]. Previous in vivo studies
in melanoma indicated that the effects of 6474 treatment on different cell lines included
a reduction in cell proliferation, an increase in apoptosis, and reduced invasion in a
three-dimensional tissue culture model system [144]. Others have shown that
HLM006474 may be useful in cancer prevention by leading to an increase in apoptosis
and decrease of proliferation in tumorigenic human embryonic stem cells [214], as well
as leading to a decrease in tumor formation in mouse embryos prone to retinoblastoma
[215]. Together, these results suggest that interference with E2F activity using small
molecules may have clinical application in cancer therapy.
In the current work, we provide a more thorough characterization of 6474 in the
context of lung cancer. HLM006474 reduced the viability of a wide variety of cell lines.
In combination with several common chemotherapeutic agents, HLM006474 synergized
with paclitaxel but not with cisplatin nor gemcitabine. In consideration of previously
published data suggesting a relationship between E2F3 activity and paclitaxel

30
sensitivity, E2F3 was examined further in NSCLC cell lines to determine if this protein
could possibly explain the observed synergy between paclitaxel and 6474. The data
demonstrate that E2F3 can alter cellular sensitivity to paclitaxel, and that increased
expression of this protein observed in short treatments with the compound may have
enhanced the synergy between paclitaxel and 6474. Taken together, these results
suggest that specific E2F inhibition may be an effective therapy for lung cancer patients,
especially if combined with other chemotherapeutic agents such as paclitaxel. Also,
these results suggest that E2F3 could be useful as a biomarker for paclitaxel sensitivity
in NSCLC.
Results
Sensitivity to 6474 in Lung Cancer Cell Lines Vary Between 15-75 μM
Seventeen lung cancer cell lines (eight NSCLC cell lines and nine SCLC cell
lines) were treated with 6474 for 120 hours to determine their IC50s (Table 3.1). These
IC50s ranged from 15 to 75 μM, and the overall average IC50 (31.41 ± 6.11 µM) is
roughly equivalent to the previously determined biochemical IC50 (29.8 ± 7.6 µM) [144].
No significant difference between the average IC50s for NSCLC (27.99 µM) versus
SCLC (34.46 µM) was detected.
Rb-Null Cells Are More Sensitive to 6474 than Syngeneic Rb+/+ Cells
Since 6474 is a pan-E2F inhibitor, it was expected that cells lacking RB1 would
have increased sensitivity to 6474. However, it was surprising to note that SCLC cell
lines were not more sensitive to 6474 than NSCLC cells (as shown in Table 3.1) even
though they almost universally lack functional Rb [12, 13]. To explore whether 6474
would function as expected in syngeneic cell lines where the only variable is Rb status,

31
Rb+/+ and Rb-/- mouse embryonic fibroblasts (MEFs) (kindly provided by Dr. Frederic
Kaye’s lab at the University of Florida) were treated with varying concentrations of 6474.
Following confirmation of the cells’ Rb status using Western blots (Figure 3.1A), cells
were treated with 0, 20, 40, or 60 µM 6474. Rb-/- cells analyzed via Western blots
demonstrated apoptosis following lower doses of 6474 as demonstrated by PARP
cleavage (Figure 3.1B). Likewise, APO-BrdU TUNEL assays gave similar results,
Table 3.1: 6474 IC50s vary in lung cancer cell lines from 15-75 μM.
Note: Table reprinted from the following: Kurtyka, C.A., L. Chen, and W.D. Cress, E2F inhibition synergizes with paclitaxel in lung cancer cell lines. PLoS One, 2014. 9(5): p. e96357.
Cell Line Tumor Type IC50 (in μM) STDEV
A549 NSCLC 31.80 12.90
NCI-H1299 NSCLC 27.30 16.50
NCI-H1650 NSCLC 34.00 3.60
NCI-H1975 NSCLC 44.30 12.10
NCI-H292 NSCLC 28.90 3.10
NCI-H358 NSCLC 19.10 4.60
NCI-H441 NSCLC 15.50 3.40
NCI-H661 NSCLC 23.00 3.20
DMS-79 SCLC 22.30 3.10
SCLC-16HC SCLC 24.90 4.00
SCLC-16HV SCLC 51.40 10.90
SCLC-86M1 SCLC 15.70 2.40
DMS114 SCLC 23.80 1.50
NCI-H209 SCLC 21.90 7.19
NCI-H69 SCLC 53.70 5.44
NCI-H82 SCLC 21.30 3.02
NCI-N417 SCLC 75.10 6.96
NSCLC Average 27.99 7.43
SCLC Average 34.46 4.95
Overall Average 31.41 6.11

32
showing greater levels of terminal deoxynucleotidyl transferase dUTP nick end labeling
in Rb-/- cells (Figure 3.1C). Further confirmation was shown via CellTiter-Blue cell
viability assays, where Rb-/- cells had 6474 IC50s that were less than half of those for
Rb+/+ cells (Figure 3.1D). Therefore, these experiments demonstrate that for syngeneic
cell lines, those lacking Rb are more sensitive to E2F inhibition as expected.
Figure 3.1: Rb-null MEFs are more sensitive to 6474 than syngeneic Rb+/+ cells. Rb+/+ and Rb-/- mouse embryonic fibroblasts (MEFs) were confirmed to have the expected levels of Rb (A.), then treated with varying concentrations of 6474. Rb-/- cells were shown to be more sensitive to 6474 via increased PARP cleavage (B.), increased APO-BRDU incorporation (C.), and lower 6474 IC50s (D.).
A.
- PARP
- cleaved PARP
:6474, μM 0 20 40 60 0 20 40 60
MEF Rb-/-MEF Rb+/+
C.
Rb
-/-+/+
- Rb
- pRb (807/811)
- Actin
B.
- Actin
D. HLM6474-Hi
1227 cells:MEFS Rb+/+, -/- r= 0.998 IC50= 20.52E-6
[HLM6474-Hi]-5
%o
fu
ntr
eate
d
-20
0
20
40
60
80
100
120
HLM6474-Hi
1227 cells:MEFS Rb+/+, -/- r= 0.998 IC50= 8.7E-6
[HLM6474-Hi]-5
%of
untr
ea
ted
-20
0
20
40
60
80
100
120
MEFs Rb+/+
Ave. IC50: 16+3 μM
MEFs Rb-/-
Ave. IC50: 7+2 μM
% g
row
th o
f u
ntr
ea
ted
% g
row
th o
f u
ntr
ea
ted
10 20 40 605
μM 6474, log scale
HLM6474-Hi
1227 cells:MEFS Rb+/+, -/- r= 0.998 IC50= 20.52E-6
[HLM6474-Hi]-5
%o
fu
ntr
eate
d
-20
0
20
40
60
80
100
120HLM6474-Hi
1227 cells:MEFS Rb+/+, -/- r= 0.998 IC50= 20.52E-6
[HLM6474-Hi]-5
%o
fu
ntr
eate
d
-20
0
20
40
60
80
100
120
HLM6474-Hi
1227 cells:MEFS Rb+/+, -/- r= 0.998 IC50= 8.7E-6
[HLM6474-Hi]-5
%of
untr
ea
ted
-20
0
20
40
60
80
100
120HLM6474-Hi
1227 cells:MEFS Rb+/+, -/- r= 0.998 IC50= 8.7E-6
[HLM6474-Hi]-5
%of
untr
ea
ted
-20
0
20
40
60
80
100
120
MEFs Rb+/+
Ave. IC50: 16+3 μM
MEFs Rb-/-
Ave. IC50: 7+2 μM
% g
row
th o
f u
ntr
ea
ted
% g
row
th o
f u
ntr
ea
ted
10 20 40 605
μM 6474, log scale
MEFs Rb+/+
MEFs Rb-/-
0
5
10
15
20
25
30
35
0 20 40 60
Rb +/+
Rb -/-
% A
PO
-Brd
U incorp
ora
tion
μM 6474
MEF Rb-/-
MEF Rb+/+
A.
- PARP
- cleaved PARP
:6474, μM 0 20 40 60 0 20 40 60
MEF Rb-/-MEF Rb+/+
C.
Rb
-/-+/+
- Rb
- pRb (807/811)
- Actin
B.
- Actin
D. HLM6474-Hi
1227 cells:MEFS Rb+/+, -/- r= 0.998 IC50= 20.52E-6
[HLM6474-Hi]-5
%o
fu
ntr
eate
d
-20
0
20
40
60
80
100
120
HLM6474-Hi
1227 cells:MEFS Rb+/+, -/- r= 0.998 IC50= 8.7E-6
[HLM6474-Hi]-5
%of
untr
ea
ted
-20
0
20
40
60
80
100
120
MEFs Rb+/+
Ave. IC50: 16+3 μM
MEFs Rb-/-
Ave. IC50: 7+2 μM
% g
row
th o
f u
ntr
ea
ted
% g
row
th o
f u
ntr
ea
ted
10 20 40 605
μM 6474, log scale
HLM6474-Hi
1227 cells:MEFS Rb+/+, -/- r= 0.998 IC50= 20.52E-6
[HLM6474-Hi]-5
%o
fu
ntr
eate
d
-20
0
20
40
60
80
100
120HLM6474-Hi
1227 cells:MEFS Rb+/+, -/- r= 0.998 IC50= 20.52E-6
[HLM6474-Hi]-5
%o
fu
ntr
eate
d
-20
0
20
40
60
80
100
120
HLM6474-Hi
1227 cells:MEFS Rb+/+, -/- r= 0.998 IC50= 8.7E-6
[HLM6474-Hi]-5
%of
untr
ea
ted
-20
0
20
40
60
80
100
120HLM6474-Hi
1227 cells:MEFS Rb+/+, -/- r= 0.998 IC50= 8.7E-6
[HLM6474-Hi]-5
%of
untr
ea
ted
-20
0
20
40
60
80
100
120
MEFs Rb+/+
Ave. IC50: 16+3 μM
MEFs Rb-/-
Ave. IC50: 7+2 μM
% g
row
th o
f u
ntr
ea
ted
% g
row
th o
f u
ntr
ea
ted
10 20 40 605
μM 6474, log scale
MEFs Rb+/+
MEFs Rb-/-
HLM6474-Hi
1227 cells:MEFS Rb+/+, -/- r= 0.998 IC50= 20.52E-6
[HLM6474-Hi]-5
%o
fu
ntr
eate
d
-20
0
20
40
60
80
100
120
HLM6474-Hi
1227 cells:MEFS Rb+/+, -/- r= 0.998 IC50= 8.7E-6
[HLM6474-Hi]-5
%of
untr
ea
ted
-20
0
20
40
60
80
100
120
MEFs Rb+/+
Ave. IC50: 16+3 μM
MEFs Rb-/-
Ave. IC50: 7+2 μM
% g
row
th o
f u
ntr
ea
ted
% g
row
th o
f u
ntr
ea
ted
10 20 40 605
μM 6474, log scale
HLM6474-Hi
1227 cells:MEFS Rb+/+, -/- r= 0.998 IC50= 20.52E-6
[HLM6474-Hi]-5
%o
fu
ntr
eate
d
-20
0
20
40
60
80
100
120HLM6474-Hi
1227 cells:MEFS Rb+/+, -/- r= 0.998 IC50= 20.52E-6
[HLM6474-Hi]-5
%o
fu
ntr
eate
d
-20
0
20
40
60
80
100
120
HLM6474-Hi
1227 cells:MEFS Rb+/+, -/- r= 0.998 IC50= 8.7E-6
[HLM6474-Hi]-5
%of
untr
ea
ted
-20
0
20
40
60
80
100
120HLM6474-Hi
1227 cells:MEFS Rb+/+, -/- r= 0.998 IC50= 8.7E-6
[HLM6474-Hi]-5
%of
untr
ea
ted
-20
0
20
40
60
80
100
120
MEFs Rb+/+
Ave. IC50: 16+3 μM
MEFs Rb-/-
Ave. IC50: 7+2 μM
% g
row
th o
f u
ntr
ea
ted
% g
row
th o
f u
ntr
ea
ted
10 20 40 605
μM 6474, log scale
MEFs Rb+/+
MEFs Rb-/-
0
5
10
15
20
25
30
35
0 20 40 60
Rb +/+
Rb -/-
% A
PO
-Brd
U incorp
ora
tion
μM 6474
MEF Rb-/-
MEF Rb+/+
0
5
10
15
20
25
30
35
0 20 40 60
Rb +/+
Rb -/-
% A
PO
-Brd
U incorp
ora
tion
μM 6474
0
5
10
15
20
25
30
35
0 20 40 60
Rb +/+
Rb -/-
% A
PO
-Brd
U incorp
ora
tion
μM 6474
MEF Rb-/-
MEF Rb+/+

33
6474 Synergizes with Paclitaxel, but Not Cisplatin nor Gemcitabine, in
NSCLC Cell Lines
In order to examine whether 6474 would synergize with common
chemotherapeutic agents used to treat NSCLC patients, combination indices were
calculated for each combination of 6474 with cisplatin, gemcitabine, and paclitaxel. In
H1299 cells, 6474 is antagonistic with cisplatin (Figure 3.2A, CI = 1.40) and gemcitabine
(Figure 3.2B, CI = 1.39), but weakly synergistic with paclitaxel (Figure 3.2C, CI = 0.98).
This synergy was confirmed via Western blot where there was PARP cleavage in
samples treated with both 6474 and paclitaxel, but not when untreated or with either
compound alone (Figure 3.2D). Similar results were seen in H292 cells, where 6474
was antagonistic with cisplatin (Figure 3.2E, CI = 1.51) and gemcitabine (Figure 3.2F, CI
= 1.46), but synergistic with paclitaxel (Figure 3.2G, CI = 0.96).
Sensitivity to Paclitaxel Correlates to E2F3 Levels
It has been previously shown that high E2F3 activity correlates with enhanced
sensitivity to paclitaxel in ovarian cancer [192] and ER-negative breast cancer [193].
Therefore, we wanted to examine whether this might hold true in NSCLC as well. First,
we compared endogenous E2F3 mRNA levels to log paclitaxel IC50s from ten NSCLC
cell lines (Figure 3.3A). This analysis demonstrated that there is a significant negative
correlation between E2F3 mRNA levels and log paclitaxel IC50s. Also, endogenous
E2F3a and E2F3b protein levels from the same cell lines (Figure 3.3B) were compared
to IC50s and shown to correlate in a similar, though insignificant, manner (Figure 3.3C).
To further confirm these findings, H1299 cells were transfected with control, E2F3a, or
E2F3b siRNA (Figure 3.4A) and treated with paclitaxel, and then their cell

34
Figure 2
A. B.
C. D.
- PARP
- cleaved PARP
- Actin
H1299
Paclitaxel
+ +
+ +
6474
E. F.
G.
Exp 859A - CT Blue Assay - H292Timecourse: HLM006474 plus Gemacitabine or media 5 days assay
HLM006474 [M]
1x10⁻⁶ 10x10-6 100x10-6
% o
f co
ntr
ol (±
SD
)
0
10
20
30
40
50
60
70
80
90
100
110
Gem [M]
100x10-9 1x10⁻⁶
HLM
Gem
Combi (200:3)
HLM [µM]10 100
% o
f contr
ol (±
SD
)
0
20
40
60
80
100
CisPt [µM]10
HLM
CisPt
Combi (4:1)
HLM [µM]10 100
% o
f co
ntr
ol (±
SD
)
0
20
40
60
80
100
Gem [nM]100
HLM
Gem
Combi (200:1)
10 100
0.1 1
HLM [μM]
Gem [μM]
Exp 859A - CT Blue Assay - H292Timecourse: HLM006474 plus Cisplatin or media 5 days assay
HLM006474[M]
1x10⁻⁶ 10x10-6 100x10-6
% o
f co
ntr
ol (±
SD
)
0
10
20
30
40
50
60
70
80
90
100
110
CisPt [M]
1x10⁻⁶ 10x10-6
HLM
CisPt
Combi (4:1)
HLM [µM]10 100
% o
f contr
ol (±
SD
)
0
20
40
60
80
100
CisPt [µM]10
HLM
CisPt
Combi (4:1)
10 100 HLM [μM]
1 10 CisPt [μM]
HLM [µM]10 100
% o
f contr
ol (±
SD
)
0
20
40
60
80
100
CisPt [µM]10
HLM
CisPt
Combi (4:1)
Exp 859A - CT Blue Assay - H292Timecourse: HLM006474 plus Pactacxel or media 5 days assay
HLM006474 [M]
1x10⁻⁶ 10x10-6 100x10-6
% o
f co
ntr
ol (±
SD
)
0
10
20
30
40
50
60
70
80
90
100
110
Pac [M]
100x10-12 1x10⁻⁹
HLM
Pac
Combi (20000:1)
HLM [µM]10
% o
f contr
ol (±
SD
)
0
20
40
60
80
100
Pac [nM]1
HLM
Pac
Combi (20000:1)
HLM [µM]10 100
% o
f contr
ol (±
SD
)
0
20
40
60
80
100
CisPt [µM]10
HLM
CisPt
Combi (4:1)
10 100 HLM [μM]
0.1 1 Pac [nM]
HLM [µM]10 100
% o
f contr
ol (±
SD
)
0
20
40
60
80
100
CisPt [µM]10
HLM
CisPt
Combi (4:1)
HLM [μM]
CisPt [μM]
0
2
0
4
0
60
8
0
10
0
HLM [µM]10 100
% o
f contr
ol (±
SD
)
0
20
40
60
80
100
CisPt [µM]10
HLM
CisPt
Combi (4:1)
HLM [μM]
CisPt [μM]
HLM [µM]10 100
% o
f contr
ol (±
SD
)
0
20
40
60
80
100
CisPt [µM]10
HLM
CisPt
Combi (4:1)
HLM [μM]
CisPt [μM]
0
2
0
4
0
60
8
0
10
0
HLM [µM]10 100
% o
f contr
ol (±
SD
)
0
20
40
60
80
100
Pac [nM]10
HLM
Pac
Combi (4000:1)
HLM [μM]
Pac [nM]
0
2
0
4
0
60
8
0
10
0
HLM [µM]10 100
% o
f contr
ol (±
SD
)
0
20
40
60
80
100
Pac [nM]10
HLM
Pac
Combi (4000:1)
HLM [μM]
Pac [nM]
HLM [µM]10 100
% o
f contr
ol (±
SD
)
0
20
40
60
80
100
Pac [nM]10
HLM
Pac
Combi (4000:1)
HLM [μM]
Pac [nM]
0
2
0
4
0
60
8
0
10
0
HLM [µM]10 100
% o
f contr
ol (±
SD
)
0
20
40
60
80
100
Gem [nM]100
HLM
Gem
Combi (200:1)
HLM [μM]
Gem [nM]
0
2
0
4
0
60
8
0
10
0
HLM [µM]10 100
% o
f contr
ol (±
SD
)
0
20
40
60
80
100
Gem [nM]100
HLM
Gem
Combi (200:1)
HLM [μM]
Gem [nM]
HLM [µM]10 100
% o
f contr
ol (±
SD
)
0
20
40
60
80
100
Gem [nM]100
HLM
Gem
Combi (200:1)
HLM [μM]
Gem [nM]
0
2
0
4
0
60
8
0
10
0
0
20
40
60
80
1
00
0
20
40
60
80
1
00
0
20
40
60
80
1
00
Figure 2
A. B.
C. D.
- PARP
- cleaved PARP
- Actin
H1299
Paclitaxel
+ +
+ +
6474
E. F.
G.
Exp 859A - CT Blue Assay - H292Timecourse: HLM006474 plus Gemacitabine or media 5 days assay
HLM006474 [M]
1x10⁻⁶ 10x10-6 100x10-6
% o
f contr
ol (±
SD
)
0
10
20
30
40
50
60
70
80
90
100
110
Gem [M]
100x10-9 1x10⁻⁶
HLM
Gem
Combi (200:3)
HLM [µM]10 100
% o
f contr
ol (±
SD
)
0
20
40
60
80
100
CisPt [µM]10
HLM
CisPt
Combi (4:1)
HLM [µM]10 100
% o
f co
ntr
ol (±
SD
)
0
20
40
60
80
100
Gem [nM]100
HLM
Gem
Combi (200:1)
10 100
0.1 1
HLM [μM]
Gem [μM]
Exp 859A - CT Blue Assay - H292Timecourse: HLM006474 plus Cisplatin or media 5 days assay
HLM006474[M]
1x10⁻⁶ 10x10-6 100x10-6
% o
f co
ntr
ol (±
SD
)
0
10
20
30
40
50
60
70
80
90
100
110
CisPt [M]
1x10⁻⁶ 10x10-6
HLM
CisPt
Combi (4:1)
HLM [µM]10 100
% o
f contr
ol (±
SD
)
0
20
40
60
80
100
CisPt [µM]10
HLM
CisPt
Combi (4:1)
10 100 HLM [μM]
1 10 CisPt [μM]
HLM [µM]10 100
% o
f contr
ol (±
SD
)
0
20
40
60
80
100
CisPt [µM]10
HLM
CisPt
Combi (4:1)
Exp 859A - CT Blue Assay - H292Timecourse: HLM006474 plus Pactacxel or media 5 days assay
HLM006474 [M]
1x10⁻⁶ 10x10-6 100x10-6
% o
f co
ntr
ol (±
SD
)
0
10
20
30
40
50
60
70
80
90
100
110
Pac [M]
100x10-12 1x10⁻⁹
HLM
Pac
Combi (20000:1)
HLM [µM]10
% o
f contr
ol (±
SD
)
0
20
40
60
80
100
Pac [nM]1
HLM
Pac
Combi (20000:1)
HLM [µM]10 100
% o
f contr
ol (±
SD
)
0
20
40
60
80
100
CisPt [µM]10
HLM
CisPt
Combi (4:1)
10 100 HLM [μM]
0.1 1 Pac [nM]
HLM [µM]10 100
% o
f contr
ol (±
SD
)
0
20
40
60
80
100
CisPt [µM]10
HLM
CisPt
Combi (4:1)
HLM [μM]
CisPt [μM]
0
2
0
4
0
60
8
0
10
0
HLM [µM]10 100
% o
f contr
ol (±
SD
)
0
20
40
60
80
100
CisPt [µM]10
HLM
CisPt
Combi (4:1)
HLM [μM]
CisPt [μM]
HLM [µM]10 100
% o
f contr
ol (±
SD
)
0
20
40
60
80
100
CisPt [µM]10
HLM
CisPt
Combi (4:1)
HLM [μM]
CisPt [μM]
0
2
0
4
0
60
8
0
10
0
HLM [µM]10 100
% o
f contr
ol (±
SD
)
0
20
40
60
80
100
Pac [nM]10
HLM
Pac
Combi (4000:1)
HLM [μM]
Pac [nM]
0
2
0
4
0
60
8
0
10
0
HLM [µM]10 100
% o
f contr
ol (±
SD
)
0
20
40
60
80
100
Pac [nM]10
HLM
Pac
Combi (4000:1)
HLM [μM]
Pac [nM]
HLM [µM]10 100
% o
f contr
ol (±
SD
)
0
20
40
60
80
100
Pac [nM]10
HLM
Pac
Combi (4000:1)
HLM [μM]
Pac [nM]
0
2
0
4
0
60
8
0
10
0
HLM [µM]10 100
% o
f contr
ol (±
SD
)
0
20
40
60
80
100
Gem [nM]100
HLM
Gem
Combi (200:1)
HLM [μM]
Gem [nM]
0
2
0
4
0
60
8
0
10
0
HLM [µM]10 100
% o
f contr
ol (±
SD
)
0
20
40
60
80
100
Gem [nM]100
HLM
Gem
Combi (200:1)
HLM [μM]
Gem [nM]
HLM [µM]10 100
% o
f contr
ol (±
SD
)
0
20
40
60
80
100
Gem [nM]100
HLM
Gem
Combi (200:1)
HLM [μM]
Gem [nM]
0
2
0
4
0
60
8
0
10
0
0
20
40
60
80
1
00
0
20
40
60
80
1
00
0
20
40
60
80
1
00
Figure 2
A. B.
C. D.
- PARP
- cleaved PARP
- Actin
H1299
Paclitaxel
+ +
+ +
6474
E. F.
G.
Exp 859A - CT Blue Assay - H292Timecourse: HLM006474 plus Gemacitabine or media 5 days assay
HLM006474 [M]
1x10⁻⁶ 10x10-6 100x10-6
% o
f co
ntr
ol (±
SD
)
0
10
20
30
40
50
60
70
80
90
100
110
Gem [M]
100x10-9 1x10⁻⁶
HLM
Gem
Combi (200:3)
HLM [µM]10 100
% o
f contr
ol (±
SD
)
0
20
40
60
80
100
CisPt [µM]10
HLM
CisPt
Combi (4:1)
HLM [µM]10 100
% o
f co
ntr
ol (±
SD
)
0
20
40
60
80
100
Gem [nM]100
HLM
Gem
Combi (200:1)
10 100
0.1 1
HLM [μM]
Gem [μM]
Exp 859A - CT Blue Assay - H292Timecourse: HLM006474 plus Cisplatin or media 5 days assay
HLM006474[M]
1x10⁻⁶ 10x10-6 100x10-6
% o
f co
ntr
ol (±
SD
)
0
10
20
30
40
50
60
70
80
90
100
110
CisPt [M]
1x10⁻⁶ 10x10-6
HLM
CisPt
Combi (4:1)
HLM [µM]10 100
% o
f contr
ol (±
SD
)
0
20
40
60
80
100
CisPt [µM]10
HLM
CisPt
Combi (4:1)
10 100 HLM [μM]
1 10 CisPt [μM]
HLM [µM]10 100
% o
f contr
ol (±
SD
)
0
20
40
60
80
100
CisPt [µM]10
HLM
CisPt
Combi (4:1)
Exp 859A - CT Blue Assay - H292Timecourse: HLM006474 plus Pactacxel or media 5 days assay
HLM006474 [M]
1x10⁻⁶ 10x10-6 100x10-6
% o
f co
ntr
ol (±
SD
)
0
10
20
30
40
50
60
70
80
90
100
110
Pac [M]
100x10-12 1x10⁻⁹
HLM
Pac
Combi (20000:1)
HLM [µM]10
% o
f contr
ol (±
SD
)
0
20
40
60
80
100
Pac [nM]1
HLM
Pac
Combi (20000:1)
HLM [µM]10 100
% o
f contr
ol (±
SD
)
0
20
40
60
80
100
CisPt [µM]10
HLM
CisPt
Combi (4:1)
10 100 HLM [μM]
0.1 1 Pac [nM]
HLM [µM]10 100
% o
f contr
ol (±
SD
)
0
20
40
60
80
100
CisPt [µM]10
HLM
CisPt
Combi (4:1)
HLM [μM]
CisPt [μM]
0
2
0
4
0
60
8
0
10
0
HLM [µM]10 100
% o
f contr
ol (±
SD
)
0
20
40
60
80
100
CisPt [µM]10
HLM
CisPt
Combi (4:1)
HLM [μM]
CisPt [μM]
HLM [µM]10 100
% o
f contr
ol (±
SD
)
0
20
40
60
80
100
CisPt [µM]10
HLM
CisPt
Combi (4:1)
HLM [μM]
CisPt [μM]
0
2
0
4
0
60
8
0
10
0
HLM [µM]10 100
% o
f contr
ol (±
SD
)
0
20
40
60
80
100
Pac [nM]10
HLM
Pac
Combi (4000:1)
HLM [μM]
Pac [nM]
0
2
0
4
0
60
8
0
10
0
HLM [µM]10 100
% o
f contr
ol (±
SD
)
0
20
40
60
80
100
Pac [nM]10
HLM
Pac
Combi (4000:1)
HLM [μM]
Pac [nM]
HLM [µM]10 100
% o
f contr
ol (±
SD
)
0
20
40
60
80
100
Pac [nM]10
HLM
Pac
Combi (4000:1)
HLM [μM]
Pac [nM]
0
2
0
4
0
60
8
0
10
0
HLM [µM]10 100
% o
f contr
ol (±
SD
)
0
20
40
60
80
100
Gem [nM]100
HLM
Gem
Combi (200:1)
HLM [μM]
Gem [nM]
0
2
0
4
0
60
8
0
10
0
HLM [µM]10 100
% o
f contr
ol (±
SD
)
0
20
40
60
80
100
Gem [nM]100
HLM
Gem
Combi (200:1)
HLM [μM]
Gem [nM]
HLM [µM]10 100
% o
f contr
ol (±
SD
)
0
20
40
60
80
100
Gem [nM]100
HLM
Gem
Combi (200:1)
HLM [μM]
Gem [nM]
0
2
0
4
0
60
8
0
10
0
0
20
40
60
80
1
00
0
20
40
60
80
1
00
0
20
40
60
80
1
00
- PARP
- cleaved PARP
- Actin
H1299
Paclitaxel
+ +
+ +
6474
A. B.
C. D.
E. F.
G.
6474 (μM)
Pac (nM)
6474 (μM)
Gem (μM)
6474 (μM)
CisPt (μM)
6474
Pac
Combi (2000:1)
6474
Gem
Combi (200:1)
6474
CisPt
Combi (4:1)
6474 (μM)
Pac (nM)
6474
Pac
Combi (4000:1)
6474 (μM)
Gem (μM)
6474
Gem
Combi (200:1)
6474 (μM)
CisPt (μM)
6474
CisPt
Combi (4:1)
Figure 2
A. B.
C. D.
- PARP
- cleaved PARP
- Actin
H1299
Paclitaxel
+ +
+ +
6474
E. F.
G.
Exp 859A - CT Blue Assay - H292Timecourse: HLM006474 plus Gemacitabine or media 5 days assay
HLM006474 [M]
1x10⁻⁶ 10x10-6 100x10-6
% o
f co
ntr
ol (±
SD
)
0
10
20
30
40
50
60
70
80
90
100
110
Gem [M]
100x10-9 1x10⁻⁶
HLM
Gem
Combi (200:3)
HLM [µM]10 100
% o
f contr
ol (±
SD
)
0
20
40
60
80
100
CisPt [µM]10
HLM
CisPt
Combi (4:1)
HLM [µM]10 100
% o
f co
ntr
ol (±
SD
)
0
20
40
60
80
100
Gem [nM]100
HLM
Gem
Combi (200:1)
10 100
0.1 1
HLM [μM]
Gem [μM]
Exp 859A - CT Blue Assay - H292Timecourse: HLM006474 plus Gemacitabine or media 5 days assay
HLM006474 [M]
1x10⁻⁶ 10x10-6 100x10-6
% o
f co
ntr
ol (±
SD
)
0
10
20
30
40
50
60
70
80
90
100
110
Gem [M]
100x10-9 1x10⁻⁶
HLM
Gem
Combi (200:3)
HLM [µM]10 100
% o
f contr
ol (±
SD
)
0
20
40
60
80
100
CisPt [µM]10
HLM
CisPt
Combi (4:1)
HLM [µM]10 100
% o
f co
ntr
ol (±
SD
)
0
20
40
60
80
100
Gem [nM]100
HLM
Gem
Combi (200:1)
10 100
0.1 1
HLM [μM]
Gem [μM]
Exp 859A - CT Blue Assay - H292Timecourse: HLM006474 plus Cisplatin or media 5 days assay
HLM006474[M]
1x10⁻⁶ 10x10-6 100x10-6
% o
f co
ntr
ol (±
SD
)
0
10
20
30
40
50
60
70
80
90
100
110
CisPt [M]
1x10⁻⁶ 10x10-6
HLM
CisPt
Combi (4:1)
HLM [µM]10 100
% o
f contr
ol (±
SD
)
0
20
40
60
80
100
CisPt [µM]10
HLM
CisPt
Combi (4:1)
10 100 HLM [μM]
1 10 CisPt [μM]
HLM [µM]10 100
% o
f contr
ol (±
SD
)
0
20
40
60
80
100
CisPt [µM]10
HLM
CisPt
Combi (4:1)
Exp 859A - CT Blue Assay - H292Timecourse: HLM006474 plus Cisplatin or media 5 days assay
HLM006474[M]
1x10⁻⁶ 10x10-6 100x10-6
% o
f co
ntr
ol (±
SD
)
0
10
20
30
40
50
60
70
80
90
100
110
CisPt [M]
1x10⁻⁶ 10x10-6
HLM
CisPt
Combi (4:1)
HLM [µM]10 100
% o
f contr
ol (±
SD
)
0
20
40
60
80
100
CisPt [µM]10
HLM
CisPt
Combi (4:1)
10 100 HLM [μM]
1 10 CisPt [μM]
HLM [µM]10 100
% o
f contr
ol (±
SD
)
0
20
40
60
80
100
CisPt [µM]10
HLM
CisPt
Combi (4:1)
Exp 859A - CT Blue Assay - H292Timecourse: HLM006474 plus Pactacxel or media 5 days assay
HLM006474 [M]
1x10⁻⁶ 10x10-6 100x10-6
% o
f co
ntr
ol (±
SD
)
0
10
20
30
40
50
60
70
80
90
100
110
Pac [M]
100x10-12 1x10⁻⁹
HLM
Pac
Combi (20000:1)
HLM [µM]10
% o
f contr
ol (±
SD
)
0
20
40
60
80
100
Pac [nM]1
HLM
Pac
Combi (20000:1)
HLM [µM]10 100
% o
f contr
ol (±
SD
)
0
20
40
60
80
100
CisPt [µM]10
HLM
CisPt
Combi (4:1)
10 100 HLM [μM]
0.1 1 Pac [nM]
Exp 859A - CT Blue Assay - H292Timecourse: HLM006474 plus Pactacxel or media 5 days assay
HLM006474 [M]
1x10⁻⁶ 10x10-6 100x10-6
% o
f co
ntr
ol (±
SD
)
0
10
20
30
40
50
60
70
80
90
100
110
Pac [M]
100x10-12 1x10⁻⁹
HLM
Pac
Combi (20000:1)
HLM [µM]10
% o
f contr
ol (±
SD
)
0
20
40
60
80
100
Pac [nM]1
HLM
Pac
Combi (20000:1)
HLM [µM]10 100
% o
f contr
ol (±
SD
)
0
20
40
60
80
100
CisPt [µM]10
HLM
CisPt
Combi (4:1)
10 100 HLM [μM]
0.1 1 Pac [nM]
HLM [µM]10 100
% o
f contr
ol (±
SD
)
0
20
40
60
80
100
CisPt [µM]10
HLM
CisPt
Combi (4:1)
HLM [μM]
CisPt [μM]
0
2
0
4
0
60
8
0
10
0
HLM [µM]10 100
% o
f contr
ol (±
SD
)
0
20
40
60
80
100
CisPt [µM]10
HLM
CisPt
Combi (4:1)
HLM [μM]
CisPt [μM]
HLM [µM]10 100
% o
f contr
ol (±
SD
)
0
20
40
60
80
100
CisPt [µM]10
HLM
CisPt
Combi (4:1)
HLM [μM]
CisPt [μM]
0
2
0
4
0
60
8
0
10
0
HLM [µM]10 100
% o
f contr
ol (±
SD
)
0
20
40
60
80
100
Pac [nM]10
HLM
Pac
Combi (4000:1)
HLM [μM]
Pac [nM]
0
2
0
4
0
60
8
0
10
0
HLM [µM]10 100
% o
f contr
ol (±
SD
)
0
20
40
60
80
100
Pac [nM]10
HLM
Pac
Combi (4000:1)
HLM [μM]
Pac [nM]
HLM [µM]10 100
% o
f contr
ol (±
SD
)
0
20
40
60
80
100
Pac [nM]10
HLM
Pac
Combi (4000:1)
HLM [μM]
Pac [nM]
0
2
0
4
0
60
8
0
10
0
HLM [µM]10 100
% o
f contr
ol (±
SD
)
0
20
40
60
80
100
Gem [nM]100
HLM
Gem
Combi (200:1)
HLM [μM]
Gem [nM]
0
2
0
4
0
60
8
0
10
0
HLM [µM]10 100
% o
f contr
ol (±
SD
)
0
20
40
60
80
100
Gem [nM]100
HLM
Gem
Combi (200:1)
HLM [μM]
Gem [nM]
HLM [µM]10 100
% o
f contr
ol (±
SD
)
0
20
40
60
80
100
Gem [nM]100
HLM
Gem
Combi (200:1)
HLM [μM]
Gem [nM]
0
2
0
4
0
60
8
0
10
0
0
20
40
60
80
1
00
0
20
40
60
80
1
00
0
20
40
60
80
1
00
Figure 2
A. B.
C. D.
- PARP
- cleaved PARP
- Actin
H1299
Paclitaxel
+ +
+ +
6474
E. F.
G.
Exp 859A - CT Blue Assay - H292Timecourse: HLM006474 plus Gemacitabine or media 5 days assay
HLM006474 [M]
1x10⁻⁶ 10x10-6 100x10-6
% o
f contr
ol (±
SD
)
0
10
20
30
40
50
60
70
80
90
100
110
Gem [M]
100x10-9 1x10⁻⁶
HLM
Gem
Combi (200:3)
HLM [µM]10 100
% o
f contr
ol (±
SD
)
0
20
40
60
80
100
CisPt [µM]10
HLM
CisPt
Combi (4:1)
HLM [µM]10 100
% o
f co
ntr
ol (±
SD
)
0
20
40
60
80
100
Gem [nM]100
HLM
Gem
Combi (200:1)
10 100
0.1 1
HLM [μM]
Gem [μM]
Exp 859A - CT Blue Assay - H292Timecourse: HLM006474 plus Cisplatin or media 5 days assay
HLM006474[M]
1x10⁻⁶ 10x10-6 100x10-6
% o
f co
ntr
ol (±
SD
)
0
10
20
30
40
50
60
70
80
90
100
110
CisPt [M]
1x10⁻⁶ 10x10-6
HLM
CisPt
Combi (4:1)
HLM [µM]10 100
% o
f contr
ol (±
SD
)
0
20
40
60
80
100
CisPt [µM]10
HLM
CisPt
Combi (4:1)
10 100 HLM [μM]
1 10 CisPt [μM]
HLM [µM]10 100
% o
f contr
ol (±
SD
)
0
20
40
60
80
100
CisPt [µM]10
HLM
CisPt
Combi (4:1)
Exp 859A - CT Blue Assay - H292Timecourse: HLM006474 plus Pactacxel or media 5 days assay
HLM006474 [M]
1x10⁻⁶ 10x10-6 100x10-6
% o
f co
ntr
ol (±
SD
)
0
10
20
30
40
50
60
70
80
90
100
110
Pac [M]
100x10-12 1x10⁻⁹
HLM
Pac
Combi (20000:1)
HLM [µM]10
% o
f contr
ol (±
SD
)
0
20
40
60
80
100
Pac [nM]1
HLM
Pac
Combi (20000:1)
HLM [µM]10 100
% o
f contr
ol (±
SD
)
0
20
40
60
80
100
CisPt [µM]10
HLM
CisPt
Combi (4:1)
10 100 HLM [μM]
0.1 1 Pac [nM]
HLM [µM]10 100
% o
f contr
ol (±
SD
)
0
20
40
60
80
100
CisPt [µM]10
HLM
CisPt
Combi (4:1)
HLM [μM]
CisPt [μM]
0
2
0
4
0
60
8
0
10
0
HLM [µM]10 100
% o
f contr
ol (±
SD
)
0
20
40
60
80
100
CisPt [µM]10
HLM
CisPt
Combi (4:1)
HLM [μM]
CisPt [μM]
HLM [µM]10 100
% o
f contr
ol (±
SD
)
0
20
40
60
80
100
CisPt [µM]10
HLM
CisPt
Combi (4:1)
HLM [μM]
CisPt [μM]
0
2
0
4
0
60
8
0
10
0
HLM [µM]10 100
% o
f contr
ol (±
SD
)
0
20
40
60
80
100
Pac [nM]10
HLM
Pac
Combi (4000:1)
HLM [μM]
Pac [nM]
0
2
0
4
0
60
8
0
10
0
HLM [µM]10 100
% o
f contr
ol (±
SD
)
0
20
40
60
80
100
Pac [nM]10
HLM
Pac
Combi (4000:1)
HLM [μM]
Pac [nM]
HLM [µM]10 100
% o
f contr
ol (±
SD
)
0
20
40
60
80
100
Pac [nM]10
HLM
Pac
Combi (4000:1)
HLM [μM]
Pac [nM]
0
2
0
4
0
60
8
0
10
0
HLM [µM]10 100
% o
f contr
ol (±
SD
)
0
20
40
60
80
100
Gem [nM]100
HLM
Gem
Combi (200:1)
HLM [μM]
Gem [nM]
0
2
0
4
0
60
8
0
10
0
HLM [µM]10 100
% o
f contr
ol (±
SD
)
0
20
40
60
80
100
Gem [nM]100
HLM
Gem
Combi (200:1)
HLM [μM]
Gem [nM]
HLM [µM]10 100
% o
f contr
ol (±
SD
)
0
20
40
60
80
100
Gem [nM]100
HLM
Gem
Combi (200:1)
HLM [μM]
Gem [nM]
0
2
0
4
0
60
8
0
10
0
0
20
40
60
80
1
00
0
20
40
60
80
1
00
0
20
40
60
80
1
00
Figure 2
A. B.
C. D.
- PARP
- cleaved PARP
- Actin
H1299
Paclitaxel
+ +
+ +
6474
E. F.
G.
Exp 859A - CT Blue Assay - H292Timecourse: HLM006474 plus Gemacitabine or media 5 days assay
HLM006474 [M]
1x10⁻⁶ 10x10-6 100x10-6
% o
f co
ntr
ol (±
SD
)
0
10
20
30
40
50
60
70
80
90
100
110
Gem [M]
100x10-9 1x10⁻⁶
HLM
Gem
Combi (200:3)
HLM [µM]10 100
% o
f contr
ol (±
SD
)
0
20
40
60
80
100
CisPt [µM]10
HLM
CisPt
Combi (4:1)
HLM [µM]10 100
% o
f co
ntr
ol (±
SD
)
0
20
40
60
80
100
Gem [nM]100
HLM
Gem
Combi (200:1)
10 100
0.1 1
HLM [μM]
Gem [μM]
Exp 859A - CT Blue Assay - H292Timecourse: HLM006474 plus Cisplatin or media 5 days assay
HLM006474[M]
1x10⁻⁶ 10x10-6 100x10-6
% o
f co
ntr
ol (±
SD
)
0
10
20
30
40
50
60
70
80
90
100
110
CisPt [M]
1x10⁻⁶ 10x10-6
HLM
CisPt
Combi (4:1)
HLM [µM]10 100
% o
f contr
ol (±
SD
)
0
20
40
60
80
100
CisPt [µM]10
HLM
CisPt
Combi (4:1)
10 100 HLM [μM]
1 10 CisPt [μM]
HLM [µM]10 100
% o
f contr
ol (±
SD
)
0
20
40
60
80
100
CisPt [µM]10
HLM
CisPt
Combi (4:1)
Exp 859A - CT Blue Assay - H292Timecourse: HLM006474 plus Pactacxel or media 5 days assay
HLM006474 [M]
1x10⁻⁶ 10x10-6 100x10-6
% o
f co
ntr
ol (±
SD
)
0
10
20
30
40
50
60
70
80
90
100
110
Pac [M]
100x10-12 1x10⁻⁹
HLM
Pac
Combi (20000:1)
HLM [µM]10
% o
f contr
ol (±
SD
)
0
20
40
60
80
100
Pac [nM]1
HLM
Pac
Combi (20000:1)
HLM [µM]10 100
% o
f contr
ol (±
SD
)
0
20
40
60
80
100
CisPt [µM]10
HLM
CisPt
Combi (4:1)
10 100 HLM [μM]
0.1 1 Pac [nM]
HLM [µM]10 100
% o
f contr
ol (±
SD
)
0
20
40
60
80
100
CisPt [µM]10
HLM
CisPt
Combi (4:1)
HLM [μM]
CisPt [μM]
0
2
0
4
0
60
8
0
10
0
HLM [µM]10 100
% o
f contr
ol (±
SD
)
0
20
40
60
80
100
CisPt [µM]10
HLM
CisPt
Combi (4:1)
HLM [μM]
CisPt [μM]
HLM [µM]10 100
% o
f contr
ol (±
SD
)
0
20
40
60
80
100
CisPt [µM]10
HLM
CisPt
Combi (4:1)
HLM [μM]
CisPt [μM]
0
2
0
4
0
60
8
0
10
0
HLM [µM]10 100
% o
f contr
ol (±
SD
)
0
20
40
60
80
100
Pac [nM]10
HLM
Pac
Combi (4000:1)
HLM [μM]
Pac [nM]
0
2
0
4
0
60
8
0
10
0
HLM [µM]10 100
% o
f contr
ol (±
SD
)
0
20
40
60
80
100
Pac [nM]10
HLM
Pac
Combi (4000:1)
HLM [μM]
Pac [nM]
HLM [µM]10 100
% o
f contr
ol (±
SD
)
0
20
40
60
80
100
Pac [nM]10
HLM
Pac
Combi (4000:1)
HLM [μM]
Pac [nM]
0
2
0
4
0
60
8
0
10
0
HLM [µM]10 100
% o
f contr
ol (±
SD
)
0
20
40
60
80
100
Gem [nM]100
HLM
Gem
Combi (200:1)
HLM [μM]
Gem [nM]
0
2
0
4
0
60
8
0
10
0
HLM [µM]10 100
% o
f contr
ol (±
SD
)
0
20
40
60
80
100
Gem [nM]100
HLM
Gem
Combi (200:1)
HLM [μM]
Gem [nM]
HLM [µM]10 100
% o
f contr
ol (±
SD
)
0
20
40
60
80
100
Gem [nM]100
HLM
Gem
Combi (200:1)
HLM [μM]
Gem [nM]
0
2
0
4
0
60
8
0
10
0
0
20
40
60
80
1
00
0
20
40
60
80
1
00
0
20
40
60
80
1
00
- PARP
- cleaved PARP
- Actin
H1299
Paclitaxel
+ +
+ +
6474
A. B.
C. D.
E. F.
G.
6474 (μM)
Pac (nM)
6474 (μM)
Gem (μM)
6474 (μM)
CisPt (μM)
6474
Pac
Combi (2000:1)
6474
Gem
Combi (200:1)
6474
CisPt
Combi (4:1)
6474 (μM)
Pac (nM)
6474
Pac
Combi (4000:1)
6474 (μM)
Gem (μM)
6474
Gem
Combi (200:1)
6474 (μM)
CisPt (μM)
6474
CisPt
Combi (4:1)
Figure 3.2: 6474 synergizes with paclitaxel, but not cisplatin nor gemcitabine, in NSCLC cell lines. H1299 cells were treated with 6474 in combination with common chemotherapeutic agents and analyzed for synergy using CellTiter Blue assays and Chou-Talalay analysis. 6474 was antagonistic with cisplatin (A.) and gemcitabine (B.), but synergistic with paclitaxel (C.), as confirmed via Western blot (D.). Similar results were seen in H292 cells with 6474 and cisplatin (E.), gemcitabine (F.), and paclitaxel (G.). Note: Figure reprinted from the following: Kurtyka, C.A., L. Chen, and W.D. Cress, E2F inhibition synergizes with paclitaxel in lung cancer cell lines. PLoS One, 2014. 9(5): p. e96357.

35
viability was analyzed via MTS assays (Figure 3.4B). These studies showed that cells
depleted of E2F3a and E2F3b were more viable in the presence of paclitaxel, thus
confirming the E2F3 level-paclitaxel IC50 relationship that was previously observed.
Figure 3
A.
E2F3 mRNA levels
Pa
clit
axe
l lo
gIC
50
(nM
)
C.
Pa
clit
axe
l lo
gIC
50
(nM
)
E2F3b proteinE2F3a protein
B.
-E2F3a
-E2F3b
-Actin
H23
H157
H292
H322
H358
H441
H522
H661
H165
0
H197
5
0 1 2 3 4 5 6
0.0
0
.2
0
.4
0
.6 0
.8
1.0
Correlation (R): -0.72
p-value: 0.0184
Correlation (R): −0.61
p-value: 0.0616
0.0
0
.2
0
.4
0.6
0
.8
1
.0
0.0 0.2 0.4 0.6 0.8 1.0 1.2
Correlation (R): −0.46
p-value: 0.1778
0.0
0
.2
0
.4
0.6
0
.8
1
.0
0.0 0.2 0.4 0.6 0.8 1.0 1.2
Figure 3
A.
E2F3 mRNA levels
Pa
clit
axe
l lo
gIC
50
(nM
)
C.
Pa
clit
axe
l lo
gIC
50
(nM
)
E2F3b proteinE2F3a protein
B.
-E2F3a
-E2F3b
-Actin
H23
H157
H292
H322
H358
H441
H522
H661
H165
0
H197
5
0 1 2 3 4 5 6
0.0
0.2
0.4
0.6
0.8
1.0
Correlation (R): -0.72
p-value: 0.0184
Correlation (R): −0.61
p-value: 0.0616
0.0
0.2
0.4
0.6
0.8
1.0
0.0 0.2 0.4 0.6 0.8 1.0 1.2
Correlation (R): −0.46
p-value: 0.1778
0.0
0.2
0.4
0.6
0.8
1.0
0.0 0.2 0.4 0.6 0.8 1.0 1.2
A. B.
C.
Figure 3
A.
E2F3 mRNA levels
Pa
clit
axe
l lo
gIC
50
(nM
)
C.
Pa
clit
axe
l lo
gIC
50
(nM
)
E2F3b proteinE2F3a protein
B.
-E2F3a
-E2F3b
-Actin
H23
H157
H292
H322
H358
H441
H522
H661
H165
0
H197
5
0 1 2 3 4 5 6
0.0
0
.2
0
.4
0
.6 0
.8
1.0
Correlation (R): -0.72
p-value: 0.0184
Correlation (R): −0.61
p-value: 0.0616
0.0
0
.2
0
.4
0.6
0
.8
1
.0
0.0 0.2 0.4 0.6 0.8 1.0 1.2
Correlation (R): −0.46
p-value: 0.1778
0.0
0
.2
0
.4
0.6
0
.8
1
.0
0.0 0.2 0.4 0.6 0.8 1.0 1.2
Figure 3
A.
E2F3 mRNA levels
Pa
clit
axe
l lo
gIC
50
(nM
)
C.
Pa
clit
axe
l lo
gIC
50
(nM
)
E2F3b proteinE2F3a protein
B.
-E2F3a
-E2F3b
-Actin
H23
H157
H292
H322
H358
H441
H522
H661
H165
0
H197
5
0 1 2 3 4 5 6
0.0
0.2
0.4
0.6
0.8
1.0
Correlation (R): -0.72
p-value: 0.0184
Correlation (R): −0.61
p-value: 0.0616
0.0
0.2
0.4
0.6
0.8
1.0
0.0 0.2 0.4 0.6 0.8 1.0 1.2
Correlation (R): −0.46
p-value: 0.1778
0.0
0.2
0.4
0.6
0.8
1.0
0.0 0.2 0.4 0.6 0.8 1.0 1.2
Figure 3
A.
E2F3 mRNA levels
Pa
clit
axe
l lo
gIC
50
(nM
)
C.
Pa
clit
axe
l lo
gIC
50
(nM
)
E2F3b proteinE2F3a protein
B.
-E2F3a
-E2F3b
-Actin
H23
H157
H292
H322
H358
H441
H522
H661
H165
0
H197
5
0 1 2 3 4 5 6
0.0
0.2
0.4
0.6
0.8
1.0
Correlation (R): -0.72
p-value: 0.0184
Correlation (R): −0.61
p-value: 0.0616
0.0
0.2
0.4
0.6
0.8
1.0
0.0 0.2 0.4 0.6 0.8 1.0 1.2
Correlation (R): −0.46
p-value: 0.1778
0.0
0.2
0.4
0.6
0.8
1.0
0.0 0.2 0.4 0.6 0.8 1.0 1.2
A. B.
C.
Figure 3.3: Endogenous E2F3 mRNA and protein levels correlate to paclitaxel sensitivity. Ten NSCLC cell lines were harvested for mRNA and protein for analysis. The mRNA expression was analyzed via real-time PCR and compared to the corresponding paclitaxel log IC50s for each cell line. This analysis showed a significant negative correlation between E2F3 mRNA levels and paclitaxel log IC50 (A.). Furthermore, Western blots were used to determine the endogenous E2F3a and E2F3b protein levels in these cell lines (B.). Following densitometric analysis of the Western blots, protein levels were compared to log paclitaxel IC50s. This analysis revealed a similar negative correlation as seen in the mRNA versus paclitaxel log IC50 analysis (C.). Note: Figure reprinted from the following: Kurtyka, C.A., L. Chen, and W.D. Cress, E2F inhibition synergizes with paclitaxel in lung cancer cell lines. PLoS One, 2014. 9(5): p. e96357.

36
Short Treatments of NSCLC Cell Lines with 6474 Leads to Increased
Expression of E2F-Regulated Genes
H1299 and H292 cells were treated with 6474 for 0, 3, 6, 9, 12, and 24 hours and
harvested for protein and RNA extraction. Upon analysis of protein expression levels
through Western blots, it was discovered that cells treated with 6474 for 6-9 hours had
increased E2F3a and E2F3b protein levels while E2F1 levels were not dramatically
affected (Figure 3.5A). To determine if the increased levels of E2F3 protein were at
least partially due to a change in mRNA expression of this gene, real-time PCR was
used to analyze the expression of a variety of genes. These studies showed that E2F3
mRNA expression significantly increased at 3 hours (Figure 3.5B), while E2F1 mRNA
B.
-E2F3a
-E2F3b
-Actin
con
trol
E2
F3a
E2
F3b
siRNA, 24h
control E2F3a E2F3b
% c
ell
via
bili
ty
20
25
30
35
40
* **A.A. B.B.
-E2F3a
-E2F3b
-Actin
con
trol
E2
F3a
E2
F3b
siRNA, 24h
control E2F3a E2F3b
% c
ell
via
bili
ty
20
25
30
35
40
* **A.A. B.
Figure 3.4: NSCLC paclitaxel sensitivity is affected by E2F3 levels. H1299 cells were transfected with control, E2F3a, and E2F3b siRNA (A.) and then treated with paclitaxel. Following MTS analysis, it was determined that cells deficient of E2F3 were significantly more viable than control cells (B.). These results therefore corresponded to the previously observed correlations between E2F3 levels and paclitaxel sensitivity. Note: “*” signifies p-value ≤ 0.05, “**” signifies p-value ≤ 0.01; Figure reprinted from the following: Kurtyka,
C.A., L. Chen, and W.D. Cress, E2F inhibition synergizes with paclitaxel in lung cancer cell lines. PLoS One, 2014. 9(5): p. e96357.

37
expression only significantly increased at 3 hours in H292 cells (Figure 3.5C) and E2F4
mRNA expression decreased at each time point after 0 hours (Figure 3.5D).
Furthermore, examination of the commonly-known E2F-regulated genes MCM10
(Figure 3.6A), MCM2 (Figure 3.6B), and CCNE2 (Figure 3.6C) showed that all of these
genes had increased mRNA expression at 3 hours as well.
At the Doses Expected for Lung Cancer Treatment, 6474 Toxicity Is High in
Nude Mice
To assess the potential efficacy of this compound in vivo, preliminary
experiments with nude mice were conducted. Four mice were injected twice a week with
either DMSO or escalating concentrations of 6474 (at 5, 10, 20, 30, and 40 mg/kg) for
one week per dose. After each treatment, mouse weights were measured and animal
behavior was recorded. The mice weights and health remained consistent until 40
mg/kg. At this dosage, the treated mice became lethargic, one mouse died, and weights
dropped dramatically (Table 3.2). Following sacrifice and necropsy of the remaining
mice, the major difference observed between the control and treated animals was a
darkening of the intestines (possibly due to bleeding). Organs were fixed into FFPE
blocks and used for analysis of cleaved caspase 3 protein expression via IHC. The most
drastic difference between the control and treated mice was that a great deal of cleaved
caspase 3 was observed in the germinal centers of spleens of treated mice (Figure 3.7).
Discussion
The CDK/Rb/E2F pathway represents a good target for the treatment of various
cancer types. Although development has been slow due to the toxicity of early

38
A. H1299 H292
-E2F1
-E2F3a
-E2F3b
-Actin
0 3 6 9 12 24
0 3 6 9 12 24 hr, 60μM
B.
C.
D.
C.
D.
B. ** * * ** **** * * ** ** ** ** n.s. ** **** ** n.s. ** **
n.s. ** * ** **n.s. ** * ** ** ** ** ** ** **
n.s. ** ** ** **n.s. ** ** ** **n.s. ** ** ** **n.s. ** ** ** **
G.
F.
E. ** ** ** ** **** ** ** ** *** ** ** ** *** ** ** ** **
* ** ** ** *** ** ** ** **** ** ** ** **** ** ** ** **
** ** ** ** **** ** ** ** **** * ** ** **** * ** ** **
Figure 3.5: Short treatment with 6474 leads to an increase in E2F3 protein and mRNA expression. H1299 and H292 cells were treated with 6474 for 0, 3, 6, 9, 12, and 24 hours, then harvested for mRNA and protein. Approximately 6-9 hours following the addition of 6474, protein levels of E2F3 dramatically increased (A.). Analysis of mRNA expression showed consistent increases in E2F3 levels in both cell lines (B.), but E2F1 (C.) and E2F4 (D.) levels were not similarly affected. Note: “*” signifies p-value ≤ 0.05, “**” signifies p-value ≤ 0.01; Figure reprinted from the following: Kurtyka, C.A., L. Chen, and
W.D. Cress, E2F inhibition synergizes with paclitaxel in lung cancer cell lines. PLoS One, 2014. 9(5): p. e96357.

39
G.
F.
E. ** ** ** ** **** ** ** ** *** ** ** ** *** ** ** ** **
* ** ** ** *** ** ** ** **** ** ** ** **** ** ** ** **
** ** ** ** **** ** ** ** **** * ** ** **** * ** ** **
A.
B.
C.
Table 3.2: High doses of 6474 lead to dramatic weight loss in mice.
Figure 3.6: Short treatment with 6474 leads to an increase in the mRNA expression of various E2F-regulated genes. H1299 and H292 cells were treated with 6474 for 0, 3, 6, 9, 12, and 24 hours. mRNA was harvested from these samples and analyzed via real-time PCR for (A.) MCM10, (B.) MCM2, and (C.) CCNE2 expression. All of these E2F-regulated genes showed a significant increase in mRNA expression following 3 hours of treatment with 6474. Note: “*” signifies p-value ≤ 0.05, “**” signifies p-value ≤ 0.01; Figure
reprinted from the following: Kurtyka, C.A., L. Chen, and W.D. Cress, E2F inhibition synergizes with paclitaxel in lung cancer cell lines. PLoS One, 2014. 9(5): p. e96357.
Week # Mouse Weight (grams) Dose (mg/kg)
1 27.7 0
2 26.2 0
3 21.8 40
4 17.5 405

40
compounds, CDK inhibitors have recently become more tolerable in patients and
popular in clinical trials [141, 216, 217]. We propose that targeting the CDK/Rb/E2F
pathway even further downstream, at the E2F level, may also be of value. Thus, we
have examined the potential of a pan-E2F inhibitor, HLM006474, in the treatment of
lung cancer.
It is interesting to note that SCLC cell lines were not on average more sensitive
to 6474 than NSCLC cell lines in our limited comparisons. This is somewhat surprising
since one would anticipate that in cells lacking wildtype RB1 (such as the majority of
SCLC), there would be unrestrained E2F activity, and therefore these cells would be
more sensitive. Considering that the experiments using genetically-defined Rb wildtype
and deficient MEFs showed the expected results, it can be assumed that this theory
holds in syngeneic cell lines. It is also interesting to note that the IC50s of 6474 vary
much more greatly in SCLC (15-75 μM) than in NSCLC (15-44 μM) cell lines. This
would hint that there are perhaps some other alterations in this lung cancer subtype that
DMSO 6474
Figure 3.7: High levels of cleaved caspase 3 were detected in the germinal centers of spleens of mice treated with 6474. Nude mice were treated with either DMSO or 40 mg/kg 6474, and organs were harvested and analyzed via immunohistochemistry. Investigation of the spleens from these mice showed that there were higher levels of cleaved caspase 3 in the germinal centers.

41
are not present in NSCLC. However, since there have not been as many studies in
regards to molecular subtypes of SCLC and the main focus has been TP53 and RB1
alterations, it is possible that these other putative mutations could be associated with
sensitivity to 6474.
Due to the observations made in the aforementioned data (especially the real-
time PCR experiments), perhaps a de-repression model would provide the best
explanation for the patterns we observed (Figure 3.8). This model would allow that the
promoters of various E2F-regulated genes (such as E2F3, MCM10, MCM2, and
CCNE2) are bound by inhibitory complexes until 6474 is added. The inclusion of 6474
leads to these genes becoming de-repressed so that they can be transcribed for a short
period of time before 6474 inhibits all E2F-DNA binding. This could then lead to a brief
rise in E2F3 expression (as well as an increase in the expression of other unidentified
genes that are similarly activated), which could then alter the cell’s sensitivity to
paclitaxel as described earlier. Also, it is possible that there are other mechanisms in
motion involving protein stability following 6474 treatment, for the observed increase in
E2F3 mRNA expression appears to modest to fully account for the increase in protein
expression.
At this point, we can only speculate which 6474 de-repressed gene or genes may
be responsible for the observed sensitization to paclitaxel, but we do note that E2F3 is a
reasonable candidate based on our data and the literature. E2F3 activity levels have
been previously reported to correlate with paclitaxel sensitivity in ovarian [192] and ER-
negative breast cancer [193], but this is the first time that similar trends have been
discovered in NSCLC [218]. Several explanations for the correlations between E2F3

42
levels and sensitivity to paclitaxel involve E2F3’s regulation of the expression of a
variety of genes. One possibility could be that higher E2F3 levels leads to increased
proliferation, therefore providing more opportunities for the cells to enter G2/M phase
where paclitaxel would be effective. However, this explanation would also imply that
more proliferation would allow for increased entry into S-phase as well, therefore
suggesting that cells would be more sensitive to chemotherapeutic agents such as
gemcitabine and would not match our observations. As such, perhaps a better
explanation would be that higher E2F3 levels could lead to greater expression of
apoptosis-regulating genes. Also, others have shown that overexpression of E2F3 leads
to an enrichment of microtubule-related genes [192], so this could also potentially
DP
N
SO
OO
O
O OH
Cl
E2F3
RB
Inactive (low E2F3)
Active (high E2F3)
E2F3E2F3E2F3E2F3
X
Increased
taxane
sensitivity
DP E2F3
RB
DP
N
SO
OO
O
O OH
Cl
E2F3
RB
Inactive (low E2F3)
Active (high E2F3)
E2F3E2F3E2F3E2F3
X
Increased
taxane
sensitivity
DP E2F3
RB
Figure 3.8: A de-repression model for synergy between HLM006474 and paclitaxel. Untreated cells have repressive complexes that inhibit the expression of various genes, including E2F3. Shortly after 6474 is added to the cells, these genes become “de-repressed,” thus allowing for the expression of genes such as E2F3 as well as other
unknown genes that have yet to be identified. Increased expression of these genes can then enhance the cell’s sensitivity to paclitaxel. Note: Figure reprinted from the following:
Kurtyka, C.A., L. Chen, and W.D. Cress, E2F inhibition synergizes with paclitaxel in lung cancer cell lines. PLoS One, 2014. 9(5): p. e96357.

43
explain the relationship observed here. Likewise, as discussed earlier, E2F3 has a role
in regulating the G2/M checkpoint through altering expression of AURKA [183], CDC2
[184], and CCNB1 [184, 185], which could possibly explain why higher levels of E2F3
could lead to increased sensitivity to paclitaxel. While 6474 may not have a future as a
clinical agent, information gathered here could suggest that E2F inhibition combined
with paclitaxel could prove to be an effective treatment method in the future.
In this chapter, we have demonstrated that 6474 has IC50s ranging from 15 – 75
μM within lung cancer cell lines, and that it can synergize with paclitaxel within NSCLC
cell lines. This synergy may be due to an increase in E2F3 levels, which has been
shown to correlate to paclitaxel sensitivity. Overall, these results suggest that specific
and potent inhibition of E2Fs could be an effective therapy for lung cancer patients,
especially if combined with other chemotherapeutic agents such as paclitaxel. Likewise,
these results suggest that E2F3 could be useful as a biomarker for paclitaxel sensitivity
in NSCLC.

44
CHAPTER FOUR:
AN E2F SIGNATURE PREDICTS BENEFIT OF ADJUVANT CHEMOTHERAPY IN
EARLY-STAGE NSCLC
Introduction
As mentioned earlier, E2Fs are mainly known for their role in cell cycle
regulation. Some of the most common mutations in lung cancer lead to deregulation of
E2F activity, allowing for largely unrestrained proliferation. Considering that proliferation
is one of the main hallmarks of cancer [219], having a means of measuring this process
in lung cancer patients could be very useful.
For early stage NSCLC patients, surgery is still a common option. Standard
practice typically involves giving adjuvant chemotherapy (ACT) following surgery.
Unfortunately, there has not been any major effect on enhancing overall survival (OS),
leaving the 5-year benefit of ACT at approximately 4-10% [220-223]. Due to the low
amount of survival benefit, high chemotherapeutic toxicity levels, and increasing cost of
treatment, a tool that could predict which patients would be most likely to benefit from
receiving ACT would be extremely useful. To try to fill this need, we examined
proliferative markers/gene signatures as tools.
The most well-known proliferative marker for cancer samples is Ki67 (typically
analyzed through immunohistochemistry (IHC)). Ki67 was first discovered in 1983 [224],

45
and it was determined to only be expressed by proliferating cells [224, 225] (please see
[226] for a review). Ki67 staining has been shown to be present in every stage of
proliferating cells [225], and increases in S-phase [227, 228] and the rest of the cell
cycle until reaching its highest expression levels in metaphase in mitosis [227, 229-231]
before decreasing [229, 231]. The first Ki67 antibody that could be used to examine
FFPE samples was identified in 1992 [232]. Since then, Ki67 expression has been
analyzed via immunohistochemistry in a variety of solid tumor samples, including lung
cancer. Increased Ki67 expression has been shown to trend towards lower rates of
overall survival and disease-free survival in NSCLC, though there is often not a
statistically significant difference [233-235]. Some of this lack of significance may be
related to issues with using IHC analysis for prognostic proliferative markers. These
may include antibody variability across lots and companies as well as inconsistency in
staining analysis between institutions. Also, using only one marker may not be very
informative. Therefore, it has been suggested that detecting multiple markers
simultaneously may give a better reflection of cell cycle [226].
As such, others have explored using gene signatures for calculating proliferation and
predicting patient prognosis.
Several prognostic gene signatures for early-stage NSCLC patients have been
created in the past few years [154, 156, 236-243], several of which mainly measure
proliferation. Unfortunately, markers that only serve prognostic functions are not
particularly useful for the clinic since they do not offer further guidelines for patient care
[244, 245]. As such, a great deal more interest is in predictive gene signatures that can
offer information on patient benefit from receiving ACT. Several gene expression

46
signatures have been found that can potentially serve this purpose [154, 156, 237].
However, current research with these signatures still reflects issues that can make the
transition into the clinic more difficult [244-248]. For example, some studies rely on use
of fresh frozen RNA for testing these signatures, which is not as commonplace in the
clinic as FFPE blocks (from which RNA quality is much poorer than fresh frozen
tissues). Likewise, some studies tend to rely on either microarrays or real-time PCR for
measuring signals for their signatures, which can be impractical for clinical translation.
In order to avoid these pitfalls to making the transition to clinical use, NanoString was
investigated as a platform for use of our signature.
NanoString is a relatively new technology that is capable measuring mRNA
expression in a very specific and easily multiplexed manner that does not rely on the
use of enzymatic reactions. This platform involves the use of two approximately 50-base
single-stranded DNA probes (a capture probe which are biotinylated in order to bind the
probe-mRNA complexes to streptavidin-coated nCounter cartridges, and a reporter
probe that has a unique “barcode” for each target mRNA and is eventually counted) for
each gene that needs to be measured in the assay. These probes can hybridize to their
target mRNA, are purified upon the removal of excess probes, become immobilized and
aligned on nCounter cartridges, and then are counted based on the “barcode” reading
through a nCounter Digital Analyzer [249, 250]. Due to this ease of use, NanoString is
becoming more commonly recognized as a good clinical tool. In fact, a NanoString
signature called the Prosigna Breast Cancer Gene Signature Assay (which is composed
of 50 genes for predicting early-stage breast cancer patient prognosis) has recently
been approved for use in the European Union and Israel as well as receiving FDA

47
clearance [251-253]. In light of this, it seemed reasonable to explore whether this
platform could be used to apply our signature to patient samples.
In these studies, we examined the application of an E2F gene expression
signature derived from NSCLC cell lines depleted of various Rb/E2F family members.
This signature was analyzed in two large lung adenocarcinoma patient cohorts in order
to demonstrate its prognostic ability. The prognostic efficacy of this signature was then
examined further in comparison to the common proliferative biomarker Ki67. This E2F
signature was also examined in a large cohort of early-stage lung adenocarcinoma
patients who were either observed only or who received ACT in order to determine the
signature’s effectiveness at predicting patient benefit from receiving ACT. Lastly, we
explored whether NanoString could be used to apply this signature to FFPE-derived
RNA in a comparable manner to fresh frozen RNA. Taken together, these results
suggest that this E2F signature has prognostic and predictive abilities that could be
clinically applicable through the use of NanoString.
Results
The E2F Signature Is Representative of Cell Cycle
The NSCLC cell lines H1299 and A549 were transfected with control, E2F1,
E2F3a, E2F3b, E2F3a+b, E2F4, and Rb siRNA and harvested after 36 hours for RNA
and protein extraction. All siRNA were specific to each target (Figure 4.1). RNA was
used for microarray analysis and then developed into a signature by filtering for
probesets that significantly changed in 5 out of 6 of the knockdowns in both cell lines
and altered in tumor versus normal samples. This signature of 145 probesets was then

48
used for GeneGo analysis, where it was demonstrated that, as expected, the cell cycle
was the most significantly correlated pathway (Table 4.1).
The E2F Signature Is Prognostic in Several Large NSCLC Datasets
Principal component analysis (PCA) was used to analyze this E2F signature
within two large NSCLC data cohorts, the Molecular Classification of Lung
Adenocarcinoma (MCLA) from the Director’s Challenge Consortium and the
SPORE442. The MCLA is comprised of 442 lung adenocarcinoma patient samples from
University of Michigan Cancer Center, Memorial Sloan-Kettering, Dana-Farber Cancer
Institute, and H. Lee Moffitt Cancer Center, while the SPORE442 is comprised of 442
-Rb
-E2F3a
-E2F3b
-E2F4
-E2F1
-Actin
Contr
ol
E2F
1
E2F
3a
E2F
3b
E2F
3a+
b
E2F
4
Rb : siRNA
A549
Contr
ol
E2F
1
E2F
3a
E2F
3b
E2F
3a+
b
E2F
4
Rb
H1299
-Rb
-E2F3a
-E2F3b
-E2F4
-E2F1
-Actin
Contr
ol
E2F
1
E2F
3a
E2F
3b
E2F
3a+
b
E2F
4
Rb : siRNA
A549
Contr
ol
E2F
1
E2F
3a
E2F
3b
E2F
3a+
b
E2F
4
Rb
H1299
Figure 4.1: RNAi effectively and specifically inhibits expression of the targeted E2F/Rb family members. NSCLC cell lines H1299 and A549 were transfected with control, E2F1, E2F3a, E2F3b, E2F3a+b, E2F4, and Rb siRNA. Western blots confirmed that the siRNA is capable of specifically knocking down expression of each target.

49
lung adenocarcinoma patient samples from Moffitt’s Total Cancer Care Network.
Analysis of the signature showed that those with high E2F signature scores had
significantly shorter overall survival (OS) times than those with low E2F signature
scores in both the MCLA (Figure 4.2A) and SPORE442 (Figure 4.2B) datasets.
Table 4.1: Cell cycle is the most significantly altered pathway represented in the E2F signature.
The 145 probeset E2F signature was analyzed via GeneGo. As expected due to what is already known about E2Fs, cell cycle was the most strongly represented pathway in the signature. Other expected pathways (such as apoptosis represented by the E2F1 knockdowns) are represented as well.
Maps (145-probeset TN filter) p-value
Cell cycle_The metaphase checkpoint 1.740E-06
Cell cycle_Chromosome condensation in prometaphase 5.525E-06
Cell cycle_Role of APC in cell cycle regulation 3.168E-05
Cell cycle_Start of DNA replication in early S phase 8.043E-04
Apoptosis and survival_DNA-damage-induced apoptosis 3.287E-03
Cell adhesion_ECM remodeling 3.304E-03
Cell cycle_Initiation of mitosis 9.052E-03
G-protein signaling_TC21 regulation pathway 9.052E-03
DNA damage_ATM / ATR regulation of G2 / M checkpoint 9.771E-03
Neurophysiological process_Role of CDK5 in presynaptic signaling 1.128E-02
Cell cycle_Role of SCF complex in cell cycle regulation 1.207E-02
DNA damage_Role of Brca1 and Brca2 in DNA repair 1.289E-02
DNA damage_ATM/ATR regulation of G1/S checkpoint 1.459E-02
Cell cycle_Role of Nek in cell cycle regulation 1.459E-02
Cell cycle_ESR1 regulation of G1/S transition 1.547E-02
Apoptosis and survival_Caspase cascade 1.547E-02
Development_TGF-beta-dependent induction of EMT via SMADs 1.731E-02
Cell adhesion_Plasmin signaling 1.731E-02
Influence of low doses of Arsenite on Glucose stimulated Insulin secretion in pancreatic cells 1.826E-02
Cell adhesion_Chemokines and adhesion 1.992E-02
Cytoskeleton remodeling_Cytoskeleton remodeling 2.099E-02
Cell adhesion_PLAU signaling 2.124E-02
Development_VEGF-family signaling 2.333E-02
Nicotine signaling in dopaminergic neurons, Pt. 2 - axon terminal 2.551E-02
Cytoskeleton remodeling_TGF, WNT and cytoskeletal remodeling 2.615E-02

50
A.
B.
0.0
0.2
0.4
Su
rviv
al
Pro
ba
bil
ity
0.5
0.6
0.8
1.0
Survival time (in months)
0 12 24 36 48 60
High E2F Score
Low E2F Score p-value: 3.52E-07
Figure 4. Kaplan-Meier survival curves for the molecular signatures on the SPORE444 lung adenocarcinoma dataset. (A) E2F (B) MR
(C) NF-kB and (D) TGFB.
A B
C DSurvival time (in months)
0 10 20 30 40 50 60
0.0
0.2
0.4
0.6
0.8
1.0
Su
rviv
al
Pro
ba
bil
ity
p-value: 3.11E-07
A.
B.
0.0
0.2
0.4
Su
rviv
al
Pro
ba
bil
ity
0.5
0.6
0.8
1.0
Survival time (in months)
0 12 24 36 48 60
High E2F Score
Low E2F Score
0.0
0.2
0.4
Su
rviv
al
Pro
ba
bil
ity
0.5
0.6
0.8
1.0
Survival time (in months)
0 12 24 36 48 60
High E2F Score
Low E2F Score p-value: 3.52E-07
Figure 4. Kaplan-Meier survival curves for the molecular signatures on the SPORE444 lung adenocarcinoma dataset. (A) E2F (B) MR
(C) NF-kB and (D) TGFB.
A B
C DSurvival time (in months)
0 10 20 30 40 50 60
0.0
0.2
0.4
0.6
0.8
1.0
Su
rviv
al
Pro
ba
bil
ity
p-value: 3.11E-07
Figure 4. Kaplan-Meier survival curves for the molecular signatures on the SPORE444 lung adenocarcinoma dataset. (A) E2F (B) MR
(C) NF-kB and (D) TGFB.
A B
C DSurvival time (in months)
0 10 20 30 40 50 60
0.0
0.2
0.4
0.6
0.8
1.0
Su
rviv
al
Pro
ba
bil
ity
p-value: 3.11E-07
Figure 4.2: The E2F signature is significantly prognostic in two large data cohorts. The E2F signature was analyzed via principal component analysis (PCA) to the microarray patient data from (A.) the Molecular Classification of Lung Adenocarcinoma (MCLA) from the Director’s Challenge Consortium and (B.) the SPORE442 from Moffitt’s Total Cancer
Care Network. In both data cohorts, the overall survival (OS) rates for patients with high E2F signature scores were significantly lower than for those with low E2F scores.

51
The E2F Signature Is a More Sensitive Proliferative Marker than Ki67
Another question that we needed to answer to confirm the potential usefulness of
this signature as a prognostic and/or predictive patient tool was how the E2F signature
compared to Ki67 as a proliferative marker. In order to examine this, a tissue microarray
of 145 lung carcinoma patient samples (Table 4.2) was stained with a Ki67 antibody and
scored by a pathologist (Figure 4.3A). Upon comparison of Ki67 staining scores and
OS, those with high Ki67 levels tended to have lower OS than those with low Ki67.
While this data trended in the expected manner, there was no significant difference in
OS based on Ki67 levels (Figure 4.3B). However, comparison of the E2F signature (as
calculated from microarrays from the patient samples) to the OS showed that those with
high E2F signature scores have significantly lower OS than those with low scores
(Figure 4.3C). Overall, these results suggest that the E2F signature may be more
sensitive than Ki67 as a proliferative marker.
Table 4.2: Summary of samples in tissue microarray.
Diagnosis # of coresLung carcinoma 145 (84 untreated, 61 ACT)
Normal lung tissue 58
Cell lines 10
Controls 14
Empty 6
Missing tissue 3
No tumor 4
Total 240

52
The E2F Signature Is Predictive of Early-Stage NSCLC Patient Benefit from
Adjuvant Chemotherapy
The E2F signature was then analyzed in the JBR.10 trial (using the microarray
data on GEO labeled as GSE14814), which is composed of 133 stage IB-II NSCLC
patient samples. Sixty-two of these patients were observed only following surgical
resection and the other 71 patients received cisplatin and vinorelbine adjuvant
chemotherapy (ACT). For the analysis, the observed patients (OBS) and the ACT
patients were divided into high or low E2F signature scores, and then OS was analyzed
Normal Carcinoma
0.61% 4.5%0.05% 3.1%
Core 6 Core 11 Core 12 Core 1
A.
B. C.
High Ki67 IHC
Low Ki67 IHCLog-rank p=0.2426
Years
0 1 2 3 4 5 6
0.0
0.2
0.4
Su
rviv
al P
rob
ab
ilit
y
0.5
0.6
0.8
1.0
High Ki67 IHC
Low Ki67 IHCLog-rank p=0.2426
Years
0 1 2 3 4 5 6
0.0
0.2
0.4
Su
rviv
al P
rob
ab
ilit
y
0.5
0.6
0.8
1.0
0.0
0.2
0.4
Su
rviv
al
Pro
ba
bil
ity
0.5
0.6
0.8
1.0
Years
0 1 2 3 4 5 6
High E2F Score
Low E2F Score Log-rank p=0.00660.0
0.2
0.4
Su
rviv
al
Pro
ba
bil
ity
0.5
0.6
0.8
1.0
Years
0 1 2 3 4 5 6
High E2F Score
Low E2F Score Log-rank p=0.0066
Figure 4.3: The E2F signature is a more sensitive proliferative marker than Ki67. (A.) Representative examples of Ki67 staining of the lung tissue microarray. (B.) There is no significant difference in OS between those with high and low Ki67 staining. However, the data follows the expected trend where those with high Ki67 staining tend to have lower OS. (C.) Through use of microarray data to analyze the E2F signature expression, it was determined that those with high E2F signature scores have significantly lower OS.

53
for each group. While there was no major difference in OS between low E2F signature
score groups that were OBS or ACT, there was a significant difference in OS between
OBS and ACT groups for those with high E2F signature scores (Figure 4.4).
Figure 4.4: The E2F signature is predictive of patient benefit from adjuvant chemotherapy in the JBR.10 trial. One-hundred and thirty-three patients (62 who were observed only, 71 who were given adjuvant chemotherapy (ACT)) were divided into groups with high or low E2F signature scores following PCA of the E2F signature in this trial. While there was no significant difference in OS between those with low E2F signature scores who were observed only (E2F.L_O) and those who received ACT (E2F.L_A), those who had high E2F signature scores who were observed only (E2F.H_O) had significantly lower OS than those with high E2F signature scores who received ACT (E2F.H_A). This data suggests that those with low E2F signature scores may therefore not benefit from receiving ACT as much as those with high scores.

54
NanoString Analysis of the E2F Signature in Patient Samples Was Equally
Effective Using Either Fresh Frozen RNA or FFPE-Derived RNA
In order to confirm the clinical viability of this signature, it needed to be analyzed
in several other large data cohorts. To this end, NanoString will be utilized due to its
specificity, ease in multiplexing, and previous approval for use as a clinical test for
breast cancer prognosis [254]. Before this could be accomplished, we needed to
confirm that this platform would work equally well using FFPE-derived RNA as fresh
frozen RNA. Being able to utilize FFPE patient samples for this analysis would be
especially useful since it is more readily available than fresh frozen RNA and is
therefore more practical for assay use. In order to test how use of these two RNA
sources would compare to one another, 32 paired patient samples of both types of RNA
were utilized for NanoString analysis of the E2F signature and the results were
compared to each other. Though the quality of the RNA from the FFPE samples was, as
expected, much worse than that of the fresh frozen RNA (Figure 4.5A), the NanoString
results of the paired samples were highly correlated with an average r of 0.9070,
median r of 0.9290, and standard deviation (SD) of 0.0859 (Figure 4.5B). To examine
this further, the NanoString results for each RNA type were compared to the microarray
results for each sample. Even though NanoString and microarray are different
platforms, the results still correlated reasonably well. The correlations between the fresh
frozen RNA NanoString versus microarray (average r of 0.5585, median r of 0.5608,
and SD of 0.0718) (Figure 4.5C) and the FFPE-derived RNA NanoString versus
microarray (average r of 0.5384, median r of 0.5401, and SD of 0.0891) (Figure 4.5D)

55
were not significantly different between the two RNA types, thus confirming that
NanoString works equally well for FFPE-derived RNA and fresh frozen RNA.
Figure 4.5: NanoString analysis of the E2F signature is equally effective using FFPE-derived RNA and fresh frozen RNA. (A.) Fresh frozen and FFPE-derived RNA from early-stage NSCLC patients were analyzed via an Agilent 2100 Bioanalyzer Instrument. As expected, the fresh frozen RNA (RNA Integrity Numbers (RIN) from 4.2-5.9) was in better condition than the FFPE-derived samples (RIN from 2.3-2.4). (B.) NanoString results from fresh frozen RNA were correlated to paired NanoString results from FFPE-derived RNA (representative shown here). Paired NanoString results correlated r=0.9 on average. Microarray results were then correlated to (C.) NanoString fresh frozen results and (D.) NanoString FFPE results for each sample. No significant differences between these two correlations were noted for any of the samples.
Sam
ple
49
Sam
ple
50
Sam
ple
51
Sam
ple
52
Ladder
Sam
ple
1
Sam
ple
2
Sam
ple
4
Sam
ple
5
Sam
ple
6
Sam
ple
7
Sam
ple
8
Contr
ol
FFPEFresh Frozen
4.2 4.5 5.9 4.2 2.4 2.4 2.3 2.3 2.3 2.3 2.4 9.8RNA Integrity number
(RIN)
Sam
ple
49
Sam
ple
50
Sam
ple
51
Sam
ple
52
Ladder
Sam
ple
1
Sam
ple
2
Sam
ple
4
Sam
ple
5
Sam
ple
6
Sam
ple
7
Sam
ple
8
Contr
ol
FFPEFresh Frozen
4.2 4.5 5.9 4.2 2.4 2.4 2.3 2.3 2.3 2.3 2.4 9.8RNA Integrity number
(RIN)
A. B.
C. D.
Sam
ple
49
Sam
ple
50
Sam
ple
51
Sam
ple
52
Ladder
Sam
ple
1
Sam
ple
2
Sam
ple
4
Sam
ple
5
Sam
ple
6
Sam
ple
7
Sam
ple
8
Contr
ol
FFPEFresh Frozen
4.2 4.5 5.9 4.2 2.4 2.4 2.3 2.3 2.3 2.3 2.4 9.8RNA Integrity number
(RIN)
Sam
ple
49
Sam
ple
50
Sam
ple
51
Sam
ple
52
Ladder
Sam
ple
1
Sam
ple
2
Sam
ple
4
Sam
ple
5
Sam
ple
6
Sam
ple
7
Sam
ple
8
Contr
ol
FFPEFresh Frozen
4.2 4.5 5.9 4.2 2.4 2.4 2.3 2.3 2.3 2.3 2.4 9.8RNA Integrity number
(RIN)
A. B.
C. D.

56
Discussion
These studies have shown that higher E2F activity indicates poor outcome in
early stage NSCLC patients. In NSCLC, high E2F activity tends to stem from Rb or p16
inactivation and is relatively common. Since this E2F signature has been shown to
mainly represent proliferation, the correlation between those with high E2F signature
scores and worse prognosis is sensible. Considering that this signature has been
shown to be prognostic in several large datasets, it would not be unreasonable to
suggest that this could possibly become a useful clinical tool in the future.
This E2F signature could also potentially have clinical utility for predicting which early-
stage NSCLC patients would benefit most from receiving adjuvant chemotherapy. The
most likely explanation for this is that those with high E2F signature scores should have
the highest proliferative rates, so it would be reasonable to expect that those who were
observed only would have the lowest OS. Likewise, since most chemotherapeutic
agents are expected to affect tumor tissues more than normal tissues due to the tumor’s
higher rates of proliferation, it would be logical to expect those with high E2F signature
scores to have a greater response to adjuvant chemotherapy. This explanation
suggests that those with high E2F signature scores should be more sensitive to ACT
than those with low scores, but the JBR.10 trial analyzed here only used cisplatin with
vinorelbine, so further study would be needed to confirm that this is the case. If these
results were reproducible among a wide variety of chemotherapies, perhaps this
signature could possibly become a test to predict which patients should receive
adjuvant chemotherapy as well as which patients would be less likely to benefit.

57
NanoString is a relatively new platform that is capable of measuring mRNA
expression of genes in a specific, reproducible manner. These studies have shown that
NanoString is equally effective using FFPE-derived RNA as fresh frozen RNA,
confirming the results of previous studies [255, 256]. This would prove very useful for
clinical testing since using fresh frozen RNA only is largely impractical in research, and
being able to use samples with even low levels of RNA quality would make it easier to
apply to patient samples. Furthermore, considering that the Prosigna assay (a
prognostic NanoString-based kit that measures the expression of 50 target genes and 8
normalization genes) [257] has received clearance from the US Food and Drug
Administration (FDA) for clinical use for early-stage breast cancer [252, 253], it would be
reasonable to predict that there could be a similar future utility for our E2F signature for
testing early-stage NSCLC patients.
It was not incredibly surprising to see in these studies that the E2F signature may
be a more sensitive proliferative marker than Ki67 considering that the signature can
account for the expression of over 100 genes while Ki67 is only measuring one.
Likewise, issues with immunohistochemistry as a platform for measuring proliferation
may pose issues due to lot variability in antibodies and lack of reproducibility among
institutions would make continued use of Ki67 as a proliferative marker somewhat
problematic in the clinic. As such, a NanoString-based test based on the E2F signature
would be able to sidestep these issues and potentially prove to be a useful tool in the
clinic.

58
CHAPTER FIVE:
CDK12 IS UPREGULATED IN LUNG ADENOCARCINOMA AND ITS KNOCKDOWN
SENSITIZES NSCLC CELLS TO PLATINUM THERAPY
Introduction
As mentioned previously, platinum agents such as cisplatin and carboplatin are
commonly used in the treatment of NSCLC, especially for patients who do not have
mutations that can be treated with a targeted agent. Platinum agents cause DNA
crosslinking. This crosslinking induces the DNA damage response (DDR), which can
lead to cell cycle arrest and DNA repair or lead to cell death. Since cancer cells tend to
proliferate more rapidly than normal cells, platinum agents possess increased toxicity
toward tumor cells relative to normal cells [258]. Two of the most commonly used
platinum agents are cisplatin and carboplatin. Cisplatin was the first of these two
compounds, gaining approval for clinical use in 1978. It has two chloride groups
attached to a central platinum atom that can be rapidly displaced by water (in a process
called aquation), which can in turn be displaced by reaction with DNA bases and other
biomolecules. Carboplatin (approved in 1986) has a bulkier subgroup than cisplatin that
undergoes aquation much more slowly. It is thus less toxic and is commonly used when
cisplatin is unlikely to be tolerated [259]. Though most studies have shown that cisplatin
and carboplatin have comparable efficacy in the clinic with no statistically significant
59
difference in survival rates [260-263], another study has shown that cisplatin may be
slightly more effective than carboplatin in regards to significantly enhancing the survival
rate at 1 year [264]. Other meta-analyses have shown that using third generation drugs
in doublets with cisplatin can have a survival advantage over the same agents with
carboplatin [261, 262].
DDR is typically triggered by stalled replication forks and a variety of DNA lesions
resulting from many different biological insults (UV exposure, reactive oxygen species,
ionizing radiation, etc). For double-strand breaks (DSBs), the DNA damage sensor
proteins Mre11, Rad50, and Nbs1 bind to the altered DNA. Ataxia-telangiectasia
mutated (ATM) is then recruited to this complex and binds to the C-terminus of Nbs1
[265, 266], which is assisted by 53BP1 and BRCA1 [267]. ATM can then phosphorylate
a number of proteins downstream, though it is well known for activating Chk2, which
can then phosphorylate and inactivate CDC25A, leading to a decrease in CDK activity
and cell cycle arrest [268, 269]. DNA damage can also trigger ATM and Rad3-related
(ATR) protein, which can activate Chk1 and likewise lead to inactivation of CDC25
protein family members and cell cycle arrest [270-272]. Furthermore, ATM and ATR can
also phosphorylate p53, triggering transcription of p21 and cell cycle arrest [273-275].
Recently, a screen of protein interactions with the BRCA1 carboxyl-terminal
(BRCT) domain (known to be involved with DDR) was completed. This screening
involved the use of previous literature, yeast two hybrid (Y2H) screens, and tandem
affinity purification (TAP) coupled with mass spectrometry (MS) of seven tandem BRCT
domains utilized as baits in the presence and absence of ionizing radiation to induce

60
DDR. This screen yielded 18 serine/threonine protein kinases, of which five were CDKs
[276].
The most well-known CDKs have roles in cell cycle regulation (CDK1/2/4/6) or
phosphorylation of the C-terminal domain (CTD) of RNA polymerase II for
transcriptional regulation (CDK7/9) [80, 277]. However, there are other CDKs present in
cells, and these CDKs are capable of binding different cyclins. The CDKs that were
identified in this screen (CDK5, CDK9, CDK12, CDK13, and CDK16) are some of the
less commonly studied members of the protein family, and have been previously shown
to be involved in a variety of cellular activities. CDK5 is mainly known for its roles in
central nervous system (CNS) formation and function [278-281], and has been shown to
be involved in DDR in post-mitotic neurons by phosphorylating ATM at serine 794 [282].
CDK9 is well known for its role in phosphorylating the C-terminal domain (CTD) of RNA
polymerase II, leading to greatly enhanced transcriptional processivity [283-288]. CDK9
has also been implicated in DNA damage, where CDK9 bound to cyclin K can bind to
ATR as part of maintaining genome integrity [289], and also cells where ATM has been
knocked down have less CDK9-bound transcriptional elongation complexes attached to
the promoters of NFκB-dependent early cytokine genes [290]. CDK12 has also been
found to be involved in phosphorylating the CTD of RNA polymerase II [291, 292], as
well as being involved in alternative splicing [293]. CDK13 has been shown to be
involved in alternative splicing [294, 295]. CDK16 has not been implicated in cancer,
though it is highly expressed in mouse brains and testes [296], has been suggested to
have roles in CNS formation [297], and is phosphorylated and activated by CDK5 [298,
299].

61
Although historically understudied, CDK12 has gained a lot of interest recently as
several studies have implicated it in human cancer. CDK12 has been shown to be
highly mutated in ovarian cancer [300, 301], and many of these mutations have been
shown to be unable to phosphorylate the CTD of RNA polymerase II [302]. It has been
noted that its depletion can lead to a decrease in the expression of genes involved in
DDR such as BRCA1, FANCI, and ATR due to a lack of RNA polymerase II activity,
while knockdown of CDK13 (which also binds to cyclin K) does not alter expression of
these genes [291]. Likewise, it has been noted that cells deficient of CDK12 can
become more sensitive to DNA damaging agents such as etoposide [291] and also
have decreased homologous recombination (HR) abilities, thus making cells more
sensitive to PARP inhibitors [302-304].
In the following studies, cell lines with wildtype KRAS and EGFR that lacked ALK
fusions (later discussed as “triple-negative”) were used to represent the many patients
who do not have actionable mutations and therefore cannot benefit from targeted agent
therapy, and who must instead rely upon standard chemotherapy such as cisplatin.
Considering that cisplatin is an agent that induces DDR, it was considered that targeting
some of the kinases discovered in the BRCT screen might sensitize cells to cisplatin.
Since multiple CDK family members were found in the screen, they were specifically
targeted. To investigate this, siRNA specific to the aforementioned CDKs and existing
CDK inhibitors were tested for enhancing sensitivity to cisplatin in triple-negative
NSCLC cell lines. The most promising target from these studies, CDK12, was then
investigated further to understand the mechanism behind its role in platinum sensitivity.

62
Overall, these studies suggest that CDK12 may be a useful target in triple-negative
NSCLC.
Results
CDK12 Depletion in Triple-Negative NSCLC Enhances Sensitivity to
Cisplatin
The triple-negative NSCLC cell lines H1666, H1648, and H322 were transfected
with control, CDK5, CDK9, CDK12, CDK13, and CDK16 siRNA and used in cell viability
assays to determine their cisplatin IC50s. These experiments showed that in all three cell
lines, CDK12 depletion led to increased sensitivity to cisplatin (Figure 5.1). Therefore,
CDK12 was investigated further to determine its role in NSCLC as well as in platinum
sensitivity.
Also, we tested whether CDK inhibition would alter sensitivity of triple-negative
NSCLC cell lines to cisplatin by using several commercially available CDK inhibitors (as
shown in Table 5.1). These CDK inhibitors were tested in H1648 and H322 cells for
synergy with cisplatin according to the Bliss model. Unfortunately, none of these
compounds showed any synergy (Figure 5.2). However, considering that newly
discovered CDKs such as CDK12 have not been greatly studied and are quite different
in structure from previously identified CDKs, it is possible that these existing CDK
inhibitors may not effectively target CDK12. Likewise, results discussed here were
somewhat confirmed by Bösken et al, who showed that CDK12’s kinase activity was not
strongly affected by roscovitine and purvalanol B [305].

63
siRNA Transfeced H1666 CellsTreated with Cisplatin - Day 5 (M5)
Cell Titer Glo
0.01 0.1 1 10 1000
25
50
75
100
125Control si
CDK5
CDK9
CDK12
CDK13
CDK16
Control si
16.12
CDK5
5.120
CDK9
14.10
CDK12
2.126
CDK13
5.883
CDK16
12.30
Cisplatin [uM]
% R
LU
(no
rmalized
to
co
ntr
ol)
siRNA Transfected H1648 Cells
Treated with Cisplatin - Day 5
Cell Titer Glo
09-Oct-2012
0.01 0.1 1 10 1000
20
40
60
80
100
120
140Control si
CDK5
CDK9
CDK12
CDK13
CDK16
Control si
7.398
CDK5
5.833
CDK9
7.534
CDK12
1.136
CDK13
6.535
CDK16
7.342
Cisplatin [uM]
% R
LU
(no
rma
lize
d t
o c
on
tro
l)
siRNA Transfected H1648 Cells
Treated with Cisplatin - Day 5
Cell Titer Glo
09-Oct-2012
0.01 0.1 1 10 1000
20
40
60
80
100
120
140Control si
CDK5
CDK9
CDK12
CDK13
CDK16
Control si
7.398
CDK5
5.833
CDK9
7.534
CDK12
1.136
CDK13
6.535
CDK16
7.342
Cisplatin [uM]
% R
LU
(no
rma
lize
d t
o c
on
tro
l)
siRNA Transfected H1648 Cells
Treated with Cisplatin - Day 5
Cell Titer Glo
09-Oct-2012
0.01 0.1 1 10 1000
20
40
60
80
100
120
140Control si
CDK5
CDK9
CDK12
CDK13
CDK16
Control si
7.398
CDK5
5.833
CDK9
7.534
CDK12
1.136
CDK13
6.535
CDK16
7.342
Cisplatin [uM]
% R
LU
(no
rma
lize
d t
o c
on
tro
l)
siRNA Transfected H1648 Cells
Treated with Cisplatin - Day 5
Cell Titer Glo
09-Oct-2012
0.01 0.1 1 10 1000
20
40
60
80
100
120
140Control si
CDK5
CDK9
CDK12
CDK13
CDK16
Control si
7.398
CDK5
5.833
CDK9
7.534
CDK12
1.136
CDK13
6.535
CDK16
7.342
Cisplatin [uM]
% R
LU
(no
rma
lize
d t
o c
on
tro
l)
siRNA Transfected H1648 Cells
Treated with Cisplatin - Day 5
Cell Titer Glo
09-Oct-2012
0.01 0.1 1 10 1000
20
40
60
80
100
120
140Control si
CDK5
CDK9
CDK12
CDK13
CDK16
Control si
7.398
CDK5
5.833
CDK9
7.534
CDK12
1.136
CDK13
6.535
CDK16
7.342
Cisplatin [uM]
% R
LU
(no
rma
lize
d t
o c
on
tro
l)
siRNA Transfected H322 Cells
Treated with Cisplatin - Day 5
Cell Titer Glo
09-Oct-2012
0.01 0.1 1 10 1000
20
40
60
80
100
120
140Control si
CDK5
CDK9
CDK12
CDK13
CDK16
Control si
2.542
CDK5
2.780
CDK9
3.508
CDK12
0.6562
CDK13
5.384
CDK16
2.877
Cisplatin [uM]
% R
LU
(no
rma
lize
d t
o c
on
tro
l)
siRNA Transfected H1648 Cells
Treated with Cisplatin - Day 5
Cell Titer Glo
09-Oct-2012
0.01 0.1 1 10 1000
20
40
60
80
100
120
140Control si
CDK5
CDK9
CDK12
CDK13
CDK16
Control si
7.398
CDK5
5.833
CDK9
7.534
CDK12
1.136
CDK13
6.535
CDK16
7.342
Cisplatin [uM]
% R
LU
(no
rma
lize
d t
o c
on
tro
l)
B.
A.
C.
siRNA Transfeced H1666 CellsTreated with Cisplatin - Day 5 (M5)
Cell Titer Glo
0.01 0.1 1 10 1000
25
50
75
100
125Control si
CDK5
CDK9
CDK12
CDK13
CDK16
Control si
16.12
CDK5
5.120
CDK9
14.10
CDK12
2.126
CDK13
5.883
CDK16
12.30
Cisplatin [uM]
% R
LU
(no
rmalized
to
co
ntr
ol)
siRNA Transfected H1648 Cells
Treated with Cisplatin - Day 5
Cell Titer Glo
09-Oct-2012
0.01 0.1 1 10 1000
20
40
60
80
100
120
140Control si
CDK5
CDK9
CDK12
CDK13
CDK16
Control si
7.398
CDK5
5.833
CDK9
7.534
CDK12
1.136
CDK13
6.535
CDK16
7.342
Cisplatin [uM]
% R
LU
(no
rma
lize
d t
o c
on
tro
l)
siRNA Transfected H1648 Cells
Treated with Cisplatin - Day 5
Cell Titer Glo
09-Oct-2012
0.01 0.1 1 10 1000
20
40
60
80
100
120
140Control si
CDK5
CDK9
CDK12
CDK13
CDK16
Control si
7.398
CDK5
5.833
CDK9
7.534
CDK12
1.136
CDK13
6.535
CDK16
7.342
Cisplatin [uM]
% R
LU
(no
rma
lize
d t
o c
on
tro
l)
siRNA Transfected H1648 Cells
Treated with Cisplatin - Day 5
Cell Titer Glo
09-Oct-2012
0.01 0.1 1 10 1000
20
40
60
80
100
120
140Control si
CDK5
CDK9
CDK12
CDK13
CDK16
Control si
7.398
CDK5
5.833
CDK9
7.534
CDK12
1.136
CDK13
6.535
CDK16
7.342
Cisplatin [uM]
% R
LU
(no
rma
lize
d t
o c
on
tro
l)
siRNA Transfected H1648 Cells
Treated with Cisplatin - Day 5
Cell Titer Glo
09-Oct-2012
0.01 0.1 1 10 1000
20
40
60
80
100
120
140Control si
CDK5
CDK9
CDK12
CDK13
CDK16
Control si
7.398
CDK5
5.833
CDK9
7.534
CDK12
1.136
CDK13
6.535
CDK16
7.342
Cisplatin [uM]
% R
LU
(no
rma
lize
d t
o c
on
tro
l)
siRNA Transfected H1648 Cells
Treated with Cisplatin - Day 5
Cell Titer Glo
09-Oct-2012
0.01 0.1 1 10 1000
20
40
60
80
100
120
140Control si
CDK5
CDK9
CDK12
CDK13
CDK16
Control si
7.398
CDK5
5.833
CDK9
7.534
CDK12
1.136
CDK13
6.535
CDK16
7.342
Cisplatin [uM]
% R
LU
(no
rma
lize
d t
o c
on
tro
l)
siRNA Transfected H1648 Cells
Treated with Cisplatin - Day 5
Cell Titer Glo
09-Oct-2012
0.01 0.1 1 10 1000
20
40
60
80
100
120
140Control si
CDK5
CDK9
CDK12
CDK13
CDK16
Control si
7.398
CDK5
5.833
CDK9
7.534
CDK12
1.136
CDK13
6.535
CDK16
7.342
Cisplatin [uM]
% R
LU
(no
rma
lize
d t
o c
on
tro
l)
siRNA Transfected H1648 Cells
Treated with Cisplatin - Day 5
Cell Titer Glo
09-Oct-2012
0.01 0.1 1 10 1000
20
40
60
80
100
120
140Control si
CDK5
CDK9
CDK12
CDK13
CDK16
Control si
7.398
CDK5
5.833
CDK9
7.534
CDK12
1.136
CDK13
6.535
CDK16
7.342
Cisplatin [uM]
% R
LU
(no
rma
lize
d t
o c
on
tro
l)
siRNA Transfected H322 Cells
Treated with Cisplatin - Day 5
Cell Titer Glo
09-Oct-2012
0.01 0.1 1 10 1000
20
40
60
80
100
120
140Control si
CDK5
CDK9
CDK12
CDK13
CDK16
Control si
2.542
CDK5
2.780
CDK9
3.508
CDK12
0.6562
CDK13
5.384
CDK16
2.877
Cisplatin [uM]
% R
LU
(no
rma
lize
d t
o c
on
tro
l)
siRNA Transfected H1648 Cells
Treated with Cisplatin - Day 5
Cell Titer Glo
09-Oct-2012
0.01 0.1 1 10 1000
20
40
60
80
100
120
140Control si
CDK5
CDK9
CDK12
CDK13
CDK16
Control si
7.398
CDK5
5.833
CDK9
7.534
CDK12
1.136
CDK13
6.535
CDK16
7.342
Cisplatin [uM]
% R
LU
(no
rma
lize
d t
o c
on
tro
l)
B.
A.
C.
Figure 5.1: CDK12 knockdown enhances sensitivity to cisplatin in triple-negative NSCLC cell lines. The cell lines H1666 (A.), H1648 (B.), and H322 (C.) were transfected with either control (gold square), CDK5 (olive triangle), CDK9 (green triangle), CDK12 (blue diamond), CDK13 (purple circle), or CDK16 (pink square) siRNA and utilized for cell viability assay analysis. After 120 hours of treatment with a variety of concentrations of cisplatin, CellTiter-Glo assay reagent was added to the cells and cell viability was determined. The Bliss model was used for all IC50 calculations. In all cell lines, cells transfected with CDK12 siRNA were most sensitive to cisplatin.

64
CDK12 Protein Levels Are Higher in Tumor Tissue than in Normal and
Correlate with Ki67 Expression
Studies have shown that CDK12 is commonly mutated in ovarian cancer,
suggesting that it may be a tumor suppressor [300, 301]. However, CDK12 expression
has not been extensively studied in NSCLC. To investigate this, a tissue microarray of
145 lung carcinoma samples and 58 paired normal tissues was stained with an antibody
against CDK12 and scored by a pathologist (Figure 5.3 shows representative staining).
All CDK12 staining was nuclear, and typically levels were highest in tumor samples as
compared to normal (Figure 5.4A). Likewise, upon comparison to the Ki67 staining
results using the same TMA (as discussed in Chapter Four), it was noted that CDK12
staining positively correlates with Ki67 staining in both normal and tumor samples
(Figure 5.4B; r = 0.463 for the normal samples and r = 0.534 for the tumor samples). In
fact, many tissue samples showed that the same areas with high CDK12 levels tended
to also have high Ki67 levels (for example, compare the bottom of normal core 11’s
Ki67 and CDK12 staining in Figure 5.3).
Table 5.1: Known targets of CDK inhibitors tested for synergy with cisplatin.
Inhibitor Main targets
SNS-032 (BMS-387032) CDK1, CDK2, CDK4, CDK7, CDK9, GSK3β
Roscovitine (seliciclib, CYC202) CDK1, CDK2, CDK5, CDK7, CDK8, CDK9
Dinaciclib (SCH-727965) CDK1, CDK2, CDK5, CDK9
Purvalanol B CDK1, CDK2, CDK5
Indirubin CDK1, CDK2, CDK4, CDK5, GSK3β

65
0.0
00
0.0
39
0.1
56
0.6
25
(Ind
)
2.5
10
0.0
00
2.0
00
32
0.0000.200
0.400
0.600
0.800
1.000
1.200
Cisplatin/Indirubin in H1648
Cisplatin/Indirubin
0.0
00
0.0
39
0.1
56
0.6
25
(SCH
)
2.5
10
0.0
00
2.0
00
32
0.0000.2000.400
0.6000.800
1.000
1.200
Cisplatin/SCH727965 in H1648
Cisplatin/SCH727965
0.0
00
0.0
39
0.1
56
0.6
25
(Pu
rB)
2.5
10
0.0
00
2.0
00
32
0.0000.2000.400
0.6000.800
1.000
1.200
Cisplatin/Purvalanol B in H1648
Cisplatin/Purvalanol B0
.00
0
0.0
39
0.1
56
0.6
25
(SNS)
2.5
10
0.0
00
2.0
00
32
0.0000.2000.400
0.600
0.8001.000
1.200
Cisplatin/SNS-032 in H1648
Cisplatin/SNS-032
0.0
00
0.0
39
0.1
56
0.6
25
(Ro
s)
2.5
10
0.0
00
2.0
00
32
0.0000.2000.400
0.600
0.8001.000
1.200
Cisplatin/Roscovitine in H1648
Cisplatin/Roscovitine
A.
B.
Cisplatin/Indirubin Cisplatin/SCH727965Cisplatin/Purvalanol B
Cisplatin/SNS-032 Cisplatin/Roscovitine
0.0
00
0.0
39
0.1
56
0.6
25
(Ind
)
2.5
10
0.0
00
3.0
00
48
0.0000.2000.400
0.600
0.8001.000
1.200
Cisplatin/Indirubin in H322
0.0
00
0.0
39
0.1
56
0.6
25
(Pu
rB)
2.5
10
0.0
00
3.0
00
48
0.0000.2000.4000.6000.8001.000
1.200
Cisplatin/Purvalanol B in H3220
.00
0
0.0
39
0.1
56
0.6
25
(Ro
s)
2.5
10
0.0
00
3.0
00
48
0.0000.2000.400
0.600
0.8001.000
1.200
Cisplatin/Roscovitine in H322
0.0
00
0.0
39
0.1
56
0.6
25
(SCH
)
2.5
10
0.0
00
3.0
00
48
0.0000.2000.400
0.6000.800
1.000
1.200
Cisplatin/SCH727965 in H322
0.0
00
0.0
39
0.1
56
0.6
25
(SNS)
2.5
10
0.0
00
3.0
00
48
0.0000.2000.400
0.600
0.8001.000
1.200
Cisplatin/SNS-032 in H322
Inhibition
relative to
control
Purvalanol B (μM)
Indirubin (μM)
SCH727965 (μM)
SNS-032 (μM)
Roscovitine (μM)
Cispl
atin
(μM
)
Cispl
atin
(μM
)
Cispl
atin
(μM
)
Cispl
atin
(μM
)
Cispl
atin
(μM
)
Inhibition
relative to
control
Inhibition
relative to
control
Purvalanol B (μM)
SCH727965 (μM)Cispl
atin
(μM
)
Cispl
atin
(μM
)
Cispl
atin
(μM
)
Indirubin (μM)
SNS-032 (μM)
Roscovitine (μM)Cispl
atin
(μM
)
Cispl
atin
(μM
)
Inhibition
relative to
control
0.0
00
0.0
39
0.1
56
0.6
25
(Ind
)
2.5
10
0.0
00
2.0
00
32
0.0000.200
0.400
0.600
0.800
1.000
1.200
Cisplatin/Indirubin in H1648
Cisplatin/Indirubin
0.0
00
0.0
39
0.1
56
0.6
25
(SCH
)
2.5
10
0.0
00
2.0
00
32
0.0000.2000.400
0.6000.800
1.000
1.200
Cisplatin/SCH727965 in H1648
Cisplatin/SCH727965
0.0
00
0.0
39
0.1
56
0.6
25
(Pu
rB)
2.5
10
0.0
00
2.0
00
32
0.0000.2000.400
0.6000.800
1.000
1.200
Cisplatin/Purvalanol B in H1648
Cisplatin/Purvalanol B0
.00
0
0.0
39
0.1
56
0.6
25
(SNS)
2.5
10
0.0
00
2.0
00
32
0.0000.2000.400
0.600
0.8001.000
1.200
Cisplatin/SNS-032 in H1648
Cisplatin/SNS-032
0.0
00
0.0
39
0.1
56
0.6
25
(Ro
s)
2.5
10
0.0
00
2.0
00
32
0.0000.2000.400
0.600
0.8001.000
1.200
Cisplatin/Roscovitine in H1648
Cisplatin/Roscovitine
A.
B.
Cisplatin/Indirubin Cisplatin/SCH727965Cisplatin/Purvalanol B
Cisplatin/SNS-032 Cisplatin/Roscovitine
0.0
00
0.0
39
0.1
56
0.6
25
(Ind
)
2.5
10
0.0
00
3.0
00
48
0.0000.2000.400
0.600
0.8001.000
1.200
Cisplatin/Indirubin in H322
0.0
00
0.0
39
0.1
56
0.6
25
(Pu
rB)
2.5
10
0.0
00
3.0
00
48
0.0000.2000.4000.6000.8001.000
1.200
Cisplatin/Purvalanol B in H3220
.00
0
0.0
39
0.1
56
0.6
25
(Ro
s)
2.5
10
0.0
00
3.0
00
48
0.0000.2000.400
0.600
0.8001.000
1.200
Cisplatin/Roscovitine in H322
0.0
00
0.0
39
0.1
56
0.6
25
(SCH
)
2.5
10
0.0
00
3.0
00
48
0.0000.2000.400
0.6000.800
1.000
1.200
Cisplatin/SCH727965 in H322
0.0
00
0.0
39
0.1
56
0.6
25
(SNS)
2.5
10
0.0
00
3.0
00
48
0.0000.2000.400
0.600
0.8001.000
1.200
Cisplatin/SNS-032 in H322
Inhibition
relative to
control
Purvalanol B (μM)
Indirubin (μM)
SCH727965 (μM)
SNS-032 (μM)
Roscovitine (μM)
Cispl
atin
(μM
)
Cispl
atin
(μM
)
Cispl
atin
(μM
)
Cispl
atin
(μM
)
Cispl
atin
(μM
)
Inhibition
relative to
control
Inhibition
relative to
control
Purvalanol B (μM)
SCH727965 (μM)Cispl
atin
(μM
)
Cispl
atin
(μM
)
Cispl
atin
(μM
)
Indirubin (μM)
SNS-032 (μM)
Roscovitine (μM)Cispl
atin
(μM
)
Cispl
atin
(μM
)
Inhibition
relative to
control
Figure 5.2: Cisplatin does not synergize with commercially available CDK inhibitors in NSCLC cell lines. H322 (A.) and H1648 (B.) cells were treated with varying concentrations of cisplatin and the CDK inhibitors Purvalanol B, Indirubin, SCH727965, SNS-032, and roscovitine, then analyzed for synergy by cell viability assays with CellTiter-Glo. In these assays, none of the tested CDK inhibitors synergized with cisplatin.

66
Figure 5.3: Representative Ki67 and CDK12 IHC staining in the lung carcinoma TMA. A tissue microarray of paired normals (A.) and lung adenocarcinoma (B.) was stained with CDK12 and Ki67 antibodies.
Ki67
CDK12
Normal
12.5%5.2%
3.1%0.05%
Core 11Core 6
Carcinoma2.7% 4.5%
27%16%
Core 149 Core 1
A.
Ki67
CDK12
B.
Ki67
CDK12
Normal
12.5%5.2%
3.1%0.05%
Core 11Core 6
Carcinoma2.7% 4.5%
27%16%
Core 149 Core 1
A.
Ki67
CDK12
B.
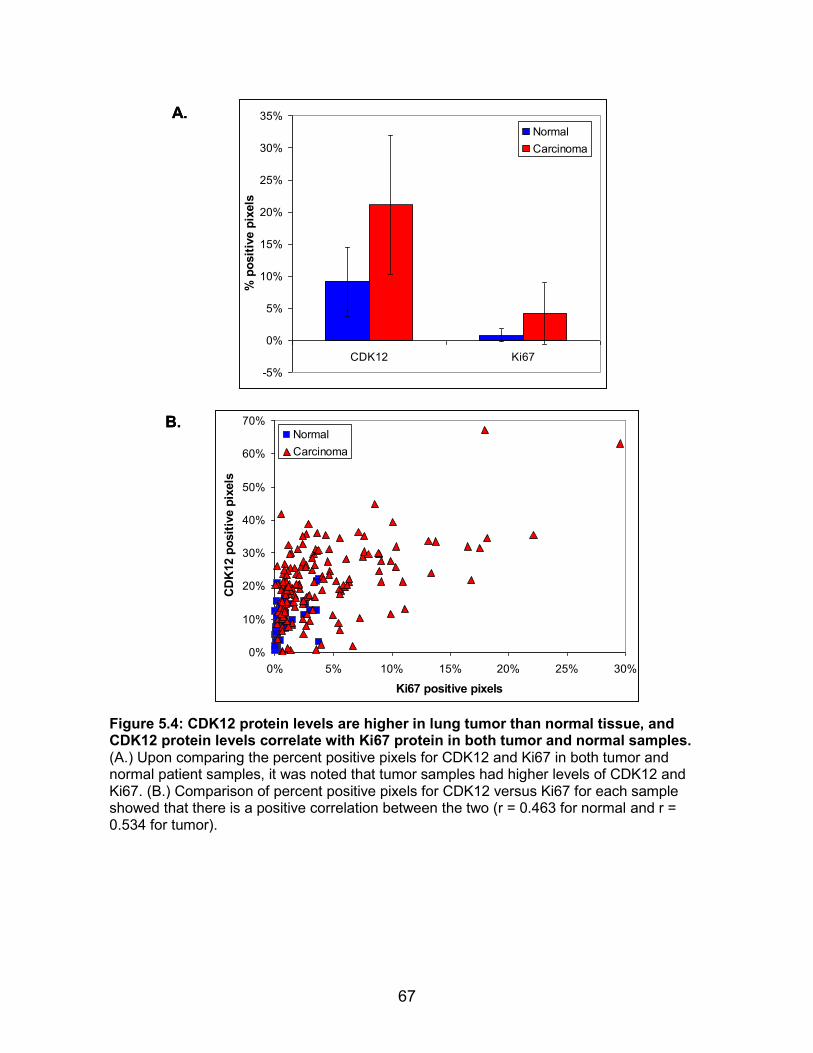
67
A.
B.
-5%
0%
5%
10%
15%
20%
25%
30%
35%
CDK12 Ki67
% p
osit
ive p
ixels
Normal
Carcinoma
0%
10%
20%
30%
40%
50%
60%
70%
0% 5% 10% 15% 20% 25% 30%
Ki67 positive pixels
CD
K12 p
osit
ive p
ixels
Normal
Carcinoma
A.
B.
-5%
0%
5%
10%
15%
20%
25%
30%
35%
CDK12 Ki67
% p
osit
ive p
ixels
Normal
Carcinoma
0%
10%
20%
30%
40%
50%
60%
70%
0% 5% 10% 15% 20% 25% 30%
Ki67 positive pixels
CD
K12 p
osit
ive p
ixels
Normal
Carcinoma
Figure 5.4: CDK12 protein levels are higher in lung tumor than normal tissue, and CDK12 protein levels correlate with Ki67 protein in both tumor and normal samples. (A.) Upon comparing the percent positive pixels for CDK12 and Ki67 in both tumor and normal patient samples, it was noted that tumor samples had higher levels of CDK12 and Ki67. (B.) Comparison of percent positive pixels for CDK12 versus Ki67 for each sample showed that there is a positive correlation between the two (r = 0.463 for normal and r = 0.534 for tumor).

68
CDK12 Depletion Does Not Alter BRCA1 nor FANCI mRNA Expression, But
Does Lead to a Decrease in ATM Expression
Since a relationship between CDK12 levels and mRNA expression of various
genes involved in DNA damage response has previously been published [291], this
relationship was first tested as a possible explanation for the enhanced sensitivity to
cisplatin that was observed in CDK12-depleted cells. H1648 and H322 cells were
transfected with control, CDK5, CDK9, and CDK12 siRNA and RNA harvested for real-
time PCR analysis. In these experiments, it was noted that there was no significant
effect on BRCA1 and FANCI expression following CDK12 knockdown in both cell lines
(Figure 5.5). In order to expand the genes being studied, Affymetrix U133A GeneChip
microarrays were used to analyze H322 and H1648 cells transfected with either control
or CDK12 siRNA. In this analysis, the top 20 and lowest 20 probes that were most
altered in the same manner in both cell lines were not related to DNA damage (Table
5.2). Therefore, it was presumed that a change in DDR-related protein activity,
translation, or stability could potentially explain the changes in cisplatin sensitivity. In
order to investigate this, the DNA Damage Antibody Sampler Kit from Cell Signaling
Technology (#9947) was used to examine several activated proteins. It was observed
that total ATM protein levels were much lower in cells transfected with CDK12 siRNA
and was the most consistently altered member of the DNA damage pathway (Figure
5.6A). Upon this finding, the microarray results were re-examined. Although ATM wasn’t
one of the most dramatically altered genes in the analysis, it was the only major DDR
gene that was affected in the CDK12 knockdowns (ATM expression was ~0.5376

69
A.
B.
0
0.5
1
1.5
2
2.5
CDK5 CDK9 CDK12 BRCA1 FANCI
RN
A f
old
ch
an
ge
(n
orm
ali
ze
d t
o G
AP
DH
)
H322 control si
H322 CDK5 si
H322 CDK9 si
H322 CDK12 si
0
0.5
1
1.5
2
2.5
3
3.5
CDK5 CDK9 CDK12 BRCA1 FANCI
RN
A f
old
ch
an
ge
(n
orm
ali
ze
d t
o G
AP
DH
)
H1648 control si
H1648 CDK5 si
H1648 CDK9 si
H1648 CDK12 si
Figure 5.5: CDK12 knockdown does not lead to a decrease in BRCA1 nor FANCI mRNA expression in triple-negative NSCLC cell lines. Triple-negative NSCLC cell lines H322 (A.) and H1648 (B.) were transfected with either control, CDK5, CDK9, or CDK12 siRNA and harvested for RNA extraction 36 hours following transfection. Real-time PCR analysis showed that contrary to what has been previously published, CDK12 knockdown cells do not have lower BRCA1 and FANCI mRNA expression as compared to control siRNA cells.

70
in cells transfected with CDK12 siRNA versus control siRNA for both cell lines). In order
to investigate this further, real-time PCR was used to examine ATM mRNA expression
levels at different times following CDK12 siRNA transfection. These results confirmed
the microarray results that ATM mRNA expression levels are ~0.5-0.6 in the CDK12
siRNA cells compared to the control siRNA cells shortly after transfection (Figure 5.6B).
Likewise, as mRNA expression of CDK12 increased over time (due to loss of siRNA),
ATM mRNA expression typically increased in a corresponding manner. These results
therefore suggest that alterations in CDK12 levels may affect ATM levels at least
partially by a decrease in ATM transcription.
Table 5.2: Genes involved in DNA damage were not dramatically affected in triple-negative NSCLC cells depleted of CDK12
Symbol AvgLog2Ratio Symbol AvgLog2Ratio
CDK12 -2.2211 C1orf96 1.038092
RFPL3-AS1 -2.1878 TMEM87A 1.035743
CDK12 -2.084 TMED5 1.035311
CARD8 -1.9979 GSTCD 1.03462
CDK12 -1.8841 NAP1L1 1.031837
RPGRIP1L -1.7926 NFIB 1.030515
CDK12 -1.7819 SUB1 1.029845
MTRF1 -1.7187 NAP1L1 1.025201
SLC2A12 -1.6436 USP12 1.025061
LOC100506418 -1.6435 SLC16A1 1.021511
SYTL5 -1.6234 PAK2 1.020837
SLC2A12 -1.6211 RRAS2 1.017765
TBC1D8 -1.5788 DHTKD1 1.016188
MUC15 -1.5695 SNAI2 1.010863
LOC100272217 -1.5681 USP45 1.010157
FAM149B1 -1.5532 NOL9 1.008509
FAM46C -1.5516 SPAG9 1.006687
CCDC121 -1.5508 ARFIP1 1.005406
ALG13 -1.5423 RASAL2 1.0028
TTC30A -1.5273 MTMR6 1.00247
20 Lowest Expressed Genes in
CDK12 siRNA genes
20 Highest Expressed Genes in
CDK12 siRNA genes

71
Figure 5.6: Cells depleted of CDK12 have decreased levels of ATM protein and mRNA. (A.) H322 and H1648 cells were transfected with either control, CDK5, CDK9, or CDK12 siRNA and either left untreated or treated with cisplatin or pemetrexed for 120 hours. Samples were then analyzed via Western blot, where it was shown that cells transfected with CDK12 siRNA were more sensitive to cisplatin but not pemetrexed (as shown by PARP cleavage) and had lower levels of ATM protein. (B.) H322 and H1648 cells were transfected with either control or CDK12 siRNA and then split into multiple plates. These samples were harvested from RNA at 24, 72, and 120 hours following transfection and analyzed via real-time PCR, where it was observed that ATM mRNA was ~50% what it was in CDK12-depleted cells following 24 hour transfection.
-PARP
-Cleaved PARP
-CDK5
-CDK9
-CDK12
-ATM
-Actin
Contr
ol
CD
K5
CD
K9
CD
K12
Contr
ol
CD
K5
CD
K9
CD
K12
Contr
ol
CD
K5
CD
K9
CD
K12
Contr
ol
CD
K5
CD
K9
CD
K12
Contr
ol
CD
K5
CD
K9
CD
K12
Contr
ol
CD
K5
CD
K9
CD
K12
untreated 5 μM cisplatin
25 μM
pemetrexed untreated 5 μM cisplatin
25 μM
pemetrexed
H322 H1648
siRNA
120 h treatment
A.
B. CDK12 mRNA ATM mRNA
H322
H1648
0
0.2
0.4
0.6
0.8
1
1.2
24 h 72 h 120 hRN
A f
old
ch
an
ge (
no
rmali
zed
to
GA
PD
H)
control si
CDK12 si
0
0.2
0.4
0.6
0.8
1
1.2
24 h 72 h 120 hRN
A f
old
ch
an
ge (
no
rmali
zed
to
GA
PD
H)
control si
CDK12 si
0
0.2
0.4
0.6
0.8
1
1.2
24 h 72 h 120 hRN
A f
old
ch
an
ge (
no
rmali
zed
to
GA
PD
H)
control si
CDK12 si
0
0.2
0.4
0.6
0.8
1
1.2
24 h 72 h 120 hRN
A f
old
ch
an
ge (
no
rmali
zed
to
GA
PD
H)
control si
CDK12 si

72
ATM Does Not Accumulate in the Nucleus and Become Insoluble
It was previously published that ATM can bind to double-strand breaks and would
otherwise be undetectable unless microextraction protocols were used [306]. Therefore,
one possible explanation for the observed decrease in ATM protein levels was that the
ATM was accumulating in the nucleus and therefore just becoming more difficult to
extract. Therefore, H322 and H1648 cells transfected with control and CDK12 siRNA
were harvested for protein using either our normal whole-cell lysis protocol (as
discussed in Chapter Two) or using a microextraction protocol kindly provided by Alvaro
Monteiro’s lab at H. Lee Moffitt Cancer Center [158, 159]. In these experiments, it was
shown that regardless of methodology for protein extraction, ATM protein levels were
dramatically lower in cells where CDK12 was knocked down (Figure 5.7). These
experiments thus showed that the alterations in ATM protein levels were not due to
alterations in ability to extract ATM.
ATM Protein Levels Do Not Decrease until 60-72 Hours after CDK12 siRNA
Transfection
To gain a better understanding of the timeline for the observed alterations in ATM
expression levels following CDK12 knockdown, ATM was measured by Western blotting
as a function of time. H322 and H1648 cells were transfected with either control or
CDK12 siRNA and split into multiple plates while changing the media (per manufacturer
protocol). Protein was extracted from treated cells at 12, 24, 36, 48, 60, and 72 hours
following transfection and analyzed via Western blots. These results showed that while
CDK12 protein levels decreased between 12-36 hours following transfection, ATM
protein levels did not decrease until much later (within 60-72 hours following

73
transfection) (Figure 5.8). The timeline of these results suggest that the observed
decrease in ATM is not due to an off-target effect of the CDK12 siRNA, where it would
be expected that ATM would decrease in approximately the same time interval as
CDK12. Also, considering that ATM mRNA levels decreased as early as 24 hours
following transfection with CDK12 siRNA, it is unlikely that the observed decrease in
ATM protein can be solely accounted for by an alteration in mRNA expression.
Therefore, it is anticipated that the decreased protein levels of ATM could be in relation
to decreased protein stability.
-ATM
-CDK12
-Actin
co
ntr
ol
CD
K1
2
co
ntr
ol
CD
K1
2
co
ntr
ol
CD
K1
2
co
ntr
ol
CD
K1
2
co
ntr
ol
CD
K1
2
co
ntr
ol
CD
K1
2
co
ntr
ol
CD
K1
2
co
ntr
ol
CD
K1
2
Normal
lysis
Cytoplasmic
extract
Nuclear
extract
Chromatin
extract
Normal
lysisCytoplasmic
extract
Nuclear
extract
Chromatin
extract
H322 H1648
: siRNA
120 hours
Figure 5.7: ATM does not localize to the nucleus in cells where CDK12 expression is knocked down. One possible explanation for the apparent loss of ATM protein in CDK12 knockdown cells was that the ATM could be localizing to double-strand breaks in the nucleus and therefore potentially become more difficult to extract. To test this, a microextraction protocol was used to isolate different fractions of the cell lysate, then these fractions were compared to the lysates from the normal extraction protocol. In both H322 and H1648 cells, ATM protein levels were dramatically lower in the CDK12 knockdown cells as compared to the controls.

74
Figure 5.8: ATM protein levels decrease approximately 60-72 hours following transfection with CDK12 siRNA. H322 and H1648 cells were transfected with either control or CDK12 siRNA, then split into multiple plates. Cells were harvested for protein extraction 12, 24, 36, 48, 60, and 72 hours following transfection, then analyzed via Western blots. Though CDK12 protein decreased in the CDK12 siRNA samples between 12-36 hours following transfections, ATM protein levels did not decrease in the same samples until 60-72 hours following transfection.
-ATM
-CDK12
-Actin
contr
ol
CD
K12
contr
ol
CD
K12
contr
ol
CD
K12
contr
ol
CD
K12
contr
ol
CD
K12
contr
ol
CD
K12
12 hr 24 hr 36 hr 48 hr 60 hr 72 hr
H322
contr
ol
CD
K12
contr
ol
CD
K12
contr
ol
CD
K12
contr
ol
CD
K12
contr
ol
CD
K12
contr
ol
CD
K12
12 hr 24 hr 36 hr 48 hr 60 hr 72 hr
siRNA
H1648
-ATM
-CDK12
-Actin
siRNA
-ATM
-CDK12
-Actin
contr
ol
CD
K12
contr
ol
CD
K12
contr
ol
CD
K12
contr
ol
CD
K12
contr
ol
CD
K12
contr
ol
CD
K12
12 hr 24 hr 36 hr 48 hr 60 hr 72 hr
H322
contr
ol
CD
K12
contr
ol
CD
K12
contr
ol
CD
K12
contr
ol
CD
K12
contr
ol
CD
K12
contr
ol
CD
K12
12 hr 24 hr 36 hr 48 hr 60 hr 72 hr
siRNA
H1648
-ATM
-CDK12
-Actin
siRNA

75
Discussion
Considering that none of the existing CDK inhibitors we tested are known to
target CDK12, it is not surprising that synergy was not observed between these
compounds and cisplatin. Nonetheless, we still believe that CDK12-specific inhibitors
may have merit. It has been noted by others that CDK12 activity is greatly inhibited by
flavopiridol [305], which was not included in the CDK inhibitor screen shown here. It is
also known that flavopiridol synergizes with cisplatin [307]. However, flavopiridol (which
is well known to be highly toxic) may still have proven unsafe for combination with
cisplatin for clinical use, so the development of a specific CDK12 inhibitor may still be
beneficial.
One interesting observation made here is that CDK12 levels tend to be higher in
NSCLC tumors rather than in normal tissues. These findings offer support that at least
in NSCLC, CDK12 may act as an oncogene. Furthermore, the findings that CDK12
levels correlate with Ki67 in lung tumor tissues (particularly that they stain the same
portions of cores) suggest that CDK12-targeted agents will primarily affect the tumor
cells that proliferate most rapidly. All of these findings suggest that CDK12 may
therefore be a useful target for cancer therapy.
Also, the findings that CDK12 knockdown enhanced sensitivity to cisplatin further
imply that CDK12 inhibition may prove useful for cancer therapy. Considering that
platinum agents are commonly used for NSCLC treatment, combining this agent with a
CDK12 inhibiting agent could prove to be a useful combination in the future. Since
CDK12 is a kinase, developing a small molecule inhibitor may be less difficult to target
compared to other protein classes.
76
Our data suggest that the increased cisplatin sensitivity observed in cells
depleted of CDK12 may be due to a concurrent decrease in ATM. This would be a
sensible putative explanation due to ATM’s well known role in DNA damage response
and cisplatin treatment’s induction of DNA crosslinking. It could prove useful to study
how big of a role ATM is playing in cisplatin sensitivity. If it were found that ATM were
the main reason for increased platinum sensitivity in CDK12-depleted cells, then further
development of ATM inhibitors might be most important for synergy with platinum
agents in patients with high CDK12 levels in the future. Of course, inhibiting ATM in
normal tissues could prove dangerous, so CDK12 might still be a better target for future
research.

77
CHAPTER SIX:
FINAL CONCLUSIONS AND FUTURE WORK
Final Conclusions
The high incidence and mortality rates of lung cancer have motivated this work.
This dissertation explores three therapeutic approaches that could impact therapeutic
management of lung cancer, particularly NSCLC.
First, we examined the utility of a novel pan-E2F inhibitor in lung cancer. As an
undergraduate student, I was part of the Cress lab team that initially identified this
compound from library screens [144]. Considering that the CDK/Rb/E2F pathway is
altered in some way in most lung cancers, this was an obvious target to explore in my
dissertation work. Though the lead compound we studied has a low likelihood of being
used clinically for lung cancer due to its limited potency and toxicity, our studies do point
to the potential use of E2F-targeted compounds. For example, we have shown that E2F
inhibition (especially targeting E2F3, one of the most commonly implicated E2Fs for
worse prognosis [308-316]) could be effective, and may also be even more successful
when combined with common chemotherapeutic agents such as paclitaxel. It could be
efficacious to develop more specific compounds since pan-E2F inhibitors such as 6474
can cause effects that essentially cancel each other out. Likewise, since E2Fs are
further downstream within the CDK/Rb/E2F pathway, development of E2F inhibitors

78
could be theoretically useful since it could be applicable in samples with a variety of
pathway deregulation methods. For example, while CDK4/6 inhibitors require wildtype
Rb in order to be effective, an E2F inhibitor could work regardless of the method of
pathway alteration.
Next, we examined a tool that could be applicable for determining patient
prognosis and predicting benefit from adjuvant chemotherapy. This project began as a
component of the E2F target project as we wanted to define the specificity of E2F family
member function. However, as we examined the E2F signature in publically-available
data, it became clear that the common E2F signature is a powerful biomarker. Also, the
predictive ability of this signature could be exceptionally useful for revealing which early-
stage NSCLC patients should receive adjuvant chemotherapy. Should clinical viability
for this signature be proven, it could save patients from being administered
chemotherapy from which they are unlikely to benefit, as well as be ultimately more
cost-effective. As such, this signature could provide another step towards more
personalized medicine being used in cancer therapy.
The third project of this dissertation on CDK12 emerged from Dr. Alvaro
Monteiro’s work on DDR, and I was recruited to the project due to my expertise in
siRNA depletion studies and interest in therapeutic interventions in NSCLC. For the
CDK12 chapter, we focused on identifying new targets in order to assist a large
population of NSCLC patients for whom there are no applicable targeted therapies who
therefore have to rely on common chemotherapeutic agents such as cisplatin. The
identification of CDK12 as a potential target in triple-negative NSCLC could be
important for the development of specific inhibitors in the future to synergize with

79
platinum agent therapy. Likewise, further study of this little-known protein could lead to
the development of other inhibitors once its function in DNA damage as well as other
pathways is better understood.
Taken together, these studies have explored several novel possibilities for lung
cancer therapy. While these studies are still relatively early, we believe that they could
lead to some exciting and useful tools for lung cancer treatment.
Future Work
There are a variety of questions that still should be answered, especially before
these findings could be clinically useful. Here, we will discuss some of the research
areas that could be examined in future investigations.
In relation to the 6474 findings, it could be interesting to examine this compound
in other cancers. For example, it was previously noted that in screening this compound
against the NCI60 panel, leukemia and lymphoma cell lines were the most sensitive
(Figure 6.1). These results were confirmed in CellTiter-Blue cell viability assays where
the 6474 IC50s in several blood cancer cell lines were much lower than the average
6474 IC50 (Table 6.1). Likewise, the caspase 3 cleavage in the germinal centers of the
spleens from the mouse experiments (discussed in Chapter Three) would further
support the potential utility of targeting blood disorders with this compound. As such,
perhaps there could be a chance that this compound would still be useful in the clinic if
much lower doses could be used.
Furthermore, considering what we and others have shown in relation to high
E2F3 levels corresponding to increased sensitivity to paclitaxel, it might be interesting to
explore the utility of this compound in bladder cancer. This cancer type commonly

80
Figure 6.1: Blood cancers are more sensitive to 6474 than other cancer types included in the NCI60. Cell lines within the NCI60 were treated with 10 μM and analyzed for cell viability. Results were determined as mean growth percent less growth percent, so cell lines with negative growth values were most sensitive to the compound. Overall, blood cancers were most sensitive to 6474.

81
contains E2F3 amplification and overexpression [308, 309, 311, 317], which is a rather
uncommon mechanism for the CDK/Rb/E2F pathway to become deregulated. This
overexpression has been noted to correlate with stage and a tumor’s ability to
proliferate and metastasize [308, 309, 311]. As such, it could be useful to determine if
there is a correlation between E2F3 levels and paclitaxel sensitivity (which can be used
as a monotherapy for bladder cancer [318]) that could be useful to determine which
patients would benefit most from receiving this therapy. Considering that correlations
between high E2F3 activity/expression levels have been noted in ovarian [192], ER-
negative breast [193], and now NSCLC samples [218], this relationship could exist in
bladder cancer as well and be worth exploring. Also, it could be interesting to determine
if bladder cancer (which is not strongly represented in the NCI60) might be sensitive to
6474 therapy at lower doses, and therefore possibly be clinically useful.
For the E2F signature project, more patient samples need to be analyzed in
order to further tighten the gene signature. This analysis should also confirm the
signature’s ability to determine patient prognosis and predict benefit of receiving
adjuvant chemotherapy. To this end, patient samples from the previously discussed
lung carcinoma tissue microarray, the Lung Cancer Biospecimen Resource Network
Table 6.1: Blood cancers have 6474 IC50s ranging from 5-20 μM.
Cell Line Tumor Type IC50 (in μM) STDEV
HL60 Leukemia 19.34 6.62
K562 Leukemia 18.89 10.04
CCRF-CEM Leukemia 5.18 2.11
SR Lymphoma 12.00 5.28
Average 13.85 6.01

82
(LCBRN), and the Spanish Lung Cancer group will be analyzed via NanoString. The
LCBRN is comprised of lung cancer samples from the Medical University of South
Carolina, the University of Virginia, and Washington University in St. Louis and receives
support from the Congressionally Directed Medical Research Program through the
Department of Defense Lung Cancer Research Program [319]. The Spanish Lung
Cancer group samples are from a phase III clinical trial of randomized early-staged
NSCLC patients treated with either surgery alone or surgery and ACT [320]. All of these
cohorts should be useful for determining the signature’s prognostic utility, while the TMA
and Spanish Lung Cancer group samples may be useful for determining if the signature
is predictive. Also, if there were other clinical trials similar in design to the JBR.10 that
included different chemotherapeutic agents (especially paclitaxel or pemetrexed due to
previously published results on their relationships with E2Fs [146, 192, 193, 218, 321,
322]), it could be interesting to see if there were any differences in sensitivity based on
E2F signature scores. Furthermore, since the signature is mainly proliferative, it is
highly possible that the signature may be equally effective in other cancer types as well.
Therefore, it could be interesting to do similar analyses using samples from clinical trials
in other tumor types. Another area that might be worth further exploration is the ability of
the signature to predict patient benefit from neoadjuvant and radiation therapy as well.
Since this signature is proliferative, it is anticipated that it may be effective for these
treatment types as well and thus even more useful in the clinic.
As for the CDK12 project, many future studies are needed to confirm the
potential of this protein as a biomarker for cisplatin sensitivity. First, it should be
determined whether the observed decrease in ATM levels following CDK12 siRNA

83
transfection is due to off-target effects of the siRNA. In order to investigate this,
individual siRNAs that were included in the pool could be tested to ensure that each
siRNA lead to a decrease in ATM protein levels. Another method that could be used to
determine this is creating stable CDK12 knockdown cell lines by transfecting shRNA
that is specific to a different region of CDK12 than the sequences that are targeted by
the siRNA used in the pool.
Next, it would be important to determine if the decrease in ATM levels is the
reason for the enhanced sensitivity to cisplatin. One test that could examine this would
be using ATM siRNA alone to see if that leads to a similar sensitivity to cisplatin as
when CDK12 is knocked down. Another way to test this could be through a comparison
of stable CDK12 knockdown cells either with or without exogenous ATM to see if the
cells’ sensitivity to cisplatin is altered.
Furthermore, it could be useful to explore CDK12’s relationship to cisplatin
sensitivity through different cellular manipulations. For example, it would be interesting
to determine if overexpressing CDK12 would lead to a decrease in cisplatin sensitivity.
Also, it could be important to examine which domains of CDK12 are important for
altering cisplatin sensitivity. One way to examine this could be through the creation of
stable cell lines expressing kinase-dead CDK12 to determine not only if ATM levels are
altered, but also if cisplatin sensitivity is altered. If ATM levels are not altered while
cisplatin sensitivity is still affected in the CDK12 kinase-dead cells, then it is unlikely that
ATM plays a major role in this process. If cisplatin sensitivity were not affected in
CDK12 kinase-dead cells, then stable cell lines expressing mutants of different CDK12
protein domains could be useful to determine which domain is important. However, it
84
could also be possible that kinase-dead CDK12 could be more harmful to cells than
knocking down CDK12 expression (possibly due to an ability to still bind to and recruit
some other proteins, but an inability to act). In that case, another method that could be
used to alter CDK12 kinase activity is through knockdown of its cyclin partners, such as
cyclin K [291, 323]. Though cyclin K is also known to associate with CDK13, knockdown
of this cyclin would be expected to alter cisplatin sensitivity mostly in relation to CDK12
activity because our previous results showed that CDK13 knockdown cells did not have
altered sensitivity to cisplatin. Another aspect of the relationship between CDK12 and
cisplatin sensitivity that would need to be explored is whether CDK12 knockdown in
normal cells would also greatly enhance their sensitivity to platinum agents. If so, then
this would suggest that CDK12 inhibitors could be quite toxic to non-cancerous tissues
when combined with cisplatin.
Should it appear that ATM is important for cisplatin sensitivity, then it would be
important to determine the mechanism behind its lessened expression upon CDK12
depletion. Considering that ATM mRNA expression decreases by approximately 50%
24 hours following CDK12 siRNA transfection but ATM protein levels do not decrease
until 60-72 hours following transfection, it is unlikely that decreased transcription or
mRNA degradation can completely account for the decrease in ATM protein levels. With
all of these aspects in consideration, it could be useful to determine if adding a
proteasome inhibitor would lead to an increase in ATM protein levels.
Lastly, it is interesting to note that CDK12 is very close to ERBB2 on
chromosome 17. Since ERBB2 amplifications occur in approximately 2-4% of NSCLC
[47, 48, 324], it could be interesting to see if any correlation could be noted between

85
NSCLC samples with ERBB2 amplifications and lowered cisplatin sensitivity. Likewise,
it could be interesting to explore CDK12 in breast cancer, where ERBB2 amplifications
are much more common (approximately 20%) [325-328], and CDK12 is already known
to be typically amplified whenever ERBB2 is as well [329]. Since cisplatin is a common
chemotherapeutic agent used for treating this cancer as well, then it could be important
to determine if HER2 expression could serve as a substitute marker for cisplatin
sensitivity. Our group had been interested in examining CDK12 and cisplatin sensitivity
in ovarian cancer cell lines due to the dearth of chemotherapeutic options for patients
with this cancer. However, no difference in sensitivity was noted in cell lines transfected
with CDK12 siRNA where ATM levels also decreased (data not shown). These results
have been confirmed by others, where it was shown in ovarian cancer cell lines that
ATM inhibition and cisplatin did not synergize [330], whereas ATM inhibition does
synergize with radiation [331]. As such, it could also be important to determine in both
NSCLC and breast cancer whether CDK12 may sensitize cells to radiation as well.

86
REFERENCES
1. ACS, Cancer Facts and Figures 2014. American Cancer Society, 2014. Atlanta, GA: p. 1-72.
2. Proctor, R.N., The history of the discovery of the cigarette-lung cancer link: evidentiary traditions, corporate denial, global toll. Tob Control, 2012. 21(2): p. 87-91.
3. Witschi, H., A short history of lung cancer. Toxicol Sci, 2001. 64(1): p. 4-6. 4. Prevention, C.f.D.C.a., Trends in Current Cigarette Smoking Among High School
Students and Adults, United States, 1965-2011, in Office on Smoking and Health, National Center for Chronic Disease Prevention and Health Promotion. 2013: Atlanta.
5. Prevention, C.f.D.C.a., Adult Cigarette Smoking in the United States: Current Estimates, in Office on Smoking and Health, National Center for Chronic Disease Prevention and Health Promotion. 2014: Atlanta.
6. Thun, M.J., et al., 50-year trends in smoking-related mortality in the United States. N Engl J Med, 2013. 368(4): p. 351-64.
7. Henley, S.J., et al., Lung Cancer Incidence Trends Among Men and Women - United States, 2005-2009. Mmwr-Morbidity and Mortality Weekly Report, 2014. 63(1): p. 1-5.
8. Chan, B.A. and J.I. Coward, Chemotherapy advances in small-cell lung cancer. J Thorac Dis, 2013. 5(Suppl 5): p. S565-78.
9. Davidson, M.R., A.F. Gazdar, and B.E. Clarke, The pivotal role of pathology in the management of lung cancer. J Thorac Dis, 2013. 5(Suppl 5): p. S463-78.
10. Travis, W., et al., eds. Histological Typing of Lung and Pleural Tumours. 3rd ed. 1999, Springer-Verlag: Berlin.
11. Peifer, M., et al., Integrative genome analyses identify key somatic driver mutations of small-cell lung cancer. Nat Genet, 2012. 44(10): p. 1104-10.
12. Shimizu, E., et al., RB protein status and clinical correlation from 171 cell lines representing lung cancer, extrapulmonary small cell carcinoma, and mesothelioma. Oncogene, 1994. 9(9): p. 2441-8.
13. Beasley, M.B., et al., The P16/cyclin D1/Rb pathway in neuroendocrine tumors of the lung. Hum Pathol, 2003. 34(2): p. 136-42.
14. Park, K.S., et al., Characterization of the cell of origin for small cell lung cancer. Cell Cycle, 2011. 10(16): p. 2806-15.
15. Calbo, J., et al., A functional role for tumor cell heterogeneity in a mouse model of small cell lung cancer. Cancer Cell, 2011. 19(2): p. 244-56.

87
16. Sutherland, K.D., et al., Cell of origin of small cell lung cancer: inactivation of Trp53 and Rb1 in distinct cell types of adult mouse lung. Cancer Cell, 2011. 19(6): p. 754-64.
17. Meuwissen, R., et al., Induction of small cell lung cancer by somatic inactivation of both Trp53 and Rb1 in a conditional mouse model. Cancer Cell, 2003. 4(3): p. 181-9.
18. Jackman, D.M. and B.E. Johnson, Small-cell lung cancer. Lancet, 2005. 366(9494): p. 1385-96.
19. Kallianos, A., et al., Therapeutic procedure in small cell lung cancer. J Thorac Dis, 2013. 5(Suppl 4): p. S420-4.
20. Shepherd, F.A., et al., The International Association for the Study of Lung Cancer lung cancer staging project: proposals regarding the clinical staging of small cell lung cancer in the forthcoming (seventh) edition of the tumor, node, metastasis classification for lung cancer. J Thorac Oncol, 2007. 2(12): p. 1067-77.
21. Pillai, R.N. and T.K. Owonikoko, Small cell lung cancer: therapies and targets. Semin Oncol, 2014. 41(1): p. 133-42.
22. Thatcher, N., et al., Gefitinib plus best supportive care in previously treated patients with refractory advanced non-small-cell lung cancer: results from a randomised, placebo-controlled, multicentre study (Iressa Survival Evaluation in Lung Cancer). Lancet, 2005. 366(9496): p. 1527-37.
23. Howlader, N., et al. SEER Cancer Statistics Review, 1975-2011, National Cancer Institute. 2014; Available from: http://seer.cancer.gov/csr/1975_2011/.
24. Petersen, I., The morphological and molecular diagnosis of lung cancer. Dtsch Arztebl Int, 2011. 108(31-32): p. 525-31.
25. Travis, W.D., E. Brambilla, and G.J. Riely, New pathologic classification of lung cancer: relevance for clinical practice and clinical trials. J Clin Oncol, 2013. 31(8): p. 992-1001.
26. Perez-Moreno, P., et al., Squamous cell carcinoma of the lung: molecular subtypes and therapeutic opportunities. Clin Cancer Res, 2012. 18(9): p. 2443-51.
27. Franklin, W.A., D.L. Aisner, and M. Varella-Garcia, Prognostic patterns in the histopathology of pulmonary adenocarcinoma. J Clin Oncol, 2012. 30(13): p. 1401-3.
28. Van Schil, P.E., A.D. Sihoe, and W.D. Travis, Pathologic classification of adenocarcinoma of lung. J Surg Oncol, 2013. 108(5): p. 320-6.
29. Kawano, O., et al., PIK3CA gene amplification in Japanese non-small cell lung cancer. Lung Cancer, 2007. 58(1): p. 159-60.
30. Spoerke, J.M., et al., Phosphoinositide 3-kinase (PI3K) pathway alterations are associated with histologic subtypes and are predictive of sensitivity to PI3K inhibitors in lung cancer preclinical models. Clin Cancer Res, 2012. 18(24): p. 6771-83.
31. Ji, M., et al., Highly frequent promoter methylation and PIK3CA amplification in non-small cell lung cancer (NSCLC). BMC Cancer, 2011. 11: p. 147.
32. Xu, J., et al., Somatic mutation analysis of EGFR, KRAS, BRAF and PIK3CA in 861 patients with non-small cell lung cancer. Cancer Biomark, 2011. 10(2): p. 63-9.

88
33. Wang, L., et al., PIK3CA mutations frequently coexist with EGFR/KRAS mutations in non-small cell lung cancer and suggest poor prognosis in EGFR/KRAS wildtype subgroup. PLoS One, 2014. 9(2): p. e88291.
34. Malanga, D., et al., Activating E17K mutation in the gene encoding the protein kinase AKT1 in a subset of squamous cell carcinoma of the lung. Cell Cycle, 2008. 7(5): p. 665-9.
35. Do, H., et al., Detection of the transforming AKT1 mutation E17K in non-small cell lung cancer by high resolution melting. BMC Res Notes, 2008. 1: p. 14.
36. Pao, W. and N. Girard, New driver mutations in non-small-cell lung cancer. Lancet Oncol, 2011. 12(2): p. 175-80.
37. Pao, W. and K.E. Hutchinson, Chipping away at the lung cancer genome. Nat Med, 2012. 18(3): p. 349-51.
38. Roberts, P.J. and T.E. Stinchcombe, KRAS mutation: should we test for it, and does it matter? J Clin Oncol, 2013. 31(8): p. 1112-21.
39. Graziano, S.L., et al., Prognostic significance of K-ras codon 12 mutations in patients with resected stage I and II non-small-cell lung cancer. J Clin Oncol, 1999. 17(2): p. 668-75.
40. Riely, G.J., et al., Frequency and distinctive spectrum of KRAS mutations in never smokers with lung adenocarcinoma. Clin Cancer Res, 2008. 14(18): p. 5731-4.
41. Goffin, J.R. and K. Zbuk, Epidermal growth factor receptor: pathway, therapies, and pipeline. Clin Ther, 2013. 35(9): p. 1282-303.
42. Lynch, T.J., et al., Activating mutations in the epidermal growth factor receptor underlying responsiveness of non-small-cell lung cancer to gefitinib. N Engl J Med, 2004. 350(21): p. 2129-39.
43. Paez, J.G., et al., EGFR mutations in lung cancer: correlation with clinical response to gefitinib therapy. Science, 2004. 304(5676): p. 1497-500.
44. Shinmura, K., et al., EML4-ALK fusion transcripts, but no NPM-, TPM3-, CLTC-, ATIC-, or TFG-ALK fusion transcripts, in non-small cell lung carcinomas. Lung Cancer, 2008. 61(2): p. 163-9.
45. Roskoski, R., Jr., Anaplastic lymphoma kinase (ALK): structure, oncogenic activation, and pharmacological inhibition. Pharmacol Res, 2013. 68(1): p. 68-94.
46. Solomon, B., K.D. Wilner, and A.T. Shaw, Current status of targeted therapy for anaplastic lymphoma kinase-rearranged non-small cell lung cancer. Clin Pharmacol Ther, 2014. 95(1): p. 15-23.
47. Hirsch, F.R., et al., Evaluation of HER-2/neu gene amplification and protein expression in non-small cell lung carcinomas. Br J Cancer, 2002. 86(9): p. 1449-56.
48. Heinmoller, P., et al., HER2 status in non-small cell lung cancer: results from patient screening for enrollment to a phase II study of herceptin. Clin Cancer Res, 2003. 9(14): p. 5238-43.
49. Stephens, P., et al., Lung cancer: intragenic ERBB2 kinase mutations in tumours. Nature, 2004. 431(7008): p. 525-6.
50. Shigematsu, H., et al., Somatic mutations of the HER2 kinase domain in lung adenocarcinomas. Cancer Res, 2005. 65(5): p. 1642-6.

89
51. Naoki, K., et al., Missense mutations of the BRAF gene in human lung adenocarcinoma. Cancer Res, 2002. 62(23): p. 7001-3.
52. Marchetti, A., et al., Clinical features and outcome of patients with non-small-cell lung cancer harboring BRAF mutations. J Clin Oncol, 2011. 29(26): p. 3574-9.
53. Chaft, J.E., et al., Coexistence of PIK3CA and other oncogene mutations in lung adenocarcinoma-rationale for comprehensive mutation profiling. Mol Cancer Ther, 2012. 11(2): p. 485-91.
54. Ding, L., et al., Somatic mutations affect key pathways in lung adenocarcinoma. Nature, 2008. 455(7216): p. 1069-75.
55. Marks, J.L., et al., Novel MEK1 mutation identified by mutational analysis of epidermal growth factor receptor signaling pathway genes in lung adenocarcinoma. Cancer Res, 2008. 68(14): p. 5524-8.
56. Ohashi, K., et al., Characteristics of lung cancers harboring NRAS mutations. Clin Cancer Res, 2013. 19(9): p. 2584-91.
57. Sasaki, H., et al., Nras and Kras mutation in Japanese lung cancer patients: Genotyping analysis using LightCycler. Oncol Rep, 2007. 18(3): p. 623-8.
58. Gainor, J.F. and A.T. Shaw, Novel targets in non-small cell lung cancer: ROS1 and RET fusions. Oncologist, 2013. 18(7): p. 865-75.
59. Govindan, R., et al., Genomic landscape of non-small cell lung cancer in smokers and never-smokers. Cell, 2012. 150(6): p. 1121-34.
60. Lee, W., et al., The mutation spectrum revealed by paired genome sequences from a lung cancer patient. Nature, 2010. 465(7297): p. 473-7.
61. Kris, M.G., et al., Identification of driver mutations in tumor specimens from 1,000 patients with lung adenocarcinoma: The NCI’s Lung Cancer Mutation Consortium (LCMC). J Clin Oncol, 2011. 29(suppl): p. abstr CRA7506.
62. Marks, J.L., et al., Mutational analysis of EGFR and related signaling pathway genes in lung adenocarcinomas identifies a novel somatic kinase domain mutation in FGFR4. PLoS One, 2007. 2(5): p. e426.
63. Drilon, A., et al., Squamous-cell carcinomas of the lung: emerging biology, controversies, and the promise of targeted therapy. Lancet Oncol, 2012. 13(10): p. e418-26.
64. Lauro, S., et al., The use of bevacizumab in non-small cell lung cancer: an update. Anticancer Res, 2014. 34(4): p. 1537-45.
65. Friend, S.H., et al., A human DNA segment with properties of the gene that predisposes to retinoblastoma and osteosarcoma. Nature, 1986. 323(6089): p. 643-6.
66. Dryja, T.P., S. Friend, and R.A. Weinberg, Genetic sequences that predispose to retinoblastoma and osteosarcoma. Symp Fundam Cancer Res, 1986. 39: p. 115-9.
67. Cavenee, W.K., et al., Expression of recessive alleles by chromosomal mechanisms in retinoblastoma. Nature, 1983. 305(5937): p. 779-84.
68. Knudson, A.G., Jr., Mutation and cancer: statistical study of retinoblastoma. Proc Natl Acad Sci U S A, 1971. 68(4): p. 820-3.
69. Sherr, C.J., Cancer cell cycles. Science, 1996. 274(5293): p. 1672-7. 70. Cobrinik, D., Pocket proteins and cell cycle control. Oncogene, 2005. 24(17): p.
2796-809.

90
71. Nevins, J.R., The Rb/E2F pathway and cancer. Hum Mol Genet, 2001. 10(7): p. 699-703.
72. Chittenden, T., D.M. Livingston, and W.G. Kaelin, Jr., The T/E1A-binding domain of the retinoblastoma product can interact selectively with a sequence-specific DNA-binding protein. Cell, 1991. 65(6): p. 1073-82.
73. Bagchi, S., R. Weinmann, and P. Raychaudhuri, The retinoblastoma protein copurifies with E2F-I, an E1A-regulated inhibitor of the transcription factor E2F. Cell, 1991. 65(6): p. 1063-72.
74. Chellappan, S.P., et al., The E2F transcription factor is a cellular target for the RB protein. Cell, 1991. 65(6): p. 1053-61.
75. Rubin, S.M., et al., Structure of the Rb C-terminal domain bound to E2F1-DP1: a mechanism for phosphorylation-induced E2F release. Cell, 2005. 123(6): p. 1093-106.
76. Flemington, E.K., S.H. Speck, and W.G. Kaelin, Jr., E2F-1-mediated transactivation is inhibited by complex formation with the retinoblastoma susceptibility gene product. Proc Natl Acad Sci U S A, 1993. 90(15): p. 6914-8.
77. Helin, K., E. Harlow, and A. Fattaey, Inhibition of E2F-1 transactivation by direct binding of the retinoblastoma protein. Mol Cell Biol, 1993. 13(10): p. 6501-8.
78. Giacinti, C. and A. Giordano, RB and cell cycle progression. Oncogene, 2006. 25(38): p. 5220-7.
79. Macaluso, M., M. Montanari, and A. Giordano, Rb family proteins as modulators of gene expression and new aspects regarding the interaction with chromatin remodeling enzymes. Oncogene, 2006. 25(38): p. 5263-7.
80. Malumbres, M. and M. Barbacid, Cell cycle, CDKs and cancer: a changing paradigm. Nat Rev Cancer, 2009. 9(3): p. 153-66.
81. Slansky, J.E. and P.J. Farnham, Transcriptional regulation of the dihydrofolate reductase gene. Bioessays, 1996. 18(1): p. 55-62.
82. Canepa, E.T., et al., INK4 proteins, a family of mammalian CDK inhibitors with novel biological functions. IUBMB Life, 2007. 59(7): p. 419-26.
83. Nakayama, K., Cip/Kip cyclin-dependent kinase inhibitors: brakes of the cell cycle engine during development. Bioessays, 1998. 20(12): p. 1020-9.
84. Besson, A., S.F. Dowdy, and J.M. Roberts, CDK inhibitors: cell cycle regulators and beyond. Dev Cell, 2008. 14(2): p. 159-69.
85. Lee, M.H. and H.Y. Yang, Negative regulators of cyclin-dependent kinases and their roles in cancers. Cell Mol Life Sci, 2001. 58(12-13): p. 1907-22.
86. Johnson, J.L., et al., Regulation of matrix metalloproteinase genes by E2F transcription factors: Rb-Raf-1 interaction as a novel target for metastatic disease. Cancer Res, 2012. 72(2): p. 516-26.
87. Andrechek, E.R., HER2/Neu tumorigenesis and metastasis is regulated by E2F activator transcription factors. Oncogene, 2013.
88. Hollern, D.P., et al., The E2F transcription factors regulate tumor development and metastasis in a mouse model of metastatic breast cancer. Mol Cell Biol, 2014.
89. Thomassen, M., Q. Tan, and T.A. Kruse, Gene expression meta-analysis identifies metastatic pathways and transcription factors in breast cancer. BMC Cancer, 2008. 8: p. 394.

91
90. Stanelle, J., et al., Gene expression changes in response to E2F1 activation. Nucleic Acids Res, 2002. 30(8): p. 1859-67.
91. Zhang, S.Y., et al., E2F-1 gene transfer enhances invasiveness of human head and neck carcinoma cell lines. Cancer Res, 2000. 60(21): p. 5972-6.
92. Weijts, B.G., et al., E2F7 and E2F8 promote angiogenesis through transcriptional activation of VEGFA in cooperation with HIF1. EMBO J, 2012. 31(19): p. 3871-84.
93. Tashiro, E., et al., Overexpression of cyclin D1 contributes to malignancy by up-regulation of fibroblast growth factor receptor 1 via the pRB/E2F pathway. Cancer Res, 2003. 63(2): p. 424-31.
94. Tashiro, E., et al., Regulation of FGF receptor-2 expression by transcription factor E2F-1. Oncogene, 2003. 22(36): p. 5630-5.
95. Pillai, S., M. Kovacs, and S. Chellappan, Regulation of vascular endothelial growth factor receptors by Rb and E2F1: role of acetylation. Cancer Res, 2010. 70(12): p. 4931-40.
96. Ji, W., W. Zhang, and W. Xiao, E2F-1 directly regulates thrombospondin 1 expression. PLoS One, 2010. 5(10): p. e13442.
97. Schaal, C., S. Pillai, and S.P. Chellappan, The Rb-E2F transcriptional regulatory pathway in tumor angiogenesis and metastasis. Adv Cancer Res, 2014. 121: p. 147-82.
98. Yamasaki, L., et al., Tumor induction and tissue atrophy in mice lacking E2F-1. Cell, 1996. 85(4): p. 537-48.
99. Field, S.J., et al., E2F-1 functions in mice to promote apoptosis and suppress proliferation. Cell, 1996. 85(4): p. 549-61.
100. DeGregori, J., et al., Distinct roles for E2F proteins in cell growth control and apoptosis. Proc Natl Acad Sci U S A, 1997. 94(14): p. 7245-50.
101. Ziebold, U., et al., E2F3 contributes both to the inappropriate proliferation and to the apoptosis arising in Rb mutant embryos. Genes Dev, 2001. 15(4): p. 386-91.
102. Hershko, T. and D. Ginsberg, Up-regulation of Bcl-2 homology 3 (BH3)-only proteins by E2F1 mediates apoptosis. J Biol Chem, 2004. 279(10): p. 8627-34.
103. Croxton, R., et al., Direct repression of the Mcl-1 promoter by E2F1. Oncogene, 2002. 21(9): p. 1359-69.
104. Rodriguez, J.M., et al., Bok, Bcl-2-related Ovarian Killer, Is Cell Cycle-regulated and Sensitizes to Stress-induced Apoptosis. J Biol Chem, 2006. 281(32): p. 22729-35.
105. Vigo, E., et al., CDC25A phosphatase is a target of E2F and is required for efficient E2F-induced S phase. Mol Cell Biol, 1999. 19(9): p. 6379-95.
106. Freeman, S.N., Y. Ma, and W.D. Cress, RhoBTB2 (DBC2) is a mitotic E2F1 target gene with a novel role in apoptosis. J Biol Chem, 2008. 283(4): p. 2353-62.
107. Ma, Y., et al., Identification of novel E2F1-regulated genes by microarray. Arch Biochem Biophys, 2002. 399(2): p. 212-24.
108. Muller, H., et al., E2Fs regulate the expression of genes involved in differentiation, development, proliferation, and apoptosis. Genes Dev, 2001. 15(3): p. 267-85.
109. Johnson, D.G., et al., Expression of transcription factor E2F1 induces quiescent cells to enter S phase. Nature, 1993. 365(6444): p. 349-52.

92
110. Ma, Y., et al., Regulation of the cyclin D3 promoter by E2F1. J Biol Chem, 2003. 278(19): p. 16770-6.
111. Chen, H.Z., S.Y. Tsai, and G. Leone, Emerging roles of E2Fs in cancer: an exit from cell cycle control. Nat Rev Cancer, 2009. 9(11): p. 785-97.
112. Taubert, S., et al., E2F-dependent histone acetylation and recruitment of the Tip60 acetyltransferase complex to chromatin in late G1. Mol Cell Biol, 2004. 24(10): p. 4546-56.
113. Lang, S.E., et al., E2F transcriptional activation requires TRRAP and GCN5 cofactors. J Biol Chem, 2001. 276(35): p. 32627-34.
114. Harbour, J.W. and D.C. Dean, The Rb/E2F pathway: expanding roles and emerging paradigms. Genes Dev, 2000. 14(19): p. 2393-409.
115. Okamoto, A., et al., Mutations in the p16INK4/MTS1/CDKN2, p15INK4B/MTS2, and p18 genes in primary and metastatic lung cancer. Cancer Res, 1995. 55(7): p. 1448-51.
116. Hamada, K., et al., Association of CDKN2A(p16)/CDKN2B(p15) alterations and homozygous chromosome arm 9p deletions in human lung carcinoma. Genes Chromosomes Cancer, 1998. 22(3): p. 232-40.
117. Yatabe, Y., et al., p27KIP1 in human lung cancers: differential changes in small cell and non-small cell carcinomas. Cancer Res, 1998. 58(5): p. 1042-7.
118. Shimizu, T., et al., Absence of a mutation of the p21/WAF1 gene in human lung and pancreatic cancers. Jpn J Cancer Res, 1996. 87(3): p. 275-8.
119. Otterson, G.A., et al., Absence of p16INK4 protein is restricted to the subset of lung cancer lines that retains wildtype RB. Oncogene, 1994. 9(11): p. 3375-8.
120. Yokoi, S., et al., A novel target gene, SKP2, within the 5p13 amplicon that is frequently detected in small cell lung cancers. Am J Pathol, 2002. 161(1): p. 207-16.
121. Modi, S., et al., Protein expression of the RB-related gene family and SV40 large T antigen in mesothelioma and lung cancer. Oncogene, 2000. 19(40): p. 4632-9.
122. Xu, H.J., et al., Absence of retinoblastoma protein expression in primary non-small cell lung carcinomas. Cancer Res, 1991. 51(10): p. 2735-9.
123. Shapiro, G.I., et al., Reciprocal Rb inactivation and p16INK4 expression in primary lung cancers and cell lines. Cancer Res, 1995. 55(3): p. 505-9.
124. Shapiro, G.I., et al., Multiple mechanisms of p16INK4A inactivation in non-small cell lung cancer cell lines. Cancer Res, 1995. 55(24): p. 6200-9.
125. Kelley, M.J., et al., Differential inactivation of CDKN2 and Rb protein in non-small-cell and small-cell lung cancer cell lines. J Natl Cancer Inst, 1995. 87(10): p. 756-61.
126. Salgia, R. and A.T. Skarin, Molecular abnormalities in lung cancer. J Clin Oncol, 1998. 16(3): p. 1207-17.
127. Kratzke, R.A., et al., Rb and p16INK4a expression in resected non-small cell lung tumors. Cancer Res, 1996. 56(15): p. 3415-20.
128. Kawamata, N., C.W. Miller, and H.P. Koeffler, Molecular analysis of a family of cyclin-dependent kinase inhibitor genes (p15/MTS2/INK4b and p18/INK4c) in non-small cell lung cancers. Mol Carcinog, 1995. 14(4): p. 263-8.
129. Rusin, M.R., et al., Intragenic mutations of the p16(INK4), p15(INK4B) and p18 genes in primary non-small-cell lung cancers. Int J Cancer, 1996. 65(6): p. 734-9.

93
130. Catzavelos, C., et al., Reduced expression of the cell cycle inhibitor p27Kip1 in non-small cell lung carcinoma: a prognostic factor independent of Ras. Cancer Res, 1999. 59(3): p. 684-8.
131. Esposito, V., et al., Prognostic role of the cyclin-dependent kinase inhibitor p27 in non-small cell lung cancer. Cancer Res, 1997. 57(16): p. 3381-5.
132. Pateras, I.S., et al., Downregulation of the KIP family members p27(KIP1) and p57(KIP2) by SKP2 and the role of methylation in p57(KIP2) inactivation in nonsmall cell lung cancer. Int J Cancer, 2006. 119(11): p. 2546-56.
133. Zhu, C.Q., et al., Skp2 gene copy number aberrations are common in non-small cell lung carcinoma, and its overexpression in tumors with ras mutation is a poor prognostic marker. Clin Cancer Res, 2004. 10(6): p. 1984-91.
134. Yokoi, S., et al., Amplification and overexpression of SKP2 are associated with metastasis of non-small-cell lung cancers to lymph nodes. Am J Pathol, 2004. 165(1): p. 175-80.
135. Kobatake, T., et al., Aberrant methylation of p57KIP2 gene in lung and breast cancers and malignant mesotheliomas. Oncol Rep, 2004. 12(5): p. 1087-92.
136. Gautschi, O., et al., Cyclin D1 in non-small cell lung cancer: a key driver of malignant transformation. Lung Cancer, 2007. 55(1): p. 1-14.
137. Santarius, T., et al., A census of amplified and overexpressed human cancer genes. Nat Rev Cancer, 2010. 10(1): p. 59-64.
138. Musgrove, E.A., et al., Cyclin D as a therapeutic target in cancer. Nat Rev Cancer, 2011. 11(8): p. 558-72.
139. Li, R., et al., Expression of cyclin D1 splice variants is differentially associated with outcome in non-small cell lung cancer patients. Hum Pathol, 2008. 39(12): p. 1792-801.
140. Puyol, M., et al., A synthetic lethal interaction between K-Ras oncogenes and Cdk4 unveils a therapeutic strategy for non-small cell lung carcinoma. Cancer Cell, 2010. 18(1): p. 63-73.
141. Guha, M., Blockbuster dreams for Pfizer's CDK inhibitor. Nat Biotechnol, 2013. 31(3): p. 187.
142. Flaherty, K.T., et al., Phase I, dose-escalation trial of the oral cyclin-dependent kinase 4/6 inhibitor PD 0332991, administered using a 21-day schedule in patients with advanced cancer. Clin Cancer Res, 2012. 18(2): p. 568-76.
143. Schwartz, G.K., et al., Phase I study of PD 0332991, a cyclin-dependent kinase inhibitor, administered in 3-week cycles (Schedule 2/1). Br J Cancer, 2011. 104(12): p. 1862-8.
144. Ma, Y., et al., A small-molecule E2F inhibitor blocks growth in a melanoma culture model. Cancer Res, 2008. 68(15): p. 6292-9.
145. Ma, Y., W.D. Cress, and E.B. Haura, Flavopiridol-induced apoptosis is mediated through up-regulation of E2F1 and repression of Mcl-1. Mol Cancer Ther, 2003. 2(1): p. 73-81.
146. Ma, Y., S.N. Freeman, and W.D. Cress, E2F4 deficiency promotes drug-induced apoptosis. Cancer Biol Ther, 2004. 3(12): p. 1262-9.
147. Ma, Y. and W.D. Cress, Transcriptional upregulation of p57 (Kip2) by the cyclin-dependent kinase inhibitor BMS-387032 is E2F dependent and serves as a negative feedback loop limiting cytotoxicity. Oncogene, 2007. 26(24): p. 3532-40.

94
148. Chou, T.C. and P. Talalay, Quantitative analysis of dose-effect relationships: the combined effects of multiple drugs or enzyme inhibitors. Adv Enzyme Regul, 1984. 22: p. 27-55.
149. Bliss, C.I., The Toxicity of Poisons Applied Jointly. Annals of Applied Biology, 1939. 26(3): p. 585-615.
150. Hurst, C.D., et al., Inactivation of the Rb pathway and overexpression of both isoforms of E2F3 are obligate events in bladder tumours with 6p22 amplification. Oncogene, 2008. 27(19): p. 2716-27.
151. Welsh, E.A., et al., Iterative rank-order normalization of gene expression microarray data. BMC Bioinformatics, 2013. 14: p. 153.
152. Edgar, R., M. Domrachev, and A.E. Lash, Gene Expression Omnibus: NCBI gene expression and hybridization array data repository. Nucleic Acids Res, 2002. 30(1): p. 207-10.
153. Chen, D.T., et al., Proliferative genes dominate malignancy-risk gene signature in histologically-normal breast tissue. Breast Cancer Res Treat, 2010. 119(2): p. 335-46.
154. Chen, D.T., et al., Prognostic and predictive value of a malignancy-risk gene signature in early-stage non-small cell lung cancer. J Natl Cancer Inst, 2011. 103(24): p. 1859-70.
155. Shedden, K., et al., Gene expression-based survival prediction in lung adenocarcinoma: a multi-site, blinded validation study. Nat Med, 2008. 14(8): p. 822-7.
156. Zhu, C.Q., et al., Prognostic and predictive gene signature for adjuvant chemotherapy in resected non-small-cell lung cancer. J Clin Oncol, 2010. 28(29): p. 4417-24.
157. Hruz, T., et al., RefGenes: identification of reliable and condition specific reference genes for RT-qPCR data normalization. BMC Genomics, 2011. 12: p. 156.
158. Rios-Doria, J., et al., Ectopic expression of histone H2AX mutants reveals a role for its post-translational modifications. Cancer Biol Ther, 2009. 8(5): p. 422-34.
159. Velkova, A., et al., Identification of Filamin A as a BRCA1-interacting protein required for efficient DNA repair. Cell Cycle, 2010. 9(7): p. 1421-33.
160. Sala, A., et al., Correlation between E2F-1 requirement in the S phase and E2F-1 transactivation of cell cycle-related genes in human cells. Cancer Res, 1994. 54(6): p. 1402-6.
161. Yang, X.H. and T.L. Sladek, Overexpression of the E2F-1 transcription factor gene mediates cell transformation. Gene Expr, 1995. 4(4-5): p. 195-204.
162. Bandara, L.R., et al., Functional synergy between DP-1 and E2F-1 in the cell cycle-regulating transcription factor DRTF1/E2F. EMBO J, 1993. 12(11): p. 4317-24.
163. Qin, X.Q., et al., Deregulated transcription factor E2F-1 expression leads to S-phase entry and p53-mediated apoptosis. Proc Natl Acad Sci U S A, 1994. 91(23): p. 10918-22.
164. Lukas, J., et al., Deregulated expression of E2F family members induces S-phase entry and overcomes p16INK4A-mediated growth suppression. Mol Cell Biol, 1996. 16(3): p. 1047-57.

95
165. Powers, J.T., et al., E2F1 uses the ATM signaling pathway to induce p53 and Chk2 phosphorylation and apoptosis. Mol Cancer Res, 2004. 2(4): p. 203-14.
166. Hershko, T., et al., Novel link between E2F and p53: proapoptotic cofactors of p53 are transcriptionally upregulated by E2F. Cell Death Differ, 2005. 12(4): p. 377-83.
167. Russell, J.L., et al., ARF differentially modulates apoptosis induced by E2F1 and Myc. Mol Cell Biol, 2002. 22(5): p. 1360-8.
168. Rogoff, H.A., et al., E2F1 induces phosphorylation of p53 that is coincident with p53 accumulation and apoptosis. Mol Cell Biol, 2002. 22(15): p. 5308-18.
169. Berkovich, E. and D. Ginsberg, ATM is a target for positive regulation by E2F-1. Oncogene, 2003. 22(2): p. 161-7.
170. Rogoff, H.A., et al., Apoptosis associated with deregulated E2F activity is dependent on E2F1 and Atm/Nbs1/Chk2. Mol Cell Biol, 2004. 24(7): p. 2968-77.
171. Chen, D., et al., Apoptosis-stimulating protein of p53-2 (ASPP2/53BP2L) is an E2F target gene. Cell Death Differ, 2005. 12(4): p. 358-68.
172. Fogal, V., et al., ASPP1 and ASPP2 are new transcriptional targets of E2F. Cell Death Differ, 2005. 12(4): p. 369-76.
173. Hsieh, J.K., et al., Novel function of the cyclin A binding site of E2F in regulating p53-induced apoptosis in response to DNA damage. Mol Cell Biol, 2002. 22(1): p. 78-93.
174. Phillips, A.C., et al., E2F-1 potentiates cell death by blocking antiapoptotic signaling pathways. Mol Cell, 1999. 4(5): p. 771-81.
175. Irwin, M., et al., Role for the p53 homologue p73 in E2F-1-induced apoptosis. Nature, 2000. 407(6804): p. 645-8.
176. Lissy, N.A., et al., A common E2F-1 and p73 pathway mediates cell death induced by TCR activation. Nature, 2000. 407(6804): p. 642-5.
177. Stiewe, T. and B.M. Putzer, Role of the p53-homologue p73 in E2F1-induced apoptosis. Nat Genet, 2000. 26(4): p. 464-9.
178. Humbert, P.O., et al., E2f3 is critical for normal cellular proliferation. Genes Dev, 2000. 14(6): p. 690-703.
179. Wu, L., et al., The E2F1-3 transcription factors are essential for cellular proliferation. Nature, 2001. 414(6862): p. 457-62.
180. Leone, G., et al., Myc requires distinct E2F activities to induce S phase and apoptosis. Mol Cell, 2001. 8(1): p. 105-13.
181. Kong, L.J., et al., Compensation and specificity of function within the E2F family. Oncogene, 2007. 26(3): p. 321-7.
182. Leone, G., et al., E2F3 activity is regulated during the cell cycle and is required for the induction of S phase. Genes Dev, 1998. 12(14): p. 2120-30.
183. He, L., et al., Identification of Aurora-A as a direct target of E2F3 during G2/M cell cycle progression. J Biol Chem, 2008. 283(45): p. 31012-20.
184. Zhu, W., P.H. Giangrande, and J.R. Nevins, E2Fs link the control of G1/S and G2/M transcription. EMBO J, 2004. 23(23): p. 4615-26.
185. Hu, Q., et al., Inhibition of CBF/NF-Y mediated transcription activation arrests cells at G2/M phase and suppresses expression of genes activated at G2/M phase of the cell cycle. Nucleic Acids Res, 2006. 34(21): p. 6272-85.

96
186. Leone, G., et al., Identification of a novel E2F3 product suggests a mechanism for determining specificity of repression by Rb proteins. Mol Cell Biol, 2000. 20(10): p. 3626-32.
187. Adams, M.R., et al., Complex transcriptional regulatory mechanisms control expression of the E2F3 locus. Mol Cell Biol, 2000. 20(10): p. 3633-9.
188. He, Y., et al., Identification of E2F-3B, an alternative form of E2F-3 lacking a conserved N-terminal region. Oncogene, 2000. 19(30): p. 3422-33.
189. Chong, J.L., et al., E2f3a and E2f3b contribute to the control of cell proliferation and mouse development. Mol Cell Biol, 2009. 29(2): p. 414-24.
190. Danielian, P.S., et al., E2f3a and E2f3b make overlapping but different contributions to total E2f3 activity. Oncogene, 2008. 27(51): p. 6561-70.
191. Cooper, C.S., et al., Nuclear overexpression of the E2F3 transcription factor in human lung cancer. Lung Cancer, 2006. 54(2): p. 155-62.
192. Matsumura, N., et al., Yin yang 1 modulates taxane response in epithelial ovarian cancer. Mol Cancer Res, 2009. 7(2): p. 210-20.
193. Tordai, A., et al., Evaluation of biological pathways involved in chemotherapy response in breast cancer. Breast Cancer Res, 2008. 10(2): p. R37.
194. Moberg, K., M.A. Starz, and J.A. Lees, E2F-4 switches from p130 to p107 and pRB in response to cell cycle reentry. Mol Cell Biol, 1996. 16(4): p. 1436-49.
195. Sardet, C., et al., E2F-4 and E2F-5, two members of the E2F family, are expressed in the early phases of the cell cycle. Proc Natl Acad Sci U S A, 1995. 92(6): p. 2403-7.
196. Verona, R., et al., E2F activity is regulated by cell cycle-dependent changes in subcellular localization. Mol Cell Biol, 1997. 17(12): p. 7268-82.
197. Gaubatz, S., et al., E2F4 is exported from the nucleus in a CRM1-dependent manner. Mol Cell Biol, 2001. 21(4): p. 1384-92.
198. Humbert, P.O., et al., E2F4 is essential for normal erythrocyte maturation and neonatal viability. Mol Cell, 2000. 6(2): p. 281-91.
199. Merlo, A., et al., 5' CpG island methylation is associated with transcriptional silencing of the tumour suppressor p16/CDKN2/MTS1 in human cancers. Nat Med, 1995. 1(7): p. 686-92.
200. Otterson, G.A., et al., CDKN2 gene silencing in lung cancer by DNA hypermethylation and kinetics of p16INK4 protein induction by 5-aza 2'deoxycytidine. Oncogene, 1995. 11(6): p. 1211-6.
201. Shin, J.Y., et al., Mechanism for inactivation of the KIP family cyclin-dependent kinase inhibitor genes in gastric cancer cells. Cancer Res, 2000. 60(2): p. 262-5.
202. Sato, N., et al., Epigenetic down-regulation of CDKN1C/p57KIP2 in pancreatic ductal neoplasms identified by gene expression profiling. Clin Cancer Res, 2005. 11(13): p. 4681-8.
203. Sedlacek, H.H., Mechanisms of action of flavopiridol. Crit Rev Oncol Hematol, 2001. 38(2): p. 139-70.
204. Fry, D.W., et al., Specific inhibition of cyclin-dependent kinase 4/6 by PD 0332991 and associated antitumor activity in human tumor xenografts. Mol Cancer Ther, 2004. 3(11): p. 1427-38.

97
205. Finn, R.S., et al., PD 0332991, a selective cyclin D kinase 4/6 inhibitor, preferentially inhibits proliferation of luminal estrogen receptor-positive human breast cancer cell lines in vitro. Breast Cancer Res, 2009. 11(5): p. R77.
206. Michaud, K., et al., Pharmacologic inhibition of cyclin-dependent kinases 4 and 6 arrests the growth of glioblastoma multiforme intracranial xenografts. Cancer Res, 2010. 70(8): p. 3228-38.
207. Dean, J.L., et al., Therapeutic CDK4/6 inhibition in breast cancer: key mechanisms of response and failure. Oncogene, 2010. 29(28): p. 4018-32.
208. Konecny, G.E., et al., Expression of p16 and retinoblastoma determines response to CDK4/6 inhibition in ovarian cancer. Clin Cancer Res, 2011. 17(6): p. 1591-602.
209. Cen, L., et al., p16-Cdk4-Rb axis controls sensitivity to a cyclin-dependent kinase inhibitor PD0332991 in glioblastoma xenograft cells. Neuro Oncol, 2012. 14(7): p. 870-81.
210. Dean, J.L., et al., Therapeutic response to CDK4/6 inhibition in breast cancer defined by ex vivo analyses of human tumors. Cell Cycle, 2012. 11(14): p. 2756-61.
211. Witkiewicz, A.K., D. Cox, and E.S. Knudsen, CDK4/6 inhibition provides a potent adjunct to Her2-targeted therapies in preclinical breast cancer models. Genes Cancer, 2014. 5(7-8): p. 261-72.
212. Porlan, E., et al., Transcriptional repression of Bmp2 by p21(Waf1/Cip1) links quiescence to neural stem cell maintenance. Nat Neurosci, 2013. 16(11): p. 1567-75.
213. Zheng, Y., et al., Arf induction by Tgfbeta is influenced by Sp1 and C/ebpbeta in opposing directions. PLoS One, 2013. 8(8): p. e70371.
214. Conklin, J.F., J. Baker, and J. Sage, The RB family is required for the self-renewal and survival of human embryonic stem cells. Nat Commun, 2012. 3: p. 1244.
215. Sangwan, M., et al., Established and new mouse models reveal E2f1 and Cdk2 dependency of retinoblastoma, and expose effective strategies to block tumor initiation. Oncogene, 2012. 31(48): p. 5019-28.
216. Dickson, M.A., et al., Phase II trial of the CDK4 inhibitor PD0332991 in patients with advanced CDK4-amplified well-differentiated or dedifferentiated liposarcoma. J Clin Oncol, 2013. 31(16): p. 2024-8.
217. Leonard, J.P., et al., Selective CDK4/6 inhibition with tumor responses by PD0332991 in patients with mantle cell lymphoma. Blood, 2012. 119(20): p. 4597-607.
218. Kurtyka, C.A., L. Chen, and W.D. Cress, E2F inhibition synergizes with paclitaxel in lung cancer cell lines. PLoS One, 2014. 9(5): p. e96357.
219. Hanahan, D. and R.A. Weinberg, Hallmarks of cancer: the next generation. Cell, 2011. 144(5): p. 646-74.
220. Rosell, R., et al., Predicting response to chemotherapy with early-stage lung cancer. Cancer J, 2011. 17(1): p. 49-56.
221. Le Chevalier, T., Adjuvant chemotherapy for resectable non-small-cell lung cancer: where is it going? Ann Oncol, 2010. 21 Suppl 7: p. vii196-8.

98
222. Gadgeel, S.M. and G. Bepler, Prognostic and predictive markers for personalized adjuvant therapy for non-small-cell lung cancer patients. Future Oncol, 2013. 9(12): p. 1909-21.
223. Sangha, R., J. Price, and C.A. Butts, Adjuvant therapy in non-small cell lung cancer: current and future directions. Oncologist, 2010. 15(8): p. 862-72.
224. Gerdes, J., et al., Production of a mouse monoclonal antibody reactive with a human nuclear antigen associated with cell proliferation. Int J Cancer, 1983. 31(1): p. 13-20.
225. Gerdes, J., et al., Cell cycle analysis of a cell proliferation-associated human nuclear antigen defined by the monoclonal antibody Ki-67. J Immunol, 1984. 133(4): p. 1710-5.
226. Scholzen, T. and J. Gerdes, The Ki-67 protein: from the known and the unknown. J Cell Physiol, 2000. 182(3): p. 311-22.
227. du Manoir, S., et al., Ki-67 labeling in postmitotic cells defines different Ki-67 pathways within the 2c compartment. Cytometry, 1991. 12(5): p. 455-63.
228. Bruno, S. and Z. Darzynkiewicz, Cell cycle dependent expression and stability of the nuclear protein detected by Ki-67 antibody in HL-60 cells. Cell Prolif, 1992. 25(1): p. 31-40.
229. Braun, N., T. Papadopoulos, and H.K. Muller-Hermelink, Cell cycle dependent distribution of the proliferation-associated Ki-67 antigen in human embryonic lung cells. Virchows Arch B Cell Pathol Incl Mol Pathol, 1988. 56(1): p. 25-33.
230. Verheijen, R., et al., Ki-67 detects a nuclear matrix-associated proliferation-related antigen. II. Localization in mitotic cells and association with chromosomes. J Cell Sci, 1989. 92 ( Pt 4): p. 531-40.
231. Starborg, M., et al., The murine Ki-67 cell proliferation antigen accumulates in the nucleolar and heterochromatic regions of interphase cells and at the periphery of the mitotic chromosomes in a process essential for cell cycle progression. J Cell Sci, 1996. 109 ( Pt 1): p. 143-53.
232. Cattoretti, G., et al., Monoclonal antibodies against recombinant parts of the Ki-67 antigen (MIB 1 and MIB 3) detect proliferating cells in microwave-processed formalin-fixed paraffin sections. J Pathol, 1992. 168(4): p. 357-63.
233. Scagliotti, G.V., et al., Prognostic significance of Ki67 labelling in resected non small cell lung cancer. Eur J Cancer, 1993. 29A(3): p. 363-5.
234. Nguyen, V.N., et al., Expression of cyclin D1, Ki-67 and PCNA in non-small cell lung cancer: prognostic significance and comparison with p53 and bcl-2. Acta Histochem, 2000. 102(3): p. 323-38.
235. Mehdi, S.A., et al., Prognostic significance of Ki-67 immunostaining and symptoms in resected stage I and II non-small cell lung cancer. Lung Cancer, 1998. 20(2): p. 99-108.
236. Mitra, R., et al., Prediction of postoperative recurrence-free survival in non-small cell lung cancer by using an internationally validated gene expression model. Clin Cancer Res, 2011. 17(9): p. 2934-46.
237. Tang, H., et al., A 12-gene set predicts survival benefits from adjuvant chemotherapy in non-small cell lung cancer patients. Clin Cancer Res, 2013. 19(6): p. 1577-86.

99
238. Wistuba, II, et al., Validation of a proliferation-based expression signature as prognostic marker in early stage lung adenocarcinoma. Clin Cancer Res, 2013. 19(22): p. 6261-71.
239. Endoh, H., et al., Prognostic model of pulmonary adenocarcinoma by expression profiling of eight genes as determined by quantitative real-time reverse transcriptase polymerase chain reaction. J Clin Oncol, 2004. 22(5): p. 811-9.
240. Hou, J., et al., Gene expression-based classification of non-small cell lung carcinomas and survival prediction. PLoS One, 2010. 5(4): p. e10312.
241. Kratz, J.R., et al., A prognostic assay to identify patients at high risk of mortality despite small, node-negative lung tumors. JAMA, 2012. 308(16): p. 1629-31.
242. Kratz, J.R., et al., A practical molecular assay to predict survival in resected non-squamous, non-small-cell lung cancer: development and international validation studies. Lancet, 2012. 379(9818): p. 823-32.
243. Xie, Y., et al., Robust gene expression signature from formalin-fixed paraffin-embedded samples predicts prognosis of non-small-cell lung cancer patients. Clin Cancer Res, 2011. 17(17): p. 5705-14.
244. Subramanian, J. and R. Simon, What should physicians look for in evaluating prognostic gene-expression signatures? Nat Rev Clin Oncol, 2010. 7(6): p. 327-34.
245. Xie, Y. and J.D. Minna, Non-small-cell lung cancer mRNA expression signature predicting response to adjuvant chemotherapy. J Clin Oncol, 2010. 28(29): p. 4404-7.
246. Subramanian, J. and R. Simon, Gene expression-based prognostic signatures in lung cancer: ready for clinical use? J Natl Cancer Inst, 2010. 102(7): p. 464-74.
247. Gazdar, A.F. and J.H. Schiller, Predictive and prognostic factors for non-small cell lung cancer--potholes in the road to the promised land. J Natl Cancer Inst, 2011. 103(24): p. 1810-1.
248. Shao, W., D. Wang, and J. He, The role of gene expression profiling in early-stage non-small cell lung cancer. J Thorac Dis, 2010. 2(2): p. 89-99.
249. Fortina, P. and S. Surrey, Digital mRNA profiling. Nat Biotechnol, 2008. 26(3): p. 293-4.
250. Geiss, G.K., et al., Direct multiplexed measurement of gene expression with color-coded probe pairs. Nat Biotechnol, 2008. 26(3): p. 317-25.
251. Nielsen, T., et al., Analytical validation of the PAM50-based Prosigna Breast Cancer Prognostic Gene Signature Assay and nCounter Analysis System using formalin-fixed paraffin-embedded breast tumor specimens. BMC Cancer, 2014. 14: p. 177.
252. NanoString Technologies, I., NanoString Technologies Receives FDA 510(k) Clearance for Prosigna™ Breast Cancer Prognostic Gene Signature Assay. 2013, NanoString Technologies, Inc.: Seattle, WA.
253. NanoString Technologies, I., NanoString Technologies Announces Adoption of the Prosigna Breast Cancer Assay by Leading US Clinical Laboratories and Cancer Centers. 2013, NanoString Technologies, Inc: Seattle, WA.
254. Gnant, M., et al., Predicting distant recurrence in receptor-positive breast cancer patients with limited clinicopathological risk: using the PAM50 Risk of Recurrence

100
score in 1478 postmenopausal patients of the ABCSG-8 trial treated with adjuvant endocrine therapy alone. Ann Oncol, 2014. 25(2): p. 339-45.
255. Reis, P.P., et al., mRNA transcript quantification in archival samples using multiplexed, color-coded probes. BMC Biotechnol, 2011. 11: p. 46.
256. Norton, N., et al., Gene expression, single nucleotide variant and fusion transcript discovery in archival material from breast tumors. PLoS One, 2013. 8(11): p. e81925.
257. NanoString Technologies, I., Prosigna™ Breast Cancer Prognostic Gene Signature Assay (Package Insert). . 2013, NanoString Technologies, Inc.: Seattle, WA.
258. Cheung-Ong, K., G. Giaever, and C. Nislow, DNA-damaging agents in cancer chemotherapy: serendipity and chemical biology. Chem Biol, 2013. 20(5): p. 648-59.
259. Fricker, S.P., Metal based drugs: from serendipity to design. Dalton Trans, 2007(43): p. 4903-17.
260. Schiller, J.H., et al., Comparison of four chemotherapy regimens for advanced non-small-cell lung cancer. N Engl J Med, 2002. 346(2): p. 92-8.
261. Hotta, K., et al., Meta-analysis of randomized clinical trials comparing Cisplatin to Carboplatin in patients with advanced non-small-cell lung cancer. J Clin Oncol, 2004. 22(19): p. 3852-9.
262. Ardizzoni, A., et al., Cisplatin- versus carboplatin-based chemotherapy in first-line treatment of advanced non-small-cell lung cancer: an individual patient data meta-analysis. J Natl Cancer Inst, 2007. 99(11): p. 847-57.
263. Jiang, J., et al., A meta-analysis of randomized controlled trials comparing carboplatin-based to cisplatin-based chemotherapy in advanced non-small cell lung cancer. Lung Cancer, 2007. 57(3): p. 348-58.
264. Rajeswaran, A., et al., Efficacy and side effects of cisplatin- and carboplatin-based doublet chemotherapeutic regimens versus non-platinum-based doublet chemotherapeutic regimens as first line treatment of metastatic non-small cell lung carcinoma: a systematic review of randomized controlled trials. Lung Cancer, 2008. 59(1): p. 1-11.
265. You, Z., et al., ATM activation and its recruitment to damaged DNA require binding to the C terminus of Nbs1. Mol Cell Biol, 2005. 25(13): p. 5363-79.
266. Cariveau, M.J., et al., Characterization of an NBS1 C-terminal peptide that can inhibit ataxia telangiectasia mutated (ATM)-mediated DNA damage responses and enhance radiosensitivity. Mol Pharmacol, 2007. 72(2): p. 320-6.
267. Lee, J.H., et al., 53BP1 promotes ATM activity through direct interactions with the MRN complex. EMBO J, 2010. 29(3): p. 574-85.
268. Matsuoka, S., M. Huang, and S.J. Elledge, Linkage of ATM to cell cycle regulation by the Chk2 protein kinase. Science, 1998. 282(5395): p. 1893-7.
269. Chaturvedi, P., et al., Mammalian Chk2 is a downstream effector of the ATM-dependent DNA damage checkpoint pathway. Oncogene, 1999. 18(28): p. 4047-54.
270. Xiao, Z., et al., Chk1 mediates S and G2 arrests through Cdc25A degradation in response to DNA-damaging agents. J Biol Chem, 2003. 278(24): p. 21767-73.

101
271. Sanchez, Y., et al., Conservation of the Chk1 checkpoint pathway in mammals: linkage of DNA damage to Cdk regulation through Cdc25. Science, 1997. 277(5331): p. 1497-501.
272. Liu, Q., et al., Chk1 is an essential kinase that is regulated by Atr and required for the G(2)/M DNA damage checkpoint. Genes Dev, 2000. 14(12): p. 1448-59.
273. Westphal, C.H., et al., atm and p53 cooperate in apoptosis and suppression of tumorigenesis, but not in resistance to acute radiation toxicity. Nat Genet, 1997. 16(4): p. 397-401.
274. Westphal, C.H., et al., Genetic interactions between atm and p53 influence cellular proliferation and irradiation-induced cell cycle checkpoints. Cancer Res, 1997. 57(9): p. 1664-7.
275. Lakin, N.D., B.C. Hann, and S.P. Jackson, The ataxia-telangiectasia related protein ATR mediates DNA-dependent phosphorylation of p53. Oncogene, 1999. 18(27): p. 3989-95.
276. Woods, N.T., et al., Charting the landscape of tandem BRCT domain-mediated protein interactions. Sci Signal, 2012. 5(242): p. rs6.
277. Malumbres, M. and M. Barbacid, Mammalian cyclin-dependent kinases. Trends Biochem Sci, 2005. 30(11): p. 630-41.
278. Tsai, L.H., et al., Activity and expression pattern of cyclin-dependent kinase 5 in the embryonic mouse nervous system. Development, 1993. 119(4): p. 1029-40.
279. Hisanaga, S. and R. Endo, Regulation and role of cyclin-dependent kinase activity in neuronal survival and death. J Neurochem, 2010. 115(6): p. 1309-21.
280. Lopes, J.P. and P. Agostinho, Cdk5: multitasking between physiological and pathological conditions. Prog Neurobiol, 2011. 94(1): p. 49-63.
281. Cheung, Z.H. and N.Y. Ip, The roles of cyclin-dependent kinase 5 in dendrite and synapse development. Biotechnol J, 2007. 2(8): p. 949-57.
282. Tian, B., Q. Yang, and Z. Mao, Phosphorylation of ATM by Cdk5 mediates DNA damage signalling and regulates neuronal death. Nat Cell Biol, 2009. 11(2): p. 211-8.
283. Marshall, N.F. and D.H. Price, Purification of P-TEFb, a transcription factor required for the transition into productive elongation. J Biol Chem, 1995. 270(21): p. 12335-8.
284. Marshall, N.F., et al., Control of RNA polymerase II elongation potential by a novel carboxyl-terminal domain kinase. J Biol Chem, 1996. 271(43): p. 27176-83.
285. Peng, J., N.F. Marshall, and D.H. Price, Identification of a cyclin subunit required for the function of Drosophila P-TEFb. J Biol Chem, 1998. 273(22): p. 13855-60.
286. Peng, J., et al., Identification of multiple cyclin subunits of human P-TEFb. Genes Dev, 1998. 12(5): p. 755-62.
287. Fu, T.J., et al., Cyclin K functions as a CDK9 regulatory subunit and participates in RNA polymerase II transcription. J Biol Chem, 1999. 274(49): p. 34527-30.
288. Napolitano, G., et al., Transcriptional activity of positive transcription elongation factor b kinase in vivo requires the C-terminal domain of RNA polymerase II. Gene, 2000. 254(1-2): p. 139-45.
289. Yu, D.S., et al., Cyclin-dependent kinase 9-cyclin K functions in the replication stress response. EMBO Rep, 2010. 11(11): p. 876-82.

102
290. Fang, L., et al., ATM regulates NF-kappaB-dependent immediate-early genes via RelA Ser 276 phosphorylation coupled to CDK9 promoter recruitment. Nucleic Acids Res, 2014. 42(13): p. 8416-32.
291. Blazek, D., et al., The Cyclin K/Cdk12 complex maintains genomic stability via regulation of expression of DNA damage response genes. Genes Dev, 2011. 25(20): p. 2158-72.
292. Cheng, S.W., et al., Interaction of cyclin-dependent kinase 12/CrkRS with cyclin K1 is required for the phosphorylation of the C-terminal domain of RNA polymerase II. Mol Cell Biol, 2012. 32(22): p. 4691-704.
293. Chen, H.H., Y.C. Wang, and M.J. Fann, Identification and characterization of the CDK12/cyclin L1 complex involved in alternative splicing regulation. Mol Cell Biol, 2006. 26(7): p. 2736-45.
294. Chen, H.H., et al., CDK13/CDC2L5 interacts with L-type cyclins and regulates alternative splicing. Biochem Biophys Res Commun, 2007. 354(3): p. 735-40.
295. Even, Y., et al., CDC2L5, a Cdk-like kinase with RS domain, interacts with the ASF/SF2-associated protein p32 and affects splicing in vivo. J Cell Biochem, 2006. 99(3): p. 890-904.
296. Besset, V., K. Rhee, and D.J. Wolgemuth, The cellular distribution and kinase activity of the Cdk family member Pctaire1 in the adult mouse brain and testis suggest functions in differentiation. Cell Growth Differ, 1999. 10(3): p. 173-81.
297. Mokalled, M.H., et al., Myocardin-related transcription factors regulate the Cdk5/Pctaire1 kinase cascade to control neurite outgrowth, neuronal migration and brain development. Development, 2010. 137(14): p. 2365-74.
298. Cheng, K., et al., Pctaire1 interacts with p35 and is a novel substrate for Cdk5/p35. J Biol Chem, 2002. 277(35): p. 31988-93.
299. Fu, W.Y., et al., Cyclin-dependent kinase 5-dependent phosphorylation of Pctaire1 regulates dendrite development. Neuroscience, 2011. 180: p. 353-9.
300. Integrated genomic analyses of ovarian carcinoma. Nature, 2011. 474(7353): p. 609-15.
301. Carter, S.L., et al., Absolute quantification of somatic DNA alterations in human cancer. Nat Biotechnol, 2012. 30(5): p. 413-21.
302. Joshi, P.M., et al., Ovarian cancer-associated mutations disable catalytic activity of CDK12, a kinase that promotes homologous recombination repair and resistance to cisplatin and poly(ADP-ribose) polymerase inhibitors. J Biol Chem, 2014. 289(13): p. 9247-53.
303. Bajrami, I., et al., Genome-wide profiling of genetic synthetic lethality identifies CDK12 as a novel determinant of PARP1/2 inhibitor sensitivity. Cancer Res, 2014. 74(1): p. 287-97.
304. Natrajan, R., et al., Characterization of the genomic features and expressed fusion genes in micropapillary carcinomas of the breast. J Pathol, 2014. 232(5): p. 553-65.
305. Bosken, C.A., et al., The structure and substrate specificity of human Cdk12/Cyclin K. Nat Commun, 2014. 5: p. 3505.
306. Andegeko, Y., et al., Nuclear retention of ATM at sites of DNA double strand breaks. J Biol Chem, 2001. 276(41): p. 38224-30.

103
307. Bible, K.C. and S.H. Kaufmann, Cytotoxic synergy between flavopiridol (NSC 649890, L86-8275) and various antineoplastic agents: the importance of sequence of administration. Cancer Res, 1997. 57(16): p. 3375-80.
308. Feber, A., et al., Amplification and overexpression of E2F3 in human bladder cancer. Oncogene, 2004. 23(8): p. 1627-30.
309. Oeggerli, M., et al., E2F3 amplification and overexpression is associated with invasive tumor growth and rapid tumor cell proliferation in urinary bladder cancer. Oncogene, 2004. 23(33): p. 5616-23.
310. Foster, C.S., et al., Transcription factor E2F3 overexpressed in prostate cancer independently predicts clinical outcome. Oncogene, 2004. 23(35): p. 5871-9.
311. Oeggerli, M., et al., E2F3 is the main target gene of the 6p22 amplicon with high specificity for human bladder cancer. Oncogene, 2006. 25(49): p. 6538-43.
312. Welch, C., Y. Chen, and R.L. Stallings, MicroRNA-34a functions as a potential tumor suppressor by inducing apoptosis in neuroblastoma cells. Oncogene, 2007. 26(34): p. 5017-22.
313. Olsson, A.Y., et al., Role of E2F3 expression in modulating cellular proliferation rate in human bladder and prostate cancer cells. Oncogene, 2007. 26(7): p. 1028-37.
314. Reimer, D., et al., Regulation of transcription factor E2F3a and its clinical relevance in ovarian cancer. Oncogene, 2011. 30(38): p. 4038-49.
315. Chou, Y.T., et al., CITED2 functions as a molecular switch of cytokine-induced proliferation and quiescence. Cell Death Differ, 2012. 19(12): p. 2015-28.
316. Zeng, X., et al., Upregulation of E2F transcription factor 3 is associated with poor prognosis in hepatocellular carcinoma. Oncol Rep, 2014. 31(3): p. 1139-46.
317. Veltman, J.A., et al., Array-based comparative genomic hybridization for genome-wide screening of DNA copy number in bladder tumors. Cancer Res, 2003. 63(11): p. 2872-80.
318. Bellmunt, J. and S. Albiol, Chemotherapy for metastatic or unresectable bladder cancer. Semin Oncol, 2007. 34(2): p. 135-44.
319. LCBRN, Lung Cancer Biospecimen Resource Network Home. Rectors and Visitors of the University of Virginia, 2012.
320. Felip, E., et al., Preoperative chemotherapy plus surgery versus surgery plus adjuvant chemotherapy versus surgery alone in early-stage non-small-cell lung cancer. J Clin Oncol, 2010. 28(19): p. 3138-45.
321. Russo, A.J., et al., E2F-1 overexpression in U2OS cells increases cyclin B1 levels and cdc2 kinase activity and sensitizes cells to antimitotic agents. Cancer Res, 2006. 66(14): p. 7253-60.
322. Giovannetti, E., et al., Molecular mechanisms underlying the synergistic interaction of erlotinib, an epidermal growth factor receptor tyrosine kinase inhibitor, with the multitargeted antifolate pemetrexed in non-small-cell lung cancer cells. Mol Pharmacol, 2008. 73(4): p. 1290-300.
323. Kohoutek, J. and D. Blazek, Cyclin K goes with Cdk12 and Cdk13. Cell Div, 2012. 7: p. 12.
324. Berge, E.M. and R.C. Doebele, Targeted therapies in non-small cell lung cancer: emerging oncogene targets following the success of epidermal growth factor receptor. Semin Oncol, 2014. 41(1): p. 110-25.

104
325. Slamon, D.J., et al., Human breast cancer: correlation of relapse and survival with amplification of the HER-2/neu oncogene. Science, 1987. 235(4785): p. 177-82.
326. Bartlett, J.M., et al., Evaluating HER2 amplification and overexpression in breast cancer. J Pathol, 2001. 195(4): p. 422-8.
327. Owens, M.A., B.C. Horten, and M.M. Da Silva, HER2 amplification ratios by fluorescence in situ hybridization and correlation with immunohistochemistry in a cohort of 6556 breast cancer tissues. Clin Breast Cancer, 2004. 5(1): p. 63-9.
328. Sauter, G., et al., Guidelines for human epidermal growth factor receptor 2 testing: biologic and methodologic considerations. J Clin Oncol, 2009. 27(8): p. 1323-33.
329. Sircoulomb, F., et al., Genome profiling of ERBB2-amplified breast cancers. BMC Cancer, 2010. 10: p. 539.
330. Teng, P.-N., et al., Inhibition of ATR, but not ATM, sensitizes gynecologic cancer cells to cisplatin American Association for Cancer Research (AACR) Annual Meeting, 2014.
331. Bateman, N., et al., Pharmacological inhibition of the DNA damage response kinases, ATR (Ataxia telangiectasia and Rad3 related) and ATM (Ataxia telangiectasia mutated), broadly sensitizes diverse subtypes of gynecological cancer cells to ionizing radiation. American Association for Cancer Research (AACR) Annual Meeting, 2014.

105
APPENDICES

106
Appendix A: Institutional Animal Care Use Committee (IACUC) Approval Letter