Embed Size (px)
Citation preview
Novel, High Activity Hydroprocessing Catalysts:
Iron Group Phosphides
Xianqin Wang
Dissertation submitted to the Virginia Polytechnic Institute and State University in partial
fulfillment of the requirements for the degree of
Doctor of Philosophy
in
Chemical Engineering
S. Ted Oyama, Chairman
David F. Cox
Ravi F. Saraf
Brian E. Hanson
Paul A. Deck
March 21, 2002
Blacksburg, Virginia
Keywords: Iron group phosphide, Phosphorus effect, Structure-sensitivity, EXAFS,
Hydrodesulfurization, Hydrodenitrogenation, Hydrodenitrogenation mechanism.
i
Novel, High Activity Hydroprocessing Catalysts:
Iron Group Phosphides
by
Xianqin Wang
Committee Chairman: S Ted Oyama
Chemical Engineering
Abstract
A series of iron, cobalt and nickel transition metal phosphides was synthesized by
means of temperature-programmed reduction (TPR) of the corresponding phosphates. The
same materials, Fe2P, CoP and Ni2P, were also prepared on a silica (SiO2) support. The
phase purity of these catalysts was established by x-ray diffraction (XRD), and the surface
properties were determined by N2 BET specific surface area (Sg) measurements and CO
chemisorption. The activities of the silica-supported catalysts were tested in a three-phase
trickle bed reactor for the simultaneous hydrodenitrogenation (HDN) of quinoline and
hydrodesulfurization (HDS) of dibenzothiophene using a model liquid feed at realistic
conditions (30 atm, 370 oC). The reactivity studies showed that the nickel phosphide
(Ni2P/SiO2) was the most active of the catalysts. Compared with a commercial Ni-Mo-S/γ-
Al2O3 catalyst at the same conditions, Ni2P/silica had a substantially higher HDS activity
(100 % vs. 76 %) and HDN activity (82 % vs. 38 %).
Because of their good hydrotreating activity, an extensive study of the preparation
of silica supported nickel phosphides, Ni2P/SiO2, was carried out. The parameters
investigated were the phosphorus content and the weight loading of the active phase. The
ii
most active composition was found to have a starting synthesis Ni/P ratio close to 1/2, and
the best loading of this sample on silica was observed to be 18 wt.%.
Extended x-ray absorption fine structure (EXAFS) and x-ray absorption near edge
spectroscopy (XANES) measurements were employed to determine the structures of the
supported samples. The main phase before and after reaction was found to be Ni2P, but
some sulfur was found to be retained after reaction.
A comprehensive scrutiny of the HDN reaction mechanism was also made over the
Ni2P/SiO2 sample (Ni/P = 1/2) by comparing the HDN activity of a series of piperidine
derivatives of different structure. It was found that piperidine adsorption involved an α-H
activation and nitrogen removal proceeded mainly by means of a β-H activation though an
elimination (E2) mechanism. The relative elimination rates depended on the type and
number of β-hydrogen atoms. Elimination of β-H atoms attached to tertiary carbon atoms
occurred faster than those attached to secondary carbon atoms. Also, the greater the
number of the β-H atoms, the higher the elimination rates. The nature of the adsorbed
intermediates was probed by Fourier transform infrared spectroscopy (FTIR) and
temperature-programmed desorption (TPD) of the probe molecule, ethylamine. This
measurement allowed the determination of the likely steps in the hydrodenitrogenation
reaction.

iii
Acknowledgements
I would like to thank my parents, Zhaolan and Yongxiang, my brothers and sisters,
Xianyi, Xianlian, Xianzi, Xianqun and Xianqiao, and my husband Jiangbo Dang, for their
love and support.
I would like to express my sincere gratitude to my advisor, Professor S. Ted Oyama
for his wise and patient supervision, and his endeavor in teaching me how to think and how
to work. I will always respect his hard work and enormous knowledge.
I would like to thank my committee members, Professors David F. Cox, Ravi F.
Saraf, Brian E. Hanson and Paul A. Deck for their time and guidance.
I would like to thank Dr. Felix Requejo for his collaboration with the EXAFS
experimental and analysis.
I also would like to thank past and current group members, Mark Abee, Juan Jose
Bravo, Chad Byrd, Paul Clark, Doohwan Lee, Yongkul Lee, Wei Li, Rakesh
Radhakrishnan, Corey Reed, Viviane Schwarz, Todd St. Clair, and Wangjae Chun, for
their support and companionship. I especially appreciate the close cooperation with Paul
Clark and Yongkul Lee.

iv
Table of Contents Chapter 1. Introduction
1.1. Motivation 1
1.2. Introduction to iron group phosphides 1
1.3. Organization of thesis 3
Chapter 2. Synthesis, Characterization and Hydrotreating Activity of Several Iron Group
Transition Metal Phosphides
2.1. Introduction 8
2.2. Experimental
2.2.1. Materials 10
2.2.2. Synthesis 12
2.2.3. Characterization 13
2.2.4. Reactivity Study 14
2.3. Results and Discussion
2.3.1. Properties and preparation of bulk phosphdies 15
2.3.2. Properties and preparation of supported phosphides 25
2.3.3. Catalytic activity in hydroprocessing 32
2.4. Conclusions 40
Chapter 3. XAFS Studies of the Effect of Phosphorus Content in Nickel Phosphide
Catalysts
3.1. Introduction 44

v
3.2. Experimental
3.2.1. Synthesis 45
3.2.2. Characterization 48
3.2.3. Reactivity Study 49
3.3. Results and Discussion 51
3.4. Conclusions 69
Chapter 4. Active phase of Ni2P/SiO2 in Hydroprocessing Reactions
4.1. Introduction 74
4.2. Experimental
4.2.1. Synthesis and characterization of catalysts 74
4.2.2. Reactivity studies 77
4.3. Results and discussion 78
4.4. Conclusions 97
Chapter 5. Mechanism
5.1. Introduction 99
5.2. Experimental
5.2.1. Materials 101
5.2.2. Synthesis of catalyst 102
5.2.3. Characterization 102
5.2.4. Reactivity study 104
5.3. Results
5.3.1. Properties of the catalyst 105
5.3.2. Reactivity of piperidines 108
vi
5.3.3. Ethylamine FT-IR spectra 112
5.3.4. Ethylamine TPD result 116
5.4. Discussions
5.4.1. Review of reaction mechanisms for piperidine hydrodenitrogenation
117
5.4.2. Test of mechanism types 123
5.4.3. Characterization of the catalyst 124
5.4.4. Reactivity 127
5.5. Conclusions 134
Chapter 6. Conclusions 139

vii
List of Tables
Table 1.1. Unit cell and space group data of iron group phosphides 2
Table 2.1. Quantities used in the preparation of supported samples 12
Table 2.2. Surface metal density and bulk density of Fe2P, CoP and Ni2P 16
Table 2.3. Characterization results of samples 27
Table 2.4. Apparent activation energy (Ea) of synthesis of the supported catalysts
30
Table 2.5. Product distribution in hydroprocessing 33
Table 2.6. Rates of HDS and HDN of the supported catalysts 34
Table 2.7. XPS results for supported nickel samples 39
Table 3.1. Quantities used in the preparation of the samples 46
Table 3.2. Catalyst characterization results 55
Table 4.1. Quantities used in the preparation of the samples 75
Table 4.2. Characterization results of samples 82
Table 4.3. Product distribution in hydroprocessing 87
Table 4.4. Summary of structural parameters used in FEFF simulation. 95
Table 5.1. Characteristics of Ni2P/SiO2. 107
Table 5.2. Analysis of experimental results 128

viii
List of Figures
Figure 1.1. Crystal structures of several iron group phosphides 3
Figure 2.1. Crystal structures of Fe2P, CoP and Ni2P 16
Figure 2.2. Temperature-programmed reduction of bulk iron phosphates at β= 1 K/min
(0.01667 K s-1) (Fe to P ratios used in the preparation are indicated) 18
Figure 2.3. X-ray diffraction patterns of iron phosphides (PDF file references are also
included) 20
Figure 2.4. Temperature-programmed reduction of bulk cobalt phosphates at β= 1 K/min
(0.01667 K s-1) (Co to P ratios used in the preparation are indicated) 21
Figure 2.5. X-ray diffraction patterns of reduced cobalt phosphates (PDF file references
are also included) 22
Figure 2.6. Temperature-programmed reduction of bulk nickel phosphates at β= 1 K/min
(0.01667 K s-1) (Ni to P ratios used in the preparation are indicated) 23
Figure 2.7. X-ray diffraction patterns of reduced nickel phosphates (PDF file references
are also included) 24
Figure 2.8. TPR comparison of supported and unsupported catalysts at β= 1 K/min
(0.01667 K s-1) 26
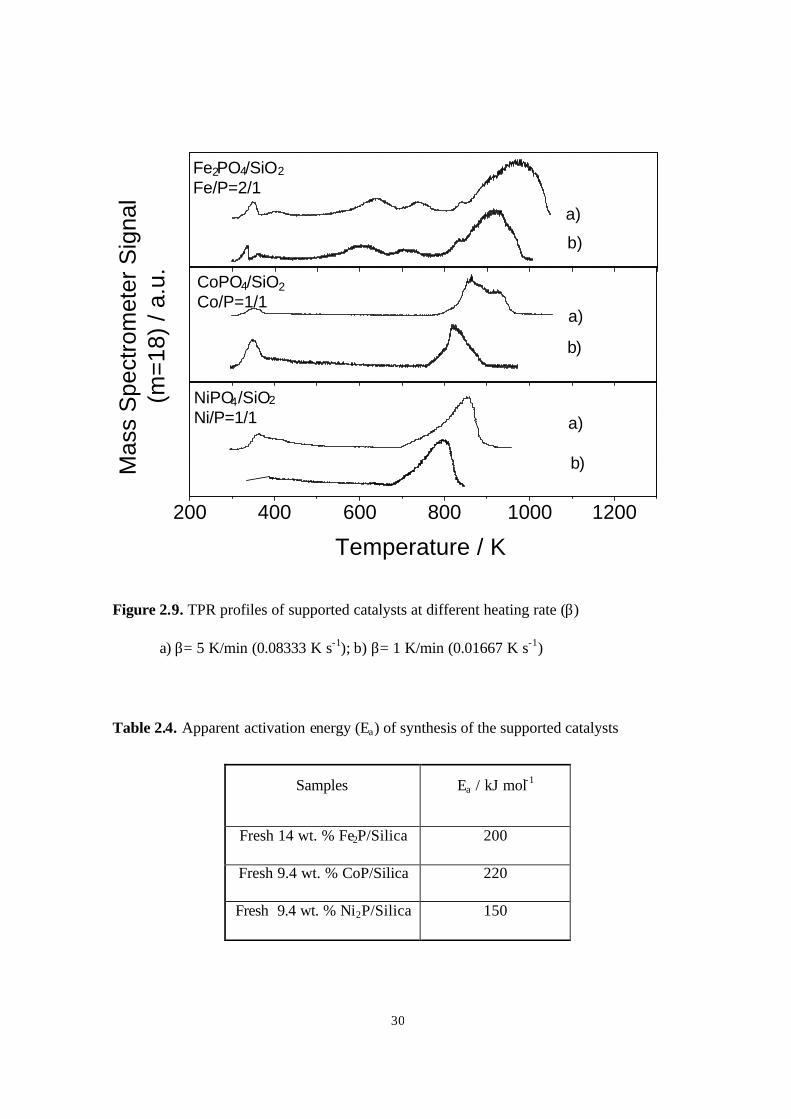
Figure 2.9. TPR profiles of supported catalysts at different heating rate (β)
a) β= 5 K/min (0.08333 K s-1). b) β= 1 K/min (0.01667 K s-1) 30
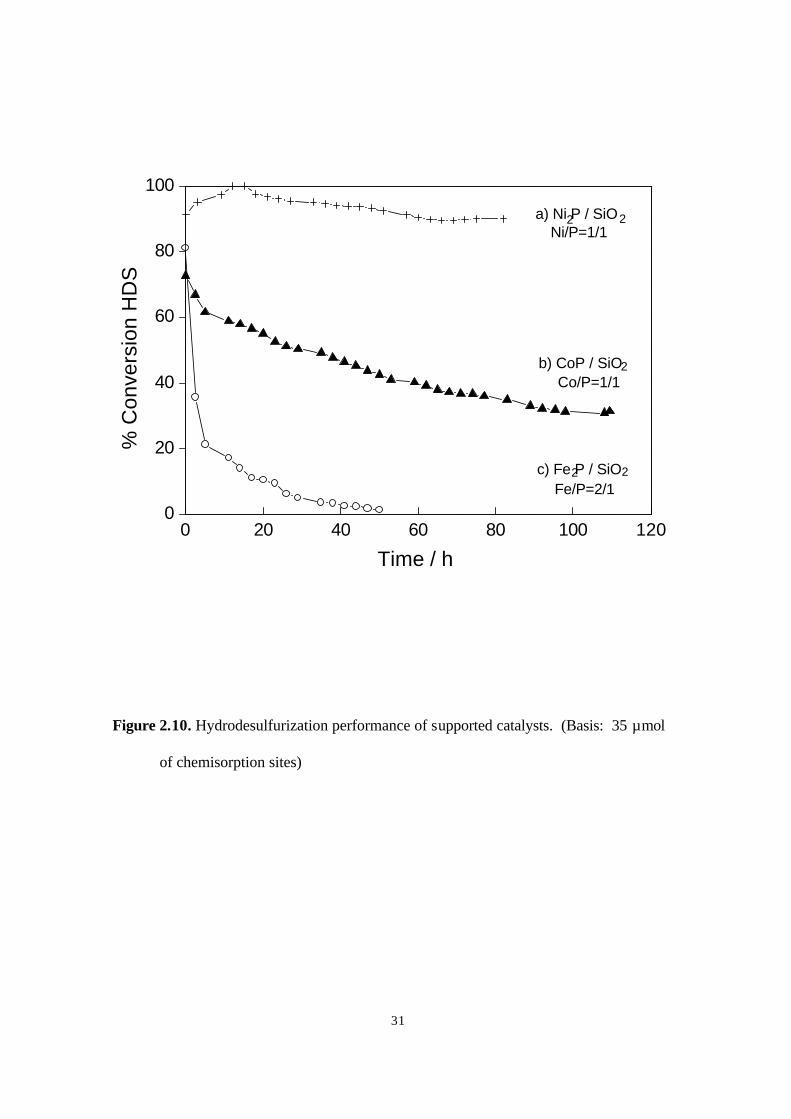
Figure 2.10. Hydrodesulfurization performance of supported catalysts. (Basis. 35 µmol
of chemisorption sites) 31
ix
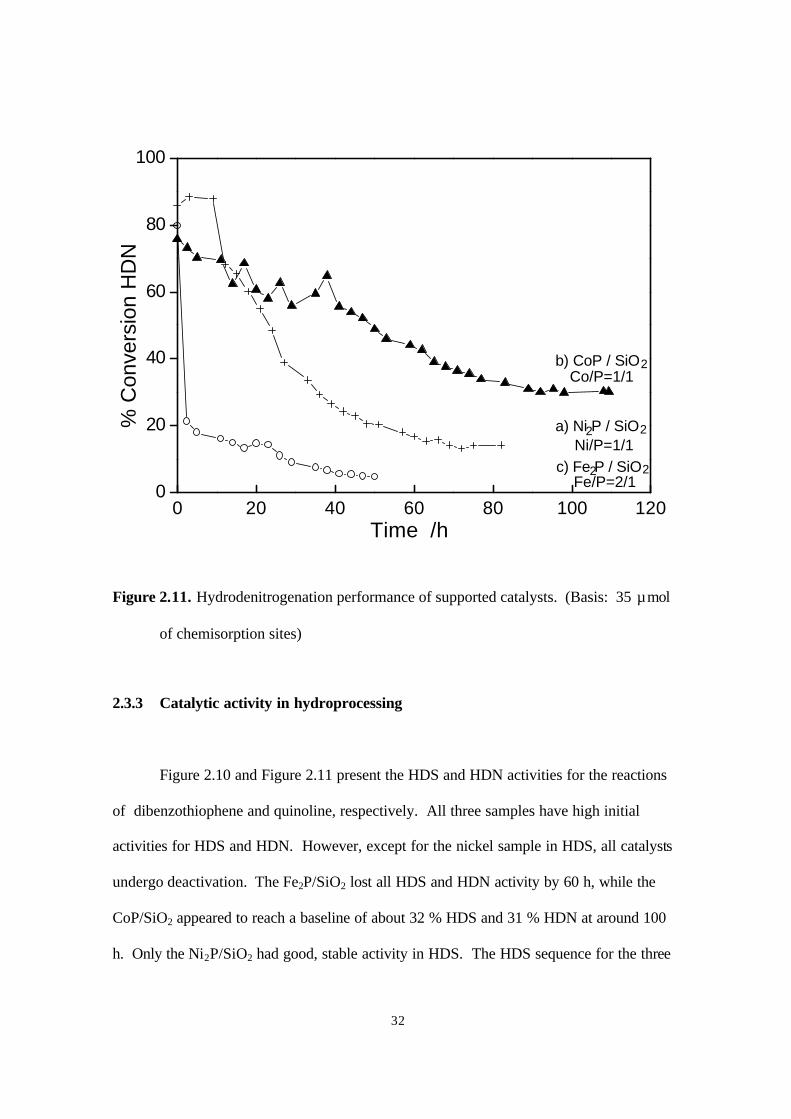
Figure 2.11. Hydrodenitrogenation performance of supported catalysts. (Basis . 35 µmol
of chemisorption sites) 32
Figure 2.12. X-ray diffraction patterns of iron phosphides and references
a) Blank sample-SiO2. b) Spent sample Fe2P/SiO2. c) Fresh sample Fe2P/SiO2.
d) Bulk sample Fe2P. e) PDF 33-670 Fe2P (Ref. 41) 36
Figure 2.13. X-ray diffraction patterns of cobalt phosphides and references
a) Blank sample-SiO2. b) Spent sample CoP/SiO 2. c) Fresh sample CoP/SiO2.
d) Bulk sample CoP. e) PDF 29-497 CoP (Ref. 41) 37
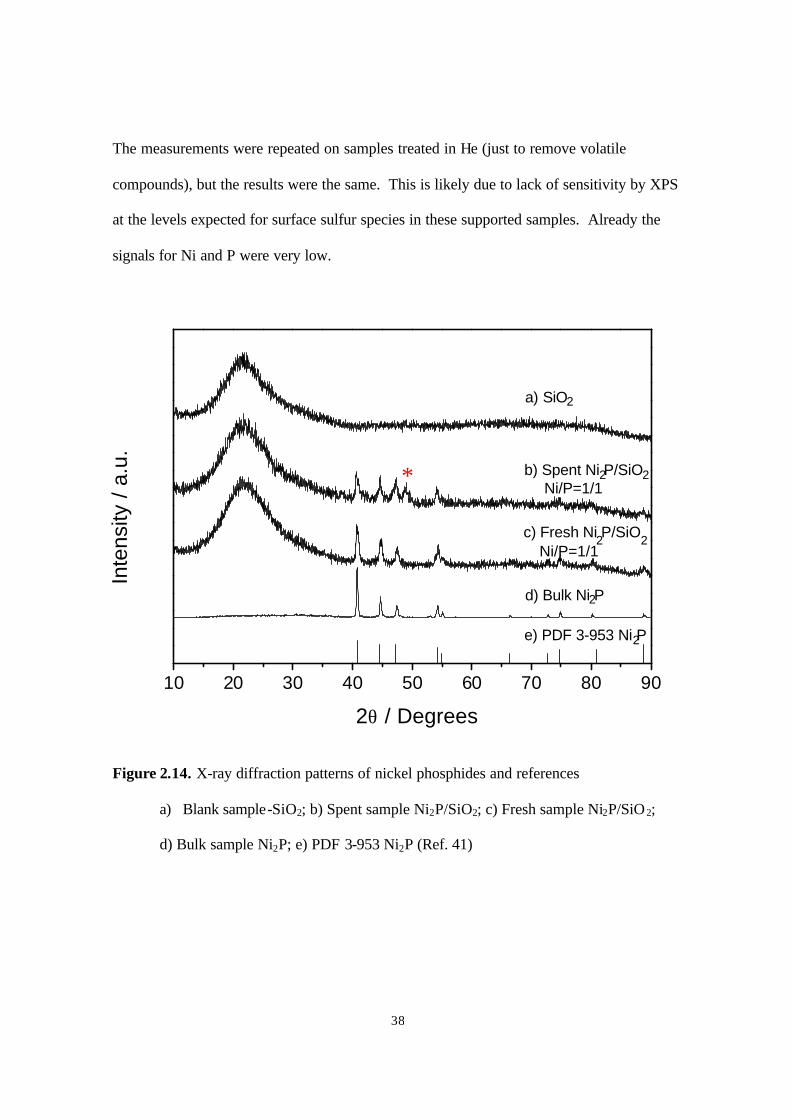
Figure 2.14. X-ray diffraction patterns of nickel phosphides and referencesa) Blank
sample-SiO2. b) Spent sample Ni2P/SiO2. c) Fresh sample Ni2P/SiO2. d) Bulk
sample Ni2P. e) PDF 3-953 Ni2P (Ref. 41) 38
Figure 3.1. Crystal structure of Ni2P 51
Figure 3.2. Mass 18 (H2O) signal from temperature-programmed reduction of the samples
at β= 1 K/min (0.01667 K s-1) 53
Figure 3.3. Mass 34 (PH3) signal from temperature-programmed reduction of the samples
at β= 1 K/min (0.01667 K s-1) 54
Figure 3.4. X-ray diffraction patterns of the fresh samples (α. Ni2P. β. Ni12P5) 57
Figure 3.5. Comparison of X-ray diffraction patterns for the fresh samples and the spent
samples 58
Figure 3.6. Superposition of the X-ray diffraction pattern of the spent sample (Ni/P=1/1)
with different references 59
Figure 3.7. Hydrodenitrogenation performance of supported catalysts 60
Figure 3.8. Hydrodesulfurization performance of supported catalysts 61
x
Figure 3.9. Comparison of hydroprocessing activities 62
Figure 3.10. Comparison of Nickel K edge EXAFS for the fresh samples with Ni/P ratios
of a) 2/1, b) 1/2, c) 1/3 and references d) Ni2P, e) NiO, f) Ni(OH)2, g) Ni metal.
65
Figure 3.11. Nickel K-edge EXAFS of the fresh and spent samples with different Ni/P
ratios. a) Ni/P = 2/1, b) Ni/P = 1/2, c) Ni/P = 1/3. 66
Figure 3.12. Comparison of Nickel K-edge EXAFS for the spent samples with Ni/P ratios
of a) 2/1, b) 1/2, c) 1/3 and references d) Ni2P, e) NiPS3, f) NiS 2, g) Ni3S5, h)
NiS. 67
Figure 4.1. Mass 18 signal from temperature-programmed reduction of the samples at β=
1K/min (0.01667 K s-1). 79
Figure 4.2. X-ray diffraction patterns of the fresh samples (α. Ni2P; β. Ni12P5 or Nickel
sulfide) 80
Figure 4.3. Comparison of X-ray diffraction patterns for the fresh samples and the spent
samples. 81
Figure 4.4. Hydrodenitrogenation performance of supported catalysts 84
Figure 4.5. Hydrodesulfurization performance of supported catalysts 85
Figure 4.6. Comparison of hydroprocessing activities. 86
Figure 4.7. Curves of HDN and HDS turnover rates and CO uptakes 89
Figure 4.8. Comparison of Nickel K edge EXAFS for the fresh samples with loading ratio
as 0.5, 1.0, 1.5, 2.0, and Ni2P, NiO, Ni(OH)2 and nickel metal. 90
Figure 4.9. Nickel K edge EXAFS of the fresh and spent samples with different loading
(12.23 wt.% here was used as loading 1.0), a) o.5; b) 1.0; c) 1.5; d) 2.0 91
xi
Figure 4.10. Comparison of Nickel K edge EXAFS for the spent samples with loading
ratio as 2.0, 1.5, 1.0, 0.5 and Ni2P, Ni(OH)2, nickel metal, Ni3S5, and NiS
93
Figure 4.11. FEFF simulations for Ni2P and Ni12P5. 96
Figure 5.1. XRD patterns of both the fresh and spent Ni2P/SiO2. 106
Figure 5.2. Conversion of piperidines. 107
Figure 5.3. HDN of piperidines. 108
Figure 5.4. Selectivity and product distribution of piperdine on Ni2P/SiO2. 110
Figure 5.5. Selectivity and product distribution of 4-methylpiperdine on Ni2P/SiO2.
110
Figure 5.6. Selectivity and product distribution of 3-methylpiperdine on Ni2P/SiO2.
111
Figure 5.7. Selectivity and product distribution of 2,6-dimethylpiperdine on Ni2P/SiO2.
111
Figure 5.8. Selectivity and product distribution of 2-methylpiperdine on Ni2P/SiO2.
112
Figure 5.9. FTIR spectra of ethylamine on SiO2 without H2S pretreatment. 112
Figure 5.10. FTIR spectra of ethylamine on SiO2 with H2S pretreatment. 113
Figure 5.11. FTIR spectra of ethylamine on Ni2P/SiO2 without H2S pretreatment. 114
Figure 5.12. FTIR spectra of ethylamine on Ni2P/SiO2 with H2S pretreatment. 114
Figure 5.13. Comparison of FTIR spectra of ethylamine on Ni2P/SiO2 without and with
H2S pretreatment. 115
xii
Figure 5.14. TPD curves of ethylamine on Ni2P/SiO2 (with H2S pretreatment. With H2 as
carrier gas) 116
List of Schemes
Scheme 5.1. E2 elimination mechanism 118
Scheme 5.2. Amine displacement mechanism 119
Scheme 5.3. SN2 Nucleophilic substitution mechanism 119
Scheme 5.4. E1 or SN1 mechanism 120
Scheme 5.5. Metalloazocyclopropane formation mechanism 121
Scheme 5.6. Iminium ion complex formation mechanism 121
Scheme 5.7. Thiohemiaminal formation mechanism 122
Scheme 5.8. N-pentylpiperidine formation mechanism 122
Scheme 5.9. 2-n-Pentylpiperidine formation mechanism 123
Scheme 5.10. Reaction order of methyl-substituted piperidines 124
Scheme 5.11. SN2 mechanism for piperidine on Ni2P/SiO2 131
Scheme 5.12. E2 mechanism for piperidine on Ni2P/SiO2
(a: first C-N cleavage, b: second C-N cleavage) 132
1
Chapter 1
Introduction
1.1 Motivation
Demands for a cleaner environment have led to a global tightening in the allowed
sulfur content in fuels and increased restrictions on the release of nitrogen oxides. For
example, in the case of sulfur the U.S. Environmental Protection Agency (EPA) has
issued regulations that would lower its allowed content in diesel fuel from the current 500
ppmw to 15 ppmw in 2006, and in gasoline from 300 ppmw to 30 ppmw by 2004 (1,2).
For this reason there are considerable efforts being expended to develop new
technologies for the production of clean fuels, like adsorption, extraction, oxidation,
alkylation, and bioprocessing (3). Currently, however, hydroprocessing appears to be the
technologically preferred solution (3). Hydroprocessing refers to a variety of catalytic
hydrogenation processes that saturate heteroatomatic rings and remove S, N, O and
metals from different petroleum streams in a refinery (4). Because of the tighter
environmental regulations new types of catalysts, which are economic, have long-life,
and possess high activity are highly desired. In this work we present results on a new
type of hydroprocessing catalyst: transition metal phosphides.
1.2 Introduction to iron group phosphides
2
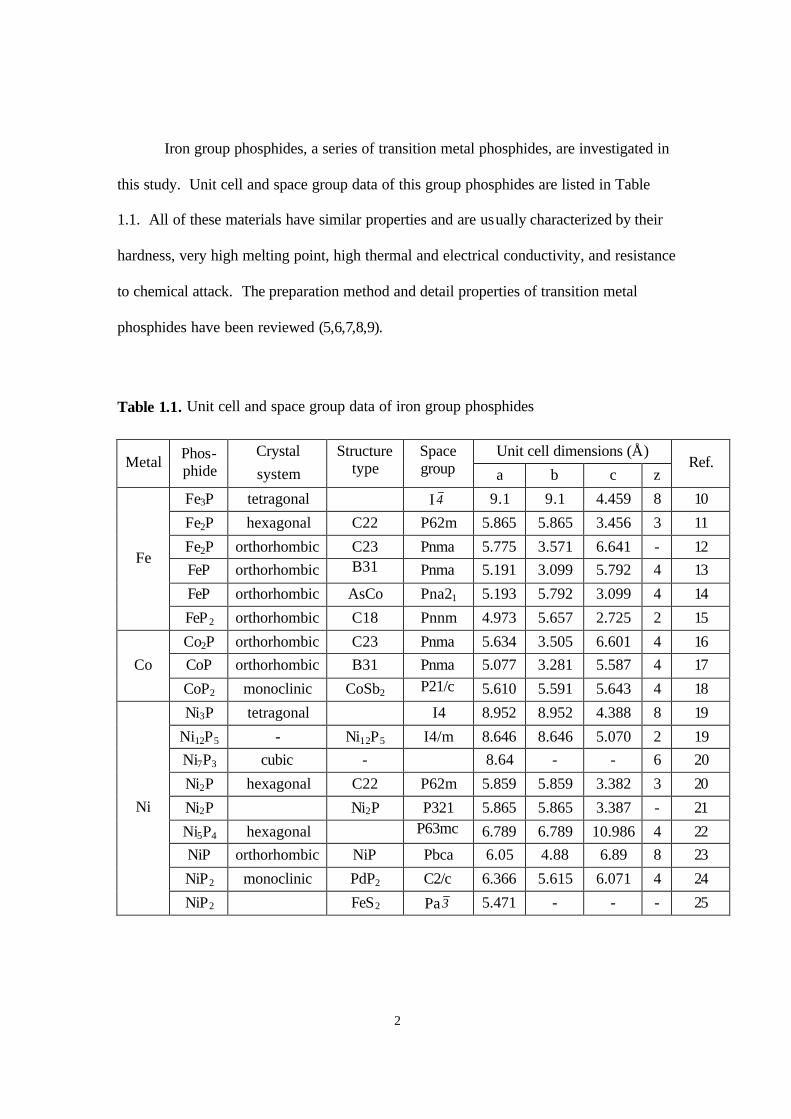
Iron group phosphides, a series of transition metal phosphides, are investigated in
this study. Unit cell and space group data of this group phosphides are listed in Table
1.1. All of these materials have similar properties and are usually characterized by their
hardness, very high melting point, high thermal and electrical conductivity, and resistance
to chemical attack. The preparation method and detail properties of transition metal
phosphides have been reviewed (5,6,7,8,9).
Table 1.1. Unit cell and space group data of iron group phosphides
Unit cell dimensions (Å)
Metal Phos-phide
Crystal system
Structure type
Space group a b c z
Ref.
Fe3P tetragonal I 4 9.1 9.1 4.459 8 10
Fe2P hexagonal C22 P62m 5.865 5.865 3.456 3 11
Fe2P orthorhombic C23 Pnma 5.775 3.571 6.641 - 12 FeP orthorhombic B31 Pnma 5.191 3.099 5.792 4 13
FeP orthorhombic AsCo Pna21 5.193 5.792 3.099 4 14
Fe
FeP2 orthorhombic C18 Pnnm 4.973 5.657 2.725 2 15
Co2P orthorhombic C23 Pnma 5.634 3.505 6.601 4 16 CoP orthorhombic B31 Pnma 5.077 3.281 5.587 4 17 Co
CoP2 monoclinic CoSb2 P21/c 5.610 5.591 5.643 4 18
Ni3P tetragonal I4 8.952 8.952 4.388 8 19
Ni12P5 - Ni12P5 I4/m 8.646 8.646 5.070 2 19 Ni7P3 cubic - 8.64 - - 6 20
Ni2P hexagonal C22 P62m 5.859 5.859 3.382 3 20
Ni2P Ni2P P321 5.865 5.865 3.387 - 21
Ni5P4 hexagonal P63mc 6.789 6.789 10.986 4 22 NiP orthorhombic NiP Pbca 6.05 4.88 6.89 8 23
NiP2 monoclinic PdP2 C2/c 6.366 5.615 6.071 4 24
Ni
NiP2 FeS2 Pa 3 5.471 - - - 25
3
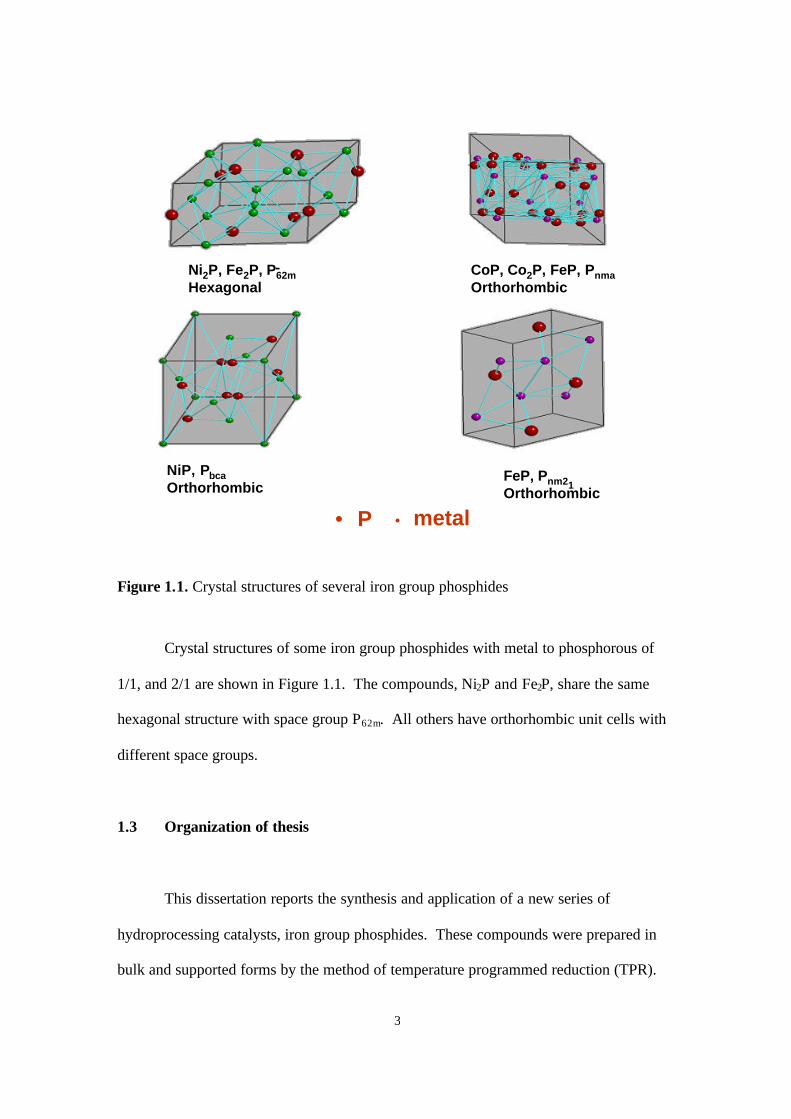
Figure 1.1. Crystal structures of several iron group phosphides
Crystal structures of some iron group phosphides with metal to phosphorous of
1/1, and 2/1 are shown in Figure 1.1. The compounds, Ni2P and Fe2P, share the same
hexagonal structure with space group P62m. All others have orthorhombic unit cells with
different space groups.
1.3 Organization of thesis
This dissertation reports the synthesis and application of a new series of
hydroprocessing catalysts, iron group phosphides. These compounds were prepared in
bulk and supported forms by the method of temperature programmed reduction (TPR).
• P
NiP, PbcaOrthorhombic
CoP, Co2P, FeP, PnmaOrthorhombic
FeP, Pnm2Orthorhombic
1
Ni2P, Fe2P, P62mHexagonal
-
• metal
4
The mechanism of hydrodenitrogenation reactions on Ni2P/SiO2 was studies by
comparing the reactivities of different methyl piperidines with different numbers of α and
β hydrogens.
Chapter 1 presents a description of the motivation of the work, which is the study
of new catalysts for hydroprocessing. The chapter gives a brief introduction to the crystal
structures and properties of the materials.
Chapter 2 presents the synthesis, characterization and hydrotreating activity of
several iron group transition metal phosphides. In this chapter, a series of bulk and silica
supported iron, cobalt and nickel metal phosphides were synthesized by means of
temperature-programmed reduction (TPR) of the corresponding phosphates. The activity
of the silica-supported catalysts in hydrodenitrogenation (HDN) and hydrodesulfurization
(HDS) was evaluated with a model feed liquid.
Chapter 3 reports the effect of P content on the structure and hydroprocessing
activity of NiP x/SiO2 catalysts. A series of these novel catalysts with different Ni/P ratios
were synthesized and characterized by BET surface area determinations, CO uptake
titrations, x-ray diffraction (XRD) analysis, and extended x-ray absorption fine structure
(EXAFS) measurements. The activity and stability of the catalysts were affected
profoundly by the phosphorus content, both reaching a maximum at a sample starting
synthesis P/Ni ratio of about 2/1.

5
Chapter 4 presents the effect of Ni2P loading on the structure and activity of
Ni2P/SiO2 catalysts. The performance of the catalysts was found to go through a
maximum with loading level.
Chapter 5 presents the results of a detailed study of the mechanism of HDN using
a series of piperidine and its derivatives on a Ni2P/SiO2 (Ni/P=1/2) catalyst. The nature
of the intermediates on the catalyst was characterized by temperature programmed
desorption (TPD) of the probe molecule ethylamine and diffuse-reflectance Fourier
transform infrared spectroscopy (FTIR).
Chapter 6 presents the general conclusions of the work.
1. US Environmental Protection Agency, Press Release, May 1, 1999; December 21,
2000.
2. Federal Register, Vol. 65, No. 28, Thursday, Feb. 10, 2000.
3. O’Connor, P. and Mayo, S., Preprints, Div. Fuel Chem. 46, 381 (2001).
4. Topsøe, H., Clausen B. S., Massoth F. E., “Hydrotreating Catalysis, Science and
Technology, (Anderson, J. R. and Boudart, M., Eds.), Catalysis -Science and
technology”, Vol.11, Springer-Verlag, New York, 1991
5. Aronsson, B., Lundström, T, and Rundquist, S., “Borides, Silicides and
Phosphides” John Wiley and Sons, London, U.K. (1965).

6
6. Toy, A. D. F., Phosphorus, in “Comprehensive Inorganic Chemistry” Chapter 20
(Bailar, J. C., Emeléus, H. J., Nyholm, R., and Trotman-Dickenson, A. F., Eds.)
Pergamon Press, Oxford, UK (1973).
7. Corbridge, D. E. C., “Phosphorus: Studies in Inorganic Chemistry” Vol. 10, p.
71 Elsevier Press (1990).
8. Corbridge, D. E. C., Pearson, M. S., and Walling, C., “Topics in Phosphorus
Chemistry”, Vol. 3, p.123, Wiley, NY (1966).
9. Clark, P., “New catalysts for hydroprocessing: molybdenum and tungsten
phosphide”, Ph.D. Dissertation, 2000, Virginia Polytechnic Institute and State
University.
10. Rundqvist, S., Acta Chem. Scand., 16, 1 (1962)
11. Carlson, B., et al., J. Solid State Chem., 8, 57 (1973)
12. Senateur, J. P., Rouault, A., Fruchart, R., Capponi, J. J., Peroux, M., Materials
Research Bulletin, 11, 631 (1976)
13. Rundqvist, S., Acta Chem. Scand., 16, 287 (1962)
14. Sete, K., Kjekshus, A., Acta Chem. Scand., 26, 1276 (1972)
15. Holseth, H., Kjekshus, A., Acta Chem. Scand., 22, 3273 (1968)
16. Roger, A., Sénateur, J. P., Fruchart, R., Annal. Chim., Paris, 4, 79 (1969)
17. Rundqvist, S., Acta Chem. Scand., 16, 287 (1962)
18. Donohue, P. C., Mater. Res. Bull., 7, 943 (1972)
19. Rundqvist, S., Hassler, E., Lundvik, L., Acta Chem. Scand., 16(1), 242 (1962)
20. Nowotny, H., Z. Phys. Chem., 40, 281 (1938)
21. Rundqvist, S., Acta Chem. Scand., 16, 992 (1962)

7
22. Elfström, M., Acta Chem. Scand., 19, 1694 (1965)
23. Larson, E., Ark. Kemi, 23(32), 335 (1965)
24. Rundqvist, S., Acta Chem. Scand., 15, 451 (1961)
25. Donohue, P. C., Bither, T. A., Young, H. S., Inorganic Chemistry, 7(5), 998 (1968)

8
Chapter 2
Synthesis, Characterization and Hydrotreating Activity of Several Iron
Group Transition Metal Phosphides
2.1 Introduction
Transition metal phosphides have attracted considerate interest for some time
because these materials are technologically important as semiconductors, luminescent
devices, and electronic components (1). A brief thermodynamic analysis of the potential
stability in H2S was carried out early in 1975 (2), and it was revealed that this group of
materials is potentially stable and sulfur-resistant. However, the transition metal
phosphides as a class of materials have received little attention as catalysts. This is
probably because the development of synthetic methods of producing materials with a high
surface area was not achieved.
The combination of the iron group metals Co and Ni with Mo and W in commercial
hydroprocessing catalysts (3,4,5) and the use of phosphorus as a promoter (6,7,8) is well
known. Many workers have studied the effect of phosphorus in sulfide catalysts
(9,10,11,12), and the topic was reviewed by Iwamoto and Grimblot (13). In these
materials, the phosphorus was found as a phosphate and primarily modified the properties
of the support, only indirectly influencing the active phase. For example, phosphorus
altered the acid -base character of alumina and improved dispersion of molybdenum on the
support. It also enhanced the solubility of the precursor metals in the preparation stages
and allowed the synthesis of high-loading catalysts (14). The effect of phosphorus
9
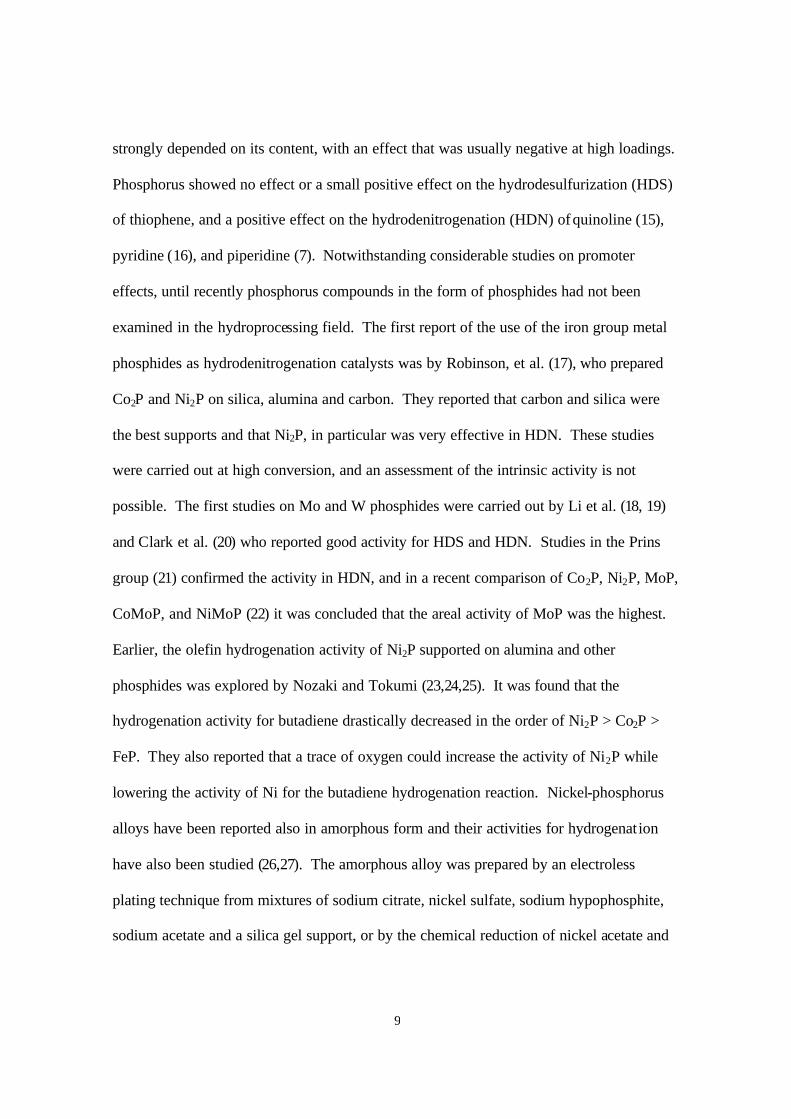
strongly depended on its content, with an effect that was usually negative at high loadings.
Phosphorus showed no effect or a small positive effect on the hydrodesulfurization (HDS)
of thiophene, and a positive effect on the hydrodenitrogenation (HDN) of quinoline (15),
pyridine (16), and piperidine (7). Notwithstanding considerable studies on promoter
effects, until recently phosphorus compounds in the form of phosphides had not been
examined in the hydroprocessing field. The first report of the use of the iron group metal
phosphides as hydrodenitrogenation catalysts was by Robinson, et al. (17), who prepared
Co2P and Ni2P on silica, alumina and carbon. They reported that carbon and silica were
the best supports and that Ni2P, in particular was very effective in HDN. These studies
were carried out at high conversion, and an assessment of the intrinsic activity is not
possible. The first studies on Mo and W phosphides were carried out by Li et al. (18, 19)
and Clark et al. (20) who reported good activity for HDS and HDN. Studies in the Prins
group (21) confirmed the activity in HDN, and in a recent comparison of Co2P, Ni2P, MoP,
CoMoP, and NiMoP (22) it was concluded that the areal activity of MoP was the highest.
Earlier, the olefin hydrogenation activity of Ni2P supported on alumina and other
phosphides was explored by Nozaki and Tokumi (23,24,25). It was found that the
hydrogenation activity for butadiene drastically decreased in the order of Ni2P > Co2P >
FeP. They also reported that a trace of oxygen could increase the activity of Ni2P while
lowering the activity of Ni for the butadiene hydrogenation reaction. Nickel-phosphorus
alloys have been reported also in amorphous form and their activities for hydrogenation
have also been studied (26,27). The amorphous alloy was prepared by an electroless
plating technique from mixtures of sodium citrate, nickel sulfate, sodium hypophosphite,
sodium acetate and a silica gel support, or by the chemical reduction of nickel acetate and
10
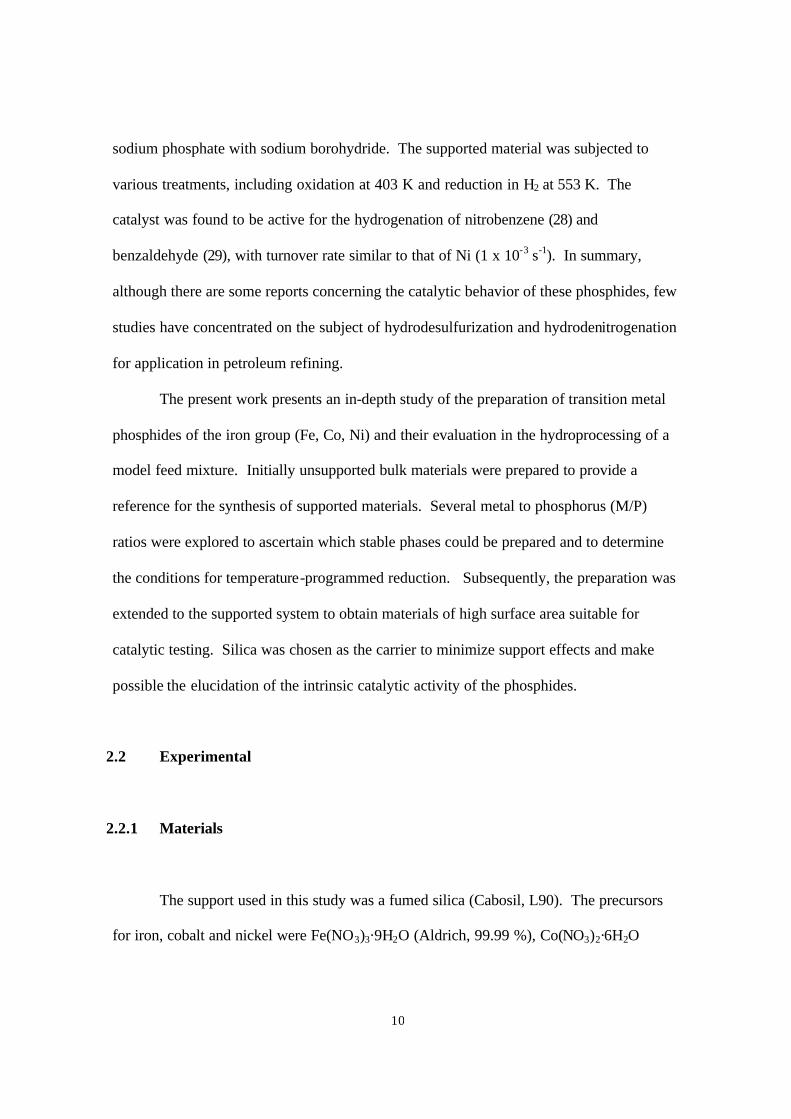
sodium phosphate with sodium borohydride. The supported material was subjected to
various treatments, including oxidation at 403 K and reduction in H2 at 553 K. The
catalyst was found to be active for the hydrogenation of nitrobenzene (28) and
benzaldehyde (29), with turnover rate similar to that of Ni (1 x 10⁻³ s-1). In summary,
although there are some reports concerning the catalytic behavior of these phosphides, few
studies have concentrated on the subject of hydrodesulfurization and hydrodenitrogenation
for application in petroleum refining.
The present work presents an in-depth study of the preparation of transition metal
phosphides of the iron group (Fe, Co, Ni) and their evaluation in the hydroprocessing of a
model feed mixture. Initially unsupported bulk materials were prepared to provide a
reference for the synthesis of supported materials. Several metal to phosphorus (M/P)
ratios were explored to ascertain which stable phases could be prepared and to determine
the conditions for temperature-programmed reduction. Subsequently, the preparation was
extended to the supported system to obtain materials of high surface area suitable for
catalytic testing. Silica was chosen as the carrier to minimize support effects and make
possible the elucidation of the intrinsic catalytic activity of the phosphides.
2.2 Experimental
2.2.1 Materials
The support used in this study was a fumed silica (Cabosil, L90). The precursors
for iron, cobalt and nickel were Fe(NO3)3·9H2O (Aldrich, 99.99 %), Co(NO3)2·6H2O
11
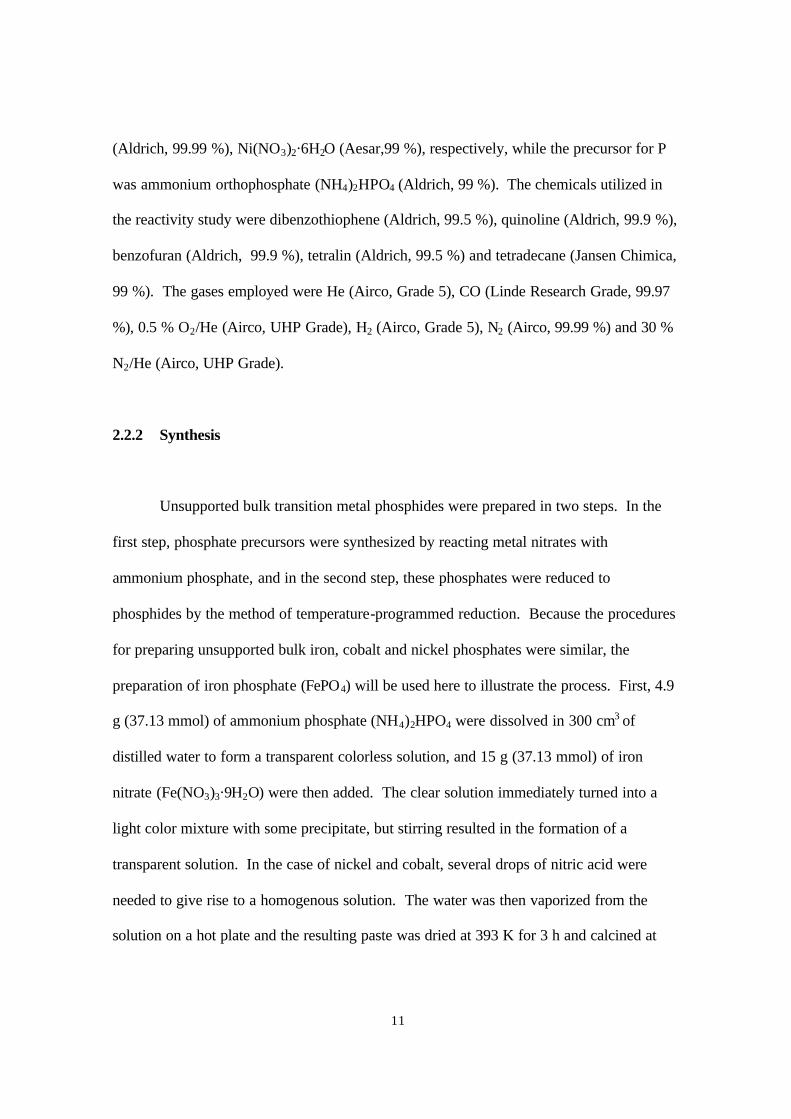
(Aldrich, 99.99 %), Ni(NO3)2·6H2O (Aesar,99 %), respectively, while the precursor for P
was ammonium orthophosphate (NH4)2HPO4 (Aldrich, 99 %). The chemicals utilized in
the reactivity study were dibenzothiophene (Aldrich, 99.5 %), quinoline (Aldrich, 99.9 %),
benzofuran (Aldrich, 99.9 %), tetralin (Aldrich, 99.5 %) and tetradecane (Jansen Chimica,
99 %). The gases employed were He (Airco, Grade 5), CO (Linde Research Grade, 99.97
%), 0.5 % O2/He (Airco, UHP Grade), H2 (Airco, Grade 5), N2 (Airco, 99.99 %) and 30 %
N2/He (Airco, UHP Grade).
2.2.2 Synthesis
Unsupported bulk transition metal phosphides were prepared in two steps. In the
first step, phosphate precursors were synthesized by reacting metal nitrates with
ammonium phosphate, and in the second step, these phosphates were reduced to
phosphides by the method of temperature-programmed reduction. Because the procedures
for preparing unsupported bulk iron, cobalt and nickel phosphates were similar, the
preparation of iron phosphate (FePO4) will be used here to illustrate the process. First, 4.9
g (37.13 mmol) of ammonium phosphate (NH4)2HPO4 were dissolved in 300 cm3 of
distilled water to form a transparent colorless solution, and 15 g (37.13 mmol) of iron
nitrate (Fe(NO3)3·9H2O) were then added. The clear solution immediately turned into a
light color mixture with some precipitate, but stirring resulted in the formation of a
transparent solution. In the case of nickel and cobalt, several drops of nitric acid were
needed to give rise to a homogenous solution. The water was then vaporized from the
solution on a hot plate and the resulting paste was dried at 393 K for 3 h and calcined at

12
773 K for 6 h in an oven. The amount collected (with some minor losses) was 5.54 g,
which corresponds to 36 mmol of iron phosphate of formula FePO4·H2O. The phosphate
was then ground with a mortar and pestle and sieved to 16/20 mesh (0.65-1.2 mm diameter
particles). In the second step of preparation, temperature-programmed reduction (TPR)
was utilized to convert the phosphate into phosphide. The reduction was carried out in a
U-shaped quartz reactor placed in a furnace controlled by a temperature programmer
(Omega Model CN 2000). The temperature was raised at β = 0.0167 K s-1 (1 K min-1), and
was monitored by a local chromel-alumel thermocouple placed in a thermowell near the
center of the reactor bed. The H2 flow rate was set at 1000 µmol s-1 (1500 cm3 min-1) per
gram of sample. A portion of the exit gas flow was sampled through a leak valve into a
mass spectrometer (Ametek/Dycor Model MA 100) and the masses 2(H2), 4(He), 18(H2O),
28(N2), 32(O2), 34(PH3), 15(NH), 44(CO2), 31(P), 62(P 2) were monitored during the
experiment, and these were recorded together with the temperature by an on-line computer.
At the end of the temperature program, the sample was cooled in helium to room
temperature, and was passivated in a 0.5 % O2/He flow for two h.
Table 2.1: Quantities used in the preparation of supported samples
Materials used Catalyst properties
Sample Silica (g)
Metal nitrate (mol)
(NH4)2HPO4 (mol)
Phosphide loading
(wt % MxP)
Metal loading
(mol % M) Fe2P/SiO2 20 0.0462 0.0231 14 11
CoP/SiO2 20 0.0231 0.0231 9.4 6.2
Ni2P/SiO2 20 0.0231 0.0231 9.4 6.1
13
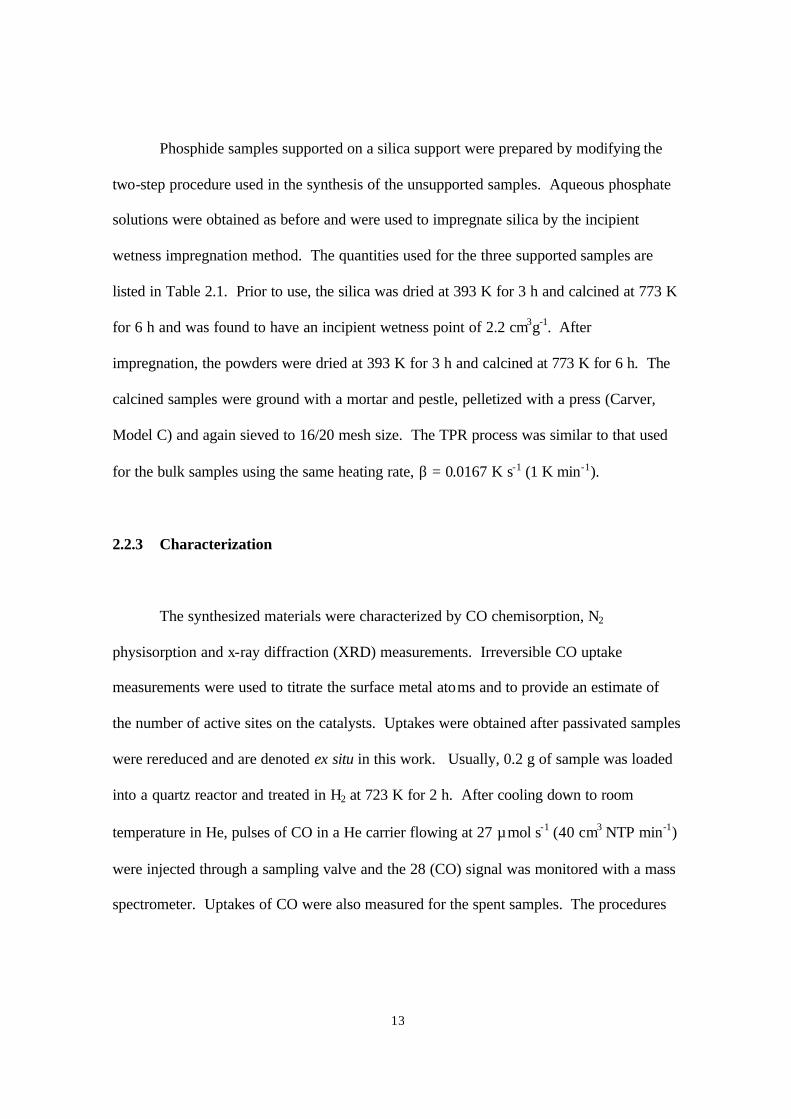
Phosphide samples supported on a silica support were prepared by modifying the
two-step procedure used in the synthesis of the unsupported samples. Aqueous phosphate
solutions were obtained as before and were used to impregnate silica by the incipient
wetness impregnation method. The quantities used for the three supported samples are
listed in Table 2.1. Prior to use, the silica was dried at 393 K for 3 h and calcined at 773 K
for 6 h and was found to have an incipient wetness point of 2.2 cm3g-1. After
impregnation, the powders were dried at 393 K for 3 h and calcined at 773 K for 6 h. The
calcined samples were ground with a mortar and pestle, pelletized with a press (Carver,
Model C) and again sieved to 16/20 mesh size. The TPR process was similar to that used
for the bulk samples using the same heating rate, β = 0.0167 K s-1 (1 K min-1).
2.2.3 Characterization
The synthesized materials were characterized by CO chemisorption, N2
physisorption and x-ray diffraction (XRD) measurements. Irreversible CO uptake
measurements were used to titrate the surface metal atoms and to provide an estimate of
the number of active sites on the catalysts. Uptakes were obtained after passivated samples
were rereduced and are denoted ex situ in this work. Usually, 0.2 g of sample was loaded
into a quartz reactor and treated in H2 at 723 K for 2 h. After cooling down to room
temperature in He, pulses of CO in a He carrier flowing at 27 µmol s-1 (40 cm3 NTP min-1)
were injected through a sampling valve and the 28 (CO) signal was monitored with a mass
spectrometer. Uptakes of CO were also measured for the spent samples. The procedures
14
were the same as those used for the fresh samples. Prior to the measurement, the spent
samples removed from the hydrotreating reactors were washed in hexane and dried.
BET surface area measurements were carried out right after the CO uptake
determinations, using a similar technique. Adsorption at liquid nitrogen temperature was
performed using a 30 % N2/He stream, and the desorption area obtained after rapid heating
was compared to the area of a calibrated volume (35.4 µmol). The surface area was
calculated from the one-point BET equation, which is reasonable for non-microporous
materials such as those used here. X-ray diffraction (XRD) patterns of the samples were
determined with a Scintag XDS-2000 powder diffractometer operated at 45 kV and 40
mA, using Cu Kα monochromatized radiation (λ = 0.154178 nm). The crystallite size of
the supported samples was calculated using the Scherrer equation: Dc = Kλ/β cos(θ),
where K is a constant taken as 0.9, λ is the wavelength of the x-ray radiation, β is the width
of the peak at half-maximum, corrected for instrumental broadening (0.1o), and 2θ is the
Bragg angle (30,31,32). The near-surface composition of the nickel samples was obtained
by x-ray photoelectron spectroscopy (XPS) (Perkin Elmer, Model 5300 with a Mg source)
operated at 15 kV and 30 mA. The 285.0 eV binding energy peak of adventious carbon
was used as reference. In the case of the spent catalysts, samples were removed from the
reactor, washed in hexane, heated in H2 to 673 K, and then passivated. Since the samples
were exposed to the atmosphere and not sputtered, contamination by carbon from the
atmosphere was present.
2.2.4 Reactivity studies
15
Hydrotreating activities of the samples were obtained in a three-phase trickle bed
reactor for hydrodenitrogenation (HDN) and hydrodesulfurization (HDS) with a model
petroleum liquid containing 2000 ppm nitrogen (quinoline), 3000 ppm sulfur
(dibenzothiophene), 500 ppm oxygen (benzofuran), 20 wt.% aromatics (tetralin), and
balance aliphatics (tetradecane). The operating conditions were close to industrial
conditions, 3.1 MPa and 643 K with a liquid flow rate of 5 cm3/h and a hydrogen flow rate
of 100 µmol s-1 (150 cm3 min-1) corresponding to a gas-liquid ratio of 9800 HSCF/bl
(standard antic feet H2/barrel). The detailed description of the testing system is reported
elsewhere (33). Quantities of catalysts loaded in the reactor correspond to the same
amount of ex situ CO uptake (35 µmol). Prior to reactivity measurements, the catalyst
samples were pretreated in exactly the same manner as before the ex situ CO uptake
determinations. Hydrotreating samples were collected every two or three hours in sealed
septum vials and were analyzed off-line with a gas chromatograph (Hewlett Packard,
5890A) equipped with a 0.32 mm i.d. x 50 m fused silica capillary column (CPSIL-5CB,
Chrompack, Inc.) and a flame ionization detector.
2.3 Results and discussion
2.3.1 Properties and preparation of bulk phosphides
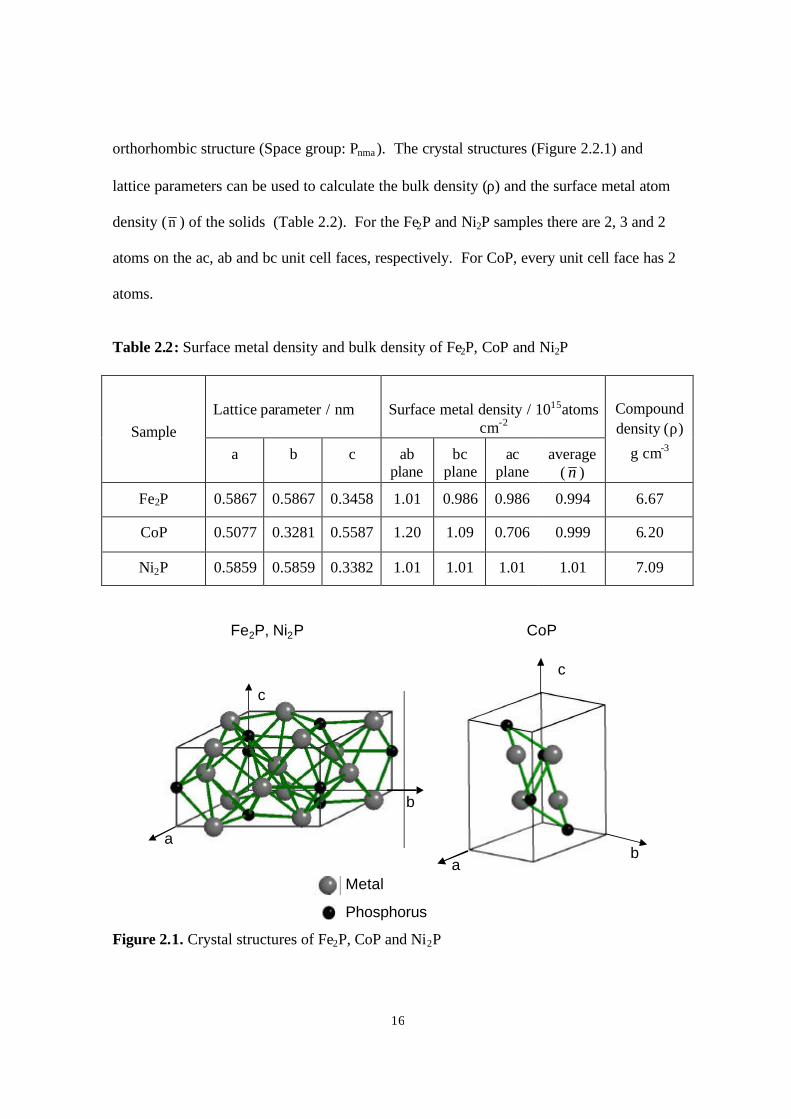
The crystal structures of the Fe, Co, and Ni phosphides are shown in Figure 2.1 and
their lattice parameters are summarized in Figure 2.2. Both Fe2P (34) and Ni2P (35) adopt
the same hexagonal structure (Space group: m26P &&& ), while CoP (36) takes on an
16
orthorhombic structure (Space group: Pnma ). The crystal structures (Figure 2.2.1) and
lattice parameters can be used to calculate the bulk density (ρ) and the surface metal atom
density (n ) of the solids (Table 2.2). For the Fe2P and Ni2P samples there are 2, 3 and 2
atoms on the ac, ab and bc unit cell faces, respectively. For CoP, every unit cell face has 2
atoms.
Table 2.2: Surface metal density and bulk density of Fe2P, CoP and Ni2P
Lattice parameter / nm Surface metal density / 1015atoms
cm-2 Sample a b c ab
plane bc
plane ac
plane average
( n )
Compound density (ρ)
g cm-3
Fe2P 0.5867 0.5867 0.3458 1.01 0.986 0.986 0.994 6.67
CoP 0.5077 0.3281 0.5587 1.20 1.09 0.706 0.999 6.20
Ni2P 0.5859 0.5859 0.3382 1.01 1.01 1.01 1.01 7.09
Figure 2.1. Crystal structures of Fe2P, CoP and Ni2P
Fe2P, Ni2P CoP
Metal
Phosphorus
c
a
b
a
c
b
17
The investigation of the phosphide materials in this study was begun by a study of
the synthesis of bulk materials of various metal-to-phosphorus ratios (M/P) by the
temperature-programmed method. This was carried out to prepare suitable references for
the supported materials, and to evaluate the conditions of preparation needed when a
support was employed.
The synthesis of the bulk phosphides involved two stages, preparation of phosphate
precursors and reduction of the precursors in a temperature programmed manner. The
results will be discussed first for iron. The precursors prepared in the first stage had
different Fe/P ratios, set at the time of preparation by adjusting the mol ratio of the
constituents. The precursors were formed by the thermal decomposition of mixtures of the
metal nitrate and ammonium phosphate in air. Because the nitrate and ammonium ions are
unstable at high temperature, it was expected that the mixture would decompose to a metal
phosphate or metal oxide-phosphate. At high metal ratios some metal oxide was also
likely. X-ray diffraction patterns of the precursors showed that they were amorphous.
18
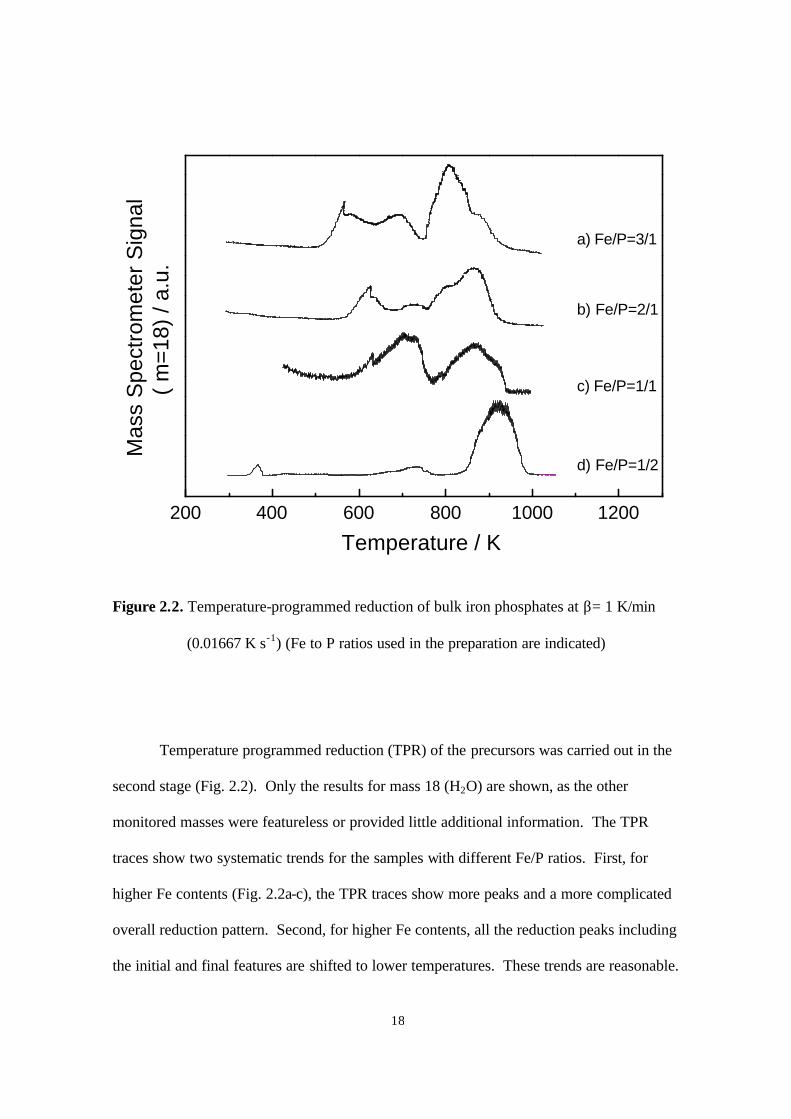
Figure 2.2. Temperature-programmed reduction of bulk iron phosphates at β= 1 K/min
(0.01667 K s-1) (Fe to P ratios used in the preparation are indicated)
Temperature programmed reduction (TPR) of the precursors was carried out in the
second stage (Fig. 2.2). Only the results for mass 18 (H2O) are shown, as the other
monitored masses were featureless or provided little additional information. The TPR
traces show two systematic trends for the samples with different Fe/P ratios. First, for
higher Fe contents (Fig. 2.2a-c), the TPR traces show more peaks and a more complicated
overall reduction pattern. Second, for higher Fe contents, all the reduction peaks including
the initial and final features are shifted to lower temperatures. These trends are reasonable.
200 400 600 800 1000 1200
d) Fe/P=1/2
a) Fe/P=3/1
b) Fe/P=2/1
c) Fe/P=1/1
Mas
s S
pect
rom
eter
Sig
nal
(
m=1
8) /
a.u.
Temperature / K

19
For higher Fe contents, the precursor is probably a mixture of iron oxide, iron phosphate
and possibly other components, and their separate reduction results in different peaks.
Also for these higher Fe contents, the proportion of iron oxide should increase, and since
this oxide is easily reducible, its TPR peaks appear at lower temperatures. In fact, it is
likely that some metallic Fe is formed and that it assists in the reduction of the other
components. For low Fe contents (Fig. 2.2 d), there is no iron oxide and reaction occurs at
the intrinsic reduction temperature of the main phosphate phase (~ 920 K). Because this
temperature is high, even if a mixture of components other than phosphates existed,
individual reduction steps cannot be resolved and the whole process appears to occur in
one stage.
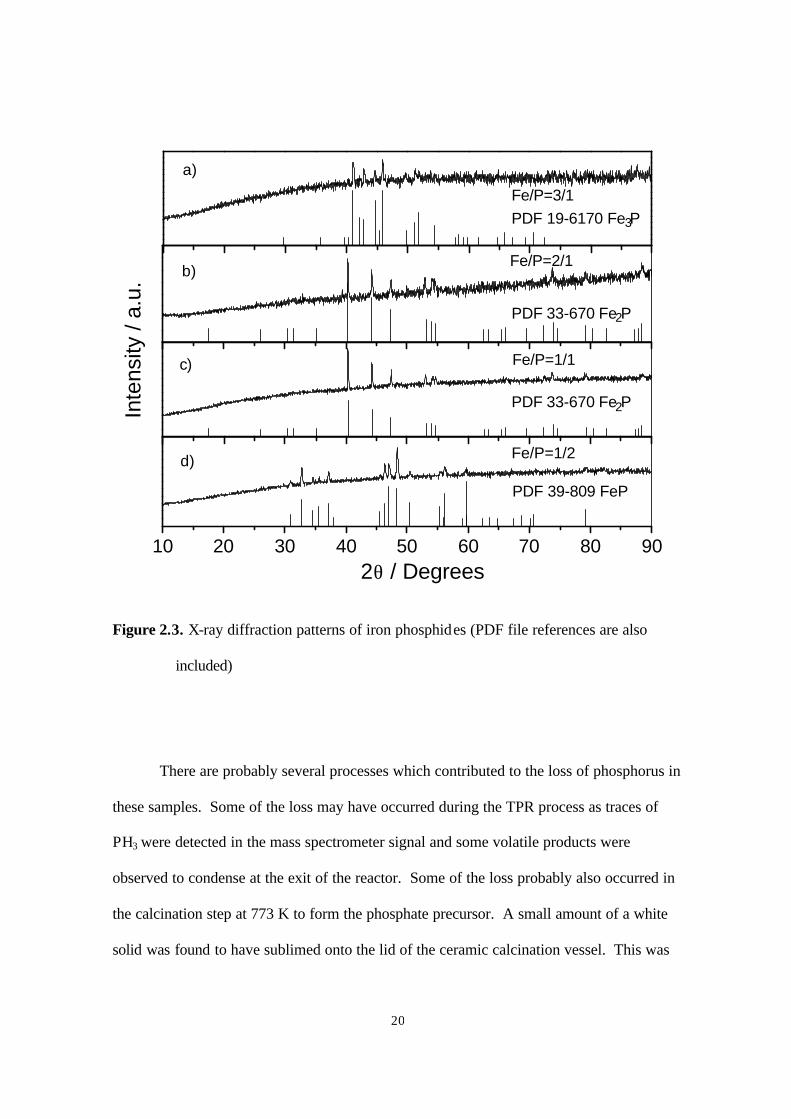
Analysis of the products of TPR was carried out by XRD (Fig. 2.3). The
diffraction patterns all show a high background because of fluorescence by the iron.
However, the presence of distinct iron phosphides can be seen easily. For the samples with
Fe/P ratios of 3/1 and 2/1, the XRD results show the expected phases of Fe3P (Fig. 2.2a)
and Fe2P (Fig. 2.3b). Comparison is made with standards from the powder diffraction file
(PDF) (37) as indicated in the figure. For the sample with Fe: P ratio of 1/1, the obtained
phase was still Fe2P (Fig. 2.3c), and there was a deficiency in phosphorus. Similarly, for
the sample with an Fe/P ratio of 1/2, the observed phase was FeP. Thus, although the
preparations were carried out with stoichiometric quantities of metal and phosphorus, the
final products tended to be metal-rich.
20
Figure 2.3. X-ray diffraction patterns of iron phosphides (PDF file references are also
included)
There are probably several processes which contributed to the loss of phosphorus in
these samples. Some of the loss may have occurred during the TPR process as traces of
PH3 were detected in the mass spectrometer signal and some volatile products were
observed to condense at the exit of the reactor. Some of the loss probably also occurred in
the calcination step at 773 K to form the phosphate precursor. A small amount of a white
solid was found to have sublimed onto the lid of the ceramic calcination vessel. This was
10 20 30 40 50 60 70 80 90
3
a)
PDF 19-6170 Fe P
Fe/P=1/2
2
b)
PDF 33-670 Fe P
Fe/P=1/1
2
c)
PDF 33-670 Fe P
Fe/P=2/1
d)
PDF 39-809 FeP
Inte
nsity
/ a.
u.
Fe/P=3/1
2θ / Degrees
21
likely to be P2O5 with a melting point of 563 K, and sublimation temperature of 787 K.
The loss of P was observed in all samples with high P levels. There is also a possibility
that some extra phosphorus in amorphous form remained mixed in the samples, and that
the observed phases were simply the stable ones under the preparation conditions.
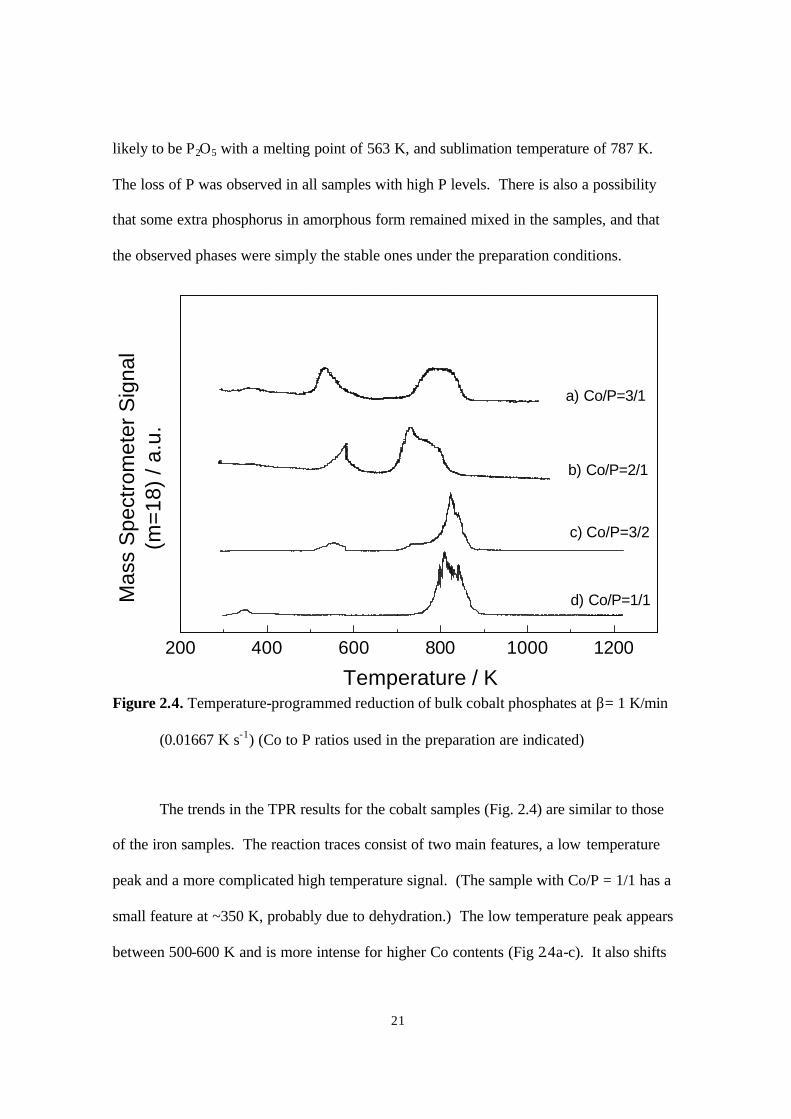
Figure 2.4. Temperature-programmed reduction of bulk cobalt phosphates at β= 1 K/min
(0.01667 K s-1) (Co to P ratios used in the preparation are indicated)
The trends in the TPR results for the cobalt samples (Fig. 2.4) are similar to those
of the iron samples. The reaction traces consist of two main features, a low temperature
peak and a more complicated high temperature signal. (The sample with Co/P = 1/1 has a
small feature at ~350 K, probably due to dehydration.) The low temperature peak appears
between 500-600 K and is more intense for higher Co contents (Fig 2.4a-c). It also shifts
200 400 600 800 1000 1200
d) Co/P=1/1
c) Co/P=3/2
b) Co/P=2/1
a) Co/P=3/1
Mas
s S
pect
rom
eter
Sig
nal
(m
=18)
/ a.
u.
Temperature / K
22
to lower temperature with increasing Co content. This behavior is consistent with the
reduction of a cobalt oxide species. The higher temperature signal appears between 700-
900 K and probably corresponds to the reduction of cobalt phosphate, which is expected to
be more difficult to reduce. It is the main feature for the Co/P = 1/1 sample (Fig. 2.4d).
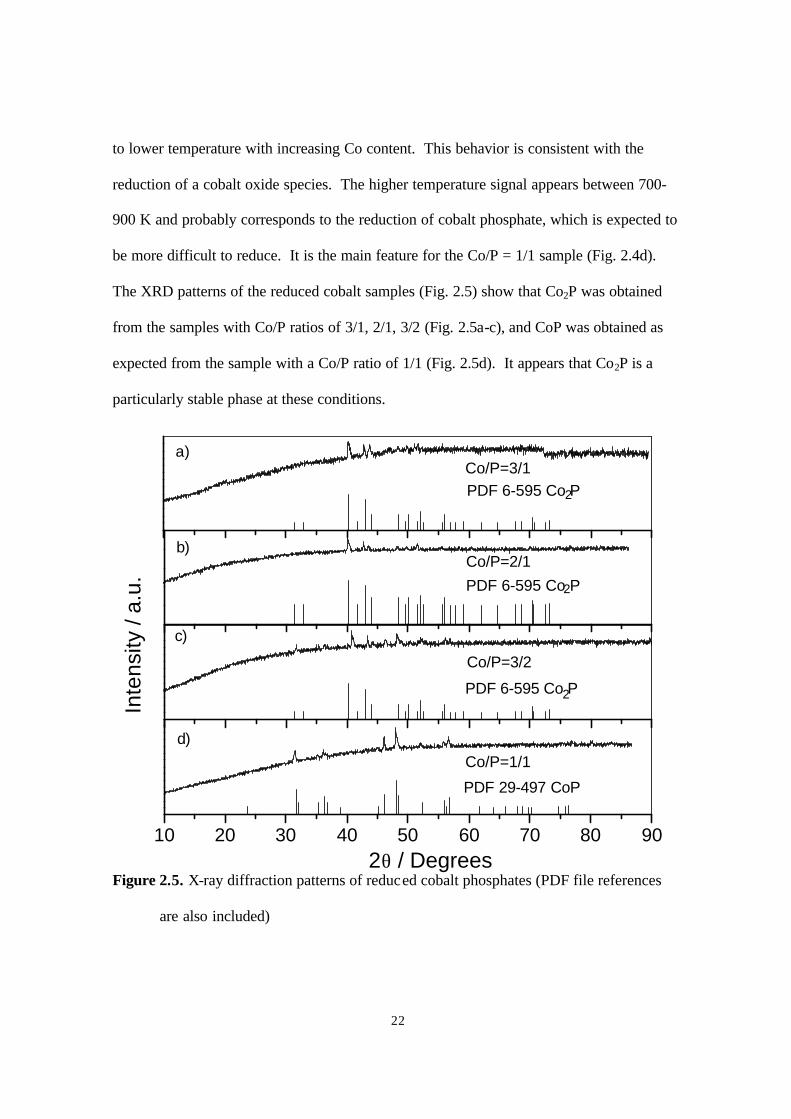
The XRD patterns of the reduced cobalt samples (Fig. 2.5) show that Co2P was obtained
from the samples with Co/P ratios of 3/1, 2/1, 3/2 (Fig. 2.5a-c), and CoP was obtained as
expected from the sample with a Co/P ratio of 1/1 (Fig. 2.5d). It appears that Co2P is a
particularly stable phase at these conditions.
Figure 2.5. X-ray diffraction patterns of reduced cobalt phosphates (PDF file references
are also included)
10 20 30 40 50 60 70 80 90
2PDF 6-595 Co P
a)
Co/P=1/1
2PDF 6-595 Co P
b)
Co/P=3/2
2PDF 6-595 Co P
c)
Co/P=2/1
Inte
nsity
/ a.
u.
2θ / Degrees
d)
PDF 29-497 CoP
Co/P=3/1

23
Figure 2.6. Temperature-programmed reduction of bulk nickel phosphates at β= 1 K/min
(0.01667 K s-1) (Ni to P ratios used in the preparation are indicated)
The same trends in the TPR traces were also observed with the nickel samples (Fig.
2.6). The reduction features were a composite of different peaks, occurring in a low
temperature range at 500 – 700 K, and at a high temperature range of 700 – 850 K. These
various features are attributed again to the reduction of different compounds, likely nickel
oxides and nickel oxide phosphate at the low temperatures and nickel phosphate at the high
temperatures. As expected, Ni3P was observed in the sample with a Ni/P ratio of 3/1 (Fig.
2.7a). But for the Ni/P ratios of 2/1, 3/2, and 1/1 (Fig. 2.7b-d), the phase obtained was
Ni2P. Probably, this is the stable phase at the conditions of the preparation, since not all
200 400 600 800 1000 1200
c) Ni/P=3/2
d) Ni/P=1/1
b) Ni/P=2/1
a) Ni/P=3/1
Mas
s S
pect
rom
eter
Sig
nal
(
m=1
8) /
a.u.
Temperature / K
24
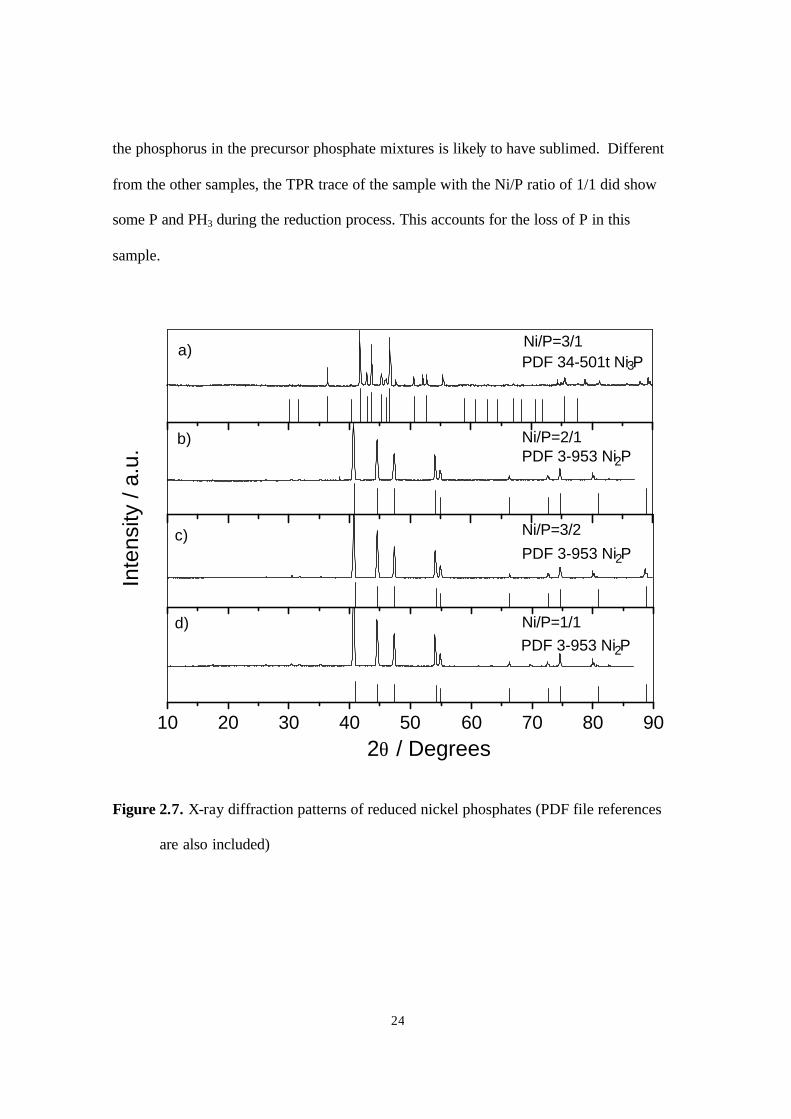
the phosphorus in the precursor phosphate mixtures is likely to have sublimed. Different
from the other samples, the TPR trace of the sample with the Ni/P ratio of 1/1 did show
some P and PH3 during the reduction process. This accounts for the loss of P in this
sample.
Figure 2.7. X-ray diffraction patterns of reduced nickel phosphates (PDF file references
are also included)
10 20 30 40 50 60 70 80 90
3PDF 34-501t Ni Pa)
Ni/P=1/1
2PDF 3-953 Ni Pb)
Ni/P=3/2
Ni/P=2/1
2PDF 3-953 Ni Pc)
Inte
nsity
/ a.
u.
2PDF 3-953 Ni Pd)
Ni/P=3/1
2θ / Degrees
25
To summarize these TPR and XRD results, the reduction of phosphate precursors
occurs readily in the Fe, Co, and Ni systems, with maximum temperatures of about 900 K.
A number of bulk phosphide compounds can be produced depending on the stoichiometric
proportions of M/P used, but the Fe2P, CoP and Ni2P products are the preferred phases
under the experimental conditions used in this study.
2.3.2 Properties and preparation of supported phosphides
In order to study the catalytic properties of the Fe, Co and Ni samples high surface
area materials were desired, and therefore, the phosphides were prepared in supported form
using silica as the carrier. The preparation involved the same steps used in the synthesis of
the bulk compounds. First, phosphates were prepared on the support and then were
reduced by TPR. The final temperatures for preparing hydrotreating catalysts were
determined by noting the point where the intensity of the water signal returned to baseline
in preliminary TPR test measurements on small samples. The final temperature for
supported iron, cobalt, nickel samples were 1000 K, 900 K, and 850 K, respectively (Fig.
2.8). Silica was selected as the carrier because in dehydrated form has few acid and base
sites and is likely to offer minimal support interaction to affect the properties of the
phosphides. Thus, the intrinsic activity of the phosphides could be determined.
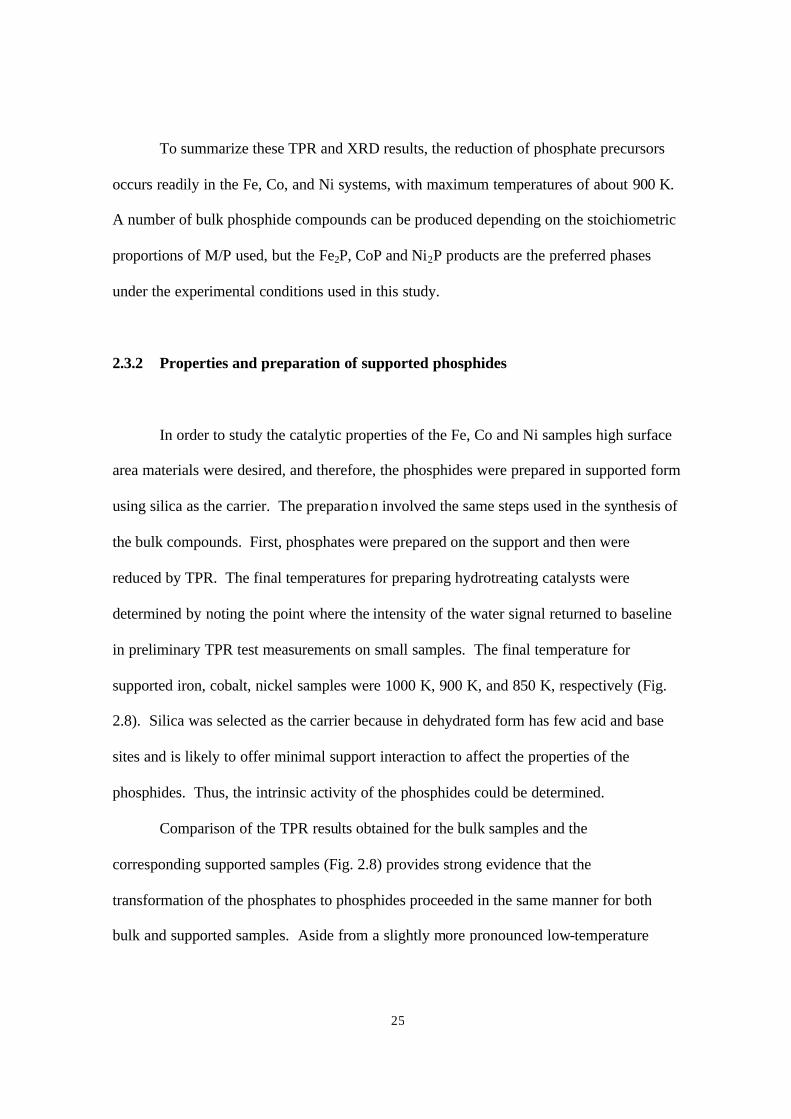
Comparison of the TPR results obtained for the bulk samples and the
corresponding supported samples (Fig. 2.8) provides strong evidence that the
transformation of the phosphates to phosphides proceeded in the same manner for both
bulk and supported samples. Aside from a slightly more pronounced low-temperature
26
dehydration feature for the supported samples, the TPR traces for the samples of iron and
cobalt were very similar to those of the unsupported forms. The reduction trace of the
supported nickel sample was somewhat simpler than that of the bulk sample, but occurred
at essentially the same temperature range.
Figure 2.8. TPR comparison of supported and unsupported catalysts at β= 1 K/min
(0.01667 K s-1).
The characterization results for the bulk and supported samples are reported in
Table 2.3. The specific surface areas (Sg) of the bulk materials were low, approximately 3
m2g-1, while those of the supported materials were close to that of the support (90 m2g-1).
b) Fe2PO
4
a) Fe2PO
4/SiO
2
Fe/P=2/1
200 400 600 800 1000 1200
Mas
s S
pect
rom
eter
Sig
nal
(m=1
8) /
a.u.
f) NiPO4
e) NiPO4/SiO
2
Ni/P=1/1
Temperature / K
d) CoPO4
c) CoPO4/SiO
2
Co/P=1/1

27
The experimental CO uptakes of the samples are reported in the third column of Table 2.3.
They were low for the bulk materials but increased for the supported samples.
Table 2.3. Characterization results of samples
Samples
BET Surface
area
Sg / m2g-1
CO uptake
µmol g-1
Dp
nm
Dc
nm
Metal site
concentration
µmol g-1
Fe2P 2.7 3 330 38 45
Fresh Fe2P/Silica 97 16 23 90
Spent Fe2P/Silica 83 0 23 90
CoP 3.1 3 310 40 51
Fresh CoP/Silica 87 16 21 72
Spent CoP/Silica 90 4 21 72
Ni2P 3.3 4 260 36 55
Fresh Ni2P/Silica 98 15 20 67
Spent Ni2P/Silica 100 13 20 67
The particle diameter of the bulk materials was calculated by the equation DP =
6/ρSg using their surface area and the bulk density (Table 2.2). The particle sizes for the
bulk Fe2P, CoP, and Ni2P samples were similar, about 260-330 nm (Table 2.3). The
crystallite sizes (Dc) were obtained from the Scherrer equation presented in the
28
experimental section. The crystallite sizes for the bulk phosphides were again similar,
about 36-40 nm. For all the bulk samples, Dp > Dc, and this could be due to strain and
disorder in the crystallites or crystallite agglomeration. The latter is probably the larger
contributor as no support was used to stabilize the samples.
The last column in Table 2.3 reports the theoretical metal site concentration
assuming that the samples were composed of uniform spherical particles. It was calculated
from the equation
Metal site concentration = fnSg ⋅⋅
where Sg is specific surface area, n is the surface metal atom density, and f is the fractional
weight loading (e.g., g Fe2P/g catalyst) of the sample (Table 2.2.1). For the bulk samples
the actual Sg was employed, while for the supported samples it was calculated from the
crystallite size using the equation Sg = 6/ρDc. The last factor, f, accounts for the loading of
the active phase on the supported samples.
In all cases the experimental CO uptake was considerably smaller (average 6.6 %
for the bulk samples, average 20.5 % for the fresh supported samples) than the
theoretically expected metal site concentration (Table 2.3) for a clean surface. This
indicates that possibly the surface is blocked by some species that prevents adsorption such
as phosphorus or unreduced oxygen. In the case of transition metal carbides it is found
that oxygen uptakes are considerably higher than CO uptakes (38,39), and this suggests
that oxygen should be tried as a chemisorption probe.

29
The effect of the heating rate on the peak temperature (Tp) associated with the
reduction of supported catalysts (Fig. 2.2.9) was briefly examined in this work. The peak
positions for water formation shifted about 40-60 K to higher temperature as the heating
rate (β) was increased from 0.0167 (1 K min-1) to 0.0833 K s-1 (5 K min-1). According to
temperature-programmed reaction theory (40), the peak temperature (Tp), is related to the
heating rate (β) and the apparent activation energy (Ea) (Table 2.4) by the Redhead
equation (2 ln Tp – ln β = Ea/RTp + Constant) (40). The activation energies found for
Fe2P/silica, CoP/silica and Ni2P/silica were 200 kJ mol-1, 220 kJ mol-1 and 150 kJ mol-1,
respectively. The results here are comparable with the activation energy of oxygen
diffusion in the corresponding metal oxides, FeO, CoO and NiO, which are 126, 144 and
166 kJ mol-1, respectively, with preexponential factors of 1.4x10⁻², 2.15x10⁻³ and 2x10⁻⁴
cm2 s-1 (41). The correspondence is reasonable as many solid state transformations are
governed by diffusion processes (42).
30
Figure 2.9. TPR profiles of supported catalysts at different heating rate (β)
a) β= 5 K/min (0.08333 K s-1); b) β= 1 K/min (0.01667 K s-1)
Table 2.4. Apparent activation energy (Ea) of synthesis of the supported catalysts
Samples Ea / kJ mol-1
Fresh 14 wt. % Fe2P/Silica 200
Fresh 9.4 wt. % CoP/Silica 220
Fresh 9.4 wt. % Ni2P/Silica 150
4 22
b)
a)
Mas
s S
pect
rom
eter
Sig
nal
(
m=1
8) /
a.u.
Fe PO /SiO Fe/P=2/1
24
b)
a)
Temperature / K
CoPO /SiO Co/P=1/1
200 400 600 800 1000 1200
4 2
b)
a)
NiPO /SiO Ni/P=1/1
31
Figure 2.10. Hydrodesulfurization performance of supported catalysts. (Basis: 35 µmol
of chemisorption sites)
0 20 40 60 80 100 1200
20
40
60
80
100
Fe/P=2/1
Co/P=1/1
22
2
22
c) Fe P / SiO
b) CoP / SiO
a) Ni P / SiO Ni/P=1/1
% C
onve
rsio
n H
DS
Time / h
32
Figure 2.11. Hydrodenitrogenation performance of supported catalysts. (Basis: 35 µmol
of chemisorption sites)
2.3.3 Catalytic activity in hydroprocessing
Figure 2.10 and Figure 2.11 present the HDS and HDN activities for the reactions
of dibenzothiophene and quinoline, respectively. All three samples have high initial
activities for HDS and HDN. However, except for the nickel sample in HDS, all catalysts
undergo deactivation. The Fe2P/SiO2 lost all HDS and HDN activity by 60 h, while the
CoP/SiO2 appeared to reach a baseline of about 32 % HDS and 31 % HDN at around 100
h. Only the Ni2P/SiO2 had good, stable activity in HDS. The HDS sequence for the three
0 20 40 60 80 100 1200
20
40
60
80
100
Fe/P=2/1
Ni/P=1/1
Co/P=1/1
2
22
2
2
c) Fe P / SiO
b) CoP / SiO
a) Ni P / SiO % C
onve
rsio
n H
DN
Time /h
33
samples was Ni2P/SiO2 > CoP/ SiO2> Fe2P/ SiO2, while the HDN sequence was: CoP/ SiO2
> Ni2P/ SiO2 > Fe2P/ SiO2. Compared with a commercial Ni-Mo-S/ γ-Al2O3 catalyst at the
same conditions (20), Ni2P/SiO2 had a higher HDS activity with 90 % versus 76 %
conversion, but a lower HDN activity with 14 % versus 38 % conversion. The
measurements were made on the basis of equal chemisorption sites loaded in the reactor
(35 µmol for the phosphides, 33 µmol for the sulfide). For the phosphides CO at room
temperature was used for the chemisorption and for the sulfide O2 at dry ice/acetone
temperature. It may be that the CO chemisorption underestimates sites on the phosphide,
so the conversions should be taken just as an approximation of intrinsic activity.
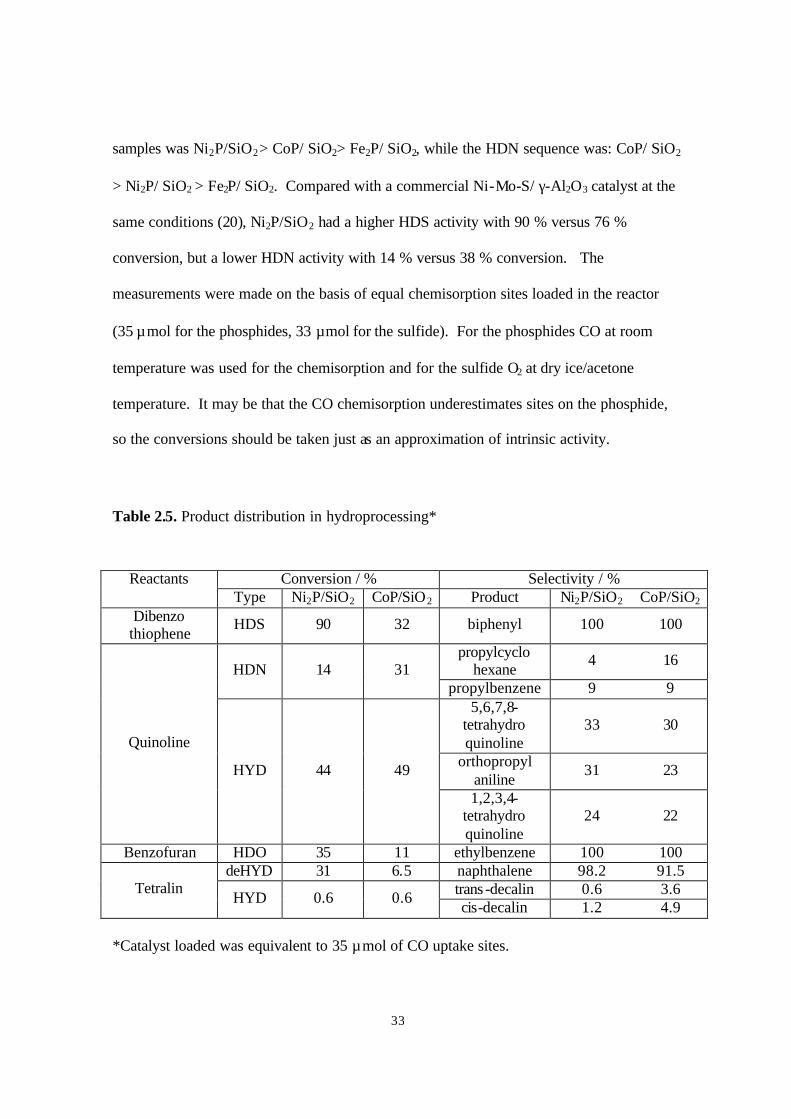
Table 2.5. Product distribution in hydroprocessing*
Conversion / % Selectivity / % Reactants
Type Ni2P/SiO2 CoP/SiO2 Product Ni2P/SiO2 CoP/SiO2 Dibenzo
thiophene HDS 90 32 biphenyl 100 100
propylcyclo hexane
4 16 HDN 14 31
propylbenzene 9 9 5,6,7,8-
tetrahydro quinoline
33 30
orthopropyl aniline
31 23
Quinoline
HYD 44 49
1,2,3,4-tetrahydro quinoline
24 22
Benzofuran HDO 35 11 ethylbenzene 100 100 deHYD 31 6.5 naphthalene 98.2 91.5
trans -decalin 0.6 3.6 Tetralin HYD 0.6 0.6
cis-decalin 1.2 4.9 *Catalyst loaded was equivalent to 35 µmol of CO uptake sites.
34
A listing of conversions and selectivities for all the reactions is provided in Table
2.5. For dibenzothiophene the only product observed was biphenyl. However, for
quinoline a number of species were obtained, and these were categorized as HDN products
and hydrogenation (HYD) products. For benzofuran, again only one product was obtained,
ethylbenzene. The amount of benzofuran used was small (500 ppm) and the reaction is
facile so is unlikely to interfere with the HDS and HDN reactions, as known from other
studies with carbides, nitrides, and sulfides (43,44). In the case of tetralin, at the reaction
conditions the major species obtained was the dehydrogenation product naphthalene,
although small amounts of cis - and trans -decalin were also observed.
Table 2.6. Rates of HDS and HDN of the supported catalysts
Turnover rate1 / 10-3 s-1
Areal rate2 / 1015 molec m-2 s-1
Specific rate3 / 108 mol g-1s-1
Volumetric rate4/ 109 mol cm-3 s -1
Sample
HDS HDN HDS HDN HDS HDN HDS HDN
Fe2P/SiO2(Fe/P=2/1) 0 0 0 0 0 0 0 0
CoP/SiO2(Co/P=1/1) 0.81 1.2 1.4 2.1 1.3 1.9 4.8 7.0
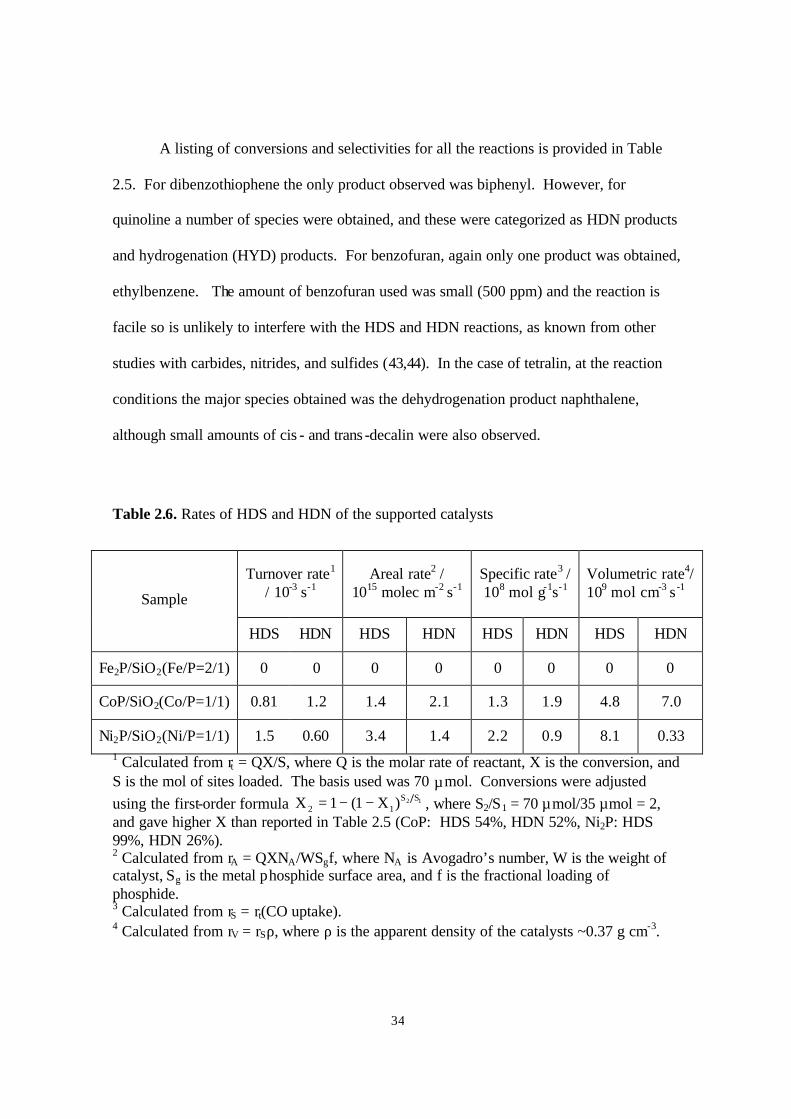
Ni2P/SiO2(Ni/P=1/1) 1.5 0.60 3.4 1.4 2.2 0.9 8.1 0.33 1 Calculated from rt = QX/S, where Q is the molar rate of reactant, X is the conversion, and S is the mol of sites loaded. The basis used was 70 µmol. Conversions were adjusted using the first-order formula 12 SS
12 )X1(1X −−= , where S2/S1 = 70 µmol/35 µmol = 2, and gave higher X than reported in Table 2.5 (CoP: HDS 54%, HDN 52%, Ni2P: HDS 99%, HDN 26%). 2 Calculated from rA = QXNA/WSgf, where NA is Avogadro’s number, W is the weight of catalyst, Sg is the metal phosphide surface area, and f is the fractional loading of phosphide. 3 Calculated from rS = rt(CO uptake). 4 Calculated from rV = rSρ, where ρ is the apparent density of the catalysts ~0.37 g cm-3.
35
Turnover rates and areal rates measured at the baseline levels are listed in Table
2.6. The basis of comparison is now 70 µmol of sites, to make the numbers directly
comparable to others presented in this thesis and published elsewhere (45). The procedure
for conversion assumes a first-order reaction and is given in the footnotes of the table. The
turnover rates are based on the experimentally determined CO uptakes on the fresh
catalysts, while the areal rates are based on the calculated surface area of the phosphide
crystallites using Sg = 6/ρDc and the weight loading factor f. The Fe2P catalyst deactivated
completely and its rate is reported as zero. The CoP/SiO2 had areal rates of 1.4 x 10¹⁵
molec m-2s -1 in HDS and 2.1 x 10¹⁵ molec m-2s-1 in HDN, while the Ni2P/SiO2 had rates of
3.4 x 10¹⁵ molec m-2s-1 in HDS and 1.4 x 10¹⁵ molec m-2s-1 in HDN. In a recent study of
the HDN on unsupported samples Stinner, et al. report areal rates of 4.8 x10¹⁶ molec m-2s-1
on Co2P and 5.8 x 10¹⁶ molec m-2s-1 on Ni2P (22). The higher HDN rates on those samples
can be attributed to several factors. First, Stinner, et al. studied only HDN and employed a
more reactive substrate (o-propylaniline rather than quinoline), which probably led to
higher rates. They also carried out their tests without using sulfur compounds in the feed.
Sulfur compounds can lead to competitive adsorption and lower rates. Finally, Stinner, et
al. used low surface area (1-3 m2g-1) unsupported materials in a low-conversion regime,
which would tend to result in higher rates. Nevertheless, despite the differences in
experimental conditions the rates are of a similar order of magnitude.
36
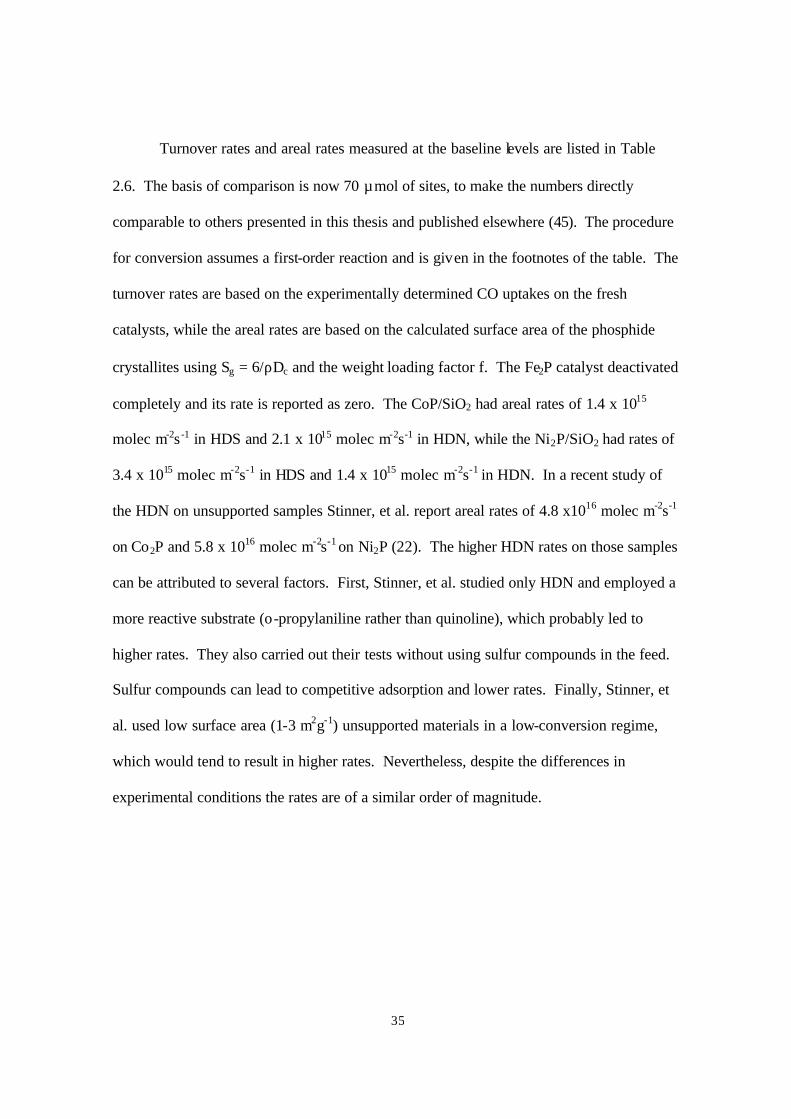
Figure 2.12. X-ray diffraction patterns of iron phosphides and references
a) Blank sample-SiO2; b) Spent sample Fe2P/SiO2; c) Fresh sample Fe2P/SiO2;
d) Bulk sample Fe2P; e) PDF 33-670 Fe2P (Ref. 41)
The XRD patterns of the silica support, fresh phosphide samples, spent samples,
and PDF references are compared in Figures 2.12-2.14. These results show that silica did
not influence the phases of the phosphides formed, which were the same as those obtained
in the bulk materials, Fe2P, CoP, and Ni2P. The XRD patterns for the spent iron and cobalt
samples were unchanged from the corresponding fresh samples, which shows that the Fe2P
phase (Fig. 2.12) and CoP phase (Fig. 2.13) are stable during the hydrotreating reaction.
10 20 30 40 50 60 70 80 90
Fe/P=2/1
Fe/P=2/1
22
2
2
2 2
2
e) PDF 33-670 Fe P
d) Bulk Fe P
c) Fresh Fe P/SiO
Inte
nsity
/ a.
u.
2θ / Degrees
b) Spent Fe P/SiO
a) SiO
37
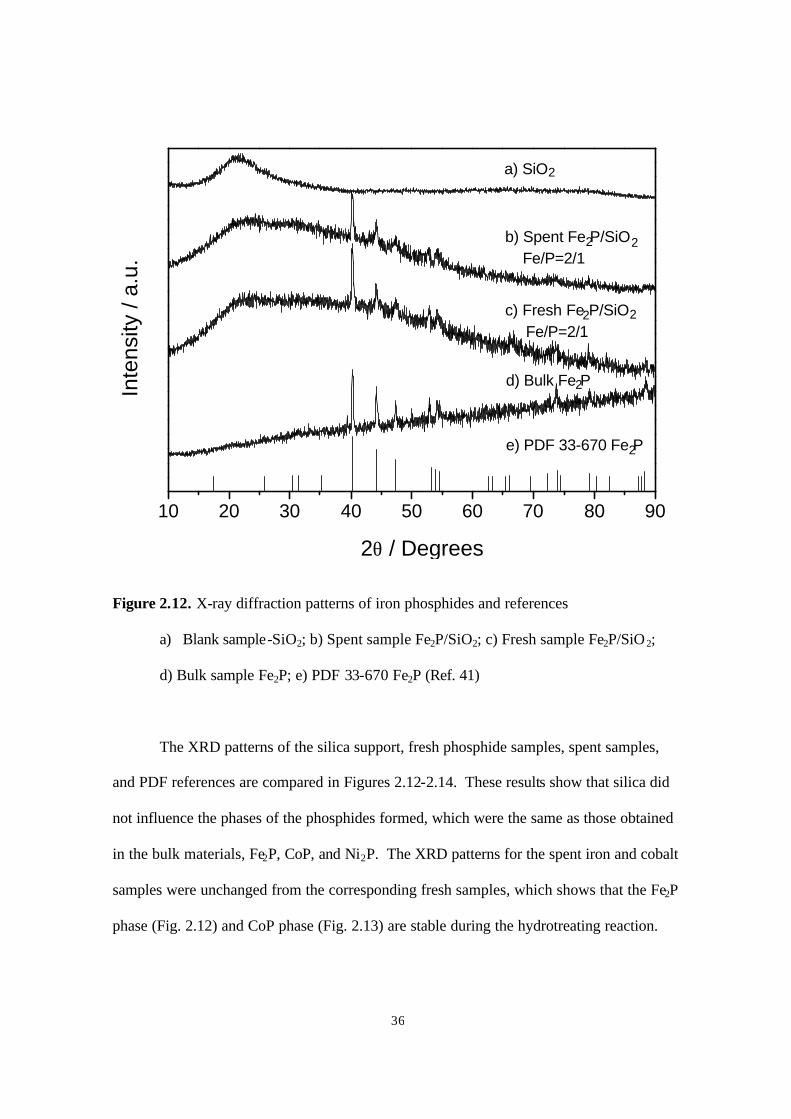
Figure 2.13. X-ray diffraction patterns of cobalt phosphides and references
a) Blank sample-SiO2; b) Spent sample CoP/SiO2; c) Fresh sample CoP/SiO2;
d) Bulk sample CoP; e) PDF 29-497 CoP (Ref. 41)
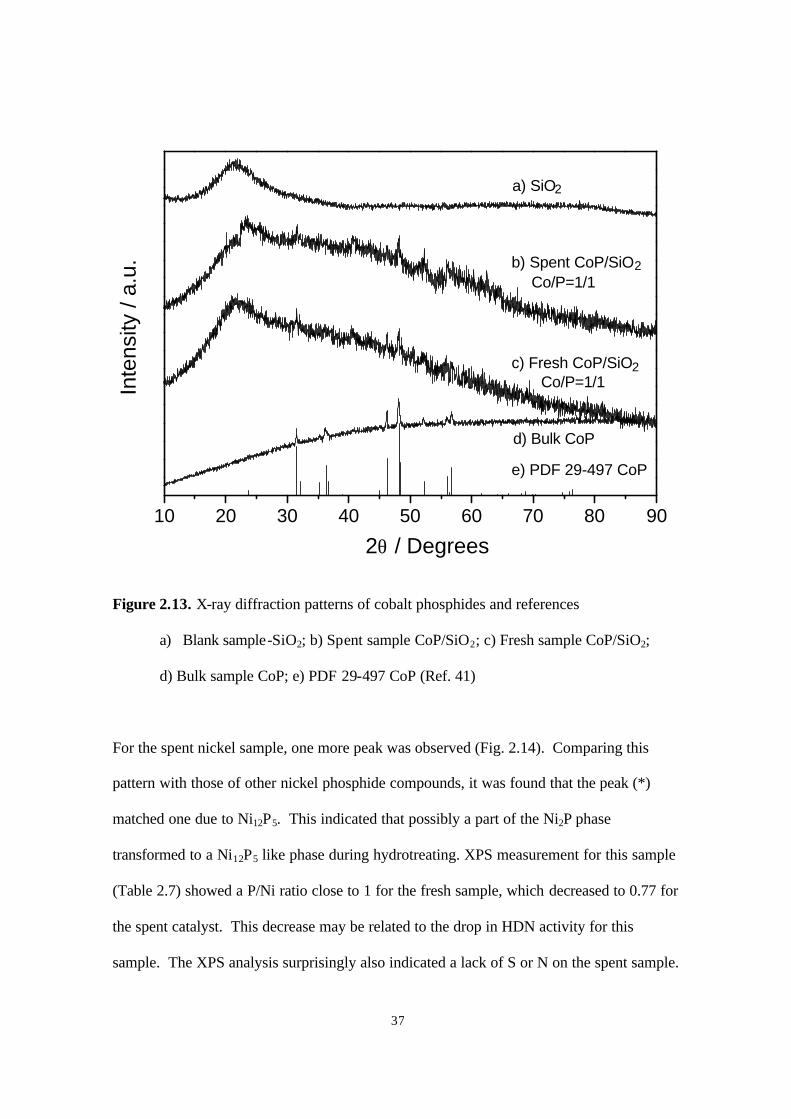
For the spent nickel sample, one more peak was observed (Fig. 2.14). Comparing this
pattern with those of other nickel phosphide compounds, it was found that the peak (*)
matched one due to Ni12P5. This indicated that possibly a part of the Ni2P phase
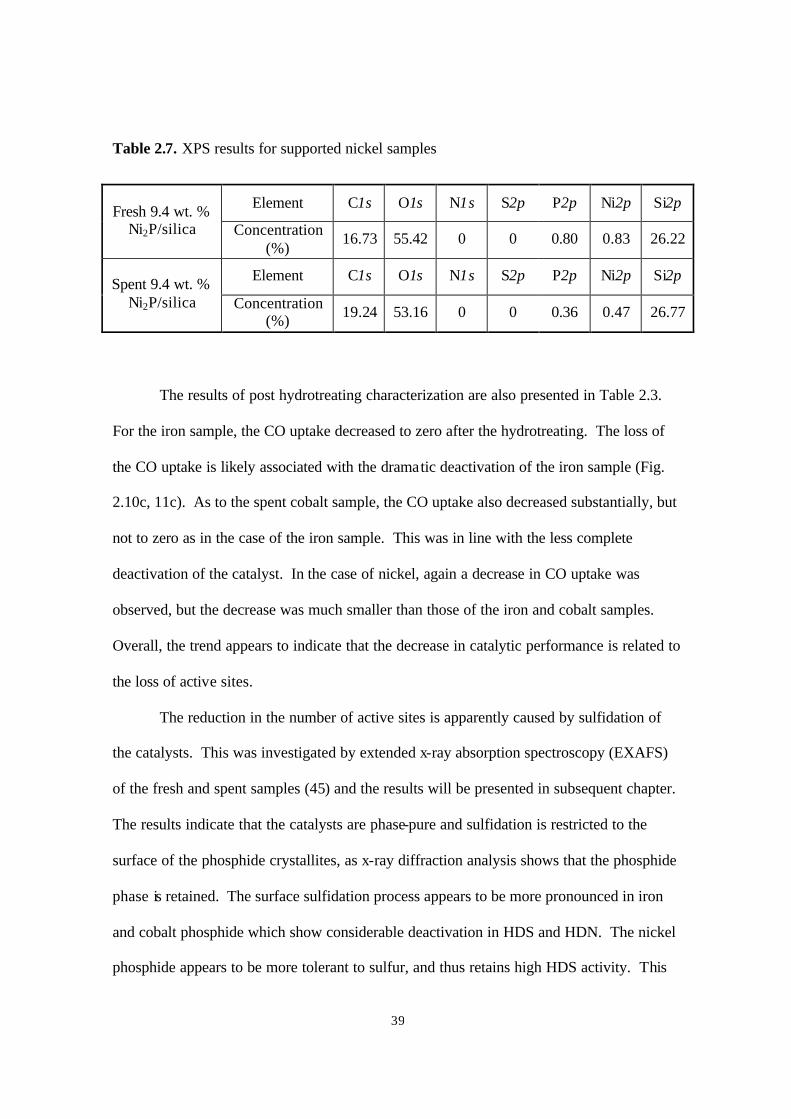
transformed to a Ni12P5 like phase during hydrotreating. XPS measurement for this sample
(Table 2.7) showed a P/Ni ratio close to 1 for the fresh sample, which decreased to 0.77 for
the spent catalyst. This decrease may be related to the drop in HDN activity for this
sample. The XPS analysis surprisingly also indicated a lack of S or N on the spent sample.
10 20 30 40 50 60 70 80 90
Co/P=1/1
Co/P=1/1
2
2
2
e) PDF 29-497 CoP
Inte
nsity
/ a.
u.
d) Bulk CoP
c) Fresh CoP/SiO
b) Spent CoP/SiO
a) SiO
2θ / Degrees
38
The measurements were repeated on samples treated in He (just to remove volatile
compounds), but the results were the same. This is likely due to lack of sensitivity by XPS
at the levels expected for surface sulfur species in these supported samples. Already the
signals for Ni and P were very low.
Figure 2.14. X-ray diffraction patterns of nickel phosphides and references
a) Blank sample-SiO2; b) Spent sample Ni2P/SiO2; c) Fresh sample Ni2P/SiO2;
d) Bulk sample Ni2P; e) PDF 3-953 Ni2P (Ref. 41)
10 20 30 40 50 60 70 80 90
Ni/P=1/1
Ni/P=1/1
2
2
22
22
2
*
e) PDF 3-953 Ni P
2θ / Degrees
Inte
nsity
/ a.
u.
d) Bulk Ni P
c) Fresh Ni P/SiO
b) Spent Ni P/SiO
a) SiO
39
Table 2.7. XPS results for supported nickel samples
Element C1s O1s N1s S2p P2p Ni2p Si2p Fresh 9.4 wt. % Ni2P/silica Concentration
(%) 16.73 55.42 0 0 0.80 0.83 26.22
Element C1s O1s N1s S2p P2p Ni2p Si2p Spent 9.4 wt. % Ni2P/silica Concentration
(%) 19.24 53.16 0 0 0.36 0.47 26.77
The results of post hydrotreating characterization are also presented in Table 2.3.
For the iron sample, the CO uptake decreased to zero after the hydrotreating. The loss of
the CO uptake is likely associated with the dramatic deactivation of the iron sample (Fig.
2.10c, 11c). As to the spent cobalt sample, the CO uptake also decreased substantially, but
not to zero as in the case of the iron sample. This was in line with the less complete
deactivation of the catalyst. In the case of nickel, again a decrease in CO uptake was
observed, but the decrease was much smaller than those of the iron and cobalt samples.
Overall, the trend appears to indicate that the decrease in catalytic performance is related to
the loss of active sites.
The reduction in the number of active sites is apparently caused by sulfidation of
the catalysts. This was investigated by extended x-ray absorption spectroscopy (EXAFS)
of the fresh and spent samples (45) and the results will be presented in subsequent chapter.
The results indicate that the catalysts are phase-pure and sulfidation is restricted to the
surface of the phosphide crystallites, as x-ray diffraction analysis shows that the phosphide
phase is retained. The surface sulfidation process appears to be more pronounced in iron
and cobalt phosphide which show considerable deactivation in HDS and HDN. The nickel
phosphide appears to be more tolerant to sulfur, and thus retains high HDS activity. This

40
is entirely reproducible. It’s HDN activity is lowered, probably because the latter reaction
is structure-sensitive (45), and the site requirements for nitrogen removal are disrupted.
2.4 Conclusions
Pure Fe2P, CoP, and Ni2P, phases were successfully synthesized by means of
temperature-programmed reduction of the corresponding phosphates. The silica-supported
forms of these samples were also successfully prepared, with retention of the active phase
and increased CO uptake and BET surface area. It was found that Fe2P/SiO2 had good
initial activity for HDS of dibenzothiophene and HDN of quinoline, but that this activity
fell to zero in about 60 h. The CoP/SiO2 catalyst also deactivated, but appeared to reach a
stable baseline of 32 % HDS and 31 % HDN conversion. Only the Ni2P/SiO2 had a stable
and high conversion in HDS of 90 %, although its HDN was low at 14 %. The
deactivation in all cases was associated with a decrease in the number of surface metal
sites as titrated by the chemisorption of CO. For the most promising catalyst Ni2P/SiO2,
HDS was higher than that of a commercial catalyst Ni-Mo-S/γ-Al2O3, based on equal sites
loaded in the reactor as measured by CO uptake for the phosphide and low-temperature O2
chemisorption for the sulfide. The development and improvement of this group of
phosphides in the hydroprocessing field is a promising area of research.
References
1. Aronsson, B., Lundström, T., Rundqvist, S., “Borides, Silicides and Phosphides”,
Wiley, New York, 1965.
41
2. Boudart, M., Cusumano, J. A., Levy, R. B., “New catalytic materials for the
liquefaction of Coal, Research project 415, final report”, p. 184, Catalytica
Associates, Inc., 5 Palo Alto Square, Palo Alto, California, 1975.
3. Damyanova, S., Spojakina, A., Vit, Z., Collect. Czech. Chem. Commun., 57, 1033
(1992).
4. Ozkan, U. S., Zhang, L. P., Ni, S. Y., Moctezuma, E., J. Catal., 148, 181 (1994).
5. Gulková, D., Zdražil, M., Collect.Czech. Chem. Commun., 64, 735 (1999).
6. Poulet, O., Hubaut, R., Kasztelan, S., Grimblot, J., Bull. Soc. Chim. Belg. European
Section, 100 (11-12), 857(1991).
7. Fitz, C. W., Jr., Rase, H. F., Ind. Eng. Chem. Prod. Res. Dev., 22, 40 (1983).
8. Lewis, J. M., Kydd, R. A., Boorman, P., M., Van Rhyn, P. H., Appl. Catal. A 84,
103 (1992).
9. Jian, M., Rico Cerda, J. L., Prins, R., Vth Workshop on Hydrotreating Catalysis,
European Section, 225 (1995).
10. Jian, M., Prins, R., Catal. Lett., 35, 193 (1995).
11. Atasanova, P., Tabakova, T., Vladov, Ch., Halachov, T., Lopez Agudo, A., Appl.
Catal. A, 161, 105 (1997).
12. Mangnus, P. J., Van Veen, J. A. R., Eijsbouts, S., De Beer, V. H. J., Moulijn, J. A.,
Appl. Catal. 61, 99 (1990).
13. Iwamoto, R., Grimblot, J., Adv. Catal., 44, 417 (1999).
14. Chadwick, D., Aitchison, D. W., Badilla-Ohlbaum, R., and Josefsson, L., Stud. Surf.
Sci. Catal. 16, 323 (1982).
42
15. Eijsbouts, S., van Gestel, J. N. M., van Veen, J. A. R., de Beer, V. H. J., Prins, R., J.
Catal., 131, 412 (1991).
16. López Agudo, A., López Cordero, R., Palacios, J. M., Fierro, J.L., Vth Workshop on
Hydrotreating Catalysis, European Section, Lille- Villeneuve d’Ascq, 237 (1995).
17. Robinson, W. R. A. M., van Gestel, J. N. M., Korányi, T. I., Eijsbouts, S., van der
Kraan, A. M., van Veen, J. A. R., and de Beer, V. H. J., J. Catal. 161, 539 (1996).
18. Li, W., Dhandapani, B., and Oyama, S.T., Chem. Lett., 207 (1998).
19. Oyama, S. T., Clark P., Teixeira da Silva, V. L. S., Lede, E. J., Requejo, F. G., J.
Phys. Chem. B 105, 4961 (2001).
20. Clark, P., Li. W., Oyama, S. T., J. Catal. 200, 140(2001).
21. Stinner, C., Prins, R., Weber, Th. , J. Catal. 191, 438(2000).
22. Stinner, C., Prins, R., Weber, Th., J. Catal. 202, 187 (2001).
23. Nozaki, F., Kitoh, T., Sodesawa, T., J. Catal., 62, 286 (1980).
24. Nozaki, F., Tokumi, M., J. Catal., 79, 207 (1983).
25. Nozaki, F., Adachi, R., J. Catal. 40, 166 (1975).
26. Wang, W., Qiao M., Li, H., Deng, J., Appl. Catal. A: 166, L243 (1998).
27. Robinson, W. R. A. M., van Gestel, J. N. Korányi, M , Eijsbouts, T. I. , S. , van der
Kraan, A. M , van Veen, J. A. R., de Beer, V. H. J., J. Catal. 161, 539 (1996).
28. Lee, S. -P., Chen, Y.-W., J. Mol. Catal. A 152, 213 (2000).
29. Li, H., Wang, W., Li, H., Deng, J.-F. , J. Catal. 194, 211 (2000).
30. Guinier, A. “X-Ray Diffraction in Crystals, Imperfect Crystals, and Amorphous
Bodies”, p. 121, W. H. Freeman and Company, San Francisco, 1963.
43
31. Warren, B.E., “ X-Ray Diffraction”, p. 254, Addison-Wesley Publishing Company,
Menlo Park, California, 1969.
32. Cullity, B.D., “Elements of X-Ray Diffraction”, 2nd Ed., p. 102, Addison-Wesley
Publishing Company, Menlo Park, California, 1978.
33. Ramanathan, S., Oyama, S. T., J. Phys. Chem., 99 (44), 16365 (1995).
34. Carlsson, B., Gölin, M., and Rundqvist, S., J. Sol. St. Chem. 8, 57 (1973).
35. Rundqvist, S., Acta Chem. Scand. 16, 992 (1962).
36. Rundqvist, S., Acta Chem. Scand. 16, 287 (1962).
37. Powder Diffraction Data Files, JCPDS International Center for Diffraction Data,
Swathmore, PA, 1992.
38. St. Clair, T. P., Dhandapani, B., Oyama, S. T., Catal. Lett. 58, 169 (1999).
39. St. Clair, T. P., Oyama, S. T., Cox, D. F., Surf. Sci. 468, 62 (2000).
40. Boudart M., Djéga-Mariadassou G., “Kinetics of Heterogeneous Catalytic
Reactions, Physical Chemistry: Science and Engineering”, p.57, Princeton University
Press, Princeton, New Jersey, 1984.
41. O’Keeffe, M., Diffusion in Oxide and Sulfides, Sintering and Related Phenomena;
Proc. Intl. Conf., Kuczynski, G. C., Hooton, N. A., and Gibbon, C. F., Eds., Gordon
and Breach, New York, 1967.
42. Bruke, J., “The Kinetics of Phase Transformations in Metals”, Pergamon, Oxford,
1965.
43. Dhandapani, B., St. Clair, T., Oyama, S. T., Appl. Catal. A: Gen. 168, 219 (1998).
44. Ramanathan, S., Yu, C. C., Oyama, S. T., J. Catal. 173, 10 (1998).
45. Wang, X., Lee, Y.-K., Oyama, S. T., Bando, K., Requejo, F. G., J. Catal., Submitted.
44
Chapter 3
XAFS Studies of the Effect of Phosphorus Content in Nickel Phosphide
Catalysts
3.1 Introduction
For the silica-supported iron group compounds, Fe2P, CoP, Co2P and Ni2P (1,2,3)
activity has been found to be moderate, with Ni2P/SiO2 having the highest activity,
especially for hydrodenitrogenation in the previous chapter. However, these catalysts
suffered from a tendency to deactivate with time on stream (1). This chapter examines the
effect of phosphorus content on the performance of supported Ni2P/SiO2. A remarkable
effect was observed on increasing the phosphorus content, which greatly increased the
activity and stability of the catalysts, making this one of the best performing materials for
hydroprocessing.
Phosphorus in the form of phosphate has been investigated and recommended as a
secondary promoter in hydroprocessing Co-Mo and Ni-Mo sulfide catalysts over a period
of almost forty years, and is used in a number of commercial catalysts (4). Many
researchers have studied the effect of phosphorus in sulfide catalysts (5,6,7,8), and the
topic has been reviewed by Iwamoto and Grimblot (9). An extensive literature reports on
various effects of phosphate in the catalysts. Many studies describe a beneficial effect of
phosphorus in catalytic activity in hydrodesulfurization (HDS) (10,11,12,13,14,15,16),
hydrodenitrogenation (HDN) (13,14,15,17,18,19,20), and hydrogenation (HYD) capability
(21,22,23). In some instances, no improvement in reactivity by phosphorus is reported

45
(24). The results presented in that paper indicated that P added to MoS2/Al2O3 catalysts
acted directly on the support to form AlPO4, and it was speculated that weaker interactions
of MoS2 with the support surface increased the stacking of MoS2 layers. Most studies find
an enhancement in activity, however, and offer several explanations for the effect of P.
These include stabilization of solutions of high metal concentrations that can yield a more
uniform impregnation (25), improvement of the resistance to coking and increased support
strength and stability (26,27), improvement of the dispersion of the Mo and W active
phases (4,10,11,12), optimization of acidity (4,28), formation of a new kind of active site
with direct participation of phosphorus (29), and alteration of the reaction mechanism
(15,30,31). The positive effect of phosphorus depends on the concentration and the
method of catalyst preparation and may be negative when these are not properly controlled
(4,15,21).
Although considerable attention has been placed on understanding the role of
phosphorus in Mo- and W-based hydrotreating catalysts, until recently, phosphorus
compounds themselves have not been studied in hydroprocessing (1,2). This paper
discusses the importance of controlling the amount of phosphorus in the preparation of
supported catalysts in order to ensure formation of the active phosphide phase without
blocking sites.
3.2 Experimental
3.2.1 Synthesis
46
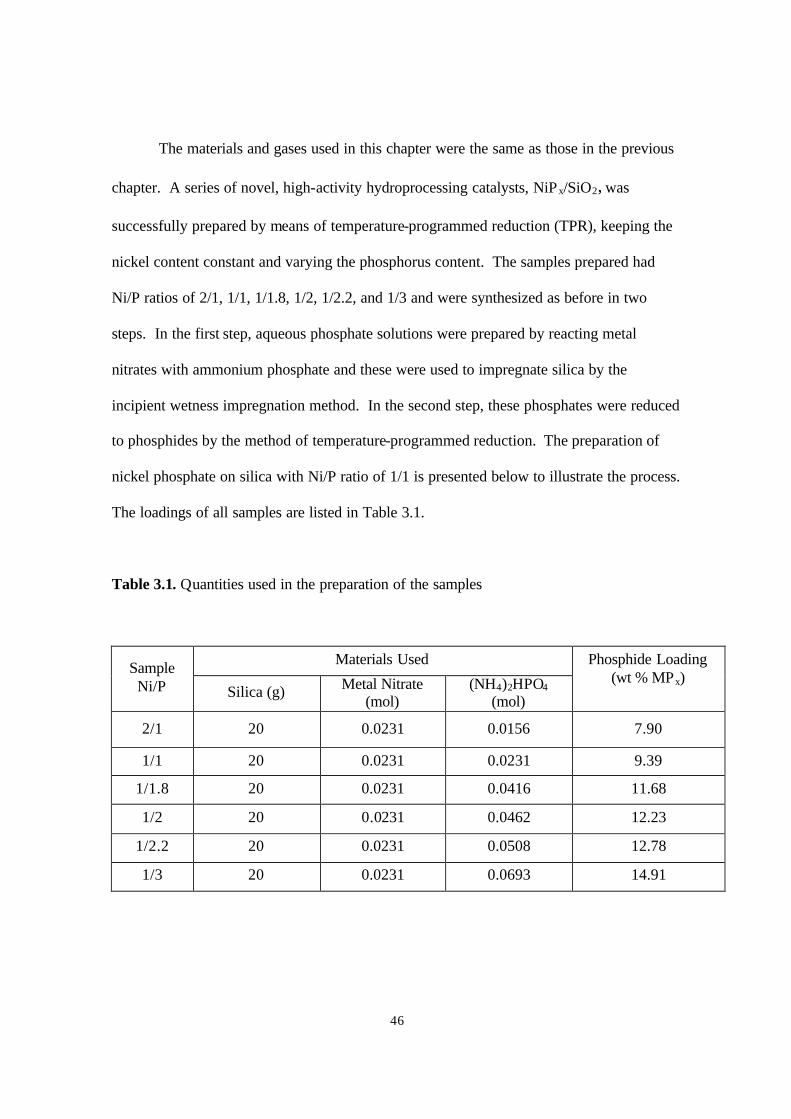
The materials and gases used in this chapter were the same as those in the previous
chapter. A series of novel, high-activity hydroprocessing catalysts, NiPx/SiO2, was
successfully prepared by means of temperature-programmed reduction (TPR), keeping the
nickel content constant and varying the phosphorus content. The samples prepared had
Ni/P ratios of 2/1, 1/1, 1/1.8, 1/2, 1/2.2, and 1/3 and were synthesized as before in two
steps. In the first step, aqueous phosphate solutions were prepared by reacting metal
nitrates with ammonium phosphate and these were used to impregnate silica by the
incipient wetness impregnation method. In the second step, these phosphates were reduced
to phosphides by the method of temperature-programmed reduction. The preparation of
nickel phosphate on silica with Ni/P ratio of 1/1 is presented below to illustrate the process.
The loadings of all samples are listed in Table 3.1.
Table 3.1. Quantities used in the preparation of the samples
Materials Used Sample Ni/P Silica (g) Metal Nitrate
(mol) (NH4)2HPO4
(mol)
Phosphide Loading (wt % MPx)
2/1 20 0.0231 0.0156 7.90
1/1 20 0.0231 0.0231 9.39
1/1.8 20 0.0231 0.0416 11.68
1/2 20 0.0231 0.0462 12.23
1/2.2 20 0.0231 0.0508 12.78
1/3 20 0.0231 0.0693 14.91
47
Prior to use, the silica was dried at 393 K for 3 h and calcined at 773 K for 6 h. The
incipient wetness point of the silica was found to be 2.2 cm3g-1. In the fist step of
preparation, 3.05 g (23.12 mmol) of ammonium phosphate (NH4)2HPO4 were dissolved in
10 cm3 distilled water in a flask to form a transparent colorless solution, and 6.72 g (23.12
mmol) of nickel nitrate (Ni(NO3)2·6H2O) were then added. The clear solution immediately
turned into a light color mixture with some precipitate. A few drops of nitric acid were
added in order to dissolve the precipitate and this resulted in a clear green solution, which
was further diluted to a volume of 44 cm3. The solution was impregnated on 20 g of silica.
After impregnation, the powder was dried at 393 K for 3 h and calcined at 773 K for 6 h.
The calcined sample was ground with a mortar and pestle, pelletized with a press (Carver,
Model C) and sieved to particles of diameter between 650 µm and 1180 µm. In the second
step of preparation, temperature-programmed reduction (TPR) was utilized to convert the
phosphate into phosphide. The reduction was carried out in a U-shaped quartz reactor
placed in a furnace controlled by a temperature programmer (Omega Model CN 2000).
The temperature was monitored by a local chromel-alumel thermocouple placed in a
thermowell near the center of the reactor bed. The H2 flow rate was set at 1000 µmol s-1
(1500 cm3 NTP min -1) per gram of sample. A portion of the exit gas flow was sampled
through a leak valve into a mass spectrometer (Ametek/Dycor Model MA 100) and the
masses 2(H2), 4(He), 15(NH), 18(H2O), 28(N2), 31(P), 32(O2), 34(PH3), 44(CO2), 62(P2)
were monitored during the experiment, and these and the temperature in real time were
recorded by an on-line computer. At the end of the temperature program, the sample was
cooled in helium to room temperature, and was passivated in a 0.5 % O2/He flow for 2 h.
48
3.2.2 Characterization
The synthesized materials were characterized by CO chemisorption, N2
physisorption, x-ray diffraction (XRD) and extended x-ray absorption fine structure
measurements (EXAFS). Irreversible CO uptake measurements were used to titrate the
surface metal atoms and to provide an estimate of the active sites on the catalysts. Uptakes
were obtained after passivation and reduction, which is referred to here as ex situ
chemisorption. Usually, 0.2 grams of reduced sample were loaded into a quartz reactor
and pretreated in H2 at 723 K for 2 h. After cooling down to room temperature in He,
pulses of CO in a He carrier flowing at 26.7 µmol s-1 (40 cm3 NTP min-1) were injected
through a sampling valve and the mass 28 (CO) signal was monitored with a mass
spectrometer.
BET surface area measurements were carried out right after the CO uptake
determinations, using a similar technique. Adsorption at liquid nitrogen temperature was
performed using a 30 % N2/He stream, and the desorption area obtained after rapid heating
was compared to the area of a calibrated volume (35.4 µmol). The surface area was
calculated from the one-point BET equation.
X-ray diffraction (XRD) patterns of both the fresh and spent samples were
determined with a Scintag XDS-2000 powder diffractometer operated at 45 kV and 40 mA,
using Cu Kα monochromatized radiation (λ=0.154178 nm). Crystal size, specific surface
area and metal site density were calculated by the methods described in Chapter 2.
In order to understand the effect of the phosphorus content on the structure of the
catalysts, the samples were examined using EXAFS (32). Nickel K-edge EXAFS were

49
obtained for fresh and spent samples with Ni/P ratios of 2/1, 1/2 and 1/3. The low
concentration of the active phase on the catalysts made their detailed characterization by x-
ray diffraction analysis difficult. For freshly prepared samples the catalysts were loaded
into glass cells with Kapton windows without exposure to the atmosphere, and these were
glass-blown shut to protect the samples. For the spent catalysts, samples were taken from
the hydroprocessing reactions, washed with hexane, and then pretreated in He flow before
loading them in the Kapton cells. The measurements were made in transmission mode at
the XAS beam line at the LNLS-National Synchrotron Light Laboratory in Campinas,
Brazil with a 1.4 GeV ring energy and a 100-150 mA ring current. The monochromator
was equipped with a channel cut Si (220) crystal and the energy resolution was about 1 eV.
Comparison of the EXAFS spectra of the catalysts were made with bulk standards.
The standards were Ni2P (Cerac, 99.5 %), NiO (Cerac, 99 %), NiS (Cerac, 99.9 %),
NiCO3[Ni(OH)2]·4H2O (Aldrich), NiS2, Ni3S5, and NiPS3. The latter three compounds
were synthesized by placing stoichiometric amounts of Ni (Aldrich, 99.8 %), S (EM
Science, 99 %), and red P (Aldrich, 99 %) fine powders in sealed quartz ampules and
heating (1 K/min) to 1073 K and maintaining this temperature for 100 h. XRD confirmed
the phase purity of the prepared standards. The EXAFS measurements of the standards
was carried out in beamline BL12B at the Photon Factory, Tsukuba, Japan, and in
beamline X18B at the Brookhaven National Laboratory. Both were operated at close to 2.5
GeV with a 400 mA ring current.
3.2.3 Reactivity studies
50
Hydrotreating activity of the samples was tested in a three-phase, packed -bed
reactor operated at 3.1 MPa and 643 K for hydrodenitrogenation (HDN),
hydrodesulfurization (HDS) and hydrogenation (HYD) with a model petroleum liquid
containing 2000 ppm nitrogen (quinoline), 3000 ppm sulfur (dibenzothiophene), 500 ppm
oxygen (benzofuran), 20 wt.% aromatics (tetralin) and balance aliphatics (tetradecane).
The schematic of the testing system was shown elsewhere (33). Briefly, the testing unit
consisted of three parallel reactors immersed in a fluidized sand bath (Techne, Model SBL-
2). The temperature of the reactors was controlled by a temperature controller (Omega,
Model 6051). The reactors were 19mm/16mm o.d/i.d. 316 SS tubes with a central
thermocouple monitoring the temperature of the catalyst bed. The catalysts were in the
form of pellets (16/20 mesh) and were supported between quartz wool plugs in a 13 mm
i.d. 316 stainless steel basket. The hydrogen flow rate was set to 100 µmols -1 (150 cm-3
NTP min-1) with a mass flow controller (Brooks, Model 5850E), and the feed liquid flow
rate (5 cm-3 h-1) was metered from burettes by high-pressure liquid pumps (LDC
Analytical, Model NCI 11D5). Quantities of catalysts loaded in the reactor corresponded
to the same amount of ex situ CO uptake (70 µmol). Prior to reactivity measurements, the
catalyst samples were pretreated in exactly the same manner as for the ex situ CO uptake
measurements. Hydrotreating samples were collected every two or three hours in sealed
septum vials and were analyzed off-line with a gas chromatograph (Hewlett Packard,
5890A) equipped with a 0.32 mm i.d. x 50 m fused silica capillary column (CPSIL-5CB,
Chrompack, Inc.) and a flame ionization detector. The product of dibenzothiophene HDS
was primarily biphenyl. The products of quinoline reaction were the denitrogenated
molecules propylbenzene and propylcyclohexane, and the N containing species,1,2,3,4-

51
tetrahydroquinoline, 7,8,9,10-tetrahydroquinoline, and propylaniline. The production of
the latter is referred to as HDA.
3.3 Results and discussion
Ni2P (34) adopts the hexagonal Fe2P structure (Space group: m26P , 2
h3D ,
Struckturbericht notation: revised C22) with lattice parameters, a = b = 0.5859 nm, c =
0.3382 nm. The crystal structure (Fig. 3.1) and lattice parameters can be used to calculate
a bulk density (ρ = 7.09 g cm-3) and the average surface metal atom density (n = 1.01 x
1015 atoms cm-2) of the solids (1).
Figure 3.1. Crystal structure of Ni2P
Ni PNi2P
a
b
c

52
The preparation of the supported phosphides was carried out in two stages. First, a
solution of the metal and phosphorus components was impregnated on the carrier silica
support and the material was dried and calcined to form supported phosphates. Second, the
phosphates were transformed into phosphides by temperature programmed reduction
(TPR) (Figs. 3.2,3). Only results for mass 18 (H2O), and 34 (PH3) are shown, as the other
monitored masses were featureless or provided no additional information. The results for
the samples with Ni/P ratios of 1/1.8 and 1/2.2 are not presented in the figures since they
were similar to those of the sample with Ni/P ratio of 1/2.
The TPR traces of mass 18 showed two systematic trends for the samples with
different Ni/P ratios. First, for lower P contents (Fig. 3.2a-c), the TPR traces showed more
peaks and a more complicated overall reduction pattern than that of higher P samples (Fig.
3.2d-f). Second, for higher P contents, all the reduction peaks, including the initial and
final features, were shifted to higher temperatures. These trends are reasonable. For lower
P contents, the precursor probably contains more nickel compounds like nickel oxide and
nickel oxy-phosphates, and their separate reduction results in different peaks. Since nickel
oxides are easily reducible, the TPR peaks appear at lower temperatures. It is possible that
some metallic Ni or a nickel phosphide phase of lower P content was formed which
assisted the reduction of other species. For higher P contents (Fig. 3.2d-2f), the nickel is
likely to be in the form of phosphate and reaction occurs at the high intrinsic reduction
temperature, Tp, of this main phosphate phase. As can be seen from Figs. 3.2d-f, the peak
temperature of the reduction traces was around 800 K, and was characteristic of the
reduction of bulk nickel phosphate (1). Because this temperature was high, successive
reduction stages could not be resolved, and the whole process appeared to occur in one
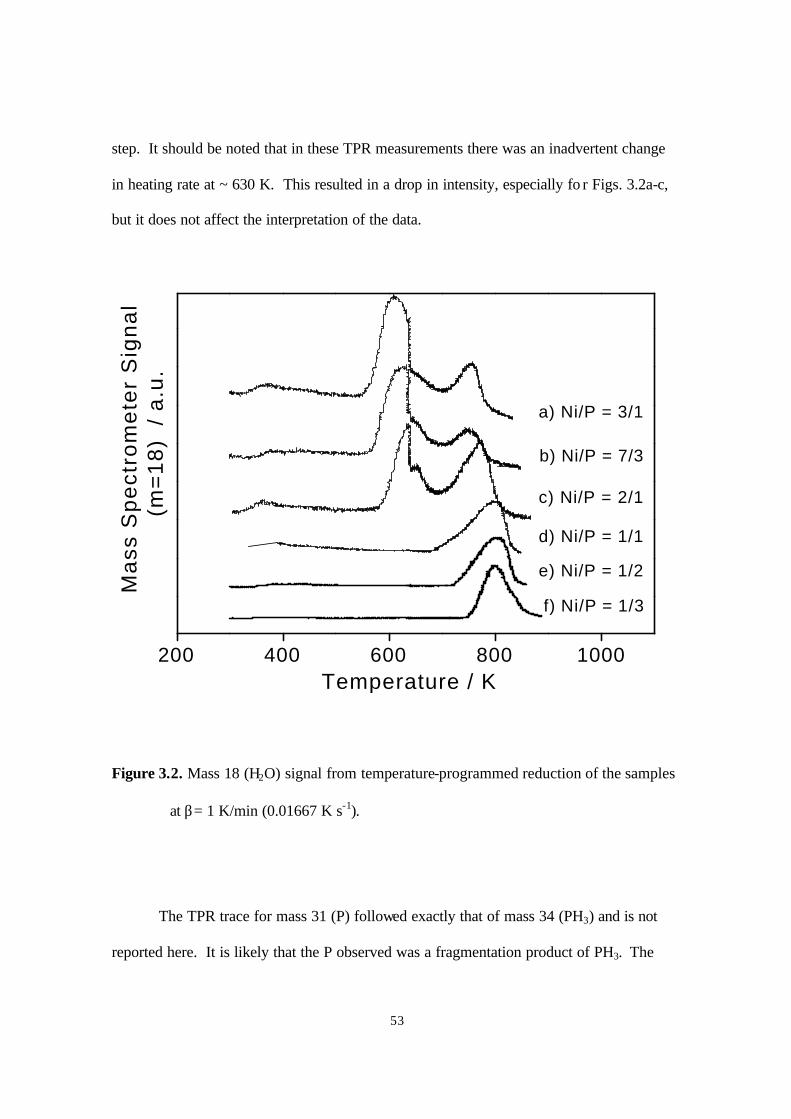
53
step. It should be noted that in these TPR measurements there was an inadvertent change
in heating rate at ~ 630 K. This resulted in a drop in intensity, especially fo r Figs. 3.2a-c,
but it does not affect the interpretation of the data.
Figure 3.2. Mass 18 (H2O) signal from temperature-programmed reduction of the samples
at β= 1 K/min (0.01667 K s-1).
The TPR trace for mass 31 (P) followed exactly that of mass 34 (PH3) and is not
reported here. It is likely that the P observed was a fragmentation product of PH3. The
200 400 600 800 1000
f) Ni/P = 1/3
e) Ni/P = 1/2
Ma
ss S
pe
ctro
me
ter
Sig
na
l
(m
=1
8)
/ a
.u.
Temperature / K
d) Ni/P = 1/1
c) Ni/P = 2/1
b) Ni/P = 7/3
a) Ni/P = 3/1
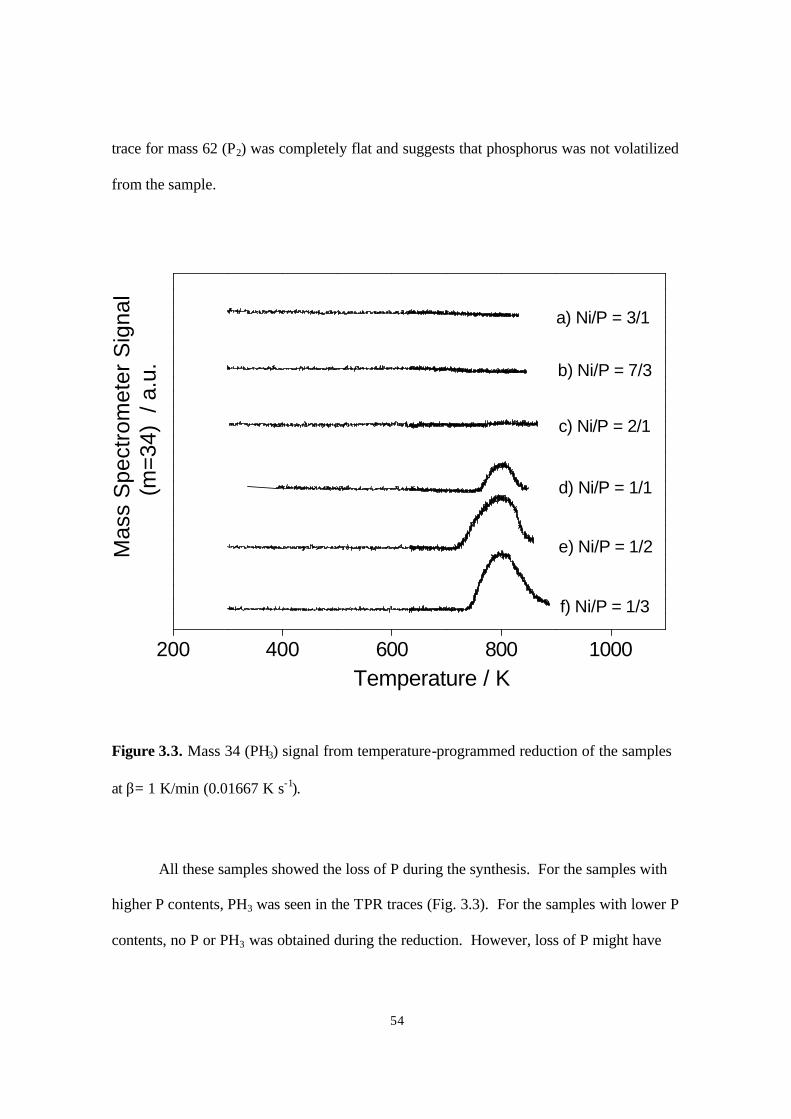
54
trace for mass 62 (P2) was completely flat and suggests that phosphorus was not volatilized
from the sample.
Figure 3.3. Mass 34 (PH3) signal from temperature-programmed reduction of the samples
at β= 1 K/min (0.01667 K s-1).
All these samples showed the loss of P during the synthesis. For the samples with
higher P contents, PH3 was seen in the TPR traces (Fig. 3.3). For the samples with lower P
contents, no P or PH3 was obtained during the reduction. However, loss of P might have
200 400 600 800 1000
f) Ni/P = 1/3
e) Ni/P = 1/2
d) Ni/P = 1/1
c) Ni/P = 2/1
b) Ni/P = 7/3
a) Ni/P = 3/1
Mas
s S
pect
rom
eter
Sig
nal
(
m=3
4) /
a.u
.
Temperature / K
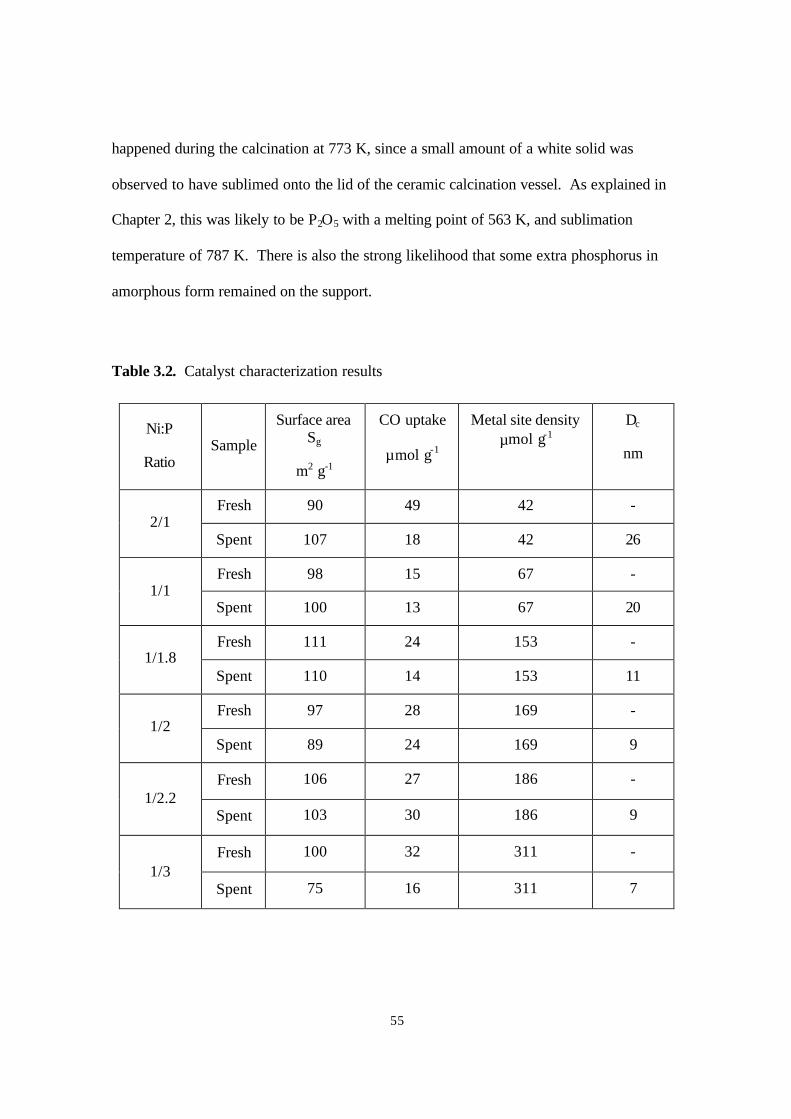
55
happened during the calcination at 773 K, since a small amount of a white solid was
observed to have sublimed onto the lid of the ceramic calcination vessel. As explained in
Chapter 2, this was likely to be P2O5 with a melting point of 563 K, and sublimation
temperature of 787 K. There is also the strong likelihood that some extra phosphorus in
amorphous form remained on the support.
Table 3.2. Catalyst characterization results
Ni:P
Ratio Sample
Surface area Sg
m2 g-1
CO uptake
µmol g-1
Metal site density µmol g-1
Dc
nm
Fresh 90 49 42 - 2/1
Spent 107 18 42 26
Fresh 98 15 67 - 1/1
Spent 100 13 67 20
Fresh 111 24 153 - 1/1.8
Spent 110 14 153 11
Fresh 97 28 169 - 1/2
Spent 89 24 169 9
Fresh 106 27 186 - 1/2.2
Spent 103 30 186 9
Fresh 100 32 311 - 1/3
Spent 75 16 311 7
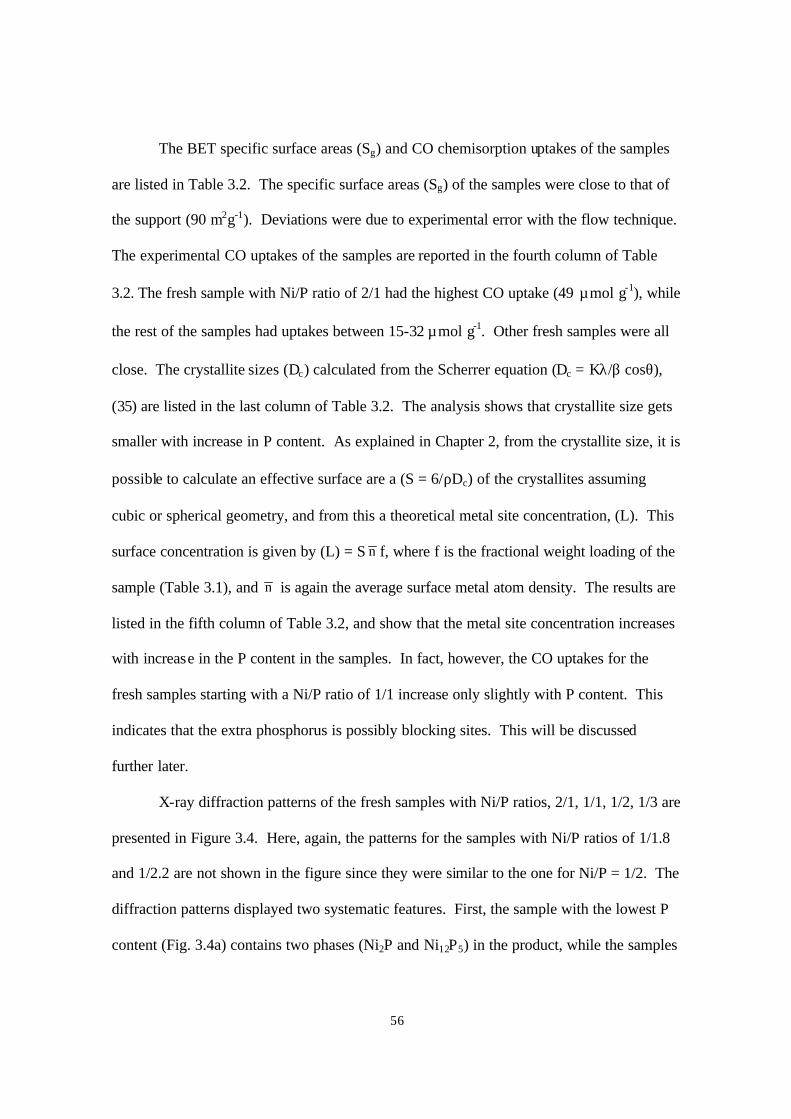
56
The BET specific surface areas (Sg) and CO chemisorption uptakes of the samples
are listed in Table 3.2. The specific surface areas (Sg) of the samples were close to that of
the support (90 m2g-1). Deviations were due to experimental error with the flow technique.
The experimental CO uptakes of the samples are reported in the fourth column of Table
3.2. The fresh sample with Ni/P ratio of 2/1 had the highest CO uptake (49 µmol g-1), while
the rest of the samples had uptakes between 15-32 µmol g-1. Other fresh samples were all
close. The crystallite sizes (Dc) calculated from the Scherrer equation (Dc = Kλ/β cosθ),
(35) are listed in the last column of Table 3.2. The analysis shows that crystallite size gets
smaller with increase in P content. As explained in Chapter 2, from the crystallite size, it is
possible to calculate an effective surface are a (S = 6/ρDc) of the crystallites assuming
cubic or spherical geometry, and from this a theoretical metal site concentration, (L). This
surface concentration is given by (L) = S n f, where f is the fractional weight loading of the
sample (Table 3.1), and n is again the average surface metal atom density. The results are
listed in the fifth column of Table 3.2, and show that the metal site concentration increases
with increase in the P content in the samples. In fact, however, the CO uptakes for the
fresh samples starting with a Ni/P ratio of 1/1 increase only slightly with P content. This
indicates that the extra phosphorus is possibly blocking sites. This will be discussed
further later.
X-ray diffraction patterns of the fresh samples with Ni/P ratios, 2/1, 1/1, 1/2, 1/3 are
presented in Figure 3.4. Here, again, the patterns for the samples with Ni/P ratios of 1/1.8
and 1/2.2 are not shown in the figure since they were similar to the one for Ni/P = 1/2. The
diffraction patterns displayed two systematic features. First, the sample with the lowest P
content (Fig. 3.4a) contains two phases (Ni2P and Ni12P5) in the product, while the samples

57
with the higher P contents had just one phase, Ni2P. The formation of Ni12P5 at lower P
content is understandable as Ni12P5 contains a lower proportion of P than Ni2P. Second,
the x-ray diffraction peaks became less intense and weaker with increasing content of P.
This indicates the formation of smaller crystallites of Ni2P with increase in P content as is
shown in the last of column in Table 3.2, and is a likely consequence of a greater
dispersion of the precursor phosphate, which is easier to form with higher P contents.
Figure 3.4. X-ray diffraction patterns of the fresh samples (α : Ni2P; β: Ni12P5)
10 20 30 40 50 60 70 80 90
a) Ni/P = 2/1
b) Ni/P = 1/1
c) Ni/P = 1/2
Inte
nsity
/ a.
u.
d) Ni/P = 1/3
2θ / Degrees

58
Figure 3.5. Comparison of X-ray diffraction patterns for the fresh samples and the spent
samples
X-ray diffraction patterns were also obtained for the spent samples (Fig. 3.5, upper
curve in each frame). The figure shows that there was no change in pattern for the sample
with Ni/P ratio of 2/1 (Fig. 3.5a), indicating that the Ni2P and Ni12P5 were stable phases at
hydrotreating conditions. For the samples with Ni/P ratio of 1/2 and 1/3, the nickel
phosphide phase became more crystallized after the hydrotreating reaction (Fig. 3.5c,d).
This is understandable due to the prolonged exposure (> 100 h) to the hydrotreating
10 20 30 40 50 60 70 80 90
c) Ni/P = 1/2
b) Ni/P = 1/1
Inte
nsity
/ a.
u.
d) Ni/P = 1/3
2θ / Degrees
a) Ni/P = 2/1
59
temperature of 643 K. For the sample with Ni/P ratios of 1/1 (Fig. 3.5b), the x-ray
diffraction pattern after reaction shows the appearance of a new peak, which is assigned to
Ni12P5. The basis for the assignment to Ni12P5 is shown in Fig. 3.6, which superposes the
pattern for the spent sample with Ni/P = 1/1 to the patterns of other nickel phosphide,
nickel sulfide, and nickel phosphide sulfide PDF reference patterns. The main peaks match
Figure 3.6. Superposition of the X-ray diffraction pattern of the spent sample (Ni/P=1/1)
with different references.
those of Ni2P, but the minor features can be attributed to the presence of a small amount of
Ni12P5. It is possible that the Ni/P = 1/1 sample may have been slightly phosphorus
10 20 30 40 50 60 70 80 90
Inte
nsity
/ a.
u.
2θ / Degrees
NiS PDF 12-41
Ni3S2 PDF 27-341
Ni3.110
S2 PDF 27-342
Ni7P
3 PDF 03-1101C
Ni2P
2S
6 PDF33-0952
Ni2P PDF3-953
Ni12
P5 PDF22-1190

60
deficient to start out with, and the prolonged exposure to the reaction temperature caused
the Ni12P5 to nucleate. It is also possible that the sample lost some phosphorus during
reaction, though this is less likely as it was not observed with the other samples.
Figure 3.7. Hydrodenitrogenation performance of supported catalysts
Figures 3.7-8 present the time course of HDS and HDN activities on the series of
phosphide catalysts. Figure 3.9 shows the effect of phosphorus content on the HDS and
HDN activities. The HDS activity was uniformly high for all the samples, with just slight
reductions for the samples with Ni/P ratios of 2/1 and 1/1. The sample with Ni/P ratio of
1/2.2 had the highest HDS conversion, essentially 100 %, although the other three samples
0 20 40 60 80 1000
20
40
60
80
100
HD
S C
onve
rsio
n / %
Time / h
Ni2P/SiO
2, Ni/P = 1/2.2
Ni2P/SiO
2, Ni/P = 1/2
Ni2P/SiO
2, Ni/P = 1/1.8
Ni2P/SiO
2, Ni/P = 1/3
Ni2P/SiO
2, Ni/P = 2/1
Ni2P/SiO
2, Ni/P = 1/1

61
with Ni/P ratios of 1 /1.8, 1/2 and 1/3 had the very close HDS conversion of 98 %. The
small effect of the P content was close to the error in the measurements of 1-2 %, but the
trends are probably real as shown more clearly in the HDN reactions. In fact, the samples
with Ni/P ratios of 1/1.8 and 1/2.2 were prepared and tested to confirm the high activity
results of the sample with Ni/P ratio of 1/2.
Figure 3.8. Hydrodesulfurization performance of supported catalysts
For the HDN reaction, the P content had a strong effect on the quinoline reaction.
The samples with Ni/P ratios of 1/1.8, 1/2 and 1/2.2 followed similar time courses with
slight deactivation resulting in final HDN conversions between 80 % to 90 % (Fig. 3.8).
0 20 40 60 80 1000
20
40
60
80
100
Ni2P/SiO
2, Ni/P = 1/2.2
Ni2P/SiO
2, Ni/P = 1/2
Ni2P/SiO
2, Ni/P = 1/1.8
HD
N C
onve
rsio
n %
Time / h
Ni2P/SiO
2, Ni/P = 1/3
Ni2P/SiO
2, Ni/P = 2/1
Ni2P/SiO
2, Ni/P = 1/1

62
The other three samples reached a far lower HDN activity, which was below 50 %,
especially for the highest and lowest P content samples. A comparison of all results is
presented in Figure 3.9, which shows the effect of P content on the activity of all the
catalysts. The best performance was obtained at a Ni/P ratio close to 1/2.
Figure 3.9. Comparison of hydroprocessing activities
The effect of P content on HDS and HDN on these samples gives insight on the
nature of the active sites responsible for these reactions. The small effect of P content on
HDS suggests that the reaction occurs principally on metal centers and that there is little
effect of ensemble size on reactivity. Hence, the reaction is structure-insensitive. On the
0.5 1.0 1.5 2.0 2.5 3.0
20
40
60
80
100
HDN
HDS
P/Ni ratio
Con
vers
ion
%
63
other hand, the relatively large effect of P on HDN suggests that P somehow participates in
the reaction. HDN has been shown to proceed by β-hydride elimination on carbides and
sulfides and more recently on phosphides (36). The active site requires an acid site to bind
the nitrogen compound and a proximal nucleophilic site to carry out the β-H attack. Thus,
the reaction is structure-sensitive. Excess P on the surface may disrupt the dual site and
cause the observed maximum in activity with P content.
Previous work had shown that Ni2P/SiO2 (Ni/P = 1/1) was only a fair catalyst for
hydroprocessing, especially for hydrodesulfurization (HDS) of dibenzothiophene (1).
Also, the HDN activity declined considerably with time. In this work, the addition of
excess phosphorus is seen to facilitate the formation of the active nickel phosphide phase,
and to reduce deactivation.
The CO uptake for the post hydrotreating samples decreased for all samples except
for the sample with Ni/P ratio of 1/2.2. This fact was more obvious for the samples with
the lower P contents, as is shown in Table 3.2. For example, the CO uptake of the fresh
sample with Ni to P ratio of 2/1 was 49 µmol g-1, but it decreased to 18 µ mol g-1 after the
hydrotreating. This loss of active centers may be an important reason for the deactivation
of the catalysts.
In order to better understand the effect of the phosphorus content on the catalytic
activity, the catalysts were examined using extended x-ray absorption fine structure
(EXAFS) analysis. The top panel in Figure 3.10 shows the Ni K-edge EXAFS results for
these fresh samples with Ni/P ratios of 2/1, 1/2, and 1/3. The sample with Ni/P = 2/1 (Fig.
3.10a) shows a main peak with a shoulder at lower interatomic distance. In contrast, the
samples with Ni/P = 1/2 and 1/3 (Figs. 3.10b,c) display two distinct peaks. Comparison of
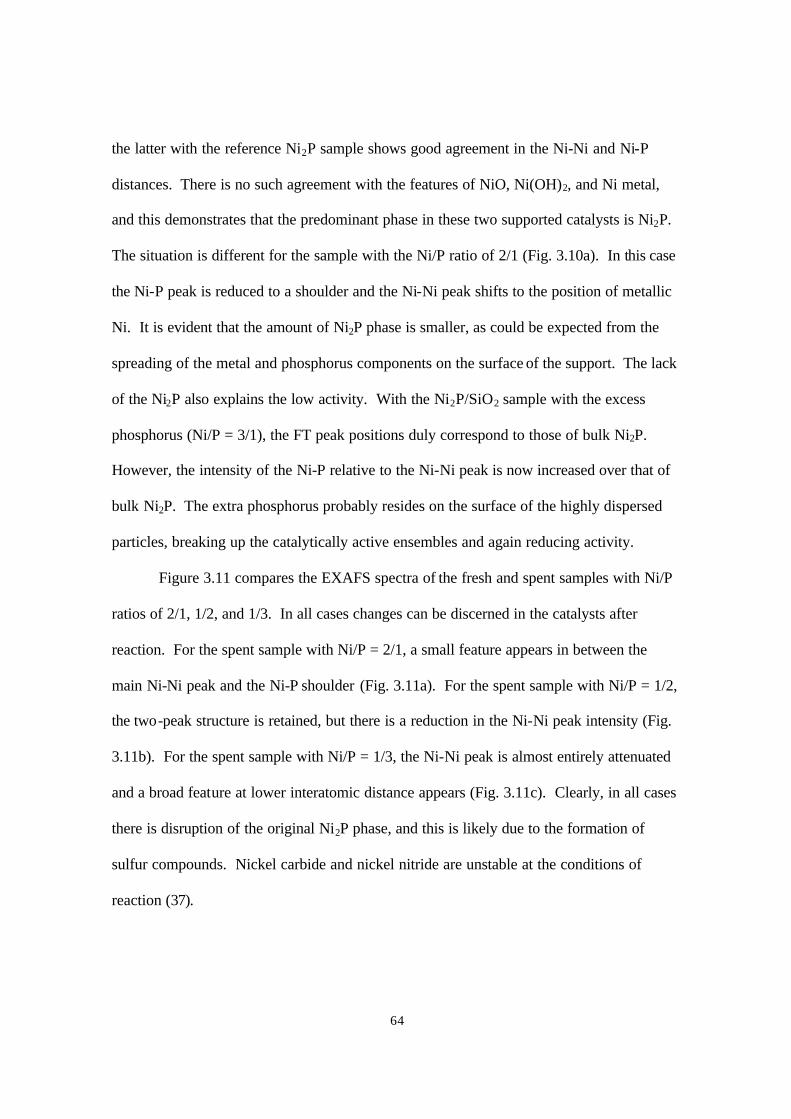
64
the latter with the reference Ni2P sample shows good agreement in the Ni-Ni and Ni-P
distances. There is no such agreement with the features of NiO, Ni(OH)2, and Ni metal,
and this demonstrates that the predominant phase in these two supported catalysts is Ni2P.
The situation is different for the sample with the Ni/P ratio of 2/1 (Fig. 3.10a). In this case
the Ni-P peak is reduced to a shoulder and the Ni-Ni peak shifts to the position of metallic
Ni. It is evident that the amount of Ni2P phase is smaller, as could be expected from the
spreading of the metal and phosphorus components on the surface of the support. The lack
of the Ni2P also explains the low activity. With the Ni2P/SiO2 sample with the excess
phosphorus (Ni/P = 3/1), the FT peak positions duly correspond to those of bulk Ni2P.
However, the intensity of the Ni-P relative to the Ni-Ni peak is now increased over that of
bulk Ni2P. The extra phosphorus probably resides on the surface of the highly dispersed
particles, breaking up the catalytically active ensembles and again reducing activity.
Figure 3.11 compares the EXAFS spectra of the fresh and spent samples with Ni/P
ratios of 2/1, 1/2, and 1/3. In all cases changes can be discerned in the catalysts after
reaction. For the spent sample with Ni/P = 2/1, a small feature appears in between the
main Ni-Ni peak and the Ni-P shoulder (Fig. 3.11a). For the spent sample with Ni/P = 1/2,
the two-peak structure is retained, but there is a reduction in the Ni-Ni peak intensity (Fig.
3.11b). For the spent sample with Ni/P = 1/3, the Ni-Ni peak is almost entirely attenuated
and a broad feature at lower interatomic distance appears (Fig. 3.11c). Clearly, in all cases
there is disruption of the original Ni2P phase, and this is likely due to the formation of
sulfur compounds. Nickel carbide and nickel nitride are unstable at the conditions of
reaction (37).
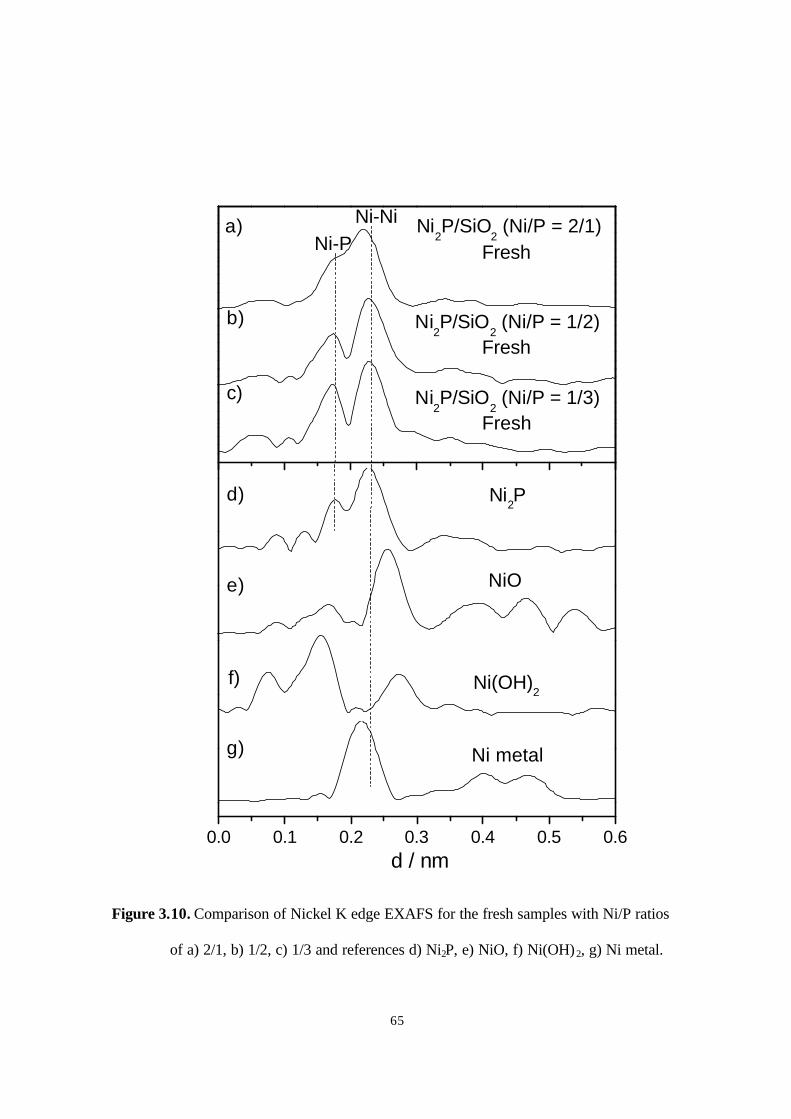
65
Figure 3.10. Comparison of Nickel K edge EXAFS for the fresh samples with Ni/P ratios
of a) 2/1, b) 1/2, c) 1/3 and references d) Ni2P, e) NiO, f) Ni(OH)2, g) Ni metal.
0.0 0.1 0.2 0.3 0.4 0.5 0.6
Ni2P
g)
f)
e)
d)
Fresh
c)
Fresh
b)
Fresha) Ni
2P/SiO
2 (Ni/P = 2/1)
Ni2P/SiO
2 (Ni/P = 1/2)
d / nm
Ni2P/SiO
2 (Ni/P = 1/3)
NiO
Ni(OH)2
Ni metal
Ni-PNi-Ni
66
Figure 3.11. Nickel K-edge EXAFS of the fresh and spent samples with different Ni/P
ratios: a) Ni/P = 2/1, b) Ni/P = ½, c) Ni/P = 1/3.
0.0 0.1 0.2 0.3 0.4 0.5 0.6
Ni-PNi-Nia)
d / nm
|FT
| of k
3 χ(k)
/ a.
u.
Fresh Spent
Fresh Spent
Fresh Spent

67
Figure 3.12. Comparison of Nickel K-edge EXAFS for the spent samples with Ni/P ratios
of a) 2/1, b) 1/2, c) 1/3 and references d) Ni2P, e) NiPS3, f) NiS2, g) Ni3S5, h) NiS.
0.0 0.1 0.2 0.3 0.4 0.5 0.6
|FT
| of k
3 χ(k)
/ a.
u.
h)
Ni2P
g)
f)
e)
d)
Spentc)
Spentb)
Spenta) Ni
2P/SiO
2 (Ni/P = 2/1)
Ni2P/SiO
2 (Ni/P = 1/2)
d / nm
Ni2P/SiO
2 (Ni/P = 1/3)
NiPS3
Ni3S
5
NiS2
NiS
Ni-PNi-S Ni-Ni
68
The identification of the changes occurring in the spent samples was carried out by
comparing their spectra to those of bulk sulfide references (Fig. 3.12). For the spent
sample with Ni/P = 2/1 (Fig. 3.12a), the small feature in between the Ni-Ni peak and the
Ni-P shoulder corresponds to a Ni-S distance in one of the sulfide references (Figs. 3.12e-
h). The sulfide is likely a lower sulfur content material like Ni3S5 or NiS, because of the
lack of a prominent peak at a shorter distance as appears in NiS2 (Fig. 3.12f), or longer
distance as appears in NiPS3 (Fig. 3.12e). Interestingly, the sample now shows Ni-Ni and
Ni-P distances that correspond to Ni2P whereas the fresh sample showed distances
displaced toward Ni metal. It is likely that the metallic portion of this sample was sulfided,
but the phosphide portion was retained.
For the spent Ni2P/SiO2 sample with Ni/P = 1/2 (Fig. 3.12b), a two-peak spectrum
with the characteristic distance of Ni2P (Fig. 3.12d) is visible. However, peaks are
broadened in comparison to the fresh sample (Fig. 3.10b) and the Ni-Ni peak is attenuated.
Although not directly visible, it is likely that a Ni-S signal is hidden between the two
peaks, broadening the spectra and reducing the Ni-Ni contribution. Still, the main features
of the Ni2P remain and the conclusion is that the active phase is a surface phospho-sulfide.
It is unlikely to be a high-sulfur phase like NiPS3, as the strong feature at long interatomic
distance is missing.
For the spent Ni2P/SiO2 (Ni/P = 1/3), the spectrum consists of a broad feature that is
likely formed from a combination of different peaks. The most likely interpretation is that
there is a dominant Ni-S signal and smaller peaks due to Ni-P and Ni-Ni on both sides. It
is difficult to understand why this sample should undergo greater sulfidation than the
sample with Ni/P = 1/2, as it contained more phosphorus in the fresh state. However,
69
recalling the XRD results (Fig. 3.5), that showed the sample with Ni/P = 1/3 to be more
highly dispersed than the sample with Ni/P = 1/2, it can be conjectured that the smaller
particle size results in a greater degree of sulfidation.
The catalytic testing showed that the activity of the phosphides was uniformly high
for HDS, but went through a maximum with P content for HDN (Fig. 3.9). Separate tests
with NiS2/SiO2 showed that it has very low activity in both HDS and HDN in agreement
with results from the literature (38). These results indicate that in the supported Ni2P/SiO2
sample the phosphorus plays an important role in the catalytic phase and supports the
conclusion that Ni-P bonding is present in all the spent samples, even though a substantial
amount of Ni-S bonding is seen in the spectra. The best sample Ni2P/SiO2 (Ni/P = 1/2)
represents an optimum where the phosphorus content and the particle size are balanced to
give some sulfur tolerance with the maintenance of high catalytic activity.
The significant finding of this study was the very high activity of the nickel
phosphide catalysts with Ni/P ratios close to 1/2. The sample with the Ni/P ratio of 1/2.2
had 100 % HDS and 81 % HDN conversion, which is much higher than that of a
commercial catalyst, Ni-Mo-S/Al2O3 (Shell 324) with 76 % HDS and 38 % HDN (39).
This is the highest activity which has been reported in the hydrotreating field for
dibenzothiophene in the presence of a nitrogen compound.
3.4 Conclusions
Phosphorus content has a profound effect on the structure and activity of NiPx/SiO2
catalysts. Ratios of Ni/P ≈ 1/2 result in materials with excellent activity in

70
hydroprocessing with HDS conversion of 100 %, and HDN conversion of 81 %, which are
much higher than those of a commercial Ni-Mo-S/Al2O3 catalyst with HDS conversion of
76 % and HDN conversion of 38 %. Phosphorus content has a small effect on HDS
indicating that the reaction is structure-insensitive, but a substantial one on HDN indicating
that the reactions are demanding. Characterization of the catalysts by EXAFS
measurements before and after reaction indicates that the active phase in the catalysts is a
phospho-sulfide. The catalysts inactive for HDN, on the other hand, have pronounced
sulfur content. Overall results indicated that on these novel, high activity hydroprocessing
catalysts, the HDS and HDN reactions are not promoted by nickel on its own, but that
phosphorus plays an important role in the reaction.
References
1 Wang, X., Clark, P., Oyama, S. T., J. Phys. Chem. 2002. In press.
2. Stinner, C., Prins, R., Weber, Th. , J. Catal., 202(1) (2001).
3. Robinson, W. R. A. M., van Gestel, J. N. M., Koranyi, T. I., Eijsbouts, S., van der
Kraan, A. M., van Veen, J. A. R., de Beer, V. H. J., J. Catal. 161(2), 539 (1996).
4. Lewis, J. M., Kydd, R. A., Boorman, R. M., Van Rhyn, P. H., Appl. Catal. A., 84,
103 (1992).
5. Jian, M., Rico Cerda, J. L., Prins, R., Vth Workshop on Hydrotreating Catalysis,
European Section , 225 (1995).
6. Jian, M., Prins, R., Catal.Lett., 35, 193 (1995).
7. Atasanova, P., Tabakova, T., Vladov, Ch., Halachov, T., Lopez Agudo, A., Appl.
Catal. A, 161, 105 (1997).
71
8. Mangnus, P. J., Van Veen, J. A. R., Eijsbouts, S., De Beer, V.H.J., Moulijn, J.A.,
Appl. Catal. 61, 99 (1990).
9. Iwamoto, R., Grimblot, J., Adv. Catal., 44, 417 (1999).
10. Lewis, J. M., Kydd, R. A., J. Catal., 136, 478 (1992).
11. Morales, A., de Agudelo, R., Appl. Catal., 23, 23 (1986).
12. Atanasova, P., Vchyti, J., Kraus, M., Halachev, T., Appl. Catal., 65, 53 (1990).
13. Cruz Reyes, J., Avalos-Boria, M., López Cordero, R., López Agudo, A, Appl.
Catal., A, 120, 147 (1994).
14. van Veen, J. A. R., Colijn, H. A., Hendriks, P. A. J. M., van Weisenes, A. J., Fuel
Proc. Tech., 35, 137 (1993).
15. Eijsbouts, S., van Gestel, J. N. M., , L., van Veen, J. A. R., de Beer, V. H. J., Prins,
R., J. Catal., 35, 137 (1991).
16. Fitz, C. W., Rase, H. F., Ind. Eng. Chem. Prod. Res. Div., 22, 40 (1983).
17. Dhandapani, B., Ramanathan, S., Yu, C. C., Fruhberger, B., Chen, J. G., Oyama, S.
T., J. Catal. 176(1), 61 (1998).
18. Tisher, R. E., Narain, N. K., Stiegel, G. J., Cillo, D. L., Ind. Eng. Chem. Prod.
Res.Div., 26, 422 (1987).
19 Mickelson, G. A., Patent, 3 755 150 (1968)
20. López Agudo, A., López Cordero, R., Palacios, J. M., Fierro, J. L., Bull. Soc. Chim.
Belg. 104(4-5), 237 (1995).
21. Fierro, J. L. G., López Agudo, A., Esquivel, N., López Cordero, R, Appl. Catal., 48,
353 (1989).
72
22. López Cordero, R., Esquivel, N., Lázaro, J., Fierro, J. L. G., López Agudo, A.,
Appl. Catal., 48, 341 (1989).
23. Housm E.C., and Lester, R., British Patent, 807 583 (1959).
24. Poulet, O., Hubaut, R., Kasztelan, S., Grimblot, J, Bull. Soc. Chim. Belg. European
Section, 100(11-12), (1991).
25. Colgan, J.D. and Chomitz , N., U. S. Patent, 3 287 280, (1966).
26. Tolman, C. A., Druliner, J. P., Krusic, P. J., Nappa, M. J., Seidel, W.C., Williams,I.
D., Ittel, S. D., J. Mol. Catal., 48, 129 (1988).
27. Goedken, V.L., Ercolani, C., J. Chem. Soc., Chem. Commun., 378( 1984).
28. Gishti, K., Iannibello, A., Marengo, S., Morelli, G., Titorelli, P. Appl. Catal. 12,
381 (1984).
29. Craje, M. W. J., de Beer, V. H. J., van der Krann, A. M., Catal. Today 10, 337
(1991).
30. Cerda, J. L. R., Prins, R., Bull. Soc. Chim. Belg. 100, 815 (1991).
31. Mangnus, P. J., van Langeveld, A. D., de Beer, V. H. J., Moulijn, J. A., Appl.
Catal., 68, 161 (1991).
32. Spectra were recorded in transmission mode using a Si(220) double crystal
monochromator with a slit aperture of 0.5 nm at the XAS beamline of the LNLS
National Synchrotron Light Laboratory in Campinas, Brasil.
33. Ramanathan, S., Oyama, S. T., J. Phys. Chem., 99, 16365 (1995).
34. Rundqvist, S., Acta Chem. Scand. 16, 992 (1962).
35. Cullity, B.D., Elements of X-Ray Diffraction, 2nd Ed., p. 102, Addison-Wesley
Publishing Company, Menlo Park, California, 1978.
73
36. Schwartz, V., Teixeira da Silva, V., Oyama, S. T, J. Mol. Catal. A: Chem. 163, 251
(2000).
37. Oyama, S. T, in Preparation of Solid Catalysts, Ertl, G., Knözinger, H., Weitkamp,
J., Eds., Wiley-VCH Verlag GmbH, Weinheim, Germany, (1999), pp. 139-150.
38. Pecoraro, T. A., Chianelli, R. R., J. Catal. 67, 430 (1981).
39. Oyama, S. T., Wang, X., Requejo, F., Sato, T., Yoshimura, Y., J. Catal. Submitted.

74
Chapter 4
Active Phase of Ni2P/SiO2 in Hydroprocessing Reactions
4.1 Introduction
The effect of Ni/P ratio on the structure and hydroprocessing behavior of NiP x/SiO2
(1) was studied in Chapter 3. It was found that increasing the phosphorus content to give a
Ni/P ratio of 1/2 substantially enhanced conversion in both HDS and HDN to
unprecedented levels. Thus, for the reaction of dibenzothiophene an HDS conversion of
100% was obtained, and for the reaction of quinoline an HDN conversion of 81% was
observed. Even in the conversion of a real feed, this material showed better activity,
selectivity, and stability than a commercial Co-Mo-S/Al2O3 (2). The objective of the
present chapter is to examine the effect of Ni2P loading on the surface properties, structure,
and reactivity of Ni2P/SiO2 catalysts in order to identify an optimal Ni2P loading for
activity and stability.
4.2 Experimental
4.2.1 Synthesis and characterization of catalysts
The materials and gases employed in this chapter were the same as those in Chapter
2. Detailed preparation procedures have been described in Chapter 3 and only a synopsis
need be presented here. Briefly, the synthesis of the catalysts involved two stages. First,
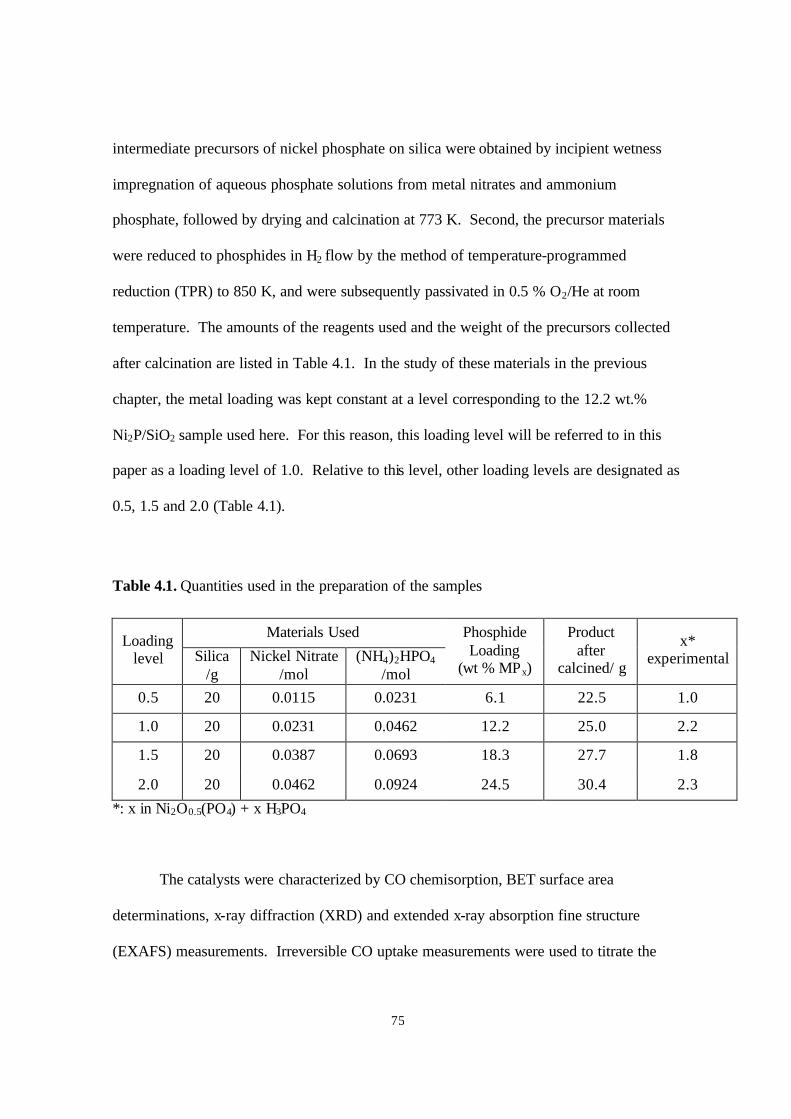
75
intermediate precursors of nickel phosphate on silica were obtained by incipient wetness
impregnation of aqueous phosphate solutions from metal nitrates and ammonium
phosphate, followed by drying and calcination at 773 K. Second, the precursor materials
were reduced to phosphides in H2 flow by the method of temperature-programmed
reduction (TPR) to 850 K, and were subsequently passivated in 0.5 % O2/He at room
temperature. The amounts of the reagents used and the weight of the precursors collected
after calcination are listed in Table 4.1. In the study of these materials in the previous
chapter, the metal loading was kept constant at a level corresponding to the 12.2 wt.%
Ni2P/SiO2 sample used here. For this reason, this loading level will be referred to in this
paper as a loading level of 1.0. Relative to this level, other loading levels are designated as
0.5, 1.5 and 2.0 (Table 4.1).
Table 4.1. Quantities used in the preparation of the samples
Materials Used Loading level Silica
/g Nickel Nitrate
/mol (NH4)2HPO4
/mol
Phosphide Loading
(wt % MPx)
Product after
calcined/ g
x* experimental
0.5 20 0.0115 0.0231 6.1 22.5 1.0
1.0 20 0.0231 0.0462 12.2 25.0 2.2
1.5 20 0.0387 0.0693 18.3 27.7 1.8
2.0 20 0.0462 0.0924 24.5 30.4 2.3
*: x in Ni2O0.5(PO4) + x H3PO4
The catalysts were characterized by CO chemisorption, BET surface area
determinations, x-ray diffraction (XRD) and extended x-ray absorption fine structure
(EXAFS) measurements. Irreversible CO uptake measurements were used to titrate the
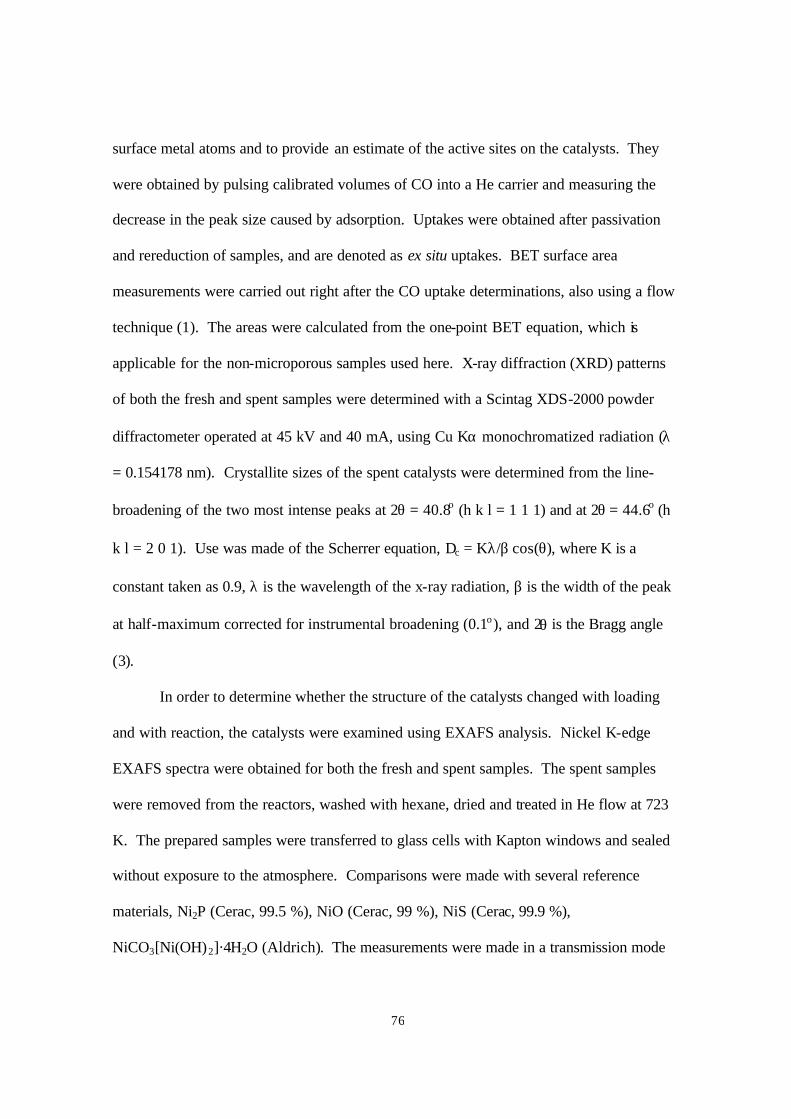
76
surface metal atoms and to provide an estimate of the active sites on the catalysts. They
were obtained by pulsing calibrated volumes of CO into a He carrier and measuring the
decrease in the peak size caused by adsorption. Uptakes were obtained after passivation
and rereduction of samples, and are denoted as ex situ uptakes. BET surface area
measurements were carried out right after the CO uptake determinations, also using a flow
technique (1). The areas were calculated from the one-point BET equation, which is
applicable for the non-microporous samples used here. X-ray diffraction (XRD) patterns
of both the fresh and spent samples were determined with a Scintag XDS-2000 powder
diffractometer operated at 45 kV and 40 mA, using Cu Kα monochromatized radiation (λ
= 0.154178 nm). Crystallite sizes of the spent catalysts were determined from the line-
broadening of the two most intense peaks at 2θ = 40.8o (h k l = 1 1 1) and at 2θ = 44.6o (h
k l = 2 0 1). Use was made of the Scherrer equation, Dc = Kλ/β cos(θ), where K is a
constant taken as 0.9, λ is the wavelength of the x-ray radiation, β is the width of the peak
at half-maximum corrected for instrumental broadening (0.1o), and 2θ is the Bragg angle
(3).
In order to determine whether the structure of the catalysts changed with loading
and with reaction, the catalysts were examined using EXAFS analysis. Nickel K-edge
EXAFS spectra were obtained for both the fresh and spent samples. The spent samples
were removed from the reactors, washed with hexane, dried and treated in He flow at 723
K. The prepared samples were transferred to glass cells with Kapton windows and sealed
without exposure to the atmosphere. Comparisons were made with several reference
materials, Ni2P (Cerac, 99.5 %), NiO (Cerac, 99 %), NiS (Cerac, 99.9 %),
NiCO3[Ni(OH)2]·4H2O (Aldrich). The measurements were made in a transmission mode
77
at the BL12C beamline in the Photon Factory, High Energy Laboratory in Tsukuba, Japan,
and at the X18B beamline in Brookhaven National Laboratory. Both were operated at
close to 2.5 GeV with a 400 mA ring current. The monochromator in Tsukuba was
equipped with a channel cut Si (311) crystal and gave an energy resolution of about 1 eV,
while that in Brookhaven used a Si (111) crystal and resulted in an energy resolution of 2
eV.
FEFF simulations to obtain phase shifts and amplitude functions of Ni2P and Ni12P5
were done with FEFF 8.0 code (4). The FEFF input file for the simulation consisted of the
cluster size (0.6 nm), atomic positions, and type of atoms obtained from crystallographic
data from the literature (5,6).
4.2.2 Reactivity studies
Hydrotreating activities of the samples were tested in a three-phase trickle bed
reactor operated at 3.1 MPa and 643 K for hydrodenitrogenation (HDN),
hydrodesulfurization (HDS), hydrodeoxygenation (HDO), and hydrodearomatization
(HDA) of a model feedstock containing 2000 ppm nitrogen (quinoline), 3000 ppm sulfur
(dibenzothiophene), 500 ppm oxygen (benzofuran), 20 wt.% aromatics (tetralin) and
balance aliphatics (tetradecane). The HDS conversion refers to the transformation of
dibenzothiophene to biphenyl, the HDN conversion to the reaction of quinoline to
denitrogenated products, the HDA conversion to the reaction of quinoline to N-containing
hydrogenated products (1,2,3,4-tetrahydroquinoline, 5,6,7,8-tetrahydroquinoline,
orthopropylaniline), and HDO conversion to the reaction of benzofuran to ethylbenzene.

78
The schematic of the testing system was shown elsewhere (7). Briefly, the testing unit
consisted of three parallel reactors immersed in a fluidized sand bath (Techne, Model SBL-
2) whose temperature was controlled by a temperature controller (Omega, Model 6015 K).
The reactors were 19mm/16mm o.d/i.d. 316 SS tubes with central thermocouples
monitoring the temperature of the catalyst beds. The catalysts were in the form of pellets
(16/20 mesh) and were supported between quartz wool plugs in 13 mm i.d. 316 stainless
steel baskets. The hydrogen flow rate was set to 100 µmol s-1 (150 cm-3 min-1, NTP) with
mass flow controllers (Brooks, Model 5850E), and the feed liquid flow rate (5 cm-3 h-1)
was metered from burettes by high pressure liquid pumps (LDC Analytical, Model NCI
11D5). Quantities of catalysts loaded in the reactors corresponded to the same amount of
ex situ CO uptake (70 µmol). Prior to reactivity measurements the catalysts were
pretreated at 723 K for 2 h before the feed liquid was introduced into the reactors.
Hydrotreating samples were collected every two or three hours in sealed septum vials, and
were analyzed off-line with a gas chromatograph (Hewlett Packard, 5890A) equipped with
a 0.32 mm i.d. x 50 m fused silica capillary column (CPSIL-5CB, Chrompack, Inc.) and a
flame ionization detector.
4.3 Results and discussion
The preparation of the supported phosphides was carried out in two stages. First,
supported phosphates were obtained by impregnation of a solution of the metal and
phosphorus components onto a carrier silica support, followed by drying and calcination.
Second, the phosphates were transformed into phosphides by temperature programmed

79
Figure 4.1. Mass 18 signal from temperature-programmed reduction of the samples at β=
1K/min (0.01667 K s-1)
reduction (TPR). There was some loss of phosphorous during the calcination stage, as
evidenced by the observation of a solid deposit on the lid of the calcination vessel. This
was likely to be P2O5 whose sublimation point (673 K) was lower than the calcination
temperature (773 K). The amount of product collected after calcination (Table 4.1) can be
used to estimate this loss. Assuming that after calcination the product is a mixture of
nickel oxyphosphate (Ni2O0.5PO4) and phosphate (as H3PO4), the theoretical moles of
phosphate would be x = 3 (since total Ni/P = 1/2). The calc ulated amount ranged from x =
300 400 500 600 700 800 900
a) Loading level = 0.5
d) Loading level = 2.0
Temperature / K
c) Loading level = 1.5
b) Loading level = 1.0
Mas
s S
pect
rom
eter
Sig
nal
(m
=18)
/ a.
u.
80
1.0 for the low loading sample to x = 2 for the higher loading samples, confirming that
there was some loss of phosphorous.
Figure 4.2. X-ray diffraction patterns of the fresh samples (α : Ni2P; β: Ni12P5 or Nickel
sulfide)
Figure 4.1 shows the water evolution during the temperature programmed reduction
stage of the synthesis. Mass 34 (PH3) followed the same trend as the water signal, and is
not displayed. Evidently there is some loss of phosphorous during reduction as well as
calcination. Other masses gave no additional information. It is clearly seen that the
reduction reactions for all the samples essentially occurred in the same temperature range,
10 20 30 40 50 60 70 80 90
2θ / Degree
b) Loading level = 1.0
Inte
nsity
/ a.
u.
c) Loading level = 1.5
d) Loading level = 2.0
a) Loading level = 0.5
e) PDF 3-953
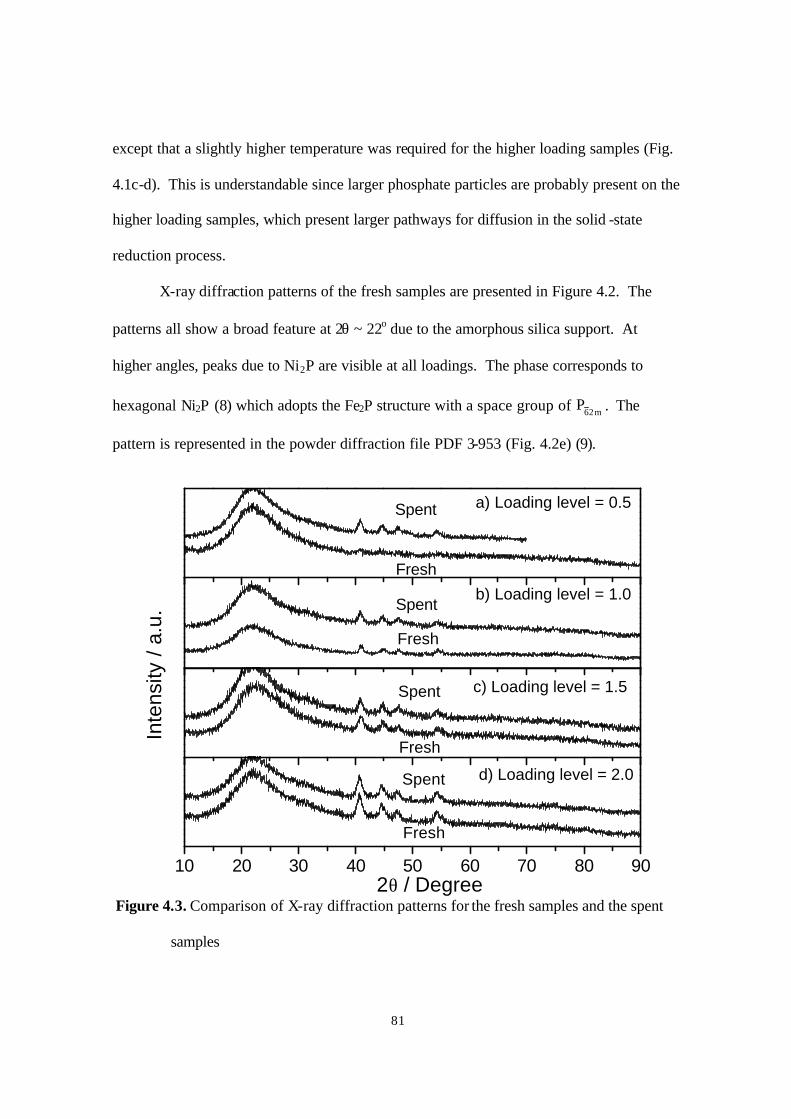
81
except that a slightly higher temperature was required for the higher loading samples (Fig.
4.1c-d). This is understandable since larger phosphate particles are probably present on the
higher loading samples, which present larger pathways for diffusion in the solid -state
reduction process.
X-ray diffraction patterns of the fresh samples are presented in Figure 4.2. The
patterns all show a broad feature at 2θ ~ 22o due to the amorphous silica support. At
higher angles, peaks due to Ni2P are visible at all loadings. The phase corresponds to
hexagonal Ni2P (8) which adopts the Fe2P structure with a space group of m26P . The
pattern is represented in the powder diffraction file PDF 3-953 (Fig. 4.2e) (9).
Figure 4.3. Comparison of X-ray diffraction patterns for the fresh samples and the spent
samples
10 20 30 40 50 60 70 80 90
Fresh
Spent
2θ / Degree
b) Loading level = 1.0
Inte
nsity
/ a.
u.
Fresh
Spent
c) Loading level = 1.5
Fresh
Spent
d) Loading level = 2.0
Fresh
Spent
a) Loading level = 0.5

82
X-ray diffraction patterns were also obtained for the spent samples (Fig. 4.3). The
figure shows that there is no change in the pattern for all the samples, demonstrating that
the Ni2P was relatively stable at the hydrotreating conditions. The intensity of the XRD
peaks for the spent samples increased, which indicates that the samples became more
crystallized after the hydrotreating reaction. The crystallization was likely a consequence
of the prolonged exposure (> 90 h) of the samples to the hydrotreating temperature of 643
K.
Table 4.2. Characterization results of samples
Loading level#
Samples BET
Surface area Sg m2g-1
CO uptake
µmolg-1
Metal site density (L)
µmolg-1
Dc
nm
Fresh 74 23 85 - 0.5
Spent 88 7 85 7.7
Fresh 97 28 170 - 1.0
Spent 89 24 170 8.7
Fresh 102 40 254 - 1.5
Spent 98 45 254 9.2
Fresh 72 37 339 - 2.0
Spent 83 27 339 9.8
#: the loading level of 1.0 corresponds to 12.2 wt.% Ni2P/SiO2
83
X-ray line broadening analysis of the spent samples indicates a weak trend toward
larger crystallite sizes with increasing sample loading. The crystallite sizes are listed in the
last column of Table 4.2 and are seen to increase from 7.7 to 9.8 nm. The surface
properties of the fresh catalysts are also shown in Table 4.2. The BET specific surface
areas (Sg) and CO chemisorption uptakes of the samples are listed in columns 3 and 4 of
the table, respectively. The Sg values of the samples were of the order of that of the silica
support (90 m2g-1) with deviations due to experimental error with the flow technique. The
CO chemisorption uptake increased with increase of the Ni2P loading, reaching a
maximum value of 40 µmol g-1, and then decreased. The results indicate that there is
probably crystallite agglomeration on the higher loading samples, resulting in a slightly
poorer dispersion of Ni2P, and hence giving lower CO chemisorption. Metal site
concentrations were obtained from the crystallite size (Dc) and the known density of metal
atoms ( n = 1.01 x 10¹⁵ atoms cm-2) from the crystal structure (1). The metal site
concentration was calculated from the equation, (L) = S n f, where f is the fractional weight
loading of the sample (Table 4.1), and n is the average surface metal atom density, S is the
theoretical surface area obtained from the equation, S = 6/ρDc. The results are listed in the
fifth column of Table 4.2, and are seen to increase with increasing loading amount. The
number of metal sites is much higher than the sites titrated by CO uptake. This could be
due in part to the agglomeration of the crystallites mentioned above. As can be seen, there
is a greater difference in the two values at higher loadings, consistent with this
interpretation. However, the differences are too large to be explained by just
agglomeration, and it is likely that CO chemisorption sites are blocked by surface
phosphorus. As described in the synthesis section, the samples here were prepared with an
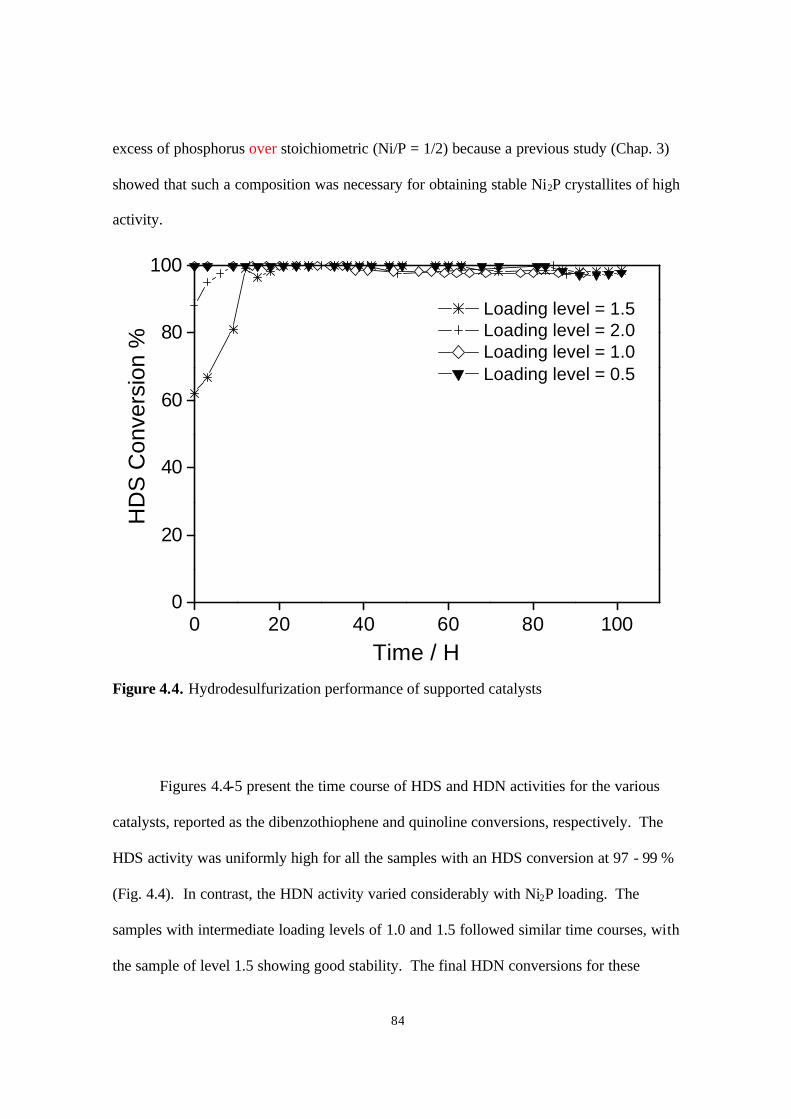
84
excess of phosphorus over stoichiometric (Ni/P = 1/2) because a previous study (Chap. 3)
showed that such a composition was necessary for obtaining stable Ni2P crystallites of high
activity.
Figure 4.4. Hydrodesulfurization performance of supported catalysts
Figures 4.4-5 present the time course of HDS and HDN activities for the various
catalysts, reported as the dibenzothiophene and quinoline conversions, respectively. The
HDS activity was uniformly high for all the samples with an HDS conversion at 97 - 99 %
(Fig. 4.4). In contrast, the HDN activity varied considerably with Ni2P loading. The
samples with intermediate loading levels of 1.0 and 1.5 followed similar time courses, with
the sample of level 1.5 showing good stability. The final HDN conversions for these
0 20 40 60 80 1000
20
40
60
80
100
HD
S C
onve
rsio
n %
Time / H
Loading level = 1.5 Loading level = 2.0 Loading level = 1.0 Loading level = 0.5

85
samples were 81 % and 91 %, respectively (Fig. 4.5). The sample with the highest and
lowest loading levels deactivated quickly and reached a low HDN activity below 40 %. A
summary of all the results is presented in Figure 4.6, which shows the effect of loading on
the activity of all the catalysts. The best performance was obtained at a loading level of
1.5 with an HDS conversion of 99 % and an HDN conversion of 91 %.
Figure 4.5. Hydrodenitrogenation performance of supported catalysts
Compared to a commercial Ni-Mo-S/Al2O3 catalyst which gives an HDS
conversion of 76 % and an HDN conversion of 38 %, the Ni2P/SiO2 with loading level 1.5
is substantially more active. The comparison here was based on 70 µmol of sites loaded in
the reactor, the sites counted by CO chemisorption for the phosphides and O2
0 20 40 60 80 1000
20
40
60
80
100
Time / H
HD
N C
onve
rsio
n %
Loading level = 1.5 Loading level = 1.0 Loading level = 0.5 Loading level = 2.0
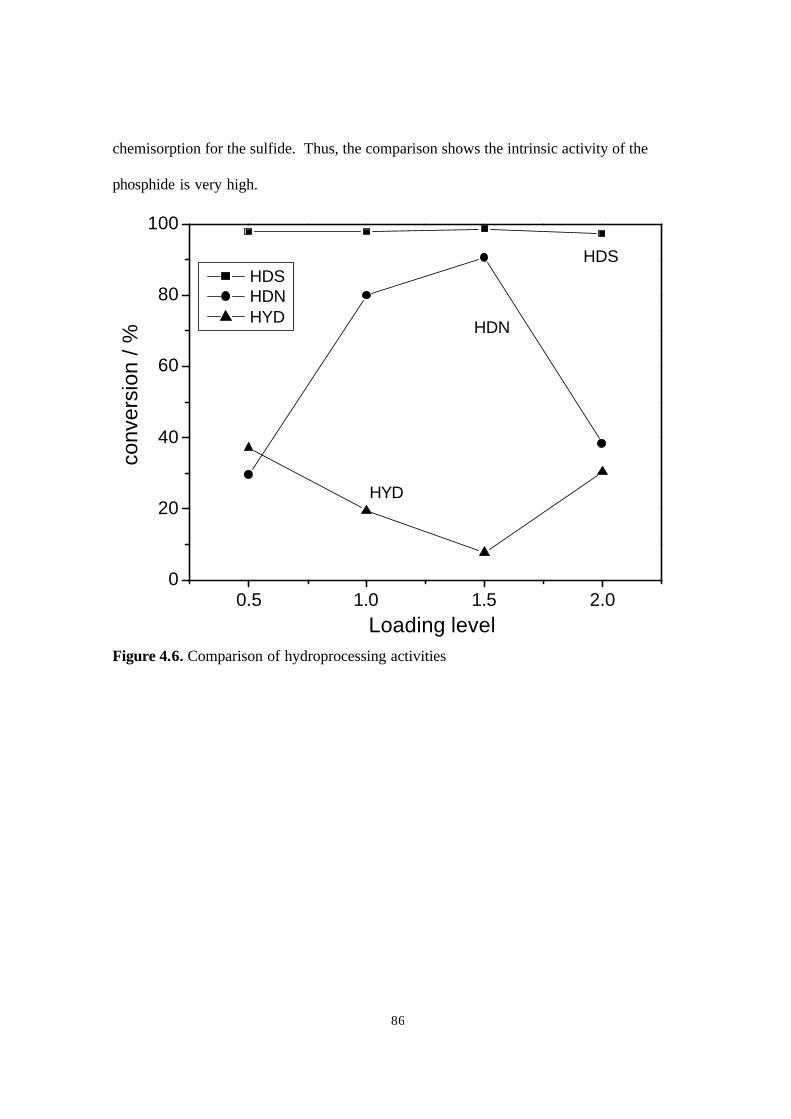
86
chemisorption for the sulfide. Thus, the comparison shows the intrinsic activity of the
phosphide is very high.
Figure 4.6. Comparison of hydroprocessing activities
0.5 1.0 1.5 2.00
20
40
60
80
100
HYD
HDN
HDS
conv
ersi
on /
%
Loading level
HDS HDN HYD
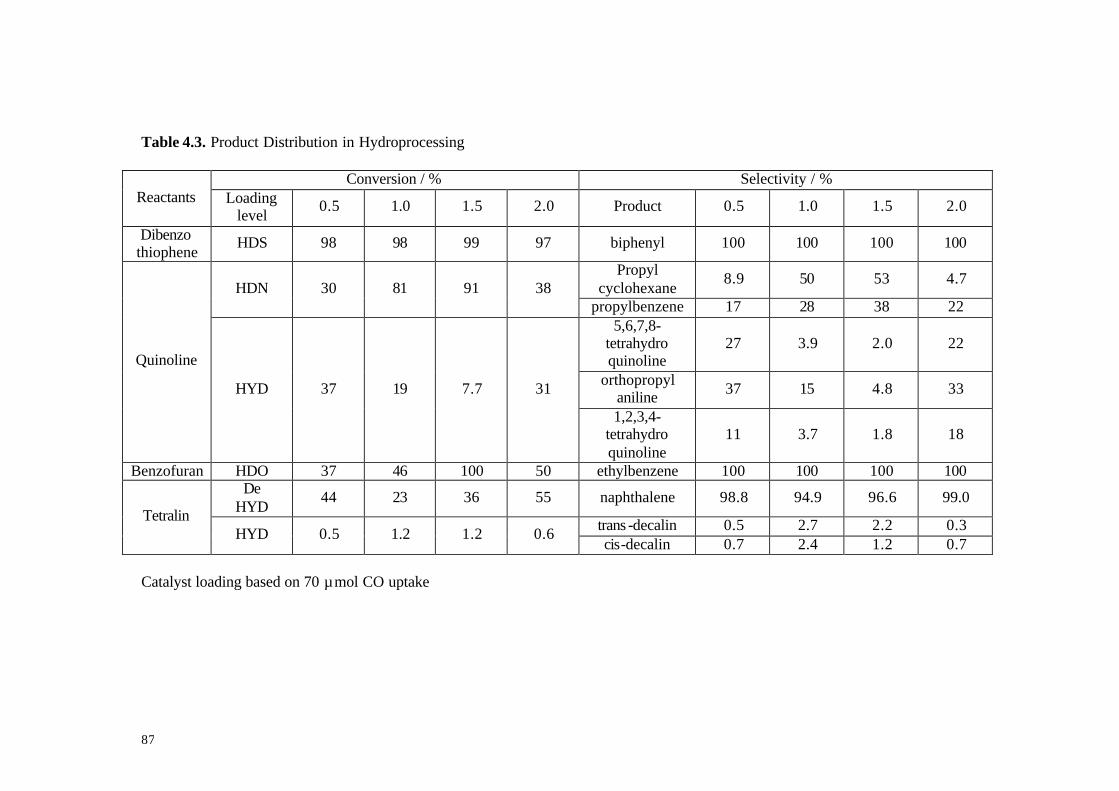
87
Table 4.3. Product Distribution in Hydroprocessing
Conversion / % Selectivity / % Reactants Loading
level 0.5 1.0 1.5 2.0 Product 0.5 1.0 1.5 2.0
Dibenzo thiophene
HDS 98 98 99 97 biphenyl 100 100 100 100
Propyl cyclohexane
8.9 50 53 4.7 HDN 30 81 91 38
propylbenzene 17 28 38 22 5,6,7,8-
tetrahydro quinoline
27 3.9 2.0 22
orthopropyl aniline 37 15 4.8 33
Quinoline
HYD 37 19 7.7 31
1,2,3,4-tetrahydro quinoline
11 3.7 1.8 18
Benzofuran HDO 37 46 100 50 ethylbenzene 100 100 100 100 De
HYD 44 23 36 55 naphthalene 98.8 94.9 96.6 99.0
trans -decalin 0.5 2.7 2.2 0.3 Tetralin
HYD 0.5 1.2 1.2 0.6 cis-decalin 0.7 2.4 1.2 0.7
Catalyst loading based on 70 µmol CO uptake
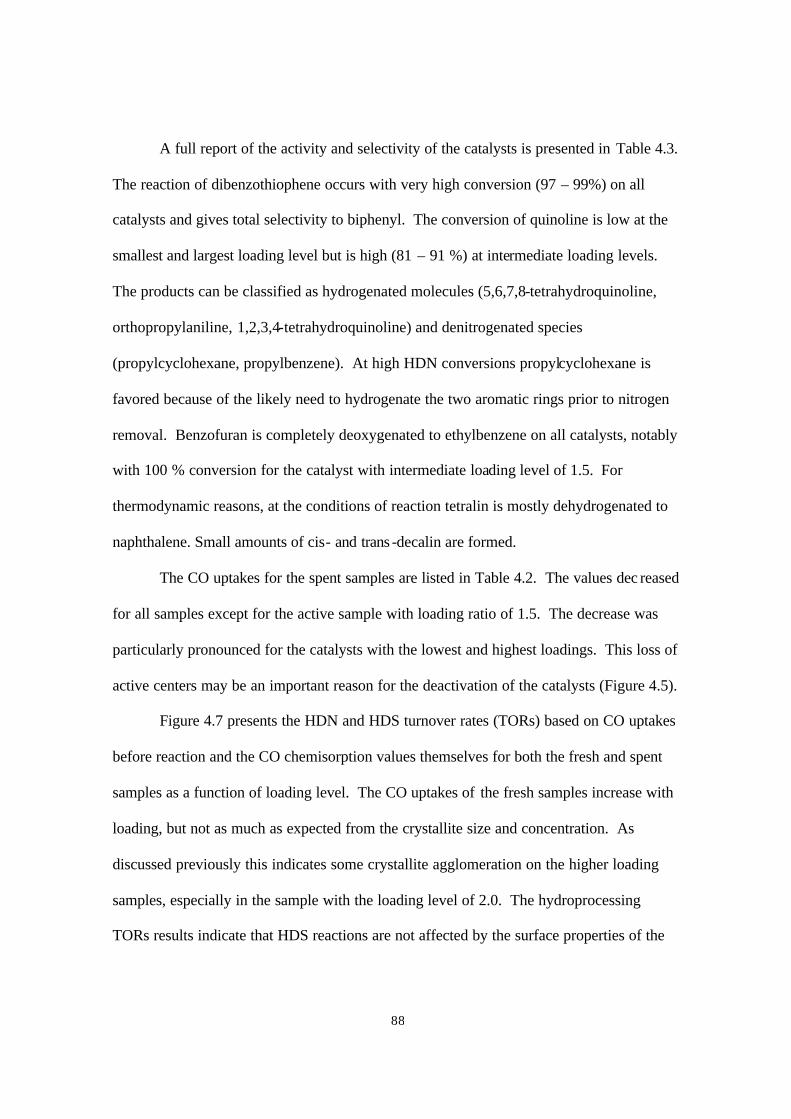
88
A full report of the activity and selectivity of the catalysts is presented in Table 4.3.
The reaction of dibenzothiophene occurs with very high conversion (97 – 99%) on all
catalysts and gives total selectivity to biphenyl. The conversion of quinoline is low at the
smallest and largest loading level but is high (81 – 91 %) at intermediate loading levels.
The products can be classified as hydrogenated molecules (5,6,7,8-tetrahydroquinoline,
orthopropylaniline, 1,2,3,4-tetrahydroquinoline) and denitrogenated species
(propylcyclohexane, propylbenzene). At high HDN conversions propylcyclohexane is
favored because of the likely need to hydrogenate the two aromatic rings prior to nitrogen
removal. Benzofuran is completely deoxygenated to ethylbenzene on all catalysts, notably
with 100 % conversion for the catalyst with intermediate loading level of 1.5. For
thermodynamic reasons, at the conditions of reaction tetralin is mostly dehydrogenated to
naphthalene. Small amounts of cis- and trans -decalin are formed.
The CO uptakes for the spent samples are listed in Table 4.2. The values dec reased
for all samples except for the active sample with loading ratio of 1.5. The decrease was
particularly pronounced for the catalysts with the lowest and highest loadings. This loss of
active centers may be an important reason for the deactivation of the catalysts (Figure 4.5).
Figure 4.7 presents the HDN and HDS turnover rates (TORs) based on CO uptakes
before reaction and the CO chemisorption values themselves for both the fresh and spent
samples as a function of loading level. The CO uptakes of the fresh samples increase with
loading, but not as much as expected from the crystallite size and concentration. As
discussed previously this indicates some crystallite agglomeration on the higher loading
samples, especially in the sample with the loading level of 2.0. The hydroprocessing
TORs results indicate that HDS reactions are not affected by the surface properties of the

89
catalysts, while the HDN reactions are very sensitive to the structure or composition of the
catalyst surface. In a previous study of the mechanism of HDN on MoP and WP (10) it
was established that denitrogenation occurred through an E2 elimination involving dual
acid and nucleophilic centers on the surfaces. The need for such surface centers also in the
case of Ni2P would make the reaction sensitive to the exact arrangement of Ni, P and
possibly S atoms on the surface, and would explain the strong effect of loading on HDN.
Figure 4.7. Curves of HDN and HDS turnover rates and CO uptakes
10
20
30
40
50 CO uptake fresh (dot line) CO uptake spent (dot line)
0.5 1.0 1.5 2.00.5
1.0
1.5
2.0 HDN (solid line) HDS (solid line)
HD
N T
OR
/ 10
-3s-1
CO
upt
ake
/ µm
ol g
-1
Loading level
10
20
30
40
50 CO uptake fresh (dot line) CO uptake spent (dot line)
0.5 1.0 1.5 2.00.5
1.0
1.5
2.0 HDN (solid line) HDS (solid line)
HD
N T
OR
/ 10
-3s-1
CO
upt
ake
/ µm
ol g
-1
Loading level
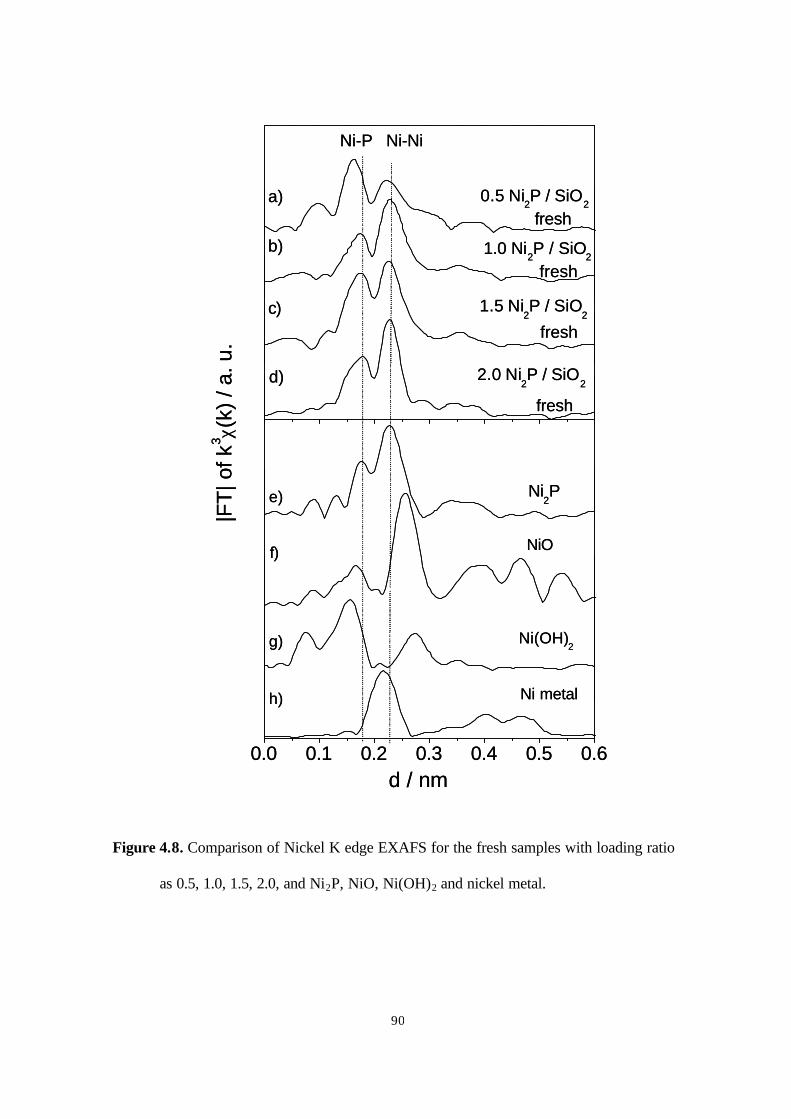
90
Figure 4.8. Comparison of Nickel K edge EXAFS for the fresh samples with loading ratio
as 0.5, 1.0, 1.5, 2.0, and Ni2P, NiO, Ni(OH)2 and nickel metal.
0.0 0.1 0.2 0.3 0.4 0.5 0.6
h)
g)
Ni metal
Ni(OH)2
|FT
| of k
3 χ(k)
/ a.
u.
d / nm
e)
d)
c)
fresh
fresh
b)
a)
fresh
fresh
Ni2P
0.5 Ni2P / SiO
2
1.0 Ni2P / SiO
2
1.5 Ni2P / SiO
2
2.0 Ni2P / SiO
2
Ni-P Ni-Ni
f) NiO
0.0 0.1 0.2 0.3 0.4 0.5 0.6
h)
g)
Ni metal
Ni(OH)2
|FT
| of k
3 χ(k)
/ a.
u.
d / nm
e)
d)
c)
fresh
fresh
b)
a)
fresh
fresh
Ni2P
0.5 Ni2P / SiO
2
1.0 Ni2P / SiO
2
1.5 Ni2P / SiO
2
2.0 Ni2P / SiO
2
Ni-P Ni-Ni
f) NiO
91
Figure 4.9. Nickel K edge EXAFS of the fresh and spent samples with different loading (
12.23 wt.% here was used as loading 1.0), a) o.5; b) 1.0; c) 1.5; d) 2.0
0.0 0.1 0.2 0.3 0.4 0.5 0.6
Ni-P Ni-Ni
d / nm
d)
0.5 Ni2P/SiO
2
Fresh Spent
c)
X 10
1.0 Ni2P/SiO
2
Fresh Spent
b)
1.5 Ni2P/SiO
2
Fresh Spent
|FT
| of k
3 χ(k)
/ a.
u.
a)
2.0 Ni2P/SiO
2
Fresh Spent
0.0 0.1 0.2 0.3 0.4 0.5 0.6
Ni-P Ni-Ni
d / nm
d)
0.5 Ni2P/SiO
2
Fresh Spent
c)
X 10
1.0 Ni2P/SiO
2
Fresh Spent
b)
1.5 Ni2P/SiO
2
Fresh Spent
|FT
| of k
3 χ(k)
/ a.
u.
a)
2.0 Ni2P/SiO
2
Fresh Spent
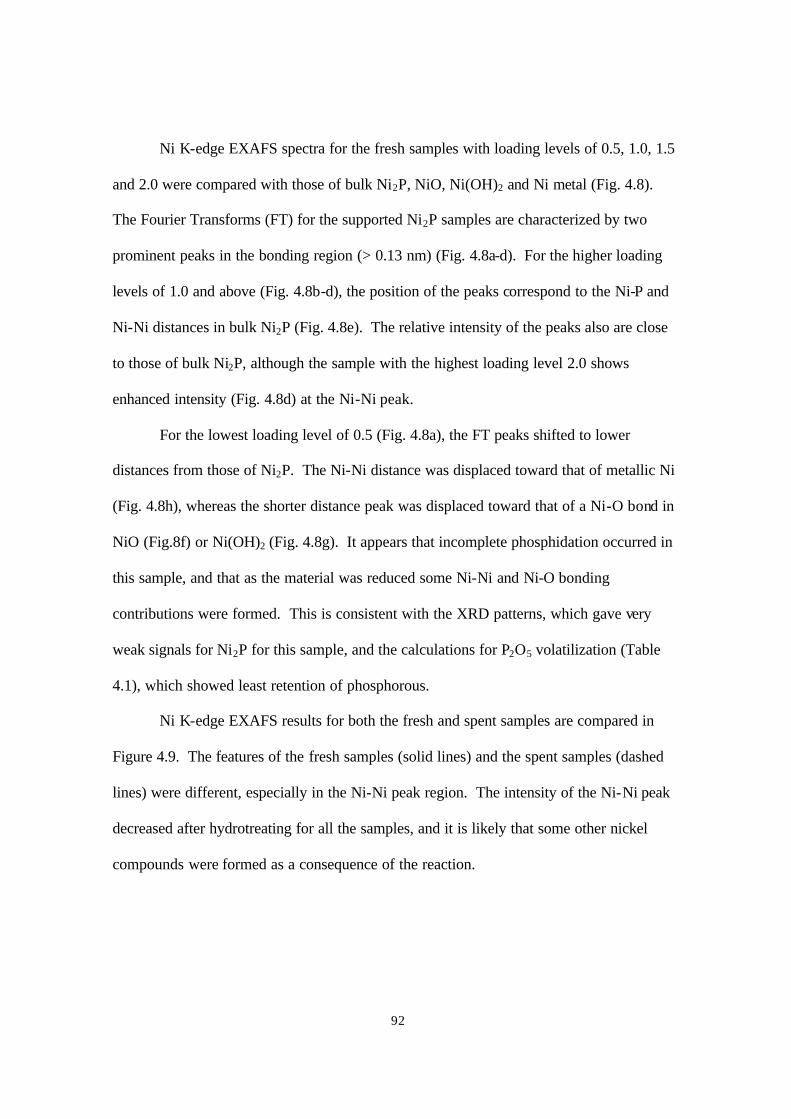
92
Ni K-edge EXAFS spectra for the fresh samples with loading levels of 0.5, 1.0, 1.5
and 2.0 were compared with those of bulk Ni2P, NiO, Ni(OH)2 and Ni metal (Fig. 4.8).
The Fourier Transforms (FT) for the supported Ni2P samples are characterized by two
prominent peaks in the bonding region (> 0.13 nm) (Fig. 4.8a-d). For the higher loading
levels of 1.0 and above (Fig. 4.8b-d), the position of the peaks correspond to the Ni-P and
Ni-Ni distances in bulk Ni2P (Fig. 4.8e). The relative intensity of the peaks also are close
to those of bulk Ni2P, although the sample with the highest loading level 2.0 shows
enhanced intensity (Fig. 4.8d) at the Ni-Ni peak.
For the lowest loading level of 0.5 (Fig. 4.8a), the FT peaks shifted to lower
distances from those of Ni2P. The Ni-Ni distance was displaced toward that of metallic Ni
(Fig. 4.8h), whereas the shorter distance peak was displaced toward that of a Ni-O bond in
NiO (Fig.8f) or Ni(OH)2 (Fig. 4.8g). It appears that incomplete phosphidation occurred in
this sample, and that as the material was reduced some Ni-Ni and Ni-O bonding
contributions were formed. This is consistent with the XRD patterns, which gave very
weak signals for Ni2P for this sample, and the calculations for P2O5 volatilization (Table
4.1), which showed least retention of phosphorous.
Ni K-edge EXAFS results for both the fresh and spent samples are compared in
Figure 4.9. The features of the fresh samples (solid lines) and the spent samples (dashed
lines) were different, especially in the Ni-Ni peak region. The intensity of the Ni-Ni peak
decreased after hydrotreating for all the samples, and it is likely that some other nickel
compounds were formed as a consequence of the reaction.
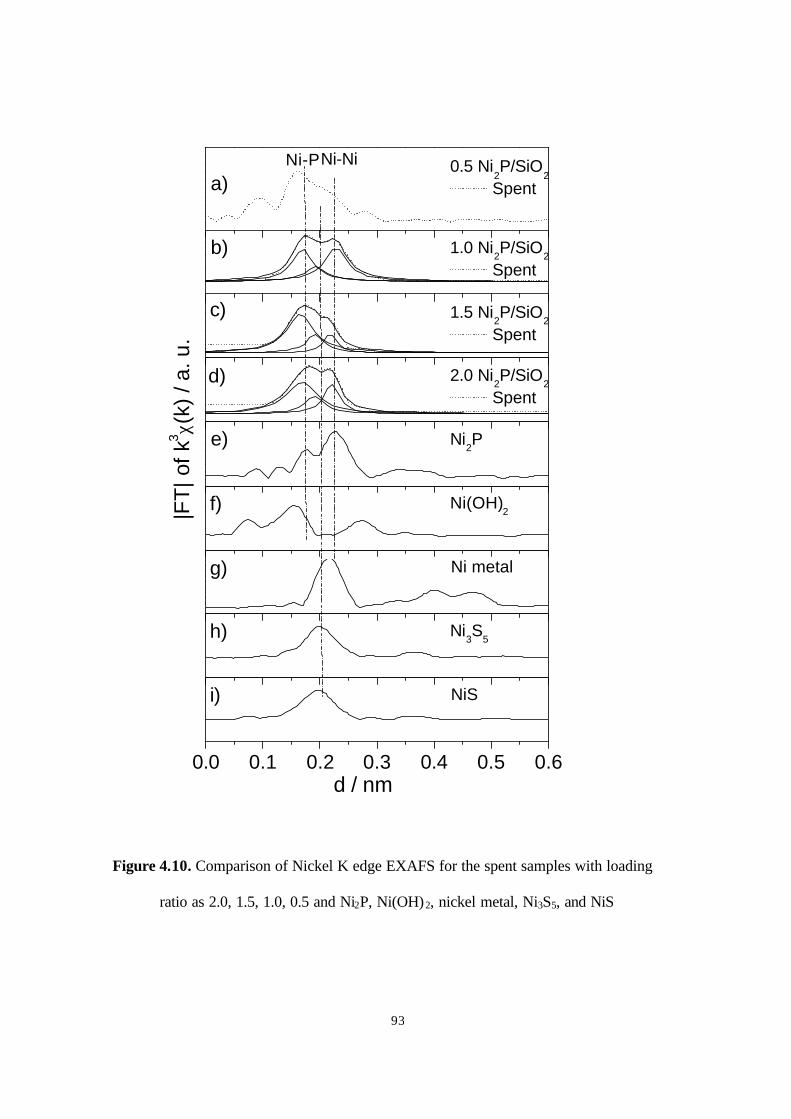
93
0.0 0.1 0.2 0.3 0.4 0.5 0.6
Ni-PNi-Ni
d / nm
d)
0.5 Ni2P/SiO
2 Spent
c)
1.0 Ni2P/SiO
2
Spent
1.5 Ni2P/SiO
2
Spent
|FT
| of k
3 χ(k)
/ a.
u.
a)
2.0 Ni2P/SiO
2
Spent
e)
b)
Ni2P
f) Ni(OH)2
g) Ni metal
h) Ni3S
5
i) NiS
Figure 4.10. Comparison of Nickel K edge EXAFS for the spent samples with loading
ratio as 2.0, 1.5, 1.0, 0.5 and Ni2P, Ni(OH)2, nickel metal, Ni3S5, and NiS

94
The EXAFS results of the spent samples (Fig. 4.10 a-d) were compared with some
reference compounds (Fig. 4.10e-i) to identify the newly formed phase. The diminution in
the intensity of the Ni-Ni peak in Ni2P for the samples (Fig. 4.10a-d) seemed to be
accompanied with a shift to lower distance. The Ni-P peak itself remained strong, though
slightly diminished in distance. The result could be due to the formation of some
phosphorous deficient Ni phase, but also could be due to development of intensity in the
Ni-S distance region. Even though no distinct Ni-S peak is seen, a feature in that region
would give rise to the broad signal actually observed. Fig. 4.10c-d shows just such a fit to
three Lorentzian line shapes for the higher loading samples.
In order to check the possibility of formation of a phosphorus-deficient phase,
calculation of the EXAFS of Ni12P5 were carried out. In a previous study of Ni2P/SiO2 of
different Ni/P ratios an XRD peak that could be due to Ni12P5 was observed for a spent
sample with Ni/P = 1/1. First, the applicability of FEFF calculations was checked with
Ni2P. The FEFF simulation of Ni2P produced a similar EXAFS oscillation compared to
the experimental result of Ni2P (Fig. 4.11a). In the higher k-region (> 80 nm-1), the
amplitude of the calculated oscillation was stronger than that of the experimental spectrum.
However, the periods of both EXAFS oscillations were quite similar. A comparison of the
Fourier transforms of bulk Ni2P and the FEFF simulation also showed good agreement
(Fig. 4.11b). The first and second nearest neighbors corresponding to Ni-P, and Ni-Ni
bonds in bulk Ni2P were identical to those obtained in the FEFF simulation (Table 4.4).
Moreover, the third and fourth shells of the Fourier transforms also showed good
agreement. This indicates that the FEFF simulation is able to account for the essential
elements of the bulk Ni2P structure.
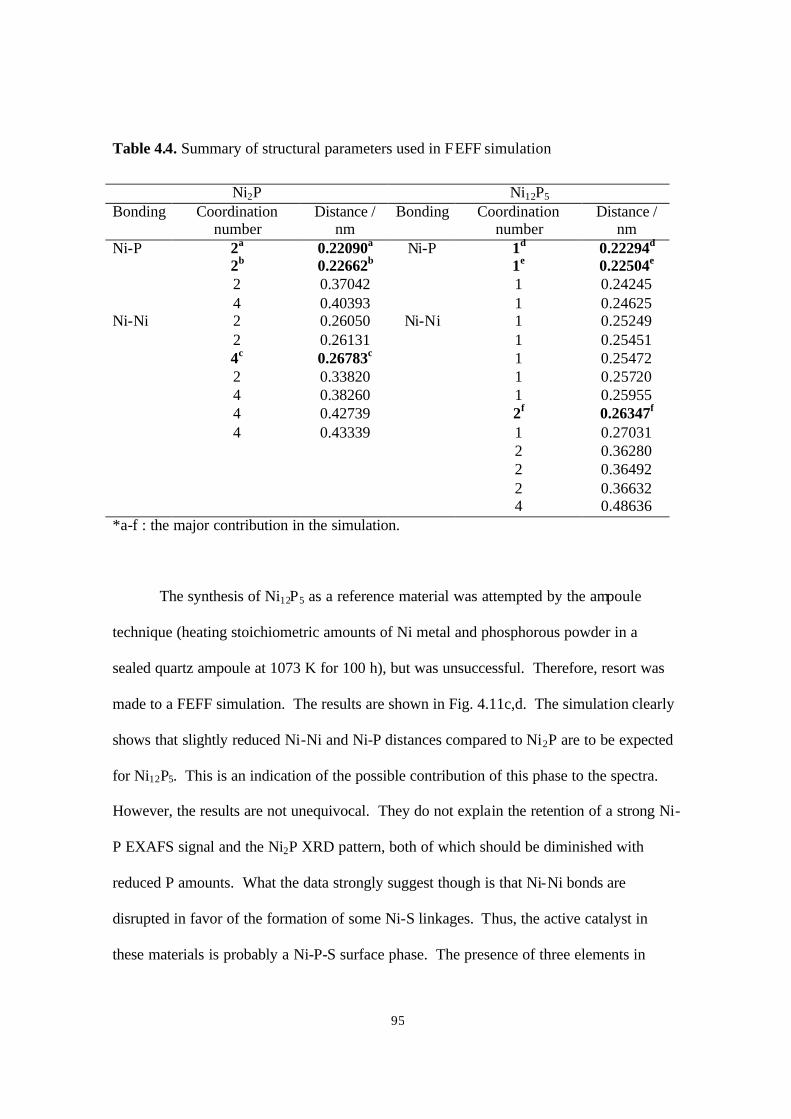
95
Table 4.4. Summary of structural parameters used in FEFF simulation
Ni2P Ni12P5
Bonding Coordination number
Distance / nm
Bonding Coordination number
Distance / nm
2a 0.22090a 1d 0.22294d 2b 0.22662b 1e 0.22504e 2 0.37042 1 0.24245
Ni-P
4 0.40393
Ni-P
1 0.24625 2 0.26050 1 0.25249 2 0.26131 1 0.25451 4c 0.26783c 1 0.25472 2 0.33820 1 0.25720 4 0.38260 1 0.25955 4 0.42739 2f 0.26347f 4 0.43339 1 0.27031 2 0.36280 2 0.36492 2 0.36632
Ni-Ni
Ni-Ni
4 0.48636 *a-f : the major contribution in the simulation.
The synthesis of Ni12P5 as a reference material was attempted by the ampoule
technique (heating stoichiometric amounts of Ni metal and phosphorous powder in a
sealed quartz ampoule at 1073 K for 100 h), but was unsuccessful. Therefore, resort was
made to a FEFF simulation. The results are shown in Fig. 4.11c,d. The simulation clearly
shows that slightly reduced Ni-Ni and Ni-P distances compared to Ni2P are to be expected
for Ni12P5. This is an indication of the possible contribution of this phase to the spectra.
However, the results are not unequivocal. They do not explain the retention of a strong Ni-
P EXAFS signal and the Ni2P XRD pattern, both of which should be diminished with
reduced P amounts. What the data strongly suggest though is that Ni-Ni bonds are
disrupted in favor of the formation of some Ni-S linkages. Thus, the active catalyst in
these materials is probably a Ni-P-S surface phase. The presence of three elements in
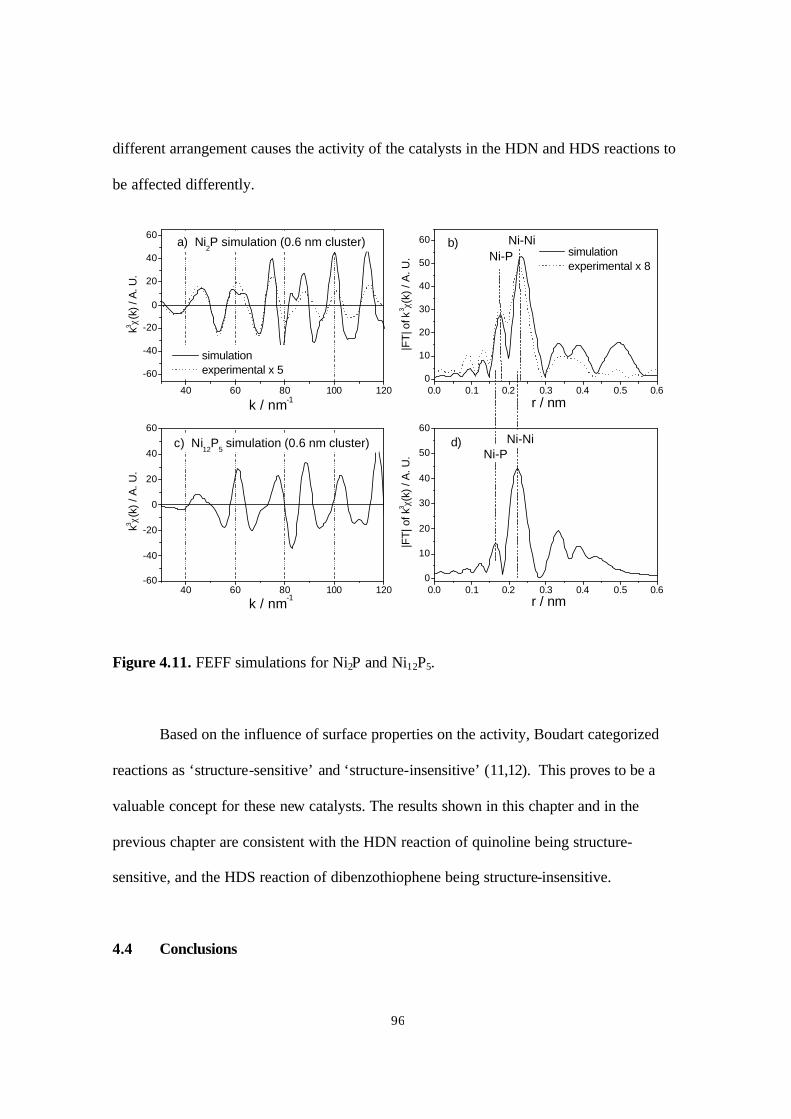
96
different arrangement causes the activity of the catalysts in the HDN and HDS reactions to
be affected differently.
Figure 4.11. FEFF simulations for Ni2P and Ni12P5.
Based on the influence of surface properties on the activity, Boudart categorized
reactions as ‘structure-sensitive’ and ‘structure-insensitive’ (11,12). This proves to be a
valuable concept for these new catalysts. The results shown in this chapter and in the
previous chapter are consistent with the HDN reaction of quinoline being structure-
sensitive, and the HDS reaction of dibenzothiophene being structure-insensitive.
4.4 Conclusions
0.0 0.1 0.2 0.3 0.4 0.5 0.60
10
20
30
40
50
60
40 60 80 100 120-60
-40
-20
0
20
40
60
0.0 0.1 0.2 0.3 0.4 0.5 0.60
10
20
30
40
50
60
40 60 80 100 120
-60
-40
-20
0
20
40
60
simulation experimental x 5
simulation experimental x 8
b)Ni-P
Ni-Ni
c) Ni12
P5 simulation (0.6 nm cluster)
a) Ni2P simulation (0.6 nm cluster)
|FT|
of k
3 χ(k)
/ A
. U.
k3 χ(k)
/ A
. U.
|FT
| of k
3 χ(k)
/ A
. U.
k3 χ(k)
/ A
. U.
r / nm
r / nm
k / nm-1
k / nm-1
Ni-NiNi-P
d)
97
The effect of loading on the structure and hydroprocessing behavior of Ni2P/SiO2
was investigated. The loading amount of Ni2P on silica was optimized with the best
reactivity results obtained at a Ni2P loading of 18 % to give an HDS conversion of 99 %,
and an HDN conversion of 91 %. These were much higher than those of a commercial
catalyst which gave an HDS conversion of 76 % and an HDN conversion of 38 %. XRD
and EXAFS showed the formation of Ni2P phase on all the fresh samples. The spent
samples experienced phase changes. The surface properties obtained from the BET
surface area and CO uptake measurements indicated the occurrence of crystallite
agglomeration on the higher loading samples. The loading effect and Ni/P composition
effect on the reactivities of the catalysts indicated again that the HDN reaction of quinoline
is structure sensitive, while the HDS reaction of dibenzothiophene is structure insensitive.
References
1. Wang, X., Oyama, S. T., Requejo, F., J. Catal., submitted.
2. Oyama, S. T., Wang, X., Requejo, F., Sato, T., Yoshimura, Y., J. Catal. In press.
3. Cullity, B.D., “Elements of X-Ray Diffraction”, 2nd Ed., p. 102, Addison-Wesley
Publishing Company, Menlo Park, California, 1978.
4. Ankudinov, A.,L., Ravel, B., Rehr, J., J., Congradson, S., D., Phys. Rev. B 58,
7565 (1998)
5. Larson, E., Arkiv. Kemi., 23, 335(1965).
6. Larson, E., Arkiv. Kemi., 23, 345(1965).
98
7. Ramanathan, S., Oyama, S. T., New catalysts for Hydroprocessing: Transition
Metal Carbides and Nitrides, J. Phys. Chem., Vol.99, No.44, 1995, 16365-16372
8. Rundqvist, S., Acta Chem. Scand. 16, 992 (1962).
9. Powder Diffraction Data Files, JCPDS International Center for Diffraction Data,
Swathmore, PA, 1992.
10. Clark, P., Wang, X., Oyama, S. T., Pentylamine mechanism study.
11. Boudart, M.; Djega-Mariadasson, G, “Kinetics of Heterogeneous Catalytic
Reactions”. USA. (1984), 222 pp., Princeton University Press, Princeton, N. J.
12. Thomas, J. M.; Thomas, J. W.; Editors, “Principles and Practice of Heterogeneous
Catalysis”. Germany. (1996), 553 pp. VCH, Weinheim, Germany
99
Chapter 5
Mechanism of Hydrodenitrogenation on Supported Nickel Phosphide
(Ni2P/SiO2)
5.1 Introduction
Stricter environmental laws (1,2) and a decreasing quality of available petroleum
feedstocks are placing high demands on hydrotreating technology, a set of processes used to
remove pollutants, such as S, N, O and metals in refinery streams (3). This has led to
intensive research in the development of improved catalysts with enhanced activity for
hydrodesulfurization (HDS) and hydrodenitrogenation (HDN). Recently, a new catalyst,
nickel phosphide Ni2P, has been reported (4,5,6) with outstanding performance in
simultaneous HDN and HDS. The purpose of this work is to investigate the mechanism of
HDN on Ni2P supported on silica. This topic is important because nitrogen compounds
inhibit HDS (7) strongly and so their removal is key for obtaining ultra-low sulfur products.
Hydrodenitrogenation (HDN) of compounds in oil fractions is more difficult than
hydrodesulfurization, requiring more severe conditions and greater hydrogen consumption
(8). In most cases the prefered pathway for the HDN of heterocyclic molecules involves
hydrogenation of aromatic rings associated with nitrogen atoms because it is easier to
break C(sp3)-N bonds than C(sp2)-N bonds. Thus, quinoline undergoes complete
hydrogenation of its heterocyclic and benzenic rings before removal of nitrogen (9,10,11),
indole is hydrogenated to octahydroindoline (12) and pyridine is hydrogenated to
piperidine (13,14,15). For this reason saturated compounds such as piperidine and its
derivatives have been the subject of considerable study (16). The work is described in a
100
comprehensive discussion of the mechanism of piperidine HDN by Hadjiloizou, et al. (17),
an in-depth review of catalytic denitrogenation by Pero t (18), and a more recent insightful
monograph by Prins (19). In many cases for sulfides (20), carbides (21), and nitrides
(22,21), the C-N bond cleavage proceeds by a β-elimination mechanism catalyzed by a
Brønsted acid - Lewis base sites (23,24). Although there is some uncertainty about the
rate-limiting step (20,21,25), there is agreement that HDN involves a multi-functional
mechanism with hydrogenation and C-N cleavage carried out on different active sites
(26,27,28,29) depending on the structure of the nitrogen containing heterocyclic
compound, the reaction conditions, and the type of catalyst.
In this work, the mechanism on Ni2P/SiO2 was studied using piperidine and several
of its derivatives to determine the effect of amine structure on reactivity, and hence,
reaction pathway. Piperidine, C5H10N, is a saturated cyclic secondary amine obtained by
the hydrogenation of pyridine. The HDN of piperidine involves the cleavage of two C-N
bonds and its conversion is representative of the reaction of other cyclic nitrogen
compounds. The work is important because there are many pyridine derivatives in
petroleum and their HDN pathway involves hydrogenation to piperidine intermediates. It
was found that the result could be explained by either a dual mechanism involving SN2 and
E2 pathways or by a single mechanism involving activation of the carbon atoms in α and β
positions relative to the N atom in the ring. This work also employed a simpler amine,
ethylamine, as a reactant and spectroscopic probe of the reaction pathways. Infrared
studies allowed the determination of the structure of the reaction intermediate and the
possible mechanisms of reaction.

101
5.2 Experimental
5.2.1 Materials
The support used in this study was a fumed silica (Cabosil, L90). The catalyst
precursors were nickel nitrate, Ni(NO3)2·6H2O (Aesar, 99 %) and ammonium
orthophosphate (NH4)2HPO4 (Aldrich, 99 %). The chemicals utilized in the study of the
mechanism were dibenzothiophene (Aldrich, 99.5 %), quinoline (Aldrich, 99.9 %),
benzofuran (Aldrich, 99.9 %), tetralin (Aldrich, 99.5 %), tetradecane (Jansen Chimica, 99
%), piperidine (Aldrich, 99.9 %), 2-methyl piperidine (Aldrich, 99.9 %), 3-methyl
piperidine (Aldrich, 99.9 %), 4-methyl piperidine (Aldrich, 99.9 %), 2,6-dimethyl
piperidine (Aldrich, 99.9 %), octane (Acros, 99%), dimethyl disulfide (Aldrich, 99 %), and
ethylamine (Aldrich, 97 %), The chemicals used as gas chromatography reference samples
were 1,4-pentadiene (Aldrich, 99.9 %), pentane (Aldrich, 99.9 %), 1-pentene (Aldrich,
99.9 %), 3-methyl-1,4-pentadiene (Aldrich, 99.9 %), 4-methyl-1-pentene (Aldrich, 99.9
%), 3-methyl-1-pentene (Aldrich, 99.9 %), 2-methyl-1-pentane (Aldrich, 99.9 %), hexane
(Aldrich, 99.9 %), 3-methyl-1-pentane (Aldrich, 99.9 %), 2-methyl-1-pentene (Aldrich,
99.9 %), 1-hexene (Aldrich, 99.9 %), trans-2-hexene (Aldrich, 99.9 %), 1,4-hexadiene
(Aldrich, 99.9 %), 3-methyl-1,3-pentadiene (Aldrich, 99.9 %), trans-2-heptene (Aldrich,
99.9 %), heptane (Aldrich, 99.9 %), pyridine (Aldrich, 99.9 %), 2-picoline (Aldrich, 99.9
%), 3-picoline (Aldrich, 99.9 %), 4-picoline (Aldrich, 99.9 %), 2,6 –lutidine (Aldrich, 99.9
%). The gases employed were He (Airco, Grade 5), CO (Linde Research Grade, 99.97 %),
102
0.5 % O2/He (Airco, UHP Grade), H2 (Airco, Grade 5), N2 (Airco, 99.99 %), 10 % (v/v)
H2S/H2 (Air Products, 99.999 %) and 30 % N2/He (Airco, UHP Grade).
5.2.2 Synthesis of the catalyst
The catalyst used in this study was a nickel phosphide supported on silica,
Ni2P/SiO2, prepared with excess phosphorus (Ni/P=1/2) and a loading of 1.16 mmol Ni / g
support (12.2 wt.% Ni2P/SiO2). Previous studies (5,6) had shown that this composition
and loading level gave high activity and stability in hydroprocessing reactions. The
synthesis of the catalyst involved two steps and was described elsewhere (4, 5). Briefly, in
the first step, a supported nickel phosphate precursor was prepared by incipient wetness
impregnation of a solution of nickel and phosphorus components, followed by calcination.
In the second step, the phosphate was reduced to a phosphide by the method of
temperature-programmed reduction (TPR).
5.2.3 Characterization
The synthesized material was characterized by CO chemisorption, N2
physisorption, and x-ray diffraction (XRD) measurements. In addition, the surface
properties of the catalyst were studied using temperature programmed desorption (TPD)
and diffuse reflectance infrared Fourier transform (DRIFT) measurements of the probe
molecule ethylamine (CH3CH2NH2).
103
Irreversible CO uptakes and surface area measurements were obtained using a flow
technique (4,5). The catalyst was reduced at 723 K for 2 h in a H2 flow prior to the
measurements. Measurements on a typical spent sample were carried out after collecting
the material from the reactor, washing with hexane, and reducing the catalyst as for the
fresh sample. Powder XRD patterns were acquired with a Scintag XDS-2000 powder
diffractometer operated at 45 kV and 40 mA, using Cu Kα monochromatized radiation (λ =
0.154178 nm).
DRIFT spectra of ethylamine adsorbed on the Ni2P/SiO2 and blank SiO2 were
collected using a Fourier transform infrared spectrometer (Bio-Rad Model FTS 60A)
equipped with a heatable diffuse-reflectance flow cell (Spectratech Model HTEC-0030-
103). Studies of the effect of temperature were performed on these samples to determine
the identity and stability of the adsorbed species on the catalyst surface. The samples were
finely grounded prior to loading in the high temperature environmental chamber, and were
pretreated in a H2 flow at 723 K for 2 h in the same manner as before the hydrotreating
reactivity measurements. In order to simulate the chemical environment in which the
reactivity and mechanism tests were performed, the spectra were measured on the samples
pretreated with a gas mixture of H2S and H2 at conditions of reaction (sulfur concentration
of 3000 ppm, 553 K) and the differences with the spectra of reduced, sulfur-free samples
were analyzed. Following pretreatment, the samples were cooled to room temperature in a
helium flow, and IR spectra were collected (1024 scans in the region 4000 – 400 cm-1).
Then pulses (~ 20 µmol) of ethylamine in a helium carrier were introduced onto the sample
at room temperature. To determine the effect of temperature, the spectra were obtained
after the sample was soaked for 300 s at a certain temperature (298 K, 323 K, 333 K, 343
104
K, 353 K, 363 K, 373 K ) then cooled down to room temperature. The sample spectra
were normalized with a background spectrum acquired using a blank KBr sample. The
final spectra were calculated after subtraction of a reference spectrum from the one
obtained before the catalysts were exposed to the ethylamine gas.
Temperature programmed desorption (TPD) of ethylamine was measured on
samples pretreated in H2S using a similar procedure as was employed in the FTIR
experiments. After pretreatment, the samples were saturated with pulses (35.4 µmol) of
the ethylamine at room temperature, and purged with the carrier gas for one hour before
starting the temperature program. The amount of adsorption was calculated by the same
method as the CO uptake measurements by integrating the areas of the pulses and
calculating the differences with pulses at saturation. The temperature was raised from
room temperature to 1273 K at a heating rate of 0.1368 K s-1 (8.2 K min-1). The mass
spectrometer was used to monitor the masses (2, 4, 15, 17, 18, 27, 28, 30, 31, 44) in the
effluent gas during heating. The amounts of the desorbed species were calibrated by
injection of known amounts of pure gases (NH3, CH2CH2, CH3CH2NH2).
5.2.4 Reactivity studies
The reactivity of piperidine and its derivatives was measured in a three-phase
trickle bed reactor with a feed liquid containing 2000 ppm wt. nitrogen (piperidine or
derivatives), 3000 ppm wt. sulfur (dimethyl disulfide), 2000 ppm wt. internal standard
(octane), and balance aliphatics (tetradecane). The system was operated at 3.1 MPa and
various temperatures with an inlet liquid flow rate of 5 cm3/h and a hydrogen flow rate of
105
100 µmol s-1 (150 cm3 NTP min-1) corresponding to a gas-liquid ratio of 9800 SCF
H2/barrel. The detailed description of the testing system is reported elsewhere (30).
Quantities of catalysts loaded in the reactor corresponded to the same amount of ex situ CO
uptake (70 µmol). Prior to reactivity measurements, the catalyst samples were pretreated
in exactly the same manner as before the CO chemisorption measurements. The
experiments were long (~ 300 h). For each change in temperature, the reaction system was
allowed to run for 48 h to establish steady-state. Samples were collected every 2 or 3
hours during daytime in sealed septum vials and were analyzed off-line with a gas
chromatograph (Hewlett Packard, 5890A) equipped with a 0.32 mm i.d. x 50 m fused
silica capillary column (CPSIL-5CB, Chrompack, Inc.) and a flame ionization detector.
The results of several measurements were averaged. After several changes of operating
conditions, the reactivity of the catalyst was tested at a previous condition to verify that no
deactivation occurred.
Reaction products were identified by matching retention times to standards injected
separately. The peak areas were calibrated with the same method described elsewhere
(21). The mass balance acquired using this method was close to 100 ± 5 %.
5.3 Results
5.3.1 Properties of the catalyst
The XRD patterns of the fresh and spent samples together with the reference
patterns of SiO2, bulk Ni2P, and a powder diffraction file standard (Ni2P, PDF 3-953), are

106
shown in Figure 5.5.1. The figure reveals that the fresh sample consisted of amorphous
silica and finely dispersed Ni2P (31) with a hexagonal structure (Space group: m26P &&& ). The
intensities of the XRD lines for the spent sample were somewhat stronger that those of the
fresh material. The line-broadening of the x-ray peaks was used to calculate the average
crystallite size of the samples after reaction using the Scherrer method as described
elsewhere (4). Table 5.1. summarizes the characteristics of catalyst, including the specific
surface area and CO uptakes of the samples.
Figure 5.1. XRD patterns of both the fresh and spent Ni2P/SiO2
10 20 30 40 50 60 70 80 90
e) PDF 3-953 Ni2P
2θ / Degrees
Inte
nsity
/ a.
u.
d) Bulk Ni2P
c) Fresh Ni2P/SiO
2
b) Spent Ni2P/SiO
2
a) SiO2

107
Table 5.1. Characteristics of Ni2P/SiO2
Ni:P
Ratio Sample
Surface area
m2 g-1
CO uptake
µmol g-1
Dc
nm
Fresh 97 28 - 1/2
Spent 89 24 8.7
Figure 5.2. Conversion of piperidines
460 480 500 520 540 560 580 6000
20
40
60
80
100
N
HN
H
CH3
N
H
CH3H3C N
H
N
H
CH3
CH3
~ > >>
piperidine 4-methylpiperidine 2,6-dimethylpiperidine 3-methylpiperidine 2-methylpiperidine
Temperature / K
Tot
al C
onve
rsio
n / %
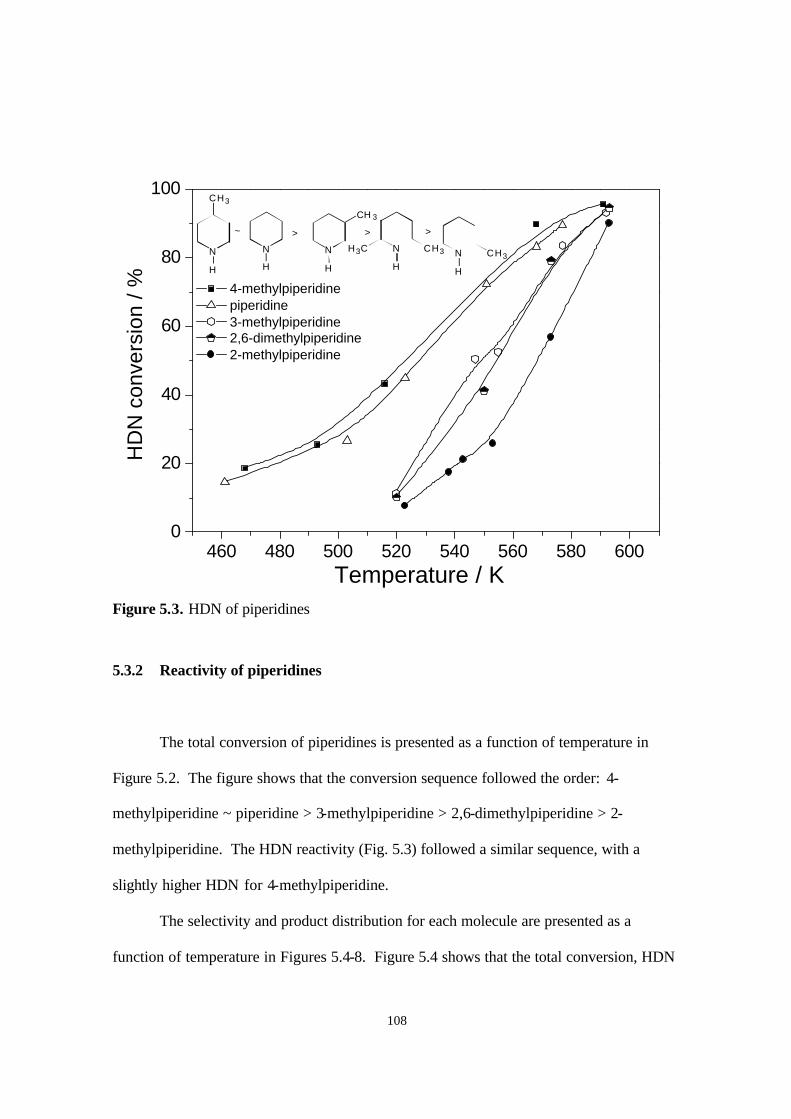
108
Figure 5.3. HDN of piperidines
5.3.2 Reactivity of piperidines
The total conversion of piperidines is presented as a function of temperature in
Figure 5.2. The figure shows that the conversion sequence followed the order: 4-
methylpiperidine ~ piperidine > 3-methylpiperidine > 2,6-dimethylpiperidine > 2-
methylpiperidine. The HDN reactivity (Fig. 5.3) followed a similar sequence, with a
slightly higher HDN for 4-methylpiperidine.
The selectivity and product distribution for each molecule are presented as a
function of temperature in Figures 5.4-8. Figure 5.4 shows that the total conversion, HDN
460 480 500 520 540 560 580 6000
20
40
60
80
100
N
H
N
H
CH3
N
H
CH3H3CN
H
N
H
CH 3
CH3
~ > > >
HD
N c
onve
rsio
n / %
Temperature / K
4-methylpiperidine piperidine 3-methylpiperidine 2,6-dimethylpiperidine 2-methylpiperidine
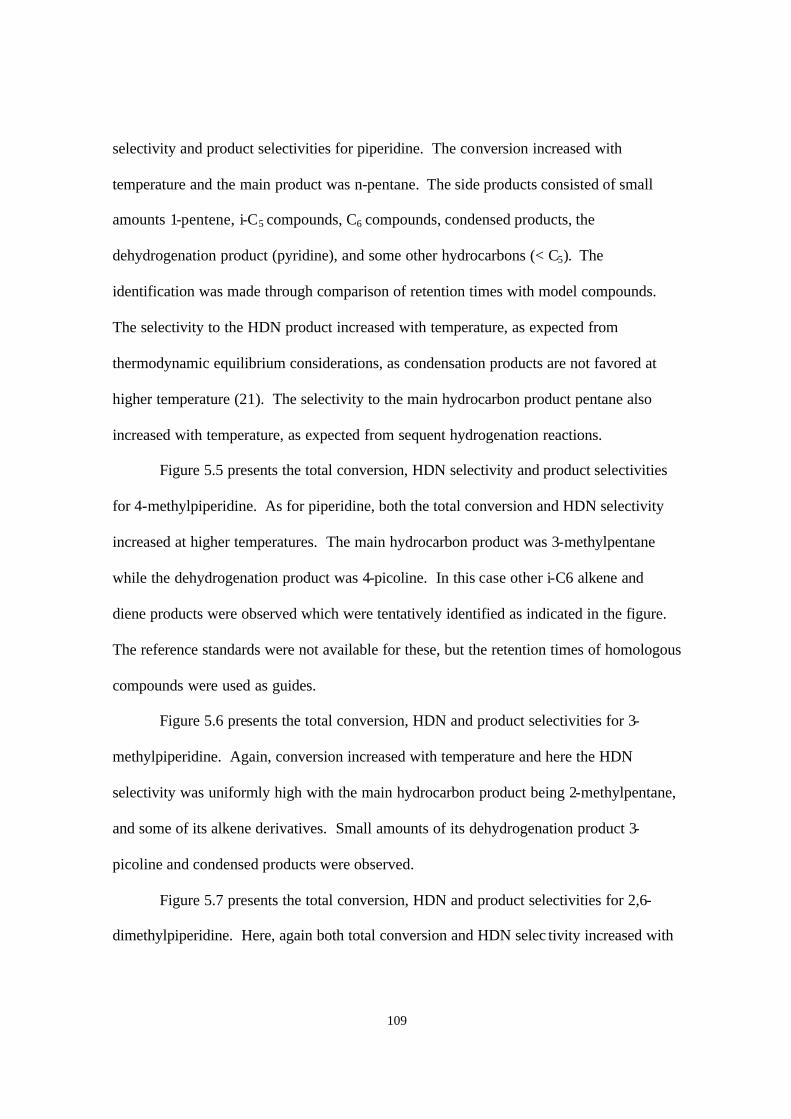
109
selectivity and product selectivities for piperidine. The conversion increased with
temperature and the main product was n-pentane. The side products consisted of small
amounts 1-pentene, i-C5 compounds, C6 compounds, condensed products, the
dehydrogenation product (pyridine), and some other hydrocarbons (< C5). The
identification was made through comparison of retention times with model compounds.
The selectivity to the HDN product increased with temperature, as expected from
thermodynamic equilibrium considerations, as condensation products are not favored at
higher temperature (21). The selectivity to the main hydrocarbon product pentane also
increased with temperature, as expected from sequent hydrogenation reactions.
Figure 5.5 presents the total conversion, HDN selectivity and product selectivities
for 4-methylpiperidine. As for piperidine, both the total conversion and HDN selectivity
increased at higher temperatures. The main hydrocarbon product was 3-methylpentane
while the dehydrogenation product was 4-picoline. In this case other i-C6 alkene and
diene products were observed which were tentatively identified as indicated in the figure.
The reference standards were not available for these, but the retention times of homologous
compounds were used as guides.
Figure 5.6 presents the total conversion, HDN and product selectivities for 3-
methylpiperidine. Again, conversion increased with temperature and here the HDN
selectivity was uniformly high with the main hydrocarbon product being 2-methylpentane,
and some of its alkene derivatives. Small amounts of its dehydrogenation product 3-
picoline and condensed products were observed.
Figure 5.7 presents the total conversion, HDN and product selectivities for 2,6-
dimethylpiperidine. Here, again both total conversion and HDN selec tivity increased with
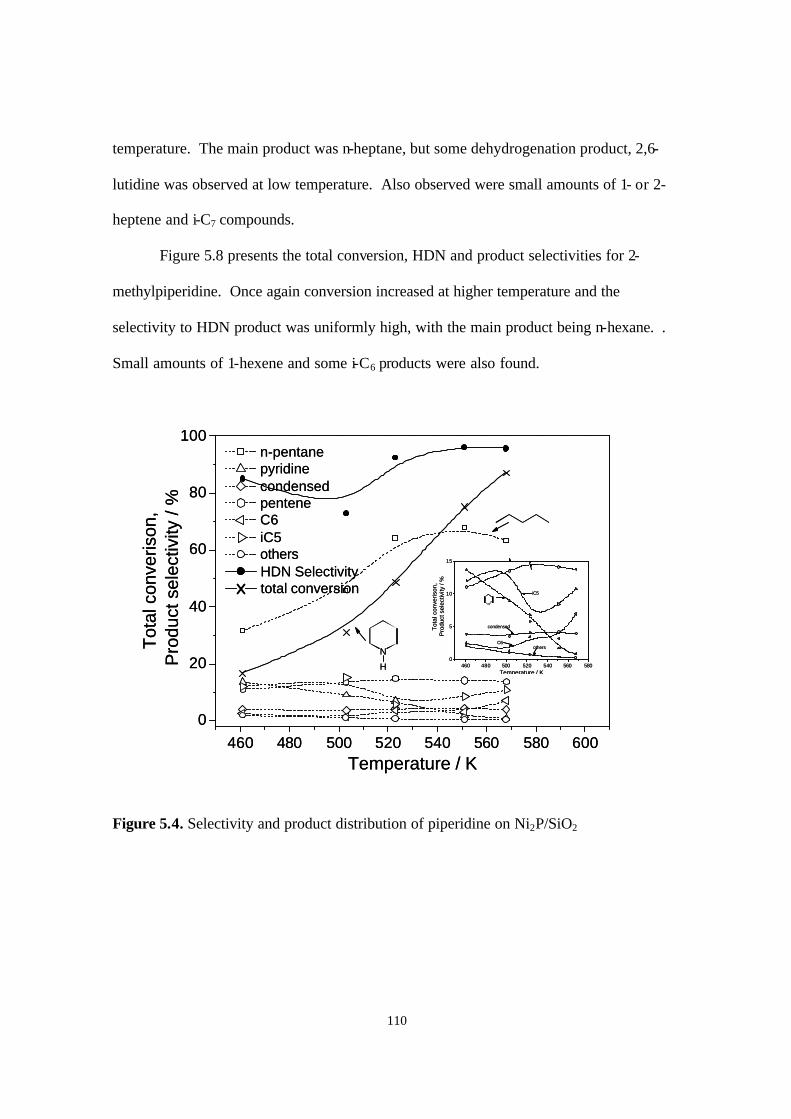
110
temperature. The main product was n-heptane, but some dehydrogenation product, 2,6-
lutidine was observed at low temperature. Also observed were small amounts of 1- or 2-
heptene and i-C7 compounds.
Figure 5.8 presents the total conversion, HDN and product selectivities for 2-
methylpiperidine. Once again conversion increased at higher temperature and the
selectivity to HDN product was uniformly high, with the main product being n-hexane. .
Small amounts of 1-hexene and some i-C6 products were also found.
Figure 5.4. Selectivity and product distribution of piperidine on Ni2P/SiO2
460 480 500 520 540 560 580 6000
20
40
60
80
100
N
H
n-pentane pyridine condensed pentene C6 iC5 others HDN Selectivity total conversion
Tot
al c
onve
rison
, P
rodu
ct s
elec
tivity
/ %
Temperature / K
460 480 500 520 540 560 5800
5
10
15
othersC6
condensed
iC5
N
Tot
al c
onve
rison
, P
rodu
ct s
elec
tivity
/ %
Temperature / K
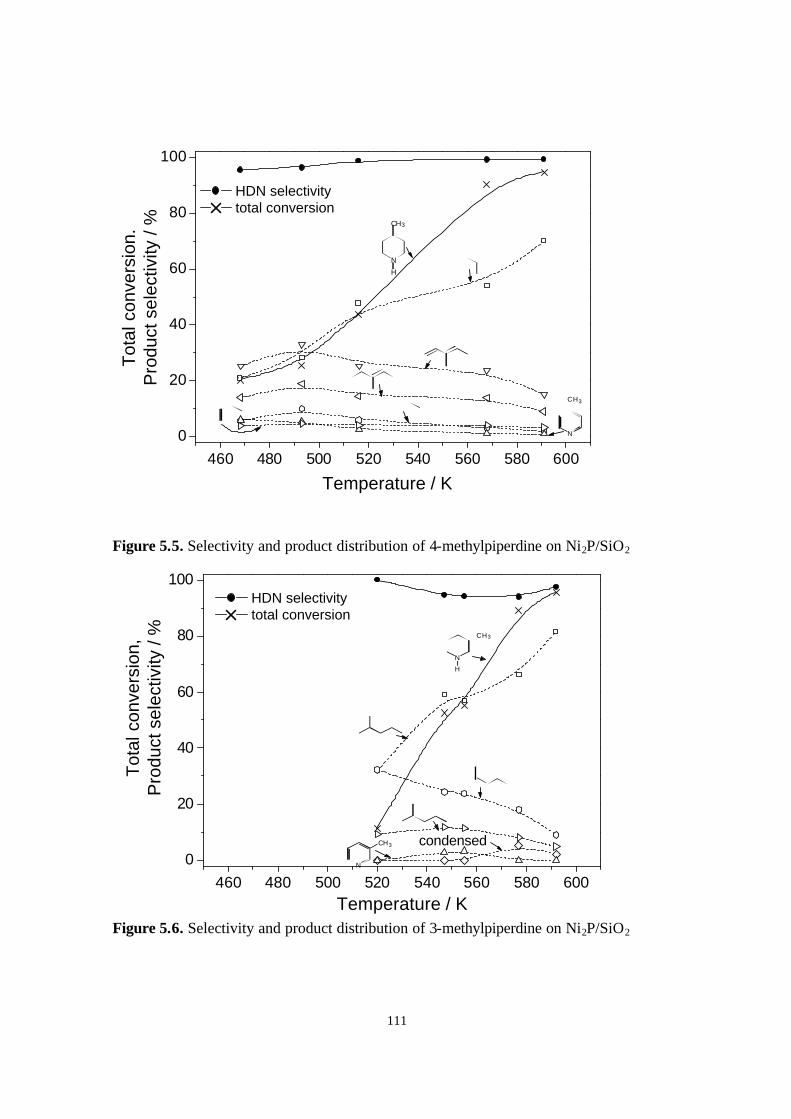
111
Figure 5.5. Selectivity and product distribution of 4-methylpiperdine on Ni2P/SiO2
Figure 5.6. Selectivity and product distribution of 3-methylpiperdine on Ni2P/SiO2
460 480 500 520 540 560 580 6000
20
40
60
80
100
N
CH3
N
H
CH3
HDN selectivity total conversion
Tot
al c
onve
rsio
n.P
rodu
ct s
elec
tivity
/ %
Temperature / K
460 480 500 520 540 560 580 6000
20
40
60
80
100
N
CH3 condensed
N
CH3
H
HDN selectivity total conversion
Tot
al c
onve
rsio
n,P
rodu
ct s
elec
tivity
/ %
Temperature / K

112
Figure 5.7. Selectivity and product distribution of 2,6-dimethylpiperdine on Ni2P/SiO2
Figure 5.8. Selectivity and product distribution of 2-methylpiperdine on Ni2P/SiO2
460 480 500 520 540 560 580 6000
20
40
60
80
100
condensedi-C7's
othersN CH3H3 C
N
H
CH3H3 C
HDN selectivity total conversion
Tot
al c
onve
rsio
n.P
rodu
ct s
elec
tivity
/ %
Temperature / K
460 480 500 520 540 560 580 6000
20
40
60
80
100
i-C6
N
H
CH3
hexane 1-hexene iC6 HDN selectivity total converison
Temperature / K
Tot
al c
onve
rsio
n,P
rodu
ct s
elec
tivity
/ %
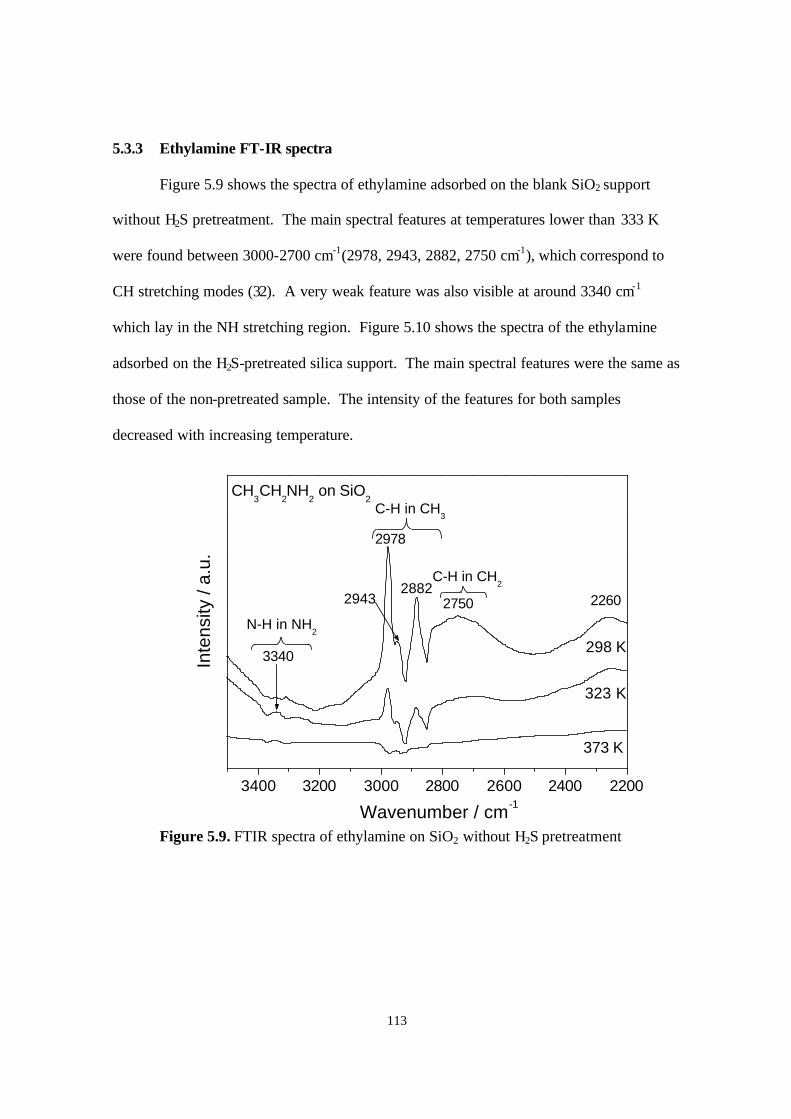
113
5.3.3 Ethylamine FT-IR spectra
Figure 5.9 shows the spectra of ethylamine adsorbed on the blank SiO2 support
without H2S pretreatment. The main spectral features at temperatures lower than 333 K
were found between 3000-2700 cm-1(2978, 2943, 2882, 2750 cm-1), which correspond to
CH stretching modes (32). A very weak feature was also visible at around 3340 cm-1
which lay in the NH stretching region. Figure 5.10 shows the spectra of the ethylamine
adsorbed on the H2S-pretreated silica support. The main spectral features were the same as
those of the non-pretreated sample. The intensity of the features for both samples
decreased with increasing temperature.
Figure 5.9. FTIR spectra of ethylamine on SiO2 without H2S pretreatment
3400 3200 3000 2800 2600 2400 2200
C-H in CH2
N-H in NH2
3340
C-H in CH3
CH3CH
2NH
2 on SiO
2
226027502882
2943
2978
373 K
323 K
298 K
Inte
nsity
/ a.
u.
Wavenumber / cm-1
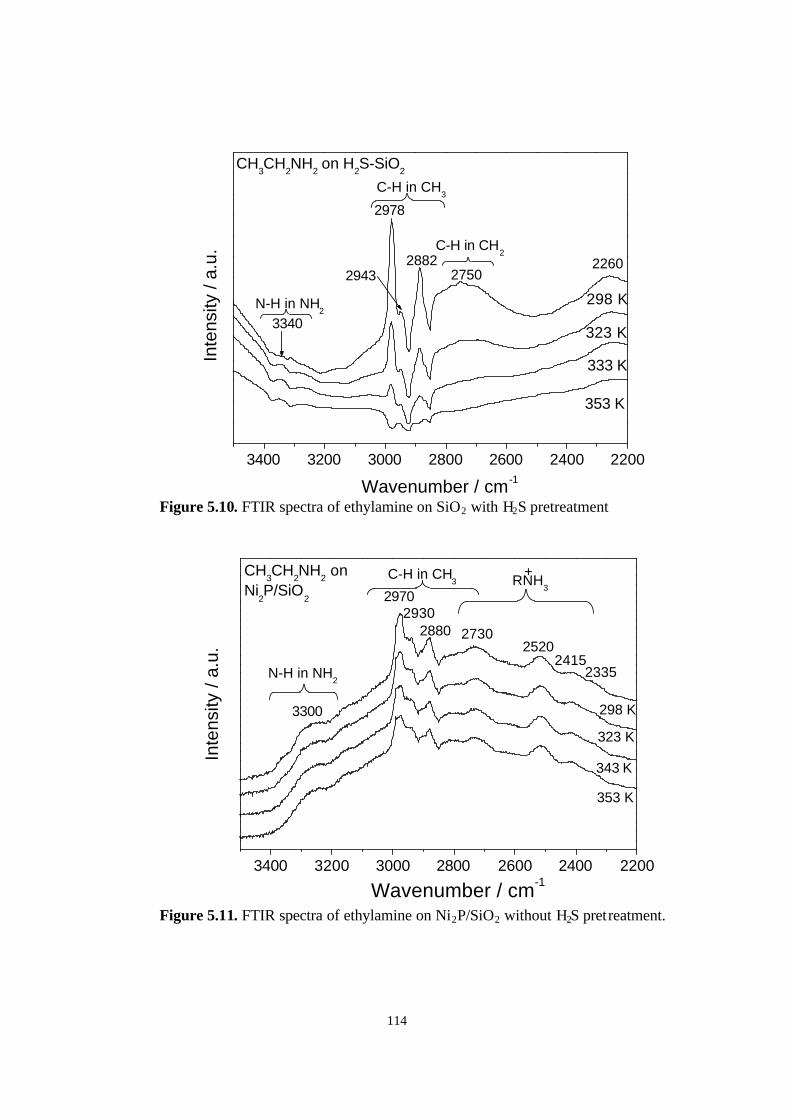
114
Figure 5.10. FTIR spectra of ethylamine on SiO2 with H2S pretreatment
Figure 5.11. FTIR spectra of ethylamine on Ni2P/SiO2 without H2S pretreatment.
3400 3200 3000 2800 2600 2400 2200
C-H in CH2
N-H in NH2
3340
C-H in CH3
CH3CH
2NH
2 on H
2S-SiO
2
22602750
28822943
2978
353 K
333 K
323 K
298 K
Inte
nsity
/ a.
u.
Wavenumber / cm-1
3400 3200 3000 2800 2600 2400 2200
C-H in CH3
2335
+RNH
3
N-H in NH2
CH3CH
2NH
2 on
Ni2P/SiO
2
24152520
273028802930
3300
2970
Inte
nsity
/ a.
u.
Wavenumber / cm-1
353 K
343 K
323 K
298 K

115
Figure 5.12. FTIR spectra of ethylamine on Ni2P/SiO2 with H2S pretreatment
The results for the spectra of the ethylamine adsorbed on the Ni2P/SiO2 catalyst
without and with H2S pretreatment are shown in Figures 5.11 and 12, respectively. In
contrast to the results on the plain SiO2 support, from both figures it is easily seen that the
spectra remain intense even above 353 K. There was a weak broad feature around 3300
cm-1, which appeared to be composed of contributions from signals at 3360, 3300, and
3260 cm-1. A major difference with the results on the SiO2 support was the presence of
strong bands at lower frequencies (2730, 2515, and 2415 cm-1). As will be discussed, these
correspond to quaternary ammonium modes (RNH3+) which appear between 2140-3200
cm-1 (33).
3400 3200 3000 2800 2600 2400 2200
C-H in CH3
+RNH
3
N-H in RNH2
CH3CH
2NH
2 on
H2S-Ni
2P/SiO
2
373 K
353 K
343 K
323 K
298 K
24152515
273028202890
29502990
3300
Inte
nsity
/ a.
u.
Wavenumber / cm-1

116
Figure 5.13. Comparison of FTIR spectra of ethylamine on Ni2P/SiO2 without and with
H2S pretreatment.
A direct comparison of the IR spectra at room temperature for H2S pretreated and
non-pretreated Ni2P/SiO2 samples is presented in Figure 5.13. It shows that the pretreated
sample had much weaker features compared to the non-pretreated sample. Because of the
decrease in the intensity of the spectra for the H2S-pretreated sample it is difficult to make
an exact determination, but it appears that the same spectral features are retained after the
H2S pretreatment. Peaks are observed at 3360, 3300, 2970, 2950, 2890, 2730, 2515, and
2415 cm-1.
3400 3200 3000 2800 2600 2400 2200
CH3CH2NH2 on Ni2P/SiO2
28902950
2990
C-H in CH3
N-H in RNH2
+RNH
3
2335
2930
24152515
27302880
29502970
3360
3300
Kub
elka
-Mun
k / a
.u.
Wavenumber / cm-1
without H2S pretreatment
with H2S pretreatment
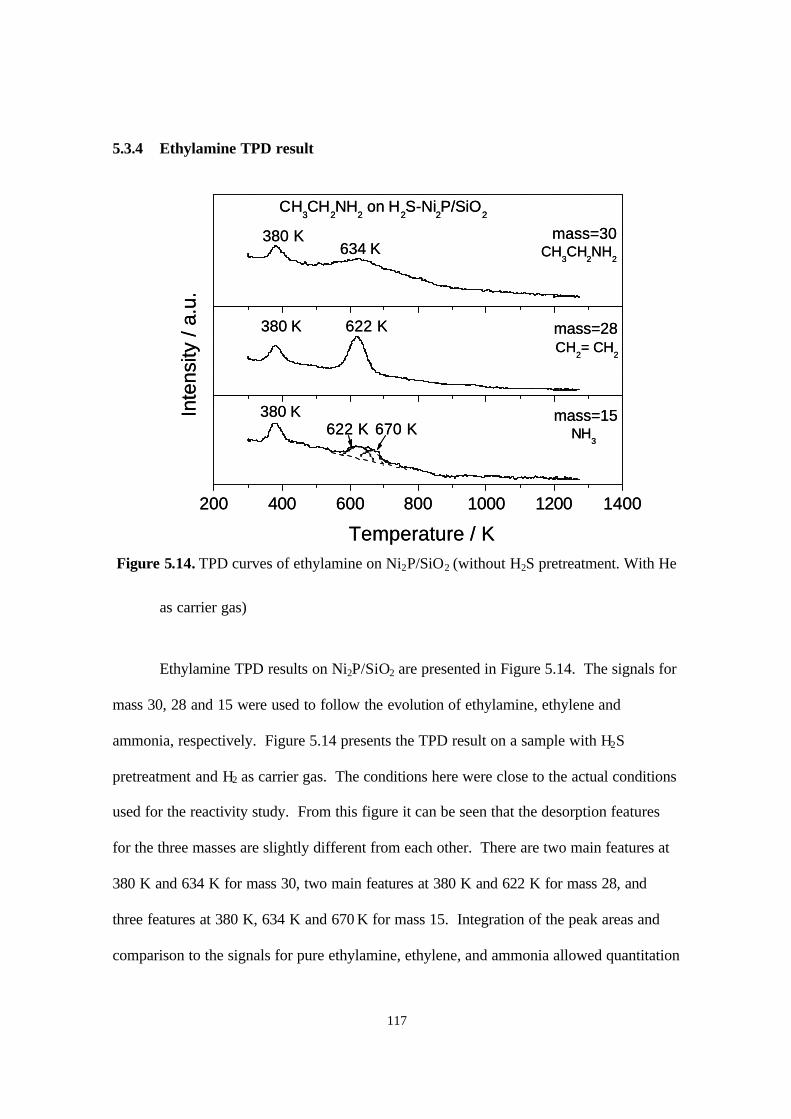
117
5.3.4 Ethylamine TPD result
Figure 5.14. TPD curves of ethylamine on Ni2P/SiO2 (without H2S pretreatment. With He
as carrier gas)
Ethylamine TPD results on Ni2P/SiO2 are presented in Figure 5.14. The signals for
mass 30, 28 and 15 were used to follow the evolution of ethylamine, ethylene and
ammonia, respectively. Figure 5.14 presents the TPD result on a sample with H2S
pretreatment and H2 as carrier gas. The conditions here were close to the actual conditions
used for the reactivity study. From this figure it can be seen that the desorption features
for the three masses are slightly different from each other. There are two main features at
380 K and 634 K for mass 30, two main features at 380 K and 622 K for mass 28, and
three features at 380 K, 634 K and 670 K for mass 15. Integration of the peak areas and
comparison to the signals for pure ethylamine, ethylene, and ammonia allowed quantitation
NH3
CH2= CH
2
CH3CH
2NH
2
CH3CH
2NH
2 on H
2S-Ni
2P/SiO
2
634 K380 K mass=30
622 K380 K mass=28
200 400 600 800 1000 1200 1400
670 K
Inte
nsity
/ a.
u.
622 K380 K mass=15
Temperature / K
NH3
CH2= CH
2
CH3CH
2NH
2
CH3CH
2NH
2 on H
2S-Ni
2P/SiO
2
634 K380 K mass=30
622 K380 K mass=28
200 400 600 800 1000 1200 1400
670 K
Inte
nsity
/ a.
u.
622 K380 K mass=15
Temperature / K

118
of the desorption features. The total amount of ethylamine adsorption was determined to
be 133 µmol/g catalyst. For ethylamine the contribution by physisorption was around 25
µmol/g and that by chemisorption was around 108 µmol/g. The desorbed amounts of
ethylene and ammonia were 110 µmol/g and 120 µmol/g, respectively, with a ratio of 0.92.
5.4 Discussion
5.4.1 Review of reaction mechanisms for piperidine hydrodenitrogenation
HDN is a process which comprises many nitrogen removal reactions and is
relatively more difficult than HDS. Generally, the hydrodenitrogenation of heterocyclic
nitrogen compounds does not occur directly and is preceeded by the hydrogenation of
aromatic nitrogen heterorings, before the hydrogenolysis of C-N bonds (18).
Nelson and Levy (23), Ho (11), Ledoux (34), and Hadjiloizou, et al. (17) describe
several mechanisms by which amines can react. In the case of piperidine in the E2
binuclear elimination mechanism the molecule is first protonated to a quarternary
ammonium species and subsequently undergoes attack by a nucleophile (B-) on a β-
hydrogen atom to form a primary amine and an olefin functionality (Scheme 5.1). The
olefin is subsequently hydrogenated. This mechanism is a generalized form of the
Hofmann degradation (exhaustive methylation), which involves pyrolisis of a quarternary
ammonium hydroxide to form a tertiary amine and an olefin (35). The elimination occurs
with an anti configuration between the β-hydrogen atom and the leaving amino group (29).
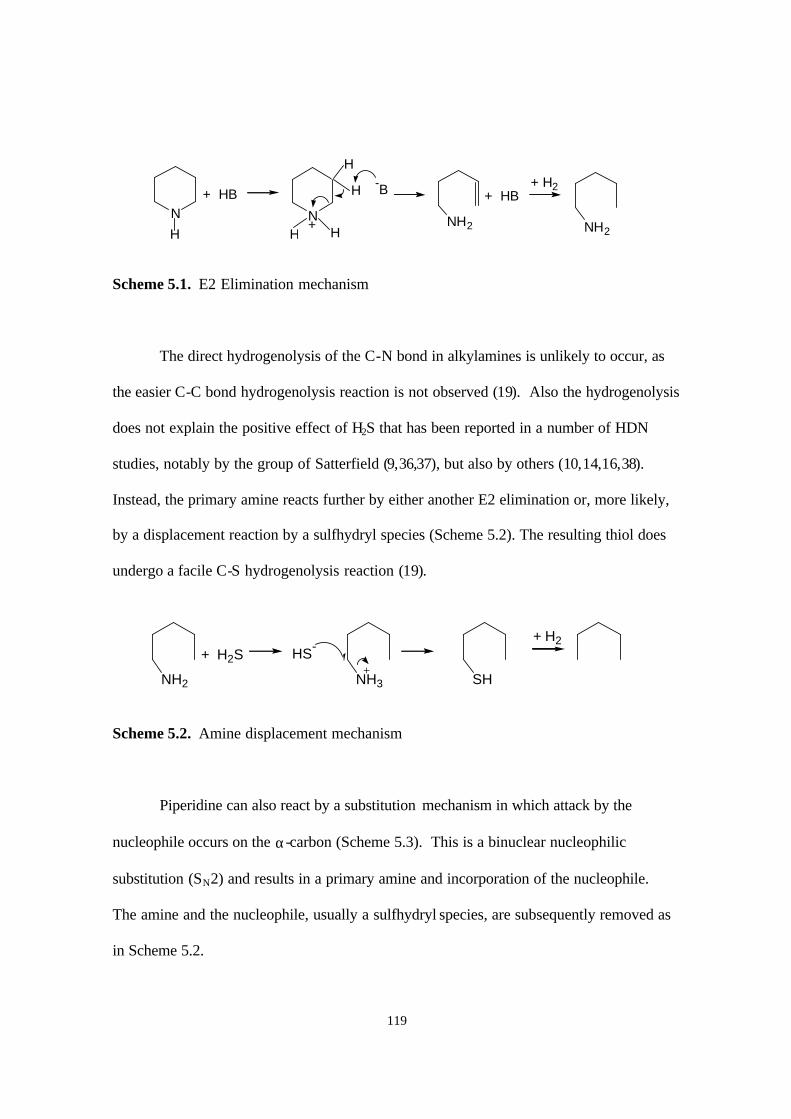
119
Scheme 5.1. E2 Elimination mechanism
The direct hydrogenolysis of the C-N bond in alkylamines is unlikely to occur, as
the easier C-C bond hydrogenolysis reaction is not observed (19). Also the hydrogenolysis
does not explain the positive effect of H2S that has been reported in a number of HDN
studies, notably by the group of Satterfield (9,36,37), but also by others (10,14,16,38).
Instead, the primary amine reacts further by either another E2 elimination or, more likely,
by a displacement reaction by a sulfhydryl species (Scheme 5.2). The resulting thiol does
undergo a facile C-S hydrogenolysis reaction (19).
Scheme 5.2. Amine displacement mechanism
Piperidine can also react by a substitution mechanism in which attack by the
nucleophile occurs on the α-carbon (Scheme 5.3). This is a binuclear nucleophilic
substitution (SN2) and results in a primary amine and incorporation of the nucleophile.
The amine and the nucleophile, usually a sulfhydryl species, are subsequently removed as
in Scheme 5.2.
N
HN
HNH2
+ HB
H
H
H
+
+ HB-B + H2
NH2
NH2
+ H2S
NH3+
HS-
SH
+ H2
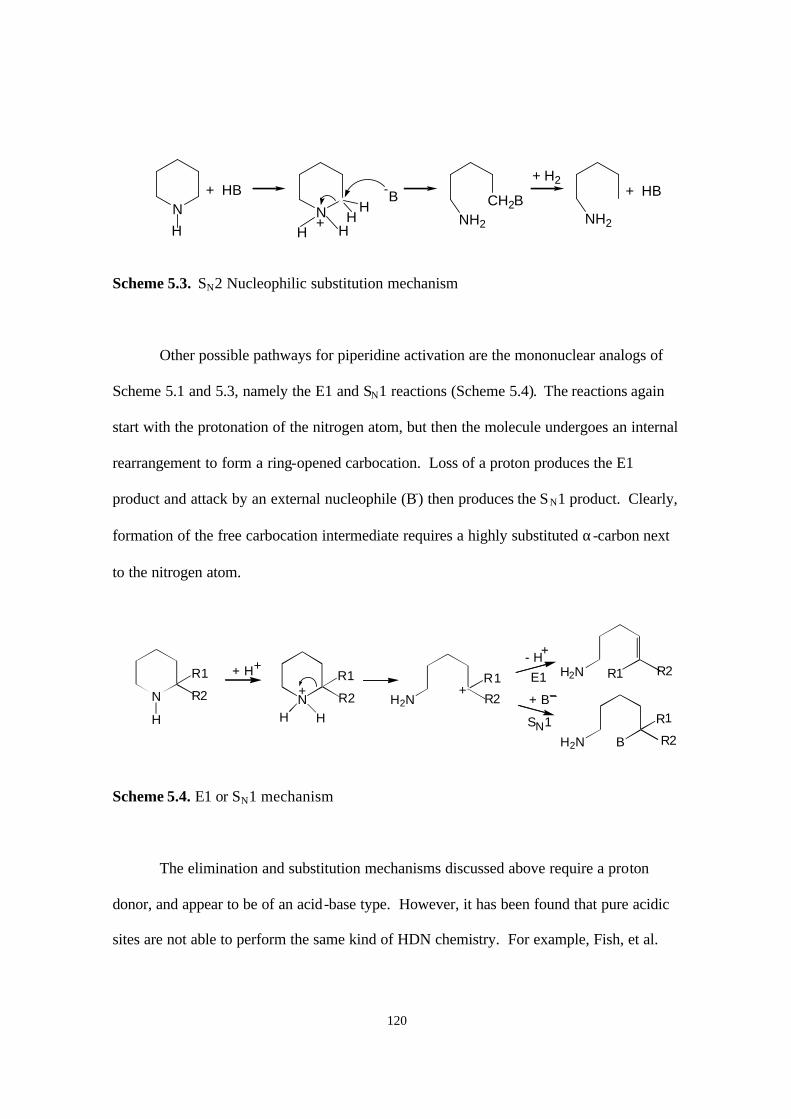
120
Scheme 5.3. SN2 Nucleophilic substitution mechanism
Other possible pathways for piperidine activation are the mononuclear analogs of
Scheme 5.1 and 5.3, namely the E1 and SN1 reactions (Scheme 5.4). The reactions again
start with the protonation of the nitrogen atom, but then the molecule undergoes an internal
rearrangement to form a ring-opened carbocation. Loss of a proton produces the E1
product and attack by an external nucleophile (B-) then produces the SN1 product. Clearly,
formation of the free carbocation intermediate requires a highly substituted α-carbon next
to the nitrogen atom.
Scheme 5.4. E1 or SN1 mechanism
The elimination and substitution mechanisms discussed above require a proton
donor, and appear to be of an acid-base type. However, it has been found that pure acidic
sites are not able to perform the same kind of HDN chemistry. For example, Fish, et al.
N NH2
CH2BNH
+ HB
H H+
-BH
HNH2
+ H2+ HB
N
R
H
N
R
HH
R
B
R
RH2N
H2N
R2
+ H
R2
- H
R2
N
R2
+ B
R2
E1
S 1
+
+1
H2N
+
1 1
1
1+
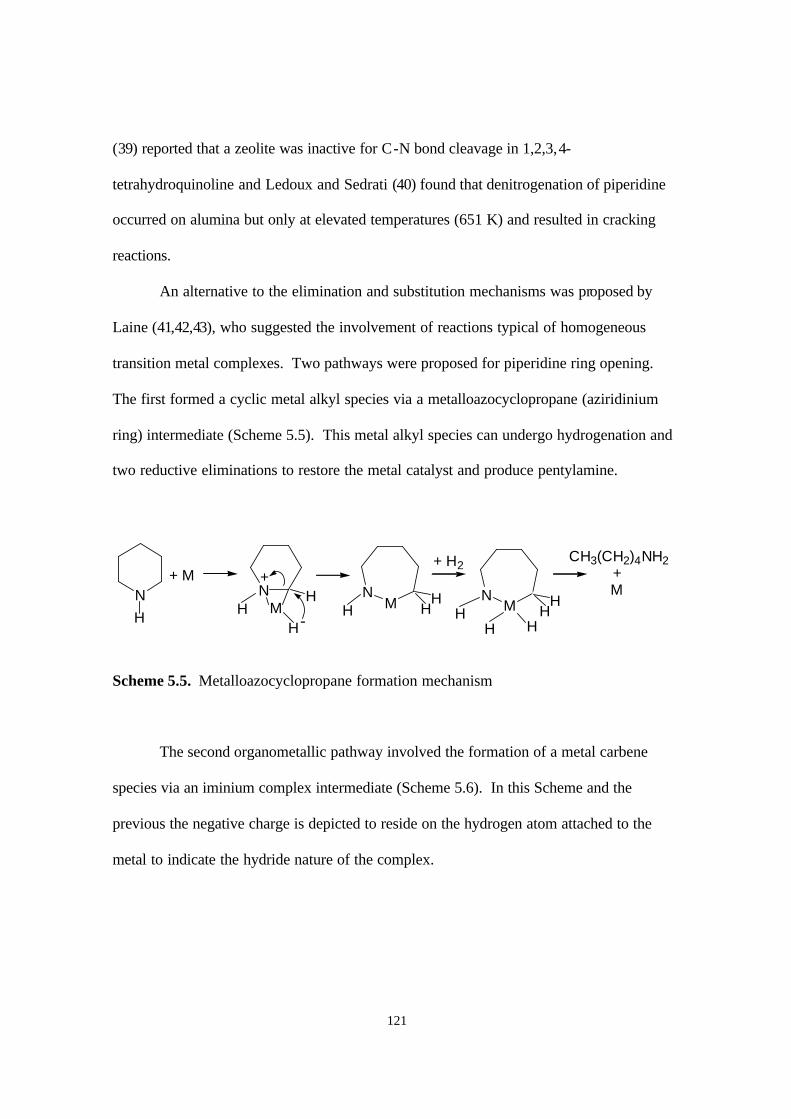
121
(39) reported that a zeolite was inactive for C-N bond cleavage in 1,2,3,4-
tetrahydroquinoline and Ledoux and Sedrati (40) found that denitrogenation of piperidine
occurred on alumina but only at elevated temperatures (651 K) and resulted in cracking
reactions.
An alternative to the elimination and substitution mechanisms was proposed by
Laine (41,42,43), who suggested the involvement of reactions typical of homogeneous
transition metal complexes. Two pathways were proposed for piperidine ring opening.
The first formed a cyclic metal alkyl species via a metalloazocyclopropane (aziridinium
ring) intermediate (Scheme 5.5). This metal alkyl species can undergo hydrogenation and
two reductive eliminations to restore the metal catalyst and produce pentylamine.
Scheme 5.5. Metalloazocyclopropane formation mechanism
The second organometallic pathway involved the formation of a metal carbene
species via an iminium complex intermediate (Scheme 5.6). In this Scheme and the
previous the negative charge is depicted to reside on the hydrogen atom attached to the
metal to indicate the hydride nature of the complex.
NH
+ MN
H
+
MH
H
-H
+ H2 CH3(CH2)4NH2
+M
MN
HH
H MN
HH
H H

122
Scheme 5.6. Iminium ion complex formation mechanism
Mentioned was made earlier of the positive effect of H2S on the HDN reaction.
This was accounted for by Lane through nucleophilic attack on the iminium complex
intermediate to form a thiohemiaminal (Scheme 5.7). The ring opened product can readily
form the alkane.
Scheme 5.7. Thiohemiaminal formation mechanism
A complication in the study of the mechanism of piperidine HDN is the occurrence
of condensation side reactions. For example, Hadjiloizou, et al. (17) found considerable
N-containing byproducts using a Co-Mo-S/USY-SiO2-Al2O3 catalyst, although this was
partly due to reactions on the highly acidic support. A number of studies report the
formation of N-pentylpiperidine (44). Portefaix et al. (45) suggest the following Scheme
for its formation involving an adsorbed activated piperidium complex which undergoes
nucleophilic attack by a second piperidine molecule (Scheme 5.8).
NH
+ MN
H
+
MH
H
-
NHMH
H
+ H2
H H
NHMH
H
CH3(CH2)4NH2+M
NH
+
MH
H
-
+ H2SN
HM
H
SH2+
-
MH2 +SHN
HNH2 S

123
Scheme 5.8. N-pentylpiperidine formation mechanism
The intermediate on the surface that leads to condensation products can also be a
Schiff’s base complex (Scheme 5.9) (41,46). This can react with a surface olefin
intermediate to form 2-n-pentylpiperidine.
Scheme 5.9. 2-n-Pentylpiperidine formation mechanism
5.4.2 Test of mechanism types
The main reaction types described in the previous section can be probed by the use
of substituted piperidines. There are two types of these compounds, piperidines with
pendant alkyl groups (usually methyl groups), and piperidines with attached ring
structures. The discussion here will be restricted to the former compounds.
A comparison of the gas-phase reactivity of several methyl-substituted piperidines
was carried out by Portefaix, et al. (45). The catalyst employed was a commercial Ni-Mo-
N
N
Mo
H
H N
Mo
H
NH
N
C5H11
N
Mo
- H-
N
Mo
+N
Mo
+N
Mo
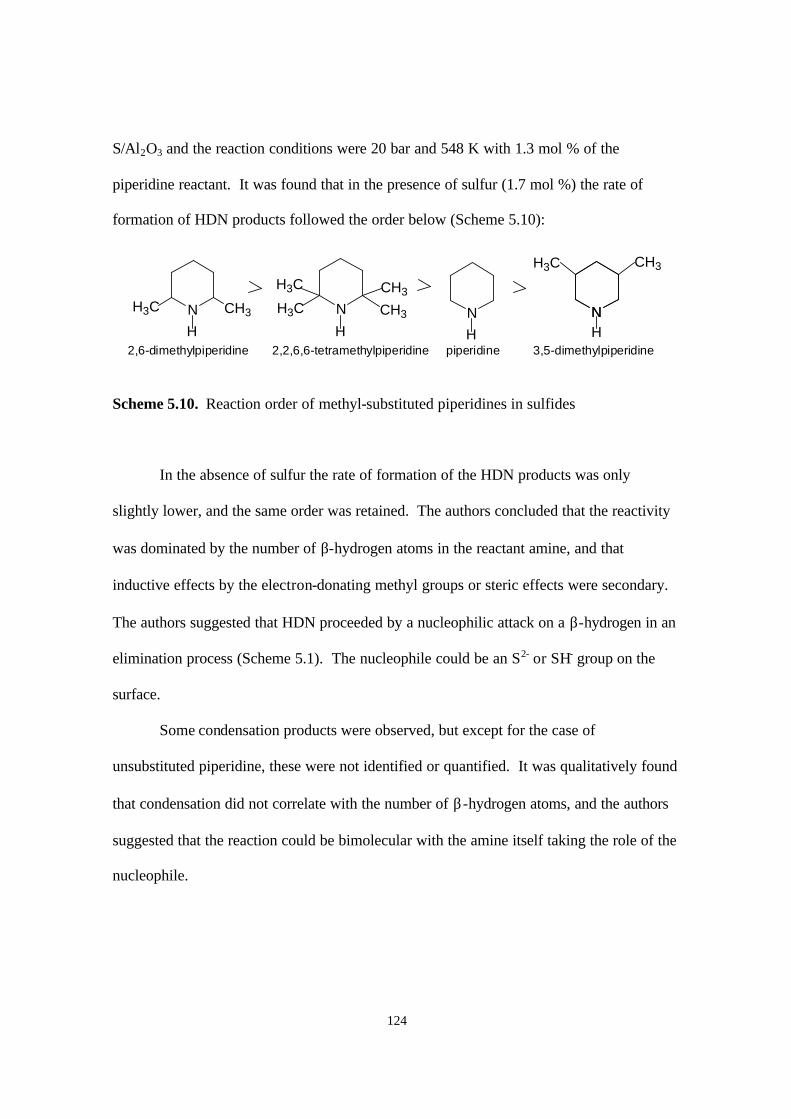
124
S/Al2O3 and the reaction conditions were 20 bar and 548 K with 1.3 mol % of the
piperidine reactant. It was found that in the presence of sulfur (1.7 mol %) the rate of
formation of HDN products followed the order below (Scheme 5.10):
Scheme 5.10. Reaction order of methyl-substituted piperidines in sulfides
In the absence of sulfur the rate of formation of the HDN products was only
slightly lower, and the same order was retained. The authors concluded that the reactivity
was dominated by the number of β-hydrogen atoms in the reactant amine, and that
inductive effects by the electron-donating methyl groups or steric effects were secondary.
The authors suggested that HDN proceeded by a nucleophilic attack on a β-hydrogen in an
elimination process (Scheme 5.1). The nucleophile could be an S2- or SH- group on the
surface.
Some condensation products were observed, but except for the case of
unsubstituted piperidine, these were not identified or quantified. It was qualitatively found
that condensation did not correlate with the number of β-hydrogen atoms, and the authors
suggested that the reaction could be bimolecular with the amine itself taking the role of the
nucleophile.
N NNN NCH3
CH3
CH3H3C
H3C
H3C
H3C CH3
2,6-dimethylpiperidine 2,2,6,6-tetramethylpiperidine piperidine 3,5-dimethylpiperidineH H H H
125
5.4.3 Characterization of the catalyst
The XRD analysis of the catalyst before and after reaction indicates that the Ni2P
phase is stable at the hydrotreating conditions. Previous studies with the EXAFS
technique showed a slight sulfidation of the sample (5,6), which suggested that the active
surface phase during the hydrotreating reactions was probably a complex containing both S
and P components.
Ni2P/SiO2 has been shown to be a high activity, novel hydroprocessing catalyst
(4,5,6). Understanding the behavior of the adsorbed species on this sample is desirable for
elucidating information about the reaction mechanism. For this purpose, FTIR
measurements of ethylamine adsorption were performed on the silica support and the H2S
pretreated and non-pretreated states of this catalyst.
The FTIR results on the plain support show that ethylamine interacts only weakly
with SiO2, with most of the adsorbed species desorbing by 373 K on both the unpretreated
and H2S-treated samples (Figs. 9,10). The main bands detected are in the C-H stretching
region at 2978, 2943, 2882, and 2750 cm-1, with a weak band due to N-H stretching
observed at 3340 cm-1 and a combination band at 2260 cm-1(32). Previous work has
shown that the N-H stretching modes are the dominant features for the ethylammonium
ion, while the C-H stretching modes are the most intense features for ethylamine (47).
Therefore, it is concluded that there are nearly no ethylammonium ion species adsorbed on
the silica and that ethylamine is present in physisorbed molecular form. This shows that
silica is a good choice as the support as it is unreactive even in presence of H2S.
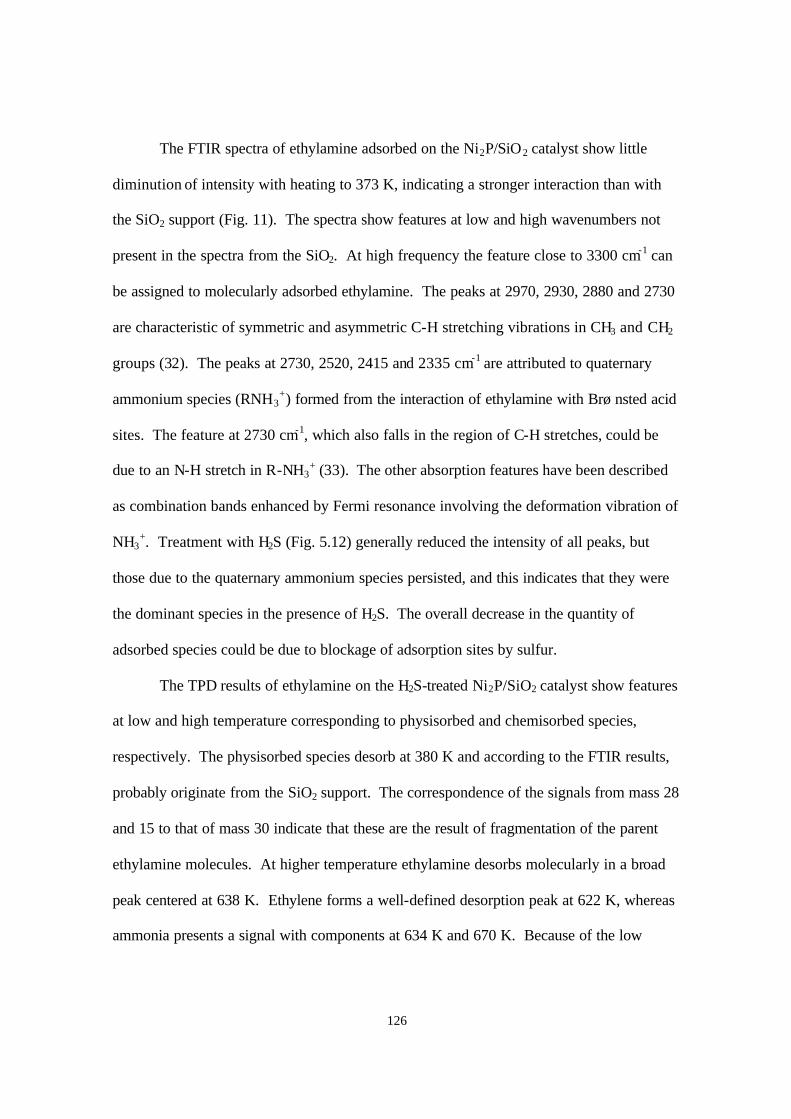
126
The FTIR spectra of ethylamine adsorbed on the Ni2P/SiO2 catalyst show little
diminution of intensity with heating to 373 K, indicating a stronger interaction than with
the SiO2 support (Fig. 11). The spectra show features at low and high wavenumbers not
present in the spectra from the SiO2. At high frequency the feature close to 3300 cm-1 can
be assigned to molecularly adsorbed ethylamine. The peaks at 2970, 2930, 2880 and 2730
are characteristic of symmetric and asymmetric C-H stretching vibrations in CH3 and CH2
groups (32). The peaks at 2730, 2520, 2415 and 2335 cm-1 are attributed to quaternary
ammonium species (RNH3+) formed from the interaction of ethylamine with Brønsted acid
sites. The feature at 2730 cm-1, which also falls in the region of C-H stretches, could be
due to an N-H stretch in R-NH3+ (33). The other absorption features have been described
as combination bands enhanced by Fermi resonance involving the deformation vibration of
NH3+. Treatment with H2S (Fig. 5.12) generally reduced the intensity of all peaks, but
those due to the quaternary ammonium species persisted, and this indicates that they were
the dominant species in the presence of H2S. The overall decrease in the quantity of
adsorbed species could be due to blockage of adsorption sites by sulfur.
The TPD results of ethylamine on the H2S-treated Ni2P/SiO2 catalyst show features
at low and high temperature corresponding to physisorbed and chemisorbed species,
respectively. The physisorbed species desorb at 380 K and according to the FTIR results,
probably originate from the SiO2 support. The correspondence of the signals from mass 28
and 15 to that of mass 30 indicate that these are the result of fragmentation of the parent
ethylamine molecules. At higher temperature ethylamine desorbs molecularly in a broad
peak centered at 638 K. Ethylene forms a well-defined desorption peak at 622 K, whereas
ammonia presents a signal with components at 634 K and 670 K. Because of the low
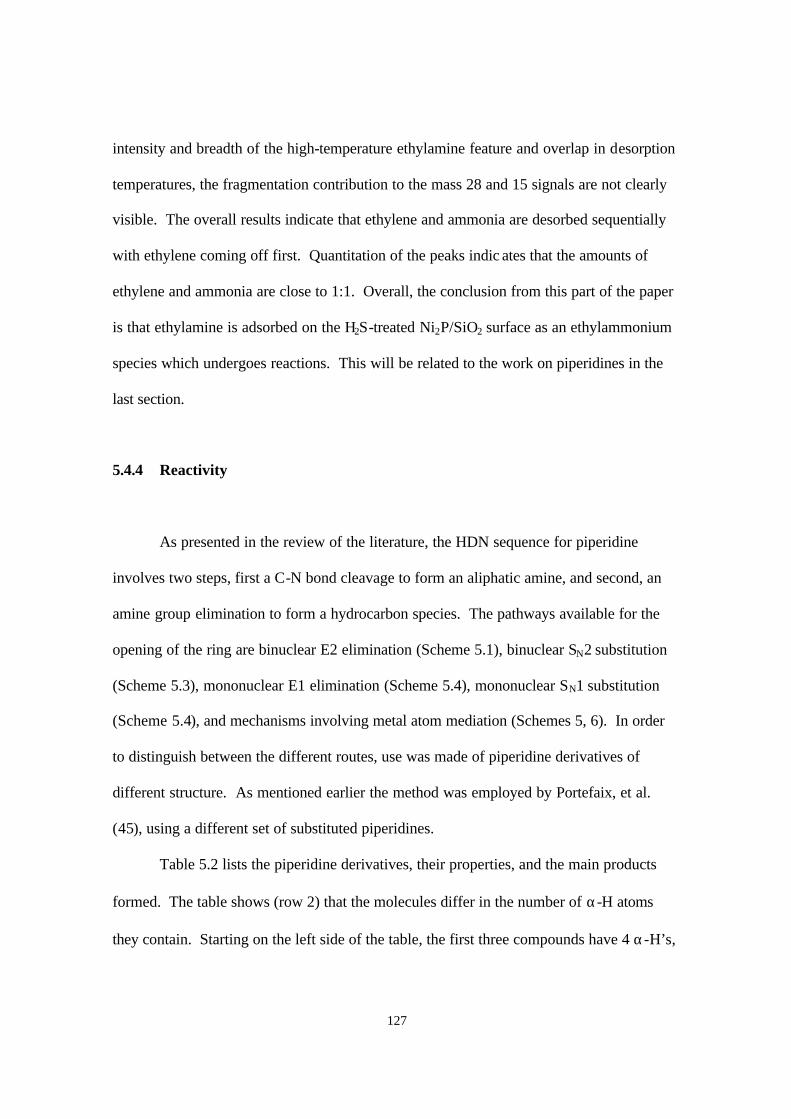
127
intensity and breadth of the high-temperature ethylamine feature and overlap in desorption
temperatures, the fragmentation contribution to the mass 28 and 15 signals are not clearly
visible. The overall results indicate that ethylene and ammonia are desorbed sequentially
with ethylene coming off first. Quantitation of the peaks indic ates that the amounts of
ethylene and ammonia are close to 1:1. Overall, the conclusion from this part of the paper
is that ethylamine is adsorbed on the H2S-treated Ni2P/SiO2 surface as an ethylammonium
species which undergoes reactions. This will be related to the work on piperidines in the
last section.
5.4.4 Reactivity
As presented in the review of the literature, the HDN sequence for piperidine
involves two steps, first a C-N bond cleavage to form an aliphatic amine, and second, an
amine group elimination to form a hydrocarbon species. The pathways available for the
opening of the ring are binuclear E2 elimination (Scheme 5.1), binuclear SN2 substitution
(Scheme 5.3), mononuclear E1 elimination (Scheme 5.4), mononuclear SN1 substitution
(Scheme 5.4), and mechanisms involving metal atom mediation (Schemes 5, 6). In order
to distinguish between the different routes, use was made of piperidine derivatives of
different structure. As mentioned earlier the method was employed by Portefaix, et al.
(45), using a different set of substituted piperidines.
Table 5.2 lists the piperidine derivatives, their properties, and the main products
formed. The table shows (row 2) that the molecules differ in the number of α-H atoms
they contain. Starting on the left side of the table, the first three compounds have 4 α-H’s,
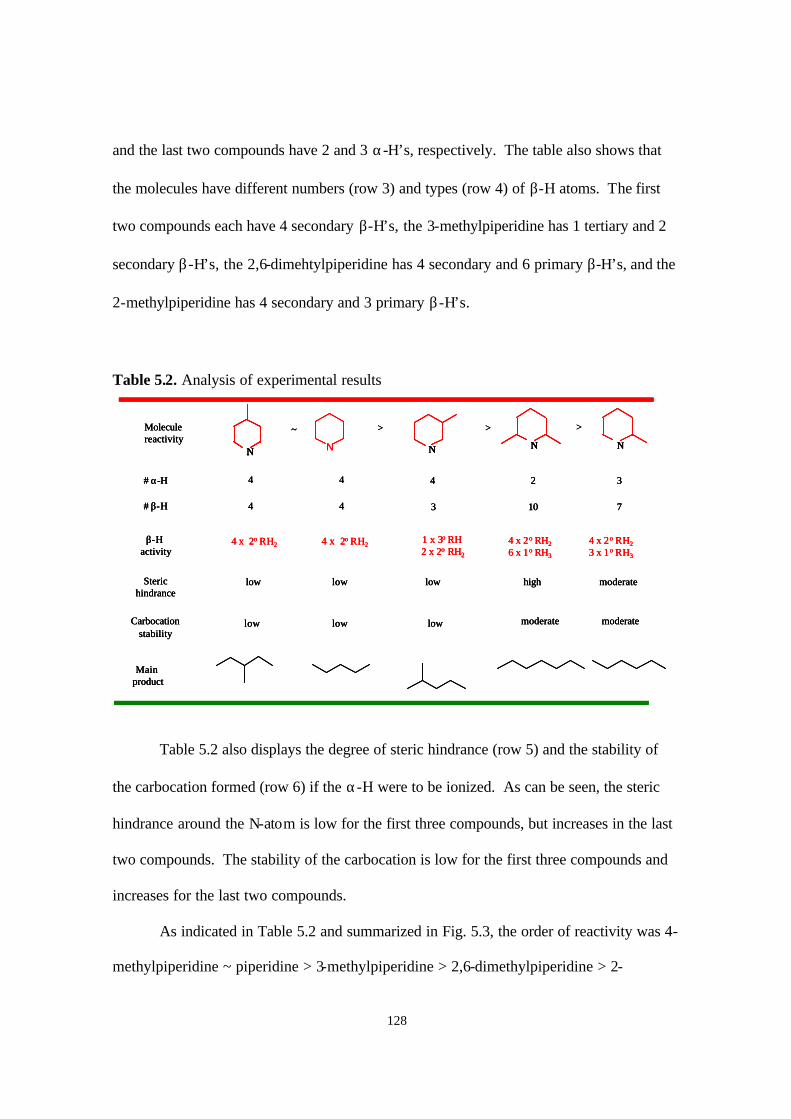
128
and the last two compounds have 2 and 3 α-H’s, respectively. The table also shows that
the molecules have different numbers (row 3) and types (row 4) of β-H atoms. The first
two compounds each have 4 secondary β-H’s, the 3-methylpiperidine has 1 tertiary and 2
secondary β-H’s, the 2,6-dimehtylpiperidine has 4 secondary and 6 primary β-H’s, and the
2-methylpiperidine has 4 secondary and 3 primary β-H’s.
Table 5.2. Analysis of experimental results
Table 5.2 also displays the degree of steric hindrance (row 5) and the stability of
the carbocation formed (row 6) if the α-H were to be ionized. As can be seen, the steric
hindrance around the N-atom is low for the first three compounds, but increases in the last
two compounds. The stability of the carbocation is low for the first three compounds and
increases for the last two compounds.
As indicated in Table 5.2 and summarized in Fig. 5.3, the order of reactivity was 4-
methylpiperidine ~ piperidine > 3-methylpiperidine > 2,6-dimethylpiperidine > 2-
NN N
Moleculereactivity
> > >
N N
~
# β-H 3 10 744
β-H activity
1 x 3o RH 2 x 2o RH2
4 x 2o RH26 x 1o RH3
4 x 2o RH23 x 1o RH3
4 x 2o RH24 x 2o RH2
Sterichindrance
low moderatehighlow low
Carbocationstability
low moderate moderatelowlow
Mainproduct
# α-H 4 2 344
NN N
Moleculereactivity
> > >
N N
~
NNNN NNN
Moleculereactivity
> > >
NNN N
~
# β-H 3 10 744# β-H 3 10 744
β-H activity
1 x 3o RH 2 x 2o RH2
4 x 2o RH26 x 1o RH3
4 x 2o RH23 x 1o RH3
4 x 2o RH24 x 2o RH2β-H activity
1 x 3o RH 2 x 2o RH2
4 x 2o RH26 x 1o RH3
4 x 2o RH23 x 1o RH3
4 x 2o RH24 x 2o RH2
Sterichindrance
low moderatehighlow lowSterichindrance
low moderatehighlow low
Carbocationstability
low moderate moderatelowlowCarbocationstability
low moderate moderatelowlow
MainproductMain
product
# α-H 4 2 344# α-H 4 2 344

129
methylpiperidine. A number of conclusions can be derived from this order, which give
considerable insight about the mechanism of denitrogenation in this class of compounds.
First, it is evident that the reactivity of the compounds does not depend directly on the
numbers of α-H atoms. Again, starting from the left of Table 5.2, the first three
compounds have 4 α-H’s, the next one has 2 α-H’s, and the last one has 3 α-H’s, and three
molecules do not relate to the order of HDN. The reactivity of the piperidines also does
not depend simply on the total numbers of β-H atoms or their type. The first two
compounds have 4 β-H’s, and the next compounds have 3, 10 and 7 β-H’s, and irrespective
of their type (1o, 2o or 3o), their quantity again does not relate to the observed sequence of
HDN. Clearly, the explanation for the order must lie elsewhere.
A property that would have been expected to have a large influence on reactivity is
steric hindrance, but interestingly, it does not. The first three compounds have the least
substitution around the N atom and duly have high activity, but the 2,6-substituted
piperidine, surprisingly has a higher reactivity than the singly-substituted 2-
methylpiperidine. Actually, such a result was observed earlier on sulfides by Portefaix, et
al (45), who reported that 2,6-dimethylpiperidine and 2,2,6,6, -tetramethylpiperidine are
more reactive than unsubstituted piperidine (Scheme 5.9). This was explained by the
occurrence of exclusively and E2 mechanism.
Finally, it is clear that the experimental sequence is unrelated to the stability of the
carbocations formed from ionization of the α-carbon atoms next to the nitrogen atoms.
The first three compounds would form relatively unstable secondary carbocations, and the
last two would form stable tertiary carbocations, but the ability to form these does not
follow the trend in reactivity.

130
Although none of the properties described in Table 5.2 can alone account for the
observed reactivity sequence, the interesting set of results described above can be
explained in two manners. The first is a competition between two separate classic
reactions, the SN2 substitution and the E2 elimination. The second is a single mechanism
involving activation of piperidine at both the α- and β- positions.
The first explanation rests on the assumption that the mechanism of reaction
depends on the structure of the amine reactant. For unhindered molecules such as
piperidine or 4-methylpiperidine reaction can proceed by a facile SN2 substitution reaction
(Scheme 5.11) to yield a ring-opened product which can subsequently undergoes
denitrogenation by a route such as shown in Scheme 5.2. Substitution at the 4-position
does not affect reactivity and both molecules have very similar conversion profiles. This
reaction is relatively simple, requiring just the right orientation for the nucleophilic
species, and is considered to occur at a high rate.
For hindered molecules with substitution at the 2- and/or 6-positions like the last
two compounds in Table 5.2, the binuclear E2 elimination becomes more important. This
reaction is favored by a greater number of abstractable β-H atoms, so 2,6-
dimethylpiperidine which has 10 β-H’s is more reactive than 2-methylpiperidine, which
has only 7 β-H’s. This was essentially the conclusion of Portefaix, et al (45) in their study
over the sulfide catalyst. A reaction pathway is shown in Scheme 5.12.
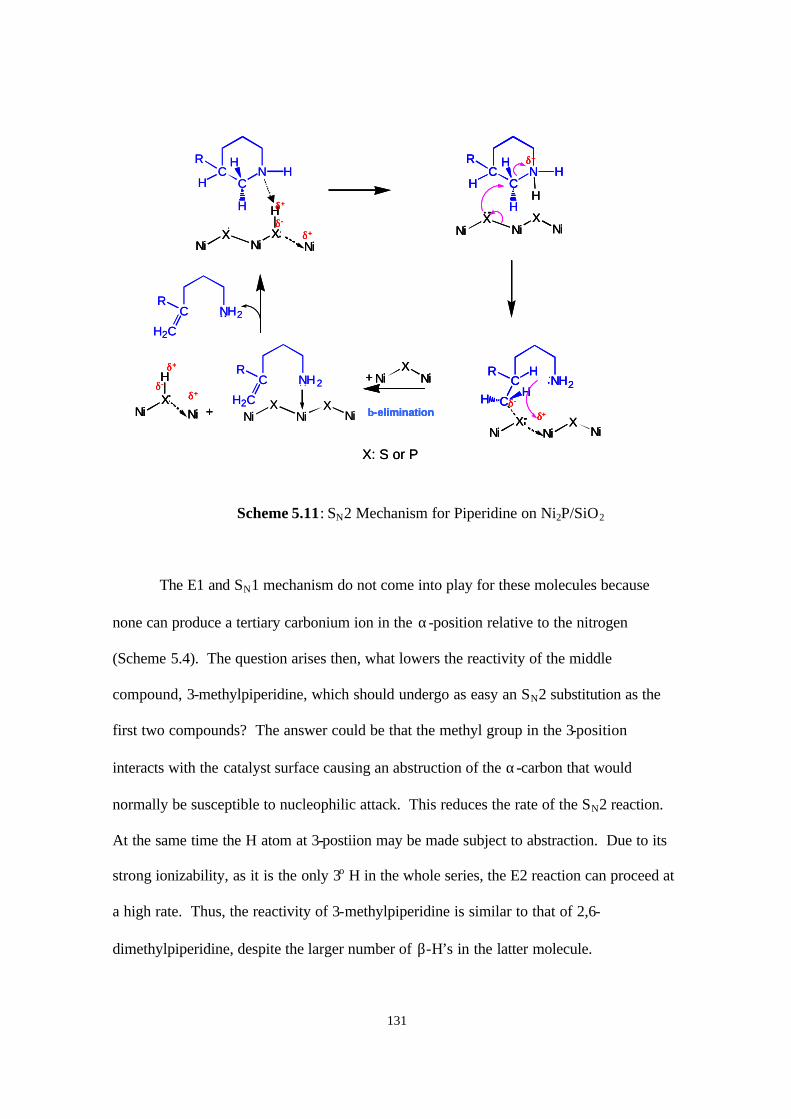
131
Scheme 5.11: SN2 Mechanism for Piperidine on Ni2P/SiO2
The E1 and SN1 mechanism do not come into play for these molecules because
none can produce a tertiary carbonium ion in the α-position relative to the nitrogen
(Scheme 5.4). The question arises then, what lowers the reactivity of the middle
compound, 3-methylpiperidine, which should undergo as easy an SN2 substitution as the
first two compounds? The answer could be that the methyl group in the 3-position
interacts with the catalyst surface causing an abstruction of the α-carbon that would
normally be susceptible to nucleophilic attack. This reduces the rate of the SN2 reaction.
At the same time the H atom at 3-postiion may be made subject to abstraction. Due to its
strong ionizability, as it is the only 3o H in the whole series, the E2 reaction can proceed at
a high rate. Thus, the reactivity of 3-methylpiperidine is similar to that of 2,6-
dimethylpiperidine, despite the larger number of β-H’s in the latter molecule.
CC
N HH
R H
H
NiX
NiX
Ni
Hδ+
δ-
δ+
NiX
NiX
Ni
C NH2R
C
H
HHδ+
δ-
CC
N HH
R H
H
NiX
NiX
Ni
H
δ+
NiX
NiX
Ni
C NH2R
H2C
C NH2R
H2C
+ NiX
Ni
β-elimination+ NiX
Ni
Hδ+
δ-
δ+
X: S or P
CC
N HH
R H
H
NiX
NiX
Ni
Hδ+
δ-
δ+
NiX
NiX
Ni
Hδ+
δ-
δ+
NiX
NiX
Ni
C NH2R
C
H
HHδ+
δ-
NiX
NiX
Ni
C NH2R
C
H
HHδ+
δ-
CC
N HH
R H
H
NiX
NiX
Ni
H
δ+
CC
N HH
R H
H
NiX
NiX
Ni
H
δ+
NiX
NiX
Ni
C NH2R
H2C
C NH2R
H2C
+ NiX
Ni
β-elimination
+ NiX
Ni
β-elimination+ NiX
Ni
Hδ+
δ-
δ+
+ NiX
Ni
Hδ+
δ-
δ+
X: S or P
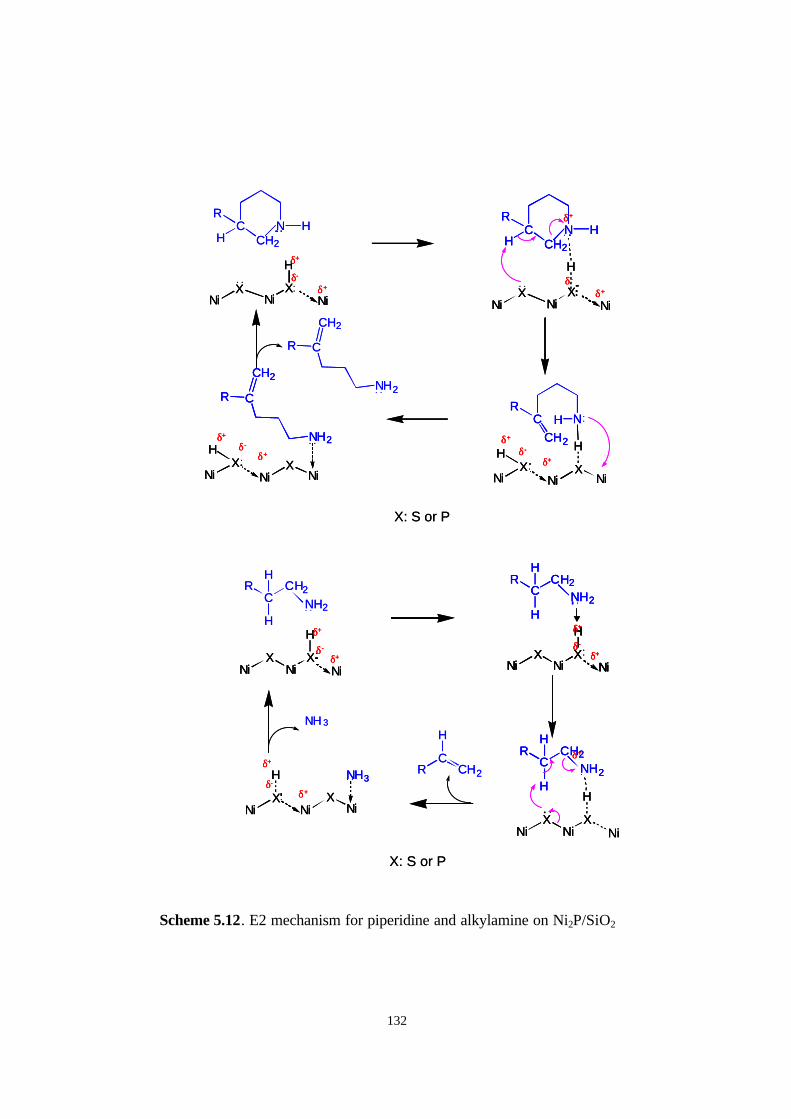
132
Scheme 5.12. E2 mechanism for piperidine and alkylamine on Ni2P/SiO2
C
CH2
NH2
R
H
NiX
NiX
Ni
δ-δ+
δ+ H
NiX
NiX
Ni
H
CCH2
NHR
δ-
δ+
δ+
H
C N HH
R
CH2
NiX
NiX
Ni
δ+
δ-
δ+
X: S or P
NiX
NiX
Ni
Hδ+
δ-
δ+
C N HH
R
CH2
C
CH2
NH2
R
C
CH2
NH2
R
H
NiX
NiX
Ni
δ-δ+
δ+
C
CH2
NH2
R
H
NiX
NiX
Ni
δ-δ+
δ+ H
NiX
NiX
Ni
H
CCH2
NHR
δ-
δ+
δ+
H
NiX
NiX
Ni
H
CCH2
NHR
δ-
δ+
δ+
H
C N HH
R
CH2
NiX
NiX
Ni
δ+
δ-
δ+
H
C N HH
R
CH2
NiX
NiX
Ni
δ+
δ-
δ+
X: S or P
NiX
NiX
Ni
Hδ+
δ-
δ+
NiX
NiX
Ni
Hδ+
δ-
δ+
C N HH
R
CH2
C
CH2
NH2
R
X: S or P
NiX
NiX
Ni
Hδ-
δ+
δ+
CCH2
NH2
R
H
H
NiX
NiX
Ni
Hδ-
δ+
δ+
CCH2
NH2
R
H
H
δ+
CCH2
NH2
R
H
H
NiX
NiX
Ni
H
CCH2R
H
δ-
δ+
NH3
NiX
Ni
H
XNi
δ+
NH 3
X: S or P
NiX
NiX
Ni
Hδ-
δ+
δ+
NiX
NiX
Ni
Hδ-
δ+
δ+
CCH2
NH2
R
H
H
NiX
NiX
Ni
Hδ-
δ+
δ+
CCH2
NH2
R
H
H
NiX
NiX
Ni
Hδ-
δ+
δ+
NiX
NiX
Ni
Hδ-
δ+
δ+
CCH2
NH2
R
H
H
δ+
CCH2
NH2
R
H
H
NiX
NiX
Ni
H
δ+
CCH2
NH2
R
H
H
NiX
NiX
Ni
H
CCH2R
H
δ-
δ+
NH3
NiX
Ni
H
XNi
δ+δ-
δ+
NH3
NiX
Ni
H
XNi
δ+
NH 3
133
The product distribution obtained with the various piperidines are all consistent
with the pathways outlined above. Thus, in all cases, the primary olefins expected from
the elimination of ammonia from the ring-opened products are observed. These undergo
subsequent hydrogenation to the parafins, which are the most plentiful products. Where
dictated by the backbone structure, various conjugated dienes or isomerization products are
sometimes produced.
The interpretation of the results above is consisted with all the known facts of the
reactions. However, it suffers from the drawback of requiring two separate pathways (SN2
and E2) and of using an ad - hoc explanation for the reactivity of the 3-methylpiperidine.
An alternative possibility is a hybrid but single mechanism operating on all reactants. This
could involve the formation of one of the intermediates suggested by Laine by an α-H
activation (Scheme 5.5 and 6). Such an initial step would immediately differentiate the
first three unhindered molecules in Table 5.2 from the last two. The last two compounds
would be the least reactive because of the smaller numbers of α-H’s. The initial activation
step at the α-carbon could be followed by a surface E2 elimination with reactivity
depending on the numbers of β-H’s and their type (3o > 2o > 1o), and would explain the
observed order. For the first three compounds the reactivity of the tertiary H would need
to be higher than that of a secondary H, but not enough to overcome the statistical weight
of 4 versus 2 secondary H’s. For the last two compounds the reactivity would be governed
by the number of 1o H atoms alone, which is higher in the 2,6-dimethylpiperidine than in
the 2-methylpiperidine.
The second explanation also fully accounts for the reactivity results. However, it is
not consistent with the observation by FTIR of a quaternary ammonium ion species formed
134
on a Brønsted site on the surface. Of course, the probe molecule in the FTIR studies was
ethylamine, and its behavior on the surface may be different from that of piperidine.
Clearly, a study with piperidine itself is needed to resolve this question and the
measurement probably need to be done at reaction conditions. Regardless of the
interpretation of the mechanism, one of the fundamental findings of this study is that the
behavior of the nickel phosphide catalyst is distinct from that of the sulfides. Like the
sulfides the phosphide is well able to carry out the E2 mechanism, but the phosphide also
has the capability of activating the α-H’s next to N atoms either by SN2 mechanism or by a
direct metal mediated reaction. This difference may account for its remarkable activity in
HDN in the presence of sulfur compounds (4,5,6).
5.5 Conclusion
The mechanism of hydrodenitrogenation (HDN) of saturated nitrogen ring
compounds was studied over a silica-supported nickel phosphide catalyst (Ni2P/SiO2, Ni/P
= 1/2) in a three-phase trickle-bed reactor operated at 3.1 MPa and 450 – 600 K. The
mechanism was probed by comparing the reactivity of piperidine and several of its
derivatives in the presence of 3000 ppm S. The relative elimination rates depended on the
structure of the molecules, and the type and number of β-hydrogen atoms, and followed the
sequence: 4-methylpiperidine ~ piperidine > 3-methylpiperidine > 2,6-dimethylpiperidine
> 2-methylpiperidine ,
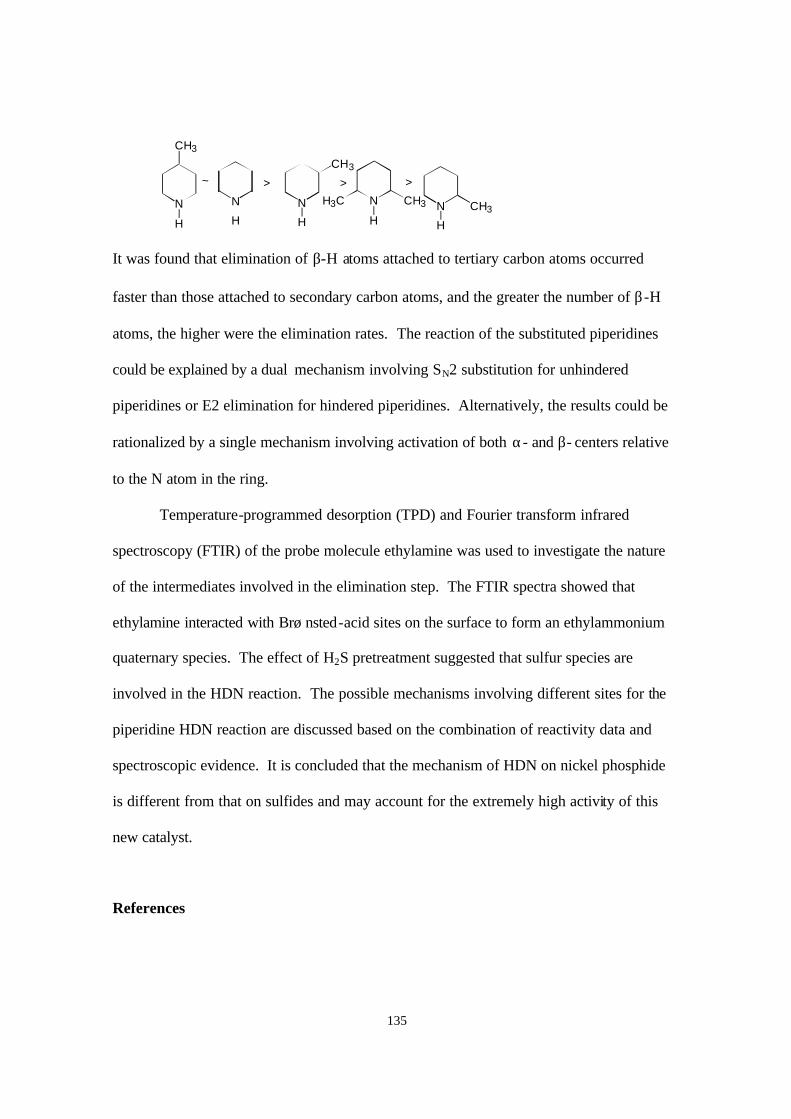
135
N
HN
H
CH3
N
H
CH3H3CN
HN
H
CH3
CH3
~ > > >
It was found that elimination of β-H atoms attached to tertiary carbon atoms occurred
faster than those attached to secondary carbon atoms, and the greater the number of β-H
atoms, the higher were the elimination rates. The reaction of the substituted piperidines
could be explained by a dual mechanism involving SN2 substitution for unhindered
piperidines or E2 elimination for hindered piperidines. Alternatively, the results could be
rationalized by a single mechanism involving activation of both α- and β- centers relative
to the N atom in the ring.
Temperature-programmed desorption (TPD) and Fourier transform infrared
spectroscopy (FTIR) of the probe molecule ethylamine was used to investigate the nature
of the intermediates involved in the elimination step. The FTIR spectra showed that
ethylamine interacted with Brønsted-acid sites on the surface to form an ethylammonium
quaternary species. The effect of H2S pretreatment suggested that sulfur species are
involved in the HDN reaction. The possible mechanisms involving different sites for the
piperidine HDN reaction are discussed based on the combination of reactivity data and
spectroscopic evidence. It is concluded that the mechanism of HDN on nickel phosphide
is different from that on sulfides and may account for the extremely high activity of this
new catalyst.
References

136
1. US Environmental Protection Agency, Press Release, May 1, 1999, December 21,
2000.
2. Federal Register, Vol. 65, No. 28, Thursday, Feb. 10, 2000.
3. Topsøe, H., Clausen B. S., Massoth F. E., “Hydrotreating Catalysis,
Science and Technology, (Anderson, J. R. and Boudart, M., Eds.), Catalysis -
Science and technology”, Vol.11, Springer-Verlag Berlin Heidelberg, New York,
1991
4. Wang, X., Clark, P., Oyama, S. T., J. Catal. 2002, in press.
5. Wang, X., Requejo. F., Oyama, S. T., J. Catal. 2001, submitted
6. Wang, X., Chun W., Asakura, K., Oyama, S. T., Loading effect, in preparation
7. Whitehurst, D. D., Knudsen, K., G., Wiwel, P., Zeuthen, P., J. Catal., In press.
8. Katzer, J. R., Sivasubramanian, R., Catal. Rev.-Sci. Eng. 20, 155 (1979).
9. Satterfield, C. N., Modell, M., Hites, R. A., Declerck, C. J., Ind. Eng. Chem. Proc.
Des. Dev. 17, 141 (1978).
10. Olalde, A., Perot, G., Appl. Catal. 13, 373 (1985).
11. Ho, T. C., Catal. Rev.-Sci. Eng. 30, 117 (1988).
12. Kim, S. C., Massoth, F. E., Ind. Eng. Chem. Res. 39, 1705 (2000).
13. McIlvried, M. G., Ind. Eng. Chem. Proc. Des. Dev. 10, 125 (1971).
14. Hanlon, R. T., Energy & Fuels 1, 424 (1987).
15. Kherbeche, A., Hubaut, R., Bonnelle, J. P., Grimblot, J., J. Catal. 131, 204 (1991).
16. Cerný, M., Collec. Czech. Chem. Commun. 47, 928 (1982).
17. Hadjiloizou, G. C., Butt, J. B., Dranoff, J. S., Ind. Eng. Chem. Res. 31, 2503 (1992).
18. Perot, G., Catal. Today 10, 447 (1991).

137
19. Prins, R., Adv. Catal. 46, 399 (2001).
20. Cattenot, M., Portefaix, J., Afonso, J., Breysse, M., Lacroix, M., Perot, G., J. of
Catal., 173, 366 (1998)
21. Schwartz, V., da Silva, V. T., Oyama, S. T., J. Mol. Catal. A, 163, 251 (2000)
22. Lee, K. S., Abe, H., Reimer, J. A., Bell, A. T., J. Catal., 139, 34 (1993).
23. Nelson, N., Levy, R. B., J. catal. 58, 485 (1979).
24. Marzari, Jorge A.; Rajagopal, S.; Miranda, Raul, Prepr. - Am. Chem. Soc., Div. Pet.
Chem. (1993), 38(3), 669-70.
25. Clark, P., Wang, X., Oyama, S. T., in press
26. Marzari, J. A., Rajagopal, S., Miranda, R., J. Catal., 156, 255 (1995).
27. Jian, M., Prins, R., J. Catal. 179, 18 (1998).
28. Rota, F., Prins, R., J. Mol. Catal. A, 162, 359 (2000).
29. Rota, F., Ranade, V., S., Prins, R., J. Catal. 200, 389 (2001).
30. Ramanathan, S., Oyama, S. T., J. Phys. Chem., 99 (44), 16365 (1995).
31. Rundqvist, S., Acta Chem. Scand. 16, 992 (1962).
32. Lin-Vien, D., Colthup, N., B., Fateley, W., G., Grasselli, J., G., The Handbook of
Infrared and Raman Characteristic Frequencies of Organic Molecules, Academic
Press, Boston, 1991, pp 155-178.
33. Willard, H. H.., Merritt, L. L., Jr., Dean, J. A., Settle, F. A., Jr., Instrumental
Methods of Analysis, Sixth Edition, D. Van Norstrand Company, New York, 1981,
Chapter 7. Page 181
34. Ledoux, M. J., in Catalysis , Vol. 7, The Chemical Society, London, 1988, pp. 125-
148.

138
35. Hofmann, A. W., Ber. Dtsch. Chem. Ges. 14, 659 (1881).
36. Satterfield, C. N., Gültekin, S., Ind. Eng. Chem. Proc. Des. Dev. 20, 62 (1981).
37. Yang, S. H., Satterfield, C. N, J. Catal. 81, 168 (1983).
38. Perot, G., Brunet, S., Canaff, C., Toulhoat, H., Bull. Soc. Chim. Belg. 96, 865 (1987).
39. Fish, R. H., Michaels, J. N., Moore, R. S., Heinemann, H., J. Catal. 123, 74 (1990).
40. Ledoux, M. J., Sedrati, M., J. Catal. 83, 235 (1983).
41. Laine, R. M., Catal. Rev.-Sci. Eng. 25, 459 (1983).
42. Laine, R. M., J. Molec. Catal. 21, 199 (1983).
43. Laine, R. M., Ann. N. Y. Acad. Sci. 415, 271 (1983).
44. Sonnemans, J., Neyens, W. J., Mars, P., J. Catal. 34, 230 (1974).
45. Portefaix, J. L., Cattenot, M., Guerriche, M., Thivolle-Cazat, J., Breysse, M., Catal.
Today 10, 473 (1991).
46. de Angelis, F., Grgurina, I., Nicoletti, R. A., Synthesis 1, 70 (1979).
47. Parrillo, D. J., Adamo, A. T., Kokotailo, G. T., Gorte, R. J., Appl, Catal., 67(1),
1990, 107-118

139
Chapter 6
Conclusions
A new series of hydrotreating catalysts, iron group phosphides in bulk and silica
supported forms, were synthesized by means of temperature-programmed reduction
(TPR) of the corresponding phosphates. The activity of the silica-supported catalysts
were tested for hydrodenitrogenation (HDN) and hydrodesulfurization (HDS) with a
model feed liquid. The reactivity study showed that these phosphides have great
potential in the hydrotreating field. In particular, Ni2P/SiO2 showed better HDS
reactivity than a Ni-Mo-S/Al2O3 commercial catalyst.
One important finding of this work is using excess P to modify the properties of
nickel phosphide catalyst. The effect of Ni/P ratio on the structure and hydrotreating
activity were studied. The results revealed that phosphorus content had a strong
influence on the structure and activity of the catalysts. The crystallite size decreased with
increase in P content. Both HDS and HDN were affected with P content, with the
maximum value at the a Ni/P ratio of 1/2. The effect of Ni2P loading on the silica
support was also investigated in this work. The sample with a loading amount of around
18 wt.% showed the better activity.
The studies of P content and Ni2P loading amount indicated that these quantities
had a strong effect on the HDN reaction, but only a minor effect on the HDS reaction.
Therefore, it is duly to conclude that the HDN reaction is structure-sensitive, while the
HDS reaction is structure-insensitive.
Both XRD and Ni K-edge EXAFS were employed to identify the phases for both
the spent and fresh catalysts. The results for both techniques demonstrated that Ni2P

140
phase was formed, and the sample experience a small phase change after prolonged
exposure to the hydrotreating test conditions. Although XPS did not reveal any S species
on the spent samples, the EXAFS comparison of the spent sample and sulfide references
indicated the presence of some sulfur probably on the surface of the catalysts.
The mechanism of hydrodenitrogenation (HDN) over a silica-supported nickel
phosphide (Ni2P/SiO2) catalyst was studied in a three-phase trickle bed reactor operated
at 3.1 MPa and various temperatures. The mechanism was probed by comparing the
reactivity of piperidine and several of its derivatives in the presence of 3000 ppm S. It
was found that piperidine activation involved α-H’s in the molecule but nitrogen removal
proceeded mainly by means of a β-elimination (E2) mechanism. The relative elimination
rates depend on the type and number of β-hydrogen atoms. Elimination of β-H atoms
attached to tertiary carbon atoms occurred faster than those attached to secondary carbon
atoms. Also, the greater number of the β-H atoms, the higher were the elimination rates.
Temperature-programmed desorption (TPD) of ethylamine was used to probe the acid
properties of Ni2P/SiO2 catalysts with and without pretreatment in H2S. The chemisorbed
amount of the ethylamine and the strength of the ethylamine interaction with the acid
centers on the surface of the catalyst decreased with the H2S pretreatment. Fourier
transform infrared spectroscopy (FTIR) indicated that H2S pretreatment decreased the
amount of both Brønsted and Lewis acid-sites. The effect of H2S pretreatment suggested
that sulfur species were involved in the HDN reactions. It was concluded that both
Brønsted and nucleophilic sites participated in the HDN reactions. In this work, a
possible mechanism involving different sites was proposed for the piperidine HDN
reactions.