Embed Size (px)
Citation preview

Novartis Global Communications
Novartis Fourth Quarter and Full Year 2020 Condensed financial report – Supplementary Data

Novartis Global Communications CH-4002 Basel - Switzerland - https://www.novartis.com
__ 2
Novartis Fourth Quarter and Full Year 2020 Condensed Financial Report – Supplementary Data INDEX Page
GROUP AND DIVISIONAL OPERATING PERFORMANCE
Group 3 Innovative Medicines 7 Sandoz 14
CASH FLOW AND GROUP BALANCE SHEET 16 INNOVATION REVIEW 20 CONDENSED CONSOLIDATED FINANCIAL STATEMENTS
Consolidated income statements 24 Consolidated statements of comprehensive income 26 Consolidated balance sheets 27 Consolidated statements of changes in equity 28 Consolidated statements of cash flows 31 Notes to condensed consolidated financial statements, including update on legal proceedings 33
SUPPLEMENTARY INFORMATION 55 CORE RESULTS
Reconciliation from IFRS to core results 56 Group 58 Innovative Medicines 60 Sandoz 61 Corporate 62 Discontinued operations 63
ADDITIONAL INFORMATION Income from associated companies 64 Condensed consolidated changes in net debt / Share information 64 Free cash flow 65 Effects of currency fluctuations 67
DISCLAIMER 69

Novartis Global Communications CH-4002 Basel - Switzerland - https://www.novartis.com
__ 3
Group Key figures 1, ² Q4 2020 Q4 2019 % change FY 2020 FY 2019 % change USD m USD m USD cc USD m USD m USD cc Net sales to third parties from continuing operations 12 770 12 403 3 1 48 659 47 445 3 3 Divisional operating income from continuing operations 2 758 2 015 37 42 10 215 9 838 4 10 Corporate income and expense, from continuing operations, net -114 -192 41 45 -63 -752 nm nm Operating income from continuing operations 2 644 1 823 45 51 10 152 9 086 12 19 As % of net sales 20.7 14.7 20.9 19.2 Income from associated companies 141 150 -6 -6 673 659 2 2 Interest expense -201 -203 1 0 -869 -850 -2 -4 Other financial income and expense -25 -11 nm nm -78 45 nm nm Taxes -460 -630 27 24 -1 807 -1 793 -1 -7 Net income from continuing operations 2 099 1 129 86 93 8 071 7 147 13 20 Net income from discontinued operations 4 590 Net income 2 099 1 129 86 93 8 071 11 737 -31 -27 Basic earnings per share from continuing operations (USD) 0.92 0.50 84 93 3.55 3.12 14 21 Basic earnings per share from discontinued operations (USD) 2.00 nm nm Basic earnings per share (USD) 0.92 0.50 84 93 3.55 5.12 -31 -26 Cash flows from operating activities from continuing operations 4 005 3 540 13 13 650 13 547 1 Free cash flow from continuing operations 3 342 3 488 -4 11 691 12 937 -10
Core Core operating income from continuing operations 3 501 3 462 1 2 15 416 14 112 9 13 As % of net sales 27.4 27.9 31.7 29.7 Core net income from continuing operations 3 034 2 985 2 3 13 158 12 104 9 12 Core net income from discontinued operations 278 Core net income 3 034 2 985 2 3 13 158 12 382 6 9 Core basic earnings per share from continuing operations (USD) 1.34 1.32 2 3 5.78 5.28 9 13 Core basic earnings per share from discontinued operations (USD) 0.12 Core basic earnings per share (USD) 1.34 1.32 2 3 5.78 5.40 7 10 nm = not meaningful
1 Continuing operations include the businesses of Innovative Medicines and Sandoz Division as well as continuing corporate functions and discontinued operations include the business of Alcon. See page 43 for full explanation.
2 Constant currencies (cc), core results and free cash flow are non-IFRS measures. An explanation of non-IFRS measures can be found on page 55. Unless otherwise noted, all growth rates in this Release refer to same period in prior year.

Novartis Global Communications CH-4002 Basel - Switzerland - https://www.novartis.com
__ 4
Strategy & COVID-19 update
• During 2020, we continued focusing Novartis as a leading medicines company powered by advanced therapy platforms and data science
• We continued to advance transformative innovation for patients, including treatments for hyperlipidemia and multiple sclerosis
• Received 26 approvals for new treatments as well as new indications for existing treatments in the US, the EU, Japan and China
• Made significant progress to solidify our culture journey towards an inspired, curious and unbossed organization
• Advanced an enterprise-wide digital transformation spanning the entire value chain • We are bringing our Digital Function and Novartis Business Services together to build a new
organization called Customer & Technology Solutions (CTS), effective February 1, 2021 • We made significant strides in building trust with society and issued the healthcare industry’s
first sustainability bond linked to access to medicines and committed to carbon neutral emissions by 2030. Significant improvements recognized by third party ESG rating agencies
• During the year, there have been COVID-19 related lockdowns in several geographies negatively impacting certain therapeutic areas, most notably in: ophthalmology, dermatology and the Sandoz retail business
• Our operations remain stable and cash collections continue to be according to our normal trade terms, with days sales outstanding at normal levels
• Novartis remains well positioned to meet its ongoing financial obligations and has sufficient liquidity to support our normal business activities
• Drug development operations are continuing with manageable disruptions (please see Innovation Review section), with our range of digital technologies allowing us to proactively manage our clinical trials portfolio and rapidly mitigate any disruptions.
• Novartis continues to work closely with third parties to fight the COVID-19 pandemic • Novartis launched a first-of-its-kind not-for-profit portfolio of 15 medicines for symptomatic
treatment of COVID-19. The portfolio is sold at no profit to governments in up to 79 eligible low and lower middle income countries
• Announced a collaboration with Molecular Partners to develop, manufacture and commercialize Molecular Partners’ anti-COVID-19 DARPin® program, for the prevention and treatment of COVID-19
Financials
In order to comply with International Financial Reporting Standards (IFRS), Novartis has separated the Group’s reported financial data into “continuing” and “discontinued” operations. The results of the Alcon business in 2019 are reported as discontinued operations. See page 43 and Notes 2, 3 and 10 in the Condensed Financial Report for a full explanation.
The commentary below focuses on continuing operations including the businesses of Innovative Medicines and Sandoz, as well as the continuing Corporate functions. We also provide information on discontinued operations.
Continuing operations fourth quarter
Net sales
Net sales were USD 12.8 billion (+3%, +1% cc) in the fourth quarter driven by volume growth of 6 percentage points, offset by price erosion of 2 percentage points and the negative impact from generic competition of 3 percentage points.
Corporate income and expense, net
Corporate income and expense, which includes the cost of Group headquarter and coordination functions, amounted to an expense of USD 114 million in the fourth quarter compared to an expense of

Novartis Global Communications CH-4002 Basel - Switzerland - https://www.novartis.com
__ 5
USD 192 million in prior year, mainly driven by income from a fair value adjustment on contingent receivables, partially offset by unfavorable contributions from the Novartis Venture Fund.
Operating income
Operating income was USD 2.6 billion (+45%, +51% cc) mainly due to lower impairments, lower legal charges and income from contingent receivables.
Core operating income was USD 3.5 billion (+1%, +2% cc) mainly driven by higher sales. Core operating income margin was 27.4% of net sales, decreasing by 0.5 percentage points (+0.4 percentage points cc).
Income from associated companies
Income from associated companies decreased from USD 150 million in prior year to USD 141 million in the fourth quarter of 2020 driven by a lower estimated share of income from Roche Holding AG.
Core income from associated companies decreased from USD 242 million in prior year to USD 229 million in the fourth quarter of 2020 in line with the decrease in reported income from associated companies.
Interest expense and other financial income/expense
Interest expense amounted to USD 201 million compared to prior year interest expense of USD 203 million. Other financial income and expense amounted to a loss of USD 25 million compared to a loss of USD 11 million in the prior year mainly due to lower interest income in the current period.
Taxes
The tax rate for continuing operations in the fourth quarter was 18.0% compared to 35.8% in the prior year. The current year fourth quarter was mainly impacted by uncertain tax positions and the effect of adjusting to the full year tax rate, which was higher than previously estimated. The prior year fourth quarter was negatively impacted by a one-time, non-cash deferred tax expense resulting from legal entity reorganizations.
The core tax rate for continuing operations was 13.5% compared to 14.6% in prior year, mainly result of effect of adjusting to the full year core tax rate, which was less than previously estimated and a change in profit mix.
Net income, EPS and free cash flow Net income was USD 2.1 billion (+86%, +93% cc) driven by higher operating income and benefiting from lower taxes. EPS was USD 0.92 (+84%, +93% cc), growing in line with net income. Core net income was USD 3.0 billion (+2%, +3% cc) mainly driven by growth in core operating income. Core EPS was USD 1.34 (+2%, +3% cc), growing in line with core net income. Free cash flow from continuing operations amounted to USD 3.3 billion (-4%) compared to USD 3.5 billion in the prior year quarter, as higher cash flows from operating activities were more than offset by increased net investment for intangible assets.

Novartis Global Communications CH-4002 Basel - Switzerland - https://www.novartis.com
__ 6
Continuing operations full year
Net sales
Net sales were USD 48.7 billion (+3%, +3% cc) in the full year mainly driven by Entresto, Zolgensma and Cosentyx. Volume contributed 9 percentage points to sales growth, partly offset by price erosion of 3 percentage points and the negative impact from generic competition of 3 percentage points.
Corporate income and expense, net
Corporate income and expense, which includes the cost of Group headquarter and coordination functions, amounted to an expense of USD 63 million in the full year, compared to an expense of USD 752 million in prior year, mainly driven by favorable contributions from the Novartis Venture Fund, income from a fair value adjustment on contingent receivables, royalty settlement gains related to intellectual property rights and lower restructuring costs.
Operating income
Operating income was USD 10.2 billion (+12%, +19% cc) mainly driven by higher sales and productivity including lower spend.
Core operating income was USD 15.4 billion (+9%, +13% cc) mainly driven by higher sales, improved gross margin and productivity including lower spend. Core operating income margin was 31.7% of net sales, increasing by 2.0 percentage points (+2.8 percentage points cc).
Income from associated companies
Income from associated companies amounted to USD 673 million in 2020 compared to USD 659 million in the prior year. This comprises mainly the share of income from Roche amounting to USD 677 million, which was broadly in line with the prior year amount of USD 662 million.
Core income from associated companies was USD 1.1 billion in 2020, in line with the prior year, mainly driven by the core income contribution from Roche.
Interest expense and other financial income/expense
Interest expense increased to USD 869 million from USD 850 million in the prior year, mainly due to an increase in interest expense from discounting long term-liabilities. Other financial income and expense amounted to a loss of USD 78 million compared to an income of USD 45 million in prior year mainly due to lower interest income in 2020.
Taxes The tax rate for continuing operations was 18.3% compared to 20.1% in the prior year. The current year tax rate was impacted by the effect of non-deductible legal charges and uncertain tax positions. The prior year tax rate was impacted by a one-time, non-cash deferred tax expense resulting from legal entity reorganizations, a prior year item and an increase to an uncertain tax position, partially offset by the deferred tax credit from Swiss tax reform. Excluding these impacts, the rate from continuing operations would have been 15.6% compared to 15.4% in the prior year. The increase from prior year was mainly the result of a change in profit mix. The core tax rate for continuing operations was 15.4% compared to 16.0% in prior year, mainly as a result of change in profit mix.

Novartis Global Communications CH-4002 Basel - Switzerland - https://www.novartis.com
__ 7
Net income, EPS and free cash flow
Net income was USD 8.1 billion (+13%, +20% cc) mainly driven by higher operating income. EPS was USD 3.55 (14%, +21% cc), growing faster than net income and benefiting from lower weighted average number of shares outstanding.
Core net income was USD 13.2 billion (+9%, +12% cc) mainly driven by growth in core operating income. Core EPS was USD 5.78 (+9%, +13% cc), growing faster than core net income and benefiting from lower weighted average number of shares outstanding.
Free cash flow from continuing operations amounted to USD 11.7 billion (-10%) compared to USD 12.9 billion in 2019, as higher operating income adjusted for non-cash items was more than offset by payments related to legal matters and lower divestment proceeds.
Discontinued operations
Discontinued operations include the business of Alcon and certain corporate costs directly attributable to Alcon up to the spin-off date. As the Alcon spin-off was completed on April 9, 2019, the prior year included three months of operating results of the divested business.
In 2020, there were no operational activities related to discontinued operations. In the full year of 2019, discontinued operations net sales were USD 1.8 billion, operating income amounted to USD 71 million and net income from discontinued operations was USD 4.6 billion, including the non-taxable non-cash net gain on distribution of Alcon Inc. to Novartis AG shareholders which amounted to USD 4.7 billion. For further details see Note 2 “Selected critical accounting policies - Distribution of Alcon Inc. to Novartis AG shareholders”, Note 3 “Significant transactions – Completion of the spin-off of the Alcon business through a dividend in kind distribution to Novartis AG shareholders” and Note 10 “Discontinued operations” in the Condensed Financial Report.
Total Group full year
For the total Group, net income amounted to USD 8.1 billion compared to USD 11.7 billion in the prior year, including the non-taxable non-cash net gain on distribution of Alcon Inc. which amounted to USD 4.7 billion. Basic earnings per share was USD 3.55 compared to USD 5.12 in prior year. Cash flow from operating activities for the total Group amounted to USD 13.6 billion and free cash flow to USD 11.7 billion.
Innovative Medicines
Q4 2020 Q4 2019 % change
FY 2020 FY 2019 % change USD m USD m USD cc USD m USD m USD cc
Net sales 10 233 9 920 3 1 39 013 37 714 3 4 Operating income 2 386 2 210 8 12 9 172 9 287 -1 4 As % of net sales 23.3 22.3 23.5 24.6 Core operating income 3 212 3 122 3 3 13 645 12 650 8 11 As % of net sales 31.4 31.5 35.0 33.5
COVID-19 impacts
The pandemic continues to negatively impact demand in certain therapeutic areas, mainly in dermatology and ophthalmology. Despite this, full year sales grew 4% (cc) with core operating income growing 11% (cc) driven by the launch uptake of Zolgensma and Piqray as well as continuing momentum on Entresto, Cosentyx, Promacta/Revolade, Jakavi, Kisqali and Tafinlar + Mekinist.

Novartis Global Communications CH-4002 Basel - Switzerland - https://www.novartis.com
__ 8
Fourth quarter Net sales
Net sales were USD 10.2 billion (+3%, +1% cc) with volume contributing 6 percentage points to growth, pricing a negative 1 percentage point and generic competition had a negative impact of 4 percentage points mainly due to Afinitor and Exjade.
In the US (USD 3.7 billion) sales were -2% versus prior year, as growth of Entresto, Cosentyx and Promacta/Revolade was more than offset by generic impacts, mainly on Afinitor and Exjade. In Europe (USD 3.7 billion, +12%, +7% cc) sales grew driven by strong performance of Zolgensma, Jakavi, Entresto, Cosentyx and Ilaris. Japan sales were USD 0.6 billion (-1%, -5% cc) as growth was negatively impacted by the Galvus co-promotion agreement. Emerging Growth Markets grew +1% (+3% cc), including double-digit growth in China, with the launches of Entresto and Cosentyx.
Pharmaceuticals BU sales were USD 6.4 billion (+4%, +2% cc). There was continued growth momentum from Entresto (USD 716 million, +38%, +35% cc), Cosentyx (USD 1.1 billion, +15%, +13% cc) and Zolgensma (USD 254 million, +37%, +33% cc). Growth was partly offset by declines in Established Medicines and mature Ophthalmology brands due to generic impacts and COVID-19.
Oncology BU sales were broadly in line with prior year (USD 3.8 billion, +2%, +1% cc). Strong performance of Promacta/Revolade (USD 471 million, +24%, +23% cc), Jakavi (USD 376 million, +28%, +24% cc), Tafinlar + Mekinist (USD 408 million, +15%, +13% cc), Kymriah (USD 141 million, +47%, +42%), Adakveo (USD 34 million) and Kisqali (USD 184 million, +19%, +18% cc) was offset by generic competition, mainly for Afinitor and Exjade, and the negative impact of the COVID-19 pandemic.
Operating income
Operating income was USD 2.4 billion (+8%, +12% cc). The increase was mainly due to lower legal charges, partly offset by lower divestment gains. Operating income margin was 23.3% of net sales increasing 1.0 percentage point (+2.3 percentage points in cc).
Core adjustments were USD 0.8 billion, mainly due to amortization, compared to USD 0.9 billion in prior year. Core adjustments decreased compared to prior year mainly due to lower legal charges, partly offset by lower divestment gains.
Core operating income was USD 3.2 billion (+3%, +3% cc) mainly driven by higher sales. Core operating income margin was 31.4% of net sales, decreasing 0.1 percentage points (+0.7 percentage points cc). Core gross margin as a percentage of sales increased by 0.2 percentage points (cc). Core R&D expenses as a percentage of net sales decreased by 0.3 percentage points (cc). Core SG&A expenses declined by 1.0 percentage points (cc) benefiting from COVID-19 related spending impacts. Core Other Income and Expense net decreased the margin by 0.8 percentage points (cc) mainly due to lower core divestments.
Full year
Net sales
Net sales were USD 39.0 billion (+3%, +4% cc) with volume contributing 10 percentage points to growth, pricing a negative 3 percentage points and generic competition had a negative impact of 3 percentage points.
The US (USD 14.3 billion, +4%) delivered strong performance of Entresto, Zolgensma and Cosentyx. Europe sales (USD 13.5 billion, +5%, +4% cc) grew driven by Entresto, Zolgensma, Jakavi, Kisqali and Kymriah. Japan sales were USD 2.4 billion (0%, -3% cc) as growth was negatively impacted by the Galvus co-promotion agreement. Emerging Growth Markets sales grew +3% (+7% cc), led by double-digit growth in China, including the launches of Cosentyx and Entresto.
Pharmaceuticals BU grew 4% (+5% cc) driven by Entresto (USD 2.5 billion, +45%, +44% cc), Zolgensma (USD 0.9 billion), Cosentyx (USD 4.0 billion, +13%, +13% cc), Ilaris (USD 0.9 billion, +30%, +31% cc) and the Xiidra acquisition. Growth was partly offset by declines in Gilenya, and lower demand for Lucentis due to COVID-19. Other Ophthalmology products were also impacted by both COVID-19 and generic competition.
Novartis Global Communications CH-4002 Basel - Switzerland - https://www.novartis.com
__ 9
Oncology BU grew 2% (+3% cc) driven by Promacta/Revolade (USD 1.7 billion, +23%, +23% cc), Jakavi (USD 1.3 billion, +20%, +20% cc), Kisqali (USD 0.7 billion, +43%, +45% cc), Tafinlar + Mekinist (USD 1.5 billion, +15%, +16% cc) and Piqray (USD 0.3 billion), partly offset by generic competition for Afinitor and Exjade.
Operating income
Operating income was USD 9.2 billion (-1%, +4% cc). Growth at constant currencies was mainly driven by sales growth, partly offset by lower divestment gains and higher amortization. Operating income margin was 23.5% of net sales, decreasing 1.1 percentage points (+0.1 percentage points cc).
Core adjustments were USD 4.5 billion mainly due to USD 3.0 billion of amortization. Core adjustments increased compared to prior year (USD 3.4 billion) mainly due to lower divestment gains and higher amortization.
Core operating income was USD 13.6 billion (+8%, +11% cc) mainly driven by sales growth, lower COVID-19 related spending and improved gross margin productivity. Core operating income margin was 35.0% of net sales, increasing 1.5 percentage points (+2.2 percentage points cc). Core gross margin increased by 0.4 percentage points (cc) mainly driven by productivity. Core R&D expenses as a percentage of net sales decreased by 0.9 percentage points (cc) mainly driven by the higher net sales, productivity and COVID-19 related spending impacts. Core SG&A expenses declined by 1.2 percentage points (cc) benefiting from COVID-19 related spending impacts. Core Other Income and Expense net decreased the margin by 0.3 percentage points (cc).

Novartis Global Communications CH-4002 Basel - Switzerland - https://www.novartis.com
__ 10
ONCOLOGY BUSINESS UNIT Q4 2020 Q4 2019 % change FY 2020 FY 2019 % change USD m USD m USD cc USD m USD m USD cc Tasigna 513 491 4 3 1 958 1 880 4 5 Promacta/Revolade 471 380 24 23 1 738 1 416 23 23 Tafinlar + Mekinist¹ 408 356 15 13 1 542 1 338 15 16 Sandostatin 363 402 -10 -11 1 439 1 585 -9 -8 Jakavi 376 293 28 24 1 339 1 114 20 20 Gleevec/Glivec 291 313 -7 -9 1 188 1 263 -6 -6 Afinitor/Votubia 259 365 -29 -30 1 083 1 539 -30 -29 Kisqali 184 155 19 18 687 480 43 45 Exjade/Jadenu 156 231 -32 -35 653 975 -33 -33 Votrient 147 177 -17 -18 635 755 -16 -15 Kymriah 141 96 47 42 474 278 71 68 Lutathera 109 107 2 1 445 441 1 1 Piqray 84 67 25 25 320 116 176 176 Adakveo 34 1 nm nm 105 1 nm nm Tabrecta 17 nm nm 35 nm nm Other 264 294 -10 -12 1 070 1 189 -10 -10 Total Oncology business unit 3 817 3 728 2 1 14 711 14 370 2 3
1. Majority of sales for Mekinist and Tafinlar are combination, but both can be used as monotherapy nm = not meaningful
Tasigna (USD 513 million, +4%, +3% cc) sales grew in US, China and Japan, partly offset by a decline in Europe.
Promacta/Revolade (USD 471 million, +24%, +23% cc) double-digit growth continued across all regions, driven by increased use in chronic immune thrombocytopenia (ITP) and as first-line treatment for severe aplastic anemia (SAA) in the US.
Tafinlar + Mekinist (USD 408 million, +15%, +13% cc), the worldwide leader in BRAF/MEK-inhibition, continued to show strong growth driven by demand in adjuvant melanoma, as well as NSCLC. Tafinlar + Mekinist is the first and only targeted therapy to achieve five-year relapse-free survival (RFS) and overall survival (OS) data in the adjuvant and metastatic melanoma settings, respectively. More than 150,000 patients have been treated with Tafinlar + Mekinist worldwide to date.
Sandostatin (USD 363 million, -10%, -11% cc) sales declined due to ongoing competitive pressure in Emerging Growth Markets, US, Europe and Japan. The brand also continues to be impacted by generic competition in Europe.
Jakavi (USD 376 million, +28%, +24% cc) double-digit growth was driven by strong demand in the myelofibrosis and polycythemia vera indications. Data readouts from two Phase III studies (REACH2 and REACH3) now show Jakavi significantly improves outcomes in patients with steroid-resistant/dependent graft-versus-host disease (GvHD) compared to best available therapy. Regulatory filings based on the GvHD data are planned for 2021.
Gleevec/Glivec (USD 291 million, -7%, -9% cc) declined due to increased generic competition.
Afinitor/Votubia (USD 259 million, -29%, -30% cc) declined due to generic competition in the US, Europe and Emerging Growth Markets.
Kisqali (USD 184 million, +19%, +18% cc) continued to see strong growth in Europe, US and Emerging Growth Markets benefiting from the ongoing impact of positive overall survival (OS) data from two pivotal Phase III trials (MONALEESA-7 and MONALEESA-3). Kisqali stands apart as the only CDK4/6 inhibitor that significantly improves OS in two large Phase III trials, regardless of metastatic sites, endocrine treatment (ET) resistance, ET partner, treatment line or menopausal status, while maintaining quality of life. Kisqali is approved for use in more than 75 countries around the world, including the US and EU member states.
Exjade/Jadenu (USD 156 million, -32%, -35% cc) declined mainly due to pressure from generic competition in the US and other regions.
Votrient (USD 147 million, -17%, -18% cc) declined due to increased competition in Europe, Japan and US.

Novartis Global Communications CH-4002 Basel - Switzerland - https://www.novartis.com
__ 11
Kymriah (USD 141 million, +47%, +42% cc) grew strongly in Europe, US and Japan. Coverage continued to expand, with more than 290 qualified treatment centers and 27 countries having coverage for at least one indication. The Japan Ministry of Health, Labor and Welfare approved commercial manufacturing for Kymriah at the Foundation for Biomedical Research and Innovation at Kobe (FBRI), building on previous regulatory approvals in Switzerland and France that expanded manufacturing capabilities.
Lutathera (USD 109 million, +2%, +1% cc) sales were broadly in line with prior year, as the COVID-19 pandemic continued to have an impact on the brand due to its requirement of administration in a hospital setting. There are 384 total centers now actively treating patients globally. Sales from all AAA brands (including Lutathera and radiopharmaceutical diagnostic products) were USD 175 million.
Piqray (USD 84 million, +25%, +25% cc) continued to grow in the US supported by further uptake of PIK3CA mutation testing. Piqray is the first and only therapy specifically developed for the approximately 40% of HR+/HER2- advanced breast cancer patients who have a PIK3CA mutation, which is associated with poor prognosis. Piqray is now approved in more than 50 countries, including the US and EU member states, with over 40 regulatory submissions in various stages of review. Piqray launched in the US in June 2019.
Adakveo (USD 34 million) US launch continued to progress well, with more than 600 accounts purchasing Adakveo to date. Payer coverage decisions expanded, both in Medicaid and commercial (with 94% coverage among commercial plans to date). Following approval in Europe in Q4, reimbursement discussions with individual countries are underway.
Tabrecta (USD 17 million) omni-channel US launch progressed well, leveraging our robust digital capabilities to accelerate patient access amid the COVID-19 pandemic. Ninety leading lung cancer institutions have started patients on treatment. Tabrecta is the first and only therapy approved by the US FDA to specifically target metastatic NSCLC with a mutation that leads to MET exon 14 skipping (METex14), as detected by an FDA-approved test.
PHARMACEUTICALS BUSINESS UNIT
IMMUNOLOGY, HEPATOLOGY and DERMATOLOGY Q4 2020 Q4 2019 % change FY 2020 FY 2019 % change USD m USD m USD cc USD m USD m USD cc Cosentyx 1 109 965 15 13 3 995 3 551 13 13 Ilaris 240 178 35 32 873 671 30 31 Total Immunology, Hepatology and Dermatology 1 349 1 143 18 16 4 868 4 222 15 16
Xolair sales for all indications are reported in the Respiratory franchise
Cosentyx (USD 1.1 billion, +15%, +13% cc) saw continued growth across indications despite lower new patient starts across the market in dermatology and rheumatology in most geographies due to COVID-19. In October, Novartis presented data from two pivotal international Phase III studies reinforcing Cosentyx as a first-line systemic treatment in pediatric psoriasis. Cosentyx is currently undergoing review by the FDA for the treatment of moderate-to-severe plaque psoriasis in children and adolescents. In November, Cosentyx received EC approval for a new 300mg autoinjector and pre-filled syringe, which enable the 300mg dose to be administered in a single injection. In China, Cosentyx has been listed in the National Reimbursement Drug List (NRDL) as the only interleukin inhibitor with planned execution March 1st, 2021.
Ilaris (USD 240 million, +35%, +32% cc) sales were driven by strong double-digit volume growth, particularly coming from the US, Europe and Japan.

Novartis Global Communications CH-4002 Basel - Switzerland - https://www.novartis.com
__ 12
OPHTHALMOLOGY Q4 2020 Q4 2019 % change FY 2020 FY 2019 % change USD m USD m USD cc USD m USD m USD cc Lucentis 530 517 3 -2 1 933 2 086 -7 -8 Xiidra 108 90 20 19 376 192 96 95 Beovu 37 35 6 2 190 35 nm nm Other 450 585 -23 -24 1 911 2 463 -22 -22 Total Ophthalmology 1 125 1 227 -8 -11 4 410 4 776 -8 -8
nm = not meaningful
Lucentis (USD 530 million, +3%, -2% cc) sales were slightly lower than prior year in constant currencies. While the COVID-19 pandemic caused reduced capacity in ophthalmology clinics, leading to fewer patients’ visits, the impact in the fourth quarter was not as strong as the second quarter.
Xiidra (USD 108 million, +20%, +19% cc) continued to rebound during the quarter as patient volume at eye care practitioners continued to increase after significant COVID-19 disruption. Total volume increased in the fourth quarter vs. third quarter, following continued investment in direct to consumer advertising. Novartis is in US ANDA litigation with a generic manufacturer. Novartis acquired Xiidra from Takeda and began recording sales as of July 1, 2019.
Beovu (USD 37 million, +6%, +2% cc) launch roll-out continued, with approval now in 57 countries and reimbursement achieved in 11 countries, including the US, Germany, Japan and Italy. Beovu received positive reimbursement recommendation by NICE in the UK. Post marketing cases termed as “retinal vasculitis” and/or “retinal vascular occlusion” that may result in severe vision loss, typically associated with intraocular inflammation and the current COVID-19 situation had an unfavorable impact on sales. Novartis has a comprehensive plan, in strong collaboration with leading external global experts to educate the retina community about the positive benefit / risk profile of Beovu.
Other ophthalmology products declined due to the negative impact of the COVID-19 pandemic and generic impacts in the US, primarily for Travatan and Ciprodex.
NEUROSCIENCE Q4 2020 Q4 2019 % change FY 2020 FY 2019 % change USD m USD m USD cc USD m USD m USD cc Gilenya 760 803 -5 -8 3 003 3 223 -7 -7 Zolgensma 254 186 37 33 920 361 155 151 Mayzent 57 17 nm nm 170 26 nm nm Aimovig 56 28 100 91 164 103 59 57 Kesimpta 14 nm nm 15 nm nm Other 12 14 -14 -13 51 60 -15 -15 Total Neuroscience 1 153 1 048 10 7 4 323 3 773 15 14
nm = not meaningful
Gilenya (USD 760 million, -5%, -8% cc) sales declined due to increased competition and the impact of COVID-19. Gilenya remains the top prescribed high efficacy therapy in 41 countries and the only one approved to treat pediatric RMS. Novartis is in US ANDA litigation with a generic manufacturer. In August 2020, the US District Court in Delaware issued a favorable decision finding the dosage regimen patent valid and infringed, which has been appealed. In parallel, an appeal against a USPTO decision upholding the dosage regimen patent in IPR proceedings is ongoing.
Zolgensma (USD 254 million, +37%, +33% cc) grew driven by geographic expansion, including reimbursement in the EU and Japan, despite COVID-19 impacts. Zolgensma was most recently approved in Brazil, Canada and Taiwan. Zolgensma is now registered in 37 countries, with access pathways in 9 EU countries covering ~25% of the EU population. Zolgensma launched in the US in June 2019.
Mayzent (USD 57 million) continued to grow steadily. Growth is driven by fulfilling an important unmet need in patients showing signs of progression despite being on other treatments. Mayzent is the first and only oral DMT studied and proven to delay disease progression in a broad SPMS patient population. In addition to the US and EU, Mayzent is now approved in the UK, Australia, Canada, Japan and Switzerland.

Novartis Global Communications CH-4002 Basel - Switzerland - https://www.novartis.com
__ 13
Aimovig (USD 56 million ex-US, ex-Japan +100%, +91% cc) is the most prescribed anti-CGRP worldwide, with more than half a million patients prescribed worldwide in the post-trial setting. Aimovig is co-commercialized with Amgen in the US, where Amgen records sales. Novartis has exclusive rights and books sales in all ex-US territories excluding Japan. During the ongoing litigation between the companies the collaboration continues and will remain in force until a final court decision.
Kesimpta (USD 14 million) was launched in the US following FDA approval in August. To initiate access, we are providing Kesimpta free of charge for US patients who are eligible for reimbursement until they are covered by their insurance. Based on our assumption on the time from initiation of therapy to reimbursement we anticipate that a majority of the sales in the first quarters of launch will be free goods. The net sales we publish reflect the mix of free to paid goods. We expect this share to decrease over time as reimbursement progresses. Kesimpta is a targeted B-cell therapy that can deliver sustained high efficacy, with a favorable safety profile and the flexibility of an at home self-administration for a broad population of RMS patients. We have seen a promising start with our flexible hybrid face-to-face / digital launch.
CARDIOVASCULAR, RENAL AND METABOLISM Q4 2020 Q4 2019 % change FY 2020 FY 2019 % change USD m USD m USD cc USD m USD m USD cc Entresto 716 518 38 35 2 497 1 726 45 44 Other 5 nm nm 1 24 -96 -99 Total Cardiovascular, Renal & Metabolism 716 523 37 34 2 498 1 750 43 42
nm = not meaningful
Entresto (USD 716 million, +38%, +35% cc) sustained strong growth with increased patient share across markets, driven by demand as the essential first choice therapy for HF patients (reduced ejection fraction). FDA Cardiovascular and Renal Drugs Advisory Committee voted 12 to 1 to support the use of Entresto in treatment of patients with heart failure with preserved ejection fraction (HFpEF). Expected FDA approval has the potential to make Entresto the first therapy indicated for both HFpEF and HFrEF in the US, and a final decision is expected in Q1 2021. Novartis is in US ANDA litigation with generic manufacturers.
RESPIRATORY Q4 2020 Q4 2019 % change FY 2020 FY 2019 % change USD m USD m USD cc USD m USD m USD cc Xolair 335 303 11 8 1 251 1 173 7 8 Ultibro Group 160 162 -1 -6 623 630 -1 -1 Other 10 6 67 55 26 22 18 17 Total Respiratory 505 471 7 3 1 900 1 825 4 5
Xolair sales for all indications are reported in the Respiratory franchise
Xolair (USD 335 million, +11%, +8% cc) continued growth in the severe allergic asthma (SAA) and chronic spontaneous urticaria (CSU) indications. The new indication of chronic rhinosinusitis with nasal polyps (CRSwNP) was approved in the US, EU and several other markets in H2 2020 and to date has been launched in Germany, Austria and the Netherlands. Novartis co-promotes Xolair with Genentech in the US and shares a portion of operating income, but we do not record any US sales.
Ultibro Group (USD 160 million, -1%, -6% cc) sales declined due to competition and the impact of the COVID-19 pandemic. Ultibro Group consists of Ultibro Breezhaler, Seebri Breezhaler and Onbrez Breezhaler.
Enerzair Group consists of Enerzair Breezhaler and Atectura Breezhaler. Both medicines have been approved in the EU, Japan, Canada, Australia, Switzerland and South Korea in 2020, together with the digital companion (sensor and app) for Enerzair Breezhaler in the EU and Switzerland. They have been launched to date in 7 markets, including Germany, Japan and the UK.

Novartis Global Communications CH-4002 Basel - Switzerland - https://www.novartis.com
__ 14
ESTABLISHED MEDICINES Q4 2020 Q4 2019 % change FY 2020 FY 2019 % change USD m USD m USD cc USD m USD m USD cc Galvus Group 293 342 -14 -14 1 199 1 297 -8 -5 Diovan Group 224 266 -16 -17 1 003 1 064 -6 -4 Exforge Group 247 245 1 -1 980 1 025 -4 -3 Zortress/Certican 112 123 -9 -12 452 485 -7 -7 Neoral/Sandimmun(e) 103 105 -2 -5 393 419 -6 -6 Voltaren/Cataflam 95 104 -9 -9 360 417 -14 -12 Other 494 595 -17 -18 1 916 2 291 -16 -15 Total Established Medicines 1 568 1 780 -12 -13 6 303 6 998 -10 -8
Galvus Group (USD 293 million, -14%, -14% cc) declined primarily due to generic competition in Emerging Growth markets and our co-promotion agreement in Japan that started in 2019.
Diovan Group (USD 224 million, -16%, -17% cc) declined mainly due to generic competition and the impact of VBP in China.
Exforge Group (USD 247 million, +1%, -1% cc) declined in Europe due to generic competition, partly offset by growth in China.
Zortress/Certican (USD 112 million, -9%, -12% cc) declined mainly due to generic competition in the US.
Neoral/Sandimmun(e) (USD 103 million, -2%, -5% cc) declined mainly due to generic competition and mandatory price reductions.
Voltaren/Cataflam (USD 95 million, -9%, -9% cc) declined mainly due to generic competition and external supply issues following the COVID-19 pandemic.
Sandoz
Q4 2020 Q4 2019 % change
FY 2020 FY 2019 % change
USD m USD m USD cc USD m USD m USD cc Net sales 2 537 2 483 2 0 9 646 9 731 -1 0 Operating income 372 -195 nm nm 1 043 551 89 106 As % of net sales 14.7 -7.9 10.8 5.7 Core operating income 528 517 2 3 2 334 2 094 11 15 As % of net sales 20.8 20.8 24.2 21.5 nm = not meaningful
COVID-19 impacts
Quarter four sales were impacted by ongoing disruption to hospitals and HCP practices, which limited patient access to treatments for our Retail business across regions. The Anti-Infectives segment was also impacted by a weaker cough and cold season likely due to COVID-19. Spending was lower for the year as we implemented and embraced new ways of working, which include lower travel and meeting costs, as well as lower promotional activities.
Fourth quarter
Net sales
Sandoz net sales were USD 2.5 billion (+2%, 0% cc) with a volume increase of 3 percentage points. There was a negative price effect of 3 percentage points, despite the benefit from off-contract sales in the US.

Novartis Global Communications CH-4002 Basel - Switzerland - https://www.novartis.com
__ 15
Sales in Europe were USD 1.4 billion (+5%, +1% cc), driven by continued strong growth in biopharmaceutical and retail continued to be negatively impacted by COVID-19. Sales in the US were USD 517 million (-14%), driven by the continued oral solids decline including partnership terminations, as well as US first-to-market launches in the prior year. Sales in Asia / Africa / Australasia were USD 441 million (+24%, +19% cc) including the contribution from the Aspen Japan acquisition. Sales in Canada and Latin America were USD 204 million (-5%, +3% cc).
Global sales of Biopharmaceuticals (biosimilars, biopharmaceutical contract manufacturing and Glatopa) grew to USD 514 million (+21%, +16% cc), driven by continued strong growth in Europe from Hyrimoz (adalimumab), Erelzi (etanercept) and Zessly (infliximab) and lower prior year sales in biopharmaceutical contract manufacturing. Launch roll-outs in other geographies also contributed to growth.
Retail sales were USD 1.9 billion (-1%, -2% cc), mainly impacted by the continued decline of US oral solids and COVID-19 related worldwide disruption, particularly in Europe. Total Anti-Infectives franchise sales were USD 320 million (-8%, -10% cc), including finished dosage forms sold under the Sandoz name (USD 184 million, -7%, -7% cc) and Anti-Infectives sold to third parties for sale under their own name (USD 136 million, -10%, -14% cc) which were impacted by a planned contract discontinuation.
Operating income
Operating income was USD 372 million, an increase of USD 567 million versus prior year mainly driven by lower impairments and lower restructuring expenses. Operating income margin increased by 23.4 percentage points in constant currencies; currency had a negative impact of 0.8 percentage points, resulting in a net increase of 22.6 percentage points to 14.7% of net sales.
Core adjustments were USD 156 million, including USD 66 million of amortization. Prior year core adjustments were USD 712 million. The change in core adjustments compared to prior year was driven by lower impairments and lower net restructuring expenses from the Sandoz Transformation.
Core operating income was USD 528 million (+2%, +3% cc) due to gross margin improvements. Core operating income margin was 20.8% of net sales, in-line with prior year (+0.8 percentage points cc). Core gross margin as a percentage of net sales increased by 0.4 percentage points (cc), driven by favorable product and geographic mix, ongoing productivity improvements and lower price effects. Core R&D expenses as a percentage of net sales increased by 0.8 percentage points (cc) driven by pipeline investments. Core SG&A expenses declined by 0.9 percentage points (cc) benefiting from COVID-19 related spending impacts. Core Other Income and Expenses decreased by 0.3 percentage points (cc).
Full year
Net sales
Net sales were USD 9.6 billion (-1%, 0% cc) with volume growth of 2 percentage points despite the COVID-19 impacts. There was a negative price effect of 2 percentage points, despite the benefit from off-contract sales and favorable revenue deduction adjustments.
Sales in Europe were USD 5.2 billion (+2%, +2% cc). Sales in the US were USD 2.1 billion (-14%), mostly due to the continued volume decline in oral solids including partnership terminations. Sales in Asia / Africa / Australasia were USD 1.5 billion (+12%, +11% cc) including the contribution from the Aspen Japan acquisition. Sales in Canada and Latin America were USD 772 million (-2%, +8% cc).
Global sales of Biopharmaceuticals (biosimilars, biopharmaceutical contract manufacturing and Glatopa) grew to USD 1.9 billion (+20%, +19% cc), driven by continued double-digit growth in Europe from Hyrimoz (adalimumab), Erelzi (etanercept) and Zessly (infliximab) and growth from Omnitrope (somatropin) and Rixathon (rituximab) across regions. Launch roll-outs in other geographies also contributed to growth.
Retail sales were USD 7.2 billion (-5%, -4% cc) impacted by the declines in the US and COVID-19 related impact across regions. Total Anti-Infectives franchise sales were USD 1.2 billion (-11%, -11% cc) including finished dosage forms sold under the Sandoz name (USD 694 million, -11%, -10% cc) and

Novartis Global Communications CH-4002 Basel - Switzerland - https://www.novartis.com
__ 16
Anti-Infectives sold to third parties for sale under their own name (USD 474 million, -11%, -12% cc), which were impacted by a planned contract discontinuation.
Operating income
Operating income was USD 1.0 billion (+89%, +106% cc), an increase of USD 492 million versus prior year mainly due to lower impairments, continued gross margin improvements and lower spending. Operating income margin increased by 6.0 percentage points in constant currencies; currency had a negative impact of 0.9 percentage points, resulting in a net increase of 5.1 percentage points to 10.8% of net sales.
Core adjustments were USD 1.3 billion, mainly from USD 0.6 billion of amortization and impairments and USD 0.4 billion legal charges. Prior year core adjustments were USD 1.5 billion. The change in core adjustments compared to prior year was mainly due to higher prior year impairments.
Core operating income was USD 2.3 billion (+11%, +15% cc), driven by gross margin improvements, lower spending from cost discipline and COVID-19. Core operating income margin was 24.2% of net sales, increasing 2.7 percentage points (+3.3 percentage points cc). Core gross margin as a percentage of net sales increased by 1.9 percentage points (cc), driven by favorable product and geographic mix, ongoing productivity improvements and lower price effects. Core R&D expenses as a percentage of net sales increased by 0.5 percentage points (cc) driven by biosimilar pipeline investments. Core SG&A expenses declined by 1.6 percentage points (cc) benefiting from COVID-19 related spending impacts. Core Other Income and Expense decreased by 0.3 percentage points (cc).
GROUP CASH FLOW AND BALANCE SHEET Cash flow Fourth quarter Net cash flows from operating activities from continuing operations amounted to USD 4.0 billion, compared to USD 3.5 billion in the prior year quarter. Higher net income adjusted for non-cash items and other adjustments, including divestment gains, favorable working capital and hedging results were partly offset by higher payments out of provisions related to legal matters.
Net cash flows used in investing activities from continuing operations amounted to USD 0.6 billion, compared to net cash inflows of USD 0.4 billion in the prior year quarter.
The current year quarter cash outflows were mainly driven by purchases of property, plant and equipment, intangible and financial assets of USD 1.1 billion. These cash outflows were partly offset by cash inflows of USD 0.3 billion from the sale of financial assets and USD 0.3 billion from the sale of property, plant and equipment and intangible assets.
In the prior year quarter, net cash inflows of USD 0.4 billion from investing activities from continuing operations were driven by USD 1.0 billion proceeds from the sale of intangible and financial assets (including USD 0.3 billion proceeds from the sale of Alcon Inc. shares). Net other cash outflows of USD 0.6 billion were driven by the purchases of property, plant and equipment, intangible assets, financial assets and other non-current assets of USD 0.7 billion, partly offset by USD 0.1 billion proceeds from

Novartis Global Communications CH-4002 Basel - Switzerland - https://www.novartis.com
__ 17
the sale of property, plant and equipment and cash inflows from acquisitions and divestments of businesses, net.
Net cash flows used in financing activities from continuing operations amounted to USD 2.9 billion, compared to USD 1.2 billion in the prior year quarter.
The current year quarter cash outflows were driven by USD 1.9 billion for net treasury share transactions and USD 0.9 billion for net repayments of current financial debts. Payment for lease liabilities, net, resulted in a net cash outflow of USD 0.1 billion.
In the prior year quarter, net cash flows used in financing activities from continuing operations were driven by USD 1.1 billion for net repayments of current financial debts. Payments for lease liabilities, net, resulted in a net cash outflow of USD 0.1 billion.
Free cash flow from continuing operations amounted to USD 3.3 billion (-4%) compared to USD 3.5 billion in the prior year quarter, as higher cash flows from operating activities were more than offset by increased net investment for intangible assets.
Full year
Net cash flows from operating activities from continuing operations amounted to USD 13.6 billion, compared to USD 13.5 billion in 2019. This increase was mainly driven by higher net income adjusted for non-cash items and other adjustments, including divestment gains, partly offset by higher payments out of provisions related to legal matters.
Net cash outflows used in investing activities from continuing operations amounted to USD 13.1 billion, compared to USD 1.1 billion in 2019.
The current year cash outflows were mainly driven by USD 10.0 billion for acquisitions and divestments of businesses, net (including the acquisition of The Medicines Company for USD 9.5 billion, net of cash acquired USD 0.1 billion, and the acquisition of the Japanese business of Aspen Global Incorporated for USD 0.3 billion); USD 1.4 billion for net purchases of marketable securities and commodities; USD 1.3 billion for purchases of property, plant and equipment; and USD 1.3 billion for purchases of intangible assets. These cash outflows were partly offset by cash inflows of USD 0.7 billion from the sale of financial assets (including USD 0.3 billion proceeds from the sale of Alcon Inc. shares) and USD 0.4 billion from the sale of intangible assets.
In 2019, net cash flows used in investing activities from continuing operations were driven by USD 3.8 billion for acquisitions and divestments of businesses, net (including the acquisition of Xiidra from Takeda Pharmaceutical Company Limited for USD 3.5 billion and the acquisition of IFM Tre, Inc. for USD 0.3 billion); USD 1.4 billion for purchases of property, plant and equipment; USD 0.9 billion for purchases of intangible assets; and USD 0.4 billion for purchases of financial assets and other non-current assets. These cash outflows were partly offset by cash inflows of USD 2.3 billion from the net proceeds from the sale of marketable securities and commodities; USD 0.9 billion from the sale of property, plant and equipment (including the proceeds from the sale and leaseback of real estate); USD 1.2 billion from the sale of financial assets (including USD 1.0 billion proceeds from the sale of Alcon Inc. shares); and USD 1.0 billion from the sale of intangible assets.
Net cash flows used in investing activities from discontinued operations amounted to USD 0.1 billion compared to USD 1.2 billion in 2019. The current year includes payments for transaction related expenditures. In 2019, the net outflows were mainly driven by USD 0.3 billion for the acquisition of

Novartis Global Communications CH-4002 Basel - Switzerland - https://www.novartis.com
__ 18
PowerVision, Inc.; USD 0.6 billion due to derecognized cash and cash equivalents following the completion of the Alcon spin-off, on April 9, 2019; and transaction related expenditures.
Net cash flows used in financing activities from continuing operations amounted to USD 2.2 billion, compared to USD 16.9 billion in 2019.
The current year cash outflows were driven by USD 7.0 billion for the dividend payment; USD 2.1 billion for net treasury share transactions; USD 2.0 billion for the repayment of two US dollar bonds at maturity; USD 0.3 billion net payments for lease liabilities; and USD 0.2 billion for other financing cash outflows, net. These cash outflows were partly offset by cash inflows of USD 7.1 billion from the increase in non-current financial debts, mainly consisting of USD 4.9 billion from the issuance of bonds denominated in US dollars (notional amount of USD 5.0 billion) and USD 2.1 billion from the issuance of a sustainability-linked bond denominated in euro (notional amount of EUR 1.85 billion); and USD 2.3 billion from the net increase in current financial debts.
In 2019, net cash flows used in financing activities from continuing operations were driven by USD 6.6 billion for the dividend payment; USD 5.3 billion for the net treasury share transactions (mainly related to the up-to USD 5 billion share buyback); USD 3.1 billion for net non-current financial debts (mainly driven by the repayment at maturity of a US dollar bond of USD 3.0 billion); USD 1.6 billion for net repayments of current financial debts; and USD 0.3 billion for payments of lease liabilities, net.
Net cash flows used in financing activities from discontinued operations amounted to USD 50 million, compared to a cash inflow of USD 3.3 billion in 2019. The current year cash outflows are for transaction costs. In 2019, cash inflows included mainly the proceeds from the USD 3.5 billion Alcon borrowings, partly offset by USD 0.2 billion payments for transaction costs.
Free cash flow from continuing operations amounted to USD 11.7 billion (-10%) compared to USD 12.9 billion in 2019, as higher operating income adjusted for non-cash items was more than offset by payments related to legal matters and lower divestment proceeds.
Balance sheet As of December 31, 2019, the assets and liabilities of the Sandoz US generic oral solids and dermatology businesses were reported as current assets and liabilities held for sale in the consolidated balance sheet. In March 2020, Novartis decided to retain the Sandoz US generic oral solids and dermatology businesses and, on April 2, 2020, announced the mutual agreement with Aurobindo to terminate the sale agreement. As such, these assets and liabilities are reclassified to their respective consolidated balance sheet lines as from March 31, 2020; the prior year consolidated balance sheet is not restated (see Note 3 in the Condensed Financial Report).
Assets
Total non-current assets of USD 102.4 billion at December 31, 2020, increased by USD 13.5 billion compared to December 31, 2019. Intangible assets other than goodwill increased by USD 8.0 billion mainly due to the acquisitions of The Medicines Company and of the Japanese business of Aspen Global Incorporated, net additions, favorable currency translation adjustments and the reclassification of the intangible assets of the disposal group held for sale of USD 0.3 billion, partially offset by amortization and impairments. Goodwill increased by USD 3.5 billion, and deferred tax assets by USD 0.3 billion, mainly due to the acquisition of The Medicines Company and favorable currency translation adjustments. Investments in associated companies increased by USD 1.0 billion primarily due to favorable currency translation adjustments, as income from associated companies was largely offset by dividends received. Financial assets and other non-current assets increased by USD 0.5 billion, mainly due to fair value adjustments on financial assets. Property, plant and equipment increased by USD 0.2 billion, mainly due to net additions and the reclassification of property, plant and equipment of the disposal group held for

Novartis Global Communications CH-4002 Basel - Switzerland - https://www.novartis.com
__ 19
sale of USD 0.1 billion and favorable currency translation adjustments, partly offset by depreciation and impairments. Right-of-use assets were broadly in line with December 31, 2019.
Total current assets of USD 29.7 billion at December 31, 2020, increased by USD 0.2 billion compared to December 31, 2019. Marketable securities, commodities, time deposits, and derivative financial instruments increased by USD 1.6 billion, mainly due to the investment of a portion of the September 16, 2020 issuance of the euro denominated sustainability-linked bond. Inventories increased by USD 1.1 billion, which includes USD 0.2 billion from the reclassification of the inventory of the disposal group held for sale. These increases were partly offset by a decrease in cash and cash equivalents by USD 1.5 billion, and in other current assets by USD 0.2 billion. Trade receivables and income tax receivables were broadly in line with December 31, 2019.
Liabilities
Total non-current liabilities of USD 42.3 billion increased by USD 7.8 billion compared to December 31, 2019. Non-current financial debts increased by USD 5.9 billion, mainly driven by the issuance of a euro denominated sustainability-linked bond for a notional amount of EUR 1.85 billion (USD 2.2 billion), and the issuance of US dollar denominated bonds for a total notional amount of USD 5.0 billion. This increase is partly offset by the reclassification from non-current to current financial debt for a total of USD 2.3 billion consisting of a EUR 1.25 billion (USD 1.5 billion) bond and a EUR 0.6 billion (USD 0.7 billion) bond due in March 2021 and November 2021, respectively. Deferred tax liabilities increased by USD 1.6 billion mainly due to the acquisition of The Medicines Company. Provisions and other non-current liabilities increased by USD 0.3 billion, and lease liabilities were broadly in line compared to December 31, 2019.
Total current liabilities of USD 33.1 billion increased by USD 4.8 billion compared to December 31, 2019. Current financial debts and derivative financial instruments increased by USD 2.8 billion, due to the reclassification from non-current to current financial debt of USD 2.3 billion and higher short-term borrowings, partly offset by the repayment at maturity of two US dollar bonds totaling USD 2.0 billion. Provisions and other current liabilities increased by USD 1.8 billion mainly due to a USD 1.8 billion treasury share repurchase obligation under a share buyback trading plan and current income tax liabilities increased by USD 0.3 billion. Trade payables and lease liabilities were broadly in line compared to December 31, 2019.
Equity
The Group’s equity increased by USD 1.1 billion to USD 56.7 billion at December 31, 2020 compared to December 31, 2019. This increase was mainly due to the net income of USD 8.1 billion, the net effect of the exercise of options and employee transactions of USD 0.8 billion, equity-based compensation of USD 0.7 billion, favorable currency translation differences of USD 3.2 billion and the net favorable fair value adjustments on financial instruments of USD 0.3 billion. This was partially offset by the cash-dividend payment of USD 7.0 billion, purchase of treasury shares of USD 3.1 billion and the increase of the treasury share repurchase obligation of USD 1.8 billion.
Net debt and debt/equity ratio
The Group’s liquidity amounted to USD 11.6 billion at December 31, 2020, compared to USD 11.4 billion at December 31, 2019. Total non-current and current financial debts, including derivatives, amounted to USD 36.0 billion at December 31, 2020, compared to USD 27.4 billion at December 31, 2019. The debt/equity ratio increased to 0.64:1 at December 31, 2020, compared to 0.49:1 at December 31, 2019. The net debt increased to USD 24.5 billion at December 31, 2020, compared to USD 15.9 billion at December 31, 2019.

Novartis Global Communications CH-4002 Basel - Switzerland - https://www.novartis.com
__ 20
Innovation Review Benefiting from our continued focus on innovation, Novartis has one of the industry’s most innovative and inventive pipelines with more than 160 projects in clinical development. Selected Innovative Medicines approvals: US, EU and Japan in Q4 Product Active ingredient/
Descriptor Indication Region
Adakveo crizanlizumab Sickle cell disease EU - Oct Leqvio Inclisiran Hyperlipidemia EU - Dec Xolair omalizumab Nasal polyps EU - Aug / US - Nov
Selected Innovative Medicines projects awaiting regulatory decisions Completed submissions Product Indication US EU Japan News update Cosentyx 300mg AI Q4 2020 Approved - EU approval October 2020 Entresto Chronic heart failure
with preserved ejection fraction
Q2 2020 - December 2020 FDA Advisory Committee recommended use of Entresto® to treat patients with HFpEF
Leqvio (Inclisiran)
Hyperlipidemia Q4 2019 Approved - Novartis received a CRL from the FDA due to unresolved facility inspection-related conditions at a third-party manufacturing facility in Europe
- FDA has not raised any concerns related to the efficacy or safety of inclisiran. Response to CRL planned to be submitted Q2 - Q3 2021
OMB157 (Kesimpta in US)
Relapsing Multiple Sclerosis
Approved Q1 2020 Q3 2020
Selected Innovative Medicines pipeline projects Project/ Compound
Potential indication/ Disease area
First planned submissions
Current Phase
News update
ABL001 (asciminib)
Chronic myeloid leukemia 3rd line
H1-2021 III - ASCEMBL data presented at ASH - FDA Fast Track designation - EU Orphan Drug designation
ACZ885 (canakinumab)
Adjuvant NSCLC 2023 III - Enrollment ongoing NSCLC, 1st line H2-2021 III - Depending on timing of final read-out,
submission may move to early 2022
NSCLC, 2nd line H2-2021 III Aimovig Pediatric migraine ≥2025 III AVXS-101 (OAV101)
Spinal muscular atrophy (IT formulation)
tbc based on FDA feedback
I / II - Preclinical studies to address partial clinical hold are on track
- The FDA has acknowledged the potential of AVXS-101 IT in this patient population and recommends a pivotal confirmatory study, to be initiated after partial clinical hold is lifted
AVXS-201 (OAV201)
Rett syndrome ≥2025 I
Beovu Diabetic macular edema H1-2021 III - Positive topline results for KESTREL (second Ph3 in patients with DME), following positive topline results for KITE
- In Ph3 KESTREL study, Beovu (brolucizumab 6mg) achieved its primary endpoint of non-inferiority to aflibercept 2mg in change in best-

Novartis Global Communications CH-4002 Basel - Switzerland - https://www.novartis.com
__ 21
Project/ Compound
Potential indication/ Disease area
First planned submissions
Current Phase
News update
corrected visual acuity (BCVA) at year one (week 52)
- More than half of patients in the Beovu arm were maintained on a three-month dosing interval through year one, following the loading phase. All aflibercept patients were on a two-month dosing interval after the loading phase
Retinal vein occlusion 2023 III Diabetic retinopathy 2023 III
BYL719 (alpelisib)
PROS (PIK3CA-related overgrowth spectrum)
H2-2021 II - Planned US filing based on RWE data - Delay due to additional COVID lockdown
HER2+ adv breast cancer ≥2025 III - Updated plans considering COVID impact and Health Authorities’ advice
Triple negative breast cancer
2023 III
Head and neck squamous cell carcinoma 2L/3L
≥2025 III
Ovarian cancer 2023 III CEE321 Atopic dermatitis ≥2025 I CFZ533 (iscalimab)
Renal Tx ≥2025 II - Recently received HA feedback implies that submission targeted for 2023 based on a single pivotal Ph2b trial in kidney transplant may not be achievable
Liver Tx ≥2025 II Sjögren’s syndrome ≥2025 II
Coartem Malaria uncomplicated, <5kg patients
2024 III - Submission planned in Switzerland
Cosentyx Hidradenitis suppurativa 2022 III Ankylosing spondylitis
head-to-head vs. adalimumab
2022 III
IV regimen in PsA 2022 III IV regimen in AS 2023 III Giant cell arteritis 2024 II Lichen planus ≥2025 II Lupus nephritis ≥2025 III CPK850 Retinitis pigmentosa ≥2025 II CSJ117 Asthma ≥2025 II ECF843 Dry eye 2023 II Entresto Post-acute myocardial
infarction H2-2021 III
Jakavi Acute graft-versus-host disease (GvHD)
H1-2021 III
Chronic GvHD H1-2021 III - REACH3 data presented at ASH
KAE609 (cipargamin)
Malaria uncomplicated ≥2025 II Malaria severe ≥2025 II
KAF156 (ganaplacide)
Malaria uncomplicated ≥2025 II
Kisqali + endocrine therapy
HR+/HER2- early BC (adjuvant)
2023 III
Leqvio (Inclisiran)
Secondary prevention of cardiovascular events in patients with elevated levels of LDLC
≥2025 III - Pooled data analyses from Ph3 ORION-9, -10 and -11 showed that inclisiran consistently reduced low-density lipoprotein cholesterol (LDL-C) by approximately 51%

Novartis Global Communications CH-4002 Basel - Switzerland - https://www.novartis.com
__ 22
Project/ Compound
Potential indication/ Disease area
First planned submissions
Current Phase
News update
regardless of age and gender
Kymriah (tisagenlecleucel)
r/r Follicular lymphoma H2-2021 II - ELARA data presented at ASH r/r DLBCL in 1st relapse H2-2021 III
LJC242 (tropifexor + cenicriviroc)
Non-alcoholic steatohepatitis (NASH)
≥2025 II
LJN452 (tropifexor + licogliflozin)
Non-alcoholic steatohepatitis (NASH)
≥2025 II
LMI070 (branaplam)
Spinal muscular atrophy ≥2025 II - FDA, EU Orphan Drug designation - Dose ranging study ongoing
Huntington’s disease ≥2025 I - FDA Orphan Drug designation LNA043 Osteoarthritis ≥2025 II LNP023 (iptacopan)
Paroxysmal nocturnal hemoglobinuria
2023 II - FDA, EU Orphan Drug designation - FDA Breakthrough Therapy designation granted
IgA nephropathy 2023 II - EU Orphan Drug designation Membranous nephropathy ≥2025 II C3 glomerulopathy 2023 II - FDA, EU Orphan Drug designation
- EU PRIME designation - FDA Rare Pedriatic designation granted
Atypical haemolytic uraemic syndrome
≥2025 II - Updated plan as per protocol feasibility assessment
LOU064 (remibrutinib)
Chronic spontaneous urticaria
≥2025 II - Readout expected in H2 2021
Sjögren’s syndrome ≥2025 II Lutathera GEP-NET 1L G3 2023 III 177Lu-PSMA-617 Metastatic castration-
resistant prostate cancer (mCRPC)
H2-2021 III - Event-driven trial; readout expected in H1 2021
mCRPC Pre-taxane 2023 III - Ph3 study to be initiated in H1 2021 177Lu-PSMA-R2 Prostate cancer ≥2025 I 177Lu-NeoB Multiple Solid Tumors ≥2025 I LXE408 Visceral leishmaniasis ≥2025 II MBG453 (sabatolimab)
Myelodysplastic syndrome H2-2021 III
Unfit AML 2024 II MIJ821 Depression ≥2025 II PDR001 Combo Malignant melanoma ≥2025 II - Enrollment ongoing QBW251 (icenticaftor)
COPD 2024 II - Ph2b recruitment ongoing
QGE031 (ligelizumab)
Chronic Spontaneous Urticaria
2022 III - FDA Breakthrough Therapy designation granted
CINDU 2024 III - Ph3 study to be initiated in H2 2021 Food Allergy ≥2025 III - Ph3 study to be initiated in H2 2021
SAF312 Chronic ocular surface pain
2024 II
Tabrecta (capmatinib)
Solid Tumors 2024 II
TQJ230 (pelacarsen)
Secondary prevention of cardiovascular events in patients with elevated levels of lipoprotein(a)
≥2025 III - Enrollment ongoing - FDA Fast Track designation - China Breakthrough Therapy designation granted
UNR844 Presbyopia 2024 II

Novartis Global Communications CH-4002 Basel - Switzerland - https://www.novartis.com
__ 23
Project/ Compound
Potential indication/ Disease area
First planned submissions
Current Phase
News update
VAY736 (ianalumab)
Auto-immune hepatitis ≥2025 II Sjögren’s syndrome ≥2025 II - FDA Fast Track designation
VPM087 (gevokizumab)
1st line colorectal cancer ≥2025 I
Xolair Food Allergy 2022 III
Selected Sandoz approvals and pipeline projects Project/ Compound
Potential indication/ Disease area
News update
GP2411 (denosumab)
Osteoporosis, skeletal-related in bone met. pts (same as originator)
- In Ph3
Insulin glargine, lispro, aspart
Diabetes - Collaboration with Gan & Lee
natalizumab Multiple sclerosis and Crohn’s disease - Collaboration Polpharma Biologics trastuzumab HER2-positive cancer tumors - Collaboration EirGenix

24
Condensed consolidated financial statementsConsolidated income statementsFourth quarter (unaudited)
(USD millions unless indicated otherwise) Note Q4 2020 Q4 2019
Net sales to third parties from continuing operations 9 12 770 12 403
Other revenues 9 260 313
Cost of goods sold -4 217 -3 992
Gross profit from continuing operations 8 813 8 724
Selling, general and administration -3 924 -3 905
Research and development -2 333 -2 853
Other income 643 643
Other expense -555 -786
Operating income from continuing operations 2 644 1 823
Income from associated companies 141 150
Interest expense -201 -203
Other financial income and expense -25 -11
Income before taxes from continuing operations 2 559 1 759
Taxes -460 -630
Net income from continuing operations 2 099 1 129
Net income 2 099 1 129
Attributable to:
Shareholders of Novartis AG 2 094 1 125
Non-controlling interests 5 4
Weighted average number of shares outstanding – Basic (million) 2 265 2 265
Basic earnings per share from continuing operations (USD) 1 0.92 0.50
Total basic earnings per share (USD) 1 0.92 0.50
Weighted average number of shares outstanding – Diluted (million) 2 282 2 292
Diluted earnings per share from continuing operations (USD) 1 0.92 0.49
Total diluted earnings per share (USD) 1 0.92 0.49
1 Earnings per share (EPS) is calculated on the amount of net income attributable to shareholders of Novartis AG.

25
Consolidated income statementsFull year (audited)
(USD millions unless indicated otherwise) Note FY 2020 FY 2019
Net sales to third parties from continuing operations 9 48 659 47 445
Sales to discontinued segment 53
Net sales from continuing operations 48 659 47 498
Other revenues 9 1 239 1 179
Cost of goods sold -15 121 -14 425
Gross profit from continuing operations 34 777 34 252
Selling, general and administration -14 197 -14 369
Research and development -8 980 -9 402
Other income 1 742 2 031
Other expense -3 190 -3 426
Operating income from continuing operations 10 152 9 086
Income from associated companies 673 659
Interest expense -869 -850
Other financial income and expense -78 45
Income before taxes from continuing operations 9 878 8 940
Taxes -1 807 -1 793
Net income from continuing operations 8 071 7 147
Net loss from discontinued operations before gain on distribution of Alcon Inc.
to Novartis AG shareholders 10 -101
Gain on distribution of Alcon Inc. to Novartis AG shareholders 3, 10 4 691
Net income from discontinued operations 4 590
Net income 8 071 11 737
Attributable to:
Shareholders of Novartis AG 8 072 11 732
Non-controlling interests -1 5
Weighted average number of shares outstanding – Basic (million) 2 277 2 291
Basic earnings per share from continuing operations (USD) 1 3.55 3.12
Basic earnings per share from discontinued operations (USD) 1 2.00
Total basic earnings per share (USD) 1 3.55 5.12
Weighted average number of shares outstanding – Diluted (million) 2 296 2 319
Diluted earnings per share from continuing operations (USD) 1 3.52 3.08
Diluted earnings per share from discontinued operations (USD) 1 1.98
Total diluted earnings per share (USD) 1 3.52 5.06
1 Earnings per share (EPS) is calculated on the amount of net income attributable to shareholders of Novartis AG.

26
Consolidated statements of comprehensive incomeFourth quarter (unaudited)
(USD millions) Q4 2020 Q4 2019
Net income 2 099 1 129
Other comprehensive income to be eventually recycled into the consolidated income statement:
Net investment hedge -103 -49
Currency translation effects 1 701 863
Total of items to eventually recycle 1 598 814
Other comprehensive income never to be recycled into the consolidated income statement:
Actuarial gains from defined benefit plans, net of taxes 625 841
Fair value adjustments on equity securities, net of taxes 204 -22
Total of items never to be recycled 829 819
Total comprehensive income 4 526 2 762
Attributable to:
Shareholders of Novartis AG 4 521 2 759
Continuing operations 4 521 2 759
Non-controlling interests 5 3
Full year (audited)
(USD millions) FY 2020 FY 2019
Net income 8 071 11 737
Other comprehensive income to be eventually recycled into the consolidated income statement:
Fair value adjustments on debt securities, net of taxes 1
Fair value adjustments on deferred cash flow hedges, net of taxes 1
Total fair value adjustments on financial instruments, net of taxes 2
Novartis share of other comprehensive income recognized by associated companies, net of taxes -56 -94
Net investment hedge -201 44
Currency translation effects 1 3 194 352
Total of items to eventually recycle 2 937 304
Other comprehensive income never to be recycled into the consolidated income statement:
Actuarial gains/(losses) from defined benefit plans, net of taxes 2 143 -467
Fair value adjustments on equity securities, net of taxes 250 -47
Total of items never to be recycled 393 -514
Total comprehensive income 11 401 11 527
Attributable to:
Shareholders of Novartis AG 11 403 11 525
Continuing operations 11 403 6 948
Discontinued operations 4 577
Non-controlling interests -2 2
1 In 2019, cumulative currency translation gains of USD 123 million were recycled into the consolidated income statement as a result of the Alcon spin-off (see Notes 2, 3 and 10).2 Included in 2019 is a USD -358 million impact related to the revaluation of deferred tax assets on Swiss pension plans that were previously recognized through other comprehensive
income. This revaluation resulted from the Swiss canton Basel-Stadt tax reform, enacted in February 2019.

27
Consolidated balance sheets (audited)
Dec 31, Dec 31,
(USD millions) Note 2020 2019
Assets
Non-current assets
Property, plant and equipment 9 12 263 12 069
Right-of-use assets 1 676 1 677
Goodwill 9 29 999 26 524
Intangible assets other than goodwill 9 36 809 28 787
Investments in associated companies 9 632 8 644
Deferred tax assets 8 214 7 909
Financial assets 2 901 2 518
Other non-current assets 892 738
Total non-current assets 102 386 88 866
Current assets
Inventories 7 131 5 982
Trade receivables 8 217 8 301
Income tax receivables 239 254
Marketable securities, commodities, time deposits and derivative financial instruments 1 905 334
Cash and cash equivalents 9 658 11 112
Other current assets 2 523 2 680
Total current assets without disposal group 29 673 28 663
Assets of disposal group held for sale 3 841
Total current assets 29 673 29 504
Total assets 132 059 118 370
Equity and liabilities
Equity
Share capital 913 936
Treasury shares -53 -80
Reserves 55 738 54 618
Equity attributable to Novartis AG shareholders 56 598 55 474
Non-controlling interests 68 77
Total equity 56 666 55 551
Liabilities
Non-current liabilities
Financial debts 26 259 20 353
Lease liabilities 1 719 1 703
Deferred tax liabilities 7 422 5 867
Provisions and other non-current liabilities 6 934 6 632
Total non-current liabilities 42 334 34 555
Current liabilities
Trade payables 5 403 5 424
Financial debts and derivative financial instruments 9 785 7 031
Lease liabilities 286 246
Current income tax liabilities 2 458 2 194
Provisions and other current liabilities 15 127 13 338
Total current liabilities without disposal group 33 059 28 233
Liabilities of disposal group held for sale 3 31
Total current liabilities 33 059 28 264
Total liabilities 75 393 62 819
Total equity and liabilities 132 059 118 370

28
Consolidated statements of changes in equityFourth quarter (unaudited)
Reserves Issued share
capital and
reserves
attributable Non-
Share Treasury Retained Total value to Novartis controlling Total
(USD millions) Note capital shares earnings adjustments shareholders interests equity
Total equity at October 1, 2020 913 -44 57 403 -3 788 54 484 70 54 554
Net income 2 094 2 094 5 2 099
Other comprehensive income 2 427 2 427 0 2 427
Total comprehensive income 2 094 2 427 4 521 5 4 526
Purchase of treasury shares -9 -1 587 -1 596 -1 596
Repurchase of options -89 -89 -89
Equity-based compensation 0 177 177 177
Shares delivered to Alcon employees
as a result of the Alcon spin-off 0 1 1 1
Taxes on treasury share transactions 1 1 1
Increase of treasury share repurchase
obligation under a share buyback trading plan 4.1 -912 -912 -912
Fair value adjustments on financial assets sold 59 -59
Fair value adjustments related to divestments -2 2
Impact of change in ownership of consolidated entities 7 -1 6 -7 -1
Other movements 4.2 5 5 5
Total of other equity movements -9 -2 340 -58 -2 407 -7 -2 414
Total equity at December 31, 2020 913 -53 57 157 -1 419 56 598 68 56 666
Reserves Issued share
capital and
reserves
attributable Non-
Share Treasury Retained Total value to Novartis controlling Total
(USD millions) Note capital shares earnings adjustments shareholders interests equity
Total equity at October 1, 2019 936 -80 57 928 -6 260 52 524 74 52 598
Net income 1 125 1 125 4 1 129
Other comprehensive income 1 634 1 634 -1 1 633
Total comprehensive income 1 125 1 634 2 759 3 2 762
Purchase of treasury shares -4 -4 -4
Exercise of options and employee transactions 10 10 10
Equity-based compensation 192 192 192
Shares delivered to Alcon employees
as a result of the Alcon spin-off -14 -14 -14
Fair value adjustments on financial assets sold 38 -38
Fair value adjustments related to divestments -7 7
Other movements 4.2 7 7 7
Total of other equity movements 222 -31 191 191
Total equity at December 31, 2019 936 -80 59 275 -4 657 55 474 77 55 551

29
Consolidated statements of changes in equityFull year 2020 (audited)
Reserves Issued share capital and reserves attributable Non- Share Treasury Retained Total value to Novartis controlling Total(USD millions) Note capital shares earnings adjustments shareholders interests equity
Total equity at January 1, 2020 936 -80 59 275 -4 657 55 474 77 55 551
Net income 8 072 8 072 -1 8 071
Other comprehensive income -56 3 387 3 331 -1 3 330
Total comprehensive income 8 016 3 387 11 403 -2 11 401
Dividends -6 987 -6 987 -6 987
Purchase of treasury shares -18 -3 038 -3 056 -3 056
Reduction of share capital -23 31 -8
Exercise of options and employee transactions 8 798 806 806
Repurchase of options -89 -89 -89
Equity-based compensation 6 724 730 730
Shares delivered to Alcon employees
as a result of the Alcon spin-off 0 30 30 30
Taxes on treasury share transactions 32 32 32
Increase of treasury share repurchase obligation
under a share buyback trading plan 4.1 -1 769 -1 769 -1 769
Fair value adjustments on financial assets sold 150 -150
Fair value adjustments related to divestments -2 2
Impact of change in ownership of consolidated entities 7 -1 6 -7 -1
Other movements 4.2 18 18 18
Total of other equity movements -23 27 -10 134 -149 -10 279 -7 -10 286
Total equity at December 31, 2020 913 -53 57 157 -1 419 56 598 68 56 666

30
Consolidated statements of changes in equityFull year 2019 (audited)
Reserves Issued share
capital and
reserves
attributable Non-
Share Treasury Retained Total value to Novartis controlling Total
(USD millions) Note capital shares earnings adjustments shareholders interests equity
Total equity at January 1, 2019, as previously reported 944 -69 82 191 -4 452 78 614 78 78 692
Impact of change in accounting policies 4.3 3 3 3
Restated equity at January 1, 2019 944 -69 82 194 -4 452 78 617 78 78 695
Net income 11 732 11 732 5 11 737
Other comprehensive income -94 -113 -207 -3 -210
Total comprehensive income 11 638 -113 11 525 2 11 527
Dividends -6 645 -6 645 -6 645
Dividend in kind to effect the spin-off of Alcon Inc. 2, 3 -23 434 -23 434 -23 434
Purchase of treasury shares -31 -5 480 -5 511 -5 511
Reduction of share capital -8 12 -4
Exercise of options and employee transactions 3 207 210 210
Equity-based compensation 5 828 833 833
Shares delivered to Alcon employees
as a result of the Alcon spin-off 18 18 18
Taxes on treasury share transactions 4.4 -189 -189 -189
Decrease of treasury share repurchase obligation
under a share buyback trading plan 4.1 284 284 284
Transaction costs, net of taxes 4.5 -253 -253 -253
Changes in non-controlling interests -1 -1
Fair value adjustments on financial assets sold 95 -95
Fair value adjustments related to divestments -3 3
Impact of change in ownership of consolidated entities -3 -3 -2 -5
Other movements 4.2 22 22 22
Total of other equity movements -8 -11 -34 557 -92 -34 668 -3 -34 671
Total equity at December 31, 2019 936 -80 59 275 -4 657 55 474 77 55 551

31
Consolidated statements of cash flows Fourth quarter (unaudited)
(USD millions) Note Q4 2020 Q4 2019
Net income from continuing operations 2 099 1 129
Adjustments to reconcile net income from continuing operations to net cash flows
from operating activities from continuing operations
Reversal of non-cash items and other adjustments 6.1 1 997 2 750
Dividends received from associated companies and others 1 0
Interest received 5 42
Interest paid -221 -253
Other financial receipts 176 -33
Other financial payments -11 -8
Taxes paid 6.2 -618 -681
Net cash flows from operating activities from continuing operations before working capital
and provision changes 3 428 2 946
Payments out of provisions and other net cash movements in non-current liabilities -645 -262
Change in net current assets and other operating cash flow items 1 222 856
Net cash flows from operating activities from continuing operations 4 005 3 540
Total net cash flows from operating activities 4 005 3 540
Purchases of property, plant and equipment -521 -461
Proceeds from sale of property, plant and equipment 82 48
Purchases of intangible assets -502 -175
Proceeds from sale of intangible assets 176 552
Purchases of financial assets -105 -79
Proceeds from sale of financial assets 256 410
Purchases of other non-current assets -7 -26
Proceeds from sale of other non-current assets 2 -1
Acquisitions and divestments of interests in associated companies, net -1 -2
Acquisitions and divestments of businesses, net 6.3 54 82
Purchases of marketable securities and commodities -55 -39
Proceeds from sale of marketable securities and commodities 52 66
Net cash flows used in/from investing activities from continuing operations -569 375
Net cash flows used in investing activities from discontinued operations 10 -2 -57
Total net cash flows used in/from investing activities -571 318
Acquisitions of treasury shares -1 768 -3
Proceeds from exercised options and other treasury share transactions, net -98 -4
Repayments of non-current financial debts -1 -1
Change in current financial debts -935 -1 063
Payments of lease liabilities, net -95 -90
Impact of change in ownership of consolidated entities -2 0
Other financing cash flows, net -24 -20
Net cash flows used in financing activities from continuing operations -2 923 -1 181
Net cash flows used in financing activities from discontinued operations 10 -13 -22
Total net cash flows used in financing activities -2 936 -1 203
Net change in cash and cash equivalents before effect of exchange rate changes 498 2 655
Effect of exchange rate changes on cash and cash equivalents 166 79
Total net change in cash and cash equivalents 664 2 734
Cash and cash equivalents at October 1 8 994 8 378
Cash and cash equivalents at December 31 9 658 11 112

32
Consolidated statements of cash flows Full year (audited)
(USD millions) Note FY 2020 FY 2019
Net income from continuing operations 8 071 7 147
Adjustments to reconcile net income from continuing operations to net cash flows
from operating activities from continuing operations
Reversal of non-cash items and other adjustments 6.1 9 881 9 122
Dividends received from associated companies and others 490 463
Interest received 47 214
Interest paid -703 -793
Other financial receipts 464 28
Other financial payments -39 -33
Taxes paid 6.2 -1 833 -1 876
Net cash flows from operating activities from continuing operations before working capital
and provision changes 16 378 14 272
Payments out of provisions and other net cash movements in non-current liabilities -2 437 -924
Change in net current assets and other operating cash flow items -291 199
Net cash flows from operating activities from continuing operations 13 650 13 547
Net cash flows from operating activities from discontinued operations 78
Total net cash flows from operating activities 13 650 13 625
Purchases of property, plant and equipment -1 275 -1 379
Proceeds from sale of property, plant and equipment 88 857
Purchases of intangible assets -1 310 -878
Proceeds from sale of intangible assets 380 973
Purchases of financial assets -230 -302
Proceeds from sale of financial assets 723 1 152
Purchases of other non-current assets -61 -60
Proceeds from sale of other non-current assets 2 3
Acquisitions and divestments of interests in associated companies, net -7 -6
Acquisitions and divestments of businesses, net 6.3 -9 957 -3 760
Purchases of marketable securities and commodities -1 900 -228
Proceeds from sale of marketable securities and commodities 492 2 561
Net cash flows used in investing activities from continuing operations -13 055 -1 067
Net cash flows used in investing activities from discontinued operations 10 -127 -1 159
Total net cash flows used in investing activities -13 182 -2 226
Dividends paid to shareholders of Novartis AG -6 987 -6 645
Acquisitions of treasury shares -2 842 -5 533
Proceeds from exercised options and other treasury share transactions, net 748 201
Increase in non-current financial debts 7 126 93
Repayments of non-current financial debts -2 003 -3 195
Change in current financial debts 2 261 -1 582
Payments of lease liabilities, net -312 -273
Impact of change in ownership of consolidated entities -2 -6
Other financing cash flows, net -147 56
Net cash flows used in financing activities from continuing operations -2 158 -16 884
Net cash flows used in/from financing activities from discontinued operations 10 -50 3 257
Total net cash flows used in financing activities -2 208 -13 627
Net change in cash and cash equivalents before effect of exchange rate changes -1 740 -2 228
Effect of exchange rate changes on cash and cash equivalents 286 69
Total net change in cash and cash equivalents -1 454 -2 159
Cash and cash equivalents at January 1 11 112 13 271
Cash and cash equivalents at December 31 9 658 11 112

33
Notes to the Condensed Consolidated Financial Statements for the three-month interim period (unaudited) and year ended December 31, 2020 (audited) 1. Basis of preparationThese Condensed Consolidated Financial Statements for the three-month interim period and year ended December 31, 2020, were prepared in accordance with
International Accounting Standard 34 Interim Financial Reporting and accounting policies set out in the 2020 Annual Report published on January 26, 2021.
2. Selected critical accounting policiesThe Group’s principal accounting policies are set out in Note 1 to the Consolidated Financial Statements in the 2020 Annual Report and conform with International Financial Reporting Standards (IFRS) as issued by the International Accounting Standards Board.
The preparation of financial statements requires management to make certain estimates and assump-tions, either at the balance sheet date or during the year, which affect the reported amounts of revenues, expenses, assets, liabilities and contingent amounts.
Estimates are based on historical experience and other assumptions that are considered reasonable under the given circumstances and are continually monitored. Actual outcomes and results could differ from those esti-mates and assumptions. Revisions to estimates are rec-ognized in the period in which the estimate is revised.
As disclosed in the 2020 Annual Report, goodwill, and acquired In-Process Research & Development proj-ects are reviewed for impairment at least annually and these, as well as all other investments in intangible assets, are reviewed for impairment whenever an event or decision occurs that raises concern about their bal-ance sheet carrying value. The amount of goodwill and other intangible assets on the Group’s consolidated bal-ance sheet has risen significantly in recent years, pri-marily from acquisitions. Impairment testing may lead to potentially significant impairment charges in the future that could have a materially adverse impact on the Group’s results of operations and financial condition.
Non-current assets held for sale or held for distribution to ownersNon-current assets are accounted for as assets held for sale or related to discontinued operations when their carrying amount is to be recovered principally through a sale transaction or distribution to owners and a sale or
distribution to owners is considered highly probable. They are stated at the lower of carrying amount and fair value less costs to sell with any resulting impairment rec-ognized. Assets related to discontinued operations and assets of a disposal group held for sale are not depre-ciated or amortized. The prior year consolidated balance sheet is not restated.
If in a subsequent period, the criteria for classifica-tion as held for sale are no longer met, the recoverable amount of assets and liabilities are reclassified out of assets held for sale into the respective balance sheet lines, the prior year consolidated balance sheet is not restated. The cumulative amount of depreciation and amortization not recorded since the date of their classi-fication to assets held for sale, and any required adjust-ments to the recoverable amounts of assets are recog-nized in the consolidated income statement.
Distribution of Alcon Inc. to Novartis AG shareholdersDuring the first quarter of 2019, at the Annual General Meeting (AGM) of Novartis AG shareholders, held on February 28, 2019, the Novartis AG shareholders approved a special distribution by way of a dividend in kind to effect the spin-off of Alcon Inc.
The February 28, 2019, shareholder approval for the spin-off required the Alcon Division and selected por-tions of corporate activities attributable to Alcon’s busi-ness (the “Alcon business”) to be reported as discontin-ued operations.
The shareholder approval to spin off the Alcon busi-ness also required the recognition of a distribution liabil-ity at the fair value of the Alcon business. The Group elected to measure the distribution liability at the fair value of the Alcon business net assets taken as a whole. The distribution liability was recognized through a

34
reduction in retained earnings. It was required to be adjusted at each balance sheet date for changes in its estimated fair value, up to the date of the distribution to shareholders through retained earnings. Any resulting impairment of the business assets to be distributed would have been recognized in the consolidated income statements in “Other expense” of discontinued opera-tions, at the date of initial recognition of the distribution liability or at subsequent dates resulting from changes of the distribution liability valuation. At the April 8, 2019 distribution settlement date, the resulting gain, which was measured as the excess amount of the distribution lia-bility over the then-carrying value of the net assets of the business distributed, was recognized on the line “Gain on distribution of Alcon Inc. to Novartis AG share-holders” in the income statement of discontinued oper-ations.
The recognition of the distribution liability required the use of valuation techniques for the purposes of the impairment testing of the Alcon business’ assets to be distributed and for the measurement of the fair value of the distribution liability. These valuations required the use of management assumptions and estimates related to the Alcon business’ future cash flows, market multi-ples to estimate day one market value, and control pre-miums to apply in estimating the Alcon business, fair value. These fair value measurements were classified as “Level 3” in the fair value hierarchy. The section “—Impair-ment of goodwill and intangible assets” in Note 1 to the Consolidated Financial Statements of the 2020 Annual Report provides additional information on key assump-tions that are highly sensitive in the estimation of fair val-ues using valuation techniques.
Transaction costs that were directly attributable to the distribution (spin-off) of Alcon to the Novartis share-holders, and that would otherwise have been avoided, were recorded as a deduction from equity.
For additional disclosures, refer to Notes 3 and 10.
New IFRS standard effective as of January 1, 2020The following amended IFRS standard has been adopted by Novartis from January 1, 2020:
IFRS 3 Business Combination amendmentsThe IASB issued amendments to IFRS 3 Business Com-binations that revised the definition of a business, which assists entities with the evaluation of when an asset or group of assets acquired should be considered a busi-ness. This amended standard has been applied to trans-actions entered into on or after January 1, 2020. The amended standard allows an entity to apply an optional concentration test, on a transaction-by-transaction basis, to evaluate whether substantially all of the fair value of the gross assets acquired is concentrated in a single identifiable asset or group of similar identifiable assets. If this optional concentration test is met, the set of activities and assets is determined not to be a busi-ness. The adoption of this amended standard on Janu-ary 1, 2020 did not have a significant impact on our con-solidated financial statements and is not expected to have a significant impact in future periods. However, this will depend on the facts and circumstances of future transactions and if the Group decides to apply the optional concentration test in the assessment of whether an acquired set of activities and assets is, or is not a busi-ness.
There are no other new or amended IFRS standards or interpretations not yet effective that would be expected to have a material impact on the Group.
3. Significant transactionsSignificant transactions in 2020
The Group applied the acquisition method of account-ing for businesses acquired, and did not elect to apply the optional concentration test to account for acquired business as an asset separately acquired.
Innovative Medicines – acquisition of The Medicines CompanyOn November 23, 2019, Novartis entered into an agree-ment and plan of merger (the Merger Agreement) with The Medicines Company, a US-based pharmaceutical company headquartered in Parsippany, New Jersey USA. Pursuant to the Merger Agreement, on December 5, 2019, Novartis, through a subsidiary, commenced a ten-der offer to acquire all outstanding shares of The Medicines Company for USD 85 per share, or a total con-sideration of approximately USD 9.6 billion in cash on a
fully diluted basis, including the equivalent share value related to The Medicines Company’s convertible notes, in accordance with their terms. The tender offer expired on January 3, 2020, and on January 6, 2020, the acquir-ing subsidiary merged with and into The Medicines Com-pany, resulting in The Medicines Company becoming an indirect wholly owned subsidiary of Novartis. Novartis financed the transaction through available cash, and short- and long-term borrowings.
The Medicines Company is focused on the develop-ment of inclisiran, a potentially first-in-class, twice yearly therapy that allows administration during patients’ rou-tine visits to their healthcare professionals and will poten-tially contribute to improved patient adherence and sus-tained lower LDL-C levels.
The fair value of the total purchase consideration was USD 9.6 billion. The purchase price allocation resulted in net identifiable assets of approximately USD 7.1 billion,

35
consisting of USD 8.5 billion intangible assets, USD 1.4 billion net deferred tax liabilities and goodwill of approx-imately USD 2.5 billion.
Results of operations since the date of acquisition were not material.
Sandoz – acquisition of the Japanese business of Aspen Global Incorporated On November 11, 2019, Sandoz entered into an agree-ment for the acquisition of the Japanese business of Aspen Global Incorporated (AGI), a wholly owned sub-sidiary of Aspen Pharmacare Holdings Limited. Under the agreement, Sandoz acquired the shares in Aspen Japan K.K. and associated assets held by AGI. The trans-action closed on January 31, 2020.
Aspen’s portfolio in Japan consists of off-patent medicines with a focus on anesthetics and specialty brands. The acquisition will enable Sandoz to expand its presence in the third-largest worldwide generics mar-ketplace.
The purchase price consist of EUR 274 million (USD 303 million) upfront payment, less customary purchase price adjustment of EUR 27 million (USD 30 million), plus potential milestone payments of up to EUR 70 million (USD 77 million), which AGI is eligible to receive upon the achievement of specified milestones.
The fair value of the total purchase consideration was EUR 294 million (USD 324 million). The amount consisted of a cash payment of EUR 247 million (USD 273 million) and the fair value of contingent consideration of EUR 47 million (USD 51 million), which AGI is eligible to receive upon the achievement of specified milestones. The pur-chase price allocation resulted in net identifiable assets of USD 238 million, consisting of USD 196 million intan-gible assets, USD 26 million other net assets, USD 16 million net deferred tax assets. Goodwill amounted to USD 86 million. Results of operations since the date of acquisition were not material.
Sandoz – retention of US dermatology business and generic US oral solids portfolio, previously planned to be divestedOn September 6, 2018, Novartis announced that it entered into a stock and asset purchase agreement (SAPA) with Aurobindo Pharma USA Inc. (Aurobindo) for the sale of selected portions of its Sandoz US portfolio, specifically the Sandoz US dermatology business and generic US oral solids portfolio, for USD 0.8 billion in cash and potential earnouts. The closing was conditional on obtaining regulatory approval.
In March 2020, Novartis took the decision to retain the Sandoz US generic oral solids and dermatology busi-nesses and on April 2, 2020 entered into a mutual agree-ment with Aurobindo to terminate the transaction. The decision was taken as approval from the US Federal Trade Commission for the transaction was not obtained within the agreed timelines.
The cumulative amount of the depreciation on prop-erty, plant and equipment (USD 38 million) and amorti-zation on intangible assets (USD 102 million), not recorded
in the consolidated income statement since the date of classification as held for sale was recognized in the con-solidated income statement in the first quarter of 2020. In addition, an impairment of currently marketed prod-ucts of USD 42 million was recognized in the first quar-ter of 2020 consolidated income statement.
As at March 31, 2020, the assets and liabilities of the Sandoz US generic oral solids and dermatology busi-nesses were reclassified out of assets and liabilities of disposal group held for sale. The prior year balance sheet is not required to be restated.
In the Group’s consolidated balance sheet at Decem-ber 31, 2019, the assets and liabilities classified as dis-posal group assets and liabilities held for sale consisted of the following:
December 31,
(USD millions) 2019
Assets of disposal group classified as held for sale
Property, plant and equipment 169
Intangible assets other than goodwill 475
Deferred tax assets 11
Other non-current assets 2
Inventories 181
Other current assets 3
Total 841
Liabilities of disposal group classified as held for sale
Deferred tax liabilities 2
Provisions and other non-current
liabilities 4
Provisions and other current liabilities 25
Total 31
There are no cumulative income or expenses included in other comprehensive income relating to the disposal group.
Significant transactions in 2019
Completion of the spin-off of the Alcon business through a dividend in kind distribution to Novartis AG shareholdersOn June 29, 2018, Novartis announced its intention to seek shareholder approval for the spin-off of the Alcon business into a separately traded standalone company, following the complete structural separation of the Alcon business into a standalone company (the Alcon business or Alcon Inc.).
The Novartis AG shareholders approved the spin-off of the Alcon business at the 2019 Annual General Meet-ing held on February 28, 2019, subject to completion of certain conditions precedent to the distribution. Upon shareholder approval, the Alcon business was reported as discontinued operations, and the fair value of the Alcon business exceeded the carrying value of its net assets.
The conditions precedent to the spin-off were met and on April 8, 2019 the spin-off of the Alcon business

36
was effected by way of a distribution of a dividend in kind of Alcon Inc. shares to Novartis AG shareholders and ADR (American Depositary Receipt) holders (the Distri-bution), which amounted to USD 23.4 billion and is rec-ognized as a reduction to retained earnings. Through the Distribution, each Novartis AG shareholder received one Alcon Inc. share for every five Novartis AG shares/ADRs they held on April 8, 2019, close of business. As of April 9, 2019, the shares of Alcon Inc. are listed on the SIX Swiss Exchange (SIX) and on the New York Stock Exchange (NYSE) under the symbol “ALC.”
The dividend in kind distribution liability to effect the spin-off of the Alcon business (the distribution liability) amounted to USD 26.4 billion at March 31, 2019, unchanged from its initial recognition on February 28, 2019, and was in excess of the carrying value of the Alcon business net assets as of February 28, 2019, and as of March 31, 2019. The net assets of the Alcon business amounted to USD 23.1 billion as at March 31, 2019.
On March 6, 2019, Alcon entered into financing arrangements with a syndicate of banks under which it borrowed on April 2, 2019, a total amount of USD 3.2 bil-lion. These borrowings consisted of approximately USD 2.8 billion and the equivalent of USD 0.4 billion in EUR in bridge and other term loans under such Alcon facilities agreement. In addition, approximately USD 0.3 billion of borrowings under a number of local bilateral facilities in different countries, with the largest share of borrowings in Japan, were raised. This resulted in a total gross debt of USD 3.5 billion. These outstanding borrowings of the Alcon legal entities were recorded in the balance sheet and financing cash flow from discontinued operations. Prior to the spin-off, through a series of intercompany transactions, Alcon legal entities paid approximately USD 3.1 billion in cash to Novartis and its affiliates.
At the April 8, 2019 Distribution, the fair value of the distribution liability of the Alcon business amounted to USD 23.4 billion, a decrease of USD 3.0 billion from March 31, 2019. As mentioned above, prior to the spin-off, through a series of intercompany transactions, Alcon legal entities incurred additional net financial debt and paid approximately USD 3.1 billion in cash to Novartis and its affiliates. This additional net debt and transactions resulted in a decrease in Alcon’s net assets to USD 20.0 billion at the date of the Distribution of the dividend in kind to Novartis AG shareholders on April 8, 2019. The distribution liability at April 8, 2019, remained in excess of the then-carrying value of the Alcon business net assets.
Certain consolidated foundations own Novartis AG dividend-bearing shares restricting their availability for use by the Group. These Novartis AG shares are accounted for as treasury shares. Through the Distribu-tion, these foundations received Alcon Inc. shares rep-resenting an approximate 4.7% equity interest in Alcon Inc. Upon the loss of control of Alcon Inc. through the Distribution, the financial investment in Alcon Inc. was recognized at its fair value based on the opening traded share price of Alcon Inc. on April 9, 2019 (a Level 1 hier-archy valuation). At initial recognition, its fair value of USD 1.3 billion was reported on the Group’s consolidated bal-ance sheet as a financial asset. Management has des-ignated this investment at fair value through other com-prehensive income.
The total non-taxable, non-cash gain recognized at the distribution date of the spin-off of the Alcon business amounted to USD 4.7 billion consisting of:
April 8,
(USD millions) 2019
Net assets derecognized -20 025
Derecognition of distribution liability 23 434
Difference between net assets and distribution liability 3 409
Recognition of Alcon Inc. shares obtained
through consolidated foundations 1 273
Currency translation gains recycled into the
consolidated income statement 123
Transaction costs recognized in the
consolidated income statement -114
Gain on distribution of Alcon Inc. to
Novartis AG shareholders 4 691
For additional disclosure on discontinued operations, refer to Note 10.
Innovative Medicines – acquisition of IFM Tre, Inc. On May 7, 2019, Novartis acquired IFM Tre, Inc., a pri-vately held, US-based biopharmaceutical company focused on developing anti-inflammatory medicines tar-geting the NLRP3 inflammasome. The acquisition gives Novartis full rights to IFM Tre, Inc.’s portfolio of NLRP3 antagonists. The NLRP3 antagonists portfolio consists of one clinical program and two preclinical programs: IFM-2427, a first-in-class, clinical-stage systemic antag-onist for an array of chronic inflammatory disorders, including atherosclerosis and nonalcoholic steatohepa-titis (NASH); a preclinical-stage gut-directed molecule for the treatment of inflammatory bowel disease; and a preclinical-stage central nervous system (CNS)-pene-trant molecule.
The previously held interest of 9% was adjusted to its fair value of USD 33 million through the consolidated income statement at acquisition date. This remeasurement resulted in a gain of USD 14 million. The fair value of the total purchase consideration for acquiring the 91% stake Novartis did not already own amounted to USD 361 million. The amount consisted of an initial cash payment of USD 285 million, and the fair value of the contingent consider-ation of USD 76 million due to the IFM Tre, Inc. sharehold-ers, which they are eligible to receive upon the achieve-ment of specified development and commercialization milestones. The purchase price allocation resulted in net identifiable assets of USD 355 million, mainly intangible assets, and goodwill of USD 39 million. The 2019 results of operations since the date of acquisition were not mate-rial.
Innovative Medicines – acquisition of XiidraOn May 8, 2019, Novartis entered into an agreement with Takeda Pharmaceutical Company Limited (Takeda) to acquire the assets associated with Xiidra (lifitegrast oph-thalmic solution) 5% worldwide. Xiidra is the first and only prescription treatment approved to treat both signs and symptoms of dry eye by inhibiting inflammation caused by the disease. The transaction bolsters the Novartis front-of-the-eye portfolio and ophthalmic leadership. The transaction closed on July 1, 2019. The purchase

37
price consists of a USD 3.4 billion upfront payment, cus-tomary purchase price adjustments of USD 0.1 billion, and the potential milestone payments of up to USD 1.9 billion, which Takeda is eligible to receive upon the achievement of specified commercialization milestones.
The fair value of the total purchase consideration was USD 3.7 billion. The amount consists of an initial cash payment of USD 3.5 billion, and the fair value of the con-tingent consideration of USD 0.2 billion, which Takeda is eligible to receive upon the achievement of specified commercialization milestones.
The purchase price allocation resulted in net identi-fiable assets of approximately USD 3.6 billion, consist-ing mainly of intangible assets of USD 3.6 billion, and goodwill amounted to approximately USD 0.1 billion. In 2019, from the date of acquisition, the business gener-ated net sales of USD 0.2 billion. Management estimated that net sales for the entire year of 2019 would have amounted to USD 0.3 billion, had the business been acquired at the beginning of the 2019 reporting period. The 2019 results of operations since the date of acqui-sition were not material.
4. Summary of equity attributable to Novartis AG shareholders
Number of outstanding shares Issued share capital and (in millions) reserves attributable to Novartis AG shareholders (in USD millions)
Note 2020 2019 FY 2020 FY 2019
Balance at beginning of year 2 265.0 2 311.2 55 474 78 614
Impact of change in accounting policy 4.3 3
Restated equity at January 1 55 474 78 617
Shares acquired to be canceled -32.6 -60.3 -2 897 -5 351
Other share purchases -1.7 -1.7 -159 -160
Exercise of options and employee transactions 14.7 5.5 806 210
Repurchase of options -89
Equity-based compensation 11.0 9.4 730 833
Shares delivered to Alcon employees as a result of the Alcon spin-off 0.4 0.9 30 18
Taxes on treasury share transactions 4.4 32 -189
(Increase)/Decrease of treasury share repurchase obligation
under a share buyback trading plan 4.1 -1 769 284
Dividends -6 987 -6 645
Dividend in kind to effect the spin-off of Alcon Inc. -23 434
Net income of the period attributable to shareholders of Novartis AG 8 072 11 732
Other comprehensive income attributable to shareholders of Novartis AG 3 331 -207
Transaction costs, net of taxes 4.5 -253
Impact of change in ownership of consolidated entities 6 -3
Other movements 4.2 18 22
Balance at December 31 2 256.8 2 265.0 56 598 55 474
4.1. In November 2020, Novartis entered into an irrevo-cable, non-discretionary arrangement with a bank to repurchase Novartis shares on the second trading line under its up-to USD 2.5 billion share buyback. Novartis is able to cancel this arrangement at any time but could be subject to a 90-day waiting period. The commitment under this arrangement therefore reflects the obligated purchases by the bank under such trading plan over a rolling 90-day period, or if shorter, until the maturity date of such trading plan.
The commitment under this arrangement amounted to USD 1.8 billion as of December 31, 2020.
In August 2020, Novartis entered into an irrevocable, non-discretionary arrangement with a bank to repur-chase Novartis shares to mitigate dilution related to par-ticipation plans of associates. Novartis was able to can-cel this arrangement at any time but would have been subjected to a 90-day waiting period.
This trading plan commitment was fully executed and expired, and as a consequence, there is no contingent liability related to this plan recognized as of December 31, 2020.
In 2019, Novartis entered into a similar irrevocable, non-discretionary arrangement with a bank to repur-chase Novartis shares on the second trading line under

38
its up-to USD 5 billion share buyback and to repurchase Novartis shares to mitigate dilution related to participa-tion plans of associates. The commitment under this arrangement therefore reflects the obligated purchases by the bank under such trading plan over a rolling 90-day period, or if shorter, until the maturity date of such trad-ing plan.
The trading plan commitment was fully executed and expired, and as a consequence, there is no contingent liability related to this plan recognized as of December 31, 2019.
4.2. Other movements includes, for subsidiaries in hyper-inflationary economies, the impact of the restatement of the non-monetary assets and liabilities with the general price index at the beginning of the period as well as the restatement of the equity balances of the current year.
4.3. In 2019, the impact of change in accounting policy includes USD 3 million related to the implementation of IFRS 16 Leases.
4.4. Included in 2019 is a USD 69 million impact related to the revaluation of the deferred tax liability on treasury shares that are recognized through retained earnings. This revaluation resulted from the Swiss Federal tax reform enacted in May 2019, effective January 1, 2020.
4.5. In 2019, transaction costs that were directly attrib-utable to the distribution (spin-off) of Alcon Inc. to Novartis shareholders that would otherwise have been avoided, were recorded as a deduction from equity.
5. Financial instruments Fair value by hierarchy
The following table illustrates the three hierarchical levels for valuing financial instruments at fair value as of Decem-ber 31, 2020 and December 31, 2019. For additional information on the hierarchies and other matters, please refer to the Consolidated Financial Statements in the 2020 Annual Report, published on January 26, 2021.
Level 1 Level 2 Level 3 Total
Dec 31, Dec 31, Dec 31, Dec 31, Dec 31, Dec 31, Dec 31, Dec 31,
(USD millions) 2020 2019 2020 2019 2020 2019 2020 2019
Marketable securities
Debt securities 26 24 26 24
Fund investments 37 37
Total marketable securities 37 26 24 26 61
Derivative financial instruments 159 102 159 102
Total marketable securities and derivative
financial instruments 37 185 126 185 163
Long-term financial investments
Debt and equity securities 1 153 976 460 581 1 613 1 557
Fund investments 366 233 366 233
Contingent consideration receivables 625 399 625 399
Total long-term financial investments 1 153 976 1 451 1 213 2 604 2 189
Associated companies at fair value through profit or loss 211 186 211 186
Contingent consideration payables -1 046 -1 036 -1 046 -1 036
Other financial liabilities -23 -29 -23 -29
Derivative financial instruments -194 -185 -194 -185
Total financial liabilities at fair value -194 -185 -1 069 -1 065 -1 263 -1 250
During 2020, there were no significant transfers from one level to the other and no significant transactions associated with level 3 financial instruments. During the fourth quarter of 2020, there was one non-significant
transfer of equity securities from level 3 to level 1 for USD 29 million due to Initial Public Offerings.
The fair value of straight bonds amounted to USD 31.4 billion at December 31, 2020 (USD 23.7 billion at

39
December 31, 2019) compared to the balance sheet value of USD 28.3 billion at December 31, 2020 (USD 22.2 billion at December 31, 2019). For all other financial assets and liabilities, the carrying amount is a reason-able approximation of the fair value. The carrying amount of financial assets included in the line total long-term financial investments of USD 2.6 billion at December 31, 2020 (USD 2.2 billion at December 31, 2019) is included in line “Financial and other non-current assets” of the consolidated balance sheets.
In 2020, in accordance with the consolidated foun-dations, Alcon Inc. share divestment plans, Alcon Inc.
shares with a fair value of USD 331 million (2019: USD 976 million) were sold, or otherwise disposed of, and the USD 13 million gain on disposal (2019: USD 62 million gain on disposal) was transferred from other compre-hensive income to retained earnings (fourth quarter of 2020: fair value of USD 44 million and loss on disposal of USD 3 million; fourth quarter of 2019: fair value of USD 320 million and gain on disposal of USD 14 million).
The Group’s exposure to financial risks has not changed significantly during the period and there have been no major changes to the risk management depart-ment or in any risk management policies.
Non-current financial debt – issuance of bonds
Novartis issued the following straight bonds during 2020:
Carrying value
Nominal amount Dec 31, 2020
Coupon Currency (millions) Maturity year Issuer Issue price (USD millions)
1.75% USD 1 000 2025 Novartis Capital Corporation, New York, United States 99.852% 996
2.00% USD 1 250 2027 Novartis Capital Corporation, New York, United States 99.909% 1 245
2.20% USD 1 500 2030 Novartis Capital Corporation, New York, United States 99.869% 1 493
2.75% USD 1 250 2050 Novartis Capital Corporation, New York, United States 97.712% 1 213
0.00% 1 EUR 1 850 2028 Novartis Finance S.A., Luxembourg, Luxembourg 99.354% 2 255
1 The EUR 1 850 million bond issued in 2020 features a coupon step-up of 0.25% commencing with the first interest payment date after December 31, 2025, if one or both of the 2025
Patient Access Targets are not met. These 2025 Patient Access Targets are the 2025 Flagship Programs Patient Reach Target and the 2025 Strategic Innovative Therapies Patient Reach Target, as defined in the bond prospectus. As of December 31, 2020, there is no indication that these 2025 Patient Access Targets will not be met.
6. Details to the consolidated statements of cash flows 6.1. Reversal of non-cash items and other adjustments from continuing operations
(USD millions) Q4 2020 Q4 2019
Depreciation, amortization and impairments on:
Property, plant and equipment 353 382
Right-of-use assets 94 78
Intangible assets 1 170 1 477
Financial assets 1 -69 11
Change in provisions and other non-current liabilities 75 471
Gains on disposal and other adjustments on property, plant and equipment; intangible assets;
financial assets; and other non-current assets, net -330 -533
Equity-settled compensation expense 159 170
Income from associated companies -141 -150
Taxes 460 630
Net financial expense 226 214
Total 1 997 2 750
1 Includes fair value adjustments

40
(USD millions) FY 2020 FY 2019
Depreciation, amortization and impairments on:
Property, plant and equipment 1 758 1 547
Right-of-use assets 330 305
Intangible assets 4 376 3 974
Financial assets 1 -335 -38
Change in provisions and other non-current liabilities 1 411 1 871
Gains on disposal and other adjustments on property, plant and equipment; intangible assets;
financial assets; and other non-current assets, net -478 -1 234
Equity-settled compensation expense 738 758
Income from associated companies -673 -659
Taxes 1 807 1 793
Net financial expense 947 805
Total 9 881 9 122
1 Includes fair value adjustments
6.2. Total amount of taxes paid
In 2020, the total amount of taxes paid was USD 1.9 bil-lion (Q4 2020: USD 618 million), of which USD 1.8 billion (Q4 2020: USD 618 million) was included within “Net cash flows from operating activities from continuing operations”, and USD 88 million (Q4 2020: nil) was included within “Net cash flows used in investing activi-ties from discontinued operations.”
In 2019, the total amount of taxes paid was USD 2.0 billion (Q4 2019: USD 760 million), of which USD 1.9
billion (Q4 2019: USD 681 million) was included within “Net cash flows from operating activities from continu-ing operations,” USD 38 million (Q4 2019: nil) was included within “Net cash flows from operating activities from discontinued operations,” and USD 79 million (Q4 2019: USD 79 million) was included within “Net cash flows used in investing activities from discontinued oper-ations.”
6.3. Cash flows arising from acquisitions and divestments of businesses, net
The following is a summary of the cash flow impact of acquisitions and divestments of businesses. The most sig-nificant transactions are described in Note 3.
(USD millions) Q4 2020 Q4 2019 FY 2020 FY 2019
Net assets recognized as a result of acquisitions of businesses -10 173 -4 124
Fair value of previously held equity interests 1 7 33
Contingent consideration payable, net 98 242
Payments, deferred consideration and other adjustments, net 26 1 62 -2
Cash flows from/used for acquisitions of businesses 27 1 -10 006 -3 851
Cash flows from divestments of businesses, net 1 27 81 49 91
Cash flows from/used for acquisitions and divestments of businesses, net 54 82 -9 957 -3 760
1 In 2020, USD 49 million (Q4 2020: USD 27 million) represented the net cash inflows from divestments in previous years. In 2019, the USD 91 million (Q4 2019: USD 81 million) included USD 4 million (Q4 2019: USD 15 million net cash inflows) net cash outflows from divestments in previous years, and USD 95 million (Q4 2019: USD 66 million) net cash inflows from business divestments in 2019. The net identifiable assets of the 2019 divested businesses amounted to USD 196 million (Q4 2019: USD 133 million), comprised of non-current asset of USD 159 million (Q4 2019: USD 94 million); current assets of USD 96 million, including USD 11 million cash and cash equivalents (Q4 2019: USD 87 million, including USD 11 million cash and cash equivalents); non-current liabilities USD 18 million (Q4 2019: USD 11 million); and current liabilities of USD 41 million (Q4 2019: USD 37 million).
Notes 3 and 7 provide further information regarding acquisitions and divestments of businesses. All acquisitions were for cash.

41
7. Acquisition of businesses
Fair value of assets and liabilities arising from acquisitions of businesses:
(USD millions) FY 2020 FY 2019
Property, plant and equipment 26 44
Right-of-use assets 32
Currently marketed products 196 3 550
Acquired research and development 8 600 342
Other intangible assets 218 22
Deferred tax assets 476 60
Non-current financial and other assets 49 8
Inventories 84 195
Trade receivables and financial
and other current assets 109 4
Cash and cash equivalents 76
Deferred tax liabilities -1 977 -107
Current and non-current financial debts -32 -2
Current and non-current lease liabilities -44
Trade payables and other liabilities -144 -178
Net identifiable assets acquired 7 669 3 938
Acquired cash and cash equivalents -76
Goodwill 2 580 186
Net assets recognized as a
result of acquisitions of businesses 10 173 4 124
Note 3 details significant acquisitions of businesses, spe-cifically, The Medicines Company and the Japanese business of AGI in 2020, Xiidra and IFM Tre, Inc. in 2019. The goodwill arising out of these acquisitions is
attributable to buyer specific synergies, the assembled workforce, and the accounting for deferred tax liabilities on the acquired assets. Goodwill of USD 74 million in 2020 (2019: USD 98 million) is tax deductible.
8. Legal proceedings update A number of Novartis companies are, and will likely con-tinue to be, subject to various legal proceedings, includ-ing litigations, arbitrations and governmental investiga-tions, that arise from time to time. Legal proceedings are inherently unpredictable. As a result, the Group may become subject to substantial liabilities that may not be covered by insurance and may in the future incur judg-ments or enter into settlements of claims that could have a material adverse effect on its results of operations or cash flow. Note 20 to the Consolidated Financial State-ments in our 2019 Annual Report and 2019 Form 20-F contains a summary as of the date of these reports of significant legal proceedings to which Novartis or its sub-sidiaries were a party. The following is a summary as of January 25, 2021 of significant developments in those proceedings, as well as any new significant proceedings commenced since the date of the 2019 Annual Report and 2019 Form 20-F.
Investigations and related litigations
Government generic pricing antitrust investigations, antitrust class actionsSince 2016, Sandoz Inc. received a grand jury subpoena and a civil investigative demand and interrogatories from the Antitrust and Civil Divisions of the US Department of Justice (DOJ) in connection with alleged price fixing and market allocation of generic drugs in the US market as well as alleged False Claims Act violations. Sandoz Inc. reached a resolution with the DOJ Antitrust Division, pur-suant to which Sandoz Inc. agreed to pay USD 195 mil-lion and entered into a deferred prosecution agreement. The Sandoz resolution related to instances of miscon-duct at the company between 2013 and 2015 with regard to certain generic drugs sold in the United States. Under the terms of that agreement, Sandoz Inc. will continue to take steps to enhance its compliance program, employee training and monitoring, and will continue to cooperate with the US government’s ongoing investiga-tion into the generic pharmaceutical industry. Sandoz Inc. is also in negotiations with the DOJ Civil Division to

42
resolve potential related claims and has recorded a pro-vision of USD 187 million.
Southern District of New York (S.D.N.Y.) marketing practices investigation and litigationIn 2013, the US government filed a civil complaint in inter-vention to an individual qui tam action against Novartis Pharmaceuticals Corporation (NPC) in the United States District Court (USDC) for the S.D.N.Y. The complaint, as subsequently amended, asserted federal False Claims Act and common law claims with respect to speaker pro-grams and other promotional activities for certain NPC cardiovascular medications (Lotrel, Starlix and Valturna) allegedly serving as mechanisms to provide kickbacks to healthcare professionals (HCPs). Also in 2013, New York State filed a civil complaint in intervention assert-ing similar claims. In July 2020, Novartis finalized its set-tlement agreement with the S.D.N.Y, the New York State Attorney General and the individual relator to resolve their claims. As part of this settlement, Novartis agreed to pay USD 0.7 billion, and has agreed to new corporate integrity obligations with the Office of Inspector General of the US Department of Health & Human Services.
U.S. Government Foreign Corrupt Practices Act (FCPA) investigationsIn June 2020, Novartis reached settlements with the DOJ and the US Securities and Exchange Commission (SEC) resolving all Foreign Corrupt Practices Act (FCPA) inves-tigations into historical conduct by Novartis and its sub-sidiaries. These investigations were previously disclosed in Note 20 to the Consolidated Financial Statements in our 2019 Annual Report and 2019 Form 20-F under the headings “Greece investigation,” “South Korea investi-gation” and “Asia/Russia investigation.” As part of the coordinated resolution of these investigations, Novartis and certain of its current and former subsidiaries agreed to pay USD 0.3 billion. To resolve the DOJ investigation, Novartis Hellas S.A.C.I. entered into a deferred prosecu-tion agreement (“Novartis Hellas DPA”) pertaining to inappropriate economic benefits provided to Greek healthcare professionals from 2012 to 2015 in connec-tion with the ophthalmology product Lucentis. The Novartis Hellas DPA also covers books and records issues pertaining to the Lucentis conduct and to conduct related to a 2009 epidemiological study. The resolutions contain no allegations relating to any bribery of Greek politicians, which is consistent with what Novartis found in its own internal investigation. Alcon Pte Ltd, a former
Novartis subsidiary, has entered into a separate deferred prosecution agreement with the DOJ (“Alcon DPA”) per-taining to inappropriate economic benefits provided to Vietnamese healthcare professionals and books and records violations from 2011 to 2014 in Vietnam. This conduct related to a consultancy program run by a dis-tributor in Vietnam. To resolve the SEC investigation, Novartis AG reached an agreement pertaining to inter-nal controls and books and records violations in Greece, Vietnam and South Korea. The violations in Greece per-tain to the Lucentis-related conduct covered in the Novartis Hellas DPA as well as controls issues with Novartis Hellas post-approval studies identified by inter-nal review in 2012 and resolved by 2013. In Vietnam, the violations relate to the activities involving an Alcon dis-tributor that are the subject of the Alcon DPA. In South Korea, the violations relate to conduct for which Novartis has already taken responsibility in South Korea, where Novartis is in the final stages of resolving these issues with the local authorities. The SEC agreement also addresses certain internal controls and books and records issues related to Alcon China’s placement of surgical devices.
Lucentis/Avastin® mattersIn 2019, the French Competition Authority (FCA) issued a Statement of Objections against Novartis entities alleg-ing anti-competitive practices on the French market for anti-vascular endothelial growth factor treatments for neovascular age-related macular degeneration from 2008 to 2013. In September 2020, the FCA issued a decision finding that the Novartis entities had infringed competition law and imposing a fine of EUR 385 million (equivalent to approximately USD 452 million). Novartis has paid the fine and is appealing the FCA’s decision.
In addition to the matters described above, there have been other developments in the other legal matters described in Note 20 to the Consolidated Financial Statements contained in our 2019 Annual Report and 2019 Form 20-F.
Novartis believes that its total provisions for investi-gations, product liability, arbitration and other legal mat-ters are adequate based upon currently available infor-mation. However, given the inherent difficulties in estimating liabilities, there can be no assurance that addi-tional liabilities and costs will not be incurred beyond the amounts provided.
43
9. Segmentation of key figures
The businesses of Novartis are divided operationally on a worldwide basis into two identified reporting segments, Innovative Medicines and Sandoz. In addition, we sepa-rately report Corporate activities.
Reporting segments are presented in a manner con-sistent with the internal reporting to the chief operating decision maker which is the Executive Committee of Novartis. The reporting segments are managed sepa-rately because they each research, develop, manufac-ture, distribute and sell distinct products that require dif-fering marketing strategies.
The Executive Committee of Novartis is responsible for allocating resources and assessing the performance of the reporting segments.
The reporting segments are as follows:Innovative Medicines researches, develops, manu-
factures, distributes and sells patented prescription medicines. The Innovative Medicines Division is orga-nized into two global business units: Novartis Oncology and Novartis Pharmaceuticals. Novartis Oncology con-sists of the global business franchise Oncology, and Novartis Pharmaceuticals consists of the global business franchises Immunology, Hepatology and Dermatology; Ophthalmology; Neuroscience; Cardiovascular, Renal and Metabolism; Respiratory; and Established Medicines.
Sandoz develops, manufactures and markets finished dosage form medicines as well as intermediary products including active pharmaceutical ingredients. Sandoz is organized globally into three franchises: Retail Generics, Anti-Infectives and Biopharmaceuticals. In Retail Gener-ics, Sandoz develops, manufactures and markets active ingredients and finished dosage forms of small molecule pharmaceuticals to third parties across a broad range of therapeutic areas, as well as finished dosage form of
anti-infectives sold to third parties. In Anti-Infectives, Sandoz manufactures and supplies active pharmaceutical ingredients and intermediates, mainly antibiotics, for inter-nal use by Retail Generics and for sale to third-party cus-tomers. In Biopharmaceuticals, Sandoz develops, manu-factures and markets protein- or other biotechnology-based products, including biosimilars, and provides biotechnol-ogy manufacturing services to other companies.
Corporate includes the costs of the Group headquar-ters and those of corporate coordination functions in major countries, and items that are not specific to one segment.
Our divisions are supported by Novartis Institutes for BioMedical Research, Global Drug Development, Novartis Technical Operations and Novartis Business Services.
Further details are provided in Note 3 to the Consol-idated Financial Statements of the 2020 Annual Report.
Following the February 28, 2019, shareholders’ approval of the spin-off of the Alcon business, the Group reported its financial results as “continuing operations” and “discontinued operations” (refer to Notes 2, 3 and 10 for further details).
Continuing operations comprise the activities of Innovative Medicines and Sandoz Divisions and the con-tinuing Corporate activities.
Discontinued operations included in 2019 the oper-ational results from the Alcon eye care devices business and certain Corporate activities attributable to the Alcon business prior to the spin-off, the gain on distribution of Alcon Inc. to Novartis AG shareholders, and certain other expenses related to the Distribution (see Notes 2, 3 and 10).
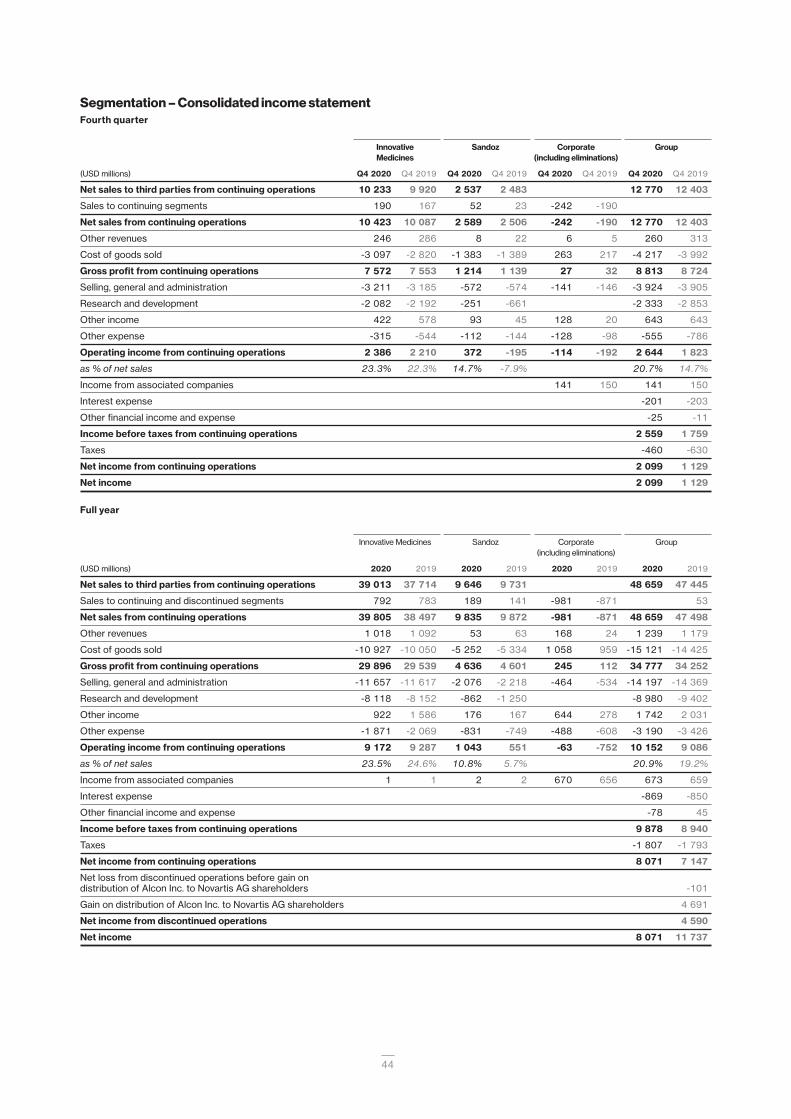
44
Segmentation – Consolidated income statement Fourth quarter
Innovative Sandoz Corporate Group Medicines (including eliminations)
(USD millions) Q4 2020 Q4 2019 Q4 2020 Q4 2019 Q4 2020 Q4 2019 Q4 2020 Q4 2019
Net sales to third parties from continuing operations 10 233 9 920 2 537 2 483 12 770 12 403
Sales to continuing segments 190 167 52 23 -242 -190
Net sales from continuing operations 10 423 10 087 2 589 2 506 -242 -190 12 770 12 403
Other revenues 246 286 8 22 6 5 260 313
Cost of goods sold -3 097 -2 820 -1 383 -1 389 263 217 -4 217 -3 992
Gross profit from continuing operations 7 572 7 553 1 214 1 139 27 32 8 813 8 724
Selling, general and administration -3 211 -3 185 -572 -574 -141 -146 -3 924 -3 905
Research and development -2 082 -2 192 -251 -661 -2 333 -2 853
Other income 422 578 93 45 128 20 643 643
Other expense -315 -544 -112 -144 -128 -98 -555 -786
Operating income from continuing operations 2 386 2 210 372 -195 -114 -192 2 644 1 823
as % of net sales 23.3% 22.3% 14.7% -7.9% 20.7% 14.7%
Income from associated companies 141 150 141 150
Interest expense -201 -203
Other financial income and expense -25 -11
Income before taxes from continuing operations 2 559 1 759
Taxes -460 -630
Net income from continuing operations 2 099 1 129
Net income 2 099 1 129
Full year
Innovative Medicines Sandoz Corporate Group (including eliminations)
(USD millions) 2020 2019 2020 2019 2020 2019 2020 2019
Net sales to third parties from continuing operations 39 013 37 714 9 646 9 731 48 659 47 445
Sales to continuing and discontinued segments 792 783 189 141 -981 -871 53
Net sales from continuing operations 39 805 38 497 9 835 9 872 -981 -871 48 659 47 498
Other revenues 1 018 1 092 53 63 168 24 1 239 1 179
Cost of goods sold -10 927 -10 050 -5 252 -5 334 1 058 959 -15 121 -14 425
Gross profit from continuing operations 29 896 29 539 4 636 4 601 245 112 34 777 34 252
Selling, general and administration -11 657 -11 617 -2 076 -2 218 -464 -534 -14 197 -14 369
Research and development -8 118 -8 152 -862 -1 250 -8 980 -9 402
Other income 922 1 586 176 167 644 278 1 742 2 031
Other expense -1 871 -2 069 -831 -749 -488 -608 -3 190 -3 426
Operating income from continuing operations 9 172 9 287 1 043 551 -63 -752 10 152 9 086
as % of net sales 23.5% 24.6% 10.8% 5.7% 20.9% 19.2%
Income from associated companies 1 1 2 2 670 656 673 659
Interest expense -869 -850
Other financial income and expense -78 45
Income before taxes from continuing operations 9 878 8 940
Taxes -1 807 -1 793
Net income from continuing operations 8 071 7 147
Net loss from discontinued operations before gain on
distribution of Alcon Inc. to Novartis AG shareholders -101
Gain on distribution of Alcon Inc. to Novartis AG shareholders 4 691
Net income from discontinued operations 4 590
Net income 8 071 11 737

45
Segmentation – Additional consolidated balance sheet and income statement disclosure
Innovative Sandoz Corporate Group Medicines (including eliminations)
Dec 31, Dec 31, Dec 31, Dec 31, Dec 31, Dec 31, Dec 31, Dec 31,
(USD millions) 2020 2019 2020 2019 2020 2019 2020 2019
Total assets 83 112 71 225 16 825 16 468 32 122 30 677 132 059 118 370
Total liabilities -15 472 -15 332 -3 786 -3 804 -56 135 -43 683 -75 393 -62 819
Total equity 56 666 55 551
Net debt 1 24 481 15 938 24 481 15 938
Net operating assets 67 640 55 893 13 039 12 664 468 2 932 81 147 71 489
Included in net operating assets are:
Property, plant and equipment 9 863 9 632 1 849 1 888 551 549 12 263 12 069
Goodwill 21 718 18 750 8 274 7 767 7 7 29 999 26 524
Intangible assets other than goodwill 35 121 27 586 1 543 1 125 145 76 36 809 28 787
1 See page 64 for additional disclosures related to net debt.
In the fourth quarter of 2020, net impairment charges for property, plant and equipment from continuing oper-ations amounted to USD 37 million (2019: USD 42 mil-lion) of which USD 33 million (2019: USD 15 million) in the Innovative Medicines Division and USD 4 million (2019: USD 27 million) in the Sandoz Division.
In 2020, net impairment charges for property, plant and equipment from continuing operations amounted to USD 440 million (2019: USD 202 million) of which USD 324 million (2019: USD 100 million) in the Innovative Medicines Division and USD 116 million (2019: USD 101 million) in the Sandoz Division. No impairment was recorded in Corporate in 2020 (2019: USD 1 million).
The following table shows the intangible asset impairment charges from continuing operations:
(USD millions) Q4 2020 Q4 2019 FY 2020 FY 2019
Innovative Medicines 1 -191 -190 -768 -669
Sandoz 2 -51 -459 -141 -506
Corporate -5 -5
Total -247 -649 -914 -1 175
1 2020 includes an impairment of USD 485 million related to the write-down of IPR&D related to cessation of clinical development program ZPL389 for atopic dermatitis and USD 181 million related to a partial write-down of the Votrient currently marketed product. 2019 includes an impairment of USD 416 million related to the write-down of IPR&D related to cessation of clinical development program EMA401 and a USD 108 million write-down related to the cessation of clinical development program for MOR106 for atopic dermatitis.
2 2019 includes an impairment of USD 442 million related to the write-down of IPR&D related to the discontinuation of the generic Advair® development program.

46
Segmentation – Net sales by region1
Fourth quarter
Q4 2020 Q4 2019 % change % change Q4 2020 Q4 2019
USD m USD m USD cc 2 % of total % of total
Innovative Medicines
Europe 3 663 3 271 12 7 36 33
US 3 653 3 735 -2 -2 36 38
Asia/Africa/Australasia 2 263 2 223 2 -2 22 22
Canada and Latin America 654 691 -5 4 6 7
Total 10 233 9 920 3 1 100 100
Of which in Established Markets 7 821 7 530 4 1 76 76
Of which in Emerging Growth Markets 2 412 2 390 1 3 24 24
Sandoz
Europe 1 375 1 308 5 1 54 53
US 517 604 -14 -14 20 24
Asia/Africa/Australasia 441 357 24 19 17 14
Canada and Latin America 204 214 -5 3 9 9
Total 2 537 2 483 2 0 100 100
Of which in Established Markets 1 843 1 797 3 -2 73 72
Of which in Emerging Growth Markets 694 686 1 6 27 28
Continuing operations
Europe 5 038 4 579 10 5 39 37
US 4 170 4 339 -4 -4 33 35
Asia/Africa/Australasia 2 704 2 580 5 1 21 21
Canada and Latin America 858 905 -5 4 7 7
Total 12 770 12 403 3 1 100 100
Of which in Established Markets 9 664 9 327 4 0 76 75
Of which in Emerging Growth Markets 3 106 3 076 1 4 24 25
1 Net sales to third parties from continuing operations by location of customer. Emerging Growth Markets comprise all markets other than the Established Markets of the US, Canada, Western Europe, Japan, Australia and New Zealand.
2 Constant currencies (cc) is a non-IFRS measure. A definition of non-IFRS measures used by Novartis can be found starting on page 55.

47
Segmentation – Net sales by region1
Full year
FY 2020 FY 2019 % change % change FY 2020 FY 2019
USD m USD m USD cc 2 % of total % of total
Innovative Medicines
Europe 13 484 12 818 5 4 35 34
US 14 342 13 789 4 4 37 37
Asia/Africa/Australasia 8 718 8 458 3 2 22 22
Canada and Latin America 2 469 2 649 -7 6 6 7
Total 39 013 37 714 3 4 100 100
Of which in Established Markets 29 643 28 573 4 3 76 76
Of which in Emerging Growth Markets 9 370 9 141 3 7 24 24
Sandoz
Europe 5 231 5 115 2 2 54 53
US 2 142 2 491 -14 -14 22 26
Asia/Africa/Australasia 1 501 1 341 12 11 16 14
Canada and Latin America 772 784 -2 8 8 7
Total 9 646 9 731 -1 0 100 100
Of which in Established Markets 7 089 7 111 0 -1 73 73
Of which in Emerging Growth Markets 2 557 2 620 -2 3 27 27
Continuing operations
Europe 18 715 17 933 4 4 38 38
US 16 484 16 280 1 1 34 34
Asia/Africa/Australasia 10 219 9 799 4 4 21 21
Canada and Latin America 3 241 3 433 -6 6 7 7
Total 48 659 47 445 3 3 100 100
Of which in Established Markets 36 732 35 684 3 2 75 75
Of which in Emerging Growth Markets 11 927 11 761 1 6 25 25
1 Net sales to third parties from continuing operations by location of customer. Emerging Growth Markets comprise all markets other than the Established Markets of the US, Canada, Western Europe, Japan, Australia and New Zealand.
2 Constant currencies (cc) is a non-IFRS measure. A definition of non-IFRS measures used by Novartis can be found starting on page 55.

48
Segmentation – Net sales by business franchise
Innovative Medicines Division net sales by business franchise Fourth quarter
Q4 2020 Q4 2019 % change % change
USD m USD m USD cc 1
Oncology
Tasigna 513 491 4 3
Promacta/Revolade 471 380 24 23
Tafinlar + Mekinist 408 356 15 13
Sandostatin 363 402 -10 -11
Jakavi 376 293 28 24
Gleevec/Glivec 291 313 -7 -9
Afinitor/Votubia 259 365 -29 -30
Kisqali 184 155 19 18
Exjade/Jadenu 156 231 -32 -35
Votrient 147 177 -17 -18
Kymriah 141 96 47 42
Lutathera 109 107 2 1
Piqray 84 67 25 25
Adakveo 34 1 nm nm
Tabrecta 17 nm nm
Other 264 294 -10 -12
Total Novartis Oncology business unit 3 817 3 728 2 1
Immunology, Hepatology and Dermatology
Cosentyx 1 109 965 15 13
Ilaris 240 178 35 32
Total Immunology, Hepatology and Dermatology 1 349 1 143 18 16
Ophthalmology
Lucentis 530 517 3 -2
Xiidra 108 90 20 19
Beovu 37 35 6 2
Other 450 585 -23 -24
Total Ophthalmology 1 125 1 227 -8 -11
Neuroscience
Gilenya 760 803 -5 -8
Zolgensma 254 186 37 33
Mayzent 57 17 nm nm
Aimovig 56 28 100 91
Kesimpta 14 nm nm
Other 12 14 -14 -13
Total Neuroscience 1 153 1 048 10 7
Cardiovascular, Renal and Metabolism
Entresto 716 518 38 35
Other 5 nm nm
Total Cardiovascular, Renal and Metabolism 716 523 37 34
Respiratory
Xolair 335 303 11 8
Ultibro Group 160 162 -1 -6
Other 10 6 67 55
Total Respiratory 505 471 7 3
Established Medicines
Galvus Group 293 342 -14 -14
Diovan Group 224 266 -16 -17
Exforge Group 247 245 1 -1
Zortress/Certican 112 123 -9 -12
Neoral/Sandimmun(e) 103 105 -2 -5
Voltaren/Cataflam 95 104 -9 -9
Other 494 595 -17 -18
Total Established Medicines 1 568 1 780 -12 -13
Total Novartis Pharmaceuticals business unit 6 416 6 192 4 2 Total division net sales 10 233 9 920 3 1
1 Constant currencies (cc) is a non-IFRS measure. A definition of non-IFRS measures used by Novartis can be found starting on page 55.
nm = not meaningful

49
Innovative Medicines Division net sales by business franchiseFull year
FY 2020 FY 2019 % change % change
USD m USD m USD cc 1
Oncology
Tasigna 1 958 1 880 4 5
Promacta/Revolade 1 738 1 416 23 23
Tafinlar + Mekinist 1 542 1 338 15 16
Sandostatin 1 439 1 585 -9 -8
Jakavi 1 339 1 114 20 20
Gleevec/Glivec 1 188 1 263 -6 -6
Afinitor/Votubia 1 083 1 539 -30 -29
Kisqali 687 480 43 45
Exjade/Jadenu 653 975 -33 -33
Votrient 635 755 -16 -15
Kymriah 474 278 71 68
Lutathera 445 441 1 1
Piqray 320 116 176 176
Adakveo 105 1 nm nm
Tabrecta 35 nm nm
Other 1 070 1 189 -10 -10
Total Novartis Oncology business unit 14 711 14 370 2 3
Immunology, Hepatology and Dermatology
Cosentyx 3 995 3 551 13 13
Ilaris 873 671 30 31
Total Immunology, Hepatology and Dermatology 4 868 4 222 15 16
Ophthalmology
Lucentis 1 933 2 086 -7 -8
Xiidra 376 192 96 95
Beovu 190 35 nm nm
Other 1 911 2 463 -22 -22
Total Ophthalmology 4 410 4 776 -8 -8
Neuroscience
Gilenya 3 003 3 223 -7 -7
Zolgensma 920 361 155 151
Mayzent 170 26 nm nm
Aimovig 164 103 59 57
Kesimpta 15 nm nm
Other 51 60 -15 -15
Total Neuroscience 4 323 3 773 15 14
Cardiovascular, Renal and Metabolism
Entresto 2 497 1 726 45 44
Other 1 24 -96 -99
Total Cardiovascular, Renal and Metabolism 2 498 1 750 43 42
Respiratory
Xolair 1 251 1 173 7 8
Ultibro Group 623 630 -1 -1
Other 26 22 18 17
Total Respiratory 1 900 1 825 4 5
Established Medicines
Galvus Group 1 199 1 297 -8 -5
Diovan Group 1 003 1 064 -6 -4
Exforge Group 980 1 025 -4 -3
Zortress/Certican 452 485 -7 -7
Neoral/Sandimmun(e) 393 419 -6 -6
Voltaren/Cataflam 360 417 -14 -12
Other 1 916 2 291 -16 -15
Total Established Medicines 6 303 6 998 -10 -8 Total Novartis Pharmaceuticals business unit 24 302 23 344 4 5 Total division net sales 39 013 37 714 3 4
1 Constant currencies (cc) is a non-IFRS measure. A definition of non-IFRS measures used by Novartis can be found starting on page 55.
nm = not meaningful

50
Net sales of the top 20 Innovative Medicines Division products in 2020 Fourth quarter
US Rest of world Total
% % % % %
change change change change change
Brands Business franchise Key indication USD m USD/cc 2 USD m USD cc 2 USD m USD cc 2
Psoriasis, ankylosing
spondylitis,
Immunology, psoriatic arthritis
Hepatology and and non-radiographic
Cosentyx Dermatology axial spondyloarthritis 686 12 423 19 15 1 109 15 13
Gilenya Neuroscience Relapsing multiple sclerosis 381 -12 379 3 -2 760 -5 -8
Cardiovascular,
Renal and
Entresto Metabolism Chronic heart failure 362 27 354 52 45 716 38 35
Tasigna Oncology Chronic myeloid leukemia 221 6 292 3 0 513 4 3
Age-related
Lucentis Ophthalmology macular degeneration 530 3 -2 530 3 -2
Immune
thrombocytopenia (ITP),
Promacta/Revolade Oncology severe aplastic anemia (SAA) 223 21 248 27 24 471 24 23
BRAF V600+ metastatic
and adjuvant melanoma;
advanced non-small cell
Tafinlar + Mekinist Oncology lung cancer (NSCLC) 149 19 259 12 10 408 15 13
Carcinoid tumors
Sandostatin Oncology and acromegaly 211 -7 152 -14 -16 363 -10 -11
Myelofibrosis (MF),
Jakavi Oncology polycythemia vera (PV) 376 28 24 376 28 24
Severe allergic asthma (SAA),
chronic spontaneous urticaria
Xolair 1 Respiratory (CSU) and nasal polyps 335 11 8 335 11 8
Galvus Group Established Medicines Type 2 diabetes 293 -14 -14 293 -14 -14
Chronic myeloid
Gleevec/Glivec Oncology leukemia and GIST 70 -10 221 -6 -9 291 -7 -9
Afinitor/Votubia Oncology Breast cancer/TSC 157 -36 102 -16 -18 259 -29 -30
Diovan Group Established Medicines Hypertension 31 63 193 -22 -23 224 -16 -17
Exforge Group Established Medicines Hypertension 3 200 244 0 -2 247 1 -1
Spinal muscular atrophy
Zolgensma Neuroscience (SMA) 106 -27 148 nm nm 254 37 33
Immunology, Auto-inflammatory (CAPS,
Hepatology and TRAPS, HIDS/MKD, FMF,
Ilaris Dermatology SJIA, AOSD and gout) 113 38 127 32 27 240 35 32
HR+/HER2-
Kisqali Oncology metastatic breast cancer 82 4 102 34 30 184 19 18
Exjade/Jadenu Oncology Chronic iron overload 25 -74 131 -4 -7 156 -32 -35
Votrient Oncology Renal cell carcinoma 59 -20 88 -15 -16 147 -17 -18
Top 20 products total 2 879 0 4 997 9 5 7 876 5 3
Rest of portfolio 774 -8 1 583 0 -3 2 357 -3 -5
Total division sales 3 653 -2 6 580 6 3 10 233 3 1
1 Net sales reflect Xolair sales for all indications.2 Constant currencies (cc) is a non-IFRS measure. A definition of non-IFRS measures used by Novartis can be found starting on page 55.
nm = not meaningful

51
Net sales of the top 20 Innovative Medicines Division products in 2020 Full year
US Rest of world Total
% % % % %
change change change change change
Brands Business franchise Key indication USD m USD/cc 2 USD m USD cc 2 USD m USD cc 2
Psoriasis, ankylosing
spondylitis,
Immunology, psoriatic arthritis
Hepatology and and non-radiographic
Cosentyx Dermatology axial spondyloarthritis 2 516 13 1 479 11 12 3 995 13 13
Gilenya Neuroscience Relapsing multiple sclerosis 1 562 -10 1 441 -3 -3 3 003 -7 -7
Cardiovascular,
Renal and
Entresto Metabolism Chronic heart failure 1 277 38 1 220 52 52 2 497 45 44
Tasigna Oncology Chronic myeloid leukemia 859 7 1 099 2 3 1 958 4 5
Age-related
Lucentis Ophthalmology macular degeneration 1 933 -7 -8 1 933 -7 -8
Immune
thrombocytopenia (ITP),
Promacta/Revolade Oncology severe aplastic anemia (SAA) 833 21 905 25 26 1 738 23 23
BRAF V600+ metastatic
and adjuvant melanoma;
advanced non-small cell
Tafinlar + Mekinist Oncology lung cancer (NSCLC) 569 18 973 14 15 1 542 15 16
Carcinoid tumors
Sandostatin Oncology and acromegaly 837 -5 602 -14 -13 1 439 -9 -8
Myelofibrosis (MF),
Jakavi Oncology polycythemia vera (PV) 1 339 20 20 1 339 20 20
Severe allergic asthma (SAA),
chronic spontaneous urticaria
Xolair 1 Respiratory (CSU) and nasal polyps 1 251 7 8 1 251 7 8
Galvus Group Established Medicines Type 2 diabetes 1 199 -8 -5 1 199 -8 -5
Chronic myeloid
Gleevec/Glivec Oncology leukemia and GIST 315 -6 873 -6 -6 1 188 -6 -6
Afinitor/Votubia Oncology Breast cancer/TSC 644 -36 439 -18 -17 1 083 -30 -29
Diovan Group Established Medicines Hypertension 124 44 879 -10 -8 1 003 -6 -4
Exforge Group Established Medicines Hypertension 16 23 964 -5 -3 980 -4 -3
Spinal muscular atrophy
Zolgensma Neuroscience (SMA) 459 50 461 nm nm 920 155 151
Immunology, Auto-inflammatory (CAPS,
Hepatology and TRAPS, HIDS/MKD, FMF,
Ilaris Dermatology SJIA, AOSD and gout) 400 32 473 29 30 873 30 31
HR+/HER2-
Kisqali Oncology metastatic breast cancer 318 27 369 60 65 687 43 45
Exjade/Jadenu Oncology Chronic iron overload 138 -69 515 -2 -2 653 -33 -33
Votrient Oncology Renal cell carcinoma 259 -22 376 -11 -10 635 -16 -15
Top 20 products total 11 126 3 18 790 6 7 29 916 5 5
Rest of portfolio 3 216 8 5 881 -5 -5 9 097 -1 0
Total division sales 14 342 4 24 671 3 4 39 013 3 4
1 Net sales reflect Xolair sales for all indications.2 Constant currencies (cc) is a non-IFRS measure. A definition of non-IFRS measures used by Novartis can be found starting on page 55.
nm = not meaningful

52
Sandoz Division net sales by business franchise Fourth quarter
Q4 2020 Q4 2019 % change % change
USD m USD m USD cc 2
Retail Generics 1 1 887 1 907 -1 -2
Biopharmaceuticals 514 425 21 16
Anti-Infectives 136 151 -10 -14
Total division net sales 2 537 2 483 2 0
1 Of which USD 184 million (2019: USD 197 million) represents Anti-Infectives sold under Sandoz name2 Constant currencies (cc) is a non-IFRS measure. A definition of non-IFRS measures used by Novartis can be found starting on page 55.
Full year
FY 2020 FY 2019 % change % change
USD m USD m USD cc 2
Retail Generics 1 7 244 7 590 -5 -4
Biopharmaceuticals 1 928 1 607 20 19
Anti-Infectives 474 534 -11 -12
Total division net sales 9 646 9 731 -1 0
1 Of which USD 694 million (2019: USD 784 million) represents Anti-Infectives sold under Sandoz name2 Constant currencies (cc) is a non-IFRS measure. A definition of non-IFRS measures used by Novartis can be found starting on page 55.
The product portfolio of Sandoz is widely spread in 2020 and 2019.
Segmentation – Other revenue Fourth quarter Innovative Medicines Sandoz Corporate Group
(USD millions) Q4 2020 Q4 2019 Q4 2020 Q4 2019 Q4 2020 Q4 2019 Q4 2020 Q4 2019
Profit sharing income 210 190 210 190
Royalty income 27 25 6 6 6 5 39 36
Milestone income 2 43 7 2 50
Other 1 7 28 2 9 9 37
Total other revenues 246 286 8 22 6 5 260 313
1 Other includes revenue from activities such as manufacturing or other services rendered, to the extent such revenue is not recorded under net sales.
Full year
Innovative Medicines Sandoz Corporate Group
(USD millions) FY 2020 FY 2019 FY 2020 FY 2019 FY 2020 FY 2019 FY 2020 FY 2019
Profit sharing income 835 732 2 835 734
Royalty income 107 104 25 19 168 24 300 147
Milestone income 39 201 11 30 50 231
Other 1 37 55 17 12 54 67
Total other revenues 1 018 1 092 53 63 168 24 1 239 1 179
1 Other includes revenue from activities such as manufacturing or other services rendered, to the extent such revenue is not recorded under net sales.

53
10. Discontinued operations
Discontinued operations included in 2019 the operational results from the Alcon eye care devices business and certain Corporate activities attributable to the Alcon business prior to the spin-off, the gain on distribution of Alcon Inc. to Novartis AG shareholders, and certain other expenses related to the Distribution (refer to Note 3 for further details).
The Alcon eye care devices business researched, discovered, developed, manufactured, distributed and sold a broad range of eye care products. Alcon was orga-nized into two global business franchises, Surgical and Vision Care. Alcon also provided services, training, edu-cation and technical support for both the Surgical and Vision Care businesses.
Consolidated income statement
(USD millions) Q4 2019 1 FY 2019
Net sales to third parties from discontinued
operations 1 777
Sales to continuing segments 32
Net sales from discontinued operations 1 809
Cost of goods sold -860
Gross profit from discontinued operations 949
Selling, general and administration -638
Research and development -142
Other income 15
Other expense -113
Operating income from discontinued operations 71
as % of net sales 4.0%
Interest expense -10
Other financial income and expense -3
Income before taxes from discontinued operations 58
Taxes -159
Net loss from discontinued operations
before gain on distribution of Alcon Inc.
to Novartis AG shareholders -101
Gain on distribution of Alcon Inc.
to Novartis AG shareholders 2 4 691
Net income from discontinued operations 2 4 590
1 As the Alcon spin-off was completed on April 9, 2019, there were no results of operations from the Alcon business in Q4 2019.
2 See Note 3 for further details on the non-taxable non-cash gain on distribution of Alcon Inc. to Novartis AG shareholders recognized on April 8, 2019, date of Distribution.
Supplemental disclosures related to the Alcon business distributed to Novartis AG shareholders
Cash flows used in investing activities from discontinued operations
Cash flows used in investing activities from discontinued operations include the investing activities of the Alcon business and cash outflows for transaction-related expenditures attributable to the series of portfolio transforma-tion transactions completed in 2015.
(USD millions) Q4 2020 Q4 2019 FY 2020 FY 2019
Payments attributable to the spin-off of the Alcon business -2 -3 -39 -29
Divested cash and cash equivalents -628
Cash flows attributable to the spin-off of the Alcon business -2 -3 -39 -657
Other cash flows used in investing activities, net -54 -88 -502
Net cash flows used in investing activities from discontinued operations -2 -57 -127 -1 159
Cash flows from financing activities from discontinued operationsIn 2020, the net cash outflows used in financing activi-ties from discontinued operations of USD 50 million (Q4 2020: USD 13 million) was for transaction cost pay-ments directly attributable to the distribution (spin-off) of the Alcon business to Novartis AG shareholders.
In 2019, the net cash inflows from financing activities from discontinued operations of USD 3.3 billion (Q4 2019: USD 22 million net cash outflows) included mainly USD 3.5 billion (Q4 2019: nil) from Alcon borrowings, partly offset by USD 0.2 billion (Q4 2019: USD 22 million) trans-action cost payments directly attributable to the distri-bution (spin-off) of the Alcon business to Novartis AG shareholders (see Note 3).
54
Significant transaction closed in 2019
In March 2019, Alcon acquired PowerVision, Inc. (Power-Vision), a privately-held, US-based medical device devel-opment company focused on developing accommoda-tive, implantable intraocular lenses. The fair value of the total purchase consideration was USD 424 million. The amount consisted of an initial cash payment of USD 289 million and the fair value of the contingent consideration of USD 135 million, due to PowerVision shareholders, which they are eligible to receive upon the achievement of specified regulatory and commercialization
milestones. The purchase price allocation resulted in net identifiable assets of USD 418 million, consisting of intan-gible assets, of USD 505 million, net deferred tax liabil-ities of USD 93 million, other net assets of USD 6 million, and goodwill of USD 6 million. The 2019 results of oper-ations since the date of the acquisition were not mate-rial.
For additional information related to the distribution (spin-off) of the Alcon business to Novartis AG share-holders, effected through a dividend in kind distribution that was completed on April 8, 2019, refer to Note 3.
11. Events subsequent to the December 31, 2020, consolidated balance sheet date
Significant transactions
Significant transactions not closed as of January 25, 2021In November 2020 and in January 2021, Novartis entered into long-term research and development agreements, both of which did not close as of January 25, 2021.
Significant transaction closed in January 2021In December 2020, Novartis entered into a business acquisition agreement that closed on January 21, 2021, with an estimated fair value purchase price of USD 235 million.
For additional information on these transactions, see Note 31 to the Consolidated Financial Statements of the Annual Report 2020.
Dividend proposal for 2020 and approval of the Group’s 2020 consolidated financial statementsOn January 25, 2021, the Novartis AG Board of Direc-tors proposed the acceptance of the 2020 consolidated financial statements of the Novartis Group for approval by the Annual General Meeting on March 2, 2021. Fur-thermore, also on January 25, 2021, the Board proposed a dividend of CHF 3.00 per share to be approved at the Annual General Meeting on March 2, 2021. If approved, total dividend payments would amount to approximately USD 7.7 billion (2019: USD 7.0 billion), using the CHF/USD December 31, 2020, exchange rate.

55
Supplementary information (unaudited)Non-IFRS disclosures
Novartis uses certain non-IFRS metrics when measur-ing performance, especially when measuring cur-rent-year results against prior periods, including core results, constant currencies, free cash flow and net debt.
Despite the use of these measures by management in setting goals and measuring the Group’s performance, these are non-IFRS measures that have no standardized meaning prescribed by IFRS. As a result, such measures have limits in their usefulness to investors.
Because of their non-standardized definitions, the non-IFRS measures (unlike IFRS measures) may not be comparable to the calculation of similar measures of other companies. These non-IFRS measures are pre-sented solely to permit investors to more fully understand how the Group’s management assesses underlying per-formance. These non-IFRS measures are not, and should not be viewed as, a substitute for IFRS measures.
As an internal measure of Group performance, these non-IFRS measures have limitations, and the Group’s performance management process is not solely restricted to these metrics.
Core resultsThe Group’s core results – including core operating income, core net income and core earnings per share – exclude fully the amortization and impairment charges of intangible assets, excluding software, net gains and losses on fund investments and equity securities valued at fair value through profit and loss, and certain acquisi-tion- and divestment-related items. The following items that exceed a threshold of USD 25 million are also excluded: integration- and divestment-related income and expenses; divestment gains and losses; restructur-ing charges/releases and related items; legal-related items; impairments of property, plant and equipment, and financial assets, and income and expense items that management deems exceptional and that are or are expected to accumulate within the year to be over a USD 25 million threshold.
Novartis believes that investor understanding of the Group’s performance is enhanced by disclosing core measures of performance since, core measures exclude items that can vary significantly from year to year, they enable better comparison of business performance across years. For this same reason, Novartis uses these core measures in addition to IFRS and other measures as important factors in assessing the Group’s perfor-mance.
The following are examples of how these core measures are utilized:
• In addition to monthly reports containing financial infor-mation prepared under International Financial Report-ing Standards (IFRS), senior management receives a monthly analysis incorporating these core measures.
• Annual budgets are prepared for both IFRS and core measures.
As an internal measure of Group performance, the core results measures have limitations, and the Group’s performance management process is not solely restricted to these metrics. A limitation of the core results measures is that they provide a view of the Group’s oper-ations without including all events during a period, such as the effects of an acquisition, divestment, or amortiza-tion/impairments of purchased intangible assets and restructurings.
Constant currenciesChanges in the relative values of non-US currencies to the US dollar can affect the Group’s financial results and financial position. To provide additional information that may be useful to investors, including changes in sales volume, we present information about our net sales and various values relating to operating and net income that are adjusted for such foreign currency effects.
Constant currency calculations have the goal of elim-inating two exchange rate effects so that an estimate can be made of underlying changes in the consolidated income statement excluding the impact of fluctuations in exchanges rates:• The impact of translating the income statements of
consolidated entities from their non-USD functional currencies to USD
• The impact of exchange rate movements on the major transactions of consolidated entities performed in cur-rencies other than their functional currency.
We calculate constant currency measures by translating the current year’s foreign currency values for sales and other income statement items into USD, using the aver-age exchange rates from the prior year and comparing them to the prior-year values in USD.
We use these constant currency measures in evalu-ating the Group’s performance, since they may assist us in evaluating our ongoing performance from year to year. However, in performing our evaluation, we also consider equivalent measures of performance that are not affected by changes in the relative value of currencies.
Growth rate calculationFor ease of understanding, Novartis uses a sign conven-tion for its growth rates such that a reduction in operat-ing expenses or losses compared to the prior year is shown as a positive growth.
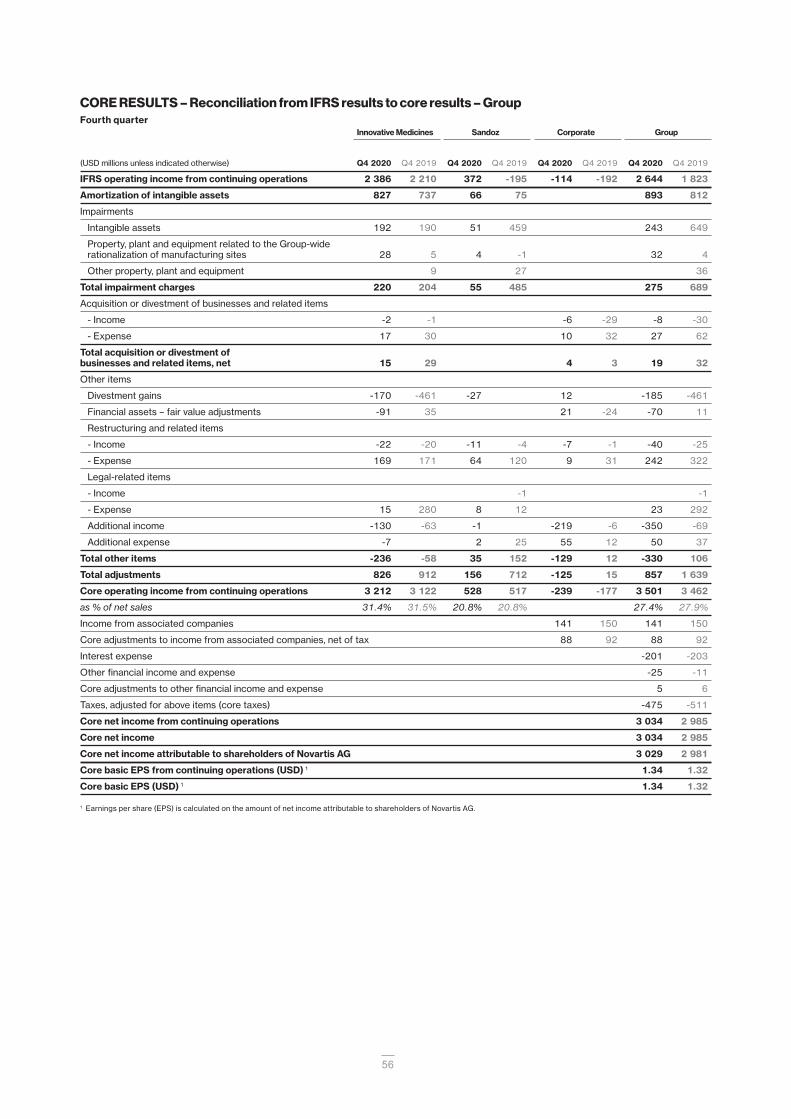
56
CORE RESULTS – Reconciliation from IFRS results to core results – GroupFourth quarter Innovative Medicines Sandoz Corporate Group
(USD millions unless indicated otherwise) Q4 2020 Q4 2019 Q4 2020 Q4 2019 Q4 2020 Q4 2019 Q4 2020 Q4 2019
IFRS operating income from continuing operations 2 386 2 210 372 -195 -114 -192 2 644 1 823
Amortization of intangible assets 827 737 66 75 893 812
Impairments
Intangible assets 192 190 51 459 243 649
Property, plant and equipment related to the Group-wide
rationalization of manufacturing sites 28 5 4 -1 32 4
Other property, plant and equipment 9 27 36
Total impairment charges 220 204 55 485 275 689
Acquisition or divestment of businesses and related items
- Income -2 -1 -6 -29 -8 -30
- Expense 17 30 10 32 27 62
Total acquisition or divestment of
businesses and related items, net 15 29 4 3 19 32
Other items
Divestment gains -170 -461 -27 12 -185 -461
Financial assets – fair value adjustments -91 35 21 -24 -70 11
Restructuring and related items
- Income -22 -20 -11 -4 -7 -1 -40 -25
- Expense 169 171 64 120 9 31 242 322
Legal-related items
- Income -1 -1
- Expense 15 280 8 12 23 292
Additional income -130 -63 -1 -219 -6 -350 -69
Additional expense -7 2 25 55 12 50 37
Total other items -236 -58 35 152 -129 12 -330 106
Total adjustments 826 912 156 712 -125 15 857 1 639
Core operating income from continuing operations 3 212 3 122 528 517 -239 -177 3 501 3 462
as % of net sales 31.4% 31.5% 20.8% 20.8% 27.4% 27.9%
Income from associated companies 141 150 141 150
Core adjustments to income from associated companies, net of tax 88 92 88 92
Interest expense -201 -203
Other financial income and expense -25 -11
Core adjustments to other financial income and expense 5 6
Taxes, adjusted for above items (core taxes) -475 -511
Core net income from continuing operations 3 034 2 985
Core net income 3 034 2 985
Core net income attributable to shareholders of Novartis AG 3 029 2 981
Core basic EPS from continuing operations (USD) 1 1.34 1.32
Core basic EPS (USD) 1 1.34 1.32
1 Earnings per share (EPS) is calculated on the amount of net income attributable to shareholders of Novartis AG.

57
CORE RESULTS – Reconciliation from IFRS results to core results – Group Full year Innovative Medicines Sandoz Corporate Group
(USD millions unless indicated otherwise) FY 2020 FY 2019 FY 2020 FY 2019 FY 2020 FY 2019 FY 2020 FY 2019
IFRS operating income from continuing operations 9 172 9 287 1 043 551 -63 -752 10 152 9 086
Amortization of intangible assets 2 999 2 447 366 314 3 365 2 761
Impairments
Intangible assets 759 632 141 503 900 1 135
Property, plant and equipment related to the Group-wide
rationalization of manufacturing sites 321 83 112 69 433 152
Other property, plant and equipment 10 2 33 2 43
Total impairment charges 1 080 725 255 605 1 335 1 330
Acquisition or divestment of businesses and related items
- Income -5 -8 -73 -108 -78 -116
- Expense 107 87 22 89 115 218 202
Total acquisition or divestment of
businesses and related items, net 102 79 22 16 7 140 86
Other items
Divestment gains -348 -1 091 -27 -39 2 -414 -1 089
Financial assets – fair value adjustments -153 -18 -183 -20 -336 -38
Restructuring and related items
- Income -36 -58 -30 -7 -28 -6 -94 -71
- Expense 484 509 252 390 35 113 771 1 012
Legal-related items
- Income -32 -32
- Expense 555 999 406 156 -26 935 1 155
Additional income -264 -316 -6 -4 -361 -95 -631 -415
Additional expense 54 87 53 121 86 119 193 327
Total other items 292 112 648 624 -516 113 424 849
Total adjustments 4 473 3 363 1 291 1 543 -500 120 5 264 5 026
Core operating income from continuing operations 13 645 12 650 2 334 2 094 -563 -632 15 416 14 112
as % of net sales 35.0% 33.5% 24.2% 21.5% 31.7% 29.7%
Income from associated companies 1 1 2 2 670 656 673 659
Core adjustments to income from associated companies, net of tax 424 427 424 427
Interest expense -869 -850
Other financial income and expense -78 45
Core adjustments to other financial income and expense -5 11
Taxes, adjusted for above items (core taxes) -2 403 -2 300
Core net income from continuing operations 13 158 12 104
Core net income from discontinued operations 1 278
Core net income 13 158 12 382
Core net income attributable to shareholders of Novartis AG 13 159 12 377
Core basic EPS from continuing operations (USD) 2 5.78 5.28
Core basic EPS from discontinued operations (USD) 2 0.12
Core basic EPS (USD) 2 5.78 5.40
1 For details on discontinued operations reconciliation from IFRS to core net income, please refer to page 63.2 Earnings per share (EPS) is calculated on the amount of net income attributable to shareholders of Novartis AG.

58
CORE RESULTS – Reconciliation from IFRS results to core results – Group Fourth quarter
Acquisition or
Amortization divestment of
Q4 2020 of intangible businesses and Other Q4 2020 Q4 2019
(USD millions unless indicated otherwise) IFRS results assets 1 Impairments 2 related items 3 items 4 Core results Core results
Gross profit from continuing operations 8 813 866 234 13 30 9 956 9 679
Operating income from continuing operations 2 644 893 275 19 -330 3 501 3 462
Income before taxes from continuing operations 2 559 981 275 19 -325 3 509 3 496
Taxes from continuing operations 5 -460 -475 -511
Net income from continuing operations 2 099 3 034 2 985
Net income 2 099 3 034 2 985
Basic EPS from continuing operations (USD) 6 0.92 1.34 1.32
Basic EPS (USD) 6 0.92 1.34 1.32
The following are adjustments to arrive at core gross profit
Cost of goods sold -4 217 866 234 13 30 -3 074 -3 037
The following are adjustments to arrive at core operating income
Selling, general and administration -3 924 1 15 -3 908 -3 922
Research and development -2 333 27 9 -2 297 -2 193
Other income 643 -8 -620 15 149
Other expense -555 32 13 245 -265 -251
The following are adjustments to arrive at core income before taxes
Income from associated companies 141 88 229 242
Other financial income and expense -25 5 -20 -5
1 Amortization of intangible assets: cost of goods sold includes the amortization of acquired rights to currently marketed products and other production-related intangible assets; research and development includes the amortization of acquired rights for technologies; income from associated companies includes USD 88 million for the Novartis share of the estimated Roche core items
2 Impairments: cost of goods sold and research and development include impairment charges related to intangible assets; other expense includes impairment charges related to property, plant and equipment
3 Acquisition or divestment of businesses and related items, including restructuring and integration charges: cost of goods sold, selling, general and administration and other expense include net charges related to acquisitions; other income and other expense include transitional service-fee income and expenses related to the Alcon distribution
4 Other items: cost of goods sold, other income and other expense include net restructuring and other charges related to the Group-wide rationalization of manufacturing sites; cost of goods sold, selling, general and administration, other income and other expense include other restructuring income and charges and related items; selling, general and administration also includes expenses related to COVID-19 donations; cost of goods sold also includes adjustments to contingent considerations; other income and other expense include fair value adjustments and divestment gains and losses on financial assets and adjustments to environmental provisions; other income also includes net gains from the divestment of products, a fair value adjustment on a contingent receivable and adjustments to provisions; other expense includes legal-related items; other financial income and expense includes a revaluation impact of a financial liability incurred through the Alcon distribution
5 Taxes on the adjustments between IFRS and core results take into account, for each individual item included in the adjustment, the tax rate that will finally be applicable to the item based on the jurisdiction where the adjustment will finally have a tax impact. Generally, this results in amortization and impairment of intangible assets and acquisition-related restructuring and integration items having a full tax impact. There is usually a tax impact on other items, although this is not always the case for items arising from legal settlements in certain jurisdictions. Adjustments related to income from associated companies are recorded net of any related tax effect. Due to these factors and the differing effective tax rates in the various jurisdictions, the tax on the total adjustments of USD 950 million to arrive at the core results before tax amounts to USD 15 million. The average tax rate on the adjustments is 1.6%.
6 Earnings per share (EPS) is calculated on the amount of net income attributable to shareholders of Novartis AG.

59
CORE RESULTS – Reconciliation from IFRS results to core results – Group Full year
Acquisition or
Amortization divestment of
FY 2020 of intangible businesses and Other FY 2020 FY 2019
(USD millions unless indicated otherwise) IFRS results assets 1 Impairments 2 related items 3 items 4 Core results Core results
Gross profit from continuing operations 34 777 3 301 377 70 138 38 663 37 392
Operating income from continuing operations 10 152 3 365 1 335 140 424 15 416 14 112
Income before taxes from continuing operations 9 878 3 789 1 335 140 419 15 561 14 404
Taxes from continuing operations 5 -1 807 -2 403 -2 300
Net income from continuing operations 8 071 13 158 12 104
Net income from discontinued operations 6 278
Net income 8 071 13 158 12 382
Basic EPS from continuing operations (USD) 7 3.55 5.78 5.28
Basic EPS from discontinued operations (USD) 7 0.12
Basic EPS (USD) 7 3.55 5.78 5.40
The following are adjustments to arrive at core gross profit
Other revenues 1 239 -136 1 103 1 113
Cost of goods sold -15 121 3 301 377 70 274 -11 099 -11 219
The following are adjustments to arrive at core operating income
Selling, general and administration -14 197 16 88 -14 093 -14 319
Research and development -8 980 64 523 3 -94 -8 484 -8 386
Other income 1 742 -6 -78 -1 335 323 495
Other expense -3 190 441 129 1 627 -993 -1 070
The following are adjustments to arrive at core income before taxes
Income from associated companies 673 424 1 097 1 086
Other financial income and expense -78 -5 -83 56
1 Amortization of intangible assets: cost of goods sold includes the amortization of acquired rights to currently marketed products and other production-related intangible assets; research and development includes the amortization of acquired rights for technologies; income from associated companies includes USD 424 million for the Novartis share of the estimated Roche core items
2 Impairments: cost of goods sold and research and development include impairment charges related to intangible assets; other income includes an impairment reversal related to property, plant and equipment; other expense includes impairment charges related to property, plant and equipment
3 Acquisition or divestment of businesses and related items, including restructuring and integration charges: cost of goods sold, selling, general and administration, research and development and other expense include net charges related to acquisitions; other income and other expense include transitional service-fee income and expenses related to the Alcon distribution
4 Other items: other revenues includes a settlement of royalties; cost of goods sold includes the cumulative amount of the depreciation up to December 31, 2019, recognized with the reclassification of property, plant and equipment out of assets of disposal group held for sale (see Note 3); cost of goods sold, other income and other expense include net restructuring and other charges related to the Group-wide rationalization of manufacturing sites; cost of goods sold, selling, general and administration, research and development, other income and other expense include other restructuring income and charges and related items; cost of goods sold and research and development also include adjustments to contingent considerations; selling, general and administration and other expense include expenses related to COVID-19 donations; selling, general and administration also includes adjustments to provisions; other income and other expense include fair value adjustments and divestment gains and losses on financial assets, and adjustments to environmental provisions; other income also includes net gains from the divestment of products, a fair value adjustment on a contingent receivable and adjustments to provisions; other expense includes adjustments to legal provisions, legal-related items and a termination fee; other financial income and expense includes a revaluation impact of a financial liability incurred through the Alcon distribution
5 Taxes on the adjustments between IFRS and core results take into account, for each individual item included in the adjustment, the tax rate that will finally be applicable to the item based on the jurisdiction where the adjustment will finally have a tax impact. Generally, this results in amortization and impairment of intangible assets and acquisition-related restructuring and integration items having a full tax impact. There is usually a tax impact on other items, although this is not always the case for items arising from legal settlements in certain jurisdictions. Adjustments related to income from associated companies are recorded net of any related tax effect. Due to these factors and the differing effective tax rates in the various jurisdictions, the tax on the total adjustments for continuing operations of USD 5.7 billion to arrive at the core results before tax amounts to USD 596 million. The average tax rate on the adjustments is 10.5%.
6 For details on discontinued operations reconciliation from IFRS to core net income please refer to page 63.7 Earnings per share (EPS) is calculated on the amount of net income attributable to shareholders of Novartis AG.
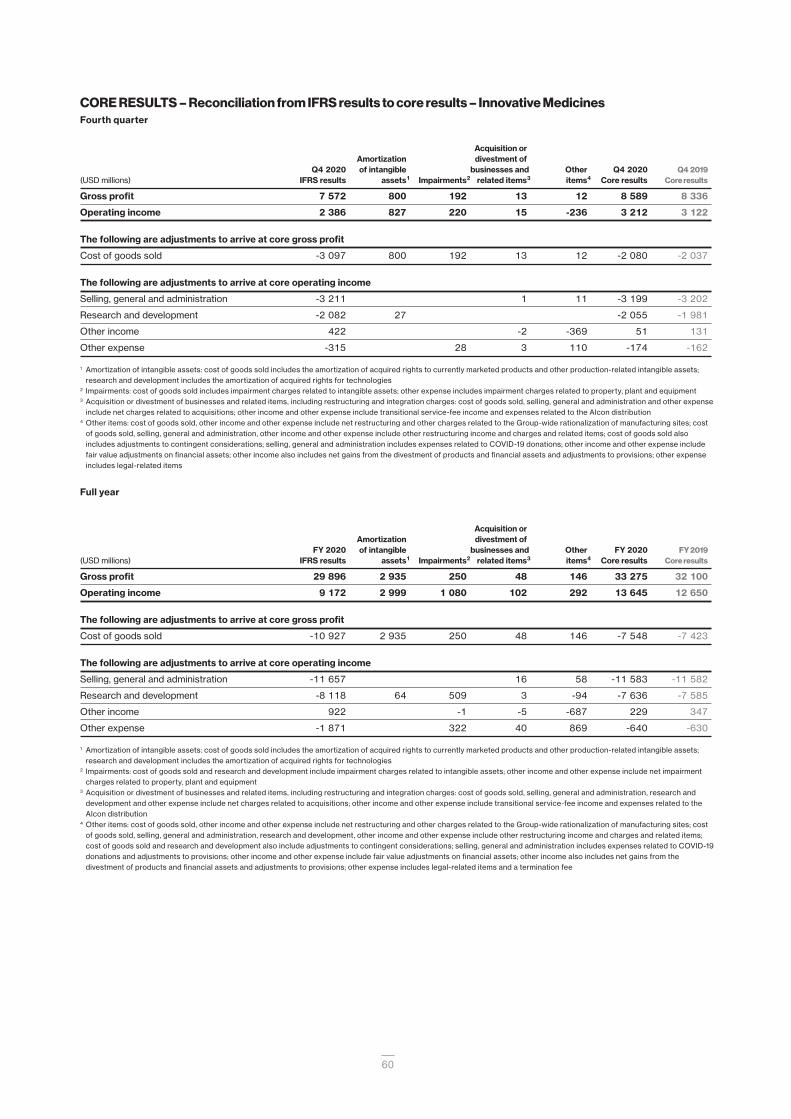
60
CORE RESULTS – Reconciliation from IFRS results to core results – Innovative Medicines Fourth quarter
Acquisition or
Amortization divestment of
Q4 2020 of intangible businesses and Other Q4 2020 Q4 2019
(USD millions) IFRS results assets 1 Impairments 2 related items 3 items 4 Core results Core results
Gross profit 7 572 800 192 13 12 8 589 8 336
Operating income 2 386 827 220 15 -236 3 212 3 122
The following are adjustments to arrive at core gross profit
Cost of goods sold -3 097 800 192 13 12 -2 080 -2 037
The following are adjustments to arrive at core operating income
Selling, general and administration -3 211 1 11 -3 199 -3 202
Research and development -2 082 27 -2 055 -1 981
Other income 422 -2 -369 51 131
Other expense -315 28 3 110 -174 -162
1 Amortization of intangible assets: cost of goods sold includes the amortization of acquired rights to currently marketed products and other production-related intangible assets; research and development includes the amortization of acquired rights for technologies
2 Impairments: cost of goods sold includes impairment charges related to intangible assets; other expense includes impairment charges related to property, plant and equipment3 Acquisition or divestment of businesses and related items, including restructuring and integration charges: cost of goods sold, selling, general and administration and other expense
include net charges related to acquisitions; other income and other expense include transitional service-fee income and expenses related to the Alcon distribution4 Other items: cost of goods sold, other income and other expense include net restructuring and other charges related to the Group-wide rationalization of manufacturing sites; cost
of goods sold, selling, general and administration, other income and other expense include other restructuring income and charges and related items; cost of goods sold also includes adjustments to contingent considerations; selling, general and administration includes expenses related to COVID-19 donations; other income and other expense include fair value adjustments on financial assets; other income also includes net gains from the divestment of products and financial assets and adjustments to provisions; other expense includes legal-related items
Full year
Acquisition or
Amortization divestment of
FY 2020 of intangible businesses and Other FY 2020 FY 2019
(USD millions) IFRS results assets 1 Impairments 2 related items 3 items 4 Core results Core results
Gross profit 29 896 2 935 250 48 146 33 275 32 100
Operating income 9 172 2 999 1 080 102 292 13 645 12 650
The following are adjustments to arrive at core gross profit
Cost of goods sold -10 927 2 935 250 48 146 -7 548 -7 423
The following are adjustments to arrive at core operating income
Selling, general and administration -11 657 16 58 -11 583 -11 582
Research and development -8 118 64 509 3 -94 -7 636 -7 585
Other income 922 -1 -5 -687 229 347
Other expense -1 871 322 40 869 -640 -630
1 Amortization of intangible assets: cost of goods sold includes the amortization of acquired rights to currently marketed products and other production-related intangible assets; research and development includes the amortization of acquired rights for technologies
2 Impairments: cost of goods sold and research and development include impairment charges related to intangible assets; other income and other expense include net impairment charges related to property, plant and equipment
3 Acquisition or divestment of businesses and related items, including restructuring and integration charges: cost of goods sold, selling, general and administration, research and development and other expense include net charges related to acquisitions; other income and other expense include transitional service-fee income and expenses related to the Alcon distribution
4 Other items: cost of goods sold, other income and other expense include net restructuring and other charges related to the Group-wide rationalization of manufacturing sites; cost of goods sold, selling, general and administration, research and development, other income and other expense include other restructuring income and charges and related items; cost of goods sold and research and development also include adjustments to contingent considerations; selling, general and administration includes expenses related to COVID-19 donations and adjustments to provisions; other income and other expense include fair value adjustments on financial assets; other income also includes net gains from the divestment of products and financial assets and adjustments to provisions; other expense includes legal-related items and a termination fee
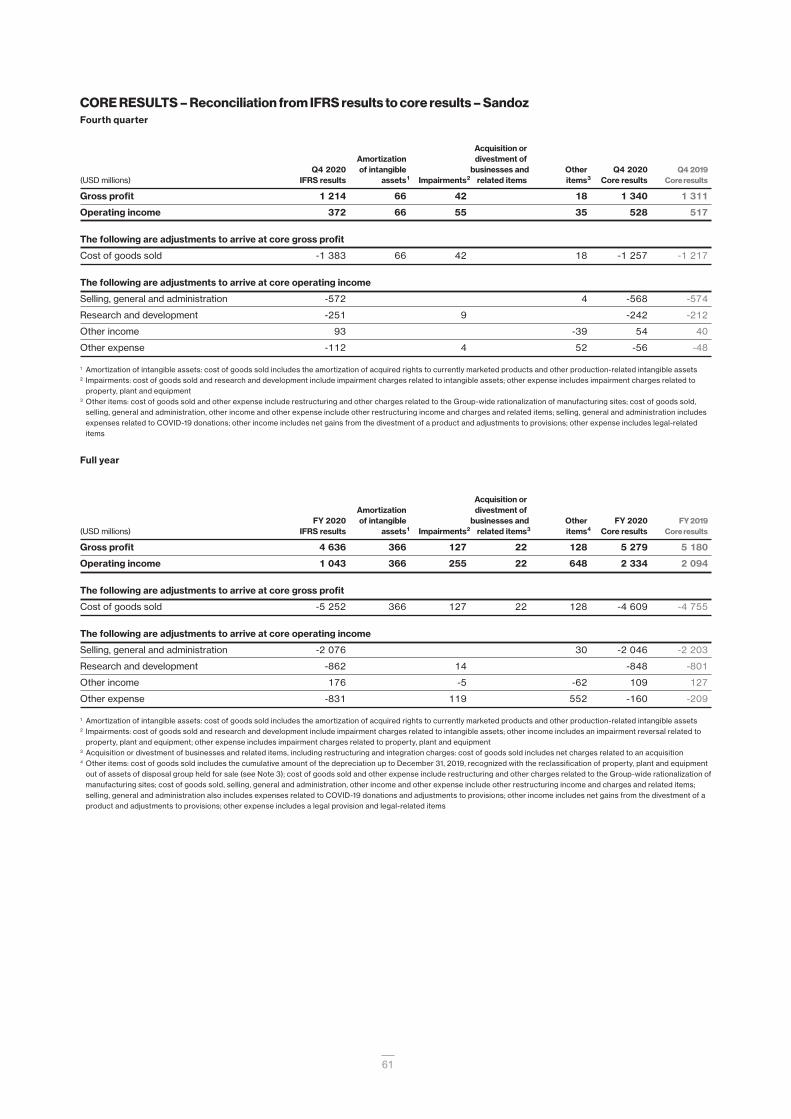
61
CORE RESULTS – Reconciliation from IFRS results to core results – Sandoz Fourth quarter
Acquisition or
Amortization divestment of
Q4 2020 of intangible businesses and Other Q4 2020 Q4 2019
(USD millions) IFRS results assets 1 Impairments 2 related items items 3 Core results Core results
Gross profit 1 214 66 42 18 1 340 1 311
Operating income 372 66 55 35 528 517
The following are adjustments to arrive at core gross profit
Cost of goods sold -1 383 66 42 18 -1 257 -1 217
The following are adjustments to arrive at core operating income
Selling, general and administration -572 4 -568 -574
Research and development -251 9 -242 -212
Other income 93 -39 54 40
Other expense -112 4 52 -56 -48
1 Amortization of intangible assets: cost of goods sold includes the amortization of acquired rights to currently marketed products and other production-related intangible assets2 Impairments: cost of goods sold and research and development include impairment charges related to intangible assets; other expense includes impairment charges related to
property, plant and equipment3 Other items: cost of goods sold and other expense include restructuring and other charges related to the Group-wide rationalization of manufacturing sites; cost of goods sold,
selling, general and administration, other income and other expense include other restructuring income and charges and related items; selling, general and administration includes expenses related to COVID-19 donations; other income includes net gains from the divestment of a product and adjustments to provisions; other expense includes legal-related items
Full year
Acquisition or
Amortization divestment of
FY 2020 of intangible businesses and Other FY 2020 FY 2019
(USD millions) IFRS results assets 1 Impairments 2 related items 3 items 4 Core results Core results
Gross profit 4 636 366 127 22 128 5 279 5 180
Operating income 1 043 366 255 22 648 2 334 2 094
The following are adjustments to arrive at core gross profit
Cost of goods sold -5 252 366 127 22 128 -4 609 -4 755
The following are adjustments to arrive at core operating income
Selling, general and administration -2 076 30 -2 046 -2 203
Research and development -862 14 -848 -801
Other income 176 -5 -62 109 127
Other expense -831 119 552 -160 -209
1 Amortization of intangible assets: cost of goods sold includes the amortization of acquired rights to currently marketed products and other production-related intangible assets2 Impairments: cost of goods sold and research and development include impairment charges related to intangible assets; other income includes an impairment reversal related to
property, plant and equipment; other expense includes impairment charges related to property, plant and equipment3 Acquisition or divestment of businesses and related items, including restructuring and integration charges: cost of goods sold includes net charges related to an acquisition4 Other items: cost of goods sold includes the cumulative amount of the depreciation up to December 31, 2019, recognized with the reclassification of property, plant and equipment
out of assets of disposal group held for sale (see Note 3); cost of goods sold and other expense include restructuring and other charges related to the Group-wide rationalization of manufacturing sites; cost of goods sold, selling, general and administration, other income and other expense include other restructuring income and charges and related items; selling, general and administration also includes expenses related to COVID-19 donations and adjustments to provisions; other income includes net gains from the divestment of a product and adjustments to provisions; other expense includes a legal provision and legal-related items

62
CORE RESULTS – Reconciliation from IFRS results to core results – CorporateFourth quarter
Acquisition or
Amortization divestment of
Q4 2020 of intangible businesses and Other Q4 2020 Q4 2019
(USD millions) IFRS results assets Impairments related items 1 items 2 Core results Core results
Gross profit 27 27 32
Operating loss -114 4 -129 -239 -177
The following are adjustments to arrive at core operating loss
Other income 128 -6 -212 -90 -22
Other expense -128 10 83 -35 -41
1 Acquisition or divestment of businesses and related items, including restructuring and integration charges: other income and other expense include transitional service fee income and expenses related to the Alcon distribution
2 Other items: other income and other expense include fair value adjustments and divestment gains and losses on financial assets, adjustments to environmental provisions and restructuring income and charges and related items; other income also includes a fair value adjustment on a contingent receivable and adjustments to provisions
Full year
Acquisition or
Amortization divestment of
FY 2020 of intangible businesses and Other FY 2020 FY 2019
(USD millions) IFRS results assets Impairments related items 1 items 2 Core results Core results
Gross profit 245 -136 109 112
Operating loss -63 16 -516 -563 -632
The following are adjustments to arrive at core gross profit
Other revenues 168 -136 32 24
The following are adjustments to arrive at core operating loss
Other income 644 -73 -586 -15 21
Other expense -488 89 206 -193 -231
1 Acquisition or divestment of businesses and related items, including restructuring and integration charges: other income and other expense include transitional service fee income and expenses related to the Alcon distribution
2 Other items: other revenues includes a settlement of royalties; other income and other expense include fair value adjustments and divestment gains and losses on financial assets, adjustments to environmental provisions and restructuring income and charges and related items; other income also includes a fair value adjustment on a contingent receivable and adjustments to provisions; other expense includes adjustments to legal provisions and expenses related to COVID-19 donations

63
CORE RESULTS – Reconciliation from IFRS results to core results – Discontinued operations 2019Fourth quarter
As the Alcon spin-off was completed on April 9, 2019, there were no results of operations from the Alcon busi-ness in Q4 2019.
Full year
Acquisition
or divestment
Amortization of businesses
FY 2019 of intangible and related Other FY 2019
(USD millions) IFRS results assets 1 Impairments items 2 items 3 Core results
Gross profit 949 165 9 1 123
Operating income of discontinued operations 71 167 112 350
Income before taxes of discontinued operations 58 337
Taxes 4 -159 -59
Net loss/income from discontinued operations
before gain on distribution of Alcon Inc.
to Novartis AG shareholders -101 278
Gain on distribution of Alcon Inc.
to Novartis AG shareholders 4 691 -4 691
Net income from discontinued operations 4 590 278
Basic EPS (USD) 5 2.00 0.12
The following are adjustments to arrive at core gross profit
Cost of goods sold -860 165 9 -686
The following are adjustments to arrive at core operating income
Selling, general and administration -638 14 -624
Research and development -142 2 4 -136
Other income 15 -3 12
Other expense -113 88 -25
1 Amortization of intangible assets: cost of goods sold includes the amortization of acquired rights to currently marketed products and other production-related intangible assets; research and development includes the amortization of acquired rights for technologies
2 Acquisition or divestment of businesses and related items represents the non-taxable non-cash gain adjustment related to the distribution of Alcon Inc. (spin-off) to Novartis AG shareholders
3 Other items: cost of goods sold, selling, general and administration, research and development and other expense include other restructuring charges and related items; research and development also includes amortization of option rights and the fair value adjustment of a contingent consideration liability; other income includes fair value adjustments on a financial asset; other expense also includes legal-related items
4 Taxes on the adjustments between IFRS and core results take into account, for each individual item included in the adjustment, the tax rate that will finally be applicable to the item based on the jurisdiction where the adjustment will finally have a tax impact. Generally, this results in amortization and impairment of intangible assets and acquisition-related restructuring and integration items having a full tax impact. There is usually a tax impact on other items, although this is not always the case for items arising from legal settlements in certain jurisdictions. Due to these factors and the differing effective tax rates in the various jurisdictions, the tax on the total adjustments, excluding the non-taxable non-cash gain on the distribution (spin-off) of Alcon Inc. to Novartis AG shareholders of USD 279 million to arrive at the core results before tax amounts to USD 100 million. The 2019 core tax rate, excluding the effect of the gain on the distribution of Alcon Inc. to Novartis AG shareholders, is 17.5%.
5 Earnings per share (EPS) is calculated on the amount of net income attributable to shareholders of Novartis AG.

64
Income from associated companies
(USD millions) Q4 2020 Q4 2019 FY 2020 FY 2019
Share of estimated Roche reported results 187 215 913 910
Prior-year adjustment -64 -129
Amortization of additional intangible assets
recognized by Novartis on initial accounting
for the equity interest -45 -63 -172 -162
Partial release of deferred tax liability recognized 43
Net income effect from Roche Holding AG 142 152 677 662
Others -1 -2 -4 -3
Income from associated companies 141 150 673 659
Core income from associated companies
(USD millions) Q4 2020 Q4 2019 FY 2020 FY 2019
Income from associated companies 141 150 673 659
Share of estimated Roche core adjustments 88 92 322 266
Roche prior year adjustment 102 161
Core income from associated companies 229 242 1 097 1 086
Net debt
Novartis calculates net debt as current financial debts and derivative financial instruments plus non-current financial debt less cash and cash equivalents and mar-ketable securities, commodities, time deposits and deriv-ative financial instruments.
Net debt is a non-IFRS measure, which means it should not be interpreted as a measure determined under IFRS. Net debt is presented as additional informa-tion because management believes it is a useful supple-mental indicator of the Group’s ability to pay dividends, to meet financial commitments, and to invest in new stra-tegic opportunities, including strengthening its balance sheet.
Condensed consolidated changes in net debt – Fourth quarter
(USD millions) Q4 2020 Q4 2019
Change in cash and cash equivalents 664 2 734
Change in marketable securities, commodities,
financial debts and financial derivatives 209 759
Change in net debt 873 3 493
Net debt at October 1 -25 354 -19 431
Net debt at December 31 -24 481 -15 938
Condensed consolidated changes in net debt – Full year
(USD millions) FY 2020 FY 2019
Change in cash and cash equivalents -1 454 -2 159
Change in marketable securities, commodities,
financial debts and financial derivatives -7 089 2 405
Change in net debt -8 543 246
Net debt at January 1 -15 938 -16 184
Net debt at December 31 -24 481 -15 938
Components of net debt
Dec 31, Dec 31,
(USD millions) 2020 2019
Non-current financial debts -26 259 -20 353
Current financial debts and derivative
financial instruments -9 785 -7 031
Total financial debt -36 044 -27 384
Less liquidity:
Cash and cash equivalents 9 658 11 112
Marketable securities, commodities,
time deposits and derivative
financial instruments 1 905 334
Total liquidity 11 563 11 446
Net debt at December 31 -24 481 -15 938
Share information
Dec 31, Dec 31,
2020 2019
Number of shares outstanding 2 256 822 048 2 265 008 488
Registered share price (CHF) 83.65 91.90
ADR price (USD) 94.43 94.69
Market capitalization (USD billions) 1 214.3 214.8
Market capitalization (CHF billions) 1 188.8 208.2
1 Market capitalization is calculated based on the number of shares outstanding (excluding treasury shares). Market capitalization in USD is based on the market capitalization in CHF converted at the quarter end CHF/USD exchange rate.

65
Free cash flow
Novartis defines free cash flow as net cash flows from operating activities and cash flows from investing activ-ities associated with purchases and sales of property, plant and equipment, of intangible assets, of financial assets and of other non-current assets. Excluded from free cash flow are cash flows from investing activities associated with acquisitions and divestments of busi-nesses and of interests in associated companies, pur-chases and sales of marketable securities and commod-ities and net cash flows from financing activities.
Free cash flow is a non-IFRS measure and is not intended to be a substitute measure for net cash flows
from operating activities as determined under IFRS. Free cash flow is presented as additional information because management believes it is a useful supplemental indica-tor of the Group’s ability to operate without reliance on additional borrowing or use of existing cash. Free cash flow is a measure of the net cash generated that is avail-able for investment in strategic opportunities, returning to shareholders and for debt repayment. Free cash flow is a non-IFRS measure, which means it should not be interpreted as a measure determined under IFRS.
Fourth quarter
(USD millions) Q4 2020 Q4 2019
Operating income from continuing operations 2 644 1 823
Adjustments for non-cash items
Depreciation, amortization and impairments 1 548 1 948
Change in provisions and other non-current liabilities 75 471
Other -171 -363
Operating income adjusted for non-cash items 4 096 3 879
Dividends received from associated companies and others 1 0
Interest and other financial receipts 181 9
Interest and other financial payments -232 -261
Taxes paid -618 -681
Payments out of provisions and other net cash movements in non-current liabilities -645 -262
Change in inventory and trade receivables less trade payables 1 000 480
Change in other net current assets and other operating cash flow items 222 376
Net cash flows from operating activities from continuing operations 4 005 3 540
Purchases of property, plant and equipment -521 -461
Proceeds from sale of property, plant and equipment 82 48
Purchases of intangible assets -502 -175
Proceeds from sale of intangible assets 176 552
Purchases of financial assets -105 -79
Proceeds from sale of financial assets 1 212 90
Purchases of other non-current assets -7 -26
Proceeds from sale of other non-current assets 2 -1
Free cash flow from continuing operations 3 342 3 488
Total free cash flow 3 342 3 488
1 For the fourth quarter of 2020 free cash flow, proceeds from the sales of financial assets excludes the cash inflows from the sale of a portion of the Alcon Inc. shares recognized by certain consolidated foundations through the Alcon spin-off, which amounted to USD 44 million (Q4 2019: USD 320 million). See Note 3.

66
Free cash flow Full year
(USD millions) FY 2020 FY 2019
Operating income from continuing operations 10 152 9 086
Adjustments for non-cash items
Depreciation, amortization and impairments 6 129 5 788
Change in provisions and other non-current liabilities 1 411 1 871
Other 260 -476
Operating income adjusted for non-cash items 17 952 16 269
Dividends received from associated companies and others 490 463
Interest and other financial receipts 511 242
Interest and other financial payments -742 -826
Taxes paid -1 833 -1 876
Payments out of provisions and other net cash movements in non-current liabilities -2 437 -924
Change in inventory and trade receivables less trade payables -730 -809
Change in other net current assets and other operating cash flow items 439 1 008
Net cash flows from operating activities from continuing operations 13 650 13 547
Purchases of property, plant and equipment -1 275 -1 379
Proceeds from sale of property, plant and equipment 88 857
Purchases of intangible assets -1 310 -878
Proceeds from sale of intangible assets 380 973
Purchases of financial assets -230 -302
Proceeds from sale of financial assets 1 447 176
Purchases of other non-current assets -61 -60
Proceeds from sale of other non-current assets 2 3
Free cash flow from continuing operations 11 691 12 937
Free cash flow from discontinued operations 2 -62
Total free cash flow 11 691 12 875
1 For the free cash flow, proceeds from the sales of financial assets excludes the cash inflows from the sale of a portion of the Alcon Inc. shares received by certain consolidated foundations through the Alcon spin-off, which amounted to USD 276 million (2019: USD 976 million). See Note 3.
2 In 2019, the free cash flow from discontinued operations was a cash outflow of USD 62 million consisting of USD 78 million net cash inflows from operating activities from discontinued operations, USD 1.2 billion net cash flows used in investing activities from discontinued operations adjusted by USD 362 million of net cash outflows for acquisition and divestments of businesses and by USD 657 million for cash outflows attributable to the spin-off of the Alcon business.

67
Effects of currency fluctuations
Principal currency translation rates
Period-end Period-end
Average Average Average Average rates rates
rates rates rates rates Dec 31, Dec 31,
(USD per unit) Q4 2020 Q4 2019 FY 2020 FY 2019 2020 2019
1 CHF 1.106 1.010 1.066 1.006 1.135 1.032
1 CNY 0.151 0.142 0.145 0.145 0.153 0.144
1 EUR 1.192 1.107 1.141 1.120 1.229 1.121
1 GBP 1.320 1.287 1.283 1.277 1.365 1.313
100 JPY 0.957 0.920 0.937 0.918 0.970 0.920
100 RUB 1.312 1.569 1.389 1.546 1.337 1.613
Currency impact on key figures The following table provides a summary of the currency impact on key Group figures due to their conversion into US dollars, the Group’s reporting currency, of the financial data from entities reporting in non-US dollars. Constant currency (cc) calculations apply the exchange rates of the prior year period to the current period financial data for entities reporting in non-US dollars. Fourth quarter
Change in Percentage Change in Percentage
Change in constant point currency Change in constant point currency
USD % currencies % impact USD % currencies % impact
Q4 2020 Q4 2020 Q4 2020 Q4 2019 Q4 2019 Q4 2019
Total Group – Continuing operations
Net sales to third parties 3 1 2 8 9 -1
Operating income 45 51 -6 34 37 -3
Net income 86 93 -7 -7 -6 -1
Basic earnings per share (USD) 84 93 -9 -6 -4 -2
Core operating income 1 2 -1 11 13 -2
Core net income 2 3 -1 11 13 -2
Core basic earnings per share (USD) 2 3 -1 14 15 -1
Innovative Medicines
Net sales to third parties 3 1 2 10 11 -1
Operating income 8 12 -4 70 73 -3
Core operating income 3 3 0 13 14 -1
Sandoz
Net sales to third parties 2 0 2 1 2 -1
Operating income nm nm nm nm nm nm
Core operating income 2 3 -1 7 10 -3
Corporate
Operating loss 41 45 -4 -10 -11 1
Core operating loss -35 -28 -7 -27 -29 2
nm = not meaningful

68
Currency impact on key figuresFull year
Change in Percentage Change in Percentage
Change in constant point currency Change in constant point currency
USD % currencies % impact USD % currencies % impact
FY 2020 FY 2020 FY 2020 FY 2019 FY 2019 FY 2019
Total Group – Continuing operations
Net sales to third parties 3 3 0 6 9 -3
Operating income 12 19 -7 8 14 -6
Net income 13 20 -7 -44 -41 -3
Basic earnings per share (USD) 14 21 -7 -43 -40 -3
Core operating income 9 13 -4 12 17 -5
Core net income 9 12 -3 11 15 -4
Core basic earnings per share (USD) 9 13 -4 12 17 -5
Innovative Medicines
Net sales to third parties 3 4 -1 8 11 -3
Operating income -1 4 -5 18 24 -6
Core operating income 8 11 -3 13 18 -5
Sandoz
Net sales to third parties -1 0 -1 -1 2 -3
Operating income 89 106 -17 -59 -53 -6
Core operating income 11 15 -4 5 10 -5
Corporate
Operating loss nm nm nm 6 4 2
Core operating loss 11 14 -3 -6 -9 3
nm = not meaningful

__ 69
Disclaimer This press release contains forward-looking statements within the meaning of the United States Private Securities Litigation Reform Act of 1995, that can generally be identified by words such as “next wave,” “transformative,” “continuing,” “progressing,” “guidance,” “will result,” “looking ahead,” “confident,” “progress,” “to execute,” “continue,” “expect,” “remains,” “to maintain,” “continues,” “to evolve,” “to take,” “to help,” “remain,” “remains,” “to grow,” “continues,” “to evolve,” “continue,” “to help,” “remain,” “to meet,” “ongoing,” “allowing,” “launch,” “addresses,” “to work,” “undertaking,” “to develop,” “investigating,” “growing,” “growth,” “to support,” “expected,” “to be,” “assume,” “would,” “estimates,” “to advance,” “to solidify,” “committed,” “enabling” “to progress,” “allowing,” “anticipate,” “pipelines,” “to supplement,” “investigational,” “taking,” “will,” “estimated,” “impact,” “submissions,” “focus,” “launches,” “innovation,” “potential,” “pipeline,” “priority,” “outlook,” “unforeseen,” “forecast,” “prevail,” “enter,” “to improve,” “transformative,” “manageable disruptions,” “ongoing disruptions,” “to delay,” or similar expressions, or by express or implied discussions regarding potential new products, potential new indications for existing products, potential product launches, or regarding potential future revenues from any such products; or regarding the impact of the COVID-19 pandemic on certain therapeutic areas including dermatology, ophthalmology and the Sandoz retail business, and on drug development operations; or regarding potential future, pending or announced transactions; regarding potential future sales or earnings of the Group or any of its divisions; or by discussions of strategy, plans, expectations or intentions; or regarding the Group’s liquidity or cash flow positions and its ability to meet its ongoing financial obligations and operational needs; or regarding our not-for-profit portfolio of 15 medicines from the Sandoz division for symptomatic treatment of COVID-19 and our collaboration with Molecular Partners to develop, manufacture and commercialize potential medicines for the prevention and treatment of COVID-19. Such forward-looking statements are based on the current beliefs and expectations of management regarding future events, and are subject to significant known and unknown risks and uncertainties. Should one or more of these risks or uncertainties materialize, or should underlying assumptions prove incorrect, actual results may vary materially from those set forth in the forward-looking statements. You should not place undue reliance on these statements. In particular, our expectations could be affected by, among other things: liquidity or cash flow disruptions affecting our ability to meet our ongoing financial obligations and to support our ongoing business activities; the impact of the COVID-19 pandemic on enrollment in, initiation and completion of our clinical trials in the future, and research and development timelines; the impact of a partial or complete failure of the return to normal global healthcare systems including prescription dynamics by mid 2021; global trends toward healthcare cost containment, including ongoing government, payer and general public pricing and reimbursement pressures and requirements for increased pricing transparency; uncertainties regarding potential significant breaches of data security or data privacy, or disruptions of our information technology systems; regulatory actions or delays or government regulation generally, including potential regulatory actions or delays with respect to the development of the products described in this press release; the potential that the strategic benefits, synergies or opportunities expected from the transactions described, including BeiGene, may not be realized or may be more difficult or take longer to realize than expected; the uncertainties in the research and development of new healthcare products, including clinical trial results and additional analysis of existing clinical data; our ability to obtain or maintain proprietary intellectual property protection, including the ultimate extent of the impact on Novartis of the loss of patent protection and exclusivity on key products; safety, quality, data integrity, or manufacturing issues; uncertainties involved in the development or adoption of potentially transformational technologies and business models; uncertainties regarding actual or potential legal proceedings, investigations or disputes; our performance on environmental, social and governance measures; general political, economic and business conditions, including the effects of and efforts to mitigate pandemic diseases such as COVID-19; uncertainties regarding future global exchange rates; uncertainties regarding future demand for our products; and other risks and factors referred to in Novartis AG’s current Form 20-F on file with the US Securities and Exchange Commission. Novartis is providing the information in this press release as of this date and does not undertake any obligation to update any forward-looking statements as a result of new information, future events or otherwise. All product names appearing in italics are trademarks owned by or licensed to Novartis Group companies.

__ 70
About Novartis Novartis is reimagining medicine to improve and extend people’s lives. As a leading global medicines company, we use innovative science and digital technologies to create transformative treatments in areas of great medical need. In our quest to find new medicines, we consistently rank among the world’s top companies investing in research and development. Novartis products reach nearly 800 million people globally and we are finding innovative ways to expand access to our latest treatments. About 110,000 people of more than 140 nationalities work at Novartis around the world. Find out more at https://www.novartis.com. Novartis will conduct a conference call with investors to discuss this news release today at 14:00 Central European time and 9:00 Eastern Time. A simultaneous webcast of the call for investors and other interested parties may be accessed by visiting the Novartis website. A replay will be available after the live webcast by visiting https://www.novartis.com/investors/event-calendar. Detailed financial results accompanying this press release are included in the condensed financial report at the link below. Additional information is provided on Novartis divisions and pipeline of selected compounds in late stage development and a copy of today's earnings call presentation can be found at https://www.novartis.com/investors/event-calendar. Novartis issued its 2020 Annual Report today, and it is available at www.novartis.com. Novartis will also file its 2020 Annual Report on Form 20-F with the US Securities and Exchange Commission today, and will post this document on www.novartis.com. Novartis shareholders may receive a hard copy of either of these documents, each of which contains our complete audited financial statements, free of charge, upon request. Novartis also issued its 2020 Novartis in Society ESG Report today, and it is available at www.novartis.com.
Important dates March 2, 2021 Annual General Meeting April 27, 2021 First quarter results July 21, 2021 Second quarter & Half Year 2021 results October 26, 2021 Third quarter & Nine Months 2021 results


