Embed Size (px)
Citation preview

- 1 -
FOURTH QUARTER 2016
EARNINGS RELEASE
ROYAL BANK OF CANADA REPORTS FOURTH QUARTER AND RECORD 2016 RESULTS
All amounts are in Canadian dollars and are based on our audited Annual and unaudited Interim Consolidated Financial Statements for the year and quarter ended October 31, 2016 and related notes prepared in accordance with International Financial Reporting Standards (IFRS). Our 2016 Annual Report (which includes our audited annual Consolidated Financial Statements and accompanying Management’s Discussion & Analysis), our 2016 Annual Information Form and our Supplementary Financial Information are available on our website at: http://www.rbc.com/investorrelations.
TORONTO, November 30, 2016 – Royal Bank of Canada (RY on TSX and NYSE) today reported record net income of $10,458 million
for the year ended October 31, 2016, up $432 million or 4% from a year ago. Results were driven by strong results in Wealth Management, which includes City National Bank (City National), and higher earnings in Insurance, which includes the Q3/16 gain on the sale of our home and auto insurance manufacturing business. Solid results in Personal & Commercial Banking and record earnings in Investor & Treasury Services also contributed to the increase. These factors were partially offset by lower earnings in Capital Markets. Our performance also benefited from our ongoing efficiency management activities. In addition, our provision for credit losses (PCL) ratio of 0.29% was up 5 basis points (bps) primarily as a result of the low oil price environment.
As of October 31, 2016, our capital position was strong, with a Basel III Common Equity Tier 1 (CET1) of 10.8%. In 2016, we increased our quarterly dividend twice, for an annual dividend increase of 5%. “We reported record earnings of $10.5 billion in 2016, driven by the strength of our diversified business model which is focused on our clients and their success. I’m pleased with our performance, which also reflects the successful integration of City National and our commitment to cost and risk management discipline,” said Dave McKay, RBC President and CEO. “Looking ahead, while the industry faces headwinds and an accelerating pace of change, we believe we are well positioned to deliver long-term shareholder value by leveraging innovation, our values-based culture which supports strong client relationships, and prudent capital and risk management.”
2016 compared to 2015
Net income of $10,458 million (up 4% from $10,026 million)
Diluted earnings per share (EPS) of $6.78 (up $0.05 from $6.73)
Return on common equity (ROE)(1)
of 16.3% (down from 18.6%)
Basel III CET1 ratio of 10.8% (up from 10.6%)
2016 Business Segment Performance
4% earnings growth in Personal & Commercial Banking, largely reflecting solid volume growth across most businesses partially offset by lower spreads, higher fee-based revenue in Canadian Banking, and higher earnings in the Caribbean. These factors were partially offset by higher costs in support of business growth and higher PCL in Canada. In Canadian Banking, we continued to improve our efficiency ratio to 43.4%, reflecting the benefits of our prudent cost management;
41% earnings growth in Wealth Management, primarily reflecting the inclusion of our acquisition of City National, lower restructuring costs related to our International Wealth Management business, and benefits from our efficiency management activities;
27% earnings growth in Insurance. Excluding the gain on sale of our home and auto insurance manufacturing business, earnings were down 6%
(2) mainly due to lower earnings from new U.K. annuity contracts and the reduction in earnings from the sale of our
home and auto insurance manufacturing business;
10% earnings growth in Investor & Treasury Services primarily due to higher funding and liquidity earnings, and higher client deposit spreads; and
2% lower earnings in Capital Markets, driven by higher PCL, and lower results in our Global Markets and Corporate and Investment Banking businesses, partially offset by lower variable compensation and the favourable impact of foreign exchange translation.
1 ROE does not have a standardized meaning under GAAP. For further information, refer to the Key performance and non-GAAP measures section on page 11 of this Earnings Release.
2 Results and measures excluding the gain on the sale of our home and auto insurance manufacturing business are non-GAAP measures. For further information, including a reconciliation, refer to the Key performance and non-GAAP section on page 11 of this Earnings Release.

- 2 -
Q4 2016 Performance
Earnings of $2,543 million were down $50 million or 2% from a year ago, as the prior year benefited from a lower effective tax rate reflecting favourable income tax adjustments mainly in Corporate Support and Capital Markets. This was mostly offset by strong earnings in Wealth Management, largely reflecting the inclusion of City National, and record earnings in Investor & Treasury Services. Results in Personal & Commercial Banking and Insurance were relatively flat. Earnings were down $352 million, or 12% from last quarter. Excluding the Q3/16 after-tax gain of $235 million from the sale of our home and auto insurance manufacturing business, earnings were down $117 million or 4%(3) due to lower earnings in Capital Markets and Personal & Commercial Banking which were partially offset by strong earnings in Insurance and Investor & Treasury Services, and higher earnings in Wealth Management. Q4 2016 Business Segment Performance Personal & Commercial Banking net income of $1,275 million was up $5 million from a year ago. Canadian Banking net income was
$1,246 million, up $19 million or 2% from a year ago, mainly reflecting solid volume growth across most businesses partially offset by lower spreads, and higher fee-based revenue. These factors were partially offset by higher PCL, higher technology spend and higher costs in support of business growth. Caribbean & U.S. Banking net income of $29 million was down $14 million or 33% from a year ago largely due to higher costs in support of business growth partially offset by higher fee-based revenue. Compared to last quarter, Personal & Commercial Banking net income was down $47 million or 4%. Canadian Banking net income was down $38 million or 3%, mainly driven by higher initiatives and technology spend, and seasonally higher marketing costs. These factors were partially offset by volume growth across most businesses and fee-based revenue growth primarily attributable to higher mutual fund distribution fees. Caribbean & U.S. Banking net income was down $9 million. Wealth Management net income of $396 million was up $141 million or 55% from a year ago, largely reflecting the inclusion of City
National, which contributed $89 million to net income, lower restructuring costs and higher earnings due to growth in average fee-based client assets. Excluding amortization of intangibles and integration costs of $29 million ($49 million before-tax) and $9 million ($16 million before-tax) respectively, City National contributed $127 million(4) to net income. Compared to last quarter, net income was up $8 million or 2%, primarily driven by higher earnings from growth in average fee-based client assets and a higher contribution from City National. Insurance net income of $228 million was up $3 million or 1% from a year ago, mainly reflecting higher earnings from new U.K. annuity
contracts. These factors were partially offset by lower results due to the sale of our home and auto insurance manufacturing business, as noted above, and the impact of foreign exchange translation. Compared to last quarter, net income was down $136 million or 37%. Excluding the Q3/16 gain from the sale of our home and auto insurance manufacturing business, as noted above, net income increased $99 million(3), mainly due to favourable actuarial adjustments reflecting management actions and assumption changes, and growth in International insurance, including earnings from new U.K. annuity contracts. Investor & Treasury Services net income of $174 million was up $86 million from a year ago, largely due to higher funding and
liquidity earnings reflecting tightening credit spreads and favourable interest rate movements, and higher client deposit spreads. These factors were partially offset by higher staff costs, a higher effective tax rate and increased investment in technology initiatives. Compared to last quarter, net income was up $17 million or 11%, primarily due to higher funding and liquidity earnings reflecting tightening credit spreads and favourable interest rate movements.
3 Results and measures excluding the gain on the sale of our home and auto insurance manufacturing business are non-GAAP measures. For further information, including a
reconciliation, refer to the Key performance and non-GAAP section on page 11 of this Earnings Release. 4 City National results excluding amortization of intangibles and integration costs is a non-GAAP measure that we believe provides readers with a better understanding of
management’s perspective on our performance. For further information, including a reconciliation, refer to the Key performance and non-GAAP section on page 11 of this Earnings Release.
Q4 2016 compared to Q4 2015
Net income of $2,543 million (down 2% from $2,593 million)
Diluted EPS of $1.65 (down $0.09 from $1.74)
ROE of 15.5% (down from 17.9%)
Q4 2016 compared to Q3 2016
Net income of $2,543 million (down 12% from $2,895 million)
Diluted EPS of $1.65 (down $0.23 from $1.88)
ROE of 15.5% (down from 18.0%)
Excluding specified item: Q4 2016 compared to Q3 2016
Net income of $2,543 million(3) (down 4% from $2,660 million)
Diluted EPS of $1.65(3) (down $0.07 from $1.72)

- 3 -
Capital Markets net income of $482 million was down $73 million or 13% from a year ago, as the prior year benefited from a lower
effective tax rate reflecting income tax adjustments related to the prior periods. In the current quarter, higher results in our Corporate and Investment Banking and Global Markets businesses were partially offset by higher variable compensation on improved results. Compared to last quarter, net income was down $153 million or 24%, mainly due to lower trading revenue and lower equity origination activity. These factors were partially offset by increased loan syndication revenue largely in the U.S. Corporate Support net loss was $12 million largely reflecting net unfavourable tax adjustments, partially offset by asset/liability
management activities. Net income last quarter was $29 million, largely reflecting asset/liability management activities. Capital – As at October 31, 2016, Basel III CET1 ratio was 10.8%, up 30 bps compared to last quarter largely due to internal capital
generation. Credit Quality – Total PCL of $358 million was up $83 million or 30% from a year ago, largely due to Canadian Banking, Wealth
Management reflecting the inclusion of City National, and Capital Markets. PCL was up $40 million or 13% compared to last quarter, largely due to higher PCL in Capital Markets, Personal & Commercial Banking and Wealth Management. Our PCL ratio of 0.27% increased 4 bps from a year ago and 3 bps compared to last quarter. Total gross impaired loans (GIL) of $3,903 million were up $1,618 million from a year ago largely due to higher impaired oil and gas loans in Capital Markets and the inclusion of City National. GIL was up $187 million from last quarter due to higher impaired loans in Capital Markets. Our GIL ratio of 0.73% increased 26 bps from a year ago and 3 bps compared to last quarter.
- 4 -
Selected financial and other highlights
As at or for the three months ended For the year ended
October 31 July 31 October 31 October 31 October 31
(Millions of Canadian dollars, except per share, number of and percentage amounts) 2016 2016 2015 2016 2015
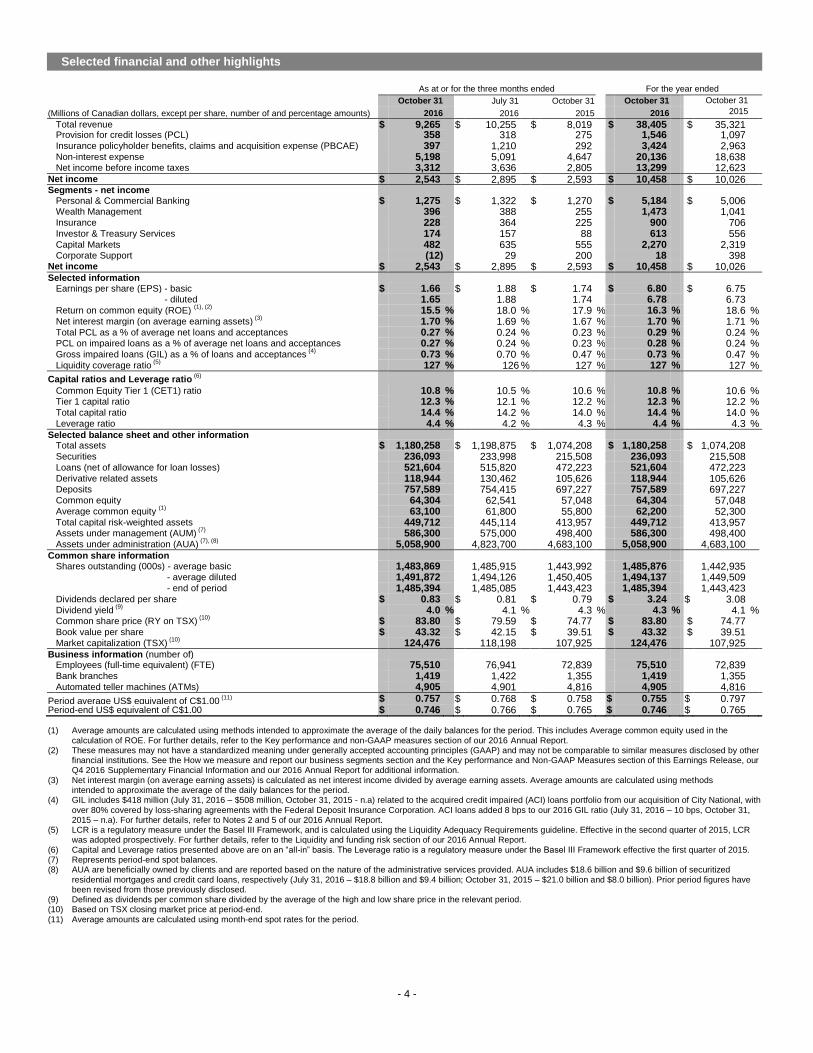
Total revenue $ 9,265 $ 10,255 $ 8,019 $ 38,405 $ 35,321 Provision for credit losses (PCL) 358 318 275 1,546 1,097
Insurance policyholder benefits, claims and acquisition expense (PBCAE) 397 1,210 292 3,424 2,963
Non-interest expense 5,198 5,091 4,647 20,136 18,638 Net income before income taxes 3,312 3,636 2,805 13,299 12,623
Net income $ 2,543 $ 2,895 $ 2,593 $ 10,458 $ 10,026 Segments - net income Personal & Commercial Banking $ 1,275 $ 1,322 $ 1,270 $ 5,184 $ 5,006 Wealth Management 396 388 255 1,473 1,041
Insurance 228 364 225 900 706
Investor & Treasury Services 174 157 88 613 556
Capital Markets 482 635 555 2,270 2,319
Corporate Support (12) 29 200 18 398 Net income $ 2,543 $ 2,895 $ 2,593 $ 10,458 $ 10,026
Selected information Earnings per share (EPS) - basic $ 1.66 $ 1.88 $ 1.74 $ 6.80 $ 6.75 - diluted 1.65 1.88 1.74 6.78 6.73
Return on common equity (ROE) (1), (2)
15.5 % 18.0 % 17.9 % 16.3 % 18.6 %
Net interest margin (on average earning assets) (3)
1.70 % 1.69 % 1.67 % 1.70 % 1.71 %
Total PCL as a % of average net loans and acceptances 0.27 % 0.24 % 0.23 % 0.29 % 0.24 %
PCL on impaired loans as a % of average net loans and acceptances 0.27 % 0.24 % 0.23 % 0.28 % 0.24 %
Gross impaired loans (GIL) as a % of loans and acceptances (4)
0.73 % 0.70 % 0.47 % 0.73 % 0.47 %
Liquidity coverage ratio (5)
127 % 126 % 127 % 127 % 127 %
Capital ratios and Leverage ratio (6)
Common Equity Tier 1 (CET1) ratio 10.8 % 10.5 % 10.6 % 10.8 % 10.6 % Tier 1 capital ratio 12.3 % 12.1 % 12.2 % 12.3 % 12.2 %
Total capital ratio 14.4 % 14.2 % 14.0 % 14.4 % 14.0 %
Leverage ratio 4.4 % 4.2 % 4.3 % 4.4 % 4.3 %
Selected balance sheet and other information Total assets $ 1,180,258 $ 1,198,875 $ 1,074,208 $ 1,180,258 $ 1,074,208
Securities 236,093 233,998 215,508 236,093 215,508
Loans (net of allowance for loan losses) 521,604 515,820 472,223 521,604 472,223
Derivative related assets 118,944 130,462 105,626 118,944 105,626 Deposits 757,589 754,415 697,227 757,589 697,227
Common equity 64,304 62,541 57,048 64,304 57,048
Average common equity (1)
63,100 61,800 55,800 62,200 52,300
Total capital risk-weighted assets 449,712 445,114 413,957 449,712 413,957 Assets under management (AUM)
(7) 586,300 575,000 498,400 586,300 498,400
Assets under administration (AUA) (7), (8)
5,058,900 4,823,700 4,683,100 5,058,900 4,683,100
Common share information Shares outstanding (000s) - average basic 1,483,869 1,485,915 1,443,992 1,485,876 1,442,935
- average diluted 1,491,872 1,494,126 1,450,405 1,494,137 1,449,509
- end of period 1,485,394 1,485,085 1,443,423 1,485,394 1,443,423
Dividends declared per share $ 0.83 $ 0.81 $ 0.79 $ 3.24 $ 3.08
Dividend yield (9)
4.0 % 4.1 % 4.3 % 4.3 % 4.1 % Common share price (RY on TSX)
(10) $ 83.80 $ 79.59 $ 74.77 $ 83.80 $ 74.77
Book value per share $ 43.32 $ 42.15 $ 39.51 $ 43.32 $ 39.51
Market capitalization (TSX) (10)
124,476 118,198 107,925 124,476 107,925
Business information (number of) Employees (full-time equivalent) (FTE) 75,510 76,941 72,839 75,510 72,839
Bank branches 1,419 1,422 1,355 1,419 1,355
Automated teller machines (ATMs) 4,905 4,901 4,816 4,905 4,816
Period average US$ equivalent of C$1.00 (11)
$ 0.757 $ 0.768 $ 0.758 $ 0.755 $ 0.797
Period-end US$ equivalent of C$1.00 $ 0.746 $ 0.766 $ 0.765 $ 0.746 $ 0.765
(1) Average amounts are calculated using methods intended to approximate the average of the daily balances for the period. This includes Average common equity used in the calculation of ROE. For further details, refer to the Key performance and non-GAAP measures section of our 2016 Annual Report.
(2) These measures may not have a standardized meaning under generally accepted accounting principles (GAAP) and may not be comparable to similar measures disclosed by other financial institutions. See the How we measure and report our business segments section and the Key performance and Non-GAAP Measures section of this Earnings Release, our Q4 2016 Supplementary Financial Information and our 2016 Annual Report for additional information.
(3) Net interest margin (on average earning assets) is calculated as net interest income divided by average earning assets. Average amounts are calculated using methods intended to approximate the average of the daily balances for the period.
(4) GIL includes $418 million (July 31, 2016 – $508 million, October 31, 2015 - n.a) related to the acquired credit impaired (ACI) loans portfolio from our acquisition of City National, with over 80% covered by loss-sharing agreements with the Federal Deposit Insurance Corporation. ACI loans added 8 bps to our 2016 GIL ratio (July 31, 2016 – 10 bps, October 31, 2015 – n.a). For further details, refer to Notes 2 and 5 of our 2016 Annual Report.
(5) LCR is a regulatory measure under the Basel III Framework, and is calculated using the Liquidity Adequacy Requirements guideline. Effective in the second quarter of 2015, LCR was adopted prospectively. For further details, refer to the Liquidity and funding risk section of our 2016 Annual Report.
(6) Capital and Leverage ratios presented above are on an “all-in” basis. The Leverage ratio is a regulatory measure under the Basel III Framework effective the first quarter of 2015. (7) Represents period-end spot balances. (8) AUA are beneficially owned by clients and are reported based on the nature of the administrative services provided. AUA includes $18.6 billion and $9.6 billion of securitized
residential mortgages and credit card loans, respectively (July 31, 2016 – $18.8 billion and $9.4 billion; October 31, 2015 – $21.0 billion and $8.0 billion). Prior period figures have been revised from those previously disclosed.
(9) Defined as dividends per common share divided by the average of the high and low share price in the relevant period. (10) Based on TSX closing market price at period-end. (11) Average amounts are calculated using month-end spot rates for the period.
- 5 -
Personal & Commercial Banking As at or for the three months ended
October 31 July 31 October 31
(Millions of Canadian dollars, except number of and percentage amounts and as otherwise noted) 2016 2016 2015
Net interest income $ 2,640 $ 2,598 $ 2,569
Non-interest income 1,144 1,137 1,080
Total revenue 3,784 3,735 3,649
PCL 288 271 240
Non-interest expense 1,780 1,687 1,717
Net income before income taxes 1,716 1,777 1,692
Net income $ 1,275 $ 1,322 $ 1,270
Revenue by business Canadian Banking 3,532 3,499 3,409 Caribbean & U.S. Banking 252 236 240
Selected balances and other information ROE 27.1% 28.0% 29.1%
NIM (1) 2.69% 2.68% 2.70%
Efficiency ratio (2) 47.0% 45.2% 47.1%
Operating leverage 0.0% 0.6% 1.0%
Average total assets $ 409,000 $ 405,000 $ 395,100
Average total earning assets 391,000 386,000 377,300
Average loans and acceptances 390,000 384,700 375,400
Average deposits 329,700 321,300 307,000
AUA (3) $ 239,600 $ 235,300 $ 223,500
AUM 4,600 4,400 4,800
Number of employees (FTE) (4) 33,896 34,828 35,211
Effective income tax rate 25.7% 25.6% 24.9%
Gross impaired loans as a % of average net loans and acceptances 0.42% 0.43% 0.48%
PCL on impaired loans as a % of average net loans and acceptances 0.29% 0.28% 0.25%
(1) Calculated as net interest income divided by average total earning assets. (2) Calculated as non-interest expense divided by total revenue. (3) AUA represents period-end spot balances and includes securitized residential mortgages and credit card loans as at October 31, 2016 of $18.6 billion and $9.6 billion, respectively
(July 31, 2016 – $18.8 billion and $9.4 billion; October 31, 2015 – $21.0 billion and $8.0 billion). (4) Amounts have been revised from those previously presented.
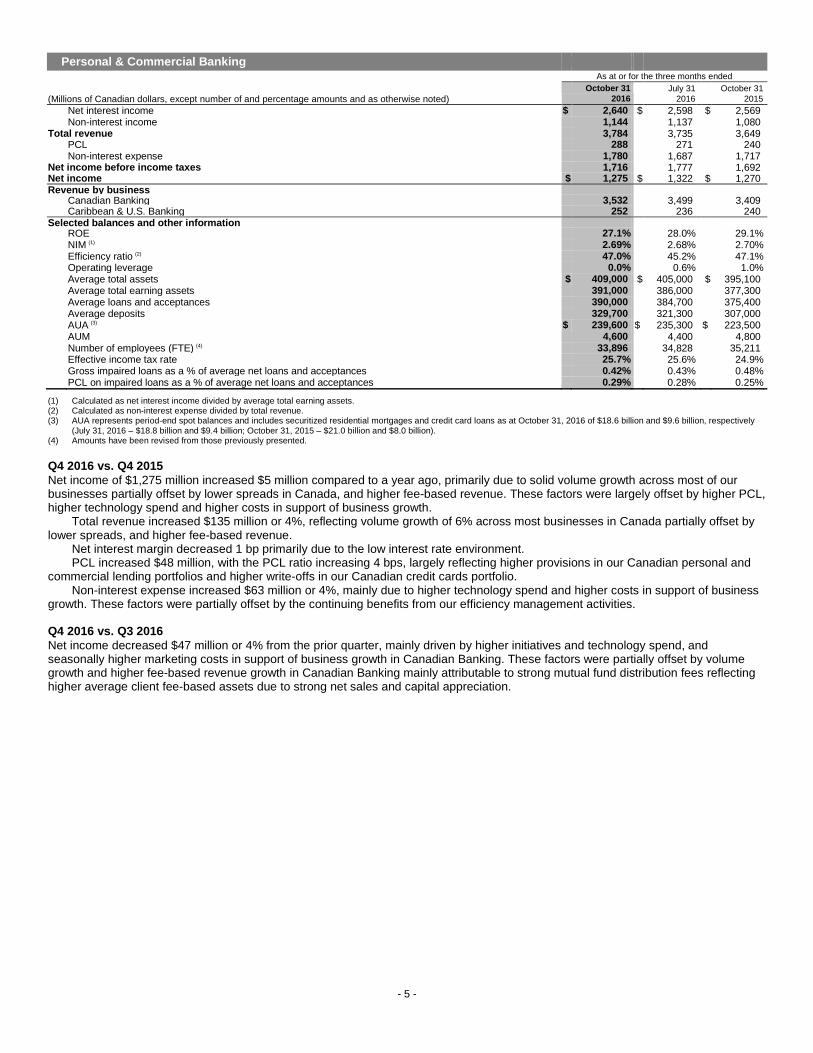
Q4 2016 vs. Q4 2015
Net income of $1,275 million increased $5 million compared to a year ago, primarily due to solid volume growth across most of our businesses partially offset by lower spreads in Canada, and higher fee-based revenue. These factors were largely offset by higher PCL, higher technology spend and higher costs in support of business growth.
Total revenue increased $135 million or 4%, reflecting volume growth of 6% across most businesses in Canada partially offset by lower spreads, and higher fee-based revenue. Net interest margin decreased 1 bp primarily due to the low interest rate environment.
PCL increased $48 million, with the PCL ratio increasing 4 bps, largely reflecting higher provisions in our Canadian personal and commercial lending portfolios and higher write-offs in our Canadian credit cards portfolio.
Non-interest expense increased $63 million or 4%, mainly due to higher technology spend and higher costs in support of business growth. These factors were partially offset by the continuing benefits from our efficiency management activities. Q4 2016 vs. Q3 2016
Net income decreased $47 million or 4% from the prior quarter, mainly driven by higher initiatives and technology spend, and seasonally higher marketing costs in support of business growth in Canadian Banking. These factors were partially offset by volume growth and higher fee-based revenue growth in Canadian Banking mainly attributable to strong mutual fund distribution fees reflecting higher average client fee-based assets due to strong net sales and capital appreciation.

- 6 -
Canadian Banking Table 20 As at or for the three months ended
October 31 July 31 October 31
(Millions of Canadian dollars, except number of and percentage amounts and as otherwise noted) 2016 2016 2015
Net interest income $ 2,471 $ 2,442 $ 2,407
Non-interest income 1,061 1,057 1,002
Total revenue 3,532 3,499 3,409
PCL 276 265 228
Non-interest expense 1,578 1,503 1,529
Net income before income taxes 1,678 1,731 1,652
Net income $ 1,246 $ 1,284 $ 1,227
Revenue by business Personal Financial Services $ 1,997 $ 1,973 $ 1,956 Business Financial Services 811 814 774 Cards and Payment Solutions 724 712 679
Selected balances and other information ROE 32.5% 33.4% 35.2%
NIM(1) 2.63% 2.63% 2.65%
Efficiency ratio(2) 44.7% 43.0% 44.9%
Operating leverage 0.4% 1.4% (1.5)%
Average total assets $ 386,500 $ 382,300 $ 373,000
Average total earning assets 374,300 368,900 360,200
Average loans and acceptances 380,900 375,600 366,100
Average deposits 311,400 302,700 288,800
AUA (3) 231,400 227,400 213,700
Number of employees (FTE) (4) 29,982 30,927 31,057
Effective income tax rate 25.7% 25.8% 25.7%
Gross impaired loans as a % of average net loans and acceptances 0.27% 0.28% 0.29%
PCL on impaired loans as a % of average net loans and acceptances 0.29% 0.28% 0.25%
(1) Calculated as net interest income divided by average total earning assets. (2) Efficiency ratio is calculated as non-interest expense divided by total revenue. (3) AUA represents period-end spot balances and includes securitized residential mortgages and credit card loans as at October 31, 2016 of $18.6 billion and $9.6 billion, respectively
(July 31, 2016 – $18.8 billion and $9.4 billion; October 31, 2015 – $21.0 billion and $8.0 billion). (4) Amounts have been revised from those previously presented. Q4 2016 vs. Q4 2015
Net income increased $19 million or 2% compared to a year ago, primarily due to solid volume growth across most of our businesses partially offset by lower spreads, and higher fee-based revenue. These factors were partially offset by higher PCL, higher technology spend and higher costs in support of business growth. Total revenue increased $123 million or 4%, mainly reflecting volume growth of 6% across most businesses partially offset by lower spreads, and higher fee-based revenue. Fee-based revenue growth is primarily due to higher transaction volumes driving card service revenue, and strong mutual fund distribution fees attributable to higher average client fee-based assets reflecting capital appreciation and strong net sales. Net interest margin decreased 2 bps primarily due to the low interest rate environment.
PCL increased $48 million, with the PCL ratio increasing 4 bps, largely reflecting higher provisions in our personal and commercial lending portfolios and higher write-offs in our credit card portfolio.
Non-interest expense increased $49 million or 3%, mostly due to higher technology spend and increased costs in support of business growth, including marketing spend. These factors were partially offset by the continuing benefits from our efficiency management activities. Q4 2016 vs. Q3 2016
Net income decreased $38 million or 3% from the prior quarter, mainly driven by higher initiatives and technology spend, and seasonally higher marketing costs in support of business growth. These factors were partially offset by volume growth across most businesses and fee-based revenue growth primarily attributable to higher mutual fund distribution fees reflecting higher average client fee-based assets due to strong net sales and capital appreciation.
- 7 -
Wealth Management As at or for the three months ended
October 31 July 31 October 31
(Millions of Canadian dollars, except number of and percentage amounts and as otherwise noted) 2016 2016 2015
Net interest income $ 524 $ 496 $ 118
Non-interest income
Fee-based revenue 1,331 1,276 1,188
Transactional and other revenue 432 463 347
Total revenue 2,287 2,235 1,653
PCL 22 14 1
Non-interest expense 1,736 1,717 1,317
Net income before income taxes 529 504 335
Net income $ 396 $ 388 $ 255
Revenue by business
Canadian Wealth Management $ 648 $ 606 $ 583
U.S. Wealth Management (including City National) 1,081 1,064 499
U.S. Wealth Management (including City National) (US$ millions) 818 817 379
International Wealth Management 102 107 124
Global Asset Management 456 458 447
Selected balances and other information
ROE 11.6% 11.4% 17.0%
NIM (1) 2.8% 2.9% 2.5%
Pre-tax margin (2) 23.1% 22.6% 20.3%
Total assets $ 87,900 $ 83,000 $ 28,200
Number of advisors (3) 4,780 4,716 3,954
Average total earning assets 73,800 68,800 19,000
Average loans and acceptances 50,200 49,100 17,300
Average deposits 91,300 85,200 37,300
AUA - total (4),(5) 875,300 850,200 823,700
- U.S. Wealth Management (including City National) (4),(5) 394,200 389,600 356,800
- U.S. Wealth Management (including City National) (US$ millions) (4),(5) 293,900 298,500 272,900
AUM (4) 580,700 569,700 492,800
Average AUA (5) 864,400 842,500 820,100
Average AUM 578,700 559,300 491,000
For the three months ended
Estimated impact of U.S. dollar, British pound and Euro translation on key income statement items Q4 2016 vs. Q4 2016 vs.
(Millions of Canadian dollars, except percentage amounts) Q4 2015 Q3 2016
Increase (decrease):
Total revenue $ (22) $ 2
Non-interest expense (22) 1
Net income 2 2
Percentage change in average US$ equivalent of C$1.00 -% (1)%
Percentage change in average British pound equivalent of C$1.00 20% 6%
Percentage change in average Euro equivalent of C$1.00 -% (1)%
(1) NIM is calculated as Net interest income divided by Average total earning assets. (2) Pre-tax margin is defined as net income before income taxes divided by total revenue. (3) Represents client-facing advisors across all our wealth management businesses. (4) Represents period-end spot balances. (5) Amounts have been revised from those previously presented.
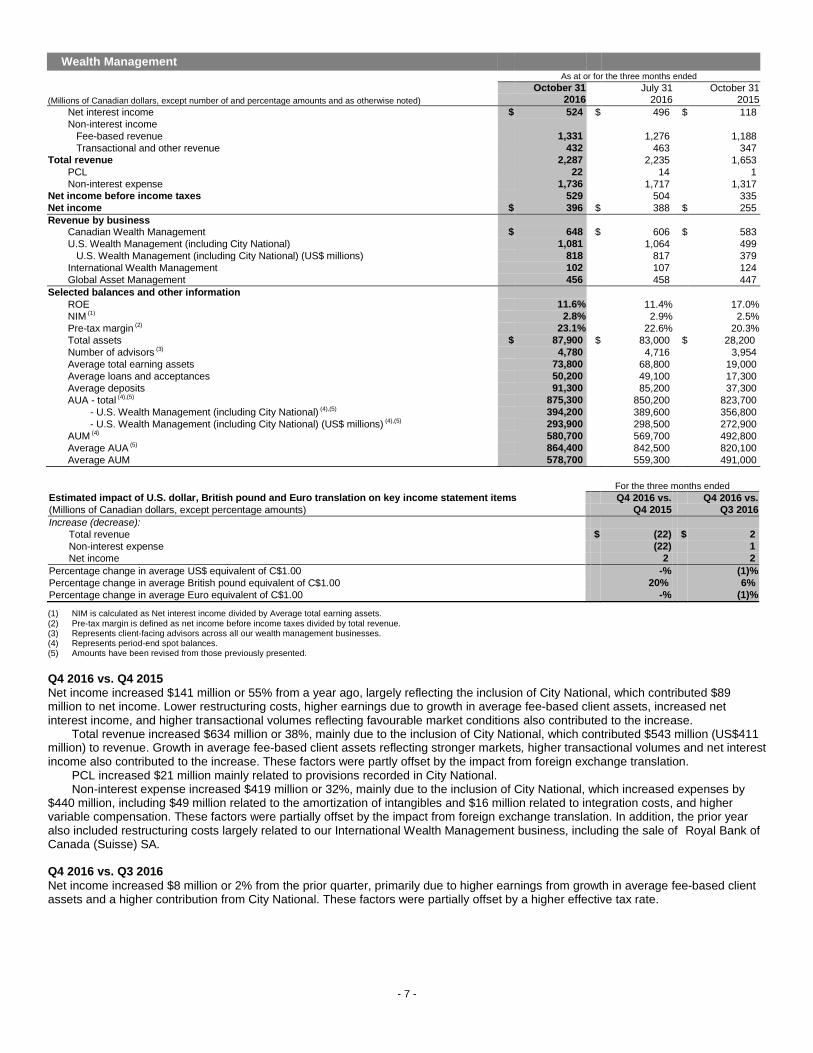
Q4 2016 vs. Q4 2015
Net income increased $141 million or 55% from a year ago, largely reflecting the inclusion of City National, which contributed $89 million to net income. Lower restructuring costs, higher earnings due to growth in average fee-based client assets, increased net interest income, and higher transactional volumes reflecting favourable market conditions also contributed to the increase.
Total revenue increased $634 million or 38%, mainly due to the inclusion of City National, which contributed $543 million (US$411 million) to revenue. Growth in average fee-based client assets reflecting stronger markets, higher transactional volumes and net interest income also contributed to the increase. These factors were partly offset by the impact from foreign exchange translation.
PCL increased $21 million mainly related to provisions recorded in City National. Non-interest expense increased $419 million or 32%, mainly due to the inclusion of City National, which increased expenses by
$440 million, including $49 million related to the amortization of intangibles and $16 million related to integration costs, and higher variable compensation. These factors were partially offset by the impact from foreign exchange translation. In addition, the prior year also included restructuring costs largely related to our International Wealth Management business, including the sale of Royal Bank of Canada (Suisse) SA.
Q4 2016 vs. Q3 2016
Net income increased $8 million or 2% from the prior quarter, primarily due to higher earnings from growth in average fee-based client assets and a higher contribution from City National. These factors were partially offset by a higher effective tax rate.

- 8 -
Insurance
As at or for the three months ended
October 31 July 31 October 31
(Millions of Canadian dollars, except percentage amounts) 2016 2016 2015
Non-interest income
Net earned premiums $ 698 $ 764 $ 933
Investment income (1) (51) 921 (343)
Fee income 176 133 127
Total revenue 823 1,818 717
Insurance policyholder benefits and claims (1) 349 1,158 237
Insurance policyholder acquisition expense 48 52 55
Non-interest expense 155 151 158
Net income before income taxes 271 457 267
Net income $ 228 $ 364 $ 225
Revenue by business
Canadian Insurance $ 295 $ 1,437 $ 295
International Insurance 528 381 422
Selected balances and other information
ROE 54.3% 75.7% 53.4%
Premiums and deposits (2) $ 1,065 $ 1,131 $ 1,309
Fair value changes on investments backing policyholder liabilities (1) (172) 543 (462)
a a For the three months ended
Estimated impact of U.S. dollar and British pound translation on key income statement items Q4 2016 vs. Q4 2016 vs.
(Millions of Canadian dollars, except percentage amounts) Q4 2015 Q3 2016
Increase (decrease):
Total revenue $ (58) $ (19) PBCAE (48) (14) Non-interest expense - - Net income (12) (5)
Percentage change in average US$ equivalent of C$1.00 -% (1)%
Percentage change in average British pound equivalent of C$1.00 20% 6%
(1) Investment income can experience volatility arising from fluctuation in the fair value of Fair Value Through Profit or Loss (FVTPL) assets. The investments which support actuarial
liabilities are predominantly fixed income assets designated as FVTPL. Consequently changes in the fair values of these assets are recorded in investment income in the consolidated statements of income and are largely offset by changes in the fair value of the actuarial liabilities, the impact of which is reflected in insurance policyholder benefits and claims.
(2) Premiums and deposits include premiums on risk-based insurance and annuity products, and individual and group segregated fund deposits, consistent with insurance industry practices.
On July 1, 2016, we completed the sale of RBC General Insurance Company to Aviva Canada Inc. (Aviva) as previously announced on January 21, 2016. The transaction involved the sale of our home and auto insurance manufacturing business and included a 15-year strategic distribution agreement between RBC Insurance and Aviva. As a result of the transaction, we recorded a gain of $287 million ($235 million after-tax) in the third quarter of 2016. Q4 2016 vs. Q4 2015
Net income increased $3 million or 1% from a year ago, mainly reflecting higher earnings from new U.K. annuity contracts and growth in International insurance. These factors were partially offset by lower results due to the sale of our home and auto insurance manufacturing business, as noted above, and the impact from foreign exchange translation.
Total revenue increased $106 million or 15%, mainly due the change in fair value of investments backing our policyholder liabilities, largely offset in PBCAE, and business growth in International insurance. These factors were partly offset by lower premiums reflecting the impact of the sale of our home and auto insurance manufacturing business and the impact from foreign exchange translation.
PBCAE increased $105 million or 36%, largely reflecting the change in fair value of investments backing our policyholder liabilities, largely offset in revenue, and growth mainly in International insurance. These factors were partially offset by lower costs due to the sale of our home and auto insurance manufacturing business, as noted above, and the impact from foreign exchange translation.
Non-interest expense decreased $3 million or 2%, primarily due to lower costs as a result of the sale of our home and auto insurance manufacturing business, as noted above, and efficiency management activities, which were partially offset by higher costs to support business growth.
Q4 2016 vs. Q3 2016
Net income decreased $136 million or 37% from the prior quarter. Excluding the after-tax gain of $235 million from the sale of our home and auto insurance manufacturing business, as noted above, net income increased $99 million or 77%
(1), mainly due to favourable
actuarial adjustments reflecting management actions and assumption changes and growth in International insurance, including earnings from new U.K. annuity contracts. (1) Results and measures excluding the gain on the sale of our home and auto insurance manufacturing business are non-GAAP measures. For further information, including a
reconciliation, refer to the Key performance and non-GAAP section on page 11 of this Earnings Release.
- 9 -
Investor & Treasury Services
As at or for the three months ended
October 31 July 31 October 31
(Millions of Canadian dollars, except percentage amounts) 2016 2016 2015
Net interest income $ 214 $ 195 $ 220
Non-interest income 390 382 228
Total revenue 604 577 448
Non-interest expense 376 368 342
Net income before income taxes 228 209 106
Net income $ 174 $ 157 $ 88
Selected balances and other information
ROE 21.0% 18.2% 10.9%
Average Deposits 124,400 123,200 149,500
Client deposits 50,900 53,000 56,500
Wholesale funding deposits 73,500 70,200 93,000
AUA(1) 3,929,400 3,724,300 3,620,300
Average AUA 3,886,900 3,699,300 3,783,700
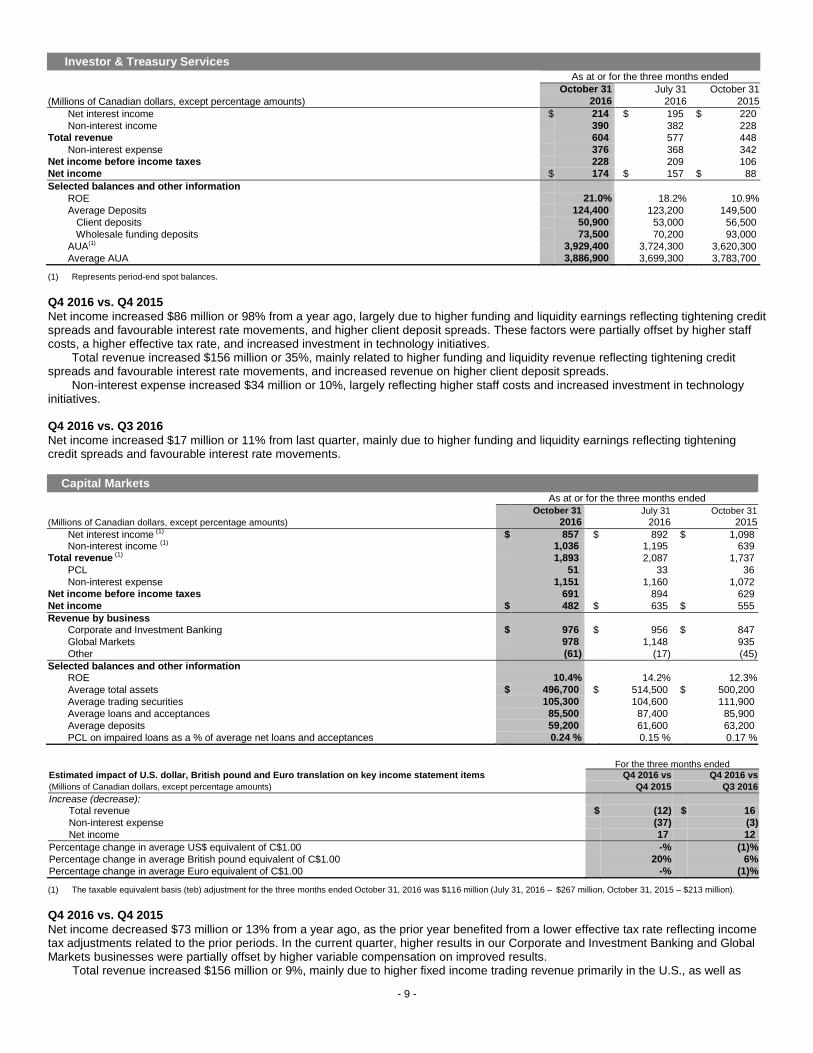
(1) Represents period-end spot balances. Q4 2016 vs. Q4 2015
Net income increased $86 million or 98% from a year ago, largely due to higher funding and liquidity earnings reflecting tightening credit spreads and favourable interest rate movements, and higher client deposit spreads. These factors were partially offset by higher staff costs, a higher effective tax rate, and increased investment in technology initiatives.
Total revenue increased $156 million or 35%, mainly related to higher funding and liquidity revenue reflecting tightening credit spreads and favourable interest rate movements, and increased revenue on higher client deposit spreads.
Non-interest expense increased $34 million or 10%, largely reflecting higher staff costs and increased investment in technology initiatives. Q4 2016 vs. Q3 2016
Net income increased $17 million or 11% from last quarter, mainly due to higher funding and liquidity earnings reflecting tightening credit spreads and favourable interest rate movements.
Capital Markets
As at or for the three months ended
October 31 July 31 October 31
(Millions of Canadian dollars, except percentage amounts) 2016 2016 2015
Net interest income (1) $ 857 $ 892 $ 1,098
Non-interest income (1) 1,036 1,195 639
Total revenue (1) 1,893 2,087 1,737
PCL 51 33 36
Non-interest expense 1,151 1,160 1,072
Net income before income taxes 691 894 629
Net income $ 482 $ 635 $ 555
Revenue by business
Corporate and Investment Banking $ 976 $ 956 $ 847
Global Markets 978 1,148 935
Other (61) (17) (45)
Selected balances and other information
ROE 10.4% 14.2% 12.3%
Average total assets $ 496,700 $ 514,500 $ 500,200
Average trading securities 105,300 104,600 111,900
Average loans and acceptances 85,500 87,400 85,900
Average deposits 59,200 61,600 63,200
PCL on impaired loans as a % of average net loans and acceptances 0.24 % 0.15 % 0.17 %
For the three months ended Estimated impact of U.S. dollar, British pound and Euro translation on key income statement items Q4 2016 vs Q4 2016 vs
(Millions of Canadian dollars, except percentage amounts) Q4 2015 Q3 2016
Increase (decrease):
Total revenue $ (12) $ 16
Non-interest expense (37) (3)
Net income 17 12
Percentage change in average US$ equivalent of C$1.00 -% (1)%
Percentage change in average British pound equivalent of C$1.00 20% 6%
Percentage change in average Euro equivalent of C$1.00 -% (1)%
(1) The taxable equivalent basis (teb) adjustment for the three months ended October 31, 2016 was $116 million (July 31, 2016 – $267 million, October 31, 2015 – $213 million).
Q4 2016 vs. Q4 2015
Net income decreased $73 million or 13% from a year ago, as the prior year benefited from a lower effective tax rate reflecting income tax adjustments related to the prior periods. In the current quarter, higher results in our Corporate and Investment Banking and Global Markets businesses were partially offset by higher variable compensation on improved results.
Total revenue increased $156 million or 9%, mainly due to higher fixed income trading revenue primarily in the U.S., as well as

- 10 -
strong debt and equity origination activity and increased loan syndication revenue largely in the U.S. These factors were partially offset by lower equity trading revenue across most regions and lower lending revenue largely in the U.S.
PCL increased $15 million or 42%, mainly due to higher provisions, net of recoveries, in the energy sector. Non-interest expense increased $79 million or 7%, mainly driven by higher variable compensation on improved results, partially
offset by the impact from foreign exchange translation and lower litigation provisions.
Q4 2016 vs. Q3 2016
Net income decreased $153 million or 24% from the prior quarter mainly due to lower fixed income and equity trading revenue largely in Europe and the U.S., and higher capital taxes. Lower equity origination activity in Canada and lower foreign exchange trading revenue across all regions further contributed to the decrease. These factors were partly offset by increased loan syndication revenue largely in the U.S.
Corporate Support
As at or for the three months ended October 31 July 31 October 31 (Millions of Canadian dollars) 2016 2016 2015 Net interest income (loss) (1) $ (48) $ (58) $ (205) Non-interest income (loss) (1) (78) (139) 20 Total revenue (1) (126) (197) (185) PCL (1) - (2) Non-interest expense (2) 8 41 Net income (loss) before income taxes (123) (205) (224) Income (recoveries) taxes (1) (111) (234) (424) Net income (2) $ (12) $ 29 $ 200
(1) Teb adjusted. (2) Net income reflects income attributable to both shareholders and Non-Controlling Interest (NCI). Net income attributable to NCI for the three months ended October 31, 2016 was $9
million (July 31, 2016 – $7 million; October 31, 2015 – $25 million).
Due to the nature of activities and consolidated adjustments reported in this segment, we believe that a comparative period analysis is not relevant. The following identifies material items affecting the reported results in each period. Total revenue and income taxes (recoveries) in each period in Corporate Support include the deduction of the teb adjustments related to the gross-up of income from Canadian taxable corporate dividends and U.S. tax credit investment business recorded in Capital Markets. The amount deducted from revenue was offset by an equivalent increase in income taxes (recoveries). The teb amount for the three months ended October 31, 2016 was $115 million compared to $267 million in the prior quarter and $213 million in the prior year period. For further discussion, refer to the How we measure and report our business segments section of our 2016 Annual Report. In addition to the teb impacts noted above, the following identifies the other material items affecting the reported results in each period. Q4 2016
Net loss was $12 million largely reflecting net unfavourable tax adjustments, partially offset by asset/liability management activities. Q3 2016
Net income was $29 million mainly reflecting asset/liability management activities. Q4 2015
Net income was $200 million primarily reflecting favourable tax adjustments and asset/liability management activities. The fourth quarter of 2015 also included transaction costs of $29 million ($23 million after-tax) related to our acquisition of City National.
- 11 -
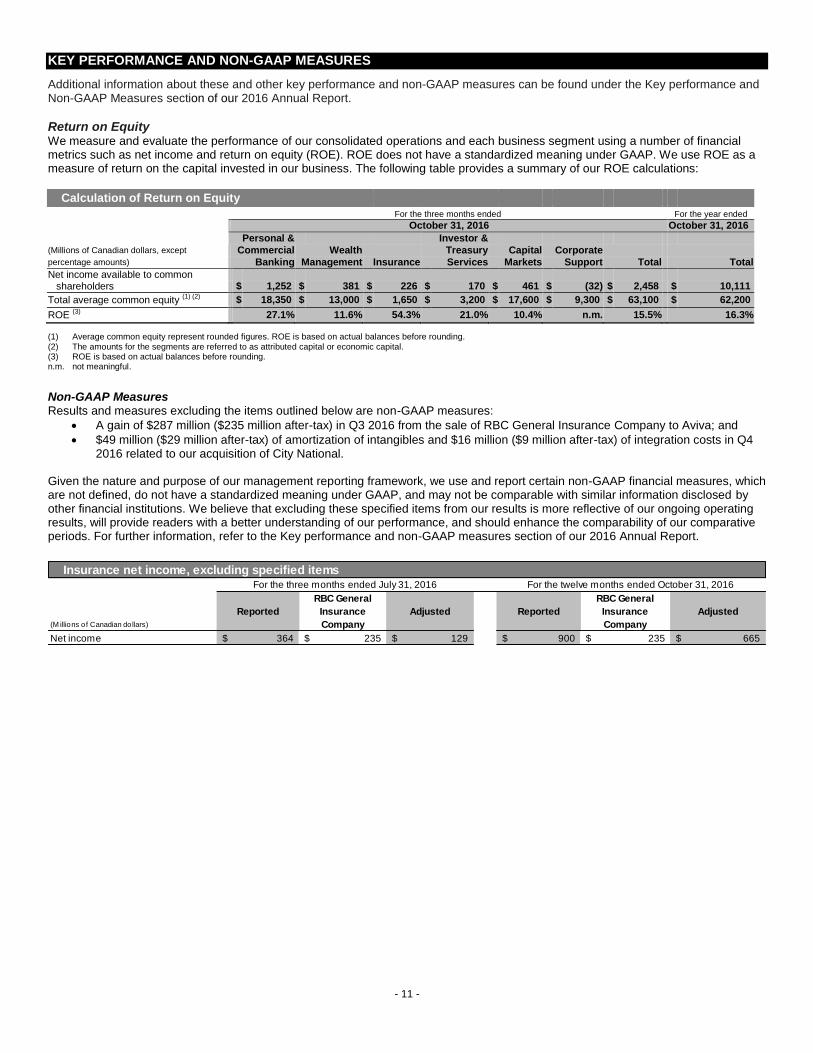
KEY PERFORMANCE AND NON-GAAP MEASURES
Additional information about these and other key performance and non-GAAP measures can be found under the Key performance and Non-GAAP Measures section of our 2016 Annual Report.
Return on Equity We measure and evaluate the performance of our consolidated operations and each business segment using a number of financial metrics such as net income and return on equity (ROE). ROE does not have a standardized meaning under GAAP. We use ROE as a measure of return on the capital invested in our business. The following table provides a summary of our ROE calculations:
Calculation of Return on Equity
For the three months ended For the year ended .
October 31, 2016 October 31, 2016 Personal & Investor &
(Millions of Canadian dollars, except Commercial Wealth Treasury Capital Corporate
percentage amounts) Banking Management Insurance Services Markets Support Total Total
Net income available to common
shareholders $ 1,252 $ 381 $ 226 $ 170 $ 461 $ (32) $ 2,458 $ 10,111
Total average common equity (1) (2) $ 18,350 $ 13,000 $ 1,650 $ 3,200 $ 17,600 $ 9,300 $ 63,100 $ 62,200
ROE (3) 27.1% 11.6% 54.3% 21.0% 10.4% n.m. 15.5% 16.3%
(1) Average common equity represent rounded figures. ROE is based on actual balances before rounding. (2) The amounts for the segments are referred to as attributed capital or economic capital. (3) ROE is based on actual balances before rounding. n.m. not meaningful.
Non-GAAP Measures Results and measures excluding the items outlined below are non-GAAP measures:
A gain of $287 million ($235 million after-tax) in Q3 2016 from the sale of RBC General Insurance Company to Aviva; and
$49 million ($29 million after-tax) of amortization of intangibles and $16 million ($9 million after-tax) of integration costs in Q4 2016 related to our acquisition of City National.
Given the nature and purpose of our management reporting framework, we use and report certain non-GAAP financial measures, which are not defined, do not have a standardized meaning under GAAP, and may not be comparable with similar information disclosed by other financial institutions. We believe that excluding these specified items from our results is more reflective of our ongoing operating results, will provide readers with a better understanding of our performance, and should enhance the comparability of our comparative periods. For further information, refer to the Key performance and non-GAAP measures section of our 2016 Annual Report.
(M illions of Canadian dollars)
Reported
RBC General
Insurance
Company
Adjusted Reported
RBC General
Insurance
Company
Adjusted
Net income 364$ 235$ 129$ 900$ 235$ 665$
Insurance net income, excluding specified itemsFor the three months ended July 31, 2016 For the twelve months ended October 31, 2016
- 12 -
October 31 July 31 October 31
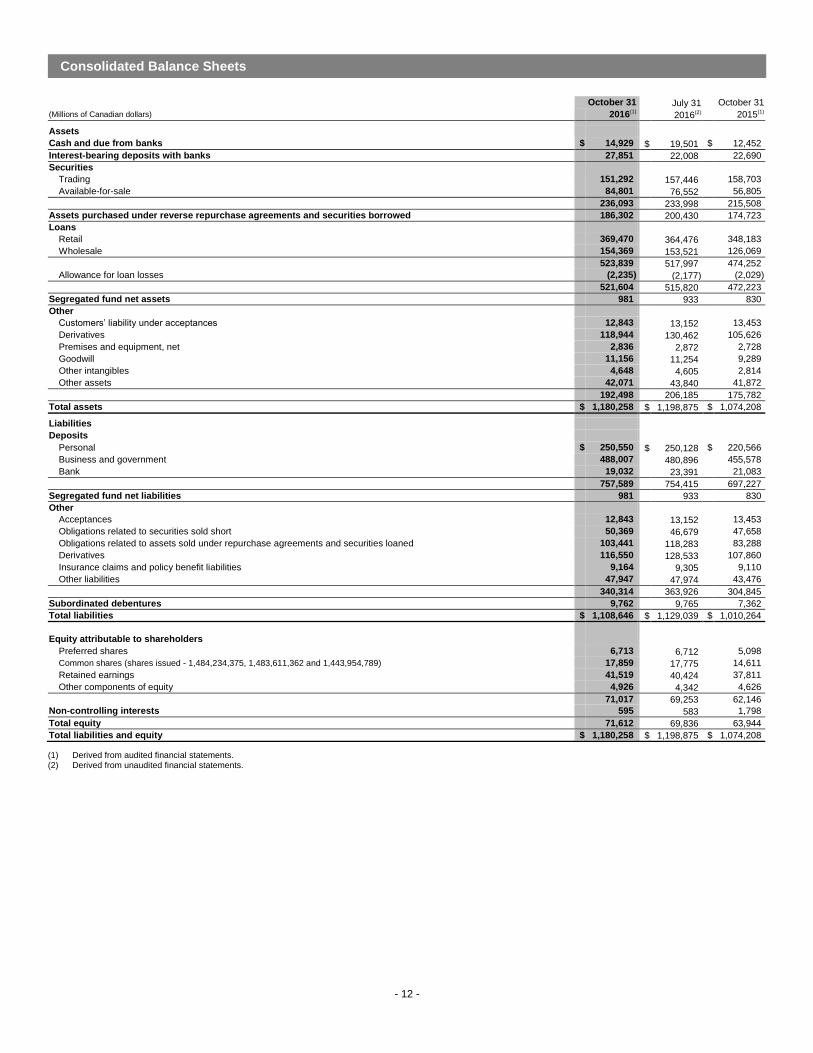
(Millions of Canadian dollars) 2016(1) 2016(2) 2015(1)
Assets
Cash and due from banks $ 14,929 $ 19,501 $ 12,452
Interest-bearing deposits with banks 27,851 22,008 22,690
Securities
Trading 151,292 157,446 158,703
Available-for-sale 84,801 76,552 56,805
236,093 233,998 215,508
Assets purchased under reverse repurchase agreements and securities borrowed 186,302 200,430 174,723
Loans
Retail 369,470 364,476 348,183
Wholesale 154,369 153,521 126,069
523,839 517,997 474,252
Allowance for loan losses (2,235) (2,177) (2,029)
521,604 515,820 472,223
Segregated fund net assets 981 933 830
Other
Customers’ liability under acceptances 12,843 13,152 13,453
Derivatives 118,944 130,462 105,626
Premises and equipment, net 2,836 2,872 2,728
Goodwill 11,156 11,254 9,289
Other intangibles 4,648 4,605 2,814
Other assets 42,071 43,840 41,872
192,498 206,185 175,782
Total assets $ 1,180,258 $ 1,198,875 $ 1,074,208
Liabilities
Deposits
Personal $ 250,550 $ 250,128 $ 220,566
Business and government 488,007 480,896 455,578
Bank 19,032 23,391 21,083
757,589 754,415 697,227
Segregated fund net liabilities 981 933 830
Other
Acceptances 12,843 13,152 13,453
Obligations related to securities sold short 50,369 46,679 47,658
Obligations related to assets sold under repurchase agreements and securities loaned 103,441 118,283 83,288
Derivatives 116,550 128,533 107,860
Insurance claims and policy benefit liabilities 9,164 9,305 9,110
Other liabilities 47,947 47,974 43,476
340,314 363,926 304,845
Subordinated debentures 9,762 9,765 7,362
Total liabilities $ 1,108,646 $ 1,129,039 $ 1,010,264
Equity attributable to shareholders
Preferred shares 6,713 6,712 5,098
Common shares (shares issued - 1,484,234,375, 1,483,611,362 and 1,443,954,789) 17,859 17,775 14,611
Retained earnings 41,519 40,424 37,811
Other components of equity 4,926 4,342 4,626
71,017 69,253 62,146
Non-controlling interests 595 583 1,798
Total equity 71,612 69,836 63,944
Total liabilities and equity $ 1,180,258 $ 1,198,875 $ 1,074,208
(1) Derived from audited financial statements. (2) Derived from unaudited financial statements.
Consolidated Balance Sheets

- 13 -
Consolidated Statements of Income
For the three-months ended For the year ended
October 31 July 31 October 31 October 31 October 31
(Millions of Canadian dollars, except per share amounts) 2016(1)
2016(1)
2015(1)
2016(2)
2015(2)
Interest income
Loans $ 4,574 $ 4,494 $ 4,203 $ 17,876 $ 16,882
Securities 1,091 1,180 1,159 4,593 4,519
Assets purchased under reverse repurchase agreements and securities borrowed 502 464 333 1,816 1,251
Deposits and other 44 46 20 167 77
6,211 6,184 5,715 24,452 22,729
Interest expense
Deposits and other 1,421 1,385 1,375 5,467 5,723
Other liabilities 538 612 486 2,227 1,995
Subordinated debentures 65 64 54 227 240
2,024 2,061 1,915 7,921 7,958
Net interest income 4,187 4,123 3,800 16,531 14,771
Non-interest income
Insurance premiums, investment and fee income 824 1,534 717 4,868 4,436
Trading revenue 119 311 (203) 701 552
Investment management and custodial fees 1,102 1,053 942 4,240 3,778
Mutual fund revenue 745 728 731 2,887 2,881
Securities brokerage commissions 350 352 352 1,429 1,436
Service charges 447 443 404 1,756 1,592
Underwriting and other advisory fees 509 524 350 1,876 1,885
Foreign exchange revenue, other than trading 217 189 222 964 814
Card service revenue 220 227 193 889 798
Credit fees 384 285 308 1,239 1,184
Net gain on available-for-sale securities 2 7 34 76 145
Share of profit in joint ventures and associates 44 44 40 176 149
Other 115 435 129 773 900
5,078 6,132 4,219 21,874 20,550
Total revenue 9,265 10,255 8,019 38,405 35,321
Provision for credit losses 358 318 275 1,546 1,097
Insurance policyholder benefits, claims and acquisition expense 397 1,210 292 3,424 2,963
Non-interest expense
Human resources 3,032 3,079 2,682 12,201 11,583
Equipment 378 346 342 1,438 1,277
Occupancy 406 387 368 1,568 1,410
Communications 278 240 253 945 888
Professional fees 312 279 307 1,078 932
Amortization of other intangibles 257 250 180 970 712
Other 535 510 515 1,936 1,836
5,198 5,091 4,647 20,136 18,638
Income before income taxes 3,312 3,636 2,805 13,299 12,623
Income taxes 769 741 212 2,841 2,597
Net income $ 2,543 $ 2,895 $ 2,593 $ 10,458 $ 10,026
Net income attributable to:
Shareholders $ 2,533 $ 2,886 $ 2,569 $ 10,405 $ 9,925
Non-controlling interests 10 9 24 53 101
$ 2,543 $ 2,895 $ 2,593 $ 10,458 $ 10,026 Basic earnings per share (in dollars) $ 1.66 $ 1.88 $ 1.74 $ 6.80 $ 6.75
Diluted earnings per share (in dollars) 1.65 1.88 1.74 6.78 6.73
Dividends per common share (in dollars) 0.83 0.81 0.79 3.24 3.08
(1) Derived from unaudited financial statements. (2) Derived from audited financial statements.
- 14 -
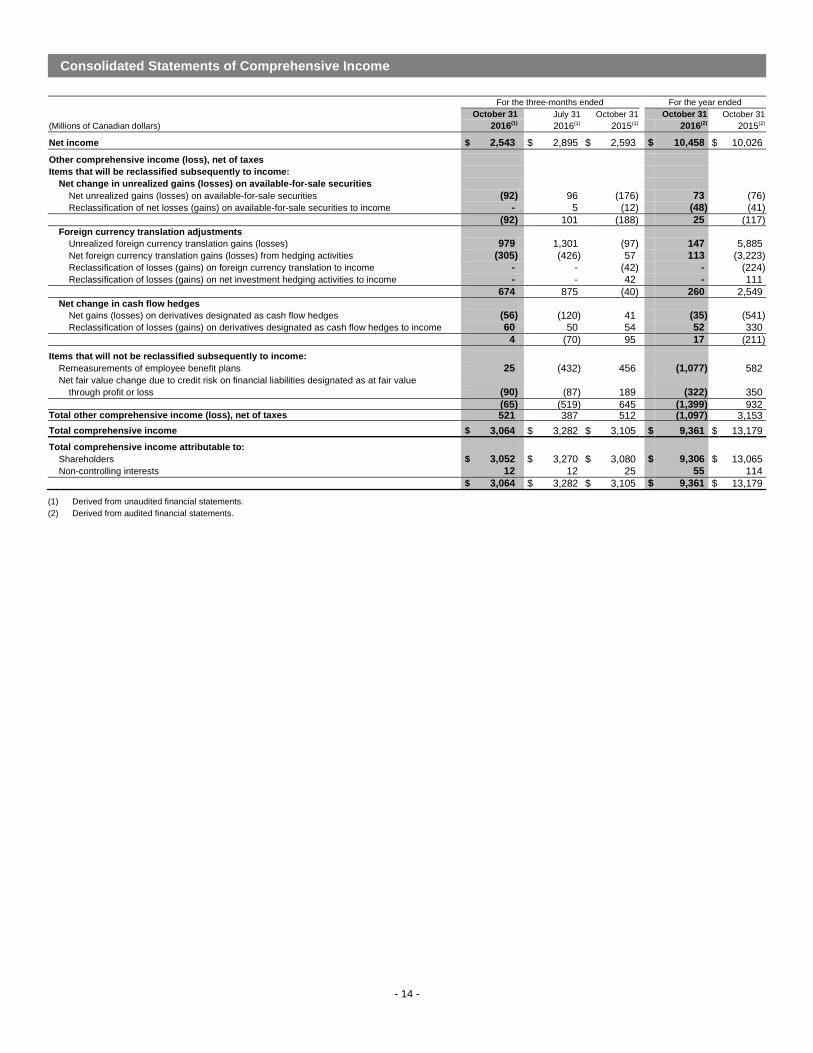
Consolidated Statements of Comprehensive Income
For the three-months ended For the year ended
October 31 July 31 October 31 October 31 October 31
(Millions of Canadian dollars) 2016(1) 2016(1) 2015(1) 2016(2) 2015(2)
Net income $ 2,543 $ 2,895 $ 2,593 $ 10,458 $ 10,026
Other comprehensive income (loss), net of taxes
Items that will be reclassified subsequently to income:
Net change in unrealized gains (losses) on available-for-sale securities
Net unrealized gains (losses) on available-for-sale securities (92) 96 (176) 73 (76)
Reclassification of net losses (gains) on available-for-sale securities to income - 5 (12) (48) (41)
(92) 101 (188) 25 (117)
Foreign currency translation adjustments
Unrealized foreign currency translation gains (losses) 979 1,301 (97) 147 5,885
Net foreign currency translation gains (losses) from hedging activities (305) (426) 57 113 (3,223)
Reclassification of losses (gains) on foreign currency translation to income - - (42) - (224)
Reclassification of losses (gains) on net investment hedging activities to income - - 42 - 111
674 875 (40) 260 2,549
Net change in cash flow hedges
Net gains (losses) on derivatives designated as cash flow hedges (56) (120) 41 (35) (541)
Reclassification of losses (gains) on derivatives designated as cash flow hedges to income 60 50 54 52 330
4 (70) 95 17 (211) Items that will not be reclassified subsequently to income:
Remeasurements of employee benefit plans 25 (432) 456 (1,077) 582
Net fair value change due to credit risk on financial liabilities designated as at fair value
through profit or loss (90) (87) 189 (322) 350
(65) (519) 645 (1,399) 932 Total other comprehensive income (loss), net of taxes 521 387 512 (1,097) 3,153 Total comprehensive income $ 3,064 $ 3,282 $ 3,105 $ 9,361 $ 13,179
Total comprehensive income attributable to:
Shareholders $ 3,052 $ 3,270 $ 3,080 $ 9,306 $ 13,065
Non-controlling interests 12 12 25 55 114
$ 3,064 $ 3,282 $ 3,105 $ 9,361 $ 13,179
(1) Derived from unaudited financial statements.
(2) Derived from audited financial statements.

- 15 -
Consolidated Statements of Changes in Equity
a Other components of equity
Treasury Treasury Available- Foreign Cash Total other Equity
Preferred Common shares - shares - Retained for-sale currency flow components attributable
to Non-
controlling Total
(Millions of Canadian dollars) shares shares preferred common earnings securities translation hedges of equity shareholders interests equity
Balance at November 1, 2013(1)
$ 4,600 $ 14,377 $ 1 $ 41 $ 27,438 $ 347 $ 686 $ 175 $ 1,208 $ 47,665 $ 1,795 $ 49,460
Changes in equity
Issues of share capital 1,000 150 - - (14) - - - - 1,136 - 1,136
Common shares purchased for cancellation
- (16) - - (97) - - - - (113) - (113)
Preferred shares redeemed (1,525) - - - - - - - - (1,525) - (1,525)
Sales of treasury shares - - 124 5,333 - - - - - 5,457 - 5,457 Purchases of treasury shares - - (125) (5,303) - - - - - (5,428) - (5,428)
Share-based compensation awards - - - - (9) - - - - (9) - (9)
Dividends on common shares - - - - (4,097) - - - - (4,097) - (4,097)
Dividends on preferred shares and other
- - - - (213) - - - - (213) (94) (307)
Other - - - - (8) - - - - (8) 18 10 Net income - - - - 8,910 - - - - 8,910 94 9,004
Total other comprehensive income (loss), net of taxes
- - - - (295) 85 1,205 (80) 1,210 915 - 915
Balance at October 31, 2014 (1)
$ 4,075 $ 14,511 $ - $ 71 $ 31,615 $ 432 $ 1,891 $ 95 $ 2,418 $ 52,690 $ 1,813 $ 54,503
Changes in equity Issues of share capital 1,350 62 - - (21) - - - - 1,391 - 1,391
Preferred shares redeemed (325) - - - - - - - - (325) - (325)
Sales of treasury shares - - 117 6,098 - - - - - 6,215 - 6,215
Purchases of treasury shares - - (119) (6,131) - - - - - (6,250) - (6,250) Share-based compensation awards - - - - (1) - - - - (1) - (1)
Dividends on common shares - - - - (4,443) - - - - (4,443) - (4,443)
Dividends on preferred shares and other
- - - - (191) - - - - (191) (92) (283)
Other - - - - (5) - - - - (5) (37) (42)
Net income - - - - 9,925 - - - - 9,925 101 10,026
Total other comprehensive income (loss), net of taxes
- - - - 932 (117) 2,536 (211) 2,208 3,140 13 3,153
Balance at October 31, 2015 (1)
$ 5,100 $ 14,573 $ (2) $ 38 $ 37,811 $ 315 $ 4,427 $ (116) $ 4,626 $ 62,146 $ 1,798 $ 63,944
Changes in equity Issues of share capital 1,855 3,422 - - (16) - - - - 5,261 - 5,261
Common shares purchased for cancellation
- (56) - - (306) - - - - (362) - (362)
Preferred shares purchased for cancellation
(242) - - - (22) - - - - (264) - (264)
Redemption of trust capital securities - - - - - - - - - - (1,200) (1,200)
Sales of treasury shares - - 172 4,973 - - - - - 5,145 - 5,145
Purchases of treasury shares - - (170) (5,091) - - - - - (5,261) - (5,261)
Share-based compensation awards - - - - (54) - - - - (54) - (54)
Dividends on common shares - - - - (4,817) - - - - (4,817) - (4,817)
Dividends on preferred shares and other
- - - - (294) - - - - (294) (63) (357)
Other - - - - 211 - - - - 211 5 216
Net income - - - - 10,405 - - - - 10,405 53 10,458
Total other comprehensive income (loss), net of taxes
- - - - (1,399) 25 258 17 300 (1,099) 2 (1,097)
Balance at October 31, 2016 (1)
$ 6,713 $ 17,939 $ - $ (80) $ 41,519 $ 340 $ 4,685 $ (99) $ 4,926 $ 71,017 $ 595 $ 71,612
(1) Derived from audited financial statements.
- 16 -
CAUTION REGARDING FORWARD-LOOKING STATEMENTS
From time to time, we make written or oral forward-looking statements within the meaning of certain securities laws, including the “safe harbour” provisions of the United States Private Securities Litigation Reform Act of 1995 and any applicable Canadian securities legislation. We may make forward-looking statements in this Earnings Release, in filings with Canadian regulators or the U.S. Securities and Exchange Commission, in reports to shareholders and in other communications. Forward-looking statements include, but are not limited to, statements relating to our financial performance objectives, vision and strategic goals, and include our President and Chief Executive Officer’s statements. The forward-looking information contained in this Earnings Release is presented for the purpose of assisting the holders of our securities and financial analysts in understanding our financial position and results of operations as at and for the periods ended on the dates presented, as well as our financial performance objectives, vision and strategic goals, and may not be appropriate for other purposes. Forward-looking statements are typically identified by words such as “believe”, “expect”, “foresee”, “forecast”, “anticipate”, “intend”, “estimate”, “goal”, “plan” and “project” and similar expressions of future or conditional verbs such as “will”, “may”, “should”, “could” or “would”. By their very nature, forward-looking statements require us to make assumptions and are subject to inherent risks and uncertainties, which give rise to the possibility that our predictions, forecasts, projections, expectations or conclusions will not prove to be accurate, that our assumptions may not be correct and that our financial performance objectives, vision and strategic goals will not be achieved. We caution readers not to place undue reliance on these statements as a number of risk factors could cause our actual results to differ materially from the expectations expressed in such forward-looking statements. These factors – many of which are beyond our control and the effects of which can be difficult to predict – include: credit, market, liquidity and funding, insurance, operational, regulatory compliance, strategic, reputation, legal and regulatory environment, competitive and systematic risks and other risks discussed in the Risk management and Overview of other risks sections of our 2016 Annual Report; global uncertainty, the Brexit vote to have the United Kingdom leave the European Union, weak oil and gas prices, cyber risk, anti-money laundering, exposure to more volatile sectors, such as lending related to commercial real estate and leveraged financing, technological innovation and new fintech entrants, increasing complexity of regulation, data management, litigation and administrative penalties; the business and economic conditions in the geographic regions in which we operate; the effects of changes in government fiscal, monetary and other policies; tax risk and transparency; and environmental risk. We caution that the foregoing list of risk factors is not exhaustive and other factors could also adversely affect our results. When relying on our forward-looking statements to make decisions with respect to us, investors and others should carefully consider the foregoing factors and other uncertainties and potential events. Material economic assumptions underlying the forward looking-statements contained in this Earnings Release are set out in the Overview and outlook section and for each business segment under the heading Outlook and priorities in our 2016 Annual Report. Except as required by law, we do not undertake to update any forward-looking statement, whether written or oral, that may be made from time to time by us or on our behalf. Additional information about these and other factors can be found in the Risk management and Overview of other risks sections of our 2016 Annual Report. Information contained in or otherwise accessible through the websites mentioned does not form part of this Earnings Release. All references in this Earnings Release to websites are inactive textual references and are for your information only.
ACCESS TO QUARTERLY RESULTS MATERIALS Interested investors, the media and others may review this quarterly Earnings Release, quarterly results slides, supplementary financial information and our 2016 Annual Report to Shareholders on our website at rbc.com/investorrelations.
Quarterly conference call and webcast presentation Our quarterly conference call is scheduled for Wednesday November 30, 2016 at 8:00 a.m. (EDT) and will feature a presentation about our third quarter results by RBC executives. It will be followed by a question and answer period with analysts. Interested parties can access the call live on a listen-only basis at: www.rbc.com/investorrelations/ir_events_presentations.html or by telephone (416-340-2217, 866-696-5910, passcode 9527507#). Please call between 7:50 a.m. and 7:55 a.m. (EDT). Management’s comments on results will be posted on RBC website shortly following the call. A recording will be available by 5:00 p.m. (EST) from November 30, 2016 until February 27, 2016 at rbc.com/investorrelations/quarterly-financial-statements.html or by telephone (905-694-9451 or 800-408-3053, passcode 7448996#). Media Relations Contacts Tanis Feasby, Senior Director, Communications, Wealth Management, Insurance & Finance, [email protected], 416-955-5172 or 1-888-880-2173 (toll-free outside Toronto) Sandra Nunes, Director, Financial Communications, [email protected], 416-974-1794 or 1-888-880-2173 (toll-free outside Toronto) Investor Relations Contacts Dave Mun, SVP & Head, Investor Relations, [email protected], 416-955-7803 Stephanie Phillips, Director, Investor Relations, [email protected], 416-955-7809 Asim Imran, Director, Investor Relations, [email protected], 416-955-7804 Brendon Buckler, Associate Director, Investor Relations, [email protected], 416-955-7807
ABOUT RBC Royal Bank of Canada is Canada’s largest bank, and one of the largest banks in the world, based on market capitalization. We are one of North America’s leading diversified financial services companies, and provide personal and commercial banking, wealth management, insurance, investor services and capital markets products and services on a global basis. We have over 80,000 full- and part-time employees who serve more than 16 million personal, business, public sector and institutional clients through offices in Canada, the .S. and other countries. For more information, please visit rbc.com. RBC helps communities prosper, supporting a broad range of community initiatives through donations, community investments and employee volunteer activities. For more information please see: http://www.rbc.com/community-sustainability/
Trademarks used in this Earnings Release include the LION & GLOBE Symbol, ROYAL BANK OF CANADA and RBC which are trademarks of Royal Bank of Canada used by Royal Bank of Canada and/or by its subsidiaries under license. All other trademarks mentioned in this Earnings Release, which are not the property of Royal Bank of Canada, are owned by their respective holders.