Embed Size (px)
Citation preview

Not Protectively Marked
1
Thermal Imager Technical Guidance Document
WS/10/CPNI/TI/002 14th April 2010

Not Protectively Marked
2
Copyright Notice
(c) CROWN COPYRIGHT 2010 This document has been produced by Waterfall Solutions Ltd as part of a programme of research and development funded and directed by the Centre for the Protection of National Infrastructure (CPNI) and it may not be reproduced or otherwise without the prior written approval from CPNI. The Copyright for all images within this document is held by a third party and should not be reproduced under any circumstances. Authors & Approval
Principal authors Dr Duncan Hickman Date: 31/03/2010 Chief Engineer Tom Riley 31/03/2010 Technical Consultant Approved by: Dr Moira Smith Date: 31/03/2010 Managing Director Contact Information
Centre for the Protection of National Infrastructure TDF/21 Central Support PO Box 60628 London SW1P 9HA Waterfall Solutions Ltd 1 & 2 Saxton Parklands Guildford Surrey GU2 9JX Tel: 01483 237200 Fax: 01483 237033 Email: [email protected] www.waterfallsolutions.co.uk Revisions Record
Issue Date Change Ref. No. Revisions Issue 1.0 31/03/2010 Changes based on
CPNI comments on Draft document.
Some clarifications and simplifications of technical issues. Movement of camera tables to Appendices.
Issue 2.0 14/04/2010 Minor edits based on final feedback.

Not Protectively Marked
3
Contents 1. Introduction ...........................................................................................................5
1.1 Scope of Document......................................................................................5 1.2 Background to Thermal Imagers and Systems ............................................5 1.3 Approach to Acquisition................................................................................6 1.4 Applicable Material and Standards...............................................................7
2. Thermal Imaging Sensor Technology ...................................................................9 2.1 The Infrared Spectrum .................................................................................9 2.2 Thermal Imager Systems ...........................................................................11 2.3 Basic Principle of Operation .......................................................................13 2.4 Image Processing.......................................................................................14
2.4.1 Image Enhancement and Fusion............................................................14 2.4.2 Detection & Tracking ..............................................................................20 2.4.3 Display of Imagery..................................................................................21
2.5 Automation in TI Camera Systems.............................................................22 2.6 TI Camera Performance Measures ............................................................23
2.6.1 Introduction.............................................................................................23 2.6.2 Measures of Resolution..........................................................................23 2.6.3 Geometrical Factors ...............................................................................23 2.6.4 Optical Properties ...................................................................................27 2.6.5 Detector and Electronics ........................................................................28 2.6.6 Target Signatures and the Atmosphere..................................................28 2.6.7 System Performance Parameters ..........................................................29
2.7 Causes of False Alarms .............................................................................31 2.8 Post-Event Analysis ...................................................................................32 2.9 Cost and Commercial Considerations........................................................32 2.10 Benefits and Limitations .............................................................................33
3. Use of i-LIDS for Video Analysis.........................................................................34 3.1 Overview of the i-LIDS Database ...............................................................34 3.2 Cameras Used ...........................................................................................35 3.3 Relevant Scenarios ....................................................................................35 3.4 Summary ....................................................................................................36
4. Specifications......................................................................................................37 4.1 Overview ....................................................................................................37 4.2 General Specification .................................................................................37 4.3 Physical Requirements...............................................................................38 4.4 Environmental Criteria................................................................................39 4.5 Installation and Coverage...........................................................................40 4.6 Performance Requirements .......................................................................41
4.6.1 Image Quality .........................................................................................41 4.6.2 Sensitivity, Resolution, and Angular Coverage ......................................42 4.6.3 Detection and Tracking and Other Functions .........................................42 4.6.4 False Alarms...........................................................................................43
4.7 User Interface.............................................................................................43 4.8 Logistics .....................................................................................................44 4.9 Growth Requirements and System Architecture ........................................45 4.10 Data Formats and Interfaces......................................................................45 4.11 Programme Issues .....................................................................................45
5. COTS Technology Review..................................................................................47 5.1 General Review of the Market ....................................................................47 5.2 TI Cameras and Suppliers..........................................................................47
5.2.1 General Remarks ...................................................................................47 5.3 Lenses and Controls ..................................................................................47 5.4 Camera Mounts and Mechanisms..............................................................48 5.5 Interfaces and Standards ...........................................................................48 5.6 Electronics..................................................................................................49

Not Protectively Marked
4
5.7 Processing Solutions..................................................................................49 5.8 Displays and User Interface Equipment .....................................................50
6. Installation, Operation, and Maintenance ...........................................................51 6.1 General Comments ....................................................................................51 6.2 Installation Issues.......................................................................................51 6.3 Testing and Calibration ..............................................................................51 6.4 Maintenance Issues ...................................................................................52
7. Summary.............................................................................................................53 8. Glossary of Terms & Abbreviations ....................................................................54
8.1 Glossary .....................................................................................................54 8.2 Abbreviations..............................................................................................57
9. References..........................................................................................................59 Appendix A: Processing and Integrated Systems ......................................................60 Appendix B: Examples of Thermal Imaging Cores ....................................................74 Appendix C: Examples of Thermal Imaging Cameras ...............................................76
Not Protectively Marked
5
1. Introduction
1.1 Scope of Document
Advice and guidance is provided on the use of Thermal Imaging (TI) cameras within security and surveillance systems. The guidance document includes information on TI technology and systems, as well as providing details on benefits and limitations. Practical issues ranging from TI camera suppliers and acquisition requirement specification through to in-service operation are addressed. Following this guidance does not in itself confer immunity from legal or health and safety obligations. Users of this guide should ensure that they possess the latest issue and all amendments. The guidance document has been prepared by Waterfall Solutions Ltd (WS) under contract 7017012 by the Centre for the Protection of National Infrastructure (CPNI). 1.2 Background to Thermal Imagers and Systems
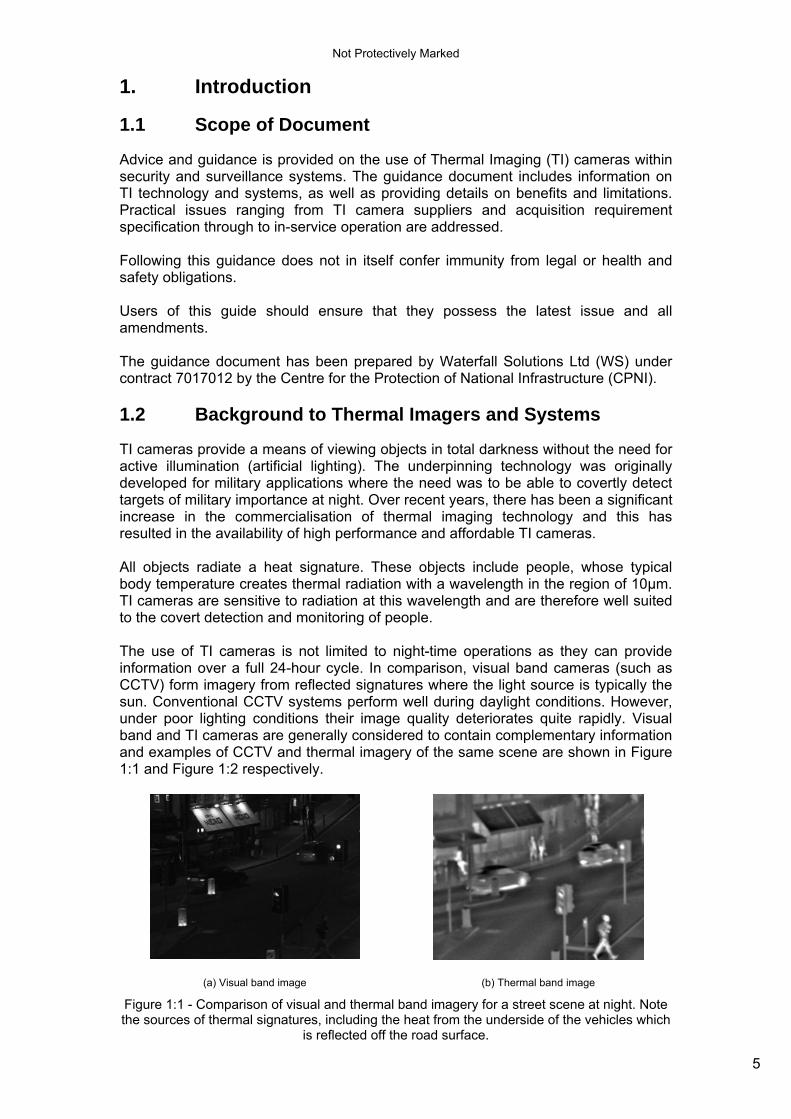
TI cameras provide a means of viewing objects in total darkness without the need for active illumination (artificial lighting). The underpinning technology was originally developed for military applications where the need was to be able to covertly detect targets of military importance at night. Over recent years, there has been a significant increase in the commercialisation of thermal imaging technology and this has resulted in the availability of high performance and affordable TI cameras. All objects radiate a heat signature. These objects include people, whose typical body temperature creates thermal radiation with a wavelength in the region of 10μm. TI cameras are sensitive to radiation at this wavelength and are therefore well suited to the covert detection and monitoring of people. The use of TI cameras is not limited to night-time operations as they can provide information over a full 24-hour cycle. In comparison, visual band cameras (such as CCTV) form imagery from reflected signatures where the light source is typically the sun. Conventional CCTV systems perform well during daylight conditions. However, under poor lighting conditions their image quality deteriorates quite rapidly. Visual band and TI cameras are generally considered to contain complementary information and examples of CCTV and thermal imagery of the same scene are shown in Figure 1:1 and Figure 1:2 respectively.
(a) Visual band image (b) Thermal band image
Figure 1:1 - Comparison of visual and thermal band imagery for a street scene at night. Note the sources of thermal signatures, including the heat from the underside of the vehicles which
is reflected off the road surface.

Not Protectively Marked
6
(a) Visual band image (b) Thermal band image
Figure 1:2 - Comparison of visual and thermal band imagery for a perimeter security situation It is difficult to see the intruder in the visual band because of the general background clutter.
1.3 Approach to Acquisition
TI cameras and systems provide a powerful capability within security and surveillance applications. However, adopting TI technology within current or future monitoring systems will attract additional costs in terms of initial acquisition, training, and in-service maintenance. It is important, therefore, to ensure that the operational effectiveness achieved fully reflects the required financial and manpower commitments made. To support the acquisition process, this guidance document will provide information against the following key questions:
1 What capability can thermal imaging provide and how would these devices be used in practice?
2 How can TI systems be assessed? 3 How should the TI camera and system be specified? 4 What camera solutions are available and what is the most cost effective
option for a given application? 5 What are the practical operational issues and how can these be met?
The format of this guidance document is aimed at providing guidance and advice against these key questions as follows: Section 2 Thermal Imaging Sensor Technology. The basic principles and
usage of TI cameras within practical situations is described. Benefits and limitations are reviewed and TI cameras are compared with other types of imaging technology. The section will therefore provide guidelines against the capability question.
Section 3 Use of i-LIDS for Video Analysis. Understanding the actual differences between different products or solutions in the context of a specific application is extremely difficult. This difficulty is often compounded by incomplete and inconsistent product specifications. The i-LIDS database provides a baseline of material against which different products can be directly tested and compared. The section will therefore provide guidelines against the assessment question.
Section 4 Specifications. Information is provided on what should be specified and why. The material covers a wide range of aspects but with the emphasis on the performance associated with TI cameras and systems. The section will therefore provide

Not Protectively Marked
7
guidelines on the specification question.
Section 5 COTS Technology Review. The take-up of TI technology within the commercial sector has created a market of commercial off-the-shelf (COTS) technology. These non-application specific products generally offer a low-cost and reliable solution to a broad range of systems. A range of different products and suppliers is reviewed together with application examples. The section will therefore provide guidelines on the costs question.
Section 6 Installation, Operation, and Maintenance. Once a TI camera system has been acquired, it has to be commissioned, used and maintained in an effective operational condition. The section will therefore provide guidelines on the operational question.
Sections 7 to 9 These sections provide some addition thoughts and recommendations in support of the guidelines provided in previous sections.
Appendix A Additional information is provided at a more detailed technical level. As such, the material aims to provide further information in support of the guidelines presented in previous sections.
Appendix B Examples of TI cores are summarised in a table.
Appendix C Examples of TI cameras are summarised in a table. 1.4 Applicable Material and Standards
A large set of documentation exists that is either directly or indirectly relevant to the use of closed-circuit television (CCTV) and digital imagery for security and surveillance applications. The following lists provide some of the relevant reports that should be read in conjunction with this guidance document, whilst a full set of documentation and related links can be found at the HOSDB web site [1]. For CCTV imaging performance and systems:
• CCTV Operational Requirements Manual [2] • UK Police Requirements for Digital CCTV Systems 09-05 [3] • Video Evidence Analysis Programme Update 07-08 [4] • Digital Imaging Procedure 2007 [5] • ACPO Practice Advice on Digital Imaging Procedure [6] • Performance Testing CCTV Perimeter Surveillance Systems 14-95 [7]
Similarly, a number of United Kingdom (UK) and international standards relate to TI cameras and associated technology (imaging, processing, displaying, and so on). A summary list of the key sources of information on standards is given below:
• National Institute of Standards and Technology [8] • US Army Night Vision & Electronics Sensors Directorate [9] • International Organisation for Standardisation [10] • Thermal Imaging Cameras Testing and Standards Development [11]
For the HOSDB i-LIDS database, the following references are available from [12]:
• i-LIDS User Guide, www.ilids.co.uk

Not Protectively Marked
8
• Parked Vehicle Scenario Definition • Abandoned Baggage Scenario Definition • Doorway Surveillance Scenario Definition • Sterile Zone Scenario Definition

Not Protectively Marked
9
2. Thermal Imaging Sensor Technology
2.1 The Infrared Spectrum
The electromagnetic spectrum comprises all sources of radiation including X-rays, visible light, radar, and radio waves. The main distinguishing feature of the different types of radiation is the wavelength associated with the carrier wave. The electromagnetic spectrum is illustrated in Figure 2:1.
Figure 2:1 - The electromagnetic spectrum
The visible band covers the spectral range over which the human vision system is sensitive. This visible spectrum covers the wavelength range of 400 x 10-9 m to 700 x 10-9 m. Given the small values of such wavelengths, they are often expressed in units of nanometres (nm) or microns (μm), where 1nm = 10-9m and 1μm = 10-6m. Thus the visible band spectral range can be expressed as either 400nm to 700nm or 0.4μm to 0.7μm. As the wavelength decreases from that of the visible part of the spectrum, the radiation band changes to the ultraviolet and then X-ray. On the other side of the visible spectrum, the wavelength increases and the radiation bands include microwave and radio. The infrared (IR) band lies between the visible band and the microwave regions. There is a well understood relationship between an object’s temperature and the wavelength of light that it emits. For example, the green part of the visible band spectrum corresponds to a temperate of approximately 5800K. This is the outer-temperature of the Sun and our visual systems have evolved to maximise the sensitivity to daylight imagery. By contrast, the IR spectrum is sensitive to lower temperatures including objects at room temperature (approximately 300K). Consequently, the IR spectrum is sensitive to the radiation from objects such as warm car engines and people, and this has driven the use of TI cameras for security and surveillance applications. The IR spectrum is invisible to the human eye and corresponds to radiation whose wavelength lies between 0.7μm (end of the visible band) and 1mm (start of the millimetre and microwave band).

Not Protectively Marked
10
The IR spectrum is composed of a number of relatively discrete bands. These bands are determined by the atmospheric transmission which, in turn, is governed by numerous molecular absorption functions. A typical transmission profile is illustrated in Figure 2:2.
Figure 2:2 - Illustrating the transmission of the IR spectrum through the atmosphere. Different molecules dominate the absorption function at different wavelengths. The most noticeable of
these is that of water between 5μm and 8μm. The IR transmission bands are often used to differentiate TI cameras. Although there are a number of different naming conventions for the IR bands, the following definitions are reasonably standard and are used within this document:
• Near Infrared (NIR): 0.7μm – 1.4 μm • Short Wave Infrared (SWIR): 1.4μm – 3.0μm • Medium Wave Infrared (MWIR): 3.0μm – 5.0 μm • Long Wave Infrared (LWIR): 8.0μm - 14μm • Very Long Wave Infrared (VLWIR) or Far Infrared (FIR): > 15μm
Imagery of the same scene can look very different depending on which band is used. Figure 2:3 illustrates the effect of viewing the same scene using SWIR and LWIR TI cameras. A visual band image is also shown for comparison.
(a) Visual band (b) SWIR band (c) LWIR band
Figure 2:3 - Examples of three different spectral bands. Note that the SWIR image looks more like the visual band image than that of the LWIR. Conversely, the MWIR (not shown here)
looks more like the LWIR. TI cameras used for security and surveillance tasks tend to use the MWIR and, more often, the LWIR band. For the detection of a person, the associated radiated signature is at a maximum in the LWIR band although the signature remains strong in the MWIR. Imagery from LWIR and MWIR cameras is primarily driven by object self-radiation (its temperature) although the shorter wavelength range of the MWIR can include a component of reflected light such as that from the Sun.
Not Protectively Marked
11
One disadvantage of MWIR and LWIR cameras for security and surveillance applications is that the imagery is very different to that of the visual band. Consequently, it can be difficult to base evidence on purely IR data. Consequently, illuminated visible band sensors could be required to gather evidence for identification purposes. 2.2 Thermal Imager Systems
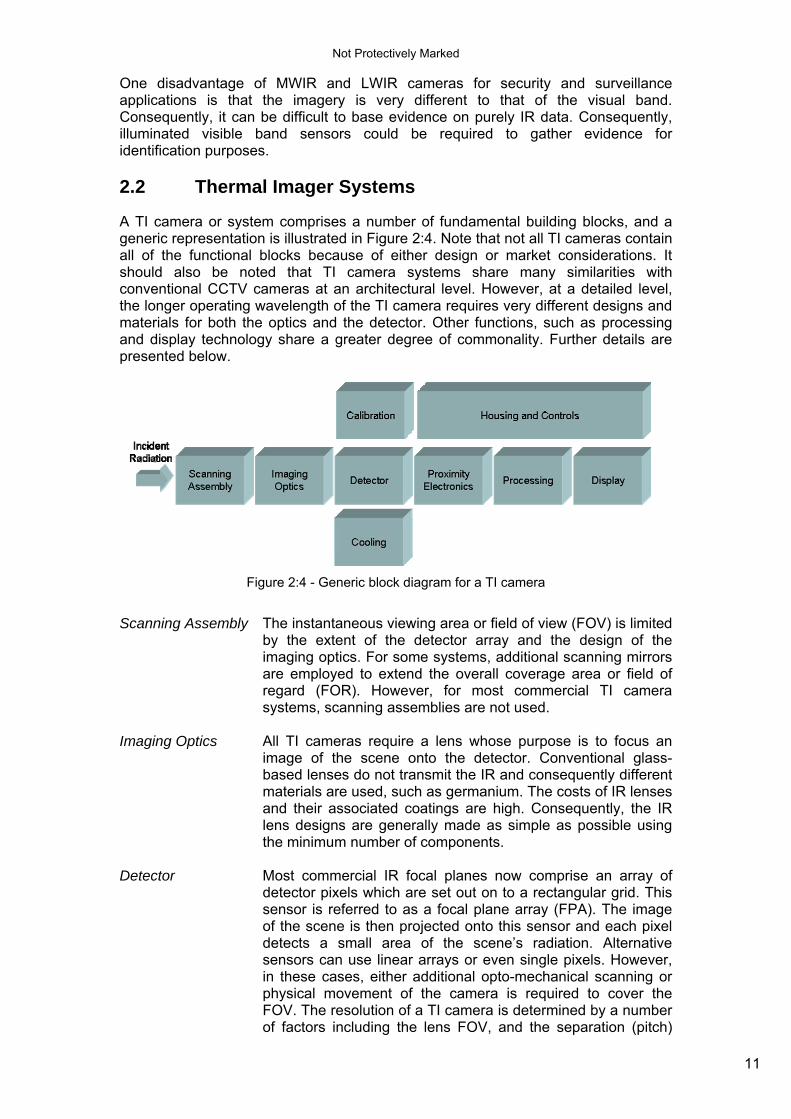
A TI camera or system comprises a number of fundamental building blocks, and a generic representation is illustrated in Figure 2:4. Note that not all TI cameras contain all of the functional blocks because of either design or market considerations. It should also be noted that TI camera systems share many similarities with conventional CCTV cameras at an architectural level. However, at a detailed level, the longer operating wavelength of the TI camera requires very different designs and materials for both the optics and the detector. Other functions, such as processing and display technology share a greater degree of commonality. Further details are presented below.
Figure 2:4 - Generic block diagram for a TI camera
Scanning Assembly The instantaneous viewing area or field of view (FOV) is limited
by the extent of the detector array and the design of the imaging optics. For some systems, additional scanning mirrors are employed to extend the overall coverage area or field of regard (FOR). However, for most commercial TI camera systems, scanning assemblies are not used.
Imaging Optics All TI cameras require a lens whose purpose is to focus an image of the scene onto the detector. Conventional glass-based lenses do not transmit the IR and consequently different materials are used, such as germanium. The costs of IR lenses and their associated coatings are high. Consequently, the IR lens designs are generally made as simple as possible using the minimum number of components.
Detector Most commercial IR focal planes now comprise an array of detector pixels which are set out on to a rectangular grid. This sensor is referred to as a focal plane array (FPA). The image of the scene is then projected onto this sensor and each pixel detects a small area of the scene’s radiation. Alternative sensors can use linear arrays or even single pixels. However, in these cases, either additional opto-mechanical scanning or physical movement of the camera is required to cover the FOV. The resolution of a TI camera is determined by a number of factors including the lens FOV, and the separation (pitch)

Not Protectively Marked
12
between adjacent detector pixels. In some TI cameras, a micro-scan mirror is introduced in the imaging optics to provide a finer level of resolution.
Calibration The response from each individual detector pixel to a given radiation level can change over time and with respect to its neighbouring pixels. This response drift can be in signal amplification (contrast or gain) or the average output signal (brightness or offset). Consequently, the IR detectors require a non-uniformity correction (NUC) to be performed. Most TI cameras employ a calibration source which is periodically viewed by the sensor. Such active calibration requires the need for opto-mechanical components which adds cost and weight. An alternative approach is to correct the errors using scene-based non-uniformity correction (SBNUC). SBNUC removes the need for separate calibration sources although it does require scene motion to calculate the gain and offset corrections.
Cooling Some TI cameras operate on the basis of the detection of individual photons by means of matching the photon energy to detector material absorption. Given that the longer wavelengths associated with the IR correspond to lower energy levels, the detectors become highly susceptible to thermally-induced noise and must therefore be cooled. In LWIR cameras, the detector arrays are typically cooled to 80K using a mechanical cooling engine. Such cooling engines add cost, complexity, weight, and require additional maintenance. They also require a cool-down period which can be many minutes. Rather than detecting individual photons, an alternative approach is to use the image of the scene to change the electrical characteristics of a detector material through heating. In this case, cooling is not required and, in fact, some detector materials are held at slightly elevated temperatures to maximise their performance. Such ‘uncooled’ TI cameras are widely available and offer moderate to good performance at low cost.
Proximity Electronics
The electrical signals generated at the sensor must be captured, amplified and read out through proximity electronics. It is important that such electronic circuitry minimises the introduction of noise prior to amplification. For photon detection cameras, the electronics can also be cooled to help reduce the noise level.
Processing The output image from the sensor is generally very poor (particularly when compared with CCTV imagery) and processing is required to generate an acceptable image output. The criteria used to judge acceptable vary depending on application but they generally include noise, contrast, uniformity, and the level of image artefacts. Processing can go beyond image enhancement and basic functions, such as digital zoom and autofocus, to include ‘higher-level’ functions such as change detection and automated tracking. Processing is a major growth area in TI camera systems because it offers greatly increased capability for minimal cost.

Not Protectively Marked
13
Display Most TI camera systems generate information that is displayed to an operator. What is often not appreciated, however, is that the display can limit the performance of the TI camera as is the case for CCTV systems. Such limitations include factors such as brightness, black level, display area, viewing distance, and viewing condition (including background lighting). Displays are typically of two sorts. The first are those that are integrated with the camera housing and the controls are constrained by the limited number of buttons on the unit. The second is a separate display screen which may provide touch panel control or a more conventional mouse and key board for direct interaction.
Housing and Controls
The housing of a TI camera is extremely important both in terms of its usability and its survivability. The latter can include handling and ingress of water and dust. The controls should allow the user to operate the camera easily and effectively. Additionally, the TI camera may need to be attached to a separate mount such as a pan-tilt-zoom (PTZ) unit.
TI cameras come in many different forms for both mounted and hand-held devices. The latter are typically, low-cost and low-weight units used by security personnel while the former corresponds to fixed installations on platforms such as posts/buildings, helicopters and patrol boats. 2.3 Basic Principle of Operation
There are two fundamental methods for detecting IR radiation: photon detection and thermal energy detection. Photon detectors rely on the energy of a thermal photon exciting electrons in the detector material which can then be collected and amplified. In a thermal detector, the incident IR radiation is absorbed, resulting in a change in resistivity which can be measured by passing a current across the sensor. Photon Detection
Compared to visible light, thermal photons are much lower in energy, which means that the photon detectors need to be cooled well below zero Celsius to prevent noise in the sensor from drowning out the incoming radiation. Because of these cooling systems, photon detectors tend to have a high sensitivity. However, it also means they are larger, heavier and more expensive, with a single camera typically costing from £30k upwards. Photon detection cameras are often referred to as cooled cameras.
Not Protectively Marked
14
Thermal Detection
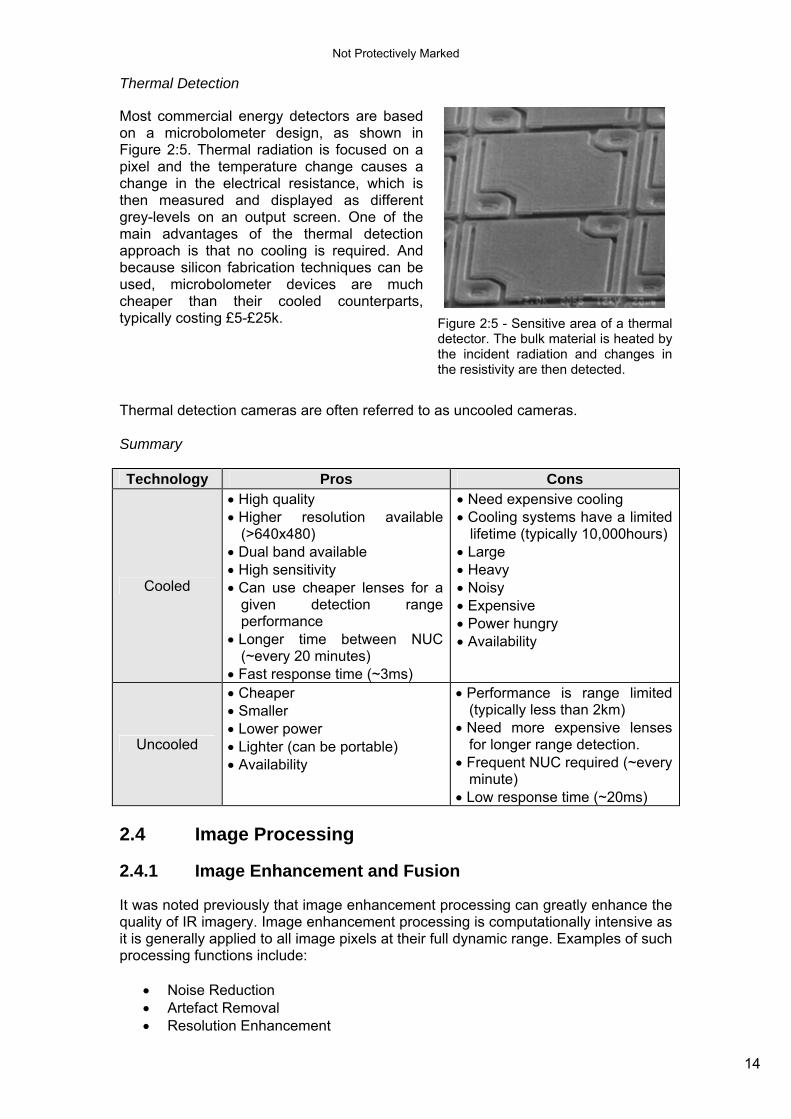
Most commercial energy detectors are based on a microbolometer design, as shown in Figure 2:5. Thermal radiation is focused on a pixel and the temperature change causes a change in the electrical resistance, which is then measured and displayed as different grey-levels on an output screen. One of the main advantages of the thermal detection approach is that no cooling is required. And because silicon fabrication techniques can be used, microbolometer devices are much cheaper than their cooled counterparts, typically costing £5-£25k.
Figure 2:5 - Sensitive area of a thermal detector. The bulk material is heated by the incident radiation and changes in the resistivity are then detected.
Thermal detection cameras are often referred to as uncooled cameras. Summary
Technology Pros Cons
Cooled
• High quality • Higher resolution available
(>640x480) • Dual band available • High sensitivity • Can use cheaper lenses for a
given detection range performance
• Longer time between NUC (~every 20 minutes)
• Fast response time (~3ms)
• Need expensive cooling • Cooling systems have a limited
lifetime (typically 10,000hours) • Large • Heavy • Noisy • Expensive • Power hungry • Availability
Uncooled
• Cheaper • Smaller • Lower power • Lighter (can be portable) • Availability
• Performance is range limited (typically less than 2km)
• Need more expensive lenses for longer range detection.
• Frequent NUC required (~every minute)
• Low response time (~20ms) 2.4 Image Processing
2.4.1 Image Enhancement and Fusion
It was noted previously that image enhancement processing can greatly enhance the quality of IR imagery. Image enhancement processing is computationally intensive as it is generally applied to all image pixels at their full dynamic range. Examples of such processing functions include:
• Noise Reduction • Artefact Removal • Resolution Enhancement

Not Protectively Marked
15
• Contrast Enhancement • Blur Removal
Some of these processes can be included in commercially available cameras although the quality may be limited. It should also be noted that with CCTV systems, these and related enhancement algorithms are sometimes referred to as video analytics (VA) or full motion video (FMV) processing. The following figure provides some illustrations of different processing functions:
(a) The removal of interference-induced noise in a thermal image. The image on the left is the original image while that on the right is from the corrected video stream. The sequence is from a maritime sequence and the presence of an object can be discerned in the corrected image (centre of the frame, just below the horizon).
(b) Movements within the scene or of the camera can be used to generate a higher
resolution image (super-resolution). The image on the left is from the original sequence and that on the right is after processing. Note that the definition of the wire fence is increased through the super-resolution process.
(c) Many image streams suffer from low quality contrast which can vary across the image
frame. The above illustrates the improved image quality for a thermal image. The processed image (on the right) has greatly improved contrast which helps the operator more readily interpret scene content.
Figure 2:6 - Examples of image enhancement algorithms

Not Protectively Marked
16
It has been noted before that visual band and thermal imagery contain complementary information. This factor can be used as a basis for combining the video streams from a TI camera with a visual band camera to produce a fused output. Such image fusion processing has been shown to greatly enhance the performance of security and surveillance systems over a 24-hour cycle and under a wider variety of weather conditions. Given the relatively low cost of CCTV compared to TI cameras, there is an emerging trend to combine them into a single housing. Figure 2:7 provides some examples of image fusion within security and surveillance scenarios.

Not Protectively Marked
17
(a) Detecting and identify targets at sea presents a major challenge because of the level of persistent clutter associated with the water surface. This can cause high levels of false alarms as well as reducing the visual clarity of the target. The above example illustrates visible band and thermal imagery of two sea kayaks. The visible band image contains a good level of detail while the thermal image provides good target contrast. The fused image, on the right, combines both the detail and contrast attributes to provide a superior image. Also note that a pseudo-colour fusion process has been used to further aid the identification of the targets.
(b) Targets often attempt to conceal themselves using natural backgrounds and features. The above illustrates the case for a person moving at the edge of a
wooded area. Note how the fused image retains the texture to provide scene context.
Not Protectively Marked
18
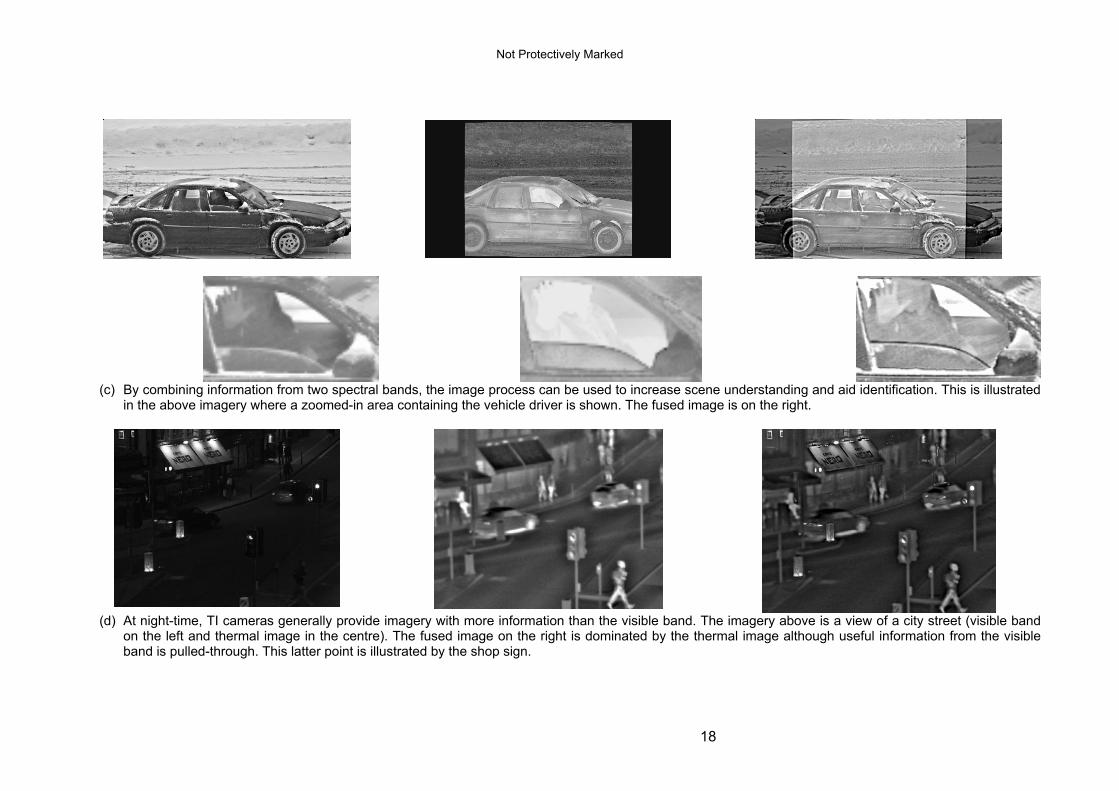
(c) By combining information from two spectral bands, the image process can be used to increase scene understanding and aid identification. This is illustrated
in the above imagery where a zoomed-in area containing the vehicle driver is shown. The fused image is on the right.
(d) At night-time, TI cameras generally provide imagery with more information than the visible band. The imagery above is a view of a city street (visible band
on the left and thermal image in the centre). The fused image on the right is dominated by the thermal image although useful information from the visible band is pulled-through. This latter point is illustrated by the shop sign.

Not Protectively Marked
19
(e) These images were taken from a police helicopter under poor viewing conditions (it was snowing). The visible band imagery is quite poor, as would be
expected, but the thermal image has more content (centre). Again, the fused image manages to pull-through the pertinent information from both bands.
Figure 2:7 - Examples of visible band, thermal, and fused images from a range of different surveillance applications

20
2.4.2 Detection & Tracking
The previous sections have focused on the enhancement of imagery in terms of their quality. Such processing is important for both situational awareness and identification purposes when the imagery is viewed directly by an operator. There is a growing trend to further analyse image streams to detect and track targets of interest. The result of this processing can be used in a number of ways including:
• Assisting operators by alerting them to specific issues or threats • Using target track information to automatically steer a PTZ-mounted camera • Determining anomalous behaviour
The detection and tracking processes are illustrated in Figure 2:8.
(a) Illustrating automatic detection of targets at sea. In this case, the objects are lifeboats. The thermal imagery contains a high level of clutter for which the detection processing has to correct.
(b) Two frames from a thermal image sequence. A person has been detected and is
tracked. The track location is then used to command the PTZ to follow the person as he moves from left to right across the FOV.
(c) Detecting moving vehicles using CCTV imagery. The image on the left shows the vehicle detections which are then used to form tracks (right-hand image). Over time, the track history is built up which bounds the nominal traffic flow behaviour. Using this information, anomalous tracks can be identified and an operator alerted if required.
Figure 2:8 - Examples of detection and tracking

21
2.4.3 Display of Imagery
Colour is characteristic of the visible band spectrum and has no meaning in the IR. Consequently, TI imagery is fundamentally greyscale. The appearance of IR imagery is also very different to that of a greyscale visible band image. In particular, IR imagery can appear to look like a negative image. Many TI cameras have the ability to display the image as either black-hot or white-hot. In white-hot schemes, the hottest objects are brighter than the cooler objects (i.e. a person would typically appear brighter than the background) while in black-hot images, hotter objects are darker. This is illustrated in Figure 2:9.
(a) White-hot image (b) Black-hot image
(c) White-hot image (d) Black-hot image
Figure 2:9 - Examples of white-hot and black-hot imagery White-hot can often be more intuitive as people are used to hot objects appearing bright. On the other hand, many people prefer black-hot as the overall look of the scene is generally closer to its visible appearance. Ultimately this choice comes down to user preference so is useful to have a ‘polarity’ or ‘invert’ switch available to the user. Some cameras provide this functionality. In some TI camera systems, the greyscale imagery can be converted to a colour map where a particular colour is associated with the brightness of the objects within the scene. Thus the colour does not reflect spectral information but rather brightness and is sometimes referred to as pseudo-colour. Examples of this are illustrated in Figure 2:10.

22
Figure 2:10- Examples of pseudo colouring of IR imagery
The brightness value of each image pixel can only take one of a limited number of values. For an 8-bit greyscale image, this corresponds to 256 possible values (28). For most modern colour displays, the RGB values for each pixel are 8-bit which, when combined, gives a 24-bit displayed image. Different TI cameras produce imagery with different numbers of grey-levels although these are typically 8, 10 or 12 bits (256, 1,024, or 4,096 grey-levels respectively). However, the human visual system can only resolve around 6 bits (or 64 grey-levels) so a greyscale image will contain more information than can be seen by an operator. Consequently, most thermal imagers provide the ability to re-scale the imagery in order to allow a user to better visualise the information. Example functions include linear, exponential and logarithmic scaling. Most display devices have brightness and contrast controls which give the user further control of the appearance of the imagery; if the scene appears bland or is being viewed under bright conditions, then it may be necessary to increase the contrast or brightness. 2.5 Automation in TI Camera Systems
An important issue for TI camera systems is the level of automation required. These levels include:
• Manual (un-assisted) • Assisted • Automated
An example of an un-assisted TI camera is the direct display of the camera image onto a display. The operator can adjust the picture quality either using the camera or via controls on a display console. The interpretation of the imagery is wholly undertaken by the operator. An assisted system is one where processing is performed on an image sequence and the results of this processing are used to alert the user to certain information (e.g. the presence of a person). An autonomous system is one where the processing is used to automate the system response rather than relying on an operator. A simple example would be the detection and tracking of a person and the raising of an alarm when a security breach occurred. Assisted and automated systems are subject to false alarms. High false alarm rates reduce the confidence in the correct operation of a system. On the other hand, a low detection rate may indicate a poor sensitivity level. The i-LIDS data sets [12] can be used to properly test the detection and false-alarm performance of systems.

23
2.6 TI Camera Performance Measures
2.6.1 Introduction
The performance of a TI camera is often described in terms of performance measures and different measures can be given for different cameras. Furthermore, suppliers generally aim to provide information on their product differentiators only, leading to an incomplete description of the TI camera’s capability. The overall performance of a TI camera can be sub-divided into the following categories:
• Geometric configuration (including FOV and target detection and identification ranges)
• Optical properties (including resolution and distortions) • Target Signature (including thermal contrast) • Detection (including sensitivity, detection ranges and false alarms) • Picture quality (including noise and contrast) • Temporal measures (including flicker and tracking) • Environmental (including thermal drift and atmospheric transmission effects)
In this section, a brief review of the different performance measures is given. Further details of the processing functions can be found in Appendix A. 2.6.2 Measures of Resolution
Resolution of a TI camera is specified in a variety of different ways in either object (target) space or image (detector) space. Object space is generally more intuitive and is described here. The image of the scene is projected onto an array of detector pixels, and each pixel detects a small area of the scene’s radiation. The scene information contained within a single pixel is therefore the average of the radiation over this area. The further the target is from the camera, the fewer pixels it occupies in the image. When a target size occupies a single pixel width, this corresponds to the instantaneous resolution of the imager. A resolution measure that is often used is that of line-pairs. A line-pair corresponds to the angular extent of two pixels. 2.6.3 Geometrical Factors
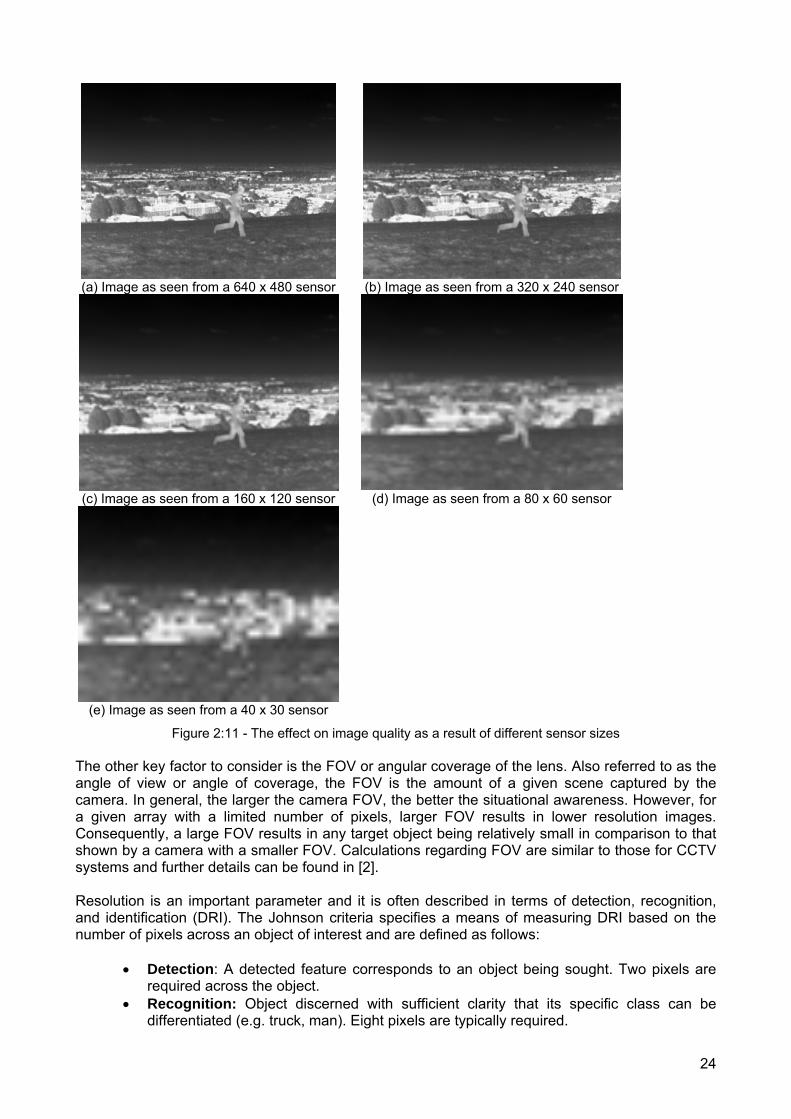
Most IR imaging sensors are a rectangular array of detector pixels. Typical array sizes include 320x240, 640x480, and 1024x768, with the cost increasing as the array size increases: the greater the number of pixels, the greater the image resolution for a given FOV. For comparison, a high-end HDTV comprises 1920 x 1080 pixels and a typical CCTV is 720 x 576 pixels. As with visible band cameras, IR sensors form an image of a scene at a focal plane within the sensor. These sensors suffer the same limitations in resolution as CCTV cameras as illustrated in Figure 2:11.
24
(a) Image as seen from a 640 x 480 sensor (b) Image as seen from a 320 x 240 sensor
(c) Image as seen from a 160 x 120 sensor (d) Image as seen from a 80 x 60 sensor
(e) Image as seen from a 40 x 30 sensor
Figure 2:11 - The effect on image quality as a result of different sensor sizes The other key factor to consider is the FOV or angular coverage of the lens. Also referred to as the angle of view or angle of coverage, the FOV is the amount of a given scene captured by the camera. In general, the larger the camera FOV, the better the situational awareness. However, for a given array with a limited number of pixels, larger FOV results in lower resolution images. Consequently, a large FOV results in any target object being relatively small in comparison to that shown by a camera with a smaller FOV. Calculations regarding FOV are similar to those for CCTV systems and further details can be found in [2]. Resolution is an important parameter and it is often described in terms of detection, recognition, and identification (DRI). The Johnson criteria specifies a means of measuring DRI based on the number of pixels across an object of interest and are defined as follows:
• Detection: A detected feature corresponds to an object being sought. Two pixels are required across the object.
• Recognition: Object discerned with sufficient clarity that its specific class can be differentiated (e.g. truck, man). Eight pixels are typically required.
25
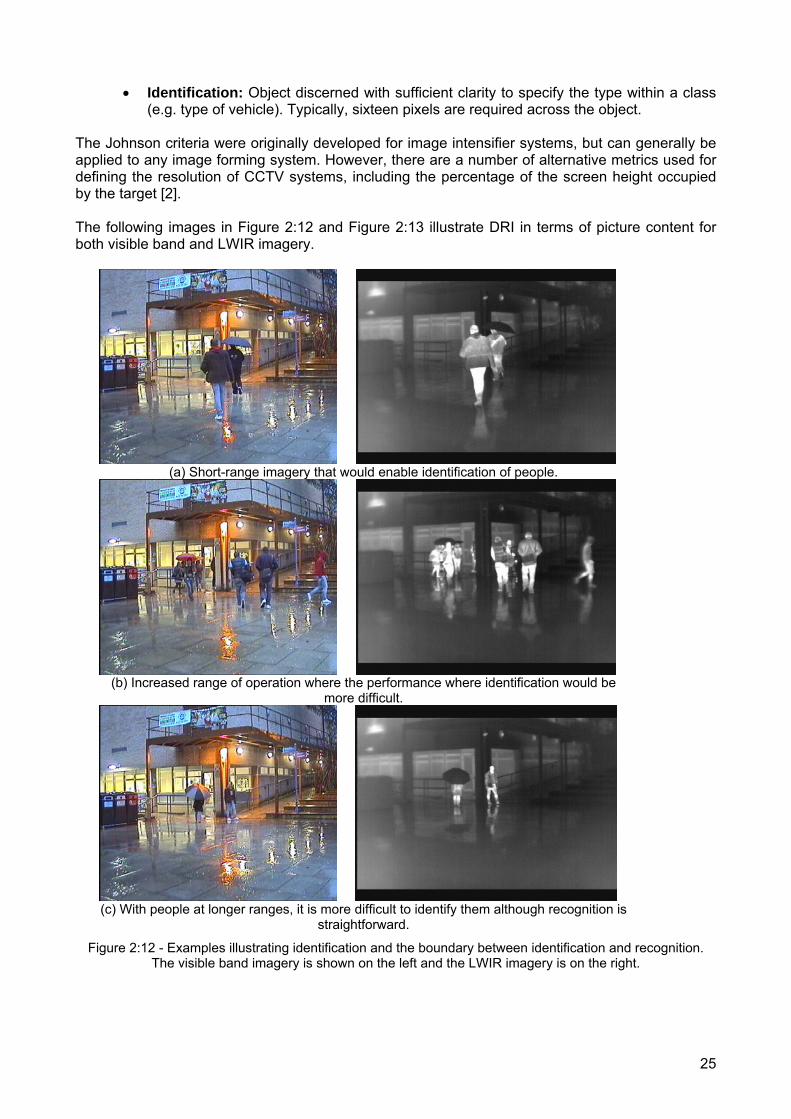
• Identification: Object discerned with sufficient clarity to specify the type within a class (e.g. type of vehicle). Typically, sixteen pixels are required across the object.
The Johnson criteria were originally developed for image intensifier systems, but can generally be applied to any image forming system. However, there are a number of alternative metrics used for defining the resolution of CCTV systems, including the percentage of the screen height occupied by the target [2]. The following images in Figure 2:12 and Figure 2:13 illustrate DRI in terms of picture content for both visible band and LWIR imagery.
(a) Short-range imagery that would enable identification of people.
(b) Increased range of operation where the performance where identification would be
more difficult.
(c) With people at longer ranges, it is more difficult to identify them although recognition is
straightforward.
Figure 2:12 - Examples illustrating identification and the boundary between identification and recognition. The visible band imagery is shown on the left and the LWIR imagery is on the right.

26
(a) Imagery containing short range through to longer range targets. Information on the person in the foreground can be readily seen and this would support identification. It is
only possible to classify targets in the distance as people (recognition).
(b) Imagery containing targets at medium and longer ranges. Note that the person shown in the foreground in (a) is now at a longer range. This association is only possible in the visible band because of the available colour information. It is not possible to make this
association in the LWIR imagery.
Figure 2:13 - Further examples illustrating identification and the boundary between identification and recognition. The visual band imagery is shown on the left and the LWIR imagery is on the right.

27
(a) Target range 50m (b) Target range 75m
(c) Target range 500m (d) Target range 500m (circled)
Figure 2:14 - Examples illustrating recognition and detection. At the shorter ranges, it is possible to determine the presence of a boat and a rower (recognition). At longer range, only the presence on an object
can be determined (detection). This section has discussed the ability of a TI camera to detect and classify a target based on basic geometrical sensor characteristics, target size, and range. In practice, other characteristics will directly impact the DRI performance including the sensitivity of the camera, the target brightness, the background, and any motion of the target. These factors are discussed below.
2.6.4 Optical Properties
The purpose of sensor optics is to collect sufficient thermal energy at sufficient resolution to meet the system requirements. The amount of energy imaged onto the sensor is determined by the transmission of the optical components and the F-number of the lens. The F-number (or stop) is a well known parameter in visible band camera systems such as a single lens reflex (SLR) camera. It is defined as the ratio of the focal length of the lens to the diameter of the entrance aperture. As with CCTV cameras, the larger the lens aperture, the greater the amount of energy that reaches the sensor. When the F-number is small, the lens is often described as ‘fast’. In the visual band, F-numbers can vary depending on application but typical aperture stop values used are 5.6, 8, 11 and 16. For each increase in stop value, the energy transmitted to the FPA is approximately halved. For TI cameras, faster lenses are generally used. For example, most uncooled TI cameras operate with an F-number in the region of 1. Although faster lenses do provide benefits in terms of collected energy (and hence longer range detection), they do have some disadvantages including higher cost and reduced depth of focus. An important difference between CCTV and TI cameras is the resolution constraint imposed by diffraction. Diffraction is the blurring of an image, the magnitude of which increases with wavelength and reduces with aperture size. Although diffraction occurs in CCTV cameras, the
28
effect is usually not noticeable because of the much smaller wavelength of the visible spectral band. The imaging ability of a lens is also limited by aberrations in the optics. The latter arises through approximations to ideal surfaces due to cost and manufacturing limitations.
Ultimately, all optical systems are diffraction limited and it is not possible to resolve smaller targets which exceed this limit. It should be noted that even for targets that can be resolved, their visibility decreases as they become smaller. Consequently, finer features within the imagery will exhibit a lower contrast. The variation of contrast at different spatial frequencies is generally referred to as the modulation transfer function (MTF). In other words, the MTF is effectively a measure of the ability of an imaging system to image objects of different sizes. 2.6.5 Detector and Electronics
Detector arrays are often described in terms of their detectivity (D) or specific detectivity (D*): the greater the D* figure, the better the detector performance. The two most common IR detector materials used for photon (cooled) TI cameras are Indium Antimonide (InSb) and Cadmium Mercury Telluride (CMT or HgxCd1-xTe). InSb is limited to MWIR and is often the material of choice for US camera suppliers. CMT can be used as a sensor in both the MWIR and LWIR by changing the ratio of mercury and cadmium. CMT is often used as the preferred material for UK and European for TI cameras. For uncooled cameras, different materials are used, with the two most common being amorphous silicon and vanadium oxide. The amorphous silicon is often preferred because, being silicon-based, it can be readily integrated with silicon circuitry. 2.6.6 Target Signatures and the Atmosphere
There are two primary sources of target signature: that which is reflected and that which is self-radiated. For the LWIR bands, the signature is generally dominated by the target’s heat radiation. For MWIR bands, direct reflection of bright sources (such as sunlight) can also contribute significantly. In the SWIR and NIR bands reflected light becomes dominant. In terms of the thermal signature, what is of interest is the contrast relative to the background. The signature is then stated in a number of ways based on the contrast temperature. This temperature difference is generally referred to as ΔT (pronounced delta T) and is measured in thousandths of Kelvin (mK). The energy associated with this temperature difference is often described through terms including radiance and radiant intensity. The atmospheric viewing conditions will affect the performance of the TI camera system. The target signature propagates through the atmosphere, which affects the signature through three basic mechanisms. Firstly, the atmosphere absorbs or scatters the energy from the target. Secondly, the atmosphere scatters radiation into the sensor’s FOV, and thirdly, the atmosphere emits its own thermal radiation. Although an IR system does offer better performance in rain and fog than the visible band, this remains somewhat limited at longer ranges. It should also be noted that the atmospheric transmission is dependent on other factors such as humidity and temperature, as shown in Figure 2:15.

29
0
10
20
30
40
50
60
70
80
90
100
0 50 100 150 200 250 300 350 400 450 500Range to Target (m)
Atm
osph
eric
Tra
nsm
issi
on (p
erce
nt)
Moderate Fog
Rain
Haze
Good Visibility
Figure 2:15 - Atmospheric transmission
The performance of LWIR sensors does decrease with high levels of humidity and this is reflected in the growing preference for MWIR sensors in areas such as the Asian-Pacific. Finally, the atmospheric transmission can be greatly reduced by smoke and other particulates. Operating in the IR spectrum can provide increased visibility through smoke compared to the visible band, as illustrated in Figure 2:16.
(a) Visual band image (b) LWIR image
Figure 2:16 - The effect of smoke on visible and LWIR bands 2.6.7 System Performance Parameters
The previous sections have provided brief descriptions of some of the most commonly used parameters associated with optics and detectors. However, in most cases, the performance parameters of interest are those of the whole TI system. Unfortunately, some suppliers will quote specific performance measures for the detector (say) rather than the complete system. In this section, some of the most useful system performance parameters are described. The first of these parameters is the signal-to-noise ratio (SNR). The SNR provides an indication of distinctiveness of a target relative to the noise level in the imagery. The noise is generated through various sources including the FPA and electronics. For an SNR of 1, the target cannot be distinguished within a single image frame. At higher SNR values, the target becomes more distinct and this is illustrated in Figure 2:17.

30
(a) SNR > 10 (b) SNR = 5.4
(c) SNR = 3.5 (d) SNR = 2.3
Figure 2:17 - The effect of noise on an image as reflected in the signal to noise ratio. The signal level used is based upon that of the rower who is at a range of approximately 75m.
A parameter that is related to SNR is the noise equivalent temperature difference (NETD) which is often quoted in mK. TI cameras detect targets on the basis of their temperature difference relative to the local background. The NETD corresponds to the temperature difference which gives a signal whose magnitude is at the same level as the noise. Targets are generally not viewed against bland backgrounds. Rather, they are seen in the context of other image features including the background. Consequently, to enable the TI camera to detect a specific target, that target signature level must be greater than that of the local scene features. This is generally referred to as the signal-to-clutter ratio (SCR). SCR is not usually quoted by camera suppliers because the background scene (which determines the SCR) changes with application. The SCR can be optimised through signal and image processing. A simple example of this is the use of a filter that is set to maximise the brightness of objects of certain sizes whilst suppressing those objects which are smaller or larger. When TI cameras are used to alert an operator to a specific event or threat characteristic, the processing will inevitably generate alarms which do no relate to the true threats. These are referred to as false alarms (FA) and the number which occurs per hour or per day is referred to as the false alarm rate (FAR). False alarms are caused by either noise or, more commonly, by other features in the scene which are very bright or have a similar size to the threat. The FAR grows very rapidly as the SNR or SCR approaches one. Using this dependency, the FAR can be controlled by setting a minimum SNR or SCR threshold, below which detections are not reported. Typically, this SNR or SCR threshold is in the region of 5 to 10 depending on the application. Although using a high threshold does reduce the FAR, it also reduces the probability that the TI system will report a detection. In other words, operating at a higher threshold level reduces parameters such as the detection range. These non-detections are sometimes referred to as ‘false negatives’ as indicated in Table 2:1.

31
Target Declared Target Not Declared
Target Present Correct Detection False Negative Target Not Present False Positive Correct Non-Detection
Table 2:1 - Terminology for false alarms There are a number of other system performance measures that are sometimes used for assisted and automated TI systems including a number of statistic or probability functions. These are briefing summarised in Table 2:2.
Parameter Annotation Description System Impact Signal to Noise Ratio
SNR A measure of the relative magnitude of the target signal to the system noise.
Low SNR values result in low detection probabilities and high false alarm rates.
Probability of Detection
Pdet A measure of the ability of the system to correctly detect a target (true positive).
Low detection probabilities result in failures to detect threats.
Probability of Declaration
Pdec A measure of the accuracy of target declaration following detection, tracking, and classification processing.
Low declaration probabilities result in failures to alert the system to the presence of threats.
Probability of Recognition
Prec A measure of the ability of the system to correctly recognise a target type.
Low probability figures increase the uncertainty with regard to the nature of the threat.
Probability of Identification
Pid A measure of the ability of the system to correctly identify a target.
Low probability figures increase the uncertainty with regard to the nature of the threat.
Probability of False Alarm
Pfa A measure of the ability of the system to distinguish between a true target and a false signal due to noise or clutter.
High probability figures indicate a decrease in the ability to extract true targets within a scene and an increase in the operator workload.
Detection Time
Tdet The time required to create a detection once a target has become unmasked (i.e. exceeds a pre-determined SNR).
Long detection times indicate a poor response in situations where threats are evolving rapidly.
Declaration Time
Tdec The time required to confirm a targets presence detection once a target has become unmasked (i.e. exceeds a pre-determined SNR).
Long detection times indicate a poor response in situations where threats are evolving rapidly.
False Alarm Rate
FAR The number of false alarms generated by the system within a given period of time.
A high FAR reduces the confidence in the system.
Table 2:2 - System performance parameters
2.7 Causes of False Alarms
False alarms relate to systems where processing is used to detect and declare specific targets or threats. In general, a processing function is applied to an image sequence using a filter that aims to

32
highlight the given target. The result of this filtering is then subject to a threshold, above which, an object is declared as a target. If an object exceeds the threshold, but is not considered as to be a target, it is referred to as a false alarm. If the threshold in the processing is too high, then the system performance will be dominated by false negatives (i.e. the probability of detecting targets which are present in the scene will be low). Conversely, if the threshold is set too low, the probability of detection of targets will be high. However, many non-targets will be declared, leading to a high false alarm rate. In TI camera systems, false alarms can be caused by two main sources. The first are noise and artefacts. These are generally generated by the camera. The second source is the scene itself where temperature differentials can present target-like features. Noise-related false alarms can be generally reduced through the use of processing such as integration of the image over time. Scene-introduced signatures are more difficult to deal with, particularly as shape and motion information cannot be used as additional discriminators. The degree of such background clutter is generally determined by the complexity of the background scene. 2.8 Post-Event Analysis
The focus of this Guidance Document is on real-time operation and specification of TI camera systems. However, for most systems, the data is recorded and stored for later review and preparation of evidence, which could include thermal imagery. This data storage and post-event analysis task is an important aspect of the use of imaging systems and is therefore mentioned briefly here.
As the cost of capture and storage devices decreases, the ability to rapidly search through large amounts of data becomes increasingly important in post-event analysis. Whilst data management can be improved through the use of meta-data, automated video analysis further reduces the human element involved in indexing and searching large volumes of data.
Specific features of a post-event analysis system include:
• Image enhancement to aid image viewing and interpretation • Intelligent data compression to reduce data storage requirements without compromising
the value of the stored data • Automated meta-data generation to support rapid data retrieval • Intelligent database search techniques to provide more efficient exploitation of the
captured imagery Additionally, automated content analysis techniques such as detection, tracking and classification may assist in post-event analysis. Traditional approaches involve replaying video which has been declared ‘of interest’, or overlaying detection and tracking information onto a video stream. More advanced methods attempt to create panoramic, three-dimensional (3D) or representative visualisations which might improve upon operator awareness. 2.9 Cost and Commercial Considerations
TI cameras are more expensive than CCTV cameras and these costs are discussed in more detail later. However, an uncooled TI camera will typically cost between £5K and £25K which is between 10 and 100 times more expensive than a CCTV camera. For cooled cameras, the costs are even higher and can be of the order of £30K to £100K for the most capable systems. The lenses for TI cameras designs are generally less flexible than their CCTV counterparts. In particular, most infrared lenses have a fixed FOV (rather than a zoom lens) and, consequently, multiple lenses may be required to meet the needs of different operational requirements.

33
TI cameras were traditionally developed for military systems and, hence, were dominated in the past by US suppliers. US companies are still a major supplier of TI cameras although there are growing numbers of other countries that can produce TI cameras including:
• UK • Europe (France and Germany) • Israel • Asia (including China)
Many of the systems provided by the US are subject to very stringent export limitations (ITAR). As a consequence of this, US technology that is exported is often older or lower specification equipment. Processing is now seen as the key technology within security and surveillance systems. This has been well recognised by the US and the export of processing technology from the US is heavily vetted through ITAR. 2.10 Benefits and Limitations
Most people are familiar with visible band cameras and so it is useful to compare the benefits and limitations of TI cameras with their visible band counterparts. These are summarised in Table 2:3. Sensor Type Advantages Disadvantages
Visible Band • High resolution • Technology well understood • Low cost • Reliable • Compact • Matches human scene
perception
• Limited to daylight / low light operation • Affected by clouds, rain, fog, haze, dust,
smoke • Limited ranging capability • Clutter constrains detection performance
MWIR/LWIR • Good angular resolution • Covert • Day/night operation • Improved viewing in poor
atmospheric conditions • Provides performance in
rain, fog, and smoke
• Cooling required for high performance systems
• Higher costs • Reduced reliability (cooling engine) • Clutter constrains detection performance
Table 2:3 - Sensor performance characteristics An important question is ‘how do different sensors compare under different atmospheric conditions?’ The following table (Table 2:4) provides a brief comparison of MWIR, LWIR and visual band sensors for different conditions. It should be noted that for certain conditions (e.g. fog) the performance of each sensor type can vary significantly.
Atmospheric Obscurant
Visible Band MWIR LWIR
Gases Very Low Low/Med Very Low/Med Haze Low/Med Very Low/Med Very Low/Low Fog Very Low Low/High Low/High Rain Low/Med Low/Med Low/Med Snow Med/High Med/High Med/High Dust Low/High Low/High Med/High
Table 2:4 - Indicative atmospheric transmissions for different visibility conditions

34
3. Use of i-LIDS for Video Analysis
3.1 Overview of the i-LIDS Database
Image Library for Intelligent Detection Systems (i-LIDS) is a controlled set of image data that is created, managed and controlled by the Home Office Scientific Development Branch (HOSDB) in partnership with the Centre for the Protection of National Infrastructure (CPNI). Its purpose is to provide the Government with a benchmark set of relevant test data against which it can assess VA systems. In an effort to ensure that all VA system providers are aware of the CPNI and HOSDB requirements, a sub-set of the i-LIDS database is made publicly available for companies to develop and assess their own products before offering them for assessment. Data sets are available from HOSDB via their website [12]. The i-LIDS database was released in 2005 and now contains five visible band scenarios:
• Event Detection o Sterile zone monitoring o Parked vehicle detection o Abandoned baggage detection o Doorway surveillance
• Object Tracking o Multiple camera tracking
Figure 3:1 - Example i-LIDS database screenshot
Once a VA system has been assessed by the HOSDB, if its purpose is event detection (real-time alerting or post-event analysis) then it will be awarded one of the following 5 categories of classification:
• Operational alert (primary) - recommended as a primary detection system in the operational alert role for parked vehicle detection applications
• Operational alert (secondary) - recommended as a secondary detection system in the operational alert role for parked vehicle detection applications
• Approaching practical recommendation – system demonstrates performance within a modest range of that required for classification as a secondary detection system for parked vehicle detection applications
• Event based recording – system recommended for use in the event based recording role for parked vehicle detection applications.
• No classification

35
Those systems which achieve the top category of classification, Operational Alert (Primary), will be given permission to use the i-LIDS logo in their marketing, and those which achieve either of the top two categories (Primary or Secondary) will be listed in the CPNI’s Catalogue of Security Equipment. It is understood that future trials are planned using TI cameras and that the gathered imagery will be added to the i-LIDS database. Further details about all aspects of i-LIDS, from detailed scenario descriptions to application forms and the list of forthcoming assessments can be found on the HOSDB’s web site [12]. 3.2 Cameras Used
All of the current i-LIDS data sets were recorded using visible band CCTV cameras, many of which provided monochrome or colour outputs. Specific details about the cameras used are not provided with the i-LIDS data sets. The specification of the cameras is less important than the image quality provided by the entire CCTV system. 3.3 Relevant Scenarios
Although none of the i-LIDS data sets currently contain footage taken with a TI, the scenarios themselves all remain pertinent to the HOSDB and CPNI, and should therefore be given consideration when assessments of TI cameras are being planned. Each of the existing scenarios is now summarised and its relevance to TI camera assessment is discussed. Event Detection:
• Sterile Zone: A VA system should alert to people in a sterile zone between two fences in the outdoors. The visible band imagery shows bland regions between fences taken from cameras at different heights and look down angles. A TI camera should facilitate the detection of people in this scenario because of their temperature difference from the background, whether during the day or at night, and should offer 24/7 operation.
• Parked Vehicle: A VA system should alert to any suspiciously parked vehicles in the urban
outdoor settings recorded. The visible band imagery shows different roads viewed from cameras at a range of different angles and heights. A TI camera should facilitate the detection of a vehicle either arriving or departing because of the heat of its engine compared to the background, but not necessarily aid the alerting of a vehicle that has been parked for some time.
• Abandoned Baggage: A VA system should alert on any unattended bags on the platform or
passageway of an underground station. The visible band imagery shows the inside of a tube station from several locations using different viewpoints and depths of field. A TI camera may offer limited benefit in this scenario over a visible-band image because the object is not expected to be at a significantly different temperature from its background.
• Doorway Surveillance: A VA system should alert on people entering and exiting a
monitored doorway. The visible band imagery shows outdoor footage from different single fixed cameras viewing different doors from a different angle and distance. A TI camera should assist the detection of people entering or exiting the doorway due to their temperature difference from the background, although it cannot be expected to help with identification or recognition in the way that a visible-band CCTV camera would.

36
Object Tracking:
• Multiple Camera Tracking: A VA system should alert on people walking through an area covered by 5 CCTV cameras which do not have overlapping fields of view. TI cameras should assist the detection of the people moving within the image if they have a sufficient temperature difference from their background surroundings, as would typically be expected to be the case. However, they would not be expected to assist the recognition or identification of the person.
3.4 Summary
In conclusion, the i-LIDS database is a valuable asset to both the VA community and government. Although limited at present to 5 scenarios, this will grow over time. All current scenarios remain highly relevant and of great importance to security and surveillance in the UK today. These data sets provide a trusted and ground-truthed benchmark against which systems can be developed as well as fairly and openly evaluated and compared. Finally, future scenarios will be developed and recorded specifically to assist with the assessment and the use of TI technology by the Government and the CNI.

37
4. Specifications
4.1 Overview
The specification of a TI camera system must be carefully defined in terms of a number of factors, including:
• General aspects covering the operational needs (the purpose of the system and how it will be used)
• Physical requirements (including size, power, mechanical interfaces and cabling) • Environmental issues (temperature, water and dust protection) • Deployment (number of required cameras and ease of re-configuration) • Performance (including image quality and false-alarm rates) • The user interface • In-service operation (including safety and reliability) • Future usage (flexibility and architectures) • System selection criteria
The following sections provide guidelines and suggestions for the development of appropriate specifications. 4.2 General Specification
The first step in the design of a TI system is to define the problem. This is known as the Level 1 operational requirement. Having completed this step, the general requirements for the TI system should be defined. This is the Level 2 operational requirement. Within the general specification, the concept of operation or usage should be established together with the expectation that the TI camera system will provide effective and efficient levels of performance and usability. It is also useful to establish whether the TI system has previously been used for similar applications. General specification issues which should be considered include:
• Is the TI camera to be used in real-time or for post-event analysis? • Is the TI camera to be static or mobile? • What are the typical operational scenarios? • What targets are to be detected?
The approach to procurement should also be addressed, together with any process requirements and specific project milestones such as:
• The use of the i-LIDS assessed VA system with the TI sensor • The need for an early prototype system for evaluation purposes • Operational and performance demonstrations or trials • Design Reviews for procurement programmes involving development • Licensing constraints associated with hardware and software • Site installation and acceptance
Additionally, information should be sought on more general issues relating to scope of supply such as:
• The type and quality of documentation provided • Warranty coverage

38
• Spares requirements and availability • Repair policy
The documentation set should include, as a minimum, a user manual and details on maintenance requirements. In terms of specifying the need for a TI camera capability, there is often a temptation to specify aspects of a particular design such as whether the camera is cooled or what the minimum NETD is. However, such an approach is not recommended. Rather, it is recommended that the requirements are specified in terms of operational requirements such as the detection of a person at a minimum range. 4.3 Physical Requirements
The TI camera system will consist of a number of items which could include the following:
• The TI camera (or cameras) • The camera mount, PTZ units and mount control • Other associated sensors including visible band (CCTV) if required • Cables and power supplies • Processing unit (if not integrated in the TI camera) • Display and control station and equipment
The specific inventory of items should be defined. In all cases, the mechanical interface for the TI camera and other hardware components must be specified. Additionally, if interchangeable lenses are required, the required lenses interface should also be defined. The physical configuration of these items will depend on the operational deployment of the system as well as the selected TI camera system. However, it should be noted that:
• The physical extent of the equipment should not limit the intended use of the TI camera system in the operational environment.
• Adequate space should be allowed for installation, maintenance, and access to the equipment and connections.
• For exposed TI camera positions, allowances should be made for the effect of increased weight due to water, snow and ice on the camera mount (including any PTZ mechanical loadings).
Where a TI camera is in an exposed environment, consideration should be given to maintaining a clear view for the optics. Potential solutions include:
• A rain shield or cowling • Hardened lens coatings • Hydrophobic coatings • Wipers and washer units
For applications where the TI camera is used as a handheld device, consideration must be given to a number of other practical considerations including:
• TI camera weight (for both viewing and carrying) • Battery-life and spare batteries • TI camera straps/handles and protective cover • Control button size and layout

39
• Time between switch-on and camera readiness If the hand-held camera is required to record data, consideration should be given to in-camera data storage and downloading. If it is necessary to download data during an operation, consideration should be given to what additional equipment will be required and the ease of downloading the data. For TI cameras mounted on a post or vehicle, the physical envelope of the TI camera should not limit or constrain the FOV of the camera. It should also be noted that any movement of the TI camera could introduce image blur. Consequently, reference should be made to the presence of such motion within the specification. For TI cameras that are mounted on a PTZ, the physical envelope should not limit or constrain the arc of movement. Additionally, the cables and connections should not impact the operation of the TI camera in terms of movement or obstruction. Electrical power will be required to operate the TI system and, consequently, consideration will need to be given to using the most appropriate power supplies and transformers. The provision of power should comply with the latest UK safety regulations as well as any specific site requirements. For the case where hand-held TI cameras are used, there is a danger associated with tripping if the camera is being used while the user is moving. In addition to power supplies, cables will be required to relay imagery and provide control signals. The anticipated cable length run should be specified as this could impact the quality of the imagery through signal degradation. The connectors used must be appropriate for the operational environment. Additionally, their design should be simple and allow the rapid removal and fitting of hardware during installation and maintenance. The connectors must be able to operate during TI camera motion and ensure that ingress protection is maintained. They should also provide adequate corrosion resistance and have a life-time commensurate with that of the TI camera system. 4.4 Environmental Criteria
The operational environment of the TI camera system must be addressed within the requirements. Factors that should be considered include:
• Indoor or outdoor operation • Levels of humidity • Atmospheric particulates including dust • Weather conditions including rain, snow and ice • Movement of the camera including wind-induced flexure • Vibration effects at the TI camera • Temperature • Electromagnetic interference.
These factors apply to all equipment associated with the TI camera system and they may vary depending on the location. The environmental issues will impact the performance and operation of the TI camera system in a number of ways. Firstly, the performance may be reduced in terms of image quality and range of operation. This could include:
• The build up of dirt or a film on the TI camera lens

40
• Image blurring due to camera motion or vibration • The presence of high temperature objects within the FOV
For some outdoor systems, particularly those in exposed or remote locations, a lens cleaner and wiper may be required. If a control room is used to view the imagery from the TI camera, advice given in the HOSDB Control Room Ergonomics [13] should be followed. The TI camera system should provide appropriate water and dust ingress protection. A generally used standard is the IEC 60529 which covers the ingress protection (IP) rating of an enclosure and consists of two (or sometimes three) numbers:
• Protection from solid objects or materials: ranges from 0 (no protection) to 6 (total protection)
• Protection from liquids (water): ranges from 0 (no protection) to 8 (total protection) • Protection against mechanical impacts: ranges from 0 to 6
The third number is often omitted. For example, if a device has an IP rating of 54, the ‘5’ describes a high level of protection from solid objects and the ‘4’ describes a medium level of protection from liquids. The last digit is commonly omitted. These ratings primarily used when defining the build standard of units that will be used outside in the open air. In most cases this leads to a requirement for an IP68 rated enclosure which is sealed against the environment. This upper limit is typical of systems used in a marine environment where any ingress of water into the system could render it inoperable. Defining the level of protection from mechanical impacts is of particular interest for systems used in harsh environments. In addition to designing the enclosure to prevent ingress of external debris and moisture, additional protection of electronic components inside the unit can be provided by the use of conformal coatings. Electromagnetic compatibility (EMC) of system is the degree to which it unintentional generates, propagates or receives electromagnetic energy (typically radio frequency) that gives rise to unwanted effects. The TI camera system should have EMC that is appropriate for the target environment, and must cover factors such as interference, degradations of the imagery the generation of interference that could affect other systems. Temperature and temperature variations will impact TI cameras both in terms of the optics and the electronics. Additionally, if a cooling engine is used, the cool down period will be impacted. The optics will be subjected to mechanical expansion and contraction which can affect the focus. Optical designs attempt to use different materials and arrangements in order to mitigate these effects (passive athermalisation). The electronics have an operational temperature range, outside of which their performance is not guaranteed. For COTS electronics, this temperature range is typically 0°C to 60°C. A storage or survival temperature is also sometimes specified which is wider than the operating temperature range. For COTS hardware, a typical storage range is 20°C to 85°C. 4.5 Installation and Coverage
The operational requirements should identify the area of coverage and the potential location of the camera(s) within this area. A trade-off will need to be performed to balance the required resolution and range performance with the number of cameras used. The latter will impact procurement, installation, maintenance, and disposal costs. In some instances, the location of the TI cameras may be limited and consequently give rise to coverage blind-spots.

41
The deployment scenario of the TI cameras will set the required detection and identification ranges. It is anticipated that the maximum required range will be less than 500m for most applications. As noted previously, if a high resolution is required at long range, this will limit the FOV of each TI camera. The TI cameras will typically be required to operate over a certain depth of field. The TI camera must be able to remain in focus over this range. It has been shown that IR is different to visual band imagery and insignificant objects in the visual band can dominate the IR picture. Such objects include:
• Hot or cold objects (temperature extremes) including plant machinery • IR reflective surfaces • Short-range surfaces or objects
Where very hot or cold objects are present, these can reduce the overall contrast and brightness within the image, even if the objects are small. Additionally, for PTZ-mounted TI cameras, such objects may only be present at certain locations of the arc. The IR picture will also vary depending on the time of day and weather conditions (in much the same way as a CCTV camera). Consequently, it is recommended that a thermal survey is undertaken prior to installation. Once the TI camera has been installed, its correct operation should be confirmed. It is also recommended that a calibration target is used to assess and confirm the performance of the TI camera at different ranges and under different viewing conditions. This calibration target could be an object of a known size and contrast temperature. Alternatively, a person could be used to confirm the system performance by standing, walking, or crawling at a known range from the camera. 4.6 Performance Requirements
The following sections provide guidelines on the specification of a TI camera in terms of its performance. 4.6.1 Image Quality
The output of the TI camera system will generally be presented to an operator via a display. It is important that the format and quality of the picture is of a good standard. Failure in this area can result in reduced effectiveness and efficiency by the operator. The system should aim to provide a display that is optimised in both brightness and contrast. However, it is also important that these parameters can be controlled independently. This will increase the viewing comfort of the operator and provide a means of optimising the picture in the presence of background lighting in the control room. IR imagery is greyscale rather than colour. However, pseudo-colours can be used to help interpret the scene. Consideration should be given to whether pseudo-colour is included. It may be appropriate to change between greyscale and pseudo-colour imagery to accommodate the preferences of different operators. There are a number of general image quality attributes that should be considered in the specification of a TI camera system. These include the following items and issues:
• The imagery should be free from temporal degradations (flicker). • The picture should be stable in terms of position, scale, and orientation.

42
• The TI camera processing should not introduce artefacts or degradations in the output imagery.
• Defects associated with the sensor such as non-responsive (or dead) pixels should be removed through processing.
• It may be appropriate to remove distortions in the imagery (due to the optical lens) through processing.
• Errors such as drift in brightness and contrast settings and non-uniformity errors should be minimised.
In addition to these basic image quality requirements, consideration should be given to enhancements that could improve the image quality. These processes include noise reduction and edge enhancement. 4.6.2 Sensitivity, Resolution, and Angular Coverage
Sensitivity, resolution and angular coverage are key parameters provided by suppliers of TI camera systems, and it is important to understand their impact on the use of thermal imagery for detection and recognition when deriving a detailed system specification. The sensitivity of a TI camera is critical as it determines the range at which targets can be detected. The sensitivity is often specified in terms of the Noise Equivalent Temperature Difference and should be measured for the overall TI camera system and not just the sensor itself. The angular resolution defines the ability of the system to distinguish features at different ranges. This resolution can be specified in terms of angle or distance. For the latter, DRI criteria could be used for a given object at specific ranges. The overall FOV is an important system parameter which should be specified in both azimuth and elevation directions. Combining high resolutions with wide fields of view will require larger sensor sizes and result in higher cost systems. For more complex and higher performance systems, there are many other performance parameters that could be specified. One of these is the minimum resolvable temperature difference (MRTD) which is a sensitivity measure that includes NETD, SNR and the system MTF. 4.6.3 Detection and Tracking and Other Functions
The TI camera system will be operated at one or more levels of autonomy:
• A simple imaging device • An assisted processing system • An autonomous system
For the latter two, processing can be added to the system which provides a capability beyond image enhancement. Two such functions are detection and tracking. Automated detection is applied to each frame of the image sequence and automatically detects objects that display specific characteristics. In an assisted processing scheme, these detections could be used to alert an operator to an event. For an autonomous scheme, the detections could be used to initiate another event such as a PTZ drive. Automated detection can be specified in terms of the range at which a given target is automatically detected for a given level of false alarms. Alternatively, the detections can be specified in terms of probabilities (e.g. ranges at which greater than a 95% probability of detection can be achieved for a given target). Detection processing is applied on a frame-by-frame basis. Tracking processing links these detections up over multiple frames to provide information on speed and direction. Tracking

43
performance is typically assessed in terms of track accuracy, consistency, and timeliness. Track accuracy is a vital performance measure which analyses how well an object of interest can be localised, or how accurately its motion can be characterised. Track consistency relates to how robust the tracking process is in terms of being able to provide consistent tracks of the same object; this is particularly important in the multiple-target case where the data-association problem can be challenging. Finally, track timeliness relates to the how rapidly the tracking process can acquire a reliable track on an object and also any temporal bias in the state estimate. Further information and guidance should be sought from i-LIDS [12]. It should be noted that an i-LIDS detection and tracking standard for thermal imagery over 500m of land and water is in development. 4.6.4 False Alarms
False alarms are generally measured in terms of the FAR. This is usually specified over a time period such as one hour, one shift, or one day. If the FAR is too high, the user confidence in the system will be quickly eroded. In practical systems, false alarms are primarily generated through the background clutter rather than the system noise. Given the variability and vagaries of real-world scenarios, it is difficult to specify the clutter and some TI camera suppliers quote FAR in terms of noise only. Such FAR performance measures can, however, be very misleading in terms of the true system FAR. The ability to limit the FAR is determined through the TI camera system processing. Consequently, one route for assessing FAR performance of the system is to use pre-recorded data, such as that in the i-LIDS database to assess the processing. For static mounted TI cameras, false alarms can be generated by known background features such as trees and bushes. In some systems, the user can de-select specific regions or objects. 4.7 User Interface
The user interface can take a number of forms including:
• An eye-piece • A small portable screen • A control room monitor • A personal computer (PC) workstation
In all cases, the controls and setting used must be appropriate for operating environment. It should be noted that the button size and layout should be appropriate for the user. For example, if the user may wear gloves when using the TI camera, this should be reflected in terms of the mechanical interface. For the case of a control room monitor or PC workstation, the interface will be both physical (keyboard, mouse, rollerball etc.) and a graphical user interface (GUI). The GUI corresponds to control buttons and sliders which appear on the display screen and can be adjusted via the keyboard or mouse. Alternatively, touch-panel displays may be used as an alternative to the more conventional means of controlling the system. The GUI should support the operator in the process of extracting the relevant information from the system without unduly increasing the workload. Typical control functions that should be considered for inclusion are:
• Brightness

44
• Contrast • Greyscale / pseudo-colour selection • Image inversion (white and black hot) • Edge sharpening adjustment • Noise reduction adjustment • Data recording • Image frame freeze • Image area selection and enlargement (digital zoom) • Video replay • Meta-data (including time and location) • Detection alerts (e.g. symbology or pop-up frames) • Audio alarms
The above functions apply to the real-time display and monitoring of the TI camera. However, it may be required to review the recorded imagery through post-event analysis (PEA). Functions with the PEA processing tend to be more complex and require an interface to a data storage medium. If visual band imagery is available in conjunction with IR data, then linking the frames through the database would support identification and provide evidence for subsequent prosecution. 4.8 Logistics
Integrated logistic support (ILS) covers the issues associated with in-service operation including:
• Quality • Equipment availability, reliability and maintainability (ARM) • Mean time between failures (MTBF) • Mean time to repair (MTTR) • Failure reporting and management • Test equipment • Spares and spares policy • Whole life cost (WLC) • Technical documentation
ILS disciplines are particularly important for more complex systems (including system using multiple COTS items). Consideration should be given to the required level of ILS and the associated quality controls used. Cost is likely to be an important factor in the selection of TI cameras. However, consideration should be given to the WLC rather than just the initial acquisition. These additional costs include upgrades, maintenance, repair, replacement, and disposal. For the latter, TI camera optics may contain hazardous materials that will require specialist disposal. Some suppliers may support camera disposal. In addition to the general ILS requirements, other factors should be considered:
• Equipment guarantees • Limitations on equipment usage (including temperature, humidity, and the physical
environment) • Activation constraints (i.e. limitations on the switching the TI camera on and off as well as
the use of standby modes) • Service and maintenance requirements • Minimum and maximum periods of usage • Repairs location and repair-time • Replacement policy

45
Finally, for TI cameras that use cooled detector technology, the impact of maintenance and cool-down time should be considered. Typically this cool-down period can take between 5 and 15 minutes. Furthermore, as the cooling engine is used, wear and tear results in an increase in the cool down period. 4.9 Growth Requirements and System Architecture
It is likely that any equipment purchased or developed for one specific task will eventually be used for different applications. The reasons for this are varied but include:
• Increased familiarity of users with new technology • New emergent threats or situations • Evaluation of technology for different applications
Therefore, consideration should be given to maximising the potential future use of the TI camera system. Examples of issues to consider include:
• Specification of standard interfaces • The use of common mechanical interface formats (including lenses) • The ability to interact with other systems through open architectures • Upgrade options of processor components and cards
4.10 Data Formats and Interfaces
Data may be output from the camera in either digital or analogue format. Some common data formats include: Analogue:
• PAL (CCIR) • NTSC (RS-170)
Digital:
• Firewire • GigE • CameraLink • LVDS
When specifying a camera output format, it is important to consider the following:
• Cost: analogue tends to be cheaper • Location: if analogue, PAL for Europe, NTSC for US • Image quality: digital protocols are generally better • Capture and display: Firewire and GigE are easier to capture on a PC, analogue is easier
to display on a monitor • Bandwidth: CameraLink or LVDS may be required for high resolution, high frame rate
cameras • Legacy equipment: does the camera need to interface with existing equipment?
4.11 Programme Issues
The previous sections have dealt primarily with the design and performance aspects of a TI camera. There are, however, additional issues that should be considered as part of the overall programme structure. A detailed discussion of such programme matters, such as planning and finance, is beyond the scope of this document. However, it is recommended that the following points are considered within the programme framework:

46
• An initial acquisition phase to provide a practical assessment. • The use of a prescribed field trial to confirm performance against realistic targets and
backgrounds. • Early user group assessment in order to influence the design and attributes of the electrical,
mechanical, and computer interface. • Training to familiarise the users with TI camera technology and IR image characteristics. • The inclusion of design reviews where design and development is required.
47
5. COTS Technology Review
5.1 General Review of the Market
There are now many suppliers of TI cameras that can be considered as COTS items. These suppliers include organisations within the UK and Europe as well as worldwide. Traditionally, many TI cameras were supplied from the US. However, because of trade restrictions, the camera specifications available to UK customers were of a lower performance quality. Over recent years, many non-US organisations have started to supply their own TI cameras and this is particularly so for the uncooled systems. Additionally, much of the performance achieved with TI cameras is derived not for the camera itself, but rather the processing that is applied to the data. In this area, the UK has a strong capability. In the following sections, information is provided on a range of TI cameras which are commercially available. This is obviously a transitory list and more suppliers may emerge over the next few years. In terms of costs, specific values will be given where possible. However, some camera suppliers can be reluctant to provide costs and, in these cases, an estimate is provided using the following bands:
• Very Low: Less than £5,000 • Low: Between £5,000 and £15,000 • Medium: Between £15,000 and £30,000 • High: Between £30,000 and £50,000 • Very High: Greater than £50,000
5.2 TI Cameras and Suppliers
5.2.1 General Remarks
Over recent years, there has been a significant growth in the number of TI camera suppliers and the range of camera designs. However, many of these suppliers only provide a repackaging of a third party’s components. These components are generally in the form of camera cores which comprise sensors, optics, and electronics. Appendices B and C provide some examples of cooled thermal imaging cores and cameras. This material has been included for information purposes and it includes some of the specification parameters presented earlier. 5.3 Lenses and Controls
Glass is not transparent in the thermal wavebands (MWIR and LWIR) and so alternative materials must be used. Unfortunately, the lens only materials that have the right transmission properties and the right physical properties (hardness and machinability), tend to be expensive exotic materials such germanium and sapphire. Germanium costs around £1000 per kilogram and so the resulting lenses can be very expensive. Most thermal sensors have fixed lenses (non-zooming). This is because zoom lenses require more optical components and hence are more expensive. Some thermal cameras offer a less expensive solution, which is to switch-in additional optics in front of the sensor to give wide and narrow fields of view. There are some continuous zoom systems, but because of their cost they are aimed at high-end long range surveillance application over many kilometres. The IR lens material is subject to expansion and contraction with temperature. Such changes impact the quality of the focus unless corrected. Although some of the more expensive modern IR

48
lenses rely on a combination of depth of field and passive athermalisation to maintain focus, lower cost lenses generally offer manual, remote or automatic focusing. The latter is the most expensive option, but is useful functionality for a remote system.
The F-number of a lens determines its light gathering, with low F-numbers corresponding to good light gathering capability. Because cooled cameras are more sensitive, they can produce imagery with lenses up to an F-number of 4 or even higher. Conversely, the lower sensitivity of uncooled cameras means that an F-number of 2 or lower is required. Lower F-number lenses tend to be more expensive because of the larger apertures required (i.e. more material is needed). In some cases, lenses for uncooled cameras can cost more than their cooled camera equivalents. In fact, for very long lenses (e.g. for long range surveillance) the cost can differ so much, that it can be cheaper to buy a more expensive cooled camera with an high F-number lens than a cheaper uncooled camera with and low F-number lens. The choice of lens must take into account the anticipated target size and distance. Finally, it is noted that most TI cameras are supplied with a lens which is specified at the procurement stage. However, in a number of cases, the lenses cannot subsequently be interchanged by the user. 5.4 Camera Mounts and Mechanisms
The TI camera will need to be physically mounted to an interface plate as part of the installation activity (excluding hand-held devices). The mechanical interface should be specified. It may also be useful to define a datum surface or set of markers which indicate the optical axis of the camera. The mechanical interface should be located such that access to the camera and the camera connectors is not limited. 5.5 Interfaces and Standards
Many thermal cameras (typically handheld devices) include a built in display or eye-piece that allows the imagery to be viewed. For larger or remote systems, the video is usually output over a composite video port although a range of digital interfaces are becoming more common. Table 5:1 summarises some of these standards.

49
Interface Type Bandwidth Range Comments
Composite (PAL/NTSC) Analogue 370 MHz 100m+
Common. Possible interference issues. Signal drop can occur over long cable lengths.
Firewire Digital 400 Mbps 5m +repeater
Widespread. Easy to interface to a PC. Limited cable length. Range can be extended by transmitting signal over optical fibre.
GigE Digital 1000 Mbps 100m Low cost interface. Uses standard Ethernet cables and switches.
LVDS Digital Variable up to 2Gbps
10m @ 360Mbps
Simple interface over twisted copper wires. Limited cable length.
CameraLink Digital 2.04 Mbps 6.12 Gbps 7m
High bandwidth. Widely used in scientific & machine vision applications. Limited cable length
USB2 Digital Up to 480Mbps 5m
Easy PC interface but uses a larger percentage of the CPU. Limited cable length.
WiFi (IEEE 802.11) Digital 54 Mbps
30m (indoors)
90m (outdoors)
Current requires a separate plug-in networking module. May require data compression (e.g. MPEG) and encryption prior to transmission. See [15].
Table 5:1 - Commonly used interface formats 5.6 Electronics
The growth in the personal computer market over the last decade has resulted in a large number of high performance processors being available on the market at low cost. These COTS items also include the more recent addition of graphical processing units (GPUs) which provide a greatly increased processing speed for specific software functions. The alternative to a PC-based processor is a field programmable gate array (FPGA). FPGAs offer lower power and lower cost hardware solutions. However, the implementation time for complex software can be significant. For TI cameras, the processing generally takes two forms. The first is the detector (or proximity electronics) which are in the camera. The second is the image processing which can either be in the camera, in a separate processing housing, or distributed between them. For the more advanced TI camera systems, a separate processing unit provides greater flexibility in terms of performance and design upgrades. 5.7 Processing Solutions
Most TI camera systems provide some level of signal and image processing functionality. It is also possible to buy processing software off-the-shelf. However, many of these software packages are aimed at non-real-time applications which may be appropriate for post event analysis but not for real-time monitoring and control.

50
For real-time processing, design work is generally required in order to provide a suitable, multi-threaded, software solution. This software design can embody off-the-shelf software, subject to licensing terms and conditions. Finally, it should be noted that the US limits software technology and, consequently, many of the US supplied TI cameras are only provided with a limited processing capability. 5.8 Displays and User Interface Equipment
Some hand-held thermal imagers have in-built displays which can either be small and designed to be viewed through an eye-piece (such as the L3 X200xp) or are larger and can be viewed form arms length (such as the FLIR B400). These in-built displays offer great convenience for man-portable systems but the image quality can often be lower than displaying the same imagery on a high quality external display. External displays come into two types, traditional cathode ray tubes (CRTs) and flat panels (most of which are liquid crystal display, LCD, devices). Generally CRTs will provide a superior image especially where movement is concerned, but the trade-off is their bulk, weight and heat generation when compared with flat panels. Flat panels tend to suffer from an effect known as motion blur, which can make detail on a moving object difficult to resolve (for example the registration plate of a moving vehicle). They have nevertheless become the first choice for most surveillance systems, in the same way that they have taken over the consumer television market. A summary of these devices is given in Table 5:2.
Type Pros Cons
Eye-piece
• Small • Cheap • Portable • Rugged
• Single user only • Must be held in front of the face
In-built LCD
• Portable • Frequently used for thermography
• Prone to scratching • Low visibility under bright light • Power drain on batteries
External CRT
• Best attainable picture quality • Much equipment was designed
for reproduction on a CRT • Low cost
• High power consumption • High heat generation • High space requirements • Manufacture largely discontinued • Weight (infrastructure)
External LCD
• Compact and light • Low power consumption • Wide range of screen sizes
available • High resolution • Low black level, but not as low as
CRT • Low cost • Weight
• Poor movement reproduction • Restricted viewing angle • Lower image contrast
Table 5:2 - Summary of display technologies
51
6. Installation, Operation, and Maintenance
6.1 General Comments
In the specification of a TI camera, the emphasis is often placed on the design and performance of the camera. In practice, however, the performance achieved is often constrained by practical issues such as installation, operation, and maintenance. In this section, some additional notes and comments are provided which support the guidance material provided in Section 4. 6.2 Installation Issues
The correct placement of the TI camera system is important and it must be carefully considered if the full benefits are to be realised. The location of the TI camera should be chosen to provide the best line-of-sight view to the area of interest. If the TI camera is mounted on a rotating mount or PTZ, no obstruction should be evident across the arc. In practice, however, the available location points will be limited. Consequently, a site-survey using a thermal imager should be undertaken to identify the best location. The mounting height of the camera should also be carefully considered as this will affect the performance of the system both in terms of range and viewing angle. Any motion of the camera could impact the quality of the image generated. These motion effects include flexure due to wind as well as vibration and shock transmitted through the mount. The installation should aim to reduce the level of movement that the camera would be subjected to. Additionally, consideration should be given to the level of weather exposure, particularly in terms of the front lens. The cable runs associated with the mounting location should be considered for power, control, and image data. For some cameras, the data integrity can be compromised if the cable run exceeds a few tens of metres. The location of the TI camera should also provide easy access for maintenance and cleaning operations. The TI camera should not be mounted in close proximity to thermal sources as these could degrade the image quality. A full thermal survey should be undertaken for the mounting location. Finally, the location position should be such that the EMC environment falls within the required tolerances of both the camera and the cables. 6.3 Testing and Calibration
It is important to confirm the correct operation of the TI camera both as part of the installation activity and periodically during the lifetime of the camera. The latter should be used to confirm the performance of the TI camera in terms of characteristics such as:
• Image sharpness (focus) • Transmission (image brightness) • Image defects (such as dirt on the front lens) • Detection sensitivity
To support these tests, calibration targets can be used which range from bespoke equipment through to the use of known objects (such as people) at given ranges from the camera.

52
6.4 Maintenance Issues
All TI cameras require some level of maintenance which should be defined by the camera suppliers. Such maintenance tasks include actions such as lens cleaning through to the replacement of components. Care should be taken to ensure that the maintenance schedule does not impact the operational effectiveness of the TI camera system. It may be necessary, as part of the maintenance programme, to remove cameras for parts replacement (including cooling fluids and cooling engines). In such a situation, a spare camera would be needed from either the supplier or from stores.

53
7. Summary TI cameras provide significant benefits for security and surveillance operations. The technology has been proven over many years within defence systems and is becoming more widely used within the broader security and surveillance market. This trend has been driven not only by the benefits of IR imagery but also by the greatly reduced procurement costs. TI cameras provide an operational capability that is complementary in nature to conventional CCTV systems. Specifically, TI cameras offer:
• Day and night operation • Effective operation during poor weather conditions • Detection of concealed or camouflaged targets
In many cases where TI cameras are introduced, it is anticipated that this will be in addition to existing CCTV cameras. Together, both camera types provide a high effective information set that can be readily interpreted by a user. Rather than providing two separate video streams, the visible and IR data can be combined into a single fused video. TI cameras operate on the basis of heat detection. This is in contrast with the human visual system and CCTV cameras which use reflected light to form an image. Consequently, IR imagery has a different appearance to the visual band which limits its use in terms of evidence (particularly for evidence purposes). Where TI cameras are introduced, the user should be provided with training that covers not only the use of the camera, but also the interpretation of the imagery. TI cameras are particularly beneficial in the detection of anomalous events in cluttered and complex environments. They can also be used to cue other sensors, including high resolution CCTV, for recognition. As noted above, TI cameras are more expensive that their CCTV counterparts. However, there is a growing number of uncooled TI cameras available which cost less than £15K and which offer a good level of performance. Given the cost differential with CCTV cameras, the introduction of TI cameras is likely to be limited and more focused on those applications where IR imaging offers significant operational benefits. As part of the procurement process, the whole life costs associated with TI cameras should be considered as these are likely to be greater than those associated with CCTV cameras. Also, the potential use of Service Management Contracts should be considered as an alternative to an outright purchase. Finally, an important aspect of TI camera systems is the processing that is applied to the image streams. This processing can add significant performance benefits for image enhancement as well as assisted processing. As such, image processing offers major operational benefits and allows lower cost cameras to be used.

54
8. Glossary of Terms & Abbreviations
8.1 Glossary
Aperture Diffraction The changes to an optical wavefront when it passes through the aperture of a camera. Diffraction limits the resolution of a camera.
Black Hot Image A thermal image in which hotter objects are displayed darker than cooler objects.
Cooled Camera A thermal camera that uses photon detection to detect IR radiation.
Detection The discovery of the presence of a target within the FOV.
Detection Time The time required to create a detection once a target has become unmasked (i.e. exceeds a pre-determined SNR).
Declaration Time The time required to confirm a targets presence detection once a target has become unmasked (i.e. exceeds a pre-determined SNR).
Infrared Spectrum The spectral range corresponding to electromagnetic radiation with a wavelength between 0.7μm (end of visible band) and 1mm (start of the millimetre and microwave wave band). The most common IR bands are the MWIR (3μm to 5μm) and LWIR (8μm to 14μm).
F-Number or F-Stop The ratio of the focal length of a lens to the diameter of the entrance aperture of a camera.
False Alarm or False Positive
A target is declared when not present.
False Alarm Rate The number of false alarms generated by the system within a given period of time.
False Negative A target is present but not declared.
Field of View The angular coverage of a lens.
Focal Plane Array An image sensing device consisting of an array of light-sensing pixels at the focal plane of a lens.
Identification An object is discerned with sufficient clarity to specify the type within a class (e.g. type of vehicle).
Infrared Image An image created using electromagnetic radiation whose wavelength lies in the 0.7μm to 1mm range. Thermal cameras typically operate over a subset of this range, in the Medium Wave Infrared or Long Wave Infrared bands.
Long Wave Infrared Electromagnetic radiation with a wavelength between 8μm and 14μm.
Medium Wave Infrared
Electromagnetic radiation with a wavelength between 3μm and 5μm.

55
Modulation Transfer Function
The variation of contrast at difference spatial frequencies within an imaging system, i.e. a measure of the ability of an imaging system to image objects of different sizes.
Near Infrared Electromagnetic radiation with a wavelength between 0.7μm and 1.4μm.
Noise Equivalent Temperature Difference
The temperature difference that gives a signal whose magnitude is the same level as the noise in a thermal imager.
Photon Detection The detection of IR radiation by using the energy of a thermal photon to excite electrons in the detector material. The electrons can then be collected and amplified.
Probability of Declaration
A measure of the accuracy of target declaration following detection, tracking, and classification processing.
Probability of Detection
A measure of the correct detection of a target.
Probability of False-Alarm
A measure of the ability of the system to distinguish between a true target and a false signal due to noise or clutter.
Probability of Identification
A measure of the ability of the system to correctly identify a target.
Probability of Recognition
A measure of the ability of the system to correctly recognise a target type.
Pseudo-Colour Image
A thermal image in which colour does not reflect spectral information but rather brightness.
Recognition An object is discerned with sufficient clarity that its specific class (e.g. vehicle, person) can be differentiated.
Short Wave Infrared
Electromagnetic radiation with a wavelength between 1.4μm and 3.0μm.
Signal-to-Clutter Ratio
A measure of the relative magnitude of the target signal and the system background.
Signal-to-Noise Ratio
A measure of the relative magnitude of the target signal and the system noise.
Specific Detectivity A figure of merit used to characterize the performance of a photodetector.
Target An object of interest.
Target Signature The observable features of a target.
Tracking The process of locating a moving target in time.
Uncooled Camera A thermal camera that uses thermal detection to detect IR radiation.

56
Thermal Detection The detection of IR radiation by allowing incident radiation to be absorbed, resulting in a change of resistivity which can be measured by passing a current across the sensor.
Very Long Wave Infrared or Far Infrared
IR radiation with a wavelength > 15μm.
Visible Band Spectrum
The spectral range over which the human vision system is sensitive.
White Hot Image A thermal image in which hotter objects are displayed brighter than cooler objects.

57
8.2 Abbreviations
ACPO Association of Chief Police Officers ARM Availability, Reliability and Maintainability ASi Amorphous Silicon BST Barium Strontium Titanate CCTV Closed Circuit Television CMT(or MCT) Cadmium Mercury Telluride COTS Commercial of the Shelf CPNI Centre for the Protection of National Infrastructure CRT Cathode Ray Tube D* Specific Detectivity DRI Detection, Recognition and Identification EMC Electromagnetic Compatibility FA False Alarm FAR False Alarm Rate FIR Far Infrared FMV Full Motion Video FOR Field of Regard FOV Field of View FPA Focal Plane Array FPGA Field Programmable Gate Array GigE Gigabit Ethernet GPU Graphics Processor Unit GUI Graphical User Interface HOSDB Home Office Scientific Development Branch i-LIDS Image Library for Intelligent Detection Systems ILS Integrated logistic support InSb Indium Antimonide IP Ingress Protection IR Infrared ITAR International Traffic in Arms Regulations LCD Liquid Crystal Display LVDS Low Voltage Differential Signal LWIR Long Wave Infrared MRTD Minimum Resolvable Temperature Difference MTBF Mean Time Before Failure MTF Modulation Transfer Function MTTR Mean Time To Repair MWIR Medium Wave Infrared NETD Noise Equivalent Temperature Difference NIR Near Infrared NTSC National Television Standards Committee NUC Non-Uniformity Correction PAL Phase Alternate Line PC Personal Computer PEA Post-Event Analysis PTZ Pan Tilt Zoom SBNUC Scene Based Non-Uniformity Correction SCR Signal to Clutter Ratio SLR Single Lens Reflex SNR Signal to Noise Ratio SWIR Short Wave Infrared TI Thermal Imager UK United Kingdom US United States

58
USB Universal Serial Bus VA Video Analytics VAT Value Added Tax VLWIR Very Long Wave Infrared VOx Vanadium Oxide WiFi Wireless Fidelity WLC Whole Life Cost WS Waterfall Solutions Limited 3D Three Dimensional
59
9. References 1 http://scienceandresearch.homeoffice.gov.uk/hosdb/cctv-imaging-technology/CCTV-and-
imaging-publications.html
2 N Cohen, J Gattuso and K MacLennan-Brown. CCTV Operational Requirements Manual 2009. HOSDB Publication No. 28/09 v5.0, April 2009.
3 http://scienceandresearch.homeoffice.gov.uk/hosdb/publications/cctv-publications/09-05-UK-Police-Requireme22835.pdf?view=Binary
4 http://scienceandresearch.homeoffice.gov.uk/hosdb/publications/cctv-publications/07-08_-_Video_Evidence_Anal12835.pdf?view=Binary
5 Digital Imaging Procedure. HOSDB Publication No. 58/07 v2.1, November 2007.
6 http://scienceandresearch.homeoffice.gov.uk/hosdb/publications/cctv-publications/ACPO_Practice_advice_on_Pol12835.pdf?view=Binary
7 J. Aldridge and C. Gilbert, Performance Testing of CCTV Perimeter Surveillance Systems (Using the Rotakin Standard Test Target) Version 1.0. Police Scientific Development Branch 14/95, 1996.
8 http://www.nist.gov
9 http://www.nvl.army.mil
10 http://www.iso.org
11 A. Lock and F. Amon. Thermal Imaging Cameras Testing and Standards Development. National Institute of Standards and Technology Sigma-Xi Poster, 2008.
12 http://www.ilids.co.uk
13 E. Wallace and C. Diffley. CCTV: Making it Work (CCTV Control Room Ergonomics). Police Scientific Development Branch Publication No 14/98, 1998.
14 Single Integrated Air Picture (SIAP) System Engineering Task Force. SIAP Attributes Version 2.0. Technical Report 2003-029, August 2003.
15 IEEE 802.11-2007. IEEE Standard for Information technology-Telecommunications and information exchange between systems-Local and metropolitan area networks-Specific requirements - Part 11: Wireless LAN Medium Access Control (MAC) and Physical Layer (PHY) Specifications.
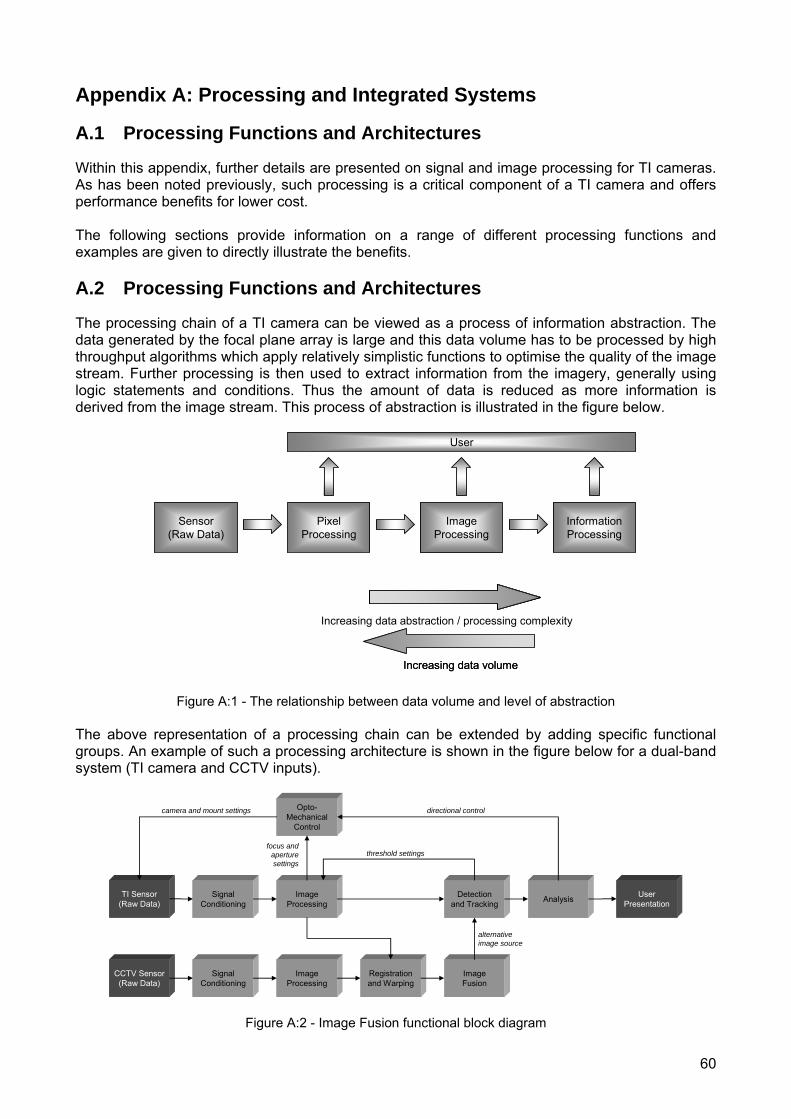
60
Appendix A: Processing and Integrated Systems
A.1 Processing Functions and Architectures
Within this appendix, further details are presented on signal and image processing for TI cameras. As has been noted previously, such processing is a critical component of a TI camera and offers performance benefits for lower cost. The following sections provide information on a range of different processing functions and examples are given to directly illustrate the benefits. A.2 Processing Functions and Architectures
The processing chain of a TI camera can be viewed as a process of information abstraction. The data generated by the focal plane array is large and this data volume has to be processed by high throughput algorithms which apply relatively simplistic functions to optimise the quality of the image stream. Further processing is then used to extract information from the imagery, generally using logic statements and conditions. Thus the amount of data is reduced as more information is derived from the image stream. This process of abstraction is illustrated in the figure below.
Sensor(Raw Data)
Pixel Processing
Information Processing
User
Image Processing
Increasing data abstraction / processing complexity
Increasing data volumeIncreasing data volume
Figure A:1 - The relationship between data volume and level of abstraction
The above representation of a processing chain can be extended by adding specific functional groups. An example of such a processing architecture is shown in the figure below for a dual-band system (TI camera and CCTV inputs).
Signal Conditioning
Image Processing
Signal Conditioning
Image Processing
Registration and Warping
Image Fusion
Detection and Tracking Analysis
Opto-Mechanical
Control
TI Sensor(Raw Data)
CCTV Sensor(Raw Data)
User Presentation
directional control
threshold settings
alternative image source
camera and mount settings
focus and aperture settings
Figure A:2 - Image Fusion functional block diagram
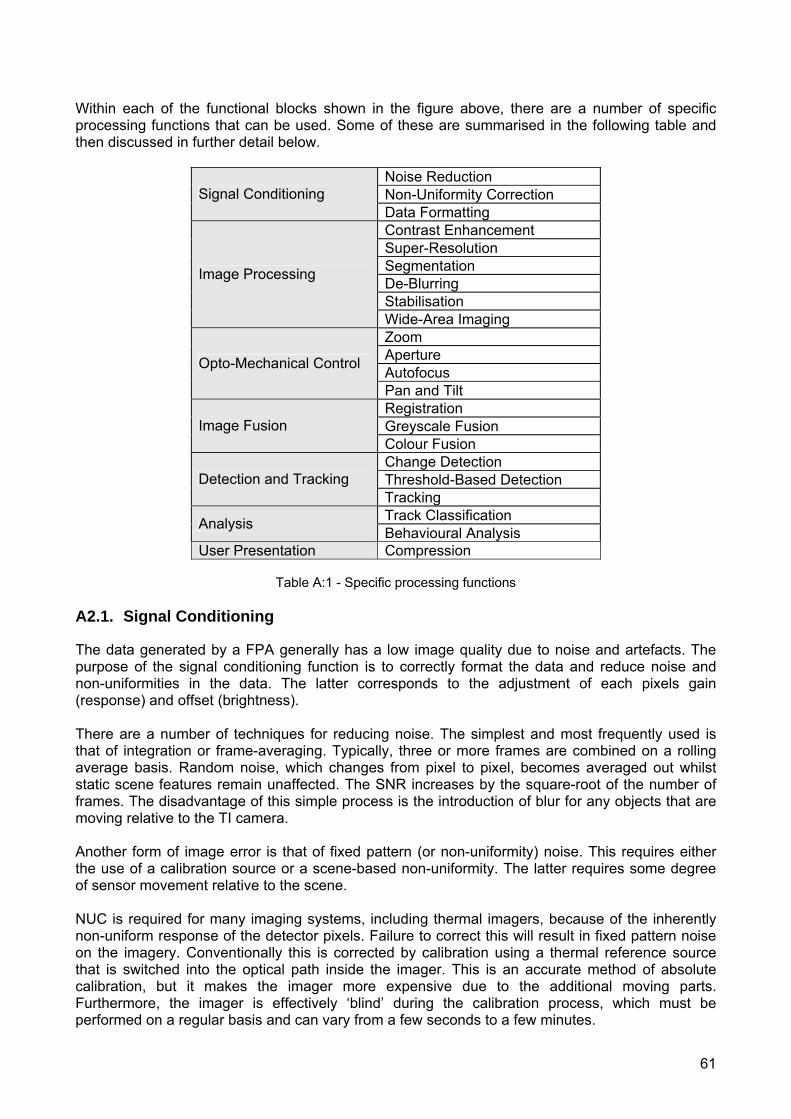
61
Within each of the functional blocks shown in the figure above, there are a number of specific processing functions that can be used. Some of these are summarised in the following table and then discussed in further detail below.
Noise Reduction Non-Uniformity Correction Signal Conditioning Data Formatting Contrast Enhancement Super-Resolution Segmentation De-Blurring Stabilisation
Image Processing
Wide-Area Imaging Zoom Aperture Autofocus Opto-Mechanical Control
Pan and Tilt Registration Greyscale Fusion Image Fusion Colour Fusion Change Detection Threshold-Based Detection Detection and Tracking Tracking Track Classification Analysis Behavioural Analysis
User Presentation Compression
Table A:1 - Specific processing functions
A2.1. Signal Conditioning
The data generated by a FPA generally has a low image quality due to noise and artefacts. The purpose of the signal conditioning function is to correctly format the data and reduce noise and non-uniformities in the data. The latter corresponds to the adjustment of each pixels gain (response) and offset (brightness). There are a number of techniques for reducing noise. The simplest and most frequently used is that of integration or frame-averaging. Typically, three or more frames are combined on a rolling average basis. Random noise, which changes from pixel to pixel, becomes averaged out whilst static scene features remain unaffected. The SNR increases by the square-root of the number of frames. The disadvantage of this simple process is the introduction of blur for any objects that are moving relative to the TI camera. Another form of image error is that of fixed pattern (or non-uniformity) noise. This requires either the use of a calibration source or a scene-based non-uniformity. The latter requires some degree of sensor movement relative to the scene. NUC is required for many imaging systems, including thermal imagers, because of the inherently non-uniform response of the detector pixels. Failure to correct this will result in fixed pattern noise on the imagery. Conventionally this is corrected by calibration using a thermal reference source that is switched into the optical path inside the imager. This is an accurate method of absolute calibration, but it makes the imager more expensive due to the additional moving parts. Furthermore, the imager is effectively ‘blind’ during the calibration process, which must be performed on a regular basis and can vary from a few seconds to a few minutes.

62
An alternative approach is that of SBNUC which dispenses with the need to perform intermediate detector calibrations. SBNUC is a means of making use of the statistics of the imaged scene in order to derive a relative calibration without the need for any external reference sources. It has the advantage of not requiring any moving parts and not having any periods of ‘blindness’ due to calibration, but has the potential drawback of requiring sufficiently diverse scene content with motion (a moving imager is best). Consequently, SBNUC requires the addition of intelligent scene monitoring to control the learning rate. SBNUC techniques can be used to either replace a conventional NUC process or as a complementary technique which operates between the NUC calibration points. In the latter case, the SBNUC allows the period between NUC points to either be increased or de-selected when priority data is being gathered. The following figure illustrates the use of SBNUC when the calibration of the camera had drifted, resulting in vertical gain and offset errors (the vertical lines in the image on the left). Although the amount of motion in the scene was limited, the SBNUC process was able to remove the errors quite effectively (image on the right).
Figure A:3 - Illustrating SBNUC (original image on the left; processed image on the right).
The final image defect considered here is that of dead pixels. In this case, the pixels do not respond to the incident light and typically either appears as black or white pixels. This defect is sometimes referred to as salt and pepper noise and the density of the dead pixels can vary across the imagery. Low densities of pixels can be removed using a number of spatial filters or simple logic elements. These generally aim to adjust the grey level value of the dead pixel to that of its neighbours. A variant to these are non-linear filtering techniques such as median filters. A.3 Image Processing
A3.1. Contrast Enhancement
Imagery is often not displayed at the optimal contrast and brightness settings for an operator even though the basic underlying information is available. There are many reasons for this, including inaccurate sensor calibration, sub-optimal greyscale mapping, and the presence of bright regions in the image. There are a number of techniques that can be used to restore the image quality, such as histogram equalisation. These techniques are generally applied in a uniform way to the complete image and generally provide less than satisfactory results. Another class of processing, which is more computationally intensive, involves processing the imagery on a localised basis.
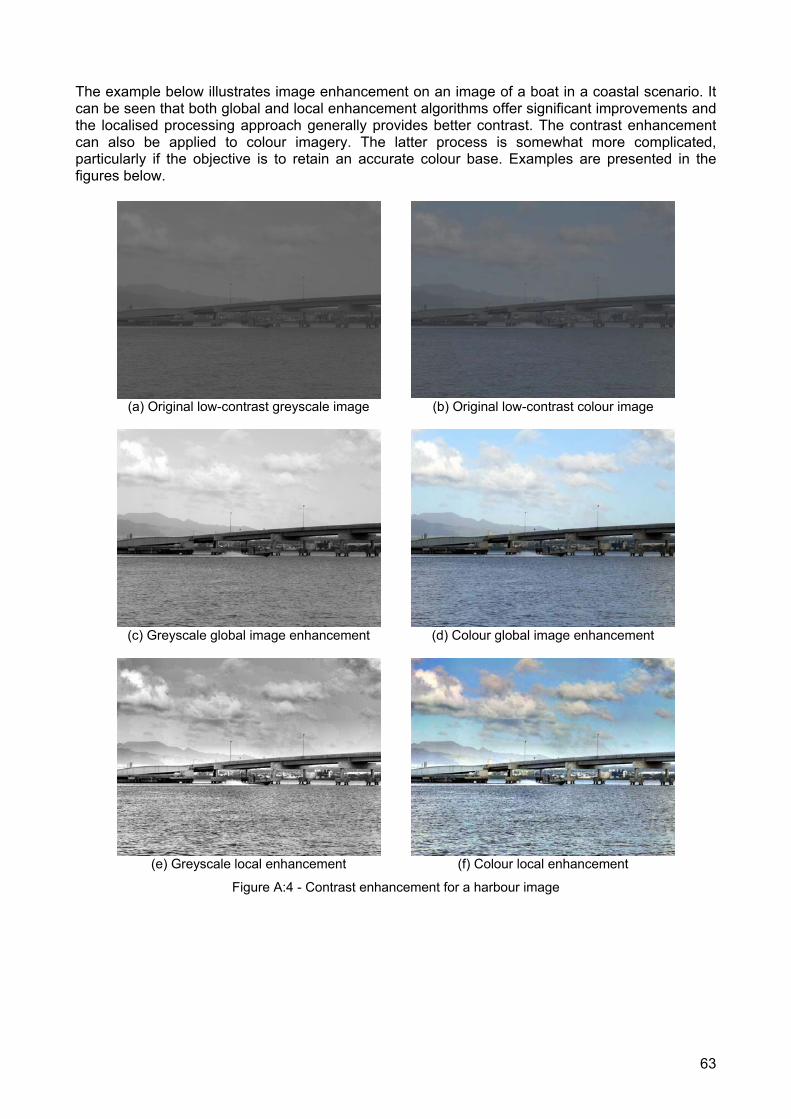
63
The example below illustrates image enhancement on an image of a boat in a coastal scenario. It can be seen that both global and local enhancement algorithms offer significant improvements and the localised processing approach generally provides better contrast. The contrast enhancement can also be applied to colour imagery. The latter process is somewhat more complicated, particularly if the objective is to retain an accurate colour base. Examples are presented in the figures below.
(a) Original low-contrast greyscale image
(b) Original low-contrast colour image
(c) Greyscale global image enhancement (d) Colour global image enhancement
(e) Greyscale local enhancement (f) Colour local enhancement
Figure A:4 - Contrast enhancement for a harbour image

64
Figure A:5 - The use of localised contrast enhancement during fog conditions A3.2. Super-Resolution
Focal plane arrays comprise a limited number of pixels which then limit the achievable spatial resolution. This is particular acute for IR FPA where the number of pixels is relatively low. One method of increasing the resolution is to employ super-resolution techniques which can give a limited improvement. In general, the techniques attempt to view the scene over multiple frames and where the sensor is slightly displaced between frames. This displacement can be achieved through a stepping mirror in the camera optics (micro-scan) or through relative movement of the camera and scene. An example of super-resolution is illustrated in the figure below.
Figure A:6 - Super-resolution provides greater detail within an image. Here, the image from a video stream (left) has been subjected to super-resolution processing (right). Note the enhanced detail on the wire fence.
A3.3. Segmentation
Image segmentation is a processing function that aims to separate an image into a number of discrete regions based upon their regional properties. An example of segmentation is shown in the figure overleaf. Segmentation is a useful process in that it enables other processing functions to be varied on a region by region basis.

65
(a) Example colour image (b) Segmented image where different colours
represent areas with similar properties. Figure A:7 - Image segmentation
Image segmentation can be used for a variety of different applications. In the figure below, an image video stream has been analysed to localise people and their shadows.
Figure A:8 - Segmentation of a frame from a video sequence. The original colour image is shown on the left and the segmented image is on the right. Note that those areas determined to be person-like have been
coloured as blue whilst shadows have been coloured red.
A3.4. De-Blurring
Imagery can become blurred for a number of reasons. Firstly, the camera may not be correctly focused. This is particularly relevant to short-range imaging systems. Secondly, the optics may produce a degraded image as a consequence of a poor design or through the accumulation of dirt or film on the lenses. Thirdly, if the camera moves relative to the scene, it can introduce motion blur. A camera forms an image by integrating incident light over a period of time. Any movement of the camera during this integration time will result in image blur. Finally, the overall scene may be well-focused but an object in the scene may be moving. Again, if this movement is large compared to the integration time, the object will become blurred. Imagery can be de-blurred using a variety of processing, the most successful techniques corresponding to the case where the characteristics of the blur function are known (e.g. relative speed and range). However, it should be noted that for blurred imagery that is also noisy, the ability to recovery a sharpened image is limited.
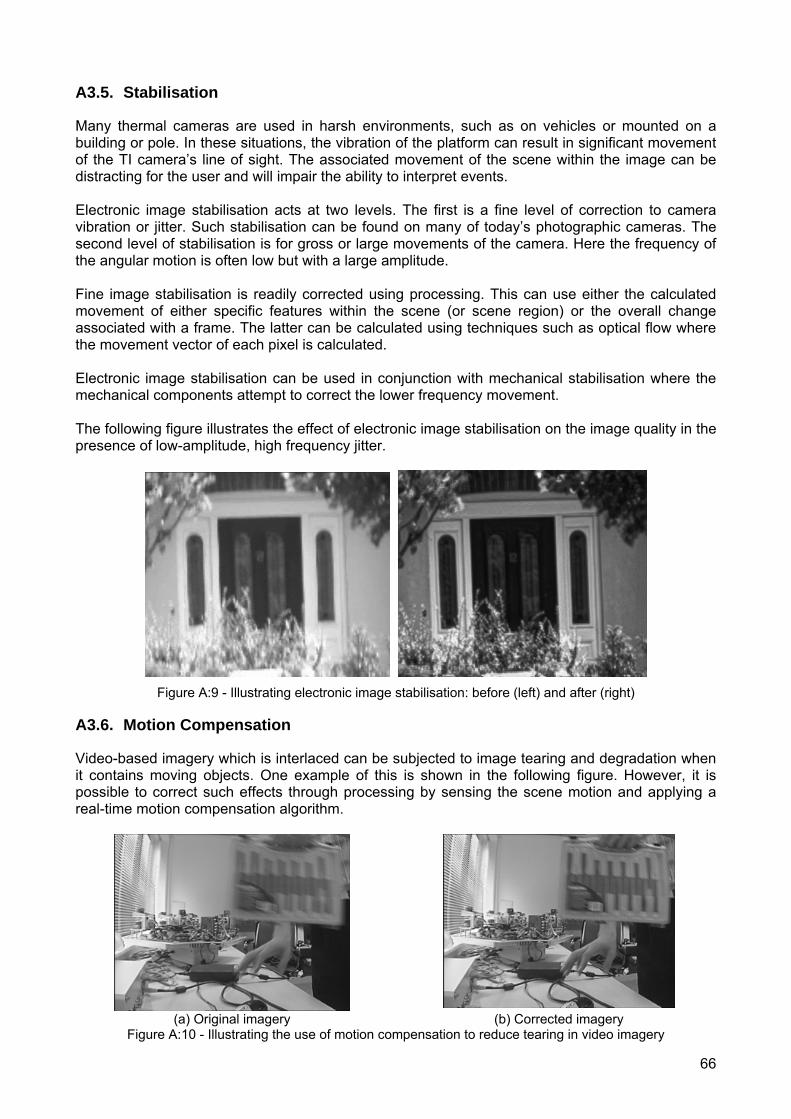
66
A3.5. Stabilisation
Many thermal cameras are used in harsh environments, such as on vehicles or mounted on a building or pole. In these situations, the vibration of the platform can result in significant movement of the TI camera’s line of sight. The associated movement of the scene within the image can be distracting for the user and will impair the ability to interpret events. Electronic image stabilisation acts at two levels. The first is a fine level of correction to camera vibration or jitter. Such stabilisation can be found on many of today’s photographic cameras. The second level of stabilisation is for gross or large movements of the camera. Here the frequency of the angular motion is often low but with a large amplitude. Fine image stabilisation is readily corrected using processing. This can use either the calculated movement of either specific features within the scene (or scene region) or the overall change associated with a frame. The latter can be calculated using techniques such as optical flow where the movement vector of each pixel is calculated. Electronic image stabilisation can be used in conjunction with mechanical stabilisation where the mechanical components attempt to correct the lower frequency movement. The following figure illustrates the effect of electronic image stabilisation on the image quality in the presence of low-amplitude, high frequency jitter.
Figure A:9 - Illustrating electronic image stabilisation: before (left) and after (right)
A3.6. Motion Compensation
Video-based imagery which is interlaced can be subjected to image tearing and degradation when it contains moving objects. One example of this is shown in the following figure. However, it is possible to correct such effects through processing by sensing the scene motion and applying a real-time motion compensation algorithm.
(a) Original imagery (b) Corrected imagery
Figure A:10 - Illustrating the use of motion compensation to reduce tearing in video imagery

67
A3.7. Wide-Area Imaging
TI cameras have a limited FOV for a given resolution. In order to increase the FOV without degrading the resolution, one method is to combine multiple cameras as illustrated in the figure below. However, in order to combine multiple images together, variations in brightness, contrast, orientations, displacement, and distortions have to be equalised in order to give a contiguous image.
(a) Camera 1 (b) Camera 2 (c) Camera 3
(d) Wide-area image
Figure A:11- Wide-area imaging using multiple camera feeds
Wide-area imagery can be formed using many cameras although the complexity of the processing increases as the number of variables increases. This is illustrated in the figure below for a very wide FOV and a full 360° imaging system.
(a) Wide-area IR imagery (approximately 120° in azimuth)
(b) Wide-area visible band imagery (360° in azimuth)
Figure A:12 - Illustrating wide-area image formation for security and surveillance applications.
A.4 Opto-Mechanical Control
A4.1. Zoom
Image zoom can be achieved either optically or digitally. However, these techniques produce different results. Optical zoom involves the movement of lenses which changes the magnification of the optics. The resolution is traded directly for FOV (i.e. as the resolution increases, the FOV decreases). Digital zoom is performed electronically and the overall FOV of the sensor is not changed (although what is presented on a screen may change). Digital zoom is a process of magnifying image data rather than changing it (as with optical zoom). Ultimately, digital zoom is limited by the pixellation
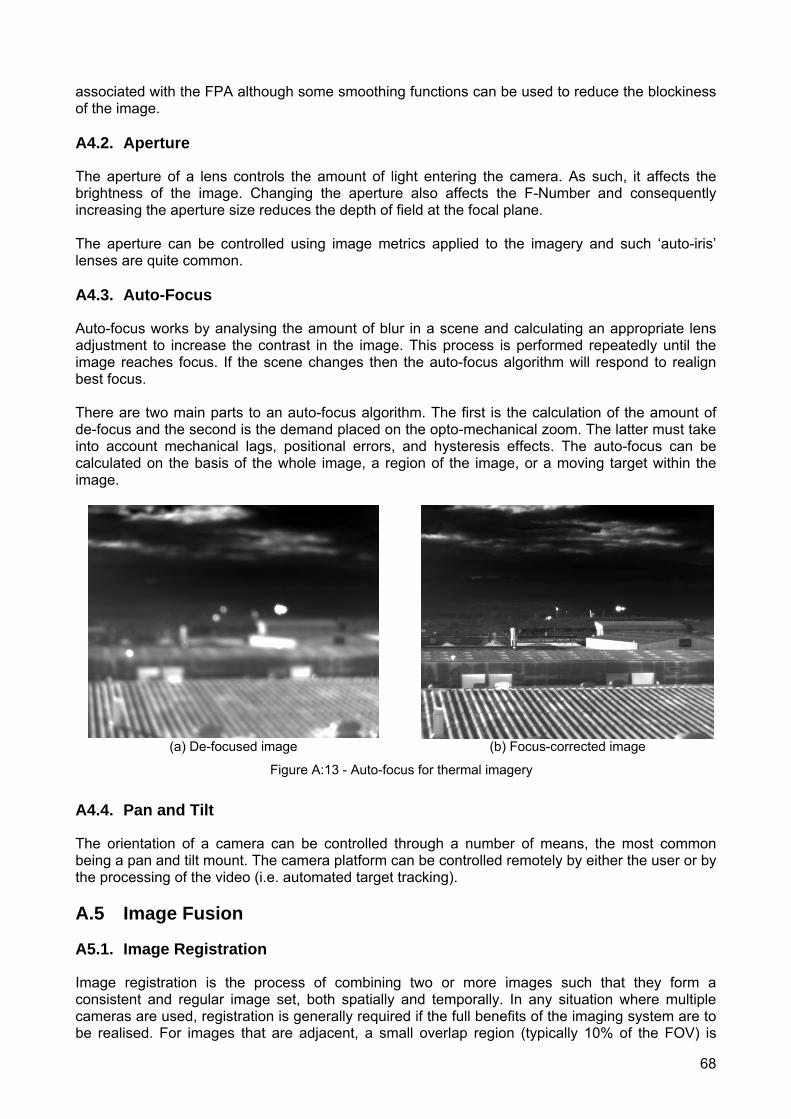
68
associated with the FPA although some smoothing functions can be used to reduce the blockiness of the image. A4.2. Aperture
The aperture of a lens controls the amount of light entering the camera. As such, it affects the brightness of the image. Changing the aperture also affects the F-Number and consequently increasing the aperture size reduces the depth of field at the focal plane. The aperture can be controlled using image metrics applied to the imagery and such ‘auto-iris’ lenses are quite common. A4.3. Auto-Focus
Auto-focus works by analysing the amount of blur in a scene and calculating an appropriate lens adjustment to increase the contrast in the image. This process is performed repeatedly until the image reaches focus. If the scene changes then the auto-focus algorithm will respond to realign best focus. There are two main parts to an auto-focus algorithm. The first is the calculation of the amount of de-focus and the second is the demand placed on the opto-mechanical zoom. The latter must take into account mechanical lags, positional errors, and hysteresis effects. The auto-focus can be calculated on the basis of the whole image, a region of the image, or a moving target within the image.
(a) De-focused image (b) Focus-corrected image
Figure A:13 - Auto-focus for thermal imagery
A4.4. Pan and Tilt
The orientation of a camera can be controlled through a number of means, the most common being a pan and tilt mount. The camera platform can be controlled remotely by either the user or by the processing of the video (i.e. automated target tracking). A.5 Image Fusion
A5.1. Image Registration
Image registration is the process of combining two or more images such that they form a consistent and regular image set, both spatially and temporally. In any situation where multiple cameras are used, registration is generally required if the full benefits of the imaging system are to be realised. For images that are adjacent, a small overlap region (typically 10% of the FOV) is

69
required between cameras in order to determine common image points. For images that view a common area (as is the case for image fusion), a consistent image feature set is sought throughout the image set. Temporal alignment of imagery is the more straightforward of the two processes, typically being solved by physically linking sensors to synchronise their outputs (‘gen-locking’). This is applicable to cameras which run at the same frame rate (e.g. 2 PAL cameras or 2 NTSC cameras). It can be expected that most multi-sensor camera systems will utilise cameras which do run at the same frame rate and use gen-locking to ensure that images are recorded at the same time by each camera. If this is not the case then frame interpolation via software is required. This is a reliable method provided that accurate time-stamping using the same mechanism has occurred for all image frames from all cameras, and software solutions are reasonably readily available for this purpose. However, if accurate time stamps are not available for the image streams from all cameras to be registered then the problem can be non-trivial, and more complex and expensive software solutions are necessary. The spatial registration process is applied to ensure that pixels from each camera stream can be overlaid exactly, despite the fact that the original resolutions and fields of view may be quite different. One image stream is chosen as the reference against which all other camera images are registered (a process termed ‘warping’), and this process must not introduce any artefacts into the image that is being warped. Spatial registration involves three key processing steps:
- Extracting image features from the camera streams and identifying associations between the features from the different streams
- Determining the optimal warping parameters back to the reference image stream on a per-camera basis
- Applying the specific warp calculated for each camera For any set of cameras, the first two processes can be performed once - preferably under controlled conditions where the depth of field is very similar to that where the system will be installed. This is because accurate spatial registration is not possible for objects at all ranges: this is a limitation, governed by the laws of physics, due to parallax effects that are introduced by having a system with multiple apertures. Hence, when the system is being set up and cameras are being focused at a certain range, they should also be registered for that same depth of field. Warping of one image onto another must, however, be applied at frame rate. Software is available for automatically applying a warp to a camera output at frame rate, whilst specialist software is also available to perform (manually or automatically) the first two steps of the process. A5.2. Image Fusion
Image fusion is the combination of images from different spectral bands into a single image. There are a number of reasons for doing this, which include:
• Optimisation of the image content (pull-through of many more scene features) • Reduced operator workload (single image to view with all pertinent features present) • Enhancement of DRI performance (due to extra content and spectral information)
Best results are achieved from a fusion system when the different camera streams to be fused provide complementary scene information. In addition, fusion systems that use IR and visible-band cameras are especially useful at the two thermal cross-over times of the day, dawn and dusk, when the resulting fused imagery is particularly instructive and presents much greater situational awareness to the operator.

70
Good quality fusion output require two key components: accurately registered (spatially and temporally) input images; a fusion method that intelligently combines scene features and adapts to the conditions and camera types being used. Some commercially-available systems simply add the different image types together or average the pixel values. These tend to be entry-level systems and do not offer high quality or reliable performance. Other, far more advanced image fusion options are also now commercially available and provide reliable, high quality imagery.
Figure A:14 -Illustrating image fusion between a visible band camera and an IR sensor. A.6 Detection and Tracking
A6.1. Change Detection
Change Detection detects changes over time by comparing the current scene to an image stored in memory which was taken at an earlier time. This capability is available in two forms: static and dynamic. Static change detection is used for automated monitoring of a fixed scene. A reference image is taken and the processing highlights to the user any changes that occur since that point. An example of this is illustrated in the figure below.
Figure A:15 - Change detection between two images (left and centre). The change between the two is a cyclist. An enlarged region of the change map is shown on the right.
Dynamic change detection is typically used for vehicle based applications. The reference in this case, is a series of images gathered at an earlier point in time as the vehicle travels along a given route. These reference frames are analysed and information about the scene is stored. Next time the vehicle passes the same point, the scene will be recognised and then the two scenes can be compared. If there are any differences, these can be highlighted to the user. A6.2. Threshold-Based Detection
Automated detection of targets is a particularly powerful technique that reduces the workload of an operator and provides the basis for autonomous systems. Detection of a particular object requires that object to exhibit differences from its surrounding area as well as having a sufficient signal-to-noise level. The differences used can be based upon many different features including:
• Contrast

71
• Size and shape • Signature spatial distribution • Temporal changes • Relative motion • Spectral content • Polarisation differences
In order to detect a target, the signal level of that target needs to pass a threshold. A threshold level is either set for the complete image frame or, for higher performance systems, on a regional image basis. If this threshold is too low, the system will become overloaded with false-alarms, but if the threshold is too high, the detection range will be reduced. There are various detection processing strategies available. One of the most common uses a regional thresholding and spatial filtering technique, and these are illustrated below.
(a) Original image (b) Detection processed image
Figure A:16 - Detection processing
Figure A:17 - Enlarged region showing the target detection boxes
An alternative approach is to use object area information when the target is resolved. An example of this is shown below. Note that this is more than the stand frame-differencing approach which would give two detections (at the bow and stern) and where the output wouldn’t readily support classification.
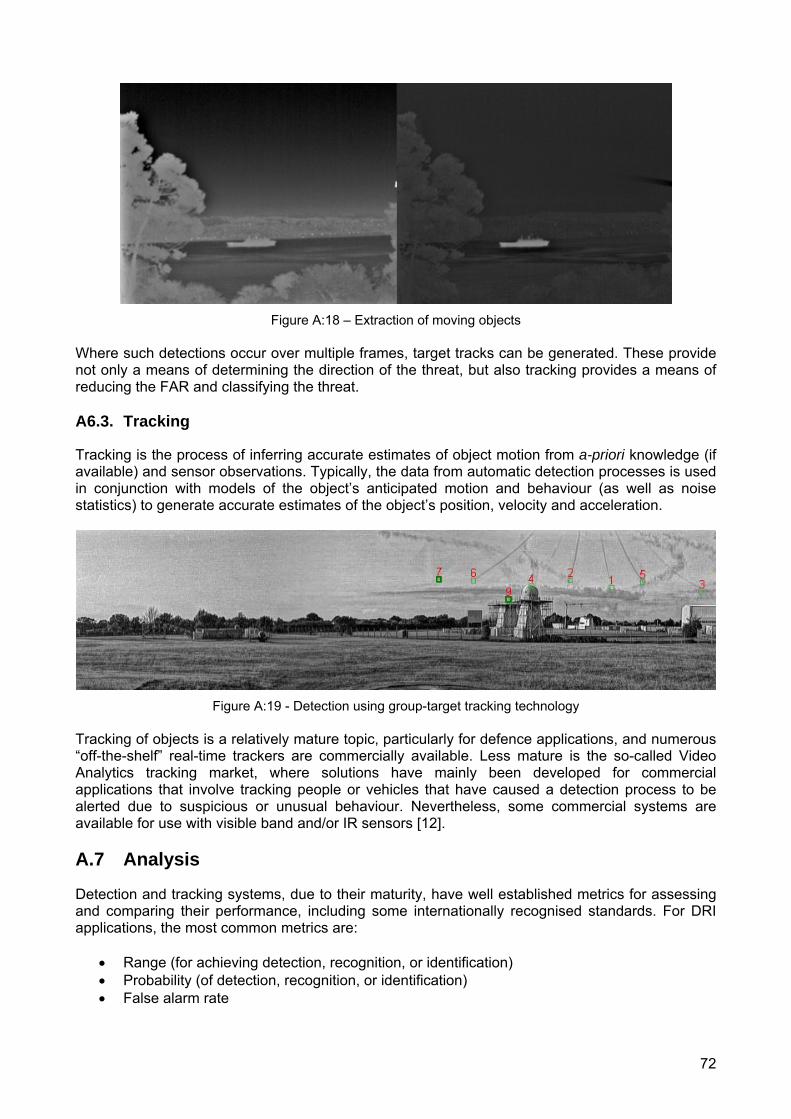
72
Figure A:18 – Extraction of moving objects
Where such detections occur over multiple frames, target tracks can be generated. These provide not only a means of determining the direction of the threat, but also tracking provides a means of reducing the FAR and classifying the threat. A6.3. Tracking
Tracking is the process of inferring accurate estimates of object motion from a-priori knowledge (if available) and sensor observations. Typically, the data from automatic detection processes is used in conjunction with models of the object’s anticipated motion and behaviour (as well as noise statistics) to generate accurate estimates of the object’s position, velocity and acceleration.
Figure A:19 - Detection using group-target tracking technology
Tracking of objects is a relatively mature topic, particularly for defence applications, and numerous “off-the-shelf” real-time trackers are commercially available. Less mature is the so-called Video Analytics tracking market, where solutions have mainly been developed for commercial applications that involve tracking people or vehicles that have caused a detection process to be alerted due to suspicious or unusual behaviour. Nevertheless, some commercial systems are available for use with visible band and/or IR sensors [12]. A.7 Analysis
Detection and tracking systems, due to their maturity, have well established metrics for assessing and comparing their performance, including some internationally recognised standards. For DRI applications, the most common metrics are:
• Range (for achieving detection, recognition, or identification) • Probability (of detection, recognition, or identification) • False alarm rate

73
In order to determine the performance of a camera system for DRI purposes and generate any of the above metrics, a representative and suitably wide-ranging set of data must be obtained from a source such as i-LIDS [12]. This is particularly important if statistical metrics such as probability of detection and false alarm rates are to have any foundation. Determining the range at which DRI is achieved clearly depends on a whole range of different issues, including whether a human or a computer is performing the task, what the environmental conditions were, and what the target was. In general, DRI analysis is performed via trials and can be aided by software analysis. For tracking, the industry standard set of metrics is the Single Integrated Air Picture (SIAP) suite which consists of the following five categories of kinematic performance metrics:
• Completeness • Clarity (Ambiguity and Spuriousness) • Continuity • Kinematic Accuracy • Timeliness
These metrics are internationally accepted and are most readily available in their mathematical form via documentation [14]. However, some companies do provide software tools that are capable of calculating the SIAP metrics for any given set of tracking data. A.8 The User Interface
The data from IR cameras is often displayed on a monitor which presents a number of additional implications in terms of the perceived quality of information. Firstly, many current and future sensors will output 12 or 14-bit image data. However, the human visual system can only accept a dynamic range of approximately 7 bits. This then presents the problem of compressing or re-displaying the data in such a way that all of the salient information is retained. Secondly, the perception of different image degradation sources is different when compared with the requirements of an automated processing system. For example, image flicker (inter-frame defect) is more of a problem to an observer whilst temporal noise (intra-frame) presents a more significant problem for an automated system. These factors are due to the eye-brain integration being typically 0.1seconds (3 frames at 30Hz). Colour is also an important factor in visual displays and forms an important part of the human brain classifier. However, for all single band IR systems such colour information does not exist, and hence images are displayed as greyscale. Artificial or pseudo-colouring of images is possible based on image segmentation or other scene cues / ground-truth data. However, this is often unreliable in terms of colour stability.

74
Appendix B: Examples of Thermal Imaging Cores
Manufacturer Country Model Resolution Sensor Material Waveband NETD Pixel Pitch
(microns) Price Notes
AIM Infrarot Module Germany IR Core 640x512 CMT MWIR <15mK 24 €45-50k Module
AIM Infrarot Module Germany IR Core 640x512 QWIP LWIR <20mK 24 €45-50k Module
Cedip (now FLIR) France Carthage ACL 640x512 InSb MWIR <20mK 20/25 ~£32k Module (SCD FPA)
Cedip (now FLIR) France Carthage ACL 640x512 InSb MWIR <20mK 15 ~£32k Module (Sofradir FPA)
Cedip (now FLIR) France Carthage ACL 640x512 QWIP LWIR ~30mK 20 ~£36k Module (Sofradir FPA)
DRS Technologies USA MWIR Module 640x480 CMT MWIR D*=4E10 Jones 25 $20k Module
DRS Technologies USA LWIR Module 640x480 CMT LWIR D*=3.5E9 Jones 25 $20k Module
FLIR USA Apache 640x512 InSb MWIR <25mK NA $70k Module
FLIR USA Spectare 640x512 InSb MWIR <25mK 15 $30k Module.
FLIR (Indigo) USA InSb FPA 640x512 InSb MWIR <25mK 15 ~$15k FPA
FLIR (Indigo) USA InSb FPA 640x512 InSb MWIR <25mK 20 ~$15k FPA
FLIR (Indigo) USA InSb FPA 640x512 InSb MWIR <25mK 25 $15k FPA
FLIR (Indigo) USA InSb FPA 640x512 InSb MWIR <25mK 30 ~$15k FPA
FLIR (IRNova) Sweden Sesam 640 640x512 QWIP LWIR 30mK 25 €14-18k FPA
L3 – Cincinnati Electronics USA CE 961 256x256 InSb MWIR 25mK 30 - FPA
L3 – Cincinnati Electronics USA CE 971 640x512 InSb MWIR 20mK 28 - FPA
Raytheon Infrared USA AE 197 640x512 InSb MWIR ~20mK 25 ~$65k (100+) Core
Raytheon Infrared USA Detector Core 640x480 InSb MWIR 20mK 20 ~$65k (100+) Core
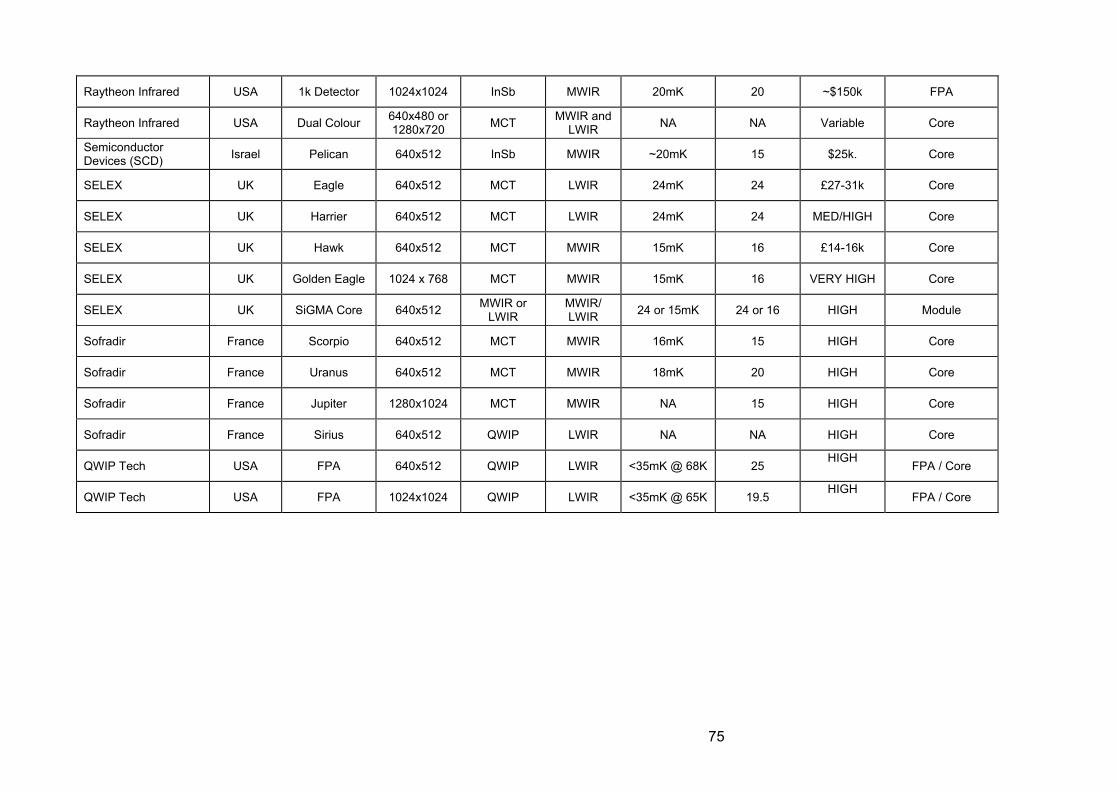
75
Raytheon Infrared USA 1k Detector 1024x1024 InSb MWIR 20mK 20 ~$150k FPA
Raytheon Infrared USA Dual Colour 640x480 or 1280x720 MCT MWIR and
LWIR NA NA Variable Core
Semiconductor Devices (SCD) Israel Pelican 640x512 InSb MWIR ~20mK 15 $25k. Core
SELEX UK Eagle 640x512 MCT LWIR 24mK 24 £27-31k Core
SELEX UK Harrier 640x512 MCT LWIR 24mK 24 MED/HIGH Core
SELEX UK Hawk 640x512 MCT MWIR 15mK 16 £14-16k Core
SELEX UK Golden Eagle 1024 x 768 MCT MWIR 15mK 16 VERY HIGH Core
SELEX UK SiGMA Core 640x512 MWIR or LWIR
MWIR/ LWIR 24 or 15mK 24 or 16 HIGH Module
Sofradir France Scorpio 640x512 MCT MWIR 16mK 15 HIGH Core
Sofradir France Uranus 640x512 MCT MWIR 18mK 20 HIGH Core
Sofradir France Jupiter 1280x1024 MCT MWIR NA 15 HIGH Core
Sofradir France Sirius 640x512 QWIP LWIR NA NA HIGH Core
QWIP Tech USA FPA 640x512 QWIP LWIR <35mK @ 68K 25 HIGH
FPA / Core
QWIP Tech USA FPA 1024x1024 QWIP LWIR <35mK @ 65K 19.5 HIGH
FPA / Core

76
Appendix C: Examples of Thermal Imaging Cameras
Make Model Sensor Price Lens (HFOV) Size Weight NETD Interface Comments Picture
ISG K3100
Uncooled LWIR ASi
384x288
£3.5k 40˚ 77x64x64 250g 50mK Composite LVDS
Affordable OEM unit used within WS TI camera protototypes
ISG K1000
Uncooled LWIR ASi
384x288
Very Low 40˚ 185x130x149 1.2kg 50mK Display Composite
Rugged Rescue and fire-fighting
camera
ISG X3
Uncooled LWIR ASi
384x288
Very Low / Low 7.3˚ 329x144x167 1.84 100mK
Display
Composite Long range surveillance
Thermoteknix Miricle 110k
Uncooled LWIR
384x288 £10k 18mm
40˚ 42x40x40 86g 50mK Composite
USB2 LVDS
Thermoteknix Miricle 307k
Uncooled LWIR
640x480 ~£18k 18mm
50˚ 45x52x48 95g 85mK Composite
USB2 LVDS

77
FLIR Photon 320
Uncooled LWIR VOx
320x240
Low
50˚ 36˚ 20˚ 14˚ 7˚
65x52x50
125g +lens
85mK @f1.6
Composite LVDS
FLIR Photon 640
Uncooled LWIR VOx
640x512
Medium
41˚ 36˚ 26˚ 19˚ 18˚ 15˚ 9˚
66x64x62 to
153x82x82
273g To
630g 85mK Composite
LVDS
FLIR SR-Series
Uncooled LWIR VOx
320x240
SR-19 £4,430 SR-35 £6,808 SR-50 £7,624 SR-100 £11,272
36˚ 20˚ 14˚ 7˚
SR-19, SR-35, SR-50
279x132x142
SR-100 381x132x142
2.7kg
or
3.6kg
85mK Composite Good range of FOVs
Good value
FLIR PTZ-35x140
Uncooled LWIR VOx
320x240
£56k 25˚ & 5˚ 385x385x470 20kg 65mK Composite
PTZ or fixed 2xTI 1xVis
FLIR B400
Uncooled LWIR VOx
320x240
Medium 25˚ 106x201x125 880g 70mK Monitor
Compoiste USB
Visible camera Fusion
FLIR HRC
Cooled MWIR InSb
640x480
£156k Zoom 14˚ to 1.1˚
474x194x225 9.7kg NA Composite Digital Continuous zoom

78
L3 Thermal
Eye X100xp
Uncooled LWIR ASi
160x120
3.5k 17˚ 134x114x51 381g 100mK Composite Compact and lightweight
L3 Thermal
Eye X200xp
Uncooled LWIR ASi
160x120
Low 11˚ 134x114x51 381g 50mK Viewfinder Composite Compact and lightweight
L3 Thermal
Eye X2400xp
Uncooled 320x240 High
12˚ 9˚ 6˚
50x53x48 23kg 100mK Composite 2X Zoom visible camera
Raytheon IR 4000B Pan&Tilt
Uncooled LWIR BST
160x120
Low 12˚ 280x230x230 4.5kg 100mK Composite
Raytheon IR-225 Uncooled
BST 320x240
Low 18˚ 260x140x140 1.8kg 100mK Composite IPAQ
Sensors Unlimited SU320 InGaAs
320x240 Low NA 50x60x95 300g +Lens NA Composite
RS-422 SWIR camera

79
Sensors Unlimited SU640 InGaAs
640x512 Medium NA 53x53x65 270g +lens NA Composite
CameraLink SWIR camera
Xenics XS 1.7-320
InGaAs SWIR
320x240
£12k uncooled
£15k cooled
NA 50x50x50 225g +lens NA Composite
USB2 Can use glass optics Must be IR corrected
BAE PMC 300
Uncooled LWIR VOx
640x480
Medium NA 100x120x120 2.5kg 100mK Composite
Jenoptik IR-TCM 384
Uncooled LWIR
384x288 Medium
65˚ 36˚ 30˚ 18˚ 12˚ 7˚
153x91x111 1050g 80mK
Firewire Composite
S-video VGA
Microscan to 768x576
Jenoptik IR-TCM 640
Uncooled LWIR
640x480 Medium
65˚ 36˚ 30˚ 18˚ 12˚ 7˚
153x91x111 1050g 80mK
Firewire Composite
S-video VGA
Microscan to 1280x960
Thermo-sensorik
QWIP 640L
Cooled LWIR QWIP
640x512
£77k NA 165x176x313 6kg 20mK LVDS Serial-Optical
Thermo-sensorik
CMT 640L
Cooled LWIR CMT
640x512
£122k NA 240x120x150 5kg 25mK GigE

80
Thermo-sensorik
CMT 640L Dual Band
Cooled MWIR LWIR CMT
640x512
£135k NA 240x120x150 5kg 15mK 30mK
GigE Serial
Optical CameraLink
Dual Band camera unit
SELEX SLX Hawk
Cooled MWIR CMT
640x512
£50k 0.9˚ 373x108x100 4.5kg 17mK
Composite RGB DVI
HDMI
Continuous zoom lens Microscan to 1280x1024
SELEX SLX Condor II
Cooled MCT
MWIR LWIR
640x512
~£85k NA 195x115x95 4kg 15mK to 26mK
Composite RGB DVI
HDMI
Microscan to 1280x1024
SELEX SLX Merlin
Cooled MWIR MCT
1024x768
~£85k NA 195x115x95 4kg 17mK
Composite RGB DVI
HDMI
Microscan to2048x1536
SELEX SLX Harrier
Cooled LWIR MCT
640x512
~£85k NA 195x115x95 4kg 14mK
to 20mK
Composite RGB DVI
HDMI
Microscan to 1280x1024